Embed Size (px)
Citation preview

H S R CHealth Services Research Centre
NIAANational Institute of Academic
Anaesthesia
The Second Patient Report of the National Emergency Laparotomy Audit (NELA)December 2014 to November 2015
July 2016

H S R CHealth Services Research Centre
NIAANational Institute of Academic
Anaesthesia
NELA REPORT 2016 | 1
The Second Patient Report of the National Emergency Laparotomy Audit (NELA)December 2014 to November 2015Citation for this report: NELA Project Team. Second Patient Report of the National Emergency Laparotomy Audit RCoA London, 2016
© The Royal College of Anaesthetists 2016 No part of this publication may be reproduced, stored in a retrieval system, or transmitted in any form or by any other means, electronic, mechanical, photocopying, recording, or otherwise, without prior permission, in writing, of the Royal College of Anaesthetists.
Whilst the Royal College of Anaesthetists has endeavoured to ensure that this document is as accurate as possible at the time it was published, it can take no responsibility for matters arising from circumstances which may have changed, or information which may become available subsequently.
All enquiries in regard to this document should be addressed to:
The National Emergency Laparotomy Audit The Royal College of Anaesthetists Churchill House 35 Red Lion Square London WC1R 4SG
020 7092 1676 [email protected] www.nela.org.uk
Design and layout by the Royal College of Anaesthetists.
2 | NELA REPORT 2016
1 FOREWORD 5
2 EXECUTIVE SUMMARY 6
3 RECOMMENDATIONS 15
4 INTRODUCTION TO THE SECOND NELA PATIENT AUDIT REPORT 18
5 DATA QUALITY AND CASE ASCERTAINMENT 25
6 PATIENT AND SURGICAL CHARACTERISTICS 28
7 SUMMARY OF STANDARDS OF CARE AND PROCESS MEASURES 32
8 REVIEW WITHIN 14 HOURS OF HOSPITAL ADMISSION BY A CONSULTANT SURGEON 35
9 PREOPERATIVE IMAGING 41
10 PREOPERATIVE DOCUMENTATION OF RISK 45
11 TIMELINESS OF CARE FOR PATIENTS UNDERGOING EMERGENCY SURGERY FOR SUSPECTED PERITONITIS 54
12 TIMELINESS OF ARRIVAL IN AN OPERATING THEATRE 57
13 CONSULTANT-DELIVERED PERIOPERATIVE CARE 62
14 GOAL DIRECTED FLUID THERAPY 72
15 DIRECT POSTOPERATIVE ADMISSION TO CRITICAL CARE 74
16 ASSESSMENT BY AN ELDERLY MEDICINE SPECIALIST 82
CONTENTS
NELA REPORT 2016 | 3
17 OUTCOMES 86
17.1 Death within 30 days and 90 days of surgery acording to ONS data
17.2 Length of hospital stay after surgery
17.3 Return to theatre following initial emergency laparotomy
17.4 Unplanned admission to critical care
18 HOW IMPROVEMENT HAS BEEN ACHIEVED 106
19 GLOSSARY 109
20 REFERENCES 111
21 APPENDICES 113
21.1 Hospital Level Data
21.2 Supplementary Summary Tables
21.3 Risk-adjustment Model and Performance of P-POSSUM
21.4 Standards of Care and Summary of Recommendations
21.5 Governance and organisational arrangements for NELA
4 | NELA REPORT 2016
This Report was prepared by members of the National Emergency Laparotomy Audit Project Team on behalf of the Royal College of Anaesthetists:
Mr Iain AndersonDr Michael BassettDr David CromwellMrs Emma DaviesMs Natalie EugeneProfessor Mike GrocottDr Carolyn JohnstonDr Angela KurybaMr Jose Lourtie Dr Ramani MoonesingheDr Dave MurrayMr Dimitri Papadimitriou Professor Carol PedenDr Thomas PoultonDr Kate Walker
Acknowledgements The NELA Project Team and Board would like to repeat our thanks to all clinical and non-clinical staff at all NHS trusts and Welsh health boards who collected and submitted data, and in particular the NELA Leads, for their hard work, leadership and continued enthusiasm (www.nela.org.uk/NELALeadDb): without this engagement, NELA would fail.
The NELA Project Team and Board would also like to thank the members of the NELA Clinical Reference Group for helping to shape the dataset and Report.

NELA REPORT 2016 | 5
1 FOREWORDWe welcome the Second Patient Report from the National Emergency Laparotomy Audit (NELA), describing the care given to adult patients having emergency bowel surgery.
The Report builds on The First Patient Report of the National Emergency Laparotomy Audit (2015) and details data on over 23,000 additional patients, bringing the total number of patients over the two years of the NELA Patient Audit to 44,000. Data have been provided from 186 hospitals, representing the overwhelming majority of hospitals in England and Wales that perform emergency laparotomy. The continuing high level of engagement with NELA is testament to the importance that clinicians place on this landmark project, as it drives changes in practice for some of the sickest patients requiring emergency surgery. We thank and congratulate all those involved locally for their efforts.
A key inclusion within this Report is the risk-adjusted, hospital-level mortality rates for these 44,000 patients. The Report found that 30-day mortality rates for individual hospitals were within the range expected. However large differences remain across a number of important standards of care, suggesting there is significant potential for improvement.
This year’s data reinforce previous findings that patients whose individualised risk assessment is documented before surgery were more likely to receive consultant-delivered care, by both surgeons and anaesthetists, and to be admitted to a critical care unit. Care has improved since the First Report, particularly with regard to the number of patients with a documented risk assessment and the level of consultant delivered care. All members of the clinical team are to be applauded for this, and we hope to see this positive trend continue in subsequent years.
Emergency laparotomy remains a complex procedure performed with very limited time for planning and patient optimisation compared with elective surgery – and the mortality rate still far exceeds that of elective bowel surgery. Organisational change such as improving access to operating theatres and critical care remains a challenge. We call upon those responsible for commissioning and delivering healthcare to consider how best to improve these aspects of care, such that patients requiring emergency laparotomy are cared for by adequately resourced multidisciplinary teams.
Data collection continues for year three of the Patient Audit. Much of the NELA data can be viewed in real-time on the NELA web tool. This in turn facilitates local quality improvement programmes that drive improved care for patients requiring emergency bowel surgery.
This Report is aimed at commissioners, NHS trusts and Welsh health boards, and clinicians. It highlights the main findings from the Audit as well as making key recommendations, which will help hospitals ensure that they are meeting the current published standards of clinical care.
We hope that commissioners, NHS trust boards and clinicians will engage closely with the findings of this Report and use them in their local settings to make changes and deliver improved care and better outcomes for this very vulnerable group of patients.
Dr Liam Brennan President, Royal College of Anaesthetists
Miss Clare Marx President, Royal College of Surgeons of England
Dr Andrew Hartle President, Association of Anaesthetists of Great Britain and Ireland
Mr John Moorehead President, Association of Surgeons of Great Britain and Ireland
6 | NELA REPORT 2016
2 EXECUTIVE SUMMARY
1 Overview1.1 This is the Second Patient Audit Report of the National Emergency Laparotomy Audit (NELA). It covers patients who
underwent emergency bowel surgery (emergency laparotomy) between December 2014 and November 2015. It describes the care received by these patients within English and Welsh NHS hospitals as well as hospital-level patient mortality.
1.2 NELA was established to describe the processes of care and outcomes of patients undergoing emergency bowel surgery in England and Wales in order to promote quality improvement. NELA was commissioned by the Healthcare Quality Improvement Partnership (HQIP) and commenced in 2012, with patient data collection from December 2013.
1.3 More than 30,000 patients undergo an emergency laparotomy each year in NHS hospitals within England and Wales.1,2 The majority of patients undergoing emergency bowel surgery have potentially life-threatening conditions requiring prompt investigation and management. These procedures are associated with high rates of postoperative complications and death; recent studies have reported that overall 15% of patients die within one month of having an emergency laparotomy.1,3,4,5
1.4 The clinical pathway for patients undergoing emergency bowel surgery is complex, and requires input from clinicians from several specialties including emergency departments, acute admissions units, radiology, surgery, anaesthesia, operating theatres, critical care and elderly care. Unlike elective (planned) care, there is often limited time to investigate and prepare these patients before surgery. This creates challenges in the delivery of care on a day-to-day basis and in bringing about long-term service improvement.
1.5 A number of recommendations and standards have been published to safeguard and improve the quality of care received by patients undergoing emergency laparotomy (Chapter 21.4). NELA names all participating hospitals and reports their outcomes and performance against published standards of care (Chapters 17 and 21.1). This allows the best performing hospitals to be identified in order that good practice can be disseminated. It also allows hospitals to see areas in which they can bring about improvement through local quality improvement (QI) initiatives. Differences in the structure of hospitals mean that it is unlikely that generic solutions will be applicable to all circumstances. Each hospital should examine its own results to identify reasons for their current situation and develop solutions to bring about improvement.
1.6 The aim of this executive summary is to provide an overview of findings from the second year of patient data collection (December 2014 to November 2015), to summarise key themes and to make recommendations for commissioners, hospitals and clinicians. Detailed comparative data for individual hospitals is presented throughout the main Report.
2 Data quality and case ascertainment2.1 Data was entered into NELA from more patients this year compared to last year (23,000 compared to 21,000). Case
ascertainment increased from 65% to 70%, with data from 186 of the 191 eligible NHS hospitals in England and Wales. Data completeness has also improved.
NELA REPORT 2016 | 7
3 Processes of care3.1 The following key processes are drawn from published standards, and adherence to them 24 hours a day, seven days a
week, constitutes delivery of high-quality care:
Timeliness of care ■ Review by a consultant surgeon within 14 hours of admission.
■ Prompt administration of antibiotics (when indicated).
■ CT scans reported by a consultant radiologist before surgery.
■ Access to theatres without delay.
Appropriate level of care guided by assessment of risks of complications and death: ■ Documented assessment, before surgery, of the risks of surgery.
■ Review before surgery by consultant surgeon and anaesthetist for high-risk patients.
■ Presence of consultant surgeon and anaesthetist in theatre for high-risk patients.
■ Admission to critical care after surgery for high-risk patients.
■ Input from Elderly Medicine specialists in the care of older patients.
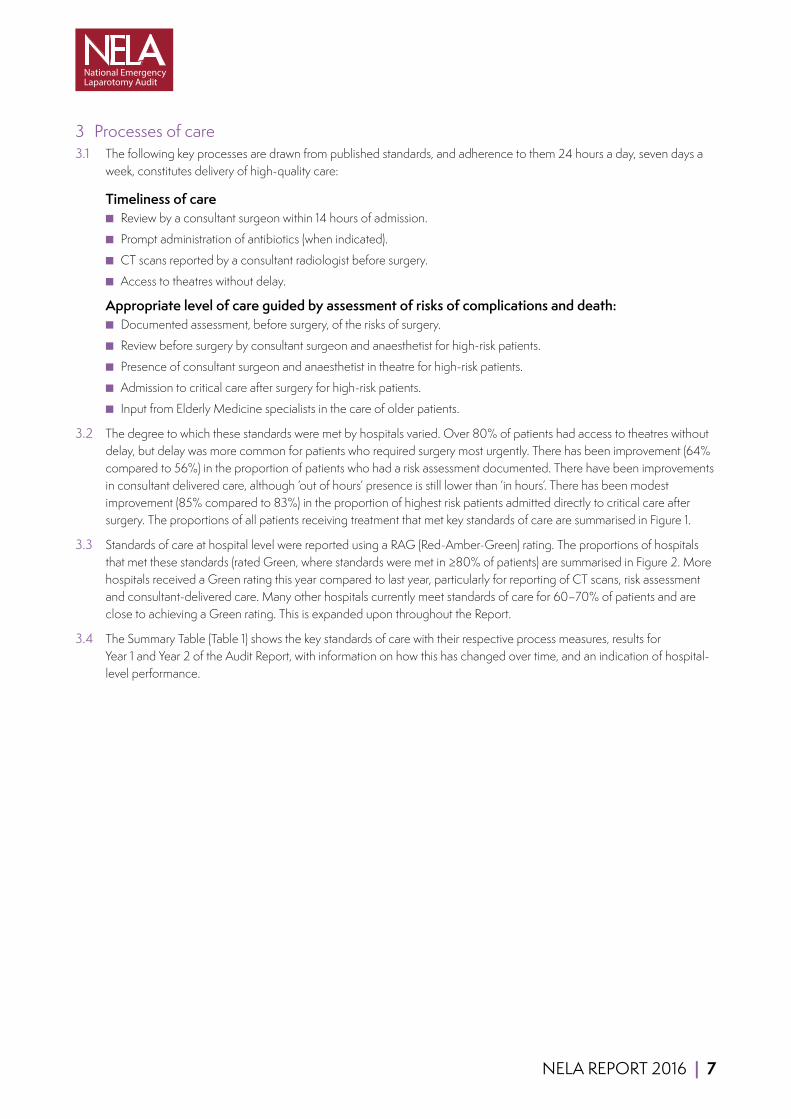
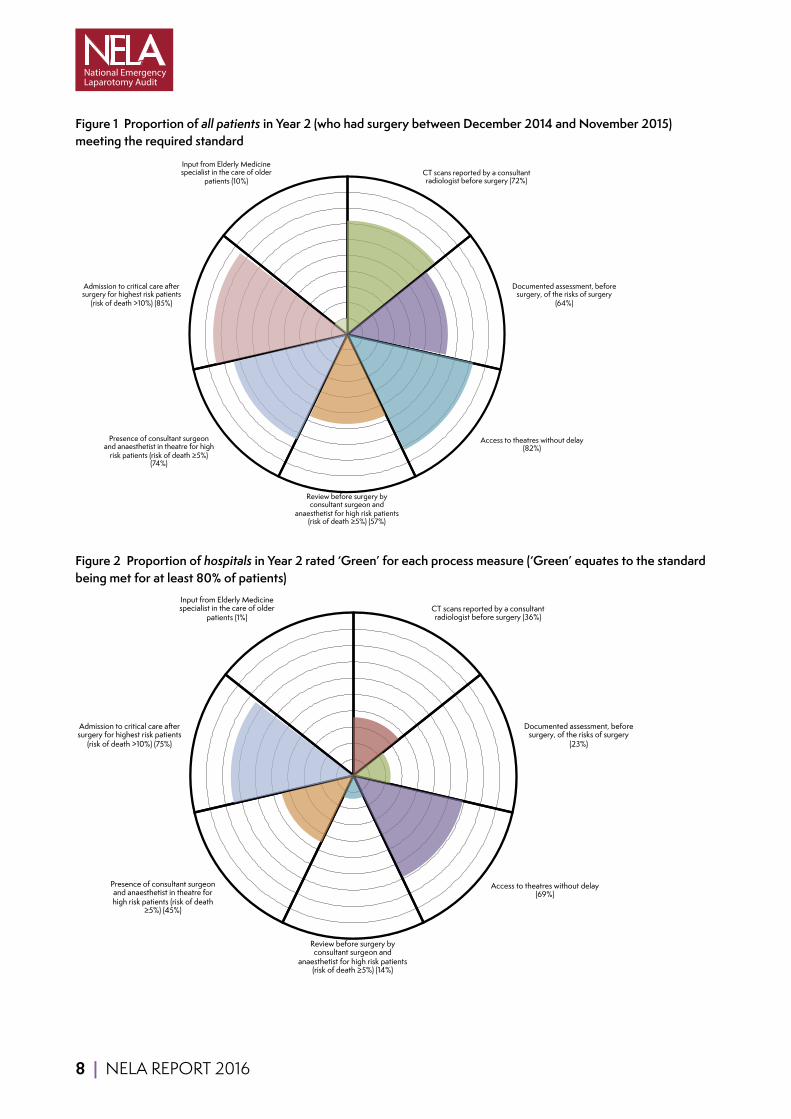
3.2 The degree to which these standards were met by hospitals varied. Over 80% of patients had access to theatres without delay, but delay was more common for patients who required surgery most urgently. There has been improvement (64% compared to 56%) in the proportion of patients who had a risk assessment documented. There have been improvements in consultant delivered care, although ‘out of hours’ presence is still lower than ‘in hours’. There has been modest improvement (85% compared to 83%) in the proportion of highest risk patients admitted directly to critical care after surgery. The proportions of all patients receiving treatment that met key standards of care are summarised in Figure 1.
3.3 Standards of care at hospital level were reported using a RAG (Red-Amber-Green) rating. The proportions of hospitals that met these standards (rated Green, where standards were met in ≥80% of patients) are summarised in Figure 2. More hospitals received a Green rating this year compared to last year, particularly for reporting of CT scans, risk assessment and consultant-delivered care. Many other hospitals currently meet standards of care for 60–70% of patients and are close to achieving a Green rating. This is expanded upon throughout the Report.
3.4 The Summary Table (Table 1) shows the key standards of care with their respective process measures, results for Year 1 and Year 2 of the Audit Report, with information on how this has changed over time, and an indication of hospital-level performance.
8 | NELA REPORT 2016
Figure 1 Proportion of all patients in Year 2 (who had surgery between December 2014 and November 2015) meeting the required standardLabels 0 1
CTscansreportedbyaconsultantradiologistbeforesurgery(72%) 72 72Documentedassessment,beforesurgery,oftherisksofsurgery(64%) 0 0Accesstotheatreswithoutdelay(82%) 0 0Reviewbeforesurgerybyconsultantsurgeonandanaesthetistforhighriskpatients(riskofdeath≥5%)(57%) 0 0Presenceofconsultantsurgeonandanaesthetistintheatreforhighriskpatients(riskofdeath≥5%)(74%) 0 0Admissiontocriticalcareaftersurgeryforhighestriskpatients(riskofdeath>10%)(85%) 0 0InputfromElderlyMedicinespecialistinthecareofolderpatients(10%) 10 0
CT scans reported by a consultant radiologist before surgery (72%)
Documented assessment, before surgery, of the risks of surgery
(64%)
Access to theatres without delay (82%)
Review before surgery by consultant surgeon and
anaesthetist for high risk patients (risk of death ≥5%) (57%)
Presence of consultant surgeon and anaesthetist in theatre for high
risk patients (risk of death ≥5%) (74%)
Admission to critical care after surgery for highest risk patients
(risk of death >10%) (85%)
Input from Elderly Medicine specialist in the care of older
patients (10%)
Figure 2 Proportion of hospitals in Year 2 rated ‘Green’ for each process measure (‘Green’ equates to the standard being met for at least 80% of patients)Labels 0 1
CTscansreportedbyaconsultantradiologistbeforesurgery(36%) 36 36Documentedassessment,beforesurgery,oftherisksofsurgery(23%) 0 0Accesstotheatreswithoutdelay(69%) 0 0Reviewbeforesurgerybyconsultantsurgeonandanaesthetistforhighriskpatients(riskofdeath≥5%)(14%) 0 0Presenceofconsultantsurgeonandanaesthetistintheatreforhighriskpatients(riskofdeath≥5%)(45%) 0 0Admissiontocriticalcareaftersurgeryforhighestriskpatients(riskofdeath>10%)(75%) 0 0InputfromElderlyMedicinespecialistinthecareofolderpatients(1%) 1 0
CT scans reported by a consultant radiologist before surgery (36%)
Documented assessment, before surgery, of the risks of surgery
(23%)
Access to theatres without delay (69%)
Review before surgery by consultant surgeon and
anaesthetist for high risk patients (risk of death ≥5%) (14%)
Presence of consultant surgeon and anaesthetist in theatre for high risk patients (risk of death
≥5%) (45%)
Admission to critical care after surgery for highest risk patients
(risk of death >10%) (75%)
Input from Elderly Medicine specialist in the care of older
patients (1%)
NELA REPORT 2016 | 9
4 Patient outcomes4.1 Postoperative mortality
The proportion of patients that died within 30 days of surgery (observed 30-day mortality) was 11.7% in Year 1 and 11.1% in Year 2. This confirms the high-risk nature of emergency bowel surgery. These figures are based on linking patients in the NELA database with independently verified mortality data from the Office for National Statistics (ONS). There was variation in risk-adjusted 30-day mortality between hospitals ranging from around 5% to 17%. No hospitals fell outside the range used to identify ‘outliers’ with unexpectedly high mortality rates.
4.2 Length of hospital stay More than half of patients who survived to leave hospital were in hospital for less than 11 days after surgery, but more than a quarter remained in hospital 20 days after surgery. Older patients were more likely to remain in hospital longer after surgery. Indicative figures based on government costings suggest that the cost of ward care alone for these patients is in excess of £200 million annually.a However there has been an improvement in average length of stay of almost two days, from 18.1 days in Year 1, to 16.3 days in Year 2. This represents an annual cost saving of over £22 million.
5 Key themes and the path to improvement5.1 Compared to the First NELA Patient Report, improved clinician engagement has resulted in a greater number of patients
being entered into NELA.
5.2 Improvements in processes of care have been seen since the First NELA Patient Report. More patients now receive a preoperative assessment of their risk of complications and death, and consultant presence during surgery has increased. Perioperative care is now largely consultant-driven, a substantial change from historical norms. However, there remain differences in consultant presence depending on the time of the day, or the day of the week, that surgery is undertaken.
5.3 This year’s results again confirm the importance of preoperative risk assessment. Where risks had been documented, patients were more likely to receive subsequent levels of care that met standards.
5.4 More hospitals are consistently delivering very high levels of service: around 30 more hospitals were rated Green for key metrics compared to last year. This demonstrates that it is possible to improve the care of emergency surgical patients within the NHS.
5.5 In general, improvement has taken place in areas that require change at the level of individual clinician and team behaviours (e.g. risk assessment and consultant presence). Clinicians should be commended for this, and encouraged to continue this improvement across other areas.
5.6 There has been little improvement across indicators that require change at an organisational level (e.g. access to theatres, critical care, and input from Elderly Medicine specialists). Rectifying this will require greater engagement between clinicians, managers and commissioners.
5.7 Inter-hospital variation in the provision of important elements of care is substantial. In many hospitals, provision of care (such as consultant presence and critical care admission) falls short of that provided for patients undergoing major elective surgery of comparable or lesser risk.
5.8 Older people continue to be the group that are at the highest risk, the longest length of stay and the highest mortality. Despite this we have not seen an improvement in collaborative working, with Elderly Medicine specialists being involved in fewer than 10% of older patients undergoing emergency laparotomy.
5.9 As continued effort is made to improve care, we expect to see a reduction in mortality. Many of the observed improvements in standards began during the current audit period. It is likely that any impact occurred too late to be reflected in this year’s mortality figures.
aBased on the cost of a hospital stay being estimated at £400/day (https://data.gov.uk/data-request/nhs-hospital-stay).

10 | NELA REPORT 2016
5.10 As standards of care improve, we would also expect to see a reduction in the length of stay for many patients. The reduction in length of stay seen in Year 2 represents a saving to the NHS of over £22 million. Investing in resources to bring about improvement and deliver high-quality care is therefore likely to be cost effective.
5.11 Examples of good practice have been collated within this Report and on the NELA website so that hospitals can adapt them for their own use. Several hospitals have made their pathways available to NELA. These are provided on the NELA website: www.nela.org.uk/pathway-examples.

11 | NELA REPORT 2016
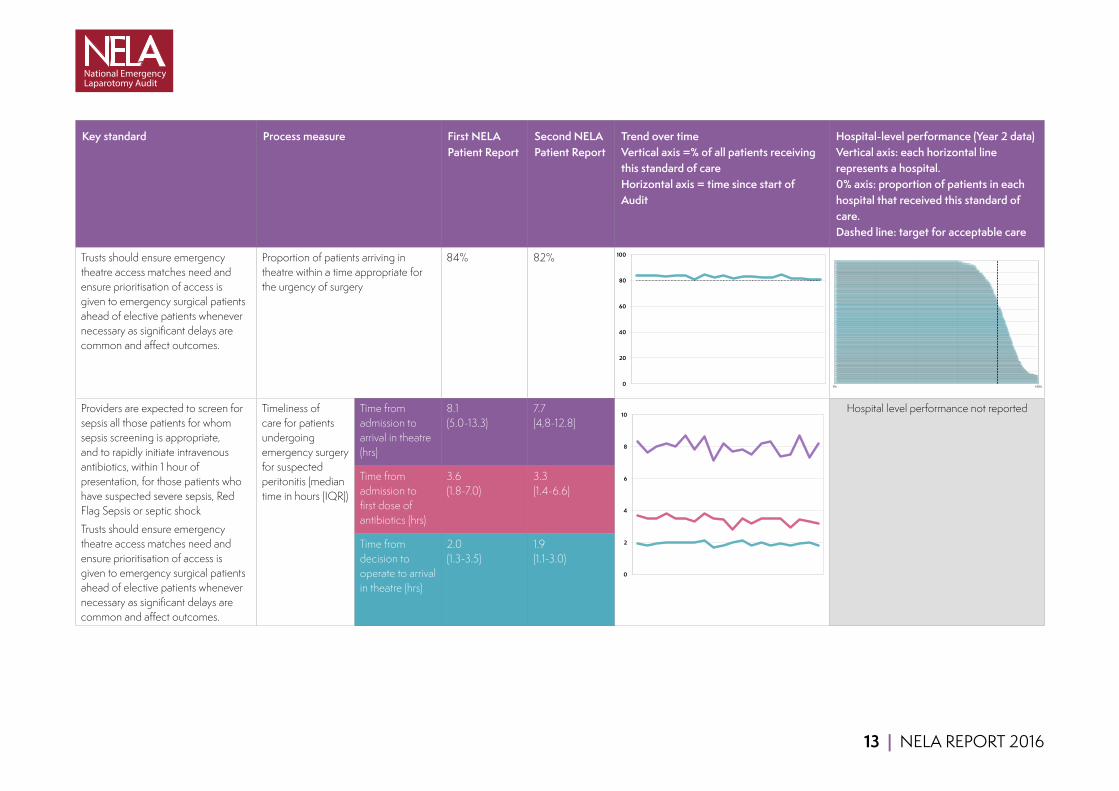
Table 1 Summary of standards, process measures, First and Second NELA Patient Reports performance, performance over time and hospital level performance
Key standard Process measure First NELA Patient Report
Second NELA Patient Report
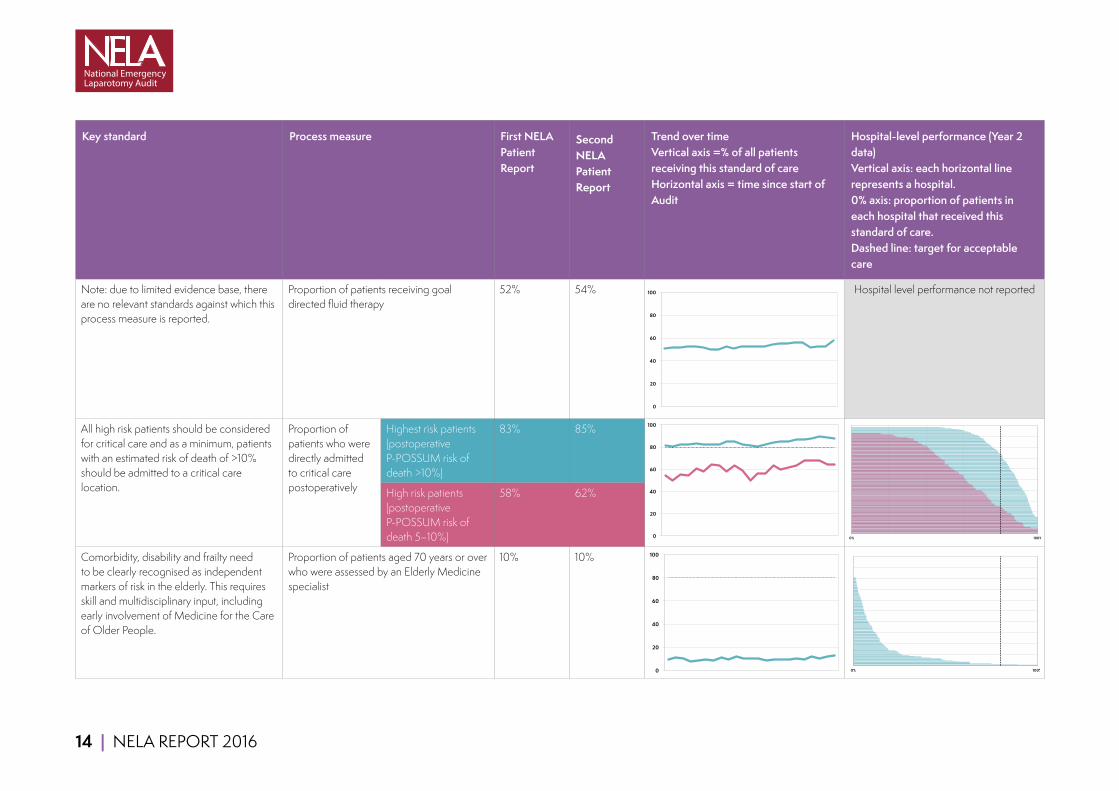
Trend over time Vertical axis =% of all patients receiving this standard of care Horizontal axis = time since start of Audit
Hospital-level performance (Year 2 data) Vertical axis: each horizontal line represents a hospital. 0% axis: proportion of patients in each hospital that received this standard of care. Dashed line: target for acceptable care
All emergency admissions must be seen and have a thorough clinical assessment by a suitable consultant as soon as possible but at the latest within 14 hours from the time of arrival at hospital.
Proportion of patients who were reviewed within 14 hours of hospital admission by a consultant surgeon
54% 55% Hospital level performance not reported
Hospitals which admit patients as emergencies must have access to both conventional radiology and CT scanning 24 hours per day, with immediate reporting.
Proportion of patients who received a CT scan before surgery
81% 83%
Proportion of patients who received a CT scan which was reported by a consultant radiologist before surgery
68% 72%
We recommend that objective risk assessment become a mandatory part of the preoperative checklist to be discussed between surgeon and anaesthetist for all patients. This must be more detailed than simply noting the ASA score.
Proportion of patients in whom a risk assessment was documented preoperatively
56% 64%
14hourconsultantsurgeonreview
Month %consrv<14 80%targetlineremovedintentionallyJan-14 54Feb-14 54Mar-14 55Apr-14 54
May-14 52Jun-14 54Jul-14 53
Aug-14 52Sep-14 54Oct-14 54Nov-14 55Dec-14 54Jan-15 56Feb-15 53Mar-15 54Apr-15 56
May-15 54Jun-15 54Jul-15 56
Aug-15 56Sep-15 57Oct-15 58Nov-15 55
CTscan
0
20
40
60
80
100
Month CTscanperfoCTscanrepo Target LinecoulourstomatchthecellsinthetableJan-14 78.8 65.7 80Feb-14 77.8 64.1 80Mar-14 80 66.5 80Apr-14 79 65.5 80May-14 80.8 67 80Jun-14 80.2 67.5 80Jul-14 82 70.3 80
Aug-14 80 68.4 80Sep-14 79.1 68 80Oct-14 81.9 70 80Nov-14 81.4 69.6 80Dec-14 79.9 69.4 80Jan-15 81.8 71.4 80Feb-15 82.1 71 80Mar-15 80.9 69.3 80Apr-15 82.4 71.3 80May-15 83.3 70.9 80Jun-15 84.1 73.7 80Jul-15 84.5 74.2 80
Aug-15 83.7 71.9 80Sep-15 84.5 74.2 80Oct-15 83.3 72.8 80Nov-15 83.9 75.2 80
Documentedrisk
Month %riskstrat TargetJan-14 53.2 80
0
20
40
60
80
100
Feb-14 54.4 80Mar-14 52.6 80Apr-14 56.4 80May-14 53 80Jun-14 56.1 80Jul-14 57.8 80Aug-14 57.2 80Sep-14 57 80Oct-14 58 80Nov-14 60 80Dec-14 57.9 80Jan-15 58.8 80Feb-15 60 80Mar-15 59.3 80Apr-15 62 80May-15 63.2 80Jun-15 64.2 80Jul-15 66.3 80Aug-15 67.6 80Sep-15 70.3 80Oct-15 68.9 80Nov-15 70.8 80
Pre-opconsultantreview
Month Reviewedby Reviewedby Reviewedby 80%Target LinecolourstomatchthecellsinthetableJan-14 71.3 80.6 59.7 80Feb-14 68.4 80.9 58.3 80Mar-14 69.9 81.2 59.4 80
0
20
40
60
80
100
Documentedrisk
%CTreported Target hospital riskstrat_premean1 0 0.8 MST 11 1 0.8 PRS 11 WLT 11 CTY 1
0.9701493 MAR 10.9428571 BRT 10.9285714 QKL 0.99038470.9166667 Colourstomatchcellsintable WSH 0.98581560.9117647 NOR 0.97752810.9074074 QEQ 0.9655172
0.9 HCH 0.95762710.9 NSH 0.956
0.8888889 KMH 0.93506490.8865248 SAN 0.92647060.8818897 BOL 0.92356690.8809524 LEW 0.91666670.8809524 FGH 0.90769230.8767123 BTH 0.90740740.8734177 KTH 0.89473690.8717949 HOM 0.8904110.8703704 WDG 0.8859650.8686868 UHW 0.87788780.8674699 BRG 0.8750.8671875 LEI 0.87288130.8648649 HAR 0.8688525
0.864 GGH 0.86666660.8636364 SLF 0.859375
0% 100% Pre-opconsultantreview
Target hospital >=5%risk,bothconsultan Target0 0.8 MST 1 01 0.8 PRS 1 1
WLT 1HHX 1MAR 1BRT 0.9666666WGH 0.9480519NSH 0.9424461SCA 0.9333334CHR 0.9230769CON 0.8833334DAR 0.875BRG 0.8636364WSH 0.8507462FRR 0.8421053FGH 0.84CKH 0.8378378OHM 0.8378378NDD 0.8333334STD 0.8333334STR 0.8333334NTG 0.8307692SHC 0.8275862SLF 0.8205128VIC 0.8143713ESU 0.8CMI 0.7945206
0% 100%

12 | NELA REPORT 2016
Key standard Process measure First NELA Patient Report
Second NELA Patient Report
Trend over time Vertical axis =% of all patients receiving this standard of care Horizontal axis = time since start of Audit
Hospital-level performance (Year 2 data) Vertical axis: each horizontal line represents a hospital. 0% axis: proportion of patients in each hospital that received this standard of care. Dashed line: target for acceptable care
Each higher risk case (predicted mortality ≥5%) should have the active input of consultant surgeon and consultant anaesthetist.
Proportion of patients with preoperative P-POSSUM risk of death ≥5% who were reviewed by a consultant surgeon, a consultant anaesthetist, and both consultants, before surgery
Preoperative review by a consultant surgeon
71% 71%
Preoperative review by a consultant anaesthetist
80% 77%
Preoperative review by both consultants
59% 57%
Proportion of patients with preoperative P-POSSUM risk of death ≥5% for whom a consultant surgeon, a consultant anaesthetist, and both consultants, were present in theatre
Consultant surgeon present in theatre
87% 89%
Consultant anaesthetist present in theatre
78% 82%
Both consultants present in theatre
70% 74%
Apr-14 72.4 78.6 59.3 80May-14 71.2 78.6 58.4 80Jun-14 71.9 78.5 58.9 80Jul-14 70.4 78.8 58.7 80
Aug-14 69.7 80.1 58.3 80Sep-14 70.3 78.3 57.9 80Oct-14 73.5 82.1 62.5 80Nov-14 70.2 80.1 59.7 80Dec-14 68.9 79.2 57.1 80Jan-15 70.7 76.9 57.1 80Feb-15 71.4 77.4 58.4 80Mar-15 68.4 79 55.9 80Apr-15 70.1 78.5 57.9 80May-15 71.2 81.2 60.1 80Jun-15 71.1 77.3 57.8 80Jul-15 72.7 72.5 56.1 80
Aug-15 72.1 73.8 57 80Sep-15 73.6 74.9 56.6 80Oct-15 73.9 72.5 55.7 80Nov-15 72.3 74.2 56.4 80
Intra-opconsultantpresence
Month Consultantsu Consultantan Bothconsulta 80%Target LinecolourstomatchthecellsinthetableJan-14 87.9 77.4 69.6 80Feb-14 85.7 76.9 68.6 80Mar-14 86.5 78 69.3 80Apr-14 88 75.5 68.4 80May-14 85.6 78.2 68.4 80
0
20
40
60
80
100
Jun-14 86.7 76.7 69 80Jul-14 86.2 76.5 68.8 80
Aug-14 86.5 77.3 69.3 80Sep-14 86.5 76.6 69.5 80Oct-14 88.3 79.4 71.6 80Nov-14 88.2 80.6 73.3 80Dec-14 85.9 80.7 70.9 80Jan-15 85.6 77.5 68.8 80Feb-15 87.4 80.5 71.8 80Mar-15 87.8 81.5 73.7 80Apr-15 88.1 80.2 72.1 80
May-15 87.4 81.6 73.3 80Jun-15 88.4 81.3 74.3 80Jul-15 89.3 82.5 75.5 80
Aug-15 90.7 81.4 75.2 80Sep-15 90.8 84.3 78.5 80Oct-15 91.3 83.8 76.9 80Nov-15 92.2 85.4 79.8 80
Timelinessofarrivalintheatre
Month Arrivedinthea TargetApr-14 83.5 80
May-14 84 80Jun-14 83.9 80Jul-14 82.9 80
Aug-14 83.9 80Sep-14 84.1 80Oct-14 80.9 80
0
20
40
60
80
100
Intra-opconsultantpresence
hospital >=5%risk,bothconsultan Target0.8 GHS 1 0 0.80.8 MST 1 1 0.8
WLT 1HHX 1BMP 1MAR 1NEV 1SHH 1VIC 1WHH 1WGH 0.9880952CHR 0.984375NCR 0.984127NSH 0.9821429CMI 0.9820359BRT 0.9752066RHC 0.9666666WSH 0.9646017MPH 0.9640288KTH 0.9615385DAR 0.961039CLW 0.9538461KMH 0.9508197NDD 0.945946CON 0.9444444SHC 0.9375YDH 0.9333334
0% 100% Timelinessofarrivalintheatre
hospital urg_otdelaymean TargetGHS 1 0 0.8MST 1 1 0.8PRS 1WLT 1BMP 1HHX 1CKH 1MAR 1MAY 1LHC 1PAH 1NOT 1HAR 0.9827586HCH 0.9782609NDD 0.9565218STD 0.9565218WMU 0.9473685BED 0.9464286PIL 0.9423077NHH 0.9402985RLI 0.9361702WAW 0.9318182MAC 0.9302326CON 0.9272727BRI 0.9256198SHC 0.9245283SCU 0.92
0% 100%
13 | NELA REPORT 2016
Key standard Process measure First NELA Patient Report
Second NELA Patient Report
Trend over time Vertical axis =% of all patients receiving this standard of care Horizontal axis = time since start of Audit
Hospital-level performance (Year 2 data) Vertical axis: each horizontal line represents a hospital. 0% axis: proportion of patients in each hospital that received this standard of care. Dashed line: target for acceptable care
Trusts should ensure emergency theatre access matches need and ensure prioritisation of access is given to emergency surgical patients ahead of elective patients whenever necessary as significant delays are common and affect outcomes.
Proportion of patients arriving in theatre within a time appropriate for the urgency of surgery
84% 82%
Providers are expected to screen for sepsis all those patients for whom sepsis screening is appropriate, and to rapidly initiate intravenous antibiotics, within 1 hour of presentation, for those patients who have suspected severe sepsis, Red Flag Sepsis or septic shock
Trusts should ensure emergency theatre access matches need and ensure prioritisation of access is given to emergency surgical patients ahead of elective patients whenever necessary as significant delays are common and affect outcomes.
Timeliness of care for patients undergoing emergency surgery for suspected peritonitis (median time in hours (IQR))
Time from admission to arrival in theatre (hrs)
8.1 (5.0-13.3)
7.7 (4,8-12.8)
Hospital level performance not reported
Time from admission to first dose of antibiotics (hrs)
3.6 (1.8-7.0)
3.3 (1.4-6.6)
Time from decision to operate to arrival in theatre (hrs)
2.0 (1.3-3.5)
1.9 (1.1-3.0)
Nov-14 84.4 80Dec-14 82.4 80Jan-15 83.5 80Feb-15 81.8 80Mar-15 82.6 80Apr-15 83.2 80
May-15 82.1 80Jun-15 81.9 80Jul-15 84.2 80
Aug-15 81.8 80Sep-15 81.2 80Oct-15 80.7 80Nov-15 80.6 80
Peritonitis
Month Mediantime Mediantime MediantimefromdecisiontooperatetoarrivalintheatreApr-14 8.3 3.7 1.9
May-14 7.6 3.5 1.8Jun-14 8 3.5 1.9 LinecolourstomatchthecellsinthetableJul-14 8.2 3.8 2
Aug-14 8 3.5 2Sep-14 8.7 3.5 2Oct-14 7.8 3.3 2Nov-14 8.6 3.8 2.1Dec-14 7.1 3.5 1.7Jan-15 8.2 3.4 1.8Feb-15 7.7 2.8 2Mar-15 7.8 3.5 2.1
0
20
40
60
80
100
Apr-15 7.5 3.2 1.8May-15 8.2 3.5 2Jun-15 8.3 3.5 1.8Jul-15 7.4 3.5 1.9
Aug-15 7.5 2.9 1.8Sep-15 8.7 3.4 1.9Oct-15 7.3 3.3 2Nov-15 8.2 3.2 1.8
Goaldirectedfluid
Month %receivingGDFT TargetlineremovedintentionallyJan-14 50.8Feb-14 51.5Mar-14 51.5Apr-14 52.3
May-14 52.5Jun-14 51.4Jul-14 50
Aug-14 49.5Sep-14 52.5Oct-14 50.5Nov-14 52.8Dec-14 53Jan-15 53Feb-15 52.4Mar-15 54.1Apr-15 55.1
May-15 55.2
0
2
4
6
8
10
Criticalcareadmission
hospital 5-10%risk >10%risk TargetBMP 1 1 0 0.8CAS 1 1 1 0.8HHX 1 1LHC 1 1MAR 1 1MST 1 1PAP 1 1PRS 1 1 ColourstomatchcellsintableWLT 0.9642857 1HUL 0.962963 1LER 0.96 1LEI 0.9285714 1FGH 0.9230769 1QEG 0.9230769 1SLF 0.9230769 1CHE 0.9230769 1SHC 0.9210526 1KTH 0.9166667 1DER 0.9130435 1BRG 0.8947369 1GLG 0.8913044 1QKL 0.882353 1PMS 0.8809524 1RSU 0.8787878 1LIN 0.8780488 1TUN 0.875 1UCL 0.875 1
0% 100%
14 | NELA REPORT 2016
Key standard Process measure First NELA Patient Report
Second NELA Patient Report
Trend over time Vertical axis =% of all patients receiving this standard of care Horizontal axis = time since start of Audit
Hospital-level performance (Year 2 data) Vertical axis: each horizontal line represents a hospital. 0% axis: proportion of patients in each hospital that received this standard of care. Dashed line: target for acceptable care
Note: due to limited evidence base, there are no relevant standards against which this process measure is reported.
Proportion of patients receiving goal directed fluid therapy
52% 54% Hospital level performance not reported
All high risk patients should be considered for critical care and as a minimum, patients with an estimated risk of death of >10% should be admitted to a critical care location.
Proportion of patients who were directly admitted to critical care postoperatively
Highest risk patients (postoperative P-POSSUM risk of death >10%)
83% 85%
High risk patients (postoperative P-POSSUM risk of death 5–10%)
58% 62%
Comorbidity, disability and frailty need to be clearly recognised as independent markers of risk in the elderly. This requires skill and multidisciplinary input, including early involvement of Medicine for the Care of Older People.
Proportion of patients aged 70 years or over who were assessed by an Elderly Medicine specialist
10% 10%
Jun-15 56.4Jul-15 55.8
Aug-15 52.1Sep-15 52.4Oct-15 52.3Nov-15 57.5
Criticalcareadmission
Month %admittedt %admittedt TargetJan-14 54.2 81.6 80 LinecolourstomatchthecellsinthetableFeb-14 50.3 80.5 80Mar-14 55.3 82.1 80Apr-14 54.2 82.6 80
May-14 60.4 83.4 80Jun-14 57.7 82.7 80Jul-14 63.9 82.7 80
Aug-14 63.5 82.7 80Sep-14 57.7 84.6 80Oct-14 63.1 85.2 80Nov-14 58.5 82.1 80Dec-14 49.8 81.2 80Jan-15 55.8 80.1 80Feb-15 56.6 82.7 80Mar-15 63.3 84.3 80Apr-15 59.9 85.3 80
May-15 61.5 85.2 80Jun-15 63.4 86.6 80Jul-15 67.7 87.2 80
0
20
40
60
80
100
Aug-15 68.1 87.7 80Sep-15 67.9 89.9 80Oct-15 63.9 88.9 80Nov-15 64 87.5 80
Elderly Medicine review
Month % >70 assess TargetJan-14 9.7 80Feb-14 11.3 80Mar-14 10.6 80Apr-14 7.4 80
May-14 9 80Jun-14 9.5 80Jul-14 8.9 80
Aug-14 11.1 80Sep-14 9.3 80Oct-14 12.2 80Nov-14 10.2 80Dec-14 10.7 80Jan-15 10.2 80Feb-15 8.4 80Mar-15 9.3 80Apr-15 9.1 80
May-15 9.8 80Jun-15 9.9 80Jul-15 9.3 80
Aug-15 11.6 80Sep-15 10.6 80
0
20
40
60
80
100
Oct-15 11.8 80Nov-15 12.7 80
0
20
40
60
80
100
ElderlyMedicinereview
hospital geri_postmean TargetWHC 1 0 0.8BRG 0.8928571 1 0.8RAD 0.75KMH 0.6346154CHX 0.6315789HIL 0.6315789STH 0.5675676SLF 0.5384616KCH 0.5NTG 0.4878049HOM 0.4782609STM 0.4761905RBE 0.4177215WHT 0.3703704BRD 0.3703704RLI 0.3333334NSH 0.3035714CLW 0.2653061BAS 0.2619048VIC 0.2535211MAY 0.25RLU 0.2459016RDE 0.2403846YDH 0.2391304DRY 0.2272727UCL 0.1904762GGH 0.1904762
0% 100%
0% 100%

NELA REPORT 2016 | 15
3 RECOMMENDATIONSUsing the Audit’s findings to improve careProcess measuresProcess measures are sensitive indicators of performance, and serve to highlight where specific actions are required to bring about improvements in care. Many hospitals currently meet standards of care for 60–70% of patients and are close to achieving a ‘Green’ rating. Clinicians, hospital managers and commissioners should examine their results. They should determine why standards are met for some of their patients, but not others, and seek to achieve more consistent delivery of high-quality care. They should monitor measures over time to assess the impact of any changes.
Mortality and other outcomesClinicians, hospital managers and commissioners also need to examine their hospital’s 30-day mortality and length of stay figures. The variation between hospitals in these measures suggests that there is room for improvement in many hospitals, especially where standards of care are not being reliably met. Whilst no hospitals were statistical ‘outliers’ for 30-day postoperative mortality, several had figures approaching a level that causes concern (‘alert’ status) – Commissioners, Chief Executives Medical and Clinical Directors, and Multidisciplinary Teams of such hospitals should make particular efforts to address any shortfalls in standards of care (Chapter 17.1).
The following 12 recommendations are aimed at addressing the key themes identified in this NELA Patient Report. Specific recommendations are highlighted in the relevant chapters.
Improvements since last year have predominantly been seen in areas involving a change in individual clinicians’ and teams’ behaviour. This needs to continue, but a more sustained effort is required to bring about the organisational change necessary to prioritise emergency care.
Commissioners 1 Commissioners should review the Audit results for hospitals from which they commission services, to assure themselves
of the quality of care provided to patients undergoing emergency laparotomy. Where hospitals fall short of standards, or where mortality is of concern, commissioners should ensure that there is adequate commissioning of:
■ Multidisciplinary input across the whole of the patient pathway (Chapters 8, 9, 13, 15 and 16).
■ Capacity to deliver consultant-delivered care and other services, such as CT scanning and reporting regardless of the time of the day or the day of the week (Chapters 8, 9 and 13).
■ Theatre capacity to prevent delays for patients requiring emergency bowel surgery. Some hospitals may require the capacity for emergency and elective care to continue in parallel (Chapter 12).
■ Critical care capacity to match high-risk caseload, such that all high-risk emergency laparotomy patients can be cared for on a critical care unit after surgery (Chapter 15).
■ Elderly Medicine services to provide input for older patients (Chapter 16).
Providers (Chief Executives and Medical Directors)In order to deliver high-quality care to high-risk emergency patients that meets standards, attention should be directed at organisational change in the following areas:
2 Patients undergoing emergency bowel surgery require consultant involvement in their care 24 hours per day, seven days per week. Rotas, job plans and staffing levels for surgeons and anaesthetists should reflect this. The workload may require an increase in the number of consultants available for emergency work. In some hospitals, this may require separation of elective and emergency care so that both services can continue in parallel without competing for resources. Delivery of high-quality care can be facilitated by reconfiguring services to locate acute surgical patients within a single area. (Chapters 8 and 13).
16 | NELA REPORT 2016
3 Policies should be developed and implemented which use individual risk assessment to guide allocation of resources (e.g. critical care) appropriate to the patient’s needs (Chapters 10, 15 and 17). This can also help with capacity planning by defining a hospital’s expected caseload and resource requirements.
4 Provision of emergency theatre capacity needs to be sufficient to enable patients to receive emergency surgical treatment without undue delay, and may require capacity to allow emergency and elective care to continue in parallel. Where capacity is limited, prioritisation of time-sensitive emergency surgery can be facilitated by policies to defer elective activity (Chapters 11 and 12).
5 National standards for postoperative critical care admission should be adhered to. This may require an increase in critical care capacity so that emergency and elective care can continue in parallel (Chapter 15).
6 Data collected from NELA has the potential to inform NHS trust boards of many different aspects of emergency care provision. Local NELA Leads and perioperative teams must have adequate time and resources to support accurate data collection, review adverse patient outcomes, and to feed this back to clinical teams and hospital management including NHS trust boards. Such resources include access to individuals with audit and quality improvement skills throughout the NHS trust, allocated (job-planned) time to support data collection and analysis, and protected time for presentation of data in departmental meetings. Effort should be invested in ensuring clinical coding is accurate (Chapters 5, 17 and 18).
Clinical Directors and Multidisciplinary Teams Patients undergoing emergency bowel surgery will receive care from a variety of clinical specialties, including the emergency department or acute admissions unit, radiology, surgery, anaesthesia, operating theatres, critical care and elderly care. These recommendations apply across these areas, as in many cases the need for change is not confined to a single area or specialty.
7 In order to reduce variation in care and minimise delays, hospitals should implement appropriate pathways for the care of emergency General Surgical patients, starting at the time of admission to hospital or referral by another team. Where pathways of care do already exist, Multidisciplinary Teams (MDT) should examine these in the light of audit data to determine their effectiveness, and identify why standards are still not met. Care pathways should ensure patients are admitted under the most appropriate specialty, aid communication within the MDT, prioritise emergency resources, and aim to ensure that all processes of care are provided for each patient. Standardised pathways of care also facilitate audit and thereby highlight key areas for improvement. Pathways should cover the following areas:
■ Referral of patients for General Surgical review if they have been admitted under non-surgical specialties.
■ Identification of patients with signs of sepsis and prompt prescription and administration of antibiotics.
■ Identification and escalation of care of patients who would benefit from the opinion of a consultant surgeon before the next scheduled ward round.
■ Rapid request, conduct, and reporting of CT scans.
■ Routine documented assessment of the risk of complications and death from surgery.
■ Presence of consultant surgeon and consultant anaesthetist for high-risk patients with a predicted mortality ≥5%.
■ Admission to critical care for patients with a predicted mortality >10%.
■ Identification of patients who would benefit from input from Elderly Medicine specialists in their perioperative care.
8 Multidisciplinary Teams should hold regular joint meetings to continuously review essential processes of care (for instance, using the NELA Quality Improvement Dashboard) and review perioperative morbidity (including unplanned returns to theatre and admissions to critical care) and mortality following emergency laparotomy. This should include formal collaboration with hospital mortality review panels in order to bring about greater understanding of where improvement is needed (Chapters 17 and 18).
9 Continuous quality improvement informed by local data should involve monitoring the impact of pathway and process changes with time-series data (run charts). The NELA web tool provides automated dashboards that can be used for this purpose. Multidisciplinary Teams should ensure that they include members with a good understanding of quality improvement principles, such as the Model for Improvement and good data feedback practices (Chapter 18).

NELA REPORT 2016 | 17
NELA LeadsWe are grateful to NELA participants for increasing case ascertainment and ensuring that data completeness was generally good. However, at some hospitals, data entry for many cases was started but not completed. In addition, fields relating to the timing of key points in the patient pathway (e.g. time of consultant surgeon review, decision to operate) were poorly completed by many hospitals (Chapter 5). Collection and feedback of high-quality data is vital to bring about improvements in care.
10 NELA Leads should review their local data to ensure case-submission and data completeness. Where data collection and entry is a problem, NELA Leads, supported by NHS trust resources, should work with clinical teams to improve this, to facilitate future audit and quality improvement (Chapter 5).
11 NELA Leads should actively promote completion of P-POSSUM data fields to ensure that risk estimation is accurate and avoid falsely elevated risk-adjusted hospital mortality rates (Chapter 5). This is in addition to the finding that standards of care were better met where risk assessment had been carried out.
Professional Stakeholder Organisations12 Professional stakeholders, such as Royal Colleges and Specialist Societies, should collaborate to:
■ Improve clarity and remove ambiguity in the wording of standards of care. This would be particularly welcome for standards for admission to critical care (Chapter 15).
■ Bring together standards in a single, unified document.
■ Highlight the issues to their members to ensure appropriate engagement.
18 | NELA REPORT 2016
4 INTRODUCTION TO THE SECOND NELA PATIENT AUDIT REPORT
What is an emergency laparotomy? Emergency laparotomy and emergency bowel surgery are terms used to describe a wide range of emergency operations on the bowel. These may be performed for a variety of conditions, including complications of elective (planned) surgery. Approximately 30,000 emergency laparotomies are performed annually in England alone.1,2
The majority of patients undergoing emergency laparotomy have potentially life-threatening conditions that require prompt investigation and treatment. Unlike elective surgery, there is often limited time to carry out investigations. These operations frequently need to be performed at short notice, and delays can lead to increased complications and risk of death.
Death, complications, prolonged in-hospital recovery, and long-term debilitation are far more common after emergency bowel surgery than after many other operations.6,7 Data from across the world have consistently shown that about 15% of patients die within a month of emergency bowel surgery.1,3,4,5 This is five to ten times greater than for ‘high-risk’ elective surgery such as cardiac, vascular and cancer surgery, including elective bowel surgery.
Why was the Audit commissioned?The National Emergency Laparotomy Audit (NELA) was commissioned by the Healthcare Quality Improvement Partnership (HQIP), and funded by NHS England and the Welsh Government. Its aims are to collect and publish high-quality comparative information from all hospitals in England and Wales at which emergency laparotomies are performed, in order to drive quality improvement in the care of these patients. It was established in response to the comparatively high death rate after emergency laparotomy, and the substantial variation in this rate between hospitals.3 Groups of doctors, including the Emergency Laparotomy Network, had become concerned that variation in the quality of delivered care might explain these figures and lobbied for a national audit.
The contract to run NELA was awarded to the Royal College of Anaesthetists (RCoA). The Audit commenced in December 2012 and is currently funded to run until November 2017. It is being run with significant input from the Clinical Effectiveness Unit of the Royal College of Surgeons of England (RCS). Additional information about its governance and organisational arrangements are presented in Chapter 21.5.
What contributes to patient outcomes?Adverse patient outcomes after emergency laparotomy (such as death and complications) may result from pre-existing health conditions of the patient having surgery, the nature of the surgery, or a variety of factors that affect the quality of care administered.8 The latter may relate to the facilities available within a hospital (structural factors), or the process of delivery of care (process measures).
Structural factors include both the presence and prompt availability of hospital facilities and the appropriately trained personnel who are required to staff them. Without timely access to essential staffed facilities, a patient’s treatment options may be limited and essential care delayed. NELA’s first Report was an Organisational Report that highlighted variation in the provision of facilities for emergency laparotomy provided by hospitals across England and Wales and was published in May 2014.9
Process measures describe the quality and speed with which assessments, diagnoses and treatments are made or delivered to individual patients. These may include:
NELA REPORT 2016 | 19
■ The type of operation performed, how promptly it is arranged after admission to hospital, and the seniority of supervising surgeons and anaesthetists.
■ How quickly antibiotics are given.
■ Whether patients are cared for in a critical care unit directly after surgery.
Underpinning all these decisions is the assessment, interpretation, and communication of the risks of death and serious complications for each individual patient. Communication is important both between clinicians to ensure that the best care is delivered, and between clinicians and patients and their next of kin, to ensure that the right decisions are agreed for each patient in the context of their individual situation.
A variety of standards exist that set out how these processes should be delivered in hospitals in order that patients receive high-quality care. NELA assesses delivery of care against these standards. A full list of these standards is provided in the relevant tables in each chapter.
What are the overall aims of the Patient Audit?The Audit’s aims are:
■ To audit the delivery of key processes of care for patients undergoing emergency laparotomy, and to report hospital-level information in order to:
› Highlight variation.
› Identify hospitals providing high levels of compliance with existing standards of care.
› Share best practice.
› Support quality improvement efforts locally, regionally and nationally.
■ To report outcomes for patients undergoing emergency laparotomy in England and Wales at hospital level, including:
› 30-day mortality.
› Length of postoperative hospital stay.
› Unplanned returns to theatre.
› Unplanned escalation in the level of postoperative care.
What does this Second NELA Patient Report cover?This is the Second NELA Patient Report, and covers the care received by patients who underwent an emergency laparotomy between 1 December 2014 and 30 November 2015.
Without robustly collected process and outcome data it has, until now, been difficult to know where improvement work should be focused. This Report describes how well NHS hospitals in England and Wales are providing care, and provides each hospital with an individual breakdown of performance against published standards. This allows the best performing hospitals to be identified so that good practice can be disseminated. It also allows hospitals to see areas where they can improve. Differences in the structure of hospitals mean that it is unlikely that generic solutions will be applicable in all circumstances. Each hospital should examine its own structures, processes and outcomes to identify areas for improvement and develop local quality improvement initiatives.
In addition to the process measures described above, this Report also includes hospital-level postoperative mortality figures based on data from the national death register provided by the Office for National Statistics (ONS), covering patients who underwent surgery from December 2013 to November 2015. Hospital-level risk-adjusted 30-day mortality figures have been presented to allow comparisons between hospitals with different case-mix (Chapter 17.1). This has been subject to an outlier analysis to detect hospitals that have outcomes that are statistically different from their peers. The collection of patient-level data is ongoing, with results published annually.

20 | NELA REPORT 2016
Overview of the First NELA Patient ReportThe First NELA Patient Report published hospital-level data on process measures, and information on the overall mortality of patients who had an emergency laparotomy. The Report found wide variation in the degree to which standards of care were met, with some hospitals providing high levels of care. We were able to contact these hospitals and disseminate information on what they were doing well, to aid quality improvement elsewhere. The overall 30-day inpatient mortality was 11%. One of the key messages to arise from the First Report was the role that risk assessment played in delivery of care. Those patients with a documented assessment of risk from emergency laparotomy were more likely to receive a subsequent level of care that met standards. This formed a key message in various publications and communication with professional stakeholders.
Overview of audit methodsAll NHS hospitals in England and Wales that undertake emergency laparotomy were invited to participate in the NELA Patient Audit. Audit leads were identified at each hospital to coordinate collection of patient data. Specific inclusion and exclusion criteria were developed to define exactly which patients should be included in the Audit. The Audit dataset was designed by the NELA Project Team with input from clinical stakeholders, and was designed to collect data that will allow comparison of care with published standards. Data were submitted to NELA via a web tool (https://data.nela.org.uk). At the end of the data-collection window, all data were downloaded from the web tool and analysed to provide the results. Comprehensive information is available in the Technical Documents that accompany this report on the NELA website (www.nela.org.uk/reports).
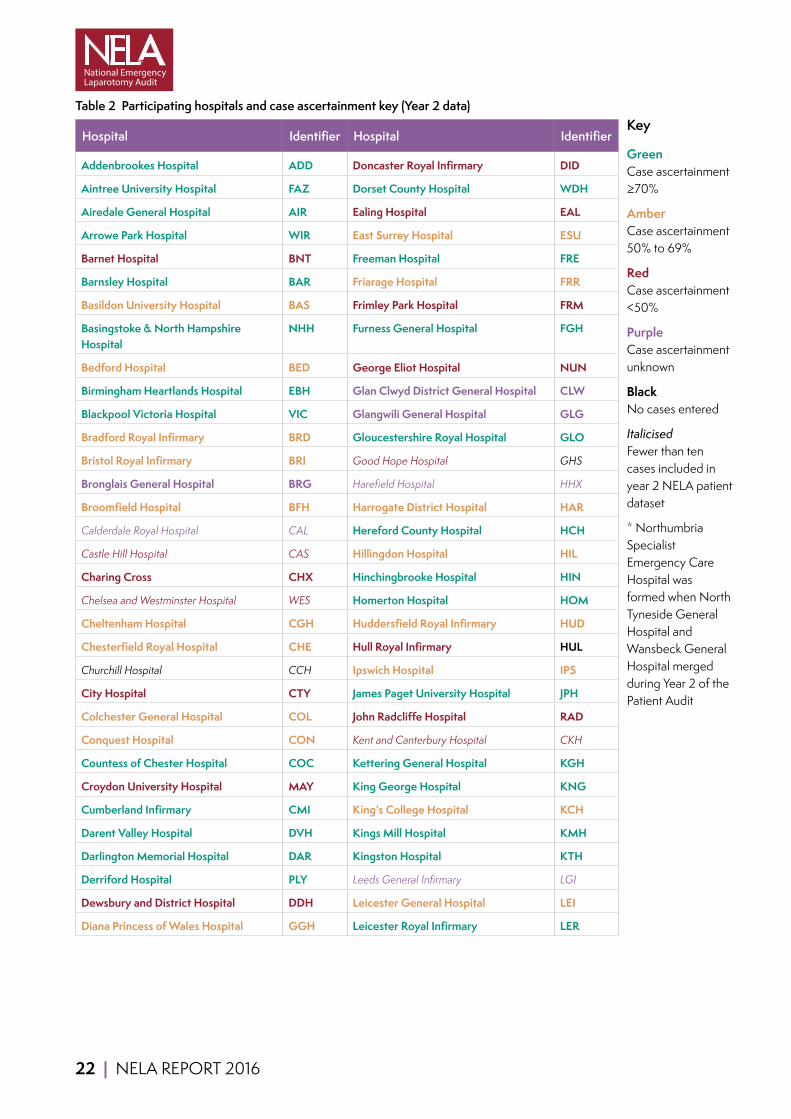
Participating hospitals and case ascertainmentThe Audit collects data on all patients aged 18 years or over undergoing emergency bowel surgery in an NHS hospital in England and Wales. Of the 191 hospitals that perform emergency laparotomy surgery, data were received from 186. A list of these hospitals is shown in Table 2 below.
Case ascertainment describes the proportion of emergency laparotomy patients on whom data were received, compared to the total number of emergency laparotomies performed. A high case ascertainment rate means that we can be more confident that the Audit’s results accurately describe the quality of care received by patients. This Report includes details for 23,138 patients, representing a high case ascertainment rate of approximately 70% of all patients that underwent emergency bowel surgery. We would urge caution when interpreting results from hospitals with low case ascertainment rates, as they may not have provided sufficient data to accurately describe the quality of patient care. Additional information on case ascertainment is provided in Chapter 5, Figure 41, and the Technical Documents accompanying this Report on the NELA website (www.nela.org.uk/reports).
How to read this ReportThe Report is divided into chapters, each covering a different part of the patient’s care pathway.
■ Key process measures are described in Chapters 7 to 16, and patient outcomes are described in Chapter 17.
■ These chapters provide:
› A description of the standards against which processes of care were measured, and the audit question being asked.
› An overall description of the extent to which a standard was met for all patients.
› A description of the results at hospital level, including comment on variability of care.
› A clinical commentary explaining the implications of the results.
› A time-series ‘run chart’ illustrating change in proportion of patients meeting each standard since the start of patient data collection. Although the Audit started collecting patient data in December 2013, these charts commence from January 2014 as there were relatively limited data available in the first month of the Audit.
■ In general, we have reported the number of hospitals that have achieved a standard of care using a RAG rating, where provision of care to at least 80% of patients constitutes an acceptable standard of care. Further information on the RAG rating is provided in Chapter 7.
■ The majority of percentage figures in the table columns have been rounded to the nearest whole number, as a result some columns may not total 100% when the individual rounded percentages are summed.

NELA REPORT 2016 | 21
We have produced graphs that show each hospital’s performance against its peers. Each hospital has been allocated an individual three-letter code. The list of hospitals and codes is shown in Table 2. In order to find each hospital within the Report, we recommend that the reader views an electronic version of the document and uses the ‘find’ function found in most PDF readers. This can usually be accessed by pressing ‘Ctrl’ + ‘F’ key, typing the three letter code into the box and pressing the ‘Enter’ key. Please also use the dropdown under the search box to select ‘whole words only’. This will indicate the position of a hospital within various hospital-level graphs and tables throughout the Report. This function may only work if the Report is downloaded rather than viewed within a web browser.
22 | NELA REPORT 2016
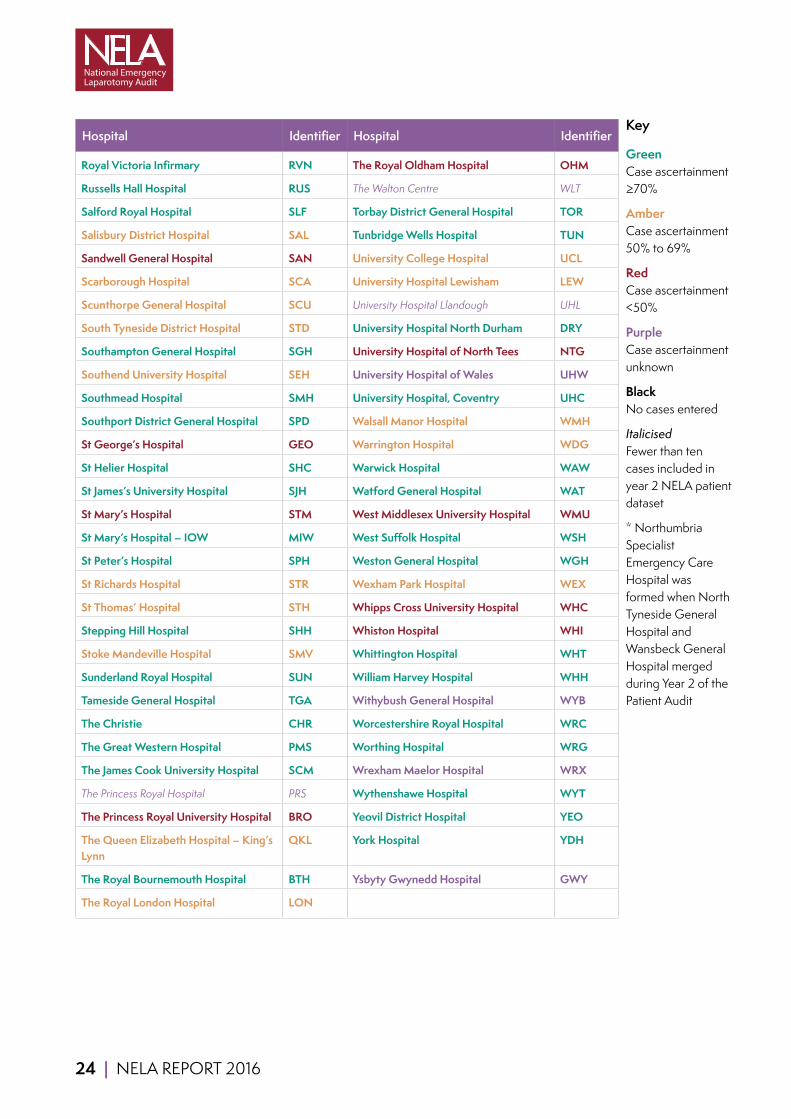
Table 2 Participating hospitals and case ascertainment key (Year 2 data)
Hospital Identifier Hospital Identifier
Addenbrookes Hospital ADD Doncaster Royal Infirmary DID
Aintree University Hospital FAZ Dorset County Hospital WDH
Airedale General Hospital AIR Ealing Hospital EAL
Arrowe Park Hospital WIR East Surrey Hospital ESU
Barnet Hospital BNT Freeman Hospital FRE
Barnsley Hospital BAR Friarage Hospital FRR
Basildon University Hospital BAS Frimley Park Hospital FRM
Basingstoke & North Hampshire Hospital
NHH Furness General Hospital FGH
Bedford Hospital BED George Eliot Hospital NUN
Birmingham Heartlands Hospital EBH Glan Clwyd District General Hospital CLW
Blackpool Victoria Hospital VIC Glangwili General Hospital GLG
Bradford Royal Infirmary BRD Gloucestershire Royal Hospital GLO
Bristol Royal Infirmary BRI Good Hope Hospital GHS
Bronglais General Hospital BRG Harefield Hospital HHX
Broomfield Hospital BFH Harrogate District Hospital HAR
Calderdale Royal Hospital CAL Hereford County Hospital HCH
Castle Hill Hospital CAS Hillingdon Hospital HIL
Charing Cross CHX Hinchingbrooke Hospital HIN
Chelsea and Westminster Hospital WES Homerton Hospital HOM
Cheltenham Hospital CGH Huddersfield Royal Infirmary HUD
Chesterfield Royal Hospital CHE Hull Royal Infirmary HUL
Churchill Hospital CCH Ipswich Hospital IPS
City Hospital CTY James Paget University Hospital JPH
Colchester General Hospital COL John Radcliffe Hospital RAD
Conquest Hospital CON Kent and Canterbury Hospital CKH
Countess of Chester Hospital COC Kettering General Hospital KGH
Croydon University Hospital MAY King George Hospital KNG
Cumberland Infirmary CMI King’s College Hospital KCH
Darent Valley Hospital DVH Kings Mill Hospital KMH
Darlington Memorial Hospital DAR Kingston Hospital KTH
Derriford Hospital PLY Leeds General Infirmary LGI
Dewsbury and District Hospital DDH Leicester General Hospital LEI
Diana Princess of Wales Hospital GGH Leicester Royal Infirmary LER
Key
Green Case ascertainment ≥70%
Amber Case ascertainment 50% to 69%
Red Case ascertainment <50%
Purple Case ascertainment unknown
Black No cases entered
Italicised Fewer than ten cases included in year 2 NELA patient dataset
* Northumbria Specialist Emergency Care Hospital was formed when North Tyneside General Hospital and Wansbeck General Hospital merged during Year 2 of the Patient Audit

NELA REPORT 2016 | 23
Hospital Identifier Hospital Identifier
Leighton Hospital LEG Princess of Wales Hospital POW
Lincoln County Hospital LIN Queen Alexandra Hospital QAP
Lister Hospital LIS Queen Elizabeth Hospital – Gateshead QEG
Liverpool Heart and Chest Hospital LHC Queen Elizabeth Hospital (Lewisham and Greenwich NHS Trust)
QEL
Luton & Dunstable Hospital LDH Queen Elizabeth Hospital Birmingham QEB
Macclesfield District General Hospital MAC Queen Elizabeth The Queen Mother Hospital
QEQ
Maidstone Hospital MST Queen’s Hospital – Burton BRT
Manchester Royal Infirmary MRI Queen’s Hospital – Romford QHR
Medway Maritime Hospital MDW Queens Medical Centre – Nottingham QMC
Milton Keynes Hospital MKH Rotherham Hospital ROT
Morriston Hospital MOR Royal Albert Edward Infirmary AEI
Musgrove Park Hospital MPH Royal Berkshire Hospital RBE
Nevill Hall Hospital NEV Royal Blackburn Hospital BLA
New Cross Hospital NCR Royal Bolton Hospital BOL
Newham University Hospital NWG Royal Brompton Hospital BMP
Norfolk and Norwich University Hospital
NOR Royal Cornwall Hospital RCH
North Devon District Hospital NDD Royal Derby Hospital DER
North Manchester General Hospital NMG Royal Devon & Exeter Hospital RDE
North Middlesex University Hospital NMH Royal Free Hospital RFH
Northampton General Hospital NTH Royal Glamorgan RGH
Northern General Hospital NGS Royal Gwent Hospital GWE
Northumbria Specialist Emergency Care Hospital*
NSH Royal Hampshire County Hospital RHC
Northwick Park/St Marks Hospital NPH Royal Lancaster Infirmary RLI
Nottingham City Hospital NOT Royal Liverpool University Hospital RLU
Papworth Hospital PAP Royal Marsden Hospital MAR
Peterborough City Hospital PET Royal Preston Hospital RPH
Pilgrim Hospital PIL Royal Shrewsbury Hospital RSS
Pinderfields Hospital PIN Royal Stoke University Hospital RSH
Poole Hospital PGH Royal Surrey County Hospital RSU
Prince Charles Hospital PCH Royal Sussex County Hospital RSC
Princess Alexandra Hospital PAH Royal United Hospital BAT
Key
Green Case ascertainment ≥70%
Amber Case ascertainment 50% to 69%
Red Case ascertainment <50%
Purple Case ascertainment unknown
Black No cases entered
Italicised Fewer than ten cases included in year 2 NELA patient dataset
* Northumbria Specialist Emergency Care Hospital was formed when North Tyneside General Hospital and Wansbeck General Hospital merged during Year 2 of the Patient Audit
24 | NELA REPORT 2016
Hospital Identifier Hospital Identifier
Royal Victoria Infirmary RVN The Royal Oldham Hospital OHM
Russells Hall Hospital RUS The Walton Centre WLT
Salford Royal Hospital SLF Torbay District General Hospital TOR
Salisbury District Hospital SAL Tunbridge Wells Hospital TUN
Sandwell General Hospital SAN University College Hospital UCL
Scarborough Hospital SCA University Hospital Lewisham LEW
Scunthorpe General Hospital SCU University Hospital Llandough UHL
South Tyneside District Hospital STD University Hospital North Durham DRY
Southampton General Hospital SGH University Hospital of North Tees NTG
Southend University Hospital SEH University Hospital of Wales UHW
Southmead Hospital SMH University Hospital, Coventry UHC
Southport District General Hospital SPD Walsall Manor Hospital WMH
St George’s Hospital GEO Warrington Hospital WDG
St Helier Hospital SHC Warwick Hospital WAW
St James’s University Hospital SJH Watford General Hospital WAT
St Mary’s Hospital STM West Middlesex University Hospital WMU
St Mary’s Hospital – IOW MIW West Suffolk Hospital WSH
St Peter’s Hospital SPH Weston General Hospital WGH
St Richards Hospital STR Wexham Park Hospital WEX
St Thomas’ Hospital STH Whipps Cross University Hospital WHC
Stepping Hill Hospital SHH Whiston Hospital WHI
Stoke Mandeville Hospital SMV Whittington Hospital WHT
Sunderland Royal Hospital SUN William Harvey Hospital WHH
Tameside General Hospital TGA Withybush General Hospital WYB
The Christie CHR Worcestershire Royal Hospital WRC
The Great Western Hospital PMS Worthing Hospital WRG
The James Cook University Hospital SCM Wrexham Maelor Hospital WRX
The Princess Royal Hospital PRS Wythenshawe Hospital WYT
The Princess Royal University Hospital BRO Yeovil District Hospital YEO
The Queen Elizabeth Hospital – King’s Lynn
QKL York Hospital YDH
The Royal Bournemouth Hospital BTH Ysbyty Gwynedd Hospital GWY
The Royal London Hospital LON
Key
Green Case ascertainment ≥70%
Amber Case ascertainment 50% to 69%
Red Case ascertainment <50%
Purple Case ascertainment unknown
Black No cases entered
Italicised Fewer than ten cases included in year 2 NELA patient dataset
* Northumbria Specialist Emergency Care Hospital was formed when North Tyneside General Hospital and Wansbeck General Hospital merged during Year 2 of the Patient Audit
NELA REPORT 2016 | 25
5 DATA QUALITY AND CASE ASCERTAINMENT
Case ascertainment Using historical data from Hospital Episode Statistics (HES), it is possible to calculate the total number of emergency laparotomies that are expected to take place annually in the NHS and also in each hospital in England (equivalent data were not available for Wales). This calculation also allows comparison of the total number of cases submitted by each hospital with the total number expected, known as the case ascertainment rate (see the Technical Documents on the NELA website (www.nela.org.uk/reports) for more information about HES). This Report includes details for 23,138 patients, representing a case ascertainment rate of 70%, an increase from 65% seen in the First Audit Report.
Hospital-level case ascertainment was RAG rated according to the proportion of cases submitted compared to the expected caseload, where Green ≥70%, Amber 50–69%, Red, <50%. There was wide variation between hospitals: 88 hospitals (47%) were rated Green, and 36 (19%) rated Red. This has important implications when attempting to assess the quality of care provided by each hospital. For hospitals with a high case ascertainment rate (greater than 70%), we can be reasonably confident that the results of the Audit provide a good indication of the quality of care in that hospital. However, hospitals with low case ascertainment rates may not have provided information on enough patients for the Audit results to accurately reflect the quality of their patient care. We have shown the case ascertainment rates for each hospital in Figure 41.
Locked cases Just over one thousand (1,046) cases were started during the period of data collection but were not locked by the deadline for case submission and were therefore not eligible for inclusion in this Report. These cases represent 4% of records opened during the second year of data collection (compared to 5% in Year 1). The failure to lock cases is likely to have significant implications for case ascertainment rates at certain hospitals.
Cases excluded based on operative procedure inclusion criteria The option ‘Other’ was selected as the primary procedure for 2,152 (9%) locked submissions (compared to 2,017 (10%) in Year 1). Review of accompanying free-text demonstrated that the primary surgical procedure was ineligible for inclusion in 722 of these cases (755 in Year 1) (www.nela.org.uk/criteria). These cases, representing 3% of locked cases (compared to 4% in Year 1), were then excluded from analyses and assessment of case ascertainment. The number of ineligible submitted cases varied between hospitals (Figure 42). No cases were excluded for ineligibility at 32 hospitals (17%) (compared to 10% in Year 1). However at two hospitals (1%) at least 10% of submitted cases were ineligible for inclusion in the Audit (compared to 4% of hospitals in Year 1).
Data completeness Time and date values The timing of certain perioperative care milestones should be documented, and documentation is necessary for departments to audit key processes of care. This year the Audit recorded the date and time of the decision to operate, with the date and time of booking recorded only if this could not be provided. Thus only one time point was required in Year 2, compared to both time points in Year 1.
Accurate times for the decision to operate (or the time of theatre booking if the time of decision to operate was not available) were missing in 14% of cases. This represents an improvement on data completeness when compared to Year 1 where the time of decision to operate was not provided for 18% of submitted cases, the time of theatre booking was not provided for 22% of submitted cases, and both times were missing in 12% of cases.

26 | NELA REPORT 2016
At 14% of hospitals the time of the decision to operate or the time of theatre booking was missing for at least a quarter of submitted cases (in Year 1, 12% of hospitals provided neither time point for more than a quarter of cases) (Figure 43). The absence of these data effectively excluded these patients from analysis of this key process measure.
P-POSSUM variables The NELA web tool collects P-POSSUM10 data for two purposes: to aid clinicians in providing an assessment of risk as part of the decision making process; and to support risk adjustment of hospital-level outcomes.
Complete preoperative and postoperative P-POSSUM data were submitted for 93% of all submitted cases (this is the same as the figure from Year 1). 28% of hospitals achieved full completion of all fields for every case (Figure 44).
Data linkageThe NELA dataset has been linked with other datasets. This serves two purposes: to reduce the burden of data collection by utilising data already collected elsewhere; and to enhance the analysis of NELA data by providing additional information about patients undergoing emergency laparotomy.
Data linkage with ONS was of high quality. Across both years of the Patient Audit, we have been able to link 99% patients to ONS (607 patients could not be linked). Due to differences in the way data have been exported for each year of the Patient Audit, there are slight differences between the denominator used for process and outcome measures. For mortality figures, the final number of patients matched between ONS and NELA was 23,177. For process measures, the figure is 23,138.
The quality of data linkage with HES at procedure level is less robust. We have been able to link around 32,500 of the 40,600 patients (80%) that underwent emergency laparotomy in England since December 2013 to an emergency laparotomy procedure on the recorded NELA operation date. This is likely to be due to accuracy of hospital coding, timing of the HES extract and the complexity associated with identifying patients who underwent an emergency laparotomy within HES. This has had implications for our ability to analyse some process measures, for instance contemporaneous case ascertainment and consultant review within 14 hours for patients admitted to hospital. Further information is provided in the Technical Documents that accompany this Report (www.nela.org.uk/reports).
CommentaryThe staff and NELA Leads in hospitals are commended for their role in supplying the data used in Year 2 of the NELA Patient Report, which was of good quality overall. At present, case ascertainment is based on historical HES data. However, HES data that covers the NELA data collection periods have now become available. Work is currently underway to update the case ascertainment algorithm and provide more accurate case ascertainment figures. Year 2 also saw a reduction in the amount of data collected, and it is likely that this contributed to increased case ascertainment by reducing the burden of data collection.
NELA REPORT 2016 | 27
QUALITY IMPROVEMENT VIGNETTE Collecting data can be a burden, particularly if this falls on a small number of people. Many successful NHS trusts have improved their data by involving other parties to help the NELA Lead. You may use the help of audit, governance or research departments, or perhaps quality or patient safety teams if you have them. Other hospitals have engaged other resources such as sepsis nurses or enhanced recovery nurses.
Royal Sussex hospital more than doubled their case ascertainment between Year 1 and Year 2 of the Audit, by enlisting the help of their hospital Quality and Safety Team:
‘Our rapid increase in case ascertainment was due to the engagement of our trusts Quality and Safety Team. This was a compulsory national audit to improve quality and safety so there was good justification in securing the services of a clinical audit officer…. the clinical audit officer retrospectively fills in the form from the patients notes and then two of the anaesthetic consultants fill in the remaining clinical information. This works well and ensures an accurate dataset.’
If the data collection falls to one person, this can be very time consuming, particularly catching data retrospectively, as described by the Worthing NELA Lead:
‘I would rather tell you that we found a ‘magic potion’ which allowed us to achieve the improvement in case ascertainment. Unfortunately it was just down to my own hard work…. Completing all outstanding cases retrospectively turned out to be an extremely tedious/ painstaking task. I was fortunate that my department was very supportive and was able to free myself from clinical work whenever possible during this period. Long term our aim is to improve the ‘real-time’ data input by everybody involved in the care of these patients. In addition we also acquired the help of one of our Specialty Doctors who is keen on making a contribution.’
Worthing improved their case ascertainment from 6% to 71%. NHS trusts must give the NELA Leads adequate time and support for this important task.
RECOMMENDATIONS Local NELA Leads and perioperative teams must have adequate time and resources to support data collection, and to feed this back to clinical teams and hospital management including NHS trust boards. The time required should be reflected in job plans (Chief Executives, Medical and Clinical Directors).
NELA Leads should review their local data to ascertain case-submission and data completeness (NELA Leads).
NELA Leads should actively promote completion of P-POSSUM data fields to ensure that risk estimation is accurate (NELA Leads).
Where data completeness is a problem, NELA Leads should work with clinical teams to improve this, to facilitate future audit and quality improvement (NELA Leads, MDT).
28 | NELA REPORT 2016
6 PATIENT AND SURGICAL CHARACTERISTICS
Descriptive information, including age, urgency of surgery and American Society of Anesthesiologists (ASA) Physical Status classificationb are used throughout this Report to stratify processes of care and outcomes after surgery so that patterns can be investigated. In the supplementary information chapters, we present tables and figures that summarise the characteristics of the patients included in this Report, their predicted risk of death, and patterns of emergency hospitalisation. The commentary below summarises relevant differences in patient and surgical characteristics between those data published in the First NELA Patient Report (December 2013 to November 2014) and this year’s data (December 2014 to November 2015).
In both years, the patients undergoing surgery tended to be older people; almost half were over the age of 70 years at the time of hospital admission (median age 67 years). The physical health of patients tended to be poor, with many rated as suffering from a severe health condition (more than half were scored as ASA 3 or above) and more than half required surgery within six hours of the decision being made to operate. Almost half of patients were calculated to have a greater than 10% likelihood of death within 30 days of surgery.
The distribution of gender, age, and ASA grade was essentially unchanged between the first and second year of data collection. The proportions of those admitted as an emergency, and those having emergency surgery for a complication of a previous surgical procedure within same admission, were identical between the two years. There were no substantial differences between the documented urgency of surgery. The median P-POSSUM predicted risk of death was slightly lower in Year 2 (7%) compared to Year 1 (8%). Full details for Year 2 data are given in Table 3.
bThe American Society of Anaesthesiologists Physical status classification (commonly referred to as ASA grade) is a subjective score that ranges from 1–5 and is commonly collected in clinical practice. It is used to classify the disease-status of patients from: the absence of systemic disease (1) to the presence of severe and life-threatening disease (5).

NELA REPORT 2016 | 29
Patient characteristicsTable 3 Characteristics of patients included in this Report (Year 2 data)
Characteristic Group Number of patients Frequency (%)
Gender Female 12,044 52
Male 11,094 48
Age in years 18–39 2,452 11
40–49 2,265 10
50–59 3,253 14
60–69 4,796 21
70–79 5,767 25
80–89 4,068 18
≥90 537 2
Hospital admission type
Emergency 21,552 93
Elective 1,586 7
ASA grade 1 2,381 10
2 7,990 35
3 8,161 35
4 4,141 18
5 465 2
Urgency of surgery <2 hours 2,943 13
2–6 hours 8,948 39
6–18 hours 7,273 31
18–24 hours 3,869 17
Procedure Primary procedure 20,832 90
Surgery for a complication of a recent procedure
2,306 10
Preoperative predicted risk of death within 30 days of surgery (P-POSSUM)
<5% Lower risk 9,536 41
5.0–10.0 High risk 4,039 18
10.1–25.0% Highest risk 4,398 19
25.1–50.0% 2,550 11
>50% 2,615 11
30 | NELA REPORT 2016
Surgical characteristicsFor each patient, hospital staff selected the indication for surgery from a list of common indications (Table 58). More than one indication could be selected and some are likely to co-exist, for example perforation and peritonitis.
Patients undergoing emergency laparotomy constitute a markedly heterogeneous population in terms of diagnosis and outcome. This makes study more difficult but the group does broadly divide into those with intestinal obstruction and those with intestinal perforation, ischaemia, or abdominal sepsis of another cause where the required degree of urgency is even greater. The distribution of recorded indication for emergency laparotomy is unchanged between the two years. Intestinal obstruction remains the most common indication for surgery, occurring in half of patients. Abdominal sepsis due to intestinal perforation, peritonitis or abdominal abscess remains common, being included as an indication for surgery on 11,349 occasions (36%). 3% of emergency laparotomies (630 cases) are performed as a result of anastomotic leak following prior gastrointestinal surgery, a similar proportion to the results from Year 1.
The primary operative procedure was selected from a list of commonly performed emergency gastrointestinal procedures (Table 4). Only one option could be chosen, although secondary and tertiary procedures could be selected in subsequent questions, and limited free text was available for primary procedures not listed. Again, there was no difference in the distribution of primary procedure between the two years. The most commonly performed procedures were adhesiolysis and small bowel resection, which were performed with equal frequency. Colorectal resections comprised the majority of the remainder of emergency laparotomies. A minority of procedures were upper gastrointestinal subspecialty specific; however this in part reflects the NELA exclusion criteria, as laparotomy for pathology of the oesophagus, gallbladder, biliary tree, liver, pancreas and spleen are all excluded from the Audit.
Between the two years, there has been only a minimal increase in the number of cases managed laparoscopically. In Year 1, 13% were commenced laparoscopically, with 7% completed by this technique. In Year 2, 14% were commenced laparoscopically with still only 8% completed by this technique. The vast majority of emergency laparotomies in England and Wales remain primary open procedures (Table 5).
Finally, participants could select more than one option from a list of common operative findings (Table 59). Once more, these are identical between the two years. Adhesions remain the most commonly found pathology (27%), although this may reflect a common secondary finding co-existing with another primary pathology. Intestinal (peptic, small bowel or colonic) perforation was found in a quarter of emergency laparotomies. Localised or disseminated malignancy was found in a fifth of cases.
The cases submitted to NELA represent a huge resource of surgical and physiological data, and detailed subgroup analysis (for example small bowel obstruction secondary to adhesions, malignant colonic obstruction, or Hartmann’s procedure) is currently ongoing in conjunction with the respective surgical subspecialty associations.
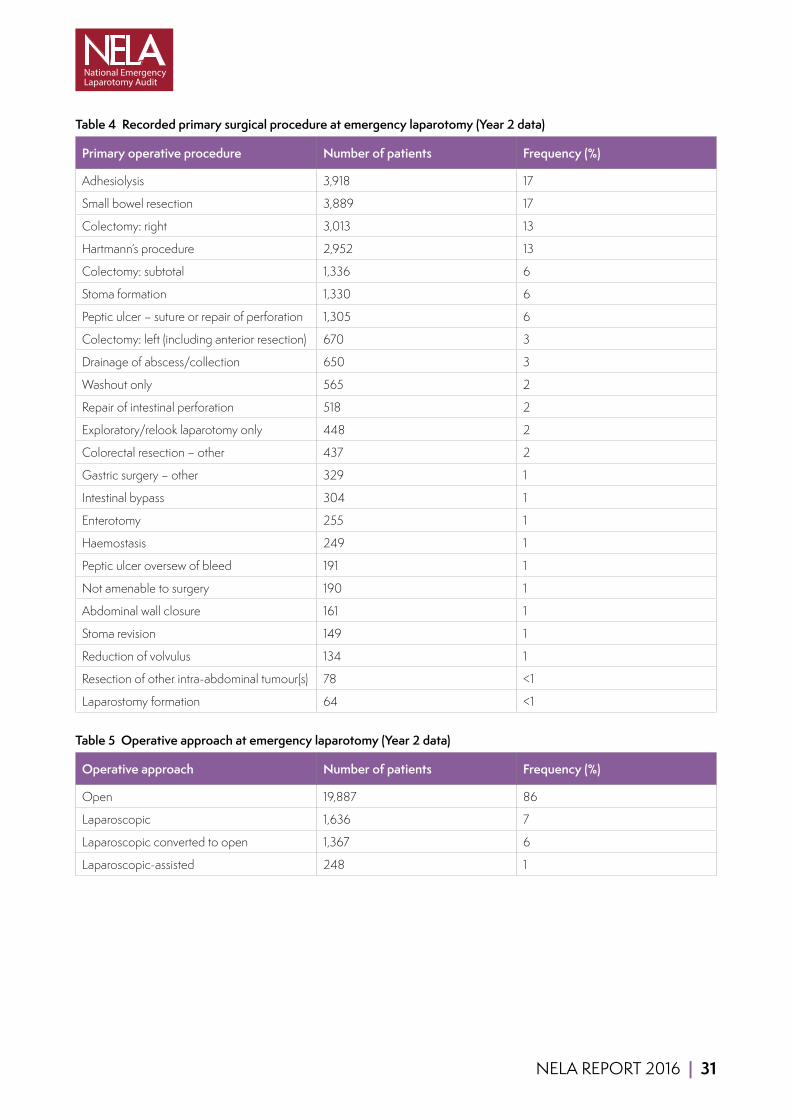
NELA REPORT 2016 | 31
Table 4 Recorded primary surgical procedure at emergency laparotomy (Year 2 data)
Primary operative procedure Number of patients Frequency (%)
Adhesiolysis 3,918 17
Small bowel resection 3,889 17
Colectomy: right 3,013 13
Hartmann’s procedure 2,952 13
Colectomy: subtotal 1,336 6
Stoma formation 1,330 6
Peptic ulcer – suture or repair of perforation 1,305 6
Colectomy: left (including anterior resection) 670 3
Drainage of abscess/collection 650 3
Washout only 565 2
Repair of intestinal perforation 518 2
Exploratory/relook laparotomy only 448 2
Colorectal resection – other 437 2
Gastric surgery – other 329 1
Intestinal bypass 304 1
Enterotomy 255 1
Haemostasis 249 1
Peptic ulcer oversew of bleed 191 1
Not amenable to surgery 190 1
Abdominal wall closure 161 1
Stoma revision 149 1
Reduction of volvulus 134 1
Resection of other intra-abdominal tumour(s) 78 <1
Laparostomy formation 64 <1
Table 5 Operative approach at emergency laparotomy (Year 2 data)
Operative approach Number of patients Frequency (%)
Open 19,887 86
Laparoscopic 1,636 7
Laparoscopic converted to open 1,367 6
Laparoscopic-assisted 248 1
32 | NELA REPORT 2016
7 SUMMARY OF STANDARDS OF CARE AND PROCESS MEASURES
This chapter briefly describes overall performance of hospitals against published standards of care. The process measures reflect key stages in the pathway of care, from the first review by a consultant surgeon, through perioperative care and into the postoperative period.
Due to the heterogeneity of the patient population, it is not appropriate to expect 100% compliance with all standards. Some standards are only applicable to particularly urgent surgery or to patients at high risk of complications and death. It should not be assumed that, because data are being collected on a particular measure, 100% compliance is required. We have taken 80% compliance as an indication that a hospital was reliably meeting a standard of care (with the exception of case ascertainment, where a value of 70% was used). In order to report hospital performance against standards, the following RAG rating is used:
Green: Standard met for at least 80% of patients (70% for case ascertainment)
Amber: Standard met for 50–79% of patients (50–69% for case ascertainment)
Red: Standard met for fewer than 50% of patients
Table 6 and Table 7 summarise the headline figures in both the First NELA Patient Report (December 2013 to November 2014) and this year’s data (December 2014 to November 2015). Full details of each process measure, including the standards of care, and any additional analysis can be found in the relevant chapters.
Some of the metrics have been refined since the First Report to reflect a greater understanding of the dataset and delivery of care. In order to make comparisons between the first- and second-year Reports, some of the Year 1 metrics have been recalculated. Hence some of the figures will appear to be different to those published in the First Report.
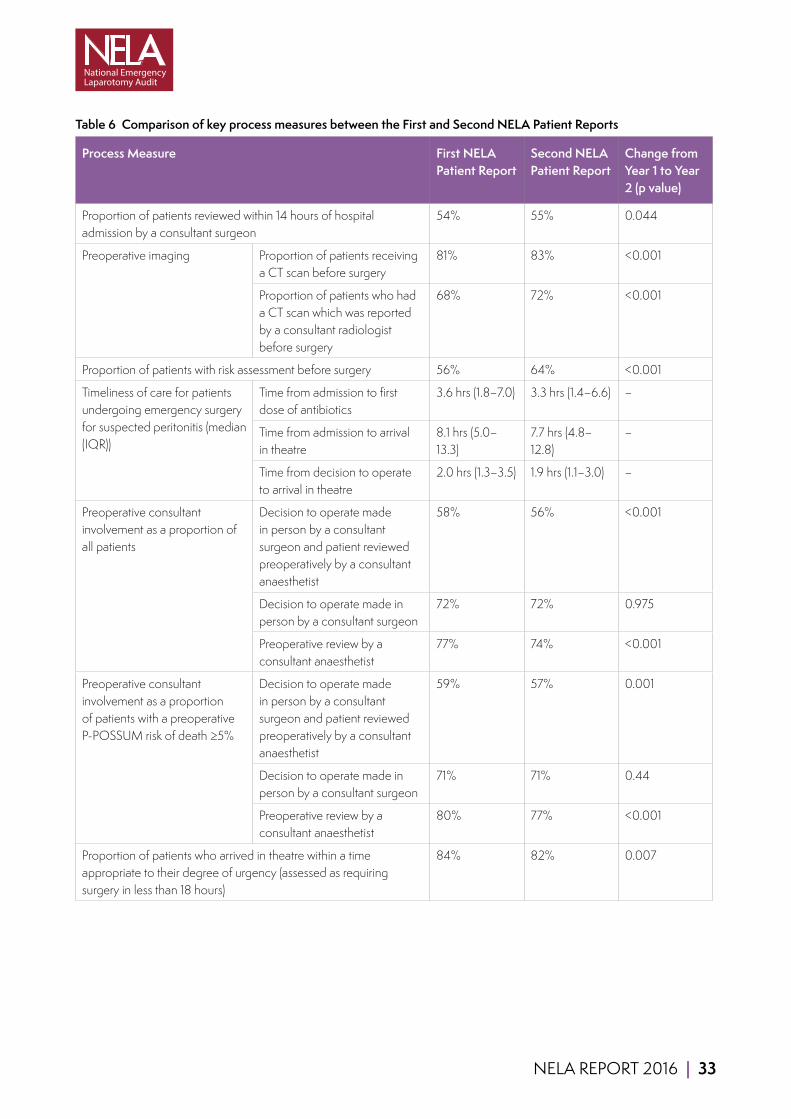
NELA REPORT 2016 | 33
Table 6 Comparison of key process measures between the First and Second NELA Patient Reports
Process Measure First NELA Patient Report
Second NELA Patient Report
Change from Year 1 to Year 2 (p value)
Proportion of patients reviewed within 14 hours of hospital admission by a consultant surgeon
54% 55% 0.044
Preoperative imaging Proportion of patients receiving a CT scan before surgery
81% 83% <0.001
Proportion of patients who had a CT scan which was reported by a consultant radiologist before surgery
68% 72% <0.001
Proportion of patients with risk assessment before surgery 56% 64% <0.001
Timeliness of care for patients undergoing emergency surgery for suspected peritonitis (median (IQR))
Time from admission to first dose of antibiotics
3.6 hrs (1.8–7.0) 3.3 hrs (1.4–6.6) –
Time from admission to arrival in theatre
8.1 hrs (5.0–13.3)
7.7 hrs (4.8–12.8)
–
Time from decision to operate to arrival in theatre
2.0 hrs (1.3–3.5) 1.9 hrs (1.1–3.0) –
Preoperative consultant involvement as a proportion of all patients
Decision to operate made in person by a consultant surgeon and patient reviewed preoperatively by a consultant anaesthetist
58% 56% <0.001
Decision to operate made in person by a consultant surgeon
72% 72% 0.975
Preoperative review by a consultant anaesthetist
77% 74% <0.001
Preoperative consultant involvement as a proportion of patients with a preoperative P-POSSUM risk of death ≥5%
Decision to operate made in person by a consultant surgeon and patient reviewed preoperatively by a consultant anaesthetist
59% 57% 0.001
Decision to operate made in person by a consultant surgeon
71% 71% 0.44
Preoperative review by a consultant anaesthetist
80% 77% <0.001
Proportion of patients who arrived in theatre within a time appropriate to their degree of urgency (assessed as requiring surgery in less than 18 hours)
84% 82% 0.007

34 | NELA REPORT 2016
Consultant presence in theatre as a proportion of all patients
Both a consultant surgeon and a consultant anaesthetist
65% 70% <0.001
Consultant surgeon 85% 87% <0.001
Consultant anaesthetist 74% 78% <0.001
Consultant presence in theatre as a proportion of patients with a preoperative P-POSSUM risk of death ≥5%
Both a consultant surgeon and a consultant anaesthetist
70% 74% <0.001
Consultant surgeon 87% 89% <0.001
Consultant anaesthetist 78% 82% <0.001
Proportion of patients with no preoperative and no intraoperative consultant involvement
All patients 2.9% 2.3% <0.001
Patients with a preoperative P-POSSUM risk of death ≥5%
2.4% 1.8% 0.001
Proportion of patients who received goal directed fluid therapy
Cardiac output monitor 37% 39% <0.001
Other method 15% 15% 0.7
Overall 52% 54% <0.001
Proportion of high and highest risk patients who were admitted directly to critical care after surgery
Patients with a postoperative P-POSSUM risk of death 5–10%
58% 62% 0.001
Patients with a postoperative P-POSSUM risk of death >10%
83% 85% <0.001
Proportion of patients aged 70 years or over who were assessed by an Elderly Medicine specialist
10% 10% 0.642
Table 7 Comparison of change in the number of hospitals rated Green (standard achieved for ≥80% of patients) for each key process measure between the First and Second NELA Patient Reports
Process Measure Number of hospitals rated Green
Change (+ve represents improvement)
First NELA Patient Report
Second NELA Patient Report
CT scan reported before surgery 50 67 17
Risk assessment before surgery 25 43 18
Arrived in theatre within appropriate timeframe 133 129 -4
Preoperative consultant surgeon and anaesthetist involvement for patients with a preoperative P-POSSUM risk of death ≥5%
24 26 2
Consultant surgeon and anaesthetist present in theatre for patients with a preoperative P-POSSUM risk of death ≥5%
65 83 18
Consultant surgeon present in theatre for patients with a preoperative P-POSSUM risk of death ≥5%
155 158 3
Consultant anaesthetist present in theatre for patients with a preoperative P-POSSUM risk of death ≥5%
96 112 16
Highest risk patients (P-POSSUM risk of death >10%) admitted directly to critical care after surgery
126 138 12
Patients aged of 70 years or over assessed by an Elderly Medicine specialist
2 2 0

NELA REPORT 2016 | 35
8 REVIEW WITHIN 14 HOURS OF HOSPITAL ADMISSION BY A CONSULTANT SURGEON
Why is this important?Emergency General Surgical admissions constitute a large workload in comparison to the number of patients requiring surgery. Only one in every ten patients who are admitted with acute abdominal pain ultimately undergoes an emergency laparotomy, and it is not always immediately apparent which patients require surgery at admission. Prompt senior review of emergency General Surgical patients is vital because complex decision making and treatment planning may be required within hours of presenting to hospital. Timely review has been shown to be associated with improved outcomes.11 Sicker patients require early review, but it is good practice for all patients to be reviewed within 12 or 14 hours and not longer than 24 hours following admission.
Limitations of data linkageWhilst patients requiring an emergency laparotomy may have been admitted to hospital under both medical and surgical specialties, the process measure for this standard of care only applies to those admitted as an emergency under General Surgical specialties. In line with HQIP requirements to reduce the burden of data collection, we chose to obtain admitting specialty from HES rather than ask this as separate question.
For the First Patient Report HES data was not available, so we reported this process measure for all patients regardless of admitting specialty, with the intention of updating this once HES data became available. Subsequent data linkage with HES has been less robust than anticipated (around 32,500 out of 43,600 patients in England across both years of the Audit). It is therefore inappropriate to report hospital-level performance against this standard of care. The standards have been included for information only.
36 | NELA REPORT 2016
KEY STANDARDS Patients admitted as an emergency should be seen by a consultant at the earliest opportunity. Ideally this should be within 12 hours and should not be longer than 24 hours. NCEPOD EA
All emergency admissions must be seen and have a thorough clinical assessment by a suitable consultant as soon as possible but at the latest within 14 hours from the time of arrival at hospital. NHS 7 Day Services
AUDIT QUESTIONS What proportion of patients was reviewed by a consultant surgeon within 14 hours of emergency presentation at hospital?
What variation existed in the proportion of patients reviewed by a consultant surgeon within 14 hours of emergency presentation, by:
1 Hospital? 2 Urgency of surgery? 3 Day and time of admission to hospital? 4 Under which specialities are patients requiring emergency laparotomy initially admitted to hospital?
KEY FINDINGS Over half (55%) of patients who were admitted as an emergency and subsequently underwent an emergency laparotomy were reviewed by a consultant surgeon within 14 hours of admission at hospital (Table 8).
A review by a consultant surgeon within 14 hours of admission occurred in a higher proportion of patients requiring more urgent surgery when compared to those requiring less urgent surgery (Table 8).
The proportion of patients who were reviewed by a consultant surgeon within 14 hours of emergency admission varied by the time of day that the patients were admitted to hospital (Table 9).
Overall 75% of patients were admitted under General Surgery, 13% under General Medicine and Gastroenterology, and 12% under ‘Other’ specialties. This varied between hospitals (Figure 5).
Clinical commentaryThere has been minimal change (from 54% to 55%) in the proportion of patients who are assessed by a consultant surgeon within 14 hours of admission. Patients who needed to go to theatre more urgently were more likely to be seen within 14 hours of admission compared to those with less clinical urgency (67% of <2 hour urgency category compared to 51% of 6–18 hour category), suggesting that in many cases the sicker patients are being identified successfully on admission by members of the clinical team (Table 8).
The First Patient Audit found variation in this measure associated with the time of day that patients were admitted. Those admitted between midnight and 8am were the most likely to be seen by a consultant surgeon within 14 hours; this observation remains unchanged (Table 9). This finding supports the notion that consultant-led ward rounds of new acute surgical admissions occur predominantly in the morning, and often only once daily.
Patients admitted in the late morning or afternoon are more likely to wait longer than 14 hours to be reviewed by a consultant surgeon, unless greater clinical urgency is highlighted by the on-call team. Of patients admitted between midday and 6pm, the proportion seen within 14 hours has improved between Year 1 and Year 2; this may suggest that in some NHS trusts there has been an increase in evening ward rounds of acute surgical admissions.
Given that 75% of patients were admitted under General Surgery, it is likely that the proportion of patients seen within 14 hours of admission is considerably higher than currently reported. It is likely that the NELA dataset will be adjusted to collect information on admitting specialty so that this process measure can be reported at hospital level in future reports.

NELA REPORT 2016 | 37
Despite the limitations of data linkage with HES, the information obtained does shed light on the admission pathways within hospitals. There was a wide range seen in the proportion of patients admitted under General Surgery (50% to 93%). Patients requiring an emergency laparotomy may have been appropriately admitted under a number of differing specialties:
■ General Surgery, if presenting to hospital with clear signs of an acute abdomen.
■ General Medicine and Gastroenterology, particularly for patients with inflammatory bowel disease, and those thought to have gastroenteritis.
■ Other specialties, particularly in specialist hospitals.
In some cases, admission under specialties other than General Surgery may reflect poor admission pathways, and it is likely that there may be some delay in patients receiving appropriate surgical care. Alternatively, some of the variation seen within the HES database at hospital level may reflect inaccurate clinical coding.
Hospital-level information on admitting specialty has been provided to allow hospitals to better understand their provision of care, and help determine whether clinical coding could be improved (Figure 5).
Table 8 Proportion of patients reviewed by a consultant surgeon within 14 hours of admission to hospital by operative urgency (Year 2 data)
Operative urgency Total number of patients Proportion reviewed by a consultant surgeon within 14 hours of emergency admission (%)
<2 hours 1,845 67
2–6 hours 6,250 61
6–18 hours 5,613 51
18–24 hours 2,941 43
Overall 16,649 55%
Table 9 Proportion of patients reviewed by a consultant surgeon within 14 hours of admission to hospital by time-of-day and day-of-week of emergency hospital admission (Year 2 data)
Time of emergency admission to hospital
Proportion reviewed by a consultant surgeon within 14 hours of emergency admission
Monday–Friday (%) Saturday–Sunday (%)
0800–1159 56 47
1200–1759 40 35
1800–2359 63 65
0000–0759 73 71
Overall 55% 54%
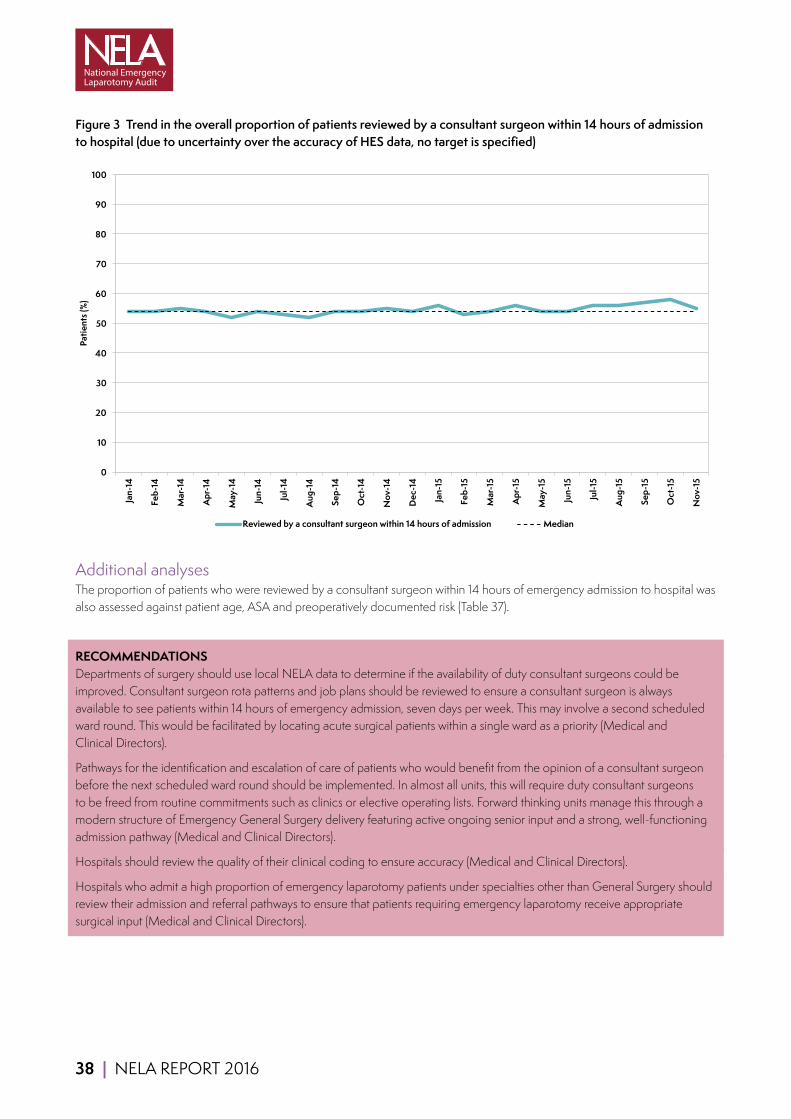
38 | NELA REPORT 2016
Figure 3 Trend in the overall proportion of patients reviewed by a consultant surgeon within 14 hours of admission to hospital (due to uncertainty over the accuracy of HES data, no target is specified)
Month Reviewedbya Median TargetJan-14 54 54 80 80%targetlinesremovedFeb-14 54 54 80Mar-14 55 54 80Apr-14 54 54 80May-14 52 54 80Jun-14 54 54 80Jul-14 53 54 80
Aug-14 52 54 80Sep-14 54 54 80Oct-14 54 54 80Nov-14 55 54 80Dec-14 54 54 80Jan-15 56 54 80Feb-15 53 54 80Mar-15 54 54 80Apr-15 56 54 80May-15 54 54 80Jun-15 54 54 80Jul-15 56 54 80
Aug-15 56 54 80Sep-15 57 54 80Oct-15 58 54 80Nov-15 55 54 80
0
10
20
30
40
50
60
70
80
90
100
Jan-
14
Feb-
14
Mar
-14
Apr
-14
May
-14
Jun-
14
Jul-1
4
Aug
-14
Sep-
14
Oct
-14
Nov
-14
Dec
-14
Jan-
15
Feb-
15
Mar
-15
Apr
-15
May
-15
Jun-
15
Jul-1
5
Aug
-15
Sep-
15
Oct
-15
Nov
-15
Patie
nts (
%)
Reviewed by a consultant surgeon within 14 hours of admission Median
Additional analysesThe proportion of patients who were reviewed by a consultant surgeon within 14 hours of emergency admission to hospital was also assessed against patient age, ASA and preoperatively documented risk (Table 37).
RECOMMENDATIONS Departments of surgery should use local NELA data to determine if the availability of duty consultant surgeons could be improved. Consultant surgeon rota patterns and job plans should be reviewed to ensure a consultant surgeon is always available to see patients within 14 hours of emergency admission, seven days per week. This may involve a second scheduled ward round. This would be facilitated by locating acute surgical patients within a single ward as a priority (Medical and Clinical Directors).
Pathways for the identification and escalation of care of patients who would benefit from the opinion of a consultant surgeon before the next scheduled ward round should be implemented. In almost all units, this will require duty consultant surgeons to be freed from routine commitments such as clinics or elective operating lists. Forward thinking units manage this through a modern structure of Emergency General Surgery delivery featuring active ongoing senior input and a strong, well-functioning admission pathway (Medical and Clinical Directors).
Hospitals should review the quality of their clinical coding to ensure accuracy (Medical and Clinical Directors).
Hospitals who admit a high proportion of emergency laparotomy patients under specialties other than General Surgery should review their admission and referral pathways to ensure that patients requiring emergency laparotomy receive appropriate surgical input (Medical and Clinical Directors).

NELA REPORT 2016 | 39
Figure 4 Proportion of cases reviewed by a consultant surgeon within 14 hours of emergncy admission to hospital. Black bars indicate hospitals with less than ten cases in this analysis
0 10% 20% 30% 40% 50% 60% 70% 80% 90% 100%
WES
BNT
HUD
FRR
ROT
NDD
CAS
EAL
WGH
BED
YDH
NTG
NMH
RBE
PIL
PAH
CON
POW
NSH
DRY
DAR
QEQ
QKL
SPH
WRX
NTH
SCA
RCH
CMI
KMH
PLY
PGH
BRD
UHW
NOR
MPH
SCU
WDH
WYB
RLI
DDH
MAR
MOR
HUL
SMH
WYT
RHC
SGH
CLW
HOM
FGH
QEB
FRM
JPH
DER
NGS
MDW
RVN
BAT
KGH
RDE
QMC
VIC
LIS
CHX
LEW
DVH
AIR
HCH
LIN
NMG
PMS
WSH
STM
UCL
SAL
STR
COC
BAR
COL
KTH
RFH
BRO
BRT
RAD
NHH
WIR
CTY
SUN
KCH
ESU
OHM
GEO
NPH
QHR
NCR
STD
WRC
LER
DID
RPH
WMU
CHE
LDH
WHH
RSU
BOL
YEO
EBH
LEG
HIN
WRG
GWY
BAS
BTH
HAR
NUN
QAP
QEL
SHC
WHT
RSS
SLF
WAW
RSH
TGA
QEG
GLO
AEI
BRG
SHH
SEH
PCH
PET
SJH
GWE
RUS
IPS
GLG
BRI
NEV
WMH
TOR
HIL
MKH
WEX
FAZ
MAC
MRI
TUN
STH
WHC
FRE
MAY
CGH
UHC
BLA
RSC
KNG
RLU
PIN
SMV
WDG
GGH
RGH
SPD
WAT
SCM
MIW
BFH
LEI
ADD
NOT
SAN
WHI
LON
CHR
CKH
BMP
LHC
MST
PAP
PRS
WLT
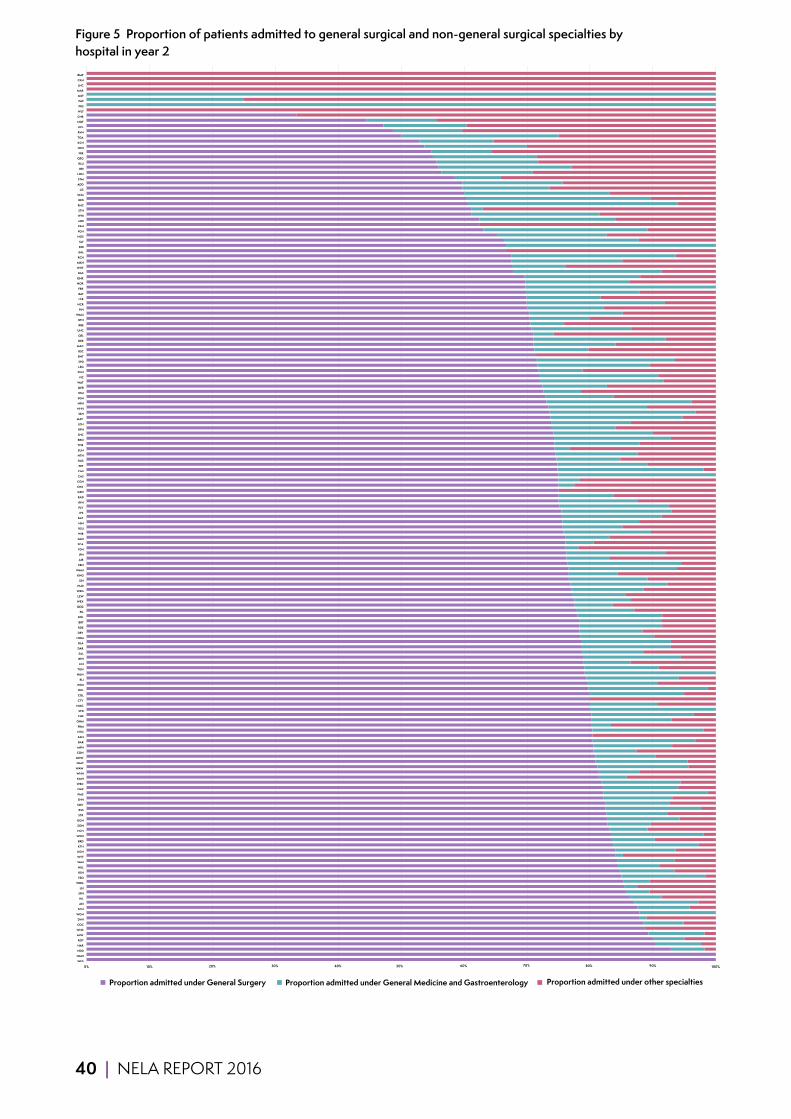
40 | NELA REPORT 2016
Figure 5 Proportion of patients admitted to general surgical and non-general surgical specialties by hospital in year 2
0% 10% 90% 100% WES
NMH
NDD
HAR
ROT
MIW
WHC
COC
DVH
WGH
SCU
AEI
HIL
SPH
LEI
WDG
YEO
RSH
HUL
SMH
WYT
KGH
KTH
BRD
WDH
HCH
DDH
GGH
STR
RSS
SMV
SHH
PMS
QAP
WRC
KMH
WHH
WAW
QMC
MDW
CON
MPH
BAR
SAN
NTG
FRM
OHM
CHE
STD
NMG
CTY
COL
QKL
WSH
RLI
NUN
TUN
LIN
BFH
SAL
DAR
BLA
HOM
DRY
RDE
BRT
BOL
PIL
QEQ
WEX
LEW
WRG
HUD
SJH
KNG
WMH
EBH
AIR
JPH
YDH
SCA
GLO
WIR
RSU
HIN
FAZ
IPS
PLY
RFH
RAD
GEO
CHX
CGH
CAS
CMI
PET
RUS
NTH
SUN
TOR
BRO
SHC
RPH
LDH
MAY
SEH
NHH
NPH
SGH
ESU
QEB
WAT
VIC
PGH
LEG
SPD
BNT
RSC
MAC
DER
QEL
UHC
RBE
BTH
WMU
PIN
NCR
LER
BAT
FRR
NOR
QHR
BAS
WHT
MKH
RCH
EAL
DID
SLF
NGS
FGH
PAH
MRI
WHI
STH
RHC
BED
SCM
LIS
ADD
STM
LON
BRI
RLU
QEG
FRE
NSH
KCH
TGA
RVN
UCL
NOT
CHR
WLT
PRS
PAP
MST
MAR
LHC
CKH
BMP
Proportion admitted under General Surgery Proportion admitted under other specialtiesProportion admitted under General Medicine and Gastroenterology
20% 30% 40% 50% 60% 70% 80%
0% 10% 90% 100% WES
NMH
NDD
HAR
ROT
MIW
WHC
COC
DVH
WGH
SCU
AEI
HIL
SPH
LEI
WDG
YEO
RSH
HUL
SMH
WYT
KGH
KTH
BRD
WDH
HCH
DDH
GGH
STR
RSS
SMV
SHH
PMS
QAP
WRC
KMH
WHH
WAW
QMC
MDW
CON
MPH
BAR
SAN
NTG
FRM
OHM
CHE
STD
NMG
CTY
COL
QKL
WSH
RLI
NUN
TUN
LIN
BFH
SAL
DAR
BLA
HOM
DRY
RDE
BRT
BOL
PIL
QEQ
WEX
LEW
WRG
HUD
SJH
KNG
WMH
EBH
AIR
JPH
YDH
SCA
GLO
WIR
RSU
HIN
FAZ
IPS
PLY
RFH
RAD
GEO
CHX
CGH
CAS
CMI
PET
RUS
NTH
SUN
TOR
BRO
SHC
RPH
LDH
MAY
SEH
NHH
NPH
SGH
ESU
QEB
WAT
VIC
PGH
LEG
SPD
BNT
RSC
MAC
DER
QEL
UHC
RBE
BTH
WMU
PIN
NCR
LER
BAT
FRR
NOR
QHR
BAS
WHT
MKH
RCH
EAL
DID
SLF
NGS
FGH
PAH
MRI
WHI
STH
RHC
BED
SCM
LIS
ADD
STM
LON
BRI
RLU
QEG
FRE
NSH
KCH
TGA
RVN
UCL
NOT
CHR
WLT
PRS
PAP
MST
MAR
LHC
CKH
BMP
Proportion admitted under General Surgery Proportion admitted under other specialtiesProportion admitted under General Medicine and Gastroenterology
20% 30% 40% 50% 60% 70% 80% 0% 10% 90% 100% WES
NMH
NDD
HAR
ROT
MIW
WHC
COC
DVH
WGH
SCU
AEI
HIL
SPH
LEI
WDG
YEO
RSH
HUL
SMH
WYT
KGH
KTH
BRD
WDH
HCH
DDH
GGH
STR
RSS
SMV
SHH
PMS
QAP
WRC
KMH
WHH
WAW
QMC
MDW
CON
MPH
BAR
SAN
NTG
FRM
OHM
CHE
STD
NMG
CTY
COL
QKL
WSH
RLI
NUN
TUN
LIN
BFH
SAL
DAR
BLA
HOM
DRY
RDE
BRT
BOL
PIL
QEQ
WEX
LEW
WRG
HUD
SJH
KNG
WMH
EBH
AIR
JPH
YDH
SCA
GLO
WIR
RSU
HIN
FAZ
IPS
PLY
RFH
RAD
GEO
CHX
CGH
CAS
CMI
PET
RUS
NTH
SUN
TOR
BRO
SHC
RPH
LDH
MAY
SEH
NHH
NPH
SGH
ESU
QEB
WAT
VIC
PGH
LEG
SPD
BNT
RSC
MAC
DER
QEL
UHC
RBE
BTH
WMU
PIN
NCR
LER
BAT
FRR
NOR
QHR
BAS
WHT
MKH
RCH
EAL
DID
SLF
NGS
FGH
PAH
MRI
WHI
STH
RHC
BED
SCM
LIS
ADD
STM
LON
BRI
RLU
QEG
FRE
NSH
KCH
TGA
RVN
UCL
NOT
CHR
WLT
PRS
PAP
MST
MAR
LHC
CKH
BMP
Proportion admitted under General Surgery Proportion admitted under other specialtiesProportion admitted under General Medicine and Gastroenterology
20% 30% 40% 50% 60% 70% 80%

NELA REPORT 2016 | 41
9 PREOPERATIVE IMAGINGWhy is this important?Radiological imaging is a fundamental component of clinical practice that can help clinicians to make diagnoses and formulate treatment plans with patients and their relatives. Modern abdominal CT scanning is extremely accurate and underpins acute surgical practice. Even when the need for surgery is obvious, reported scans can refine disease extent and inform operative urgency, the nature of likely surgery, and even the advisability of having an operation. The latter may include patients who have pathology that is not amenable to surgery, and hence prevent an unnecessary operation.
Many emergency General Surgical conditions require immediate treatment (which may be surgical or non-surgical) to prevent clinical deterioration. Timely reporting by a consultant radiologist may avoid delayed or inappropriate treatment resulting from misinterpretation of scans by non-specialist radiologists or other clinicians.12,13 The quality of the information provided by CT scanning can be enhanced by discussion between surgical and radiology colleagues in order to better understand the clinical context.
CT scanning is most informative if performed early in the management of acute conditions. Imaging facilities and staff should therefore be available 24 hours per day to ensure patients who require scanning ‘out of hours’ are not disadvantaged.
Follow up of the NELA Organisational Audit by the Royal College of Radiologists determined that 24-hour contemporaneous CT reporting by a radiologist was available at all hospitals at which emergency laparotomies were performed. The disparity between apparent availability of facilities and variation in clinical practice may therefore reflect local differences in workload, commitments, or formalised pathways of care.
KEY STANDARDS Hospitals which admit patients as emergencies must have access to both conventional radiology and CT scanning 24 hours per day, with immediate reporting. NCEPOD EA
Consultant-directed diagnostic tests and completed reporting will be available seven days a week, within 1 hour for critical patients (i.e. those for whom the test will alter their management at the time). NHS 7 Day Services
The delivery of quality clinical care is dependent on access to supporting facilities. Rapid access to CT imaging, U/S [ultrasound] scanning and laboratory analyses are critical to the efficient diagnosis, resuscitation and prioritisation of these patients. ASGBI EGS
AUDIT QUESTIONS What proportion of patients had a CT scan before surgery? (Target ≥80%)
What proportion of patients had a CT scan reported by a consultant radiologist before surgery? (Target ≥80%)
What variation existed in the proportion of patients who had a CT scan that was reported by a consultant radiologist before surgery, by:
1 Hospital? 2 Urgency of surgery? 3 Patient characteristics, including documented risk of death? 4 Day and time of admission to hospital?
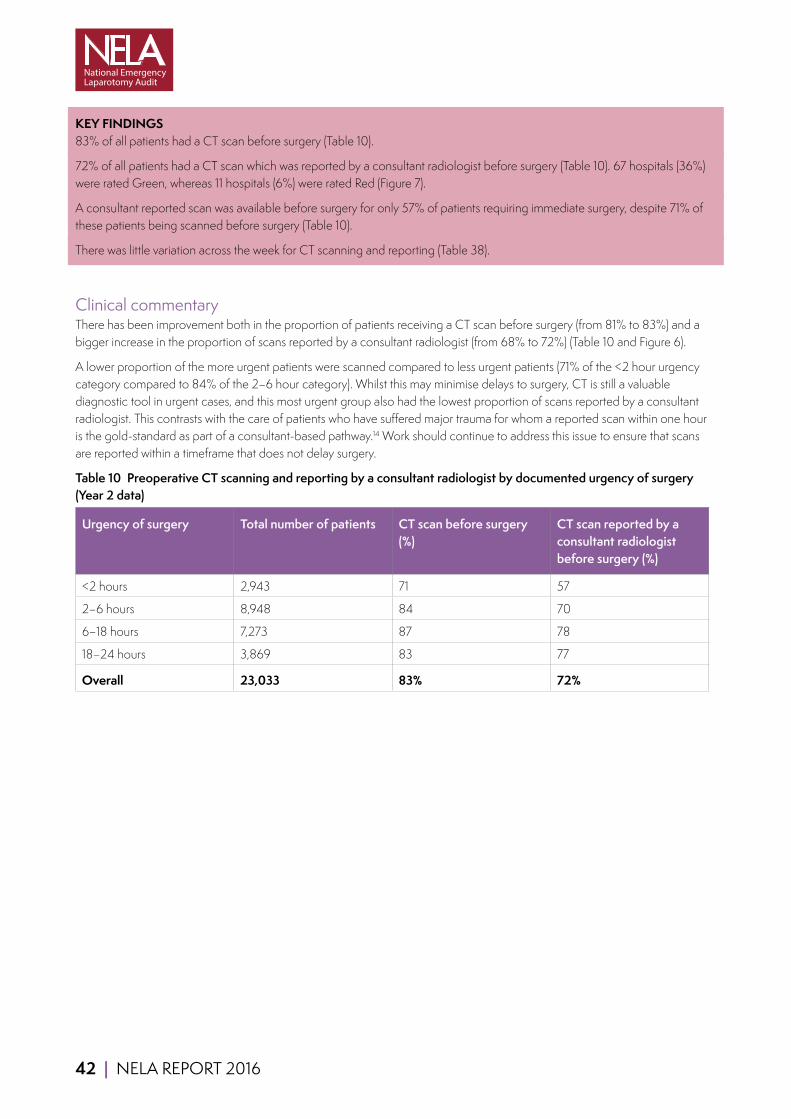
42 | NELA REPORT 2016
KEY FINDINGS 83% of all patients had a CT scan before surgery (Table 10).
72% of all patients had a CT scan which was reported by a consultant radiologist before surgery (Table 10). 67 hospitals (36%) were rated Green, whereas 11 hospitals (6%) were rated Red (Figure 7).
A consultant reported scan was available before surgery for only 57% of patients requiring immediate surgery, despite 71% of these patients being scanned before surgery (Table 10).
There was little variation across the week for CT scanning and reporting (Table 38).
Clinical commentaryThere has been improvement both in the proportion of patients receiving a CT scan before surgery (from 81% to 83%) and a bigger increase in the proportion of scans reported by a consultant radiologist (from 68% to 72%) (Table 10 and Figure 6).
A lower proportion of the more urgent patients were scanned compared to less urgent patients (71% of the <2 hour urgency category compared to 84% of the 2–6 hour category). Whilst this may minimise delays to surgery, CT is still a valuable diagnostic tool in urgent cases, and this most urgent group also had the lowest proportion of scans reported by a consultant radiologist. This contrasts with the care of patients who have suffered major trauma for whom a reported scan within one hour is the gold-standard as part of a consultant-based pathway.14 Work should continue to address this issue to ensure that scans are reported within a timeframe that does not delay surgery.
Table 10 Preoperative CT scanning and reporting by a consultant radiologist by documented urgency of surgery (Year 2 data)
Urgency of surgery Total number of patients CT scan before surgery (%)
CT scan reported by a consultant radiologist before surgery (%)
<2 hours 2,943 71 57
2–6 hours 8,948 84 70
6–18 hours 7,273 87 78
18–24 hours 3,869 83 77
Overall 23,033 83% 72%
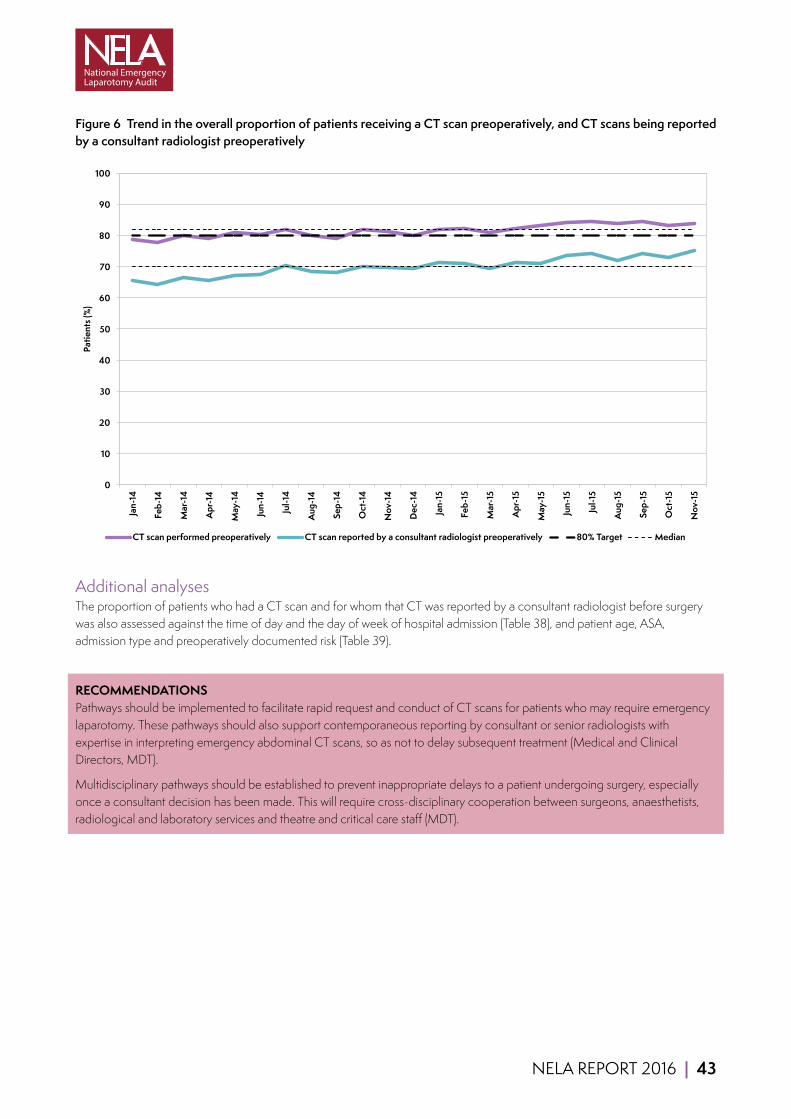
NELA REPORT 2016 | 43
Figure 6 Trend in the overall proportion of patients receiving a CT scan preoperatively, and CT scans being reported by a consultant radiologist preoperativelyMonth CTscanperfo CTscanrepo Median Median2 80%Target
Jan-14 78.8 65.7 81.8 70 80Feb-14 77.8 64.1 81.8 70 80Mar-14 80 66.5 81.8 70 80Apr-14 79 65.5 81.8 70 80
May-14 80.8 67 81.8 70 80Jun-14 80.2 67.5 81.8 70 80Jul-14 82 70.3 81.8 70 80
Aug-14 80 68.4 81.8 70 80Sep-14 79.1 68 81.8 70 80Oct-14 81.9 70 81.8 70 80Nov-14 81.4 69.6 81.8 70 80Dec-14 79.9 69.4 81.8 70 80Jan-15 81.8 71.4 81.8 70 80Feb-15 82.1 71 81.8 70 80Mar-15 80.9 69.3 81.8 70 80Apr-15 82.4 71.3 81.8 70 80
May-15 83.3 70.9 81.8 70 80Jun-15 84.1 73.7 81.8 70 80Jul-15 84.5 74.2 81.8 70 80
Aug-15 83.7 71.9 81.8 70 80Sep-15 84.5 74.2 81.8 70 80Oct-15 83.3 72.8 81.8 70 80Nov-15 83.9 75.2 81.8 70 80
0
10
20
30
40
50
60
70
80
90
100
Jan-
14
Feb-
14
Mar
-14
Apr
-14
May
-14
Jun-
14
Jul-1
4
Aug
-14
Sep-
14
Oct
-14
Nov
-14
Dec
-14
Jan-
15
Feb-
15
Mar
-15
Apr
-15
May
-15
Jun-
15
Jul-1
5
Aug
-15
Sep-
15
Oct
-15
Nov
-15
Patie
nts (
%)
CT scan performed preoperatively CT scan reported by a consultant radiologist preoperatively 80% Target Median
Additional analysesThe proportion of patients who had a CT scan and for whom that CT was reported by a consultant radiologist before surgery was also assessed against the time of day and the day of week of hospital admission (Table 38), and patient age, ASA, admission type and preoperatively documented risk (Table 39).
RECOMMENDATIONS Pathways should be implemented to facilitate rapid request and conduct of CT scans for patients who may require emergency laparotomy. These pathways should also support contemporaneous reporting by consultant or senior radiologists with expertise in interpreting emergency abdominal CT scans, so as not to delay subsequent treatment (Medical and Clinical Directors, MDT).
Multidisciplinary pathways should be established to prevent inappropriate delays to a patient undergoing surgery, especially once a consultant decision has been made. This will require cross-disciplinary cooperation between surgeons, anaesthetists, radiological and laboratory services and theatre and critical care staff (MDT).
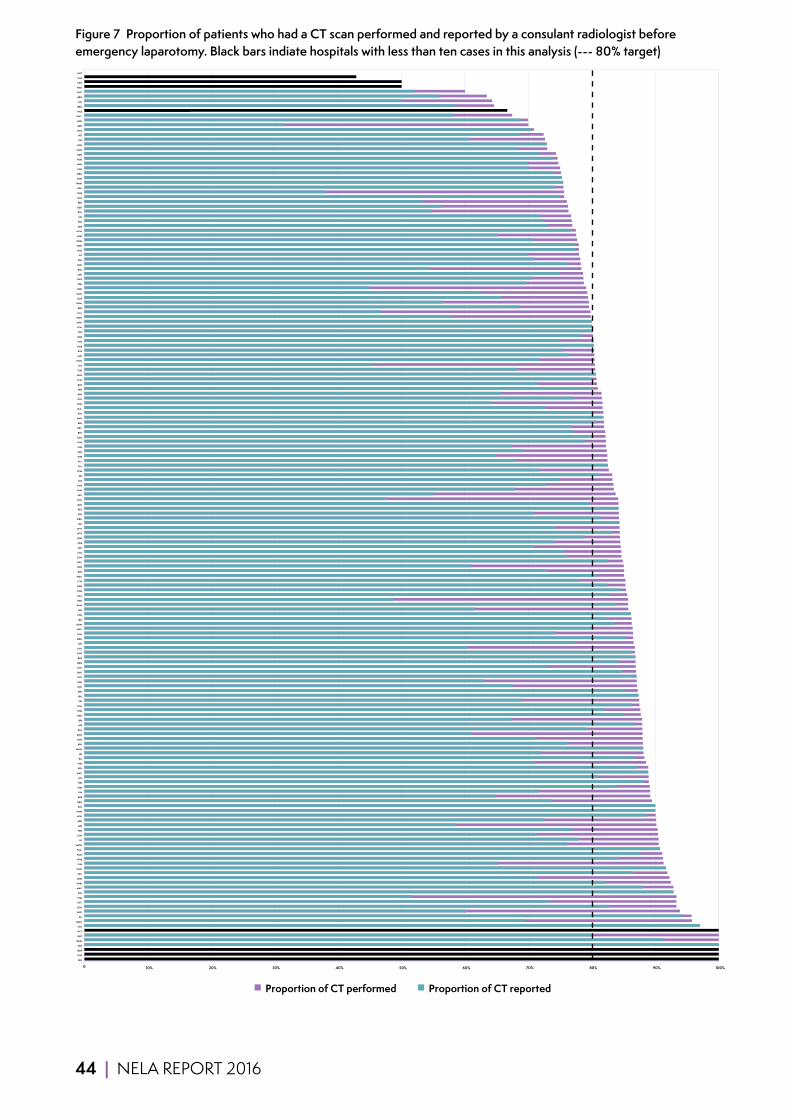
44 | NELA REPORT 2016
Figure 7 Proportion of patients who had a CT scan performed and reported by a consulant radiologist before emergency laparotomy. Black bars indiate hospitals with less than ten cases in this analysis (--- 80% target)
0 10% 20% 30% 40% 50% 60% 70% 80% 90% 100%
PRS
GHS
BMP
PAH
WMU
BNT
WLT
SCU
NMG
PIL
WHT
GGH
CTY
STM
PAP
MAC
WHH
QHR
QEL
WHC
CHR
WYB
KGH
TGA
MDW
LIS
CGH
FRR
MRI
ADD
WSH
NMH
EAL
GEO
RDE
PIN
SHH
DID
LIN
MAY
BFH
WIR
RLI
LEI
WAW
RFH
RCH
KNG
RSC
AIR
BRI
BAR
FRM
SCA
SJH
YEO
SPD
UHC
SGH
ROT
SMV
COC
QEQ
BAS
NSH
CHX
JPH
MKH
HUL
WRC
HOM
LEG
FGH
LER
KMH
RAD
QKL
PGH
NDD
TUN
WEX
RSH
RVN
NEV
CON
COL
STH
QEB
RGH
NTG
WYT
HIL
WRX
SPH
BRT
GLO
KCH
FAZ
SMH
PMS
CMI
AEI
SCM
SAL
PLY
WHI
SAN
CHE
SUN
BOL
BTH
DRY
BED
MAR
STD
BLA
DVH
KTH
RPH
HIN
BAT
CLW
NUN
TOR
SLF
POW
SHC
RUS
HAR
PCH
DAR
STR
LEW
MIW
WDG
UCL
RBE
UHW
QAP
QMC
NPH
YDH
GWE
LDH
RSU
RHC
ESU
IPS
WAT
WDH
OHM
NOR
WGH
SEH
RSS
VIC
RLU
DER
EBH
GLG
NGS
QEG
WMH
NHH
WRG
LON
MPH
HUD
DDH
MOR
HCH
FRE
PET
NTH
BRD
NCR
GWY
WES
BRG
LHC
BRO
NOT
HHX
CKH
CAS
MST
Proportion of CT performed Proportion of CT reported
NELA REPORT 2016 | 45
10 PREOPERATIVE DOCUMENTATION OF RISK
Why is this important?Death, complications, long-term debilitation, and prolonged in-hospital recovery are far more common after emergency bowel surgery than after many other operations, including elective bowel surgery.6,7
Since the risks of adverse outcomes vary between individuals, and because the risks posed by an operation sometimes outweigh proposed benefits, it is essential that they are quantified and documented before surgery for every patient. Assessment of risk can entail calculating a percentage risk of death using a variety of risk scores (e.g. P-POSSUM),15 or allocating a patient to a specific higher or lower risk category. Doing so helps guide doctors, patients, and their relatives in deciding which course of treatment is most appropriate, and allows clinicians to tailor care to the needs of each person requiring surgery. If risk has not been evaluated, it makes it harder for patients to reach an informed decision and for clinicians to target appropriate specialist care to high risk and highest risk patients.
It is possible that where risk has not been documented, potential adverse outcomes may not have been appreciated by clinicians, or discussed with the patient as part of the consent process.
Figure 8 Categories of riskThe following categories are used in the Audit:
Highest risk (>10% risk of death)
High risk (5–10% risk of death)
Lower risk (<5% risk of death)
KEY STANDARDS An assessment of mortality risk should be made explicit to the patient and recorded clearly on the consent form and in the medical record. NCEPOD KTR
Patients must be actively involved in shared decision making and supported by clear information from healthcare professionals to make fully informed choices about treatment and ongoing care that reflect what is important to them. This should happen consistently, seven days a week. NHS 7 Day Services
We recommend that objective risk assessment become a mandatory part of the preoperative checklist to be discussed between surgeon and anaesthetist for all patients. This must be more detailed than simply noting the ASA score. RCS HR
Patients with a predicted mortality ≥5% should be managed as ‘high risk’. RCS HR
46 | NELA REPORT 2016
AUDIT QUESTIONS What proportion of patients had an assessment of risk documented before surgery? (Target ≥ 80%)
What variation has been seen over time?
What were the relative proportions of patients documented to be at lower, high and highest risk of death, and how did this vary according to the time of day that surgery was performed?
What was the observed mortality rate for each risk category?
How did care vary according to whether risk had been documented in the preoperative period?
What variation existed in the proportion of patients who had a risk of death documented before surgery by:
1 Hospital? 2 Urgency of surgery? 3 Patient characteristics?
How accurate is P-POSSUM at predicting a patient’s risk of death?
KEY FINDINGS Risk of death was documented before surgery for nearly two-thirds of all patients (64%) (Table 11). This is an improvement on last year where risk was documented in 56% of patients. 43 hospitals (23%) were rated Green, whereas 42 hospitals (23%) were rated Red (Figure 13).
Overall, 41% were lower risk, 18% high risk and 41% highest risk (Table 12). Patients having surgery after midnight had a higher median P-POSSUM predicted mortality (6.0% 8am to 6pm, 9.0% 6pm to midnight, 15.2% after midnight) (Table 13)
Of the 36% of patients for whom no risk assessment had been documented:
■ 34% of patients were highest risk (calculated P-POSSUM risk of death >10%) (Table 14). ■ 19% were high risk (calculated P-POSSUM risk of death 5%–10%). ■ 47% were lower risk (calculated P-POSSSUM risk of death <5%).
Where risk was documented before surgery, a higher proportion of patients received other key process measures such as consultant presence in theatre and admission to critical care after surgery (Figure 10).
P-POSSUM is accurate up to ~15% predicted mortality; above this it tends to overestimate a patient’s risk of death (Figure 11).
Clinical commentaryRisk of death should be estimated and documented in the medical record for all patients, and risks should be discussed with patients and their relatives to inform shared decision making. It is therefore encouraging that there has been an increase in the proportion of patients whose risk of death from surgery was assessed and documented in the preoperative period (from 56% to 64%) (Figure 12). Those who tend to have worse outcomes (e.g. due to age, ASA or increasing surgical urgency) were more likely to have risk documented, suggesting that clinicians use formal risk scoring to augment clinical judgement (Table 15 and Table 16). However, 36% of patients still do not have a documented risk assessment.
Participants provided sufficient data to allow us to calculate the P-POSSUM predicted risk of death for 93% of all patients, including those who had no risk documented prior to surgery (Table 11). For the 7% of patients with missing P-POSSUM data, we calculated the P-POSSUM risk of death in keeping with accepted methodology by assigning the missing variables to the lowest risk category.16 This allowed us to examine how the standards of care provided to this latter group compared to an equivalent group of patients in whom the risk of death had been documented before surgery. Where there was no documented risk before surgery, the median predicted risk of death (based on P-POSSUM score) was 5.6%, meaning they fall into the high risk (5–10%) group (Table 11). Observed 30-day mortality in the ‘not documented’ group was also similar to the high risk group (7.3% and 7.1% respectively) (Figure 9).

NELA REPORT 2016 | 47
The First NELA Patient Report found that standards of care (including presence of a consultant surgeon and a consultant anaesthetist for surgery) were better met and appropriate levels of care (e.g. critical care admission) were better provided if a risk assessment had been documented. This trend has continued, emphasising the fact that risk assessment appears to drive more appropriate clinical management. This is summarised in Figure 10 and expanded upon in relevant chapters (Chapters 13 and 15) throughout this Report.
Table 11 P-POSSUM risk of death, observed ONS 30-day and 90-day mortality by documented preoperative risk category (Year 2 data)
Documented preoperative risk category
Proportion of patients (%)
Median P-POSSUM risk of death within 30 days of surgery (%)
Observed 30-day mortality based on ONS data (%)
Observed 90-day mortality based on ONS data (%)
Lower (<5%) 24 2.7 1.7 4.1
High (5–10%) 14 7.4 7.1 11.7
Highest (>10%) 26 29.1 26.9 33.1
Not documented 36 5.6 7.3 10.5
Overall 100% 7.0% 11.1% 15.1%
Table 12 Relative proportions in each risk category (based on calculated preoperative P-POSSUM risk of death) by time of arrival in operating theatre (Year 2 data)
Time of day Total number of patients
Proportion of patients (%)
Lower risk (<5%) High risk (5–10%) Highest risk (>10%)
0800–1759 14,718 45 18 37
1800–2359 5,517 36 17 47
0000–0759 1,920 26 15 59
(missing) 983 44 18 38
Overall 23,138 41% 18% 41%
Table 13 Median preoperative calculated P-POSSUM risk of death by time of day of arrival in operating theatre (Year 2 data)
Time of day Total number of patients Median P-POSSUM risk of death (%)
0800–1759 14,718 6.0
1800–2359 5,517 9.0
0000–0759 1,920 15.2
(missing) 983 6.3
Overall 23,138 7.0%
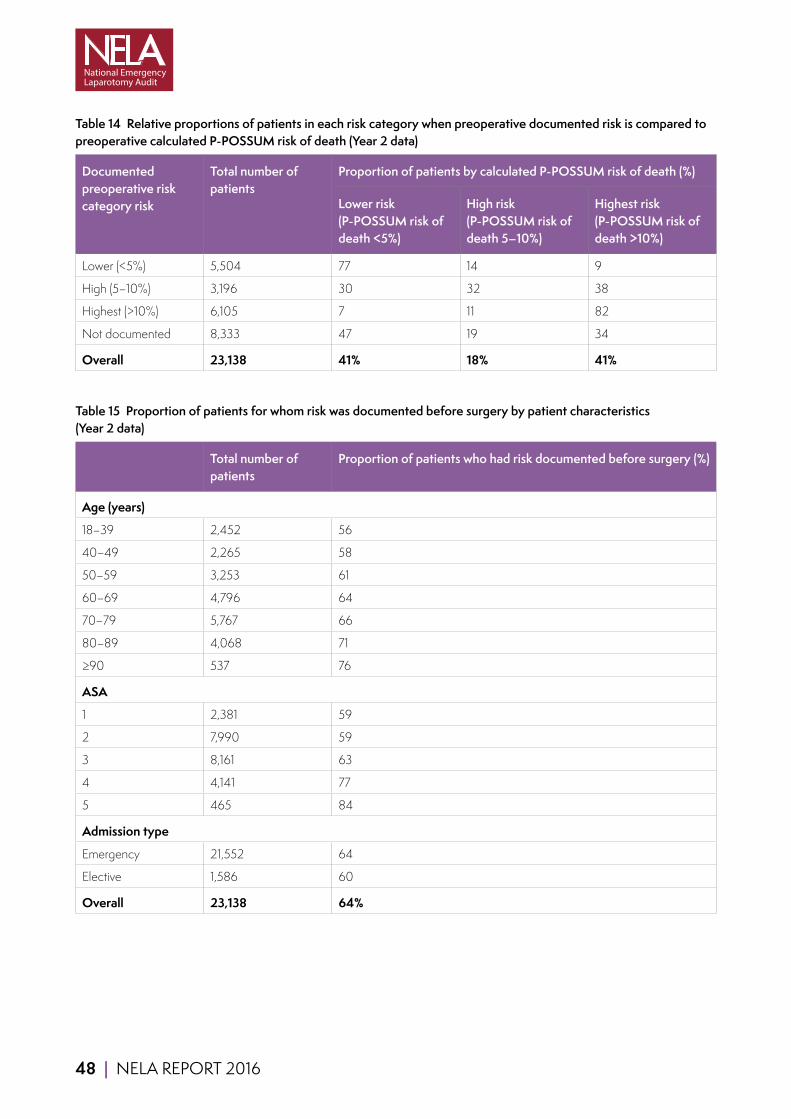
48 | NELA REPORT 2016
Table 14 Relative proportions of patients in each risk category when preoperative documented risk is compared to preoperative calculated P-POSSUM risk of death (Year 2 data)
Documented preoperative risk category risk
Total number of patients
Proportion of patients by calculated P-POSSUM risk of death (%)
Lower risk (P-POSSUM risk of death <5%)
High risk (P-POSSUM risk of death 5–10%)
Highest risk (P-POSSUM risk of death >10%)
Lower (<5%) 5,504 77 14 9
High (5–10%) 3,196 30 32 38
Highest (>10%) 6,105 7 11 82
Not documented 8,333 47 19 34
Overall 23,138 41% 18% 41%
Table 15 Proportion of patients for whom risk was documented before surgery by patient characteristics (Year 2 data)
Total number of patients
Proportion of patients who had risk documented before surgery (%)
Age (years)
18–39 2,452 56
40–49 2,265 58
50–59 3,253 61
60–69 4,796 64
70–79 5,767 66
80–89 4,068 71
≥90 537 76
ASA
1 2,381 59
2 7,990 59
3 8,161 63
4 4,141 77
5 465 84
Admission type
Emergency 21,552 64
Elective 1,586 60
Overall 23,138 64%
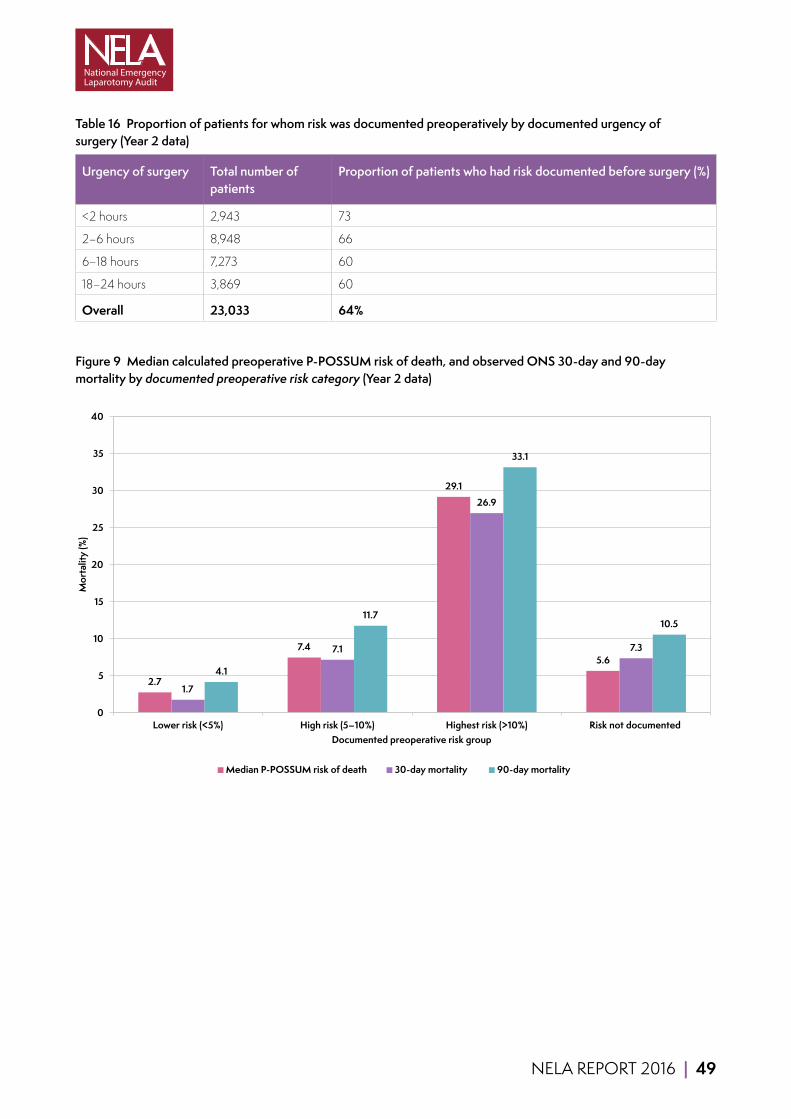
NELA REPORT 2016 | 49
Table 16 Proportion of patients for whom risk was documented preoperatively by documented urgency of surgery (Year 2 data)
Urgency of surgery Total number of patients
Proportion of patients who had risk documented before surgery (%)
<2 hours 2,943 73
2–6 hours 8,948 66
6–18 hours 7,273 60
18–24 hours 3,869 60
Overall 23,033 64%
Figure 9 Median calculated preoperative P-POSSUM risk of death, and observed ONS 30-day and 90-day mortality by documented preoperative risk category (Year 2 data)
2.7
7.4
29.1
5.6
1.7
7.1
26.9
7.3
4.1
11.7
33.1
10.5
0
5
10
15
20
25
30
35
40
Lower risk (<5%) High risk (5–10%) Highest risk (>10%) Risk not documented
Mor
talit
y (%
)
Documented preoperative risk group
Median P-POSSUM risk of death 30-day mortality 90-day mortality

50 | NELA REPORT 2016
Figure 10 Intraoperative presence of both a consultant surgeon and consultant anaesthetist, and direct postoperative admission to critical care by documented preoperative risk category (Year 2 data)
66
39
71 69
78
90
66
53
0
10
20
30
40
50
60
70
80
90
100
Both consultants present in theatre Direct postoperative admission to critical care
Prop
ortio
n of
pat
ient
s (%
)
Lower risk (<5%) High risk (5-10%) Highest risk (>10%) Risk not documented
How well does P-POSSUM predict risk?The estimate of risk of death provided by P-POSSUM is reasonably accurate below around 15%. However above this, P-POSSUM tends to overestimate risk. This is illustrated in Figure 11 (further information is provided in chapter 21.3). With regard to use of P-POSSUM in clinical situations, P-POSSUM is still useful for identifying patients who fall in a lower, high or highest risk category, in order to make decisions about the need for resources such as critical care. However we urge caution in reliance on P-POSSUM when used to guide clinical decision making at high levels of predicted mortality as it overestimates risk of death by a factor of approximately two.
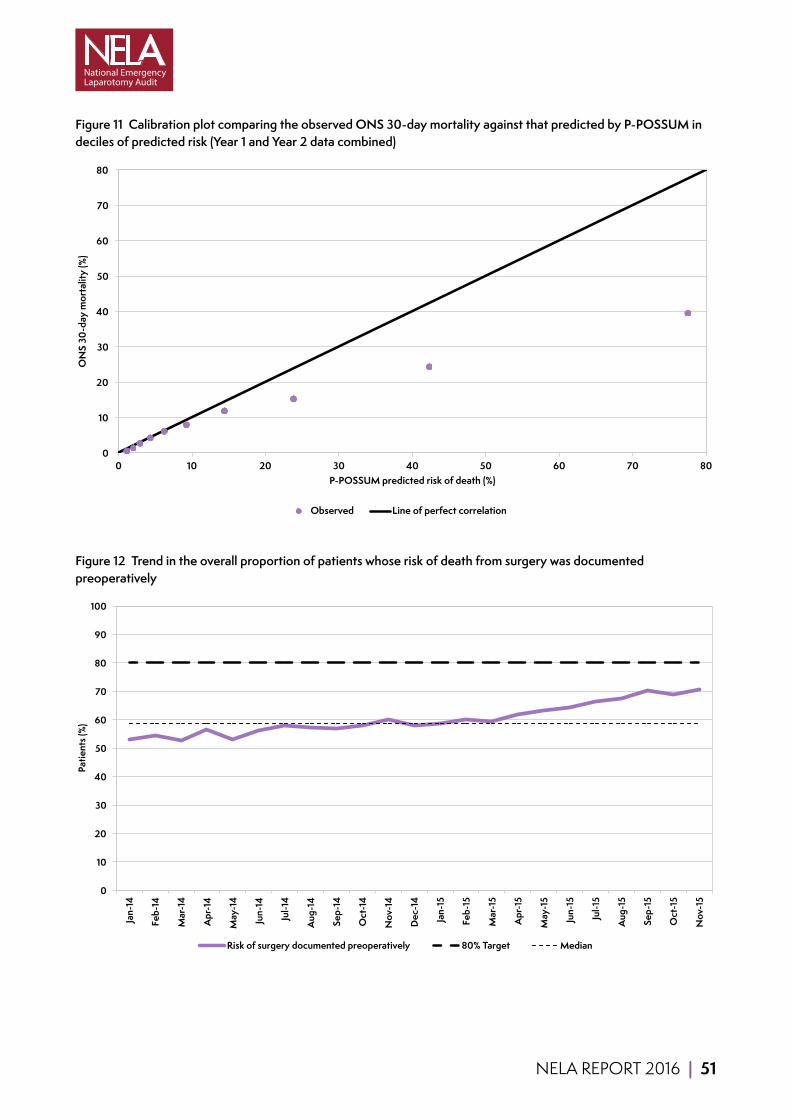
NELA REPORT 2016 | 51
Figure 11 Calibration plot comparing the observed ONS 30-day mortality against that predicted by P-POSSUM in deciles of predicted risk (Year 1 and Year 2 data combined)
0
10
20
30
40
50
60
70
80
0 10 20 30 40 50 60 70 80
ON
S 30
-day
mor
talit
y (%
)
P-POSSUM predicted risk of death (%)
Observed Line of perfect correlation
Figure 12 Trend in the overall proportion of patients whose risk of death from surgery was documented preoperatively
0
10
20
30
40
50
60
70
80
90
100
Jan-
14
Feb-
14
Mar
-14
Apr
-14
May
-14
Jun-
14
Jul-1
4
Aug
-14
Sep-
14
Oct
-14
Nov
-14
Dec
-14
Jan-
15
Feb-
15
Mar
-15
Apr
-15
May
-15
Jun-
15
Jul-1
5
Aug
-15
Sep-
15
Oct
-15
Nov
-15
Patie
nts (
%)
Risk of surgery documented preoperatively 80% Target Median

52 | NELA REPORT 2016
QUALITY IMPROVEMENT VIGNETTE Many hospitals improved their preoperative risk assessment with changes to booking processes to include prompts.
Southport District General hospital has a new ‘laparotomy pathway that is now compulsory to complete at the point of booking a laparotomy in the theatre complex. Part of the data to complete for the single-sheet laparotomy booking form is a section for P-POSSUM with the necessary requirements of surgical and anaesthetic staff being clearly stated on the form.’ This led to a 6-fold improvement in risk documentation.
The Queen Elizabeth Hospital, King’s Lynn achieved 99% of patients undergoing preoperative risk assessment with the ‘implementation of an Emergency Theatre Booking System which requires surgeons to enter physiological and laboratory data (which make up the P-POSSUM score). When a patient is then booked they appear on our booking screen with their P-POSSUM mortality risk displayed.’
As with all improving hospitals, leadership and teamwork is also important.
In Furness hospital they had: ‘Strong, passionate and enthusiastic leadership highly motivated for quality improvement. Team work and co-operation in particular the middle grade doctors. Successfully raised awareness across all departments that emergency laparotomy patients matter and need to be given priority especially amongst the junior surgical doctors.’
RECOMMENDATIONS Policies should be developed and implemented which use individual risk assessment to allocate resources (e.g. critical care) appropriate to the patient’s need (Medical and Clinical Directors).
When surgery is contemplated, a formal assessment of the risk of death and complications should be undertaken by a clinician and documented in the patient record. This information should be communicated to all members of the MDT in order to prioritise care and allocate appropriate resources. If surgery is undertaken, this risk assessment should be documented on the patient consent form (MDT).
P-POSSUM should continue to be used to assess risk. However clinicians should be aware that it over-predicts above ~15% risk and should not rely solely on P-POSSUM assessments of risk when deciding on benefits of treatment (MDT).
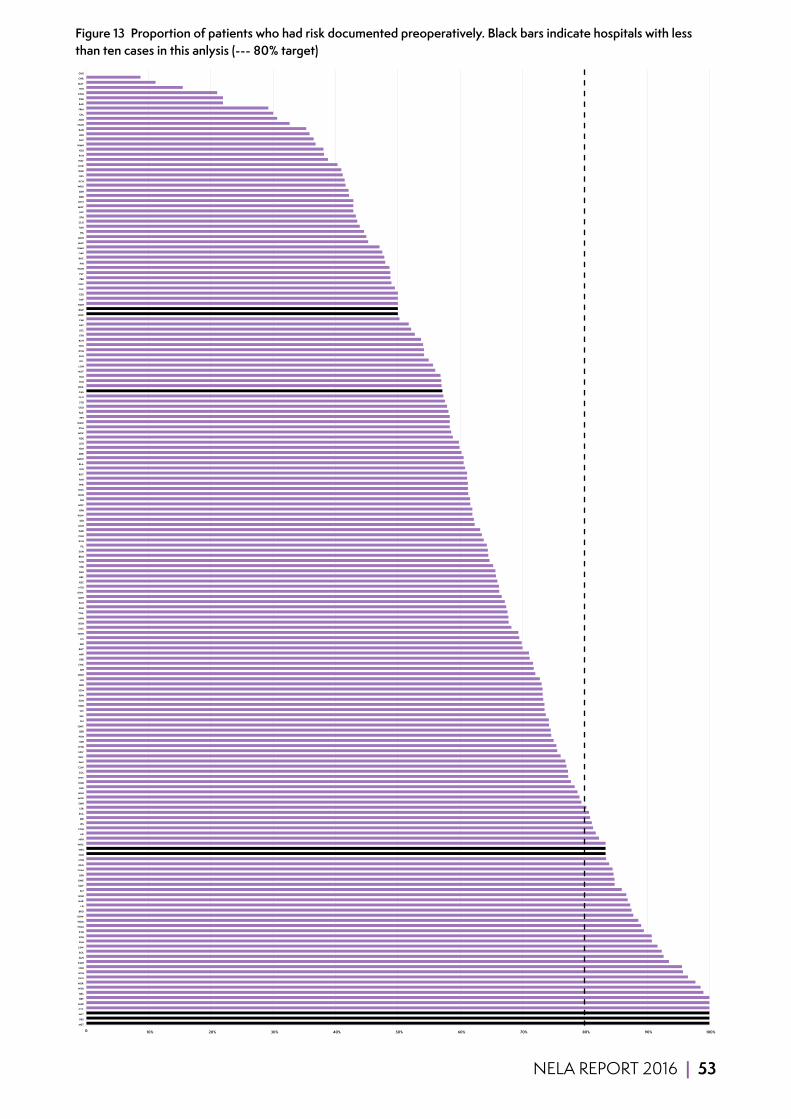
NELA REPORT 2016 | 53
Figure 13 Proportion of patients who had risk documented preoperatively. Black bars indicate hospitals with less than ten cases in this anlysis (--- 80% target)
0 10% 20% 30% 40% 50% 60% 70% 80% 90% 100%
MST
PRS
WLT
CTY
MAR
BRT
QKL
WSH
NOR
QEQ
HCH
NSH
KMH
SAN
BOL
LEW
FGH
BTH
KTH
HOM
WDG
UHW
BRG
LEI
HAR
GGH
SLF
SMV
GWE
BFH
OHM
QEG
NTH
CKH
WES
WHC
NPH
AEI
CON
IPS
BRI
SCA
LER
SMH
MOR
NHH
HUL
HUD
WYT
COL
CLW
PMS
DRY
NEV
WYB
SEH
PGH
QEB
QMC
RLI
SAL
VIC
NDD
SGH
RPH
SCM
BRD
LIN
WDH
SJH
CHX
FRR
MRI
BNT
AIR
LIS
WHH
COC
RGH
MPH
TGA
SHH
SCU
DDH
GWY
NTG
RSC
RBE
BAS
STR
TUN
BRO
SUN
PIL
RVN
CGH
DAR
KGH
DID
POW
RFH
WRC
JPH
NUN
NGS
WIR
PAH
ROT
SPD
BLA
MDW
DER
YDH
LEG
RDE
WRX
STM
WAW
PET
FAZ
GEO
STD
GLO
CAS
WEX
YEO
RLU
NOT
LON
QEL
RUS
DVH
WHI
RCH
STH
UCL
BAT
CMI
HHX
BMP
NMH
PAP
ESU
CHE
UHC
FRE
PLY
WGH
PIN
RHC
QAP
WMU
MAC
MKH
HIL
TOR
GLG
SPH
LHC
MIW
WHT
BED
EBH
WRG
KCH
RSS
QHR
NCR
WAT
PCH
RSU
WMH
SHC
LDH
RAD
NMG
ADD
EAL
FRM
BAR
RSH
KNG
HIN
MAY
CHR
GHS

54 | NELA REPORT 2016
11 TIMELINESS OF CARE FOR PATIENTS UNDERGOING EMERGENCY SURGERY FOR SUSPECTED PERITONITIS
Why is this important?Many patients requiring an emergency laparotomy have signs of sepsis. Sepsis is a term used to describe widespread, severe inflammation in the body resulting from infection. Intra-abdominal sepsis is life-threatening and early administration of antibiotics before surgery has been shown to improve the likelihood of survival.17,18 The delivery of effective antibiotics is part of the first-line management of sepsis and remains part of resuscitation within the first hour of diagnosis of sepsis.19 The ability of a hospital to deliver this treatment rapidly is dependent on reliable pathways of care and good communication between staff across different departments. The second part of the treatment process which these patients require is urgent surgical control of the source of the sepsis. It is well established that more rapid control of the source of peritonitis correlates with increased survival rates.
As with the First NELA Patient Report, in order to evaluate this, we selected the group of patients admitted as an emergency with the diagnosis of peritonitis who were subsequently deemed to require surgery within six hours of a decision being made to operate, and who had surgery within 24 hours of admission. This constitutes a relatively clearly defined group that requires both urgent antibiotic therapy and urgent surgery, and who were likely to have signs of sepsis on admission. This allows us to analyse how effective clinical teams were at delivering key interventions rapidly.
KEY STANDARDS Those with septic shock require immediate broad-spectrum antibiotics with fluid resuscitation and source control. RCS HR
Providers are expected to screen for sepsis all those patients for whom sepsis screening is appropriate, and to rapidly initiate intravenous antibiotics, within 1 hour of presentation, for those patients who have suspected severe sepsis, Red Flag Sepsis or septic shock. CQUIN 2015/2016
Trusts should ensure emergency theatre access matches need and ensure prioritisation of access is given to emergency surgical patients ahead of elective patients whenever necessary as significant delays are common and affect outcomes. RCS HR
AUDIT QUESTIONS For patients admitted as an emergency who were scheduled for emergency laparotomy for suspected peritonitis within six hours of the decision to operate and underwent sugery within 24 hours of admission to hospital:
1 What was the interval between admission to hospital and administration of antibiotics? 2 What was the interval between antibiotic administration and arrival in an operating theatre? 3 What was the interval between admission to hospital and arrival in an operating theatre?

NELA REPORT 2016 | 55
KEY FINDINGS 2,056 patients were scheduled for emergency laparotomy for suspected peritonitis within six hours of a decision to operate and underwent surgery within 24 hours of admission to hospital (Table 40).
99% patients in this cohort received antibiotics. Over half of patients had received the first dose of an antibiotic within three and a half hours of emergency admission to hospital, but almost a quarter had yet to receive antibiotics six and a half hours after admission. When analysed according to time of arrival in theatre, 17% (319 of 1825 patients where all time data were available) received the first dose of antibiotics at the same time as or after their arrival in theatre.
Over half of patients arrived in theatre for surgery within two hours of the decision being made to operate, and three-quarters of patients arrived in theatre within three hours of the decision.
However, eight hours after admission just under half of these patients had not yet arrived in theatre for surgery, and a quarter waited over 12.5 hours.
Clinical commentarySelecting this specific subgroup, where surgery within six hours was considered necessary for the treatment of peritonitis and underwent surgery within 24 hours of admission to hospital, allowed us to look at the speed with which time-critical elements of care had been delivered. It is likely that many patients should have received antibiotics earlier, rather than on arrival in theatre. The slight improvement in time from 3.6 hours (IQR 1.8 to 7.0 hours) to 3.3 hours (IQR 1.4 to 6.6 hours) for delivery of antibiotics is encouraging, as early antibiotic therapy is known to be associated with improved mortality. Nevertheless, the fact that almost 25% of these patients still waited over 6.5 hours for antibiotics requires further examination and local case-specific review. We would hope to see continued improvement, especially given the concurrent CQUIN surrounding the treatment of sepsis.
Also of concern is the median time of 7.7 hours that it takes for these patients to reach the operating theatre, as a shorter time to achieve control of the source of sepsis is known to be associated with improved mortality.18 Over 25% of patients waited more than 12.5 hours. For these patients the greater part of the delay appears to reside within the admission and decision process, as time from decision to operation is typically much shorter. Local case review could help NHS trusts focus on the specific bottlenecks in their pathway of care.
Due to the small numbers within this cohort, we have been unable to produce hospital-level results for these process measures.

56 | NELA REPORT 2016
Figure 14 Trends in the median times from admission to administration of antibiotics, admission to arrival in theatre, and decision to operate to arrival in theatre in patients with peritonitis
0
1
2
3
4
5
6
7
8
9
10
Apr
-14
May
-14
Jun-
14
Jul-1
4
Aug
-14
Sep-
14
Oct
-14
Nov
-14
Dec
-14
Jan-
15
Feb-
15
Mar
-15
Apr
-15
May
-15
Jun-
15
Jul-1
5
Aug
-15
Sep-
15
Oct
-15
Nov
-15
Tiim
e (h
ours
)
Median time from admission to arrival in theatre Median time from admission to antibiotics
Median time from decision to operate to arrival in theatre Median
Additional analysesThe interval between admission to hospital and administration of antibiotics, and between admission and the decision to operative and arrival in theatre was assessed against patient age, ASA, documented risk and operative urgency (Table 40), and the day and time of admission (Table 41 and Table 42).
RECOMMENDATIONS Any areas of the hospital that admit emergency General Surgical patients need to have robust mechanisms in place to identify patients with signs of sepsis and ensure prompt prescription and administration of antibiotics (Medical and Clinical Directors, MDT).
Medical and Clinical Directors should examine their emergency theatre provision in the context of their local Audit results, in order to determine whether sufficient resources are available to enable patients to receive emergency surgical treatment without undue delay (Medical and Clinical Directors).
Multidisciplinary Teams, including emergency departments and acute assessment units, should review their pathways of care for the administration of antibiotics in order to identify why delays occur (MDT).
Clinicians should regularly review Audit data on timing of administration of antibiotics and time to theatre in order to ensure that aims are being achieved (MDT).
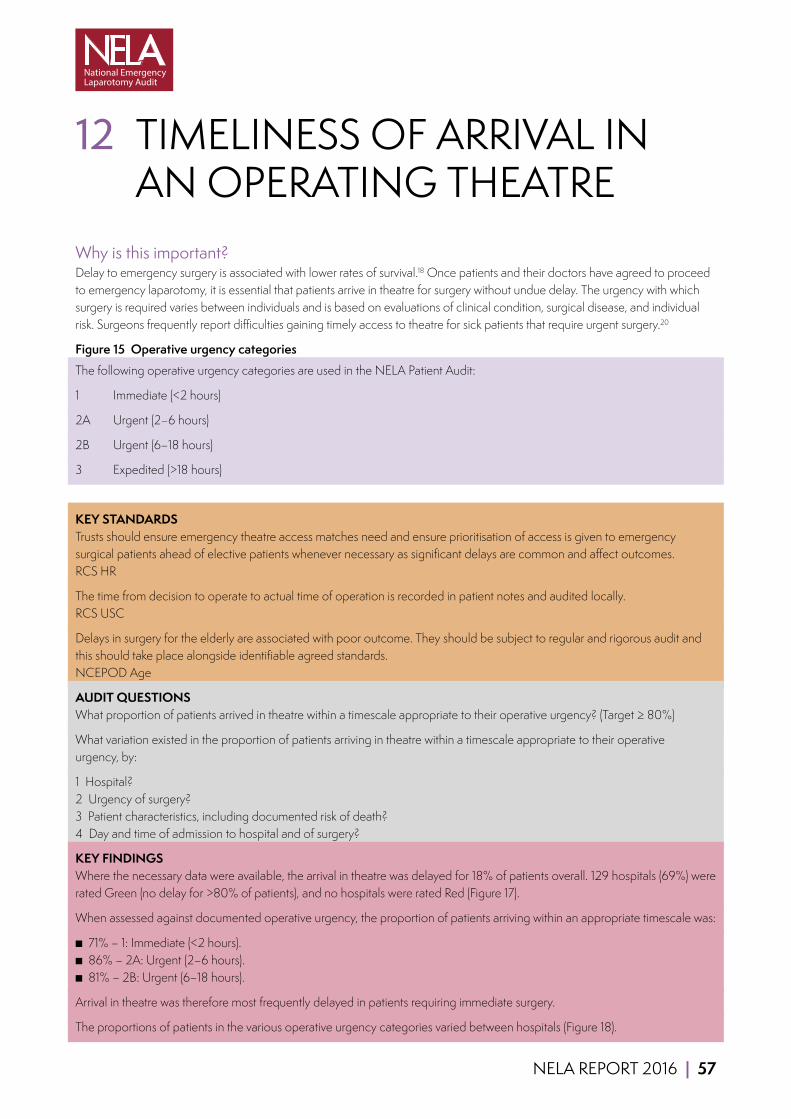
NELA REPORT 2016 | 57
12 TIMELINESS OF ARRIVAL IN AN OPERATING THEATRE
Why is this important?Delay to emergency surgery is associated with lower rates of survival.18 Once patients and their doctors have agreed to proceed to emergency laparotomy, it is essential that patients arrive in theatre for surgery without undue delay. The urgency with which surgery is required varies between individuals and is based on evaluations of clinical condition, surgical disease, and individual risk. Surgeons frequently report difficulties gaining timely access to theatre for sick patients that require urgent surgery.20
Figure 15 Operative urgency categoriesThe following operative urgency categories are used in the NELA Patient Audit:
1 Immediate (<2 hours)
2A Urgent (2–6 hours)
2B Urgent (6–18 hours)
3 Expedited (>18 hours)
KEY STANDARDS Trusts should ensure emergency theatre access matches need and ensure prioritisation of access is given to emergency surgical patients ahead of elective patients whenever necessary as significant delays are common and affect outcomes. RCS HR
The time from decision to operate to actual time of operation is recorded in patient notes and audited locally. RCS USC
Delays in surgery for the elderly are associated with poor outcome. They should be subject to regular and rigorous audit and this should take place alongside identifiable agreed standards. NCEPOD Age
AUDIT QUESTIONS What proportion of patients arrived in theatre within a timescale appropriate to their operative urgency? (Target ≥ 80%)
What variation existed in the proportion of patients arriving in theatre within a timescale appropriate to their operative urgency, by:
1 Hospital? 2 Urgency of surgery? 3 Patient characteristics, including documented risk of death? 4 Day and time of admission to hospital and of surgery?
KEY FINDINGS Where the necessary data were available, the arrival in theatre was delayed for 18% of patients overall. 129 hospitals (69%) were rated Green (no delay for >80% of patients), and no hospitals were rated Red (Figure 17).
When assessed against documented operative urgency, the proportion of patients arriving within an appropriate timescale was:
■ 71% – 1: Immediate (<2 hours). ■ 86% – 2A: Urgent (2–6 hours). ■ 81% – 2B: Urgent (6–18 hours).
Arrival in theatre was therefore most frequently delayed in patients requiring immediate surgery.
The proportions of patients in the various operative urgency categories varied between hospitals (Figure 18).
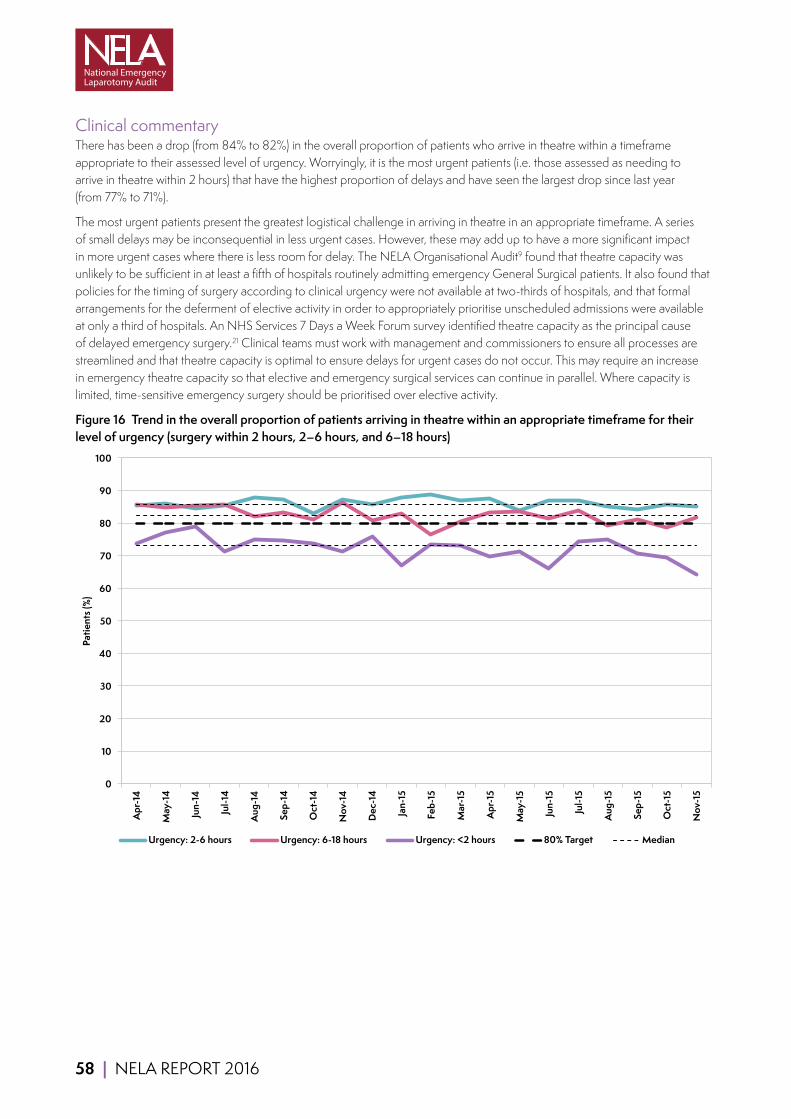
58 | NELA REPORT 2016
Clinical commentaryThere has been a drop (from 84% to 82%) in the overall proportion of patients who arrive in theatre within a timeframe appropriate to their assessed level of urgency. Worryingly, it is the most urgent patients (i.e. those assessed as needing to arrive in theatre within 2 hours) that have the highest proportion of delays and have seen the largest drop since last year (from 77% to 71%).
The most urgent patients present the greatest logistical challenge in arriving in theatre in an appropriate timeframe. A series of small delays may be inconsequential in less urgent cases. However, these may add up to have a more significant impact in more urgent cases where there is less room for delay. The NELA Organisational Audit9 found that theatre capacity was unlikely to be sufficient in at least a fifth of hospitals routinely admitting emergency General Surgical patients. It also found that policies for the timing of surgery according to clinical urgency were not available at two-thirds of hospitals, and that formal arrangements for the deferment of elective activity in order to appropriately prioritise unscheduled admissions were available at only a third of hospitals. An NHS Services 7 Days a Week Forum survey identified theatre capacity as the principal cause of delayed emergency surgery.21 Clinical teams must work with management and commissioners to ensure all processes are streamlined and that theatre capacity is optimal to ensure delays for urgent cases do not occur. This may require an increase in emergency theatre capacity so that elective and emergency surgical services can continue in parallel. Where capacity is limited, time-sensitive emergency surgery should be prioritised over elective activity.
Figure 16 Trend in the overall proportion of patients arriving in theatre within an appropriate timeframe for their level of urgency (surgery within 2 hours, 2–6 hours, and 6–18 hours)
0
10
20
30
40
50
60
70
80
90
100
Apr
-14
May
-14
Jun-
14
Jul-1
4
Aug
-14
Sep-
14
Oct
-14
Nov
-14
Dec
-14
Jan-
15
Feb-
15
Mar
-15
Apr
-15
May
-15
Jun-
15
Jul-1
5
Aug
-15
Sep-
15
Oct
-15
Nov
-15
Patie
nts (
%)
Urgency: 2-6 hours Urgency: 6-18 hours Urgency: <2 hours 80% Target Median
NELA REPORT 2016 | 59
Additional analysesTimeliness of arrival in theatre was assessed against patient age, ASA, admission type, documented risk and operative urgency (Table 43), and the day and time of surgery (Table 44).
QUALITY IMPROVEMENT VIGNETTE Several hospitals improved the timeliness of access to theatres with streamlined booking processes. Great Western Hospital moved into the top performing quartile:
‘In the last year we have adopted a boarding card where the surgical team need to specify a classification of urgency of surgery prior to booking the case. This has required some education which has improved awareness of urgency and we now have more objective data to scrutinise.’
RECOMMENDATIONS Medical and Clinical Directors should examine their emergency theatre provision in the context of their local Audit results, in order to determine whether sufficient resources are available to enable patients to receive emergency surgical treatment without undue delay (Medical and Clinical Directors).
Multidisciplinary pathways should be established to prevent inappropriate delays in a patient undergoing surgery, especially once a consultant decision has been made. This will require cross-disciplinary cooperation between surgeons, anaesthetists, radiological and laboratory services, and theatre and critical care staff (MDT).
Theatre capacity should be sufficient to allow emergency and elective surgery to continue in parallel. Where capacity is limited, prioritisation of time-sensitive emergency surgery can be facilitated by policies to defer elective activity (Medical and Clinical Directors).
Commissioners should work with local providers to determine whether theatre capacity is sufficient to prevent potentially harmful delays to surgery in patients requiring emergency bowel operations. Some hospitals may require the capacity for emergency and elective care to continue in parallel (Commissioners and provider Chief Executives).
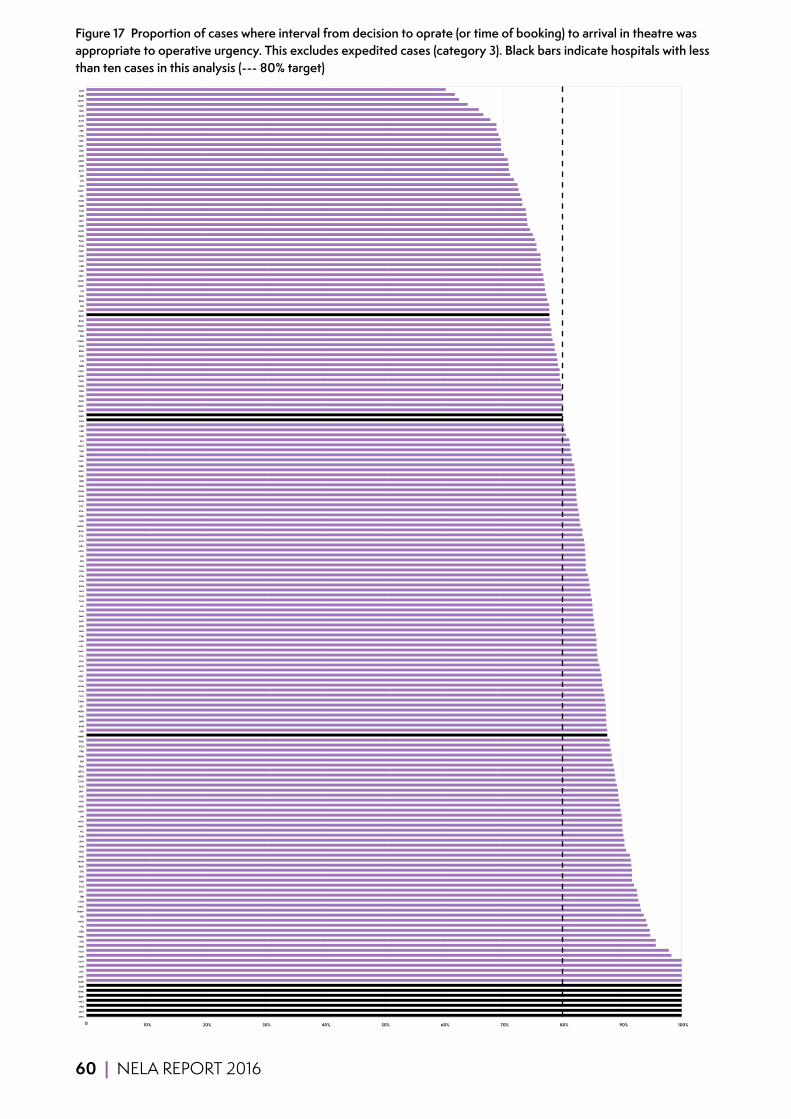
60 | NELA REPORT 2016
Figure 17 Proportion of cases where interval from decision to oprate (or time of booking) to arrival in theatre was appropriate to operative urgency. This excludes expedited cases (category 3). Black bars indicate hospitals with less than ten cases in this analysis (--- 80% target)
0 10% 20% 30% 40% 50% 60% 70% 80% 90% 100%
GHS
MST
PRS
WLT
BMP
HHX
CKH
MAR
MAY
LHC
PAH
NOT
HAR
HCH
NDD
STD
WMU
BED
PIL
NHH
RLI
WAW
MAC
CON
BRI
SHC
SCU
PAP
DDH
STR
RHC
WGH
HUL
HUD
SPH
LEW
FGH
VIC
WHT
WEX
LIN
MPH
WRX
YDH
YEO
DRY
BLA
CGH
WRG
QEQ
FRM
JPH
WHH
FRR
PCH
RDE
NMH
SPD
RVN
BFH
PMS
WDH
PET
KMH
QEG
KGH
HOM
TOR
WRC
RSS
WDG
BAS
COL
QMC
EAL
NSH
CMI
WHI
NTH
BAR
SMH
SUN
HIL
TUN
GLG
BAT
PGH
LDH
KTH
BTH
HIN
DID
AEI
NCR
QKL
GLO
CTY
RGH
MDW
RSU
WIR
SCA
PLY
NUN
SGH
OHM
SHH
RBE
DAR
WAT
DER
COC
SEH
STH
WYT
SLF
LEG
LER
ESU
CAS
WES
CHR
WHC
GEO
NPH
RPH
KNG
RLU
MOR
NGS
BRD
LEI
BOL
BRO
SCM
WMH
PIN
WSH
POW
RCH
BNT
CHX
SJH
BRG
RUS
LIS
GWE
NOR
NEV
EBH
MRI
FAZ
QHR
QAP
STM
TGA
NMG
GGH
ADD
UHC
BRT
CHE
QEB
WYB
SAL
GWY
UCL
IPS
AIR
ROT
RSH
MKH
DVH
RFH
SMV
RSC
NTG
FRE
MIW
KCH
SAN
QEL
CLW
UHW
RAD
LON
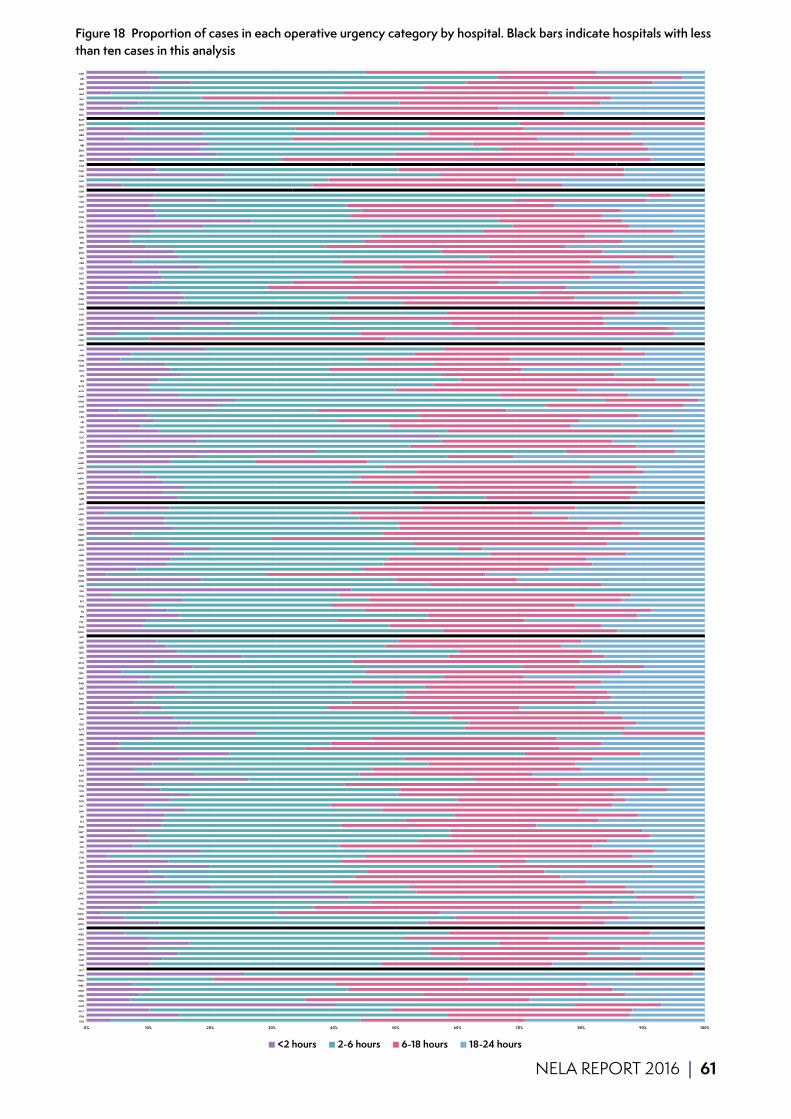
NELA REPORT 2016 | 61
Figure 18 Proportion of cases in each operative urgency category by hospital. Black bars indicate hospitals with less than ten cases in this analysis
0% 10% 20% 30% 40% 50% 60% 70% 80% 90% 100% YEO
YDH
WYT
WYB
WSH
WRX
WRG
WRC
WMU
WMH
WLT
WIR
WHT
WHI
WHH
WHC
WGH
WEX
WES
WDH
WDG
WAW
WAT
VIC
UHW
UHC
UCL
TUN
TOR
TGA
SUN
STR
STM
STH
STD
SPH
SPD
SMV
SMH
SLF
SJH
SHH
SHC
SGH
SEH
SCU
SCM
SCA
SAN
SAL
RVN
RUS
RSU
RSS
RSH
RSC
RPH
ROT
RLU
RLI
RHC
RGH
RFH
RDE
RCH
RBE
RAD
QMC
QKL
QHR
QEQ
QEL
QEG
QEB
QAP
PRS
POW
PMS
PLY
PIN
PIL
PGH
PET
PCH
PAP
PAH
OHM
NUN
NTH
NTG
NSH
NPH
NOT
NOR
NMH
NMG
NHH
NGS
NEV
NDD
NCR
MST
MRI
MPH
MOR
MKH
MIW
MDW
MAY
MAR
MAC
LON
LIS
LIN
LHC
LEW
LER
LEI
LEG
LDH
KTH
KNG
KMH
KGH
KCH
JPH
IPS
HUL
HUD
HOM
HIN
HIL
HHX
HCH
HAR
GWY
GWE
GLO
GLG
GHS
GGH
GEO
FRR
FRM
FRE
FGH
FAZ
ESU
EBH
EAL
DVH
DRY
DID
DER
DDH
DAR
CTY
CON
COL
COC
CMI
CLW
CKH
CHX
CHR
CHE
CGH
CAS
BTH
BRT
BRO
BRI
BRG
BRD
BOL
BNT
BMP
BLA
BFH
BED
BAT
BAS
BAR
AIR
AEI
ADD
<2 hours 2-6 hours 6-18 hours 18-24 hours

62 | NELA REPORT 2016
13 CONSULTANT-DELIVERED PERIOPERATIVE CARE
Why is this important?Consultant delivered care for any high-risk surgical procedure is a cornerstone of high-quality practice; hence, the management of patients requiring emergency bowel surgery should be directed by consultant surgeons and consultant anaesthetists throughout the perioperative period. These principles are reflected in the standards of care against which we audit, and are in keeping with the level of service provided to high-risk patients undergoing planned (elective) surgery.
Preoperative careConsultant expertise is required for the complex and individualised management of patients before surgery, including attention to patient and carer wishes alongside the risks and benefits of different treatment options. In some cases, this may lead to a decision that an operation is inappropriate or likely to be futile. It is therefore important that consultant surgeons and consultant anaesthetists have the opportunity to review patients before surgery.
Intraoperative careThe management of patients during emergency bowel surgery can be challenging and experience is required for the complex decision making required to identify and deliver the next steps in care. Patients can deteriorate very quickly during surgery and these time-pressured situations require consultant presence.
KEY STANDARDS Preoperative care Each higher risk case (predicted mortality ≥5%) should have the active input of consultant surgeon and consultant anaesthetist. RCS HR
Intraoperative care A consultant surgeon (CCT holder) and consultant anaesthetist are present for all cases with predicted mortality ≥10% and for cases with predicted mortality >5% except in specific circumstances where adequate experience and manpower is otherwise assured. RCS USC
Each higher risk case (predicted mortality ≥5%) should have the active input of consultant surgeon and consultant anaesthetist. Surgical procedures with a predicted mortality of ≥10% should be conducted under the direct supervision of a consultant surgeon and a consultant anaesthetist unless the responsible consultants have actively satisfied themselves that junior staff have adequate experience and manpower and are adequately free of competing responsibilities. RCS HR
NELA REPORT 2016 | 63
AUDIT QUESTIONS Preoperative care What proportion of patients was reviewed before surgery by a consultant surgeon (in person when making the decision to operate) and a consultant anaesthetist? (Target ≥ 80%)
Intraoperative care What proportion of patients had a consultant surgeon and a consultant anaesthetist directly supervising care during surgery? (Target ≥ 80%)
What variation in these process-measures existed, by:
1 Hospital? 2 Patient characteristics, including documented risk of death? 3 Day and time of surgery?
KEY FINDINGS Preoperative care All patients Overall, 56% of patients were reviewed in person by both a consultant surgeon and a consultant anaesthetist before emergency laparotomy (Table 17).
60% of patients were reviewed in person by both a consultant surgeon and a consultant anaesthetist if an assessment of risk had been documented before surgery; if risk was not documented, only 49% were reviewed by both consultants (Table 17).
Overall, the decision to operate was made in person by a consultant surgeon for 72% of patients, and 74% of patients were reviewed by a consultant anaesthetist before surgery (Table 17).
High and highest risk patients (preoperative P-POSSUM risk of death ≥5%) 57% of high and highest risk patients were reviewed in person by both a consultant surgeon and consultant anaesthetist before surgery (Table 18). 26 hospitals (14%) were rated Green, whereas 62 hospitals (33%) were rated Red (Figure 21).
The decision to operate was made in person by a consultant surgeon for 71% of high and highest risk patients, and 77% of high and highest risk patients were reviewed by a consultant anaesthetist before surgery (Table 18).
Intraoperative care All patients Overall, care during surgery was directly supervised by both a consultant surgeon and a consultant anaesthetist for 70% of patients (Table 19).
Overall, consultant surgeons directly supervised 87% of operations and consultant anaesthetists directly supervised care during surgery for 78% of patients (Table 19).
Both consultants were present for 73% of operations during the week and 63% at the weekend. Within this there was variation by the time of day and between specialities (Table 21).
High and highest risk patients (preoperative P-POSSUM risk of death ≥5%) Care during surgery was directly supervised by both a consultant surgeon and a consultant anaesthetist for 74% of high and highest risk patients (Table 20). 83 hospitals (45%) were rated Green, whereas 14 hospitals (8%) were rated Red (Figure 22).
Consultant surgeons directly supervised 89% of operations for high and highest risk patients (Table 20).
Consultant anaesthetists directly supervised the intraoperative care of 82% of high and highest risk patients (Table 20).
Both consultants were present for 76% of operations during the week and 68% at weekends. Again there was variation by the time of day and between specialities (Table 22).

64 | NELA REPORT 2016
Clinical commentaryThe proportion of patients that underwent surgery under the direct supervision of a consultant surgeon and consultant anaesthetist increased from 65% in Year 1 to 70% in Year 2. Greater consultant presence was associated with a higher preoperative predicted risk of death, with fewer than 3% of the highest risk patients (>10% risk) undergoing surgery with no consultant present (Table 19 and Table 20). This increase in consultant presence was seen at all times of the day, with the greatest increase being ‘out of hours’ (including after midnight, and weekends). The greatest ‘out of hours’ increase was seen for consultant anaesthetists whose presence increased from 50% to 60%.
This increase in consultant delivered care is welcomed, and suggests a greater awareness of the high-risk nature of emergency bowel surgery. This improvement in consultant delivered care may be linked to the improvement in the proportion of patients who underwent a formal documented risk assessment. As found in both the Year 1 and the present Year 2 Audit Reports, for equivalent categories of risk and mortality, consultant input was better where an assessment of risk had been documented preoperatively (Table 17 and Table 19).
The Audit found that, regardless of the day of surgery, the highest-risk patients undergo surgery between midnight and 8am (Table 13): this is in keeping with previous recommendations that only life- or limb-saving surgery should occur at this time.22
There was little variation in the proportion of high and highest risk patients (P-POSSUM risk of death ≥5%) undergoing surgery under the direct supervision of a consultant surgeon according to day of surgery; however fewer high and highest risk patients had surgery under the direct supervision of a consultant anaesthetist at the weekend (75%) compared to weekdays (84%) (Table 22). Patients undergoing surgery which started between midnight and 8am were more likely to have consultant delivered care at the weekends than on weekdays (Table 21 and Table 22). This finding requires further examination – for example, to explore the possibility that the need to undertake elective duties (on weekdays) after a night on-call may influence whether a consultant attends overnight emergency surgery.
Evidence from Acute Medicine suggests that work patterns, rather than just numbers of on-call consultants, influence patient outcomes: reduced mortality rates have been observed at hospitals where on-call consultants were free from fixed-commitments, were on-call for blocks of at least two consecutive days or where at least two consultant ward rounds occurred every day.23
The higher levels of consultant input during daytime hours are likely to be in part a reflection of the availability of dedicated emergency theatres staffed by consultants with job-planned sessions.
It is likely that a multitude of factors are responsible for the varying degrees of consultant input found across hospitals, by the day of the week and by time of the day. Each hospital will need to determine its own reasons for any shortfall in provision. This may include exploring the impact of elective commitments on the ability of consultants to provide direct input into the care of emergency patients.
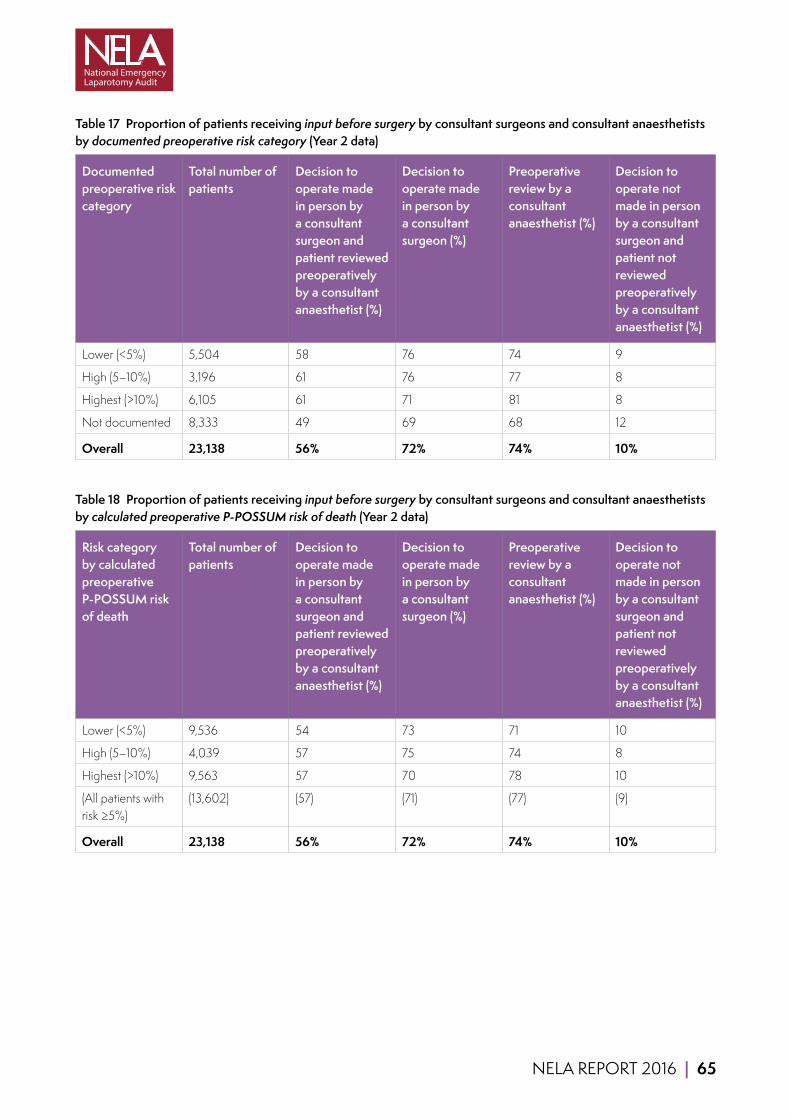
NELA REPORT 2016 | 65
Table 17 Proportion of patients receiving input before surgery by consultant surgeons and consultant anaesthetists by documented preoperative risk category (Year 2 data)
Documented preoperative risk category
Total number of patients
Decision to operate made in person by a consultant surgeon and patient reviewed preoperatively by a consultant anaesthetist (%)
Decision to operate made in person by a consultant surgeon (%)
Preoperative review by a consultant anaesthetist (%)
Decision to operate not made in person by a consultant surgeon and patient not reviewed preoperatively by a consultant anaesthetist (%)
Lower (<5%) 5,504 58 76 74 9
High (5–10%) 3,196 61 76 77 8
Highest (>10%) 6,105 61 71 81 8
Not documented 8,333 49 69 68 12
Overall 23,138 56% 72% 74% 10%
Table 18 Proportion of patients receiving input before surgery by consultant surgeons and consultant anaesthetists by calculated preoperative P-POSSUM risk of death (Year 2 data)
Risk category by calculated preoperative P-POSSUM risk of death
Total number of patients
Decision to operate made in person by a consultant surgeon and patient reviewed preoperatively by a consultant anaesthetist (%)
Decision to operate made in person by a consultant surgeon (%)
Preoperative review by a consultant anaesthetist (%)
Decision to operate not made in person by a consultant surgeon and patient not reviewed preoperatively by a consultant anaesthetist (%)
Lower (<5%) 9,536 54 73 71 10
High (5–10%) 4,039 57 75 74 8
Highest (>10%) 9,563 57 70 78 10
(All patients with risk ≥5%)
(13,602) (57) (71) (77) (9)
Overall 23,138 56% 72% 74% 10%

66 | NELA REPORT 2016
Table 19 Proportion of patients whose care during surgery was directly supervised by consultant surgeons and consultant anaesthetists by documented preoperative risk category (Year 2 data)
Documented preoperative risk category
Total number of patients
Both consultants present in theatre (%)
Consultant surgeon present (%)
Consultant anaesthetist present (%)
Neither consultant present in theatre (%)
Lower (<5%) 5,504 66 84 75 6
High (5–10%) 3,196 71 87 80 4
Highest (>10%) 6,105 78 90 85 3
Not documented 8,333 66 86 74 6
Overall 23,138 70% 87% 78% 5%
Table 20 Proportion of patients whose care during surgery was directly supervised by consultant surgeons and consultant anaesthetists by calculated preoperative P-POSSUM risk of death (Year 2 data)
Risk category by calculated preoperative P-POSSUM risk of death
Total number of patients
Both consultants present in theatre (%)
Consultant surgeon present (%)
Consultant anaesthetist present (%)
Neither consultant present in theatre (%)
Lower (<5%) 9,536 64 84 73 7
High (5–10%) 4,039 70 87 78 5
Highest (>10%) 9,563 76 89 83 3
(All patients with risk ≥ 5%)
(13,602) (74) (89) (82) (4)
Overall 23,138 70% 87% 78% 5%
Table 21 Proportion of all patients whose care during surgery was directly supervised by consultant surgeons and consultant anaesthetists by time of day and day of week of arrival in operating theatre (Year 2 data)
Time of arrival in operating theatre
Monday–Friday (%) Saturday–Sunday (%)
Both consultants
Consultant surgeon
Consultant anaesthetist
Both consultants
Consultant surgeon
Consultant anaesthetist
0800–1159 78 88 89 66 90 72
1200–1759 79 90 87 66 89 72
1800–2359 64 84 73 60 85 66
0000–0759 49 73 59 50 77 60
Overall 73% 87% 82% 63% 87% 69%
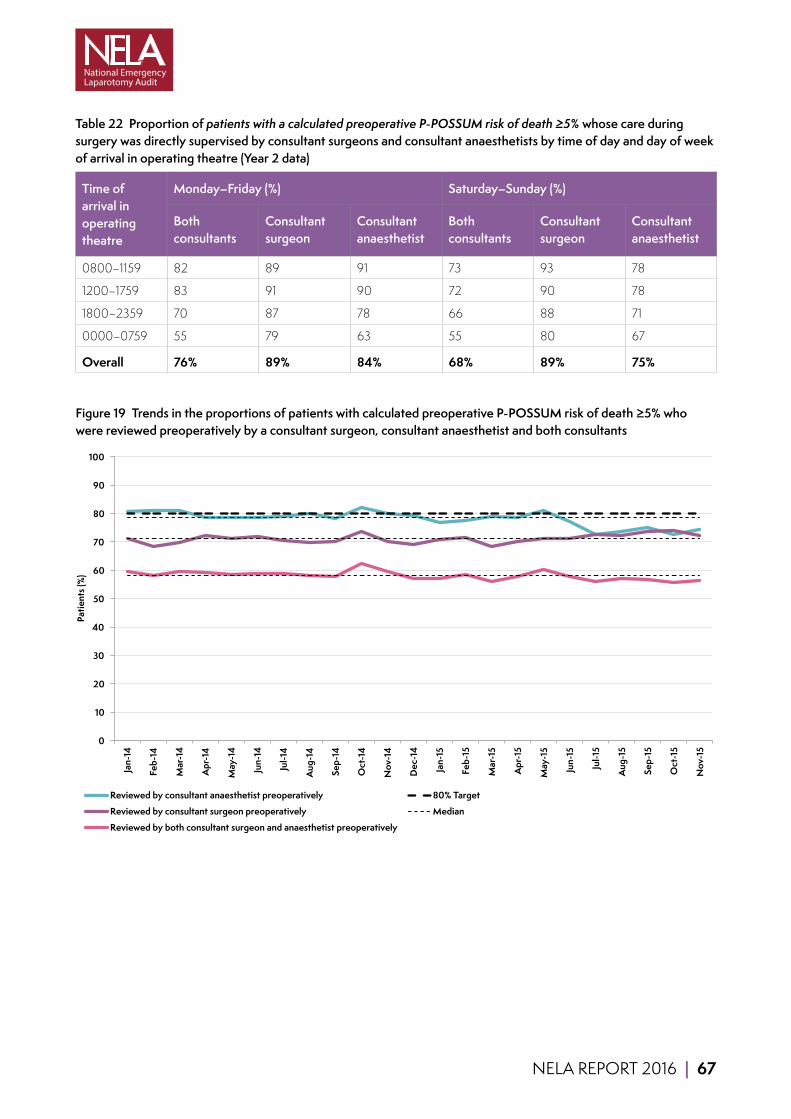
NELA REPORT 2016 | 67
Table 22 Proportion of patients with a calculated preoperative P-POSSUM risk of death ≥5% whose care during surgery was directly supervised by consultant surgeons and consultant anaesthetists by time of day and day of week of arrival in operating theatre (Year 2 data)
Time of arrival in operating theatre
Monday–Friday (%) Saturday–Sunday (%)
Both consultants
Consultant surgeon
Consultant anaesthetist
Both consultants
Consultant surgeon
Consultant anaesthetist
0800–1159 82 89 91 73 93 78
1200–1759 83 91 90 72 90 78
1800–2359 70 87 78 66 88 71
0000–0759 55 79 63 55 80 67
Overall 76% 89% 84% 68% 89% 75%
Figure 19 Trends in the proportions of patients with calculated preoperative P-POSSUM risk of death ≥5% who were reviewed preoperatively by a consultant surgeon, consultant anaesthetist and both consultants
0
10
20
30
40
50
60
70
80
90
100
Jan-
14
Feb-
14
Mar
-14
Apr
-14
May
-14
Jun-
14
Jul-1
4
Aug
-14
Sep-
14
Oct
-14
Nov
-14
Dec
-14
Jan-
15
Feb-
15
Mar
-15
Apr
-15
May
-15
Jun-
15
Jul-1
5
Aug
-15
Sep-
15
Oct
-15
Nov
-15
Patie
nts (
%)
Reviewed by consultant anaesthetist preoperatively 80% Target
Reviewed by consultant surgeon preoperatively Median
Reviewed by both consultant surgeon and anaesthetist preoperatively
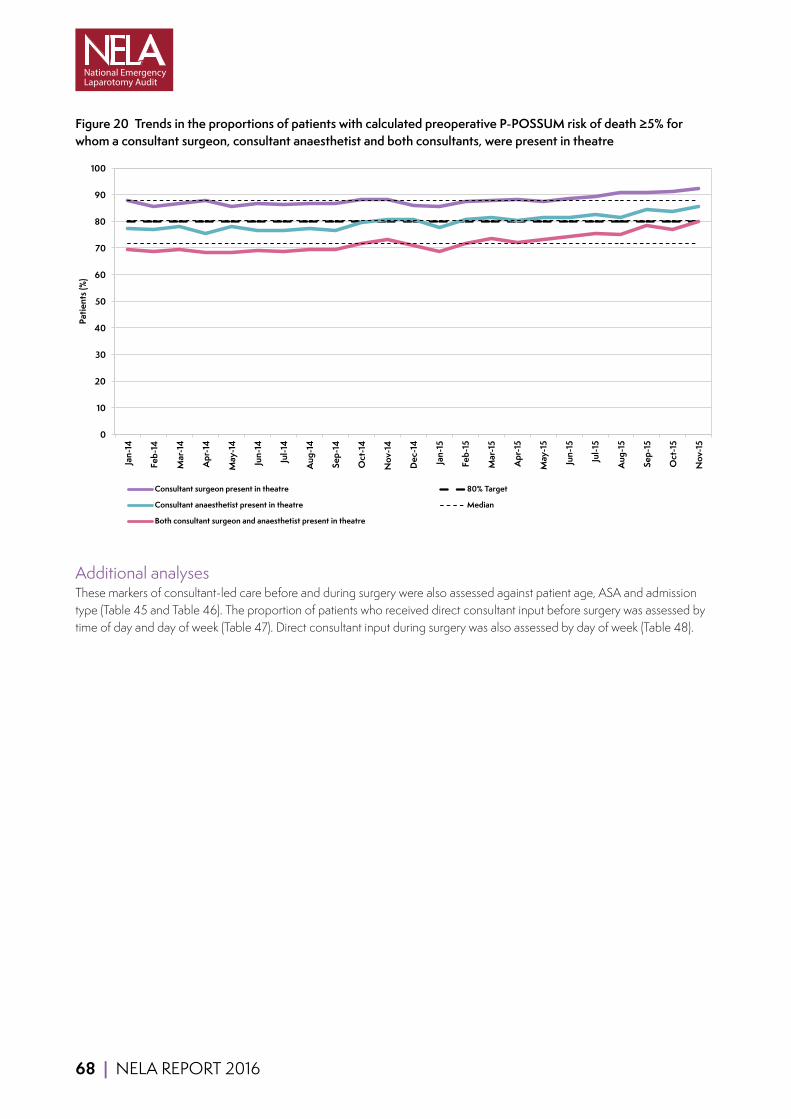
68 | NELA REPORT 2016
Figure 20 Trends in the proportions of patients with calculated preoperative P-POSSUM risk of death ≥5% for whom a consultant surgeon, consultant anaesthetist and both consultants, were present in theatre
0
10
20
30
40
50
60
70
80
90
100
Jan-
14
Feb-
14
Mar
-14
Apr
-14
May
-14
Jun-
14
Jul-1
4
Aug
-14
Sep-
14
Oct
-14
Nov
-14
Dec
-14
Jan-
15
Feb-
15
Mar
-15
Apr
-15
May
-15
Jun-
15
Jul-1
5
Aug
-15
Sep-
15
Oct
-15
Nov
-15
Patie
nts (
%)
Consultant surgeon present in theatre 80% Target
Consultant anaesthetist present in theatre Median
Both consultant surgeon and anaesthetist present in theatre
Additional analysesThese markers of consultant-led care before and during surgery were also assessed against patient age, ASA and admission type (Table 45 and Table 46). The proportion of patients who received direct consultant input before surgery was assessed by time of day and day of week (Table 47). Direct consultant input during surgery was also assessed by day of week (Table 48).
NELA REPORT 2016 | 69
QUALITY IMPROVEMENT VIGNETTE Improving consultant presence requires strong leadership and communication from within the surgical team. Medway Maritime hospital achieved 84% consultant presence in theatres:
‘[Our] lead surgeon for NELA is willing to lead by example and strongly believes in the project. Identify who are the other surgeons that will be early adopters.’
They used data intelligently and in detail:
‘[We] review the individual cases that died in the previous 12 months. Identify common trends; look in particular for unnecessary delays. Take time to present this data back to the operating surgeons. Dwell upon the old idea that consultant-led surgery during the day, improves outcomes when compared to inexperienced registrars at night. If this is then extended to the consultant operating at night when patients have suffered less of a physiological insult, the outcomes will improve.’
Changing working patterns may also increase consultant presence in emergency care including emergency laparotomy, as demonstrated by Royal Preston hospital (91% consultant presence in theatres):
‘We brought in our SOTW [surgeon of the week]/Duty system in September 2013….since then there has been one SOTW and two duty surgeons during the week and two surgeons at the weekend... having more consultants involved in acute care has probably facilitated increased consultant presence, even for more ‘simple’ cases. It also allows discussion of complex/sub-specialist cases which is of great benefit. Use of ‘fallow’ elective theatres that become available….mean that more laparotomies are done in daytime hours and with a surgical consultant presence.’
RECOMMENDATIONS Local protocols should be developed which ensure a consultant-delivered service for emergency laparotomy patients. Rotas, job plans and staffing levels for surgeons and anaesthetists should allow a consultant-delivered service 24 hours per day, seven days per week (Medical and Clinical Directors).
Consideration should be given to increasing the number of consultants available for emergency surgical work as required to facilitate a consultant-delivered anaesthetic service 24 hours per day, seven days per week. This may be of particular relevance to hospitals in which on-call anaesthetists also cover other emergency services such as trauma, maternity or critical care (Medical and Clinical Directors).
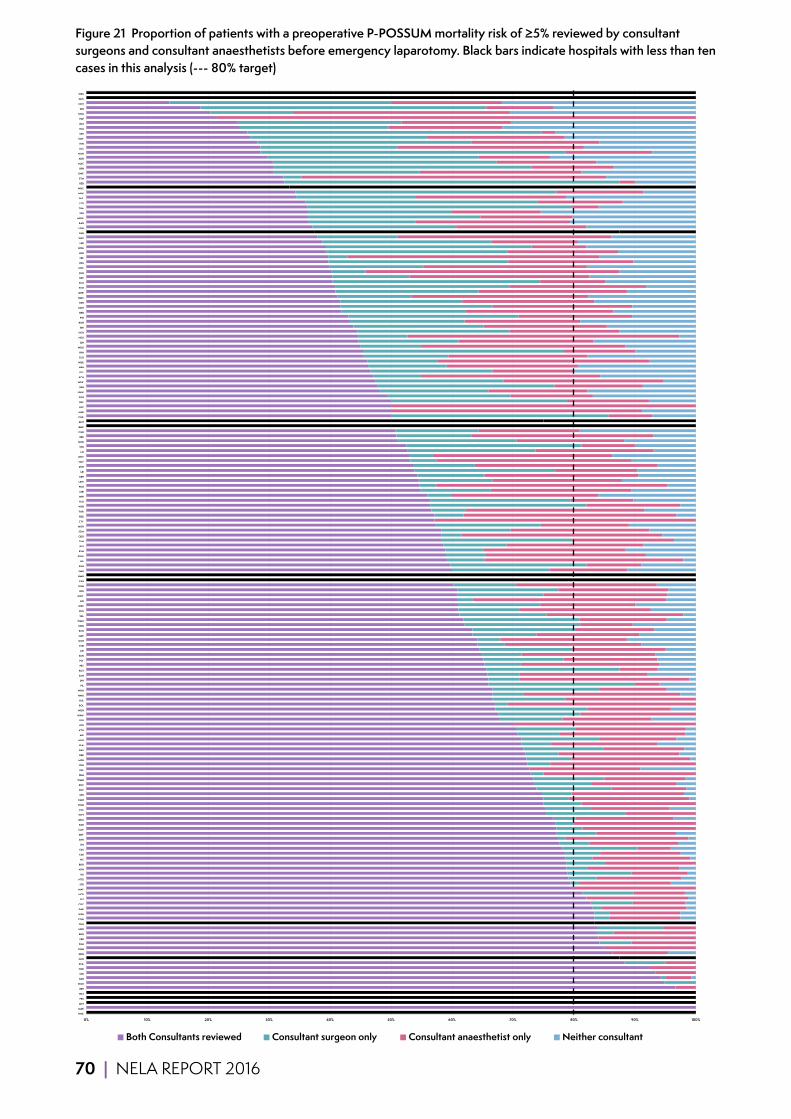
70 | NELA REPORT 2016
Figure 21 Proportion of patients with a preoperative P-POSSUM mortality risk of ≥5% reviewed by consultant surgeons and consultant anaesthetists before emergency laparotomy. Black bars indicate hospitals with less than ten cases in this analysis (--- 80% target)
0% 10% 20% 30% 40% 50% 60% 70% 80% 90% 100%
HHX
MAR
MST
PRS
WLT
BRT
WGH
NSH
STD
CHR
SCA
GEO
DDH
OHM
FGH
FRR
BRG
NDD
CKH
CON
WSH
DAR
COC
SLF
NCR
MAY
STR
NTG
RLI
NTH
BRO
VIC
CMI
ESU
IPS
SHH
DRY
CLW
BAR
QEQ
WYT
COL
HOM
KMH
SPH
SHC
RHC
WMH
FRM
EAL
YDH
MPH
DER
BAS
BLA
HUD
AIR
KTH
BTH
QEB
WAW
WDH
BOL
HUL
NMG
WHH
PIL
JPH
SAN
ROT
PET
PLY
SUN
AEI
CHE
GGH
QAP
RCH
NHH
WMU
SAL
RUS
WRC
LIN
GWY
WIR
KGH
CAS
NMH
SMH
PGH
HIL
POW
RVN
RSS
TUN
QEG
SCM
MOR
CTY
RDE
TOR
WYB
YEO
WHI
MRI
PMS
LEW
EBH
LEI
DVH
NEV
WHT
LIS
STH
NOR
RBE
CGH
BMP
BNT
CHX
HAR
LHC
QKL
SGH
UHW
BFH
WRX
KCH
QEL
NPH
WEX
GLO
RPH
WDG
SJH
NGS
HCH
BRI
RGH
PIN
BRD
MKH
RSH
QMC
QHR
PCH
SCU
RSC
GLG
UHC
RSU
FRE
LDH
WRG
LER
WAT
PAH
LON
RAD
MDW
SPD
TGA
LEG
FAZ
MIW
WHC
BED
STM
GWE
RFH
MAC
ADD
NUN
UCL
HIN
SMV
SEH
RLU
BAT
PAP
KNG
DID
NOT
GHS
WES
Both Consultants reviewed Consultant surgeon only Consultant anaesthetist only Neither consultant 0% 10% 20% 30% 40% 50% 60% 70% 80% 90% 100%
HHX
MAR
MST
PRS
WLT
BRT
WGH
NSH
STD
CHR
SCA
GEO
DDH
OHM
FGH
FRR
BRG
NDD
CKH
CON
WSH
DAR
COC
SLF
NCR
MAY
STR
NTG
RLI
NTH
BRO
VIC
CMI
ESU
IPS
SHH
DRY
CLW
BAR
QEQ
WYT
COL
HOM
KMH
SPH
SHC
RHC
WMH
FRM
EAL
YDH
MPH
DER
BAS
BLA
HUD
AIR
KTH
BTH
QEB
WAW
WDH
BOL
HUL
NMG
WHH
PIL
JPH
SAN
ROT
PET
PLY
SUN
AEI
CHE
GGH
QAP
RCH
NHH
WMU
SAL
RUS
WRC
LIN
GWY
WIR
KGH
CAS
NMH
SMH
PGH
HIL
POW
RVN
RSS
TUN
QEG
SCM
MOR
CTY
RDE
TOR
WYB
YEO
WHI
MRI
PMS
LEW
EBH
LEI
DVH
NEV
WHT
LIS
STH
NOR
RBE
CGH
BMP
BNT
CHX
HAR
LHC
QKL
SGH
UHW
BFH
WRX
KCH
QEL
NPH
WEX
GLO
RPH
WDG
SJH
NGS
HCH
BRI
RGH
PIN
BRD
MKH
RSH
QMC
QHR
PCH
SCU
RSC
GLG
UHC
RSU
FRE
LDH
WRG
LER
WAT
PAH
LON
RAD
MDW
SPD
TGA
LEG
FAZ
MIW
WHC
BED
STM
GWE
RFH
MAC
ADD
NUN
UCL
HIN
SMV
SEH
RLU
BAT
PAP
KNG
DID
NOT
GHS
WES
Both Consultants reviewed Consultant surgeon only Consultant anaesthetist only Neither consultant

NELA REPORT 2016 | 71
Figure 22 Proportion of patients with a preoperative P-POSSUM mortality risk of ≥5% for whom surgery was directly supervised by consultant surgeons and consultant anaesthetists. Black bars indicate hospitals with less than ten cases in this analysis (--- 80% target)
0% 10% 20% 30% 40% 50% 60% 70% 80% 90% 100%
BMP
BNT
CAS
EAL
GHS
HHX
MAR
MST
NEV
WLT
SHH
RHC
WHH
VIC
NCR
CMI
STD
NTH
NSH
WSH
WGH
DAR
KTH
NDD
MPH
KMH
BRT
SUN
RBE
CLW
YDH
CHR
IPS
FRR
STR
WIR
SLF
HOM
DRY
CON
FRM
MRI
SPH
RUS
SHC
JPH
BOL
BLA
OHM
LIN
ESU
WAT
WMH
LEI
RDE
BRG
NOT
AIR
RCH
COL
LEW
NMG
QKL
RLI
QEG
CKH
SCA
BRO
QEQ
EBH
HUD
BED
HAR
RVN
PIL
GLG
MAC
UCL
PMS
QMC
WEX
WYT
QAP
WRC
CHE
WRX
LDH
CTY
NUN
PAP
SCM
BFH
GWY
DVH
TOR
DDH
RSU
SMH
GEO
WHT
BTH
DID
BRD
WAW
MKH
SMV
WHI
LIS
SGH
MAY
STH
CGH
QEL
COC
ROT
DER
PET
NHH
POW
LER
AEI
FRE
KGH
RAD
WDG
WYB
YEO
RPH
BAR
GGH
RSS
SEH
KCH
WDH
LEG
PIN
PLY
PCH
HIN
NTG
PAH
BAS
SAL
NGS
CHX
GLO
UHW
NMH
RSH
RFH
HIL
STM
HCH
TUN
SAN
MOR
QHR
LON
RGH
PGH
FGH
UHC
BAT
NPH
SJH
MDW
TGA
WRG
GWE
FAZ
HUL
WHC
KNG
SCU
QEB
RSC
NOR
WMU
SPD
RLU
ADD
LHC
BRI
MIW
PRS
WES
Both consultants present Consultant surgeon only Consultant anaesthetist only Neither consultant 0% 10% 20% 30% 40% 50% 60% 70% 80% 90% 100%
BMP
BNT
CAS
EAL
GHS
HHX
MAR
MST
NEV
WLT
SHH
RHC
WHH
VIC
NCR
CMI
STD
NTH
NSH
WSH
WGH
DAR
KTH
NDD
MPH
KMH
BRT
SUN
RBE
CLW
YDH
CHR
IPS
FRR
STR
WIR
SLF
HOM
DRY
CON
FRM
MRI
SPH
RUS
SHC
JPH
BOL
BLA
OHM
LIN
ESU
WAT
WMH
LEI
RDE
BRG
NOT
AIR
RCH
COL
LEW
NMG
QKL
RLI
QEG
CKH
SCA
BRO
QEQ
EBH
HUD
BED
HAR
RVN
PIL
GLG
MAC
UCL
PMS
QMC
WEX
WYT
QAP
WRC
CHE
WRX
LDH
CTY
NUN
PAP
SCM
BFH
GWY
DVH
TOR
DDH
RSU
SMH
GEO
WHT
BTH
DID
BRD
WAW
MKH
SMV
WHI
LIS
SGH
MAY
STH
CGH
QEL
COC
ROT
DER
PET
NHH
POW
LER
AEI
FRE
KGH
RAD
WDG
WYB
YEO
RPH
BAR
GGH
RSS
SEH
KCH
WDH
LEG
PIN
PLY
PCH
HIN
NTG
PAH
BAS
SAL
NGS
CHX
GLO
UHW
NMH
RSH
RFH
HIL
STM
HCH
TUN
SAN
MOR
QHR
LON
RGH
PGH
FGH
UHC
BAT
NPH
SJH
MDW
TGA
WRG
GWE
FAZ
HUL
WHC
KNG
SCU
QEB
RSC
NOR
WMU
SPD
RLU
ADD
LHC
BRI
MIW
PRS
WES
Both consultants present Consultant surgeon only Consultant anaesthetist only Neither consultant
72 | NELA REPORT 2016
14 GOAL DIRECTED FLUID THERAPY
Why is this important?Goal directed fluid therapy (GDFT) describes a variety of techniques for administering intravenous fluids during surgery based on the individual needs of each patient defined by measured physiological goals. Reported benefits include fewer complications after surgery and reduced length of hospital stay, but these data are mainly derived from studies of patients undergoing elective surgery.24 The evidence base for GDFT in patients undergoing emergency laparotomy is very limited and because of this we report use of GDFT but have not made firm recommendations over its use.
KEY STANDARDS Due to limited evidence base, it is not appropriate to compare practice against any standards.
AUDIT QUESTIONS What proportion of patients received goal directed fluid therapy during surgery?
Which methods of goal directed fluid therapy were used?
What variation existed in the proportion of patients who received goal directed fluid therapy during surgery, by:
1 Hospital? 2 Patient characteristics, including documented risk of death?
KEY FINDINGS Goal directed fluid therapy was used in the care of 54% of patients during surgery.
A cardiac output monitor was used in the intraoperative management of 39% of patients, whereas alternative methods were used for the remaining 15%.
Goal directed fluid therapy was more commonly used in the care of higher risk patients (Table 49 and Table 50):
■ 57% of patients aged over 80 years. ■ 68% of patients documented preoperatively to be highest risk. ■ 64% of those requiring immediate surgery.
Clinical commentaryThe overall use of goal directed fluid therapy (GDFT) has remained similar to last year at 54%; however use has increased in higher risk patients (Table 49 and Table 50). As the evidence base has not altered, and clinical equipoise appears to exist, we have not produced hospital level ratings for the use of GDFT.

NELA REPORT 2016 | 73
Figure 23 Trend in the overall proportion of patients receiving intraoperative goal directed fluid therapy (due to clinical equipoise no target is specified)
0
10
20
30
40
50
60
70
80
90
100
Jan-
14
Feb-
14
Mar
-14
Apr
-14
May
-14
Jun-
14
Jul-1
4
Aug
-14
Sep-
14
Oct
-14
Nov
-14
Dec
-14
Jan-
15
Feb-
15
Mar
-15
Apr
-15
May
-15
Jun-
15
Jul-1
5
Aug
-15
Sep-
15
Oct
-15
Nov
-15
Patie
nts (
%)
GDFT in theatre Median
Additional analysesGoal directed fluid therapy was also assessed against patient age, ASA, admission type and operative urgency (Table 49 and Table 50).
RECOMMENDATIONS Until the evidence base is better defined, it is difficult to make firm recommendations about the use of GDFT in emergency laparotomy. Further analysis of the ONS outcome data may provide useful information on the role of GDFT in this group of patients.
74 | NELA REPORT 2016
15 DIRECT POSTOPERATIVE ADMISSION TO CRITICAL CARE
Why is this important?The definition of critical care used in this Audit encompasses both Level 2 and Level 3 care (high dependency and intensive care units).25 These are designated wards that can provide patients with advanced treatments to support life and/or the function of bodily organs. These treatments are frequently required by patients having emergency bowel surgery, and cannot be provided on general wards. Some patients are admitted to critical care units because they need these treatments immediately. Others are at high risk of deteriorating to a point where they may require such treatment, and should therefore be admitted for close observation and to avoid delay if treatment is subsequently required.
There is evidence that more patients die if they are initially cared for on a general ward and then subsequently require treatment on a critical care unit, than if they are transferred directly to a critical care unit.4,7,26 Therefore, standards state that clinicians should, at the time of surgery, assess risk for all patients in order to identify individuals who need to be cared for on a critical care unit, and ensure that those in need of this are transferred there directly after surgery. The first year of the Patient Audit found that some hospitals admitted all of their emergency laparotomy patients to critical care following surgery.
The Audit has shown across a variety of measures that half of patients who had an emergency laparotomy were at greater than 10% risk of death within 30 days of surgery (Table 3, Table 11, Table 25, Figure 9, Figure 29, Figure 30, and Figure 31). Standards state that these patients should be admitted to a critical care unit. An even greater number were classified as high risk (≥5% risk of death), for whom critical care admission after surgery should be considered.
KEY STANDARDS Patients with a predicted mortality ≥5% should be managed as ‘high risk’. RCS HR
All high risk patients should be considered for critical care and as a minimum, patients with an estimated risk of death of ≥10% should be admitted to a critical care location. RCS HR
Intensive care requirements are considered for all patients needing emergency surgery. There is close liaison and communication between the surgical, anaesthetic and intensive care teams perioperatively with the common goal of ensuring optimal safe care in the best interests of the patient. RCS USC
The outcome of high-risk General Surgical patients could be improved by the adequate and effective use of critical care in addition to a better preoperative risk stratification protocol. ASGBI PS
NELA REPORT 2016 | 75
AUDIT QUESTIONS What proportions of high and highest risk patients were admitted directly to a high dependency or intensive care unit following surgery? (Target ≥ 80% for highest risk patients)
What was the length of stay in critical care?
What variation existed in the proportion of patients admitted directly to a high dependency or intensive care unit following surgery, by:
1 Hospital? 2 Assessed risk of death? 3 Day and time of surgery?
KEY FINDINGS All patients The median length of stay in critical care for those admitted directly from theatres was three days (IQR 2–6 days).
The proportion of patients admitted directly to critical care varied according to the category of risk documented before surgery. A greater proportion of high and highest risk patients were admitted compared to lower risk, and those in whom risk had not been documented (Table 23).
75% of patients undergoing surgery which started between midnight and 8am were admitted to critical care, compared to 60% of patients whose operations started between 8am and midnight (Table 24).
Patients with a P-POSSUM risk of death ≥5% Overall, 78% of patients with a risk of death ≥5% were admitted directly to a critical care bed after surgery (Table 25).
High risk (P-POSSUM risk of death 5–10%) patients as identified at the end of surgery 18% of patients were identified as being high risk. 62% of these were admitted directly to a critical care bed after surgery (Table 25).
Highest risk (P-POSSUM risk of death >10%) patients as identified at the end of surgery 41% of patients were identified as being at highest risk. 85% of these were admitted directly to a critical care bed after surgery (Table 25). 138 hospitals (75%) were rated Green, whereas two hospitals (1%) were rated Red (Figure 26).
Clinical commentaryThe overall rate of direct postoperative admission to critical care is similar to Year 1 (61% in Year 2, 60% in Year 1). The proportion of patients admitted to critical care after surgery in all three risk groups has risen: from 33% to 36% in the lower risk group, 58% to 62% in the high risk group, and 83% to 85% in the highest risk group (risk categorisation based on end of surgery P-POSSUM mortality risk estimate). 78% of patients with a predicted mortality ≥5% (i.e. high and highest risk) were admitted to critical care after surgery. Three-quarters of hospitals were able to admit at least 80% of their highest risk patients to critical care postoperatively. Patients for whom the decision to palliate had been made at the end of surgery (471 patients) and those who died in theatre (69 patients) have been excluded from these calculations.
A higher proportion of patients whose surgery was started between midnight and 8am were admitted to critical care regardless of the day of the week, in keeping with their higher level of predicted risk (Table 26). Critical care admission after surgery was broadly similar across the days of the week (Table 27).
It is encouraging that there has been some improvement in these figures. Nevertheless, we encourage hospitals to examine their own data to check local compliance, and if applicable, to understand the reasons why some of the highest risk patients may not be admitted to critical care after surgery. This is particularly important in the 25% of hospitals that did not achieve 80% compliance with this measure for highest risk patients.
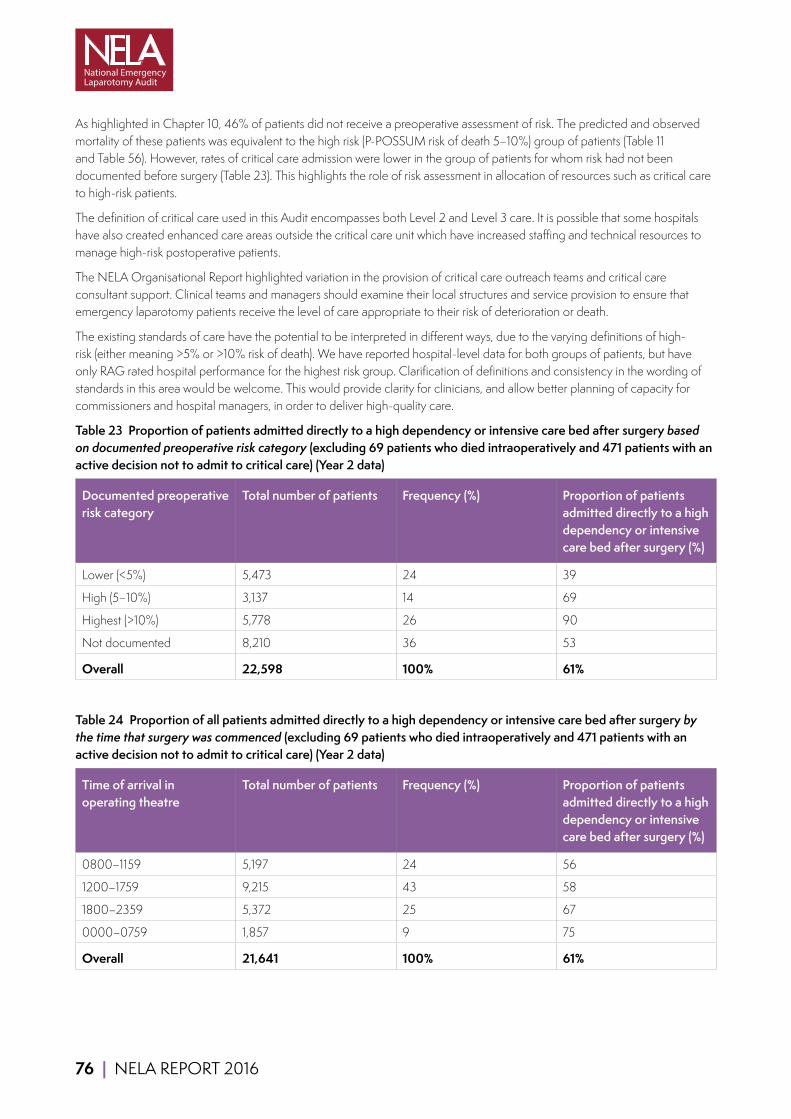
76 | NELA REPORT 2016
As highlighted in Chapter 10, 46% of patients did not receive a preoperative assessment of risk. The predicted and observed mortality of these patients was equivalent to the high risk (P-POSSUM risk of death 5–10%) group of patients (Table 11 and Table 56). However, rates of critical care admission were lower in the group of patients for whom risk had not been documented before surgery (Table 23). This highlights the role of risk assessment in allocation of resources such as critical care to high-risk patients.
The definition of critical care used in this Audit encompasses both Level 2 and Level 3 care. It is possible that some hospitals have also created enhanced care areas outside the critical care unit which have increased staffing and technical resources to manage high-risk postoperative patients.
The NELA Organisational Report highlighted variation in the provision of critical care outreach teams and critical care consultant support. Clinical teams and managers should examine their local structures and service provision to ensure that emergency laparotomy patients receive the level of care appropriate to their risk of deterioration or death.
The existing standards of care have the potential to be interpreted in different ways, due to the varying definitions of high-risk (either meaning >5% or >10% risk of death). We have reported hospital-level data for both groups of patients, but have only RAG rated hospital performance for the highest risk group. Clarification of definitions and consistency in the wording of standards in this area would be welcome. This would provide clarity for clinicians, and allow better planning of capacity for commissioners and hospital managers, in order to deliver high-quality care.
Table 23 Proportion of patients admitted directly to a high dependency or intensive care bed after surgery based on documented preoperative risk category (excluding 69 patients who died intraoperatively and 471 patients with an active decision not to admit to critical care) (Year 2 data)
Documented preoperative risk category
Total number of patients Frequency (%) Proportion of patients admitted directly to a high dependency or intensive care bed after surgery (%)
Lower (<5%) 5,473 24 39
High (5–10%) 3,137 14 69
Highest (>10%) 5,778 26 90
Not documented 8,210 36 53
Overall 22,598 100% 61%
Table 24 Proportion of all patients admitted directly to a high dependency or intensive care bed after surgery by the time that surgery was commenced (excluding 69 patients who died intraoperatively and 471 patients with an active decision not to admit to critical care) (Year 2 data)
Time of arrival in operating theatre
Total number of patients Frequency (%) Proportion of patients admitted directly to a high dependency or intensive care bed after surgery (%)
0800–1159 5,197 24 56
1200–1759 9,215 43 58
1800–2359 5,372 25 67
0000–0759 1,857 9 75
Overall 21,641 100% 61%

NELA REPORT 2016 | 77
Table 25 Proportion of patients admitted directly to a high dependency or intensive care bed after surgery based on calculated postoperative P-POSSUM risk of death (excluding 69 patients who died intraoperatively and 471 patients with an active decision not to admit to critical care) (Year 2 data)
Risk category by calculated postoperative P-POSSUM risk of death
Total number of patients Frequency (%) Proportion of patients admitted directly to a high dependency or intensive care bed after surgery (%)
Lower (<5%) 9,014 41 36
High (5–10%) 4,010 18 62
Highest (>10%) 9,101 41 85
(All patients with risk ≥5%) (13,111) (59) (78)
Overall 22,125 100% 61%
Table 26 Proportion of patients with a calculated postoperative P-POSSUM risk of death >10% admitted directly to a high dependency or intensive care bed after surgery by time of day and day of week that surgery was commenced (excluding 69 patients who died intraoperatively and 471 patients with an active decision not to admit to critical care) (Year 2 data)
Time of arrival in operating theatre Proportion of patients admitted directly to a high dependency or intensive care bed after surgery (%)
Monday–Friday (%) Saturday–Sunday (%)
0800–1159 81 83
1200–1759 82 86
1800–2359 89 90
0000–0759 91 93
Overall 86% 88%

78 | NELA REPORT 2016
Table 27 Proportion of patients with a calculated postoperative P-POSSUM risk of death >10% admitted directly to a high dependency or intensive care bed after surgery by the day that surgery was commenced (excluding 69 patients who died intraoperatively and 471 patients with an active decision not to admit to critical care) (Year 2 data)
Day of arrival in operating theatre
Total number of patients Frequency (%) Proportion of patients admitted directly to a high dependency or intensive care bed after surgery (%)
Monday 1,228 13 86
Tuesday 1,402 15 85
Wednesday 1,474 16 85
Thursday 1,451 16 83
Friday 1,407 15 84
Saturday 1,164 13 86
Sunday 1,127 12 88
Overall 9,253 100% 85%
Figure 24 Trends in the proportions of patients with a calculated postoperative P-POSSUM risk of death 5–10% and >10% admitted directly to a high dependency or intensive care bed after surgery (excluding 69 patients who died intraoperatively and 471 patients with an active decision not to admit to critical care)
0
10
20
30
40
50
60
70
80
90
100
Jan-
14
Feb-
14
Mar
-14
Apr
-14
May
-14
Jun-
14
Jul-1
4
Aug
-14
Sep-
14
Oct
-14
Nov
-14
Dec
-14
Jan-
15
Feb-
15
Mar
-15
Apr
-15
May
-15
Jun-
15
Jul-1
5
Aug
-15
Sep-
15
Oct
-15
Nov
-15
Patie
nts (
%)
Patients with postoperative P-POSSUM risk of death >10% admitted directly to critical care after surgery Patients with postoperative P-POSSUM risk of death 5–10% admitted directly to critical care after surgery Median 80% Target (Applies only to those with a postopetative P-POSSUM risk of death >10%)

NELA REPORT 2016 | 79
Additional analysesThe proportion of patients admitted directly to a high dependency or intensive care bed after surgery was also assessed against patient age, ASA, admission type and operative urgency (Table 51 and Table 52), time of day and day of week of surgery (Table 53 and Table 54).
RECOMMENDATIONS Local audit data should be examined to determine if national standards for postoperative critical care admission are being met. Where compliance is poor, a change of local policies and reconfiguration of services should be considered to enable all high-risk emergency laparotomy patients to be cared for on a critical care unit after surgery (Commissioners and provider Chief Executives).
When surgery is contemplated, a formal assessment of the risk of death and complications should be undertaken by a clinician and documented in the patient record. This information should be communicated to all members of the MDT in order to prioritise care and allocate appropriate resources. If surgery is undertaken, this risk assessment should be documented on the patient consent form (MDT).
Professional stakeholders, such as Royal Colleges and Specialist Societies, should collaborate to improve clarity and remove ambiguity in the wording of standards of care for high-risk patients (Professional Stakeholder Organisations).
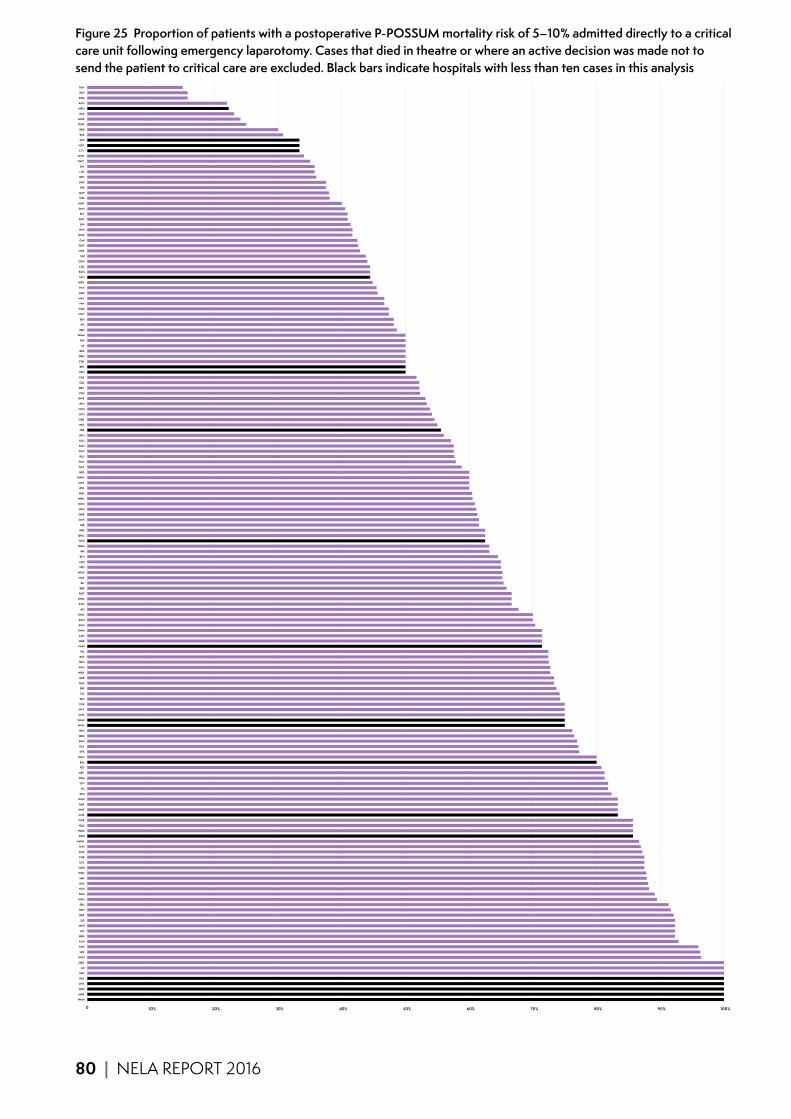
80 | NELA REPORT 2016
Figure 25 Proportion of patients with a postoperative P-POSSUM mortality risk of 5–10% admitted directly to a critical care unit following emergency laparotomy. Cases that died in theatre or where an active decision was made not to send the patient to critical care are excluded. Black bars indicate hospitals with less than ten cases in this analysis
0 10% 20% 30% 40% 50% 60% 70% 80% 90% 100%
NMH
MAR
GEO
CHX
HUL
SHC
LEI
QEG
WDH
LER
TUN
FGH
BRG
LIN
MPH
SLF
DER
NPH
SPD
WSH
SGH
KTH
RUS
MRI
WRC
NDD
UCL
CHE
PMS
SHH
MDW
DDH
HOM
QKL
WYB
CHR
WHT
BAR
WHH
ESU
PIL
STH
FRM
NEV
PET
EAL
GGH
STR
BLA
DVH
QEQ
RSU
WHC
WMU
CLW
WYT
TOR
SPH
VIC
FRE
GLG
QEB
WRX
RVN
NTH
BAT
HIL
NUN
DAR
SAN
KMH
SCM
KGH
KNG
AEI
KCH
OHM
ROT
RBE
RLI
NGS
WDG
YEO
LDH
BFH
BRI
NMG
NTG
QMC
RDE
AIR
CGH
QHR
LON
WGH
WRG
NSH
LEW
MAY
WAW
BOL
SCA
SMV
RLU
PGH
SUN
GLO
BTH
FRR
RSC
HAR
HCH
NHH
RFH
GWE
YDH
DRY
QEL
FAZ
PAH
BRT
STM
BRO
BED
LIS
PIN
WMH
EBH
IPS
SEH
COC
HUD
HIN
MAC
ADD
PCH
WEX
SCU
RGH
COL
CON
SJH
NCR
WAT
CMI
NOR
WHI
JPH
RHC
PLY
SMH
MIW
WIR
QAP
DID
UHC
RPH
LEG
SAL
GWY
UHW
CTY
NOT
STD
RSS
BRD
POW
MOR
BAS
MKH
RCH
RAD
RSH
TGA
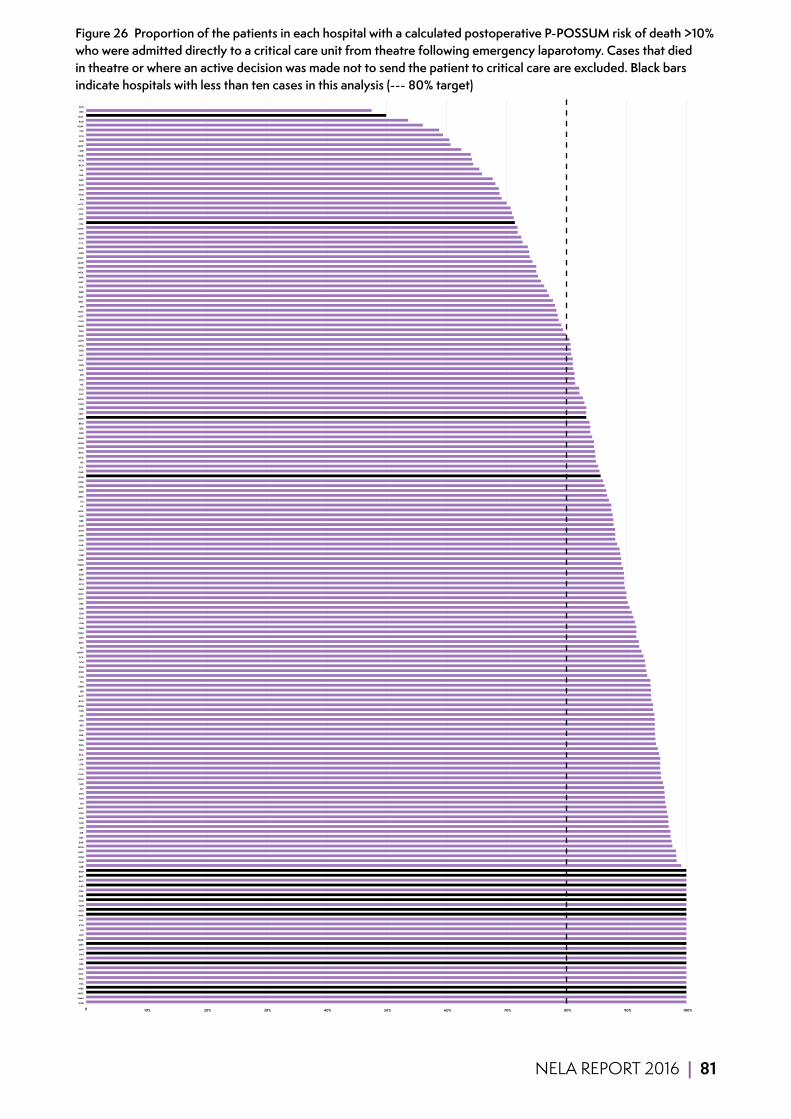
NELA REPORT 2016 | 81
Figure 26 Proportion of the patients in each hospital with a calculated postoperative P-POSSUM risk of death >10% who were admitted directly to a critical care unit from theatre following emergency laparotomy. Cases that died in theatre or where an active decision was made not to send the patient to critical care are excluded. Black bars indicate hospitals with less than ten cases in this analysis (--- 80% target)
0 10% 20% 30% 40% 50% 60% 70% 80% 90% 100%
WYB
WMU
WHC
WES
UCL
STM
SHC
QEG
PRS
PAP
PAH
NPH
MST
MAR
LHC
LEI
KTH
HUL
HHX
GEO
FGH
CKH
CHR
CHE
CAS
BRG
BNT
BMP
LER
GLG
WSH
NGS
WDH
BAR
QKL
AIR
SPD
TUN
BFH
BTH
WRC
LIN
TOR
SHH
SLF
MRI
WHH
CLW
YEO
STR
LEW
BLA
RSU
PMS
NSH
DER
SCM
PET
NTH
VIC
STH
HOM
RVN
ROT
BRI
KMH
RLI
ESU
DDH
SGH
SPH
SCA
MDW
AEI
RUS
RPH
OHM
EBH
LON
PGH
LDH
QEB
FRE
WYT
WHT
SMH
PCH
FRM
SUN
BRT
WMH
GWE
CMI
RLU
HAR
YDH
MPH
DVH
KCH
RBE
SEH
WRX
PIL
LIS
QMC
DAR
CHX
KNG
NUN
QHR
BOL
IPS
NTG
RHC
KGH
GGH
WGH
RDE
QEL
BRO
NMH
NEV
FRR
CON
WDG
RSC
GLO
HIL
HIN
SJH
FAZ
RFH
GWY
BAT
BED
QEQ
MKH
NHH
BAS
NMG
CGH
NOT
MAC
JPH
DRY
SMV
BRD
PLY
WAT
WIR
WEX
NDD
MOR
WAW
RSH
WRG
CTY
RGH
ADD
UHW
EAL
UHC
COL
COC
NCR
PIN
HUD
WHI
SAN
QAP
TGA
SAL
RCH
HCH
NOR
DID
MIW
LEG
SCU
STD
POW
RAD
MAY
RSS
GHS

82 | NELA REPORT 2016
16 ASSESSMENT BY AN ELDERLY MEDICINE SPECIALIST
Why is this important?Ageing is associated with reduced physiological reserve, increasing multimorbidity and increasing prevalence of frailty.27 All of these factors reduce the ability of older people to compensate for the physiological stress of surgery and anaesthesia, and increase the risk of an adverse outcome after major emergency surgery.28 Almost half the patients undergoing emergency laparotomy are over the age of 70. Therefore efforts to improve care for this group of patients are therefore likely to bring about considerable benefits.
As increasing numbers of older people undergo emergency surgery, and because they present with complex medical, nursing and social issues, the need for specialist input by Elderly Medicine teams in the perioperative period is increasingly being recognised.27
Whilst there is no standard definition of older age, the Audit has used 70 years as the lower limit to explore postoperative assessment by an Elderly Medicine specialist.
KEY STANDARDS Clear protocols for the postoperative management of elderly patients undergoing abdominal surgery should be developed which include, where appropriate, routine review by an MCOP [Medicine for Care of Older People] consultant and nutritional assessment. NCEPOD Age
Comorbidity, disability and frailty need to be clearly recognised as independent markers of risk in the elderly. This requires skill and multidisciplinary input, including early involvement of Medicine for the Care of Older People. NCEPOD Age
All emergency inpatients must have prompt assessment by a multi-professional team to identify complex or on-going needs, unless deemed unnecessary by the responsible consultant. NHS 7 Day Services
AUDIT QUESTIONS What proportion of patients undergoing emergency laparotomy was aged 70 years or over?
How did outcomes of patients aged 70 years or over compare with those of younger patients?
What proportion of patients aged 70 years or over was assessed by an Elderly Medicine specialist following surgery? (Target ≥ 80%)
Is there variation between hospitals in the proportion of patients aged 70 years or over who were assessed postoperatively by an Elderly Medicine specialist?
KEY FINDINGS 10% of patients aged 70 years or over and 18% of patients aged 90 years or over were assessed by an Elderly Medicine specialist after surgery (Table 28). Two hospitals (1%) were rated Green, whereas 174 hospitals (95%) were rated Red (Figure 28).

NELA REPORT 2016 | 83
Clinical commentaryThe Audit has shown that around half of all patients undergoing an emergency laparotomy are aged 70 years or over (Table 3). 30-day mortality and hospital length of stay are also much higher in older patients compared to younger cohorts (Figure 29 and Figure 36). It is therefore concerning that the proportion of older patients who receive a postoperative review from an Elderly Medicine specialist remains so low. Overall this has not changed compared to the First Report, and even seems to have worsened for the oldest patients, although it is acknowledged that the numbers are small (Table 28).
Evidence from elderly patients undergoing emergency hip fracture surgery suggests that perioperative involvement of an Elderly Medicine specialist can improve outcomes. Given the longer length of stay seen in the elderly, increasing Elderly Medicine involvement may be a cost effective way of improving care. The NELA Organisational Audit suggested that Elderly Medicine specialists were available at 98% of participating hospitals. The apparent disparity between clinical need, service availability and what is actually provided continues to suggest there are barriers to routine Elderly Medicine involvement in older emergency laparotomy patients. The circumstances are likely to differ between hospitals, but any local barriers should be urgently addressed to improve the care of this high-risk population.
Table 28 Proportion of patients aged 70 years or over assessed after surgery by an Elderly Medicine specialist following emergency laparotomy by patient age (Year 2 data)
Total number of patients Proportion of patients assessed after surgery by an Elderly Medicine specialist (%)
70–79 5,767 7
80–89 4,068 13
≥90 537 18
Overall 10,372 10%
Figure 27 Trend in the overall proportion of patients aged 70 years or over assessed after surgery by an Elderly Medicine specialist
0
10
20
30
40
50
60
70
80
90
100
Jan-
14
Feb-
14
Mar
-14
Apr
-14
May
-14
Jun-
14
Jul-1
4
Aug
-14
Sep-
14
Oct
-14
Nov
-14
Dec
-14
Jan-
15
Feb-
15
Mar
-15
Apr
-15
May
-15
Jun-
15
Jul-1
5
Aug
-15
Sep-
15
Oct
-15
Nov
-15
Patie
nts (
%)
Patients aged 70 years or over assessed by an Elderly Medicine specialist after surgery 80% Target Median
84 | NELA REPORT 2016
Additional analysesThe proportion of patients aged 70 years or over was also assessed against ASA, admission type and documentation of risk (Table 55).
QUALITY IMPROVEMENT VIGNETTE Improving Elderly Medicine specialist review requires NHS trusts to engage with Elderly Medicine colleagues to develop an interest in surgical patients.
Kings Mill hospital has the highest proportion of patients assessed by Elderly Medicine in the country. Their approach was to ‘have face-to-face meetings with Elderly Medicine colleagues and explain the NELA standards of care/rationale behind them. The trust Elderly Medicine clinical lead was already familiar with Jugdeep Dhesi’s POPS (Proactive care of Older People going to have Surgery) work and was fully supportive of the NELA initiative. Colleagues from Surgery and Elderly Medicine also attended a Royal College of Surgeons one-day regional workshop ‘Meeting the needs of an ageing population’ in November 2014 which helped promote multidisciplinary working.’
RECOMMENDATIONS Increased Elderly Medicine input may require specific commissioning for this service (Commissioners and provider Chief Executives).
Pathways should be implemented to ensure that all patients aged 70 years or over, who undergo an emergency laparotomy, receive an assessment of multimorbidity, frailty and cognition to guide further input from an Elderly Medicine specialist (MDT).

NELA REPORT 2016 | 85
Figure 28 Proportion of patients over the age of 70 that were assessed by an elderly medicine specialist after surgery. Black bars indicate hospitals with less than ten cases in this analysis (--- 80% target)
0 10% 20% 30% 40% 50% 60% 70% 80% 90% 100%
WHC
BRG
RAD
KMH
CHX
HIL
STH
SLF
KCH
NTG
HOM
STM
RBE
WHT
BRD
RLI
NSH
CLW
BAS
VIC
MAY
RLU
RDE
YDH
DRY
UCL
GGH
SMV
BFH
QEB
PET
WRX
HAR
MKH
TGA
MPH
NTH
LEG
PLY
BOL
GEO
DDH
NUN
MIW
RFH
WDG
RCH
LON
LIS
RGH
SMH
GWE
HUL
SCU
ADD
WAT
QAP
LDH
AEI
NHH
UHC
FGH
DER
FAZ
LER
NPH
GWY
WHH
PAH
RHC
LEW
CMI
DVH
PGH
FRE
ESU
RSS
SHC
POW
BRI
SCM
WRG
WDH
WYT
STD
NEV
PIL
NOR
RVN
MOR
QMC
SHH
NCR
KTH
SAL
QEG
QEL
WSH
UHW
YEO
HCH
TOR
SJH
SGH
BAR
SPH
DAR
HUD
MDW
CON
BTH
FRR
SCA
STR
WMH
PCH
WGH
BED
NMG
MAC
WAW
FRM
HIN
IPS
OHM
BAT
COL
GLO
WRC
PMS
WEX
PIN
WIR
CHE
RUS
GLG
MRI
SPD
RSC
NGS
RSU
KGH
QKL
RPH
TUN
QEQ
BLA
EBH
WES
WLT
BMP
CKH
HHX
BNT
CHR
NMH
CAS
CTY
MAR
LHC
EAL
PAP
NOT
ROT
BRT
SAN
WMU
NDD
WHI
WYB
AIR
COC
LEI
RSH
KNG
BRO
DID
LIN
CGH
SUN
SEH
JPH
QHR
86 | NELA REPORT 2016
17 OUTCOMESWhy is this important?Previous studies from the UK and other countries have shown mortality rates following emergency laparotomy of 13–18% at 30 days, equating to one in every five to six people who undergo these procedures dying within a month of surgery.3,4,5
NELA is one of several audit and quality improvement projects currently running across the world to improve patient outcomes after surgery.29,30,31 This cohort of more than 40,000 individuals represents the largest group of patients undergoing emergency laparotomy to have been followed prospectively.
At present, little is known about patients’ postoperative course in hospital (including location of care, length of stay and the development of complications) or after discharge from hospital, other than survival beyond the first month after surgery.32 It is therefore essential that, in addition to assessing variation between hospitals and patient groups, the Audit should establish baseline measures of patient outcomes for this group of patients. This information will be helpful for patients and clinicians when discussing treatment options.
Mortality data from the Office for National Statistics (ONS) have been matched to the NELA data, so it has been possible to report all-cause 30-day and 90-day mortality rates, as opposed to the inpatient mortality that was reported in Year 1. ONS mortality data only became available after the publication of the First Patient Report, and so 30-day and 90-day mortality has been reported for both years, covering patients who underwent surgery from December 2013 to November 2015. Using these figures it has also been possible to develop a model to assess hospital-level risk-adjusted outcomes.
AUDIT QUESTIONS What proportion of patients who underwent an emergency laparotomy died within 30 and 90 days of surgery?
What variation was seen between hospitals, and were there any outliers?
For patients who survived surgery, what was the length of hospital stay?
What proportion of patients returned to theatre for further surgery?
What proportion of patients had an unplanned admission to critical care following surgery?
What variation existed in the above outcomes, by:
1 Patient characteristics, including documented risk of death? 2 Operative urgency? 3 Surgical characteristics, including operation performed? 4 Day of week?
NELA REPORT 2016 | 87
17.1 DEATH WITHIN 30 DAYS AND 90 DAYS OF SURGERY ACORDING TO ONS DATA
KEY FINDINGS During the combined Year 1 and Year 2 period 11.4% of patients died within 30 days of surgery. 90-day mortality was 15.6%.
30-day mortality was 11.7% in Year 1, and 11.1% in Year 2.
Mortality increased with:
■ Increasing risk category (Table 29) ■ Increasing age (Figure 29) ■ Increasing ASA grade (Figure 30) ■ Increasing surgical urgency (Figure 31)
Mortality rates varied substantially by the operative procedure performed at emergency laparotomy (Table 30).
Risk-adjusted 30-day postoperative mortality rates among hospitals for the two-year period varied from around 5% to 17%. These values reflect the relatively small number of cases on which the figures were derived, and the size of the differences is within the range expected from random variation. No hospitals had 30-day mortality rates that fell outside the expected range (based on 99.8% control limits) (Figure 34).
Clinical commentaryOverall, 30-day mortality derived from ONS data was lower than previously reported 30-day in-hospital mortality following emergency laparotomy.3,4,5 These data again confirm that death after emergency bowel surgery is far more common than after elective operations that are considered to be high-risk.6,7 Subgroups of patients, such as those over the age of 70, those requiring immediate surgery, and for some surgical conditions, have substantially higher mortality rates.
The observed difference in mortality rates, in comparison to previous reports, may reflect a genuine overall improvement in patient outcomes after surgery over time.33 This may in turn be a consequence of the interest and activity generated around NELA and several major quality improvement projects including EPOCH and ELPQuIC.34,35 The NELA data relate to around 70% of all estimated emergency laparotomy activity in England and Wales during the audit period and is very likely to be an accurate estimate of current mortality following this procedure. The availability and publication of 90-day mortality data is also helpful in providing a greater understanding of longer-term outcomes following emergency laparotomy and provides greater information to patients and clinicians.
Outcomes varied substantially by the main operation performed (Table 30):
■ Over half of the procedures were colonic and small bowel resections, and were associated with an ONS 30-day mortality of between 9.0% and 15.3%.
■ Particularly high 30-day mortality rates were noted after several procedures including: formation of laparostomy (25.0%), exploratory or relook laparotomy (23.9%), and pathologies not amenable to surgery (74.7%). The latter group will include patients for whom palliation was the only appropriate clinical option.
■ No emergency laparotomy should be considered low risk, but the raw 30-day and 90-day mortality rates suggest that outcomes may be better if bowel resection is not required.
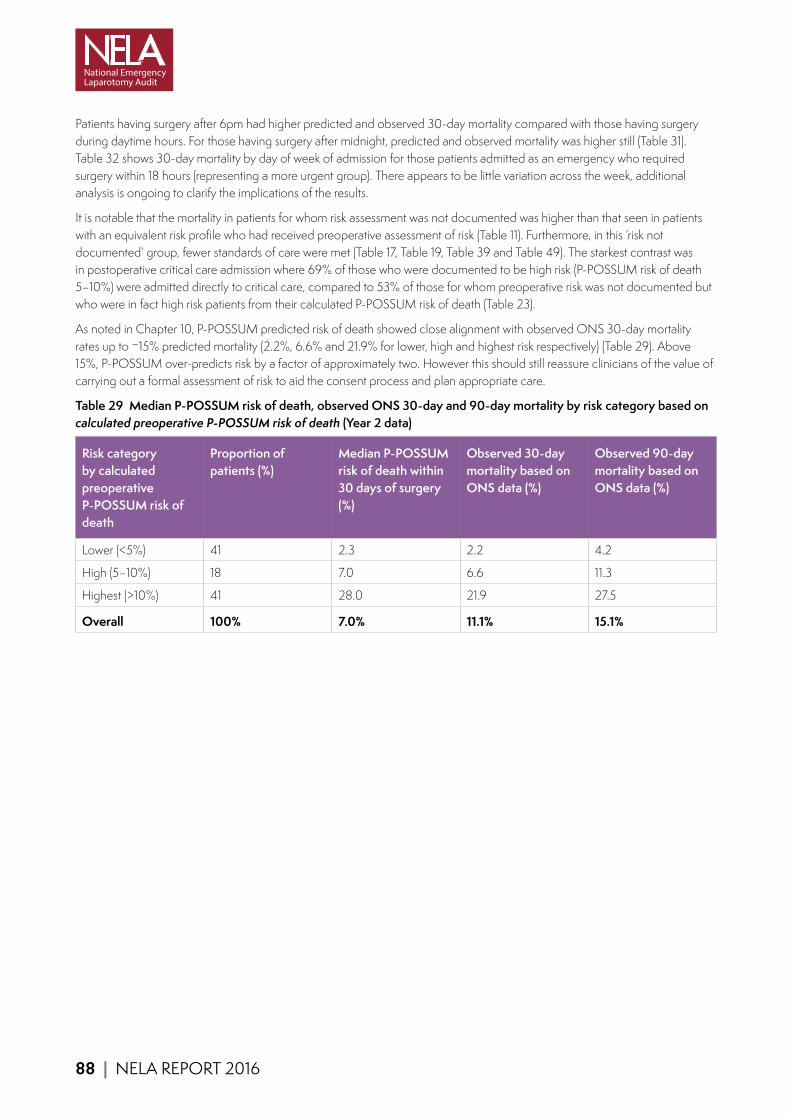
88 | NELA REPORT 2016
Patients having surgery after 6pm had higher predicted and observed 30-day mortality compared with those having surgery during daytime hours. For those having surgery after midnight, predicted and observed mortality was higher still (Table 31). Table 32 shows 30-day mortality by day of week of admission for those patients admitted as an emergency who required surgery within 18 hours (representing a more urgent group). There appears to be little variation across the week, additional analysis is ongoing to clarify the implications of the results.
It is notable that the mortality in patients for whom risk assessment was not documented was higher than that seen in patients with an equivalent risk profile who had received preoperative assessment of risk (Table 11). Furthermore, in this ‘risk not documented’ group, fewer standards of care were met (Table 17, Table 19, Table 39 and Table 49). The starkest contrast was in postoperative critical care admission where 69% of those who were documented to be high risk (P-POSSUM risk of death 5–10%) were admitted directly to critical care, compared to 53% of those for whom preoperative risk was not documented but who were in fact high risk patients from their calculated P-POSSUM risk of death (Table 23).
As noted in Chapter 10, P-POSSUM predicted risk of death showed close alignment with observed ONS 30-day mortality rates up to ~15% predicted mortality (2.2%, 6.6% and 21.9% for lower, high and highest risk respectively) (Table 29). Above 15%, P-POSSUM over-predicts risk by a factor of approximately two. However this should still reassure clinicians of the value of carrying out a formal assessment of risk to aid the consent process and plan appropriate care.
Table 29 Median P-POSSUM risk of death, observed ONS 30-day and 90-day mortality by risk category based on calculated preoperative P-POSSUM risk of death (Year 2 data)
Risk category by calculated preoperative P-POSSUM risk of death
Proportion of patients (%)
Median P-POSSUM risk of death within 30 days of surgery (%)
Observed 30-day mortality based on ONS data (%)
Observed 90-day mortality based on ONS data (%)
Lower (<5%) 41 2.3 2.2 4.2
High (5–10%) 18 7.0 6.6 11.3
Highest (>10%) 41 28.0 21.9 27.5
Overall 100% 7.0% 11.1% 15.1%
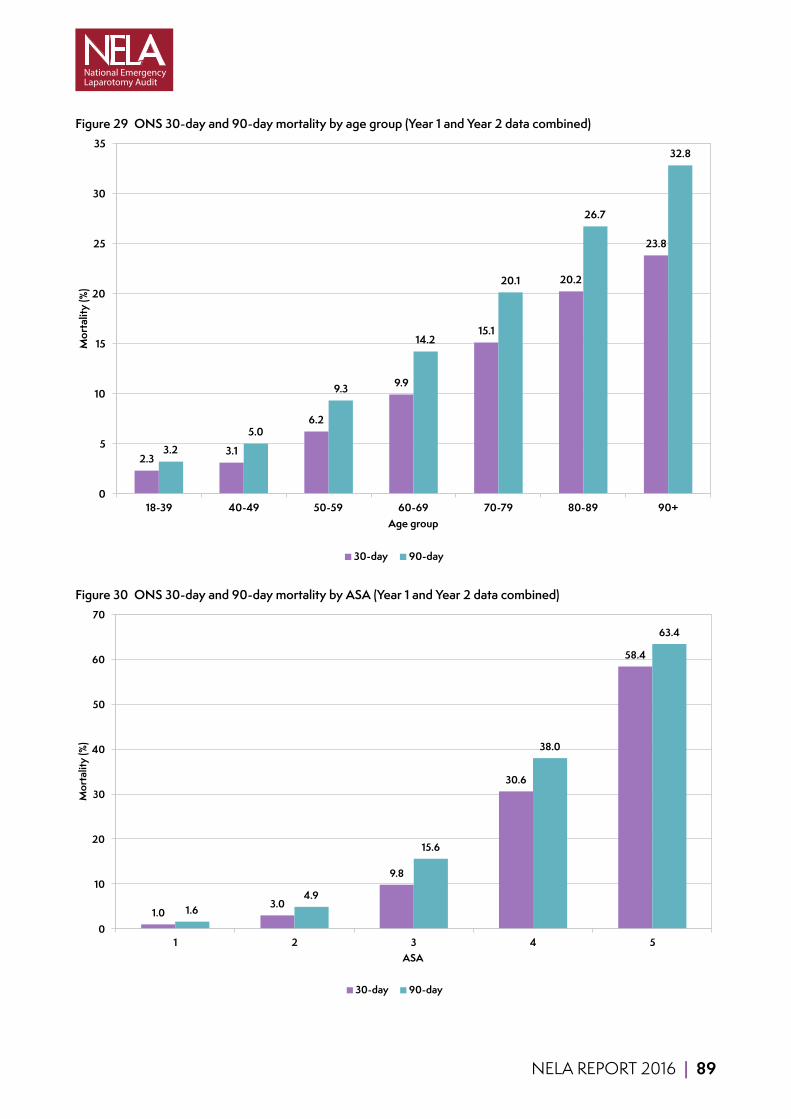
NELA REPORT 2016 | 89
Figure 29 ONS 30-day and 90-day mortality by age group (Year 1 and Year 2 data combined)
2.3 3.1
6.2
9.9
15.1
20.2
23.8
3.2 5.0
9.3
14.2
20.1
26.7
32.8
0
5
10
15
20
25
30
35
18-39 40-49 50-59 60-69 70-79 80-89 90+
Mor
talit
y (%
)
Age group
30-day 90-day
Figure 30 ONS 30-day and 90-day mortality by ASA (Year 1 and Year 2 data combined)
1.0 3.0
9.8
30.6
58.4
1.6 4.9
15.6
38.0
63.4
0
10
20
30
40
50
60
70
1 2 3 4 5
Mor
talit
y (%
)
ASA
30-day 90-day
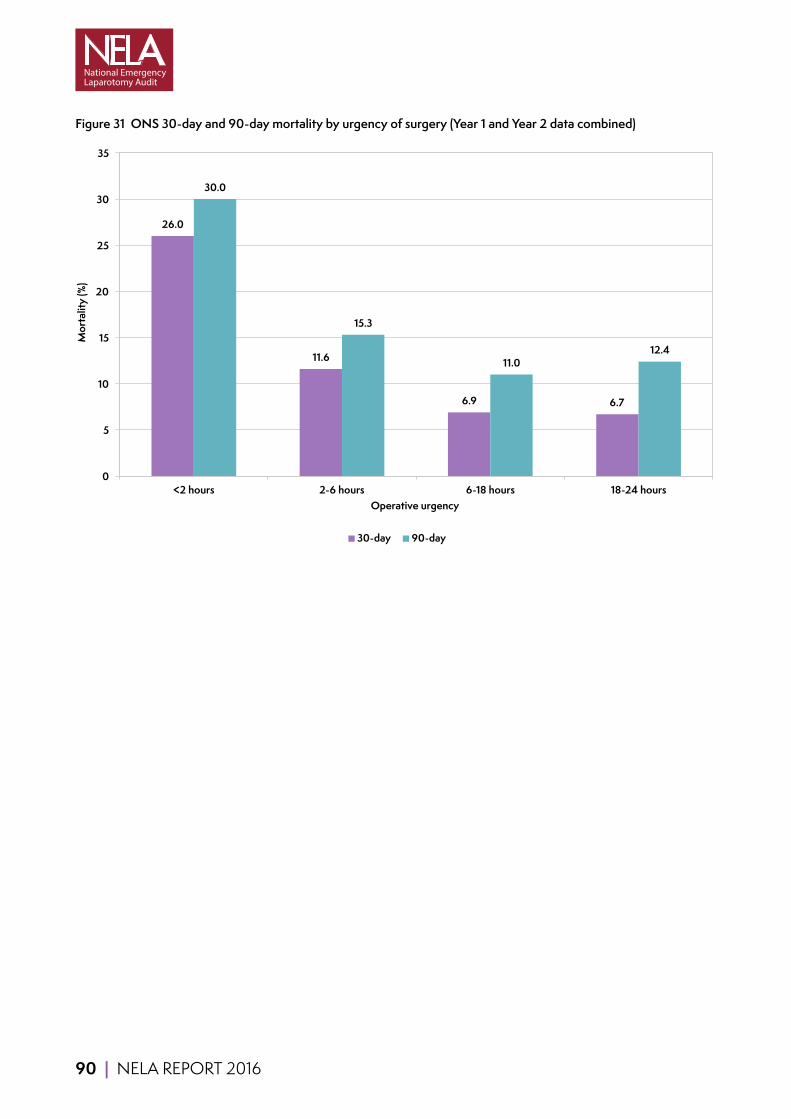
90 | NELA REPORT 2016
Figure 31 ONS 30-day and 90-day mortality by urgency of surgery (Year 1 and Year 2 data combined)
26.0
11.6
6.9 6.7
30.0
15.3
11.0 12.4
0
5
10
15
20
25
30
35
<2 hours 2-6 hours 6-18 hours 18-24 hours
Mor
talit
y (%
)
Operative urgency
30-day 90-day
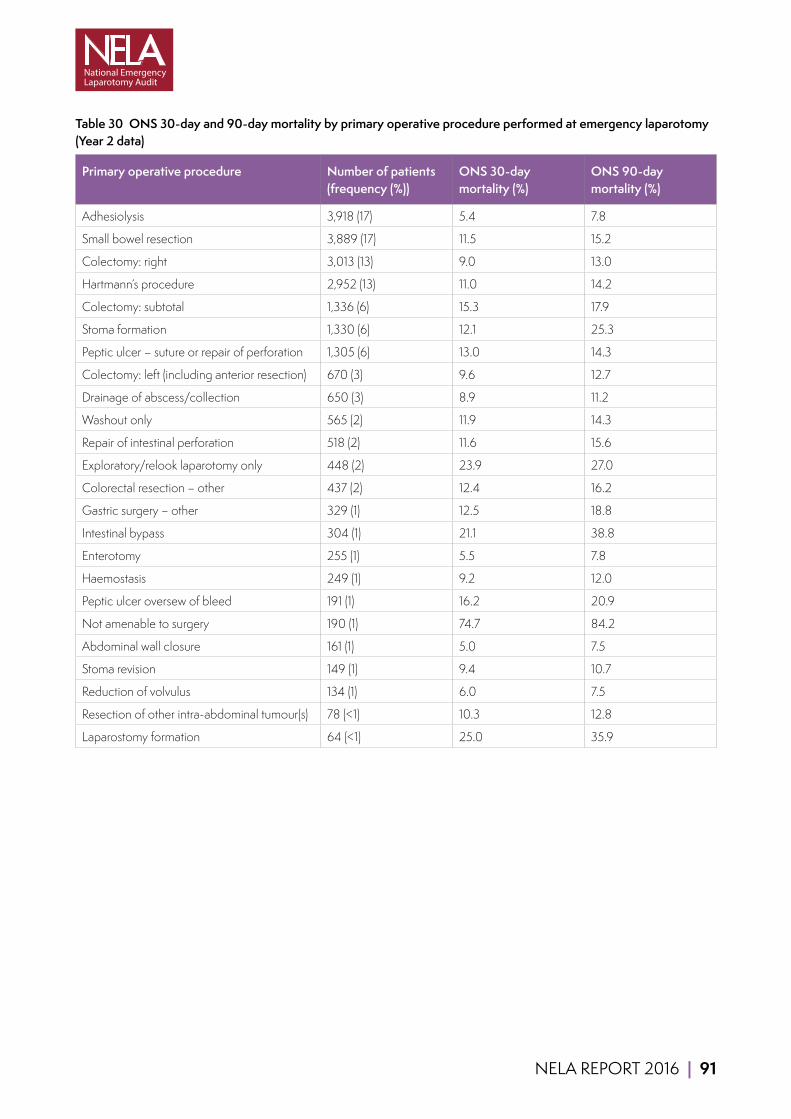
NELA REPORT 2016 | 91
Table 30 ONS 30-day and 90-day mortality by primary operative procedure performed at emergency laparotomy (Year 2 data)
Primary operative procedure Number of patients (frequency (%))
ONS 30-day mortality (%)
ONS 90-day mortality (%)
Adhesiolysis 3,918 (17) 5.4 7.8
Small bowel resection 3,889 (17) 11.5 15.2
Colectomy: right 3,013 (13) 9.0 13.0
Hartmann’s procedure 2,952 (13) 11.0 14.2
Colectomy: subtotal 1,336 (6) 15.3 17.9
Stoma formation 1,330 (6) 12.1 25.3
Peptic ulcer – suture or repair of perforation 1,305 (6) 13.0 14.3
Colectomy: left (including anterior resection) 670 (3) 9.6 12.7
Drainage of abscess/collection 650 (3) 8.9 11.2
Washout only 565 (2) 11.9 14.3
Repair of intestinal perforation 518 (2) 11.6 15.6
Exploratory/relook laparotomy only 448 (2) 23.9 27.0
Colorectal resection – other 437 (2) 12.4 16.2
Gastric surgery – other 329 (1) 12.5 18.8
Intestinal bypass 304 (1) 21.1 38.8
Enterotomy 255 (1) 5.5 7.8
Haemostasis 249 (1) 9.2 12.0
Peptic ulcer oversew of bleed 191 (1) 16.2 20.9
Not amenable to surgery 190 (1) 74.7 84.2
Abdominal wall closure 161 (1) 5.0 7.5
Stoma revision 149 (1) 9.4 10.7
Reduction of volvulus 134 (1) 6.0 7.5
Resection of other intra-abdominal tumour(s) 78 (<1) 10.3 12.8
Laparostomy formation 64 (<1) 25.0 35.9

92 | NELA REPORT 2016
Table 31 Median preoperative P-POSSUM risk of death and observed ONS 30-day mortality for all patients by time of day of arrival in operating theatre (Year 2 data)
Time of day Median P-POSSUM risk of death (%) ONS 30-day mortality (%)
0800–1159 5.7 8.8
1200–1759 6.1 9.7
1800–2359 9.0 13.0
0000–0759 15.2 16.9
Overall 7.0% 11.1%
Table 32 ONS 30-day mortality by the day of the week of hospital admission and of surgery for patients admitted as an emergency and with a surgical urgency category <18 hours (Year 2 data)
Day of week Day of admission Day of surgery
Number of patients (frequency (%))
ONS 30-day mortality (%)
Number of patients (frequency (%))
ONS 30-day mortality (%)
Monday 2,898 (16) 13.3 2,364 (13) 13.5
Tuesday 2,714 (15) 11.2 2,740 (15) 11.6
Wednesday 2,581 (14) 11.7 2,745 (15) 12.8
Thursday 2,630 (15) 11.4 2,778 (16) 10.4
Friday 2,600 (15) 13.0 2,702 (15) 11.8
Saturday 2,190 (12) 10.9 2,299 (13) 12.1
Sunday 2,266 (13) 11.9 2,251 (13) 11.6
Figure 32 Trend in the overall ONS 30-day and 90-day mortality percentage rate (split medians denoting the change from Year 1 to Year 2)
11.7 11.3
16.3
14.9
0
2
4
6
8
10
12
14
16
18
20
Jan-
14
Feb-
14
Mar
-14
Apr
-14
May
-14
Jun-
14
Jul-1
4
Aug
-14
Sep-
14
Oct
-14
Nov
14
Dec
-14
Jan
15
Feb-
15
Mar
-15
Apr
-15
May
-15
Jun-
15
Jul-1
5
Aug
-15
Sep-
15
Oct
-15
Nov
15
Mor
talit
y (%
)
30-day mortality 90-day mortality Median

NELA REPORT 2016 | 93
Risk-adjusted hospital-level mortalityNELA was provided with date of death by the ONS, from which it has been possible to calculate all-cause 30-day postoperative mortality for individual hospitals. We have presented these figures using a funnel plot. This is a widely used graphical method for comparing outcome information across hospitals. In the plots, each dot represents an NHS hospital. The mortality rate is shown on the vertical axis, with dots higher up the axis showing higher values. The horizontal axis shows surgical activity, with dots further to the right showing NHS hospitals that perform more operations.
The benefit of funnel plots is that they show whether the mortality rates of hospitals differ from the national average by more than would be expected due to random variation. Random variation will always affect statistical information like mortality rates, and its influence is greater among hospitals that perform smaller numbers of procedures. This is shown by the curved ‘funnel’ limits. We have followed the standard approach of using 99.8% control limits to define the region within which we would expect the mortality rates of hospitals to fall if their values only differed from the national rate because of random variation. These are the outer limits of the funnel plot, and hospitals above this line are considered to be ‘outliers’ for mortality. The inner funnel limits are defined as 95% control limits, and hospitals above this line but below the 99.8% outer limits have ‘alert’ status.
The unadjusted 30-day mortality rates are shown in Figure 33. This appears to show a number of hospitals with higher than expected 30-day mortality rates, especially among those with lower case numbers. However, these unadjusted figures do not take into account the risk profile of the patients treated at particular hospitals. Using patient demographic, surgical, and physiological variables in the NELA dataset, a statistical model was created to determine whether an individual was at high- or low-risk of death after surgery, and this was used to derive risk-adjusted hospital 30-day mortality rates (see the Technical Documents section of the NELA website (www.nela.org.uk/reports) for full methodology).
The funnel plot in Figure 34 shows the risk-adjusted 30-day mortality rate for each hospital. No hospitals have rates that fall outside the 99.8% control limit.
Figure 34 also illustrates that, using two years of data, there is still a degree of statistical uncertainty around the mortality rates of hospitals, with individual values typically falling between 5% and 17%. This is a consequence of the relatively low volumes, and with more years of data we will be able to produce more precise mortality rates. Nonetheless, it illustrates a limitation of outcome indicators like 30-day mortality, and highlights the importance of hospitals using the information presented in this Report on both the process of care and postoperative outcomes to examine their local practice.
P-POSSUM can also be used to calculate observed versus expected mortality rates for a particular hospital, and many hospitals currently do this. As previously reported in Chapter 10 and Chapter 21.3, P-POSSUM overestimates the predicted mortality among higher risk patients. This means that the use of P-POSSUM to calculate observed to expected mortality ratios will be falsely reassuring.

94 | NELA REPORT 2016
Figure 33 Funnel plot of unadjusted ONS 30-day mortality rates (Year 1 and Year 2 data combined)
0
10
20
30
40
50
60
70
80
0 50 100 150 200 250 300 350 400 450 500 550 600 650 700
ON
S 30
-day
mor
talit
y (%
)
Number of operations
95% Limit 99.8% Limit National Average Hospital
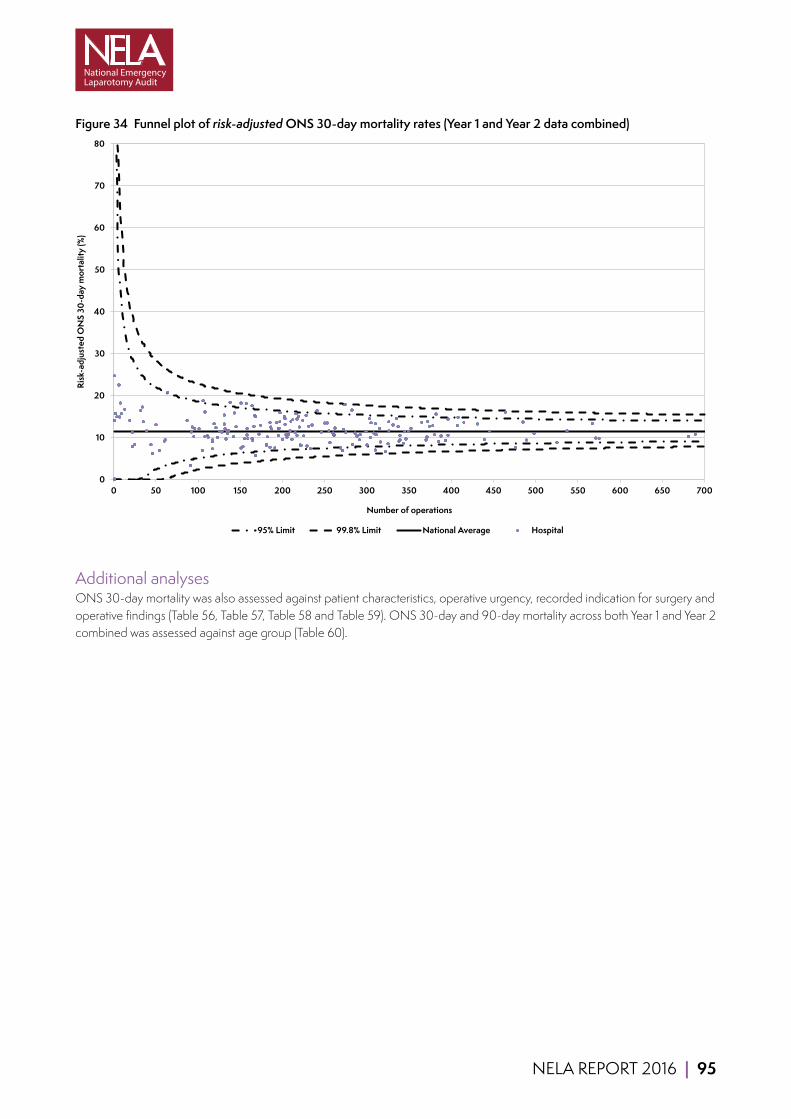
NELA REPORT 2016 | 95
Figure 34 Funnel plot of risk-adjusted ONS 30-day mortality rates (Year 1 and Year 2 data combined)
0
10
20
30
40
50
60
70
80
0 50 100 150 200 250 300 350 400 450 500 550 600 650 700
Risk
-adj
uste
d O
NS
30-d
ay m
orta
lity
(%)
Number of operations
95% Limit 99.8% Limit National Average Hospital
Additional analysesONS 30-day mortality was also assessed against patient characteristics, operative urgency, recorded indication for surgery and operative findings (Table 56, Table 57, Table 58 and Table 59). ONS 30-day and 90-day mortality across both Year 1 and Year 2 combined was assessed against age group (Table 60).

96 | NELA REPORT 2016
17.2 LENGTH OF HOSPITAL STAY AFTER SURGERY
Prolonged length of stay after an emergency laparotomy is a substantial burden on patients, who are removed from their normal home environments, and on health service resources. Postoperative length of hospital stay is a measure of patient experience, outcome and resource utilisation. A short duration of postoperative hospital stay may reflect efficient care pathways and reduced complications.
KEY FINDINGS Overall, half of patients had been discharged within 11 days of surgery (Table 33 and Figure 35).
More than a quarter of patients had left hospital within seven days of surgery, but a quarter were still in hospital more than 19 days after their initial operation (Table 33 and Figure 35).
Length of stay after surgery increased with age. Half of patients under the age of 40 left hospital by day seven after surgery, whereas half of patients over the age of 80 were still in hospital more than 14 days after surgery (Table 33 and Figure 36).
Length of stay after surgery increased with markers of sickness (e.g. ASA status, risk category and urgency of surgery) (Table 33 and Table 34)
There was considerable variation in the median postoperative length of stay between hospitals, ranging from around 7 to 18 days (Figure 38).
Clinical commentarySince patient deaths while in hospital can falsely reduce length of stay, only patients who survived to leave hospital were included in the following analyses in this chapter.
The time patients spend in hospital after an emergency laparotomy varies by operative urgency and patient characteristics (Table 33 and Table 34). It is not surprising that length of stay increases with markers of sickness as these patients are more likely to suffer postoperative complications. Of note is the higher postoperative length of stay for patients whose emergency laparotomy was a consequence of prior elective surgery, confirming that complications of surgery are associated with increased healthcare burden. There is a marked difference in length of stay between older and younger age groups. Investment in Elderly Medicine physicians to manage complex older patients may not only improve outcomes but could also reduce length of stay.
The mean length of stay of all patients has reduced from 18.1 days in Year 1, to 16.3 days in Year 2 (p<0.001). Using the Government’s estimated costs of £400 for a day in hospital,36 this suggests that the financial burden of length of stay alone is in excess of £200 million per year for all 30,000 patients undergoing emergency laparotomy in England and Wales. However the improvement in length of stay seen from Year 1 to Year 2 represents an annual saving of around £22 million.
There was variation in length of stay at hospital level, with a median postoperative length of stay ranging from around 7 days to 18 days (Figure 38). Some of this variation may be due to patient characteristics and shorter durations of stay for patients who died in hospital. However it is probable that this is due in part to variation in the delivery of care. Hospital teams should review their length of stay in the context of the Audit’s other local results. As standards of care improve, we would expect to see a reduction in the length of stay for many patients. Investing in resources to bring about improvement and deliver high-quality care is therefore likely to be cost effective.
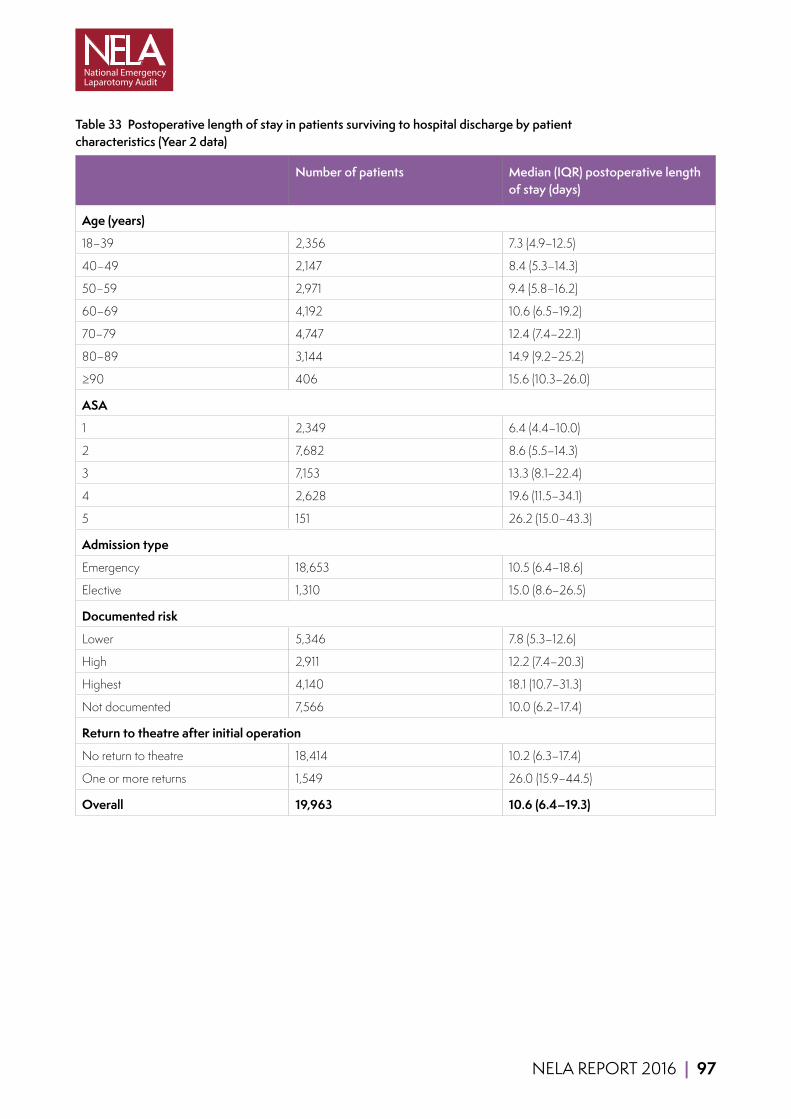
NELA REPORT 2016 | 97
Table 33 Postoperative length of stay in patients surviving to hospital discharge by patient characteristics (Year 2 data)
Number of patients Median (IQR) postoperative length of stay (days)
Age (years)
18–39 2,356 7.3 (4.9–12.5)
40–49 2,147 8.4 (5.3–14.3)
50–59 2,971 9.4 (5.8–16.2)
60–69 4,192 10.6 (6.5–19.2)
70–79 4,747 12.4 (7.4–22.1)
80–89 3,144 14.9 (9.2–25.2)
≥90 406 15.6 (10.3–26.0)
ASA
1 2,349 6.4 (4.4–10.0)
2 7,682 8.6 (5.5–14.3)
3 7,153 13.3 (8.1–22.4)
4 2,628 19.6 (11.5–34.1)
5 151 26.2 (15.0–43.3)
Admission type
Emergency 18,653 10.5 (6.4–18.6)
Elective 1,310 15.0 (8.6–26.5)
Documented risk
Lower 5,346 7.8 (5.3–12.6)
High 2,911 12.2 (7.4–20.3)
Highest 4,140 18.1 (10.7–31.3)
Not documented 7,566 10.0 (6.2–17.4)
Return to theatre after initial operation
No return to theatre 18,414 10.2 (6.3–17.4)
One or more returns 1,549 26.0 (15.9–44.5)
Overall 19,963 10.6 (6.4–19.3)
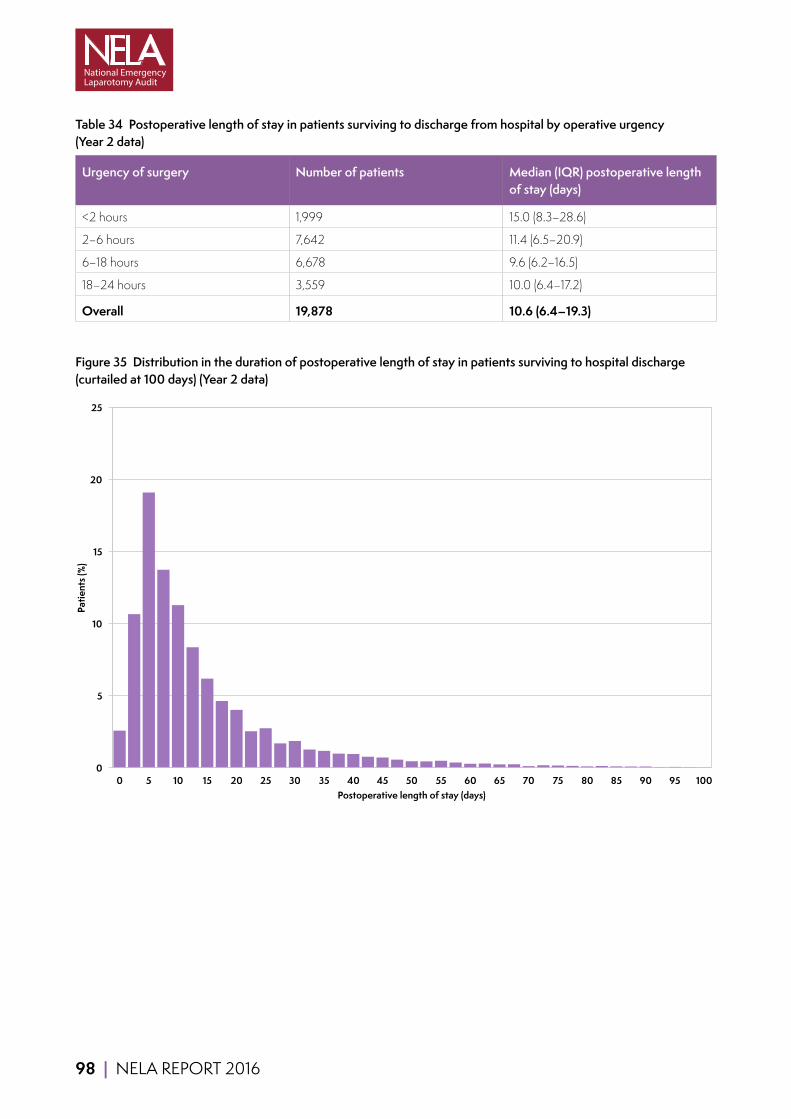
98 | NELA REPORT 2016
Table 34 Postoperative length of stay in patients surviving to discharge from hospital by operative urgency (Year 2 data)
Urgency of surgery Number of patients Median (IQR) postoperative length of stay (days)
<2 hours 1,999 15.0 (8.3–28.6)
2–6 hours 7,642 11.4 (6.5–20.9)
6–18 hours 6,678 9.6 (6.2–16.5)
18–24 hours 3,559 10.0 (6.4–17.2)
Overall 19,878 10.6 (6.4–19.3)
Figure 35 Distribution in the duration of postoperative length of stay in patients surviving to hospital discharge (curtailed at 100 days) (Year 2 data)
0
5
10
15
20
25
0 5 10 15 20 25 30 35 40 45 50 55 60 65 70 75 80 85 90 95 100
Patie
nts (
%)
Postoperative length of stay (days)

NELA REPORT 2016 | 99
Figure 36 Median postoperative length of stay in patients surviving to hospital discharge by age category on the day of admission (Year 2 data)
7.3
8.4
9.5
10.6
12.4
15.4 16.3
0
2
4
6
8
10
12
14
16
18
18-39 40-49 50-59 60-69 70-79 80-89 90+
Med
ian
post
oper
ativ
e le
ngth
of s
tay
(day
s)
Age category
Figure 37 Trend in the median postoperative length of stay
0
2
4
6
8
10
12
14
Jan-
14
Feb-
14
Mar
-14
Apr
-14
May
-14
Jun-
14
Jul-1
4
Aug
-14
Sep-
14
Oct
-14
Nov
-14
Dec
-14
Jan-
15
Feb-
15
Mar
-15
Apr
-15
May
-15
Jun-
15
Jul-1
5
Aug
-15
Sep-
15
Oct
-15
Nov
-15
Med
ian
post
oper
ativ
e le
ngth
of s
tay
(day
s)
Median postoperative length of stay Median

100 | NELA REPORT 2016
Figure 38 Median postoperative length of stay (days) by hospital in patients surviving to discharge. Black bars indicate hospitals with less than ten cases in this analysis
0 5 10 15 20 25 30 35
BMP
CTY
LHC
PAP
CAS
MAR
FRE
LON
NEV
STH
LEG
KCH
MRI
OHM
CHR
NOT
GLG
RLU
CKH
RFH
GWY
RGH
BRT
ROT
HUL
CHE
SCM
STR
STM
WDG
BRG
HAR
QEB
FRR
GGH
HUD
WMH
QEL
FRM
RLI
LIN
CON
BAR
SLF
RPH
BLA
GEO
BRO
BOL
SUN
DVH
SGH
MOR
PIL
UCL
WGH
FAZ
EAL
RSH
SHC
QEG
WRG
LER
CHX
BRD
TUN
VIC
SPD
PMS
NMH
WYB
HIL
BRI
SEH
WHH
NGS
SPH
WRC
QHR
RUS
NCR
GWE
WHC
BAS
RSU
SHH
PIN
UHW
WHI
TGA
KTH
KNG
ADD
MIW
LEW
FGH
STD
NTG
PLY
QMC
WIR
QAP
SCU
NPH
MPH
RSC
RVN
WMU
PCH
YEO
BED
NOR
NMG
IPS
MDW
YDH
CGH
DID
RDE
CLW
LDH
UHC
SJH
PAH
AIR
QKL
WEX
AEI
PET
NUN
NHH
POW
SCA
BAT
COL
ESU
TOR
WAT
BTH
DDH
HOM
MAC
HCH
LEI
WDH
DER
HIN
DAR
BFH
RAD
NSH
BNT
WRX
NDD
SAL
WSH
JPH
DRY
GHS
NTH
SMH
WAW
GLO
MAY
LIS
COC
WYT
SMV
QEQ
KMH
MKH
CMI
RCH
EBH
RSS
RHC
WHT
PGH
SAN
RBE
KGH
WES
NELA REPORT 2016 | 101
17.3 RETURN TO THEATRE FOLLOWING INITIAL EMERGENCY LAPAROTOMY
Return to theatre following emergency laparotomy may be an indicator of an unsuccessful initial procedure or of a complication that has occurred. It may also reflect a judicious and cautious approach in a patient who may have been too unwell to tolerate more extensive initial surgery. This may reflect severity of the original illness but may also reflect the quality of the care the patient has received.
This group comprises all patients who underwent an emergency laparotomy, regardless of whether it was a primary procedure, including those whose initial emergency laparotomy was performed for a complication of prior elective surgery.
KEY FINDINGS Overall, 9% of patients returned to theatre at least once after their initial operation (Table 35).
The most marked variation was observed by admission type (Table 35). Returns to theatre following an emergency laparotomy were more frequent if the initial emergency laparotomy had been for a complication of elective surgery.
The proportion of patients who returned to theatre also varied with increasing risk and operative urgency (Table 35 and Table 36).
Patients who returned to theatre had a longer postoperative length of stay (Table 33), and a higher 30-day and 90-day mortality rate (Table 56).
There was considerable variation between hospitals in the proportion of their patients returning to theatre, ranging from around 2% to 20% (Figure 39).
Clinical commentaryOverall, 2,146 patients (9%) returned to theatre on at least one occasion after their initial emergency laparotomy. Of the patients who were initially admitted electively to hospital, a fifth (21%) returned to theatre on at least one occasion after their initial emergency laparotomy. In contrast, 8% of emergency admissions did so (Table 35).
Mortality was higher in patients who returned to theatre: 16.9% of patients who returned to theatre died within 30 days of their initial operation, compared to 10.2% in those who did not return to theatre (Table 56).
Postoperative length of stay was also considerably longer, at 26.0 days in those that returned to theatre, compared to 10.2 days in those that did not (Table 33).
It is clear from the above results that patients who returned to theatre have a worse outcome than those who did not. Higher predicted risk of death and increasing operative urgency were both associated with an increased risk of return to theatre (Table 35 and Table 36). This finding is not surprising, given the potential reasons why a patient may return to theatre: for example, it may represent prudent decision making in a patient who was too unwell to undergo more extensive surgery at the outset. The variation in return to theatre rate at hospital level is shown in Figure 39. Some of this variation may be due to patient characteristics. However it may also be a consequence of failure to deliver appropriate care. It is therefore important that hospital teams review their returns to theatre to identify the underlying reasons.

102 | NELA REPORT 2016
Table 35 Proportion of patients who returned to theatre following their initial emergency laparotomy by admission type and documented risk (Year 2 data)
Total number of patients Proportion patients who returned to theatre following initial emergency laparotomy (%)
Admission type
Emergency 21,552 8
Elective 1,586 21
Documented risk
Lower 5,504 5
High 3,196 8
Highest 6,105 13
Not documented 8,333 10
Overall 23,138 9%
Table 36 Proportion of patients who returned to theatre following their initial emergency laparotomy by documented urgency of surgery (Year 2 data)
Urgency of surgery Total number of patients Proportion patients who returned to theatre following initial emergency laparotomy (%)
<2 hours 2,943 16
2–6 hours 8,948 10
6–18 hours 7,273 7
18–24 hours 3,869 6
Overall 23,033 9%
Additional analysesThe proportion of patients who returned to theatre following their initial emergency laparotomy was also assessed against patient age and ASA (Table 61).
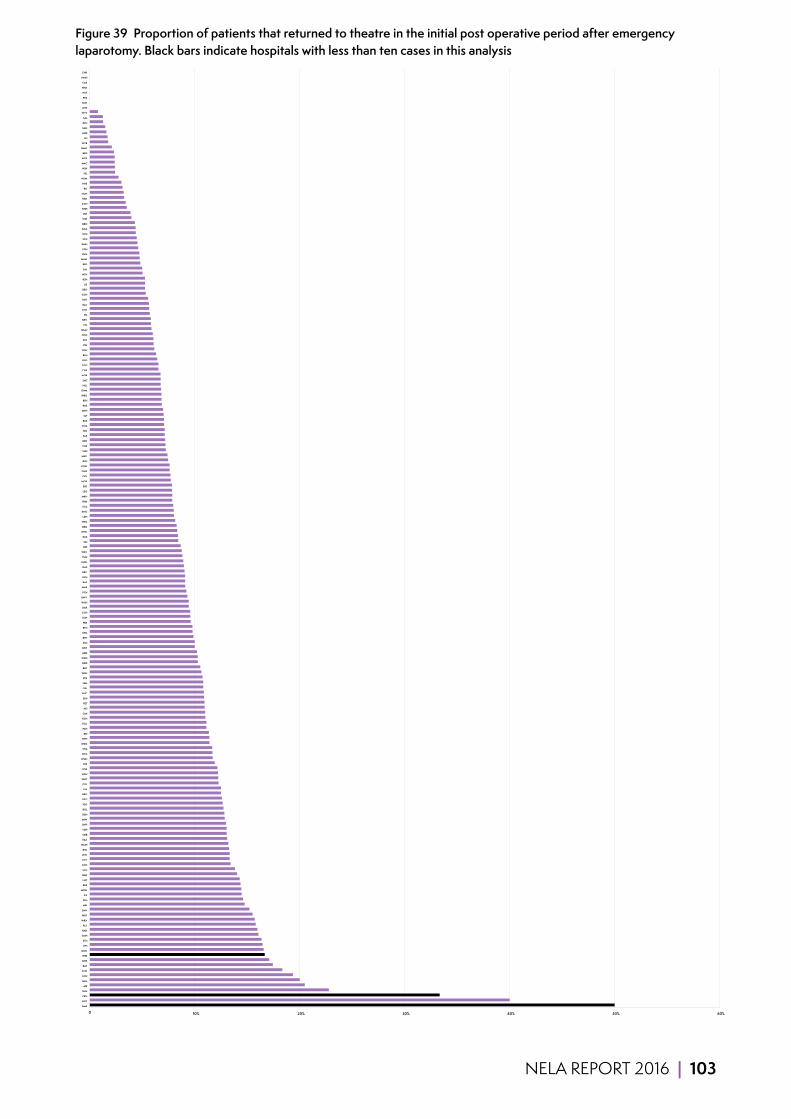
NELA REPORT 2016 | 103
Figure 39 Proportion of patients that returned to theatre in the initial post operative period after emergency laparotomy. Black bars indicate hospitals with less than ten cases in this analysis
0 10% 20% 30% 40% 50% 60%
BMP
NOT
CKH
SUN
AIR
GLG
LON
CLW
BAT
QHR
WES
QMC
JPH
STH
SMH
RAD
PLY
WRX
WAT
SMV
MRI
SPH
IPS
MDW
RBE
LHC
BAR
UCL
KCH
CTY
LEW
RSC
WMH
FAZ
QEB
YDH
DVH
MIW
DDH
BOL
YEO
QEG
BRG
LIN
COL
WHT
RGH
WHI
FRE
WGH
NTG
STM
WDG
NPH
BRI
PAH
TGA
HCH
CMI
AEI
PET
SEH
RHC
QEL
EBH
STR
WSH
BRT
NDD
WDH
ADD
BNT
ESU
BTH
UHC
RFH
FRR
SGH
CGH
DAR
WHH
GWY
PCH
MAR
BAS
RCH
DRY
QAP
UHW
TUN
WEX
DID
SJH
RUS
WHC
QEQ
WRC
LDH
KNG
SCA
FRM
MKH
LEG
SPD
MOR
QKL
GWE
POW
RSU
MAY
SHH
TOR
DER
PAP
HIN
SCM
RSS
SLF
MPH
RDE
BFH
WRG
OHM
HUL
SHC
NOR
CHE
COC
GLO
RLU
PGH
PIN
STD
CON
WMU
VIC
NEV
PIL
CHX
BLA
ROT
GGH
GEO
LIS
RSH
NTH
EAL
BED
WAW
RVN
FGH
KMH
SCU
KTH
NGS
BRO
WIR
LER
NHH
KGH
HAR
NUN
RLI
PMS
HOM
HIL
NSH
MAC
NCR
BRD
NMG
WYB
LEI
HUD
SAN
RPH
SAL
WYT
GHS
MST
PRS
WLT
HHX
CAS
NMH
CHR
104 | NELA REPORT 2016
17.4 UNPLANNED ADMISSION TO CRITICAL CARE
Standards state that high-risk patients should be admitted to critical care following surgery. It is likely that patients admitted to the ward rather than to critical care may deteriorate because they do not receive the required level of care from the outset. Data from other literature suggest that these patients have a higher mortality than if they had been admitted to critical care from the outset.4,7,26
KEY FINDINGS Overall, 879 patients (3.8%) required an escalation of care, and were admitted from a ward to critical care following surgery. This is relatively unchanged from last year (4%).
636 patients (2.7%) had been admitted to critical care directly from theatres, but returned to critical care having been discharged to the ward.
231 patients (1.0%) were admitted from the ward having never been admitted to critical care, of whom 125 were in the highest risk category (P-POSSUM risk of death >10%), meaning they should have been admitted directly to critical care after surgery rather than from the ward.
There was wide variation between hospitals, ranging from zero to more than 15% (Figure 40).
Clinical commentaryHospitals varied in the proportion of their patients who had an unplanned admission to critical care. Whilst the median rate was 3.2% this ranged from zero to greater than 15%. Only 125 (0.5%) patients had an unplanned admission when they should have received postoperative critical care from the outset.
Despite the relatively small numbers within this cohort, hospitals can still use these cases as an opportunity to review how care is delivered at patient level. Hospital teams should review unplanned admission to critical care to determine if any are due to unrecognised deterioration on the ward, premature discharge from critical care, or if patients were inappropriately sent to the ward from theatres.
The numbers of patients in this cohort are too small to undertake any meaningful analysis of mortality. High rates of unplanned critical care admissions may be due to insufficient critical care capacity, or alternatively may reflect inadequate assessment of risk before surgery leading to inappropriate allocation of beds. The magnitude of variation between hospitals is shown in Figure 40. Hospitals with high rates of unplanned admissions should review their local policies and procedures, and determine whether they have sufficient critical care capacity.
RECOMMENDATIONS Hospital teams should review the care received by patients who suffer adverse outcomes. This includes: (MDT)
■ Those who died following surgery. ■ Those who returned to theatre following their emergency laparotomy. ■ Those who had an unplanned escalation of care in the postoperative period.
The results of these reviews should be discussed at multidisciplinary meetings, and cascaded to those involved in the planning and delivery of care to drive improvements (MDT, Medical and Clinical Directors).
Hospitals should ensure they have policies in place for the allocation of critical care resources according to risk, and clear escalation protocols for patients who deteriorate on the ward (Medical and Clinical Directors).

NELA REPORT 2016 | 105
Figure 40 Proportion of patients that had an unplanned admission to critical care from the ward within seven days of their emergency laparotomy. Cases that died in theatre or where an active decision was made not to send to critical care postoperatively are excluded. Black bars indicate hospitals with less than ten cases in this analysis
0 10% 20% 30% 40% 50% 60%
HHX
AIR
PAP
NOT
WAT
QEQ
WYB
TGA
PCH
FRM
WEX
DDH
HCH
BRD
BOL
QEB
UCL
FAZ
SPH
WRC
STM
LEG
BFH
CTY
LIS
KNG
BRO
NTG
NPH
TOR
QEL
DVH
QHR
GWY
GLG
RSH
BAS
HIN
WAW
OHM
FRR
RUS
POW
LON
PAH
SCM
SUN
DRY
YEO
SPD
GWE
LEW
RAD
STH
NEV
BLA
RGH
PLY
MKH
NTH
BAR
KTH
RBE
IPS
SJH
BTH
CHR
MIW
WHI
HOM
QEG
GLO
QMC
HUL
RSS
LDH
MAY
CHE
SGH
CHX
JPH
FRE
BRI
BAT
SCA
YDH
UHW
RCH
NSH
MPH
RLU
NUN
NMG
ADD
CMI
UHC
COL
WHT
STD
RSU
SHH
SCU
WRX
WSH
WMH
WHH
MDW
CLW
BRT
ESU
SHC
CON
SMH
PET
LER
LEI
SEH
SAL
NGS
RDE
HIL
MAC
EBH
RVN
SLF
NOR
BRG
RFH
DER
AEI
RHC
PIN
PMS
MOR
COC
WDG
CGH
HAR
VIC
RLI
SMV
PGH
FGH
NDD
SAN
LIN
PIL
KCH
WRG
BED
NCR
NHH
MRI
QKL
DAR
WGH
RSC
HUD
WYT
TUN
QAP
KMH
WIR
GHS
MST
PRS
BMP
CKH
WES
CAS
BNT
NMH
WHC
LHC
MAR
GEO
EAL
WMU
ROT
GGH
STR
DID
WDH
KGH
RPH
106 | NELA REPORT 2016
18 HOW IMPROVEMENT HAS BEEN ACHIEVED
There have been significant improvements since the initiation of the Audit, and individual units who have achieved widespread adoption and implementation of NELA recommendations have been able to demonstrate reductions in their crude mortality. Around 30 more hospitals now meet key standards of care compared to last year. A review of NELA projects presented at scientific meetings and discussions with top performing units have provided some of the insight into how clinical improvements have been achieved. Many of these have been presented within the quality improvement vignettes throughout the report.
While the second year of data collection was in progress, there have been two major studies running which have worked at large scale to improve care for patient undergoing emergency laparotomy. The ‘EPOCH’ (Enhanced PeriOperative Care for High risk surgical patients) study was a multi-centre, stepped wedge cluster randomised trial conducted in 90 NHS hospitals (including six Scottish hospitals) over an 85 week period.34 Data collection ceased at the end of October 2015. The EPOCH trial intervention comprised two components: an evidence-based integrated care pathway and a quality improvement package to support effective implementation of the pathway into clinical practice. EPOCH used the NELA dataset for its process and outcome measures. Teams within the study have seen success at a local level. At the time of writing this report, the EPOCH results are still being analysed. As part of EPOCH, an ethnographic study was undertaken to assess how change happened at individual sites, and detailed exit questionnaires will also inform how we understand the facilitators and barriers to improvement for these high-risk surgical patients. A second study, the Emergency Laparotomy Collaborative, is taking place across the South of England and involves 24 acute hospitals. This project is scaling up the work done in the ELPQuIC study35 and aims to deliver six key themes using a care bundle approach. Again this study uses NELA data for its process and outcome measures. Additionally the study will focus on two areas for improvement, care of the older patient undergoing emergency laparotomy and the management of sepsis, both problems highlighted in the First NELA Patient Report.
The importance of dataCollection of performance and outcome data of the emergency laparotomy pathway is now ‘business as usual’ for most centres. This data is being used in a number of ways to aid improvement.37
The NELA Quality Improvement Dashboard enables NHS trusts to view their data in time series or run chart format. Displaying data changes over time is a fundamental tool for monitoring the impact of changes, as part of an iterative improvement cycle. The Quality Improvement Dashboard run charts will also demonstrate sustained improvement more effectively than using limited ‘before and after’ collection periods often seen in traditional audit. Furthermore, clinical processes have natural variation over time. Plotting data over time in relation to the median value can also allow units to identify non-random variation, using a set of simple rules.38
There are many cases of NELA data being used to evaluate service changes using historic NELA data against prospectively recorded data, for example after the introduction of new consultant job plans or roles such as emergency surgery coordinators. NELA data has been used to strengthen the case for emergency service changes by allowing units to compare their data against national performance standards. It is often difficult to make a case for additional resources in emergency surgical care, in comparison to elective care where services are easier to plan and evaluate. NELA data has helped clinicians to build a case for investment in service improvements for non-elective care, particularly for funding the additional posts required to allow early consultant review and presence in operating theatres.
As well as allowing peer comparisons, NELA data has helped units pin point which improvements are most pressing within their own service, by recording performance across a range of measures in the whole patient pathway. This is particularly important when financial and time resources are constrained. For example units have developed emergency laparotomy priority slots for imaging, or expanded critical care provision for laparotomy patients when the data demonstrated that these were the areas which required most improvement within their pathway.
NELA REPORT 2016 | 107
In addition to using NELA data to inform change, many units are using NELA recommendations as a template to develop innovative working practices to make widespread improvement along the emergency laparotomy pathway. There are numerous examples of new surgical clerking proformas, operating theatre booking procedures, emergency team meetings and multidisciplinary data review practices that encompass a range of NELA recommendations. Teams have also used NELA data to monitor the effectiveness of their innovations. Many of these have been collated on the NELA website and are available for download (www.nela.org.uk/Pathway-Examples).
Whilst widespread and significant improvements have been seen in many process measures, there has been limited success in some areas. In general improvement has taken place at level of clinician and service, but has been slower in system-wide change. The message from units which perform well on establishing Elderly Medicine postoperative review suggest that this is wholly dependent on finding a clinician within the Elderly Medicine services with the suitable skill set to perform the role. Such skills are still not commonplace, and so improvement has been limited despite NHS trusts knowing that this gap in provision exists. It will require system-wide development of ‘Proactive care of older people going to have surgery’ (POPS)39 or similar training to fill this gap before widespread improvements are seen.
Moving from knowing what we are doing, to knowing how to improveSeveral NHS trusts were able to improve over a range of measures simultaneously, by using their NELA data within an overarching quality improvement initiative. Many NHS trusts emphasised the importance of having quality improvement skills within their project group, either as part of the EPOCH study, Emergency Laparotomy Collaborative, or with general training on quality improvement skills. Successful project teams sought widespread engagement and had leadership or ‘NELA champions’ shared beyond one specialty. Many set up regular multidisciplinary team meetings to look at data and reduce internal variation by targeting underlying causes when care deviated from best practice recommendations. NELA data formed an important part of the Plan-Do-Study-Act cycle used to refine and monitor improvements. Many commented that this was a long journey, but once good working relationships and improvement habits were established, using data as a driver for improvement became ‘business as usual’.
Dissemination of best practiceNELA awards trainee poster prizes at ASGBI and AAGBI conferences, to encourage units to showcase their best practice developments. There is also a section of the NELA website which holds examples of care pathways developed to support the NELA recommendations (www.nela.org.uk/Pathway-Examples).
The NELA Lead database contains contact details of leads in each NHS trust. We will be building on our quality improvement resources to help individual leads make the most of their data, and to encourage peers to learn from each other to improve care and reduce variation.
NELA has focused the attention of clinicians and those managing clinical services on the pathway of a single type of procedure. It is likely that there have been benefits to other patients using similar pathways, such as conservatively managed surgical patients who may benefit from early consultant review, even if they do not go for surgery and are therefore not included in the NELA dataset.
108 | NELA REPORT 2016
QUALITY IMPROVEMENT VIGNETTE Kingston hospital was in the top quartile over a range of measures. They described their improvement journey as: ‘Dedication to quality improvement. Never stop. Allow time to embed changes in clinical practise and produce results. Continuing leadership, teamwork. EPOCH gave us an evidenced structure and ‘buy in’ from other specialties... regular meetings and specific results discussed. Success celebrated. Shortfalls reminded team about adherence. Trainee involvement – enthuse them, encourage and support presentation of results to appropriate national meetings. It was/is the perseverance of the team to continue and keep up the standard of care.’
RECOMMENDATIONS NHS trusts should review their data in run charts using the NELA Quality Improvement Dashboard to monitor performance and inform them about the impact of organisational changes over time (Chief Executives, Medical and Clinical Directors, MDT).
Teams should endeavour to use quality improvement methodology such as the Model For Improvement when planning and executing changes to patient pathways or organisational processes (MDT, Medical and Clinical Directors).
Improvement teams should be multidisciplinary, and use good engagement and data feedback practices to implement changes. Patients’ or carers’ views and involvement should be sought at all stages of developing and making improvements (MDT, Medical and Clinical Directors).
NELA REPORT 2016 | 109
19 GLOSSARYAAA Age Anaesthesia Association
AAGBI Association of Anaesthetists of Great Britain and Ireland
Abdomen/Abdominal Anatomical area between chest and pelvis, which contains numerous organs including the bowel
Adhesiolysis Surgical procedure to remove intra-abdominal adhesions that often cause bowel obstruction
Anastomotic Leak Leak from a join in the bowel
APP Association for Perioperative Practice
ASA American Society of Anesthesiologists Physical Status score (ASA-PS)
ASGBI Association of Surgeons of Great Britain and Ireland
Average A number to describe a series of observations. Depending on the pattern of these observations, the median/or mean will better describe the series
BGS British Geriatric Society
Bowel Part of the continuous tube starting at the mouth and finishing at the anus. It includes the stomach, small intestine, large intestine and rectum
CEU Clinical Effectiveness Unit of the Royal College of Surgeons of England
Colitis Inflammation of the colon
Colon Part of the large intestine
Colorectal Resection Surgical procedure to remove part of the bowel
Colostomy Surgical procedure to divert one end of the large intestine (colon) through an opening in the abdominal wall (tummy). A colostomy bag is used to collect bowel contents
CQUIN Commissioning for Quality and Innovation. A system of linking healthcare providers' income to achievement of local quality improvement goals
CRG Clinical Reference Group. Consists of representatives from partner organisations, stakeholders and patients, acting in an advisory capacity to the NELA Project Team
CT Computed tomography – a very advanced form of X-ray used in diagnosis and treatment
EGS Emergency General Surgery. Often refers to the group of patients admitted to hospital with conditions that require the expertise of General Surgeons. 10% require emergency bowel surgery
Elective In this Report, refers to both the mode of hospital admission and to urgency of surgery. The timing of elective care can usually be planned to suit both patient and hospital (can be weeks to months). In contrast, urgent/ emergency care usually has to take place within very short timescales (hours)
ELN Emergency Laparotomy Network
Emergency laparotomy Bowel surgery that, due to underlying conditions, must be carried out without undue delay
FICM Faculty of Intensive Care Medicine
GCS/Glasgow Coma Scale An assessment tool which is used to objectively measure a patient’s conscious state
Hartmann’s Procedure Surgical procedure to remove part of the large bowel resulting in the formation of an end colostomy, and leaving part of the rectum in-situ
HES Hospital Episode Statistics
HQIP Healthcare Quality Improvement Partnership
HSRC Health Services Research Centre
ICNARC Intensive Care National Audit and Research Centre
ICS Intensive Care Society
110 | NELA REPORT 2016
Ileostomy Surgical procedure to divert one end (or two ends in a loop colostomy) of the small intestine (small bowel) through an opening in the abdomen (tummy). An ileostomy bag is used to collect bowel contents
Intestine Part of the bowel
Intra-abdominal Inside the abdomen/tummy
Intraoperative During surgery
IQR Interquartile range – the middle 50% of observations either side of the median
Ischaemia Loss of, or insufficient blood supply to an affected area or organ
Laparoscopic Keyhole surgery
MDT Multidisciplinary team
Mean Mathematical average
Median Midpoint of all observations when ranked in order from smallest to largest (see average)
NCEPOD National Confidential Enquiry into Patient Outcome and Deaths
NELA National Emergency Laparotomy Audit
NIAA National Institute of Academic Anaesthesia
Non-operative Treatment options that do not require surgery
Obstruction Blockage of the bowel. It can be caused by a variety of conditions and can cause the bowel to burst (perforate). It has the potential to make people very unwell and can be life threatening
ONS Office for National Statistics
PEDW Patient Episode Database of Wales
Perforation One or more holes in the wall of the bowel. It can be caused by a variety of conditions. It has the potential to make people very unwell very quickly and can be life threatening
Perioperative Around the time of surgery (incorporating preoperative, intraoperative and postoperative)
Peritonitis Infection or inflammation within the abdomen, causing severe pain. It has the potential to make people very unwell very quickly and can be life threatening
Postoperative After surgery
P-POSSUM A tool which has been validated for estimating an individual patient’s risk of death within 30 days of emergency General Surgery.10
Preoperative Before surgery
Radiological imaging Diagnostic techniques including X-ray and CT
RCN Royal College of Nursing
RCoA Royal College of Anaesthetists
RCR Royal College of Radiologists
RCS Royal College of Surgeons of England
Rectum The final section of the large intestine
Sepsis Widespread, severe inflammation in the body resulting from infection
SIRS Systemic Inflammatory Response Syndrome
Small Bowel Resection Surgical procedure to remove part of the small bowel (small intestine)
Stoma Surgical opening in the abdominal wall for the bowel to terminate. See also colostomy and ileostomy
Subtotal Colectomy Surgical procedure to remove part of the large bowel except the very lowest part or ‘rectum’ of the large bowel
NELA REPORT 2016 | 111
20 REFERENCES1 Symons NR et al. Mortality in high-risk emergency general surgical admissions. Br J Surg 2013;100(10):1318–1325.
2 Shapter SL, Paul MJ, White SM. Incidence and estimated annual cost of emergency laparotomy in England: is there a major funding shortfall? Anaesth 2012;67(5):474–478.
3 Saunders DI et al. Variations in mortality after emergency laparotomy: the first report of the UK emergency laparotomy network. Br J Anaesth 2012;109(3):368–375.
4 Vester-Andersen M et al. Mortality and postoperative care pathways after emergency gastrointestinal surgery in 2904 patients: a population-based cohort study. Br J Anaesth 2014;112(5):860–870.
5 Al-Temimi MH et al. When is death inevitable after emergency laparotomy? Analysis of the American College of Surgeons national surgical quality improvement program database. J Am Coll Surg 2012;215(4):503–511.
6 Ingraham AM et al. Comparison of hospital performance in non-emergency versus emergency colorectal operations at 142 hospitals. J Am Coll Surg 2010;210(2):155–165.
7 Pearse RM et al. Mortality after surgery in Europe: a 7-day cohort study. Lancet 2012;380(9847):1059–1065.
8 Donabedian A. Evaluating the quality of medical care. Milbank Mem Fund Q 1966;44(3):166–206.
9 First organisational report of the National Emergency Laparotomy Audit. NELA Project Team. NELA, London 2014 (www.nela.org.uk/reports).
10 Prytherch DR et al. POSSUM and Portsmouth POSSUM for predicting mortality. Br J Surg 1998;85(9):1217–1220.
11 McFarlane HJ et al. The Scottish Audit of Surgical Mortality: a review of areas of concern related to anaesthesia over 10 years. Anaesth 2009;64(12):1324–1331.
12 Briggs RK et al. Provisional reporting of polytrauma CT by on-call radiology registrars. Is it safe? Clin Radiol 2010;65(8):616–622.
13 Hillier JC, Tattersall DJ, Gleeson FV. Trainee reporting of computer tomography examinations: do they make mistakes and does it matter? Clin Radiol 2004;59(2):159–162.
14 Standards of practice and guidance for trauma radiology in severely injured patients: Second Edition. RCR, London 2015 (www.rcr.ac.uk/sites/default/files/publication/bfcr155_traumaradiol.pdf)
15 Oliver CM et al. Risk assessment tools validated for patients undergoing emergency laparotomy: a systematic review. Br J Anaesth 2015;115(6):849–860.
16 Copeland GP, Jones D, Walters M. POSSUM: a scoring system for surgical audit. Br J Surg 1991;78(3):355–360.
17 Kumar A et al. Duration of hypotension before initiation of effective antimicrobial therapy is the critical determinant of survival in human septic shock. Crit Care Med 2006;34(6):1589–1596.
18 Buck DL, Vester-Andersen M, Møller MH. Surgical delay is a critical determinant of survival in performated peptic ulcer. Br J Surg 2013;100(8):1045–1049.
19 International Guidelines for Management of Severe Sepsis and Septic Shock. Surviving Sepsis Campaign, London 2012 (www.sccm.org/Documents/SSC-Guidelines.pdf).
20 Anderson I, Krysztopik R, Cripps N. Emergency General Surgery Survey. ASGBI, London 2010 (www.asgbi.org.uk/en/members/asgbi_surveys.cfm).
21 NHS Services 7 Days a Week Forum. Evidence base and clinical standards for the care and onward transfer of acute patients. NHSE, London 2013 (www.england.nhs.uk/wp-content/uploads/2013/12/evidence-base.pdf).
22 Who operates when? II. NCEPOD, London 2003 (www.ncepod.org.uk/2003report/Downloads/03full.pdf).
23 Bell D et al. Consultant Input in Acute Medical Admissions and Patient Outcomes in Hospitals in England: A Multivariate Analysis. Plos One 2013;8(4):e61476.
24 Grocott MP et al. Perioperative increase in global blood flow to explicit defined goals and outcomes after surgery: a Cochrane systematic review. Br J Anaesth 2013;111(4):535–548.

112 | NELA REPORT 2016
25 Guidelines for the Provision of Intensive Care services. Faculty for Intensive Care Medicine and Intensive Care Society. FICM, London 2015 (www.ficm.ac.uk/sites/default/files/GPICS%20-%20Ed.1%20(2015).pdf).
26 Pearse RM et al. Identification and characterisation of the high-risk surgical population in the United Kingdom. Crit Care 2006;10(3):R81 doi:10.1186/cc4928.
27 Barnett K et al. Epidemiology of multimorbidity and implications for health care, research, and medical education: a cross-sectional study. Lancet 2012;380(9836):37–43.
28 Ingraham AM et al. Variation in quality of care after emergency general surgery procedures in the elderly. J Am Coll Surg 2011;212(6):1039–1048.
29 Audits of Surgical Mortality Overview. RASC, Australia (www.surgeons.org/for-health-professionals/audits-and-surgical-research/anzasm/#national_report).
30 The Dr Foster global comparitors study (www.drfoster.com/tools/global-comparators).
31 National Surgical Quality Improvement Programme (ACS NSQIP). ACS, USA (www.facs.org/quality-programs/acs-nsqip).
32 Howes TE et al. Postoperative morbidity survey, mortality and length of stay following emergency laparotomy. Anaesth 2015;70(9):1020–1027.
33 The first patient report of the National Emergency Laparotomy Audit. NELA Project Team. NELA, London 2015 (www.nela.org.uk/reports).
34 Pearse RM et al. Study Protocol – Enhanced Perioperative Care for High-risk patients (EPOCH) Trial: A stepped wedge cluster randomised trial of a quality improvement intervention for patients undergoing emergency laparotomy, 2014 (www.epochtrial.org/docs/EPOCH Protocol revision V2 0 280414.pdf).
35 Huddart S et al. Use of a pathway quality improvement care bundle to reduce mortality after emergency laparotomy. Br J Surg 2015;102(1):57–66.
36 NHS Hospital Stay. DH, London 2015 (https://data.gov.uk/data-request/nhs-hospital-stay).
37 Peden CJ, Moonesinghe SR. Measurement for improvement in anaesthesia and intensive care. Br J Anaesth 2016 (doi:10.1093/bja/aew105).
38 Perla RJ, Provost LP, Murray SK. The run chart: a simple analytical tool for learning from variation in healthcare processes. BMJ Qual Saf 2011;20(1):46–51.
39 Dhesi J. Setting up a proactive service to make surgery safer for older people. The Health Foundation, London 2013.
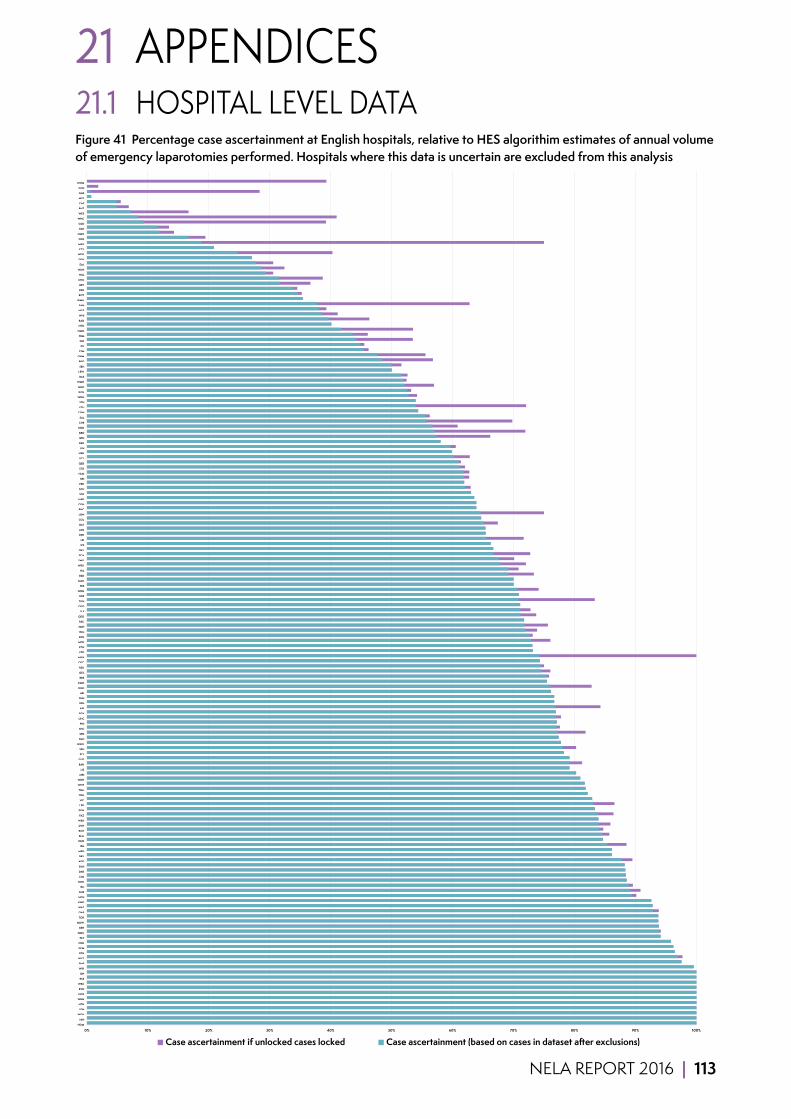
NELA REPORT 2016 | 113
21 APPENDICES21.1 HOSPITAL LEVEL DATAFigure 41 Percentage case ascertainment at English hospitals, relative to HES algorithim estimates of annual volume of emergency laparotomies performed. Hospitals where this data is uncertain are excluded from this analysis
0% 10% 20% 30% 40% 50% 60% 70% 80% 90% 100%
HOM
HIN
WGH
LDH
NTH
WHH
NCR
RVN
WRC
RSS
SJH
WIR
PMS
WYT
BTH
SCM
CHR
PET
QMC
EBH
MDW
TOR
QAP
WAT
KNG
HCH
RUS
RLI
NHH
CMI
DAR
SUN
ADD
DRY
MPH
JPH
QHR
BLA
RCH
DVH
WSH
FAZ
PGH
LER
VIC
YDH
TGA
WHT
WDH
MRI
LIS
BAR
GLO
PLY
SPH
WAW
FGH
SPD
SHC
PIN
UHC
SGH
AIR
RFH
SHH
AEI
KGH
KMH
RBE
QEL
RSU
COC
MKH
YEO
KTH
MIW
BOL
RLU
SMH
RSC
QEG
SLF
QEQ
TUN
RDE
WRG
FRE
MAC
BED
HIL
WEX
SMV
SCA
QKL
IPS
LEI
RPH
LEG
BAT
COL
LON
RHC
CGH
HAR
STR
SCU
FRR
BRI
HUD
STD
QEB
UCL
NPH
LIN
DER
BFH
BRD
NDD
CHE
SAL
CON
ESU
STH
WDG
KCH
GGH
WMH
BAS
LEW
SEH
BRO
OHM
STM
PIL
DID
FRM
NMG
NTG
RAD
WHI
NGS
SAN
WMU
ROT
RSH
BRT
CHX
HUL
NUN
EAL
DDH
NOR
CTY
MAY
CKH
NMH
PAH
GEO
WHC
WES
BNT
CAS
MST
GHS
CCH
NWG
Case ascertainment if unlocked cases locked Case ascertainment (based on cases in dataset after exclusions)

114 | NELA REPORT 2016
Figure 42 Proportion of submitted cases that were excluded due to ineligibility of surgical procedure(s) performed by hospital
0 5% 10% 15% 20% 25%
PAP
FRR
HOM
WDH
NMH
EAL
LIN
FGH
POW
RFH
JPH
SEH
PIN
DID
DVH
SPH
ESU
LER
BAS
BAR
MOR
SHC
UHC
STM
NTG
NUN
BRD
WAT
GWE
WMU
AEI
GWY
FAZ
MRI
WHI
BRO
GEO
LIS
RSU
WHT
LEW
NGS
DER
QEB
HIL
RVN
CHE
MAR
STD
STH
NTH
MKH
SAN
TUN
BFH
STR
MDW
NPH
CHX
SAL
UHW
SHH
SMV
AIR
WGH
NHH
WYB
CGH
KGH
QAP
BOL
SLF
PET
PGH
SGH
RCH
PIL
WRX
BRI
BLA
TOR
QEL
SMH
CON
QHR
DDH
RAD
KCH
YDH
PLY
HIN
WAW
HUD
RLI
EBH
SCA
NOR
SUN
RBE
WIR
MPH
WSH
VIC
NMG
CMI
BRG
PMS
KNG
LEG
OHM
WRC
DRY
DAR
TGA
BTH
RSH
HCH
WYT
NDD
MIW
RUS
QEG
HUL
GGH
PCH
KMH
YEO
IPS
WRG
SJH
NSH
FRE
MAC
NCR
GLO
FRM
RGH
LDH
UCL
RDE
RSS
COC
CLW
KTH
WEX
GLG
LEI
SCM
ADD
RPH
COL
RLU
WHH
RSC
GHS
MST
PRS
WLT
HHX
BMP
CKH
WES
CAS
BNT
WHC
LHC
CTY
PAH
CHR
NOT
MAY
BRT
ROT
HAR
SCU
BED
NEV
RHC
SPD
QKL
WMH
WDG
LON
QEQ
BAT
QMC
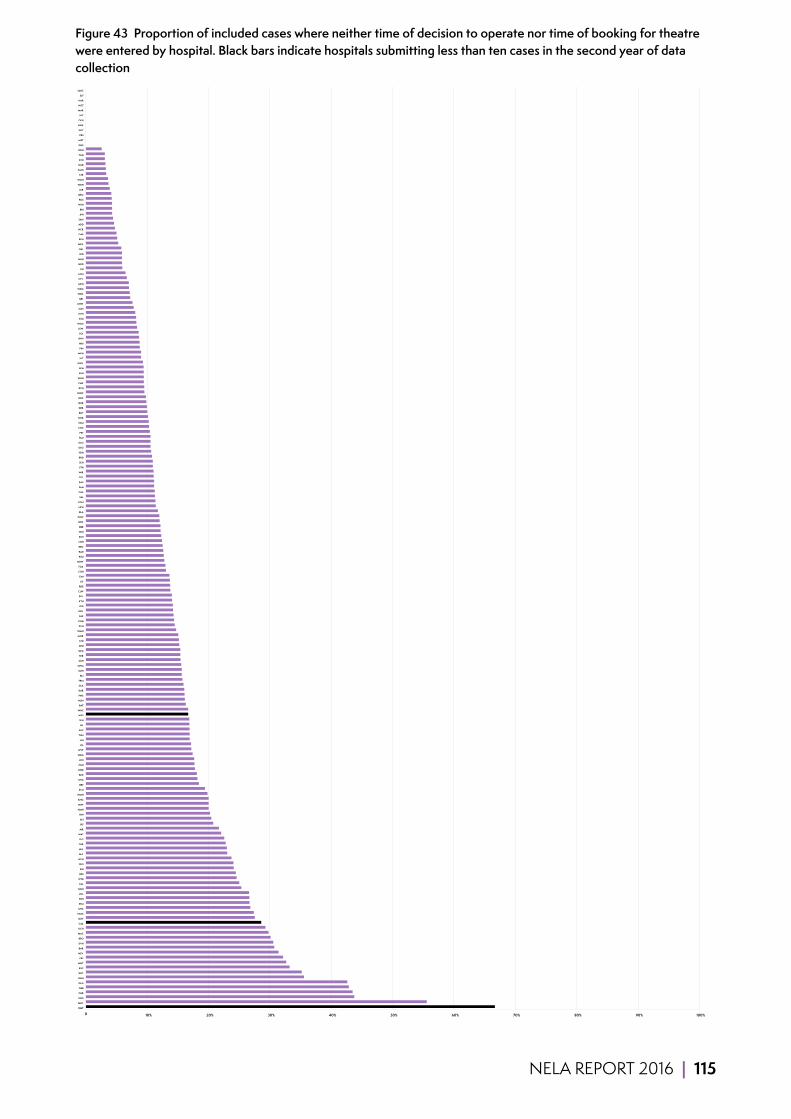
NELA REPORT 2016 | 115
Figure 43 Proportion of included cases where neither time of decision to operate nor time of booking for theatre were entered by hospital. Black bars indicate hospitals submitting less than ten cases in the second year of data collection
0 10% 20% 30% 40% 50% 60% 70% 80% 90% 100%
BMP
MAY
NGS
CHR
QEB
GLG
RGH
ROT
RSC
WHT
FRE
NEV
BAR
DVH
BRO
MAC
KCH
CAS
SMV
NMG
UHC
STM
EBH
UCL
GGH
EAL
WYB
RSS
SJH
YEO
HCH
FAZ
HUL
TOR
LEG
WAT
AIR
IPS
AEI
HIN
NMH
MIW
KNG
WMH
SCU
BRT
NTG
BED
GWE
PGH
LDH
WRG
WYT
PIL
LIN
TUN
SHC
HIL
SPH
WES
WHC
BAT
NUN
PMS
DAR
SCA
FRM
RLI
SMH
OHM
SGH
FRR
QEG
RFH
STD
MOR
WMU
PCH
KGH
PAP
DRY
DID
KTH
BOL
CLW
RDE
LIS
CMI
CGH
TGA
MDW
RSU
RAD
BRG
NSH
RSH
WHI
RBE
WRC
POW
BLA
NPH
CON
SAL
CHE
PAH
BAS
COL
WIR
STH
SEH
BRD
YDH
GEO
GLO
RLU
PET
COC
SCM
NOR
BNT
DER
QHR
RHC
WAW
RCH
CHX
WHH
SHH
BFH
GWY
VIC
MKH
PIN
MRI
RVN
PLY
LEW
HOM
ESU
NTH
SUN
UHW
QEL
WRX
WDG
MPH
CTY
LON
LEI
NDD
NHH
SPD
QKL
WEX
RPH
QAP
NCR
ADD
SAN
JPH
BRI
WSH
RUS
QEQ
LER
WDH
WGH
STR
KMH
HUD
BTH
FGH
DDH
GHS
MST
PRS
WLT
HHX
CKH
LHC
MAR
NOT
HAR
SLF
QMC
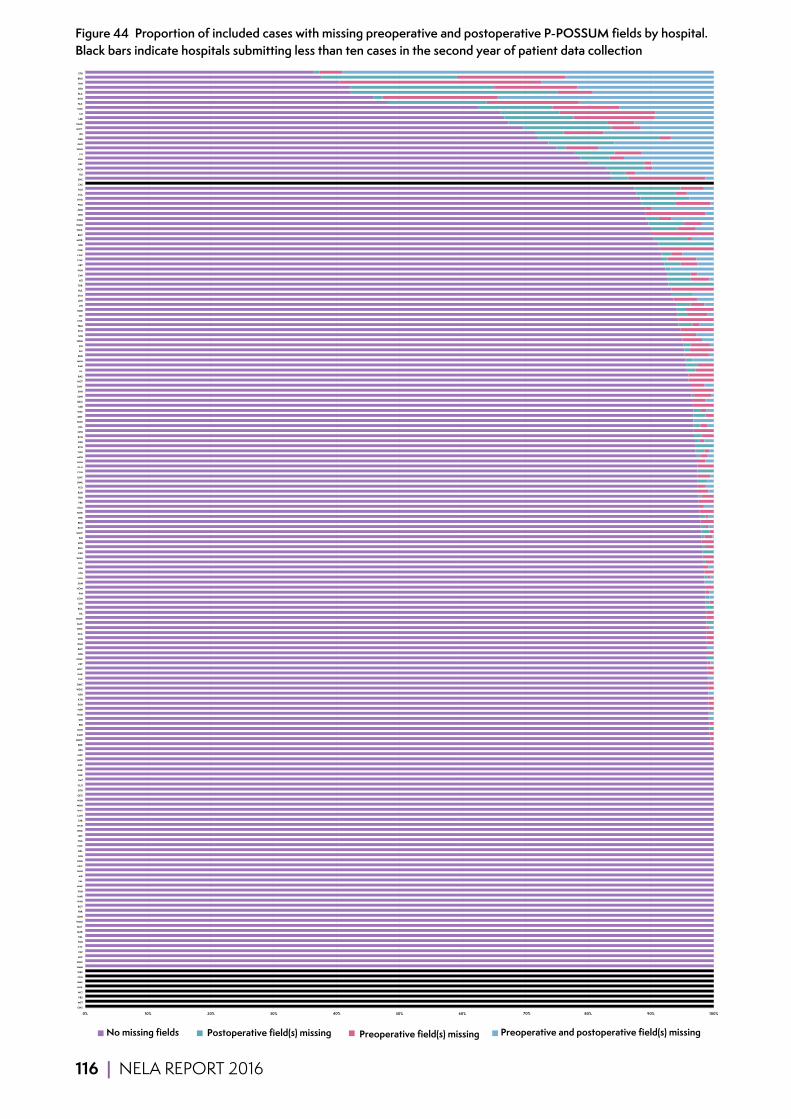
116 | NELA REPORT 2016
Figure 44 Proportion of included cases with missing preoperative and postoperative P-POSSUM fields by hospital. Black bars indicate hospitals submitting less than ten cases in the second year of patient data collection
0% 10% 20% 30% 50% 60% 80% 90% 100% GHS
MST
PRS
WLT
HHX
BMP
CKH
WES
NMH
WHC
LHC
PAP
CTY
PAH
EAL
MAR
MAY
WMU
DDH
FRR
ROT
WYB
HAR
FGH
MIW
SAL
AIR
NHH
NEV
KNG
LEG
QKL
COC
TGA
QEL
WEX
HCH
STR
LON
WYT
WDH
WSH
QEG
BTH
GLO
BAT
DER
QHR
RSC
NCR
QAP
RSS
RDE
MDW
KMH
KGH
BRI
DID
HUD
NSH
SGH
KTH
RSH
WDG
QMC
CHE
DAR
WHT
PET
POW
RFH
RHC
RGH
SUN
SCA
WRC
MAC
WAW
HIL
BOL
SEH
CON
PIN
HOM
SAN
NTH
STD
BFH
PLY
WGH
ESU
RUS
RPH
SJH
UHW
RCH
BRG
WIR
NOR
SCM
FRE
YDH
RAD
YEO
GWE
UHC
CGH
GLG
GGH
MPH
TUN
SCU
RSU
RVN
NPH
UCL
NUN
DRY
WAT
MRI
QEQ
SMH
SHH
SMV
NOT
BAS
PIL
BAR
MKH
BRD
SLF
JPH
WRG
SPH
PCH
FRM
CHX
VIC
NDD
LIN
LDH
STM
HUL
TOR
AEI
CMI
PGH
BRT
CLW
LEW
CHR
SPD
MOR
BNT
WRX
WMH
OHM
WHI
ADD
PMS
NTG
COL
RLU
CAS
SHC
RLI
KCH
RBE
EBH
LIS
WHH
GEO
QEB
IPS
GWY
NMG
LER
LEI
NGS
FAZ
DVH
BLA
BED
HIN
BRO
STH
No missing fields
40%
Postoperative field(s) missing Preoperative field(s) missing
70%
Preoperative and postoperative field(s) missing 0% 10% 20% 30% 50% 60% 80% 90% 100%
GHS
MST
PRS
WLT
HHX
BMP
CKH
WES
NMH
WHC
LHC
PAP
CTY
PAH
EAL
MAR
MAY
WMU
DDH
FRR
ROT
WYB
HAR
FGH
MIW
SAL
AIR
NHH
NEV
KNG
LEG
QKL
COC
TGA
QEL
WEX
HCH
STR
LON
WYT
WDH
WSH
QEG
BTH
GLO
BAT
DER
QHR
RSC
NCR
QAP
RSS
RDE
MDW
KMH
KGH
BRI
DID
HUD
NSH
SGH
KTH
RSH
WDG
QMC
CHE
DAR
WHT
PET
POW
RFH
RHC
RGH
SUN
SCA
WRC
MAC
WAW
HIL
BOL
SEH
CON
PIN
HOM
SAN
NTH
STD
BFH
PLY
WGH
ESU
RUS
RPH
SJH
UHW
RCH
BRG
WIR
NOR
SCM
FRE
YDH
RAD
YEO
GWE
UHC
CGH
GLG
GGH
MPH
TUN
SCU
RSU
RVN
NPH
UCL
NUN
DRY
WAT
MRI
QEQ
SMH
SHH
SMV
NOT
BAS
PIL
BAR
MKH
BRD
SLF
JPH
WRG
SPH
PCH
FRM
CHX
VIC
NDD
LIN
LDH
STM
HUL
TOR
AEI
CMI
PGH
BRT
CLW
LEW
CHR
SPD
MOR
BNT
WRX
WMH
OHM
WHI
ADD
PMS
NTG
COL
RLU
CAS
SHC
RLI
KCH
RBE
EBH
LIS
WHH
GEO
QEB
IPS
GWY
NMG
LER
LEI
NGS
FAZ
DVH
BLA
BED
HIN
BRO
STH
No missing fields
40%
Postoperative field(s) missing Preoperative field(s) missing
70%
Preoperative and postoperative field(s) missing
0% 10% 20% 30% 50% 60% 80% 90% 100% GHS
MST
PRS
WLT
HHX
BMP
CKH
WES
NMH
WHC
LHC
PAP
CTY
PAH
EAL
MAR
MAY
WMU
DDH
FRR
ROT
WYB
HAR
FGH
MIW
SAL
AIR
NHH
NEV
KNG
LEG
QKL
COC
TGA
QEL
WEX
HCH
STR
LON
WYT
WDH
WSH
QEG
BTH
GLO
BAT
DER
QHR
RSC
NCR
QAP
RSS
RDE
MDW
KMH
KGH
BRI
DID
HUD
NSH
SGH
KTH
RSH
WDG
QMC
CHE
DAR
WHT
PET
POW
RFH
RHC
RGH
SUN
SCA
WRC
MAC
WAW
HIL
BOL
SEH
CON
PIN
HOM
SAN
NTH
STD
BFH
PLY
WGH
ESU
RUS
RPH
SJH
UHW
RCH
BRG
WIR
NOR
SCM
FRE
YDH
RAD
YEO
GWE
UHC
CGH
GLG
GGH
MPH
TUN
SCU
RSU
RVN
NPH
UCL
NUN
DRY
WAT
MRI
QEQ
SMH
SHH
SMV
NOT
BAS
PIL
BAR
MKH
BRD
SLF
JPH
WRG
SPH
PCH
FRM
CHX
VIC
NDD
LIN
LDH
STM
HUL
TOR
AEI
CMI
PGH
BRT
CLW
LEW
CHR
SPD
MOR
BNT
WRX
WMH
OHM
WHI
ADD
PMS
NTG
COL
RLU
CAS
SHC
RLI
KCH
RBE
EBH
LIS
WHH
GEO
QEB
IPS
GWY
NMG
LER
LEI
NGS
FAZ
DVH
BLA
BED
HIN
BRO
STH
No missing fields
40%
Postoperative field(s) missing Preoperative field(s) missing
70%
Preoperative and postoperative field(s) missing
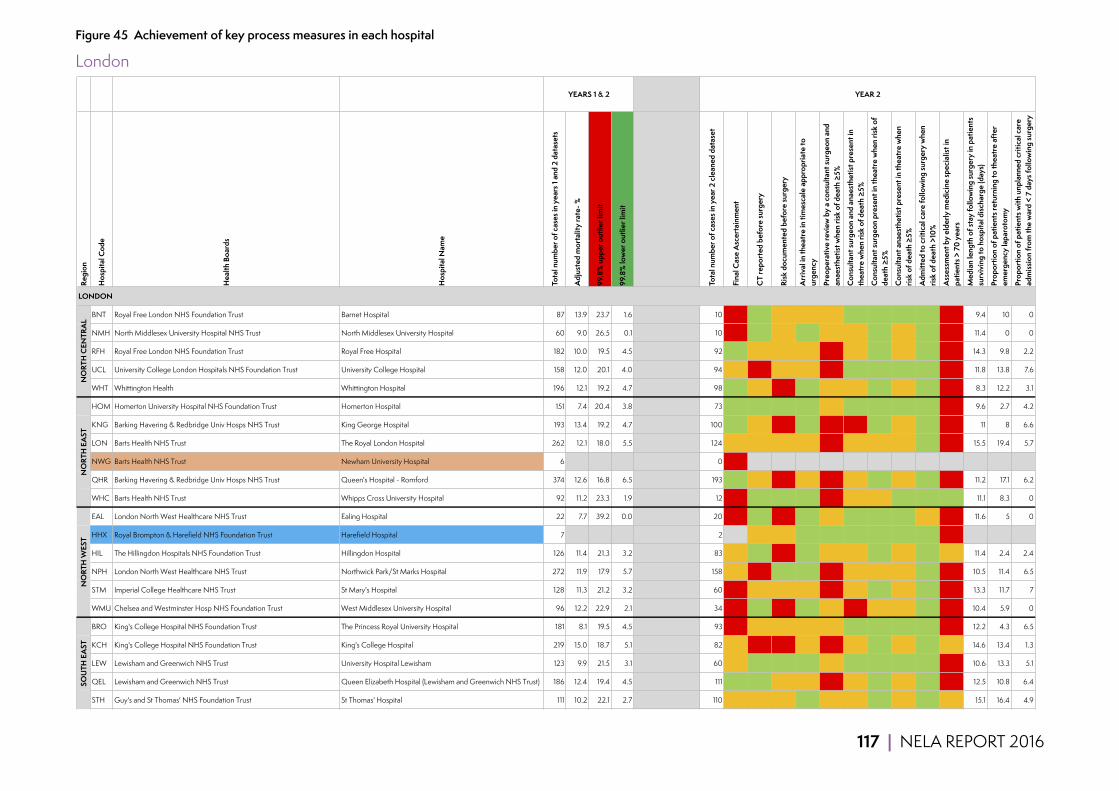
117 | NELA REPORT 2016
Figure 45 Achievement of key process measures in each hospital
LondonRe
gion
Hos
pita
l Cod
e
Hea
lth B
oard
s
Hos
pita
l Nam
e
Tota
l num
ber o
f cas
es in
yea
rs 1
and
2 da
tase
ts
Adj
uste
d m
orta
lity
rate
- %
99.8
% u
pper
out
lier l
imit
99.8
% lo
wer
out
lier l
imit
Tota
l num
ber o
f cas
es in
yea
r 2 c
lean
ed d
atas
et
Fina
l Cas
e A
scer
tain
men
t
CT
repo
rted
bef
ore
surg
ery
Risk
doc
umen
ted
befo
re su
rger
y
Arr
ival
in th
eatr
e in
tim
esca
le a
ppro
pria
te to
ur
genc
y
Preo
pera
tive
revi
ew b
y a
cons
ulta
nt su
rgeo
n an
d an
aest
hetis
t whe
n ris
k of
dea
th ≥
5%
Con
sulta
nt su
rgeo
n an
d an
aest
hetis
t pre
sent
in
thea
tre
whe
n ris
k of
dea
th ≥
5%
Con
sulta
nt su
rgeo
n pr
esen
t in
thea
tre
whe
n ris
k of
de
ath
≥5%
Con
sulta
nt a
naes
thet
ist p
rese
nt in
thea
tre
whe
n ris
k of
dea
th ≥
5%
Adm
itted
to c
ritic
al c
are
follo
win
g su
rger
y w
hen
risk
of d
eath
>10
%
Ass
essm
ent b
y el
derly
med
icin
e sp
ecia
list i
n pa
tient
s > 7
0 ye
ars
Med
ian
leng
th o
f sta
y fo
llow
ing
surg
ery
in p
atie
nts
surv
ivin
g to
hos
pita
l disc
harg
e (d
ays)
Prop
ortio
n of
pat
ient
s ret
urni
ng to
thea
tre
afte
r em
erge
ncy
lapa
roto
my
Prop
ortio
n of
pat
ient
s with
unp
lann
ed c
ritic
al c
are
adm
issio
n fr
om th
e w
ard
< 7
days
follo
win
g su
rger
y
BNT Royal Free London NHS Foundation Trust Barnet Hospital 87 13.9 23.7 1.6 10 5 80 70 78 50 100 100 100 100 0 9.4 10 0
NMH North Middlesex University Hospital NHS Trust North Middlesex University Hospital 60 9.0 26.5 0.1 10 12 90 50 88 60 60 80 60 83 0 11.4 0 0
RFH Royal Free London NHS Foundation Trust Royal Free Hospital 182 10.0 19.5 4.5 92 77 76 62 70 31 60 100 60 81 14 14.3 9.8 2.2
UCL University College London Hospitals NHS Foundation Trust University College Hospital 158 12.0 20.1 4.0 94 60 47 52 72 29 82 94 82 100 19 11.8 13.8 7.6
WHT Whittington Health Whittington Hospital 196 12.1 19.2 4.7 98 82 60 43 90 53 75 94 76 90 37 8.3 12.2 3.1
HOM Homerton University Hospital NHS Foundation Trust Homerton Hospital 151 7.4 20.4 3.8 73 101 84 89 87 75 91 94 97 94 48 9.6 2.7 4.2
KNG Barking Havering & Redbridge Univ Hosps NHS Trust King George Hospital 193 13.4 19.2 4.7 100 93 61 21 80 20 46 88 53 86 0 11 8 6.6
LON Barts Health NHS Trust The Royal London Hospital 262 12.1 18.0 5.5 124 65 70 56 60 37 57 74 73 91 13 15.5 19.4 5.7
NWG Barts Health NHS Trust Newham University Hospital 6 0 0
QHR Barking Havering & Redbridge Univ Hosps NHS Trust Queen's Hospital - Romford 374 12.6 16.8 6.5 193 85 72 41 76 41 57 98 58 86 0 11.2 17.1 6.2
WHC Barts Health NHS Trust Whipps Cross University Hospital 92 11.2 23.3 1.9 12 8 92 83 80 33 50 50 100 100 100 11.1 8.3 0
EAL London North West Healthcare NHS Trust Ealing Hospital 22 7.7 39.2 0.0 20 28 90 30 86 73 100 100 100 71 0 11.6 5 0
HHX Royal Brompton & Harefield NHS Foundation Trust Harefield Hospital 7 2 40 50 50 100 100 100 100 100 100 0
HIL The Hillingdon Hospitals NHS Foundation Trust Hillingdon Hospital 126 11.4 21.3 3.2 83 69 84 45 85 59 59 94 61 81 63 11.4 2.4 2.4
NPH London North West Healthcare NHS Trust Northwick Park/St Marks Hospital 272 11.9 17.9 5.7 158 60 45 82 80 46 53 76 62 100 10 10.5 11.4 6.5
STM Imperial College Healthcare NHS Trust St Mary's Hospital 128 11.3 21.2 3.2 60 45 52 58 76 32 59 94 59 100 48 13.3 11.7 7
WMU Chelsea and Westminster Hosp NHS Foundation Trust West Middlesex University Hospital 96 12.2 22.9 2.1 34 35 91 47 95 62 43 71 67 100 0 10.4 5.9 0
BRO King's College Hospital NHS Foundation Trust The Princess Royal University Hospital 181 8.1 19.5 4.5 93 48 56 65 79 79 83 96 87 84 0 12.2 4.3 6.5
KCH King's College Hospital NHS Foundation Trust King's College Hospital 219 15.0 18.7 5.1 82 53 48 41 68 47 65 96 65 88 50 14.6 13.4 1.3
LEW Lewisham and Greenwich NHS Trust University Hospital Lewisham 123 9.9 21.5 3.1 60 50 80 92 90 55 85 100 85 96 9 10.6 13.3 5.1
QEL Lewisham and Greenwich NHS Trust Queen Elizabeth Hospital (Lewisham and Greenwich NHS Trust) 186 12.4 19.4 4.5 111 74 86 55 66 47 69 89 75 84 5 12.5 10.8 6.4
STH Guy's and St Thomas' NHS Foundation Trust St Thomas' Hospital 111 10.2 22.1 2.7 110 54 71 53 81 53 70 86 75 94 57 15.1 16.4 4.9
LONDON
YEARS 1 & 2 YEAR 2N
ORT
H C
ENTR
AL
NO
RTH
EA
STN
ORT
H W
EST
SOU
TH E
AST
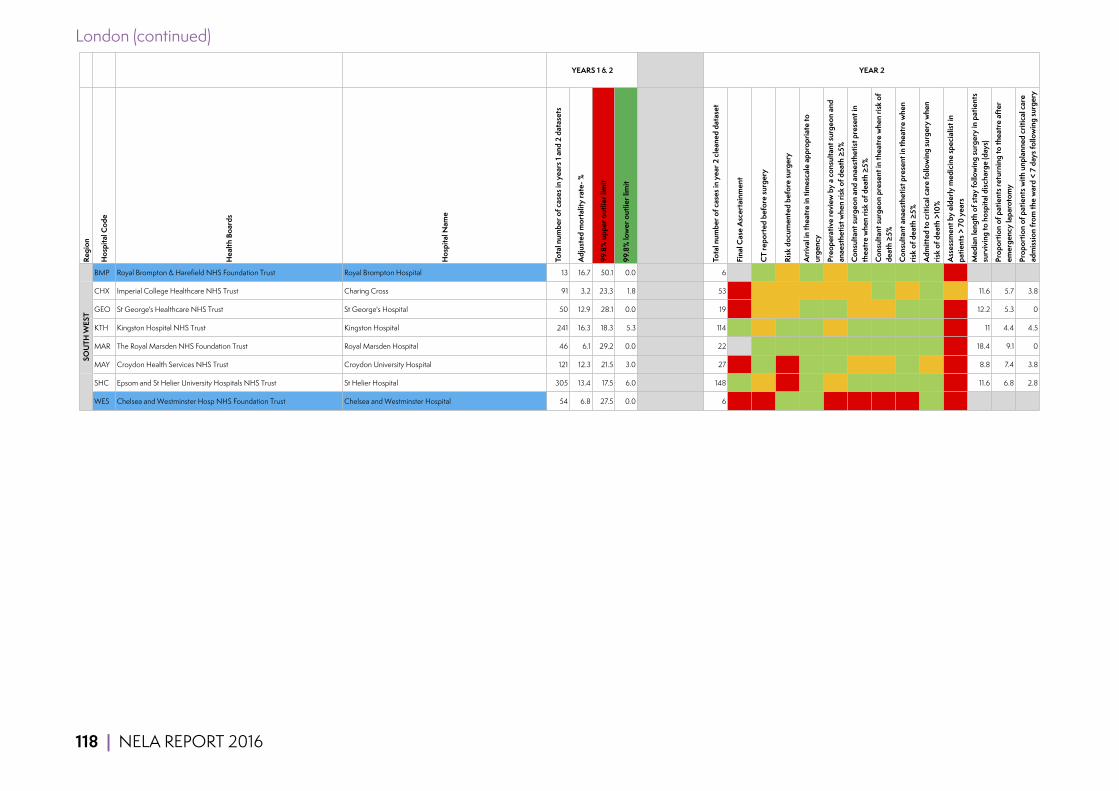
118 | NELA REPORT 2016
London (continued)
Regi
on
Hos
pita
l Cod
e
Hea
lth B
oard
s
Hos
pita
l Nam
e
Tota
l num
ber o
f cas
es in
yea
rs 1
and
2 da
tase
ts
Adj
uste
d m
orta
lity
rate
- %
99.8
% u
pper
out
lier l
imit
99.8
% lo
wer
out
lier l
imit
Tota
l num
ber o
f cas
es in
yea
r 2 c
lean
ed d
atas
et
Fina
l Cas
e A
scer
tain
men
t
CT
repo
rted
bef
ore
surg
ery
Risk
doc
umen
ted
befo
re su
rger
y
Arr
ival
in th
eatr
e in
tim
esca
le a
ppro
pria
te to
ur
genc
y
Preo
pera
tive
revi
ew b
y a
cons
ulta
nt su
rgeo
n an
d an
aest
hetis
t whe
n ris
k of
dea
th ≥
5%
Con
sulta
nt su
rgeo
n an
d an
aest
hetis
t pre
sent
in
thea
tre
whe
n ris
k of
dea
th ≥
5%
Con
sulta
nt su
rgeo
n pr
esen
t in
thea
tre
whe
n ris
k of
de
ath
≥5%
Con
sulta
nt a
naes
thet
ist p
rese
nt in
thea
tre
whe
n ris
k of
dea
th ≥
5%
Adm
itted
to c
ritic
al c
are
follo
win
g su
rger
y w
hen
risk
of d
eath
>10
%
Ass
essm
ent b
y el
derly
med
icin
e sp
ecia
list i
n pa
tient
s > 7
0 ye
ars
Med
ian
leng
th o
f sta
y fo
llow
ing
surg
ery
in p
atie
nts
surv
ivin
g to
hos
pita
l disc
harg
e (d
ays)
Prop
ortio
n of
pat
ient
s ret
urni
ng to
thea
tre
afte
r em
erge
ncy
lapa
roto
my
Prop
ortio
n of
pat
ient
s with
unp
lann
ed c
ritic
al c
are
adm
issio
n fr
om th
e w
ard
< 7
days
follo
win
g su
rger
y
BMP Royal Brompton & Harefield NHS Foundation Trust Royal Brompton Hospital 13 16.7 50.1 0.0 6 600 100 50 100 50 100 100 100 100 0
CHX Imperial College Healthcare NHS Trust Charing Cross 91 3.2 23.3 1.8 53 32 60 72 78 50 61 100 61 86 63 11.6 5.7 3.8
GEO St George's Healthcare NHS Trust St George's Hospital 50 12.9 28.1 0.0 19 9 74 58 80 88 75 75 100 100 14 12.2 5.3 0
KTH Kingston Hospital NHS Trust Kingston Hospital 241 16.3 18.3 5.3 114 73 77 89 84 70 95 98 97 100 6 11 4.4 4.5
MAR The Royal Marsden NHS Foundation Trust Royal Marsden Hospital 46 6.1 29.2 0.0 22 600 82 100 100 100 100 100 100 100 0 18.4 9.1 0
MAY Croydon Health Services NHS Trust Croydon University Hospital 121 12.3 21.5 3.0 27 19 89 11 100 80 70 70 100 50 25 8.8 7.4 3.8
SHC Epsom and St Helier University Hospitals NHS Trust St Helier Hospital 305 13.4 17.5 6.0 148 77 76 36 92 74 89 98 91 100 7 11.6 6.8 2.8
WES Chelsea and Westminster Hosp NHS Foundation Trust Chelsea and Westminster Hospital 54 6.8 27.5 0.0 6 7 17 83 80 0 0 0 0 100 0
SOU
TH W
EST
YEARS 1 & 2 YEAR 2

119 | NELA REPORT 2016
Central
Regi
on
Hos
pita
l Cod
e
Hea
lth B
oard
s
Hos
pita
l Nam
e
Tota
l num
ber o
f cas
es in
yea
rs 1
and
2 da
tase
ts
Adj
uste
d m
orta
lity
rate
- %
99.8
% u
pper
out
lier l
imit
99.8
% lo
wer
out
lier l
imit
Tota
l num
ber o
f cas
es in
yea
r 2 c
lean
ed d
atas
et
Fina
l Cas
e A
scer
tain
men
t
CT
repo
rted
bef
ore
surg
ery
Risk
doc
umen
ted
befo
re su
rger
y
Arr
ival
in th
eatr
e in
tim
esca
le a
ppro
pria
te to
ur
genc
y
Preo
pera
tive
revi
ew b
y a
cons
ulta
nt su
rgeo
n an
d an
aest
hetis
t whe
n ris
k of
dea
th ≥
5%
Con
sulta
nt su
rgeo
n an
d an
aest
hetis
t pre
sent
in
thea
tre
whe
n ris
k of
dea
th ≥
5%
Con
sulta
nt su
rgeo
n pr
esen
t in
thea
tre
whe
n ris
k of
de
ath
≥5%
Con
sulta
nt a
naes
thet
ist p
rese
nt in
thea
tre
whe
n ris
k of
dea
th ≥
5%
Adm
itted
to c
ritic
al c
are
follo
win
g su
rger
y w
hen
risk
of d
eath
>10
%
Ass
essm
ent b
y el
derly
med
icin
e sp
ecia
list i
n pa
tient
s > 7
0 ye
ars
Med
ian
leng
th o
f sta
y fo
llow
ing
surg
ery
in p
atie
nts
surv
ivin
g to
hos
pita
l disc
harg
e (d
ays)
Prop
ortio
n of
pat
ient
s ret
urni
ng to
thea
tre
afte
r em
erge
ncy
lapa
roto
my
Prop
ortio
n of
pat
ient
s with
unp
lann
ed c
ritic
al c
are
adm
issio
n fr
om th
e w
ard
< 7
days
follo
win
g su
rger
y
CHE Chesterfield Royal Hospital NHS Foundation Trust Chesterfield Royal Hospital 168 15.0 19.9 4.2 107 56 67 50 74 64 79 81 96 100 2 13.3 6.5 3.8
DER Derby Hospitals NHS Foundation Trust Royal Derby Hospital 338 9.0 17.2 6.2 181 58 56 60 82 72 68 96 70 95 10 9.6 7.2 2.2
KGH Kettering General Hospital NHS Foundation Trust Kettering General Hospital 286 11.0 17.7 5.8 146 76 88 62 87 60 67 83 82 85 2 6.8 3.4 0
KMH Sherwood Forest Hospitals NHS Foundation Trust Kings Mill Hospital 288 10.2 17.7 5.8 154 75 84 94 87 75 94 98 95 94 63 8.6 4.5 0.7
LEI University Hospitals of Leicester NHS Trust Leicester General Hospital 168 5.7 19.9 4.2 118 66 72 87 79 54 87 90 90 100 0 9.6 1.7 2.6
LER University Hospitals of Leicester NHS Trust Leicester Royal Infirmary 575 9.7 15.7 7.4 309 83 61 80 80 39 67 97 68 99 10 11.6 3.9 2.6
LIN United Lincolnshire Hospitals NHS Trust Lincoln County Hospital 220 12.4 18.7 5.1 136 60 81 73 90 61 88 89 99 96 0 12.4 12.5 1.5
NOT Nottingham University Hospitals NHS Trust Nottingham City Hospital 25 8.2 36.7 0.0 25 21 52 56 100 14 86 86 91 79 0 14.4 40 17.4
NTH Northampton General Hospital NHS Trust Northampton General Hospital 380 10.6 16.8 6.5 199 104 70 83 85 79 96 97 98 95 16 9.3 5 4.6
NUN George Eliot Hospital NHS Trust George Eliot Hospital 108 10.2 22.2 2.6 31 29 81 61 82 29 79 86 86 86 14 10 3.2 3.2
PIL United Lincolnshire Hospitals NHS Trust Pilgrim Hospital 105 6.8 22.4 2.4 70 45 94 64 94 66 82 98 84 88 6 11.8 5.7 1.5
QMC Nottingham University Hospitals NHS Trust Queens Medical Centre - Nottingham 689 10.7 15.3 7.7 338 94 63 74 86 41 81 94 86 87 6 10.6 16.6 4.1
EAST
MID
LAN
DS
CENTRAL
YEARS 1 & 2 YEAR 2

120 | NELA REPORT 2016
Central (continued)
Regi
on
Hos
pita
l Cod
e
Hea
lth B
oard
s
Hos
pita
l Nam
e
Tota
l num
ber o
f cas
es in
yea
rs 1
and
2 da
tase
ts
Adj
uste
d m
orta
lity
rate
- %
99.8
% u
pper
out
lier l
imit
99.8
% lo
wer
out
lier l
imit
Tota
l num
ber o
f cas
es in
yea
r 2 c
lean
ed d
atas
et
Fina
l Cas
e A
scer
tain
men
t
CT
repo
rted
bef
ore
surg
ery
Risk
doc
umen
ted
befo
re su
rger
y
Arr
ival
in th
eatr
e in
tim
esca
le a
ppro
pria
te to
ur
genc
y
Preo
pera
tive
revi
ew b
y a
cons
ulta
nt su
rgeo
n an
d an
aest
hetis
t whe
n ris
k of
dea
th ≥
5%
Con
sulta
nt su
rgeo
n an
d an
aest
hetis
t pre
sent
in
thea
tre
whe
n ris
k of
dea
th ≥
5%
Con
sulta
nt su
rgeo
n pr
esen
t in
thea
tre
whe
n ris
k of
de
ath
≥5%
Con
sulta
nt a
naes
thet
ist p
rese
nt in
thea
tre
whe
n ris
k of
dea
th ≥
5%
Adm
itted
to c
ritic
al c
are
follo
win
g su
rger
y w
hen
risk
of d
eath
>10
%
Ass
essm
ent b
y el
derly
med
icin
e sp
ecia
list i
n pa
tient
s > 7
0 ye
ars
Med
ian
leng
th o
f sta
y fo
llow
ing
surg
ery
in p
atie
nts
surv
ivin
g to
hos
pita
l disc
harg
e (d
ays)
Prop
ortio
n of
pat
ient
s ret
urni
ng to
thea
tre
afte
r em
erge
ncy
lapa
roto
my
Prop
ortio
n of
pat
ient
s with
unp
lann
ed c
ritic
al c
are
adm
issio
n fr
om th
e w
ard
< 7
days
follo
win
g su
rger
y
ADD Cambridge University Hosps NHS Foundation Trust Addenbrookes Hospital 525 8.7 15.9 7.2 284 88 73 31 74 30 40 94 43 72 12 10.9 10.2 3.2
BAS Basildon and Thurrock University Hospitals NHS Foundation Trust Basildon University Hospital 191 7.4 19.3 4.6 99 52 87 66 86 72 62 85 74 79 26 11.1 9.1 6.1
BED Bedford Hospital NHS Trust Bedford Hospital 174 12.9 19.7 4.3 83 69 81 42 95 33 83 98 85 81 3 10.4 4.8 1.2
BFH Mid Essex Hospital Services NHS Trust Broomfield Hospital 197 15.8 19.1 4.7 117 57 87 85 87 48 78 87 88 97 19 9.5 6.8 6.8
COL Colchester Hospital University NHS Foundation Trust Colchester General Hospital 326 11.5 17.3 6.1 163 65 75 77 86 75 85 94 90 71 3 9.85 12.3 3.2
HIN Hinchingbrooke Health Care NHS Trust Hinchingbrooke Hospital 159 9.7 20.1 4.0 84 100 80 15 84 28 63 96 63 81 3 9.5 7.1 6
IPS Ipswich Hospital NHS Trust Ipswich Hospital 283 8.2 17.7 5.8 159 66 70 81 72 78 92 96 94 85 3 10.4 14.5 4.5
JPH James Paget University Hosps NHS Foundation Trust James Paget University Hospital 352 12.1 17.0 6.3 164 85 77 62 88 66 89 91 98 78 0 9.4 16.5 3.7
LDH Luton and Dunstable Hospital NHS Foundation Trust Luton & Dunstable Hospital 331 12.9 17.2 6.2 187 104 75 36 84 39 79 93 84 91 11 10.2 8 3.9
LIS East and North Hertfordshire NHS Trust Lister Hospital 202 14.9 19.0 4.8 95 79 78 69 77 53 72 98 74 87 13 8.8 5.3 6.7
NOR Norfolk and Norwich University Hospitals NHS Foundation Trust Norfolk and Norwich University Hospital 316 8.9 17.4 6.1 89 25 65 98 77 51 43 65 65 64 6 10.4 6.7 2.3
PAH The Princess Alexandra Hospital NHS Trust Princess Alexandra Hospital 64 20.7 26.0 0.2 18 12 100 61 100 38 63 75 75 100 9 10.1 11.1 5.6
PAP Papworth Hospital NHS Foundation Trust Papworth Hospital 22 11.1 39.2 0.0 14 117 93 50 92 21 79 100 79 100 0 21.1 7.1 18.2
PET Peterborough & Stamford Hosps NHS Foundation Trust Peterborough City Hospital 315 12.1 17.4 6.1 192 94 69 58 87 65 68 70 98 95 18 10.1 10.9 2.6
QKL The Queen Elizabeth Hospital King's Lynn NHS Foundation Trust The Queen Elizabeth Hospital - King's Lynn 215 11.1 18.8 5.0 104 67 83 99 84 50 85 92 92 97 1 10.1 7.7 1
SEH Southend University Hospital NHS Foundation Trust Southend University Hospital 282 16.4 17.7 5.8 156 50 73 75 82 26 66 87 72 88 0 11.4 10.9 2.6
WAT West Hertfordshire Hospitals NHS Trust Watford General Hospital 345 11.4 17.1 6.3 245 93 78 39 82 38 88 91 96 76 11 9.8 15.5 9.2
WSH West Suffolk NHS Foundation Trust West Suffolk Hospital 256 8.7 18.1 5.5 141 84 89 99 78 83 96 96 100 98 5 9.4 10.6 2.9
YEARS 1 & 2 YEAR 2EA
ST O
F EN
GLA
ND
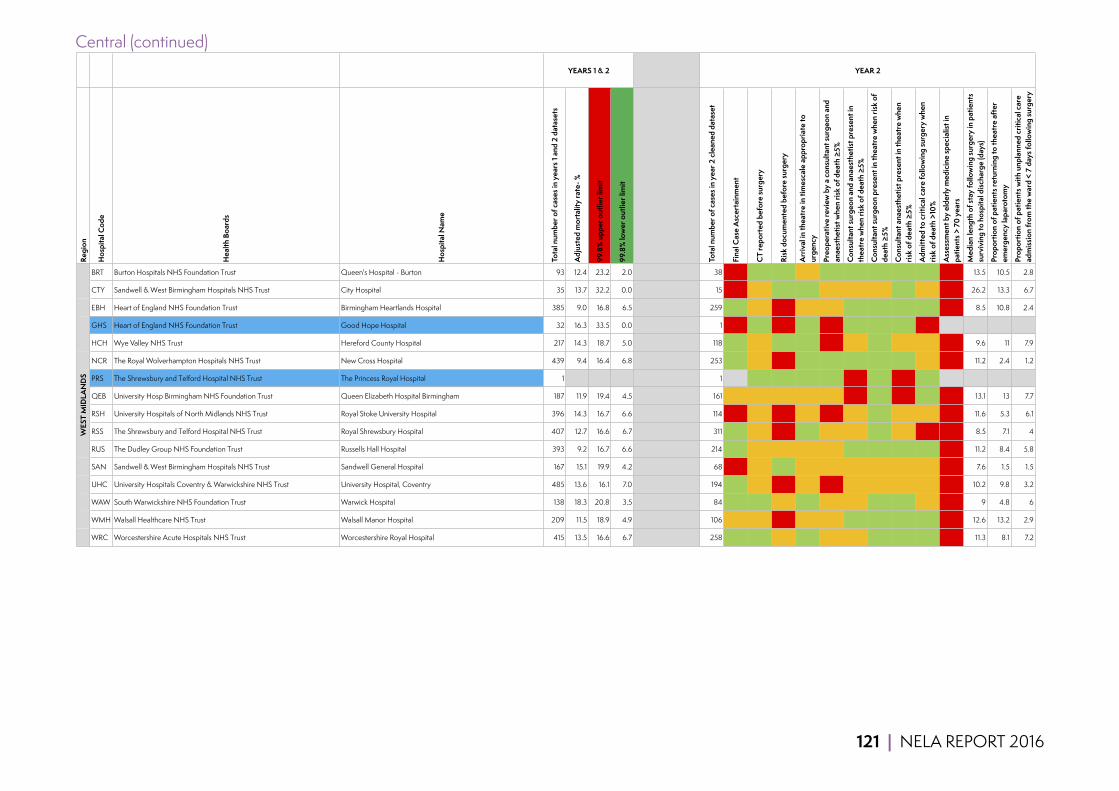
121 | NELA REPORT 2016
Central (continued)
Regi
on
Hos
pita
l Cod
e
Hea
lth B
oard
s
Hos
pita
l Nam
e
Tota
l num
ber o
f cas
es in
yea
rs 1
and
2 da
tase
ts
Adj
uste
d m
orta
lity
rate
- %
99.8
% u
pper
out
lier l
imit
99.8
% lo
wer
out
lier l
imit
Tota
l num
ber o
f cas
es in
yea
r 2 c
lean
ed d
atas
et
Fina
l Cas
e A
scer
tain
men
t
CT
repo
rted
bef
ore
surg
ery
Risk
doc
umen
ted
befo
re su
rger
y
Arr
ival
in th
eatr
e in
tim
esca
le a
ppro
pria
te to
ur
genc
y
Preo
pera
tive
revi
ew b
y a
cons
ulta
nt su
rgeo
n an
d an
aest
hetis
t whe
n ris
k of
dea
th ≥
5%
Con
sulta
nt su
rgeo
n an
d an
aest
hetis
t pre
sent
in
thea
tre
whe
n ris
k of
dea
th ≥
5%
Con
sulta
nt su
rgeo
n pr
esen
t in
thea
tre
whe
n ris
k of
de
ath
≥5%
Con
sulta
nt a
naes
thet
ist p
rese
nt in
thea
tre
whe
n ris
k of
dea
th ≥
5%
Adm
itted
to c
ritic
al c
are
follo
win
g su
rger
y w
hen
risk
of d
eath
>10
%
Ass
essm
ent b
y el
derly
med
icin
e sp
ecia
list i
n pa
tient
s > 7
0 ye
ars
Med
ian
leng
th o
f sta
y fo
llow
ing
surg
ery
in p
atie
nts
surv
ivin
g to
hos
pita
l disc
harg
e (d
ays)
Prop
ortio
n of
pat
ient
s ret
urni
ng to
thea
tre
afte
r em
erge
ncy
lapa
roto
my
Prop
ortio
n of
pat
ient
s with
unp
lann
ed c
ritic
al c
are
adm
issio
n fr
om th
e w
ard
< 7
days
follo
win
g su
rger
y
BRT Burton Hospitals NHS Foundation Trust Queen's Hospital - Burton 93 12.4 23.2 2.0 38 32 84 100 74 97 93 100 93 89 0 13.5 10.5 2.8
CTY Sandwell & West Birmingham Hospitals NHS Trust City Hospital 35 13.7 32.2 0.0 15 21 73 100 83 57 79 79 100 73 0 26.2 13.3 6.7
EBH Heart of England NHS Foundation Trust Birmingham Heartlands Hospital 385 9.0 16.8 6.5 259 94 53 42 76 54 83 87 94 92 1 8.5 10.8 2.4
GHS Heart of England NHS Foundation Trust Good Hope Hospital 32 16.3 33.5 0.0 1 1 100 0 100 0 100 100 100 0
HCH Wye Valley NHS Trust Hereford County Hospital 217 14.3 18.7 5.0 118 89 73 96 98 44 58 94 61 64 5 9.6 11 7.9
NCR The Royal Wolverhampton Hospitals NHS Trust New Cross Hospital 439 9.4 16.4 6.8 253 100 69 40 84 81 98 99 99 70 6 11.2 2.4 1.2
PRS The Shrewsbury and Telford Hospital NHS Trust The Princess Royal Hospital 1 1 100 100 100 100 0 100 0 100
QEB University Hosp Birmingham NHS Foundation Trust Queen Elizabeth Hospital Birmingham 187 11.9 19.4 4.5 161 61 74 75 73 68 44 95 44 91 18 13.1 13 7.7
RSH University Hospitals of North Midlands NHS Trust Royal Stoke University Hospital 396 14.3 16.7 6.6 114 34 73 22 71 42 60 95 60 74 0 11.6 5.3 6.1
RSS The Shrewsbury and Telford Hospital NHS Trust Royal Shrewsbury Hospital 407 12.7 16.6 6.7 311 162 72 41 86 59 66 82 79 48 7 8.5 7.1 4
RUS The Dudley Group NHS Foundation Trust Russells Hall Hospital 393 9.2 16.7 6.6 214 89 75 54 77 61 89 95 95 92 2 11.2 8.4 5.8
SAN Sandwell & West Birmingham Hospitals NHS Trust Sandwell General Hospital 167 15.1 19.9 4.2 68 38 69 93 67 66 58 74 79 68 0 7.6 1.5 1.5
UHC University Hospitals Coventry & Warwickshire NHS Trust University Hospital, Coventry 485 13.6 16.1 7.0 194 77 68 49 74 40 54 76 67 71 10 10.2 9.8 3.2
WAW South Warwickshire NHS Foundation Trust Warwick Hospital 138 18.3 20.8 3.5 84 78 88 58 93 68 73 84 86 74 3 9 4.8 6
WMH Walsall Healthcare NHS Trust Walsall Manor Hospital 209 11.5 18.9 4.9 106 52 75 37 78 73 87 98 87 89 4 12.6 13.2 2.9
WRC Worcestershire Acute Hospitals NHS Trust Worcestershire Royal Hospital 415 13.5 16.6 6.7 258 119 80 62 87 61 79 85 94 97 2 11.3 8.1 7.2
WES
T M
IDLA
ND
SYEARS 1 & 2 YEAR 2

122 | NELA REPORT 2016
North of England
Regi
on
Hos
pita
l Cod
e
Hea
lth B
oard
s
Hos
pita
l Nam
e
Tota
l num
ber o
f cas
es in
yea
rs 1
and
2 da
tase
ts
Adj
uste
d m
orta
lity
rate
- %
99.8
% u
pper
out
lier l
imit
99.8
% lo
wer
out
lier l
imit
Tota
l num
ber o
f cas
es in
yea
r 2 c
lean
ed d
atas
et
Fina
l Cas
e A
scer
tain
men
t
CT
repo
rted
bef
ore
surg
ery
Risk
doc
umen
ted
befo
re su
rger
y
Arr
ival
in th
eatr
e in
tim
esca
le a
ppro
pria
te to
ur
genc
y
Preo
pera
tive
revi
ew b
y a
cons
ulta
nt su
rgeo
n an
d an
aest
hetis
t whe
n ris
k of
dea
th ≥
5%
Con
sulta
nt su
rgeo
n an
d an
aest
hetis
t pre
sent
in
thea
tre
whe
n ris
k of
dea
th ≥
5%
Con
sulta
nt su
rgeo
n pr
esen
t in
thea
tre
whe
n ris
k of
de
ath
≥5%
Con
sulta
nt a
naes
thet
ist p
rese
nt in
thea
tre
whe
n ris
k of
dea
th ≥
5%
Adm
itted
to c
ritic
al c
are
follo
win
g su
rger
y w
hen
risk
of d
eath
>10
%
Ass
essm
ent b
y el
derly
med
icin
e sp
ecia
list i
n pa
tient
s > 7
0 ye
ars
Med
ian
leng
th o
f sta
y fo
llow
ing
surg
ery
in p
atie
nts
surv
ivin
g to
hos
pita
l disc
harg
e (d
ays)
Prop
ortio
n of
pat
ient
s ret
urni
ng to
thea
tre
afte
r em
erge
ncy
lapa
roto
my
Prop
ortio
n of
pat
ient
s with
unp
lann
ed c
ritic
al c
are
adm
issio
n fr
om th
e w
ard
< 7
days
follo
win
g su
rger
y
DAR County Durham & Darlington NHS Foundation Trust Darlington Memorial Hospital 224 13.9 18.6 5.1 106 88 78 63 82 83 95 98 97 87 5 9.5 9.4 1
DRY County Durham & Darlington NHS Foundation Trust University Hospital North Durham 304 9.9 17.5 6.0 155 86 77 76 89 77 90 95 95 78 23 9.4 9 5.3
FRE The Newcastle upon Tyne Hospitals NHS Foundation Trust Freeman Hospital 155 9.7 20.3 3.9 84 70 61 49 69 40 67 71 90 90 8 17.5 11.9 3.6
NSH Northumbria Healthcare NHS Foundation Trust Northumbria Specialist Emergency Care Hospital 464 15.9 16.3 6.9 250 86 96 86 94 96 99 97 95 30 9.5 2.4 3.3
NTG North Tees & Hartlepool NHS Foundation Trust University Hospital of North Tees 112 10.0 22.0 2.8 77 40 83 66 69 79 63 88 72 85 49 10.6 11.7 6.5
QEG Gateshead Health NHS Foundation Trust Queen Elizabeth Hospital - Gateshead 253 13.4 18.1 5.5 143 71 74 84 87 58 84 85 99 100 5 11.6 12.6 4.2
RVN The Newcastle upon Tyne Hospitals NHS Foundation Trust Royal Victoria Infirmary 498 10.9 16.1 7.1 254 101 61 64 87 59 82 88 93 94 6 10.5 4.7 2.4
SCM South Tees Hospitals NHS Foundation Trust The James Cook University Hospital 260 10.9 18.0 5.5 127 96 72 73 79 58 78 92 86 95 7 13.3 7.1 5.6
STD South Tyneside NHS Foundation Trust South Tyneside District Hospital 135 10.9 21.0 3.4 66 61 80 58 96 93 97 100 97 59 7 10.6 6.1 3.1
SUN City Hospitals Sunderland NHS Foundation Trust Sunderland Royal Hospital 372 13.8 16.9 6.5 180 88 79 64 85 65 93 99 94 90 0 12.2 22.8 5.6
NORTH
NO
RTH
EA
STYEARS 1 & 2 YEAR 2

123 | NELA REPORT 2016
North of England (continued)
Regi
on
Hos
pita
l Cod
e
Hea
lth B
oard
s
Hos
pita
l Nam
e
Tota
l num
ber o
f cas
es in
yea
rs 1
and
2 da
tase
ts
Adj
uste
d m
orta
lity
rate
- %
99.8
% u
pper
out
lier l
imit
99.8
% lo
wer
out
lier l
imit
Tota
l num
ber o
f cas
es in
yea
r 2 c
lean
ed d
atas
et
Fina
l Cas
e A
scer
tain
men
t
CT
repo
rted
bef
ore
surg
ery
Risk
doc
umen
ted
befo
re su
rger
y
Arr
ival
in th
eatr
e in
tim
esca
le a
ppro
pria
te to
ur
genc
y
Preo
pera
tive
revi
ew b
y a
cons
ulta
nt su
rgeo
n an
d an
aest
hetis
t whe
n ris
k of
dea
th ≥
5%
Con
sulta
nt su
rgeo
n an
d an
aest
hetis
t pre
sent
in
thea
tre
whe
n ris
k of
dea
th ≥
5%
Con
sulta
nt su
rgeo
n pr
esen
t in
thea
tre
whe
n ris
k of
de
ath
≥5%
Con
sulta
nt a
naes
thet
ist p
rese
nt in
thea
tre
whe
n ris
k of
dea
th ≥
5%
Adm
itted
to c
ritic
al c
are
follo
win
g su
rger
y w
hen
risk
of d
eath
>10
%
Ass
essm
ent b
y el
derly
med
icin
e sp
ecia
list i
n pa
tient
s > 7
0 ye
ars
Med
ian
leng
th o
f sta
y fo
llow
ing
surg
ery
in p
atie
nts
surv
ivin
g to
hos
pita
l disc
harg
e (d
ays)
Prop
ortio
n of
pat
ient
s ret
urni
ng to
thea
tre
afte
r em
erge
ncy
lapa
roto
my
Prop
ortio
n of
pat
ient
s with
unp
lann
ed c
ritic
al c
are
adm
issio
n fr
om th
e w
ard
< 7
days
follo
win
g su
rger
y
AEI Wrightington, Wigan & Leigh NHS Foundation Trust Royal Albert Edward Infirmary 250 13.3 18.2 5.4 137 76 81 82 84 65 67 92 70 92 11 10.1 10.9 2.2
BLA East Lancashire Hospitals NHS Trust Royal Blackburn Hospital 431 13.2 16.5 6.8 213 85 73 61 89 71 88 94 94 95 1 12.3 5.6 4.8
BOL Bolton NHS Foundation Trust Royal Bolton Hospital 225 10.3 18.6 5.1 157 73 80 92 79 67 88 90 98 85 15 12.2 12.7 7.7
CHR The Christie NHS Foundation Trust The Christie 39 11.3 30.7 0.0 23 96 65 9 80 92 92 100 92 100 0 14.4 0 4.3
CMI North Cumbria University Hospitals NHS Trust Cumberland Infirmary 310 13.2 17.4 6.0 191 88 75 50 86 79 98 98 99 89 8 8.5 11 3.2
COC Countess of Chester Hospital NHS Foundation Trust Countess of Chester Hospital 211 9.5 18.9 4.9 107 74 73 68 82 83 69 86 81 71 0 8.6 6.5 1.9
FAZ Aintree University Hospitals NHS Foundation Trust Aintree University Hospital 299 11.4 17.6 5.9 191 84 55 58 76 34 50 58 75 81 10 11.7 13.1 7.6
FGH University Hospitals of Morecambe Bay NHS Foundation Trust Furness General Hospital 117 9.0 21.8 2.9 65 77 86 91 90 84 55 97 55 100 10 10.6 4.6 1.5
LEG Mid Cheshire Hospitals NHS Foundation Trust Leighton Hospital 185 7.6 19.4 4.5 102 65 82 60 81 36 64 90 72 61 15 15 7.8 6.9
LHC Liverpool Heart & Chest Hospital NHS Foundation Trust Liverpool Heart and Chest Hospital 19 13.9 41.5 0.0 14 50 43 100 50 36 36 93 100 0 25.2 14.3 0
MAC East Cheshire NHS Trust Macclesfield District General Hospital 166 12.5 19.9 4.2 84 70 88 45 93 31 82 96 82 78 3 9.6 2.4 2.4
MRI Central Manchester University Hospitals NHS Foundation Trust Manchester Royal Infirmary 325 8.4 17.3 6.1 183 80 58 71 76 55 89 95 95 96 2 14.6 14.8 1.1
NMG The Pennine Acute Hospitals NHS Trust North Manchester General Hospital 117 9.3 21.8 2.9 95 42 69 33 75 67 85 100 85 79 3 10.4 2.1 3.2
OHM The Pennine Acute Hospitals NHS Trust The Royal Oldham Hospital 217 10.4 18.7 5.0 103 48 71 84 82 85 88 99 90 92 3 14.5 6.8 6
RLI University Hospitals of Morecambe Bay NHS Foundation Trust Royal Lancaster Infirmary 204 10.6 19.0 4.8 128 89 87 74 94 79 84 95 89 94 33 12.4 3.1 1.6
RLU Royal Liverpool and Broadgreen Univ Hospitals NHS Trust Royal Liverpool University Hospital 371 10.1 16.9 6.5 190 72 55 57 80 25 41 60 63 89 25 14.4 6.3 3.2
RPH Lancashire Teaching Hospitals NHS Foundation Trust Royal Preston Hospital 311 10.6 17.4 6.0 157 65 66 73 80 46 66 93 71 92 1 12.3 1.3 0
SHH Stockport NHS Foundation Trust Stepping Hill Hospital 310 6.9 17.4 6.0 138 77 84 67 82 77 99 99 100 96 6 11.1 7.2 3
SLF Salford Royal NHS Foundation Trust Salford Royal Hospital 275 11.0 17.8 5.7 128 71 45 86 81 82 91 100 91 96 54 12.3 7 2.3
SPD Southport & Ormskirk Hospital NHS Trust Southport District General Hospital 195 10.4 19.2 4.7 102 77 85 61 88 36 42 53 71 97 2 11.5 7.8 5.1
TGA Tameside Hospital NHS Foundation Trust Tameside General Hospital 210 13.7 18.9 4.9 108 82 91 68 75 36 51 77 61 66 16 11.1 11.1 8.6
VIC Blackpool Teaching Hospitals NHS Foundation Trust Blackpool Victoria Hospital 382 15.5 16.8 6.5 189 83 72 74 90 79 98 98 100 95 25 11.5 5.8 1.7
WDG Warrington & Halton Hospitals NHS Foundation Trust Warrington Hospital 231 12.6 18.5 5.2 114 53 58 89 86 45 67 71 90 83 14 13.2 11.4 1.8
WHI St Helens & Knowsley Teaching Hospitals NHS Trust Whiston Hospital 131 13.0 21.1 3.3 74 39 65 54 85 56 72 84 84 69 0 11.1 12.2 4.3
WIR Wirral University Teaching Hospital NHS Foundation Trust Arrowe Park Hospital 388 10.3 16.7 6.5 227 100 71 61 83 61 92 97 93 75 2 10.6 4 0.4
WLT The Walton Centre NHS Foundation Trust The Walton Centre 4 1 0 100 100 100 100 100 100 0
WYT University Hospital of South Manchester NHS Foundation Trust Wythenshawe Hospital 271 6.8 17.9 5.6 128 97 74 77 81 75 80 93 84 90 7 8.6 0.8 0.8
NO
RTH
WES
TYEARS 1 & 2 YEAR 2
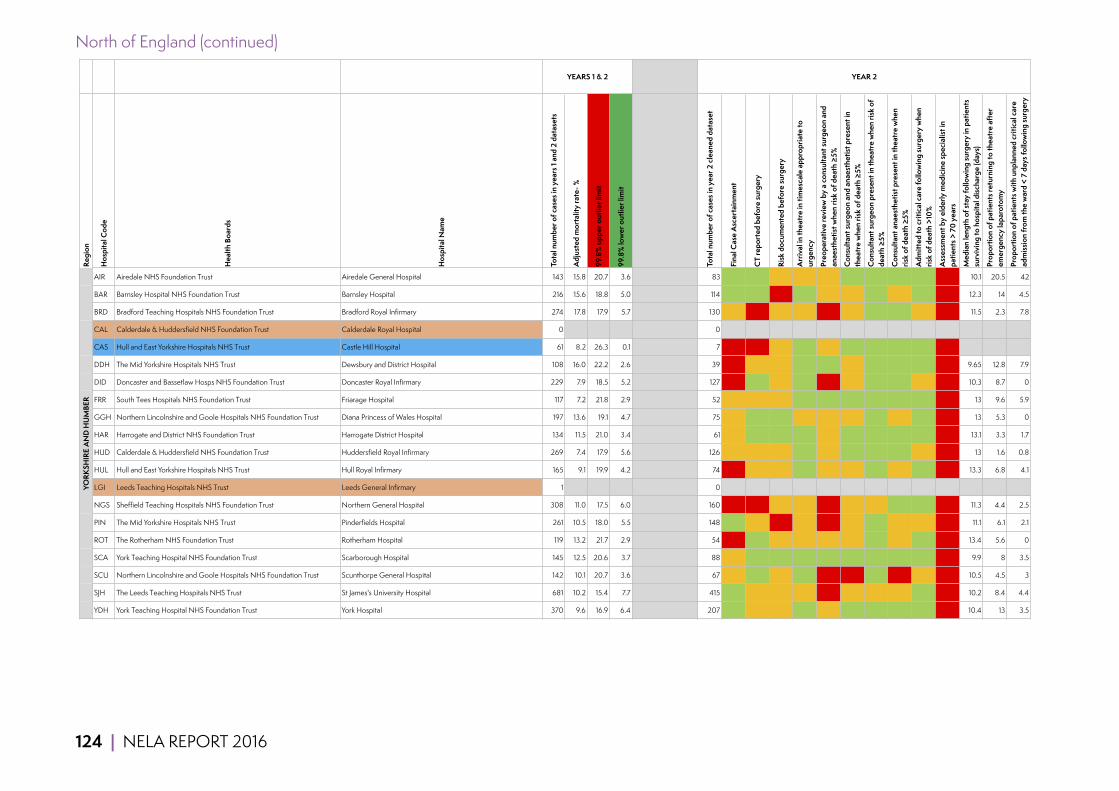
124 | NELA REPORT 2016
North of England (continued)
Regi
on
Hos
pita
l Cod
e
Hea
lth B
oard
s
Hos
pita
l Nam
e
Tota
l num
ber o
f cas
es in
yea
rs 1
and
2 da
tase
ts
Adj
uste
d m
orta
lity
rate
- %
99.8
% u
pper
out
lier l
imit
99.8
% lo
wer
out
lier l
imit
Tota
l num
ber o
f cas
es in
yea
r 2 c
lean
ed d
atas
et
Fina
l Cas
e A
scer
tain
men
t
CT
repo
rted
bef
ore
surg
ery
Risk
doc
umen
ted
befo
re su
rger
y
Arr
ival
in th
eatr
e in
tim
esca
le a
ppro
pria
te to
ur
genc
y
Preo
pera
tive
revi
ew b
y a
cons
ulta
nt su
rgeo
n an
d an
aest
hetis
t whe
n ris
k of
dea
th ≥
5%
Con
sulta
nt su
rgeo
n an
d an
aest
hetis
t pre
sent
in
thea
tre
whe
n ris
k of
dea
th ≥
5%
Con
sulta
nt su
rgeo
n pr
esen
t in
thea
tre
whe
n ris
k of
de
ath
≥5%
Con
sulta
nt a
naes
thet
ist p
rese
nt in
thea
tre
whe
n ris
k of
dea
th ≥
5%
Adm
itted
to c
ritic
al c
are
follo
win
g su
rger
y w
hen
risk
of d
eath
>10
%
Ass
essm
ent b
y el
derly
med
icin
e sp
ecia
list i
n pa
tient
s > 7
0 ye
ars
Med
ian
leng
th o
f sta
y fo
llow
ing
surg
ery
in p
atie
nts
surv
ivin
g to
hos
pita
l disc
harg
e (d
ays)
Prop
ortio
n of
pat
ient
s ret
urni
ng to
thea
tre
afte
r em
erge
ncy
lapa
roto
my
Prop
ortio
n of
pat
ient
s with
unp
lann
ed c
ritic
al c
are
adm
issio
n fr
om th
e w
ard
< 7
days
follo
win
g su
rger
y
AIR Airedale NHS Foundation Trust Airedale General Hospital 143 15.8 20.7 3.6 83 77 87 70 71 71 86 90 95 97 0 10.1 20.5 42
BAR Barnsley Hospital NHS Foundation Trust Barnsley Hospital 216 15.6 18.8 5.0 114 79 85 22 85 77 66 80 77 98 5 12.3 14 4.5
BRD Bradford Teaching Hospitals NHS Foundation Trust Bradford Royal Infirmary 274 17.8 17.9 5.7 130 57 32 73 79 42 73 88 82 77 37 11.5 2.3 7.8
CAL Calderdale & Huddersfield NHS Foundation Trust Calderdale Royal Hospital 0 0
CAS Hull and East Yorkshire Hospitals NHS Trust Castle Hill Hospital 61 8.2 26.3 0.1 7 5 43 57 80 60 100 100 100 100 0
DDH The Mid Yorkshire Hospitals NHS Trust Dewsbury and District Hospital 108 16.0 22.2 2.6 39 27 72 67 92 86 77 95 82 93 14 9.65 12.8 7.9
DID Doncaster and Bassetlaw Hosps NHS Foundation Trust Doncaster Royal Infirmary 229 7.9 18.5 5.2 127 44 88 62 84 19 73 88 84 63 0 10.3 8.7 0
FRR South Tees Hospitals NHS Foundation Trust Friarage Hospital 117 7.2 21.8 2.9 52 62 77 71 88 84 92 96 92 83 4 13 9.6 5.9
GGH Northern Lincolnshire and Goole Hospitals NHS Foundation Trust Diana Princess of Wales Hospital 197 13.6 19.1 4.7 75 52 83 87 75 64 66 83 77 85 19 13 5.3 0
HAR Harrogate and District NHS Foundation Trust Harrogate District Hospital 134 11.5 21.0 3.4 61 64 80 87 98 50 82 85 91 88 17 13.1 3.3 1.7
HUD Calderdale & Huddersfield NHS Foundation Trust Huddersfield Royal Infirmary 269 7.4 17.9 5.6 126 62 74 78 91 71 83 97 84 69 5 13 1.6 0.8
HUL Hull and East Yorkshire Hospitals NHS Trust Hull Royal Infirmary 165 9.1 19.9 4.2 74 29 74 78 91 67 50 83 55 100 13 13.3 6.8 4.1
LGI Leeds Teaching Hospitals NHS Trust Leeds General Infirmary 1 0
NGS Sheffield Teaching Hospitals NHS Foundation Trust Northern General Hospital 308 11.0 17.5 6.0 160 38 38 61 79 45 61 68 93 98 2 11.3 4.4 2.5
PIN The Mid Yorkshire Hospitals NHS Trust Pinderfields Hospital 261 10.5 18.0 5.5 148 77 72 48 78 43 64 92 69 69 2 11.1 6.1 2.1
ROT The Rotherham NHS Foundation Trust Rotherham Hospital 119 13.2 21.7 2.9 54 35 87 61 71 66 69 94 69 94 0 13.4 5.6 0
SCA York Teaching Hospital NHS Foundation Trust Scarborough Hospital 145 12.5 20.6 3.7 88 67 86 81 83 88 83 97 83 93 4 9.9 8 3.5
SCU Northern Lincolnshire and Goole Hospitals NHS Foundation Trust Scunthorpe General Hospital 142 10.1 20.7 3.6 67 62 97 67 92 40 45 94 49 59 13 10.5 4.5 3
SJH The Leeds Teaching Hospitals NHS Trust St James's University Hospital 681 10.2 15.4 7.7 415 133 69 72 78 45 53 69 70 81 5 10.2 8.4 4.4
YDH York Teaching Hospital NHS Foundation Trust York Hospital 370 9.6 16.9 6.4 207 82 70 60 89 72 93 93 100 88 24 10.4 13 3.5
YEARS 1 & 2 YEAR 2YO
RKSH
IRE
AN
D H
UM
BER
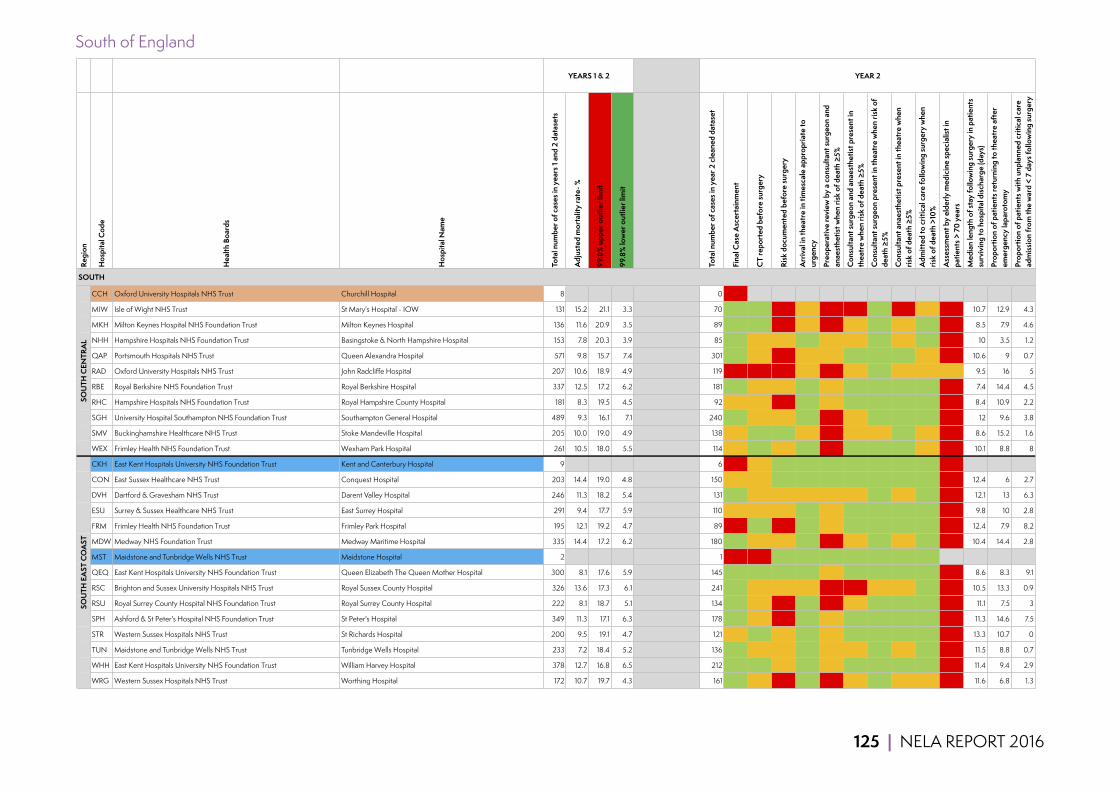
125 | NELA REPORT 2016
South of England
Regi
on
Hos
pita
l Cod
e
Hea
lth B
oard
s
Hos
pita
l Nam
e
Tota
l num
ber o
f cas
es in
yea
rs 1
and
2 da
tase
ts
Adj
uste
d m
orta
lity
rate
- %
99.8
% u
pper
out
lier l
imit
99.8
% lo
wer
out
lier l
imit
Tota
l num
ber o
f cas
es in
yea
r 2 c
lean
ed d
atas
et
Fina
l Cas
e A
scer
tain
men
t
CT
repo
rted
bef
ore
surg
ery
Risk
doc
umen
ted
befo
re su
rger
y
Arr
ival
in th
eatr
e in
tim
esca
le a
ppro
pria
te to
ur
genc
y
Preo
pera
tive
revi
ew b
y a
cons
ulta
nt su
rgeo
n an
d an
aest
hetis
t whe
n ris
k of
dea
th ≥
5%
Con
sulta
nt su
rgeo
n an
d an
aest
hetis
t pre
sent
in
thea
tre
whe
n ris
k of
dea
th ≥
5%
Con
sulta
nt su
rgeo
n pr
esen
t in
thea
tre
whe
n ris
k of
de
ath
≥5%
Con
sulta
nt a
naes
thet
ist p
rese
nt in
thea
tre
whe
n ris
k of
dea
th ≥
5%
Adm
itted
to c
ritic
al c
are
follo
win
g su
rger
y w
hen
risk
of d
eath
>10
%
Ass
essm
ent b
y el
derly
med
icin
e sp
ecia
list i
n pa
tient
s > 7
0 ye
ars
Med
ian
leng
th o
f sta
y fo
llow
ing
surg
ery
in p
atie
nts
surv
ivin
g to
hos
pita
l disc
harg
e (d
ays)
Prop
ortio
n of
pat
ient
s ret
urni
ng to
thea
tre
afte
r em
erge
ncy
lapa
roto
my
Prop
ortio
n of
pat
ient
s with
unp
lann
ed c
ritic
al c
are
adm
issio
n fr
om th
e w
ard
< 7
days
follo
win
g su
rger
y
CCH Oxford University Hospitals NHS Trust Churchill Hospital 8 0 0
MIW Isle of Wight NHS Trust St Mary's Hospital - IOW 131 15.2 21.1 3.3 70 73 80 43 69 34 17 91 20 61 14 10.7 12.9 4.3
MKH Milton Keynes Hospital NHS Foundation Trust Milton Keynes Hospital 136 11.6 20.9 3.5 89 74 85 45 71 42 73 100 73 81 17 8.5 7.9 4.6
NHH Hampshire Hospitals NHS Foundation Trust Basingstoke & North Hampshire Hospital 153 7.8 20.3 3.9 85 89 75 79 94 62 67 95 71 80 11 10 3.5 1.2
QAP Portsmouth Hospitals NHS Trust Queen Alexandra Hospital 571 9.8 15.7 7.4 301 93 66 48 76 63 80 97 82 68 11 10.6 9 0.7
RAD Oxford University Hospitals NHS Trust John Radcliffe Hospital 207 10.6 18.9 4.9 119 40 49 35 62 37 67 81 79 54 75 9.5 16 5
RBE Royal Berkshire NHS Foundation Trust Royal Berkshire Hospital 337 12.5 17.2 6.2 181 75 69 66 82 51 93 96 96 88 42 7.4 14.4 4.5
RHC Hampshire Hospitals NHS Foundation Trust Royal Hampshire County Hospital 181 8.3 19.5 4.5 92 64 76 48 92 73 98 100 98 85 9 8.4 10.9 2.2
SGH University Hospital Southampton NHS Foundation Trust Southampton General Hospital 489 9.3 16.1 7.1 240 77 63 73 82 49 72 86 80 93 5 12 9.6 3.8
SMV Buckinghamshire Healthcare NHS Trust Stoke Mandeville Hospital 205 10.0 19.0 4.9 138 68 85 85 70 27 72 74 92 77 19 8.6 15.2 1.6
WEX Frimley Health NHS Foundation Trust Wexham Park Hospital 261 10.5 18.0 5.5 114 68 81 57 90 46 81 94 87 75 2 10.1 8.8 8
CKH East Kent Hospitals University NHS Foundation Trust Kent and Canterbury Hospital 9 6 17 50 83 100 83 83 100 83 100 0
CON East Sussex Healthcare NHS Trust Conquest Hospital 203 14.4 19.0 4.8 150 54 76 81 93 83 90 96 94 83 4 12.4 6 2.7
DVH Dartford & Gravesham NHS Trust Darent Valley Hospital 246 11.3 18.2 5.4 131 84 64 54 70 54 78 95 79 88 8 12.1 13 6.3
ESU Surrey & Sussex Healthcare NHS Trust East Surrey Hospital 291 9.4 17.7 5.9 110 54 71 50 80 78 88 95 93 93 8 9.8 10 2.8
FRM Frimley Health NHS Foundation Trust Frimley Park Hospital 195 12.1 19.2 4.7 89 44 82 29 89 73 90 96 92 90 3 12.4 7.9 8.2
MDW Medway NHS Foundation Trust Medway Maritime Hospital 335 14.4 17.2 6.2 180 94 76 61 83 36 53 87 59 93 5 10.4 14.4 2.8
MST Maidstone and Tunbridge Wells NHS Trust Maidstone Hospital 2 1 1 0 100 100 100 100 100 100 100
QEQ East Kent Hospitals University NHS Foundation Trust Queen Elizabeth The Queen Mother Hospital 300 8.1 17.6 5.9 145 71 84 97 89 77 83 85 98 81 1 8.6 8.3 9.1
RSC Brighton and Sussex University Hospitals NHS Trust Royal Sussex County Hospital 326 13.6 17.3 6.1 241 72 79 66 70 40 43 57 67 82 2 10.5 13.3 0.9
RSU Royal Surrey County Hospital NHS Foundation Trust Royal Surrey County Hospital 222 8.1 18.7 5.1 134 74 54 38 83 40 77 87 88 95 2 11.1 7.5 3
SPH Ashford & St Peter's Hospital NHS Foundation Trust St Peter's Hospital 349 11.3 17.1 6.3 178 78 71 43 90 75 89 91 98 93 5 11.3 14.6 7.5
STR Western Sussex Hospitals NHS Trust St Richards Hospital 200 9.5 19.1 4.7 121 63 80 65 92 79 92 97 95 96 4 13.3 10.7 0
TUN Maidstone and Tunbridge Wells NHS Trust Tunbridge Wells Hospital 233 7.2 18.4 5.2 136 71 78 65 85 58 58 86 67 97 1 11.5 8.8 0.7
WHH East Kent Hospitals University NHS Foundation Trust William Harvey Hospital 378 12.7 16.8 6.5 212 118 82 69 88 67 98 98 99 96 9 11.4 9.4 2.9
WRG Western Sussex Hospitals NHS Trust Worthing Hospital 172 10.7 19.7 4.3 161 71 74 42 89 39 51 84 58 74 7 11.6 6.8 1.3
SOU
TH E
AST
CO
AST
YEARS 1 & 2 YEAR 2
SOUTH
SOU
TH C
ENTR
AL
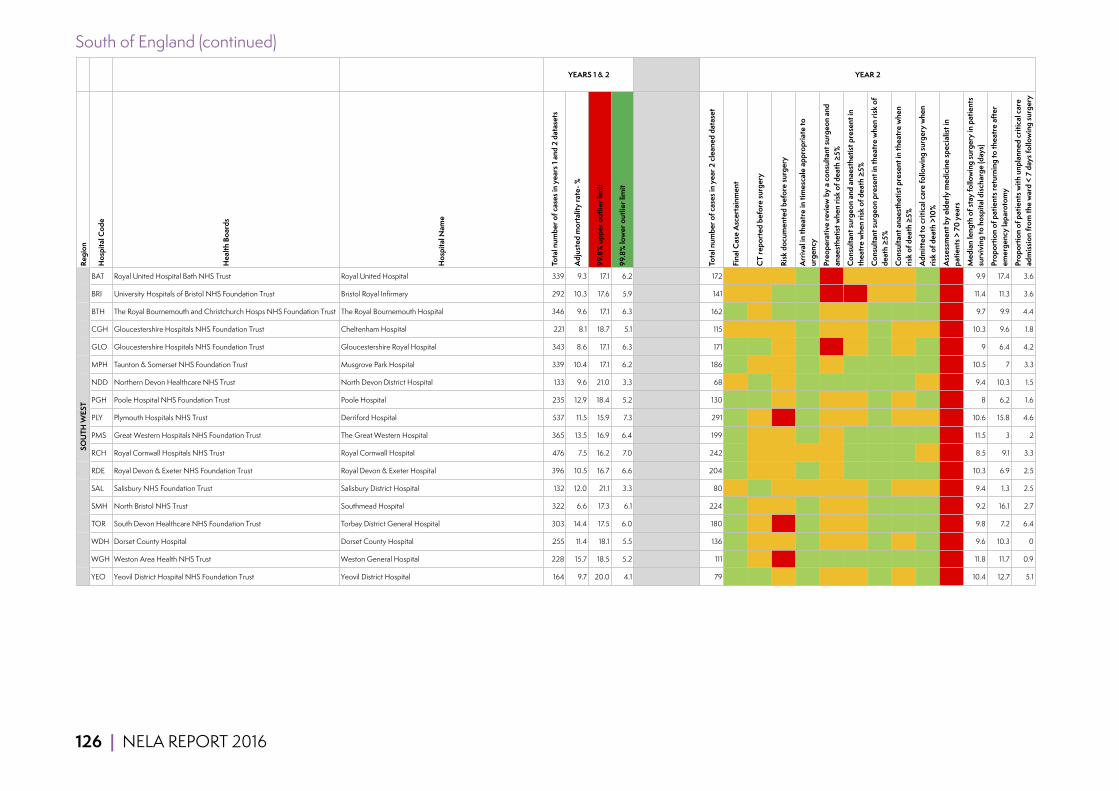
126 | NELA REPORT 2016
South of England (continued)
Regi
on
Hos
pita
l Cod
e
Hea
lth B
oard
s
Hos
pita
l Nam
e
Tota
l num
ber o
f cas
es in
yea
rs 1
and
2 da
tase
ts
Adj
uste
d m
orta
lity
rate
- %
99.8
% u
pper
out
lier l
imit
99.8
% lo
wer
out
lier l
imit
Tota
l num
ber o
f cas
es in
yea
r 2 c
lean
ed d
atas
et
Fina
l Cas
e A
scer
tain
men
t
CT
repo
rted
bef
ore
surg
ery
Risk
doc
umen
ted
befo
re su
rger
y
Arr
ival
in th
eatr
e in
tim
esca
le a
ppro
pria
te to
ur
genc
y
Preo
pera
tive
revi
ew b
y a
cons
ulta
nt su
rgeo
n an
d an
aest
hetis
t whe
n ris
k of
dea
th ≥
5%
Con
sulta
nt su
rgeo
n an
d an
aest
hetis
t pre
sent
in
thea
tre
whe
n ris
k of
dea
th ≥
5%
Con
sulta
nt su
rgeo
n pr
esen
t in
thea
tre
whe
n ris
k of
de
ath
≥5%
Con
sulta
nt a
naes
thet
ist p
rese
nt in
thea
tre
whe
n ris
k of
dea
th ≥
5%
Adm
itted
to c
ritic
al c
are
follo
win
g su
rger
y w
hen
risk
of d
eath
>10
%
Ass
essm
ent b
y el
derly
med
icin
e sp
ecia
list i
n pa
tient
s > 7
0 ye
ars
Med
ian
leng
th o
f sta
y fo
llow
ing
surg
ery
in p
atie
nts
surv
ivin
g to
hos
pita
l disc
harg
e (d
ays)
Prop
ortio
n of
pat
ient
s ret
urni
ng to
thea
tre
afte
r em
erge
ncy
lapa
roto
my
Prop
ortio
n of
pat
ient
s with
unp
lann
ed c
ritic
al c
are
adm
issio
n fr
om th
e w
ard
< 7
days
follo
win
g su
rger
y
BAT Royal United Hospital Bath NHS Trust Royal United Hospital 339 9.3 17.1 6.2 172 65 72 52 85 25 54 73 64 81 3 9.9 17.4 3.6
BRI University Hospitals of Bristol NHS Foundation Trust Bristol Royal Infirmary 292 10.3 17.6 5.9 141 62 67 81 93 44 35 56 58 94 7 11.4 11.3 3.6
BTH The Royal Bournemouth and Christchurch Hosps NHS Foundation Trust The Royal Bournemouth Hospital 346 9.6 17.1 6.3 162 96 77 91 84 70 74 94 80 97 4 9.7 9.9 4.4
CGH Gloucestershire Hospitals NHS Foundation Trust Cheltenham Hospital 221 8.1 18.7 5.1 115 64 71 63 89 51 70 88 73 79 0 10.3 9.6 1.8
GLO Gloucestershire Hospitals NHS Foundation Trust Gloucestershire Royal Hospital 343 8.6 17.1 6.3 171 79 80 57 84 46 60 87 66 82 3 9 6.4 4.2
MPH Taunton & Somerset NHS Foundation Trust Musgrove Park Hospital 339 10.4 17.1 6.2 186 86 70 68 90 72 94 98 96 88 16 10.5 7 3.3
NDD Northern Devon Healthcare NHS Trust North Devon District Hospital 133 9.6 21.0 3.3 68 57 82 74 96 84 95 100 95 75 0 9.4 10.3 1.5
PGH Poole Hospital NHS Foundation Trust Poole Hospital 235 12.9 18.4 5.2 130 83 85 75 85 60 57 84 60 91 8 8 6.2 1.6
PLY Plymouth Hospitals NHS Trust Derriford Hospital 537 11.5 15.9 7.3 291 78 68 49 82 65 63 86 71 76 15 10.6 15.8 4.6
PMS Great Western Hospitals NHS Foundation Trust The Great Western Hospital 365 13.5 16.9 6.4 199 98 73 77 87 55 81 82 99 95 2 11.5 3 2
RCH Royal Cornwall Hospitals NHS Trust Royal Cornwall Hospital 476 7.5 16.2 7.0 242 84 71 54 78 63 85 96 88 64 14 8.5 9.1 3.3
RDE Royal Devon & Exeter NHS Foundation Trust Royal Devon & Exeter Hospital 396 10.5 16.7 6.6 204 71 65 59 88 57 87 87 98 84 24 10.3 6.9 2.5
SAL Salisbury NHS Foundation Trust Salisbury District Hospital 132 12.0 21.1 3.3 80 56 83 74 73 61 61 92 69 66 6 9.4 1.3 2.5
SMH North Bristol NHS Trust Southmead Hospital 322 6.6 17.3 6.1 224 72 68 79 85 60 75 94 80 90 13 9.2 16.1 2.7
TOR South Devon Healthcare NHS Foundation Trust Torbay District General Hospital 303 14.4 17.5 6.0 180 94 68 44 87 57 77 81 91 96 5 9.8 7.2 6.4
WDH Dorset County Hospital Dorset County Hospital 255 11.4 18.1 5.5 136 81 77 72 87 67 64 93 70 98 7 9.6 10.3 0
WGH Weston Area Health NHS Trust Weston General Hospital 228 15.7 18.5 5.2 111 103 77 49 91 95 96 97 99 84 3 11.8 11.7 0.9
YEO Yeovil District Hospital NHS Foundation Trust Yeovil District Hospital 164 9.7 20.0 4.1 79 73 87 57 89 56 67 95 67 96 5 10.4 12.7 5.1
SOU
TH W
EST
YEARS 1 & 2 YEAR 2
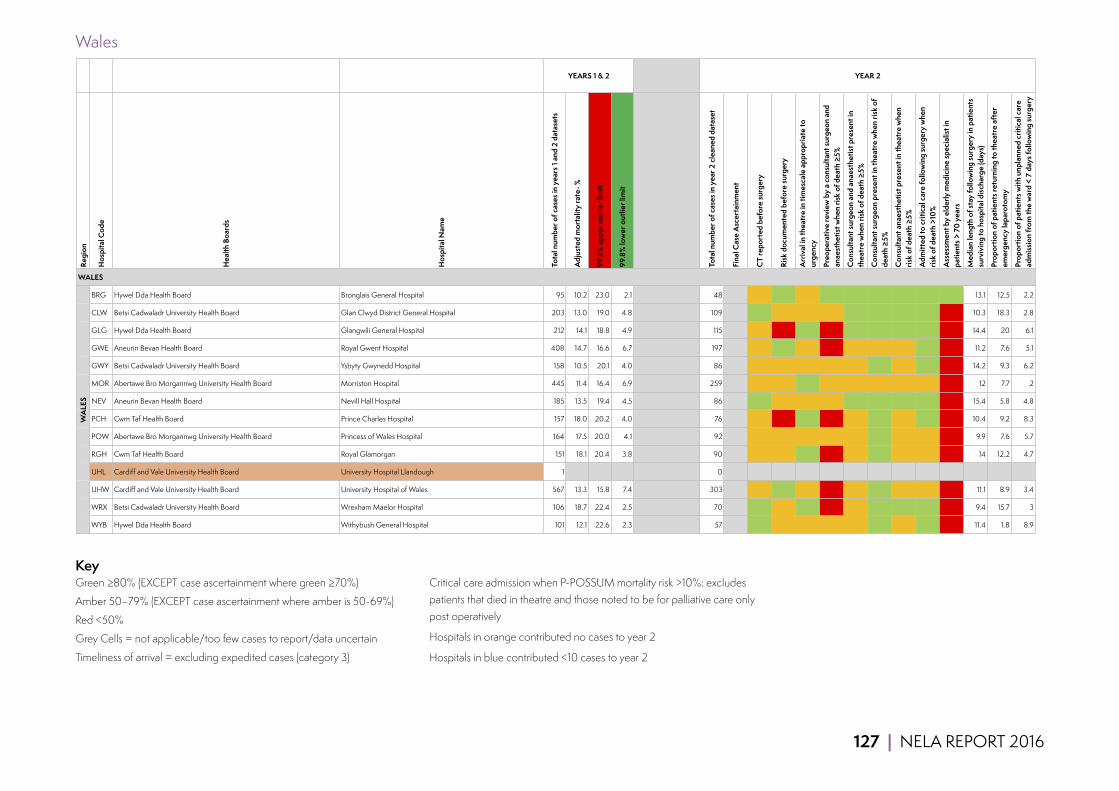
127 | NELA REPORT 2016
Wales
Regi
on
Hos
pita
l Cod
e
Hea
lth B
oard
s
Hos
pita
l Nam
e
Tota
l num
ber o
f cas
es in
yea
rs 1
and
2 da
tase
ts
Adj
uste
d m
orta
lity
rate
- %
99.8
% u
pper
out
lier l
imit
99.8
% lo
wer
out
lier l
imit
Tota
l num
ber o
f cas
es in
yea
r 2 c
lean
ed d
atas
et
Fina
l Cas
e A
scer
tain
men
t
CT
repo
rted
bef
ore
surg
ery
Risk
doc
umen
ted
befo
re su
rger
y
Arr
ival
in th
eatr
e in
tim
esca
le a
ppro
pria
te to
ur
genc
y
Preo
pera
tive
revi
ew b
y a
cons
ulta
nt su
rgeo
n an
d an
aest
hetis
t whe
n ris
k of
dea
th ≥
5%
Con
sulta
nt su
rgeo
n an
d an
aest
hetis
t pre
sent
in
thea
tre
whe
n ris
k of
dea
th ≥
5%
Con
sulta
nt su
rgeo
n pr
esen
t in
thea
tre
whe
n ris
k of
de
ath
≥5%
Con
sulta
nt a
naes
thet
ist p
rese
nt in
thea
tre
whe
n ris
k of
dea
th ≥
5%
Adm
itted
to c
ritic
al c
are
follo
win
g su
rger
y w
hen
risk
of d
eath
>10
%
Ass
essm
ent b
y el
derly
med
icin
e sp
ecia
list i
n pa
tient
s > 7
0 ye
ars
Med
ian
leng
th o
f sta
y fo
llow
ing
surg
ery
in p
atie
nts
surv
ivin
g to
hos
pita
l disc
harg
e (d
ays)
Prop
ortio
n of
pat
ient
s ret
urni
ng to
thea
tre
afte
r em
erge
ncy
lapa
roto
my
Prop
ortio
n of
pat
ient
s with
unp
lann
ed c
ritic
al c
are
adm
issio
n fr
om th
e w
ard
< 7
days
follo
win
g su
rger
y
BRG Hywel Dda Health Board Bronglais General Hospital 95 10.2 23.0 2.1 48 58 88 77 84 86 89 97 100 89 13.1 12.5 2.2
CLW Betsi Cadwaladr University Health Board Glan Clwyd District General Hospital 203 13.0 19.0 4.8 109 80 77 64 77 93 97 96 96 27 10.3 18.3 2.8
GLG Hywel Dda Health Board Glangwili General Hospital 212 14.1 18.8 4.9 115 75 43 85 40 82 97 85 98 2 14.4 20 6.1
GWE Aneurin Bevan Health Board Royal Gwent Hospital 408 14.7 16.6 6.7 197 71 85 77 31 50 68 68 89 13 11.2 7.6 5.1
GWY Betsi Cadwaladr University Health Board Ysbyty Gwynedd Hospital 158 10.5 20.1 4.0 86 58 66 73 61 78 97 78 81 10 14.2 9.3 6.2
MOR Abertawe Bro Morgannwg University Health Board Morriston Hospital 445 11.4 16.4 6.9 259 68 79 80 57 58 76 74 74 6 12 7.7 2
NEV Aneurin Bevan Health Board Nevill Hall Hospital 185 13.5 19.4 4.5 86 83 76 77 53 100 100 100 83 7 15.4 5.8 4.8
PCH Cwm Taf Health Board Prince Charles Hospital 157 18.0 20.2 4.0 76 75 38 88 41 63 86 67 90 4 10.4 9.2 8.3
POW Abertawe Bro Morgannwg University Health Board Princess of Wales Hospital 164 17.5 20.0 4.1 92 72 62 78 59 67 92 75 56 7 9.9 7.6 5.7
RGH Cwm Taf Health Board Royal Glamorgan 151 18.1 20.4 3.8 90 79 68 83 43 57 91 60 73 13 14 12.2 4.7
UHL Cardiff and Vale University Health Board University Hospital Llandough 1 0
UHW Cardiff and Vale University Health Board University Hospital of Wales 567 13.3 15.8 7.4 303 56 88 63 48 60 80 69 72 5 11.1 8.9 3.4
WRX Betsi Cadwaladr University Health Board Wrexham Maelor Hospital 106 18.7 22.4 2.5 70 81 59 90 47 79 95 84 88 18 9.4 15.7 3
WYB Hywel Dda Health Board Withybush General Hospital 101 12.1 22.6 2.3 57 84 75 73 56 67 100 67 100 0 11.4 1.8 8.9
WALES
WA
LES
YEARS 1 & 2 YEAR 2
KeyGreen ≥80% (EXCEPT case ascertainment where green ≥70%)
Amber 50–79% (EXCEPT case ascertainment where amber is 50-69%)
Red <50%
Grey Cells = not applicable/too few cases to report/data uncertain
Timeliness of arrival = excluding expedited cases (category 3)
Critical care admission when P-POSSUM mortality risk >10%: excludes patients that died in theatre and those noted to be for palliative care only post operatively
Hospitals in orange contributed no cases to year 2
Hospitals in blue contributed <10 cases to year 2

128 | NELA REPORT 2016
21.2 SUPPLEMENTARY SUMMARY TABLES
Table 37 Proportion of patients who were reviewed by a consultant surgeon within 14 hours of emergency admission to hospital. Data presented for patients admitted as an emergency and for whom the time of consultant review had been entered into the NELA web tool (Year 2 data)
Total number of patients Proportion of patients reviewed by consultant surgeon within 14 hours of admission (%)
Age (years)
18–39 1,755 56
40–49 1,595 58
50–59 2,314 57
60–69 3,437 55
70–79 4,138 54
80–89 3,022 53
≥90 424 52
ASA
1 1,778 64
2 5,890 56
3 5,894 52
4 2,834 53
5 289 54
Documented risk
Lower 4,215 58
High 2,385 56
Highest 4,337 55
Not documented 5,748 52
Overall 16,685 55%

NELA REPORT 2016 | 129
Table 38 Preoperative CT scanning and reporting by a consultant radiologist by time of day and day of week of emergency hospital admission (Year 2 data)
Time of emergency admission to hospital
Monday–Friday Saturday–Sunday
CT scan before surgery (%)
CT scan reported by a consultant radiologist before surgery (%)
CT scan before surgery (%)
CT scan reported by a consultant radiologist before surgery (%)
0800–1159 81 72 85 73
1200–1759 83 72 83 72
1800–2359 84 71 84 72
0000–0759 81 72 85 74
Overall 82% 72% 84% 73%
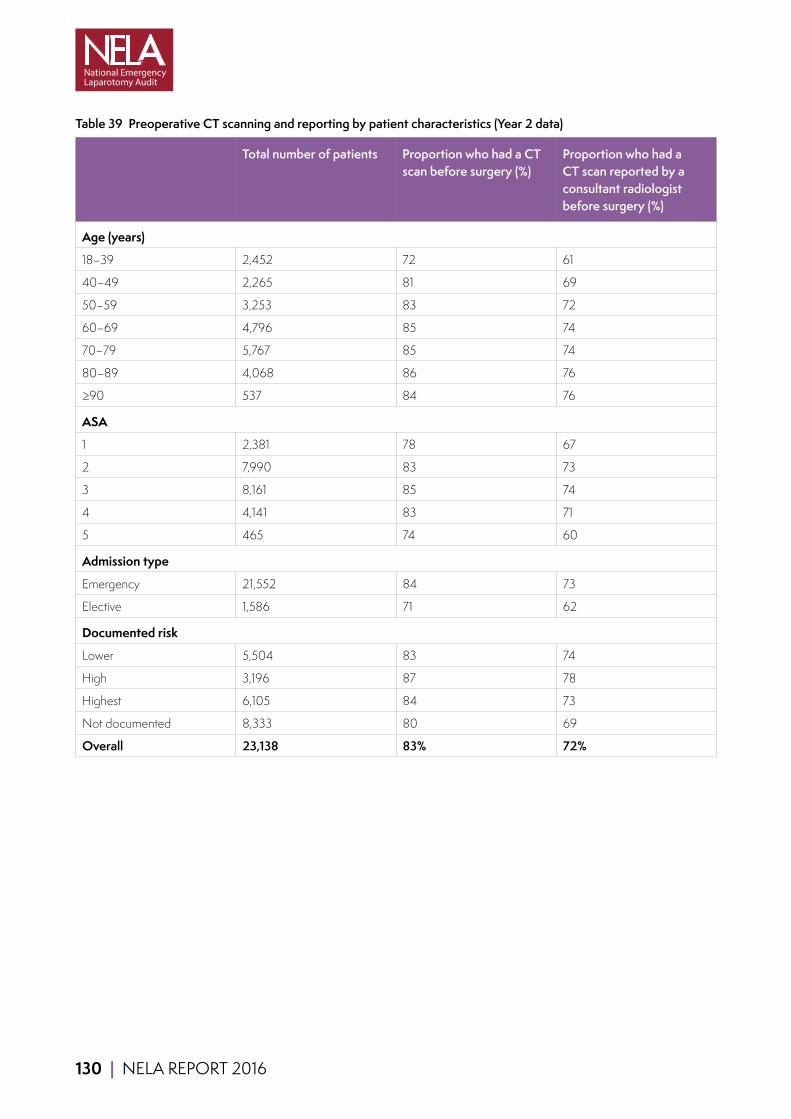
130 | NELA REPORT 2016
Table 39 Preoperative CT scanning and reporting by patient characteristics (Year 2 data)
Total number of patients Proportion who had a CT scan before surgery (%)
Proportion who had a CT scan reported by a consultant radiologist before surgery (%)
Age (years)
18–39 2,452 72 61
40–49 2,265 81 69
50–59 3,253 83 72
60–69 4,796 85 74
70–79 5,767 85 74
80–89 4,068 86 76
≥90 537 84 76
ASA
1 2,381 78 67
2 7,990 83 73
3 8,161 85 74
4 4,141 83 71
5 465 74 60
Admission type
Emergency 21,552 84 73
Elective 1,586 71 62
Documented risk
Lower 5,504 83 74
High 3,196 87 78
Highest 6,105 84 73
Not documented 8,333 80 69
Overall 23,138 83% 72%
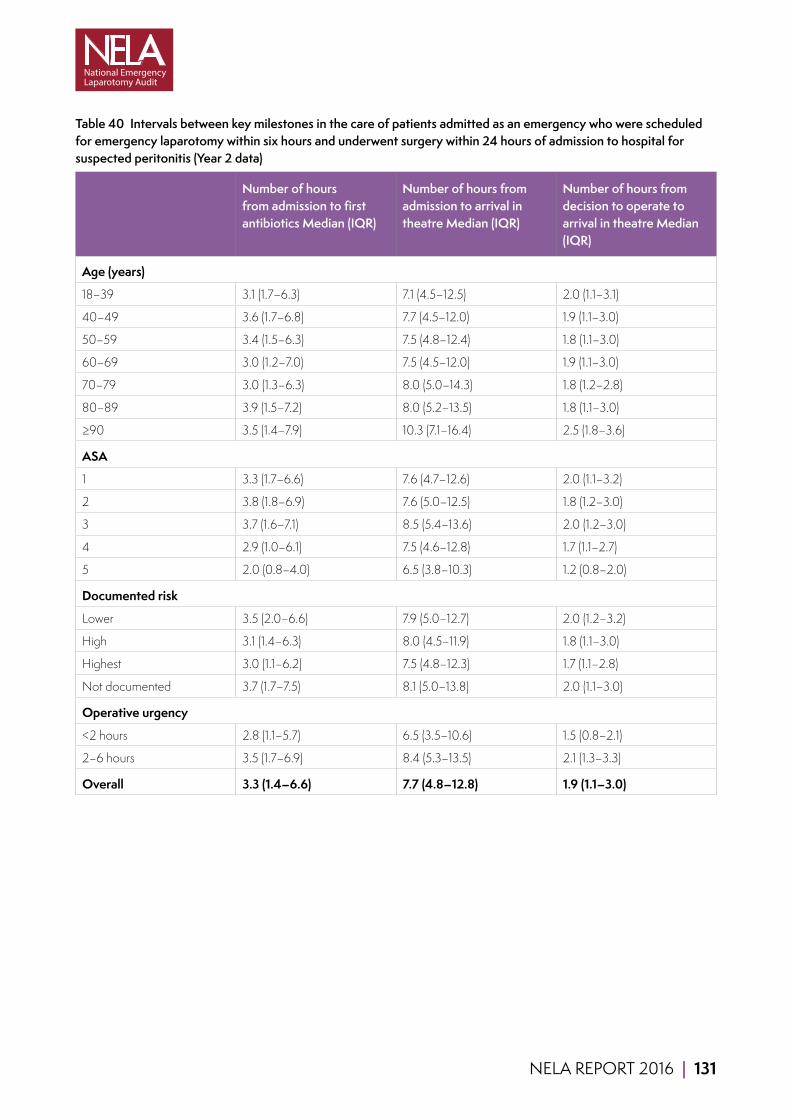
NELA REPORT 2016 | 131
Table 40 Intervals between key milestones in the care of patients admitted as an emergency who were scheduled for emergency laparotomy within six hours and underwent surgery within 24 hours of admission to hospital for suspected peritonitis (Year 2 data)
Number of hours from admission to first antibiotics Median (IQR)
Number of hours from admission to arrival in theatre Median (IQR)
Number of hours from decision to operate to arrival in theatre Median (IQR)
Age (years)
18–39 3.1 (1.7–6.3) 7.1 (4.5–12.5) 2.0 (1.1–3.1)
40–49 3.6 (1.7–6.8) 7.7 (4.5–12.0) 1.9 (1.1–3.0)
50–59 3.4 (1.5–6.3) 7.5 (4.8–12.4) 1.8 (1.1–3.0)
60–69 3.0 (1.2–7.0) 7.5 (4.5–12.0) 1.9 (1.1–3.0)
70–79 3.0 (1.3–6.3) 8.0 (5.0–14.3) 1.8 (1.2–2.8)
80–89 3.9 (1.5–7.2) 8.0 (5.2–13.5) 1.8 (1.1–3.0)
≥90 3.5 (1.4–7.9) 10.3 (7.1–16.4) 2.5 (1.8–3.6)
ASA
1 3.3 (1.7–6.6) 7.6 (4.7–12.6) 2.0 (1.1–3.2)
2 3.8 (1.8–6.9) 7.6 (5.0–12.5) 1.8 (1.2–3.0)
3 3.7 (1.6–7.1) 8.5 (5.4–13.6) 2.0 (1.2–3.0)
4 2.9 (1.0–6.1) 7.5 (4.6–12.8) 1.7 (1.1–2.7)
5 2.0 (0.8–4.0) 6.5 (3.8–10.3) 1.2 (0.8–2.0)
Documented risk
Lower 3.5 (2.0–6.6) 7.9 (5.0–12.7) 2.0 (1.2–3.2)
High 3.1 (1.4–6.3) 8.0 (4.5–11.9) 1.8 (1.1–3.0)
Highest 3.0 (1.1–6.2) 7.5 (4.8–12.3) 1.7 (1.1–2.8)
Not documented 3.7 (1.7–7.5) 8.1 (5.0–13.8) 2.0 (1.1–3.0)
Operative urgency
<2 hours 2.8 (1.1–5.7) 6.5 (3.5–10.6) 1.5 (0.8–2.1)
2–6 hours 3.5 (1.7–6.9) 8.4 (5.3–13.5) 2.1 (1.3–3.3)
Overall 3.3 (1.4–6.6) 7.7 (4.8–12.8) 1.9 (1.1–3.0)
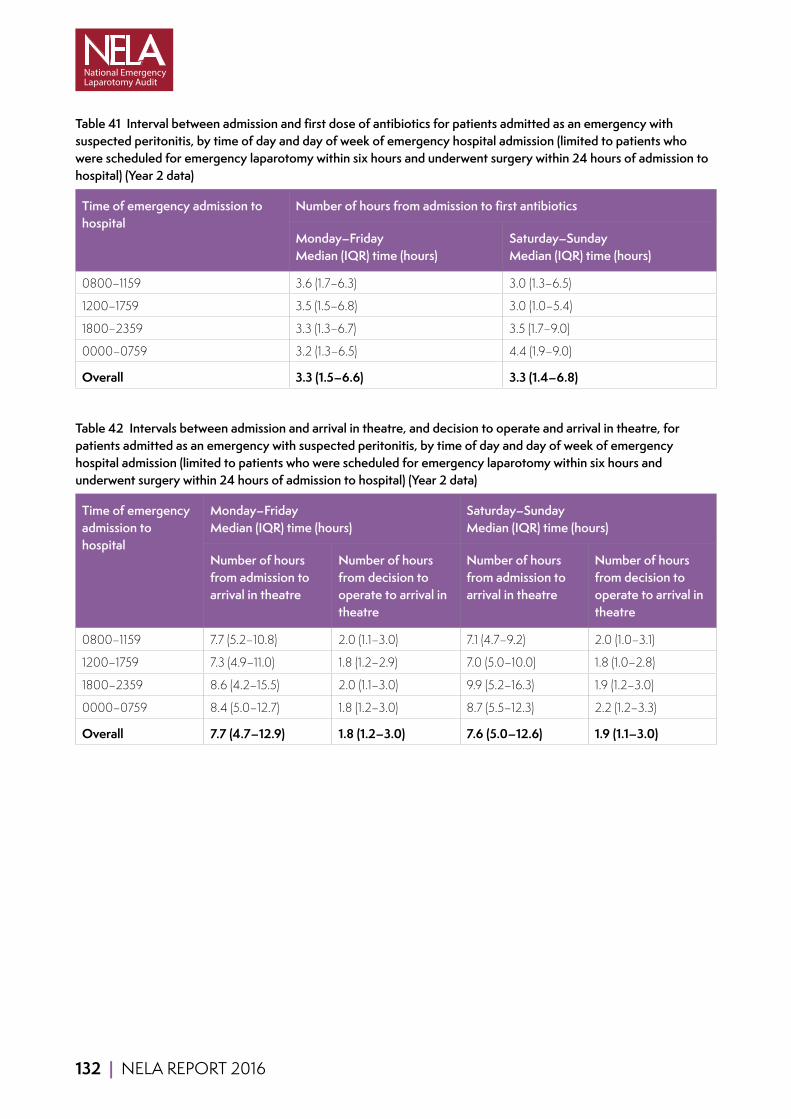
132 | NELA REPORT 2016
Table 41 Interval between admission and first dose of antibiotics for patients admitted as an emergency with suspected peritonitis, by time of day and day of week of emergency hospital admission (limited to patients who were scheduled for emergency laparotomy within six hours and underwent surgery within 24 hours of admission to hospital) (Year 2 data)
Time of emergency admission to hospital
Number of hours from admission to first antibiotics
Monday–Friday Median (IQR) time (hours)
Saturday–Sunday Median (IQR) time (hours)
0800–1159 3.6 (1.7–6.3) 3.0 (1.3–6.5)
1200–1759 3.5 (1.5–6.8) 3.0 (1.0–5.4)
1800–2359 3.3 (1.3–6.7) 3.5 (1.7–9.0)
0000–0759 3.2 (1.3–6.5) 4.4 (1.9–9.0)
Overall 3.3 (1.5–6.6) 3.3 (1.4–6.8)
Table 42 Intervals between admission and arrival in theatre, and decision to operate and arrival in theatre, for patients admitted as an emergency with suspected peritonitis, by time of day and day of week of emergency hospital admission (limited to patients who were scheduled for emergency laparotomy within six hours and underwent surgery within 24 hours of admission to hospital) (Year 2 data)
Time of emergency admission to hospital
Monday–Friday Median (IQR) time (hours)
Saturday–Sunday Median (IQR) time (hours)
Number of hours from admission to arrival in theatre
Number of hours from decision to operate to arrival in theatre
Number of hours from admission to arrival in theatre
Number of hours from decision to operate to arrival in theatre
0800–1159 7.7 (5.2–10.8) 2.0 (1.1–3.0) 7.1 (4.7–9.2) 2.0 (1.0–3.1)
1200–1759 7.3 (4.9–11.0) 1.8 (1.2–2.9) 7.0 (5.0–10.0) 1.8 (1.0–2.8)
1800–2359 8.6 (4.2–15.5) 2.0 (1.1–3.0) 9.9 (5.2–16.3) 1.9 (1.2–3.0)
0000–0759 8.4 (5.0–12.7) 1.8 (1.2–3.0) 8.7 (5.5–12.3) 2.2 (1.2–3.3)
Overall 7.7 (4.7–12.9) 1.8 (1.2–3.0) 7.6 (5.0–12.6) 1.9 (1.1–3.0)

NELA REPORT 2016 | 133
Table 43 Proportion of patients who arrived in theatre in a timescale appropriate to their operative urgency after the decision was made to perform surgery (or from time of booking if time of decision unavailable). Expedited surgery (category 3) has been excluded from this analysis (Year 2 data)
Surgery required within 2 hours
Surgery required within 2–6 hours
Surgery required within 6–18 hours
All patients assessed
n= % n= % n= % n= %
Age (years)
18–39 263 74 791 87 645 82 1,699 83
40–49 241 72 813 88 607 82 1,661 83
50–59 391 69 1,111 87 840 82 2,342 82
60–69 553 71 1,631 87 1,264 81 3,448 82
70–79 698 73 1,923 85 1,543 80 4,164 81
80–89 457 67 1,441 84 1,121 81 3,019 81
≥90 29 62 184 86 167 84 380 84
ASA
1 198 74 875 89 721 87 1,794 87
2 447 70 2,529 86 2,529 81 5,505 83
3 684 67 2,739 84 2,252 80 5,675 80
4 1,035 67 1,630 87 669 80 3,334 81
5 268 76 121 93 16 56 405 81
Admission type
Emergency 2,288 70 7,301 86 5,917 81 15,506 82
Elective 344 79 593 90 270 84 1,207 86
Documented risk
Lower 202 64 1,754 86 1,913 83 3,869 84
High 271 69 1,143 85 895 81 2,309 82
Highest 1,497 70 2,443 87 1,038 82 4,978 81
Not documented 662 74 2,554 85 2,341 80 5,557 82
Overall 2,632 71% 7,894 86% 6,187 81% 16,713 82%

134 | NELA REPORT 2016
Table 44 Proportion of patients who arrived in theatre in a timescale appropriate to their operative urgency category, by time of day and day of week of arrival in an operating theatre. Expedited surgery (category 3) has been excluded from this analysis (Year 2 data)
Time of arrival in operating theatre
Monday–Friday (%) Saturday–Sunday (%)
Surgery required within 2 hours
Surgery required within 2–6 hours
Surgery required within 6–18 hours
Surgery required within 2 hours
Surgery required within 2–6 hours
Surgery required within 6–18 hours
0800–1159 76 80 73 69 84 75
1200–1759 66 86 80 60 88 80
1800–2359 66 87 91 73 86 90
0000–0759 77 88 96 76 90 93
Overall 70% 86% 81% 70% 87% 81%

NELA REPORT 2016 | 135
Table 45 Proportions of patients receiving input before surgery by consultant surgeons and consultant anaesthetists by patient characteristics (Year 2 data)
Total number of patients
Proportion of patients (%)
Decision to operate made in person by a consultant surgeon and patient reviewed preoperatively by a consultant anaesthetist
Decision to operate made in person by a consultant surgeon
Preoperative review by a consultant anaesthetist
Decision to operate not made in person by a consultant surgeon and patient not reviewed preoperatively by a consultant anaesthetist
Age (years)
18–39 2,452 51 70 69 12
40–49 2,265 53 70 72 12
50–59 3,253 55 71 73 10
60–69 4,796 57 74 74 9
70–79 5,767 57 72 76 9
80–89 4,068 58 73 77 8
≥90 537 60 74 77 8
ASA
1 2,381 48 68 67 14
2 7,990 54 73 70 10
3 8,161 58 74 75 9
4 4,141 60 69 82 8
5 465 58 63 86 8
Admission type
Emergency 21,552 56 72 74 10
Elective 1,586 58 72 76 9
Overall 23,138 56% 72% 74% 10%
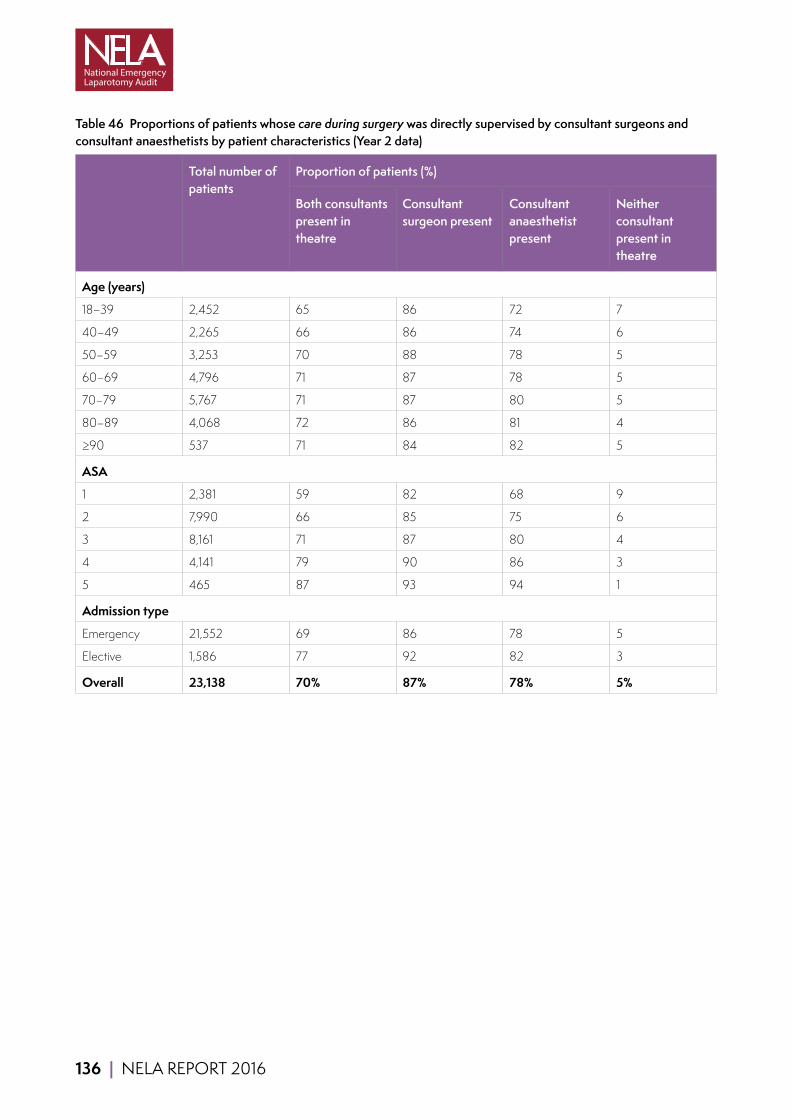
136 | NELA REPORT 2016
Table 46 Proportions of patients whose care during surgery was directly supervised by consultant surgeons and consultant anaesthetists by patient characteristics (Year 2 data)
Total number of patients
Proportion of patients (%)
Both consultants present in theatre
Consultant surgeon present
Consultant anaesthetist present
Neither consultant present in theatre
Age (years)
18–39 2,452 65 86 72 7
40–49 2,265 66 86 74 6
50–59 3,253 70 88 78 5
60–69 4,796 71 87 78 5
70–79 5,767 71 87 80 5
80–89 4,068 72 86 81 4
≥90 537 71 84 82 5
ASA
1 2,381 59 82 68 9
2 7,990 66 85 75 6
3 8,161 71 87 80 4
4 4,141 79 90 86 3
5 465 87 93 94 1
Admission type
Emergency 21,552 69 86 78 5
Elective 1,586 77 92 82 3
Overall 23,138 70% 87% 78% 5%

NELA REPORT 2016 | 137
Table 47 Proportion of patients receiving input before surgery by consultant surgeons and consultant anaesthetists by time of day and day of week of arrival in theatre (Year 2 data)
Time of arrival in operating theatre
Monday–Friday (%) Saturday–Sunday (%)
Both consultants
Consultant surgeon
Consultant anaesthetist
Both consultants
Consultant surgeon
Consultant anaesthetist
0800–1159 63 77 81 53 76 69
1200–1759 65 81 80 56 78 70
1800–2359 52 69 71 43 61 66
0000–0759 23 34 57 25 38 55
Overall 58% 73% 76% 49% 69% 67%
Table 48 Proportions of patients whose care during surgery was directly supervised by consultant surgeons and consultant anaesthetists by day of arrival in theatre (Year 2 data)
Day of arrival in operating theatre
Total number of patients
Proportion of patients (%)
Both consultants present in theatre
Consultant surgeon present
Consultant anaesthetist present
Neither consultant present in theatre
Monday 2,988 72 87 81 5
Tuesday 3,556 73 87 82 4
Wednesday 3,669 73 87 82 4
Thursday 3,694 73 87 82 4
Friday 3,537 70 85 80 5
Saturday 2,917 62 87 69 6
Sunday 2,777 62 86 69 7
Overall 23,138 70% 87% 78% 5%

138 | NELA REPORT 2016
Table 49 Proportions of patients receiving goal directed fluid therapy and method of provision by patient characteristics (Year 2 data)
Total number of patients
Proportion of patients (%)
Cardiac output monitor
Other method Overall
Age (years)
18–39 2,452 31 13 44
40–49 2,265 34 13 47
50–59 3,253 38 14 52
60–69 4,796 42 15 57
70–79 5,767 41 16 57
80–89 4,068 43 16 59
≥90 537 39 15 54
ASA
1 2,381 29 12 42
2 7,990 35 14 48
3 8,161 41 15 57
4 4,141 48 17 66
5 465 46 25 70
Admission type
Emergency 21,552 39 15 54
Elective 1,586 39 16 55
Documented risk
Lower 5,504 35 14 49
High 3,196 43 16 58
Highest 6,105 51 17 68
Not documented 8,333 32 14 46
Overall 23,138 39% 15% 54%

NELA REPORT 2016 | 139
Table 50 Proportions of patients receiving goal directed fluid therapy and method of provision by documented urgency of surgery (Year 2 data)
Urgency of surgery Total number of patients
Proportion of patients (%)
Cardiac output monitoring
Other method Overall
<2 hours 2,943 45 19 64
2–6 hours 8,948 42 15 57
6–18 hours 7,273 36 14 50
18–24 hours 3,869 33 14 47
Overall 23,033 39% 15% 54%
Table 51 Proportion of patients admitted directly to a high dependency or intensive care bed after surgery by patient characteristics (excluding 69 patients who died intraoperatively and 471 patients with an active decision not to admit to critical care) (Year 2 data)
Total number of patients Proportion of patients admitted directly to a high dependency or intensive care bed after surgery (%)
Age (years)
18–39 2,438 40
40–49 2,238 47
50–59 3,194 54
60–69 4,683 63
70–79 5,607 68
80–89 3,923 75
≥90 515 72
ASA
1 2,375 31
2 7,931 45
3 8,001 69
4 3,906 91
5 385 99
Admission type
Emergency 21,041 60
Elective 1,557 75
Overall 22,598 61%

140 | NELA REPORT 2016
Table 52 Proportion of patients admitted directly to a high dependency or intensive care bed after surgery by operative urgency (excluding 69 patients who died intraoperatively and 471 patients with an active decision not to admit to critical care) (Year 2 data)
Urgency of surgery Total number of patients Proportion of patients admitted directly to a high dependency or intensive care bed after surgery (%)
<2 hours 2,773 87
2–6 hours 8,762 67
6–18 hours 7,177 51
18–24 hours 3,784 46
Overall 22,496 61%
Table 53 Proportion of all patients admitted directly to a high dependency or intensive care bed after surgery by time of day and day of week that surgery was commenced (excluding 69 patients who died intraoperatively and 471 patients with an active decision not to admit to critical care) (Year 2 data)
Time of arrival in operating theatre Proportion of patients admitted directly to a high dependency or intensive care bed after surgery (%)
Monday–Friday (%) Saturday–Sunday (%)
0800–1159 56 56
1200–1759 58 60
1800–2359 67 68
0000–0759 75 73
Overall 64% 64%

NELA REPORT 2016 | 141
Table 54 Proportion of all patients admitted directly to a high dependency or intensive care bed after surgery by the day that surgery was commenced (excluding 69 patients who died intraoperatively and 471 patients with an active decision not to admit to critical care) (Year 2 data)
Day of arrival in operating theatre
Total number of patients Frequency (%) Proportion of patients admitted directly to a high dependency or intensive care bed after surgery (%)
Monday 2,923 13 62
Tuesday 3,471 15 61
Wednesday 3,584 16 60
Thursday 3,605 16 60
Friday 3,453 15 61
Saturday 2,850 13 62
Sunday 2,712 12 62
Overall 22,598 100% 61%
Table 55 Proportion of patients aged 70 years or over who were assessed after surgery by an Elderly Medicine specialist following emergency laparotomy by patient characteristics (Year 2 data)
Total number of patients Proportion of patients assessed after surgery by an Elderly Medicine specialist (%)
ASA
1 249 4
2 2,784 8
3 4,570 11
4 2,544 12
5 225 6
Admission type
Emergency 9,668 11
Elective 704 6
Documented risk
Lower 1,581 8
High 1,652 11
Highest 3,825 12
Not documented 3,314 9
Overall 10,372 10%
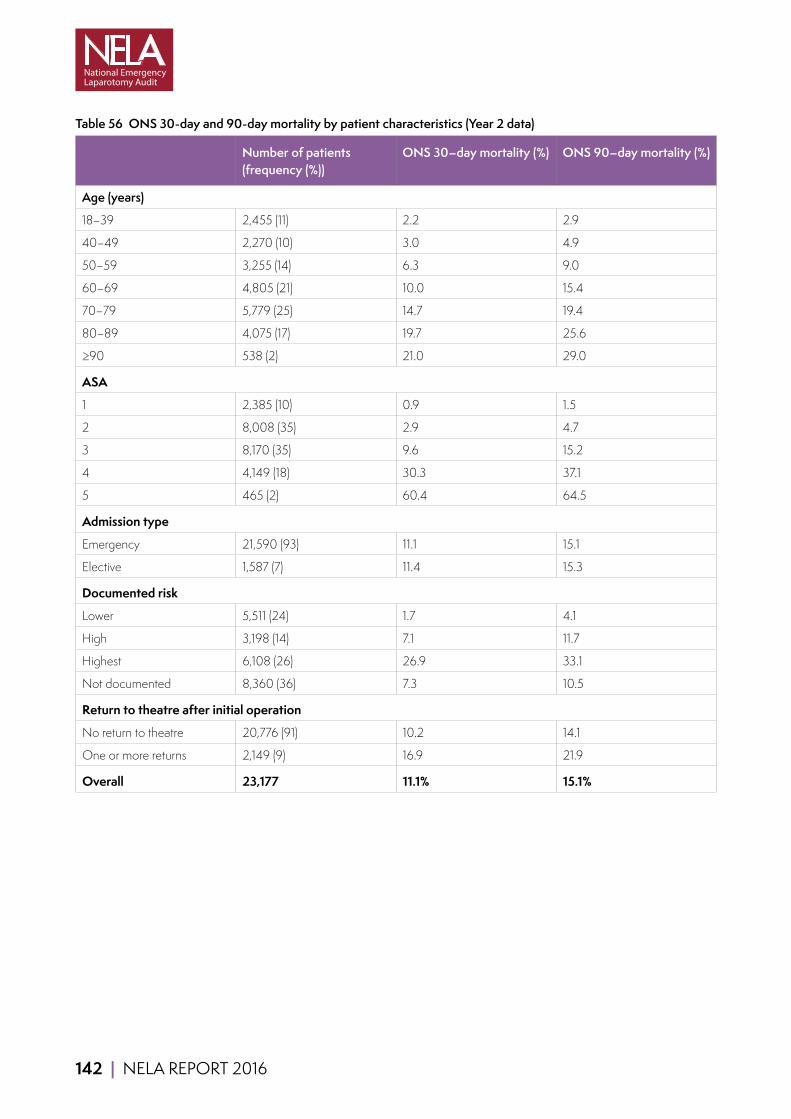
142 | NELA REPORT 2016
Table 56 ONS 30-day and 90-day mortality by patient characteristics (Year 2 data)
Number of patients (frequency (%))
ONS 30–day mortality (%) ONS 90–day mortality (%)
Age (years)
18–39 2,455 (11) 2.2 2.9
40–49 2,270 (10) 3.0 4.9
50–59 3,255 (14) 6.3 9.0
60–69 4,805 (21) 10.0 15.4
70–79 5,779 (25) 14.7 19.4
80–89 4,075 (17) 19.7 25.6
≥90 538 (2) 21.0 29.0
ASA
1 2,385 (10) 0.9 1.5
2 8,008 (35) 2.9 4.7
3 8,170 (35) 9.6 15.2
4 4,149 (18) 30.3 37.1
5 465 (2) 60.4 64.5
Admission type
Emergency 21,590 (93) 11.1 15.1
Elective 1,587 (7) 11.4 15.3
Documented risk
Lower 5,511 (24) 1.7 4.1
High 3,198 (14) 7.1 11.7
Highest 6,108 (26) 26.9 33.1
Not documented 8,360 (36) 7.3 10.5
Return to theatre after initial operation
No return to theatre 20,776 (91) 10.2 14.1
One or more returns 2,149 (9) 16.9 21.9
Overall 23,177 11.1% 15.1%
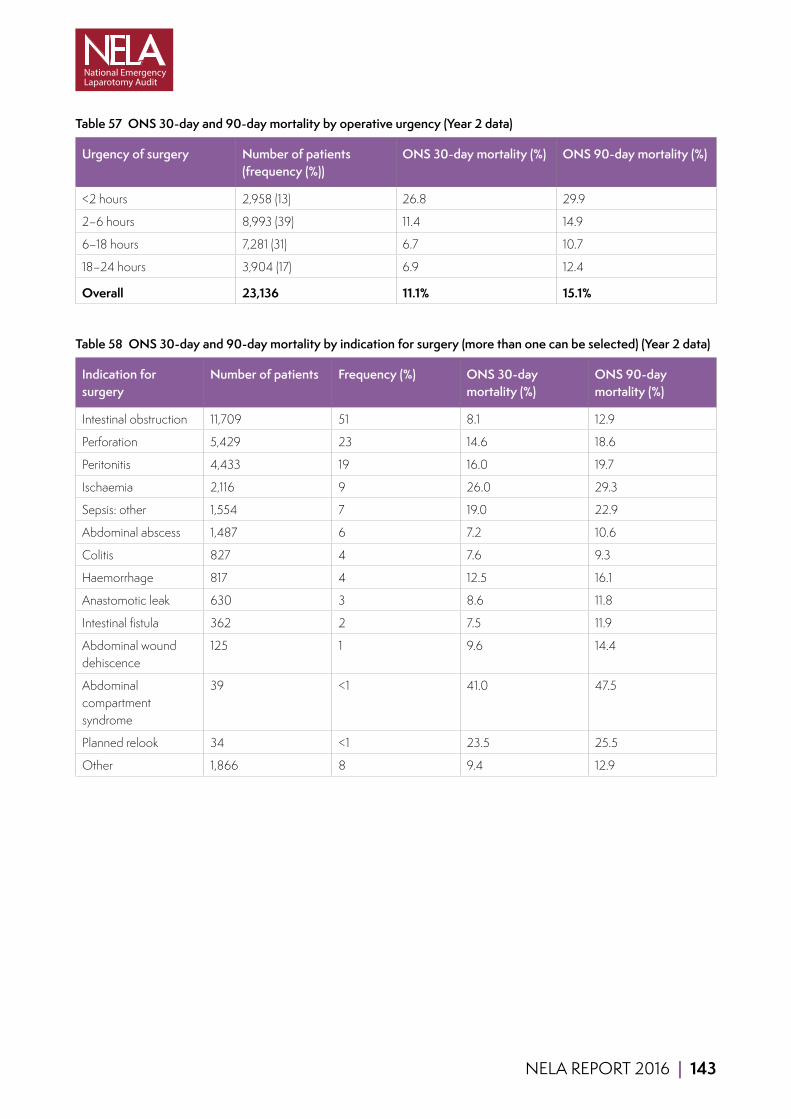
NELA REPORT 2016 | 143
Table 57 ONS 30-day and 90-day mortality by operative urgency (Year 2 data)
Urgency of surgery Number of patients (frequency (%))
ONS 30-day mortality (%) ONS 90-day mortality (%)
<2 hours 2,958 (13) 26.8 29.9
2–6 hours 8,993 (39) 11.4 14.9
6–18 hours 7,281 (31) 6.7 10.7
18–24 hours 3,904 (17) 6.9 12.4
Overall 23,136 11.1% 15.1%
Table 58 ONS 30-day and 90-day mortality by indication for surgery (more than one can be selected) (Year 2 data)
Indication for surgery
Number of patients Frequency (%) ONS 30-day mortality (%)
ONS 90-day mortality (%)
Intestinal obstruction 11,709 51 8.1 12.9
Perforation 5,429 23 14.6 18.6
Peritonitis 4,433 19 16.0 19.7
Ischaemia 2,116 9 26.0 29.3
Sepsis: other 1,554 7 19.0 22.9
Abdominal abscess 1,487 6 7.2 10.6
Colitis 827 4 7.6 9.3
Haemorrhage 817 4 12.5 16.1
Anastomotic leak 630 3 8.6 11.8
Intestinal fistula 362 2 7.5 11.9
Abdominal wound dehiscence
125 1 9.6 14.4
Abdominal compartment syndrome
39 <1 41.0 47.5
Planned relook 34 <1 23.5 25.5
Other 1,866 8 9.4 12.9
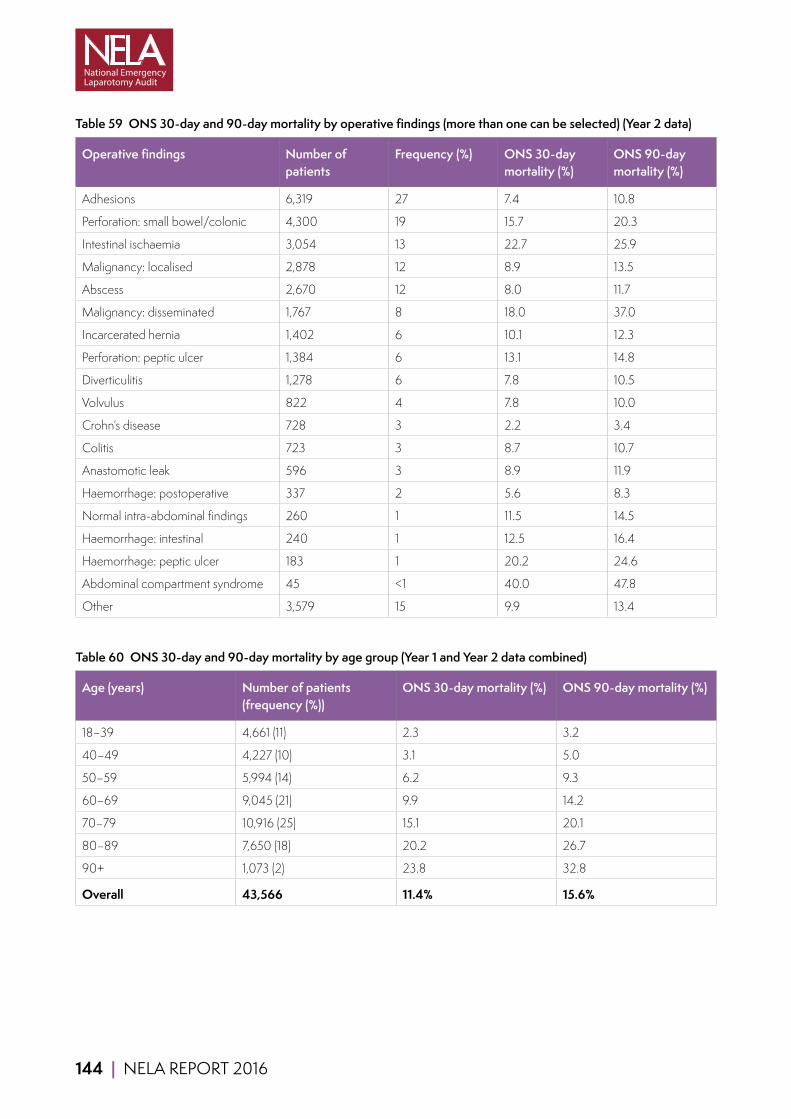
144 | NELA REPORT 2016
Table 59 ONS 30-day and 90-day mortality by operative findings (more than one can be selected) (Year 2 data)
Operative findings Number of patients
Frequency (%) ONS 30-day mortality (%)
ONS 90-day mortality (%)
Adhesions 6,319 27 7.4 10.8
Perforation: small bowel/colonic 4,300 19 15.7 20.3
Intestinal ischaemia 3,054 13 22.7 25.9
Malignancy: localised 2,878 12 8.9 13.5
Abscess 2,670 12 8.0 11.7
Malignancy: disseminated 1,767 8 18.0 37.0
Incarcerated hernia 1,402 6 10.1 12.3
Perforation: peptic ulcer 1,384 6 13.1 14.8
Diverticulitis 1,278 6 7.8 10.5
Volvulus 822 4 7.8 10.0
Crohn’s disease 728 3 2.2 3.4
Colitis 723 3 8.7 10.7
Anastomotic leak 596 3 8.9 11.9
Haemorrhage: postoperative 337 2 5.6 8.3
Normal intra-abdominal findings 260 1 11.5 14.5
Haemorrhage: intestinal 240 1 12.5 16.4
Haemorrhage: peptic ulcer 183 1 20.2 24.6
Abdominal compartment syndrome 45 <1 40.0 47.8
Other 3,579 15 9.9 13.4
Table 60 ONS 30-day and 90-day mortality by age group (Year 1 and Year 2 data combined)
Age (years) Number of patients (frequency (%))
ONS 30-day mortality (%) ONS 90-day mortality (%)
18–39 4,661 (11) 2.3 3.2
40–49 4,227 (10) 3.1 5.0
50–59 5,994 (14) 6.2 9.3
60–69 9,045 (21) 9.9 14.2
70–79 10,916 (25) 15.1 20.1
80–89 7,650 (18) 20.2 26.7
90+ 1,073 (2) 23.8 32.8
Overall 43,566 11.4% 15.6%
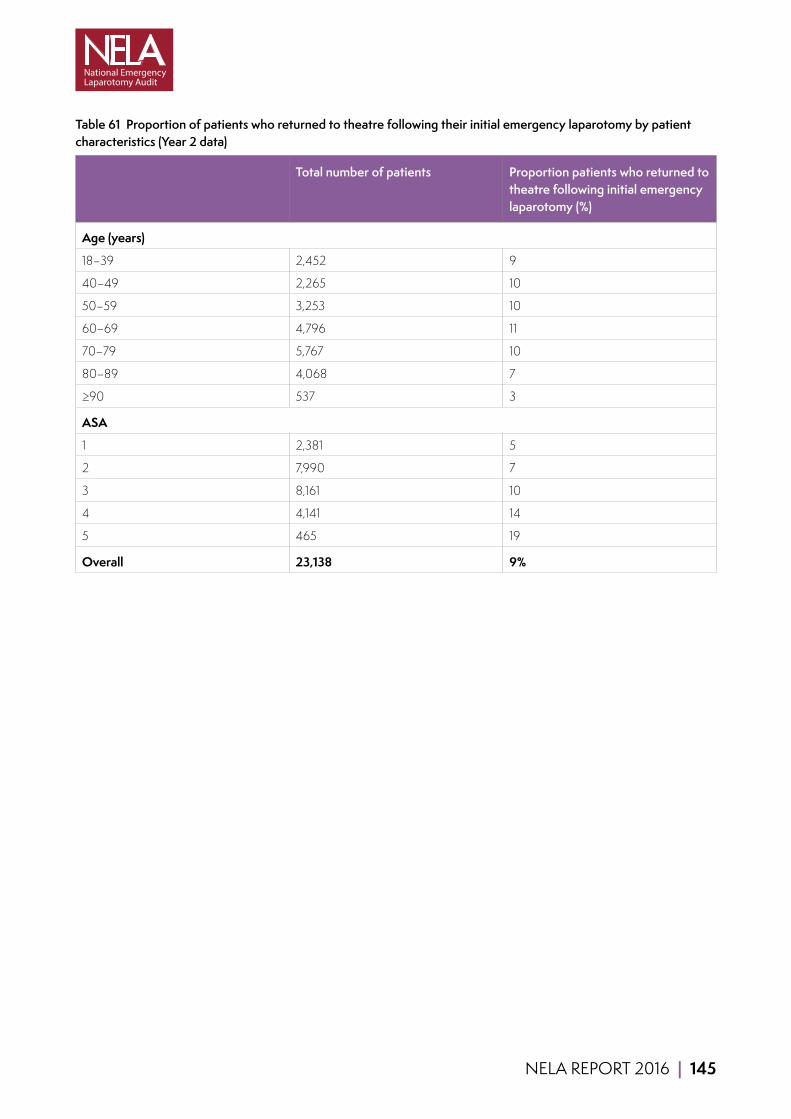
NELA REPORT 2016 | 145
Table 61 Proportion of patients who returned to theatre following their initial emergency laparotomy by patient characteristics (Year 2 data)
Total number of patients Proportion patients who returned to theatre following initial emergency laparotomy (%)
Age (years)
18–39 2,452 9
40–49 2,265 10
50–59 3,253 10
60–69 4,796 11
70–79 5,767 10
80–89 4,068 7
≥90 537 3
ASA
1 2,381 5
2 7,990 7
3 8,161 10
4 4,141 14
5 465 19
Overall 23,138 9%
146 | NELA REPORT 2016
21.3 NELA RISK-ADJUSTMENT MODEL AND PERFORMANCE OF P-POSSUM
A risk model was developed to produce the risk-adjusted 30-day postoperative mortality results for hospitals performing emergency bowel surgery. The model was based on data submitted to NELA on patients who had their operations between 1 December 2013 and 30 November 2015 in an NHS hospital within England and Wales. We excluded patients:
■ Whose age was outside the range of 18 years to 113 years.
■ Who had an unknown mortality status at 30 days.
■ Recorded as having a surgical procedure that was not eligible for inclusion in NELA.
■ Who had a date of death that occurred before date of admission.
The risk model included 22 variables describing different aspects of the patient’s admission. The variables included:
■ Patient age and sex.
■ Preoperative factors including ASA score, systolic blood pressure, urgency of surgery, and comorbid conditions.
■ Preoperative physiological measurements (creatinine, sodium, potassium, urea, and white blood cell count).
■ Perioperative factors (peritoneal soiling, intraoperative blood loss).
Patient status at 30 days after surgery was primarily determined using data from the ONS mortality dataset. In the minority of cases where there were ‘no trace’ observations within the ONS mortality dataset, we used the inpatient status at 30 days instead.
Logistic regression was used to assess the relationship between 30-day mortality and the individual patient and treatment characteristics. Variables were included in the model using the appropriate mathematical form. This was typically a linear relationship, but it was also necessary to include non-linear terms for some variables (eg, physiological measurements).
The risk model proved to have excellent discrimination, with a C-index of 0.863 (95% CI: 0.858, 0.868). The C-index ranges from 0.5 (no better than toss of coin) to 1 (perfect discrimination). The model also demonstrated good calibration (Figure 46). The calibration plot highlights the considerable heterogeneity in risk faced by patients undergoing emergency laparotomy. The average observed ONS 30-day mortality in the two groups with the highest risk are around 28% and 48%, respectively. Additional information about the risk prediction model is provided in the accompanying Technical Documents (www.nela.org.uk/reports).

NELA REPORT 2016 | 147
Figure 46 Risk adjustment calibration plot comparing the observed ONS 30-day mortality against that predicted by the model in deciles of predicted risk (Year 1 and Year 2 data combined)
0
10
20
30
40
50
0 10 20 30 40 50
ON
S 30
-day
mor
talit
y (%
)
NELA model predicted risk (%)
Observed Line of perfect correlation
We also examined the performance of the P-POSSUM model on the NELA patients, using its original coefficients. The discrimination of the P-POSSUM was still reasonably high, with a C-index of 0.803 (95% CI: 0.797, 0.809). However, the calibration plot for the P-POSSUM model (Figure 50) reveals that it no longer provides an adequate prediction of surgical risk among the cohort of high-risk patients. It now overestimates a patient’s risk of death. This may be due to differences between the NELA patients and those in the original cohort used to develop P-POSSUM. It may also be a reflection of the improvements in healthcare since the P-POSSUM model was first developed.
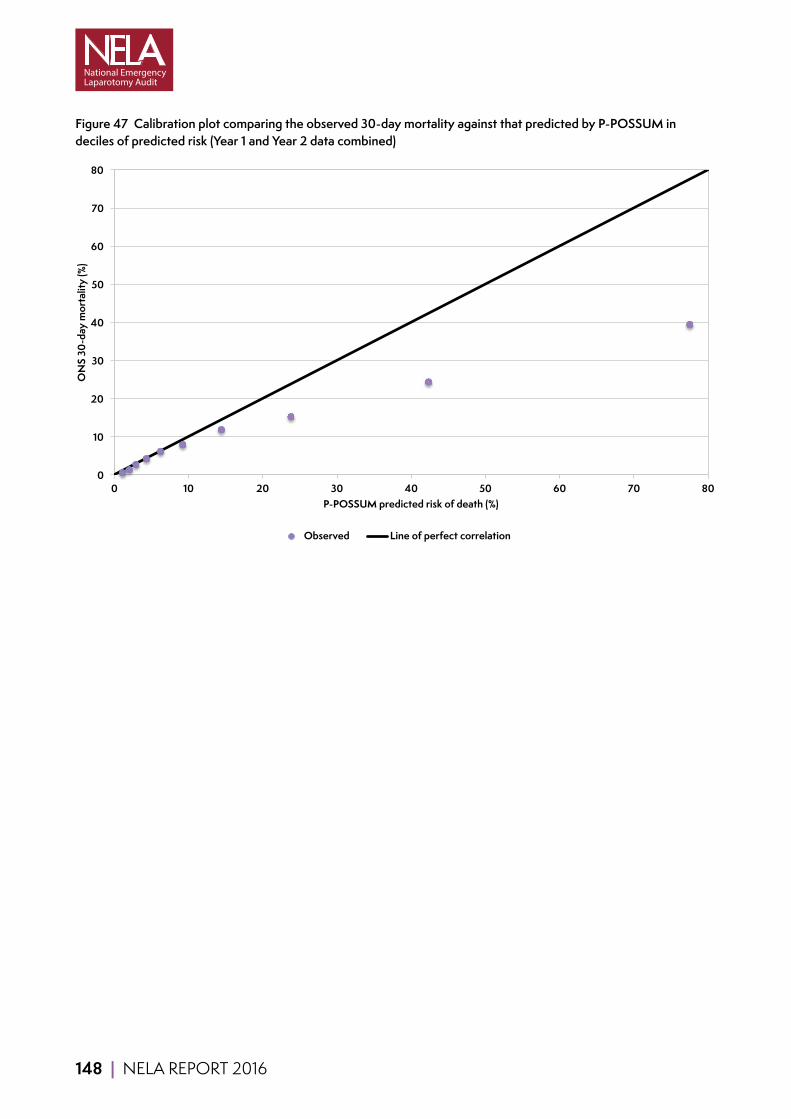
148 | NELA REPORT 2016
Figure 47 Calibration plot comparing the observed 30-day mortality against that predicted by P-POSSUM in deciles of predicted risk (Year 1 and Year 2 data combined)
0
10
20
30
40
50
60
70
80
0 10 20 30 40 50 60 70 80
ON
S 30
-day
mor
talit
y (%
)
P-POSSUM predicted risk of death (%)
Observed Line of perfect correlation
NELA REPORT 2016 | 149
21.4 STANDARDS OF CARE AND SUMMARY OF RECOMMENDATIONS
ASGBI EGS Emergency General Surgery: The future, a consensus statement (ASGBI, 2007)
ASGBI PS Patient safety: A consensus statement (ASGBI, 2009)
CQUIN Guidance for 2015/2016. NHS England/contracting and incentives team (CQUIN, 2015)
NCEPOD Age An age old problem: review of the care received by elderly patients undergoing surgery (NCEPOD, 2010)
NCEPOD EA Emergency Admissions: A journey in the right direction (NCEPOD, 2007)
NCEPOD KTR Knowing the risk: A review of the perioperative care of surgical patients (NCEPOD, 2011)
NHS 7 Day Services Seven day services clinical standards (NHS IQ, 2016)
NICE CG50 Clinical Guideline 50: Acutely ill patients in hospital (NICE, 2007)
NICE MTG3 Medical Technologies Guidance: CardioQ-ODM (NICE, 2011)
NSF older people The National Service Framework for Older People (DH, 2001)
RCS HR The Higher Risk General Surgical Patient: towards improved care for a forgotten group (RCSEng and DH, 2011)
RCS USC Emergency Surgery Standards for unscheduled surgical care (RCSEng, 2011)

150 | NELA REPORT 2016
KEY STANDARDS AGAINST WHICH CARE IS REPORTED IN THIS REPORT
Chapter 8 Patients admitted as an emergency should be seen by a consultant at the earliest opportunity. Ideally this should be within 12 hours and should not be longer than 24 hours. NCEPOD EA
All emergency admissions must be seen and have a thorough clinical assessment by a suitable consultant as soon as possible but at the latest within 14 hours from the time of arrival at hospital. NHS 7 Day Services
Chapter 9 Hospitals which admit patients as emergencies must have access to both conventional radiology and CT scanning 24 hours per day, with immediate reporting. NCEPOD EA
Consultant-directed diagnostic tests and completed reporting will be available seven days a week, within 1 hour for critical patients (i.e those for whom the test will alter their management at the time). NHS 7 Day Services
The delivery of quality clinical care is dependent on access to supporting facilities. Rapid access to CT imaging, U/S [ultrasound] scanning and laboratory analyses are critical to the efficient diagnosis, resuscitation and prioritisation of these patients. ASGBI EGS
Chapter 10 An assessment of mortality risk should be made explicit to the patient and recorded clearly on the consent form and in the medical record. NCEPOD KTR
Patients must be actively involved in shared decision making and supported by clear information from healthcare professionals to make fully informed choices about treatment and ongoing care that reflect what is important to them. This should happen consistently, seven days a week. NHS 7 Day Services
We recommend that objective risk assessment become a mandatory part of the preoperative checklist to be discussed between surgeon and anaesthetist for all patients. This must be more detailed than simply noting the ASA score. RCS HR
Patients with a predicted mortality ≥5% should be managed as ‘high risk’.
Chapter 11 Those with septic shock require immediate broad-spectrum antibiotics with fluid resuscitation and source control. RCS HR
Providers are expected to screen for sepsis all those patients for whom sepsis screening is appropriate, and to rapidly initiate intravenous antibiotics, within 1 hour of presentation, for those patients who have suspected severe sepsis, Red Flag Sepsis or septic shock. CQUIN 2015/2016
Trusts should ensure emergency theatre access matches need and ensure prioritisation of access is given to emergency surgical patients ahead of elective patients whenever necessary as significant delays are common and affect outcomes. RCS HR

NELA REPORT 2016 | 151
Chapter 12 Trusts should ensure emergency theatre access matches need and ensure prioritisation of access is given to emergency surgical patients ahead of elective patients whenever necessary as significant delays are common and affect outcomes. RCS HR
The time from decision to operate to actual time of operation is recorded in patient notes and audited locally. RCS USC
Delays in surgery for the elderly are associated with poor outcome. They should be subject to regular and rigorous audit and this should take place alongside identifiable agreed standards. NCEPOD Age
Chapter 13 Each higher risk case (predicted mortality ≥5%) should have the active input of consultant surgeon and consultant anaesthetist. RCS HR
A consultant surgeon (CCT holder) and consultant anaesthetist are present for all cases with predicted mortality ≥10% and for cases with predicted mortality >5% except in specific circumstances where adequate experience and manpower is otherwise assured. RCS USC
Each higher risk case (predicted mortality ≥5%) should have the active input of consultant surgeon and consultant anaesthetist. Surgical procedures with a predicted mortality of ≥10% should be conducted under the direct supervision of a consultant surgeon and a consultant anaesthetist unless the responsible consultants have actively satisfied themselves that junior staff have adequate experience and manpower and are adequately free of competing responsibilities. RCS HR
Chapter 14 There should be clear strategies for the management of intraoperative low blood pressure in the elderly to avoid cardiac and renal complications. Non-invasive measurement of cardiac output facilitates this during major surgery in the elderly. NCEPOD Age
Chapter 15 Patients with a predicted mortality ≥5% should be managed as ‘high risk’.
All high risk patients should be considered for critical care and as a minimum, patients with an estimated risk of death of ≥10% should be admitted to a critical care location. RCS HR
Intensive care requirements are considered for all patients needing emergency surgery. There is close liaison and communication between the surgical, anaesthetic and intensive care teams perioperatively with the common goal of ensuring optimal safe care in the best interests of the patient. RCS USC
The outcome of high-risk General Surgical patients could be improved by the adequate and effective use of critical care in addition to a better preoperative risk stratification protocol. ASGBI PS
Chapter 16 Clear protocols for the postoperative management of elderly patients undergoing abdominal surgery should be developed which include, where appropriate, routine review by an MCOP [Medicine for Care of Older People] consultant and nutritional assessment. NCEPOD Age
Comorbidity, disability and frailty need to be clearly recognised as independent markers of risk in the elderly. This requires skill and multidisciplinary input, including early involvement of Medicine for the Care of Older People. NCEPOD Age
All emergency inpatients must have prompt assessment by a multi-professional team to identify complex or on- going needs, unless deemed unnecessary by the responsible consultant. NHS 7 Day Services
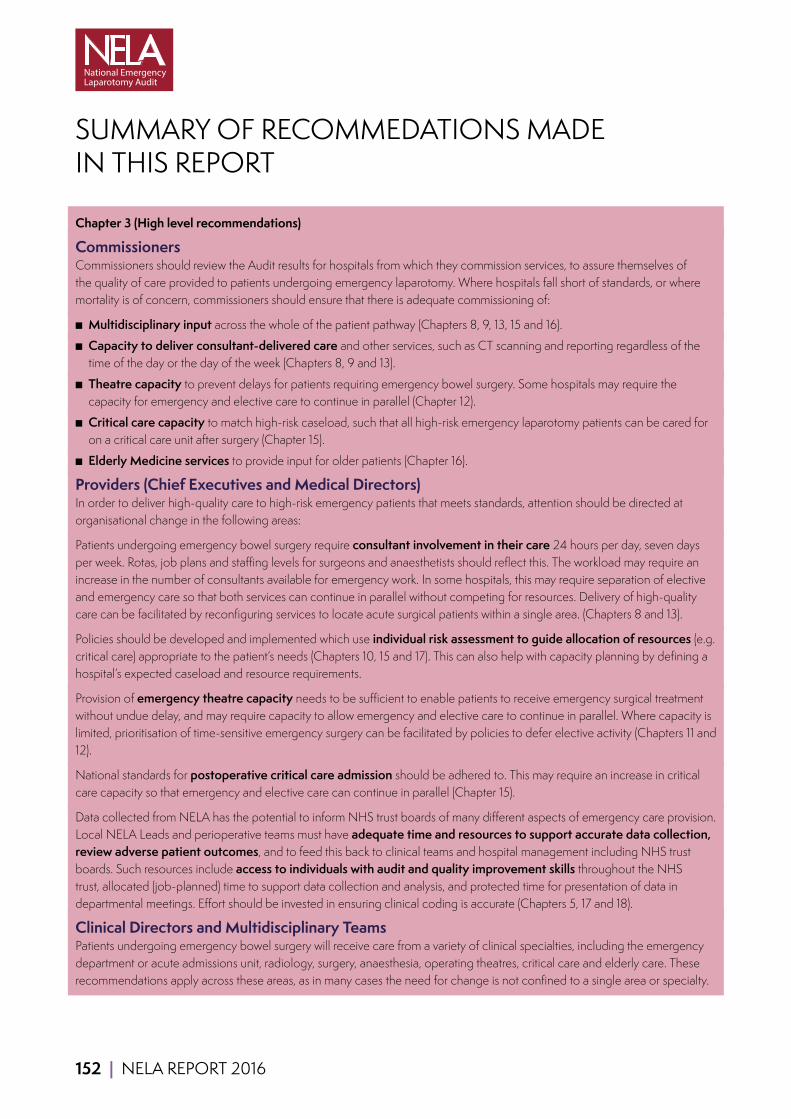
152 | NELA REPORT 2016
SUMMARY OF RECOMMEDATIONS MADE IN THIS REPORT
Chapter 3 (High level recommendations)
Commissioners Commissioners should review the Audit results for hospitals from which they commission services, to assure themselves of the quality of care provided to patients undergoing emergency laparotomy. Where hospitals fall short of standards, or where mortality is of concern, commissioners should ensure that there is adequate commissioning of:
■ Multidisciplinary input across the whole of the patient pathway (Chapters 8, 9, 13, 15 and 16).
■ Capacity to deliver consultant-delivered care and other services, such as CT scanning and reporting regardless of the time of the day or the day of the week (Chapters 8, 9 and 13).
■ Theatre capacity to prevent delays for patients requiring emergency bowel surgery. Some hospitals may require the capacity for emergency and elective care to continue in parallel (Chapter 12).
■ Critical care capacity to match high-risk caseload, such that all high-risk emergency laparotomy patients can be cared for on a critical care unit after surgery (Chapter 15).
■ Elderly Medicine services to provide input for older patients (Chapter 16).
Providers (Chief Executives and Medical Directors) In order to deliver high-quality care to high-risk emergency patients that meets standards, attention should be directed at organisational change in the following areas:
Patients undergoing emergency bowel surgery require consultant involvement in their care 24 hours per day, seven days per week. Rotas, job plans and staffing levels for surgeons and anaesthetists should reflect this. The workload may require an increase in the number of consultants available for emergency work. In some hospitals, this may require separation of elective and emergency care so that both services can continue in parallel without competing for resources. Delivery of high-quality care can be facilitated by reconfiguring services to locate acute surgical patients within a single area. (Chapters 8 and 13).
Policies should be developed and implemented which use individual risk assessment to guide allocation of resources (e.g. critical care) appropriate to the patient’s needs (Chapters 10, 15 and 17). This can also help with capacity planning by defining a hospital’s expected caseload and resource requirements.
Provision of emergency theatre capacity needs to be sufficient to enable patients to receive emergency surgical treatment without undue delay, and may require capacity to allow emergency and elective care to continue in parallel. Where capacity is limited, prioritisation of time-sensitive emergency surgery can be facilitated by policies to defer elective activity (Chapters 11 and 12).
National standards for postoperative critical care admission should be adhered to. This may require an increase in critical care capacity so that emergency and elective care can continue in parallel (Chapter 15).
Data collected from NELA has the potential to inform NHS trust boards of many different aspects of emergency care provision. Local NELA Leads and perioperative teams must have adequate time and resources to support accurate data collection, review adverse patient outcomes, and to feed this back to clinical teams and hospital management including NHS trust boards. Such resources include access to individuals with audit and quality improvement skills throughout the NHS trust, allocated (job-planned) time to support data collection and analysis, and protected time for presentation of data in departmental meetings. Effort should be invested in ensuring clinical coding is accurate (Chapters 5, 17 and 18).
Clinical Directors and Multidisciplinary Teams Patients undergoing emergency bowel surgery will receive care from a variety of clinical specialties, including the emergency department or acute admissions unit, radiology, surgery, anaesthesia, operating theatres, critical care and elderly care. These recommendations apply across these areas, as in many cases the need for change is not confined to a single area or specialty.
NELA REPORT 2016 | 153
In order to reduce variation in care and minimise delays, hospitals should implement appropriate pathways for the care of emergency General Surgical patients, starting at the time of admission to hospital or referral by another team. Where pathways
of care do already exist, Multidisciplinary Teams (MDT) should examine these in the light of audit data to determine their efficacy, and identify why standards are still not met. Care pathways should ensure patients are admitted under the most appropriate specialty, aid communication within the MDT, prioritise emergency resources, and aim to ensure that all processes of care are provided for each patient. Standardised pathways of care also facilitate audit and thereby highlight key areas for improvement. Pathways should cover the following areas:
■ Referral of patients for General Surgical review if they have been admitted under non-surgical specialties.
■ Identification of patients with signs of sepsis and prompt prescription and administration of antibiotics.
■ Identification and escalation of care of patients who would benefit from the opinion of a consultant surgeon before the next scheduled ward round.
■ Rapid request, conduct, and reporting of CT scans.
■ Routine documented assessment of the risk of complications and death from surgery.
■ Presence of consultant surgeon and consultant anaesthetist for high-risk patients with a predicted mortality ≥5%.
■ Admission to critical care for patients with a predicted mortality >10%.
■ Identification of patients who would benefit from input from Elderly Medicine specialists in their perioperative care.
Multidisciplinary Teams should hold regular joint meetings to continuously review essential processes of care (for instance, using the NELA Quality Improvement Dashboard) and review perioperative morbidity (including unplanned returns to theatre and admissions to critical care) and mortality following emergency laparotomy. This should include formal collaboration with hospital mortality review panels in order to bring about greater understanding of where improvement is needed (Chapters 17 and 18).
Continuous quality improvement informed by local data should involve monitoring the impact of pathway and process changes with time-series data (run charts). The NELA web tool provides automated dashboards that can be used for this purpose. Multidisciplinary Teams should ensure that they include members with a good understanding of quality improvement principles, such as the Model for Improvement and good data feedback practices (Chapter 18).
NELA Leads NELA Leads should review their local data to ensure case-submission and data completeness. Where data collection and entry is a problem, NELA Leads, supported by NHS trust resources, should work with clinical teams to improve this, to facilitate future audit and quality improvement (Chapter 5).
NELA Leads should actively promote completion of P-POSSUM data fields to ensure that risk estimation is accurate and avoid falsely elevated risk-adjusted hospital mortality rates (Chapter 5). This is in addition to the finding that standards of care were better met where risk assessment had been carried out.
Professional Stakeholder Organisations Professional stakeholders, such as Royal Colleges and Specialist Societies, should collaborate to:
■ Improve clarity and remove ambiguity in the wording of standards of care. This would be particularly welcome for standards for admission to critical care (Chapter 15).
■ Bring together standards in a single, unified document.
■ Highlight the issues to their members to ensure appropriate engagement.
Chapter 5 (Data quality and case ascertainment) Local NELA Leads and perioperative teams must have adequate time and resources to support data collection, and to feed this back to clinical teams and hospital management including NHS trust boards. The time required should be reflected in job plans (Chief Executives, Medical and Clinical Directors).
NELA Leads should review their local data to ascertain case-submission and data completeness (NELA Leads).
NELA Leads should actively promote completion of P-POSSUM data fields to ensure that risk estimation is accurate (NELA Leads).
154 | NELA REPORT 2016
Where data completeness is a problem, NELA Leads should work with clinical teams to improve this, to facilitate future audit and quality improvement (NELA Leads, MDT).
Chapter 8 (Consultant surgeon review within 14 hours of admission) Departments of surgery should use local NELA data to determine if the availability of duty consultant surgeons could be improved. Consultant surgeon rota patterns and job plans should be reviewed to ensure a consultant surgeon is always available to see patients within 14 hours of emergency admission, seven days per week This may involve a second scheduled ward round. This would be facilitated by locating acute surgical patients within a single ward as a priority (Medical and Clinical Directors).
Pathways for the identification and escalation of care of patients who would benefit from the opinion of a consultant surgeon before the next scheduled ward round should be implemented. In almost all units, this will require duty consultant surgeons to be freed from routine commitments such as clinics or elective operating lists. Forward thinking units manage this through a modern structure of Emergency General Surgery delivery featuring active ongoing senior input and a strong, well-functioning admission pathway (Medical and Clinical Directors).
Hospitals should review the quality of their clinical coding to ensure accuracy (Medical and Clinical Directors).
Hospitals who admit a high proportion of emergency laparotomy patients under specialties other than General Surgery should review their admission and referral pathways to ensure that patients requiring emergency laparotomy receive appropriate surgical input (Medical and Clinical Directors).
Chapter 9 (Preoperative imaging) Pathways should be implemented to facilitate rapid request and conduct of CT scans for patients who may require emergency laparotomy. These pathways should also support contemporaneous reporting by consultant or senior radiologists with expertise in interpreting emergency abdominal CT scans, so as not to delay subsequent treatment (Medical and Clinical Directors, MDT).
Multidisciplinary pathways should be established to prevent inappropriate delays to a patient undergoing surgery, especially once a consultant decision has been made. This will require cross-disciplinary cooperation between surgeons, anaesthetists, radiological and laboratory services and theatre and critical care staff (MDT).
Chapter 10 (Preoperative documentation of risk) Policies should be developed and implemented which use individual risk assessment to allocate resources (e.g. critical care) appropriate to the patient’s need (Medical and Clinical Directors).
When surgery is contemplated, a formal assessment of the risk of death and complications should be undertaken by a clinician and documented in the patient record. This information should be communicated to all members of the MDT in order to prioritise care and allocate appropriate resources. If surgery is undertaken, this risk assessment should be documented on the patient consent form (MDT).
P-POSSUM should continue to be used to assess risk. However clinicians should be aware that it over-predicts above ~15% risk and should not rely solely on P-POSSUM assessments of risk when deciding on benefits of treatment (MDT).
Chapter 11 (Timliness of care for patient with peritonitis) Any areas of the hospital that admit emergency General Surgical patients need to have robust mechanisms in place to identify patients with signs of sepsis and ensure prompt prescription and administration of antibiotics (Medical and Clinical Directors, MDT).
Medical and Clinical Directors should examine their emergency theatre provision in the context of their local Audit results, in order to determine whether sufficient resources are available to enable patients to receive emergency surgical treatment without undue delay (Medical and Clinical Directors).
Multidisciplinary Teams, including emergency departments and acute assessment units, should review their pathways of care for the administration of antibiotics in order to identify why delays occur (MDT).
Clinicians should regularly review Audit data on timing of administration of antibiotics and time to theatre in order to ensure that aims are being achieved (MDT).

NELA REPORT 2016 | 155
Chapter 12 (Timliness of arrival in theatre) Medical and Clinical Directors should examine their emergency theatre provision in the context of their local Audit results, in order to determine whether sufficient resources are available to enable patients to receive emergency surgical treatment without undue delay (Medical and Clinical Directors).
Multidisciplinary pathways should be established to prevent inappropriate delays in a patient undergoing surgery, especially once a consultant decision has been made. This will require cross-disciplinary cooperation between surgeons, anaesthetists, radiological and laboratory services, and theatre and critical care staff (MDT).
Theatre capacity should be sufficient to allow emergency and elective surgery to continue in parallel. Where capacity is limited, prioritisation of time-sensitive emergency surgery can be facilitated by policies to defer elective activity (Medical and Clinical Directors).
Commissioners should work with local providers to determine whether theatre capacity is sufficient to prevent potentially harmful delays to surgery in patients requiring emergency bowel operations. Some hospitals may require the capacity for emergency and elective care to continue in parallel (Commissioners and provider Chief Executives).
Chapter 13 (Consultant-delivered perioperative care) Local protocols should be developed which ensure a consultant-delivered service for emergency laparotomy patients. Rotas, job plans and staffing levels for surgeons and anaesthetists should allow a consultant-delivered service 24 hours per day, seven days per week (Medical and Clinical Directors).
Consideration should be given to increasing the number of consultants available for emergency surgical work as required to facilitate a consultant-delivered anaesthetic service 24 hours per day, seven days per week. This may be of particular relevance to hospitals in which on-call anaesthetists also cover other emergency services such as trauma, maternity or critical care (Medical and Clinical Directors).
Chapter 15 (Postoperative admission to critical care) Local audit data should be examined to determine if national standards for postoperative critical care admission are being met. Where compliance is poor, a change of local policies and reconfiguration of services should be considered to enable all high-risk emergency laparotomy patients to be cared for on a critical care unit after surgery (Commissioners and provider Chief Executives).
When surgery is contemplated, a formal assessment of the risk of death and complications should be undertaken by a clinician and documented in the patient record. This information should be communicated to all members of the MDT in order to prioritise care and allocate appropriate resources. If surgery is undertaken, this risk assessment should be documented on the patient consent form (MDT).
Professional stakeholders, such as Royal Colleges and Specialist Societies, should collaborate to improve clarity and remove ambiguity in the wording of standards of care for high-risk patients (Professional Stakeholder Organisations).
Chapter 16 (Postoperative assessment by an Elderly Medicine specialist) Increased Elderly Medicine input may require specific commissioning for this service (Commissioners and provider Chief Executives).
Pathways should be implemented to ensure that all patients aged 70 years or over, who undergo an emergency laparotomy, receive an assessment of multimorbidity, frailty and cognition to guide further input from an Elderly Medicine specialist (MDT).
Chapter 17 (Outcomes) Hospital teams should review the care received by patients who suffer adverse outcomes. This includes: (MDT)
■ Those who died following surgery.
■ Those who returned to theatre following their emergency laparotomy.
■ Those who had an unplanned escalation of care in the postoperative period
The results of these reviews should be discussed at multidisciplinary meetings, and cascaded to those involved in the planning and delivery of care to drive improvements (MDT, Medical and Clinical Directors).

156 | NELA REPORT 2016
Hospitals should ensure they have policies in place for the allocation of critical care resources according to risk, and clear escalation protocols for patients who deteriorate on the ward (Medical and Clinical Directors).
Chapter 18 (Quality improvement) NHS trusts should review their data in run charts using the NELA Quality Improvement Dashboard to monitor performance and inform them about the impact of organisational changes over time (Chief Executives, Medical and Clinical Directors, MDT).
Teams should endeavour to use quality improvement methodology such as the Model For Improvement when planning and executing changes to patient pathways or organisational processes (MDT, Medical and Clinical Directors).
Improvement teams should be multidisciplinary, and use good engagement and data feedback practices to implement changes. Patients’ or carers’ views and involvement should be sought at all stages of developing and making improvements (MDT, Medical and Clinical Directors)

NELA REPORT 2016 | 157
21.5 GOVERNANCE AND ORGANISATIONAL ARRANGEMENTS FOR NELA
Project BoardThe Project Board oversees the strategic direction and is responsible for monitoring all aspects of delivery of the project by the Project Team and sub-contractors, and is accountable to the stakeholder organisations.
ChairMr John Moorehead, President, Association of Surgeons of Great Britain and Ireland
MembersMr John Abercrombie, Royal College of Surgeons of England
Dr Liam Brennan, Royal College of Anaesthetists representative
Dr David Cromwell, Clinical Effectiveness Unit, Royal College of Surgeons of England
Ms Tasneem Hoosain, Health Quality Improvement Partnership
Dr Jeremy Langton, Royal College of Anaesthetists representative
Ms Lauren Osborne, patient representative
Mr Tim Russell, Intensive Care National Audit & Research Centre
Dr Yvonne Silove, Health Quality Improvement Partnership
Ms Lynne Smith, patient representative
Miss Gillian Tierney, Association of Surgeons of Great Britain and Ireland
Project TeamThe NELA Project Team is responsible for the ongoing delivery of the project.
ChairProfessor Mike Grocott, RCoA Council Member, Consultant in Anaesthesia and Critical Care Medicine, University Hospital Southampton
NELA National Clinical LeadDr Dave Murray, Consultant Anaesthetist, James Cook University Hospital, Middlesbrough
MembersMr Iain Anderson, NELA Surgical Adviser, Association of Surgeons of Great Britain and IrelandDr Michael Bassett, Research Fellow, NIAA Health Services Research CentreMr Martin Cripps, Net SolvingDr David Cromwell, NELA Methodologist, Clinical Effectiveness Unit, Royal College of Surgeons of EnglandMrs Emma Davies, Surgical Research FellowMs Sharon Drake, RCoA Director of Clinical Quality and ResearchMs Natalie Eugene, Statistician, Clinical Effectiveness Unit, Royal College of Surgeons of EnglandMr James Goodwin, RCoA Research ManagerDr Carolyn Johnston. NELA Quality Improvement Lead (St George's University Hospital)Dr Angela Kuryba, Statistician, Clinical Effectiveness Unit, Royal College of Surgeons of EnglandMr Jose Lourtie, RCoA Research SupervisorDr Ramani Moonesinghe, Director, NIAA Health Services Research CentreMr Dimitri Papadimitriou, NELA Research Team AdministratorProfessor Carol Peden, NELA Quality Improvement Adviser

158 | NELA REPORT 2016
Dr Thomas Poulton, Research Fellow, NIAA Health Services Research CentreDr Kate Walker, Statistician, Clinical Effectiveness Unit, Royal College of Surgeons of England
Clinical Reference Group (CRG)All relevant clinical professional and specialty stakeholders have direct input into the design and conduct of this Audit. The Clinical Reference Group consists of representatives from partner organisations as well as other stakeholders, including patients. The CRG acts in an advisory capacity to the Project Team, providing specialty-specific advice, and lay advice as appropriate. CRG meetings are chaired by Professor Mike Grocott and are attended by members of the Project Team.
List of organisations and membersAge Anaesthesia Association (AAA)Dr Irwin Foo, Immediate Past President, Age Anaesthesia Association
The Association of Anaesthetists of Great Britain and Ireland (AAGBI)Dr Richard Griffiths, Honorary Secretary AAGBI
The Association for Perioperative Practice (AfPP)Ms Jenny Abraham, Perioperative Specialist Laparoscopic Nurse Practitioner
The Association of Surgeons of Great Britain and Ireland (ASGBI)Mr Iain Anderson, Executive Board Member, ASGBI Mr Nicholas Markham, Executive Board Member, ASGBI
British Geriatric Society (BGS)Dr Jugdeep Dhesi, Chair of BGS Perioperative Care of Older People Undergoing Surgery, POPS
Emergency Laparotomy Network (ELN) Dr Simon Varley, Chair, Emergency Laparotomy Network Dr David Saunders, Secretary, Emergency Laparotomy Network
The Faculty of Intensive Care Medicine (FICM)Dr Diane Monkhouse, Consultant in Anaesthesia and Critical Care
Intensive Care National Audit & Research Centre (ICNARC)Mr Tim Russell, Technical Services Manager
The Intensive Care Society (ICS) Dr Andy Rhodes, Council Member, The Intensive Care Society
Quality ObservatoriesDr Gary Cook, Consultant Epidemiologist
The Royal College of Anaesthetists (RCoA)Dr Liam Brennan, President, RCoA Dr Jeremy Langton, Vice-President, RCoA Dr Hywel Jones, Consultant Anaesthetist
The Royal College of Emergency Medicine (RCEM)Dr Sally-Anne Wilson, Quality in Emergency Care Committee member, RCEM
The Royal College of Nursing (RCN)Mr J P Nolan, Nurse Adviser in Acute, Emergency and Critical Care
The Royal College of Radiologists (RCR)Dr Richard Wright, Radiology Audit Committee member
NELA REPORT 2016 | 159
The Royal College of Surgeons of England (RCS)Mr John Abercrombie, Council Member, Royal College of Surgeons of EnglandMr Mike Parker, Council Member, Royal College of Surgeons of EnglandMr Nicholas Lees, Consultant General and Colorectal SurgeonDr David Cromwell, Clinical Effectiveness Unit, Royal College of Surgeons of England
UK Clinical Director NetworkDr Mike Nevin, National Lead UK Clinical Director Network
Commissioning representativeDr Mark Spencer, Medical Director Quality and Service Design, NHS England
Patient representative – ElderlyMrs Joyce Colston
Patient representative – AnaesthesiaMs Lauren Osborne Ms Lynne Smith

The National Emergency Laparotomy Audit The Royal College of Anaesthetists National Institute of Academic Anaesthesia Health Services Research Centre
Churchill House 35 Red Lion Square London WC1R 4SG 020 7092 1676 [email protected] www.nela.org.uk