Embed Size (px)
Citation preview

Astronomy & Astrophysics manuscript no. pks2004-447 ©ESO 2021February 24, 2021
The first GeV flare of the radio-loud narrow-line Seyfert 1 galaxyPKS 2004−447
Andrea Gokus1, 2, V. S. Paliya3, S. M. Wagner2, S. Buson2, F. D’Ammando4, P. G. Edwards5, M. Kadler2, M. Meyer6,R. Ojha7, 8, 9, J. Stevens10, J. Wilms1
1 Remeis Observatory and Erlangen Centre for Astroparticle Physics, Universität Erlangen-Nürnberg, Sternwartstr. 7, 96049 Bam-berg, Germanye-mail: [email protected]
2 Lehrstuhl für Astronomie, Universität Würzburg, Emil-Fischer-Straße 31, 97074 Würzburg, Germany3 Aryabhatta Research Institute of Observational Sciences (ARIES), Manora Peak, Nainital 263001, India
e-mail: [email protected] Istituto di Radioastronomia - INAF, Via P. Gobetti 101, 40129 Bologna, Italy5 CSIRO Astronomy and Space Science, P.O. Box 76, Epping NSW 1710, Australia6 Friedrich-Alexander Universität Erlangen-Nürnberg, Erlangen Centre for Astroparticle Physics, Erwin-Rommel-Str. 1, 91058 Er-
langen, Germany7 NASA Goddard Space Flight Center, Greenbelt, MD 20771, USA8 Catholic University of America, Washington, DC 20064, USA9 University of Maryland, Baltimore County, 1000 Hilltop Cir, Baltimore, MD 21250, USA
10 CSIRO Astronomy and Space Science, 1828 Yarrie Lake Road, Narrabri NSW 2390, Australia
Received September 9, 2020; accepted February 20, 2021
ABSTRACT
Context. On 2019 October 25, the Fermi-Large Area Telescope observed the first ever γ-ray flare from the radio-loud narrow-lineSeyfert 1 galaxy PKS 2004−447 (z = 0.24). Prior to this discovery, only four sources of this type had shown a flare at Gigaelectronvoltenergies.Aims. We report on follow-up observations in the radio, optical-UV, and X-ray bands that were performed by ATCA, the Neil GehrelsSwift observatory, XMM-Newton, and NuSTAR, respectively, and analyse these multi-wavelength data with a one-zone leptonic modelin order to understand the physical mechanisms that were responsible for the flare.Methods. We study the source’s variability across all energy bands and additionally produce γ-ray light curves with different timebinnings to study the variability in γ-rays on short timescales during the flare. We examine the combined X-ray spectrum from 0.5–50 keV by describing the spectral shape with an absorbed power law. We analyse multi-wavelength datasets before, during, and afterthe flare and compare these with a low activity state of the source by modelling the respective spectral energy distributions (SEDs)with a one-zone synchrotron inverse Compton radiative model. Finally, we compare the variability and the SEDs to γ-ray flarespreviously observed from other γ-loud narrow-line Seyfert 1 galaxies.Results. At γ-ray energies (0.1–300 GeV) the flare reached a maximum flux of (1.3 ± 0.2) × 10−6 ph cm−2 s−1 in daily binning and atotal maximum flux of (2.7±0.6)×10−6 ph cm−2 s−1 when a 3-hour binning was used. With a photon index of Γ0.1−300GeV = 2.42±0.09during the flare, this corresponds to an isotropic γ-ray luminosity of (2.9 ± 0.8) × 1047 erg s−1. The γ-ray, X-ray, and optical-UV lightcurves that cover the end of September to the middle of November show significant variability, and we find indications for flux-doubling times of ∼ 2.2 hours at γ-ray energies. The soft X-ray excess, which is observed for most narrow-line Seyfert 1 galaxies, isnot visible in this source. During the flare, the SED exhibits large Compton dominance. While the increase in the optical-UV rangecan be explained by enhanced synchrotron emission, the elevated γ-ray flux can be accounted for by an increase in the bulk Lorentzfactor of the jet, similar to that observed for other flaring γ-ray blazars.Conclusions.
Key words. galaxies: active – galaxies: jets – gamma rays: galaxies – quasars: individual (PKS 2004−447)
1. Introduction
Narrow-line Seyfert 1 (NLSy 1) objects are typically located inthe centres of spiral galaxies. They differ from normal Seyfert 1galaxies through their unusual narrow lines originating fromthe broad line region (FWHM (Hβ) ≤ 2000 km s−1; Osterbrock& Pogge 1985). These lines are proportionally strong with re-gard to the forbidden [O iii] λ5007Å line, with a flux ratio of[O iii]/Hβ ≤ 3. Surprisingly, a small percentage (< 7%) ofNLSy 1 galaxies are found to be radio-loud (e.g. Komossa et al.2006; Singh & Chand 2018). When the Fermi Large Area Tele-
scope (LAT) detected γ-ray emission from the NLSy 1 galaxyPMN J0948+0022 (Abdo et al. 2009a) in 2009, these objects be-came the third class of active galactic nuclei (AGNs) to be de-tected at γ-ray energies. This discovery was soon followed bythe detection of three more γ-NLSy 1 galaxies based on data ac-cumulated over one year (Abdo et al. 2009b).
The second data release (DR2) of the Fourth Fermi-LATsource catalogue (4FGL; Abdollahi et al. 2020) reports nine γ-ray detected NLSy1 galaxies, though a few other studies haveproposed more identifications (see, e.g., Ciprini & Fermi-LAT
Article number, page 1 of 17
arX
iv:2
102.
1163
3v1
[as
tro-
ph.H
E]
23
Feb
2021

A&A proofs: manuscript no. pks2004-447
Collaboration 2018; Romano et al. 2018; Paliya et al. 2018).To distinguish them from non-γ-ray detected NLSy 1s, we re-fer to them as γ-NLSy 1s. Among the small sample of γ-NLSy 1 galaxies, four sources have shown at least one GeVflare with a luminosity comparable to blazar flares in the first11 years of Fermi observations. These sources are 1H 0323+342(Paliya et al. 2014), SBS 0846+513 (D’Ammando et al. 2012),PMN J0948+0022 (Foschini et al. 2011; D’Ammando et al.2015), and PKS 1502+036 (Paliya & Stalin 2016; D’Ammandoet al. 2016). Gamma-ray variability of days or weeks is a com-mon feature of blazars (e.g. Abdo et al. 2010). Furthermore,the more powerful blazar class of flat-spectrum radio quasars(FSRQs) appears to be more variable than the less luminous BLLacs (Rajput et al. 2020). Flaring γ-NLSy 1 galaxies thereforeconstitute a very interesting target for observations during statesof high activity since they seem to be scarce and so rarely showflares.
As postulated, for example by Peterson et al. (2000), centralblack holes in NLSy 1 galaxies exhibit high accretion rates forradio-quiet and radio-loud NLSy 1 galaxies alike; however, thereis an ongoing debate about the mass of their central engines.While deriving the mass via virial methods results in fairly lowblack hole masses of MBH < 108M (e.g. Grupe & Mathur 2004;Deo et al. 2006; Järvelä et al. 2017), other methods suggest thatblack hole masses of NLSy 1s are comparable to those in FS-RQs (e.g., Decarli et al. 2008; Marconi et al. 2008; Viswanathet al. 2019). Detailed discussions on this topic have recently beensummarised by D’Ammando (2019) and Paliya et al. (2019).
Because Seyfert galaxies generally belong to the class ofradio-quiet AGNs and are not detected in γ-rays, γ-NLSy 1sseem to contradict the AGN unification scheme (Urry &Padovani 1995). Their radio and γ-ray emission suggests thatrelativistic jets are present in these systems, indicating possi-ble evolutionary processes within these sources. Additionally,the nature of their host galaxies remains an open question.D’Ammando et al. (2018), for instance, found indications foran elliptical host galaxy for the γ-NLSy 1 PKS 1502+036, al-though Olguín-Iglesias et al. (2020) stated that a disk-like hostfits their observation better. A systematic study by the latter au-thors indicates that the hosts of radio-loud NLSy 1s are prefer-entially disk galaxies, with a spiral galaxy suggested as the hostfor PKS 2004−447. Furthermore, high-resolution near-infraredimaging of some of the NLSy1s has also revealed ongoinggalaxy mergers, thus suggesting a pivotal role played by suchmergers in triggering the jet launching (see, e.g., Paliya et al.2020). Therefore, given the small sample of known γ-ray NLSy1 galaxies and their unclear nature, each new study of one ofthese objects can help improve our understanding of the under-lying physical properties both in regard to their probable link toAGN evolution and to their role within the unified scheme ofAGNs.
The most recent γ-ray flare was detected fromPKS 2004−447 (z = 0.24; Gokus 2019). This is the firstGigaelectronvolt flare observed from this AGN. The sourceshowed a γ-ray flux of (1.1 ± 0.2) × 10−6 ph cm−2 s−1 in the0.1 − 300 GeV energy range on 2019 October 25 and continuedto stay at a high activity level on the following day. Its flux dur-ing the flare was a factor of ∼55 higher than its average flux asreported in the 4FGL catalogue (Gokus 2019). PKS 2004−447was one of the first γ-NLSy 1 galaxies seen by Fermi/LAT buthas never before shown an outburst comparable to blazar flares.Additionally, this AGN is of a somewhat mysterious nature asit does not show typical features compared to other similarlyclassified sources. In the X-rays it lacks a soft excess (see e.g.
Gallo et al. 2006; Orienti et al. 2015; Kreikenbohm et al. 2016),which is usually common in the spectra of NLSy 1 galaxies.In the radio band, PKS 2004−447 shows only a little extendedemission and a steep spectrum, suggestive of a compact-steep-spectrum (CSS) object (Oshlack et al. 2001; Gallo et al. 2006;Schulz et al. 2016). As shown by Schulz et al. (2016), thisbehaviour is unique among the small γ-NLSy 1 sample, andit is also extremely rare for γ-loud AGNs. There are only fiveCSS sources reported in the Fourth Fermi/LAT AGN catalogue(4LAC; Ajello et al. 2020).
We have carried out a multi-frequency campaign to studythis first γ-ray flaring event from PKS 2004−447, including ob-servations from NuSTAR, Swift, XMM-Newton, and the AustraliaTelescope Compact Array (ATCA). In this paper we present thefindings and conclusions of this dataset. We describe the datareduction in Section 2. We present the results of our variabil-ity analysis in Section 3.1 and the results of the X-ray analysisin Section 3.2, and we describe the model for the spectral en-ergy distribution (SED) in Section 3.3. We discuss our findingsin Section 4 and conclude in Section 5. We adopt a flat cosmol-ogy of H0 = 67.8 km s−1 Mpc−1, Ωλ = 0.692, and ΩM = 0.308(Planck Collaboration et al. 2016).
2. Observations and data reduction
2.1. Fermi Large Area Telescope observations
The LAT on board the Fermi satellite is a pair-conversion tele-scope. It has been in operation since 2008 (Atwood et al. 2009).LAT’s all-sky monitoring strategy provides a full coverage ofthe γ-ray sky every 3.2 h, that is two Fermi orbits. Our reduc-tion of the Fermi-LAT data follows the standard data reductionprocess1 and uses the Science Tools v11r04p00. We extractthose events suitable for an analysis2 with energies in the rangefrom 100 MeV to 300 GeV in a region of interest (ROI) of 15centred at the 4FGL position of PKS 2004−447. We ignore allevents with zenith angles ≥ 90, in order to exclude γ-rays orig-inating from Earth-limb effects. We use the post-launch instru-ment response function P8R3_SOURCE_V2, gll_iem_v07 as theGalactic diffuse model and iso_P8R3_SOURCE_V2_v1 to modelthe isotropic diffusion emission3. We use a maximum likelihoodanalysis to optimise our model parameters and determine thesignificance of the modelled γ-ray signal via the test statisticTS = 2∆ log(L), where L is the likelihood function that rep-resents the difference between models with and without a pointsource at the source coordinates (Mattox et al. 1996). Our modelincludes all 4FGL sources within 20 of PKS 2004−447. Follow-ing the 4FGL, we model the spectrum of PKS 2004−447 with alogarithmic parabola and discuss the significance of the spec-tral curvature during the time of the flare in Section 3.1. For allsources within 3 that have TS ≥ 10, as well as for the isotropicand Galactic diffuse components, we leave the normalisation freeto vary but keep the spectral parameters as reported in the 4FGL.For the sources not fulfilling these requirements, the normalisa-tion is set to their respective 4FGL value as well.
Data used for compiling the low-state SED are centred intime on Swift and XMM-Newton observations performed in 2012March and May, respectively (see Kreikenbohm et al. 2016).They cover 24 months from 2011 May 1 through 2013 May 1.1 https://fermi.gsfc.nasa.gov/ssc/data/analysis/documentation/2 We use SOURCE class events and set the following flags:(DATA_QUAL>0)&&(LAT_CONFIG==1)3 The background models are available athttps://fermi.gsfc.nasa.gov/ssc/data/access/lat/BackgroundModels.html
Article number, page 2 of 17

Gokus et al.: The first GeV flare of PKS 2004−447
Post flareFlarePre flare Fermi/LAT×10−7
2019/Nov/152019/Nov/012019/Oct/152019/Oct/01
15
10
5
0
15
10
5
0
NuSTARXMM-Newton
Swift/XRT×10−125
4
3
2
1
5
4
3
2
1
W2M2W1
UBV
5880558800587955879058785587805877558770587655876058755
0.6
0.4
0.2
0
0.6
0.4
0.2
0
F0.1
−300
GeV
[ph
cm
−2
s−1]
F0.5
−10
keV
[erg
cm
−2
s−1]
Modified Julian Date
FO
pti
cal/
UV
[mJy]
Fig. 1. Light curves in the γ-ray (top), X-ray (middle), and UV/optical (bottom) regimes from 2019 September 27 until 2019 November 19.TheFermi-LAT light curve shows the daily binned flux of the bins with TS ≥ 1. LAT light curve bins with TS < 1 are represented as 2σ upper limitarrows. All errors represent the 1σ uncertainties. For NuSTAR, the flux is interpolated down to 0.5 keV. The dark-grey shadowed region marks thetime range that is used for the flare SED, while the pre- and post-flare time ranges are shown in light grey.
We compute a daily-binned light curve from 2019 September26 to 2019 November 19, shown in Fig. 1, and keep the param-eters of all sources in the ROI fixed to the values derived by theanalysis over this time range. For a deeper investigation of theγ-ray variability in the source around the time of the γ-ray flare,we go to smaller time binnings (12 h, 6 h, and 3 h). We generatethese light curves similarly to the daily binned light curve, butover a slightly shorter time range, from 2019 October 10 to 2019November 14. Uncertainties for all Fermi-LAT light curves areshown at the 1σ level.
2.2. Neil Gehrels Swift Observatory observations
Following our detection of the flare of PKS 2004−447 on 2019October 25 (Gokus 2019), we triggered a target of opportunityobservation with the Swift satellite (Gehrels et al. 2004), whichwas performed on 2019 October 27 (D’Ammando et al. 2019).This observation was followed by several follow-up observationson 2019 October 28 and 30 and 2019 November 4, 6, 9, and13. The Swift observations were performed in photon-countingmode. In order to clean the data and create calibrated event fileswe used the standard filtering methods and xrtpipeline, asdistributed in the HEASOFT (v6.26) package. The spectrum ofthe source was accumulated from a circular region with a radiusof 35′′. The background region was defined by an annulus withan inner radius of 50′′ and an outer radius of 150′′ at the samecoordinates as the source region.
To derive the source fluxes and describe the spectral shape,we use the Interactive Spectral Interpretation System (ISIS, Ver-sion 1.6.2-40 Houck & Denicola 2000). Throughout this pa-per, we describe the absorption in the interstellar medium usingvern cross sections (Verner et al. 1996) and wilm abundances(Wilms et al. 2000). We use C-statistics (Cash 1979) and esti-
mate all uncertainties at 68% confidence (1 σ). The source spec-tra are binned after the algorithm described by Kaastra & Bleeker(2016) in order to ensure optimal binning. We adopt an absorbedpower law (tbabs*powerlaw) to model each spectrum. TheGalactic H i column density, NH,Gal = 2.97 × 1020 cm−2, is takenfrom the H i 4π survey (HI4PI; HI4PI Collaboration et al. 2016),modelled with tbabs (Wilms et al. 2000), and kept fixed duringthe fit. The observations confirm a high state of the X-ray fluxcompared to previous X-ray observations (an overview of all X-ray observations between 2004 and 2012 is given by Kreiken-bohm et al. 2016). The results are listed in Table 1 together withthe results from the XMM-Newton and NuSTAR data analysed inthis work. For the X-ray light curve we analyse each Swift/XRTobservation individually. For building SEDs we stack all Swiftobservations that fall into the time interval considered.
Simultaneously to the XRT, the Ultraviolet/Optical Tele-scope (UVOT) on board Swift was also observing the source. Weuse this instrument to derive optical and ultraviolet fluxes. Thedata are reduced using the standard procedures with a source re-gion of 5′′ and a background annulus with an inner radius of 7′′and an outer radius of 21′′. The optical-UV fluxes shown in thispaper are dereddened via the E(B−V) correction using the Fitz-patrick parametrisation (Fitzpatrick 1999). The magnitude val-ues are converted to flux units using the unfolding procedureimplemented in ISIS, which is a model-independent approachdescribed by Nowak et al. (2005). The optical-UV light curve isshown in Fig. 1.
2.3. XMM-Newton observations
In addition to the Swift monitoring, we performed an XMM-Newton ToO observation on 2019 October 31 with an exposuretime of 11 ks (ObsID: 0853980701). Archival data taken during
Article number, page 3 of 17
A&A proofs: manuscript no. pks2004-447
Table 1. Results from the analysis of the individual X-ray observations by Swift/XRT (S), XMM-Newton/MOS+pn (X) and NuSTAR/FPMA+B(N). We report unabsorbed fluxes in units of 10−12 erg cm−2 s−1. NB: The photon index reported for NuSTAR is the index for the full NuSTARenergy range from 3 to 79 keV and the flux is extrapolated down to 0.5 keV.
ObsDate Instrument ObsID Net Exposure [ks] Γ0.5−10 keV Flux0.5−10 keV Statistics (C-stat./dof)
2019-10-02 S 00081881003 1.2 1.3 ± 0.4 1.2+0.5−0.3 55.72/45
2019-10-05 S 00081881004 0.9 1.4 ± 0.4 1.1+0.5−0.3 27.30/45
2019-10-09 S 00081881005 2.0 1.02 ± 0.21 1.9 ± 0.4 40.03/452019-10-27 S 00032492020 2.9 1.62 ± 0.18 1.59+0.25
−0.22 59.59/46
2019-10-28 S 00032492021 2.0 1.14 ± 0.21 2.0+0.4−0.3 46.34/45
2019-10-30 S 00032492022 1.6 0.69+0.29−0.30 3.5+1.1
−0.9 61.51/45
2019-10-31 X 0853980701 11.2 1.424 ± 0.024 2.06 ± 0.05 97.23/802019-11-01 N 90501649002 30.1 1.31 ± 0.05 1.10 ± 0.04 357.54/3312019-11-04 S 00032492024 3.6 1.31 ± 0.15 1.90+0.29
−0.25 61.64/46
2019-11-06 S 00032492025 0.7 1.79+0.26−0.25 2.8+0.7
−0.6 33.31/45
2019-11-09 S 00032492026 3.4 1.97 ± 0.23 0.88+0.17−0.14 38.50/45
2019-11-13 S 00032492027 2.5 1.27 ± 0.19 1.9+0.4−0.3 50.87/45
the low state of the source were obtained from an observation in2012 May, which has been discussed in detail by Kreikenbohmet al. (2016). The observations by XMM-Newton (Jansen et al.2001) were performed with both the PN (Strüder et al. 2001)and the MOS (Turner et al. 2001) CCD arrays of the EuropeanPhoton Imaging Camera (EPIC). The observation of optical-UVemission was conducted with the Optical Monitor (OM; Masonet al. 2001).
The observation with the EPIC was performed in the SmallWindow Mode with a thin filter. We use standard methods of theXMM-Newton Science Analysis System (SAS, Version 18.0) toprocess the observation data files, and to create calibrated eventlists and images. We extract the source spectrum and a lightcurve for an energy range from 0.5 keV to 10 keV from a cir-cular region of 35′′ radius around the source. The background istaken from a circle with a radius of 60′′. For both the source andthe background spectra we extract the single and double eventpatterns for the EPIC-pn detector and all events for the EPIC-MOS detectors. Pile-up is negligible in the observation. We fitthe spectra of the EPIC-MOS and EPIC-pn detectors simultane-ously with an absorbed power law, while using the optimal bin-ning approach. The result is listed in Table 1 together with the re-sults from the analysis of Swift/XRT and NuSTAR observations.The X-ray flux of PKS 2004−447 seen by XMM-Newton shortlyafter the flare is also part of the X-ray light curve in Fig. 1.
The OM observed the source in the v, b, u, w1, and m2 filtersin imaging mode with an exposure time of 1200 s, 1200 s, 1200 s,1780 s, and 2200 s, respectively. The data were processed usingthe SAS task omichain and omsource. For the count rate toflux conversion we used the conversion factors given in the SASwatchout dedicated page 4. The optical/UV fluxes were dered-dened via E(B − V) correction, using the same approach as forSwift, and are included in the light curve shown in Fig. 1.
2.4. NuSTAR observation
We performed a ToO observation with the Nuclear Spectro-scopic Telescope Array (NuSTAR; Harrison et al. 2013) with an
4 https://www.cosmos.esa.int/web/xmm-newton/sas-watchout-uvflux.
exposure of 30 ks on 2019 November 1 (ObsID: 90501649002).We use standard methods of the software package NUSTARDAS(Version v1.8.0) distributed in HEASOFT and the calibrationdatabase (CALDB) 20190812 to reduce and extract the data forboth Focal Plane Modules A and B (FPMA, FPMB). We usenuproducts to create spectra and response files. We choose acircular region with 50′′ radius for the source region, and a cir-cle with 120′′ radius in a source-free region as the backgroundregion. We use the same binning method as we used for theSwift/XRT and XMM-Newton spectra and fit the spectra fromFPMA and FPMB simultaneously with an absorbed power lawfrom 3 to 79 keV. The result is given in Table 3. In order to com-pare the flux directly with the other X-ray observations in thelight curve in Fig. 1, we extrapolate the flux down to 0.5 keVand list this value for the flux in Table 1. Initial modelling of thedata shows a slight indication for a spectral hardening at higherenergies that is, however, also compatible with residuals causedby slight variations of the background level at the ∼10% level.In our final fits we therefore vary the normalisation of the back-ground by introducing a multiplicative constant that accounts forthis variation.
2.5. ATCA observations
As part of the TANAMI blazar monitoring programme, ATCAhas been observing PKS 2004−447 at multiple radio frequenciessince 2009(Stevens et al. 2012). The ATCA is an array of six22-m diameter radio antennas located in northern New SouthWales, at a latitude of −30 and altitude 237 m above sea level.Its baselines can be adjusted and its configuration is typicallychanged every few weeks. The longest possible baseline is 6 km.ATCA receivers can be quickly switched enabling observationsto be made over a large range of frequencies in a short periodof time. For our study, monitoring data between 5.5 GHz and40 GHz are collected for the pre-flare and the flaring states5. Thedata consist of snapshot observations of PKS 2004−447 coveringa duration of several minutes, which were calibrated against the
5 Supplementary data from the C 007 ATCA calibrator programmewere used.
Article number, page 4 of 17

Gokus et al.: The first GeV flare of PKS 2004−447
ATCA primary flux calibrator PKS 1934−638. Data reduction iscarried out in the standard manner with the MIRIAD softwarepackage6.
3. Results
3.1. Variability
Figure 1 shows the light curves for PKS 2004−447 based on thedaily-binned γ-ray emission, and individual X-ray observationsby Swift/XRT and XMM-Newton/EPIC, and optical-UV obser-vations by Swift/UVOT and XMM-Newton/OM. The γ-ray fluxstarted to rise on 2019 October 23 (MJD 58779). It reached adaily-averaged maximum of (1.2 ± 0.2) × 10−6 ph cm−2 s−1,which was maintained over about two days. After that, the fluxdecreased within two days, returning to the same flux levelas before the flare. In the 3 h binned γ-ray light curves, on2019 October 26 (MJD 58782.6), we find a maximum flux of(2.7±0.6)×10−6 ph cm−2 s−1. This is the highest γ-ray flux evermeasured for PKS 2004−447. Together with the spectral indexof Γ0.1−300GeV = 2.42±0.09 measured during the flare, we derivean isotropic γ-ray luminosity of (2.9 ± 0.8) × 1047 erg s−1. Thelight curves binned on different timescales are shown in Fig. 2.For all analyses that follow, we do not include any time bins withTS < 4, but, for visual purposes, we plot these data points as up-per limits in Fig. 1 and Fig. 2.
At X-ray energies (0.5–10 keV), the flux was highest on2019 October 30 (MJD 58786), with a flux of 3.3+1.1
−0.9 ×
10−12 erg cm−2 s−1 and a power law index of 0.8± 0.3. The shortexposure time of this observation results in poor constraints onthe spectral parameters. The optical emission in the V, B, and Ubands shows strong variations. The maximum flux occured on2019 October 27 (MJD 58783), which coincides with the timeof the γ-ray flare.
To quantify the variability, we first apply a χ2 test against thenull hypothesis that the emission from PKS 2004−447 is con-stant in each energy band. In the γ-ray band, we find a null-hypothesis probability of p < 0.006 for each of the light curves,regardless of their time binning, thus confirming variability. Witha p-value < 0.00001, the X-ray light curve shown in Fig. 1 ex-hibits significant variability as well. On shorter timescales, how-ever, no significant variability is detected in either the XMM-Newton (p = 0.06) or the NuSTAR (p ∼ 1) data. In the optical-UV band, strong variability (p < 0.03) at a level of up to a factorof five compared to the flux before the flare is observed with themaximum roughly coinciding with the γ-ray flare.
Variability is also seen in the ATCA radio light curves (seeFig. 3). This is in agreement with earlier work by Schulz et al.(2016), who discussed the radio variability of PKS 2004−447based on TANAMI/ATCA observations between 2010 and 2014and found moderate variability. Given that only two observa-tions are located in the time range in which we analysed the γ-and X-ray variability, we do not conduct the chi-squared test onthese. Following the ATCA calibrator database documentation7,we have flagged several epochs that were plotted in Schulz et al.(2016). We show an updated version of the PKS 2004−447 ra-dio light curve, including data up to early 2020. These data arepresented in Table A.1 of Appendix A1. The uncertainties re-ported are statistical only and do not include any systematic er-rors, which in general are known to be smaller than 5% in thecentimetre bands (Tingay et al. 2003).6 http://www.atnf.csiro.au/computing/software/miriad/7 https://www.narrabri.atnf.csiro.au/calibrators/calibrator_database_documentation.html
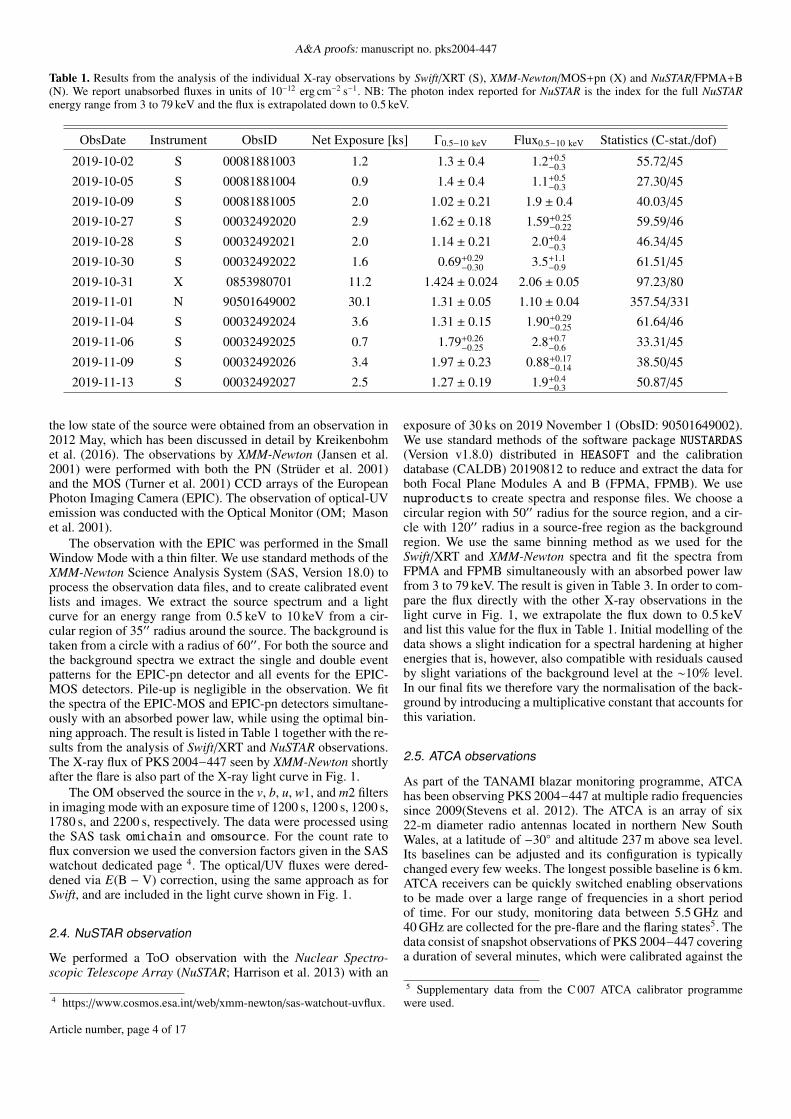
The radio emission of PKS 2004−447 through 2018 untilearly 2020 can be characterised by an overall rising trend inall radio bands. In the months prior to the γ-ray flare (markedby the dashed grey line in Fig. 3), PKS 2004−447 showeda relatively constant flux-density level of about 440 mJy at5.5 GHz and 350 mJy at 9 GHz. Full broadband radio spectra ofPKS 2004−447 were taken on 2019 October 4 and 2019 Novem-ber 22, namely about 21 days before and 28 days after the 2019October 25 γ-ray flare. Figure 4 shows a difference spectrum,which illustrates the difference between the spectra derived dur-ing each of these two epochs. While the higher frequencies showonly a mild increase in radio emission after the flare, the 5.5 GHzemission increased by about 25 mJy (∼6%). It is not possibleto determine whether this increase is related to the γ-ray flare.For other AGNs, delays of a few months have been reported be-tween γ-ray flares and subsequent radio flux density increases(e.g. Fuhrmann et al. 2014; Ramakrishnan et al. 2015).
To look further into the flare behaviour in γ-rays, theBayesian-block algorithm is applied (Scargle et al. 2013). Ac-cording to Meyer et al. (2019), a flare can be described as a groupof blocks, which is determined by applying the HOP8 algorithm.In this algorithm, each Bayesian block that surpasses a certainbaseline is assigned to belong to its highest adjacent block. Forthis work, we chose the mean flux of each light curve to rep-resent the baseline flux, as illustrated in yellow in Fig. 2. Thetotal duration of the flare can then be defined as the time rangebetween the beginning of the first block and the end of the lastblock above the baseline, while the peak is assumed to be locatedat the centre of the maximum block. This time range is definedas a HOP group9, for which we measure the rise time τrise fromthe beginning of the HOP-group to the peak, and the decay timeτdecay from the peak to the end of the HOP-group. We conserva-tively estimate the error on the edge of each Bayesian block to beas big as the binning of each respective light curve (e.g. ±1d indaily binning). To apply this method to the Fermi light curves ofPKS 2004−447, we calculate the Bayesian blocks as describedby Scargle et al. (2013), and set the parameter ncp_prior= 2.
A source is not necessarily detected significantly in eachlight curve bin, hence upper limits on the flux are usually re-ported (see e.g. the Fermi-LAT light curve in Fig. 1) in orderto give an indication about the trend of the flux of a source. Ina standard LAT light-curve analysis, it is not straightforward todeal with data bins that have a low test statistic. Moreover, thenumber of such low-significance flux bins typically increases fora finer binning. Specifically, this is problematic for the Bayesian-block point algorithm which assumes that the flux in each binfollows Gaussian statistics. For a low source significance thisassumption is not valid. A common approach is to ignore the up-per limits altogether as upper limits cannot be inserted as such inthe Bayesian-block algorithm, and therefore waive the informa-tion contained in data points with low significance, thus biasingthe analysis results. To avoid this, we take all data into accountand calculate best-possible flux values also in the case of low-significance data bins following the standard analysis procedure.For light-curve bins that have a low significance, a problem thatoccurs in the determination of the fluxes and their correspondinguncertainties with the Likelihood calculation is that the Likeli-hood fit does not converge and this can then yield unreasonably
8 The name HOP is not an acronym, but taken from the verb ’to hop’to each data element’s highest neighbour (Eisenstein & Hut 1998).9 Meyer et al. (2019) added an additional criterion requiring that themaximum block is at least five times above the average flux in order tosingle out only the brightest flares, which we drop in our analysis.
Article number, page 5 of 17

A&A proofs: manuscript no. pks2004-447
One day binned
2019/Nov/012019/Oct/15
15
10
5
0
15
10
5
0
12h binned15
10
5
0
15
10
5
0
6h binned20
10
0
20
10
0
3h binned
58800587955879058785587805877558770
30
20
10
0
30
20
10
0
Modified Julian Date
F0.1
−300G
eV
[10
−7
ph
cm
−2s−
1]
Fig. 2. Gamma-ray light curves of PKS 2004−447 during the 2019 GeV flare for the different time binnings of the LAT data. Time bins withTS < 1 have an estimated error that was derived using their 1σ upper limit value. For those bins we show the 2σ upper limits in grey to visuallyshow how many bins would have been rejected from the analysis otherwise. The Bayesian blocks are shown in red, while the baseline (average fluxduring the time range from 2019 October 10 to 2019 November 14) is shown in yellow. The dashed lines mark the time range chosen to constructthe broadband SED of the flaring state.
58500580005750057000565005600055500
600
500
400
300
200
100
20202019201820172016201520142013201220112010
40 GHz38 GHz
21.2 GHz19 GHz17 GHz
16.8 GHz9 GHz
5.5 GHz
Modified Julian Date
Flu
x[m
Jy]
Fig. 3. ATCA light curves taken from 2010−2020 in the λ4-cm (5.5 GHz, 9 GHz), λ15-mm (16.8 GHz, 17 GHz, 19 GHz, and 21.2 GHz) andλ7-mm band (38 GHz, 40 GHz). The time of the flare is marked by a dashed grey line.
small values for the flux uncertainties. This can have a stronginfluence on the Bayesian-block algorithm. Hence, to avoid thisissue, rather than relying on the Likelihood to provide the uncer-tainties on the flux values, we calculate the 1-sigma upper limitsfor the flux in the low-flux bins and use the difference betweenthese upper-limit values and the flux returned by the Likelihoodas a conservative proxy for the magnitude of the flux uncertain-
ties. In this way our light curve does not exhibit gaps and theBayesian-block algorithm can be applied to a continuous dataset.
The results from the Bayesian-block algorithm are shown inred in Fig. 2. Following Meyer et al. (2019) we define the flareasymmetry via
A =τrise − τdecay
τrise + τdecay. (1)
Article number, page 6 of 17
Gokus et al.: The first GeV flare of PKS 2004−447
2015105
30
20
10
0
-10
Frequency [GHz]
St 2
−St 1
[mJy]
Fig. 4. Difference spectrum derived from the radio observations 21 daysbefore (t1) and 28 days after (t2) the flare. The dashed line marks thezero change of the flux.
Table 2. Flare lengths in days for the different binnings of the Fermilight curves. The times τrise and τdecay are derived via the HOP algorithmapplied on the Bayesian block analysis. A is the asymmetry as definedin Eq. 1.
τrise [d] τdecay [d] ADaily 3.5 ± 1 6.5 ± 1 −0.30 ± 0.1512 h 3.0 ± 0.5 2.5 ± 0.5 0.09 ± 0.136 h 1.5 ± 0.25 1.5 ± 0.25 0.00 ± 0.123 h 1.625 ± 0.125 1.625 ± 0.125 0.00 ± 0.05
Uncertainties are obtained using Gaussian error propagation.The results are shown in Table 2.
The asymmetry values depend on the binning size chosenfor the light curve: For the daily-binned light curve, the proce-dure yields an asymmetry value A < 0, indicating a faster risethan decay of the flare. The 12-hour binned light curve resolvesmore structure and a local dip at MJD 58785 followed by anincreased flux level separated from the flare. Due to this the re-sulting Bayesian blocks indicate a slightly faster decay than rise(A > 0). The 6- and 3-hour binning, in turn, resolve this to con-sist of a very short and a longer symmetric flare. We focus on thelatter, which lies within the time range chosen to construct theSED of the flaring state as indicated with dashed lines in Fig. 2.The properties of this flare and the corresponding higher bin-nings are reported in Table 2, but it is important to note that the6- and 3-hour flares only represent a fraction of the daily and 12-hour one. Furthermore, the 6- and 3-hour binned flares consistof one block only which, by definition, results in A = 0. Thus,the perceived flare symmetry is most likely due to the analysisprocedure and limited sensitivity rather than actual symmetry ofthe flux behaviour and the true flare shape remains unknown. In-terestingly, nine days after the main flare a second, shorter flareis identified by the Bayesian-block algorithm in all light curvesbut the daily-binned one. This demonstrates that the γ-ray vari-ability of the source takes place on sub-day scales. What appearsto be one flare in daily binning is shown to consist of three inde-pendent flares in 6- and 3-hour binning. Unfortunately, the sen-sitivity of the instrument is not high enough to fully resolve thisstructure. In general, care has to be taken in the interpretation ofBayesian flare-duration studies by considering and testing differ-ent bin sizes.
To quantify this sub-dayscale variability, we scan all Fermilight curves for significant jumps in flux between adjacent datapoints and calculate the minimum doubling and halving times.The most significant flux difference (∼2.88σ) between adja-cent data points is found in the 6-hour binned light curve atMJD 58792.0, during the second, shorter flare. We compute a
flux-doubling timescale of τd = 2.2 ± 0.8 hours, assuming anexponential rise (Zhang et al. 1999).
We search for the presence of spectral curvature in the γ-ray spectrum of the brightest state during the flare (MJD 58781-58784) and obtain the curvature via
TScurve = 2(logL(logparabola) − logL(powerlaw)) (2)
from Nolan et al. (2012). Our analysis yields TScurve = 11.66,providing tentative evidence for the presence of curvature in theγ-ray spectrum. Although the photon index of 2.42 ± 0.09 mea-sured during the flare is marginally harder than the average pho-ton index of 2.60±0.05 reported in 4FGL (Abdollahi et al. 2020),the difference is not large enough to claim that spectral harden-ing has taken place during the flare. PKS 2004−447 is signifi-cantly detected up to an energy of 3 GeV during the flare. Theslight curvature of the spectrum and the increasing flux thresh-old for detection are responsible for the non-detection at higherenergies. Attenuation of the γ-ray emission seen by Fermi-LATdue to pair production with the extragalactic background light(EBL) is negligible at these energies for the redshift (z = 0.24)of PKS 2004−447.
3.2. Analysis of the X-ray spectra
A feature often seen in X-ray spectra of NLSy 1 galaxies is asoft excess below 2 keV (Vaughan et al. 1999; Grupe 2004).Previously, Gallo et al. (2006) found an indication of a softexcess in PKS 2004−447 in XMM-Newton data from 2004,while the source was in a higher state. However, Orienti et al.(2015) and Kreikenbohm et al. (2016) did not find an excess forPKS 2004−447 during its low state in 2012, and Kreikenbohmet al. (2016) could not confirm the excess in the data from 2004.
Given that the source showed its brightest X-ray flux com-pared to previous observations during the γ-ray flare reportedhere, we search for an excess below 2 keV in the XMM-Newtonspectrum. We apply a simple, unbroken power law model withGalactic H i absorption. Similar to the analysis of the individ-ual X-ray spectra, we use C-statistics (Cash 1979) and esti-mate all uncertainties at 1σ confidence. All spectra are binnedfollowing the optimal binning procedure of Kaastra & Bleeker(2016). Modelling both the spectra obtained with XMM-Newtonand NuSTAR individually between 3 and 10 keV with a powerlaw yields compatible values for the power-law indices for bothinstruments (Γ3−10 keV = 1.33 ± 0.09 for XMM-Newton vs.1.37 ± 0.10 for NuSTAR). Although the observations are sepa-rated by one day, this result justifies the use of the spectra fromboth instruments for a combined analysis.
First, we fitted the data in the full energy range from0.5 keV to 79 keV with a fixed NH, which yields a good fitwith χ2
red = 1.18 (721.1/608) and a best-fit power-law index ofΓ = 1.45 ± 0.02. Freeing the NH parameter, we find an upperlimit of ≤ 0.75 times the Galactic value for the absorption, mean-ing there is no evidence for significant intrinsic absorption inPKS 2004−447. Therefore, we kept this parameter fixed at theGalactic value in the further analysis.
To search for a soft excess, we fitted the spectra again, butonly for the 2−79 keV band, and extrapolated the best fit down to0.5 keV. We show the EPIC-pn and EPIC-MOS spectra in Fig. 5,where the fits to the full and the hard energy range are shown asa solid and a dashed line, respectively. For plotting purposes, theXMM-Newton spectra are binned with a signal-to-noise (S/N) ra-tio of 5 per energy bin, and the NuSTAR spectra with a S/N ratio
Article number, page 7 of 17

A&A proofs: manuscript no. pks2004-447
0.80.5
10−1
NuSTAR/FPMA+BXMM/EPIC-MOS
XMM/EPIC-pn10−1
10−2
10−3
10−4
0.5 − 50 keV : χ2/d.o.f. = 721.1/6082
1
2 − 50 keV : χ2/d.o.f. = 595.3/508
5020520.5 101
2
1
Counts
s−1
keV
−1
Rati
o
Energy [keV]
Rati
o
Fig. 5. XMM-Newton and NuSTAR spectra withthe best-fit results of an absorbed power-lawmodel. For plotting purposed only the spec-tra are binned to a S/N of 5 and 3 for XMM-Newton and NuSTAR, respectively. Bins fromthe NuSTAR spectrum are only shown up to50 keV, because at energies above this, no sig-nificant bin for the given S/N value is found.Upper panel: EPIC pn (blue), MOS (red) andFPMA/FPMB (yellow) data together with thebest fits for the full (0.5-80 keV) energy range(solid line) as well as the hard (2-80 keV) energyrange (dashed line). The zoom window showssmall deviations between the fits of the full andthe hard energy range. Middle panel: Data-to-model ratio for the best fit to the full energyrange. Lower panel: Data-to-model ratio for thebest-fit to the hard energy range with extrapolat-ing the model down to 0.5 keV.
of 3. The fit results in χ2red = 1.17 (595.3/508) and Γ = 1.45+0.01
−0.02.This power-law index agrees with that obtained from modellingthe full fitted energy range. Describing the data with a brokenpower law also yields no evidence for a soft excess. We there-fore conclude that there is no evidence for a soft excess in theX-ray spectrum of PKS 2004−447 during the 2019 October out-burst as the fits are indistinguishable.
The presence of an iron Kα line at 6.4 keV is also a com-mon feature in NLSy 1 galaxies. Among the small γ-NLSy 1sample, however, only 1H 0323+342 shows an indication for aniron-line feature. For our data, adding an unresolved Gaussianline at 6.4 keV does not improve the fit statistics. We determinean upper limit for the equivalent width of EW6.4 keV ≤ 73 eV atthe 90% confidence level. This limit is slightly less constrainingthan what has been reported for this source in previous analyses(Gallo et al. 2006; Orienti et al. 2015; Kreikenbohm et al. 2016).
The photon index derived from the XMM-Newton observa-tion is harder compared to the values derived from the low stateanalysed by Orienti et al. (2015) and Kreikenbohm et al. (2016),This fits into the ’harder-when-brighter’ behaviour of blazars,more precisely BL Lacs (e.g. Giommi et al. 1990; Wang et al.2018). During an XMM-Newton observation in 2004, and alsoat the end of 2013 during a monitoring campaign with Swift,PKS 2004−447 was in a bright state as well. However, a spec-tral hardening was not observed at these times (Gallo et al.2006; Kreikenbohm et al. 2016), which suggests that differentprocesses might be responsible for the X-ray variability that ispresent on monthly and yearly timescales.
3.3. Spectral energy distribution
Due to X-ray and optical-UV observations ∼20 days before, dur-ing, and after the flare, we can construct the broadband SEDsfor PKS 2004−447 and study the evolution of the SEDs over theflaring period. We construct three SEDs, covering the time spansof a pre-flare state of the source (MJD 58754–58770), the flar-ing period (MJD 58781–58784), and the post-flare period rightafter the γ-ray flare (MJD 58787–58789). These time ranges aremarked in Fig. 1. We also consider a low activity state of thissource for comparison, adopting the period from Kreikenbohmet al. (2016). The Fermi-LAT data used for the low-state SED arecentred on XMM-Newton and Swift observations in 2012 Mayand March, respectively, and cover 24 months from 2011 May 1through 2013 May 1.
We can describe the broadband SEDs of PKS 2004−447 forall four activity states with a simple synchrotron inverse Comp-ton radiative model (see, e.g. Sikora et al. 2009; Dermer &Menon 2009; Ghisellini & Tavecchio 2009). In particular, theemission region is assumed to be spherical (radius Rblob), mov-ing along the jet axis with the bulk Lorentz factor Γb. The emis-sion region is also considered to cover the entire cross-section ofthe jet whose semi-opening angle is assumed to be 0.1 radian.We have assumed a viewing angle of 2, similar to that adoptedin the modelling of beamed AGNs (cf. Ghisellini & Tavecchio2015). Considering a significantly larger viewing angle woulddrastically reduce the Doppler boosting (e.g. Dermer 1995). In-deed, the observation of the large-amplitude γ-ray flare from thesource indicates a significant Doppler boosting as explained inthe next section, hence supporting a small viewing angle.
In our model, a relativistic population of electrons fills theemission region and emits synchrotron and inverse Comptonradiation in the presence of a uniform but tangled magneticfield B. The energy distribution of the electrons, with minimumand maximum energies of γmin and γmax, respectively, follows asmooth broken power law of the type
Q(γ) = Q0γ−s1
b
(γ/γb)s1 + (γ/γb)s2, (3)
where γb is the break Lorentz factor, s1 and s2 are the spectralindices of the power law below and above γb, and Q0 is a nor-malisation constant.
We include various sources of seed photons in the compu-tation of the inverse Compton radiation caused by the relativis-tic electrons present in the jet. Sources include the synchrotronphotons produced within the emission region (synchrotron selfCompton or SSC, see, e.g. Finke et al. 2008; van den Berg et al.2019) and thermal emission originating outside the jet (so-calledexternal Compton or EC process; e.g. Sikora et al. 1994; Błaze-jowski et al. 2000). For the latter, we adopt radiation emitted bythe accretion disk, X-ray corona, broad line region (BLR), andthe dusty torus. The comoving-frame radiative energy densitiesof these AGN components have been adopted following the pre-scriptions of Ghisellini & Tavecchio (2009) and are used to de-rive the EC flux. Jet powers are calculated assuming a two-sidedjet and equal number density of electrons and protons, mean-ing we do not consider the presence of pairs in the jet (see, e.g.Pjanka et al. 2017). Protons are assumed to be cold and to par-ticipate only in carrying the jet’s momentum.
Article number, page 8 of 17

Gokus et al.: The first GeV flare of PKS 2004−447
We generate the broadband SEDs following the methodol-ogy described in Sect. 2 and reproduce them using the modeloutlined above. The results are shown in Fig. 6 and the associ-ated spectral flux values and SED parameters are presented inTables 3 and 4.
4. Discussion
4.1. Variability
The detection of a γ-ray flare from PKS 2004−447 providesmore observational evidence supporting the blazar-like be-haviour of γ-NLSy 1 galaxies (see also e.g. Baldi et al. 2016).In general, γ-ray variability is an indicator for the presenceof a closely aligned, relativistic jet. For blazars variability ontimescales as short has minutes is commonly observed at TeVenergies (e.g. Rieger & Volpe 2010; Aleksic et al. 2011), butsuch short timescales have only been observed in few sources atGeV energies (e.g. Meyer et al. 2019).
It has been proposed that γ-NLSy 1s represent the startof the life of an AGN, when the central black hole massis still below 108M and the source appears not as brightas a full-grown FSRQ (Mathur 2000; Foschini 2017; Paliya2019). Nevertheless, the detection of blazar-like short-term vari-ability in γ-NLSy 1 galaxies, which has been seen previouslyin 1H 0323+342 (flux doubling timescales of ∼ 3h; Paliyaet al. 2014) and PKS 1502+036 (variability on 12 h timescales;D’Ammando et al. 2016), suggests that the physical mechanismsoperating in the relativistic jet of γ-NLSy 1s are similar to thoseworking in blazar jets resulting in fast γ-ray variability (e.g.Shukla & Mannheim 2020). For PKS 2004−447, we find indica-tions for sub-daily variability with flux doubling times as shortas 2.2 hours at a 2.8σ level.
We note that if we consider only GeV flares with fluxesabove 10−6 ph cm−2 s−1, the few observed flares by γ-NLSy 1galaxies lasted roughly 1–4 days. Blazar flares reported from sin-gle sources at γ-ray energies have a tendency to be brighter, lastlonger, and for some sources occur more often, but a strong biastowards the most luminous and extreme detections exists dueto the different sensitivities and observing constraints of space-based and ground-based γ-ray telescopes: While the large fieldof view and observing strategy of Fermi-LAT offers unbiased all-sky observations of many blazars in the GeV energy regime, itsrelatively small collection area renders it less sensitive to weakflares. In the TeV energy range Cherenkov telescopes have largecollection areas giving them good sensitivity to short time vari-ability, but with their relatively small fields of view and low dutycycles, their observations are limited to a smaller sub-sampleof targeted observations on blazars. Even though observing pro-grammes often include scheduled observations on a selection ofblazars during the parts of the year that they are visible fromthe ground, many blazar observations are triggered and there-fore take place during a particularly active period. This leadsto an under-reporting of short, less luminous blazar flares, whichcould in turn belong to a class of less luminous blazars that mightbe missing in the AGN evolution scenario.
4.2. Physical interpretation of the SED parameters
We now turn to the interpretation of the SED of PKS 2004−447.We first discuss the low activity state SED of the source beforeconsidering the γ-ray flaring epochs. The motivation is to firstderive the quiescent-level SED parameters and then to explainthe flaring-state SEDs while changing the minimum number of
input parameters. This approach may permit us to understand theprimary factors responsible for the γ-ray flare.
We have used the Hβ emission line dispersion (1869 km s−1)and luminosity (1.62 × 1042 erg s−1) reported in Foschini et al.(2017), which were calculated from the optical spectrum of PKS2004−447 published in Drinkwater et al. (1997) to derive a valueof the mass of the black hole of MBH = 7× 10⁷M. This value issimilar to that usually determined for radio-loud NLSy 1 galax-ies (Foschini et al. 2017) but lower than typical blazars (e.g.Shaw et al. 2012). Interestingly, Baldi et al. (2016) have reporteda MBH of 6 × 10⁸ M from the spectropolarimetric observationof PKS 2004−447. Furthermore, the accretion disk luminosityreported in Foschini et al. (2017, Ldisk = 4.8 × 1044 erg s−1) isnot supported by the shape of the low activity state optical-UVspectrum of PKS 2004−447. This is because the radiation fromsuch a luminous accretion disk should be detectable in the formof a strong big blue bump at optical-UV frequencies, especiallyduring the low jet activity state. As can be seen in the top leftpanel of Fig. 6, no such feature was observed. Rather, by re-producing the observed optical-UV emission with the combinedsynchrotron and accretion disk spectra, we have constrained theLdisk value to 2 × 1043 erg s−1. A larger Ldisk value would be indisagreement with the data. For the adopted values of MBH andLdisk, the accretion rate in Eddington units is ∼0.4% of the Ed-dington one. This is lower than ∼1%, which is typically foundfor radiatively efficient accreting systems, that is AGNs exhibit-ing broad emission lines (e.g. Ghisellini et al. 2017; Paliya et al.2019). This observation indicates that PKS 2004−447 could beone of the rare AGNs where the accretion process can be radia-tively efficient even with such a low level of accretion activity(see, e.g. Fig. 6 of Best & Heckman 2012).
For a look at the evolution of the SED we start with thelow activity state. There, the infrared-to-ultraviolet (IR-to-UV)spectrum of PKS 2004−447 is well explained by the synchrotronemission. We note that the emission from a giant elliptical galaxycould explain part of the observed IR-optical SED. Though thewavelength at which the host galaxy emission peaks (∼1.5 mi-cron) is not covered in our multi-band follow-up campaign, theobserved flux variability and the overall shape of the optical-UVspectrum (Fig. 1 and Fig. 6) point to the synchrotron origin ofthe observed emission.
The shape of the steeply falling optical-to-UV SED enablesus to constrain the high-energy spectral index of the particlespectrum, s2, and also the break, γb, and maximum energy of theemitting electron population, γmax. On the other hand, we use theshape of the X-ray spectrum to constrain the low-energy particlespectral index, s1. The model fails to explain the low-frequencyradio data because compact emission regions are synchrotron-self absorbed at low radio frequencies. Additional emission com-ponents on larger scales (approaching parsec scales and beyond)dominate the observed radio emission, but are not included inthe model.
In the low activity state, the X-ray emission is mainly due toSSC. The level of SSC along with the constrained synchrotronemission allows us to derive the size of the emission region andthe magnetic field (see Table 3). The γ-ray emission is explainedwith the external Compton process with seed photons providedby the dusty torus. This sets the location of the emission regionoutside the BLR but inside the dusty torus. The shape of the γ-ray spectrum provides further constraints to s2. Overall, the de-rived SED parameters during the low activity state are similar toprevious studies (Paliya et al. 2013; Orienti et al. 2015). Thereare a few minor differences, for example the large bulk Lorentzfactor reported by Orienti et al. (2015), which could be mainly
Article number, page 9 of 17
A&A proofs: manuscript no. pks2004-447
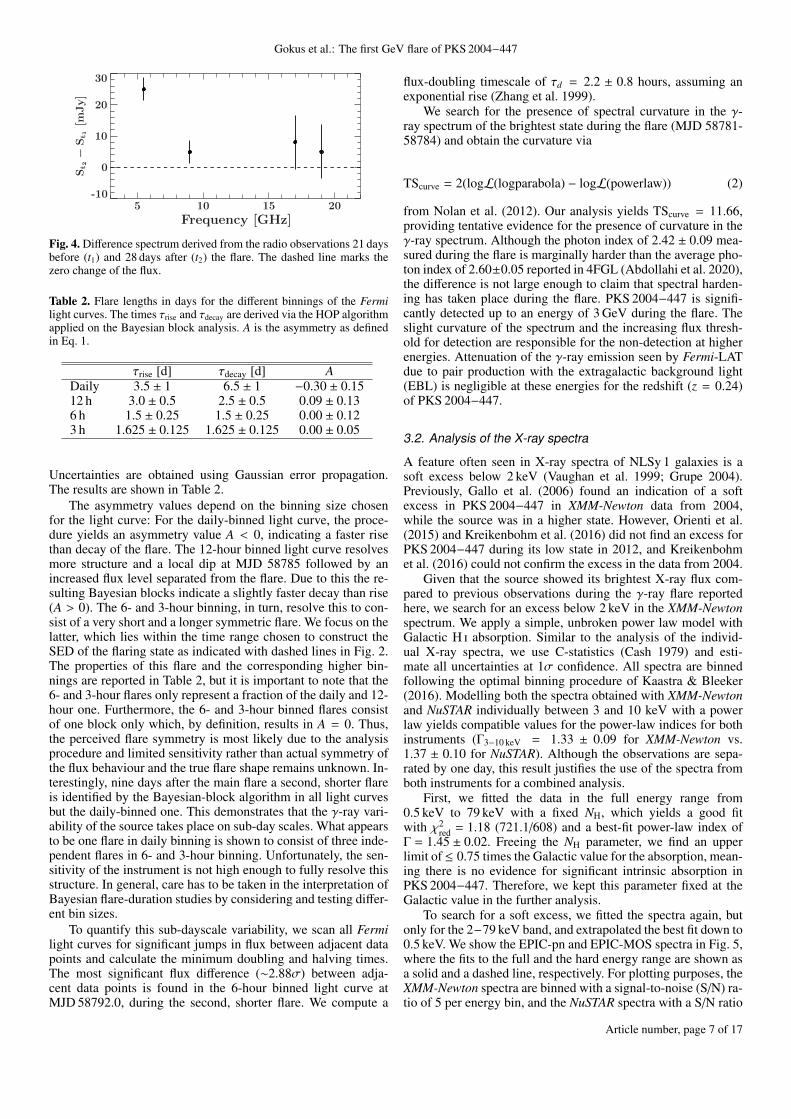
Table 3. Summary of the analysis of each individual energy range for each SED.
Gamma-rayActivity state Time bin Γ0.1−300 GeV F0.1−300 GeV TS
(MJD) (10−8 ph cm−2 s−1)
Low activity 55682−56413 2.39±0.13 1.2±0.3 50.4Pre-flare 58754−58770 2.62±0.22 16±4 38.8
Flare 58781−58784 2.42±0.09 130.0±11.6 472Post-flare 58787−58789 2.22±0.17 43±9 97
Soft X-rayActivity state Exposure Γ0.5−10 keV Flux0.5−10 keV Statistics
(ksec) C-stat./dof
Low activity (XMM/pn) 31.76 1.682 ± 0.029 0.451 ± 0.013 80.36/76Pre-flare (XRT) 4.05 1.14 ± 0.16 1.53+0.25
−0.22 55.06/45
Flare (XRT) 2.90 1.62 ± 0.18 1.59+0.25−0.22 59.59/46
Post-flare (XMM/pn) 7.77 1.424 ± 0.024 2.06 ± 0.05 97.23/80
Hard X-rayActivity state Exposure Γ3−79 keV Flux3−79 keV Background Statistics
(ksec) norm C-stat./dof
Post-flare (NuSTAR) 30.07 1.31 ± 0.05 6.3+0.5−0.4 0.89 ± 0.12 (FPMA) 357.54/331
1.07+0.14−0.13 (FMPB)
Activity Optical-UVstate V B U UVW1 UVM2 UVW2
Low 0.72 ± 0.05 0.50 ± 0.03 0.34 ± 0.02 0.18 ± 0.01 0.12 ± 0.01 0.12 ± 0.01Pre-flare 0.55 ± 0.24 0.55 ± 0.14 0.44 ± 0.09 0.23 ± 0.05 0.11 ± 0.04 0.12 ± 0.04Flare 3.12 ± 0.24 2.99 ± 0.14 2.05 ± 0.10 0.92 ± 0.06 0.73 ± 0.20 0.44 ± 0.03Post-flare 2.8 ± 0.3 1.90 ± 0.18 1.32 ± 0.14 0.65 ± 0.11 0.31 ± 0.07 0.27 ± 0.05
Notes. The X-ray and optical-UV fluxes are in units of 10−12 erg cm−2 s−1. For the X-rays, we report the unabsorbed flux.
Table 4. Summary of the parameters used for and derived from the modelling of the multi-epoch SEDs of PKS 2004−447 shown in Fig. 6. Thecentral black hole mass and the accretion disk luminosity are taken as 7×10⁷ M and 2×1043 erg s−1, respectively, and we assume the characteristictemperature of the IR-torus to be 1100 K. A viewing angle of 2 is adopted. For the given accretion disk luminosity, the size of the BLR and dustytorus are 4.6×10⁻³ pc and 3.4×10⁻² pc, respectively. We note that the jet powers are computed by assuming a two-sided jet.
Parameter Symbol Low Activity Pre-flare Flare Post-flareParticle spectral index before break energy s1 2.1 2.1 1.7 2.0Particle spectral index after break energy s2 4.0 4.0 4.0 4.0Minimum Lorentz factor of the particle distribution γ′min 4 4 4 4Break Lorentz factor of the particle distribution γ′b 1.3 × 10³ 1.1 × 10³ 0.9 × 10³ 1.1 × 10³
Maximum Lorentz factor of the particle distribution γ′max 6000 5500 5000 5000Particle energy density, in erg cm−3 U′e 0.18 0.22 0.10 0.22Magnetic field, in Gauss B 0.4 0.3 0.3 0.3Bulk Lorentz factor Γb 11 20 26 24Dissipation distance, in 10−2 parsec Rdist 2.01 2.01 2.01 2.01Size of the emission region, in 1015cm Rblob 6.2 6.2 6.2 5.17Compton dominance CD 2 10 18 20Jet power in electrons, in erg s−1, in log scale Pe 44.2 44.8 44.7 45.0Jet power in magnetic field, in erg s−1, in log scale PB 42.7 43.0 43.2 43.0Radiative jet power, in erg s−1, in log scale Pr 43.7 44.9 45.2 45.2Jet power in protons, in erg s−1, in log scale Pp 46.2 46.8 46.3 46.9
due to datasets taken at different epochs and underlying assump-tions associated with the adopted leptonic models. In particular,and in contrast to what we do here, the X-ray part of the SEDduring a different low activity state of the source was modelled
by Orienti et al. (2015) with the EC of seed photons from thedusty torus.
During the pre-flare phase, Swift-UVOT shows that the levelof the optical-UV emission, and hence the synchrotron radiation,remains comparable to that measured during the quiescent state
Article number, page 10 of 17

Gokus et al.: The first GeV flare of PKS 2004−447
108 1012 1016 1020 1024
ν (Hz)
10−14
10−13
10−12
10−11
10−10
10−9
νFν
(erg
cm−
2s−
1)
ATCA
UVOT
XMM
LAT
Low state
108 1012 1016 1020 1024
ν (Hz)
UVOT
XRT
LAT
ATCA
Pre flare
1043
1044
1045
1046
1047
νLν
(erg
s−1)
108 1012 1016 1020 1024
ν (Hz)
10−14
10−13
10−12
10−11
10−10
10−9
νFν
(erg
cm−
2s−
1)
UVOT
XRT
LATFlare
108 1012 1016 1020 1024
ν (Hz)
OM
XMM+
NuSTAR
LAT
Post flare
1043
1044
1045
1046
1047
νLν
(erg
s−1)
Fig. 6. Spectral energy distribution of PKS 2004−447 for four stages modelled with a simple leptonic emission model. Open green circles referto the archival measurements taken from the SSDC SED builder (https://tools.ssdc.asi.it/), whereas filled black circles represent the data analysedby us. The thin solid pink line shows the synchrotron emission. Dashed green and dash-dash-dot orange lines correspond to the synchrotron selfCompton and external Compton processes, respectively. The dotted black line shows the thermal emission from the accretion disk and dusty torus.The thick solid blue line is the sum of all radiative components. The SEDs are sorted from left to right as follows: low (MJD 55682–56413),pre-flare (MJD 58754–58770), flaring (MJD 58781–58784), and post-flare activity states (MJD 58787–58789), as defined in the text. The modelparameters are listed in Table 3.
(Fig. 6). In addition to the X-ray flux increase, a significant spec-tral hardening is observed in the 0.5–10 keV energy range (seeTable 3). We explain the X-ray spectrum with a combination ofthe SSC and EC processes. There is a slight decrease in the mag-netic field (from 0.4 G to 0.3 G) causing an enhancement of bothSSC and EC fluxes since the level of the synchrotron emissionremains the same. This is because a decrease in the magneticfield strength requires an increase in the number of electrons toproduce the same level of the synchrotron flux, which ultimatelyenhances the inverse Compton flux (e.g. Dermer et al. 2009).Above a few keV, the modelled pre-flare SED includes a signif-icant contribution from EC photons. The different electron pop-ulations of SSC and EC producing electrons is responsible forthe flattening of the X-ray spectrum. Furthermore, the increasein the γ-ray flux is even larger compared to that seen in the X-rayband. The ratio of the inverse Compton to synchrotron peak lu-
minosities, meaning Compton dominance (see, e.g., Finke 2013)significantly increases with respect to the low activity state. Weexplain this observation with an increase in the bulk Lorentz fac-tor and, hence, a larger Doppler boosting.
At the peak of the flare, the enhancement of the γ-ray fluxis largest with respect to that observed at lower frequencies(Fig. 6). There is an increase in the optical-UV flux level in-dicating an elevated electron energy, possibly due to a fresh sup-ply of energetic electrons within the emission region. Accord-ingly, the synchrotron energy density gets enhanced, leading tothe brightening of the SSC radiation, as observed in the X-rayband. However, the larger amplitude of the flux variations seenat γ-rays indicates an even stronger boosting. Since we explainthe γ-ray spectrum with the EC process, this can be understoodas follows: In addition to the usual beaming due to the relativisticmotion of the plasma towards the observer, the external photon
Article number, page 11 of 17

A&A proofs: manuscript no. pks2004-447
field receives an additional boosting due to motion of the emis-sion region with respect to the photon fields external to the jet(see Dermer 1995). This phenomenon causes the radiation pat-tern of the external Compton emission to be anisotropic even inthe comoving frame, making it more sensitive to Doppler boost-ing with respect to the synchrotron and SSC mechanisms. Therelatively large enhancement of the γ-ray flux could therefore bedue to increased Doppler boosting. This conjecture is confirmedby the SED modelling, where we find the bulk Lorentz factorto increase considerably during the flare. This also makes theEC peak much more luminous than the synchrotron peak, thusindicating a Compton dominated SED, which is observed (seeFig. 6).
The data from PKS 2004−447 taken after the peak of the γ-ray flare reveal a decrease in the optical-UV and X-ray fluxes,similar to that found during the pre-flare state, while the sourceremains bright in the γ-rays, indicating a still large Dopplerbeaming, albeit a bit lower than that at the flare peak (see Ta-ble 4). Comparing the photon indices derived from the individualXMM-Newton and NuSTAR data during the post-flare period (seeTable 3, a slight spectral hardening is visible at hard X-ray en-ergies, even when we consider the influence of the background.As discussed above, this observation implies a dominance of theSSC mechanism at softer X-rays (<10 keV). At higher energies,the EC process takes over, leading to the observation of the flat-ter NuSTAR spectrum. These findings reveal the crucial role ofdata taken above 10 keV in disentangling various radiative mech-anisms at work during the flare.
When we compared various jet powers estimated during dif-ferent activity states, an interesting pattern was noticed. Com-pared to the low state, the jet powers increase during the pre-flare phase, particularly the radiative and kinetic powers, Pr andPp, in which a change of about one order of magnitude more isfound. During the main flare, there is a significant enhancementof Pr; however, the kinetic luminosity decreases. This behavioursuggests an efficient conversion of Pp into radiation during theflare since Pp has increased in the post-flare state, again. Thispresence of radiatively efficient jets during γ-ray flares has alsobeen reported for blazars (see, e.g. Tanaka et al. 2011; Saito et al.2013; Paliya et al. 2015). Interestingly, the observed radiativepower exceeds the total available accretion power. Given the factthat this is the first GeV outburst detected from PKS 2004−447in more than a decade of Fermi-LAT operation, such extraordi-nary events can be considered rather rare and short-lived (e.g.Tavecchio et al. 2010).
4.3. Comparison with flares from other γ-NLSy 1 galaxies
Since the sample of flaring γ-NLSy 1 galaxies is so small, notmuch is known about their typical flaring behaviour nor abouttheir possible differences. We compare the flaring state broad-band SED of PKS 2004−447 with four γ-NLSy 1 galaxies thathave shown a GeV flare in the past. The data for 1H 0323+342,PMN J0948+0022, and PKS 1502+036 are taken from Paliya &Stalin (2016). Although the brightest flare of SBS 0846+513,which happened in 2011, is not covered by multi-wavelengthdata, this source showed high γ-ray activity in May 2012 aswell. During that time, the γ-ray emission was slightly below theflare of 2011, but X-ray and optical-UV data are available. Wetake data of SBS 0846+513 from D’Ammando et al. (2013). AllSEDs obtained from data throughout their respective flares areplotted in Fig. 7. The parameters discussed in this comparisonare also listed in Table 5.
1015 1018 1021 1024
ν (rest-frame, Hz)
1043
1044
1045
1046
1047
νLν
(erg
s−1)
PMN J0948+0022 (2012 Dec-2013 Jan)
SBS 0846+513 (2012 May)
PKS 1502+036 (2015 Dec)
1H 0323+342 (2013 Aug-Sep)
PKS 2004−447 (2019 Nov)
Fig. 7. Comparison of the rest-frame SEDs of γ-ray flaring NLSy 1galaxies covering their GeV flaring epochs. The epochs of the flaresare given in their labels. Except for PKS 2004−447, data taken for thiscomparison were analysed by Paliya & Stalin (2016) and D’Ammandoet al. (2013).
The shape of the optical-UV emission from PKS 2004−447is similar to that of SBS 0846+513, but differs from the otherthree sources: Although the level of luminosity is different for1H 0323+342, PMN J0948+0022, and PKS 1502+036, their ob-served optical-UV spectra could all be explained with a combi-nation of the synchrotron and accretion disk emission (Paliyaet al. 2014). For 1H 0323+342, the optical-UV emission re-mains disk dominated even during the GeV flare. Such thermalemission, however, is not observed in PKS 2004−447 (see alsoFig. 6). Taken together with SED modelling, this indicates thatemission from the accretion disk is negligible compared to thesynchrotron emission.
In the X-rays, the luminosity of PKS 2004−447 is simi-lar to that of PKS 1502+036 and 1H 0323+342. Within thesoft X-rays, models predict a transition from SSC to EC emis-sion. During flaring states, the EC can become dominant overSSC, as it is the case for 1H 0323+342, PMN J0948+0022 andPKS 1502+036. The EC component of PKS 2004−447, how-ever, starts at higher energies compared to the other γ-NLSy 1galaxies; therefore most of its soft X-ray emission originatesfrom SSC. The spectral shapes of γ-NLSy 1 galaxies behavesimilarly by showing a harder spectral index during a flare com-pared to low states. All sources, including PKS 2004−447, showphoton indices of ∼1.3-1.6.
In the γ-rays, PKS 2004−447 reaches about the same lumi-nosity as PKS 1502+036, and is about one order of magnitudemore luminous than 1H 0323+342 (see Fig. 7). SBS 0846+513showed a slightly higher luminosity, while PMN J0948+0022presents the highest luminosity ever observed for a γ-ray flareof a NLSy 1 galaxy, exceeding the luminosity of PKS 2004-447by a factor of ten. The γ-ray photon indices during the flar-ing state are ∼2.5, with the exception of SBS 0846+513, whichshows a significantly harder spectrum. Both PKS 2004−447 andPKS 1502+036 exhibit a similar luminosity and bulk Lorentzfactor (PKS 1502+036 has Γ = 25; Paliya & Stalin 2016). Themass of their central black holes is similar as well. However,the accretion disk luminosity of the latter is a factor of ∼30larger indicating a higher accretion rate in Eddington units. Sincethe sizes of the BLR and the torus adjust to the luminosity ofthe accretion disk, they are likely ten times larger as well forPKS 1502+036. For PKS 2004−447, in order to be able to pro-
Article number, page 12 of 17

Gokus et al.: The first GeV flare of PKS 2004−447
Table 5. Comparison of chosen SED model parameters of the flaring γ-NLSy 1 galaxies. The abbreviations for the papers refer to the followingpapers: G-2020: this paper; P-2014: Paliya et al. (2014); P&S-2016: Paliya & Stalin (2016); D’A-2013: D’Ammando et al. (2013); D’A-2015:D’Ammando et al. (2015)
PKS 2004−447 1H 0323+342 PKS 1502+036 SBS 0846+513 PMN J0948+0022Reference G-2020 P-2014 P&S-2016 D’A-2013 D’A-2015
Redshift, z 0.24 0.061 0.409 0.5835 0.584
Optical/UV:Ldisk [erg s−1] 2 × 1043 1 × 1045 6 × 1044 4.4 × 1043 5.7 × 1045
Origin of emission Synchrotron Accretion disk Synchrotron + Synchrotron Synchrotron +accretion disk accretion disk
X-ray:Index 1.38 ± 0.29 1.55 ± 0.08 1.33 ± 0.56 1.6 ± 0.3 1.55 ± 0.11Dominance in soft X-rays SSC EC EC EC EC
γ-ray:Γ0.1−300 GeV 2.42 ± 0.09 2.47 ± 0.11 2.57 ± 0.16 2.13 ± 0.05 2.65 ± 0.11Lγ [erg s−1] 2.9 × 1047 4.7 × 1046 1.2 × 1048 5 × 1047 − 1048 1.5 × 1048
Γb 26 7 25 40 30Compton process EC/Torus EC/BLR EC/Torus EC/Torus EC/Torus
duce a similar γ-ray luminosity, a higher particle density is re-quired.
The γ-ray emission of PKS 2004−447 is explained by theEC process with seed photons provided by the dusty torus,as already reported for SBS 0846+513, PMN J0948+0022, andPKS 1502+036 during flaring episodes (D’Ammando et al.2013, 2015, 2016). As is observed for PKS 2004−447, a highCompton dominance has also been seen in these sources at thepeak of the activity, confirming that the EC emission is the mainmechanism for producing γ-rays, similar to several FSRQs. Thisresult confirms the similarities between γ-NLSy 1s and FSRQs.In contrast to PKS 2004−447, for which an increase in the bulkLorentz factor is the driver of the change in the SED for differ-ent activity states, comparing low and flaring activity states, theSEDs of SBS 0846+513, PMN J0948+0022, and PKS 1502+036can be described satisfactorily by changing the electron distribu-tion parameters as well as the magnetic field. In the same way, asignificant shift of the synchrotron peak has been observed dur-ing the flaring states of SBS 0846+513 and PMN J0948+0022,while it was not observed for PKS 2004−447.
5. Summary
In this paper we presented the analysis of the first GeV flarefrom the γ-NLSy 1 galaxy PKS 2004−447. We created daily andsub-daily binned Fermi-LAT light curves and used the methodof Meyer et al. (2019) to derive the temporal behaviour of theflare. We built SEDs containing (quasi-)simultaneous datasets,and modelled the emission of the source during a low state, aswell as before, during and after the flare, with a one-zone, lep-tonic model. Our main results are the following:
1. Short-term variability on timescales of hours to weeks isfound in the γ-rays. The X-ray and optical-UV light curvesshow flux changes within days. The ATCA light curves showa steady rise since 2018. Observations before and after theflare revealed a slight increase, which seemed to be strongestat 5.5 GHz. We find indications for γ-ray flux-doubling timesas short as ∼ 2.2 hours at the ∼3σ level.
2. The soft excess frequently observed in the X-ray spectraof NLSy 1 galaxies is not found in the XMM-Newton spec-
trum of PKS 2004−447 during the flare, which is in agree-ment with the 2012 low-state analysis of Kreikenbohm et al.(2016).
3. The simultaneous multi-wavelength data can be well de-scribed with a one-zone leptonic model. The emission re-gion from where the flare possibly originated lies outside theBLR, but within the dusty torus. The γ-ray emission is dom-inated by EC processes, while the SEDs of the flaring, pre-,and post-flare state exhibit strong Compton dominance. Dur-ing the GeV flare, the source was in an elevated activity stateat lower frequencies as well. However, the amplitude of theflux variability was the highest in the γ-ray band. SED mod-elling explains this behaviour with an increase in the bulkLorentz factor of the jet, similar to that typically seen in pow-erful FSRQs.
We conclude that all of the observations of PKS 2004−447, andγ-NLSy1 in general, point to a scenario in which these objectscould be considered to belong to the blazar sub-class of radio-loud emitters.Acknowledgements. We are grateful to the journal referee for a constructivecriticism. We thank the Fermi-LAT collaboration members E. Ros, D. Horan,D. J. Thompson, and G. Johannesson for their comments, which helped to im-prove the manuscript. A. Gokus was partially funded by the Bundesministeriumfür Wirtschaft und Technologie under Deutsches Zentrum für Luft- und Raum-fahrt (DLR grant number 50OR1607O) and by the German Science Foundation(DFG grant number KR 3338/4-1). V.S.P.’s work was supported by the Initiativeand Networking Fund of the Helmholtz Association. S.M.W. acknowledges sup-port by the Stiftung der deutschen Wirtschaft (sdw). F.D. acknowledges financialcontribution from the agreement ASI-INAF n. 2017-14-H.0. We are grateful tothe ATCA, Swift, XMM-Newton, and NuSTAR PIs for approving the ToO ob-servations, and to the mission operation teams for quickly executing them. TheFermi LAT Collaboration acknowledges generous ongoing support from a num-ber of agencies and institutes that have supported both the development and theoperation of the LAT as well as scientific data analysis. These include the Na-tional Aeronautics and Space Administration and the Department of Energy inthe United States, the Commissariat à l’Energie Atomique and the Centre Na-tional de la Recherche Scientifique / Institut National de Physique Nucléaire et dePhysique des Particules in France, the Agenzia Spaziale Italiana and the IstitutoNazionale di Fisica Nucleare in Italy, the Ministry of Education, Culture, Sports,Science and Technology (MEXT), High Energy Accelerator Research Organiza-tion (KEK) and Japan Aerospace Exploration Agency (JAXA) in Japan, and theK.A. Wallenberg Foundation, the Swedish Research Council and the SwedishNational Space Board in Sweden. Additional support for science analysis duringthe operations phase is gratefully acknowledged from the Istituto Nazionale diAstrofisica in Italy and the Centre National d’Études Spatiales in France. This
Article number, page 13 of 17

A&A proofs: manuscript no. pks2004-447
work was performed in part under DOE Contract DE-AC02-76SF00515. Thiswork made use of data from the NuSTAR mission, a project led by the Cali-fornia Institute of Technology, managed by the Jet Propulsion Laboratory, andfunded by the National Aeronautics and Space Administration. We thank theNuSTAR Operations, Software, and Calibration teams for support with the ex-ecution and analysis of these observations. This research has made use of theNuSTAR Data Analysis Software (NuSTARDAS) jointly developed by the ASIScience Data Center (ASDC, Italy) and the California Institute of Technology(USA). We acknowledge the use of public data from the Swift data archive.The Australia Telescope Compact Array is part of the Australia Telescope Na-tional Facility which is funded by the Australian Government for operation as aNational Facility managed by CSIRO. This research has made use of a collec-tion of ISIS functions (ISISscripts) provided by ECAP/Remeis observatory andMIT (http://www.sternwarte.uni-erlangen.de/isis/). The colours in Fig. 1, Fig. 2,Fig. 3, and Fig. 5 were taken from Paul Tol’s colour schemes and templates(https://personal.sron.nl/ pault/).
ReferencesAbdo, A. A., Ackermann, M., Ajello, M., et al. 2010, ApJ, 722, 520Abdo, A. A., Ackermann, M., Ajello, M., et al. 2009a, ApJ, 699, 976Abdo, A. A., Ackermann, M., Ajello, M., et al. 2009b, ApJ, 707, L142Abdollahi, S., Acero, F., Ackermann, M., et al. 2020, ApJS, 247, 33Ajello, M., Angioni, R., Axelsson, M., et al. 2020, ApJ, 892, 105Aleksic, J., Antonelli, L. A., Antoranz, P., et al. 2011, ApJ, 730, L8Atwood, W. B., Abdo, A. A., Ackermann, M., et al. 2009, ApJ, 697, 1071Baldi, R. D., Capetti, A., Robinson, A., Laor, A., & Behar, E. 2016, MNRAS,
458, L69Best, P. N. & Heckman, T. M. 2012, MNRAS, 421, 1569Błazejowski, M., Sikora, M., Moderski, R., & Madejski, G. M. 2000, ApJ, 545,
107Cash, W. 1979, ApJ, 228, 939Ciprini, S. & Fermi-LAT Collaboration. 2018, in Revisiting Narrow-Line Seyfert
1 Galaxies and their Place in the Universe, 20D’Ammando, F. 2019, Galaxies, 7, 87D’Ammando, F., Acosta-Pulido, J. A., Capetti, A., et al. 2018, MNRAS, 478,
L66D’Ammando, F., Gokus, A., Kadler, M., & Ojha, R. 2019, Swift follow-up of
the flaring NLSy1 PKS 2004-447, ATEL 13233D’Ammando, F., Orienti, M., Finke, J., et al. 2016, MNRAS, 463, 4469D’Ammando, F., Orienti, M., Finke, J., et al. 2013, MNRAS, 436, 191D’Ammando, F., Orienti, M., Finke, J., et al. 2012, MNRAS, 426, 317D’Ammando, F., Orienti, M., Finke, J., et al. 2015, MNRAS, 446, 2456Decarli, R., Dotti, M., Fontana, M., & Haardt, F. 2008, MNRAS, 386, L15Deo, R. P., Crenshaw, D. M., & Kraemer, S. B. 2006, AJ, 132, 321Dermer, C. D. 1995, ApJ, 446, L63Dermer, C. D., Finke, J. D., Krug, H., & Böttcher, M. 2009, ApJ, 692, 32Dermer, C. D. & Menon, G. 2009, High Energy Radiation from Black Holes:
Gamma Rays, Cosmic Rays, and Neutrinos (Princeton: Princeton Univ. Press)Drinkwater, M. J., Webster, R. L., Francis, P. J., et al. 1997, MNRAS, 284, 85Eisenstein, D. J. & Hut, P. 1998, ApJ, 498, 137Finke, J. D. 2013, ApJ, 763, 134Finke, J. D., Dermer, C. D., & Böttcher, M. 2008, ApJ, 686, 181Fitzpatrick, E. L. 1999, PASP, 111, 63Foschini, L. 2017, Frontiers in Astronomy and Space Sciences, 4, 6Foschini, L., Berton, M., Caccianiga, A., et al. 2017, A&A, 603, C1Foschini, L., Ghisellini, G., Kovalev, Y. Y., et al. 2011, MNRAS, 413, 1671Fuhrmann, L., Larsson, S., Chiang, J., et al. 2014, MNRAS, 441, 1899Gallo, L. C., Edwards, P. G., Ferrero, E., et al. 2006, MNRAS, 370, 245Gehrels, N., Chincarini, G., Giommi, P., et al. 2004, ApJ, 611, 1005Ghisellini, G., Righi, C., Costamante, L., & Tavecchio, F. 2017, MNRAS, 469,
255Ghisellini, G. & Tavecchio, F. 2009, MNRAS, 397, 985Ghisellini, G. & Tavecchio, F. 2015, MNRAS, 448, 1060Giommi, P., Barr, P., Garilli, B., Maccagni, D., & Pollock, A. M. T. 1990, ApJ,
356, 432Gokus, A. 2019, Fermi LAT detection of a GeV flare from the radio-loud narrow-
line Seyfert 1 Galaxy PKS 2004-447, ATEL 13229Grupe, D. 2004, AJ, 127, 1799Grupe, D. & Mathur, S. 2004, ApJ, 606, L41Harrison, F. A., Craig, W. W., Christensen, F. E., et al. 2013, ApJ, 770, 103HI4PI Collaboration, Ben Bekhti, N., Flöer, L., et al. 2016, A&A, 594, A116Houck, J. C. & Denicola, L. A. 2000, in Astronomical Data Analysis Software
and Systems IX, ed. N. Manset, C. Veillet, & D. Crabtree, ASP Conf. Ser. No.216 (San Francisco: Astron. Soc. Pacific), 591
Jansen, F., Lumb, D., Altieri, B., et al. 2001, A&A, 365, L1Järvelä, E., Lähteenmäki, A., Lietzen, H., et al. 2017, A&A, 606, A9Kaastra, J. S. & Bleeker, J. A. M. 2016, A&A, 587, A151
Komossa, S., Voges, W., Xu, D., et al. 2006, AJ, 132, 531Kreikenbohm, A., Schulz, R., Kadler, M., et al. 2016, A&A, 585, A91Marconi, A., Axon, D. J., Maiolino, R., et al. 2008, ApJ, 678, 693Mason, K. O., Breeveld, A., Much, R., et al. 2001, A&A, 365, L36Mathur, S. 2000, MNRAS, 314, L17Mattox, J. R., Bertsch, D. L., Chiang, J., et al. 1996, ApJ, 461, 396Meyer, M., Scargle, J. D., & Blandford, R. D. 2019, ApJ, 877, 39Nolan, P. L., Abdo, A. A., Ackermann, M., et al. 2012, ApJS, 199, 31Nowak, M. A., Wilms, J., Heinz, S., et al. 2005, ApJ, 626, 1006Olguín-Iglesias, A., Kotilainen, J., & Chavushyan, V. 2020, MNRAS, 492, 1450Orienti, M., D’Ammando, F., Larsson, J., et al. 2015, MNRAS, 453, 4037Oshlack, A. Y. K. N., Webster, R. L., & Whiting, M. T. 2001, ApJ, 558, 578Osterbrock, D. E. & Pogge, R. W. 1985, ApJ, 297, 166Paliya, V. S. 2019, Journal of Astrophysics and Astronomy, 40, 39Paliya, V. S., Ajello, M., Rakshit, S., et al. 2018, ApJ, 853, L2Paliya, V. S., Parker, M. L., Jiang, J., et al. 2019, ApJ, 872, 169Paliya, V. S., Pérez, E., García-Benito, R., et al. 2020, ApJ, 892, 133Paliya, V. S., Sahayanathan, S., Parker, M. L., et al. 2014, ApJ, 789, 143Paliya, V. S., Sahayanathan, S., & Stalin, C. S. 2015, ApJ, 803, 15Paliya, V. S. & Stalin, C. S. 2016, ApJ, 820, 52Paliya, V. S., Stalin, C. S., Shukla, A., & Sahayanathan, S. 2013, ApJ, 768, 52Peterson, B. M., McHardy, I. M., Wilkes, B. J., et al. 2000, ApJ, 542, 161Pjanka, P., Zdziarski, A. A., & Sikora, M. 2017, MNRAS, 465, 3506Planck Collaboration, Ade, P. A. R., Aghanim, N., et al. 2016, A&A, 594, A13Rajput, B., Stalin, C. S., & Rakshit, S. 2020, A&A, 634, A80Ramakrishnan, V., Hovatta, T., Nieppola, E., et al. 2015, MNRAS, 452, 1280Rieger, F. M. & Volpe, F. 2010, A&A, 520, A23Romano, P., Vercellone, S., Foschini, L., et al. 2018, MNRAS, 481, 5046Saito, S., Stawarz, Ł., Tanaka, Y. T., et al. 2013, ApJ, 766, L11Scargle, J. D., Norris, J. P., Jackson, B., & Chiang, J. 2013, ApJ, 764, 167Schulz, R., Kreikenbohm, A., Kadler, M., et al. 2016, A&A, 588, A146Shaw, M. S., Romani, R. W., Cotter, G., et al. 2012, ApJ, 748, 49Shukla, A. & Mannheim, K. 2020, Nature Communications, 11, 4176Sikora, M., Begelman, M. C., & Rees, M. J. 1994, ApJ, 421, 153Sikora, M., Stawarz, Ł., Moderski, R., Nalewajko, K., & Madejski, G. M. 2009,
ApJ, 704, 38Singh, V. & Chand, H. 2018, MNRAS, 480, 1796Stevens, J., Edwards, P. G., Ojha, R., et al. 2012, 2012 Fermi & Jansky Proceed-
ings - eConf C1111101, arXiv:1205.2403Strüder, L., Briel, U., Dennerl, K., et al. 2001, A&A, 365, L18Tanaka, Y. T., Stawarz, Ł., Thompson, D. J., et al. 2011, ApJ, 733, 19Tavecchio, F., Ghisellini, G., Bonnoli, G., & Ghirlanda, G. 2010, MNRAS, 405,
L94Tingay, S. J., Jauncey, D. L., King, E. A., et al. 2003, PASJ, 55, 351Turner, M. J. L., Abbey, A., Arnaud, M., et al. 2001, A&A, 365, L27Urry, C. M. & Padovani, P. 1995, PASP, 107, 803van den Berg, J. P., Böttcher, M., Domínguez, A., & López-Moya, M. 2019, ApJ,
874, 47Vaughan, S., Reeves, J., Warwick, R., & Edelson, R. 1999, MNRAS, 309, 113Verner, D. A., Ferland, G. J., Korista, K. T., & Yakovlev, D. G. 1996, ApJ, 465,
487Viswanath, G., Stalin, C. S., Rakshit, S., et al. 2019, ApJ, 881, L24Wang, Y., Xue, Y., Zhu, S., & Fan, J. 2018, ApJ, 867, 68Wilms, J., Allen, A., & McCray, R. 2000, ApJ, 542, 914Zhang, Y. H., Celotti, A., Treves, A., et al. 1999, ApJ, 527, 719
Article number, page 14 of 17

Gokus et al.: The first GeV flare of PKS 2004−447
Appendix A: Flux densities measured with ATCA
The radio data in Table A.1 cover ATCA observations from 2010up to early 2020 of PKS 2004−447 and are taken in three differ-ent bands ( λ4-cm, λ15-mm, and λ7-mm).
Article number, page 15 of 17
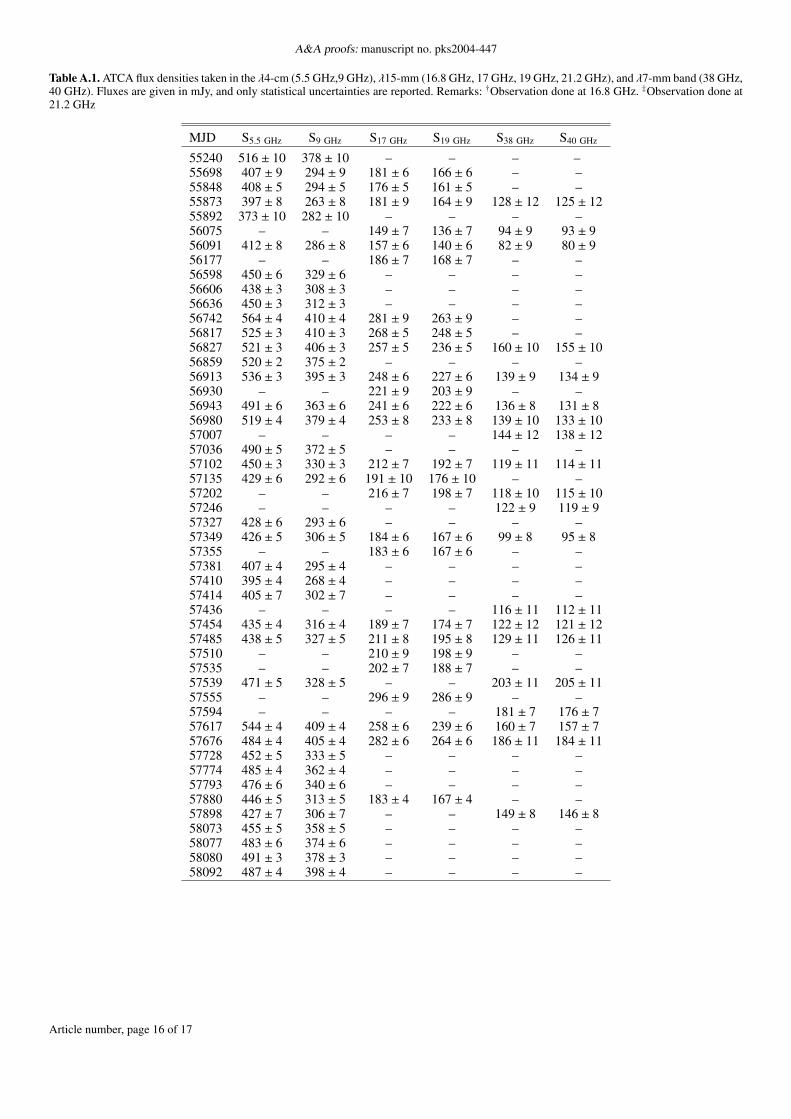
A&A proofs: manuscript no. pks2004-447
Table A.1. ATCA flux densities taken in the λ4-cm (5.5 GHz,9 GHz), λ15-mm (16.8 GHz, 17 GHz, 19 GHz, 21.2 GHz), and λ7-mm band (38 GHz,40 GHz). Fluxes are given in mJy, and only statistical uncertainties are reported. Remarks: †Observation done at 16.8 GHz. ‡Observation done at21.2 GHz
MJD S5.5 GHz S9 GHz S17 GHz S19 GHz S38 GHz S40 GHz
55240 516 ± 10 378 ± 10 – – – –55698 407 ± 9 294 ± 9 181 ± 6 166 ± 6 – –55848 408 ± 5 294 ± 5 176 ± 5 161 ± 5 – –55873 397 ± 8 263 ± 8 181 ± 9 164 ± 9 128 ± 12 125 ± 1255892 373 ± 10 282 ± 10 – – – –56075 – – 149 ± 7 136 ± 7 94 ± 9 93 ± 956091 412 ± 8 286 ± 8 157 ± 6 140 ± 6 82 ± 9 80 ± 956177 – – 186 ± 7 168 ± 7 – –56598 450 ± 6 329 ± 6 – – – –56606 438 ± 3 308 ± 3 – – – –56636 450 ± 3 312 ± 3 – – – –56742 564 ± 4 410 ± 4 281 ± 9 263 ± 9 – –56817 525 ± 3 410 ± 3 268 ± 5 248 ± 5 – –56827 521 ± 3 406 ± 3 257 ± 5 236 ± 5 160 ± 10 155 ± 1056859 520 ± 2 375 ± 2 – – – –56913 536 ± 3 395 ± 3 248 ± 6 227 ± 6 139 ± 9 134 ± 956930 – – 221 ± 9 203 ± 9 – –56943 491 ± 6 363 ± 6 241 ± 6 222 ± 6 136 ± 8 131 ± 856980 519 ± 4 379 ± 4 253 ± 8 233 ± 8 139 ± 10 133 ± 1057007 – – – – 144 ± 12 138 ± 1257036 490 ± 5 372 ± 5 – – – –57102 450 ± 3 330 ± 3 212 ± 7 192 ± 7 119 ± 11 114 ± 1157135 429 ± 6 292 ± 6 191 ± 10 176 ± 10 – –57202 – – 216 ± 7 198 ± 7 118 ± 10 115 ± 1057246 – – – – 122 ± 9 119 ± 957327 428 ± 6 293 ± 6 – – – –57349 426 ± 5 306 ± 5 184 ± 6 167 ± 6 99 ± 8 95 ± 857355 – – 183 ± 6 167 ± 6 – –57381 407 ± 4 295 ± 4 – – – –57410 395 ± 4 268 ± 4 – – – –57414 405 ± 7 302 ± 7 – – – –57436 – – – – 116 ± 11 112 ± 1157454 435 ± 4 316 ± 4 189 ± 7 174 ± 7 122 ± 12 121 ± 1257485 438 ± 5 327 ± 5 211 ± 8 195 ± 8 129 ± 11 126 ± 1157510 – – 210 ± 9 198 ± 9 – –57535 – – 202 ± 7 188 ± 7 – –57539 471 ± 5 328 ± 5 – – 203 ± 11 205 ± 1157555 – – 296 ± 9 286 ± 9 – –57594 – – – – 181 ± 7 176 ± 757617 544 ± 4 409 ± 4 258 ± 6 239 ± 6 160 ± 7 157 ± 757676 484 ± 4 405 ± 4 282 ± 6 264 ± 6 186 ± 11 184 ± 1157728 452 ± 5 333 ± 5 – – – –57774 485 ± 4 362 ± 4 – – – –57793 476 ± 6 340 ± 6 – – – –57880 446 ± 5 313 ± 5 183 ± 4 167 ± 4 – –57898 427 ± 7 306 ± 7 – – 149 ± 8 146 ± 858073 455 ± 5 358 ± 5 – – – –58077 483 ± 6 374 ± 6 – – – –58080 491 ± 3 378 ± 3 – – – –58092 487 ± 4 398 ± 4 – – – –
Article number, page 16 of 17

Gokus et al.: The first GeV flare of PKS 2004−447
Table A.2. Table A.1 continued.
MJD S5.5 GHz S9 GHz S17 GHz S19 GHz S38 GHz S40 GHz58183 392 ± 5 292 ± 5 205 ± 8 193 ± 8 – –58227 387 ± 4 297 ± 4 194 ± 7 179 ± 7 121 ± 10 118 ± 1058229 398 ± 6 312 ± 6 – – – –58279 392 ± 4 313 ± 4 – – 116 ± 15 113 ± 1558377 352 ± 5 293 ± 5 – – – –58379 354 ± 3 299 ± 3 – – – –58391 – – 254 ± 5 239 ± 5 – –58462 424 ± 3 299 ± 3 – – – –58490 414 ± 4 219 ± 4 – – – –58513 383 ± 4 281 ± 4 – – – –58562 433 ± 5 317 ± 5 – – – –58590 408 ± 3 296 ± 3 – – – –58601 425 ± 7 295 ± 7 – – – –58715 442 ± 3 358 ± 3 – – – –58727 – – 225 ± 12† 192 ± 12‡ – –58760 440 ± 2 347 ± 2 244 ± 5 229 ± 5 156 ± 8 152 ± 858809 465 ± 3 352 ± 3 252 ± 7 234 ± 7 – –58829 459 ± 4 327 ± 4 – – – –58879 433 ± 4 332 ± 4 – – – –58923 467 ± 4 362 ± 4 – – – –58934 479 ± 4 358 ± 4 – – – –58942 464 ± 7 414 ± 7 – – – –58958 501 ± 5 359 ± 5 227 ± 10† 184 ± 102‡ – –
Article number, page 17 of 17