Embed Size (px)
Citation preview

Mon. Not. R. Astron. Soc. 355, 273–296 (2004) doi:10.1111/j.1365-2966.2004.08321.x
The star formation history of Seyfert 2 nuclei
R. Cid Fernandes,1� Q. Gu,2� J. Melnick,3� E. Terlevich,4�† R. Terlevich,4�†D. Kunth,5� R. Rodrigues Lacerda1� and B. Joguet51Departamento de Fısica, CFM, Universidade Federal de Santa Catarina, PO Box 476, Florianopolis 88040-900, SC, Brazil2Department of Astronomy, Nanjing University, Nanjing 210093, China3European Southern Observatory, Alonso de Cordova 3107, Santiago, Chile4Instituto Nacional de Astrof ısica, Optica y Electronica, Tonantzintla, Puebla, Mexico5Institut d’Astrophysique de Paris, 98bis Boulevard Arago, 75014 Paris, France
Accepted 2004 August 13. Received 2004 July 25; in original form 2004 February 16
ABSTRACTWe present a study of the stellar populations in the central ∼200 pc of a large and homogeneoussample comprising 79 nearby galaxies, most of which are Seyfert 2s. The star formation historyof these nuclei is reconstructed by means of state-of-the-art population synthesis modelling oftheir spectra in the 3500–5200 Å interval. A quasar-like featureless continuum (FC) is addedto the models to account for possible scattered light from a hidden active galactic nucleus(AGN).
We find the following. (1) The star formation history of Seyfert 2 nuclei is remarkablyheterogeneous: young starbursts, intermediate-age and old stellar populations all appear insignificant and widely varying proportions. (2) A significant fraction of the nuclei show astrong FC component, but this FC is not always an indication of a hidden AGN: it can alsobetray the presence of a young, dusty starburst. (3) We detect weak broad Hβ emission inseveral Seyfert 2s after cleaning the observed spectrum by subtracting the synthesis model.These are most likely the weak scattered lines from the hidden broad-line region envisaged inthe unified model, given that in most of these cases independent spectropolarimetry data find ahidden Seyfert 1. (4) The FC strengths obtained by the spectral decomposition are substantiallylarger for the Seyfert 2s which present evidence of broad lines, implying that the scattered non-stellar continuum is also detected. (5) There is no correlation between the star formation in thenucleus and either the central or overall morphology of the parent galaxies.
Key words: galaxies: active – galaxies: Seyfert – galaxies: statistics – galaxies: stellarcontent.
1 I N T RO D U C T I O N
Our understanding of how galaxies form and evolve has changed ina rather unexpected way in recent years. On the one hand, massiveblack holes now appear to populate the nuclei of virtually every(massive enough) galaxy. On the other, the nuclei of active galaxies(AGN), previously thought to be the only galaxies that harbouredmassive black holes, are now known to be the hosts of massive star-forming regions. Hence, black holes and starburst clusters coexistand are ubiquitous in the nuclear regions of galaxies.
The observational evidence for this scenario is abundant. Thepresence of strong Ca II triplet absorptions in a large sample of
�E-mail: [email protected] (RCF); [email protected] (QG); [email protected] (JM); [email protected] (ET); [email protected] (RT); [email protected](DK); [email protected] (RRL)†Visiting fellows, Institute of Astronomy, Cambridge.
Seyfert 2s and some Seyfert 1s provided the first direct evi-dence for a population of red supergiant stars in their nuclear re-gions (Terlevich, Diaz & Terlevich 1990). The absence of signsof a broad-line region (BLR) in the direct optical spectra ofSeyfert 2 nuclei which show broad lines in polarized light canonly be understood if there is an additional central source ofblue/ultraviolet continuum associated with the obscuring torus (CidFernandes & Terlevich 1995). This conclusion is further sup-ported by observations that polarization is lower in the continuumthan in the scattered broad lines (Miller & Goodrich 1990; Tran1995a,b)
Most of the ultraviolet to near-infrared continuum light in a num-ber of Seyfert 2s, in particular all those so far observed with theHubble Space Telescope (HST), is due to nuclear starbursts thatare resolved in HST images. In some of these galaxies, the star-burst luminosities are comparable to those of their ionizing engines.Thus, an observer situated along the axis of the torus will detect
C© 2004 RAS
Dow
nloaded from https://academ
ic.oup.com/m
nras/article/355/1/273/3101537 by guest on 29 Decem
ber 2021

274 R. Cid Fernandes et al.
comparable contributions to the optical continuum coming from thestarburst and from the BLR components (Heckman et al. 1995,1997). Massive star-forming regions are even found in the nuclei ofpowerful radio galaxies through the detection of Balmer absorptionlines or strong Ca II triplet lines (Melnick et al. 1997; Aretxaga et al.2001; Wills et al. 2002), showing that the intimate link betweennuclear activity and star formation exists not only in spiral galaxies,but also in massive ellipticals.
We have been engaged in a large spectroscopic survey of thenearest Seyfert galaxies in the Southern hemisphere aimed at char-acterizing the properties of nuclear star-forming regions as a firststep to understanding the link between nuclear starbursts and mas-sive black holes. The first results of this project were reportedin Joguet et al. (2001 hereafter J01) where high signal-to-noiseratio (S/N) observations of about 80 Seyfert 2s were presented.This first inspection of the data revealed that about 50 per centof Seyfert 2s exhibit clear spectral signatures of star formationin the recent past (�100 Myr), most notably high-order Balmerlines in absorption. The other half of the sample is equally splitbetween nuclei with strong emission lines but weak absorptionlines, and nuclei with a rich absorption-line spectrum and reddishcontinuum, characteristic of old stellar populations. These resultsare in line with those obtained with smaller samples (Schmitt,Storchi-Bergmann & Cid Fernandes 1999; Gonzalez Delgado,Heckman & Leitherer 2001; Cid Fernandes et al. 2001a, here-after CF01), and highlight the high frequency of star formation inSeyfert 2s.
Recently we have also started to detect high-order Balmer linesin type 1 Seyfert galaxies, which may indicate the presence of ex-tremely compact and luminous starbursts. The fraction of type 1Seyfert galaxy nuclei with Balmer absorption is understandablylower than in Seyfert 2s given the additional difficulty of dis-entangling the stellar absorption features from the broad emis-sion lines in type 1 Seyfert galaxies (Torres-Papaqui et al., inpreparation).
This paper is the first of a series devoted to a quantitative analysisof the stellar populations in the nuclei of nearby Seyfert galax-ies. We present detailed population synthesis models for a sam-ple of 79 galaxies studied by J01. For each galaxy we derive thenuclear star formation history (SFH), and correlate the nuclearstellar populations with other properties such as the emission-line spectra and the (central) morphology of the parent galaxy.The models are also used to produce continuum-subtracted ‘pureemission-line’ spectra, which will be used in subsequent papersto study other properties of the nuclei including emission-lineprofiles, the relation between stellar and nebular kinematics, etc.The ultimate aim of this study is to have at least a first glimpseat the coveted evolutionary connection between monsters andstarbursts.
This first paper concentrates on the presentation of our synthesismethod and the results of its application to the J01 sample. Sec-tion 2 reviews the data set used in this study. A spectral synthesismethod that combines tools from empirical population synthesiswith the new Bruzual & Charlot (2003, hereafter BC03) models isdescribed in Section 3, and its application to 65 Seyfert 2s and 14other galaxies is presented in Section 4. The model subtracted spec-tra are used to search for weak broad emission features in Section 5.Section 6 presents an empirical characterization of the stellar pop-ulations in the sample based on a set of spectral indices. The statis-tics of star formation in Seyfert 2s and relations to host morphol-ogy are discussed in Section 7. Finally, Section 8 summarizes ourconclusions.
2 T H E DATA S E T
Highly efficient blue spectroscopic observations of nearby Seyfert2s were carried out in four observing runs between 1998May and 2000 August, with the 1.5-m ESO telescope atLa Silla (Chile). The spectra cover a wavelength range from 3470 to5450 Å, with a spatial sampling of 0.82 arcsec pixel−1. A detaileddescription of the obtention and reduction of the data, as well as ofthe selection of the sample, has been published in J01.
For this work, 1D spectra have been extracted afresh, restrict-ing ourselves to the central pixel, which, at the redshifts of thegalaxy sample and adopting H 0 = 75 km s−1 Mpc−1, representsthe central 59–439 pc for the Seyfert 2s (median = 174 pc), and45–596 pc for the type 1 Seyfert galaxies, low-ionization nuclearemission regions (LINERs), starburst and normal galaxies (me-dian = 121 pc). Table 1 lists some properties of the galaxies inthe sample, including morphology, far-infrared properties and thelinear scale.
J01 listed 15 galaxies of the sample with dubious (or wrong) type 2Seyfert classification. After inspection of the spectra and a revisionof literature data, six extra objects were reclassified: NGC 1097(Storchi-Bergmann et al. 2003), NGC 4303 (Colina, Cervino &Gonzalez Delgado 2003; Jimenez-Bailon et al. 2003) and NGC4602 were classified as LINERs; NGC 2935 and the mergers NGC1487 and 3256 were reclassified as starbursts (Dessauges-Zavadskyet al. 2000; Lira et al. 2002). After these minor revisions, the finalsample has 65 Seyfert 2s, one type 1 Seyfert galaxy, four LINERs,four starburst/H II nuclei and five normal galaxies. Note that ourlist of Seyfert 2s includes some mixed cases, such as NGC 6221(Levenson et al. 2001), NGC 7496 (J01) and NGC 7679 (Gu et al.2001; Della Ceca et al. 2001). Except for subtle details like high-excitation components in the wings of the [O III] and Hβ profiles,these nuclei look like starbursts in the optical but have X-ray prop-erties of AGN (see also Maiolino et al. 2003; Goncalves et al.1999).
3 S P E C T R A L S Y N T H E S I S
3.1 The method
The modelling of stellar populations in galaxies has recently un-dergone a major improvement with the publication of high spectralresolution evolutionary synthesis models by BC03. We have incor-porated this new library into a modified version of the populationsynthesis code described by Cid Fernandes et al. (2001b). The codesearches for the linear combination of N � simple stellar populations(SSPs), i.e. populations of same age (t) and metallicity (Z), that bestmatches a given observed spectrum Oλ. The equation for a modelspectrum Mλ is
Mλ(x, Mλ0 , AV , v�, σ�) = Mλ0
(N�∑j=1
x j b j,λrλ
)⊗ G(v�, σ�) (1)
where the various parameters are as follows.
(i) b j,λ ≡ LλSSP(t j , Z j )/Lλ0
SSP(t j , Z j ) is the spectrum of the jthSSP normalized at λ0. The LSSP
λ (tj, Zj) spectra are taken from BC03models computed with the STELIB library (Le Borgne et al. 2003),Padova tracks and Chabrier (2003) mass function.
(ii) r λ ≡ 10−0.4(Aλ−Aλ0 ) is the reddening term, with Aλ as the ex-tinction at wavelength λ. Extinction is modelled as due to a uniformdust screen, parametrized by the V-band extinction AV . The Cardelliet al. (1989) extinction law with RV = 3.1 is adopted.
C© 2004 RAS, MNRAS 355, 273–296
Dow
nloaded from https://academ
ic.oup.com/m
nras/article/355/1/273/3101537 by guest on 29 Decem
ber 2021

Star formation history of Seyfert 2 nuclei 275
Table 1. Sample galaxy properties. Column 2: spectral class. Column 3: Hubble type, taken from RC3 except forobjects marked ∗ , whose morphology was taken from NED. Column 4: inner Hubble type, taken from Malkanet al. (1998). Column 5: linear scale. Columns 6 and 7: IRAS colours between 25, 60 and 100 µm. Column 8:far-infrared luminosity, in L�.
Name Type Hubble I-type pc/arcsec α(25, 60) α(60, 100) log LFIR
ESO 103-G35 Sy2 S0 E 257 0.02 1.54 9.87ESO 104-G11 Sy2 SBb 293 −2.00 −1.22 10.43ESO 137-G34 Sy2 SAB0/a S0 178 −1.29 −4.31 10.12ESO 138-G01 Sy2 E L 177 −0.47 0.20 9.66ESO 269-G12 Sy2 S0 320
ESO 323-G32 Sy2 SAB0 310 −1.35 −1.11 9.81ESO 362-G08 Sy2 S0 Sa 309 −1.45 −1.67 9.68ESO 373-G29 Sy2 SBab Sb 181ESO 381-G08 Sy2 SBbc SBb 212 −1.30 −0.85 10.33ESO 383-G18 Sy2 S0/a∗ 240 −0.60 −0.81 9.40
ESO 428-G14 Sy2 S0/a 105 −1.04 −0.62 9.49ESO 434-G40 Sy2 S0/a 160Fairall 0334 Sy2 SB SBb 359 −1.15 −1.46 9.84Fairall 0341 Sy2 S0a Sa? 312 −1.05 −0.69 9.75IC 1657 Sy2 SBbc 232 −2.66 −1.94 10.10
IC 2560 Sy2 SBb 189 −1.41 −1.24 9.92IC 5063 Sy2 S0 220 −0.36 0.48 10.14IC 5135 Sy2 Sa 313 −2.34 −0.86 11.03IRAS 11215−2806 Sy2 S0∗ S0 262 −0.59 −0.76 9.40MCG +01-27-020 Sy2 ? 227 −0.51 −2.07 9.24
MCG -03-34-064 Sy2 SB 321 −0.83 0.14 10.53Mrk 0897 Sy2 Scd 510 −1.95 −1.00 10.69Mrk 1210 Sy2 Sa∗ Sa 261 0.11 0.73 9.83Mrk 1370 Sy2 Sa∗ Sa 476NGC 0424 Sy2 SB0/a Sb 226 −0.04 −0.02 9.72
NGC 0788 Sy2 S0/a S0 264 0.00 −0.29 9.32NGC 1068 Sy2 Sb 73 −0.83 −0.47 10.77NGC 1125 Sy2 SB0/a Sb/c 212 −1.58 −0.34 9.95NGC 1667 Sy2 SABc Sc 294 −2.48 −1.77 10.62NGC 1672 Sy2 SBb 87 −2.40 −1.47 10.28
NGC 2110 Sy2 SAB0 Sa 151 −1.82 −0.62 9.77NGC 2979 Sy2 Sa 176 −2.05 −1.77 9.56NGC 2992 Sy2 Sa 149 −2.18 −2.43 10.26NGC 3035 Sy2 SBbc 281 −1.47 −1.78 9.62NGC 3081 Sy2 SAB0/a SB0/a 154
NGC 3281 Sy2 Sab 207 −1.10 −0.18 10.24NGC 3362 Sy2 SABc Sb 536NGC 3393 Sy2 SBa Sa 242 −1.25 −1.06 9.96NGC 3660 Sy2 SBbc 238 −2.44 −1.74 9.93NGC 4388 Sy2 Sb 163 −1.23 −1.12 10.28
NGC 4507 Sy2 SABb SBa/b 229 −1.29 −0.44 10.14NGC 4903 Sy2 SBc 319 −1.12 −2.23 9.85NGC 4939 Sy2 Sbc Sa 201 −1.91 −2.61 9.92NGC 4941 Sy2 SABab 72 −1.09 −2.17 8.80NGC 4968 Sy2 SAB0/a Sa 191 −0.93 −0.41 9.72
NGC 5135 Sy2 SBab Sc 266 −2.23 −1.03 10.91NGC 5252 Sy2 S0 S0 447NGC 5427 Sy2 Sc Sc 169 −2.55 −2.90 10.24NGC 5506 Sy2 Sa 120 −0.96 −0.11 9.85NGC 5643 Sy2 SABc 77 −1.91 −1.32 9.93
NGC 5674 Sy2 SABc SBc 483 −1.87 −1.86 10.44NGC 5728 Sy2 SABa 180 −2.54 −1.15 10.27NGC 5953 Sy2 Sa Sc 127 −2.46 −1.26 10.06NGC 6221 Sy2 SBc Sd 96 −2.20 −1.65 10.42NGC 6300 Sy2 SBb Sd 72 −2.13 −1.77 9.78
NGC 6890 Sy2 Sb 156 −2.03 −1.46 9.85NGC 7172 Sy2 Sa ? 168 −2.30 −1.50 10.09
C© 2004 RAS, MNRAS 355, 273–296
Dow
nloaded from https://academ
ic.oup.com/m
nras/article/355/1/273/3101537 by guest on 29 Decem
ber 2021

276 R. Cid Fernandes et al.
Table 1 – continued
Name Type Hubble I-type pc/arcsec α(25, 60) α(60, 100) log LFIR
NGC 7212 Sy2 S? Irr? 516 −1.51 −1.04 10.72NGC 7314 Sy2 SABbc Sd 92 −2.13 −2.60 9.51NGC 7496 Sy2 SBb 107 −1.90 −1.20 9.83
NGC 7582 Sy2 SBab ? 102 −2.32 −0.77 10.52NGC 7590 Sy2 Sbc Sd 103 −2.42 −2.41 9.85NGC 7679 Sy2 SB0 332 −2.13 −0.56 10.71NGC 7682 Sy2 SBab SB0 332NGC 7743 Sy2 SB0 S0 110 −1.57 −2.28 8.95
Mrk 0883 Sy1 ? 727 −1.75 −0.22 10.50NGC 1097 LINER E 82 −2.39 −1.27 10.34NGC 4303 LINER SABbc 101 −3.23 −1.97 10.31NGC 4602 LINER SABbc 164 −2.47 −1.86 10.03
NGC 7410 LINER SBa E/S0 113 −2.49 −2.80 8.99ESO 108-G17 STB I0∗ 142 −2.20 −0.90 9.26NGC 1487 STB P 55 −2.89 −1.32 8.85NGC 2935 STB SABb 147 −2.55 −2.18 9.85NGC 3256 STB SBm 177 −1.95 −0.52 11.23
NGC 2811 Normal SBa 153 −1.51 −2.67 9.04NGC 3223 Normal Sb 187 −2.49 −2.67 10.14NGC 3358 Normal SAB0/a 193NGC 3379 Normal E 59NGC 4365 Normal E 80
(iii) x is the population vector, whose components xj ( j = 1, . . . ,N �) represent the fractional contribution of each SSP in the base tothe total synthetic flux at λ0. These flux fractions can be convertedto a mass fractions vector µ using the model light-to-mass ratios atλ0.
(iv) Mλ0 , the synthetic flux at the normalization wavelength, playsthe role of a scaling parameter.
(v) G(v�, σ �) is the line-of-sight stellar velocity distribution,modelled as a Gaussian centred at velocity v� and broadenedby σ �.
The match between model and observed spectra is evaluated by
χ 2(x, Mλ0 , AV , v�, σ�) =Nλ∑
λ=1
[(Oλ − Mλ)wλ]2, (2)
where the weight spectrum wλ is defined as the inverse of the noisein Oλ. Regions containing emission lines or spurious features (badpixels or sky residuals) are masked out by assigning wλ = 0.
We normalize Oλ by its median value (ON) in a window contain-ing λ0 instead of normalizing it by Oλ0 , which is obviously moresensitive to noise than the median flux. The synthetic spectrum isthus modelled in units of ON , and we expect to obtain M λ0 ∼ 1 inthese units.
The search for the best parameters is carried out with a simulatedannealing method, which consists of a series of N M likelihood-guided Metropolis tours through the parameter space [see CidFernandes et al. (2001b) for an illustrated discussion of the Metropo-lis method applied to the population synthesis problem]. In each it-eration, the weights wλ are increased by a factor f w, thus narrowingthe peaks in the χ 2(x, M λ0 , AV , v∗ , σ ∗ ) hypersurface. The step size(ε) in each parameter is concomitantly decreased and the number ofsteps (N s) is increased to ensure that each parameter can in principlerandom-walk through all its allowed range of values (e.g. xj = 0 →1 for the x components). To speed up computations, the kinematic
parameters v� and σ � are kept fixed within the Metropolis loops, andrefitted at the end of each loop by a simpler minimization algorithm.
The output population vector usually contains many xj = 0 com-ponents. The code offers the possibility of refitting the data exclud-ing these components, which in principle allows a finer search for abest fit. In practice, however, this turns out to have little effect uponthe results reported here. We have also implemented a conjugategradients routine, which runs after each Metropolis loop, in order torefine the search for a minimum χ2, but this feature too turns out tobe largely irrelevant. The code ‘clips’ deviant points, assigning zeroweight to pixels that are more than 3σ away from the rms O λ −M λ residual flux. This feature, which obviously requires an initialestimate of Mλ, is useful to mask weak emission lines or defects inOλ not eliminated by the original wλ = 0 mask.
This same general method, with variations on numerical schemes,spectral base, extinction laws and other details, has been used inseveral recent investigations (e.g. Kauffmann et al. 2003a; Tremonti2003; Mayya et al. 2004; BC03).
3.2 The spectral base and tests
A key ingredient in the synthesis of stellar populations is the spec-tral base bj,λ. Ideally, the elements of the base should span the rangeof spectral properties observed in the sample galaxies and provideenough resolution in age and metallicity to address the desired sci-entific questions.
We used as a starting base the 30 SSPs used by Tremonti (2003)in her study of SDSS galaxies. These SSPs cover 10 ages, t =5 × 10⁶, 2.5 × 10⁷, 108, 2.9 × 10⁸, 6.4 × 10⁸, 9 × 10⁸, 1.4 ×10⁹, 2.5 × 10⁹, 5 × 10⁹ and 1.1 × 10¹⁰ yr, and three metallicities,Z = 0.2, 1 and 2.5 Z�. Tremonti also included nine other spectra inher base, corresponding to continuous star formation models of dif-ferent ages, e-folding times and metallicities. Not surprisingly, wefound that these spectra are very well modelled by combinations ofthe SSPs in the base. Their inclusion in the base therefore introduces
C© 2004 RAS, MNRAS 355, 273–296
Dow
nloaded from https://academ
ic.oup.com/m
nras/article/355/1/273/3101537 by guest on 29 Decem
ber 2021

Star formation history of Seyfert 2 nuclei 277
unnecessary redundancies, so we opted not to include these com-ponents. Smaller bases, with these same ages but only one or twometallicities, were also explored.
Extensive simulations were performed to evaluate the code’s abil-ity to recover input parameters, to calibrate its technical parameters(number of steps, step size, etc.) and to investigate the effects ofnoise in the data. To emulate the modelling of real galaxy spec-tra discussed in Section 4, the simulations were restricted to the3500–5200 Å interval, with masks around the wavelengths of strongemission lines.
Tests with fake galaxies generated out of the base show that, in theabsence of noise, the code is able to recover the input parameters toa high degree of accuracy. This is illustrated in Figs 1(a)–(c), wherewe plot input against output xj fractions for three selected ages andall three metallicities. The rms difference between input and outputxj in these simulations is typically ∼0.02.
0
25
50
75
0
25
50
75
0 25 50 75
0
25
50
75
0 25 50 75 0 25 50 75
Figure 1. Tests of the spectral synthesis method. Panels (a)–(c) compare input against output xj fractions for fake galaxies generated out of the base andwith no noise. Each panel contains individual xj components corresponding to three different metallicities but the same age. Panels (d)–(f) are equivalent topanels (a)–(c), but for simulations with noise of amplitude S/N = 20 added to each spectrum. The output fractions are now represented by the mean xj, and theerror bars correspond to the dispersion among 50 different realizations of the noise for each galaxy. The bottom panels (g)–(i) present the population vectorcondensed into just three age groups, xY, xI and xO, binned over all metallicities.
This good agreement goes away when noise is added to the spec-tra. As found in other population synthesis methods (e.g. Mayyaet al. 2004), noise has the effect of inducing substantial rearrange-ments among x components corresponding to spectrally similarpopulations. The reason for this is that noise washes away the differ-ences between bj,λ spectra which are similar due to intrinsic degen-eracies of stellar populations (like the age–metallicity degeneracy;Worthey 1994). The net effect is that, for practical purposes, thebase becomes linearly dependent, such that a given component iswell reproduced by linear combinations of others, as extensivelydiscussed by Cid Fernandes et al. (2001b). For realistic S/N ratios,these rearrangements have disastrous effects upon the individual xj
fractions, as illustrated in Figs 1(d)–(f). The test galaxies in theseplots are the same ones as used in the noise-free simulations (pan-els a–c), but with Gaussian noise of amplitude S/N = 20 addedto their spectra. Each galaxy was modelled 50 times for different
C© 2004 RAS, MNRAS 355, 273–296
Dow
nloaded from https://academ
ic.oup.com/m
nras/article/355/1/273/3101537 by guest on 29 Decem
ber 2021
278 R. Cid Fernandes et al.
realizations of the noise, and we plot the mean output xj with an er-ror bar to indicate the rms dispersion among these set of perturbedspectra. Clearly, the individual xj fractions are not well recoveredat all. Hence, while in principle it is desirable to use a large, fine-graded base, the resulting SFH expressed in x cannot be trusted tothe same level of detail.
A strategy to circumvent this problem is to group the xj fractionscorresponding to spectrally similar components, which yields muchmore reliable results at the expense of a coarser description of thestellar population mixture. This reduction can be done in a numberof ways (Pelat 1997; Moultaka & Pelat 2000; Chan, Mitchell &Cram 2003). Here we use our simulations to define combinationsof x components that are relatively immune to degeneracy effects.We define a reduced population vector with three age ranges: t �25 Myr; 100 Myr � t � 1.4 Gyr; and t � 2.5 Gyr. The result-ing population vector is denoted by (xY, xI, xO), where ‘Y’, ‘I’ and‘O’ correspond to young, intermediate and old respectively. Notethat the metallicity information is binned over in this description.Figs 1(g)–(i) show the input against output (xY, xI, xO) compo-nents for the same S/N = 20 simulations as described above. Thedeviations observed in the individual xj fractions are negligible inthis condensed description. Finally, we note that extinction does notsuffer from the degeneracies that plague the population vector. ForS/N = 20 the output AV matches the input value to within 0.04 magrms.
4 A P P L I C AT I O N TO S E Y F E RT 2 S
The synthesis method described above was applied to the spectrapresented in Section 2 in order to estimate the star formation historyin the central regions of Seyfert 2s.
4.1 Setup
For the application described in this paper, we have used the fol-lowing setup: N M = 10 Metropolis loops, with weights increasinggeometrically from f w = 0.1 to 10 times their nominal values whilethe step sizes decrease from ε = 0.1 to 0.005 for both the x compo-nents, Mλ0 and AV . The number of steps in each Metropolis run iscomputed as a function of the number of parameters being changedand the step size: N s = (N � + 1) ε−2. Since we are modelling galac-tic nuclei, it is reasonable to neglect the contribution of metal-poorpopulations. We thus opted to use a base of N � = 20 componentswith the same 10 ages described above but reduced to Z = 1 Z�and 2.5 Z�. This setup gives a total of ∼ 3 × 10⁶ steps in the searchfor a best model.
4.2 Preprocessing
Prior to the synthesis, all spectra were corrected for Galactic extinc-tion using the law of Cardelli, Clayton & Mathis (1989) and the AB
values from Schlegel, Finkbeiner & Davis (1998) as listed in theNASA/IPAC Extragalactic Database (NED). The spectra were alsorebinned to 1 Å sampling and shifted to the rest frame. The fittedvalues of v� should therefore be close to zero.
We chose to normalize the base at λ0 = 4020 Å, while the ob-served spectra are normalized to the median flux between 4010 and4060 Å. This facilitates comparison with previous studies, whichused a similar normalization (e.g. Gonzalez Delgado et al. 2004). Aflat error spectrum is assumed. We estimate the error in Oλ fromthe rms flux in the relatively clean window between 4760 and4810 Å. The signal-to-noise ratio varies between S/N ∼ 12 and
67, with a median of 27 in this interval, and about half these valuesin the 4010–4060 Å range.
Masks of 20–30 Å around obvious emission lines were con-structed for each object individually. In sources like NGC 3256 andESO 323-G32, these wλ = 0 masks remove relatively small portionsof the original spectra. In several cases, however, the emission-linespectrum is so rich that the unmasked spectrum contains relativelyfew stellar features apart from the continuum shape (e.g. Mrk 1210,NGC 4507). It some cases it was also necessary to mask the λ <
3650 Å region because of strong nebular emission in the Balmercontinuum (e.g. NGC 7212). The strongest stellar features that areless affected by emission are Ca II K and the G band. We have in-creased the weight of these two features by multiplying wλ by 2 inwindows of ∼40 Å around their central wavelengths, although thisis of little consequence for the results reported in this paper.
4.3 Featureless continuum component
A non-stellar component, represented by a F ν ∝ ν−1.5 power law,was added to the stellar base to represent the contribution of anAGN featureless continuum, a traditional ingredient in the spectralmodelling of Seyfert galaxies since Koski (1978). The fractionalcontribution of this component to the flux at λ0 is denoted by xF C.
In the framework of the unified model (e.g. Antonucci 1993), inSeyfert 2s this FC, if present, must be scattered radiation from thehidden type 1 Seyfert nucleus. Nevertheless, one must bear in mindthat young starbursts can easily appear disguised as an AGN-lookingcontinuum in optical spectra, a common problem faced in spectralsynthesis of Seyfert 2s (Cid Fernandes & Terlevich 1995; Storchi-Bergmann et al. 2000). The interpretation of xF C thus demands care.This issue is further discussed in Section 5.3.
4.4 Spectral synthesis results
Figs 2–10 illustrate some of the spectral fits. The examples werechosen to represent the variety of spectra and star formation historiesfound in the sample. The figures show the observed and syntheticspectra, as well as the Oλ − Mλ ‘pure emission’ residual spectrum.Emission lines, particularly weak ones, appear much more clearlyin the residual spectrum. The starlight subtraction also enhances theBalmer lines, particularly in nuclei with a significant intermediate-age stellar population (e.g. ESO 362-G08). A detailed analysis ofthe emission lines is postponed to a future communication.
The SFH plots (right-hand panels in Figs 2–10) show flux (xj)and mass (µj) fractions for all 10 ages spanned by the base, plus theFC component. Note that, by concentrating on the age distribution,we are ignoring the metallicity information in x. Even binning overZ, a description of the SFH in terms of 10 age bins is too detailedgiven the effects of noise, intrinsic degeneracies of the synthesis pro-cess, and limited spectral coverage of the data, which is even furtherlimited by the masks around emission lines. Rearrangements of thexj strengths among adjacent age bins in these figures would pro-duce fits of comparable quality, as found in independent populationsynthesis studies (e.g. Mayya et al. 2004).
As discussed in Section 3.2, a coarser but more robust descriptionof the SFH requires further binning of the age distributions in Figs 2–8. In Table 2 we condense the population vector x on to just fourcomponents: an FC (xFC), and three stellar components representingyoung (t � 2.5 × 10⁷ yr), intermediate-age (108 � t � 1.4 × 10⁹
yr) and old (t � 2.5 × 10⁹ yr) populations, denoted by xY, xI and xO
respectively. We note that the 25-Myr component is zero or closeto it in practically all galaxies, so that xY is virtually identical to
C© 2004 RAS, MNRAS 355, 273–296
Dow
nloaded from https://academ
ic.oup.com/m
nras/article/355/1/273/3101537 by guest on 29 Decem
ber 2021
Star formation history of Seyfert 2 nuclei 279
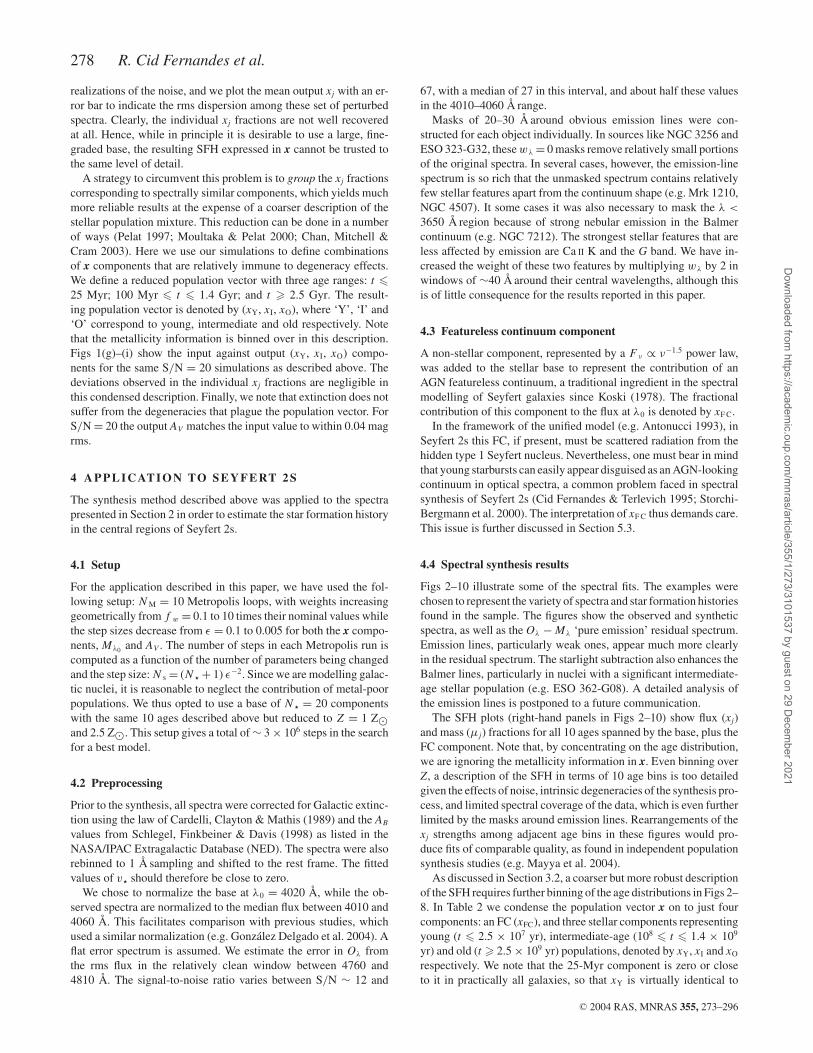
Figure 2. Results of the spectral fits for ESO 103-G35. The top left panel shows the logarithm of the observed and the synthetic spectra (shifted down forclarity). The O λ − M λ residual spectrum is shown in the bottom left panel. The spectral regions actually used in the synthesis are plotted with a thick (black)line, while masked regions are plotted with a thin (blue) line. Crosses indicate points excluded from the synthesis by a 3σ clipping algorithm. All spectra areshown in units of the normalization flux ON. The panels on the right show the population vector binned in the 10 ages of the base. The top panel corresponds tothe population vector in flux fraction (x), normalized to λ0 = 4020 Å, while the corresponding mass fractions vector µ is shown at the bottom. The power-lawcomponent xFC is plotted with an (arbitrary) age of 105.5 yr and marked by a diamond. No mass is associated to this component (i.e. µFC = 0 in the bottomright panel).
the 5-Myr component. Mass fractions are described into just threecomponents: µY, µI and µO, since we do not associate a mass tothe FC.
The values of AV and σ � produced by the synthesis are also listedin Table 2. The velocity dispersion was corrected by the instrumen-tal resolutions of both the J01 spectra (σ inst = 62 km s−1) and theSTELIB library (∼86 km s−1). Fig. 11 compares our estimates of σ �
with values compiled from the literature (mostly Nelson & Whittle1995). The agreement is good, with a mean and rms difference of3 ± 21 km s−1. In the median, our values are 12 km s−1 largerthan those in the literature, possibly due to filling of stellar ab-sorptions by weak emission lines not masked out in the fits. Onthe whole, however, this is a minor effect given that the uncer-tainty in σ � is typically 20 km s−1 both for our and the literaturevalues.
The quality of the fits can be measured by χ2λ, which is the χ 2 of
equation (2) divided by the effective number of wavelengths usedin the synthesis (i.e. discounting the masked points). In most caseswe obtain χ 2
λ ∼ 1, indicative of a good fit. However, the value of χ2λ
depends on the assumed noise amplitude and spectrum, as well ason extra weights given to special windows, so standard χ2 statistical
goodness-of-fit diagnostics do not apply. An alternative, albeit ratherinformal, measure of the quality of the fits is given by the meanabsolute percentage deviation between Oλ and Mλ for unmaskedpoints, which we denote by λ. Qualitatively, one expects this ratioto be of the order of the noise-to-signal (N/S) ratio. This expectationwas confirmed by the simulations, which yield λ = 10.9 ± 4.8 percent for S/N = 10 and 4.6 ± 0.4 per cent for S/N = 20. In the datafits we typically obtain values of 2–5 per cent for this figure of merit(Table 2), which is indeed of the order of (S/N)−1.
The random uncertainties in the model parameters were estimatedby means of Monte Carlo simulations, adding Gaussian noise withamplitude equal to the rms in the 4760–4810 Å range and repeatingthe fits 100 times for each galaxy. The resulting dispersions in theindividual xj components range from 2 to 8 per cent, with an averageσ (xj) of 4 per cent. As expected, the binned proportions are betterdetermined than the individual ones, with typical 1σ uncertainties of2, 2, 4 and 4 per cent for xFC, xY, xI and xO respectively. These valuesshould be regarded as order-of-magnitude estimates of the errors insynthesis. The detailed mapping of the error domain in parameterspace requires a thorough investigation of the full covariance matrix,a complex calculation given the high dimensionality of the problem.
C© 2004 RAS, MNRAS 355, 273–296
Dow
nloaded from https://academ
ic.oup.com/m
nras/article/355/1/273/3101537 by guest on 29 Decem
ber 2021
280 R. Cid Fernandes et al.
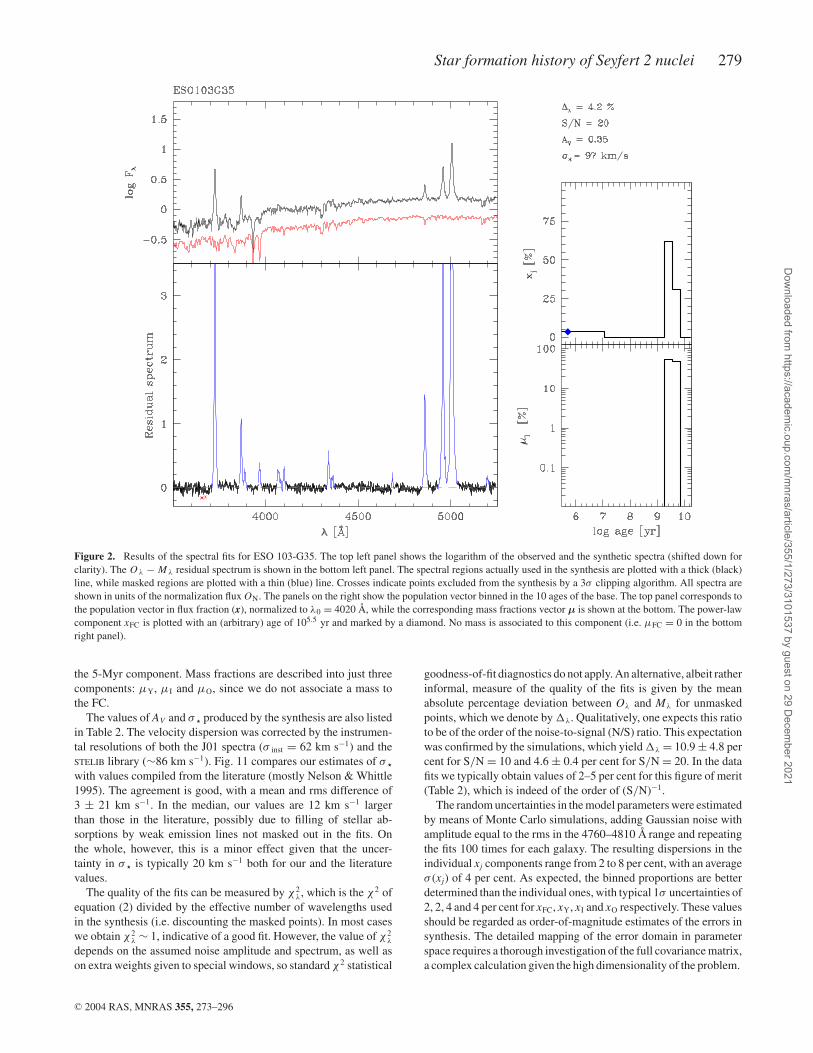
Figure 3. As Fig. 2, but for NGC 5506.
4.5 Diversity of stellar populations in Seyfert 2s
The spectral synthesis analysis shows that type 2 Seyfert nuclei aresurrounded by virtually every type of stellar population, as can beseen by the substantial variations in the derived SFHs (Figs 2–10and Table 2).
Some nuclei, like ESO 103-G35 (Fig. 2), NGC 4903 and 4941are dominated by old stars, with populations older than 2 Gyr ac-counting for over 80 per cent of the light at 4020 Å, while ESO362-G08 (Fig. 8), Mrk 1370, NGC 2979 and others have verystrong intermediate-age populations, with x I > 70 per cent. Youngstarbursts are also ubiquitous. In Mrk 1210, NGC 5135 and 7410they account for more than half of the λ4020 flux, and in severalother Seyfert 2s their contribution exceeds 20 per cent. Strong FCcomponents are also detected in several cases (e.g. NGC 5506 andMrk 883). In general, at least three of these four components arepresent with significant strengths (x � 10 per cent) in any onegalaxy.
This diversity is further illustrated in Fig. 12, where we presenta face-on projection of the x Y/FC + x I + x O = 1 plane, withx Y/FC ≡ x Y + x FC. This heterogeneity contrasts with the resultsfor our small sample of normal galaxies, all five of which are dom-inated by old stars (x O ∼ 85 per cent), with a minor contributionfrom intermediate-age populations.
4.6 Comparison with previous results
Several galaxies in our sample had their stellar populations stud-ied before. In this section we compare our results with those re-
ported by CF01, who combine observations of Seyfert 2s fromseveral other papers (Heckman et al. 1997; Storchi-Bergmann,Cid Fernandes & Schmitt 1998; Schmitt, Storchi-Bergmann &Cid Fernandes 1999; Gonzalez Delgado et al. 1998; GonzalezDelgado, Heckman & Leitherer 2001). There are 13 galaxies incommon with CF01. Their data are similar in wavelength rangeand quality to those in this paper. Furthermore (not coincidentally,of course), they follow a description of stellar population plus FCcomponents based on three broad groups, similar to those definedin Sections 3.2 and 4.4, which facilitates comparison with our re-sults. The main differences between these two studies resides in themethod of analysing the stellar population mixture. Whereas wemake use of the full spectrum, the population synthesis performedby CF01 is based on a handful of spectral indices (those listed inTable 3). Also, the stellar population base used by CF01 is that ofSchmidt et al. (1991), built upon integrated spectra of star clus-ters whose age and metallicity were determined by Bica & Alloin(1986), whereas here we use the BC03 models. Notwithstandingthe different methodologies, as well as differences in the spectrathemselves (e.g. due to the larger apertures in CF01), one expectsto find a reasonable agreement between these two studies.
Fig. 13 summarizes the results of this comparison. Stars are usedto plot the xY/FC fraction of CF01 (called just ‘xFC’ in that paper)against our estimate, after rescaling it to λ0 = 4861 Å to match thenormalization in CF01. The agreement is very good, with a meanoffset of 4 per cent and rms of 6 per cent between the two studies.Crosses and circles are used for the xINT and xOLD components ofCF01, which represent ∼100 Myr and �1 Gyr age bins. While
C© 2004 RAS, MNRAS 355, 273–296
Dow
nloaded from https://academ
ic.oup.com/m
nras/article/355/1/273/3101537 by guest on 29 Decem
ber 2021

Star formation history of Seyfert 2 nuclei 281
Figure 4. As Fig. 2, but for Mrk 883.
qualitatively similar, these two components do not compare wellwith our definitions of xI and xO, which are systematically largerand smaller than xINT and xOLD respectively. This is essentially due tothe different age-grouping schemes employed. Binning our 100- and290-Myr base components into x′
I and all t � 640 Myr componentsinto x′
O yields a good correspondence with the xINT and xOLD ofCF01, with residuals similar to those obtained for xY/FC, as shownin Fig. 13.
The two discrepant crosses at the bottom of Fig. 13 are IC 5135(NGC 7130) and NGC 5135. Again, the disagreement is only appar-ent. Our spectral synthesis finds null contributions of the 100- and290-Myr components, but for NGC 5135 it fits 27 per cent of thecontinuum at 4861 Å as due to the 640-Myr component, while for IC5135 18 and 21 per cent are associated with 640- and 900-Myr-oldbursts respectively. In our discrete base these components are adja-cent in age to the 290 Myr used as the upper limit for x′
I in the plot,and hence could well be regrouped within an intermediate-age com-ponent by a slight modification of the age range associated with x′
I,removing the discrepancy. In short, these ambiguities arise primarilybecause of the different age resolutions employed in the two stud-ies. Finally, we note that our results for these two galaxies comparewell with those of Gonzalez Delgado et al. (2001), who performeda detailed spectral fit of the Balmer absorption lines characteristicof intermediate-age populations using their own models (GonzalezDelgado, Leitherer & Heckman 1999). For both IC 5135 andNGC 5135 they find ∼50, 40 and 10 per cent contributions (at 4800Å) of young, intermediate-age and old populations respectively,where the intermediate-age component is modelled as a combina-
tion of 200-, 500- and 1000-Myr bursts. Our condensed populationvector (at 4861 Å) for these galaxies is (x Y/FC, x I, x O) = (60, 40,0) and (56, 27, 17) respectively.
We thus conclude that the population synthesis results reportedhere are consistent to within x ∼ 10 per cent with previous results,which is quite remarkable given differences in data and analysismethods. A clear advantage of our approach with respect to methodslike those in CF01 is that we model the full spectrum, which, besidesproviding more constraints, yields a more detailed understanding ofthe different components that make up a type 2 Seyfert spectrum.This advantage is explored next.
5 A NA LY S I S O F T H E S TA R L I G H T-S U B T R AC T E D S P E C T R A
The excellent fits of the starlight in our spectra provide a uniqueopportunity to investigate the presence of weak emission featuresin the O λ − M λ residual spectra. In this section we explore thisopportunity and examine the consequences for the interpretation ofthe synthesis results.
5.1 Wolf–Rayet stars
The presence of Wolf–Rayet (WR) starts, which produce the so-called WR bump at ∼4680 Å, provides a clear indication of starburstactivity that is complementary to the population synthesis. We haveused the starlight-subtracted spectra to investigate the presence ofthe WR bump in our sample galaxies.
C© 2004 RAS, MNRAS 355, 273–296
Dow
nloaded from https://academ
ic.oup.com/m
nras/article/355/1/273/3101537 by guest on 29 Decem
ber 2021
282 R. Cid Fernandes et al.
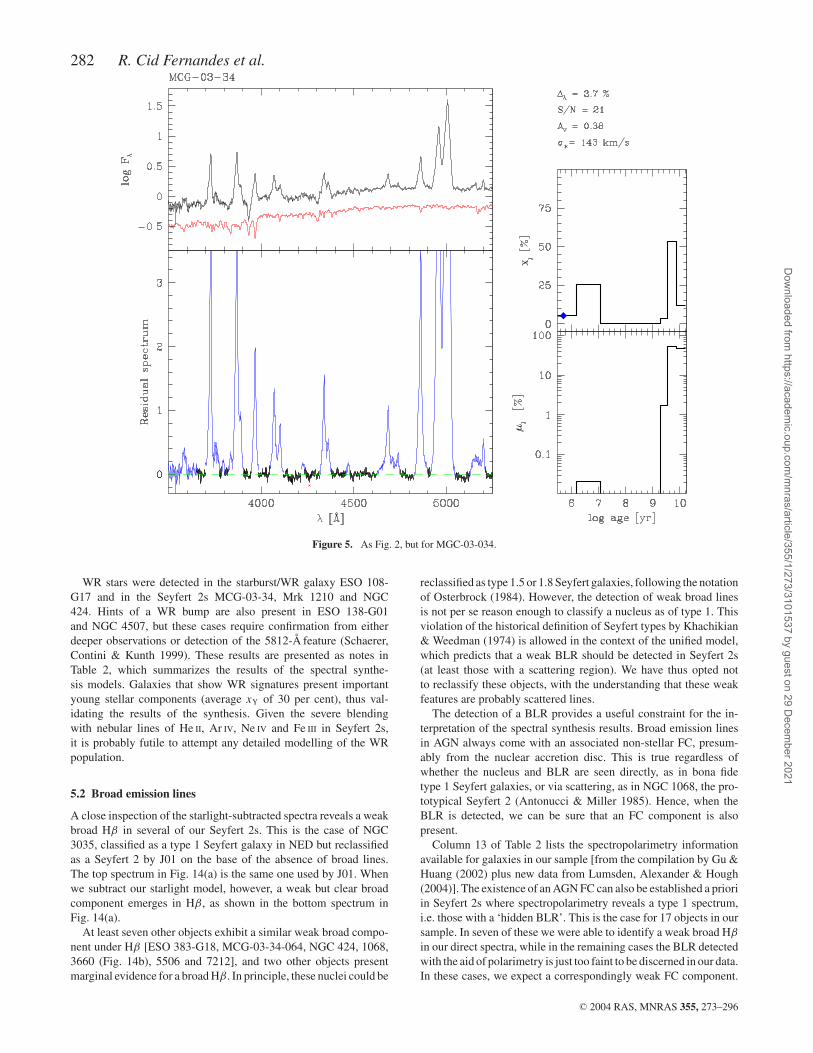
Figure 5. As Fig. 2, but for MGC-03-034.
WR stars were detected in the starburst/WR galaxy ESO 108-G17 and in the Seyfert 2s MCG-03-34, Mrk 1210 and NGC424. Hints of a WR bump are also present in ESO 138-G01and NGC 4507, but these cases require confirmation from eitherdeeper observations or detection of the 5812-Å feature (Schaerer,Contini & Kunth 1999). These results are presented as notes inTable 2, which summarizes the results of the spectral synthe-sis models. Galaxies that show WR signatures present importantyoung stellar components (average xY of 30 per cent), thus val-idating the results of the synthesis. Given the severe blendingwith nebular lines of He II, Ar IV, Ne IV and Fe III in Seyfert 2s,it is probably futile to attempt any detailed modelling of the WRpopulation.
5.2 Broad emission lines
A close inspection of the starlight-subtracted spectra reveals a weakbroad Hβ in several of our Seyfert 2s. This is the case of NGC3035, classified as a type 1 Seyfert galaxy in NED but reclassifiedas a Seyfert 2 by J01 on the base of the absence of broad lines.The top spectrum in Fig. 14(a) is the same one used by J01. Whenwe subtract our starlight model, however, a weak but clear broadcomponent emerges in Hβ, as shown in the bottom spectrum inFig. 14(a).
At least seven other objects exhibit a similar weak broad compo-nent under Hβ [ESO 383-G18, MCG-03-34-064, NGC 424, 1068,3660 (Fig. 14b), 5506 and 7212], and two other objects presentmarginal evidence for a broad Hβ. In principle, these nuclei could be
reclassified as type 1.5 or 1.8 Seyfert galaxies, following the notationof Osterbrock (1984). However, the detection of weak broad linesis not per se reason enough to classify a nucleus as of type 1. Thisviolation of the historical definition of Seyfert types by Khachikian& Weedman (1974) is allowed in the context of the unified model,which predicts that a weak BLR should be detected in Seyfert 2s(at least those with a scattering region). We have thus opted notto reclassify these objects, with the understanding that these weakfeatures are probably scattered lines.
The detection of a BLR provides a useful constraint for the in-terpretation of the spectral synthesis results. Broad emission linesin AGN always come with an associated non-stellar FC, presum-ably from the nuclear accretion disc. This is true regardless ofwhether the nucleus and BLR are seen directly, as in bona fidetype 1 Seyfert galaxies, or via scattering, as in NGC 1068, the pro-totypical Seyfert 2 (Antonucci & Miller 1985). Hence, when theBLR is detected, we can be sure that an FC component is alsopresent.
Column 13 of Table 2 lists the spectropolarimetry informationavailable for galaxies in our sample [from the compilation by Gu &Huang (2002) plus new data from Lumsden, Alexander & Hough(2004)]. The existence of an AGN FC can also be established a prioriin Seyfert 2s where spectropolarimetry reveals a type 1 spectrum,i.e. those with a ‘hidden BLR’. This is the case for 17 objects in oursample. In seven of these we were able to identify a weak broad Hβ
in our direct spectra, while in the remaining cases the BLR detectedwith the aid of polarimetry is just too faint to be discerned in our data.In these cases, we expect a correspondingly weak FC component.
C© 2004 RAS, MNRAS 355, 273–296
Dow
nloaded from https://academ
ic.oup.com/m
nras/article/355/1/273/3101537 by guest on 29 Decem
ber 2021
Star formation history of Seyfert 2 nuclei 283
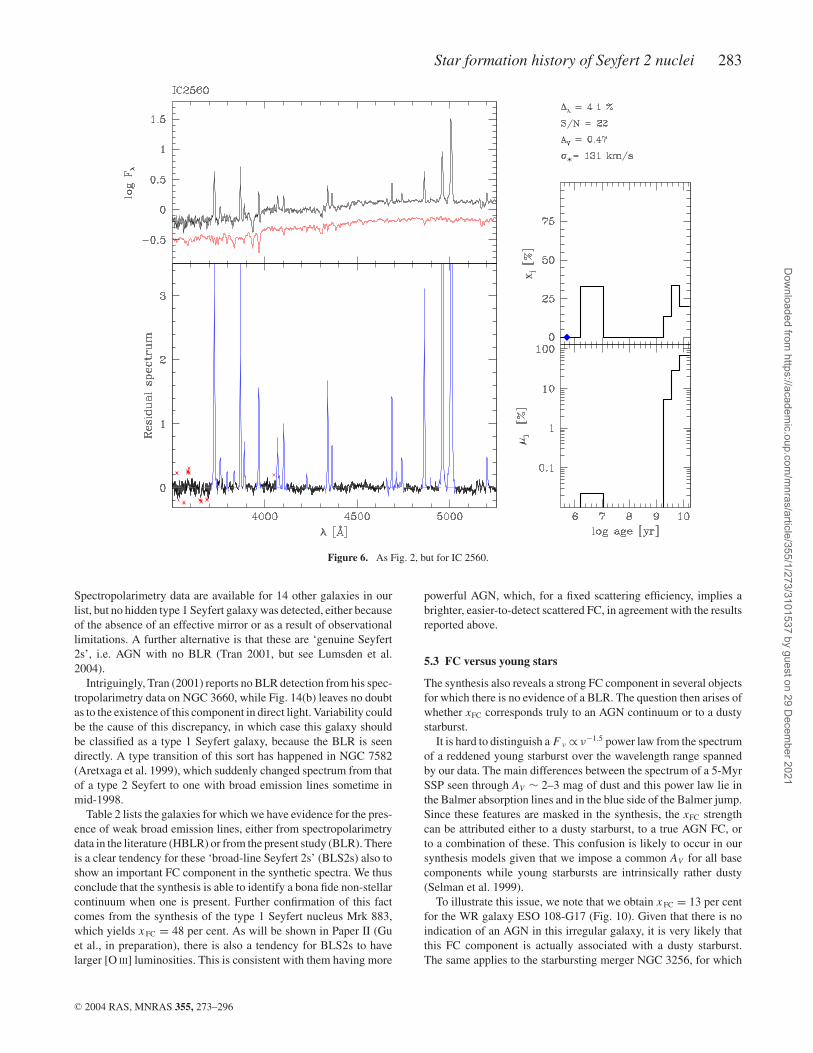
Figure 6. As Fig. 2, but for IC 2560.
Spectropolarimetry data are available for 14 other galaxies in ourlist, but no hidden type 1 Seyfert galaxy was detected, either becauseof the absence of an effective mirror or as a result of observationallimitations. A further alternative is that these are ‘genuine Seyfert2s’, i.e. AGN with no BLR (Tran 2001, but see Lumsden et al.2004).
Intriguingly, Tran (2001) reports no BLR detection from his spec-tropolarimetry data on NGC 3660, while Fig. 14(b) leaves no doubtas to the existence of this component in direct light. Variability couldbe the cause of this discrepancy, in which case this galaxy shouldbe classified as a type 1 Seyfert galaxy, because the BLR is seendirectly. A type transition of this sort has happened in NGC 7582(Aretxaga et al. 1999), which suddenly changed spectrum from thatof a type 2 Seyfert to one with broad emission lines sometime inmid-1998.
Table 2 lists the galaxies for which we have evidence for the pres-ence of weak broad emission lines, either from spectropolarimetrydata in the literature (HBLR) or from the present study (BLR). Thereis a clear tendency for these ‘broad-line Seyfert 2s’ (BLS2s) also toshow an important FC component in the synthetic spectra. We thusconclude that the synthesis is able to identify a bona fide non-stellarcontinuum when one is present. Further confirmation of this factcomes from the synthesis of the type 1 Seyfert nucleus Mrk 883,which yields x FC = 48 per cent. As will be shown in Paper II (Guet al., in preparation), there is also a tendency for BLS2s to havelarger [O III] luminosities. This is consistent with them having more
powerful AGN, which, for a fixed scattering efficiency, implies abrighter, easier-to-detect scattered FC, in agreement with the resultsreported above.
5.3 FC versus young stars
The synthesis also reveals a strong FC component in several objectsfor which there is no evidence of a BLR. The question then arises ofwhether xFC corresponds truly to an AGN continuum or to a dustystarburst.
It is hard to distinguish a F ν ∝ ν−1.5 power law from the spectrumof a reddened young starburst over the wavelength range spannedby our data. The main differences between the spectrum of a 5-MyrSSP seen through AV ∼ 2–3 mag of dust and this power law lie inthe Balmer absorption lines and in the blue side of the Balmer jump.Since these features are masked in the synthesis, the xFC strengthcan be attributed either to a dusty starburst, to a true AGN FC, orto a combination of these. This confusion is likely to occur in oursynthesis models given that we impose a common AV for all basecomponents while young starbursts are intrinsically rather dusty(Selman et al. 1999).
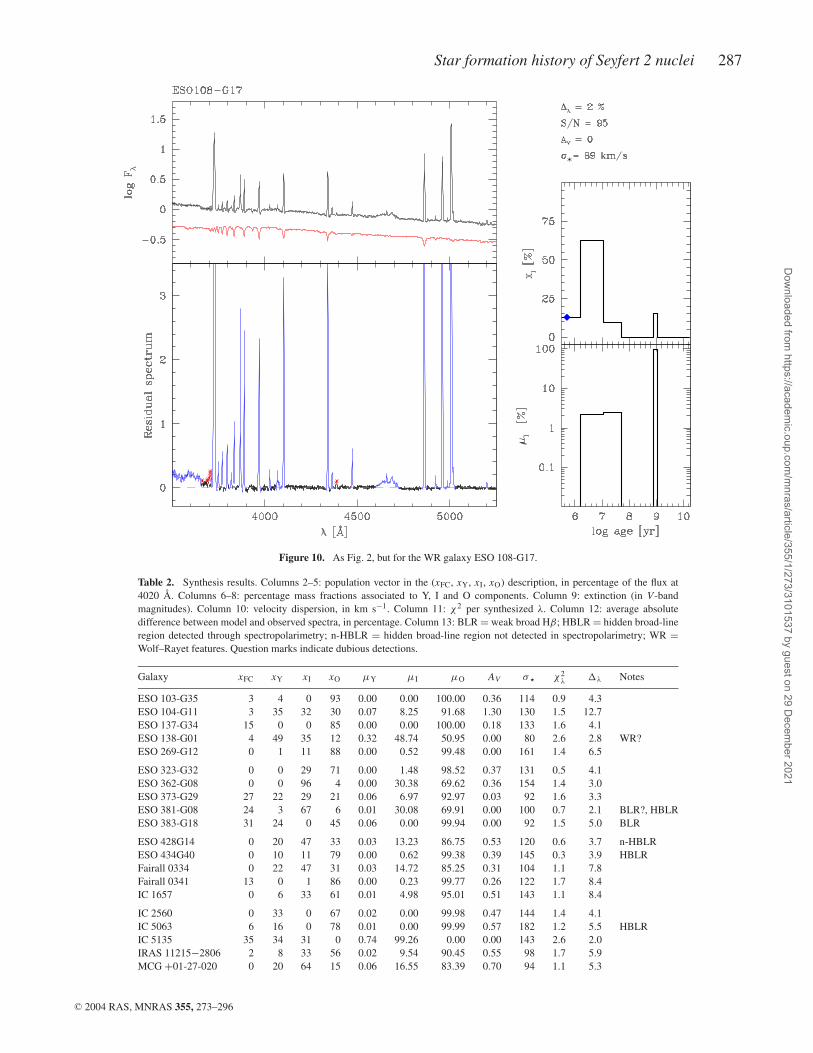
To illustrate this issue, we note that we obtain x FC = 13 per centfor the WR galaxy ESO 108-G17 (Fig. 10). Given that there is noindication of an AGN in this irregular galaxy, it is very likely thatthis FC component is actually associated with a dusty starburst.The same applies to the starbursting merger NGC 3256, for which
C© 2004 RAS, MNRAS 355, 273–296
Dow
nloaded from https://academ
ic.oup.com/m
nras/article/355/1/273/3101537 by guest on 29 Decem
ber 2021

284 R. Cid Fernandes et al.
Figure 7. As Fig. 2, but for NGC 5135.
we derive x FC = 24 per cent. Note, however, that in both cases thesynthesis identifies a dominant young population, with x Y = 72 and45 per cent respectively.
Not surprisingly, the starburst–FC degeneracy is more pro-nounced in galaxies known to harbour an active nucleus. ForNGC 6221, for instance, we find x FC = 32 per cent, x Y = 28 per centand AV = 0.5, while from the detailed imaging analysis and mod-elling of the full spectral energy distribution carried out by Levensonet al. (2001) we know that this nucleus is dominated by heavily ex-tincted (AV ∼ 3) young star clusters within <1 arcsec of the AGN,with just a few per cent of the optical light originating in the AGNresponsible for its Seyfert-like X-ray properties. Most of the largexFC obtained by the synthesis is thus associated with this reddenedstarburst. Another emblematic example is IC 5135 (NGC 7130),whose ultraviolet spectrum shows wind lines of massive stars anda logarithmic slope typical of dusty starbursts, with little or no signof a power law (Gonzalez Delgado et al. 1998), while our synthesisyields x FC = 35 per cent, x Y = 34 per cent and AV = 0. Similarcomments can be made about other galaxies in the sample (e.g.NGC 5135 and 7582).
These examples show that dusty starbursts, when present, are de-tected as an FC component by our synthesis method. The fractionxFC should thus be regarded as an upper limit to the contributionof a true FC, while the light fraction associated with very recentstar formation is bracketed between xY and xY/FC. While there isno way to break this spectral degeneracy without broader spectral
coverage, the information on the presence of weak broad lines, col-lected in Table 2, helps in tackling this issue. As discussed in Section5.2, whenever a BLR component is detected in either direct or po-larized light, we can be sure that a true FC is present. One thusexpects BLS2s to have larger xFC values than Seyfert 2s for whichwe have no such independent evidence for the presence of an AGNcontinuum.
This expectation is confirmed by the synthesis. The four largestvalues of xFC among Seyfert 2s, for instance, are all found in sys-tems that show weak broad Hβ. The link between large xFC andthe presence of broad lines is illustrated in Fig. 15, which showsthat the fraction of BLS2s increases systematically with increasingxFC. This effect is also clear in the statistics of xFC, which assumesa median (mean) value of 21 per cent (19 per cent) among BLS2sbut just 2 per cent (7 per cent) among the rest of the Seyfert 2s. Aspredicted in Section 5.2, selecting only the galaxies where we seethe BLR in our direct spectra increases the median (mean) xFC to31 per cent (29 per cent), while the 10 nuclei where a hidden BLRappears in polarized spectra but not in our data have weaker FCs:5 per cent (8 per cent).
Overall, these results confirm the prediction of Cid Fernandes& Terlevich (1995), who estimated that a broad component in Hβ
should become discernible whenever the scattered FC contributeswith �20 per cent of the optical continuum. Whenever xFC exceeds∼20 per cent but no BLR is seen, this component most likely orig-inates in a dusty starburst rather than in a non-stellar source.
C© 2004 RAS, MNRAS 355, 273–296
Dow
nloaded from https://academ
ic.oup.com/m
nras/article/355/1/273/3101537 by guest on 29 Decem
ber 2021

Star formation history of Seyfert 2 nuclei 285
Figure 8. As Fig. 2, but for ESO 362-G08.
6 S T E L L A R I N D I C E S
In order to facilitate the comparison of some relevant aspects of ourpopulation synthesis models and published work, we have found itconvenient to express our results in terms of specific indices (linesand colours). In this section we present a simple characterization ofthe stellar populations in Seyfert 2s on the basis of a set of indicescommonly used in the literature.
6.1 Direct measurements
In order to provide an empirical characterization of stellar popu-lations in our sample galaxies, we have measured a set of stellarindices directly from the observed spectra. To facilitate the compar-ison with previous studies, we have employed the index definitionsused by Cid Fernandes et al. (2004), which are ultimately basedon the studies by Bica & Alloin (1986a,b) and Bica (1988) of starcluster and galaxy spectra.
We have measured the equivalent widths of the Ca II K (W K), CN(W CN) and G bands (WG), as well as the colours C3660 and C4510, de-fined as the ratios between the continuum at 3660 and 4510 Å to thecontinuum at 4020 Å, respectively. All these indices are measuredwith respect to a pseudo-continuum, which we define automaticallyfollowing the recipe in Cid Fernandes et al. (2004), after verifyingthat it works well for the present sample. Table 3 lists the resultingstellar indices. In this paper we give particular emphasis to the Kline. Previous studies have shown that W K, which essentially mea-
sures the contrast between old and young populations, provides auseful mono-parametric description of stellar populations in galax-ies. For instance, Seyfert 2s with unambiguous signatures of re-cent star formation (such as ultraviolet wind lines, the WR bump,or high-order Balmer absorption lines) all have K lines diluted toW K � 10 Å (CF01).
Fig. 16(a) shows the W K versus C3660 diagram. This plot has theadvantage of involving only direct measurements, which, in the caseof the JO1 spectra, is not possible for more popular indices. The solidand dotted curves show the evolution of instantaneous burst BC03models for solar (solid, green line) and 2.5-solar metallicity (dotted,red line). The region occupied by pure stellar populations in thisdiagram is delimited by these tracks and a mixing line joining theyoungest and oldest models. Points located below the BC03 modelsin the bottom right of the plot are explained as a combination ofobservational errors and intrinsic reddening, both of which affectthe C3660 colour more than W K.
The dashed (blue) line in Fig. 16 represents a mixing line, wherea canonical AGN F ν ∝ ν−1.5 power law is added to an old stellarpopulation in different proportions, from a pure power law at (W K,C 3660) = (0, 1.05) to a pure 1010 yr population at ∼(20, 0.7). Thefact that few galaxies line up along this mixing line shows that asimple ‘elliptical galaxy’ plus power-law model, adopted in manyearly AGN studies, does not apply to the bulk of Seyfert 2s. On thecontrary, the spread of points in this diagram implies a substantialdiversity in the central stellar populations of Seyfert 2s, in agreementwith our synthesis results (e.g. Fig. 12) as well as with previous
C© 2004 RAS, MNRAS 355, 273–296
Dow
nloaded from https://academ
ic.oup.com/m
nras/article/355/1/273/3101537 by guest on 29 Decem
ber 2021

286 R. Cid Fernandes et al.
Figure 9. As Fig. 2, but for Mrk 1370.
studies (Cid Fernandes, Storchi-Bergmann & Schmitt 1998; SeroteRoos et al. 1998; Boisson et al. 2000; J01).
6.2 Indirect measurements
Unfortunately, other useful tracers of the star formation history,such as the Dn(4000) and HδA indices (Worthey & Ottaviani 1997;Balogh et al. 1999), cannot be measured directly for many of ourgalaxies because of severe contamination by emission lines. An indi-rect measurement of these indices can be performed over the modelstarlight spectra described in Section 3. Naturally, the informationcontained in these ‘semi-empirical’ indices is identical to the onecontained in the model spectra from which they are measured. Theyare nevertheless useful for stellar population diagnostics based onobservable indices, such as the Dn(4000) versus HδA diagram am-ply explored by Kauffmann et al. (2003a,b) in their study of SDSSgalaxies.
Fig. 16(b) shows W K and C3660 measured from the dereddenedsynthetic spectra. The main difference with respect to the observedversion of this diagram (Fig. 16a) is in the bottom right points,which move upwards (to within the region spanned by the BC03models) as a result of the correction for intrinsic reddening. Objectsin which a BLR is detected in either direct or polarized light (i.e.BLS2s, represented by filled circles) occupy a characteristic regionin this plot, close to the power-law plus old stars mixing line. Thisis consistent with the existence of an FC implied by the detectionof a BLR. This tendency is also evident, albeit less clearly, in theobserved W K versus C3660 diagram (Fig. 16a).
Fig. 17 shows the synthetic Dn(4000) versus HδA diagram forour sample. As in Fig. 16, the scatter of points in this plot reflectsthe wide variety of stellar populations of Seyfert 2s, ranging fromsystems dominated by young stars, to post-starbursts and older sys-tems, as well as mixtures of these populations. Again, objects wherean FC is known to be present from the detection of a BLR are sys-tematically offset towards the power-law plus old stars mixing line.Note, however, that even these objects cannot be entirely explainedin terms of this simple two-component model. An illustrative exam-ple in this respect is Mrk 1210, with Dn(4000) = 1.3 and Hδ A = 1.6Å. This galaxy has both a hidden BLR detected through spectropo-larimetry (Tran, Miller & Kay 1992) and a very young starburst,responsible for its WR bump (Storchi-Bergmann et al. 1998; Joguet2001). Other examples include Mrk 477 (Tran et al. 1992; Heckmanet al. 1997), Mrk 463E (Miller & Goodrich 1990; Gonzalez Delgadoet al. 2001) and NGC 424 (Moran et al. 2000; Joguet 2001).
7 D I S C U S S I O N
7.1 Statistics of star formation in Seyfert 2s
Fig. 18 shows histograms of the xY/FC, xI and xO components forthe 65 Seyfert 2s in the sample, as well as the distributions ofW K and log t , the flux-weighted mean stellar age (computed ac-cording to its definition in Cid Fernandes, Leao & Lacerda 2003).These histograms illustrate the frequency of recent star formation inSeyfert 2s.
C© 2004 RAS, MNRAS 355, 273–296
Dow
nloaded from https://academ
ic.oup.com/m
nras/article/355/1/273/3101537 by guest on 29 Decem
ber 2021
Star formation history of Seyfert 2 nuclei 287
Figure 10. As Fig. 2, but for the WR galaxy ESO 108-G17.
Table 2. Synthesis results. Columns 2–5: population vector in the (xFC, xY, xI, xO) description, in percentage of the flux at4020 Å. Columns 6–8: percentage mass fractions associated to Y, I and O components. Column 9: extinction (in V-bandmagnitudes). Column 10: velocity dispersion, in km s−1. Column 11: χ2 per synthesized λ. Column 12: average absolutedifference between model and observed spectra, in percentage. Column 13: BLR = weak broad Hβ; HBLR = hidden broad-lineregion detected through spectropolarimetry; n-HBLR = hidden broad-line region not detected in spectropolarimetry; WR =Wolf–Rayet features. Question marks indicate dubious detections.
Galaxy xFC xY xI xO µY µI µO AV σ � χ2λ λ Notes
ESO 103-G35 3 4 0 93 0.00 0.00 100.00 0.36 114 0.9 4.3ESO 104-G11 3 35 32 30 0.07 8.25 91.68 1.30 130 1.5 12.7ESO 137-G34 15 0 0 85 0.00 0.00 100.00 0.18 133 1.6 4.1ESO 138-G01 4 49 35 12 0.32 48.74 50.95 0.00 80 2.6 2.8 WR?ESO 269-G12 0 1 11 88 0.00 0.52 99.48 0.00 161 1.4 6.5
ESO 323-G32 0 0 29 71 0.00 1.48 98.52 0.37 131 0.5 4.1ESO 362-G08 0 0 96 4 0.00 30.38 69.62 0.36 154 1.4 3.0ESO 373-G29 27 22 29 21 0.06 6.97 92.97 0.03 92 1.6 3.3ESO 381-G08 24 3 67 6 0.01 30.08 69.91 0.00 100 0.7 2.1 BLR?, HBLRESO 383-G18 31 24 0 45 0.06 0.00 99.94 0.00 92 1.5 5.0 BLR
ESO 428G14 0 20 47 33 0.03 13.23 86.75 0.53 120 0.6 3.7 n-HBLRESO 434G40 0 10 11 79 0.00 0.62 99.38 0.39 145 0.3 3.9 HBLRFairall 0334 0 22 47 31 0.03 14.72 85.25 0.31 104 1.1 7.8Fairall 0341 13 0 1 86 0.00 0.23 99.77 0.26 122 1.7 8.4IC 1657 0 6 33 61 0.01 4.98 95.01 0.51 143 1.1 8.4
IC 2560 0 33 0 67 0.02 0.00 99.98 0.47 144 1.4 4.1IC 5063 6 16 0 78 0.01 0.00 99.99 0.57 182 1.2 5.5 HBLRIC 5135 35 34 31 0 0.74 99.26 0.00 0.00 143 2.6 2.0IRAS 11215−2806 2 8 33 56 0.02 9.54 90.45 0.55 98 1.7 5.9MCG +01-27-020 0 20 64 15 0.06 16.55 83.39 0.70 94 1.1 5.3
C© 2004 RAS, MNRAS 355, 273–296
Dow
nloaded from https://academ
ic.oup.com/m
nras/article/355/1/273/3101537 by guest on 29 Decem
ber 2021

288 R. Cid Fernandes et al.
Table 2 – continued
Galaxy xFC xY xI xO µY µI µO AV σ � χ2λ λ Notes
MCG -03-34-064 5 26 0 69 0.02 0.00 99.98 0.38 155 1.5 3.8 BLR, HBLR, WRMrk 0897 18 19 60 3 0.20 60.56 39.24 0.00 133 1.8 2.1Mrk 1210 3 53 5 39 0.07 0.89 99.05 1.03 114 4.1 5.9 HBLR, WRMrk 1370 0 0 73 27 0.00 13.17 86.83 0.47 86 1.6 4.7NGC 0424 36 13 0 52 0.02 0.00 99.98 0.62 143 1.8 4.2 BLR, HBLR, WR
NGC 0788 0 13 0 87 0.01 0.00 99.99 0.00 163 1.3 6.0 HBLRNGC 1068 23 24 0 54 0.04 0.00 99.96 0.00 144 1.1 3.1 BLR, HBLRNGC 1125 10 0 64 26 0.00 48.92 51.08 0.04 105 1.6 5.8NGC 1667 0 8 26 66 0.01 2.54 97.45 0.58 149 1.6 8.9 n-HBLRNGC 1672 9 12 68 11 0.03 24.55 75.42 0.24 97 0.7 2.7
NGC 2110 0 26 7 67 0.01 0.05 99.93 0.38 242 2.8 9.2NGC 2979 0 1 78 21 0.00 15.70 84.30 0.70 112 1.4 5.5NGC 2992 0 6 35 59 0.00 2.60 97.40 1.24 172 0.9 6.3 HBLRNGC 3035 9 5 18 69 0.00 0.18 99.81 0.08 161 0.8 4.6 BLRNGC 3081 21 5 0 74 0.00 0.00 100.00 0.06 134 0.5 3.0 HBLR
NGC 3281 2 16 0 82 0.01 0.00 99.99 0.67 160 0.8 5.6 n-HBLRNGC 3362 12 0 30 58 0.00 10.39 89.61 0.21 104 1.2 5.7 n-HBLRNGC 3393 14 4 0 83 0.00 0.00 100.00 0.06 157 0.4 2.7NGC 3660 45 0 28 26 0.00 3.98 96.02 0.06 95 1.0 2.9 BLR, n-HBLRNGC 4388 16 13 0 70 0.02 0.00 99.98 0.73 111 1.5 4.3 HBLR
NGC 4507 24 19 0 57 0.02 0.00 99.98 0.00 144 0.6 2.2 BLR?, HBLR, WR?NGC 4903 0 6 11 83 0.00 0.50 99.50 0.55 200 1.0 6.8NGC 4939 0 15 0 85 0.01 0.00 99.99 0.18 155 0.7 3.7NGC 4941 2 1 11 86 0.00 0.35 99.65 0.16 98 0.1 2.9 n-HBLRNGC 4968 1 20 58 22 0.04 15.17 84.79 1.04 121 1.5 7.9
NGC 5135 12 57 24 6 0.17 6.27 93.56 0.38 143 2.8 2.8 n-HBLRNGC 5252 0 14 0 86 0.01 0.00 99.99 0.57 209 0.9 3.8 HBLRNGC 5427 0 16 12 72 0.01 1.63 98.35 0.45 100 1.5 6.9NGC 5506 63 0 5 33 0.00 4.75 95.25 0.76 98 1.9 3.9 BLR, HBLRNGC 5643 6 0 88 6 0.00 43.15 56.85 0.30 93 0.7 2.1 n-HBLR
NGC 5674 2 0 36 63 0.00 0.71 99.29 0.64 129 1.1 10.0NGC 5728 0 20 51 28 0.02 6.99 92.99 0.25 155 0.5 2.0 n-HBLRNGC 5953 18 1 74 7 0.00 57.94 42.06 0.67 93 0.9 2.7NGC 6221 32 28 32 8 0.14 14.43 85.43 0.49 111 1.7 3.3NGC 6300 0 0 75 25 0.00 16.03 83.97 0.92 100 0.5 4.2 n-HBLR
NGC 6890 13 6 9 72 0.01 2.27 97.72 0.45 109 0.7 3.9 n-HBLRNGC 7172 0 11 13 76 0.01 0.95 99.05 0.80 190 1.7 11.5 n-HBLRNGC 7212 35 0 0 65 0.00 0.00 100.00 0.36 168 1.5 3.2 BLR, HBLRNGC 7314 27 5 0 68 0.00 0.00 100.00 0.83 60 2.0 16.6 HBLRNGC 7496 27 23 44 6 0.07 9.11 90.82 0.00 101 1.9 2.3 n-HBLR
NGC 7582 31 0 69 0 0.00 100.00 0.00 1.23 132 1.9 2.1 n-HBLRNGC 7590 1 0 49 50 0.00 7.63 92.38 0.70 99 0.4 3.0 n-HBLRNGC 7679 9 0 91 0 0.00 81.81 18.19 0.42 96 2.7 2.6NGC 7682 6 8 0 86 0.00 0.00 100.00 0.00 152 0.9 4.2 HBLRNGC 7743 0 1 77 21 0.00 23.10 76.89 0.48 95 0.6 3.4MRK 0883 48 16 31 5 0.14 74.38 25.47 0.69 202 0.7 3.6
NGC 1097 19 31 37 12 0.05 4.10 95.85 0.24 150 2.2 3.9NGC 4303 11 4 59 26 0.00 12.69 87.30 0.10 82 0.3 2.8NGC 4602 0 25 49 25 0.04 8.10 91.87 0.36 94 1.1 5.3NGC 7410 12 57 24 6 0.17 6.33 93.50 0.54 140 2.7 2.8
ESO 108-G17 13 72 15 0 4.70 95.30 0.00 0.00 108 10.6 2.1 WRNGC 1487 0 96 0 4 0.75 0.00 99.25 0.00 145 6.0 5.4NGC 2935 0 12 38 50 0.01 1.93 98.07 0.37 143 0.5 3.2NGC 3256 24 45 30 0 1.00 47.94 51.07 0.45 128 4.7 2.5NGC 2811 0 0 13 87 0.00 0.08 99.92 0.28 246 0.6 4.2
NGC 3223 0 0 12 88 0.00 0.15 99.85 0.18 170 0.7 5.7NGC 3358 0 0 18 82 0.00 0.56 99.44 0.21 194 0.7 5.0NGC 3379 0 0 14 86 0.00 0.27 99.73 0.00 217 0.7 3.8NGC 4365 0 0 17 83 0.00 0.13 99.87 0.29 257 0.7 4.6
C© 2004 RAS, MNRAS 355, 273–296
Dow
nloaded from https://academ
ic.oup.com/m
nras/article/355/1/273/3101537 by guest on 29 Decem
ber 2021
Star formation history of Seyfert 2 nuclei 289
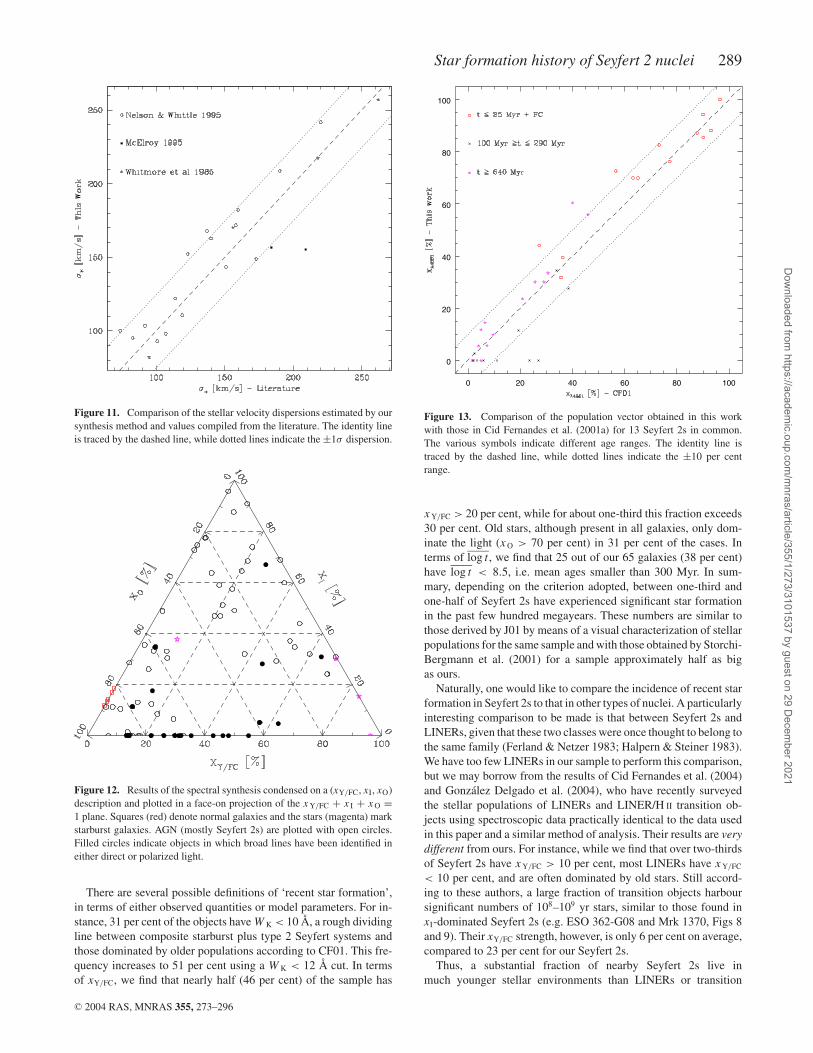
Figure 11. Comparison of the stellar velocity dispersions estimated by oursynthesis method and values compiled from the literature. The identity lineis traced by the dashed line, while dotted lines indicate the ±1σ dispersion.
Figure 12. Results of the spectral synthesis condensed on a (xY/FC, xI, xO)description and plotted in a face-on projection of the x Y/FC + x I + x O =1 plane. Squares (red) denote normal galaxies and the stars (magenta) markstarburst galaxies. AGN (mostly Seyfert 2s) are plotted with open circles.Filled circles indicate objects in which broad lines have been identified ineither direct or polarized light.
There are several possible definitions of ‘recent star formation’,in terms of either observed quantities or model parameters. For in-stance, 31 per cent of the objects have W K < 10 Å, a rough dividingline between composite starburst plus type 2 Seyfert systems andthose dominated by older populations according to CF01. This fre-quency increases to 51 per cent using a W K < 12 Å cut. In termsof xY/FC, we find that nearly half (46 per cent) of the sample has
0 20 40 60 80 100
0
20
40
60
80
100
Figure 13. Comparison of the population vector obtained in this workwith those in Cid Fernandes et al. (2001a) for 13 Seyfert 2s in common.The various symbols indicate different age ranges. The identity line istraced by the dashed line, while dotted lines indicate the ±10 per centrange.
x Y/FC > 20 per cent, while for about one-third this fraction exceeds30 per cent. Old stars, although present in all galaxies, only dom-inate the light (x O > 70 per cent) in 31 per cent of the cases. Interms of log t , we find that 25 out of our 65 galaxies (38 per cent)have log t < 8.5, i.e. mean ages smaller than 300 Myr. In sum-mary, depending on the criterion adopted, between one-third andone-half of Seyfert 2s have experienced significant star formationin the past few hundred megayears. These numbers are similar tothose derived by J01 by means of a visual characterization of stellarpopulations for the same sample and with those obtained by Storchi-Bergmann et al. (2001) for a sample approximately half as bigas ours.
Naturally, one would like to compare the incidence of recent starformation in Seyfert 2s to that in other types of nuclei. A particularlyinteresting comparison to be made is that between Seyfert 2s andLINERs, given that these two classes were once thought to belong tothe same family (Ferland & Netzer 1983; Halpern & Steiner 1983).We have too few LINERs in our sample to perform this comparison,but we may borrow from the results of Cid Fernandes et al. (2004)and Gonzalez Delgado et al. (2004), who have recently surveyedthe stellar populations of LINERs and LINER/H II transition ob-jects using spectroscopic data practically identical to the data usedin this paper and a similar method of analysis. Their results are verydifferent from ours. For instance, while we find that over two-thirdsof Seyfert 2s have x Y/FC > 10 per cent, most LINERs have x Y/FC
< 10 per cent, and are often dominated by old stars. Still accord-ing to these authors, a large fraction of transition objects harboursignificant numbers of 108–109 yr stars, similar to those found inxI-dominated Seyfert 2s (e.g. ESO 362-G08 and Mrk 1370, Figs 8and 9). Their xY/FC strength, however, is only 6 per cent on average,compared to 23 per cent for our Seyfert 2s.
Thus, a substantial fraction of nearby Seyfert 2s live inmuch younger stellar environments than LINERs or transition
C© 2004 RAS, MNRAS 355, 273–296
Dow
nloaded from https://academ
ic.oup.com/m
nras/article/355/1/273/3101537 by guest on 29 Decem
ber 2021

290 R. Cid Fernandes et al.
Figure 14. (a) The total spectrum (top) of NGC 3035, and the starlight-subtracted spectrum (bottom) of the same galaxy, showing a broad Hβ com-ponent not evident in the total spectrum. The dashed line marks the zero fluxlevel for the bottom spectrum. (b) As the top panel, but for NGC 3660.
objects, which suggests an evolutionary sequence. Given that thelater objects are known to harbour less luminous AGN and have dif-ferent gas excitation conditions than Seyfert galaxies, if confirmed,this would imply a substantial evolution of the AGN itself – in par-allel with the evolution of stars in its surroundings.
7.2 Aperture effects
Spectra collected through apertures of fixed angular size sampledistance-dependent linear scales, which may introduce systematiceffects on the derived stellar population mixtures. In order to in-vestigate whether such potential biases affect our results in somesystematic way, we plot in Fig. 19 the equivalent width of Ca II Kagainst the parsec/arcsec scale. (Recall that our observations coveran area of ∼1 arcsec2.) No systematic trend is observed betweenthis stellar population tracer and the linear dimension of the regionssampled by our data. The same conclusion holds for the x compo-
0 20 40 60
0
10
20
30
40
0
0.2
0.4
0.6
0.8
1
Figure 15. Histogram of the FC fraction in Seyfert 2s. Black areas corre-spond to galaxies where a true FC is known to exist from the detection of aBLR in either direct or polarized light. The fraction of these latter galaxieswith respect to the whole sample increases with increasing xFC, as shownby the dashed line and right-hand scale.
nents, none of which correlates with distance either. The absenceof systematic trends indicates that our analysis is not affected byaperture effects.
7.3 Relation to host galaxy morphology
A galaxy’s morphology carries important information for the studyof star formation history in galaxies (e.g. Kennicutt 1998). Fromearly to late types, galaxy colours become bluer and star formationrates higher. Storchi-Bergmann et al. (2001) studied the relationshipbetween nuclear stellar population and morphology in a sample of35 Seyfert 2s, 13 in common with our sample. They found thatthe fraction of galaxies with recent nuclear/circumnuclear starburstincreases along the Hubble sequence and that there is a relationbetween the presence of a nuclear starburst and a late ‘inner Hub-ble type’ from the HST classifications of Malkan, Gorjian & Tam(1998).
In order to check this result in our larger sample, we have col-lected morphological information on the host galaxies from (deVaucouleurs et al. 1991, hereafter RC3), and the inner Hubble typesfrom Malkan et al. (1998). In Fig. 20 we plot three of our stellarpopulation tracers (W K, xY/FC and mean age) against the RC3 andinner morphological types (later types have larger numbers). Thereis no correlation in our sample between (optical) morphology andnuclear star formation. Since the HST snapshot survey of Malkanet al. was taken using the F606W filter, which is sensitive to dust ex-tinction and Hα emission, we searched the HST/NICMOS archivedata and found images for 36 of our galaxies taken with the F160Wfilter. No clear trend between morphological type and nuclear stellarpopulation is found in the near-infrared images either.
Finally, following Storchi-Bergmann et al. (2001) we also lookedfor companions to our Seyfert 2s according to angular separation,radial velocity and apparent magnitude. We find that 40 per centof the galaxies with W K < 10 Å and 47 per cent of those with
C© 2004 RAS, MNRAS 355, 273–296
Dow
nloaded from https://academ
ic.oup.com/m
nras/article/355/1/273/3101537 by guest on 29 Decem
ber 2021

Star formation history of Seyfert 2 nuclei 291
Table 3. Stellar spectral indices, computed with the definitions of Cid Fernandes et al. (2004). Colourswere corrected for Galactic extinction.
Galaxy W K (Å) W CN (Å) WG (Å) C3660 C4510
ESO 103G35 16.6 ± 0.7 10.5 ± 0.9 10.1 ± 0.4 0.61 ± 0.03 1.47 ± 0.04ESO 104G11 10.9 ± 1.3 5.4 ± 1.7 7.8 ± 0.7 0.57 ± 0.05 1.21 ± 0.06ESO 137-G34 16.8 ± 0.7 11.4 ± 0.9 10.8 ± 0.4 0.75 ± 0.04 1.45 ± 0.04ESO 138-G01 7.7 ± 0.5 5.0 ± 0.7 4.6 ± 0.4 0.83 ± 0.02 0.93 ± 0.02ESO 269-G12 17.5 ± 0.9 14.0 ± 1.0 11.1 ± 0.5 0.66 ± 0.04 1.42 ± 0.04
ESO 323G32 16.3 ± 0.8 13.8 ± 0.9 10.7 ± 0.4 0.55 ± 0.03 1.39 ± 0.04ESO 362G08 8.0 ± 0.5 8.0 ± 0.6 7.4 ± 0.3 0.43 ± 0.02 1.10 ± 0.02ESO 373G29 5.9 ± 0.5 6.4 ± 0.7 6.4 ± 0.4 0.76 ± 0.02 1.02 ± 0.02ESO 381-G08 8.9 ± 0.4 5.5 ± 0.5 5.6 ± 0.2 0.72 ± 0.01 1.15 ± 0.02ESO 383-G18 10.5 ± 0.8 6.1 ± 1.1 7.0 ± 0.6 0.90 ± 0.04 1.07 ± 0.04
ESO 428G14 13.5 ± 0.7 10.7 ± 0.8 9.2 ± 0.4 0.60 ± 0.03 1.24 ± 0.03ESO 434G40 16.7 ± 0.7 13.5 ± 0.9 11.0 ± 0.4 0.64 ± 0.03 1.52 ± 0.04Fairall 0334 9.8 ± 1.8 7.5 ± 1.9 8.6 ± 0.9 0.73 ± 0.07 1.19 ± 0.06Fairall 0341 13.7 ± 1.2 10.0 ± 1.3 10.5 ± 0.6 0.73 ± 0.05 1.49 ± 0.06IC 1657 10.9 ± 1.4 7.4 ± 1.7 8.9 ± 0.8 0.66 ± 0.06 1.31 ± 0.07
IC 2560 11.0 ± 1.0 11.0 ± 1.1 9.6 ± 0.5 0.76 ± 0.04 1.40 ± 0.05IC 5063 16.9 ± 0.7 12.4 ± 0.8 10.5 ± 0.4 0.61 ± 0.04 1.47 ± 0.04IC 5135 4.6 ± 0.4 3.4 ± 0.5 3.2 ± 0.3 0.88 ± 0.02 0.92 ± 0.01IRAS 11215 14.3 ± 0.7 9.0 ± 1.0 9.1 ± 0.4 0.62 ± 0.03 1.26 ± 0.04MCG +01-27 7.8 ± 0.7 8.2 ± 0.8 7.4 ± 0.4 0.55 ± 0.03 1.05 ± 0.03
MCG -03-34 11.9 ± 1.5 12.3 ± 1.7 9.1 ± 0.9 0.80 ± 0.06 1.35 ± 0.07Mrk 0897 4.8 ± 0.4 4.1 ± 0.5 4.1 ± 0.3 0.70 ± 0.01 0.93 ± 0.01Mrk 1210 9.0 ± 1.5 8.7 ± 1.9 6.5 ± 1.0 0.79 ± 0.06 1.18 ± 0.07Mrk 1370 5.8 ± 0.8 7.2 ± 0.9 6.1 ± 0.4 0.53 ± 0.02 1.05 ± 0.03NGC 0424 11.1 ± 0.6 9.5 ± 0.7 7.8 ± 0.4 0.86 ± 0.03 1.33 ± 0.03
NGC 0788 17.9 ± 0.8 13.2 ± 1.0 11.2 ± 0.5 0.68 ± 0.03 1.37 ± 0.04NGC 1068 8.6 ± 0.5 8.9 ± 0.7 6.5 ± 0.4 0.86 ± 0.02 1.14 ± 0.02NGC 1125 10.5 ± 1.0 8.4 ± 1.2 7.9 ± 0.5 0.63 ± 0.03 1.14 ± 0.04NGC 1667 18.9 ± 1.0 15.3 ± 1.2 11.7 ± 0.6 0.67 ± 0.04 1.46 ± 0.06NGC 1672 10.0 ± 0.6 7.9 ± 0.8 6.8 ± 0.4 0.63 ± 0.02 1.08 ± 0.02
NGC 2110 13.7 ± 1.0 14.2 ± 1.1 10.5 ± 0.5 0.74 ± 0.05 1.40 ± 0.05NGC 2979 11.4 ± 0.9 8.5 ± 1.1 8.7 ± 0.5 0.51 ± 0.03 1.29 ± 0.04NGC 2992 16.4 ± 0.8 14.2 ± 0.8 11.2 ± 0.4 0.51 ± 0.04 1.57 ± 0.04NGC 3035 12.9 ± 0.6 11.5 ± 0.7 9.1 ± 0.3 0.68 ± 0.03 1.32 ± 0.03NGC 3081 15.1 ± 0.9 13.6 ± 1.0 9.4 ± 0.5 0.78 ± 0.04 1.44 ± 0.05
NGC 3281 16.0 ± 1.1 12.5 ± 1.3 11.6 ± 0.6 0.70 ± 0.05 1.73 ± 0.07NGC 3362 15.3 ± 0.8 11.3 ± 0.9 9.5 ± 0.5 0.61 ± 0.03 1.39 ± 0.04NGC 3393 17.4 ± 0.7 14.6 ± 0.8 10.6 ± 0.4 0.71 ± 0.03 1.44 ± 0.04NGC 3660 7.2 ± 0.7 8.0 ± 0.8 6.4 ± 0.4 0.78 ± 0.03 1.26 ± 0.03NGC 4388 14.0 ± 1.0 9.3 ± 1.2 9.4 ± 0.5 0.77 ± 0.04 1.43 ± 0.05
NGC 4507 11.1 ± 0.4 8.8 ± 0.6 7.4 ± 0.3 0.81 ± 0.04 1.20 ± 0.02NGC 4903 17.6 ± 0.9 15.1 ± 1.0 12.0 ± 0.4 0.67 ± 0.04 1.71 ± 0.06NGC 4939 17.3 ± 0.9 14.3 ± 1.0 11.8 ± 0.5 0.72 ± 0.04 1.54 ± 0.05NGC 4941 17.9 ± 0.8 15.3 ± 1.0 11.3 ± 0.5 0.65 ± 0.03 1.58 ± 0.05NGC 4968 10.7 ± 1.0 7.8 ± 1.2 8.1 ± 0.5 0.52 ± 0.04 1.29 ± 0.05
NGC 5135 3.3 ± 0.4 3.7 ± 0.5 3.8 ± 0.3 0.77 ± 0.02 0.89 ± 0.01NGC 5252 17.0 ± 0.6 13.5 ± 0.7 11.0 ± 0.3 0.71 ± 0.02 1.43 ± 0.03NGC 5427 16.4 ± 0.9 13.1 ± 1.1 11.4 ± 0.5 0.67 ± 0.04 1.33 ± 0.05NGC 5506 7.9 ± 1.0 5.8 ± 1.1 5.7 ± 0.5 0.93 ± 0.05 1.29 ± 0.04NGC 5643 9.7 ± 0.5 6.3 ± 0.6 6.3 ± 0.3 0.54 ± 0.02 1.09 ± 0.02
NGC 5674 12.4 ± 1.1 11.3 ± 1.3 7.9 ± 0.6 0.65 ± 0.04 1.28 ± 0.05NGC 5728 11.7 ± 0.5 9.3 ± 0.6 7.8 ± 0.3 0.60 ± 0.02 1.16 ± 0.02NGC 5953 11.7 ± 0.5 8.3 ± 0.6 7.1 ± 0.3 0.58 ± 0.02 1.24 ± 0.02NGC 6221 6.9 ± 0.5 2.1 ± 0.6 2.7 ± 0.3 0.78 ± 0.02 1.05 ± 0.02NGC 6300 16.6 ± 1.2 9.9 ± 1.4 9.5 ± 0.7 0.58 ± 0.04 1.58 ± 0.07
NGC 6890 13.7 ± 0.8 7.9 ± 1.0 8.9 ± 0.5 0.68 ± 0.03 1.42 ± 0.04NGC 7172 16.7 ± 1.3 13.0 ± 1.4 10.8 ± 0.6 0.53 ± 0.05 1.56 ± 0.07NGC 7212 12.0 ± 0.6 8.2 ± 0.8 8.0 ± 0.4 0.84 ± 0.03 1.44 ± 0.03NGC 7314 17.8 ± 1.9 11.7 ± 2.5 10.0 ± 1.1 0.67 ± 0.09 1.37 ± 0.11
C© 2004 RAS, MNRAS 355, 273–296
Dow
nloaded from https://academ
ic.oup.com/m
nras/article/355/1/273/3101537 by guest on 29 Decem
ber 2021

292 R. Cid Fernandes et al.
Table 3 – continued
Galaxy W K (Å) W CN (Å) WG (Å) C3660 C4510
NGC 7496 4.1 ± 0.4 3.4 ± 0.5 3.8 ± 0.2 0.78 ± 0.01 0.94 ± 0.01
NGC 7582 4.5 ± 0.4 1.6 ± 0.5 3.0 ± 0.2 0.59 ± 0.01 1.18 ± 0.01NGC 7590 16.3 ± 0.7 10.2 ± 0.9 10.2 ± 0.4 0.59 ± 0.03 1.51 ± 0.04NGC 7679 2.1 ± 0.6 2.2 ± 0.6 2.7 ± 0.3 0.55 ± 0.01 0.89 ± 0.01NGC 7682 16.3 ± 0.9 13.1 ± 1.1 10.2 ± 0.5 0.73 ± 0.04 1.43 ± 0.05NGC 7743 13.6 ± 0.7 8.5 ± 0.8 8.2 ± 0.4 0.54 ± 0.02 1.27 ± 0.03
Mrk 0883 6.2 ± 0.5 5.1 ± 0.7 2.7 ± 0.3 0.82 ± 0.02 1.10 ± 0.02NGC 1097 5.1 ± 0.5 5.3 ± 0.7 5.2 ± 0.3 0.74 ± 0.02 0.99 ± 0.02NGC 4303 11.8 ± 0.6 8.7 ± 0.7 7.4 ± 0.3 0.64 ± 0.02 1.22 ± 0.03NGC 4602 9.6 ± 0.7 7.6 ± 1.0 8.1 ± 0.5 0.59 ± 0.03 1.11 ± 0.03
NGC 7410 3.3 ± 0.4 3.7 ± 0.5 3.8 ± 0.3 0.75 ± 0.02 0.92 ± 0.01ESO 108-G17 2.4 ± 0.6 1.4 ± 0.9 2.2 ± 0.5 1.06 ± 0.03 0.81 ± 0.02NGC 1487 2.0 ± 0.7 4.5 ± 1.1 3.4 ± 0.6 0.86 ± 0.03 0.69 ± 0.02NGC 2935 12.8 ± 0.6 11.5 ± 0.7 9.8 ± 0.3 0.61 ± 0.02 1.33 ± 0.03NGC 3256 3.6 ± 0.5 1.7 ± 0.6 2.8 ± 0.3 0.77 ± 0.02 0.89 ± 0.01
NGC 2811 18.6 ± 0.6 18.2 ± 0.7 12.7 ± 0.3 0.57 ± 0.02 1.57 ± 0.03NGC 3223 17.2 ± 0.7 15.6 ± 0.8 12.2 ± 0.4 0.63 ± 0.03 1.59 ± 0.04NGC 3358 18.4 ± 0.7 15.9 ± 0.8 11.8 ± 0.4 0.61 ± 0.03 1.56 ± 0.04NGC 3379 19.0 ± 0.6 18.6 ± 0.6 12.5 ± 0.3 0.59 ± 0.02 1.49 ± 0.03NGC 4365 18.6 ± 0.5 18.5 ± 0.6 12.2 ± 0.3 0.54 ± 0.02 1.56 ± 0.03
W K > 10 Å show the presence of companions, compared respec-tively with 42 and 47 per cent that do not have near neighbours.
Hence, contrary to the findings of Storchi-Bergmann et al. (2001),we find no correlation between the nuclear stellar populations ofSeyfert 2s and either morphological types or environments. Sincethere is a substantial overlap between our samples, the discrepancy ismost likely statistical. Given the importance of the result, however,it would be worth while to repeat the study in an even larger sampleof galaxies.
8 S U M M A RY
We have presented a study of the stellar population in the central∼50–500 pc of a large, well-defined and homogeneous sample ofSeyfert 2s from the atlas of J01. Our main results may be summarizedas follows.
(i) We have developed a spectral synthesis code that decomposesan observed spectrum as a sum of simple stellar populations, rep-resented by state-of-the-art evolutionary synthesis models, plus anAGN continuum. Unlike previous studies, which use only a fewabsorption equivalent widths and colours (e.g. Bica 1988; Schmittet al. 1999; Cid Fernandes et al. 2001a,b), we now synthesize thewhole observed spectrum. The method produces an estimate of thestar formation history in terms of flux (x) or mass (µ) fractions asso-ciated to each component in the spectral base, as well as extinctionand velocity dispersions. As in other population synthesis studies,the accuracy of our method is limited by noise, spectral coverageand intrinsic degeneracies of stellar populations. These limitationsare not critical as long as one does not attempt an overdetailed de-scription of the star formation history.
(ii) The synthesis method was applied to 3500–5200 Å spectra of65 Seyfert 2s and 14 other galaxies from the J01 atlas. The synthesisproduces excellent fits of the observed spectra, with typical fluxresiduals of 2–5 per cent. The star formation history deduced fromthese fits is remarkably varied among Seyfert 2s. Young starbursts,
intermediate-age and old populations all appear in significant andmixed amounts.
(iii) The stellar velocity dispersions obtained from the synthesisare in good agreement with measurements in the literature for galax-ies in common. This is important since this information gives us ahandle on the black hole mass (Ferrarese & Merritt 2000; Gebhardtet al. 2000).
(iv) The starlight-subtracted spectra were used to investigate thepresence of weak broad emission features, which are hard to detectin the total spectrum. This analysis revealed the signatures of WRstars in three (maybe five) Seyfert 2s, all of which have large youngstellar populations as deduced by the synthesis.
(v) The analysis of the ‘pure emission’ spectra further allowedthe detection of a weak BLR-like component under Hβ in sev-eral Seyfert 2s. For most of these objects, independent spectropo-larimetry data reveal a type 1 spectrum. We are thus detecting in di-rect, non-polarized light the scattered BLR predicted by the unifiedmodel.
(vi) The detection of a BLR in either direct or polarized lightimplies that an associated FC should also be present in our spectrum.Indeed, the FC strengths obtained by the spectral decomposition forthe 17 Seyfert 2s in our sample which present such evidence aresubstantially larger than for nuclei with no indications of a BLR.The fraction of these ‘broad-line Seyfert 2s’ increases systematicallywith increasing xFC.
(vii) Dusty young starbursts can also appear disguised as anAGN-looking continuum. We have identified several cases wherethis indeed happens. These Seyfert 2s tend to have large xFC andxY fractions. The information on the existence of a BLR, andthus of a true FC component, helps to break, at least partly, thisstarburst–FC degeneracy. Whenever the spectral synthesis iden-tifies a strong (�20 per cent) FC but no BLR is detected ei-ther in the residual or polarized spectra, the FC is most likelydominated by a dusty starburst rather than scattering of a hiddenAGN.
C© 2004 RAS, MNRAS 355, 273–296
Dow
nloaded from https://academ
ic.oup.com/m
nras/article/355/1/273/3101537 by guest on 29 Decem
ber 2021

Star formation history of Seyfert 2 nuclei 293
0 5 10 15 20
0.4
0.6
0.8
1
1.2
0 5 10 15 20
0.4
0.6
0.8
1
1.2
Figure 16. The C3660 versus W K diagram for the J01 sample. Panel (a)shows the results for C3660 and W K as measured directly from the observedspectra, whereas in (b) these two indices are measured from synthetic spectraconstructed to match the observed stellar spectrum. In both panels the solid(green) and dotted (red) curves represent the evolution of BC03 models ofinstantaneous bursts with 1 Z� and 2.5 Z� metallicity respectively. Theapproximate location of populations with ages log t = 6, 7, 8, 9 and 10 yrare indicated by the labels in panel (b). The dashed (blue) line between (W K,C 3660) = (0, 1.05) and ∼(20, 0.7) represents a mixing line, where a F ν ∝ν−1.5 power law is added to a 1010 yr stellar population; diamonds (blue)mark power-law fractions in steps of 25 per cent. The average error bar isindicated in the top right in (a). Symbols are as in Fig. 12.
(viii) Stellar indices were measured from both the observed andthe synthetic spectra to provide a more empirical characterizationof the stellar content of our galaxies and to facilitate comparisonswith independent studies. These indices, which include W K, the3660/4020 colour, Dn(4000) and HδA, confirm the heterogeneity ofnuclear stellar populations in Seyfert 2s.
(ix) Between one-third and one-half of nearby Seyfert 2s haveexperienced significant star formation in the recent past. Thus, as a
Figure 17. The Dn(4000) versus HδA diagram. As in Fig. 16(b), bothindices were measured from the synthetic spectra. The numbers around theBC03 SSP evolutionary sequences mark the logarithm of the age (in yr). Thesymbols and lines are as in Fig. 16.
class, type 2 Seyfert nuclei live in a much younger stellar environ-ment than LINERs and normal galactic nuclei.
(x) We find no significant correlation between the host morphol-ogy (as deduced from both ground-based and HST optical and near-infrared images) and stellar population in Seyfert 2s. The presence ofcompanions does not seem to correlate with the stellar populationseither.
We have shown that, using modern population synthesis models,it is possible to obtain meaningful information about the history ofstar formation in objects for which the spectral data are dominatedby strong emission lines. The road to detailed quantitative investi-gations of the relationship between star formation and AGN is nowopen. We will be travelling along it in our forthcoming papers.
AC K N OW L E D G M E N T S
QG is grateful for the hospitality of UFSC and ESO-Santiago and thesupport from CNPq and the National Natural Science Foundationof China under grants 10103001 and 10221011 and the NationalKey Basic Research Science Foundation (NKBR SG 19990754).Partial support from CNPq and PRONEX is also acknowledged.We also thank the anonymous referee for his/her careful reading andconstructive criticism of the original manuscript. The NASA/IPACExtragalactic Database (NED) is operated by the Jet PropulsionLaboratory, California Institute of Technology, under contract withthe National Aeronautics and Space Administration.
R E F E R E N C E S
Antonucci R., 1993, ARA&A, 31, 473Antonucci R., Miller J. S., 1985, ApJ, 297, 621Aretxaga I., Joguet B., Kunth D., Melnick J., Terlevich R., 1999, ApJ, 519,
L123
C© 2004 RAS, MNRAS 355, 273–296
Dow
nloaded from https://academ
ic.oup.com/m
nras/article/355/1/273/3101537 by guest on 29 Decem
ber 2021
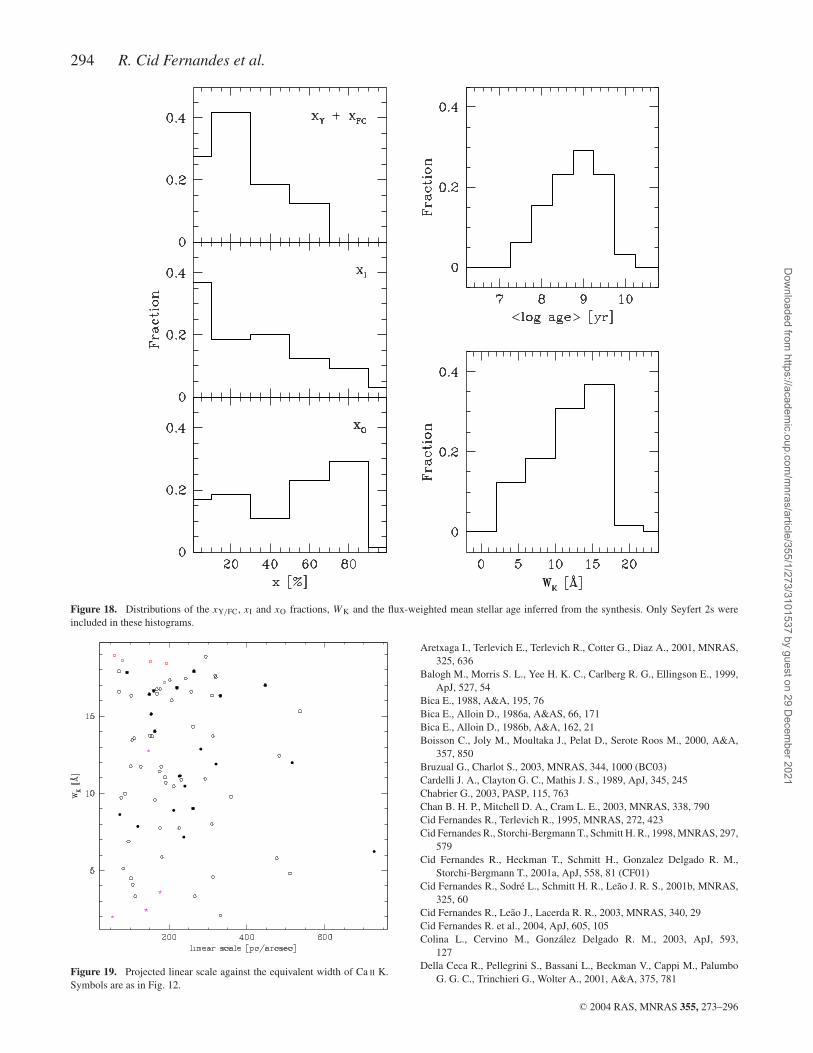
294 R. Cid Fernandes et al.
Figure 18. Distributions of the xY/FC, xI and xO fractions, W K and the flux-weighted mean stellar age inferred from the synthesis. Only Seyfert 2s wereincluded in these histograms.
Figure 19. Projected linear scale against the equivalent width of Ca II K.Symbols are as in Fig. 12.
Aretxaga I., Terlevich E., Terlevich R., Cotter G., Diaz A., 2001, MNRAS,325, 636
Balogh M., Morris S. L., Yee H. K. C., Carlberg R. G., Ellingson E., 1999,ApJ, 527, 54
Bica E., 1988, A&A, 195, 76Bica E., Alloin D., 1986a, A&AS, 66, 171Bica E., Alloin D., 1986b, A&A, 162, 21Boisson C., Joly M., Moultaka J., Pelat D., Serote Roos M., 2000, A&A,
357, 850Bruzual G., Charlot S., 2003, MNRAS, 344, 1000 (BC03)Cardelli J. A., Clayton G. C., Mathis J. S., 1989, ApJ, 345, 245Chabrier G., 2003, PASP, 115, 763Chan B. H. P., Mitchell D. A., Cram L. E., 2003, MNRAS, 338, 790Cid Fernandes R., Terlevich R., 1995, MNRAS, 272, 423Cid Fernandes R., Storchi-Bergmann T., Schmitt H. R., 1998, MNRAS, 297,
579Cid Fernandes R., Heckman T., Schmitt H., Gonzalez Delgado R. M.,
Storchi-Bergmann T., 2001a, ApJ, 558, 81 (CF01)Cid Fernandes R., Sodre L., Schmitt H. R., Leao J. R. S., 2001b, MNRAS,
325, 60Cid Fernandes R., Leao J., Lacerda R. R., 2003, MNRAS, 340, 29Cid Fernandes R. et al., 2004, ApJ, 605, 105Colina L., Cervino M., Gonzalez Delgado R. M., 2003, ApJ, 593,
127Della Ceca R., Pellegrini S., Bassani L., Beckman V., Cappi M., Palumbo
G. G. C., Trinchieri G., Wolter A., 2001, A&A, 375, 781
C© 2004 RAS, MNRAS 355, 273–296
Dow
nloaded from https://academ
ic.oup.com/m
nras/article/355/1/273/3101537 by guest on 29 Decem
ber 2021
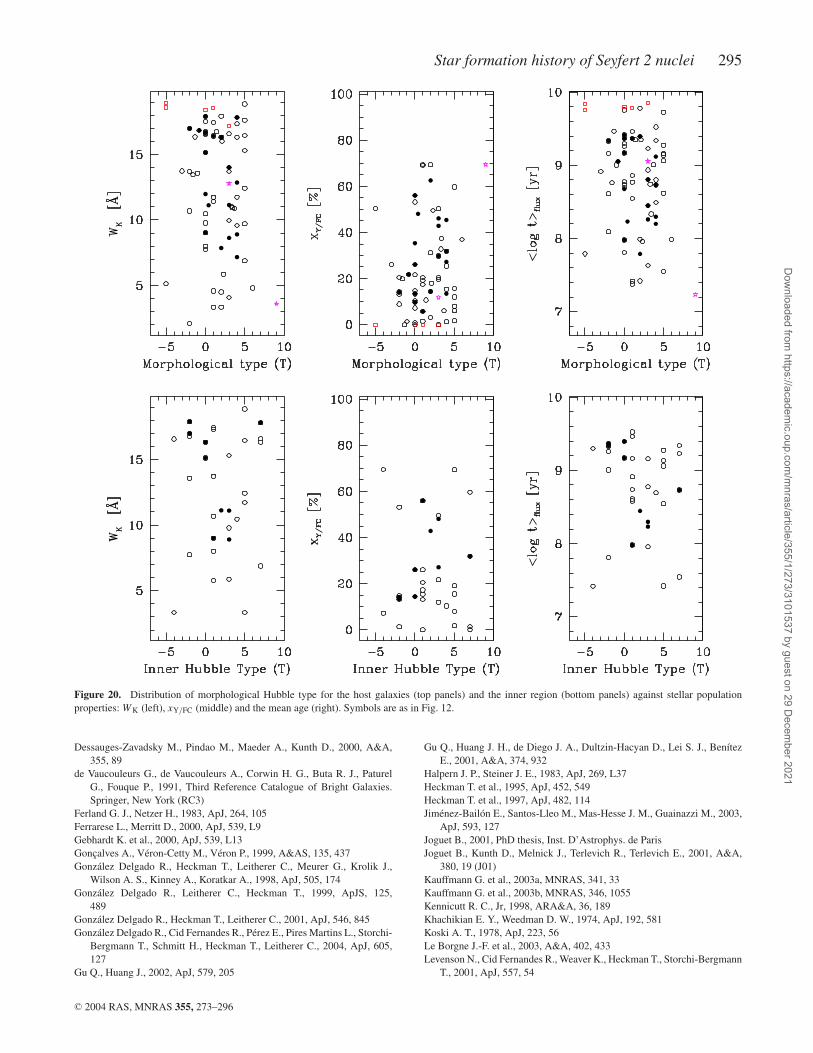
Star formation history of Seyfert 2 nuclei 295
Figure 20. Distribution of morphological Hubble type for the host galaxies (top panels) and the inner region (bottom panels) against stellar populationproperties: W K (left), xY/FC (middle) and the mean age (right). Symbols are as in Fig. 12.
Dessauges-Zavadsky M., Pindao M., Maeder A., Kunth D., 2000, A&A,355, 89
de Vaucouleurs G., de Vaucouleurs A., Corwin H. G., Buta R. J., PaturelG., Fouque P., 1991, Third Reference Catalogue of Bright Galaxies.Springer, New York (RC3)
Ferland G. J., Netzer H., 1983, ApJ, 264, 105Ferrarese L., Merritt D., 2000, ApJ, 539, L9Gebhardt K. et al., 2000, ApJ, 539, L13Goncalves A., Veron-Cetty M., Veron P., 1999, A&AS, 135, 437Gonzalez Delgado R., Heckman T., Leitherer C., Meurer G., Krolik J.,
Wilson A. S., Kinney A., Koratkar A., 1998, ApJ, 505, 174Gonzalez Delgado R., Leitherer C., Heckman T., 1999, ApJS, 125,
489Gonzalez Delgado R., Heckman T., Leitherer C., 2001, ApJ, 546, 845Gonzalez Delgado R., Cid Fernandes R., Perez E., Pires Martins L., Storchi-
Bergmann T., Schmitt H., Heckman T., Leitherer C., 2004, ApJ, 605,127
Gu Q., Huang J., 2002, ApJ, 579, 205
Gu Q., Huang J. H., de Diego J. A., Dultzin-Hacyan D., Lei S. J., BenıtezE., 2001, A&A, 374, 932
Halpern J. P., Steiner J. E., 1983, ApJ, 269, L37Heckman T. et al., 1995, ApJ, 452, 549Heckman T. et al., 1997, ApJ, 482, 114Jimenez-Bailon E., Santos-Lleo M., Mas-Hesse J. M., Guainazzi M., 2003,
ApJ, 593, 127Joguet B., 2001, PhD thesis, Inst. D’Astrophys. de ParisJoguet B., Kunth D., Melnick J., Terlevich R., Terlevich E., 2001, A&A,
380, 19 (J01)Kauffmann G. et al., 2003a, MNRAS, 341, 33Kauffmann G. et al., 2003b, MNRAS, 346, 1055Kennicutt R. C., Jr, 1998, ARA&A, 36, 189Khachikian E. Y., Weedman D. W., 1974, ApJ, 192, 581Koski A. T., 1978, ApJ, 223, 56Le Borgne J.-F. et al., 2003, A&A, 402, 433Levenson N., Cid Fernandes R., Weaver K., Heckman T., Storchi-Bergmann
T., 2001, ApJ, 557, 54
C© 2004 RAS, MNRAS 355, 273–296
Dow
nloaded from https://academ
ic.oup.com/m
nras/article/355/1/273/3101537 by guest on 29 Decem
ber 2021

296 R. Cid Fernandes et al.
Lira P., Ward M., Zezas A., Alonso-Herrero A., Ueno S., 2002, MNRAS,330, 259
Lumsden S. L., Alexander D. M., Hough J. H., 2004, MNRAS, 348, 1451McElroy D. B., 1995, ApJS, 100, 105Maiolino R. et al., 2003, MNRAS, 344, L59Malkan M. A., Gorjian V., Tam R., 1998, ApJS, 117, 25Mayya Y. D., Bressan A., Rodrıguez M., Valdes J. R., Chavez M., 2004,
ApJ, 600, 188Melnick J., Gopal-Krishna, Terlevich R., 1997, A&A, 318, 337Miller J. S., Goodrich R. W., 1990, ApJ, 355, 456Moran E., Barth A., Kay L., Filippenko A. V., 2000, ApJ, 540, L73Moultaka J., Pelat D., 2000, MNRAS, 314, 409Nelson C., Whittle M., 1995, ApJS, 99, 67Osterbrock D. E., 1984, QJRAS, 25, 1Pelat D., 1997, MNRAS, 284, 365Schaerer D., Contini T., Kunth D., 1999, A&A, 341, 399Schlegel D., Finkbeiner D., Davis M., 1998, ApJ, 500, 525Schmidt A. A., Copetti M. V. F., Alloin D., Jablonka P., 1991, MNRAS, 303,
173Schmitt H., Storchi-Bergmann T., Cid Fernandes R., 1999, MNRAS, 303,
74Selman F., Melnick J., Bosch G., Terlevich R., 1999, A&A, 341, 98
Serote Roos M., Boisson C., Joly M., Ward M. J., 1998, MNRAS, 301, 1Storchi-Bergmann T., Cid Fernandes R., Schmitt H., 1998, ApJ, 501,
94Storchi-Bergmann T., Raimann D., Bica E., Fraquelli H. A., 2000, ApJ, 544,
747Storchi-Bergmann T., Gonzalez Delgado R. M., Schmitt H. R., Cid
Fernandes R., Heckman T., 2001, ApJ, 559, 147Storchi-Bergmann T. et al., 2003, ApJ, 598, 956Terlevich E., Diaz A. I., Terlevich R., 1990, MNRAS, 242, 271Tran H. D., 1995a, ApJ, 440, 578Tran H. D., 1995b, ApJ, 440, 597Tran H. D., 2001, ApJ, 554, L19Tran H. D., Miller J., Kay L., 1992, ApJ, 397, 452Tremonti C., 2003, PhD thesis, Johns Hopkins Univ.Whitmore B. C., McElroy D. B., Tonry J. L., 1985, ApJS, 59, 1Wills K. A., Tadhunter C. N., Robinson T. G., Morganti R., 2002, MNRAS,
333, 211Worthey G., 1994, ApJS, 94, 687Worthey G., Ottaviani D. L., 1997, ApJS, 111, 377
This paper has been typeset from a TEX/LATEX file prepared by the author.
C© 2004 RAS, MNRAS 355, 273–296
Dow
nloaded from https://academ
ic.oup.com/m
nras/article/355/1/273/3101537 by guest on 29 Decem
ber 2021


![MNRAS ATEX style file v3.0 Moonfalls: Collisions between ...arXiv:1805.00019v1 [astro-ph.EP] 30 Apr 2018 MNRAS 000, 1–12 (2018) Preprint 2 May 2018 Compiled using MNRAS LATEX style](https://img.dokumen.tips/doc/110x75/5ed3b7b8c1bc7732fe50c6b1/mnras-atex-style-ile-v30-moonfalls-collisions-between-arxiv180500019v1.jpg)

![MNRAS ATEX style file v3 - arXiv · arXiv:1707.00277v1 [astro-ph.SR] 2 Jul 2017 MNRAS 000, 1–16 (2017) Preprint 4 July 2017 Compiled using MNRAS LATEX style file v3.0 Thelow](https://img.dokumen.tips/doc/110x75/6000b79e9b2d9151d62dc718/mnras-atex-style-ile-v3-arxiv-arxiv170700277v1-astro-phsr-2-jul-2017-mnras.jpg)