Embed Size (px)
Citation preview
JOURNAL OF SEDIMENTARY PETROLOGY, VOL. 42, NO. 4, P. 775-793 FIGS. 1-14, DECF.~B=, 1972
THE ROLE OF S U B A Q U E O U S DEBRIS FLOW IN GENERATING T U R B I D I T Y C U R R E N T S t
MONTY A. HAMPTON Geology Department, University of Rhode Island, Kingston, Rhode Island 02881
ABSTRACT
Turbidity currents may be generated in the oceans as part of the sequence from landsliding through debris flow to turbidity current flow. Three aspects of this sequence examined here are 1) the transition from land- sliding to debris flow, 2) the mechanics of subaqueous debris flow, and 3) the transition from subaqueous debris flow to turbidity-current flow.
The transition from landsliding to debris flow, as observed in the subaerial environment, occurs readily if water is incorporated into the landslide debris as it is jostled and remoulded during downslope movement. Remoulding and incorporation of water reduce the strength and increase the fluid behavior of the debris, thereby causing it toflow rather than slide. Incorporation of only a few percent water typically decreases the strength of landslide debris by a factor of two or more; therefore, landslide debris commonly becomes very fluid with incorporation of a small amount of water. The ready availability of water in the marine environment suggests that conditions are favorable for the development of subaqueous debris flows from subaqueous landslides.
Debris flow has been modeled as flow of a plastico-viscous substance, which has a yield strength and deforms viscously at stresses greater than the yield strength. The conditions required for movement of a subaqueous debris flow are described in terms of a critical thickness of debris, which varies directly with strength and in- versely with submerged unit weight and slope angle. Within a debris flow, viscous shear occurs where shear stress exceeds the shear strength of the debris, but where shear stress is less than shear strength the material is rafted along as a nondeforming plug. Distinct zones of viscous shear and nondeformation exist in a sub- aqueous debris flow.
Transition from subaqueous debris flow to turbidity-current flow involves extensive dilution of debris-flow material, reducing the density from about 2.0 gm/cm 8 to about 1.1 gm/cm 3. In experiments, subaqueous debris- flow material was mixed with the surrounding water by erosion of material from the front of the flow and ejection of the material into the overlying water to form a dilute turbulent cloud (turbidity current). The amount of mixing, and hence the size o f the turbidity current, varied inversely with the strength of the debris. Conditions that cause mixing at the front of a subaqueous debris flow are illustrated by analyzing flow around a half-body, with boundary-layer separation.
Turbidity curreuts also may be generated from subaqueous debris flows by mixing water directly into the body of the flow, behind the front, although this type of mixing was not observed in experiments. Mixing into the body of the flow can result from flow instability, either by breaking interface waves or by momentum transfer associated with turbulence, but available information suggests that mixing due to instability is in- hibited by the presence of clay and coarse granular solids in debris. Mixing by erosion from the front of a debris flow is favored as being a more typical process of generating turbidity currents because this mixing is a natural consequence of debris flowing through water; it requires no special conditions to operate.
INTRODUCTION
Turb id i ty currents are gravi ty-dr iven, di lute mixtures of granular solids and water t h a t are widely considered to be i m p o r t a n t t r anspor t ing agents for oceanic sediments. The mechanics of tu rb id i ty -cur ren t flow and the features of tu rb id i ty -cur ren t deposits have been s tudied extensively, bu t the origin of these currents is not well understood.
Many tu rb ld i ty -cur ren t deposits are asso- ciated with large-scale submar ine landslides (Heezen and Ewing, 1952, 19.55; Menard, 1964, p. 196-201), and it is a common assumpt ion t h a t turb id i ty currents originate from landslides or slumps. Bulk densities of submar ine land- slide debris range from abou t 1.5 to 2.4 g m / c m 3,
i Manuscript received February 28, 1972; revised July 19, 1972.
which is significantly greater t han densit ies of 1.03 to 1.12 g m / e m 8 es t imated for tu rb id i ty currents (Meaard , 1964). A basic problem con- cerning generat ion of tu rb id i ty currents is how marine sediments become di luted to these low densities. W h a t mechanisms operate during the generat ion process?
In order to invest igate th is question, a t t en t ion in this paper is focused on a hypothet ica l se- quence of events leading from submar ine land- sliding to tu rb id i ty -cur ren t flow. A basic postu- late is t h a t in the na tura l env i ronmen t an in te rmedia te flow process occurs between sup- marine landsliding and tu rb ld l ty -cur ren t flow; this process is debris flow.
The sequence from landsliding th rough debris flow to tu rb id i ty -cur ren t flow is examined in this s tudy with the goal of describing a mechanism by which tu rb id i ty currents can be generated.

776 M O N T Y H A M P T O N
Three stages of the sequence, each involving subaqueous debris flow, receive primary con- sideration: 1) transition between landsliding and debris flow, 2) mechanics of subaqneous debris flow, and 3) transition between sub- aqueous debris flow and turbidity-current flow. Experimental, theoretical, and field evidence are used to elucidate the significant features of this sequence and to assess the likelihood of its oc- currence in the oceans.
DESCRIPTION OF LANDSLIDING, DEBRIS FLOW,
AND TURBIDITY-CURRENT FLOW
Landsliding, debris flow, and turbidity-cur- rent flow all are mass transport processes that involve gravity-drlven movement of mixtures of solid particles and water. Landsliding is char- acterized by movement along a few individual shear planes, with most of the material ex- periencing limited deformation. Original in- ternal structures, such as laminations and bedding planes, may be distorted but they are not completely destroyed.
In contrast, movement of a debris flow occurs along innumerable shear planes within the body of the material. Thus, rather than sliding, the material flows.
Because of the inaccessibility of the deep marine environment, debris flow has not been observed directly in the oceans, but several in- stances of subaerial debris flow have been documented (e.g., see Jahns, 1949; Sharp and Nobles, 1953; Curry, 1966; Johnson, 1070). Sub- aerial debris flows characteristically move slug- gishly in a series of waves, or surges. If large ob- jects such as boulders are present in a debris flow, they are highly concentrated at the front of a typical surge and are pushed along by the more fluid material behind the front (Johnson, 1970, p, 440). Surprisingly large objects may be carried in suspension in a debris flow. Boulders several feet in diameter have been observed floating partially submerged in some flows (Jahns, 1949). Support of the suspended load is provided mainly by the yield strength of the debris, and suspension occurs even though flow of the debris is very sluggish (laminar) (John- son, 1970, p. 461).
l)ebris flows can be mobile at high densities and low water contents. Sharp and Nobles (1953) measured a bulk density of 2.4 gm/cm a and a water content of 25 percent, by weight, for some subaerial flows at Wrightwnod, Cali- fornia. Curry (1966) measured a density of 2.5 gm/cm a and a water content of less than 10 weight percent for a flow in the Tenmile Range, Colorado.
According to many studies, a turbidity current resembles a slowly boiling cloud pushing its way
through surrounding, quiet water (e.g., Bell, 1942). Sediment particles within a turbidity current move along irregular paths, reflecting a state of turbulence (Middleton, 1966a). Support of the suspended load is mainly derived from turbulence.
A turbidity current moves downslope be- cause its density exceeds that of the surround- ing water. The density contrast is generally believed to be small; Menard (1964) suggested that marine turbidity currents have densities ranging from 1.03 to 1.12 gm/cm 3. Deposition from turbidity currents has been inferred for many modern and ancient sands (Ericson, and others, 1952, 1961; Emery, 1958; Ewing, and others, 1958; Bouma, 1962).
TRANSITION FROM LANDSLIDING TO DEBRIS FLOW
Field Observations
Arvid Johnson, of Stanford University, and I observed several subaerial debris flows during the winter and spring of 1969. Most of these flows were generated in debris that initially moved as a landslide. The observations made on the initiation of these debris flows can readily be extrapolated to the subaqueous environment, and thus they aid in understanding the me- chanics of the sequence from landsliding to debris flow to turbldity-current flow in the oceans.
The debris flows we observed occurred at Woodside and Wrightwood, California. Wood- side is in the Santa Cruz Mountains approxi- mately 30 miles south of San Francisco, and Wrightwood is in the San Gabriel Mountains about 40 miles northeast of Los Angeles. The flows at \Vrightwood were large compared to those at \Voodside.
Woodaide: The debris flows at Woodside oc- curred in February, 1060, during a period of prolonged rainfall. The source material for these flows was a clayey soil containing some silt, sand, and a few pebbles and cobbles. A few thousand cubic meters of material was in- volved. We were able to view the initiation process closely at Woodside; up to a distance of a few feet.
Initial movement of debris involved a land- slide mass about 100 meters long, 50 meters wide, and 10 meters deep. After a few days of movement a scarp about 10 meters high had formed near the center of the mass. Movement continued behind the scarp as slow translation along individual planes; hence many smaller scarps formed behind the main one. In front of the main scarp, movement took place largely as debris flow. Groundwater seepage occurred
S U B A Q U E O U S D E B R I S I N G E N E R A T I N G T U R B I D I T Y C U R R E N T S 777
nearly everywhere along the central steep scarp face, and several small springs existed. The soil composing the scarp was so soft t h a t i t barely suppor ted a person's weight.
Ini t ia t ion of the debris flows took place in the vicinity of the steep face of the scarp. Over a period of two days we observed approximate ly 50 flows at Woodside. Each flow invoh 'ed less than a cubic meter of debris.
In i t ia t ion of individual debris flows typical ly began with landslide movement of water-sa tu- rated blocks of soil from the scarp face. As a block moved downslope, it was jostled and agi tated. This resulted in dis integrat ion of the block, with the incorporat ion of some surface seepage water. By the t ime the debris had moved a few feet, remoulding of the debris was so complete tha t ensuing movement was a debris flOW.
Transi t ion from landsliding to debris flow was most rapid in the vicinity of springs, where water was plentiful. In these areas small, in- dividual blocks of debris commonly broke loose from the scarp face and tumbled to the base of the scarp where they accumulated with o ther similar material. Spring water flowed over the accumulat ion of debris, with lit t le appa ren t absorpt ion into the debris. The accumulated debris sluggishly resumed movement downslope when a critical mass buil t up, and differential movement caused incorporat ion of some of the spring water into the debris. I t also caused re- moulding of the entire mass. Thus, the debris became much more fluid than it was when it began sliding. Succeeding movement was a very mobile flow. The t rans i t ion from landsliding to debris flow took place over a distance of 1 to 3 meters.
This general description fits most debris flows tha t or iginated near springs. In areas of less groundwater seepage, material did not a t t a in the fas t -moving debris-flow s ta te so readily, if at all. In these areas, sliding commonly caused extensive remoulding of the debris, bu t the debris did not become as fluid as i t did when water was incorporated. In a few cases debris flow did occur wi thout incorporat ion of water, but it was only after an unusual ly great thick- ness of remoulded debris had accumulated a t the base of the steep scarp.
Wrightwood: Debris flows occurred at Wright- wood in May, 1969, during warm weather fol- lowing a winter t ha t was marked by heavy snow- and rainfall. The source rock for the debris flows mainly was fractured and weathered quar tz-mica schist.
The debris flows or iginated at the steep- walled, landslide-scarred head of Hea th Canyon,
in the San Gabriel Mounta ins , and were con- ta ined in a narrow gully down the length of the canyon. Upon exit ing the canyon, the flows spread out over pre-existing debris-flow de~ posits. The total distance of t ravel of most flows was approximate ly 1.5 kilometers.
During the t ime of debris-flow act ivi ty , a b u n d a n t water seeped from the ground at the head of Hea th Canyon. Muddy seepage water flowed down the narrow gully in the canyon during the t ime between debris flows.
In i t ia t ion of the flows at Wrightwood fol- lowed the same general pa t t e rn as at Woodside, a l though the Wrightwood flows generally were larger. Initial movement of debris began as landsliding on the steep slopes at the head of Hea th Canyon. During sliding the debris was intensely jostled, result ing in remoulding of the debris and incorporat ion of some avai lable seepage water. As a result of remoulding and of increased water content , the debris became rela- t ively fluid and subsequent ly t raveled as a de- bris flow. Velocities of abou t 100 cm/sec were measured for some debris flows.
A few flows a t Wrightwood originated by liquefaction of slope material . Por t ions of slope debris, with lit t le appa ren t ac t iv i ty taking place within them, suddenly would liquefy and im- mediately began to flow wi thou t the typical jostl ing and remoulding of coherent blocks t h a t usually preceded debris flow. Flows t h a t orig- ina ted in th is manner involved less t han a t en th of a cubic meter of debris and were uncommon.
Available evidence from Wrightwood suggests t h a t large debris flows can be ini t iated by re- moulding of landslide debris. The size of the flows we saw ini t ia te involved up to a few hundred cubic meters of material . Some land- slide scars at the head of Hea th Canyon are a few hundred meters wide, suggesting large single failure events . Single debris flows t ha t occurred in Hea th Canyon in 1941 had a volume possibly as great as 1,200,000 cubic meters (Gleason and Amidon, 1941; Sharp and Nobles, 1953). This implies t h a t some large debris flows are generated from landslides.
Discussion of the Initiation Mechanism
Observat ion of debris flows a t Woodslde and Wrightwood indicates t h a t two steps are critical to the ini t ia t ion process: 1) efficient remoulding of the debris and 2) incorporat ion of water. Therefore, a debris flow can be expected to de- velop from a landslide or s lump if there is suf- ficient agi ta t ion of the slide mass and a supply of water. An addi t ional f a c t o r - - t h e clay conten t of the debr is - -a l so is impor tan t , as discussed subsequent ly.
Johnson (1970, p. 503) derived an expression
778 M O N T Y H A M P T O N
3500 I
3O0O kaolinite
I~SO0 N
5 • 0 0 0
~ I ~ 0 0
I 0 0 0
50¢
montmorillonite j / \
!°I
\\ ! ~'~'~,o • ~* I i . . . . - i ~ '
4 0 BO 6O 7 0 eo 9o I00
WEIGHT PERCENT WATER Fxa. 1.--Rdationship between strength and water
content for four slurry types. Data from Hampton (1970).
describing the critical conditions for debris flow. In its simplest form, the expression is
K y, = - - , (1)
sin
where yc is the critical thickness of the debris, k is the yield strength of the debris, 3' is the unit weight of the debris, and ~ is the slope angle. If the debris is on an infinitely long, infinitely wide slope and the thickness of the debris is greater than y~ determined from equation 1, the material will flow. Equation 1 implies that reduction of the strength of debris reduces the critical thickness and thus promotes movement as a debris flow.
An increase in water content reduces the strength of debris (fig. 1). At low water contents, just above saturation of the debris, the strength is relatively high and is very sensitive to addi- tion of water. For example, incorporation of two to three percent water causes a large decrease of strength, typically by more than a factor of two. Debris with a high water content has relatively low strength, and strength is relatively insensi- tive to change in water content. The curve for kaolinlte-tap water slurries in Figure i most clearly demonstrates these features. Slurries con- taining silt and sand in addition to clay have a similar relationship between strength and water content (Hampton, 1970).
Apply the data of Figure 1 to the field ob-
servations of the previous section. Clay-bear- ing landslide debris, with water content near saturation, corresponds to the steep, low-water- content part of the curve. Thus, addition of only a small amount of water causes a significant de- crease in strength with a consequent increase in the fluid behavior of landslide debris.
Incorporation of water also increases the fluid volume, producing a larger average spacing be- tween granular partlcles. This reduces the amount of frictional contact between grains, and hence, reduces the angle of internal friction. Therefore, the minimum slope necessary for flew, irrespective of thickness; can be reduced by in- corporation of water.
Remoulding breaks down structure within debris and commonly causes a reduction of strength in addition to that caused by water in- take. This strength loss (sensitivity) was not determined for the soils at Woodside and Wrightwood, so it is not known whether re- moulding decreased strength significantly, in addition to the decrease caused by incorpora- tion of water.
Initiation of Subaqueous Debris Flow
Because of the ready availability of water, the submarine environment is favorable for the initiation of debris flows by the process that operated at Woodside and Wrightwood. A sub- marine landslide mass undergoing sufficient agitation to accomplish remouldlng is likely to incorporate the critical few percent water to mobilize the mass as a debris flow.
Very large submarine landslides, resulting from earthquakes or rapid sedimentation rates, have been documented. For example, Menard (1964, p. 196) lists some failures that involved several million cubic meters of sediment. There- fore, subaqueous debris flows of this magnitude can reasonably be expected.
Large subaqueous debris flows also may be generated from the accumulation of small in- dividual failures; a large, single failure event is not required. Many debris flows at Woodslde and Wrightwood were composed of the ac- cumulation of small failures. This implies that large subaqueous debris flows may initiate inde- pendently of catastrophic and spectacular land- slide events.
Continuance of Flow
Terzaghi (1956) suggested that after debris flow becomes inJtlated on a submarine slope the granular material settles through the pore fluid, with the result that the debris mass expels pore fluid, compacts, and stops moving. He suggested, therefore, that submarine debris flows might only have short duration. However, according
S U B A Q U E O U S DEBRIS IN G E N E R A T I N G T U R B I D I T Y C U R R E N T S 779
to Morgenstern (1967), the low permeability of clay-bearing debris reduces settling velocities significantly, with the result that sufficient mo- mentum for continued movement may be ob- tained by the flow before the pore fluid escapes.
Observations reported by Johnson, (1970, p. 461) and by Hampton (1970) indicate that the fluid phase of debris (i.e., the mixture of clay minerals and water) can have significant strength (fig. 1). The strength of the fluid depends on the presence of clay, and is absent in the pore fluids ot debris that contains no clay. If thorough homogenization of debris occurs during the initiation of a flow, the pore fluid (water plus clay) may have enough strength to completely support the granular material. Therefore, grains do not settle through the fluid. The conclusion is that expulsion of pore fluid does not occur in clay-bearing debris if the fluid phase has enough strength to support the granular solids. Thus, such debris is capable of flowing for a long duration.
The presence of clay is important for sus- tained movement of a debris flow. A surprisingly small amount of clay, less thay 10~ of the total solids, is required for complete support of sand- sized inaterial in a debris flow (Hampton 1970, 1972). Furthermore, when debris is flowing, granular solids within the flow collide with one another producing a dispersive pressure (Bagnold, 1056) that also helps to support grains.
MECHANICS OF $UBAQUEOUS DEBRIS FLOW
Theory
Johnson (1965, 1970) developed a rheological model for debris flow. He proposed that the de- formational behavior of debris is described by an idealized relationship between stress and strain-rate, of the form
ir,] =c+, , tan¢+~7~e, ; Ir, I >c+~t ta .n¢ , (2)
where r, is shear stress, c is cohesion, cr~ is normal stress, ¢~ is angle of internal friction, yc is vis- cosity, and ~, is rate of shear strain. This rela- tionship is a combination of the Coulomb equa- tion, c+o'n tan ~, and the Newtonian viscous model, ~t , , and it applies to laminar deforma- tion. The name Coulomb-viscous model is con- venient for the relationship expressed by equa- tion 2. It is analogous to the Bingham model (Reiner, 1960) :
I~.q =k+~ ,~ . ; I~.t >k , (3) where k is shear strength and ~b is Bingham viscosity. The Coulon]b-viscous model and the Bingham model are known generally as plastico- viscous theological models.
l I I
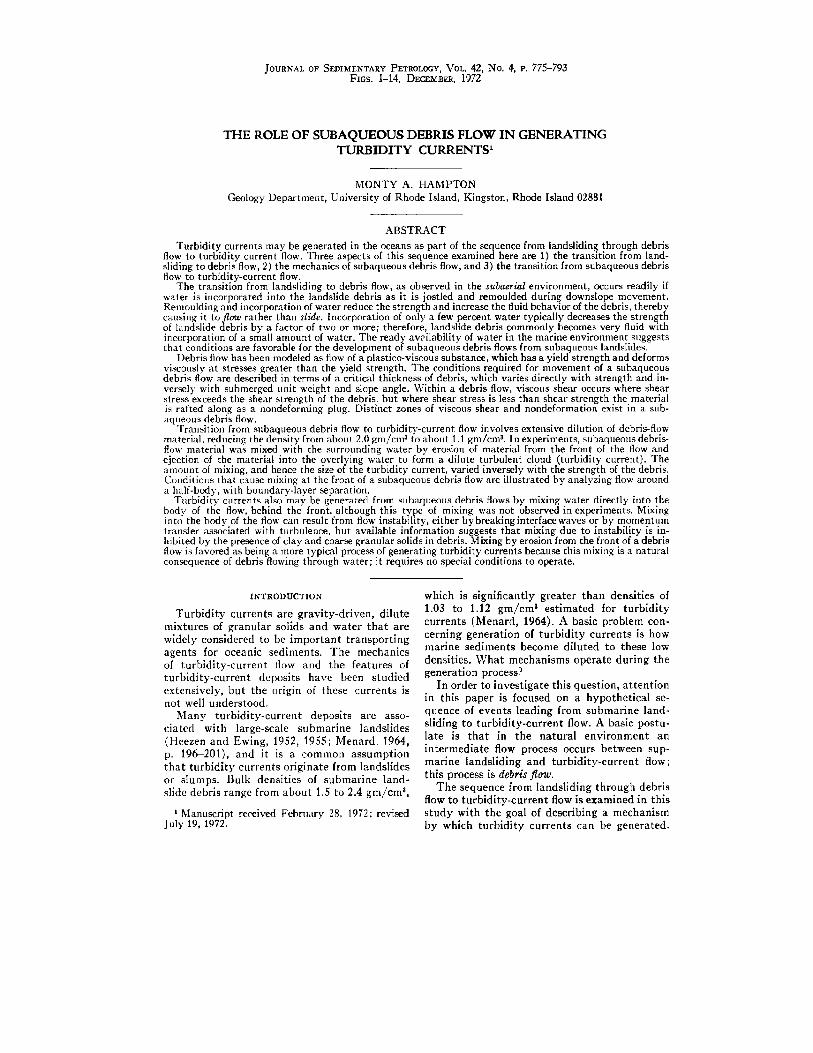
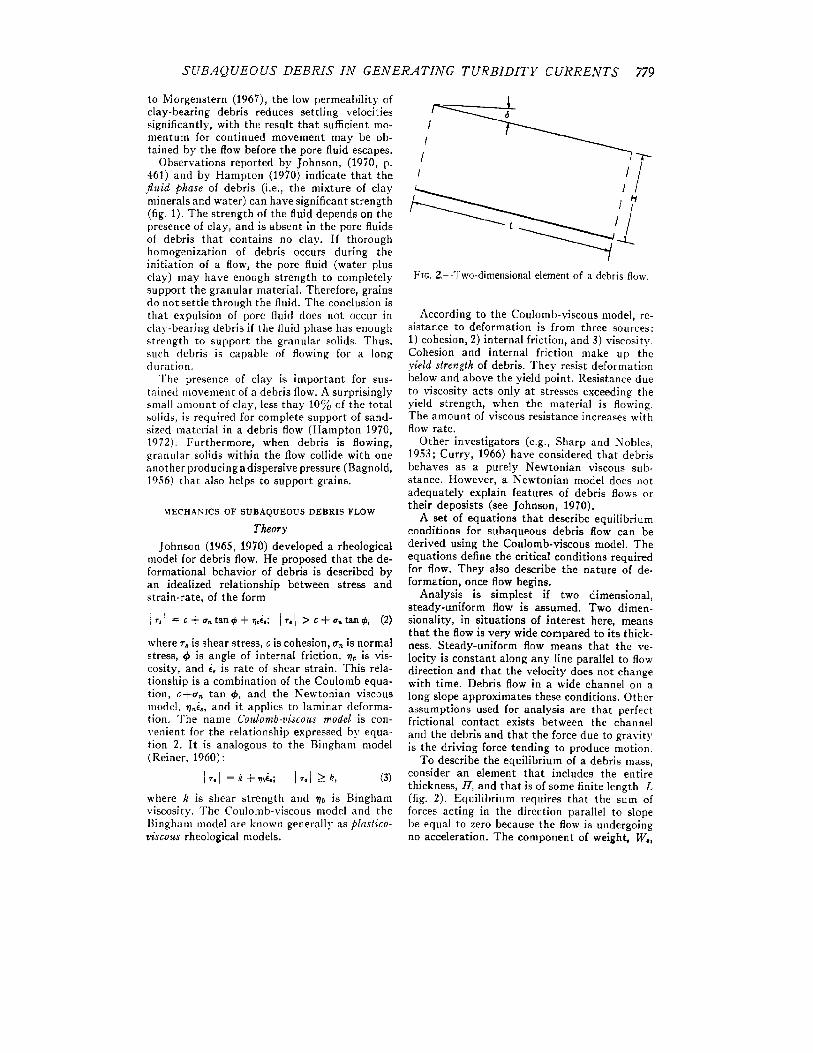
Fro. 2.--Two-dimensional element of a debris flow.
According to the Coulomb-viscous model, re- sistance to deformation is from three sources: 1) cohesion, 2) internal friction, and 3) viscosity Cohesion and internal friction make up the yield strength of debris. They resist deformation below and above the yield point. Resistance due to viscosity acts only at stresses exceeding the yield strength, when the material is flowing. The amount of viscous resistance increases with flow rate.
Other investigators (e.g., Sharp and Nobles, 1953; Curry, 1966) have considered that debris behaves as a purely Newtonian viscous sub- stance. However, a Newtonian model does not adequately explain features of debris flows or their deposists (see Johnson, 1970).
A set of equations that describe equilibrium conditions for subaqueous debris flow can be derived using the Coulomb-viscous model. The equations define the critical conditions required for flow. They also describe the nature of de- formation, once flow begins.
Analysis is simplest if two dimensional, steady-uniform flow is assumed. Two dimen- sionality, in situations of interest here, means that the flow is very wide compared to its thick- ness. Steady-uniform flow means that the ve- locity is constant along any line parallel to flow direction and that the velocity does not change with time. Debris flow in a wide channel on a long slope approximates these conditions. Other assumptions used for analysis are that perfect frictional contact exists between the channel and the debris and that the force due to gravity is the driving force tending to produce motion.
To describe the equilibrium of a debris mass, consider an element that includes the entire thickness, H, and that is of some finite length L (fig. 2). Equilibrium requires that the sum of forces acting in the direction parallel to slope be equal to zero because the flow is undergoing no acceleration. The component of weight, W,,

780 3 1 ( ) N T t " I I A M P T O N
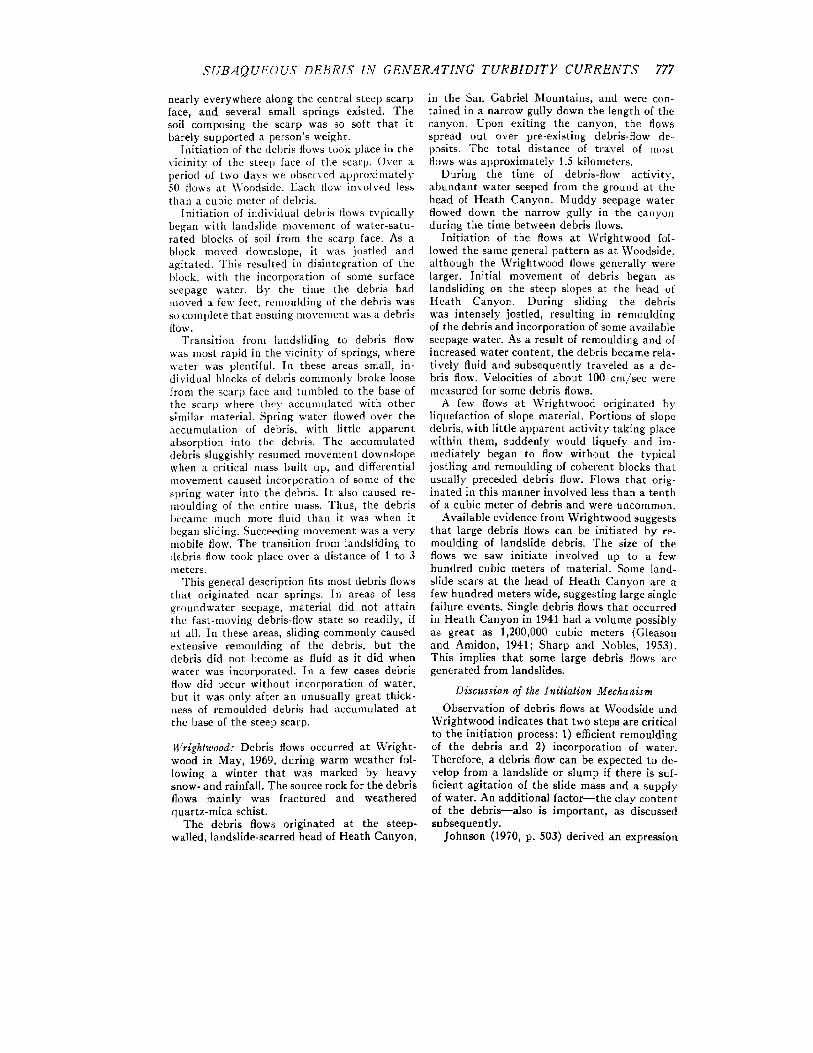
Fro. 3.--Idealized shear-stress distribution within a subaqueous debris flow.
at any depth below the surface, is given by
W, = ~'bLy sin ~, (4)
where y~ is the submerged uni t weight of the debris, b is the width of the flow, L is the length of the element, 3' is the dep th below the surface of the element and ~ is the slope angle.
Two forces resist the driving force: 1) the internal resistance to shear, F,, and 2) the force of friction, Fi, at the interface of the debris flow and the overlying water. For equil ibrium the dr iving force is equal to the resisting force:
- F i + ~'bLy sin 6 - F, = 0. (5)
Dividing equat ion 5 by the surface area of the element, b X L , and rearranging, gives the in- ternal shear stress, r,, resisting the downslope pull of weight.
r,~ = 7'y sin 6 - r, ~.6)
where r, is the interface stress. The internal shear stress is ei ther positive or negative, de- pending on the relative magnl tndes of ~ 'y sin and ri. At the depth y0 where
r , = 0 and no shear stress exists. The internal shear-stress dis t r ibut ion for an idealized sub- aqueous debris flow is i l lustrated in Figure 3.
At an33" place within the debris where the shear stress exceeds the shear s t reng th of the debris, flow will occur. From equat ion 2, the criterion for yield is
Ir, i >_ c + a , tano (7)
Ei ther positive or negative shear stress in ex- cess of the shear s t rength causes the debris to yield, or flow. Subs t i tu t ing equat ion 6 into equation 7 gives
' r i - 5'3' sinai -~ c-I- a,, tan4,
or r, -4- ~.'y sin 8 >_ ± (c + ~, tan 0). (8)
Solving for y in equat ion 8 gives the critical depth, y~, at which yielding begins to occur:
r~ ± (c + a,,tane) 3'~ y' sin ~ i9)
Thus, yielding begins to occur at two critical depths; one is located below the point of no shear stress, y0, and the other is an equal dis lance above it. No flow occurs between these two critical depths, and the material behaves as a rigid plug there (fig. 4c). Flow occurs outside these depths.
Equat ion 9 is of general importance concern- ing mobilization of a debris flow. Consider a quan t i ty of remoulded, potential debris-flow material resting on a submar ine slope. For ma- terial at rest ri = 0 , Y0 is at the upper surface of the debris, and the shear stress dis t r ibut ion ap- pears as in figure 4a. Shear stress is less than shear s t rength at depths less than yc, implying t h a t if thickness of the debris is less than y~ flog. will not occur. Thus, debris of total thick- ness H will not flow unless condit ions of s t rength, specific weight, and slope yield a value of y~ t ha t is less than H. Fur thermore , if for some reason the thickness of flowing debris decreases, flow stops when H becomes equal to Yc (assum- ing perfect frictional contac t between the chan- nel and debris).
If the debris flow is moving very slowly, the interface stress, r,, is essentially zero. In this case, y0 is very near the surface of the flow, and the upper value of y~ exists imaginari ly above the surface of the flow. For small values of r , the upper critical dep th also lies above the sur- face of the flow, and the lower value is slightly below the critical depth of ri=O. Essentially, this means that the nondeforming plug thickens as a small stress is applied to the upper surface . f the debris flow. For increasing values of ri the plug cont inues to thicken. At the value of ri = k, the upper value of y~ coincides with the upper surface. For values of ri > k, the two values of y~ are within the flow; therefore, a region of flowing material exists bo th above and below the nondeformlng plug (see also, Einstein, 1041). The three cases in which rl is 1) zero, 2) small, and 3) large are compared in Figure 4.
Discussion of theory: Although equat ion 9 is specifically applicable only to two-dimensional flow, the conclusions reached with it are valid for subaqueous debris flow in general. T h a t is, the tendency toward deve lopment of a f loating plug exists in a subaqueous debris flow, irrespective of channel shape. The floating plug is a conse quence of the s t rength of the debris and of the interface stress. A two-dimensional flow model was used for analysis because a simple, yet in- s t ruct ive analytical expression can be derived for it. A difficulty in applying the equat ions di- rectly to s i tuat ions in na tu re is tha t the value of r, cannot be determined ei ther theoret ical ly or experimental ly.
Observations: The existence of a rigid plug of

.';(_i3. tQUI:©U5 D E B R I S ]_V {,E),t2R. tTI: \{; TURBIDIT!." ('('NA't:.VT.s 781
debris has been verified experimentally for sub- arial debris flow. Figure 5 is a vertical view down on the top of an experimental debris flow. The flow is in a 10-centimeter diameter semi- circular channel, and the debris is composed of kaolinite with approximately 70 weight-percent water.
The black line evident on the surface of the flow is ink that was squirted as a straight line perpendicular to the ftow direction about a second before taking the photograph. The shape of the line, therefore, essentially is a velocity profiIe and reflects deformation of the debris. Notice the wide central portion of the line that has not been deformed. This is the region of the rigid plug. A rigid plug also has been observed in natural debris flows (Johnson, 1970, p. 509- 513).
Evidence of Subaqueous Debris Flow
Although subaqueous debris flows have not been observed directly in the ocean, evidence for their existence is available from a number of
r ,g ld r ' ~
4 I o ~
f ,'- : k : : _ &
i ~ ~ " ~ 7 - - - - - ~ - -
• \
,: . . . :
FIG. 4.--Theoretical velocity profiles and shear- stress distributions for three magnitudes of interface stress. T~ is shear stress• Tj is interface stress, and u is velocity, a) Tt = O, b) Small interface stress, c) Large interface stress.
FIG. 5.--I'lan view of slurry flow in a semicircular ch:mneI with the vel(wily distribution indicated by the i~k line.
sources. Most of the evidence is based on com- parison of textural characteristics of marine sediments with those of subaerial debris-flow deposits.
One common textural characteristic typical of subaerial debris-flow deposits is bimodal or multimodal size distribution; the larger particles are set at random in a finer-grained matrix (Johnson, 1970). Layers with these features have been discovered in some deep-sea sediment cores (e.g., see Ericson, and others, 1961; Shepard, 1963, p. 328; and Bouma and Shepard, 1964). The size range of the coarse material in these layers is from gravel to boulders. A claye:." matrix is reported to be present in some samples. Layers with such coarse material have been in- terpreted as debris-flow deposits (Shepard, 1963). Cores containing gravel to boulder layers have been obtained in deep Atlantic basins (Ericson, and others, 1961), in Hudson Canyon (Shepard. 1963, p. 32s), and in the Gulf of California (Bouma and Shepard, 1964). Typically, these deposits have been encountered in areas where turbidity currents are believed to have occurred.
Probable submarine debris-flow deposits are evident in ancient rocks; pebbly mudstones are an example. Three striking features of pebbly mudstones are: (1) poor sorting and multi- modal size distribution, (2) high percentage of
782 M O N T Y H A M P T O N
fine-grained, clayey matrix, and (3) inferred de- position in deep water (Crowell, 1957). The gen- eral features of pebbly mudstones indicate that deposition was from a mass-transport process such as debris flow, not from ocean currents.
Two examples of pebbly to bouidery mudstone deposits occurring at the base of the Venado Formation (Upper Cretaceous) in California have been described by Peterson (1965). Some of the clasts in these deposits have a maximum diameter of 2.5 meters. As inferred from the rocks above and below the bouldery deposits, deposition was in deep water. Peterson suggests that these rocks were emplaced by a mass- transport process. I would suggest debris flow. Turbidites also are abundant in the Venado Formation.
One of the problems of identifying debris- flow deposits in ancient rocks is that not all of these deposits necessarily have a multimodal size distribution. In all the examples cited above, the debris-flow mechanism was inferred because of coarse particles set in a fine-grained matrix. However, the presence of coarse material such as pebbles and boulders is not required for debris flow. Some clay-bearing sediments containing sand as their coarsest material can move as a debris flow (Hampton, 1972). Lithified deposits from such flows would be difficult to distinguish from a sandstone or mudstone deposited by traction currents. I suggest that sandy debris flows are involved in generating turbidity cur- r e n t s .
TRANSITION FROM DEBRIS FLOW TO
TURBIDITY-CURRENT FLO'W
Previous Studies
Several authors have suggested that large turbidity currents generated on the ocean floor are preceded by some sort of movement such as slumping or debris flow, but a variety of ideas has been presented regarding the transition to turbidity-current flow.
Kuenen (1952) proposed that slumps or debris flows change into turbidity currents with no change in water content, as a result of break- down of thixotropic strength and the onset of turbulence. Kuenen supported this hypothesis with some simple experiments. He agitated samples of clayey marine sediment and noted that the consistency of the samples decreased significantly because of thixotropy. In Knenen's opinion, the change in behavior of the clayey sediment when agitated is on the order of the difference in behavior of a slump and turbidity current. Kuenen (1951) suggested that turbidity currents have high densities; on the order of 1.60 gm/cm' .
Morgenstern (1967) calculated that submarine slumps can be expected to accelerate to high velocities if strength is reduced significantly at failure and if expulsion of pore water is suffi- ciently slow. According to Morgenstern, a slump becomes a turbidity current when the velocity becomes high enough for turbulence to develop. He suggested that mixing with the surrounding water may take place due to instability at the debris-water interface.
Van der Knaap and Eijpe (1968) studied turbidity-current generation experimentally. They induced slumping in inclined subaqueous sediments by raising the pore pressure at planes of permeability contrast, such as at the interface between a clay layer overlying a sand layer. Turbidi ty currents were generated in their ex- periments when the slumped sediment reached the base of the initial slope and was thrown into suspension.
Van Andel and Komar (1969) speculated that turbidity currents may be generated by a hy- draulic-jump mechanism. They suggested that flows moving downslope are in supercritical state (Froude number >1) , and that a hydraulic jump occurs when the flow moves out onto a flat basin and becomes subcritical (Froude num b e r < 1). Energy is dissipated as turbulence dur- ing the jump process, which places a large amount of material into suspension. They pro- posed that the high-density, supercritical phase of flow can be considered a slide, and the low- density, subcritical phase can be considered a turbidity current.
Allen (1971) suggested that submarine slumps are transformed into turbidity currents by mix- ing of water at the bottom of the front of the moving slump. This mixing mechanism involves inflow of water along tunnels that exist across the front of the slump.
Experiments
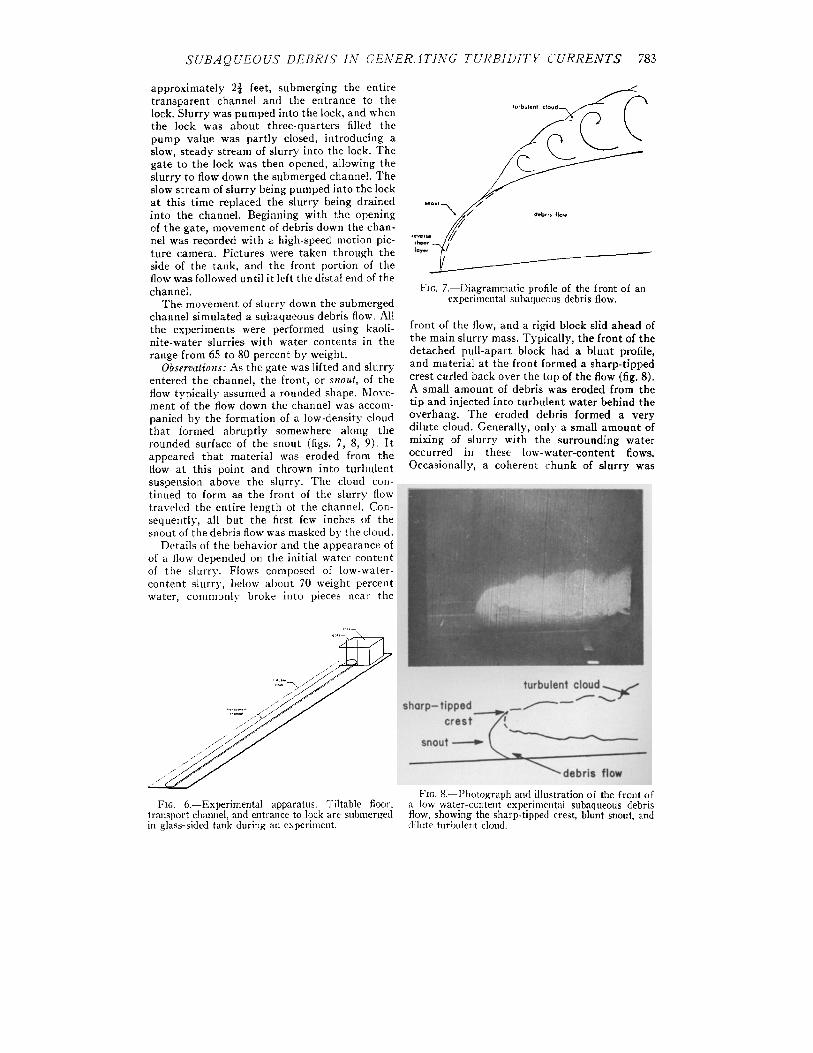
Apparatus: I conducted experiments to de- termine how water mixes with the sediment of a subaqueous debris flow to initiate dilute turbidity-current flow. The experiments were performed in a glass-sided tank 20 feet long, 3 feet wide, and 3 feet deep. A transparent semi- circular channel, 18 feet long and 4 inches in diameter, was placed on a tilted plywood floor within the tank (fig. 6). The tilt of the floor was 7 degrees. A lock was located at the upper end of the transparent channel, and a vertically slid- ing gate separated the lock from the channel. A 15-horsepower slurry pump was used to mix kaolinlte-water slurries and pump them into the lock prior to an experiment.
Procedure: Prior to each experiment, the glass- sided tank was filled with tap water to a depth of
S U B A Q U E O U S DEBRIS fig G E N E R A T I N G T U R B I D I T Y C U R R E N T S 783
approximately 2{ feet, submerging the entire transparent channel and the entrance to the lock. Slurry was pumped into the lock, and when the lock was about three-quarters filled the pump value was partly closed, introducing a slow, steady stream of slurry into the lock. The gate to the lock was then opened, allowing the slurry to flow down the submerged channel. The slow stream of slurry being pumped into the lock at this t ime replaced the slurry being drained into the channel. Beginning with the opening of the gate, movement of debris down the chan- nel was recorded with a high-speed motion pic- ture camera. Pictures were taken through the side of the tank, and the front portion of the flow was followed until it left the distal end of the channel.
The movement of slurry down the submerged channel simulated a subaqueous debris flow. All the experiments were performed using kaoli- nite-water slurries with water contents in the range from 65 to 80 percent by weight.
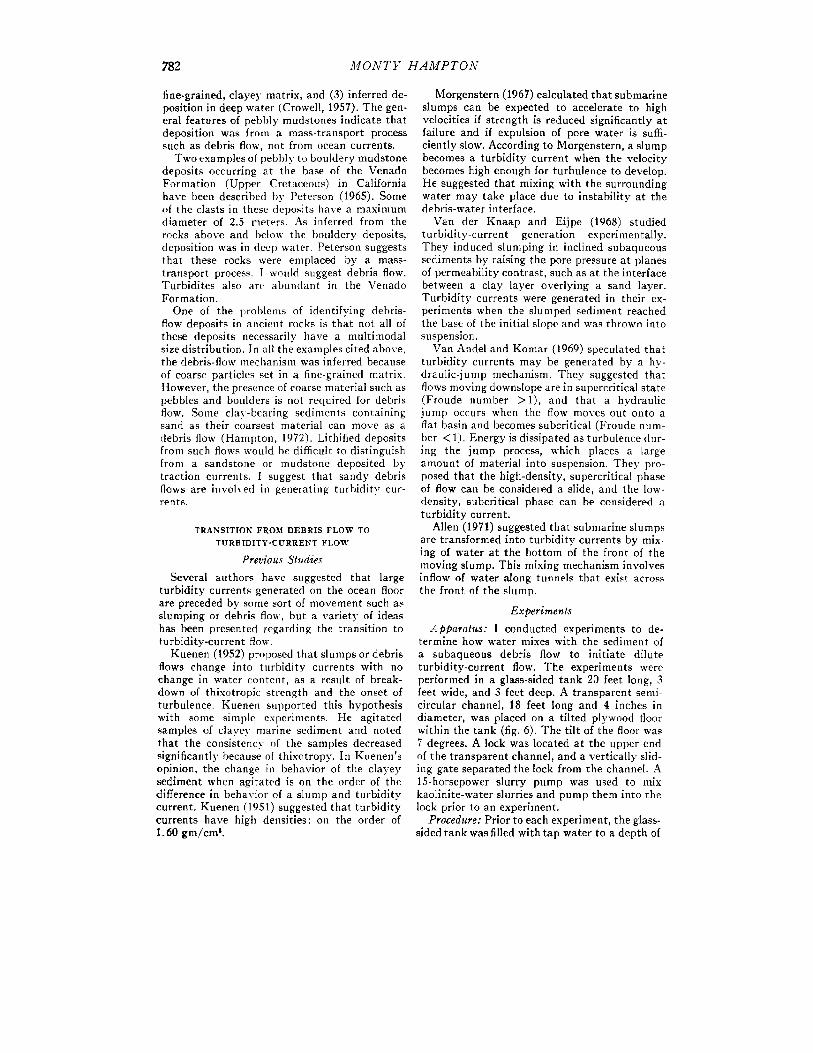
Observations: As the gate was lifted and slurry entered the channel, the front, or snout, of the flow typically assumed a rounded shape. Move- ment of the flow down the channel was accom- panied by the formation of a low-density cloud that formed abruptly somewhere along the rounded surface of the snout (figs. 7, 8, 9). I t appeared that material was eroded from the flow at this point and thrown into turbulent suspension above the slurry. The cloud con- tinued to form as the front of the slurry flow traveled the entire length of the channel. Con- sequently, all but the first few inches of the snout of the debris flow was masked by the cloud.
Details of the behavior and the appearance of of a flow depended on the initial water content of the slurry. Flows composed of low-water- content slurry, below about 70 weight percent water, commonly broke into pieces near the
turbulent cloud
,:.::,jS~ . . . . . . ,,o..
L..~/
FIG. 7.--Diagrammatic profile of the front of an experimental subaqueous debris flow.
front of the flow, and a rigid block slid ahead of the main slurry mass. Typically, the front of the detached pull-apart block had a blunt profile, and material at the front formed a sharp-tipped crest curled back over the top of the flow (fig. 8). A small amount of debris was eroded from the tip and injected into turbulent water behind the overhang. The eroded debris formed a very dilute cloud. Generally, only a small amount of mixing of slurry with the surrounding water occurred in these low-water-content flows. Occasionally, a coherent chunk of slurry was
Io,, " jr
/ - Fro. 6.--Experimental apparatus. Tiltable floor,
transport channel, and entrance to lock are submerged in glass-sided tank during an experiment.
turbulent cloud sharp-tipped_._.~ _ ~ ~ " ~ J
crest 7
- - ~ d e b r i s flow FIG. 8.--Photograph and illustration of the front of
a low-water-content experimental subaqueous debris flow, showing the sharp-tipped crest, blunt snout, and dilute turbulent cloud.

784 ] IONTI" I t . 1MPTO.V
CI. turbulent clout.d__j~" ~
reverse j ~ ' J - ' ~ J
- - " ~ d e b r i s flow
b turbulent ctoud ~>.~',, • S._.,..
snou| .--o,~~ I - - ! "-debris flow
l:lc:. 9.--Photogral)hs and illustrations of a medium- water-content experimental snbaqueous debris flow. a) \Vedge-shaped snout, b) Blunt snout.
torn from the overhang and tossed abou t in the turbulent water.
Flow of medium-water -conten t slurries, with about 70 to 75 weight percent water, differed somewhat from the drier flows described above. The profile of the f ront lacked a sharp crest and tile shape of the snout varied as the slurry moved down the channel. The shape commonly
changed back aild forth from a wedge-shaped to a blunt profile (fig. 9).
A large tu rbu len t cloud formed at the front and covered most of the surface of the flow. These clouds were visually denser than those formed from low-water-content slurries. The amount of mixing increased significantly with water content .
One notable feature of medium-water -conten t flows was t ha t a th in layer of s lurry a t the sur- face of the snout was sheared in a direct ion op- posite to the direction of flow (figs. 7 and 9a). Within this layer, slurry moved back from the leading edge toward the point where the cloud formed. When the material reached t h a t point, it was abrup t ly thrown into suspension to form the di lute cloud. Occasionally a large coherent piece of slurry was torn from the f ront of the debris flow and injected into the cloud.
The exact location of the point of separat ion was not easy to define in all instances, bu t never- theless three dist inct zones of flow always existed: (1) the debris flow proper, (2) the zone of reverse shear, and (3) the dilute t u rbu len t cloud.
Motion near the f ront of debris flows contain- ing more than abou t 75 percent water was chaotic. Apparent ly , the region of reverse shear existed th roughout most of the snout of the flow. The largest clouds formed in these flows, pre- sumably indicat ing t h a t erosion at the front was the most intense. Blocks of coherent debris were ejected into the cloud less f requent ly than in other flows; the material in the cloud was thoroughly mixed with the surrounding water.
Discussion: Several features of the experi- ments are significant. Mixing of a debris flow and water took place in all flows, regardless of the water conten t of the slurry. The amount of mixing varied direct ly with initial water con- tent of a slurry, and the magni tude of mixing increased considerably over a small range of water contents . Mixing was slight for kaolinite slurries with less than abou t 70 weight percent water; i t was intense for those with more t han about 75 weight percent water. Mixing occurred mainly at the snout of the flow. The surface of a debris flow, behind the snout, was covered by a turbid cloud, bu t apparen t ly not much mixing was taking place there. Most of the mixing took place over a certain small area on the snout. Commonly, material within the snout of the debris flow underwent shear, and movement of material was directed toward the point of mix- ing. At this point, the sheared material was ab rup t ly thrown into suspension to form an expanded, dilute cloud t h a t resembled a tur- b id i ty current . The mixing process, therefore, was one of removing debris from the front of the

S ( r B : I Q U E O U S I ) E B k l S I N G E N E R A T I N G T U R B I D I T Y C U R R E N T S 785
debris flow and ejecting it into the overlying water. Wa te r was not observed to be mixed into the body of the debris flow, which would have expanded the ent ire debris flow and reduced its bulk densi ty throughout .
The exper iments emphasized a mechanism of mixing tha t previously has not been considered in discussions of ini t iat ion of tu rb id i ty currents . Mixing at the front of a debris flow generated a completely dist inct phase of flow t h a t behaved differently from the debris flow" itself. The debris flow did not t ransform ent irely into a tu rb id i ty current ; ra ther , it generated one as a dis t inct phase.
Analysis of the Experiments
The mixing mechanism observed in the experi- ments can be analyzed using the theory of flow around a half-body (see Vallentine, 1967). A half-body is a mathemat ica l ly derived form tha t has semi-infinite length an in profile resembles the profile of a debris flow combined with its mirror image. Expressions can be derived for the pressures and the velocities of fluid flow around a half-body, and these can be used to make in- ferences about mixing. A l imitat ion of applying this theory to subaqueous debris flow is t ha t the half-body model applies specifically to flow around rigid bodies. Exact expressions have not been derived tha t describe flow around de- formable bodies, in part icular those like debris flow tha t can diffuse and mix with the surround- ing fluid.
The half-body model is developed by com- bining two s tandard flow pa t te rns : uniform flow and .flow from a source (see Vallentine, 1967, p. 102). The equations describing each of these models, when added, yield a resul tant equat ion t ha t describes the pa t te rn of flow around a half- body. Assumpt ions for this model are t ha t ideal, inviscid fluids are involved and t ha t flow is irrotational.
Specific flow pa t te rns are described by stream functions. Differentiation of the s t ream function of a part icular flow pa t te rn with respect to one of the coordinate directions, x or y, gives the flow velocity perpendicular to t ha t direction; there- fore, in two-dimensional space,
- - = u and - - = v (10) dy dx
where ~b is the s t ream function, u is velocity in the x-dlrection, and v is velocity in the y-direc- tion. In polar coordinates the relat ionships are
v~ = - - - (11) r d O
and
. 0 'I
/
FIG. 10.--Two standard patterns of flow. a) Uniform flow, b) Flow (tom a source.
0¢, v 0 = - - ( 1 2 )
Or
where vr is the component of velocity radially away from the origin, v0 is the componen t of velocity perpendicular to vr, r is the length of the line from the origin to a par t icular point, and 0 is the angle between this line and the x-axis.
The s team function also has the proper ty tha t is cons tan t along a part icular s t reamline in the
flow. A picture of a par t icular flow pa t t e rn at any in s t an t is obta ined by set t ing 6 equal to various constants , thereby determining several streamlines of the flow.
The uniform-flow model describes a flow pat- tern with cons tan t velocity th roughout the field (fig. 10a). The equat ions describing uniform flow of velocity U, inclined at an angle a to the x-axis are
a/, u = - = l ' c ~ c e ( 1 3 ) 3v
and
0¢ v = - - = Usina. (14)
Ox
Successive integrat ion of these equat ions gives the equat ion of the s t ream function for uniform flow :
= U(y cos a -- x sin ~) (15)
and in polar coordinates:
q~ = Ur(sin 0 cos a - cos 0 sin a) (16)
= Ur sin (0 -- a).
The model for a source is defined as flow radially outward from a point (fig. 10b). In two dimensions, only one equat ion is needed to describe a source if polar coordinates are used:
I 0 ~ Q v, , (t7)
r 00 2rr
where vr is the "radial velocity, and Q is the s t rength of the source (volume of flow per uni t t ime). The tangent ia l velocity, re, perpendieular

786 M O N T Y H A M P T O N
FIG. l l . --Flow from a source in a field of uniform flow. Dashed lines represe~t the source and uniform- flow patterns, and the solid lines represent the resul- tant pattern. Flow is from left to right.
to vr, is zero for a source, and therefore, equat ion 17 describes the flow.
In tegra t ion of equat ion 17 gives the equat ion of the s t ream function for a source:
9_ 0 = m0 (18) ¢~ = 2~r
The quan t i t y (Q/27r) = m is cons tan t for a par t icular source.
Combining a source and uniform flow pro- duces the pa t t e rn of flow around a half-body. The equat ion for the s t ream funct ion of a half- body is obta ined by adding the equat ions of the component pat terns. Consider a source t ha t is placed with its center a t the origin in a field of uniform flow. The uniform flow is parallel to the x-axis; therefore a = 0 (Eq. 15). The equat ion for the s t ream function of the resu l tan t pa t t e rn obtained by addit ion of equat ions 15 and 18 is
= Ur sin 0 + mO (19)
Graphical representa t ion of the flow pa t te rn is accomplished by superimposing the flow of the two componen t pa t t e rns and connect ing points of equal total ~b (fig. 11). The dashed lines of Figure 11 are the streamlines of a source and uniform flow; the solid lines represent the com- bined flow pat te rn . Flow is from left to right.
The s t reamline coincident with the x-axis splits a t S and completely envelops flow from the source (fig. 11). This s t reamline can be regarded as a solid boundary , and i t defines the surface of a half-body. If only the port ion of the flow field above the axis of s y m m e t r y is considered, the pa t t e rn resembles idealized s teady flow a round the f ront of a subaqueous debris flow (fig. 12a).
The equat ion of the half-body surface is de- termined using some known condit ions at S. At S, which is on the half-body surfaee, flow from
the source is completely nullified by the uniform flow. S is a s tagnat ion point; the resul tant velocity, V, is zero there. Therefore, a t S,
r = r,, # = r , and V = 0.
Subs t i tu t ing the per t inent values into equat ion 19,
~b = Uro sin ~ + m r
0 = - , ( 2 0 )
2
which is a constant . Because S is on the bound- a ry streamline, and because ~, is cons tan t along a streamline, combina t ion of equat ion 19 with equat ion 20 gives the equat ion of the half-body profile.
O ~b = Ur s i n e + m 0 = -
2 o r
m ( ~ - 0) r = - - (21)
U sin 8
The u and v velocity components t h roughou t the flow field are equal to the sums of the u and v components of the source and uniform flow. Therefore, in the flow field a round a half-body
m u = U + - - c o s 0 (22)
r
gn v = - - sin 0 (23)
r
The resu l tan t velocity, V, in the flow field is equal to the resu l tan t of the componen t vectors:
2mU rn ~ V 2 = u ~ + v ~= U 2 + - - c o s 0 + (24-)
The pressure normal to the surface of the
FIG. 12.--Flow around a hal-body, a) Profile of half-body and water streamlines. Flow is from left to right, b) Pressure distribution along the surface of a half-body.

S U B A Q U E O U S D E B R I S I N G E N E R A T I N G T U R B I D I T Y C U R R E N T S 787
half-body is of interest in analyzing mixing and can be computed using equation 24. The pressure distribution throughout the entire flow field is calculated first, using the Bernouilli equation (see Valentine, 1967, p. 37).
Vo po v- '+-P+. = Fg + 7 + ~0, (2s~ 2g y
where p is pressure, and z is elevation with re- spect to some datum. The subscripts refer to values of a variable at a specific reference point; for example, at infinity.
Combining equations 24 and 25 gives the pressure distribution throughout the flow field. Combining this result with equation 21 gives the pressure distribution along the surface of the half-body. In dimensionless form, the surface pressure distribution is
p - :~0 ~i. [2 sin0 ] ½oU ~ ~ - 0 t . cos0+ (~_0)3
(26) 2g
+ F~ (z~ - ~). (Note that by choosing the reference point at infinity along the negative x-axis, the reference velocity, V0, becomes equal to the uniform-flow velocity, U.) The pressure distribution along the surface of the half-body is illustrated in Figure 12b. It will be used to analyze the mechanism of mixing observed in the experiments after some preliminary discussion.
The model for flow around a half-body ap- plies to a rigid body in an inviscid fluid. In the case of a debris flow moving through water, how- ever, the surrounding fluid has viscosity and the body is potentially deformable.
The viscosity of the fluid changes the flow pat- tern close to the surface of the half-body. In particular, because there is no relative motion between the viscous fluid and boundary of the half-body where the two are in contact, a bound- ary layer exists (Sehlichting, 1960) where the flow velocity goes from zero to that predicted by equation 24. The high velocity gradient within the boundary layer is responsible for creating shear stress at the surface of the half-body. Flow velocity in the fluid closely approaches that pre- dicted by equation 24 up to the boundary layer.
The pressure distribution at the surface is not affected appreciably by the presence of a boundary layer. According to Schliehting (1960, p. 27), the pressure essentially is constant over the small thickness of the boundary layer; there- fore, " . . . the external pressure is 'impressed' on the boundary layer." The pressure distribution shown in Fignre 12b is valid for viscous fluids.
With a normal, undisturbed boundary layer the shear stress acting tangential to the surface of a rigid body is proportional to some power of the
Fro. 13.--Flow around a half-body, with boundary- layer separation. Flow is from left to right.
flow velocity (Sehlichting, 1960, p. 26). There- fore, the shear stresses on the surface of a half- body increase with the velocity of flow. However, the shear stress varies from point to point over the surface at any particular flow velocity (Eq. 24).
Under certain conditions, the flow pattern of a viscous fluid around a rigid body is significantly different from that predicted by the preceding theory. In particular, boundary-layer separation. may occur in regions where steamlines diverge in the direction of flow creating a positive pressure gradient that retards movement of the fluid in the boundary layer (Schlichting, 1960, p. 27; Vallentine, 1967, p. 71). This condition exists for flow around a half-body downsteam from the point of minimum pressure, point M, in Figure 12b. As a fluid element reaches the front of the half-body and begins to move in the boundary layer, it flows down a negative pressure gradient for some distance, with an increase in kinetic energy. Some of this kinetic energy, however, is consumed by friction in the boundary layer, and when the element reaches the positive pressure gradient at point M, its kinetic energy is eonsumed both by pressure increase and by friction. Consequently, if the adverse gradient is large enough, fluid in the boundary layer comes to a stop at some point along the surface, past M. Flow beyond this point moves in the reverse direction, which causes the oncoming boundary layer to be deflected away from the boundary. A diagrammatic pattern of flow around a half-body, with separation, is shown in Figure 13.
When boundary-layer separation occurs, the flow pattern and pressure distribution are changed markedly from that predicted by ideal- fluid theory. The region where reversed motion occurs becomes the site of a vortex, which may be of considerable size. Experiments indicate that the region in which the vortex occurs is a region of low pressure (Schliehting, 1960).
Discussion: The preceding theory can be ap- plied to mixing at the front of a subaqueous debris flow. An exact theoretical model of the

788 M O N T Y H A M P T O N
experiments cannot be constructed because the theory does not take into account deformation of the debris flow. However, by extrapolating from the theory the details of the mixing mech- anism can be deduced.
The shear stress trangential to the surface of a debris flow increases with flow velocity. At sufficiently high velocities, the shear stress can be expected to exceed the shear strength of the debris somewhere along the surface. Material in the region where shear stress exceeds shear strength will move back along the surface of the flow in response to the shear stress. This explains the layer of reverse shear that was observed in man?, experiments. This explanation is sup- ported by the observation that the reverse-shear layer was small or nonexistent in high-strength debris flows (fig. 8). Shear stress apparently did not reach a great enough magnitude to exceed the shear strength of the debris in these flows. In flows of low strength, shear stresses exceeded t h e strength over a large portion of the front of the flow, with the result that a large zone of reverse shear was formed.
The pressure distribution for flow around a half-body (fig. 12b) is similar to that around the front of a debris flow. The general features of the pressure distribution explain the actual mixing mechanism. Near the front edge of the flow, pressure is great enough to hold material to the debris-flow surface in the reverse-shear layer. In the region of low pressure, however, there is a tendency for the debris to deform outward from the surface. This low-pressure region roughly corresponds to the region occupied by the ex- panded, dilute cloud.
The pressure distribution around a half-body tends to produce boundary-layer separation at the front of a subaqueous debris flow, which augments mixing because of turbulence and low pressures that accompany separation. In the ex- periments using hlgh-strength slurries, the shape of the sharp crest at the top of the front was very favorable for separation. Current ripples have a similar shape and separation is known to occur at their crests (see, for example, Briggs and Middleton, 1965; Kennedy, 1969). The reason that mixing was small in flows with sharp crests is due to the high strength of the slurries. No significant zone of reversed shear deforma- tion was observed in these flows, and therefore slurry was not fed into the separation zone. The shear stresses were not great enough to erode much material from the flow.
Separation also occurred in experiments using medium and low-strength slurries, although in a modified form from that which would occur along a rigid boundary. The cloud of mixed material formed abruptly at some point on the
surface of the flow; i.e., at the separation point. Also, motion within the cloud was turbulent from the very point of inception, suggesting the existence of a separation vortex. These observa- tions imply that material moved in the reverse- shear layer to a separation point where it was lifted abruptly from the surface of the debris flow and mixed into the separation vortex to form a turbidity current.
In summary, an explanation of the mixing process that operated in the experiments is provided by the theory developed for flow around a half-body. The theory indicates that there is a tendency for deformation of the front of a subaqueous debris flow in response to stresses imposed by the surrounding water. Extrapolating from the theory, the experiments demonstrate that material in the reverse-shear layer is continually moved into the low-pressure region, lifted away from the debris-flow surface, placed into the region of turbulence, and mixed with the overlying water. The cloud formed by this mixed material is a turbidty current.
Mixing at the front of a subaqueous debris flow requires no special conditions in order to operate; it is a natural consequence of debris moving through water. The question remains, however, whether large turbidity currents can be generated by this mechanism acting alone. Evidence from the experiments suggests that a large quant i ty of debris can be mixed by this mechanism, but quant i ta t ive s tatements can- not be made as to whether the mechanism is efficient enough to generate large-scale turbidity currents in the oceans, independent of other mechanisms.
INSTABILITY AS A MECHANISM FOR DILUTING
SUBAQUEOUS DEBRIS FLOWS
General
Mixing of water into the body of a subaqueous debris flow, behind the snout, can be studied in terms of instability. Instabil i ty may occur at the interface between the debris flow and the over- lying water (interface waves), or it may occur within the flow itself (turbulence). This type of mixing is known to occur in turbidity currents under some conditions (Middleton, 1966b), and it has been mentioned by Morgenstern (1967) as a mechanism of transforming subaqueous slumps into turbidity currents.
Mixing due to interface waves is a significant concern in stratlfied-flow situations that involve sharp density discontinuities, whereas mixing due to turbulence occurs in stratified flows with gradual density variations (Keulegan, 1949). Although mixing of these types was not observed in the experiments of this study, both processes
S U B A Q U E O U S D E B R I S I N G E N E R A T I N G T U R B I D I T Y C U R R E N T S 789
are possibilities for mixing water into large subaqueous debris flows in the ocean.
Mixing Due to Interface Instability
Considering stratified flow with a sharp den- sity discontinuity, the interface between two fluids of differing densities remains distinct and planar if the relative flow velocity on opposite sides of the interface is small. At moderate rela- tive velocities, waves form along the interface; the amplitude of the waves increases with flow velocity, and the profile of the waves becomes sharp crested. At some critical relative velocity the interface becomes unstable and waves break, with the result that fluid is mixed across the interface (Keulegan, 1949).
The nature of the flow near an interface in stratified Newtonian fluids has been studied by Keulegan (1944), who showed that a laminar boundary layer exists near a stable interface. The laminar boundary layer is interrupted only when the interface becomes unstable and break- ing of waves occurs. The laminar boundary layer does not allow turbulent eddies within the flow to penetrate the interface. Therefore, mix- ing due to turbulence does not occur as long as the interface is distinct and stable.
Ippen and Harleman (1952) extended Keule- fan 's work and found that for laminar flow the criterion for interface instability is a function of Reynolds nnmber and Froude number of the denser NquJd. The 3 ' defined Reynolds number, /~, aS
V d, n ~ - - (27)
V$
where V is flow velocity, d~ is thickness of the denser fluid, and v, is kinematic viscosity. They defined Froude number, F, as
V F = PAp - W i , 128)
LT e J where Ap is the density contrast of the two liquids; pt, is the density of the upper liquid, and g is the acceleration of gravity.
This criterion for instability applies only to Newtonian fluids but some quali tat ive inferences can be made that pertain to non-Newtonian debris flows. Interface stability of Newtonian fluids depends on two dimensionless variables: (1) Reynolds number and (2) Froude number. If debris is considered to be a Bingham substance, stability is a function of these variables plus another variable: the Bingham number,
kd B = - . (29)
~b V
where k is strength and ~b is Bingham viscosity. The dependence of stability on Bingham number has been demonstrated by Hedstr6m (1952), and stability increases with increased Bingham number. This implies that with increased strength of debris, higher energy conditions are required for instability at the surface of a debris flow than for a Newtonian fluid, and thus, mix- ing is inhibited. Experimental quantification of the relationship of strength to interface stability is needed to determine whether the level of strength typical of subaqueous debris flows is great enough to seriously retard interface mixing.
Allen (1971) argued against interface instabil- i ty as the major mechanism for diluting sub- marine slumps on the basis that the mechanism is not efficient enough to incorporate the large amount of water needed to expand slump debris into a low-density turbidity current. He sup- ported his argument by noting that the mag- nitude of interfacial friction is small and that interfaclal mixing only dilutes the uppermost level of the slump. Allen suggested that mixing at the front, by a mechanism different than that proposed here, is the major dilution mechanism.
Mixing Due to Turbulence
Another possibility for mixing across the interface is by momentum transfer due to turbu- lence. Keulegan (1949) mentioned that in many natural situations, mixing across a sharp inter- face perhaps occurs only over a relatively short initial reach of the flow. He argued that mixing by wave instability destroys the sharp density discontinuity and tends to produce a gradual density transition in stratified flow. If the inter- face assumes the form of a transitional layer, mixing takes place by momentum exchange due to penetration of turbulent eddies across the diffuse layer, not by the beraking of interface waves. This argument may hold for subaqueous debris flows. If mixing takes place behind the front, it is likely to be due to interface instability during initial stages of movement. If such mixing produces a sufficiently diffuse interface, mixing due to turbulence may become important. But, if turbulence does not occur or is of low intensity, mixing by this mechanism will be minor during much of the llfe of the debris flow. The factors that govern turbulence in debris flows can be deduced using the results from some studies that have been made on pipe flow of Bingham sub- stances (Babbit t and Caldwell, 1939, 1940; Hed- str0m, 1952). Enough data are available to war- rant some conclusions about dilution of sub- aqueous debris flows by turbulent mixing.
Turbulence is a form of instability. Instability of Newtonlan fluids is governed by a single di- mensionless var iable--Reynolds number (Reyn-

790 M O N T Y H A M P T O N
g z
o lealo [tom lob~* i i
o o
o 8
. . . . . . . . . . ~iA , , , . . . . . . 10' io' io'
C~lT~C*t mtvl'COtD$ NUMI.tm I kD
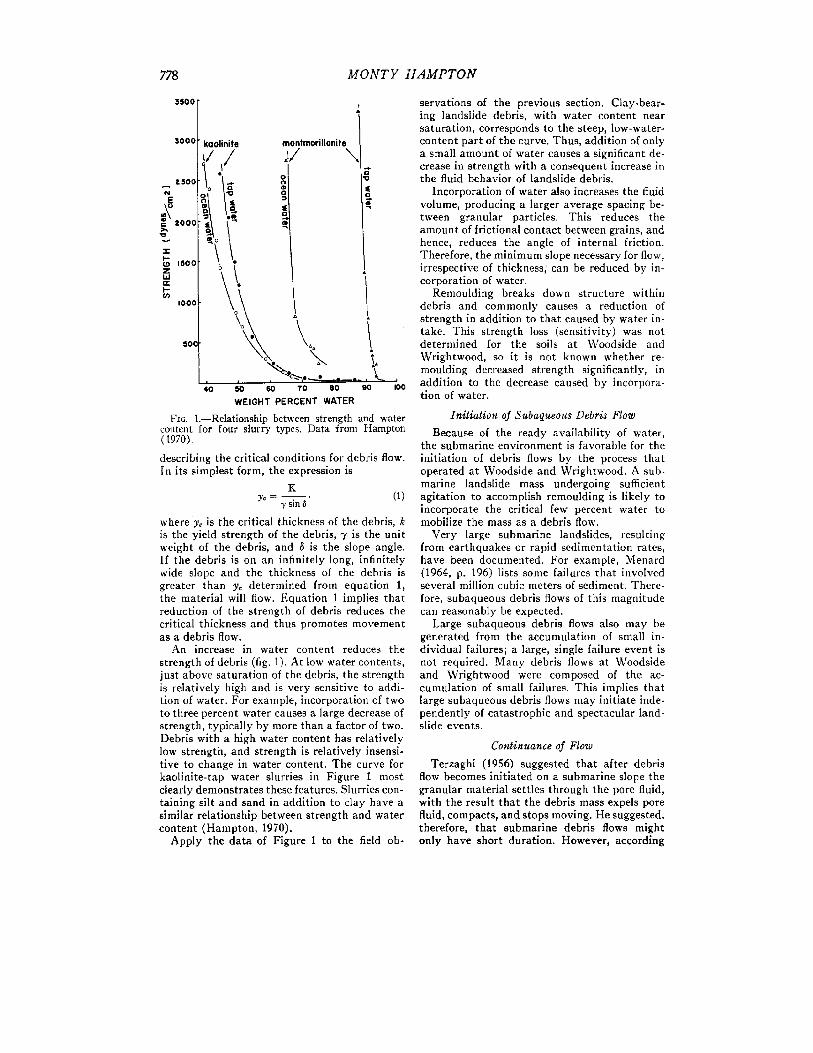
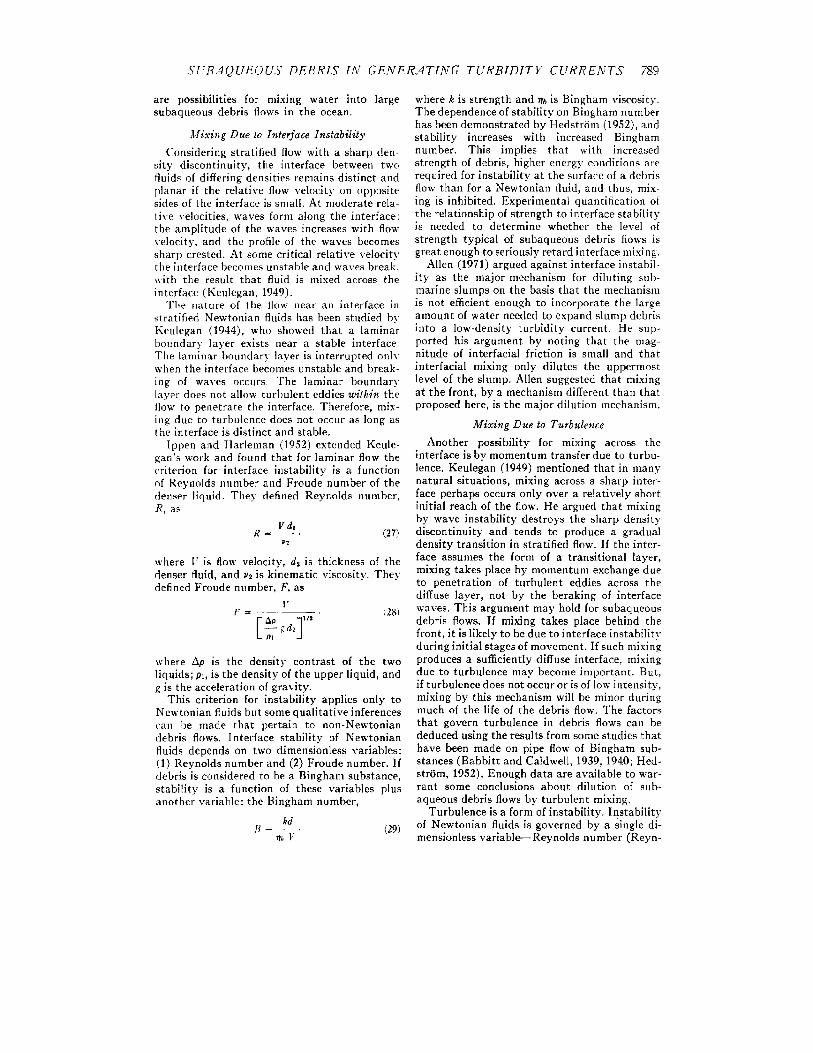
FiG. 14.--Relationship of critical Reynolds number to Bingham number for clay-shlrry pipe flow.
olds, 1883). Reynolds number also governs in- stability in a debris flow, but strength is a factor too, which necessitates consideration of Bingham number.
HedstrSm (1952) investigated the onset of turbulence in Bingham substances and demon- strated with theory and experimental data that the critical value of Reynolds number is related to Bingham number, and it is a function only of Bingham number. He presented a curve that
represents this relationship (fig. 14). The data HedstrSm used to plot this curve involved only a few experiments, but he gave theoretical support to his argument.
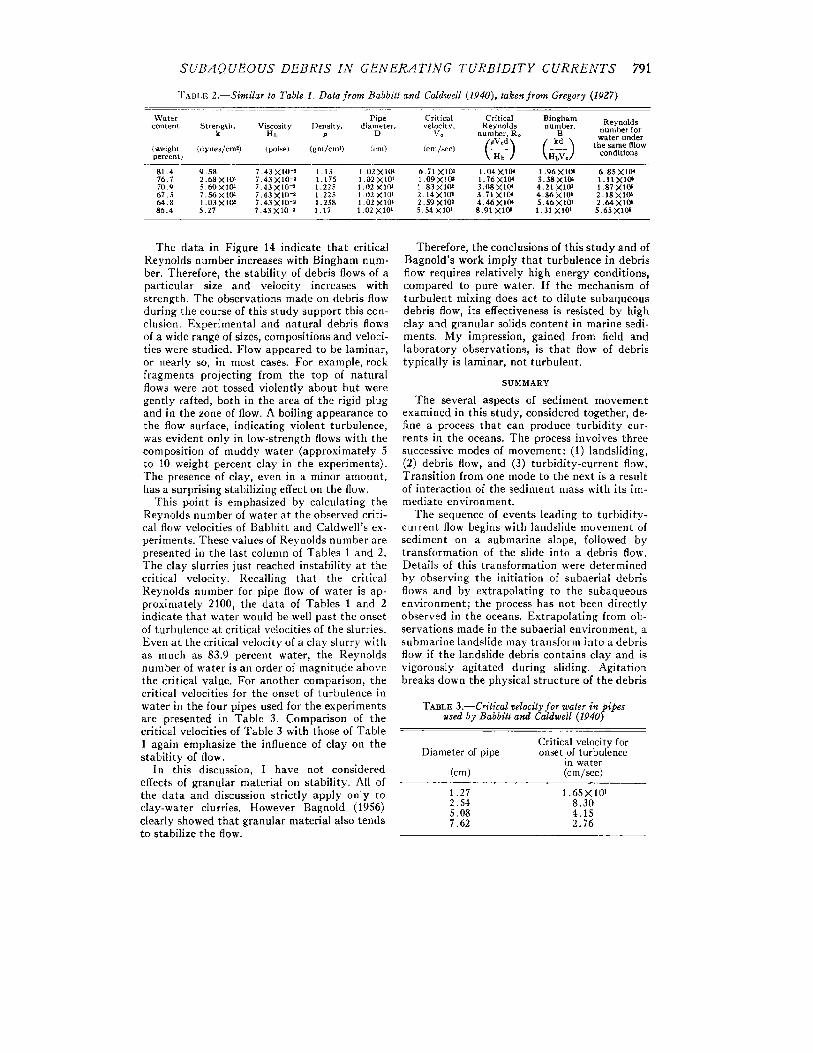
Some other experimental data are available that can be used to test Hedstr6m's conclusions. Babbitt and Caldwell (1939, 1940) studied the onset of turbulence in clay slurries flowing through pipes and presented enough data from their experiments that critical Reynolds number and Bingham number can be calculated. They also presented data from a study by Gregory (1937) that can be used in the same way. The data are presented in Tables 1 and 2. Figure 14 shows Hedstr6m's curve relating critical Reyn- olds number to Bingham number. The data from Tables i and 2 are plotted on this figure also. The data are consistently lower than the curve of Hedstr6m. The significance, however, is that all of the data suggest the same general relationship between critical Reynolds number and Bingham number.
The data in Figure 14 have implications re- garding turbulence in debris flow. The implica- tions are qualitative, however, because the data represent flow in closed pipes. Data for open- channel flow situations such as debris flow prob- ably would describe a curve similar to the curve of Figure 14, but with a different scale. In sup- port of this assumption, it is known that data for pipe flow and open-channel flow of Newtonian fluids commonly describe similar curves, except for scale (see, for example, Chow, 1959).
TABLE 1.--Critical Reynolds numbers and Bingham numbers for flow of some clay slurries (Tennessee ball clay). Data from Babbitt and Caldwell (1940)
W a t e r Pipe Cri t ica l Cr i t i ca l B i n g h a m R e y n o l d s ~ont~nt S t r e n g t h . Viscos i ty . Dens i ty , d i a m e t e r , ve loc i ty , R e y n o l d s n u m b e r ,
k H b p d Ve n u m b e r , Re B n u m b e r f o r w a t e r u n d e r
percent) \ ~ b ] ~ , cond i t ions
70 .2 4 .2 9 X I 0 : 2 . 2 3 XIO-I 1 .21
7,:1,5 2 . 8 6 X10² 2 . 2 3 X l O - t 1 .:20
75 .0 2 . 1 0 X lOS 1 .63 X IO - t I . 18
70 .7 I .38 XI(12 t .4¢ X10-1 1 .16
7'9.7 0 . 9 1 X10² 1 .19 X I g -1 1 .15
8 3 . 9 0 . 3 9 X 1 0 1 0 . 8 9 X IO - I 1 .12
2 . 5 4 5 . 3 4 X10² 7.377X101 9 . 1 6 1 .38 XIO~ 5 . 0 8 4 . 8 9 XlO= 1 .35 X 104 2 . 0 0 X i O l 2 . 4 8 XlO~ 7 . 6 2 4 . 7 3 XIO~ 1 .96 X l O ~ 3 , 1 0 X101 3 . 6 0 X I ( ~
| . 2 7 4 . 3 3 XlO2 2 . 0 6 Xll~l 3 . 7 6 ~ , 5 0 k104 2 . 5 4 4 . 4 8 XIO~ 6 . 1 4 X I O S 7 . 2 5 1 . 1 4 X I O i 5 . 08 4 . 1 2 XIOt 1 .11 X104 1 .58 XIO] 2 . 0 9 X I O 5 7 .62 4 .21 X102 1 . 7 3 XI04 2 .31 XlOt 3 .21 X I O I
1 . 27 3 .66)<102 3 . 3 6 XIOi 4 . 4 9 4 . 6 5 XlOI 2 . 5 4 3 . 9 4 XIO= 77.25 XIO! g . 32 1 .00 X l O s 5 . 0 8 3 . 3 6 X10~ 1 .24 XIO't 1 . 95 XIO~ 1 .71 X 1 0 5 7 .62 3.51 XIO= 1 . 9 4 Xl04 2 . 8 0 XIO t 2 . 6 8 X10~
2..54 3 . 3 6 XIO~ 6 . 6 6 XIOS 7 . 0 8 . S 4 X l O ¢ 5 . 0 8 2 . 7 5 XIO~ 1 .09 X 104 1 .71 XIOI 1 .40 X 10~ 7 .62 2 . 9 0 XI02 1 .72 XI04 2 . 4 4 XlOt 2 .21 XIO b
1 .27 2 . 3 5 X i O S 2 . 8 8 X lOS 4 . 1 4 2 . 9 8 M I D 2 . 5 4 2 . 4 1 X I O = 5 . g I . X I O I 8 . 0 7 6 . 1 2 X i O 4 5 , 0 8 2 . 3 2 XIO~ 1 . 1 4 XlO~t 1 . 68 XIOt I . l g X I O l 7 . 6 2 2 . 3 5 X10= 1 . 7 3 X 1 0 ~ 2 . 4 8 Xl01 1 . 7 9 X t O 4
1 . 2 7 1 . 6 5 XIOI 2 . 6 4 X 1 0 | 3 . 3 7 2 . 1 0 X l O i 2 . 5 4 1 .62 k tO~ 5 . 1 8 XIOI 6 . 8 8 4 .11 XIO a 5 . 0 8 1 .55 XI02 g . 9 2 XIOI 1 .44 X lOt 7 .87 X lO 4 7 .62 1 . 5 5 XIO~ 1 .49 XIO~, 2 . 1 6 X 1 0 t I . l g X l O ~
S U B A Q U E O U S D E B R I S I N G E N E R g t T I N G T U R B I D I T Y C U R R E N T S 791
"FABLE 2.--Similar to Table 1. Data from Babbitt and Caldwell (1940), taken from Gregory (1997)
Water Pipe Critical Critical Bingham Reynolds content Strength, Viscosity, Density, diameter, veloci ty , Reynolds number,
k Hb P D \:0 number. R~ B number for water under
(weight (dynes/crn') percent) ( p o i s e ) ( g m / c m | ) (cm) (crn/sec) " " --~ .-- x - i b (.cVed ~ ] . ~ x /kH~Ve ) the same fllow conditions
81.4 g.Sg 7.43 X I 0 1 1.13 1.02 XI01 6,71X101 1.04 XI0~ 1.96 XI0t 6.S5 Xl0't 76.7 2.68 XIO 1 7.43 XI0-~ 1.175 1.02 XI01 1.09 X10~t 1.76 X10⁴ 3.3S Xl01 1.1t XICS 7o.9 5.60 XI01 7.43 XI0~ 1.225 1.02 Xl01 "..83 XlOt 3,o8 X 10" 4 . 2 1 X I ~ 1.87 X10I, 67.5 7.S6XI01 7.43 XI0-2 1.225 1.02 X10 t 2.14X10t 3.71 X1O4 4.S6 Xl01t 2. IS XI0~, 64.8 1.113 XIO~ 7.43 Xl0m 1.258 1.02 XI01 2.S9 XI02 4.46 XI04 5.46 XI01 2.64 XIO~ 86.4 5.27 7,43 X10--t 1.17 1.02 XI01 5.54 X10 t 8.91XIOI 1.31XI01 $.65 XI0S
The data in Figure 14 indicate that critical Reynolds number increases with Bingham num- ber. Therefore, the stability of debris flows of a particular size and velocity increases with strength. The observations made on debris flow during the course of this study support this con- clusion. Experimental and natural debris flows of a wide range of sizes, compositions and veloci- ties were studied. Flow appeared to be laminar, or nearly so, in most cases. For example, rock fragments projecting from the top of natural flows were not tossed violently about but were gently rafted, both in the area of the rigid plug and in the zone of flow. A boiling appearance to the flow surface, indicating violent turbulence, was evident only in low-strength flows with the composition of muddy water (approximately 5 to 10 weight percent clay in the experiments). The presence of clay, even in a minor amount. has a surprising stabilizing effect on the flow.
This point is emphasized by calculating the Reynolds number of water at the observed criti- cal flow velocities of Babbit t and Caldwell's ex- periments. These values of Reynolds number are presented in the last column of Tables 1 and 2. The clay slurries just reached instability at the critical velocity. Recalling that the critical Reynolds number for pipe flow of water is ap- proximately 2100, the data of Tables 1 and 2 indicate that water would be well past the onset of turbulence at critical velocities of the slurries. Even at the critical velocity of a clay slurry with as much as 83.9 percent water, the Reynolds number of water is an order of magnitude above the critical value. For another comparison, the critical velocities for the onset of turbulence in water in the four pipes used for the experiments are presented in Table 3. Comparison of the critical velocities of Table 3 with those of Table 1 again emphasize the influence of clay on the stability of flow.
In this discussion, I have not considered effects of granular material on stability. All of the data and discussion strictly apply only to clay-water clurries. However Bagnold (1956) clearly showed that granular material also tends to stabilize the flow.
Therefore, the conclusions of this s tudy and of Bagnold's work imply that turbulence in debris flow requires relatively high energy conditions, compared to pure water. If the mechanism of turbulent mixing does act to dilute subaqueous debris flow, its effectiveness is resisted by high clay and granular solids content in marine sedi- ments. My impression, gained from field and laboratory observations, is that flow of debris typically is laminar, not turbulent.
SUMMARY
The several aspects of sediment movement examined in this study, considered together, de- fine a process that can produce turbidity cur- rents in the oceans. The process involves three successive modes of movement: (1) landsliding, (2) debris flow, and (3) turbidity-current flow. Transition from one mode to the next is a result of interaction of the sediment mass with its im- mediate environment.
The sequence of events leading to turbidity- current flow begins with landslide movement of sediment on a submarine slope, followed by transformation of the slide into a debris flow. Details of this transformation were determined by observing the initiation of subaerial debris flows and by extrapolating to the subaqueous environment; the process has not been directly observed in the oceans. Extrapolating from ob- servations made in the subaerial environment, a submarine landslide may transform into a debris flow if the landslide debris contains clay and is vigorously agitated during sliding. Agitation breaks down the physical structure of the debris
TABLE 3.--Critical velocity for water in pipes used by Babbitt and Caldwell (1940)
Critical velocity for Diameter of pipe onset of turbulence
in water (cm) (cm/sec)
1.277 1.65X10 ~ 2.54 8.30 5.08 4.15 7.62 2.76

792 M O N T Y H A M P T O N
and incorporates ocean water into the debris. Breakdown of s t ruc ture and incorporat ion of water decrease the s t rength of the landslide ma- terial and thereby cause i t to move by internal shear (debris flow) ra ther than by rigid sliding (landslide). Large ca tas t rophic failures in the oceans t ha t experience vigourous agi ta t ion can generate large debris flows. Also, the debris from several small landslides may accumulate at a place and move as a large debris flow when a critical thickness of debris builds up. An init ial large ca tas t rophic event is not required.
Movemen t of a subaqueous debris flow de- pends on s t rength, submerged unit weight, and thickness of the debris, as well as the angle of the local slope. With in a debris flow, viscous shear occurs where shear stress exceeds the shear s t rength of the debris; bu t where shear stress is less than the s t rength, the material is raf ted along as a rigid plug.
Exper iments indicate t h a t t rans i t ion from subaqueous debris flow to tu rb id i ty -cur ren t flow takes place by erosion of sediment from the front of the debris flow. Erosion occurs by shear- ing of sediment back along the surface of the front of the flow to a place where i t is ab rup t ly thrown into tu rbu len t suspension. As sediment is th rown into suspension ahove the debris flow it mixes with water to form a dilute tu rb id i ty current . The mixing mechanism is explained by analyzing the mechanics of fluid motion around the front of a debris flow. Theory indicates t h a t the surrounding water sets up shear stresses at the surface of the debris flow and tha t boundary- layer separat ion tends to occur somewhere along the surface of the debris flow. A region of low pressure and intense turbulence exists behind the
point of separat ion. Thus, the shear stresses ac- count for the layer of reverse shear, and separa- tion and the low-pressure region of turbulence account for placement of sediment into suspen sion.
Mixing of water into the body of a debris flow due to instabi l i ty , e i ther in the form of unstable interface waves or in ternal turbulence, was not observed in the experiments. Mixing due to ins tabi l i ty is inhibi ted by the presence of clay and granular solids in the debris. Available evi- dence, a l though inconclusive, imply t ha t this mechanism is not the major one by which large tu rb id i ty currents are generated.
Mixing a t the f ront of a debirs flow is sug- gested as being a major mechanism for generat- ing turb id i ty currents in the ocean. This mecha- nism is favored because it requires no special condit ions in order to operate ; i t is a na tura l consequence of debris moving through water. The efficiency of this mechanism has not been quantified, bu t exper iments qual i ta t ively indi- cate t h a t i t can generate large tu rb id i ty cur- rents.
ACKNOWLEDGMENTS
This paper is based on par t of my Ph.D. thesis submi t t ed to Stanford Universi ty. Arvid M. Johnson very ably supervised my work. The project was supported by cont rac t no. 14-08- 0001-1084 from the Uni ted States Geological Survey. I am grateful to Parke D. Snavely, Jr., Mar ine Geology Section, USGS, for his advice and encouragement . Arnold H. Bourns, Richard V. Fisher, and Dale C. Krause reviewed the manuscr ip t and suggested many improvements .
REFERENCES
ALLEN, J. R. I.., 1971, Mixing at turbidity current heads and its geological implications: Jour. Sed. Petrology, v. 41, p. 97-113.
BABBITT, H. E., and CALDWELL. D. H., 1939, Laminar flow of sludges in pipes with special reference to sewage sludge: lllinois Univ. Eng. Expt. Sta., Bull. 319, 59 p.
- - , 1940, Turbulent flow of sludges in pipes: Illinois Univ. Eng. Expt. Sta., Bull. 323, 41 p. BAGNOLD, R. A., 1956, The flow of eohesionless grains in fluids: Royal Soc. London Philos. Trails., v. 249,
p. 235-297. BELL, H. S., 1942, Density currents as agents for transporting sediments: Jour. Geology, v. 50, p. 512-547. BOUMA, A. H., 1962, Sedimentology of some flyseh deposits: Elsevier Publ. Co., Amsterdam, Netherlands,
168 p. . . . . . A N D S H E P A R D , F. P., 1964, Large rectangular cores from submarine canyons and fan valleys: Am. Assoc.
Petroleum Geologists Bull., v. 48, p. 225-231. BttlGGS, L. I., and MIODLETON, G. V., 1965, Hydromechanical principles of sediment structure formation, in
Primary sedimentary structures and their hydrodynamic interpretation: Soc. Econ. Paleontologists and Mineralogists Spec. Pub. 12, p. 5-16.
CHOW, V T., 1959, Open-channel hydraulics: McGraw-Hill Book Co., New York, N.Y. 680 p. C~OWELL, J. C., 1957, Origin of pebbly mudstones: Geol. Soc. America Bull., v. 68, p. 993-1009. CURRY, R. R.. 1966, Observation of alpine mudflows in the Tenmile Range, central Colorado: Geol. Soc.
America Bull., v. 77, p. 771-776. EINSTEIN, H. A., 1941, The viscosity of highly concentrated underflows and its influence on mixing: Am.
Geophys. Union Trans., v. 22, p. 597-603. EMERY, K. O., 1958, Southern California basins, in Habitat of Oil: Am. Assoc. Petroleum Geologists, Tulsa,
Okla. p. 955-967. ERicsoN, D. B., Ewn,,lG, MAURICE, ANn Heezen, B. C., 1952, Turbidity currents and sediments in North
Atlantic: Am. Assoc. Petroleum Geologists Bull., v. 36, p. 489-511.

X[Yt~. . IQUE()US DEBRIS" I.V G E . V E R . - t T I N G T U R B I D I T Y C~:RNP.'A'T.7 793
, EWlNO, MAURICE, WOLLIN, GOESTA, AND HEEZEN, B. C., 1961, Atlantic deep-sea sediment cores: Geol. Soc. America Bull., v. 72, p. 193-286.
EWlNG, MAURICE, ERICSON, n . B., AND HEEZEN, B. C., 1958, Sediments and topography of the Gulf of Mexico, in Habi ta t of Oil: Am. Assoc. Petroleum Geologists Tulsa, Okla. p. 995-1053.
GLEASON, C. H., AND AMIDON, R. E., 1941, Landslide and mudflow, Wrightwood, California: California Forest and Range Expt. Sta., Unpub. R e p t , p. 1-7.
GREGORY, W. B., 1927, Pumping clay slurry through a four-inch pipe: Mech. Eng., v. 49. p. 609-616. HAMPTON, M. A., 1970, Subaqueous debris flow and generation of turbidity currents: Unpub. P h . D thesis,
Stanford University, Stanford, Calif., 180 p. - - - - , 1972, Transport of ocean sediments by debris flow (abs.) : Am. Assoc. Petroleum Geologists Bull., v. 56,
p. 622. HEDSTRG~I, B. O. A., 1952, Flow of plastic materials in pipes: Indus. and Eng. Chem., v. 44, p. 651-656. HEEZEN, B. C., AND EWING, MAERICE, 1952, Tnrbidi ty currents and submarine s lumps and the Grand Banks
ear thquake: Am. Jour. Sci., v. 250, p. 849-873. , 1955, Orleansville ear thquake and turbidity currents: Am. Assoc. Petroleum Geologists Bull., v. 39,
p. 2505-2514. ]PPEN, m. T., AND HARLEMAN, D. R. F., 1952, Steady-state characteristics of subsurface flow: U.S. Natl. Bur.
Standards Circ. 521, p. 80-93. JAHNS, R. H., 1949, Desert Floods: Eng. and Sci. p. 10-14. JOHNSON, A. M., 1965, A model for debris flow: Unpub. Ph.D. thesis, The Pennsylvania State Univ., Uni-
versity Park, Pa., 305 p. - - - - , 1970, Physical processes in geology: Freeman, Cooper, and Co., San Francisco, Calif., 571 p. KENNEDY, J. F., 1969, The formation of sediment ripples, dunes, and ant idunes: l"n Sears, W. R., and van Dyke,
Milton, (eds.), Annual review of fluid mechanics, Palo Alto, Calif., Ann. Reviews, Inc., p. 147-168. KEULEt;AN, G. H., 1944, Laminar flow at the interface of two liquids: U.S. Natl. Bur. Standards Jour. Research,
v. 32, p. 303-327. , 1949, Interfacial instability and mixing in stratified flows: U.S. Natl. Standards Jonr. Research, v. 43,
p. 487--500. ]<I'ENEN, PH. H., 1951, Properties of turbidity currents of high density, '/n Turbidi ty currents and the trans-
portation of corase sediments to deep water: Soc. Econ. Paleontologists and Mineralogists Spec. Pub. 2, p. 14 33.
- - , 1952, Est imated size of the Grand Banks turbidity currertt: Am. Jour. Sci., v. 250, p. 874-884. Mv.yARo, I1. W., 1964, Marine geology of the Pacific: McGraw-Hill Book Co., New York, N.Y., 271 p. MIDDLETON, G. V.. 1966a, Experiments on densi ty and turbidity currents 1. Motion of the head: Canadian
Jour. Earth Sci., v. 3, p. 523-546. , 1966b, Experiments on density and turbidity currents If. Uniform flow of densi ty currents: Canadiau
Jour. Earth Sci. v. 3, p. 627-637. MORI;ENSTERN, N. R., 1967, Submarine s lumping and the initiation of turbidity currents; In Richards, A. (ed.),
Marine Geotechniqne, p. 189-220. I¥:rERSON, G. L., 1965, Implications of two Cretaceous mass transport deposits, Sacramento Valley, Cali-
fornia: Jour. 5ed. Petrology, v. 35. p. 401-407. RIe]INF. R. NIARKUS, 1960, Deformation, strain, and f low--an e lementary introdtmtion to rheology: Interscience
Publishers, New York, N.Y., 347 p ]{I,:YNOLDS, OSBORNE, 1883, An experimental investigation of the circumstances which determine whether the
motion of water shall be direct or sinuous, and of the law of resistance in parallel channels: Royal Soc. London Philos. Trans., v. 174, p. 935-982.
~;CHt.ICHTIXG, H., 1960, Boundary laver theory: McGraw-Hill Book Co., New York, N. Y. 647 p. SHEPARD, E. P.. 1963. Submarine'gedlogy: Harper & Row., New York, N. Y., 557 p. SHARP. R. P., AND NOBLES, L. H., 1953, Mudflow of I941 at Wrlghtwood, Southern California: Geol. Scc.
America Bull., v. 64, p. 547-560. "l'l.:l~zA~;Itl. KARL, 1956, Varieties of submarine slope failures: Eighth Texas Conf. of Soil Mech. and Founda-
tion En~. Proc., Spec. Pub. 29, Bur. Eng. Research, Texas Univ. VALLENTINE. H. R., 1967, Applied hydrodynamics: Plenum Press, New York, N.Y., 326 p. VAN ANDEL, T. H., AND t'~OMAR, P. D., 1969, Ponded sediments of the Mid-Atlantic Ridge between 220 and 23 °
North latitude: Geol. Soc. America Bull., v. 80, p. 1163-1190. VA5. DER KNAPP, \V., AND EIJPE, R., 1968, Some experiments on the genesis of turbidity currents: Sedimentol-
ogy, v. 11, p. 115-124.