Embed Size (px)
Citation preview
The Role of Habitat Structure Abstract.-Microha bitat structure influences population density more than other demographic
in Organizing Small Mammal variables such as age and sex cornposition Microhabitat heterogeneity, or quantitative
Populations and Communities1
Gregory H. Adler2
Environmental heterogeneity has maintained a position of prominence in theoretical population and com- munity ecology (reviewed by Levin 1976, Wiens 1976, and Wiens et al. 1986). Heterogeneity allows organ- isms to select different habitats, which subsequently can have pro- found consequences for the organiza- tion of populations and communities. Environmental heterogeneity can be studied, both theoretically and em- pirically, at different scales. Conclu- sions based on the study of habitat structure may differ widely depend- ing upon the scale of structure exam- ined. The scale of environmental sub- division can be viewed as occurring along various continua, e.g., from the area occupied by a single individual to a biogeographic or continental area (Wiens et al. 1986), or from mi- crohabitat to macrohabitat.
In this paper, I concentrate on the microhabitat to macrohabitat scale. I define microhabitat as physical habi- tat characteristics likely to vary over the home range of a single individual (e.g., the number of herbaceous stems within a circumscribed area) and macrohabitat as the major habi-
'Paper presented at symposium, Man- agement of Amphibians, Reptiles, and Small Mammals in North America. (Flag- staff. AZ, July 19-2 1 , 1988.)
2Gregory H. Adler is Research Fellow in Population Sciences, Department of Popu- lation Sciences, Schod of Public Health, Harvard University, 665 Huntington Avenue, Boston, MA 02 1 15.
variation in microhabitat structure, apparently has little influence on phenomena such as population stability. Scale mediates effects of habitat structure and heterogeneity on population and community organization. I suggest that microhabitat structure influences density more than other aspects of demography, whereas macrohabitat structure and heterogeneity are more important in influencing population stability, demography, and community structure.
tat type where an entire population may be found (e.g., grassy field or deciduous woodland in the case of small mammals). Microhabitat struc- ture therefore can vary substantially within a single macrohabitat.
I summarize results from a series of long-term studies on the role of habitat structure in organizing small mammal populations and c o k u n i - ties that I conducted in eastern Mas- sachusetts. These studies were de- signed to examine (1) habitat associa- tions and habitat selection and the roles of intra- and interspecific inter- actions in affecting habitat utiliza- tion, and (2) the influence of habitat structure on density and demogra- phy. In these studies, I focus primar- ily on microhabitat structure, and I develop a conceptual scheme which shows how microhabitat and mac- rohabitat structure organize small mammal populations and communi- ties.
STUDY SITES AND GENERAL METHODS
Study Sites
The long-term studies were con- ducted at three sites in eastern Mas- sachusetts: Broadmoor/Little Pond Audubon Sanctuary, South Natick; Great Island, near West Yarrnouth; and the University of Massachusetts Nantucket Field Station, Nantucket. Sampling areas within each study
site were confined to a 300-ha area and were exposed to the same cli- mate and the same predators, com- peti tors, and parasites.
Broadmoor consists of a mosaic of grassy fields separated by mixed de- ciduous-coniferous woodland. Sam- pling at Broadmoor was confined to the fields, which were dominated by the grasses Agropyron regens and Poa pratensis. Other herbaceous and woody plants, including goldenrod (Solidago spp.), milkweed (Asclepias syriaca), poison ivy (Rh us radicand, and several species of deciduous tree saplings, were much less prevalent.
Great Island is a 240-ha island connected to mainland Cape Cod by a causeway. The island is dominated by deciduous and coniferous wood- land but has structurally simpler habitat along the shore. This shore- line habitat consists primarily of beach grass (Ammophila breviligulata), with patches of poison ivy, Virginia creeper (Parfhenocissus quinquefolia), bayberry (Myrica pensylvanica), rose (Rosa carolina), and juniper (Juniperus virginiana).
Nantucket Island (ca. 12,300 ha and lying approximately 30 km off the coast of Cape Cod) has large ar- eas of low, dense woody growth (heath) where small mammals were sampled. Heath at the study site was composed primarily of rose and bay- berry, with patches of goldenrod and other herbaceous plants and grasses interspersed within the brush. Scat- tered juniper trees also were present.

Sampling Procedures
I sampled small mammals at each sbdy site by monthly Iive-trapping with Longworth live-traps for ap- proximately 4 to 5 years. At each study site, I monitored two 0.4-ha grids located in grassy or brushy habitat. One grid served as a control in which all small mammals were individually marked by ear-tags (ro- dents) or toe-clips (insectivores). The other grid, located 30.4 rn from the conirol and situated in csaagigpous habitat, served as an experimental grid from which all small m a m a k were removed permanently upon first capture (Adler 1985). All small mammals captured on this grid after the initial removal period were con- sidered colonists. 1 also sampled small mammals on 4 nearby trapping plots which also were located in similar macrohabitat but covered a range of microhabitats. Each plot consisted of two parallel traplines located 30.4 m apart. Each trapline was 15 stations long at Broadmoor (except on one plot where both tra- plines were 12 stations long) and on Nantucket and 20 stations long on Great Island. These plots were trapped on a rotation basis (AdPer 1987). On Great Island, an additional 4 control grids were monitored monthly from April through Septem- ber for five years (Adler and Wilson 1987). These grids were not confined to structurally simple macrohabib ts but ranged from grassland to mature woodland habitats.
Grid 1 was located at the edge of a stand of pitch pine. (Pinus rigida), white oak (Quercus alba), and black oak ((2. velictina?. Dense brushy understory covering a large portion sf the grid consisted of bayberry, huckleberry (Gaylussacia bcrccata), and inkberry holly (Ilex glabra). Low-lying areas sf the grid were damp and har- bored large cranberry (Vaccinium macrocarpon) and sundew (Drosera spp.). Very little herbaceous vegeta- tion was present. Grid 2 also was lo- cated at the edge of a pitch pine,
white oak, and black oak w d l a r r d brushy, treeless portions of the grid. but was more elevated and ccpnse- Grid 3 was ~ocated within a white quently drier. A dense brushy under- oak and black oak woodland. A story cmsisl'ed of bayberry, p i son dense shrub cover of blueberry, ivy, and c o r n o n g ~ w ~ ~ b r i e r !Snrilux 'marlberry (Arctostaphylos uvra-ursi), rotundifilia). Crass was present in the common greenbrier, and bullbrier

greenbrier (S . born-nod was present, the cornpanior, control for the experi- along with bracken fern (Ptere'ditkm mental grid and was located in dense aquiiiniurn). Grid 4 was located on beach grass containing scattered Pine Island, a 7-ha islet 37 rn from patches of bay&~;y, juniper, and poi- Great Island and co~ulwted to the son ivv.
d
latter by a narrow sandy spit. White F sampled vegetakon structure at oak and black oak formed a canopy every trip station on all grids a d over much of the grid, and a dense plots by measuring 23 habitat vari- woody understory of bayberry and ables related to plant structure and other shrubs also was present. Densc species richness (table 1). Two addi- beach grass was preLsent in the bee- tional habitat vari sbles describing less portions of the grid. Grid 5 was canopy structure were included in
the analysis on Great Island control gids (table 1 ). Measurement proce- dures were given by Adler (1985) and Adler and Wilson ( 1987).
Ba Analysis
I relied extensively upon principal components analysis CPCA) and dis- criminant function analysis (DFA) in order to uncover the structure of complex and temporally variable small mammal populations and their relationships to habitat structure. Specifically, my aims were to (1) re- duce the number of habitat dimen- sions, (2) derive a quantitative meas- ure of habitat heterogeneity, (3) quantify patterns of habitat utiliza- tion, (4) combine covarying demo- graphic traits into single variables, and 353 derive indices of demo- graphic variability.
In these studies, H recognized two related descriptors of microhabitat structure. H defined a microhabitat structure-diversi t); variable or gradi- ent as a characteristic that described the physical structure of the mi- crohabitat and that varied in magni- tude along a continuum. 1 defined microhabitat heterogeneity as a quantitative measure of horizontal variation in microhabitat ckaracteris- tics (August 1983, Adler 1987).
I subjected the habitat data rneas- ured at each trap station to PCA to reduce the number of habitat vari- ables. At each site, I conducted two PCks of the 25 variables, one with control and experimental grids com- bined and one with the 4 trapping plots cornbind. I also conducted a PCA of 24 habitat variables for all five control. grids on Great Island combined. HBl(dO was eliminated from this analysis because only one nonzero value was recorded on the five grids.
Each principal component (PC) with an eigenvalue greater than 1.0 was retained for further analysis as a new habitat variable. Principal com- ponents derived h m PCAs of grid
and plot data were quite similar within each site, based upon factor loadings on the original habitat vari- ables (Adler 1985,1987). At Broad- moor, five PCs were retained for analysis from both grid and plot data, whereas six were retained from analysis of grid data; four PCs were interpreted similarly in both data sets. PCAs of Nantucket grid and plot data both yielded seven retain- able PCs, three of which could be in- terpreted similarly between the two data sets. The PCA of habitat data from the five control grids on Great Island yielded seven PCs.
I computed a microhabitat hetero- geneity index for each of the four trapping plots at the three study sites and for each of the five control grids on Great Island (Adler 1987, Adler and Wilson 1987). This index was based on the supposition that the standard deviation of the within-plot or within-grid mean vector of a PC described the variability of a mi- crohabitat gradient on a given plot or grid. Since each successive PC con- tributed less to the total variance in
habitat data, I adjusted for each PC's contribution to the total variance by multiplying the factor scores by the square root of that PC's eigenvalue.
I examined capture data in rela- tion to habitat structure at both the level of individual trap stations (habitat association and selection) and at the level of a grid or plot (de- mography). I used mu1 tiple linear regression and residuals analysis to relate these small mammal (depend- ent) variables to habitat (independ- ent) variables. More complete de- scriptions of analytical techniques are given in each section below, and a brief outline of the sampling design is given in table 2.
SPECIES COMPOSITION
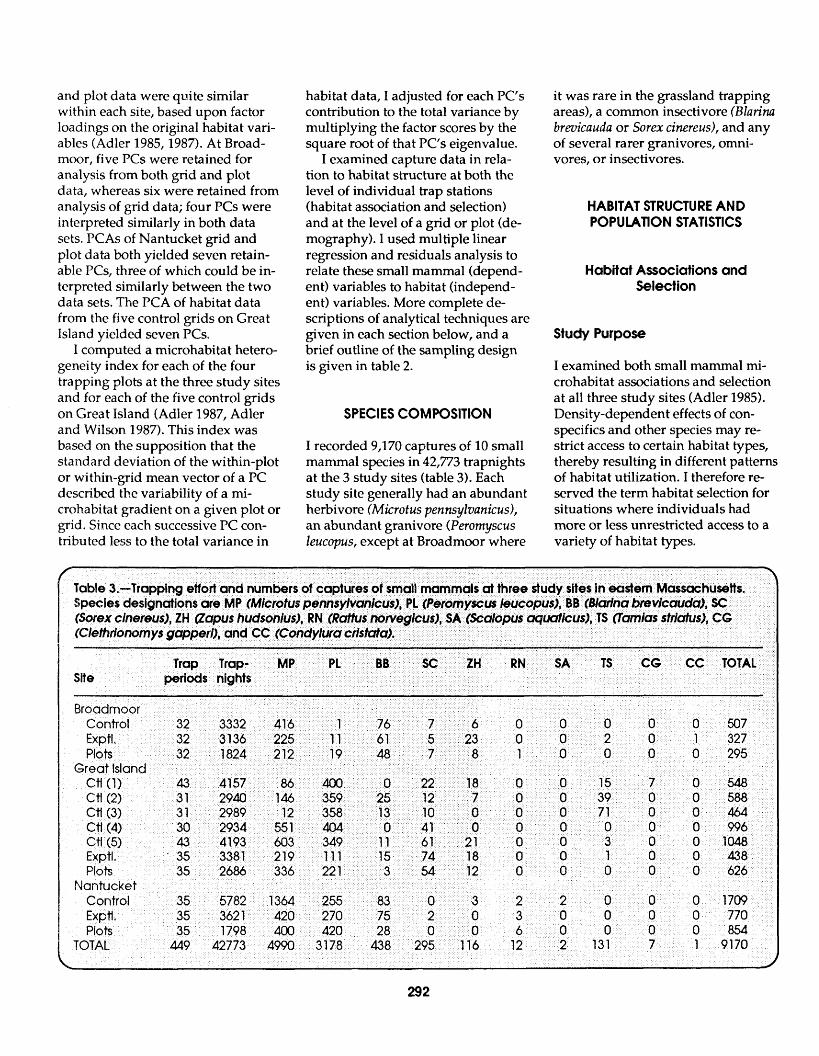
I recorded 9,170 captures of 10 small mammal species in 42,773 trapnights at the 3 study sites (table 3). Each study site generally had an abundant herbivore (Microtus pennsylvanicus), an abundant granivore (Peromyscus leucopus, except at Broadmoor where
it was rare in the grassland trapping areas), a common insectivore (Blarina brevicauda or Sorex cinereus), and any of several rarer granivores, omni- vores, or insectivores.
HABITAT STRUCTURE AND POPULATION STATISTICS
Habitat Associations and Selection
Study Purpose
I examined both small mammal mi- crohabitat associations and selection at all three study sites (Adler 1985). Density-dependent effects of con- specifics and other species may re- strict access to certain habitat types, thereby resulting in different patterns of habitat utilization. I therefore re- served the term habitat selection for situations where individuals had more or less unrestricted access to a variety of habitat types.
Analytical Approach
I defined an association as a statisti- cal relationship between the numbers of captures of a species at trap sta- tions and a quantitative measure of microhabitat structure. To determine these relationships, I regressed the total number of captures of a species at each control grid trap station on factor scores of each PC. The experi- mental grid represented an area where densities were continually being reduced and vacant microhabi- tats were more often available to colonizing individuals.
To determine differences in mi- crohabitat associations between con- trol and experimental grids, I in- cluded a dummy variable coding for grid (control or experimental) and habitat variable x grid interaction terms (Adler 1985).
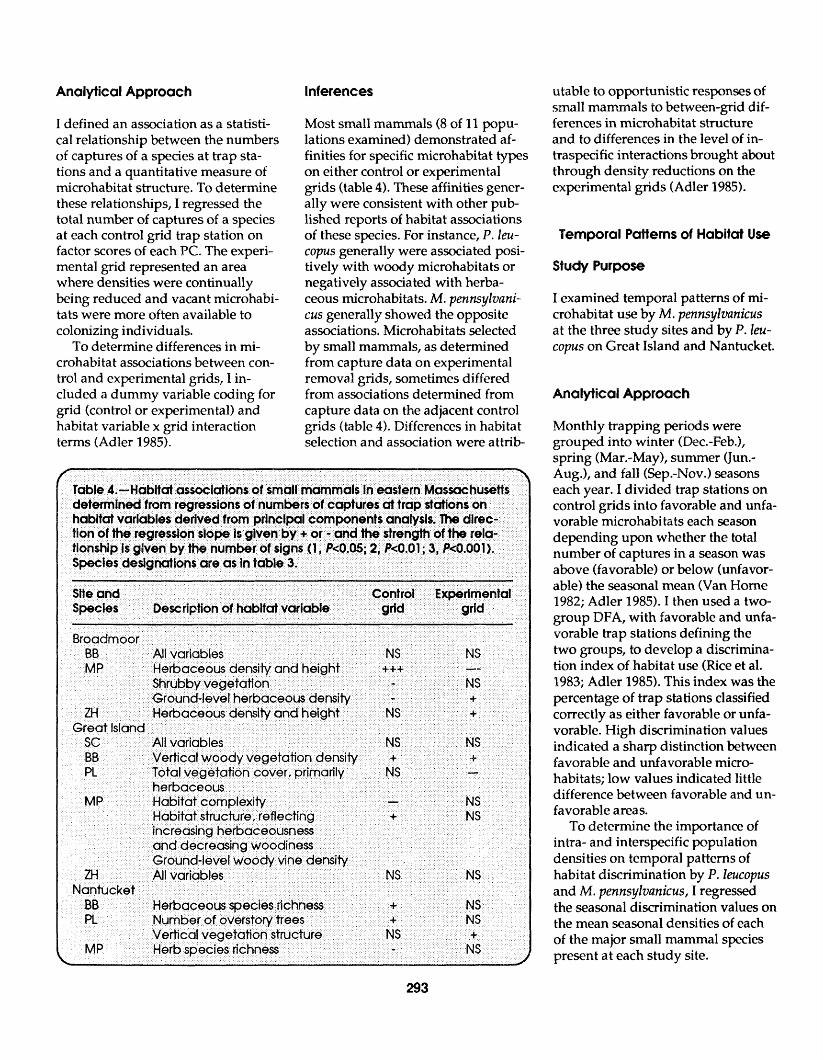
Inferences
Most small mammals (8 of I I popu- lations examined) demonstrated af- finities for specific microhabitat types on either control or experimental grids (table 4). These affinities gener- ally were consistent with other pub- lished reports of habitat associations of these species. For instance, P. leu- copus generally were associated posi- tively with woody microhabita ts or negatively associated with herba- ceous microhabitats. M. pennsylwani- cus generally showed the opposite associations. Microhabitats selected by small mammals, as determined from capture data on experimental removal grids, sometimes differed from associations determined from capture data on the adjacent control grids (table 4). Differences in habitat selection and association were attrib-
utable to opportunistic responses of small mammals to between-grid dif- ferences in microhabitat structure and to differences in the level of in- traspecific interactions brought about through density reductions on the experimental grids (Adler 1985).
Temporal Patterns of Habitat Use
Study Purpose
I examined temporal patterns of mi- crohabitat use by M. pennsylwanicus at the three study sites and by P. leu- copus on Great Island and Nantucket.
AnalyticaP Approach
Monthly trapping periods were grouped into winter (1Dec.-Feb.), spring (Mar.-May), summer gun.- Aug.), and fall (Sep.-Nov.) seasons each year. I divided trap stations on control grids into favorable and unfa- vorable microhabitats each season depending upon whether the total number of captures in a season was above (favorable) or below (unfavor- able) the seasonal mean (Van Home 1982; Adler 1985). 1 then used a two- group DFA, with favorable and unfa- vorable trap stations defining the two groups, to develop a discrirnina- tion index of habitat use (Rice et al. 1983; Adler 1985). This index was the percentage of trap stations classified correctly as either favorable or unfa- vorable. High discrimination values indicated a sharp distinction between favorable and unfavorable micro- habitats; low values indicated little difference between favorable and un- favorable areas.
To determine the importance of intra- and interspecific population densities on temporal pa ttems of habitat discrimination by P. leucopus and M. pennsylwanicus, I regressed the seasonal discrimination values on the mean seasonal densities of each of the major small mammal species present at each study site.
inferences
In the case of M. pennsylvanicus, den- sity and discrimination were nega- tively related at Broadmoor and positively related on Great Island. The unexpected positive relationship on Great Island could be explained by the distribution of captures over the grid; 17 capture stations had less than two captures during the entire study and were in a sparsely vege- tated area. As density increased, the remaining 32 trap stations became increasingly utilized. The distinction between favorable and unfavorable microhabitats increasingly became a distinction between unoccupied, sparsely vegetated stations and occu- pied, densely vegetated stations.
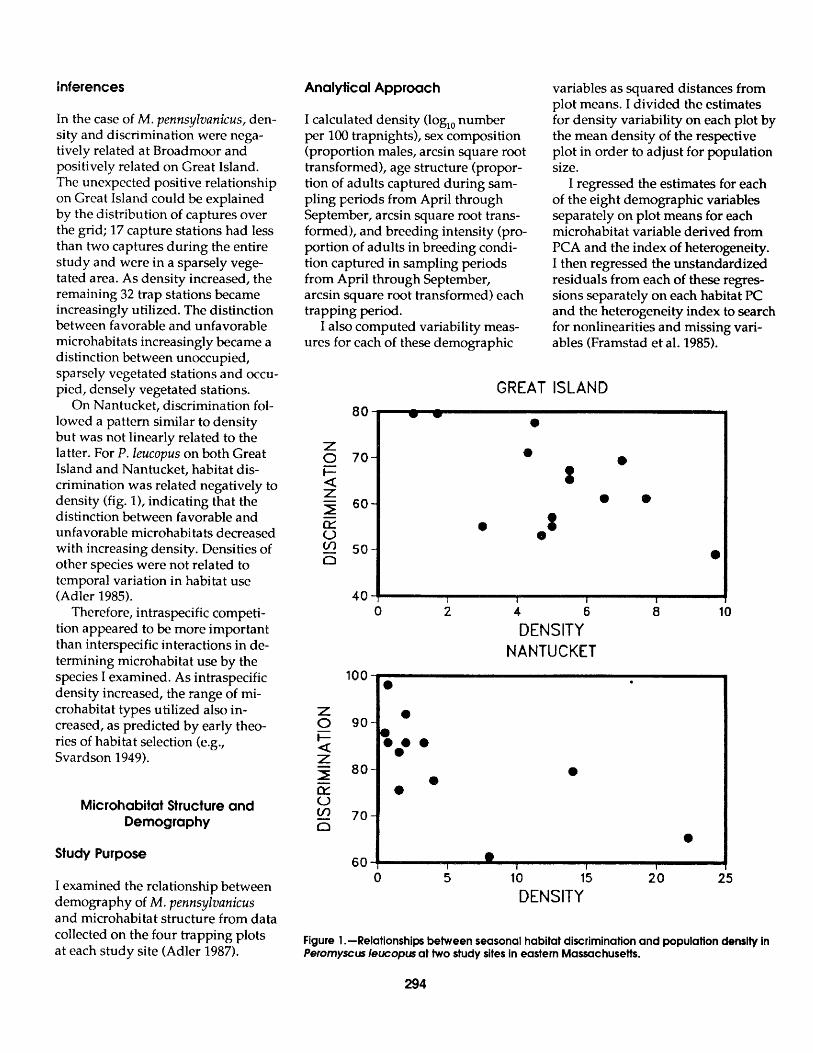
On Nantucket, discrimination fol- lowed a pattern similar to density but was not linearly related to the latter. For P. lsucopus on both Great Island and Nantucket, habitat dis- crimination was related negatively to density (fig. I), indicating that the distinction between favorable and unfavorable microhabitats decreased with increasing density. Densities of other species were not related to temporal variation in habitat use (Adler 1985).
Therefore, intraspecific competi- tion appeared to be more important than interspecific interactions in de- termining microhabitat use by the species I examined. As intraspecific density increased, the range of mi- crohabitat types utilized also in- creased, as predicted by early t h e ries of habitat selection (e.g., Svardson 1949).
Microhabitat Structure and Demography
Study Purpose
I examined the relationship between demography of M. pennsylvanicus and microhabitat structure from data collected on the four trapping plots at each study site (Adler 1987).
Analytical Approach
I calculated density (log,, number per 100 trapnights), sex composition (proportion males, arcsin square root transformed), age structure (propor- tion of adults captured during sam- pling periods from April through September, arcsin square root trans- formed), and breeding intensity (pro- portion of adults in breeding condi- tion captured in sampling periods from April through September, arcsin square root transformed) each trapping period.
I also computed variability meas- ures for each of these demographic
variables as squared distances from plot means. I divided the estimates for density variability on each plot by the mean density of the respective plot in order to adjust for population size.
I regressed the estimates for each of the eight demographic variables separately on plot means for each microhabitat variable derived from PCA and the index of heterogeneity. I then regressed the unstandardized residuals from each of these regres- sions separately on each habitat PC and the heterogeneity index to search for nonlineari ties and missing vari- ables (Framstad et al. 1985).
GREAT ISLAND
DENSITY NANTUCKET
0 5 10 15 20 25 DENSITY
Figure 1 .-Relationships between seasonal habitat discrimination and population density in Peromyxus leucopus at two study sites in eastern Massachusetts.

Inferences
Densities of M. pennsylvanicus and P. leucupus were ordered linearly along microhabitat gradients (Adler 1987), consistent with patterns of mi- crohabita t associations and selection in these two species (table 5). In general, M. pennsylvanicus densities were higher on plots with more her- baceous and grassy cover or less woody cover. Nantucket was excep- tional, however, with M. pennsylvani- cus densities increasing along gradi- ents of increasing woody growth and shrub species richness. I captured large numbers of this vole in dense heath with little or no herbaceous vegetation.
Perumyscus leucopus densities on Great Island could not be related to microhabi tat structure, probably be- cause of the generalist nature of this mouse relative to the breadth of mi- crohabitats sampled. Indeed, when sampling areas included other mi- crohabitats, density could be related to overall microhabitat structure (see below). P. leucopus densities on Nan- tucket increased with increasing shrub species richness (table 5). Den- sities of both species were more vari-
able in poorer habitats. Microhabitat structure was a poor predictor of other aspects of demography such as age and sex composition. However, variability in demographic structure often was greater in low-density habitats. While some of the variabil- ity in density and demography may have been due to statistical depend- ence on population size (i.e., greater sampling error at small population sizes), biological effects (e.g.,response to environmental fluc- tuations) also must have been impor- tant. More favorable microhabitats should have maintained a more stable composition over time due to greater intraspecific interactions, whereas poorer microhabitats should have contained a more unstable as- semblage of predominantly transient and subordinate individuals due to spillover during periods of high den- sity (Adler 1987). In contrast to the importance of microhabi ta t gradi- ents, the quantitative measure of mi- crohabitat heterogeneity generally was unrelated to demographic phe- nomena. In only one case did mi- crohabitat heterogeneity explain vari- ation in demography better than any structure-diversity variable.
Macrohabitat Structure and Demography
Study Purpose
I further examined the relationship between demography of P. leucopus and microhabitat structure across macrohabitats. P. leucopus is a habitat generalist which occurs in habitats ranging from grassland to mature deciduous and coniferous forests in southeastern Massachusetts.
Analytical Approach
For this purpose, data from the five control grids on Great Island were analyzed (Adler and Wilson 1987). Monthly trapping data were ana- lyzed with respect to 10 demo- graphic variables. Grid means of density (log,, minimum number known alive), adult male body mass, and observed range length (ORL, the maximum linear distance between capture points of an individual, Stickel 1954) were compared using Tukey's multiple comparisons test. Mean male and female ORLs were compared on each grid using t-tests.
Contingency table analysis was used to compare age structure (pro- portion adult), adult survival (stan- dardized 14-day rates), sex composi- tion (proportion of mice tagged that were males), adult residence rates (proportions of adults captured in at least two trapping periods), overwin- ter residence (proportions of mice present during Sep. and surviving to the subsequent Apr.), the propr- tions of adults that were reproduc- tively active, and the proportions of young mice (mice with some grey pelage remaining) that were repro- ductively active. These 10 variables were examined for intersex differ- ences within a grid (except sex com- position) and for intergrid differ- ences.
To examine temporal dynamics of demography, monthly trapping data were grouped into early summer

(Apr.-Jun.) and late sum~ner (Jul.- Sep.) seasons. The following demo- graphic variables were estimated on each grid during each season: density (mean log,, minimum number known alive), proportions of males and of females that were adults, pro- portion of males, mean adult male body mass, proportions of adult males and of adult females breeding, and survival rates of adult males and of adult females (weighted mean 14- day rates). Variables expressed as proportions were arcsin quare root transformed.
Many rodent population parame- ters are known to covary (e.g., Schad- fer and Tamarin 1973). Accordingly, a PCA of the eight variables was exe- cuted in order to include covarying parameters as single demographic variables; four PCs with eigenvalues greater than 1.0 were retained for further analysis.
These PCs were correlated with (Udensity and adult survival, (2)adult female breeding activity, (3)adult male breeding activity, and (4)the proportion of males. Variabil- ity indices of each of these PCs were calculated each season for each grid as squared distances from grid means (Adler and Wilson 1987). A measure of overall demographic variability was calculated for each grid each season as squared dis- tances of the factor scores from the mean factor score, summed over the four PCs.
Factor scores within each PC were multiplied by the square root of that PC's eigenvalue in order to account for the unequal contributions to overall variance of each PC (Adler and Wilson 1987). This method al- lowed variables with different scales of measurement to be included to- gether without further scaling or weighting. Seasonal estimates of each of the PCA-derived demographic variables and their variability esti- mates were regressed separately on each of the PCB-derived microhabi- tat variables and the index of hetero- geneity.
Inferences
Statistical tests which were signifi- cant at H34I.05 are qualitatively sum- marized in table 6. Grid means of the first three demographic PCs revealed thee demographic groups. Grids 1 and 5 were located farthest from any adjacent grid in three-dimensional space, whereas grids 2,3, and 4 were clustered more tightly together with respect to demographic structure (table 7). Grid 1 was characterized by low density and survival, a Iow pro- portion of females, low breeding in- tensity, and high demographic vari- ability. Grid 5 was characterized by low density and survival, a high pro- portion of females, moderate breed- ing intensity, and high demographic variability. Grids 2,3, and 4 were characterized by high density and survival, low lo m erate proportion of females, moderate to high breed- ing intensity, and low demographic variability. Two low-density groups (represented by grid 1 and grid 5) and one high-density group (repre- sented by grids 1,2, and 3) therefore
were evident. The low-density groups were more variable in terms of each of the demographic PCs and in overall demographic structure. In general, density, survival, and bred- ing activity increased along gradients of increasing woodiness or decreas- ing herbaceousness, whereas demo- graphic variability decreased along these gradients (table 8).
SYNTHESIS
I found microhabi tat structure to be a potentially important force in organ- izing small mammal populations, particularly in reiation to associa- tions and densities. Small mammals generally were associated with par- ticular rnicrohabitats, as revealed by analysis of single trap stations. How- ever, associations often differed be- tween control and experimental grids. I suggest that the small mam- mals I studied selected specific mi- crohabitats and were opportunistic in their responses to habitat not occu- pied by other individuals (as on the

experimental grids). Since most small mammals that I studied were mi- crohabi tat selectors, microhabitat structure therefore was a crucial de- terminant of local community com- position. Furthermore, microhabi tat st~ucture also should have affected temporal variability of community structure since populations in low- density areas were more variable.
Affinities of each small mammal species for particular microhabitats resulted in density-habi tat relation- ships when averaged over a larger sampling area (grids or plots). Thus, small mammal densities generally could be related to microhabitat structure. Survival and breeding ac- tivity, which generally covary with density, also could be related to mi- crohabitat structure when sampling areas spanned macrohabitat bounda- ries. The importance of microhabitat structure in affecting other demo-
graphic characteristics such as sex composition and age structure was not as pronounced. Gradients of mi- crohabitat structure can be envi- sioned as comprising an environ- mental suitability gradient, with the endpoints being uninhabitable and optimal (where individual fitness is highest). Demographic characteris- tics then vary along this gradient of suitability and along other gradients. The gradient of suitability is corn- posed of factors related not only to habitat structure but also to focd re- sources and release from predation, competition, and parasitism. Density alone may not be a strong correlate of suitability (Van Home 19831, but density in concert with survival and breeding activity should increase along the gradient of suitability. By contrast, demographic variability should decrease along this gradient. Several habitat types may represent
similar csndi tiom of environmental suitability, particuIarEy for habitat gerwralists such as P~omyscus leu- copus. Therefore, it may be difficult to relate demography to microhabitat structure because similar demo- graphic structure may be found in different habitats (AdPes and Wilson 1987).
CQuantitaiive measures of habitat hc iurrpgemei ty generally were unre- la kcd to dern13g~aphic variables, in cun~trast to the mass of theory pre- dicting that heterogeneity promotes population stability (eg., den Bser 1968, Levins a969, Smith 1 972, Mayn- ard Sn~'e?h 2974, Steek 1974, Tanner 1975, Siesrseth 1977,1980, Lomnicki 1978,1980, de Jong 1979, Hassell 11981)). The contrast between my re- slal ts and theoretical predictions may be reconciled by introducing scale. My measures of heterogeneity were at the microhabitat level, whereas many models have implied mac- rohabi tat heterogeneity so that or- ganisms may disperse into a patch and establish a resident population (e.g., Levins 1969). Increasing the number of such patches increases the spatial heterogeneity sf an area, which then promotes population sta- bility. I suggest that microhabitat structure will affect density more than it will other demographic char- acteristics, whereas macrohabitat structure and heterogeneity will be more important in stabilizing popu- lations and in influencing demo- graphic structure (e.g., sex composi- tion and age structure).
My conclusions concerning the importance of habitat structure in organizing small mammal popula- tions and communities can be shown schematically (fig. 2). According to this scheme, microhabitat structure primarily affects habitat selection, density, and density variability (since density generally is related inversely to variability). Macrohabitat shuc- ture primarily affects population sta- bility (stability being enhanced by macrohabitat heterogeneity) and demographic structure. Habitat se-
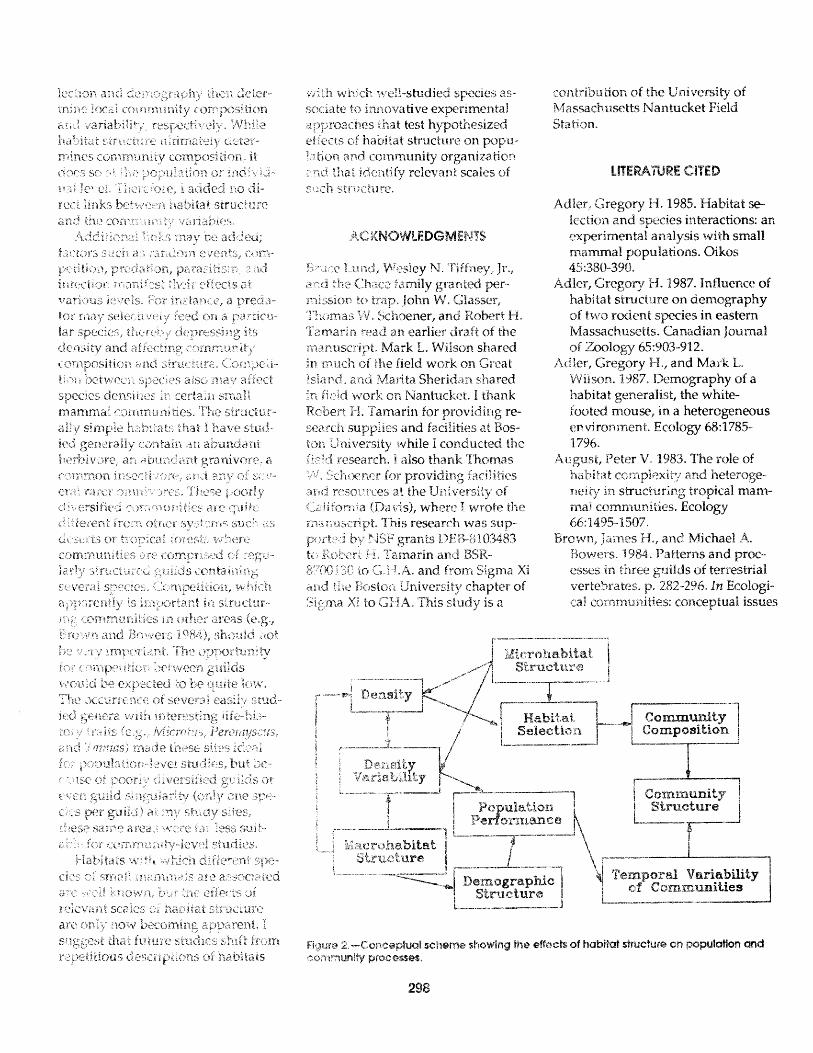
ef m a rodent species in eastern Tvfassacfi.use tis. Canadian Joasrnal
hdker, Gregory El., and Mark &. Wiison. N87, I,'remugrap&y of a habitat generalist, the white- footed mouse, in a heteragenwus enviro~-~~-tse~;f. Ecology 68:1785- %796..
August, Peter V. 1983. The role of h&i';~t cornpisxit;~ ; r ~ d hekeroge- wary in struct- iz~i~g tropical nmn-1-

and the evidence. Donald R. Strong, Jr., Daniel Simberloff, Lawrence G. Abele, and Anne B. Thistle, editors. Princeton Univer- sity Press, Princeton, NJ.
de Jong, G. 1979. The influence of the distribution of juveniles over patches of food on the dynamics of a population. Netherlands Jour- nal of Zoology 29:33-51.
den Boer, P. J. 1968. Spreading of risk and stabilization of animal num- bers and the heterogeneity of the environment: the problem of the persistence of sparse populations. p. 77-97. In Dynamics of Popula- tions. Proceedings of the Ad- vanced Study Institute on Dynam- ics and Numbers of Populations, Oosterbeek, 7-18 September 1970. P.J. den Boer and G. R. Gradwell, editors. Centre for Agricultural Publishing and Documentation (PUDOC), Wageningen, The Ne th- erlands.
Framstad, E., S. Engen, and N. Stenseth. 1985. Regression analy- sis, residual analysis, and missing variables in regression models. Oikos 44~319-323.
Hassell, Michael P. 1980. Some con- sequences of habitat heterogeneity for population dynamics. Oikos 35:150-160.
Levin, Simon A. 1976. Population dynamic models in heterogeneous environments. Annual Review of Ecology and Systematics 7:287- 310.
Levins, Richard. 1969. Some demo- graphic and genetic consequences of environmental heterogeneity for biological control. Bulletin of the Entomological Society of America 15:237-240.
Lornnicki, Adam. 1978. Individual differences between animals and the natural regulation of their numbers. Journal of Animal Ecol- ogy 47:461-475.
Lomnicki, Adam. 1980. Regulation of population density due to individ- ual differences and patchy envi- ronment. Oikos 35:285-193.
Maynard Smith, John. 1974. Models in ecology. Cambridge University Press, Cambridge, United King- dom.
Schaffer, William M., and Robert H. Tamarin. 1973. Changing repro- ductive rates and population cycles in lemmings and voles. Evolution 27:111-124.
Smith, Frank E. 1972. Spatial hetero- geneity, stability, and diversity in ecosystems. Transactions of the Connecticut Academy of Arts and Sciences 44:309-335.
Steele, John H. 1974. Spatial hetero- geneity and population stability. Nature 248:83.
Stenseth, N. C. 1977. On the impor- tance of spatio-temporal heteroge- neity for the population dynamics of rodents: towards a theoretical foundation of rodent control. Oikos 29545-552.
Stenseth, N. C. 1980. Spatial hetero- geneity and population stability: some evolutionary consequences. Oikos 35165-184.
Stickel, Lucille F. 1954. A comparison of certain methods of measuring ranges of small mammals. Journal of Mammalogy 35:l-15.
Svardson, Gunnar. 1949. Competi- tion and habitat selection in birds. Oikos 1:157-174.
Tanner, James T. 1975. The stability and the intrinsic growth rates of prey and predator populations. Ecology 56:855-867.
Van Horne, Beatrice. 1982. Niches of adult and juvenile deer mice (Pero- myscus maniculatus) in sera1 stages of coniferous forest. Ecology 63:992-lOO3.
Van Horne, Beatrice. 1983. Density as a misleading indicator of habitat quality. Journal of Wildlife Man- agement 47:893-901.
Wiens, John A. 1976. Population re- sponses to patchy environments. Annual Review of Ecology and Systematics 7231-120.
Wiens, John A, John F. Addicott, Ted J. Case, and Jared Diamond. 1986. Overview: the importance of spa- tial and temporal scale in ecology investigations. p.945-153. In Com- munity ecology. Jared Diamond and Ted. J. Case, editors. Harper and Row Publishers, New York, NY.