Embed Size (px)
Citation preview

NBER WORKING PAPER SERIES
THE ROLE OF EXPORTERS AND DOMESTIC PRODUCERS IN GVCS: EVIDENCE FOR BELGIUM BASED ON EXTENDED NATIONAL SUPPLY-AND-USE
TABLES INTEGRATED INTO A GLOBAL MULTIREGIONAL INPUT-OUTPUT TABLE
Bernhard MichelCaroline Hambÿe
Bart Hertveldt
Working Paper 25155http://www.nber.org/papers/w25155
NATIONAL BUREAU OF ECONOMIC RESEARCH1050 Massachusetts Avenue
Cambridge, MA 02138October 2018
The authors would like to thank Nadim Ahmad and Lucian Cernat as well as participants of the CRIW Conference on 'The Challenges of Globalization in the Measurement of National Accounts' for their comments that have helped to improve this article. We also acknowledge the invaluable support of Gaëtan De Menten, Geert Bryon and Alix Damman with the Larray module that they have created for Python and that was used for all calculations. The views expressed herein are those of the authors and do not necessarily reflect the views of the National Bureau of Economic Research.
NBER working papers are circulated for discussion and comment purposes. They have not been peer-reviewed or been subject to the review by the NBER Board of Directors that accompanies official NBER publications.
© 2018 by Bernhard Michel, Caroline Hambÿe, and Bart Hertveldt. All rights reserved. Short sections of text, not to exceed two paragraphs, may be quoted without explicit permission provided that full credit, including © notice, is given to the source.

The Role of Exporters and Domestic Producers in GVCs: Evidence for Belgium based on Extended National Supply-and-Use Tables Integrated into a Global Multiregional Input-Output Table Bernhard Michel, Caroline Hambÿe, and Bart HertveldtNBER Working Paper No. 25155October 2018JEL No. C67,D22,D57,F14,F15
ABSTRACT
For a finer analysis of global value chain integration and competitiveness, we develop and apply a method for a micro-data based breakdown of manufacturing industries in the 2010 Belgian supply-and-use tables into export-oriented and domestic market firms. The former are defined as those firms that export at least 25% of their turnover. We then derive export-heterogeneous national input-output tables which we integrate into a global table. Our analyses reveal that: a) export-oriented manufacturers have lower value-added in output shares and import proportionally more of the intermediates they use; b) exports of export-oriented manufacturers generate substantial value added in other Belgian firms, in particular providers of services; c) Belgium’s backward participation in global value chains is mainly due to export-oriented manufacturers and its forward participation is due to other firms, d) export-oriented manufacturers participate in value chains that comprise, on average, a greater number of upstream and downstream production stages and of which a greater share is located abroad.
Bernhard MichelBelgian Federal Planning Bureau Avenue des Arts 47-491000 [email protected]
Caroline HambÿeBelgian Federal Planning BureauAvenue des Arts 47-491000 [email protected]
Bart HertveldtBelgian Federal Planning BureauAvenue des Arts 47-491000 [email protected]

2
1. Introduction
Trade liberalisation and technological developments have largely contributed to increasing global eco-
nomic integration between the early 1990s and the late 2000s by reducing trade costs (transport costs,
communication costs…). This went hand in hand with profound changes in firm organisation that still
shape production processes today. Firms have re-organised their production processes by dividing them
into a growing number of separate stages and by outsourcing more and more of those production stages
to domestic and foreign suppliers. Due to these changes, value chains have become increasingly
fragmented and international or even global. Input-output tables and models are among the foremost
tools for the macro-economic analysis of value chains because they allow to map the full set of upstream
and downstream links in the chain. The calculation of multipliers and linkages based on input-output
tables yields information on how and to what extent industries are integrated into value chains. Such
analyses were traditionally based on national input-output tables and hence restricted to domestic value
chains in individual countries. However, the statistical development of global input-output tables over
the past decade has allowed to widen the scope and look at the integration of countries and industries
into global value chains (Koopman et al., 2010; Johnson and Noguera, 2012; Inomata, 2017; Los, 2017).
For input-output based analyses of value chains, fragmentation also poses a challenge in terms of the
granularity of underlying industry-level data. In input-output tables, firms are traditionally grouped into
industries according to the type of goods and services they produce. But within fragmented value chains
patterns of specialisation are likely to be related to other firm characteristics. Therefore, the analysis of
value creation in the context of fragmented value chains can be improved through a breakdown of
industries into different types of firms. As suggested in OECD (2015), it is desirable to disaggregate
industries in supply-and-use and input-output tables according to firm characteristics such as size,
ownership or exporter status because these characteristics may actually be the source of technological
differences between firms within industries that are traditionally defined in terms of product similarity.

3
The same point is made by Los (2017) arguing that “such differences can only be captured in value chain
trade indicators if each industry is split in two subindustries (p.317)”.
This insight has prompted several efforts to account for firm heterogeneity in supply-and-use tables
(SUT) and input-output tables (IOT), i.e. to generate so-called heterogeneous or extended tables. This
work was initially triggered by the desire to isolate firms engaged in processing trade as these firms differ
from other firms in terms of technology and import patterns. Processing traders were isolated in IOT for
China (Koopman et al., 2012; Ma et al., 2015) and firms operating under special export regimes were
separated out in Mexico’s IOT (De la Cruz et al., 2011). Both these disaggregations have also been
integrated into the OECD’s inter-country input-output tables (Yamano and Webb, 2018). In similar vein,
firms active in free trade zones have been isolated in tables for Costa Rica (Saborio, 2015). Beyond
special trade regimes, Ahmad et al. (2013) provide a proof of concept for a micro-data based split of
industries in Turkish IOT into exporters and other firms. Several other initiatives have been gathered in
the context of the OECD’s Expert Group on Extended Supply-and-Use Tables: they come, amongst
others, from Austria (disaggregation by exporter status and ownership, see Lais and Kolleritsch, 2017),
the Netherlands (disaggregation by size class, see Chong et al. 2017), and the US (disaggregation by
ownership, see Fetzer et al., 2018). Finally, Piacentini and Fortanier (2015) and Cadestin et al. (2018)
introduce firm heterogeneity into multi-country input-output tables in terms of firm size and ownership.
They do so in a proportional way based on aggregated international firm-level databases.
In this work, we break down manufacturing industries in the 2010 Belgian SUT and IOT into firms that
are export-oriented and firms that mainly serve the domestic market. For this purpose, we use the full set
of individual firm-level data sources that serve for the construction of Belgium’s official SUT and IOT
for 2010. The resulting export-heterogeneous tables allow us to test for differences in input structures
and import patterns of export-oriented firms and other firms, and to analyse their respective integration
into domestic value chains based on input-output multipliers and linkages as defined in Miller and Blair
(2009) and Hambÿe (2012). We also compare our results with those for homogeneous industries derived

4
from the official 2010 Belgian IOT to show that accounting for export heterogeneity in those tables yields
important new insights. Moreover, we integrate the export-heterogeneous Belgian IOT into the global
tables of the World Input-Output Database (WIOD) to determine how export-oriented and domestic
market manufacturing firms contribute to Belgium’s participation and position in global value chains.
The analysis of contributions to value creation based on data disaggregated along these lines provides a
clearer picture of the sources of a country’s competitiveness.
The novelty of our approach is twofold: the estimation of the industry-level output, input and import
structures in the exporter heterogeneous SUT and IOT are data-based rather than just proportional as in
most prior contributions, and the integration of the Belgian tables into the global table is such that these
Belgian data are not modified. Furthermore, as globalisation has become a major challenge in the
measurement of national accounts for individual countries, we also see this work as a contribution to
determining whether the national accounts – which officially comprise SUT and IOT – can accommodate
recent findings from the academic literature on international trade. Analyses of the characteristics of
exporters based on firm-level data have indeed shown that exporters are different from domestic firms in
terms of production technology. Exporters are not only bigger and more productive (Melitz, 2003), but
they also import more of the intermediates they use (Bas, 2009).
This article is organised as follows. We start off by providing details on constructing export-
heterogeneous supply-and-use and input-output tables for Belgium in section 2. This includes
explanations on how we have disaggregated manufacturing industries in Belgian supply-and-use tables,
derived national heterogeneous input-output tables and integrated them into the global input-output table
of the WIOD project. In section 3, we analyse differences in input structures between manufacturing
exporters and non-exporters and take a look at their integration into both domestic and global value
chains. Finally, we draw conclusions in section 4.

5
2. Export heterogeneity in supply-and-use and input-output tables: sources and data
construction
Supply-and-use tables (SUT) are an integral part of national accounts (NA) and provide detailed
information about economic flows in monetary terms: they describe production processes and income
generated through production. As the central balancing tool for the national accounts, they match the
supply and use of goods and services. While SUT are mainly a statistical tool, symmetric input-output
tables (IOT) are an analytical tool derived from SUT based on assumptions about the relation between
output and inputs.1
SUT are product-by-industry tables with domestic production and imports given in the supply table, and
intermediate inputs, final uses (final consumption of households and government, gross fixed capital
formation, changes in inventories and exports of goods and services) and value added reported in the use
table. Thus, the use table reveals the structure of production costs by industry. The classification of
industries in SUT is such that industries are made up of production units or firms that produce similar
goods or services, e.g. all producers of chemicals or financial services are grouped together in one
industry. Heterogeneity is traditionally conceived as depending on the detail of the industry classification.
The broadly defined chemicals industry will lump together firms that produce different types of
chemicals: industrial gases, fertilizers, etc. The standard approach to account for such heterogeneity is
further disaggregation of the industry classification along the lines of detailed product categories.
However, as emphasized in OECD (2015), there may also be other sources of firm heterogeneity within
industries: firms in one industry differ in terms of size and ownership, and they are exporters or serve
only the domestic market. Their production cost structure may then differ accordingly. Therefore, it is
worthwhile considering alternative disaggregations of industries within SUT and IOT.
1 For a more detailed description of the construction of SUT and IOT and their role within the system of national accounts, see Beutel (2017).
6
The focus here is on heterogeneity in terms of export behaviour: we disaggregate manufacturing
industries into export-oriented firms and firms serving mainly the domestic market. The literature on firm
heterogeneity and international trade points to differences between exporters and non-exporters in terms
of technology. In particular, exporters are found to have higher productivity levels (and mark-ups) which
allows them to cover the fixed cost related to exporting (Melitz, 2003). Moreover, the more productive
exporters tend to rely more on imported inputs. They have better access to global input markets, which
allows them to purchase cheaper and/or higher quality inputs abroad, thereby further boosting their
productivity (Bas, 2009). These technological differences may also shape and be shaped by the deeper
integration of exporters into global value chains.
We introduce export heterogeneity into Belgian SUT and IOT for the year 2010 by disaggregating
manufacturing industries according to exporter status at the most detailed industry-level breakdown. The
official Belgian SUT for 20102 – the most recent input-output reference year – have been constructed
according to the rules of the European System of Accounts (ESA 2010).3 The most detailed unpublished
version (workformat) of the SUT contains a breakdown into 133 industries and 350 product categories,
which are respectively based on the European Union industry and product classifications NACE Rev.2
and CPA2008.4 Manufacturing covers NACE Rev.2 industries 10 to 33, which amounts to 57 industries
in the workformat classification. For disaggregating these industries, we rely on most of the firm-level
data that are used in the construction of the SUT. We make sure that our disaggregation is consistent with
the official Belgian SUT, i.e. values for output, intermediate inputs and value added of the split
manufacturing industries sum to the values for the total non-heterogeneous industry.
2 We will also refer to these as standard SUT. 3 The 2010 Belgian SUT at purchasers’ prices and at basic prices with a 64 industry and product breakdown (as
well as the IOT) can be downloaded for free from the website of the Belgian Federal Planning Bureau (FPB): http://www.plan.be/databases/data-54-en-input+output+tables+2010+esa+2010+december+2015+. Further detail (in French or Dutch) on their construction can be found in FPB (2015).
4 NACE stands for Statistical Classification of Economic Activities in the European Community and CPA for Statistical Classification of Products by Activity in the European Economic Community.

7
The stylized supply table and use tables shown in tables 1 and 2 illustrate the SUT with a disaggregation
of manufacturing industries (columns) according to exporter status. Table 3 and table 4 add a split of the
use table according to the origin of the used goods and services, i.e. whether they are imported or
purchased from Belgian producers (table 3) and, among the latter, whether they are sourced from
exporters or non-exporters (table 4).
In practice, we proceed in several steps to obtain export-heterogeneous Belgian SUT for 2010. First, we
identify exporters and disaggregate total output and intermediate inputs for the 57 manufacturing
industries in the tables. Then, we split the columns of both the supply and the use table that contain the
product distribution of output and intermediate inputs for each industry. We also specifically disaggregate
the use table to identify the use of imported intermediate inputs and purchases of intermediate inputs
from manufacturing exporters and non-exporters. Finally, we derive symmetric heterogeneous industry-
by-industry IOT, which we then integrate into a global multi-regional input-output table (GMRIO).
2.1 Disaggregating total industry-level output and intermediate inputs
Identifying exporters among manufacturing firms allows us to disaggregate total industry-level output
and intermediate consumption for the 57 manufacturing industries in the SUT based on the exporters’
share of turnover and purchases. The results correspond to the dark grey cells in the bottom row of tables
1 and 2 and the 4th row from the bottom in table 2. Disaggregated value added including net taxes on
products is obtained as the difference between total output and intermediate inputs of the heterogeneous
manufacturing industries (dark grey cells in the 2nd and 3rd rows from the bottom in table 2).
The general business register underlying the 2010 national accounts (NA) and SUT contains 40 194
manufacturing firms5 for which data on turnover and total purchases is available based on the following
sources: balance sheet data, structural business survey data and periodical value added tax (VAT)
5 Belgian national accounts (NA) are based on legal units, which we refer to as firms.
8
declarations.6 These are the main data sources used to estimate industry-level NA aggregates for total
output and intermediate inputs by industry. The 40 194 manufacturing firms with turnover and total
purchases data constitute our full sample. Their total turnover sums to 229.7 billion euros. Merging in
merchandise export data, we calculate export to turnover ratios for these firms and consider those with a
ratio above 25% as export-oriented. This yields a sample split for manufacturing firms into 2 430 export-
oriented firms, and 37 764 firms that mainly serve the domestic market, which we refer to as domestic
market firms. The share of export-oriented firms in turnover amounts to about 75% (171.2 billion euros).
Hence, export-oriented firms are bigger firms: their average turnover is 70.4 million euros compared to
5.7 million euros for the entire sample. Due to the 25% cut-off ratio for defining export-oriented firms,
this category of firms does not account for all exports. Merchandise exports of export-oriented firms
amount to 98.2 billion euros out of a total of 101.3 billion euros of exports by manufacturing firms (97%).
All these sample characteristics are summarised in the upper part of table 5.
2.2 Disaggregating manufacturing industries in the supply-and-use tables
As illustrated by the light grey cells in tables 1 and 2, the SUT contain the distribution of industry-level
output and use of intermediate inputs over product categories. For the column-wise split of manufacturing
industries in the 2010 Belgian SUT into export-oriented and domestic market firms, we use a restricted
sample of firms for which we have information on turnover and purchases by product category.
In the Belgian SUT, the product distribution of output and intermediate inputs is derived from several
sources. The main source are two supplementary questionnaires annexed to the structural business survey
(SBS): one on the product detail of turnover and the other on the product detail of total purchases. These
two questionnaires are sent out jointly every five years to a restricted sample of big firms (all firms with
at least 50 employees plus smaller firms if necessary to reach a coverage of minimum 50% of turnover
6 The order of this list of sources reflects the hierarchy in their use. Balance sheet data is the primary source. If balance sheet data is unavailable for a firm, then structural business survey data is used, and if that is not available either, then data from periodical VAT declarations is used.

9
at the 4-digit industry-level). For the product detail on output in manufacturing industries, the data from
the supplementary SBS questionnaire on turnover is complemented by data from the survey on industrial
production (Prodcom). Moreover, the data is compared to firm-level exports by product category to
correct inconsistencies. By the same token, the data from the supplementary SBS questionnaire on the
product detail of total purchases are cross-checked and corrected for inconsistencies through a
comparison with firm-level imports by product category and data on domestic purchases from the VAT
transaction dataset.7 The latter comprises all transactions between domestic firms on which VAT is levied.
In the construction of the SUT, the resulting cross-checked datasets are used to distribute total industry-
level output and intermediate inputs over product categories.
In 2010, 1 710 manufacturing firms completed the supplementary SBS questionnaires. They form the
restricted sample for establishing the product distributions. Their turnover amounts to 181.2 billion euros,
which is 79% of the total turnover of the 40 194 manufacturing firms in our full sample. Among these
1 710 firms, 980 are export-oriented (export to turnover ratio above 25%). The turnover of these export-
oriented firms sums to 149.9 billion euros (88% of the turnover of all 2 430 export-oriented firms in the
full sample). Within the restricted sample, the average size of export-oriented firms also largely exceeds
that of firms serving mainly the domestic market (153.0 against 42.8 million euros). Finally, exports of
export-oriented firms in the restricted sample amount to 83.9 billion euros compared to total exports of
85.9 billion euros by all firms in the restricted sample (98%). Again, table 5 provides an overview of
these sample characteristics.
We split the restricted sample into export-oriented and domestic market firms and use the cross-checked
data from the supplementary SBS questionnaires on turnover and total purchases to estimate separate
product distributions of output and intermediate inputs for both groups of firms in each manufacturing
7 In the construction of the SUT, the aim of these corrections is to avoid that the underlying inconsistencies in the firm-level data resurface in the balancing process of the tables.

10
industry. We were able to do so for 47 out of the 57 manufacturing industries. The sample size was
insufficient for domestic market firms in eight industries and for exporter-oriented firms in two industries.
In those cases, we had to make a proportionality assumption. Given the aim to investigate differences in
production cost structures, we have been striving to determine the product distributions of output and
intermediate inputs of heterogeneous industries based on firm-level data rather than just assume
proportionality to the non-heterogeneous industries in the official tables. A sample split based on lower
export to turnover ratios increases the number of industries where the sample size for non-exporters is
insufficient for a data-based estimation of the product distribution of output and inputs. Hence, we faced
a trade-off between including exporters with a low export to turnover ratio in the exporter sample and
avoiding proportionality in the estimation of the product distributions of the heterogeneous industries.
Finally, we apply a RAS-procedure to ensure consistency with respect to the product distribution of
output and intermediate inputs of the non-heterogeneous industries in the official SUT. As a result, we
obtain a heterogeneous supply table as shown in table 1 and a heterogeneous use table as shown in table
2. The heterogeneous use table is still at purchasers’ prices. For transformation to basic prices, the
valuation matrices for trade and transport margins and for taxes less subsidies on products must be
subtracted. As we have no firm-level information that would allow us to disaggregate valuation tables by
exporter status, we do so proportionally to values of intermediate inputs at purchasers’ prices.
2.3 Disaggregating the use table according to the origin of the products
The disaggregation of the use table at basic prices according to the origin of the products is done in two
steps: first a split into imported and domestic goods and services (table 3) and then a split of the latter
into goods produced by export-oriented manufacturers and by domestic market manufacturers (upper
part of table 4). The official Belgian use table at basic prices contains a split according to the origin of
the goods and services, i.e. a use table for domestic output and a use table for imports. This is necessary
for deriving an IOT. Hence, we need to split the heterogeneous use table into heterogeneous use tables
for domestic output and imports. This requires specific data work for the columns of manufacturing

11
industries (see table 3).8 To estimate the use of imported intermediate inputs by export-oriented and
domestic market manufacturers, we use product-level import data for these firms corrected for re-exports
and excluding imports of capital goods. Again, a RAS-procedure is applied so that the disaggregation
respects the values of imported intermediate inputs in the official use table. The use of domestically-
produced intermediate inputs by export-oriented and domestic market manufacturers is calculated as the
difference between total and imported intermediate inputs.
As shown shaded in light grey in table 4, the entire rows for domestically-produced manufactured goods
in the use table can be further disaggregated according to whether these goods are produced by domestic
market manufacturers or by export-oriented manufacturers. To do this, we proceed in two steps. First, we
disaggregate exports, which are part of final uses. As illustrated above, export-oriented firms do not
account for all exports due to the 25% export to turnover cut-off ratio for identifying these firms. Based
on the sample split (full sample) and firm-level export data by product category, we determine exports
by export-oriented and domestic market firms for all categories of manufactured goods. Second, for all
other final and intermediate use categories, we disaggregate the rows proportionally for each category of
manufactured goods based on shares of export-oriented and domestic market firms in output of these
goods that is not exported. These shares are calculated from the data in the heterogeneous supply table.
This completes the column-wise and row-wise disaggregation of Belgium’s 2010 SUT into export-
oriented and domestic market firms in manufacturing industries as illustrated in tables 1 and 4. Tables 6
and 7 present the resulting heterogeneous SUT in a very aggregated form.
2.4 Deriving export-heterogeneous industry-by-industry input-output tables
For the transformation of SUT at basic prices into symmetric industry-by-industry IOT, we choose the
commonly used fixed product sales structure assumption (Model D in Eurostat, 2008). According to this
8 For all other industries and all final demand categories, the split into goods and services of domestic origin and imports is the same as in the official use table.

12
assumption, “each product has its own specific sales structure irrespective of the industry where it is
produced” (Beutel, 2017, p.119). This comes down to assuming that an industry’s output of a product is
delivered to users in the same proportion as total economy-wide output of that product.9
The heterogeneous industry-by-industry IOT that we derive from the heterogeneous SUT is given in very
aggregated form in table 8. The rows of this industry-by-industry IOT show the values of deliveries of
an industry’s output to the different users. The columns for industries indicate where they purchase their
inputs from, and their value added, i.e. they describe the industries’ cost structures.
2.5 Integrating the export-heterogeneous IOT for Belgium into a global table
The last step of our statistical work is to integrate the 2010 heterogeneous IOT for Belgium into a global
multi-regional input-output table (GMRIO) for the same year. Among the available GMRIOs, we have
chosen the global table from the 2016 release of the World Input-Output Database (WIOD).10 This 2010
World Input-Output Table (WIOT) is consistent with the 2008 System of National Accounts (SNA 2008)
and covers 43 countries (including Belgium) and 56 industries in a classification that is compatible with
NACE Rev.2.11 All values are in current dollars.
In a nutshell, the construction of a WIOT starts from publicly available national SUT, which are
complemented with international trade data from COMTRADE and combined into world SUT. The
industry-by-industry WIOT is derived from this world SUT based on the standard fixed product sales
structure assumption. The WIOT respects countries’ published national accounts aggregates (output and
value added by industry as well as totals of final demand by category), but the inner structure of the tables
is not consistent with published SUT or IOT of individual countries due to necessary transformations in
9 See Eurostat (2008) for the mathematical expressions of the derivation of industry-by-industry IOT from SUT under the fixed product sales structure assumption.
10 These tables can be downloaded for free from the website of the WIOD project: http://www.wiod.org/. Timmer et al. (2015) provides an introduction to WIOD data, and Timmer et al. (2016) contains a detailed description of the sources and methodology for constructing the world input-output tables (WIOT).
11 There are 19 manufacturing industries among those 56 industries, which are identical to the 19 manufacturing industries in the A64 breakdown of the NACE Rev.2 of our national tables (see list in the appendix).

13
the course of the construction process (Dietzenbacher et al., 2013). This is problematic for our analysis
as we want to keep the structure of our export-heterogeneous Belgian table as it is when integrating it
into the WIOT. Edens et al. (2015) have developed a methodology for introducing a national table for
the Netherlands into the WIOT without changing these national data: they replace the input data for the
Netherlands by more detailed national data, which are actually a firm-level-data-based extension of the
most detailed official national SUT, and they replicate the construction process of the WIOT keeping
data for the Netherlands constant. A similar methodology has been applied for Belgium for the years
1995-2007 in Hambÿe et al. (2018). Here, we have opted for a shortcut compared to this thorough
method: we directly integrate the Belgian IOT into the 2010 WIOT. This is less cumbersome than the
method of Edens et al. (2015). As shown in Hambÿe et al. (2018) for the years 1995-2007, the main
difference between official national data and WIOT data for Belgium is in re-exports. This also holds
true for the year 2010.
We start off by converting our Belgian IOT into dollars based on the exchange rate used in WIOD
(1.3257$/€). As a second step, we use the Belgian firm-level data on exports and imports by partner
country to distribute imports and exports in our national tables over countries of origin and destination.
This includes determining the specific country distribution of exports and imports of export-oriented
manufacturers. For the distribution of Belgian exports over use categories in the destination countries,
we rely on data from WIOD on the use of imports from Belgium in these countries. In a third step, we
replace all domestic transactions, imports and exports for Belgium in the WIOT by data based on our
heterogeneous national IOT (including imports and exports distributed over countries and country-user
pairs obtained in the previous step). Then, we adjust the data for all other countries in the WIOT with a
RAS procedure. This yields a 2010 WIOT entirely consistent with national data for Belgium – we also
refer to this as the adapted WIOT – with a disaggregation of Belgian manufacturing industries into
export-oriented firms and domestic market firms.

14
3. Export heterogeneity in input-output tables: analysis
Input-output tables enable the analysis of production structures and value chains. With heterogeneous
tables, this analysis can be specifically focused on certain types of firms. In this section, we first compare
the direct cost structures of export-oriented and domestic market firms in Belgian manufacturing
industries. Then, we proceed to the analysis of their integration into domestic value chains based on the
national heterogeneous IOT and standard input-output models taking into account the full indirect cost
structures. Finally, we use the GMRIO tables with export heterogeneity for Belgian manufacturing to
look at the integration of export-oriented and domestic market firms into global value chains (GVC).
3.1 Differences in direct production cost structures
The IOT with exporter heterogeneity in table 8 reveals that export-oriented firms account for almost
three-quarters of total output of manufacturing industries but only for two-thirds of total manufacturing
value added. In other words, export-oriented manufacturers have a lower value added to gross output
ratio than manufacturing firms that mainly serve the domestic market (graph 1). Moreover, export-
oriented manufacturing firms do not only purchase more intermediate inputs compared to their gross
output, they also purchase proportionally more of their intermediate inputs from abroad. Indeed, as
illustrated in graph 1, imports make for almost 57% of total intermediate inputs of export-oriented firms,
while this share is just below 37% for firms mainly serving the domestic market. Hence, in line with
prior findings in the literature on firm heterogeneity and international trade, export-oriented
manufacturing firms in Belgium tend to rely more on imported intermediate inputs. Narrowing things
down to inputs from manufacturing, this import share becomes 65% for export-oriented firms and 51%
for firms that mainly serve the domestic market (graph 1). This corresponds to offshoring of
manufactured goods as originally defined in Feenstra and Hanson (1996). Export-oriented manufacturing
firms engage more into offshoring, which reflects the greater cross-border fragmentation of their
production processes. Graph 1 also reports values for these three indicators (value added to gross output
ratio, share of imports in total inputs and share of imports in total inputs from manufacturing) for the

15
whole of manufacturing based on the standard IOT for 2010. They turn out to be closer to the values for
export-oriented manufacturing firms due to the higher shares of this group of firms in the industry totals.
Based on the heterogeneous IOT and looking at intermediate input structures, graph 2 illustrates
differences between export-oriented and domestic market manufacturers in terms of their purchases from
domestic suppliers. More than half comes from other (service) industries for both groups. But domestic
market firms purchase relatively more of their intermediate inputs from other domestic market firms,
while export-oriented firms purchase relatively more from other export-oriented firms.
Finally, we also test for similarity of intermediate input structures at a more detailed level by calculating
the correlation between technical coefficients of export-oriented and domestic market firms in each
manufacturing industry. Technical coefficients are the result of a normalisation of an industry’s input
structure by its output, i.e. they indicate the amount of the different types of intermediate inputs required
per unit of output. The average correlation between intermediate input structures of export-oriented and
domestic market firms in the same industry is 0.707. This excludes industries for which we had to rely
on proportionality when determining the respective product distributions of inputs for export-oriented
and domestic market firms. The histogram in graph 3 shows the distribution of the correlation
coefficients. Among industries for which the input structure is not split proportionally, ‘Printing’ and
‘Manufacture of motor vehicles’ have the highest correlation coefficients (0.99) and ‘Manufacture of air
and spacecraft and parts thereof’ and ‘Manufacture of leather and related products’ the lowest (0.29), i.e.
export-oriented and domestic market firms have very similar intermediate input structures in the former
and relatively different ones in the latter.
3.2 Integration into domestic value chains
Input-output analysis goes one step further by taking into account the (indirect) intermediate input
requirements of suppliers. The underlying idea is to determine the effect of a final demand shock
(domestic final demand or exports) on economy-wide output or value added. The final demand shock
prompts a firm to expand the scale of its production process. The firm purchases more inputs from its

16
suppliers, and, as a consequence, the firm’s suppliers also produce more output, for which they purchase
additional inputs from their suppliers. In turn, the suppliers’ suppliers produce more output and purchase
extra inputs, and so on. This gives rise to an upstream effect on output, i.e. through the increase in
purchases of intermediate inputs. Standard input-output analysis models the effect of such a demand
shock on the entire domestic production chain in terms of output, value added and employment generated
in the chain. Here, we focus on output and value added of export-oriented and domestic market firms.
In the input-output model, the total effect on output is measured by multiplying the shock by the Leontief
inverse matrix. This accounts for the magnitude of the shock and all extra output generated in domestic
supplying (upstream) industries. In a national IOT framework, the Leontief inverse matrix 𝐿𝐿𝑑𝑑, which is
also called total domestic requirements matrix, is calculated as follows:
𝐿𝐿𝑑𝑑 = (𝐼𝐼 − 𝐴𝐴𝑑𝑑)−1 (1)
where 𝐴𝐴𝑑𝑑 is an industry-by-industry matrix of domestic technical coefficients and 𝐼𝐼 is an identity matrix
of the same dimensions as 𝐴𝐴𝑑𝑑. For any industry, domestic technical coefficients represent the shares of
inputs purchased from domestic supplying industries in its total output. The matrix 𝐴𝐴𝑑𝑑 is calculated as
𝑍𝑍𝑑𝑑 ∗ 𝑦𝑦�−1 where 𝑍𝑍𝑑𝑑 is the matrix of domestically-produced intermediate inputs and 𝑦𝑦� a diagonalised
vector of output by industry. Any element 𝑙𝑙𝑖𝑖𝑖𝑖𝑑𝑑 of the 𝐿𝐿𝑑𝑑-matrix represents domestic output by industry i
generated (directly or indirectly) by a one-euro final demand shock for output of industry j. The sum over
all i (producing industries) is called the output multiplier for industry j (∑ 𝑙𝑙𝑖𝑖𝑖𝑖𝑑𝑑𝑖𝑖 ). It indicates how many
extra euros of domestic output are generated (in all industries) through domestic intermediate input
purchases by a one-euro increase in final demand for output of industry j. The output multiplier is an
indicator of an industry’s backward integration into a country’s economy.12
12 Note that, in this national framework, imported intermediate inputs are not taken into account as they do not generate domestic output. Thus, industries that use relatively more domestically-produced intermediate inputs tend to have higher output multipliers.

17
Effects can also be calculated in terms of value added. Multiplying 𝑙𝑙𝑖𝑖𝑖𝑖𝑑𝑑 by industry i’s value added in
output share 𝑣𝑣𝑖𝑖 yields the amount of value added generated in industry i by this shock to industry j’s final
demand. The value added multiplier corresponds to the sum over the producing industries (∑ 𝑣𝑣𝑖𝑖𝑙𝑙𝑖𝑖𝑖𝑖𝑑𝑑𝑖𝑖 ). It
indicates how many extra euros of domestic value added are generated (in all industries) through
intermediate input purchases by a one-euro increase in final demand for output of industry j.
Based on the 2010 heterogeneous national IOT for Belgium, we calculate output and value added
multipliers for export-oriented and domestic market firms in manufacturing industries. Overall results
are reported in graph 4, including those for total manufacturing based on the standard IOT. The average
output multiplier is substantially higher for domestic market firms than for export-oriented firms, i.e.
export-oriented manufacturers are less backward integrated into the Belgian economy. This finding
reflects the international fragmentation of their production process. They use more intermediate inputs
than domestic market manufacturers, but most of these inputs are imported, which implies that their
(domestic) output multiplier is lower. The value added multiplier for domestic market manufacturers is
also higher (0.58 against 0.43 for export-oriented manufacturers). Two underlying differences between
export-oriented and domestic market manufacturers drive this result. First, a one-euro final demand shock
to the output of export-oriented manufacturers generates less direct value added than an equivalent shock
to the output of domestic market manufacturers since the value added in output share is lower for export-
oriented manufacturers. Second, it also generates proportionally less output in domestic upstream
industries and hence also less value added. The output and value added multipliers for manufacturing
overall shown in graph 4 are closer to the multipliers for export-oriented firms. This is again due to the
higher weight of export-oriented firms in manufacturing industries.
Graphs 5 and 6 report output and value added multipliers by NACE Rev.2 A64 industry for export-
oriented and domestic market manufacturers (see list in the appendix). The output multiplier of export-
oriented manufacturers is lower for all but five manufacturing industries. Moreover, there is a large
18
spread in the values of output multipliers: between 1.32 and 1.91 for domestic market firms and between
1.26 and 1.83 for export-oriented firms. The value added multiplier is lower for export-oriented firms
than for domestic market firms in all industries except for the pharmaceutical and the other transport
equipment industries (codes 21 and 30).
Finally, in input-output analysis, an industry’s integration into the domestic economy is considered not
only in terms of its purchases of domestically-produced intermediate inputs (upstream) but also in terms
of its deliveries of goods and services to other domestic (downstream) industries that use them as
intermediates. The former is referred to as backward integration or backward linkages of an industry and,
as mentioned above, can be measured by the output multiplier. The latter is referred to as forward
integration or forward linkages of an industry. Their calculation is based on the Ghosh inverse matrix:
𝐺𝐺𝑑𝑑 = (𝐼𝐼 − 𝐵𝐵𝑑𝑑)−1 (2)
where 𝐵𝐵𝑑𝑑 = 𝑦𝑦�−1 ∗ 𝑍𝑍𝑑𝑑 is a matrix containing the shares of the (domestic) purchasing industries in the
output of the producing industry. Total forward linkages of industry i correspond to the sum of its row in
the Ghosh inverse matrix (∑ 𝑔𝑔𝑖𝑖𝑖𝑖𝑑𝑑𝑖𝑖 ) and measure how a value added shock to industry i (directly and
indirectly) affects economy-wide output through the sales of industry i’s output as intermediate inputs to
other domestic industries. Hence, an industry with high total forward linkages “supplies a significant part
of its output as intermediate inputs to other industries” (Miller and Temurshoev, 2013, p.9).
Our calculations of this forward linkage indicator show that it is generally much lower for export-oriented
manufacturers than for domestic market manufacturers, i.e. forward integration into the domestic
economy is higher for domestic market firms. Export-oriented firms deliver relatively less of their output
to other domestic industries. However, exports may be used as intermediate inputs abroad. Hence, export-
oriented firms are likely to be integrated forward into global value chains rather than domestic value
chains. This cannot be identified based on a national IOT, which does not provide information on how
exports are used in destination countries, but requires a GMRIO.

19
Integration of export-oriented and domestic market manufacturers into Belgian domestic value chains is
summarized in the scatterplots of graph 7. Backward integration is shown on the horizontal axis and
forward integration on the vertical axis. Both are normalized with respect to the average for all
manufacturing industries. The scatterplot for manufacturing firms serving mainly the domestic market is
skewed more towards the top and right indicating a stronger integration into domestic value chains.
3.3 Foreign and domestic value added in exports
As production processes have become increasingly fragmented at the international level, a growing share
of international trade is trade in intermediate goods and services (Miroudot et al., 2009). Moreover,
greater fragmentation implies that many goods are shipped back and forth in the course of the production
process before being delivered to final consumers. Due to multiple border crossings, gross export flows
have increased faster than the underlying value added. These trends in international trade and production
have prompted researchers to look at the domestic and foreign value added shares in a countries’ exports
(Hummels et al., 2001; Koopman et al., 2014). The vertical specialization in trade (VS) share measure
defined by Hummels et al. (2001) represents “the value of imported inputs embodied in goods that are
exported” (p.76-77) as a share of gross exports. It is a widely-used indicator of the extent of the
international fragmentation of production processes and reveals how much foreign value added is
contained in a country’s exports. The VS share is calculated as 𝑖𝑖′𝐴𝐴𝑚𝑚𝐿𝐿𝑑𝑑𝑒𝑒/𝑖𝑖′𝑒𝑒 where 𝐴𝐴𝑚𝑚 is the matrix of
imported intermediate input coefficients, 𝑒𝑒 the vector of gross exports and 𝑖𝑖 a summation vector. Its
complement is the domestic value added in exports (DVAX) share (Koopman et al., 2014), calculated as
𝑣𝑣′𝐿𝐿𝑑𝑑𝑒𝑒/𝑖𝑖′𝑒𝑒 where 𝑣𝑣 is a vector of industry-level value added in output shares.13 Belgium’s VS share of
exports computed with the standard 2010 IOT amounts to 43.7%. In manufacturing, Belgium’s VS share
stands at the much higher level of 55.2%.
13 The term 𝑖𝑖′𝐴𝐴𝑚𝑚 measures the foreign share of output. In the context of calculations with a national IOT, it is taken to measure foreign value added in output. This ignores potential feedback effects that can only be taken into account with a global table (see section 3.4).

20
As emphasized in Piacentini and Fortanier (2015), “the use of homogeneous input-output tables (…)
assumes that imported inputs are used evenly in production for domestic sales and exports. If domestic
production is different from production for exports, i.e. the input-output structure of exporters is different
from the one of non-exporters, then the measure based on standard (IOT) is biased. The direction of the
bias is clear: as exporters make a more intensive use of intermediate imports than non-exporters, the
standard measure under-estimates vertical specialization (p.16).” Based on our export heterogeneous IOT
the overall VS share for Belgium amounts to 44.1% and for manufacturing to 56.0%.14 Hence, the
downward bias of computing the VS share with the standard table is rather small. Nonetheless, computing
separate VS shares for export-oriented and domestic market firms reveals a large difference, which is
indeed driven by the difference in the intensity in the use of imported intermediates. The VS share is
57.2% for export-oriented manufacturers and 45.1% for domestic market manufacturers.15
Three main factors have an influence on the VS share: a) the share of exports in total output, b) the value
added to output ratio, and c) the share of imports in total use of intermediate inputs (Piacentini and
Fortanier, 2015). By definition, export-oriented manufacturers have a higher share of exports in total
output. But the other two factors also play a role. Export-oriented manufacturers have lower value added
to output ratios, i.e. use proportionally more intermediates in their production process, and they rely to a
larger extent on imports when sourcing these intermediates.16
As mentioned above, the complement of the VS share is the domestic value added in exports (DVAX)
share. Total domestic value added generated in Belgium in 2010 by exports amounts to 109.9 billion
euros, which corresponds to 55.9% of Belgium’s total gross exports (196.5 billion euros). We use the
heterogenous IOT to specifically decompose the domestic (Belgian) value added embodied in exports by
industry and firm types. Results are reported in table 9 with value added by types of firms in the rows
14 Tables 10 and 11 give an overview of the VS shares that we have calculated. 15 Appendix graph A1 reports industry-level VS shares for export-oriented and domestic market manufacturers. 16 See graphs A2 and A3 in the appendix.

21
and exports by types of firms in the columns. As an example on how to read this table take the cell
corresponding to the second row in the first column: it contains the value added of domestic market
manufacturers generated by exports of export-oriented manufacturers. The table reveals several
interesting results. First, the exports of export-oriented manufacturers generate a total domestic value
added of 45.4 billion euros, of which more than half is value added of this group of firms. But their
exports also generate a substantial amount of value added in the rest of the Belgian economy: 17.1 billion
euros in other industries, which are mainly service industries, and 2.4 billion euros for domestic market
firms in manufacturing industries. Hence, Belgian service industries do actually participate in GVCs
through their deliveries to export-oriented manufacturers. Second, the exports of domestic market
manufacturers and firms in the other industries generate only very little value added for export-oriented
manufacturers. Again, this is related to the lesser integration of export-oriented manufacturers into the
domestic economy. Third, the exports of the other industries, mostly service exports, generate
comparatively less value added in manufacturing (for both export-oriented and domestic market firms).
Two characteristics of service industries contribute to this finding: they have a higher value added to
output ratio and services make for a larger share of the intermediates they purchase. The comparison of
column and row totals of table 9 shows, for export-oriented manufacturers, that the value added generated
in Belgium by their exports (45.4) is much higher than their value added due to total Belgian exports
(26.8). The opposite holds for domestic market manufacturers and firms in other industries. Adding the
imported content of exports, graph 8 sums up the sources of content in gross exports by types of firms.
Graph 9 provides a comparison of shares in gross exports and in domestic value added in exports and
reveals striking differences between groups of firms. Export-oriented manufacturers account for more
than half of Belgium’s total gross exports (54%) but only for a quarter of domestic value added generated
by exports (24%). Most of domestic value added in exports is generated in other industries, i.e. service

22
industries (69%), while the share of these industries in gross exports is only 40%. For domestic market
manufacturers, shares in gross exports and domestic value added in exports are similar and low.17
3.4 Integration into global value chains
Incorporating the Belgian export-heterogeneous IOT into the 2010 WIOT allows to look at how Belgian
export-oriented and domestic market manufacturers are integrated into and positioned within global
value chains. Such an analysis relies on a multi-regional input-output model. In essence, the multi-
regional model works the same way as the national model, but the scope of the effects is extended: the
multi-regional model takes into account not only purchases and sales of domestically-produced
intermediates but also purchases of intermediate inputs from abroad as well as deliveries to foreign
intermediate and final demand. In the standard Leontief model, all upstream effects are captured by the
elements of the multi-regional Leontief inverse matrix 𝐿𝐿𝑀𝑀𝑀𝑀𝑀𝑀𝑀𝑀, which is calculated based on the multi-
regional matrix of technical coefficients 𝐴𝐴𝑀𝑀𝑀𝑀𝑀𝑀𝑀𝑀:
𝐿𝐿𝑀𝑀𝑀𝑀𝑀𝑀𝑀𝑀 = (𝐼𝐼 − 𝐴𝐴𝑀𝑀𝑀𝑀𝑀𝑀𝑀𝑀)−1 (3)
Any element in this matrix represents the output of a country-industry pair that is generated by a one-
dollar18 final demand shock to output of another country-industry pair. In this multi-regional set-up, a
final demand shock to the output of an industry in a country gives rise to domestic effects and effects in
other countries through imports of intermediates (spillover effects). Moreover, it may lead to feedback
effects for the country when the industry purchases intermediate inputs from foreign suppliers and these
foreign suppliers, in turn, purchase intermediate inputs from the country where the shock has occurred.
3.4.1 Vertical specialisation
17 Graph A4 in the appendix also shows where the upstream effects of a shock to exports of export-oriented or domestic market manufacturers actually occur (in terms of output and value added). In line with the results reported above, the biggest part of the upstream effects occurs in the ‘other industries’, which mainly comprise service industries. Note that the composition of exports is different for the two groups of firms.
18 While national tables for Belgium are labelled in euros, the WIOT is labelled in dollars. We decided to keep the original currency of the latter table.

23
In a multi-regional setting, the VS share is a measure of backward integration into GVCs. Its computation
is based on the 𝑉𝑉𝐵𝐵𝑉𝑉 industry-country by industry-country matrix of value added embodied in exports.
𝑉𝑉𝐵𝐵𝑉𝑉 = 𝑣𝑣�𝑀𝑀𝑀𝑀𝑀𝑀𝑀𝑀 ∗ 𝐿𝐿𝑀𝑀𝑀𝑀𝑀𝑀𝑀𝑀 ∗ �̂�𝑒𝑀𝑀𝑀𝑀𝑀𝑀𝑀𝑀 (4)
Here, 𝑣𝑣�𝑀𝑀𝑀𝑀𝑀𝑀𝑀𝑀 is a diagonalised vector of value added in output shares and �̂�𝑒𝑀𝑀𝑀𝑀𝑀𝑀𝑀𝑀 a diagonalised vector of
gross exports for all country-industry pairs contained in the GMRIO table. The 𝑉𝑉𝐵𝐵𝑉𝑉 matrix can be
divided into a domestic part 𝑉𝑉𝐵𝐵𝑉𝑉𝑑𝑑 (on the block diagonal) and a foreign part 𝑉𝑉𝐵𝐵𝑉𝑉𝑛𝑛𝑑𝑑 (off the block
diagonal). The column sum of the domestic part yields domestic value added in exports by country-
industry pair (𝑖𝑖′ ∗ 𝑉𝑉𝐵𝐵𝑉𝑉𝑑𝑑) and the column sum of the foreign part yields foreign value added in exports
by country-industry pair (𝑖𝑖′ ∗ 𝑉𝑉𝐵𝐵𝑉𝑉𝑛𝑛𝑑𝑑). By summing over industries for each country and dividing by
country-level gross exports, we obtain country-level DVAX and VS shares.
A comparison of VS shares for all 43 countries in the adapted WIOT reveals that Belgium is among the
countries with the highest shares, i.e. it is highly backward integrated into GVCs. This is illustrated in
graph 10. As reported earlier, Belgium’s VS share stands at 43.7% based on the standard (homogeneous)
national IOT and at 44.1% based on the heterogeneous national IOT. When recalculating VS shares with
the adapted 2010 WIOT, i.e. into which we have integrated our national IOT for Belgium, we obtain a
VS share of 43.2% without export heterogeneity and of 43.7% with export heterogeneity.19 Table 10
summarises VS share results from different types of tables. In our setting where data for Belgium in the
GMRIO tables are entirely consistent with the national IOT, VS shares based on multiregional tables are
by definition lower than VS shares based on national tables. This is due to the feedback effects in the
multiregional model, which increase the domestic value added in exports and hence reduce the VS
share.20 In practice, the difference between VS shares based on multiregional tables and VS shares based
19 Belgium’s VS share calculated with the original 2010 WIOT amounts to 42.7%. Note also that Los (2017) reports a VS share of 46% for Belgium based on the 2011 WIOT.
20 The consistency of Belgian data in the adapted WIOT with data from the national IOT for Belgium implies that industry-level value-added coefficients and gross exports for Belgium are identical in both tables. Hence,
24
on national tables is small because feedback effects are small. Table 10 also highlights again that the
downward bias due to the use of standard rather than heterogeneous tables is rather small. But export-
oriented and domestic market manufacturers have very different VS shares as illustrated in table 11.
3.4.2 Global value chain participation
The VS share indicates how a country’s firms participate backward in GVCs, i.e. through purchases of
intermediates from abroad for producing exports. But they may also participate in GVCs by exporting
intermediate inputs that are then used (directly and indirectly) in the production of third country exports.
This alternative way of participating in GVCs was already identified in Hummels et al. (2001). These
authors suggested to measure such forward integration into GVCs by the VS1 share. In their definition,
it is calculated as the value of a country’s exports embodied in foreign countries’ exports divided by the
country’s gross exports.21 In our set-up, a country-industry pair’s exports embodied in third country
exports corresponds to the row sum of the foreign part (off the block diagonal) of the 𝑉𝑉𝐵𝐵𝑉𝑉 matrix
(𝑉𝑉𝐵𝐵𝑉𝑉𝑛𝑛𝑑𝑑 ∗ 𝑖𝑖). A country’s VS1 share is then obtained by summing over all industries for that country and
dividing by the country’s gross exports.22
Both VS and VS1 shares for a country depend on its average position in GVCs: countries with a greater
share of downstream activities tend to have higher VS shares and lower VS1 shares, and vice-versa for
countries with more upstream activities. For a more comprehensive assessment of countries’ participation
differences in national IOT-based and WIOT-based DVAX shares (and also VS shares) originate from differences between 𝐿𝐿𝑑𝑑 and the Belgian domestic part of 𝐿𝐿𝑀𝑀𝑀𝑀𝑀𝑀𝑀𝑀 . As the national setting cannot account for feedback effects, the elements of 𝐿𝐿𝑑𝑑 are always smaller than the elements of the Belgian domestic part of 𝐿𝐿𝑀𝑀𝑀𝑀𝑀𝑀𝑀𝑀 (see Round, 2001, and Koopman et al., 2010). Therefore, Belgium’s national IOT-based DVAX share is smaller than its WIOT-based DVAX share, and the opposite holds for Belgium’s VS share (see table 10).
21 Computing this VS1 share requires information about the use of exports in the destination country, which is only available in GMRIO tables. Hence, it cannot be done with national IOT. This is why Hummels et al. (2001) were not able to compute the VS1 share they had defined.
22 There is a slight methodological difference between the forward linkages that we have calculated with the national IOT and the forward integration into GVCs that we calculate with the adapted WIOT: the former is based on a Ghosh inverse matrix, while the latter is based on a (multi-regional) Leontief inverse matrix.

25
in GVCs, Koopman et al (2010) define the GVC participation index that sums the VS and VS1 measures
and is normalised by total country-level exports.23
Graph 11 shows a comparison of the GVC participation index for all countries in the 2010 WIOT with a
split into the contributions of backward and forward integration. Again, Belgium is among the countries
with the highest values for this index, i.e. Belgium is highly integrated into global value chains, both
backward and forward. This result is in line with the results reported by De Backer and Miroudot (2014)
based on data from the OECD’s 2009 inter-country input-output (ICIO) table. Forward participation is
especially high for countries producing raw materials such as Australia, Norway and Russia. As a
consequence, these countries are higher ranked in terms of GVC participation than in terms of the VS
share. Overall, country size does seem to matter for these indicators with smaller countries having a
higher GVC participation index on average.
The integration of the export-heterogeneous IOT for Belgium into the 2010 WIOT allows to determine
contributions of export-oriented manufacturers, domestic market manufacturers and other industries to
Belgium’s participation in global value chains as shown in graph 12. The third stacked bar in the graph
indicates that Belgium’s participation in GVCs is due for 55% to export-oriented manufacturing firms,
for 38% to the firms in other industries and for the remaining 6% to domestic market manufacturing
firms. The first and second stacked bars illustrate the difference in how export-oriented manufacturers
and firms in other industries participate in GVCs. There is a clear distribution of the roles: export-oriented
manufacturers essentially participate in GVCs through their purchases of imported intermediate inputs
for producing exports (backward integration), while firms in other industries participate in GVCs mainly
through exports of intermediates for export production abroad (forward integration).
23 De Backer et Miroudot (2014) highlight an issue of double counting for the GVC participation index: “[a]s domestically produced inputs can incorporate some of the foreign inputs, there is an overlap and potentially some double counting […]. Likewise, some foreign inputs can incorporate domestic value added exported in an earlier stage of the value chain (p.10)”.
26
3.4.3 Position in global value chains
The set of GVC indicators is completed by two measures of the position of an industry or country in
global value chains: the number of embodied production stages and the distance to final demand. For
any industry in a country, the former indicates the average number of production stages up to the point
where the industry’s production activity takes place, while the latter indicates the average number of
production stages until its output becomes embodied in a good or service delivered to final demand.
These indicators of position are complementary with respect to vertical specialisation and GVC
participation, which measure how value chains are fragmented in terms of value added contributions.
Our main aim is to compare Belgian export-oriented and domestic market manufacturers in terms of
value chain position based on these two indicators. Accounting for export heterogeneity in manufacturing
does not significantly alter overall results for Belgium for these position indicators.24
The number of embodied production stages indicator was initially proposed in Fally (2012). Its original
definition is recursive based on a weighted count of the number of embodied intermediates, i.e. it is a
measure of the length of the input chain of an industry’s production.25 It can be shown that the calculation
boils down to computing the industry’s total backward linkages (Miller and Temurshoev, 2013).26 Thus,
with a GMRIO table, it is computed as 𝑖𝑖′ ∗ 𝐿𝐿𝑀𝑀𝑀𝑀𝑀𝑀𝑀𝑀. If the production of an industry does not require
intermediate inputs, then the indicator is equal to one. Its value then increases with the number of
intermediate inputs used in an industry’s production process and their importance in that process (share
of intermediates in output). The use of GMRIO tables for calculating the measure allows to distinguish
24 Computing the number of embodied production stages and the distance to final demand for Belgium with the homogeneous or heterogeneous adapted WIOT makes for a difference of 0.1% or less. Values for these position indicators based on the original WIOT differ by approximately 2% from values based on the adapted WIOT.
25 The measure is sometimes also referred to as ‘value chain length’ (De Backer and Miroudot, 2014), but it should be kept in mind that it is a purely backward looking indicator, i.e. of the length of the input chain up to the industry’s production, and not of the entire value chain up to final demand. Miller and Temurshoev (2013) have independently developed the equivalent measure of ‘input downstreamness’. In an earlier contribution, Dietzenbacher and Romero (2007) proposed the more complex “average propagation length” measure.
26 This is true because “the distance between any two stages of production is assumed to be one” (Miller and Temurshoev, 2013, p.10).
27
between the domestic and foreign embodied production stages. In terms of interpretation, De Backer and
Miroudot (2014) emphasize that with plant-level information the indicator would represent the actual
number of production stages. Given the relatively high level of aggregation of industries in GMRIO
tables, and in the WIOT in particular, the indicator calculated with such tables should rather be interpreted
as an ordinal measure for comparing countries or industries.
Averaging over industries with output weights, we find a slightly higher number of embodied production
stages for export-oriented manufacturers (2.89) than for domestic market manufacturers (2.72) as shown
in Table 12. This also holds for most individual manufacturing industries (graph 13) and is consistent
with our earlier finding that export-oriented manufacturers purchase more intermediates per unit of
output, i.e. outsource more. Moreover, export-oriented manufacturers have, on average, more foreign
embodied production stages than domestic market manufacturers (1.33 against 0.99) and less domestic
embodied production stages (1.56 against 1.73) as could be expected based on their respective import
shares. Graph 13 shows that this is also the case for almost all individual manufacturing industries.
Finally, the number of embodied production stages of the other industries (mostly services) is lower
(2.07), and most of their embodied production stages are domestic (1.60 against 0.47 for the foreign
ones). In terms of country ranking, graph 14 shows that, in international comparison, Belgium has an
above average number of embodied production stages.
The distance to final demand indicator was originally suggested by Fally (2012) and Antras et al.
(2012).27 It is the forward-looking complement of the number of embodied production stages indicator.
Its calculation is a weighted count of the number of production stages until an industry’s output (initially
often sold for intermediate consumption) becomes embodied in a good or service delivered to final
demand. It turns out that it is equivalent to an industry’s total forward linkages (Miller and Temurshoev,
27 Note that it has also been referred to as indicator of ‘upstreamness’ by these authors and as ‘output upstreamness’ by Miller and Temurshoev (2013).

28
2013). In a GMRIO set-up, it is thus calculated for any industry by taking the row sum of the
multiregional Ghosh inverse matrix (𝐺𝐺𝑀𝑀𝑀𝑀𝑀𝑀𝑀𝑀 ∗ 𝑖𝑖 where 𝐺𝐺𝑀𝑀𝑀𝑀𝑀𝑀𝑀𝑀 = (𝐼𝐼 − 𝐵𝐵𝑀𝑀𝑀𝑀𝑀𝑀𝑀𝑀)−1). The indicator takes a
value of 1 if all of an industry’s output is delivered to final demand, and it increases with the share of the
industry’s output that is delivered to other industries (i.e. intermediate demand) and with the number of
production stages (i.e. industries) involved until the output becomes embodied in a good or service
delivered to final demand. Industries with a higher distance value are also said to be more upstream and
industries with a lower value are said to be more downstream.28 Again, values should be interpreted as
ordinal, i.e. for comparing countries or industries. Moreover, the use of GMRIO tables allows for a
distinction between a domestic distance to final demand and a foreign distance to final demand.
According to our results with industry distance values aggregated with output weights, manufacturing
industries in Belgium are on average more upstream with a distance value of 2.62 against 2.12 for the
other – mainly service – industries. This is consistent with the idea that, for example, basic metal products
are transformed in a greater number of production stages before reaching final customers than personal
services. Within manufacturing, export-oriented firms have a slightly higher distance to final demand
than domestic market firms (2.66 against 2.50, see table 12). For the former, the domestic and foreign
distance are identical (1.33), while for the latter domestic distance dominates (1.85 against 0.65). Graph
15 shows a large spread in distance to final demand across manufacturing industries in Belgium but only
small differences between export-oriented and domestic market firms. Finally, in terms of the country
ranking for distance to final demand, Belgium is slightly more specialised in upstream activities than the
world average (distance value of 2.25 against 2.20, see graph 16).
28 As a caveat, Los (2017) points out that “the upstreamness of an industry (defined at a relatively aggregated level as in most global IO databases) can vary substantially across countries, due to the fact that an industry in a country can be specialized in the production of components, while the same industry in a different country can be specialized in assembly activities (which are downstream). (…) The apparently rather different activities carried out in these industries show that international fragmentation of production processes makes comparisons of industries with identical labels or codes increasingly difficult” (p.307).

29
4. Conclusions
The disaggregation of industries in SUT and IOT according to exporter status is considered as highly
desirable since it may actually reveal technological differences between firms within an industry defined
in terms of product similarity (OECD, 2015; Los, 2017). In this working paper, we describe the statistical
methodology for obtaining export-heterogeneous SUT and IOT for Belgium for 2010 and their
integration into a GMRIO table, and we present results from analyses based on these tables.
From a statistical point of view, our data-based split of manufacturing industries into export-oriented and
domestic market firms represents a clear improvement with respect to the proportionality assumptions
that most prior contributions in this field have relied on. This is true in particular for the product structures
of output and intermediate inputs of these two types of firms. Our work also illustrates a statistical
limitation in this respect: for a small country like Belgium, sample sizes may prove insufficient at the
most detailed industry level for such a data-based split of output and input structures. In our case, we
faced a trade-off between including minor exporters in the category of export-oriented firms and avoiding
proportionality in the estimation of product distributions for heterogeneous industries. Although this may
be less of an issue for larger countries, it represents a serious constraint for combined disaggregations of
SUT and IOT, e.g. for firm size and ownership.
The analyses based on the resulting national export-heterogeneous IOT reveal differences between ex-
port-oriented and domestic market firms in manufacturing industries in terms of input structures and
import patterns. Export-oriented manufacturers have lower value-added in output shares, and they import
proportionally more of the intermediates they use, i.e. their production processes are more fragmented,
in particular internationally. These results, obtained in a setting that is consistent with the national
accounts, confirm findings in prior analyses on firm heterogeneity in international trade (Melitz, 2003;
Bas, 2009). Furthermore, our input-output analyses show that export-oriented manufacturing firms are
less integrated upstream and downstream into the Belgian economy than domestic market firms, and that

30
the exports of export-oriented manufacturers generate a substantial amount of value added in other
Belgian firms, in particular providers of services.
With the heterogeneous Belgian table incorporated into the WIOT, we obtain further insights on the roles
of the different types of firms in Belgium’s integration into global value chains. Export-oriented
manufacturers are the drivers of Belgium’s backward GVC participation, i.e. through imports of
intermediates for export-production, while the other firms push Belgium’s forward GVC participation,
i.e. by producing intermediates for other countries’ exports. Moreover, export-oriented manufacturers
participate in value chains that comprise, on average, a greater number of upstream and downstream
production stages and of which a greater share is located abroad.
The value chain analysis based on heterogeneous IOT highlights that the external competitiveness of
Belgian manufacturing depends not only on export-oriented manufacturing firms but also on
manufacturing firms that mainly serve the domestic market and supplier firms in service industries.
Export-oriented manufacturers need to be competitive on foreign markets and domestic suppliers have
to be competitive in the production of the inputs delivered to those export-oriented firms (internal
competitiveness). Hence, it is not sufficient to focus only on export-oriented firms. They are the
spearhead of participation in GVCs, but domestic upstream suppliers must also be taken into account.
Overall, for Belgium to reap the full benefits from exports, the entire value chains must be considered.
References
Ahmad N., Araújo S., Lo Turco A. and D. Maggioni (2013), “Using Trade Microdata to Improve Trade
in Value-Added Measures: Proof of Concept Using Turkish Data”, in Mattoo A., Wang Z. and S.-J.
Wei (eds.), Trade in Value Added: Developing New Measures of Cross-Border Trade, World Bank,
pp. 187 - 220.

31
Antras, P., D. Chor, T. Fally and R. Hillberry (2012), “Measuring the Upstreamness of Production and
Trade Flows”, American Economic Review, 102 (3), pp. 412 – 416.
Bas M. (2009), “Trade, Foreign Inputs and Firms’ Decisions: Theory and Evidence”, CEPII Working
Paper N°2009-35, December 2009.
Beutel, J. (2017), “The supply and use framework of national accounts” (Chapter 3) in T. Ten Raa (ed.),
Handbook of Input-Output Analysis, Edward Elgar.
Cadestin, C., De Backer K., Desnoyers-James I., Miroudot S., Rigo D. and M. Ye (2018), “Multinational
enterprises and global value chains: the OECD analytical AMNE database”, OECD Trade Policy
Papers, No. 211, OECD Publishing, Paris.
Chong, S., Hooekstra R., Lemmers O., Van Beveren I., Van den Berg M., Van Der Wal R. and P. Verbiest
(2017), “The role of small and medium enterprises in the Dutch economy: An analysis using an
extended supply and use table”, unpublished, transmitted by the authors
De la Cruz, J., Koopman R., Wang Z. and S.-J. Wei (2011), ‘Estimating Foreign Value-Added in Mexico’s
Manufacturing exports, Office of Economics Working Paper N° 2011-04A, U.S. International Trade
Commission.
De Backer, K. and S. Miroudot (2014), “Mapping Global Value Chains”, European Central Bank
Working Paper n° 1677, Frankfurt.
Dietzenbacher, E. and I. Romero (2007), “Production chains in an interregional framework: Identification
by means of average propagation lengths”, International Regional Science Review, 30 (4), pp. 362 –
383.
Dietzenbacher E., Los B, Stehrer R., Timmer M. and G. de Vries (2013), “The Construction of World
Input-Output Tables in the WIOD Project, Economic Systems Research 25 (1), pp. 71-98.

32
Edens B., R. Hoekstra, D. Zult, O. Lemmers, H. Wilting and R. Wu (2015), “A method to create carbon
footprint estimates consistent with national accounts”, Economic Systems Research, 27 (4), pp.440-
457.
Eurostat (2008), Eurostat Manual of Supply, Use and Input-Output Tables, Luxembourg.
Fally, T. (2012), “Production staging: Measurement and facts”, Discussion Paper, University of
Colorado-Boulder.
Feenstra, R. and G. Hanson (1996), “Globalisation, Outsourcing, and Wage Inequality”, American
Economic Review, vol. 86 (2), pp.240-245
FPB (2015), “Tableaux Entrées-Sorties 2010”, Federal Planning Bureau, Brussels.
Fetzer, J. J., Highfill, T., Hossiso, K., Howells III, T. F., Strassner, E. H. and J. A. Young (2018),
“Accounting for Firm Heterogeneity within U.S. Industries: Extended Supply-Use Tables and Trade
in Value Added using Enterprise and Establishment Level Data”, Paper presented at the CRIW
Conference on the Challenges of Globalization in the Measurement of National Accounts,
Washington DC, 9-10 March 2018.
Hambÿe C. (2012), “ Analyse entrées-sorties : modèles, multiplicateurs, linkages ”, Working Paper 12-
12, Bureau fédéral du Plan, Septembre 2012.
Hambÿe, C., B. Hertveldt and B. Michel (2018), “Does consistency with detailed national data matter
for calculating carbon footprints with global multi-regional input–output tables? A comparative
analysis for Belgium based on a structural decomposition”, Journal of Economic Structures, 7:11,
https://doi.org/10.1186/s40008-018-0110-6.
Hummels, D., Ishii J. and K.-M. Yi (2001), “The nature and growth of vertical specialization in world
trade”, Journal of International Economics, 54, pp. 75 – 96.

33
Inomata, S. (2017), “Analytical frameworks for global value chains: An overview”, in Global Value
Chain Development Report 2017: Measuring and analyzing the impact of GVCs on economic
development, International Bank for Reconstruction and Development/The World Bank
Johnson, R.C. and G. Noguera (2012), “Fragmentation and Trade in Value Added Over Four Decades”,
NBER Working Paper n° 18186.
Koopman, R., Powers W., Wang Z. and S.-J. Wei (2010), “Give credit where credit is due: Tracing value
added in global production chains”, NBER Working Paper n° 16426.
Koopman, R., Wang Z. and S.-J. Wei (2012), “Estimating domestic content in exports when processing
trade is pervasive”, Journal of Development Economics, 99, pp. 178-189.
Koopman, R., Wang Z. and S.-J. Wei (2014), “Tracing Value added and Double Counting in Gross
Exports”, American Economic Review, 104(2), pp. 459 – 94
Lais, K. and E. Kolleritsch (2017), “OECD Expert Group on Extended SUTs: Final Report Austria”,
unpublished, transmitted by the authors
Los, B. (2017), “Input-output analysis of international trade”, (Chapter 8) in T. Ten Raa (ed.), Handbook
of Input-Output Analysis, Edward Elgar.
Ma, H., Z. Wang and K. Zhu (2015), “Domestic content in China’s exports and its distribution by firm
ownership”, Journal of Comparative Economics, 43, pp. 3 – 18.
Melitz, M. J. (2003), “The Impact of Trade on Intra-Industry Reallocations and Aggregate Industry
Productivity”, Econometrica, Vol. 71, No. 6, pp. 1695 - 1725.
Miller, R. E. and P. D. Blair (2009), Input-output analysis: foundations and extensions, Cambridge,
Cambridge University Press, second edition.

34
Miller, R. E. and U. Temurshoev (2013), “Output upstreamness and input downstreamness of
industries/countries in world production”, GCDC Working Papers, Vol. GD-133, University of
Groningen.
Miroudot, S., Lanz R. and A. Ragoussis (2009), “Trade in Intermediate Goods and Services”, OECD
Trade Policy Working Paper, no. 93, OECD, Paris.
OECD (2015), Terms of Reference, Expert Group on Extended Supply and Use Tables, Paris
Piacentini, M. and F. Fortanier (2015), “Firm heterogeneity and trade in value added”,
STD/CSSP/WPTGS(2015)231, OECD Publishing.
Round, J. (2001), “Feedback Effects in Interregional Input-Output Models: What have we learned?”, in
M. Lahr and E. Dietzenbacher (eds), Input-Output Analysis: Frontiers and Extensions, Palgrave, pp.
54 - 70.
Saborio, G. (2015), “Costa Rica: An Extended Supply-Use Table”, Paper prepared for 23rd IIOA
Conference, Mexico City
Timmer, M. P., Dietzenbacher E., Los B., Stehrer R. and G. J. de Vries (2015), "An Illustrated User Guide
to the World Input–Output Database: the Case of Global Automotive Production", Review of
International Economics, 23, pp.575 – 605.
Timmer, M. P., Los B., Stehrer R. and G. J. de Vries (2016), “An Anatomy of the Global Trade Slowdown
based on the WIOD 2016 Release”, GGDC research memorandum number 162, University of
Groningen.
Yamano, N. and C. Webb (2018), “Future Development of the Inter‐Country Input‐Output (ICIO)
Database for Global Value Chain (GVC) and Environmental Analyses”, Journal of Industrial
Ecology, 22 (3), pp. 487-488.

35
Table 1 – Supply table
Agriculture Mining Manufacturing Services Total
output by product
Imports Total supply
M1 M2 … S1 S2 …
X non X X non X …
Products of agriculture
Mining products
Manufactured Products M1
M2
M3
…
Services S1
S2
S3
…
Total output by industry

36
Table 2 – Use table (column disaggregation only)
Agriculture Mining Manufacturing Services Total
Intermediate inputs
Final uses Total use
M1 M2 … S1 S2 …
X non X X non X …
Products of agriculture
Mining products
Manufactured Products M1
M2
M3
…
Services S1
S2
S3
…
Total use by industry
Net taxes on products
Value added
Output

37
Table 3 – Use table for domestic production and imports
Agriculture Mining Manufacturing Services Total
Intermediate inputs
Final uses Total use
M1 M2 … S1 S2 …
X non X X non X …
Domestic
Products of agriculture
Mining products
Manufactured Products M1
M2
…
Services S1
S2
…
Imports
Products of agriculture
Mining products
Manufactured Products M1
M2
…
Services S1
S2
…
Total use by industry
Net taxes on products
Value added
Output

38
Table 4 – Use table (full disaggregation)
Agriculture Mining Manufacturing Services Total
Interme-diate inputs
Final uses Total use
M1 M2 … S1 S2 …
X non X X non X …
Domestic
Products of agriculture
Mining products
Manufactured Products X M1
M2
…
non X M1
M2
…
Services S1
S2
…
Imports
Products of agriculture
Mining products
Manufactured Products M1
M2
…
Services S1
S2
…
Total use by industry
Net taxes on products
Value added
Output

39
Table 5 Sample characteristics for manufacturing industries, 2010
Number of firms Turnover
(billion euros) Average size
(million euros) Exports
(billion euros)
Full sample1
All firms 40,194 229.7 5.7 101.3
Export-oriented firms3 2,430 (6.0%) 171.2 (74.5%) 70.4 98.2 (96.9%)
Domestic market firms 37,764 (94.0%) 58.5 (25.5%) 1.5 3.1 (3.1%)
Restricted sample2
All firms 1,710 181.2 105.9 85.9
Export-oriented firms3 980 (57.3%) 149.9 (82.8%) 153.0 83.9 (97.6%)
Domestic market firms 730 (42.7%) 31.2 (17.2%) 42.8 2.0 (2.4%)
1 The full sample comprises all firms with data on turnover and total purchases 2 The restricted sample comprises firms with supplementary SBS questionnaires 3 Export-oriented firms are those with an export to turnover ratio above 25%
Table 6 Heterogeneous supply table for Belgium, 2010 Millions of euros
Export-oriented man-ufacturers
Domestic market manufacturers Other industries Imports Total supply
Manufactured goods 135,960 47,683 10,767 161,793 356,203
Other goods and services 13,344 4,783 538,571 100,952 657,651
Total output/imports 149,304 52,467 549,338 262,745 1,013,854
Table 7 Heterogeneous use table for Belgium, 2010 Millions of euros
Export-ori-
ented manu-facturers
Domestic mar-ket manufac-
turers
Other industries
Domestic final demand
Commodity exports
Service exports
Total output /imports
Domestic Manufactured goods, export-oriented manufac-turers
14,816 3,711 9,328 10,058 96,429 1,617 135,960
Manufactured goods, do-mestic market manufactur-ers and firms in other in-dustries
8,153 6,650 16,815 13,163 10,891 2,778 58,450
Other goods and services 27,545 12,580 170,954 260,813 21,400 63,404 556,698 Imports
Manufactured goods 39,416 9,839 15,879 35,285 61,374 0 161,793
Other goods and services 26,526 3,558 49,175 7,382 14,312 0 100,952
Total use 116,456 36,338 262,151 326,702 204,407 67,799 1,013,853
Value added 32,848 16,128 287,187
Total output 149,304 52,467 549,338
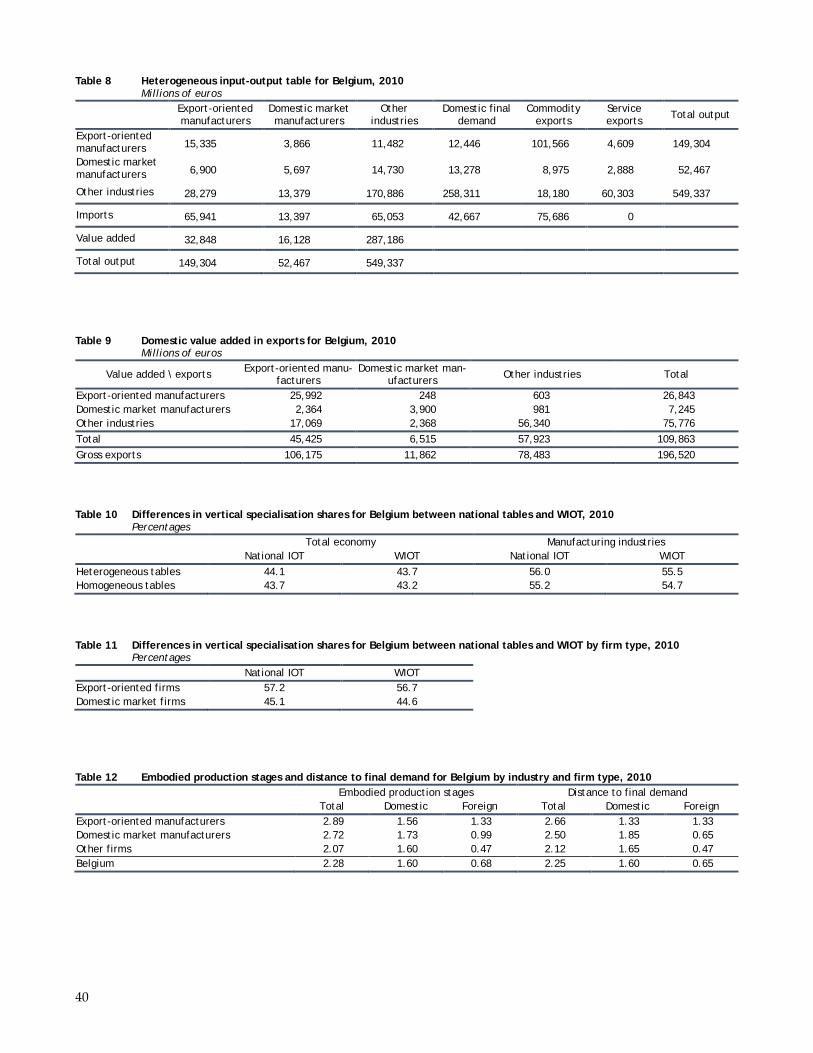
40
Table 8 Heterogeneous input-output table for Belgium, 2010 Millions of euros
Export-oriented manufacturers
Domestic market manufacturers
Other industries
Domestic final demand
Commodity exports
Service exports Total output
Export-oriented manufacturers 15,335 3,866 11,482 12,446 101,566 4,609 149,304
Domestic market manufacturers 6,900 5,697 14,730 13,278 8,975 2,888 52,467
Other industries 28,279 13,379 170,886 258,311 18,180 60,303 549,337
Imports 65,941 13,397 65,053 42,667 75,686 0
Value added 32,848 16,128 287,186
Total output 149,304 52,467 549,337
Table 9 Domestic value added in exports for Belgium, 2010 Millions of euros
Value added \ exports Export-oriented manu-facturers
Domestic market man-ufacturers Other industries Total
Export-oriented manufacturers 25,992 248 603 26,843 Domestic market manufacturers 2,364 3,900 981 7,245 Other industries 17,069 2,368 56,340 75,776 Total 45,425 6,515 57,923 109,863 Gross exports 106,175 11,862 78,483 196,520
Table 10 Differences in vertical specialisation shares for Belgium between national tables and WIOT, 2010 Percentages
Total economy Manufacturing industries National IOT WIOT National IOT WIOT Heterogeneous tables 44.1 43.7 56.0 55.5 Homogeneous tables 43.7 43.2 55.2 54.7
Table 11 Differences in vertical specialisation shares for Belgium between national tables and WIOT by firm type, 2010 Percentages
National IOT WIOT Export-oriented firms 57.2 56.7 Domestic market firms 45.1 44.6
Table 12 Embodied production stages and distance to final demand for Belgium by industry and firm type, 2010 Embodied production stages Distance to final demand Total Domestic Foreign Total Domestic Foreign
Export-oriented manufacturers 2.89 1.56 1.33 2.66 1.33 1.33 Domestic market manufacturers 2.72 1.73 0.99 2.50 1.85 0.65 Other firms 2.07 1.60 0.47 2.12 1.65 0.47 Belgium 2.28 1.60 0.68 2.25 1.60 0.65

41
Graph 1 Direct production cost structures in manufacturing, heterogenous and standard IOT, 2010 Percentages
Graph 2 Origin of domestically-sourced intermediate inputs of export-oriented and domestic market manufacturers, 2010 Percentages
Graph 3 Distribution of the industry-level correlation between technical coefficients of export-oriented and domestic market
manufacturers
22.0%
56.6%
64.6%
30.7%
36.9%
50.6%
24.3%
51.9%
61.3%
0%
10%
20%
30%
40%
50%
60%
70%
80%
Value-added to gross output ratio Share of imports in total inputs Share of imports in total inputs frommanufacturing
Export-oriented manufacturers Domestic market manufacturers Manufacturing, standard IOT
Export-oriented manufacturers, 30%
Domestic market manufacturers,
14%
Other industries, 56%
Export-oriented manufacturers
Export-oriented manufacturers, 17%
Domestic market manufacturers,
25%
Other industries,
58%
Domestic market manufacturers
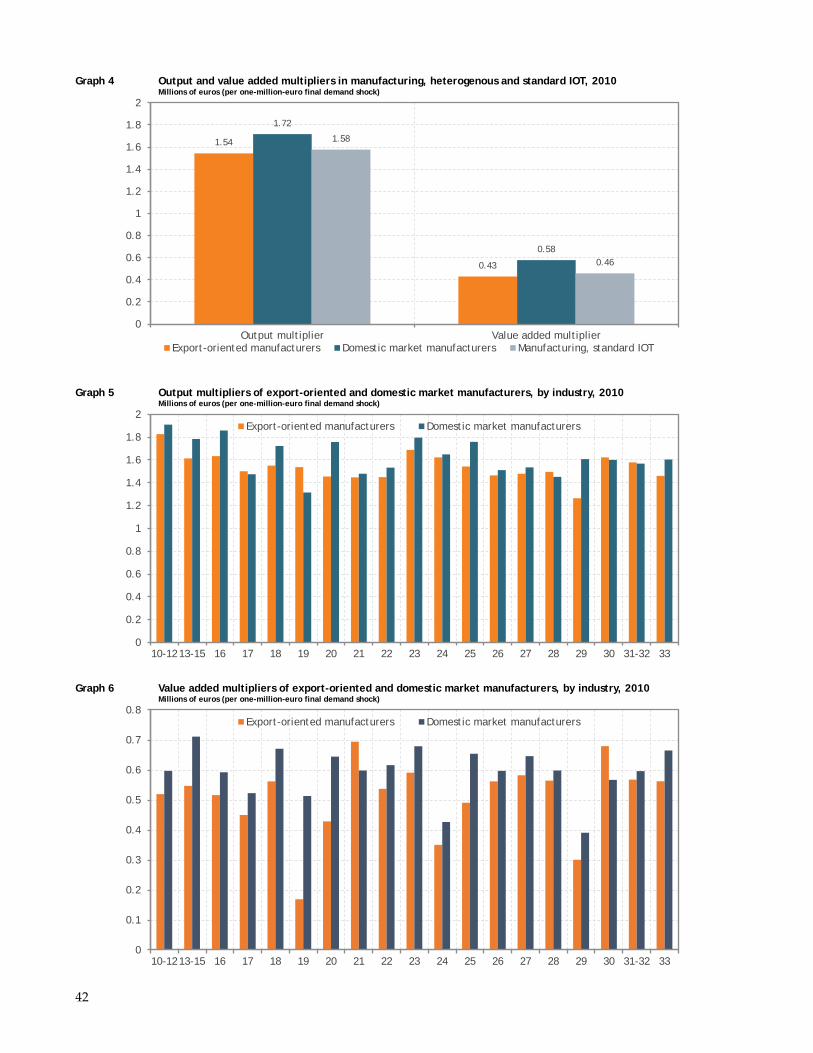
42
Graph 4 Output and value added multipliers in manufacturing, heterogenous and standard IOT, 2010 Millions of euros (per one-million-euro final demand shock)
Graph 5 Output multipliers of export-oriented and domestic market manufacturers, by industry, 2010 Millions of euros (per one-million-euro final demand shock)
Graph 6 Value added multipliers of export-oriented and domestic market manufacturers, by industry, 2010 Millions of euros (per one-million-euro final demand shock)
1.54
0.43
1.72
0.58
1.58
0.46
0
0.2
0.4
0.6
0.8
1
1.2
1.4
1.6
1.8
2
Output multiplier Value added multiplierExport-oriented manufacturers Domestic market manufacturers Manufacturing, standard IOT
0
0.2
0.4
0.6
0.8
1
1.2
1.4
1.6
1.8
2
10-12 13-15 16 17 18 19 20 21 22 23 24 25 26 27 28 29 30 31-32 33
Export-oriented manufacturers Domestic market manufacturers
0
0.1
0.2
0.3
0.4
0.5
0.6
0.7
0.8
10-12 13-15 16 17 18 19 20 21 22 23 24 25 26 27 28 29 30 31-32 33
Export-oriented manufacturers Domestic market manufacturers

43
Graph 7 Forward and backward integration into the domestic economy, export-oriented and domestic market manufacturers, 2010
Graph 8 Source of content in gross exports by industry and firm type, 2010 Millions of euros
Graph 9 Shares in domestic value added in exports and in gross exports by firm type, 2010 Percentages
0.6
0.8
1.0
1.2
1.4
1.6
0.6 0.8 1.0 1.2 1.4 1.6
Forward integration
Backward integration
Export-oriented manufacturers
0.6
0.8
1.0
1.2
1.4
1.6
0.6 0.8 1.0 1.2 1.4 1.6
Backward integration
Forward integration
Domestic market manufacturers
0
20,000
40,000
60,000
80,000
100,000
120,000
Export-oriented manufacturers Domestic market manufacturers Other industries
Value added of export-oriented manufacturers Value added of domestic market manufacturersValue added of other industries Imported content
0
0.1
0.2
0.3
0.4
0.5
0.6
0.7
0.8
Export-oriented manufacturers Domestic market manufacturers Other industriesGross exports Value added exports

44
Graph 10 Vertical specialisation shares (imported content of exports as a share of gross exports), 2010
Graph 11 Global value chain participation index, 2010 Shares in gross exports
Graph 12 Contributions to Belgium’s global value chain participation, 2010 Shares in total
0
0.1
0.2
0.3
0.4
0.5
0.6
0.7M
LT LUX
HU
NSV
KIR
LTW
NCZ
EBE
LES
TN
LD SVN
KOR
DNK
BGR
AUT
MEX
LTU
FIN
POL
SWE
LVA
ESP
PRT
FRA
DEU
CYP
ITA
HRV
TUR
ROW
CHE
GRC
ROU
CAN
GBR
CHN
IND
NO
RJP
NID
NAU
SBR
AU
SARU
S
0%
10%
20%
30%
40%
50%
60%
70%
80%
MLT LUX
SVK
HU
NTW
NCZ
EBE
LES
TN
OR
NLD IRL
AUT
SVN
RUS
BGR
CYP
POL
FIN
SWE
LTU
LVA
DNK
KOR
ROU
FRA
HRV
GRC PRT
DEU
ITA
GBR
ROW
ESP
AUS
CHE
MEX IDN
TUR
JPN
IND
USA
CAN
BRA
CHN
Backward Forward
0.70
0.26
0.55
0.06
0.07
0.06
0.24
0.68
0.38
0%
10%
20%
30%
40%
50%
60%
70%
80%
90%
100%
Backward GVC integration Forward GVC integration GVC participation indexExport-oriented manufacturers Domestic market manufacturers Other industries
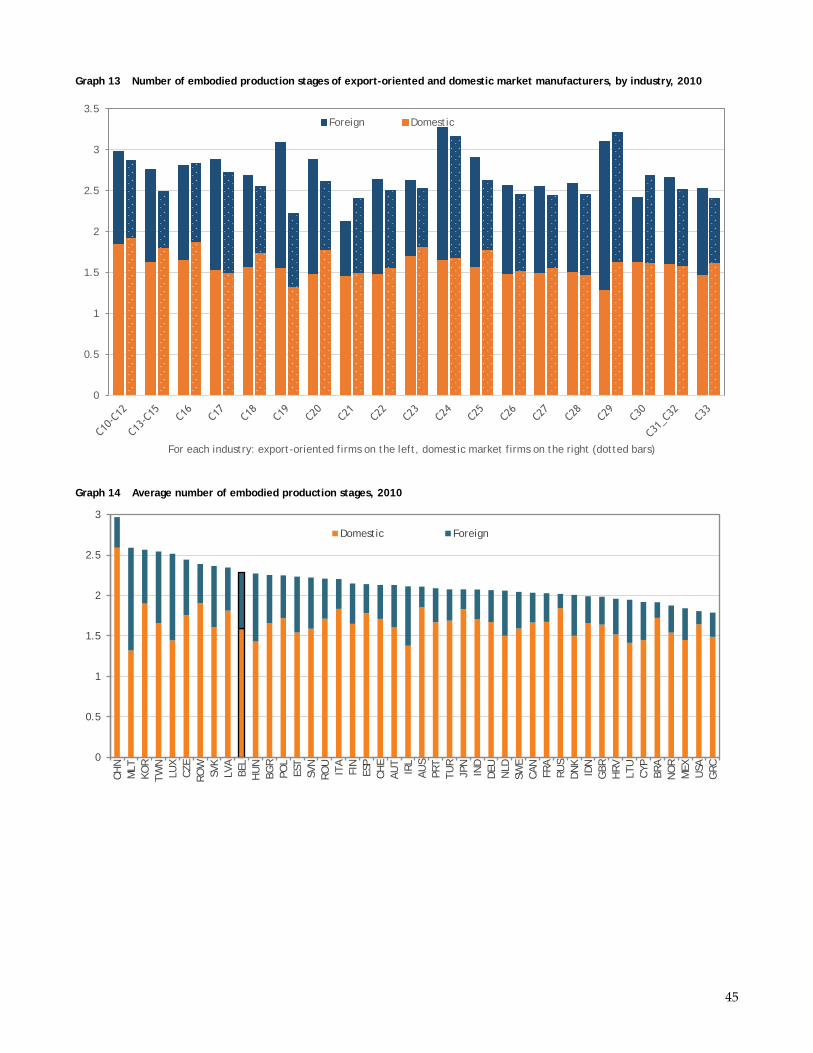
45
Graph 13 Number of embodied production stages of export-oriented and domestic market manufacturers, by industry, 2010
Graph 14 Average number of embodied production stages, 2010
0
0.5
1
1.5
2
2.5
3
3.5
For each industry: export-oriented firms on the left, domestic market firms on the right (dotted bars)
Foreign Domestic
0
0.5
1
1.5
2
2.5
3
CHN
MLT
KOR
TWN
LUX
CZE
ROW
SVK
LVA
BEL
HU
NBG
RPO
LES
TSV
NRO
UIT
AFI
NES
PCH
EAU
TIR
LAU
SPR
TTU
RJP
NIN
DDE
UN
LDSW
ECA
NFR
ARU
SDN
KID
NG
BRH
RV LTU
CYP
BRA
NO
RM
EX USA
GRC
Domestic Foreign

46
Graph 15 Distance to final demand of export-oriented and domestic market manufacturers, by industry, 2010
Graph 16 Average distance to final demand, 2010
0
0.5
1
1.5
2
2.5
3
3.5
4
For each industry: export-oriented firms on the left, domestic market firms on the right (dotted bars)
Foreign Domestic
0
0.5
1
1.5
2
2.5
3
CHN
LUX
TWN
RUS
KOR
ROW
LVA
CZE
AUS
EST
CHE
BEL
BGR
NO
RFI
NSV
KAU
TSW
ESV
NPO
LIR
LM
LTDE
UN
LD ITA
ROU
JPN
LTU
IDN
ESP
HU
NCA
NDN
KPR
TFR
AG
BRH
RVTU
RCY
PIN
DBR
AU
SAG
RC MEX
Domestic Foreign

47
Appendix
Table A1 Manufacturing industries in the A64 breakdown of the NACE Rev.2 classification
10-12 Manufacture of food products, beverages and tobacco products 13-15 Manufacture of textiles, wearing apparel and leather products 16 Manufacture of wood and of products of wood and cork, except furniture 17 Manufacture of paper and paper products 18 Printing and reproduction of recorded media 19 Manufacture of coke and refined petroleum products 20 Chemical industry 21 Manufacture of pharmaceutical products 22 Manufacture of rubber and plastic products 23 Manufacture of other non-metallic mineral products 24 Manufacture of basic metals 25 Manufacture of fabricated metal products, except machinery and equipment 26 Manufacture of computer, electronic and optical products 27 Manufacture of electrical equipment 28 Manufacture of machinery and equipment n.e.c. 29 Manufacture of motor vehicles, trailers and semi-trailers 30 Manufacture of other transport equipment 31-32 Manufacture of furniture; Other manufacturing 33 Repair and installation of machinery and equipment
Graph A1 Imported content of exports as a share of gross exports (VS share), export-oriented and domestic market manufacturers, by industry, 2010
0
0.1
0.2
0.3
0.4
0.5
0.6
0.7
0.8
0.9
10-12 13-15 16 17 18 19 20 21 22 23 24 25 26 27 28 29 30 31-32 33
Export-oriented manufacturers Domestic market manufacturers

48
Graph A2 VS share and value added to output ratio, export-oriented and domestic market manufacturers, 2010
Graph A3 VS share and share of imports in total inputs, export-oriented and domestic market manufacturers, 2010
Graph A4 Output and value added multipliers of a one million euro export shock, 2010 Millions of euros
0.00
0.10
0.20
0.30
0.40
0.50
0.60
0.00 0.20 0.40 0.60 0.80 1.00
Shar
e of
val
ue a
dded
in o
utpu
t
VS share
Export-oriented manufacturers
0.00
0.10
0.20
0.30
0.40
0.50
0.60
0.00 0.20 0.40 0.60 0.80 1.00
Shar
e of
val
ue a
dded
in o
utpu
t
VS share
Domestic market manufacturers
0.00
0.10
0.20
0.30
0.40
0.50
0.60
0.70
0.80
0.90
0.00 0.20 0.40 0.60 0.80 1.00
Shar
e of
impo
rts
in to
tal i
nput
s
VS share
Export-oriented manufacturers
0.00
0.10
0.20
0.30
0.40
0.50
0.60
0.70
0.80
0.90
0.00 0.20 0.40 0.60 0.80 1.00
Shar
e of
impo
rts
in to
tal i
nput
s
VS share
Domestic market manufacturers
1 1
0.13 0.100.07 0.15
0.340.42
0
0.2
0.4
0.6
0.8
1
1.2
1.4
1.6
1.8
2
Export-oriented manufacturers Domestic market manufacturers
Output multipliers
Export demand shock Export-oriented manufacturersDomestic market manufacturers Other industries
0.220.29
0.02
0.020.02
0.040.16
0.20
0
0.1
0.2
0.3
0.4
0.5
0.6
Export-oriented manufacturers Domestic market manufacturers
Value added multipliers
Export demand shock Export-oriented manufacturersDomestic market manufacturers Other industries