Embed Size (px)
Citation preview
i
IN AUSTRALIA’S FUTURE ENERGY
SUPPLY MIX
STORAGEENERGY
H O R I Z O NS C A N N I N G
THE ROLE OF
© Australian Council of Learned Academies (ACOLA)
ISBN 978-0-9943738-6-1
This work is copyright. All material published or otherwise created by Australian Council of Learned Academies (ACOLA) is licensed under a Creative Commons Attribution-Non-Commercial 4.0 International License.
DATE OF PUBLICATION
November 2017
PUBLISHER
Australian Council of Learned Academies Level 1, 1 Bowen Crescent Melbourne Victoria 3004 Australia Telephone: +61 (0)3 9864 0923 www.acola.org.au
SUGGESTED CITATION
Godfrey, B., Dowling, R., Forsyth, M., Grafton, R.Q. and Wyld, I., (2017) The Role of Energy Storage in Australia’s Future Energy Supply Mix. Report for the Australian Council of Learned Academies., www.acola.org.au.
REPORT DESIGN
Lyrebird [email protected]
EXPERT WORKING GROUP
Dr Bruce Godfrey FTSE (Chair)Professor Robyn Dowling (nominated by AAH)Professor Maria Forsyth FAAProfessor R. Quentin Grafton FASSA GAICD
AUTHORS
Dr Bruce Godfrey FTSE (Chair)Professor Robyn Dowling (nominated by AAH)Professor Maria Forsyth FAAProfessor R. Quentin Grafton FASSA GAICD
Support by Irene Wyld
H O R I Z O NS C A N N I N G
Australian Academy of the HumanitiesThe Australian Academy of the Humanities (AAH) advances knowledge of, and the pursuit of excellence in, the humanities in Australia. Established by Royal Charter in 1969, the Academy is an independent organisation of more than 600 elected scholars who are leaders and experts in the humanities disciplines.
The Academy promotes the contribution of the humanities disciplines for public good and to the national research and innovation system, including their critical role in the interdisciplinary collaboration required to address societal challenges and opportunities. The Academy supports the next generation of humanities researchers and teachers through its grants program, and provides authoritative and independent advice to governments, industry, the media and the public on matters concerning the humanities.
www.humanities.org.au
Working Together | ACOLAThe Australian Council of Learned Academies (ACOLA) combines the strengths of the four Australian Learned Academies: Australian Academy of the Humanities, Australian Academy of Science, Academy of Social Sciences in Australia, and Australian Academy of Technology and Engineering.
Australian Academy of ScienceThe Australian Academy of Science (AAS) is a private organisation established by Royal Charter in 1954. It comprises more than 500 of Australia’s leading scientists, elected for outstanding contributions to the life sciences and physical sciences. The Academy recognises and fosters science excellence through awards to established and early career researchers, provides evidence-based advice to assist public policy development, organises scientific conferences, and publishes scientific books and journals. The Academy represents Australian science internationally, through its National Committees for Science, and fosters international scientific relations through exchanges, events and meetings. The Academy promotes public awareness of science and its school education programs support and inspire primary and secondary teachers to bring inquiry-based science into classrooms around Australia.
www.science.org.au
AUSTRALIA’S LEARNED ACADEMIES
Academy of Social Sciences in Australia The Academy of the Social Sciences in Australia (ASSA) promotes excellence in the social sciences in Australia and in their contribution to public policy. It coordinates the promotion of research, teaching and advice in the social sciences, promotes national and international scholarly cooperation across disciplines and sectors, comment on national needs and priorities in the social sciences and provides advice to government on issues of national importance.
Established in 1971, replacing its parent body the Social Science Research Council of Australia, itself founded in 1942, the Academy is an independent, interdisciplinary body of elected Fellows. The Fellows are elected by their peers for their distinguished achievements and exceptional contributions made to the social sciences across 18 disciplines.
The Academy is an autonomous, non-governmental organisation, devoted to the advancement of knowledge and research in the various social sciences.
www.assa.edu.au
Australian Academy of Technology and EngineeringThe Australian Academy of Technology and Engineering (ATSE) advocates for a future in which technological sciences and engineering and innovation contribute significantly to Australia’s social, economic and environmental wellbeing. The Academy is empowered in its mission by some 800 Fellows drawn from industry, academia, research institutes and government, who represent the brightest and the best in technological sciences and engineering in Australia. Through engagement by our Fellows, the Academy provides robust, independent and trusted evidence-based advice on technological issues of national importance. We do this via activities including policy submissions, workshops, symposia, conferences parliamentary briefings, international exchanges and visits and the publication of scientific and technical reports. The Academy promotes science and maths education via programs focusing on enquiry-based learning, teaching quality and career promotion. ATSE fosters national and international collaboration and encourages technology transfer for economic, social and environmental benefit.
www.atse.org.au
By providing a forum that brings together great minds, broad perspectives and knowledge, ACOLA is the nexus for true interdisciplinary cooperation to develop integrated problem solving and cutting edge thinking on key issues for the benefit of Australia.
ACOLA receives funding from the Australian Government Department of Education and Training. www.acola.org.au
Lists of Tables, Figures and Boxes i
Project Aims 1Executive Summary 2Key Findings 10Background 14Introduction 18
Chapter 1 Modelling of Energy Storage Requirements for Australia 24
1 Introduction 24
1.1 Energy Storage Scenarios for Australia 26
1.2 Energy Storage Technologies and their Projected Costs 28
1.3 Modelling of System Reliability and Security 30
1.3.1 Reliability and security requirements 30
1.3.2 Overview of storage calculation process 32
1.3.3 Modelling limitations 33
1.3.4 Modelled results – storage requirements for system reliability and security 33
1.3.5 The effect of interconnectors 36
1.4 Technology Options for Storage Requirements 36
1.5 Policy and Regulatory Implications 37
1.6 Key Findings 39
Chapter 2 Opportunities for Australia in Global and Local Energy Storage Supply Chains 40
2 Introduction 40
2.1 Research and Development 41
2.1.1 Emerging energy storage technologies and Australia’s research strengths 41
2.1.2 Australia’s R&D success stories and challenges 43
2.2 Raw Resources and Beneficiation 44
2.2.1 Mineral resources and beneficiation (value-adding) 44
2.2.2 Pumped hydro resources 45
2.3 Manufacturing 46
2.3.1 Local energy storage manufacturing 46
2.3.2 Participation in global supply chains 47
2.3.3 Technology for energy storage integration and control 48
2.4 Deployment 48
2.4.1 Distributed energy storage and system integration 48
2.4.2 Grid-scale energy storage 50
2.4.3 Renewable hydrogen and ammonia 51
2.5 End of Life 52
2.5.1 Strengths and opportunities 52
2.5.2 Challenges 52
2.6 Enabling Conditions 53
2.6.1 Energy market design and regulatory frameworks 53
2.6.2 Government policy and initiatives 53
2.6.3 Access to venture capital and finance 53
2.6.4 Strategic coordination and collaboration 54
2.7 Key Findings 55
CONTENTS
Chapter 3 Environmental Benefits and Risks from Energy Storage Uptake 56
3 Introduction 56
3.1 Impact Assessment Framework 56
3.1.1 Environmental and social impacts 57
3.2 Impact Assessment 58
3.2.1 Lifecycle energy efficiency 58
3.2.2 Lifecycle greenhouse gas emissions 59
3.2.3 Supply chain criticality 59
3.2.4 Material intensity 60
3.2.5 Recyclability 60
3.2.6 Environmental health 60
3.2.7 Human rights 61
3.2.8 Health and safety 61
3.3 Maturity of Mitigation Strategies 61
3.4 Risk Analysis and Interventions 63
3.5 Key Findings 65
Chapter 4 Social Drivers and Barriers to Uptake of Energy Storage 66
4 Introduction 66
4.1 Socio-technical Uptake of Other Smart Grid Technologies 68
4.1.1 Solar PV 68
4.1.2 Smart meters 70
4.1.3 Cost reflective pricing 70
4.1.4 Energy efficiency measures 70
4.1.5 ‘Prosumers’ and energy cultures 71
4.2 Models of New Technology Acceptance 71
4.3 Methodology 72
4.4 Results 73
4.4.1 Preferred renewable energy scenario 73
4.4.2 Battery technologies 73
4.4.3 Utility scale storage 76
4.4.4 Trust, education and communication 76
4.5 Case Studies 78
4.5.1 Commercial deployment – Bundaberg, QLD 78
4.5.2 Residential deployment – Melbourne, VIC 79
Chapter 5 Conclusions 84
Appendix 1: Review of Current and Emerging Energy Storage Technologies 88
Appendix 2: Summary of Cost Data and Technical Specifications for Energy Technologies 100
Appendix 3: AEMO Generation Information by State 108
Appendix 4: Australian Organisations Involved In Energy Storage 111
Appendix 5 : Existing and Emerging Raw Resources 114
Appendix 6: Impact Assessment Framework 118
Glossary 120
Abbreviations 126
References 128
Expert Working Group 138
Acknowledgements 140
Evidence Gathering 142
Review Panel 144
i
Figure 1: Reliability (GWh) and security (GW) requirements at 2030 across the three scenarios 5
Figure 2: The ‘one-way’ traditional structure of the vertically integrated utility business model 19
Figure 3: Technology options for balancing the future grid. The number of boxes represents the technology’s ability to meet current (blue) and future (green) supply period demands. 20
Figure 4: The electricity system of the 21st century will have multiple pathways for two-way flow of both money and electricity 21
Figure 5: Balancing the energy trilemma 22
Figure 6: Total generation capacity by scenario in 2030 26
Figure 7: Generation capacity, scenarios by state 26
Figure 8: Indicative levelised cost of energy storage for bulk energy storage by technology ($A/MWh) 29
Figure 9: Changes in levelised cost of energy storage (LCOS) plotted against changes in electricity price. As shown, LCOS is proportional to the price of electricity for the energy storage technologies included. 30
Figure 10: Consecutive hours of low wind production and total low wind hours 31
Figure 11: Storage calculation overview 32
Figure 13: Reliability (GWh) and security (GW) requirements at 2030 across the three scenarios 38
Figure 14: Energy storage supply chain analysis framework 40
Figure 15: Quadrant diagram showing relative risk and exposure ratings for energy storage technologies 63
Figure 16: Summary of solar PV deployment in Australia 69
Figure 17: Graphical representation of Rogers’ Theory (1995) of technology diffusion to market which describes that successive consumer types will adopt or reject the new technology with varying propensity (shown by the brown and green bell curve). A rapid “take off” occurs as the early majority begin to adopt the new technology. Overall adoption or market share (blue S-curve) will eventually reach saturation. 71
Figure 18: 2030 energy mix, likelihood versus preference 73
Figure 19: Factors influencing purchase of storage 75
Figure 20: Levels of trust in organisations to act in the best interest of the consumer 76
Figure 21: Knowledge of home battery storage 77
Figure 22: Bundaberg Christian Colleges’ extensive solar array 78
Figure 23: Jayne and Cathy’s house with solar panels, inverter and battery system 79
Figure 24: Alkimos community storage battery container 80
LIST OF FIGURES
ii
Table 1: Storage capacity requirements under the three scenarios 5
Table 2: Overview of industry opportunities by technology across the energy storage supply chain 7
Table 3: Summary of storage requirements in 2030: LOW RE, MID RE, & HIGH RE scenarios 34
Figure 12: Cost comparisons 37
Table 5: Risk matrix comparing the “order” (low-medium-high) of environmental and social impacts across the storage technologies 62
Table 6: Summary of outcomes of SWOT analysis for energy storage 87
Box 1: Energy security and reliability in Australia’s electrical power system 3
Box 2: Inertia and Australia’s electrical power system 31
Box 3: Would batteries have prevented the South Australian blackout on 28 September 2016? 35
Box 4: Successful energy storage R&D outcomes 44
Box 5: Examples of Australian pumped hydro energy storage projects 46
Box 6: Commercialisation through international partnerships 47
Box 7: Utility and network businesses – demonstration and trials 49
Box 8: Major Expansion of the Snowy Hydro Scheme – “Snowy Hydro 2” 50
Box 9: Australian companies working on recycling 52
Box 10: Definitions for S-LCA 58
Box 11: Responses to deployment of energy storage technologies 67
Box 12: Technology readiness levels 88
LIST OF TABLES
LIST OF BOXES

1
PROJECT AIMS
Delivered as a partnership between the Australian Council of Learned Academies (ACOLA) and Australia’s Chief Scientist, the Energy Storage project studies the transformative role that energy storage may play in Australia’s energy systems; future economic opportunities and challenges; and current state of, and future trends in, energy storage technologies and their underpinning sciences.
The project examines the scientific, technological, economic and social aspects of the role that energy storage can play in Australia’s transition to a low-carbon economy to 2030, and beyond.
2
EXECUTIVE SUMMARY
Australia is undergoing an energy transformation that promises to intensify over the coming decades. In the electricity generation sector this transformation involves: a greater reliance on renewable energy in response to climate mitigation policies; relocation of where energy is generated and distributed as a result of changing economics of energy costs and technological developments; and how and when energy is consumed with the advent of ‘prosumers’1.
Energy storage is critical to a successful transformation as it provides the vital
link between energy production and consumption (See Box 1) and allows
for greater penetration of both utility scale variable renewable generation
and distributed energy generation. Without effective planning, appropriate
investment and also incentives to develop and deploy energy storage
technologies, the costs of electricity in Australia will continue to increase
and there will be less reliable (adequate and secure) electricity supply.
These could have large negative implications on the Australian economy.
1. “Active energy consumers, often called ‘prosumers’ because they both consume and produce electricity, could dramatically change the electricity system. Various types of prosumers exist: residential prosumers who produce electricity at home – mainly through solar photovoltaic panels on their rooftops, citizen-led energy cooperatives or housing associations, commercial prosumers whose main business activity is not electricity production, and public institutions like schools or hospitals.” (European Parliament Think Tank, 2016).
1. “Active energy consumers, often called ‘prosumers’ because they both consume and produce electricity, could dramatically change the electricity system. Various types of prosumers exist: residential prosumers who produce electricity at home – mainly through solar photovoltaic panels on their rooftops, citizen-led energy cooperatives or housing associations, commercial prosumers whose main business activity is not electricity production, and public institutions like schools or hospitals.” (European Parliament Think Tank, 2016).
3
Box 1: Energy security and reliability in Australia’s electrical power system
Physical energy security for electricity
generation and transmission comes from
ensuring the ability to rapidly cope, within
seconds or less, with fluctuations in energy
demand and supply. Historically, security
is provided by the ‘mechanical inertia’ of
moving turbines. This inertia allows the system
frequency (50 cycles per second in Australia)
to cope with the ups and downs of supply
and demand and ensures there is no blackout.
Indeed, blackouts occur when the frequency
drops too low because demand exceeds
supply by too much and for too long. ‘Load
shedding’, where demand is reduced or parts
of the system are ‘switched off ’, can be used –
but with big disturbances in interconnected
electricity grids there can be a cascading
failure that results in a major power disruption.
Energy storage that can provide electricity
into a grid at a moment’s notice is an
alternative to spinning turbines to provide
electricity security and balance energy
demand with supply. Adequate, appropriate
and available (i.e. connected to the grid)
energy storage in South Australia would
have likely prevented the South Australian
electricity blackout of 28 September 2016 as
well as the need for emergency load shedding
in New South Wales and South Australia in
February 2017.
Energy reliability refers to the ability to
balance electricity supply and demand over
longer periods (other than seconds to minutes
as explained above for energy security). For
instance, there may be a peak load demand
for electricity generation at the end of a very
hot summer’s day as people switch on their
air conditioners when they return home
from work. An adequate electricity supply
is needed at these times to meet this peak
demand, which may not coincide with peak
variable renewable supply. Having readily
available electricity generation sources (e.g.
gas turbine generators) that can be powered
up at these peak times can provide reliability,
but this may be an expensive option if the
plant only operates at peak demand periods.
An alternative is energy storage where the
electricity is stored in a physical (pumped
hydro), electrochemical (batteries) or high
temperature thermal (e.g. molten salts,
graphite or silicon) way when variable
renewable energy is available (such as when
the sun is shining for solar power or the wind
is blowing for wind turbines). Energy storage
is also a potentially less expensive alternative
to keeping standby power plants idle most
of the year, because of the other system
purposes to which storage can be applied
(i.e. security).
4
Uptake of Storage Solutions
Energy storage is an emerging industry
globally and the application of storage in
high volumes for both the stationary and
transport sectors is still immature. Storage
comes in many forms and can be applied in
many scenarios. These include: in-front-of-the-
meter large scale grid storage or community
based or micro grid storage; behind-the-
meter individual consumer storage coupled
to solar generation (there are more than
1.8 million buildings, mostly households, in
Australia with roof-top solar power systems);
electrified transport (buses, cars, motorcycles
and heavy and light vehicles for delivery);
new defence requirements (notably the new
submarine, unmanned aerial vehicle (UAVs)
etc.); as well as numerous other applications
with niche requirements (e.g. mining or
off-grid applications).
While acknowledging these diverse
applications for energy storage, this report
primarily considers the transformative role
that energy storage can play in Australia’s
electricity systems. It identifies future
economic opportunities and challenges and
describes the current state of and future
trends in energy storage technologies.
It examines the scientific, technological,
economic and social economy aspects of the
role that energy storage can play in Australia’s
transition to a low-carbon economy by 2030,
and beyond to a low-carbon economy.
Over the coming decade or two there is
unlikely to be only one favoured form of
storage. Based on expected-cost curves,
the most likely forms of energy storage will
include: pumped hydro, batteries, compressed
air and molten salt (coupled with solar power
generation). These different technologies have
varying costs and other characteristics, so
determining which is the ‘best’ form of energy
storage depends on where it is needed, for
what purpose (either reliability or security
or both), the nature of the electricity grid,
and the current and future types of electricity
generation.
Battery systems are the most cost effective
when stabilising the grid, provided they have
a ‘fast frequency response’ (FFR) capability
through appropriate power electronics
to synthesise the FFR, and are ready for
immediate discharge when required. By
comparison, where geology and water
availability permit, large-scale energy storage
by pumped hydro is most cost effective for
delivering energy reliability.
Both batteries and pumped hydro
technologies can provide energy security and
energy reliability. Notably, having invested
in batteries for security then the incremental
cost of adding more storage capacity for
reliability depends on the relative cost of
the battery cells and the balance of plant
(the supporting components and auxiliary
systems of a power plant needed to deliver
the energy). There will be circumstances when
adding cells to a battery storage scheme will
be cheaper than using pumped hydro, even
though pumped hydro would represent the
cheapest stand-alone solution.
Behind-the-meter energy storage will
also increase as more consumers choose
to take control of their electricity needs
(e.g. those already with solar) and with the
increasing possibility of microgrids being
established. These types of deployment offer
opportunities for aggregation of distributed
storage assets to boost security and reliability,
particularly at the local distribution level in
electricity networks.
Models and requirements for uptake
A National Electricity Market (NEM) model was
used to assess the requirements of energy
storage out to 2030. The model was based
on hourly supply and demand data for a year
5
where there was the longest period of low
availability of variable renewable resources
(worst case scenario for variable renewable
supply). Three scenarios underpinned the
modelling in this report: (1) ‘LOW RE’ low
renewable energy scenario (where variable
renewables account for approximately 35 per
cent generation); (2) ‘MID RE’, where variable
renewables account for approximately
50 per cent generation); and (3) ‘HIGH RE’, a
high renewable energy generation scenario
(where variable renewables account for
approximately 75 per cent generation).
State levels of variable renewable electricity
generation are also provided in this model,
and these could be as high as 100 per cent for
South Australia and Tasmania, depending on
the scenario.
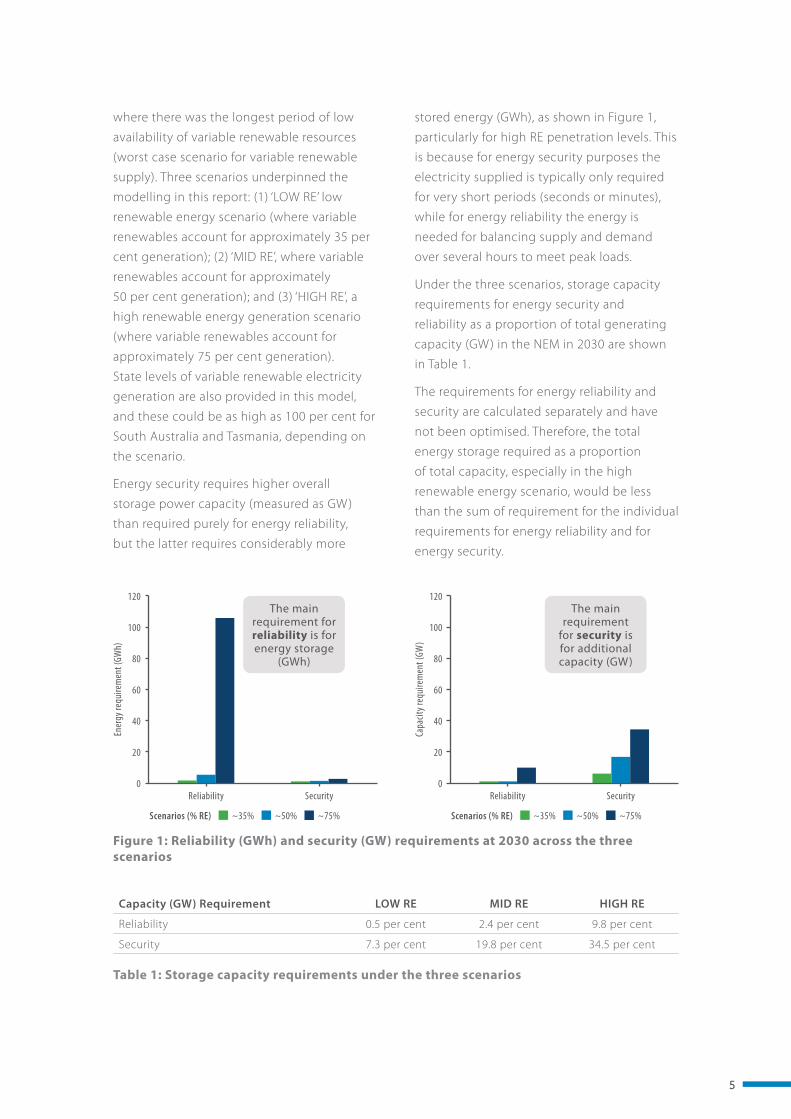
Energy security requires higher overall
storage power capacity (measured as GW)
than required purely for energy reliability,
but the latter requires considerably more
stored energy (GWh), as shown in Figure 1,
particularly for high RE penetration levels. This
is because for energy security purposes the
electricity supplied is typically only required
for very short periods (seconds or minutes),
while for energy reliability the energy is
needed for balancing supply and demand
over several hours to meet peak loads.
Under the three scenarios, storage capacity
requirements for energy security and
reliability as a proportion of total generating
capacity (GW) in the NEM in 2030 are shown
in Table 1.
The requirements for energy reliability and
security are calculated separately and have
not been optimised. Therefore, the total
energy storage required as a proportion
of total capacity, especially in the high
renewable energy scenario, would be less
than the sum of requirement for the individual
requirements for energy reliability and for
energy security.
Figure 1: Reliability (GWh) and security (GW) requirements at 2030 across the three scenarios
120
100
80
60
40
20
0
Ener
gy re
quire
men
t (GW
h)
Reliability Security
Capa
city r
equi
rem
ent (
GW)
Reliability Security
120
100
80
60
40
20
0
The main requirement for reliability is for energy storage
(GWh)
The main requirement
for security is for additional capacity (GW)
Capacity (GW) Requirement LOW RE MID RE HIGH RE
Reliability 0.5 per cent 2.4 per cent 9.8 per cent
Security 7.3 per cent 19.8 per cent 34.5 per cent
Table 1: Storage capacity requirements under the three scenarios
~50%~35% ~75%Scenarios (% RE) ~50%~35% ~75%Scenarios (% RE)
6
The costs of ensuring sufficient energy
storage depend on assumptions about the
levelised costs of storage in 2030. For energy
security alone, the costs in 2030 prices could
range from $A3.6 billion, under the LOW
RE scenario, to $A11 billion under the MID
RE scenario (which would also easily meet
the reliability requirements at that time)
and to as much as $A22 billion under the
HIGH RE scenario. By comparison, network
capital spending in the NEM is currently
between $A5–6 billion each year, equating to
approximately $A70 billion in total if this level
of expenditure is continued annually through
to 2030.
Energy storage is both a technically feasible
and an economically viable approach to
responding to Australia’s energy security and
reliability needs to 2030, even with a high
renewables generation scenario. Nevertheless,
there will need to be suitable planning and
policies, and financial incentives, for either
states or the private sector to build the
appropriate level of storage. Achieving the
right balance between technology neutrality
and making strategic choices is essential
to achieving resilient and cost-effective
outcomes.
Public Attitudes to Energy Storage
Australians’ knowledge of, and attitudes
towards, energy storage will shape
acceptance and adoption. General knowledge
of energy storage options is limited, and
largely restricted to batteries (the ‘Tesla
effect’). This lack of knowledge is one of
the factors limiting uptake of storage,
especially at the domestic scale. From focus
group and national survey work undertaken
for this report, there is low trust in the
Australian energy system’s capacity to deliver
consistent and efficient electricity provision
at reasonable prices. This low level of trust
includes government, but also extends to
energy providers and retailers. Regaining
consumer trust in the energy system,
including articulating the costs and benefits
of energy storage, is vital for enabling the
uptake of energy storage.
There is a demand for domestic scale energy
storage by households across Australia as
a means of future proofing against further
electricity price rises and to take control of
energy supply. Under certain conditions,
Australians would be willing adopters of
home-based batteries for energy storage.
These conditions include policy and market
certainty that allows households to calculate
the costs and benefits of domestic scale
storage, given that it requires significant initial
outlay. Households would also like assurances
that safety standards for batteries are in place
and adhered to, and that battery systems
are installed safely. While there is limited
consumer knowledge of storage options,
there are indications that should policy and
market settings change then uptake may
quickly follow. The experience of the post-
2008 policy framework and rollout of rooftop
solar photovoltaics (PV) is instructive for
domestic-scale energy storage. With premium
feed-in-tariffs being phased out, households
with rooftop solar PV are likely to be early
adopters of energy storage.
There is a latent demand for storage. Almost
60 per cent of people surveyed preferred a
scenario comprised of a higher renewables
mix in 2030, and nearly three-quarters of this
group preferred that energy storage, rather
than coal and gas, bolster grid reliability.
Energy storage beyond the individual
dwelling – at grid scale or for multiple
dwellings – is not well known, with pumped
hydro being the form most identified. People
have environmental concerns with pumped
hydro, but this may stem from inadequate
knowledge.

7
Opportunities for Australia
This report identifies significant energy
storage technology opportunities for
Australia across global supply chains, as
summarised in Table 2.
Australia has world-class resources of raw
materials used in battery manufacturing,
most notably lithium. Our raw materials,
together with our world-class expertise in
the development of energy storage solutions,
including batteries, the design of software
and hardware to optimise integration in smart
energy systems, and expertise in the design
and deployment of systems for off-grid energy
supply and micro-grids, demonstrate that
Australia has the potential to become a
world leader.
While the possibility of Australia becoming a
manufacturer of existing battery technologies
is highly unlikely, there is opportunity for
manufacturing of next generation battery
technologies. This is particularly true in niche
markets such as situations where safety
is paramount, defence applications, and
for Australia’s high ambient temperature
conditions. Given that current lithium-ion
technology was not designed for stationary
storage or electric vehicles, but for portable
electronics, then an Australian technology
that is purposed for a specific application
(e.g. hot conditions or defence applications)
could underpin the establishment and
growth of a local manufacturing capability.
We are currently manufacturing, for example,
lead-acid batteries specifically for Australian
submarines.
Chemical storage is identified as a potential
major new export opportunity as countries
such as Japan and Korea embrace hydrogen
energy. Australia is already committed to
supply hydrogen to Japan, but this will be
produced using coal. There are opportunities
to use our solar energy resources to produce
and export renewable hydrogen and
ammonia, enabling growth of a new industry
that may be suited to northern Australia.
While Australia is very capable in the research
and development (R&D) of energy storage
excellent opportunity good opportunity potential opportunity if blank: not applicable
*Any process that improves the economic value of a mineral ore by removing commercially worthless minerals, which results in a higher-grade product and a waste stream.
Technology Raw Resources Beneficiation* Manufacturing Deployment End of Life
Established Battery Technologies
Next-Generation Battery Technologies
Renewable Hydrogen and Ammonia
Thermal Energy Storage
Pumped Hydro Energy Storage
Integration and Control Technologies
Table 2: Overview of industry opportunities by technology across the energy storage supply chain
8
technologies, we do not have a history
of converting this in to growth in local
manufacture or the development of a local
industry, with several examples identified
where technology based on Australian
intellectual property (IP) has been developed
overseas Conditions required for Australia
to create an energy storage industry may
include the availability and support of
start-up accelerators, creation of R&D
incentives for industry to invest, and
encouraging more venture capital.
The impact and risks of the various energy
storage technologies vary. Pumped hydro was
found to be a low risk, low impact technology.
Despite the geographic limitations for
pumped hydro, and the time (years) to
implement new facilities, it is a technology
that offers much potential for deployment
in the grid.
While lithium-ion technology is the battery
technology of choice for most energy storage
applications, it comes with risks and impacts.
For example, existing technologies rely on
materials that have human rights impacts (for
example mining of cobalt in the Democratic
Republic of Congo) and availability of
lithium resources. However, there is a
potential opportunity for Australia, which
has considerable lithium resources and where
technologies for benefaction of lithium ores
are being developed.
Recycling is identified as an opportunity for
Australia, with a history of recycling more
than 90 per cent of lead-acid batteries.
Opportunities to develop technologies
to recycle components of lithium batteries
(including cobalt, nickel and lithium) could
be further encouraged and supported.
Importantly, Australia has an opportunity
to encourage product stewardship across
the whole life cycle, including responsible
sourcing of materials, development of
mining standards and sustainability
codes, and disposal.
Options for Further Work
Our findings provide reassurance that both
energy reliability and security requirements
can be met with readily available storage
technologies. Notwithstanding, the market
and technologies for energy storage and its
integration into electricity networks continue
to evolve. Research investment in the
following will be valuable:
• The optimum balance of generation,
storage and interconnection, taking into
account cost optimisation and the long-
term strategic opportunities for Australia.
• The role of ‘prosumers’ including their
effects on the market, the system (equity
and pricing concerns) and on their
contribution to the energy transformation
that is underway.
• The broader question of public literacy as
Australians’ knowledge of, and attitudes
towards, energy storage will shape its
acceptance and adoption.
• A deeper analysis of opportunities for
growth of a substantial energy storage
industry in Australia.
9
Conclusion
Over the past decade, Australia’s electricity
market has experienced change on an
unprecedented scale. In a decentralised,
yet integrated 21st century energy future,
electricity networks must enable new
opportunities for managing the complexity of
multiple pathways for flows of electricity and
payments. Energy storage has the potential to
upend the industry structures, both physical
and economic, that have defined power
markets for the last century.
There is a legitimate role for governments
to ensure that the right policy settings are
enacted to drive growth in energy storage.
Policy leadership will result in innovation,
investment, the establishment of new high
technology industries, the growth of existing
high technology industries and increased or
new energy exports. A proactive approach
will provide the opportunity for Australia to
lead and facilitate re-skilling of workforces
and the creation of jobs across all levels of the
value chain from mining and manufacturing
through to consumer spending.
“Australia needs to move much faster to ensure its energy market is keeping pace with rapid technological change. The electricity system and regulation hasn’t kept up with the furious pace of technology development …Technology is evolving so quickly … That’s really where we’re going in energy.”
Audrey Zibelman Chief Executive Officer Australian Energy Market Operator (AEMO) (Australian Financial Review, 28 March, 2017)
10
KEY FINDINGS
The key findings presented below are drawn from the four major chapters within this report – modelling of storage requirements for reliable electricity in Australia; opportunities for Australian research and industry in global and local energy storage supply chains; environmental benefits and risks from the uptake of energy storage; and the social drivers and barriers to uptake of energy storage.
1. There is a near-term requirement to strengthen energy security2 in NEM jurisdictions. Maintaining acceptable energy security levels for customers will dominate energy reliability3 requirements until well in excess of 50 per cent renewable energy penetration.4
• Batteries are cost-effective for system
security when installed with a high power-
to-energy ratio, noting that there are other
ways to strengthen system security (e.g.
installation of more fast-start gas turbines,
use of spinning reserve in wind turbines,
and demand response and load shedding
measures).
2. “System security” is the ability to deliver near-instantaneous power (GW) for short periods (seconds to minutes) as fast frequency response to withstand sudden changes or contingency events in electricity generation (e.g. failure of a large generator), transmission (loss of a transmission line) or demand.
3. “System reliability” is the ability to meet electrical energy demand (GWh) at all times of the day, the year, and in future.
4. Ensuring system reliability and system security is a core function of the Australian Energy Market Operator (AEMO).
2. At an aggregated national level5, Australia can reach penetrations of 50 per cent renewable energy without a significant requirement for storage to support energy reliability.
• Installing the levels of storage power
capacity (GW) required for the purpose of
security creates the opportunity to expand
energy stored (GWh) capacity for reliability
at a lower marginal cost than would
otherwise be the case.
• Despite significant development time,
pumped hydro energy storage (PHES)
is presently the cheapest way to meet a
reliability requirement. Projections indicate
that the most cost-effective energy storage
5. The storage requirements differ at a state level.
2. “System security” is the ability to deliver near-instantaneous power (GW) for short periods (seconds to minutes) as fast frequency response to withstand sudden changes or contingency events in electricity generation (e.g. failure of a large generator), transmission (loss of a transmission line) or demand.
3. “System reliability” is the ability to meet electrical energy demand (GWh) at all times of the day, the year, and in future.
4. Ensuring system reliability and system security is a core function of the Australian Energy Market Operator (AEMO).
5. The storage requirements differ at a state level.
11
options available in 2030 will be PHES,
lithium-ion batteries and zinc bromine
batteries. These all have similar levelised
cost of storage (LCOS), depending on the
PHES sites selected and uncertainty in the
rate of reduction of battery costs.
3. Australia is well placed to participate in global energy storage supply chains. Business opportunities will arise, given appropriate policy decisions at State and Commonwealth levels, and incentives.
• Australia has abundant raw mineral
resources for batteries (most notably
lithium), but could capture greater value
through beneficiation (value-adding to the
raw mineral resources).
• Australian companies and researchers
are commercialising their energy storage
intellectual property (software and
hardware for battery integration, design
and deployment of off-grid energy supply
and micro-grids, and battery technology
and components) through international
and global partnerships.
• Australia has abundant resources (e.g.
solar), appropriately skilled workforces
and established supply chain relationships
to generate renewable hydrogen and
ammonia at the volumes required to
supply potential export markets, such
as Japan and Korea.
4. Australia’s research and development performance in energy storage technologies is world class, but would benefit from strategic focus and enhanced collaboration.
• Australia is recognised as conducting
world-leading research in several
energy storage disciplines including
electrochemistry, materials development
and materials processing for advanced
batteries, and power system design and
modelling.
12
• Deriving the full return-on-investment
from this research requires improved
research translation through national
and international industry-research
collaboration and commercialisation.
5. The availability of private sector risk capital and profitable revenue streams for Australian energy storage start-ups and projects is a challenge for new ventures, as is policy uncertainty.
• Profitable revenue streams from energy
markets together with consistent, stable
and integrated energy and climate policies
will be essential to drive investment in
energy storage and other technology
solutions that support decarbonisation
of the electricity system while ensuring
system security and consumer equity.
• Technology-neutral market-based
reforms will be required to address these
challenges at least cost.
6. A high uptake of battery storage has a potential for significant safety, environmental and social impacts that would undermine net benefits.
• The development of safety standards is
required given anticipated rapid uptake
of batteries.
• As an early market “test bed” for batteries,
Australia has an opportunity to promote
and lead development of sustainable
supply chains from mining to disposal.
This would use Australia’s expertise in
sustainable mining to lead and support the
development of international standards.
• There are opportunities for consumers
to influence commercial behaviour
globally through improved awareness of
the environmental and social impacts of
battery development.
7. Unless planned for and managed appropriately, batteries present a future waste management challenge.
• Australia has an opportunity to play a
product stewardship role to ensure the
sustainable repurposing of used electric
vehicle batteries and recycling of all
batteries.
• Focused development of recycling
infrastructure and technology will be
crucial and provides an opportunity for
industry development and job growth.
13
8. Australians are deeply concerned by the sharp rise in electricity prices and affordability. They hold governments and energy providers directly responsible for the perceived lack of affordability.
• Deregulation of the electricity market,
changes in feed-in-tariff schemes and
other time of use tariffs have led to
an underlying general mistrust of the
government and energy providers.
• Focus group participants believe that
individual consumers who can afford
home battery storage units may elect to
become independent of the grid to avoid
rising energy costs.
9. Energy storage is not a well-known concept in the community and there are concerns that a lack of suitable standards at the household level will affect safety.
• A majority of respondents surveyed said
they did not know enough to make an
informed decision about whether to
purchase a home battery storage unit.
• Although a battery storage installation
standard is currently being developed,
there are concerns that an early incident
may have serious ramifications for
household deployment, with many
referring to the “Home Insulation
Program” failure.
• “Pumped hydro” was recognised by some
as an established utility scale technology,
but that possible “social licence” issues
may arise due to the perception of
competing land use and a potential
lack of water.
• There is an opportunity for governments
to increase the public’s knowledge and
awareness of energy systems (from
energy generation through to storage –
at utility and consumer levels).
10. Australians favour a higher renewable mix by 2030, particularly PV and wind, with significant energy storage deployed to manage grid security.
• The majority of those surveyed suggested
they would look to government to play a
role in the future energy mix, but lacked
confidence that their preference for
higher renewables would be achieved
without consistent energy policies.
1414
BACKGROUND
Delivered as a co-funded project between the Australian Council of Learned Academies (ACOLA) and Australia’s Chief Scientist, this report considers the transformative role that energy storage can play in Australia’s energy systems; identifies economic opportunities and challenges; and describes the current state of, and future trends in, energy storage technologies. It examines the scientific, technological, economic and social aspects of the role that energy storage can play in Australia’s transition to a low-carbon economy over the coming decade and beyond. While acknowledging the diverse applications and services that energy storage technologies can provide (including for transport), this report focuses on storage of low-carbon energy for electricity supply in Australia, together with industry, export and research opportunities.
This project was commissioned in July 2016.
Events since commissioning have focused
the interest of governments, industry and
the community on the potential and need
for energy storage to play a role in Australia’s
transitioning energy supply mix. These events
include:
• Extreme weather events that resulted in
South Australia’s state-wide blackout in
September 2016, and emergency load-
shedding in New South Wales and South
Australia in February 2017.
• The announcement in November 2016,
and completion on 31 March 2017, of
the closure of Hazelwood power station
in Victoria.
• Commissioning of two major reviews
by the Australian Government:
– ‘An independent review into the future
security of the National Electricity
Market’ led by Australia’s Chief Scientist,
Dr Alan Finkel (announced in October
2016); and
– A review into retail electricity pricing
in Australia to be undertaken by
the Australian Competition and
Consumer Commission (announced
in March 2017).

1515
• Establishment by the Australian Senate
in October 2016 (report published in
April 2017) of a Select Committee into
the Resilience of Electricity Infrastructure in
a Warming World. This inquiry reported
on the role of storage technologies
and localised distributed generation to
provide Australia’s electricity networks
with the resilience to withstand the
increasing severity and frequency of
extreme weather events driven by global
warming, and recommend measures that
should be taken by federal, state and local
governments to hasten the rollout of such
technologies.
• Announcement by the Minister for the
Environment and Energy in April 2017 that
a special review on power system security,
electricity prices and emission reductions
was to be delivered jointly by the Climate
Change Authority and the Australian
Energy Market Commission. The report
was delivered by 1 June 2017 to provide
advice on policies to enhance power
system security and to reduce electricity
prices consistent with achieving Australia’s
emission reduction targets in the Paris
Agreement.
16
• The development by Energy Networks
Australia and CSIRO of an Electricity
Network Transformation Roadmap
(published in April 2017) which outlines a
national plan to “keep the lights on, make
sure bills are affordable and decarbonise
our electricity industry by mid-century”
(Graham, 2017).
• Announcements by the Premiers of
South Australia and Victoria in March
2017 that their governments would
invest $A150 million and $A25 million
respectively into the delivery of energy
storage projects in support of system
security within those states.
• Announcement by the Australian
Government (March 2017) that it would
invest up to $A2 billion into the expansion
of the Snowy Mountains Hydro Scheme
(badged as Snowy Mountains Scheme 2),
with a feasibility study to be concluded by
the end of 2017.
– In the 2017 Budget, announced on
9 May, the Australian Government
indicated that it might take greater
ownership of the Snowy Mountains
Hydro Scheme from Victoria and New
South Wales.
• Announcements of major projects
involving energy storage including a
$A1 billion project led by Lyon Energy to
build a 330 MW solar farm with a 100 MW
battery with four hours of storage in South
Australia, the 250 MW Kidston solar farm
and pumped hydro storage project in
North Queensland (250 MW with six hours’
storage), and the Lakeland solar project in
North Queensland (a 10.8 MW solar farm
and a 5.3 MWh battery).
Methodology
Two underpinning phases supported the
development of this report:
• Phase I – provided an outline of the
Australian context for energy storage, an
overview of relevant policy and regulatory
developments, a range of emerging energy
storage technologies, and the potential
diversity of their application.
• Phase II – consisted of four discrete work
programs that investigated key aspects
of the market identified in Phase I.
Specifically:
– A multiple-scenario approach to model
the potential requirement for uptake
of energy storage to ensure Australia’s
energy security (undertaken by UTS:
Institute for Sustainable Futures)
– The opportunities for Australian
research and industry in global and
local energy supply chains (undertaken
by the Australian Academy of
Technology and Engineering (ATSE))
– The cradle-to-grave environmental and
safety benefits and risks presented by
uptake of energy storage (undertaken
by the UTS: Institute for Sustainable
Futures)
– The social drivers of, and barriers
to, energy storage uptake, and the
potential benefit or detriment to the
public in achieving energy storage
uptake targets (undertaken by the
University of Queensland).
17
Scope
The objective of this study has not been to
forecast the stationary6 energy mix that may
be in place at 2030, but rather to determine
the range of energy storage requirements that
may arise given possible energy generation
pathways. Three scenarios were chosen to
study likely energy storage requirements:
• LOW RE – low uptake of renewable energy
• MID RE – medium uptake of renewable
energy solutions
• HIGH RE – high uptake of renewable
energy solutions.
The three scenarios, including energy from
variable and dispatchable (able to adjust
their power output supplied to the electrical
grid on demand) renewable energy sources,
respectively account for approximately
35 per cent, 50 per cent, and 75 per cent of
total electricity generated and supplied in
2030. Sources of electricity include rooftop
solar, large-scale solar, wind, pumped
hydro or any other renewable energy
technologies included in the 2030 energy
mix. The modelling relied on other studies to
provide data and to support the anticipated
rapid expansion of small-scale storage
requirements.
The key energy storage technologies reviewed
for their potential application in Australia’s
energy mix include:
• Mechanical
– Pumped hydro energy storage (PHES)
– Compressed air energy storage (CAES)
6. Because Australia is not a vehicle-manufacturing nation, this report has not attempted to forecast local use and supply of batteries for, nor to ascertain consumers’ and other stakeholders’ views on, electric, plug-in hybrid and hybrid vehicles. However, the contribution of Australian R&D and the implications for, and opportunities from, re-purposing, recycling and disposal of transport batteries are implicitly covered in this report.
• Electrochemical
– Batteries
• Chemical
– Power-to-gas (fuel synthesis using
renewable energy)
• Thermal7
– Molten salts
– Liquid air energy storage (LAES)
• Thermo-chemical
– Ammonia dissociation-recombination
Solar fuels and algal biofuels as a storage
medium did not form part of the scope of
this work.
The energy scenarios and the key energy
storage technologies, as outlined, have
informed the development of each of the four
discrete work programs. The Expert Working
Group comprising of Fellows or nominees
from each of the four Australian Learned
Academies (Australian Academy of the
Humanities, Australian Academy of Science,
Academy of the Social Sciences in Australia,
and Australian Academy of Technology
and Engineering) identified organisations
to undertake each of the discrete work
programs. The outcomes of these programs
have, in turn, informed the development of
this report.
The individual reports that resulted from the
discrete work programs are available on the
ACOLA website (www.acola.org.au).
7. Thermal storage in this context refers to storing energy in the form of high temperature heat for later use (electricity generation, process heat for industry) as opposed to low temperature thermal storage such as solar hot water or passive solar building features.
6. Because Australia is not a vehicle-manufacturing nation, this report has not attempted to forecast local use and supply of batteries for, nor to ascertain consumers’ and other stakeholders’ views on, electric, plug-in hybrid and hybrid vehicles. However, the contribution of Australian R&D and the implications for, and opportunities from, re-purposing, recycling and disposal of transport batteries are implicitly covered in this report.
7. Thermal storage in this context refers to storing energy in the form of high temperature heat for later use (electricity generation, process heat for industry) as opposed to low temperature thermal storage such as solar hot water or passive solar building features.
18
INTRODUCTION
Electricity is both a basic part of nature (lightning being the most obvious example) and one of the most widely used forms of energy. It is a secondary energy source because primary sources of energy such as coal, natural gas, nuclear energy, solar energy and wind energy must be converted into electrical power. Electricity is also an energy carrier, which means it can be converted to other forms of energy such as mechanical energy or heat.
Traditionally, electricity is generated when
a turbine spins to create an electric current.
Energy to spin these turbines comes from
burning coal or natural gas; capturing heat
from nuclear reactions, the earth itself
(geothermal energy) or concentrated solar
energy; or harnessing the wind to rotate
wind turbine blades. Solar energy can also be
converted directly to electricity (solar PV), a
technology increasingly deployed worldwide.
Sending electricity from a generating station
to customers relies on complex transmission
and distribution networks. Transmission lines
are generally of a higher voltage to carry
more power across longer distances, while
distribution lines above or below city streets
carry power to individual consumers. Both
sets of networks are critical to deliver power
to consumers.
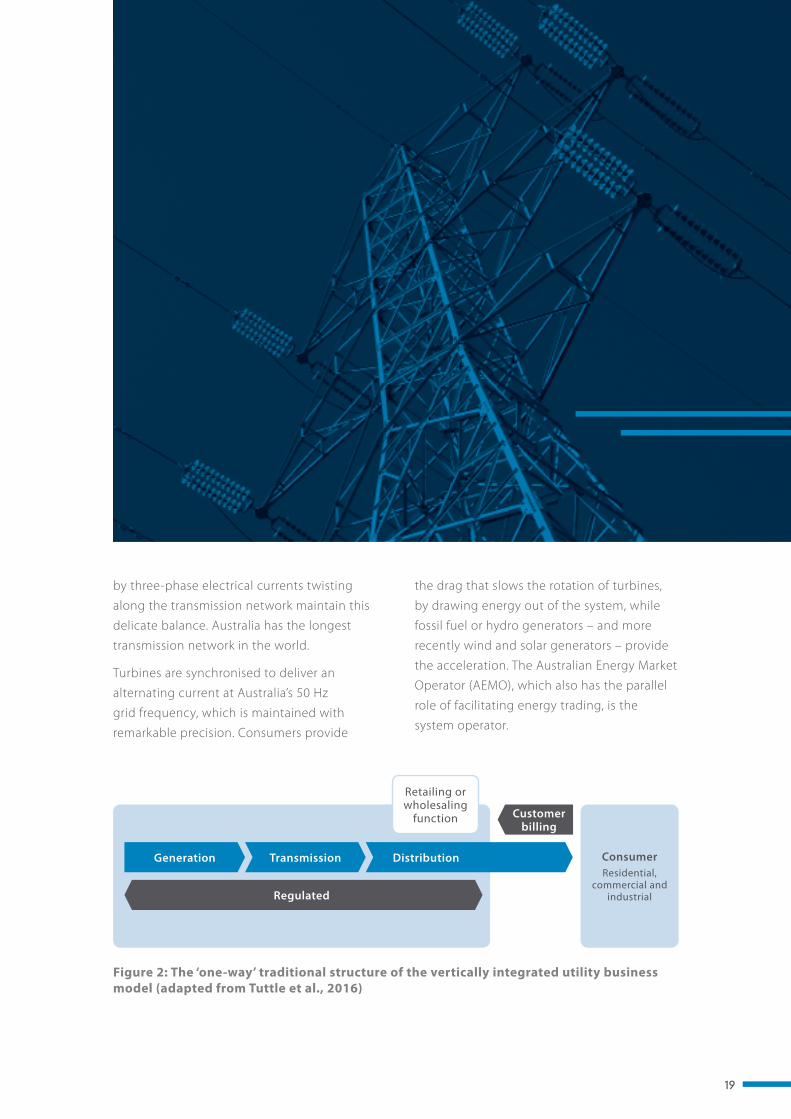
The electricity system supporting Australia’s
economy and lifestyle was built on the
economies of scale associated with large
centralised generation technologies
delivering electricity via one-way transmission
and distribution networks to industrial,
commercial and residential customers
(Figure 2). This regulated, predominantly
government-owned business model drove
down the cost of electricity, fostered universal
access, and provided reliable electric service.
To maintain a reliable and secure electricity
transmission grid, an intricate physical balance
must constantly be maintained between the
amount of power that is generated and the
amount that is consumed. Without energy
storage, once electricity is generated it must
be consumed at nearly the same time. All the
fast-spinning turbines that are joined together
19
ConsumerResidential,
commercial and industrial
Generation Transmission Distribution
Customer billing
Regulated
Retailing or wholesaling
function
Figure 2: The ‘one-way’ traditional structure of the vertically integrated utility business model (adapted from Tuttle et al., 2016)
by three-phase electrical currents twisting
along the transmission network maintain this
delicate balance. Australia has the longest
transmission network in the world.
Turbines are synchronised to deliver an
alternating current at Australia’s 50 Hz
grid frequency, which is maintained with
remarkable precision. Consumers provide
the drag that slows the rotation of turbines,
by drawing energy out of the system, while
fossil fuel or hydro generators – and more
recently wind and solar generators – provide
the acceleration. The Australian Energy Market
Operator (AEMO), which also has the parallel
role of facilitating energy trading, is the
system operator.
20
Australia’s National Electricity Market
(NEM) commenced operation in December
1998 as a wholesale market for the supply
of electricity to retailers and end-users
in Queensland, New South Wales, the
Australian Capital Territory, Victoria and
South Australia. Tasmania joined the NEM in
2005 and operations today are based in five
interconnected regions that largely follow
state boundaries. The NEM operates on the
world’s longest interconnected power system
– from Port Douglas in Queensland to Port
Lincoln in South Australia – a distance of
around 5,000 kilometres. In 2016–17 more
than $A16 billion of wholesale electricity
was traded in the NEM to meet the demand
of almost 10 million Australian Homes and
businesses (AEMO, 2017).
Over the last decade, the NEM has experienced
change on an unprecedented scale, and
that change continues unabated. State and
territory government-owned generators,
transmitters and distributors of electricity has
been variously privatised or broken up, with
intrastate and interstate retail competition
strongly encouraged and adopted.
The ownership and operating structures of
most of the businesses in Australia’s electricity
systems, and particularly in the NEM, are
radically different from those of 20 years ago.
In 2001, the Renewable Energy Target (RET )
was established by the Commonwealth
Government with the initial aim to source
two per cent of Australia’s electricity from
renewable sources. The RET has undergone
reviews and changes since, and in January
2011 was split into two parts:
• The Large-scale Renewable Energy Target,
which creates a financial incentive to
establish and expand renewable power
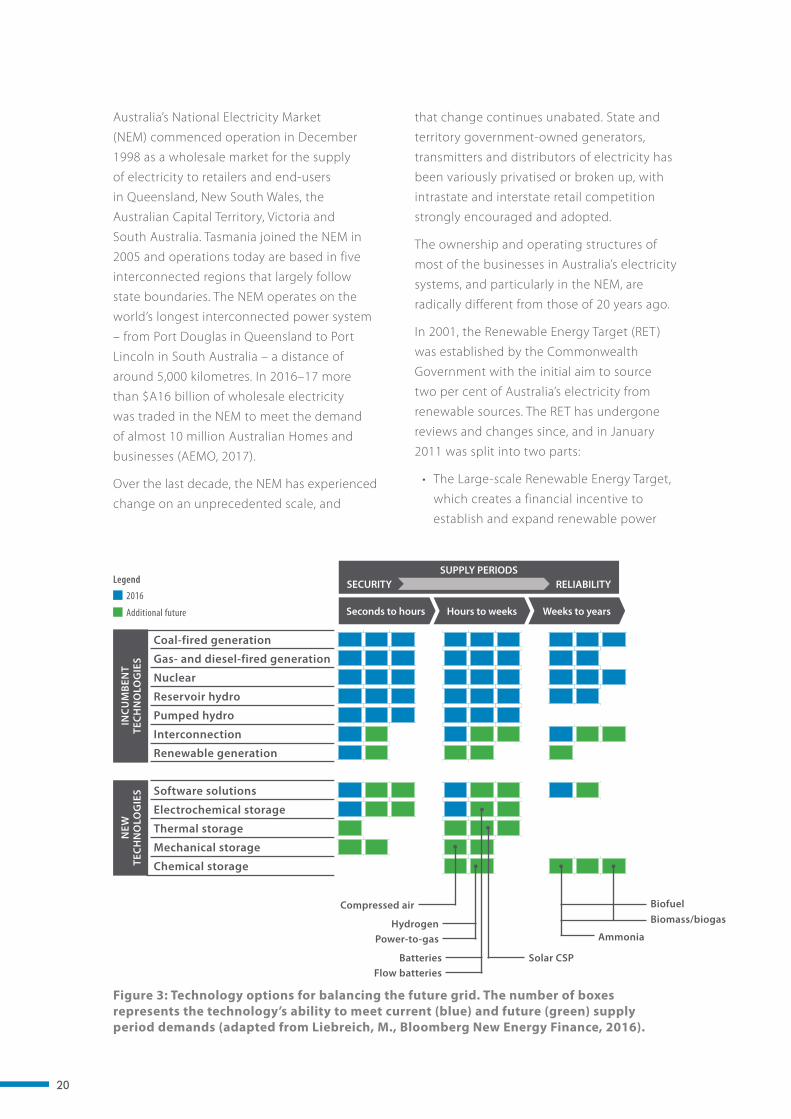
Figure 3: Technology options for balancing the future grid. The number of boxes represents the technology’s ability to meet current (blue) and future (green) supply period demands (adapted from Liebreich, M., Bloomberg New Energy Finance, 2016).
Coal-fired generation
Gas- and diesel-fired generation
Nuclear
Reservoir hydro
Pumped hydro
Interconnection
Renewable generation
Software solutions
Electrochemical storage
Thermal storage
Mechanical storage
Chemical storage
Seconds to hours Hours to weeks
SUPPLY PERIODS
AmmoniaPower-to-gasHydrogen Biomass/biogas
Flow batteriesBatteries Solar CSP
BiofuelCompressed air
2016
Additional future
Legend
INC
UM
BEN
T TE
CH
NO
LOG
IES
NEW
TE
CH
NO
LOG
IES
Weeks to years
RELIABILITYSECURITY
21
stations such as solar farms, wind farms
and hydro-electric power stations and
deliver the majority of the 33,000 GWh
2020 target.
• The Small-scale Renewable Energy Scheme
(SRES), which creates a financial incentive
for individuals and small businesses to
install eligible small-scale renewable
energy systems such as solar panel
systems, small-scale wind systems, small-
scale hydro systems, solar water heaters
and air source heat pumps.
Encouraged by the SRES as well as state and
territory technology-specific energy policies,
many Australians and Australian businesses
have invested in new generation technologies
(principally solar panel systems). This has
allowed them to take control of both their
energy use and supply (becoming ‘prosumers’)
to support action on climate change while
remaining connected to the established
electricity networks.
The positive and negative impacts of
these changes – together with a growing
range of technology options (Figure 3) –
are encouraging companies in Australia’s
electricity industry to adopt new technologies
and business models as policy makers re-
shape the regulatory regime and electricity
market structures. Australia’s continued
transition to an electricity market with greater
input from renewables will require market
regulations that are both adaptable and
dynamic to market needs.
Energy storage is seen by many as the next big change facing Australia’s electricity system. The technology can solve challenges that range from smoothing the intermittency of renewable generation to providing power quality support, and managing peak demand to reducing customers’ electricity bills. (Cavanagh et al., 2015)
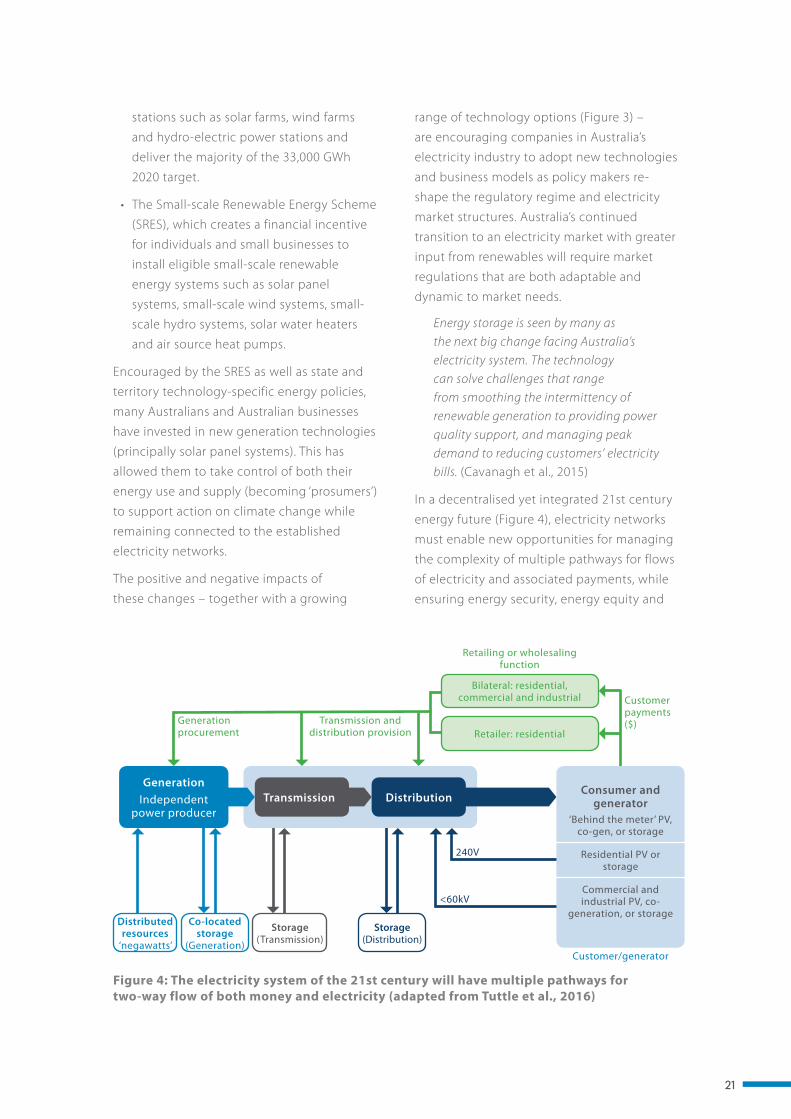
In a decentralised yet integrated 21st century
energy future (Figure 4), electricity networks
must enable new opportunities for managing
the complexity of multiple pathways for flows
of electricity and associated payments, while
ensuring energy security, energy equity and
Figure 4: The electricity system of the 21st century will have multiple pathways for two-way flow of both money and electricity (adapted from Tuttle et al., 2016)
Co-located storage
(Generation)
Consumer and generator
‘Behind the meter’ PV, co-gen, or storage
Bilateral: residential, commercial and industrial
GenerationIndependent
power producerTransmission Distribution
Commercial and industrial PV, co-
generation, or storage
Customer payments ($)Transmission and
distribution provisionGeneration procurement
Customer/generator
<60kV
240V
Retailing or wholesaling function
Retailer: residential
Distributed resources
‘negawatts’
Storage (Transmission)
Storage (Distribution)
Residential PV or storage
22
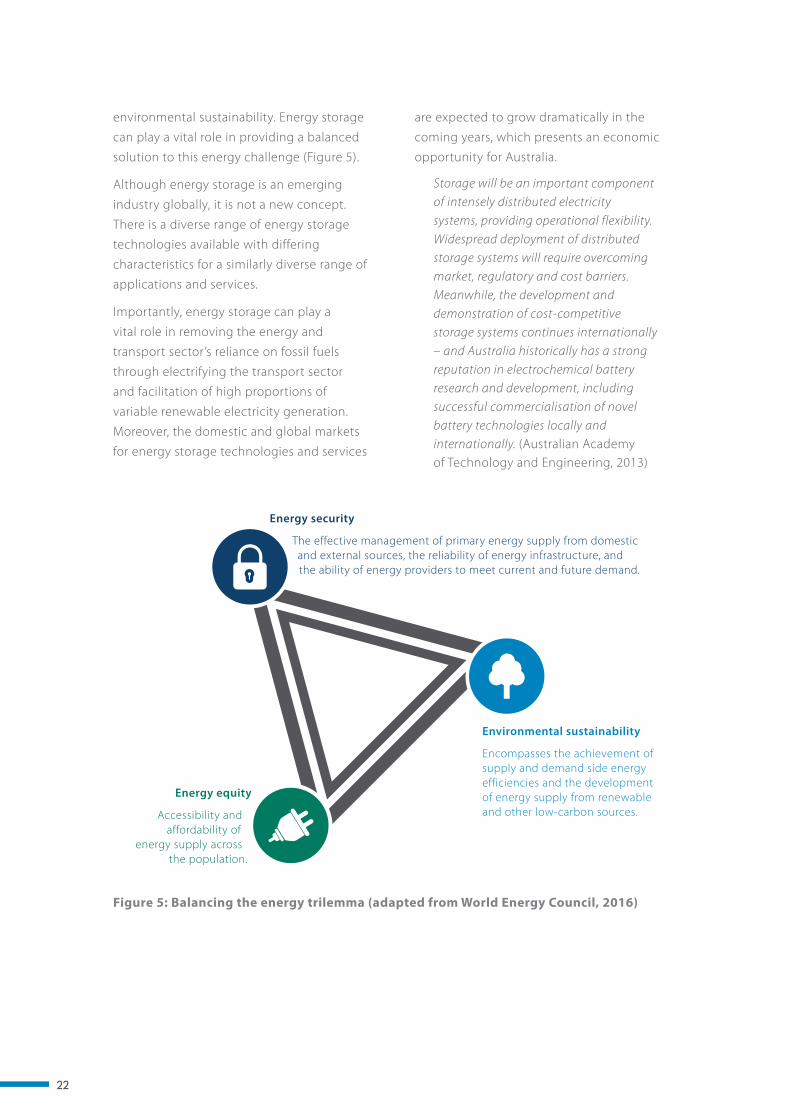
environmental sustainability. Energy storage
can play a vital role in providing a balanced
solution to this energy challenge (Figure 5).
Although energy storage is an emerging
industry globally, it is not a new concept.
There is a diverse range of energy storage
technologies available with differing
characteristics for a similarly diverse range of
applications and services.
Importantly, energy storage can play a
vital role in removing the energy and
transport sector’s reliance on fossil fuels
through electrifying the transport sector
and facilitation of high proportions of
variable renewable electricity generation.
Moreover, the domestic and global markets
for energy storage technologies and services
are expected to grow dramatically in the
coming years, which presents an economic
opportunity for Australia.
Storage will be an important component of intensely distributed electricity systems, providing operational flexibility. Widespread deployment of distributed storage systems will require overcoming market, regulatory and cost barriers. Meanwhile, the development and demonstration of cost-competitive storage systems continues internationally – and Australia historically has a strong reputation in electrochemical battery research and development, including successful commercialisation of novel battery technologies locally and internationally. (Australian Academy of Technology and Engineering, 2013)
Energy security
The effective management of primary energy supply from domestic and external sources, the reliability of energy infrastructure, and the ability of energy providers to meet current and future demand.
Energy equity
Accessibility and affordability of
energy supply across the population.
Environmental sustainability
Encompasses the achievement of supply and demand side energy efficiencies and the development of energy supply from renewable and other low-carbon sources.
Figure 5: Balancing the energy trilemma (adapted from World Energy Council, 2016)
23
Australia historically has a strong reputation
in electrochemical battery research
and development, including successful
commercialisation of novel battery technologies locally and internationally
24
CHAPTER 1 MODELLING OF ENERGY STORAGE REQUIREMENTS FOR AUSTRALIA
1 IntroductionEnergy storage and the reliability of Australia’s electricity systems are very much in the public eye. A transition towards electricity supply from renewable resources, particularly wind and solar, is accelerating as investment in renewable electricity generation and deployment continues and the potential to reduce greenhouse gas is appreciated. Despite this transformation being extensively debated, the implications for reliability of supply during this transition are not fully understood.
Energy storage has the potential to contribute
to the two aspects of reliable supply:
• System security – the ability to deliver
near-instantaneous power (GW) for short
periods (seconds to minutes) as fast
frequency response so as to withstand
sudden changes or contingency events
in electricity generation (e.g. failure of a
large generator), transmission (loss of a
transmission line) or demand.
• System reliability – the ability to meet
electric energy demand (GWh) at all times
of the day, the year, and in future.
Ensuring reliability and security are a core
function of the Australian Energy Market
Operator (AEMO) and the regulations that
underpin the market.
While there are many other uses for energy
storage that are currently driving an active
market – particularly in residential battery
storage – this report is focused on the
contribution of energy storage to reliability
of supply. The rapidly maturing supply chain
and the improving business case for energy
storage technologies are helping to make
them cost-effective.
25
Storage requirements for a given demand
profile are determined by the generation mix
available, and in particular, the proportion
of variable renewable sources such as wind
and solar, compared to dispatchable sources
such as gas, coal, hydro, or bioenergy that
can adjust their power output supplied to
the electrical grid on demand. The energy
reliability requirement will be driven by the
longest period of low variable renewable
supply, while the security requirement will be
driven by the ability of the specific generation
mix to respond to and ride through frequency
variation events.
The energy generation mix for 2030 is, of
course, unknown but is a crucial consideration
to understanding both the reliability and
the security of a power system. This study
has reviewed the likely generation mix
between a “no change” energy scenario which
involves continued growth of renewable
energy under present conditions, and a “high
renewables” scenario that has aggressive
growth towards 100 per cent renewable
energy by around the middle of the century.
Between these two scenarios is a third
scenario, “MID renewables”, that delivers
moderate growth of renewable energy.
Through these scenarios, the range of storage
requirements for reliability and security in
the NEM have been estimated. Some of the
factors that will govern the solution and key
sensitivities are also considered.
Rather than identifying specific energy
storage technologies that could be deployed
to meet the requirement, an analysis of
cost projections has been undertaken –
particularly as cost is one of the key factors
when choosing technologies.
Other factors taken into consideration include
the suitability of each technology to meet
reliability or security requirements; public
response to large-scale infrastructure projects;
geographical constraints and planning
requirements; uptake of energy storage for
purposes other than power system reliability;
safety; and the availability of alternative
solutions that do not involve energy storage.
26
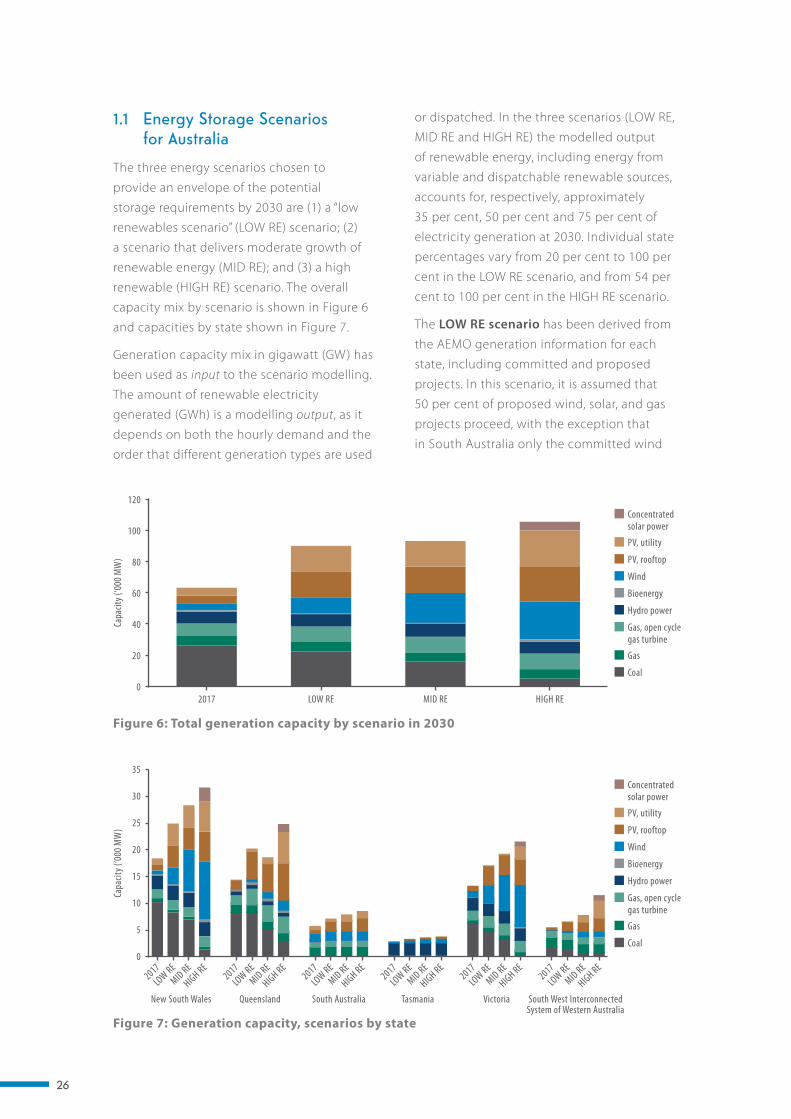
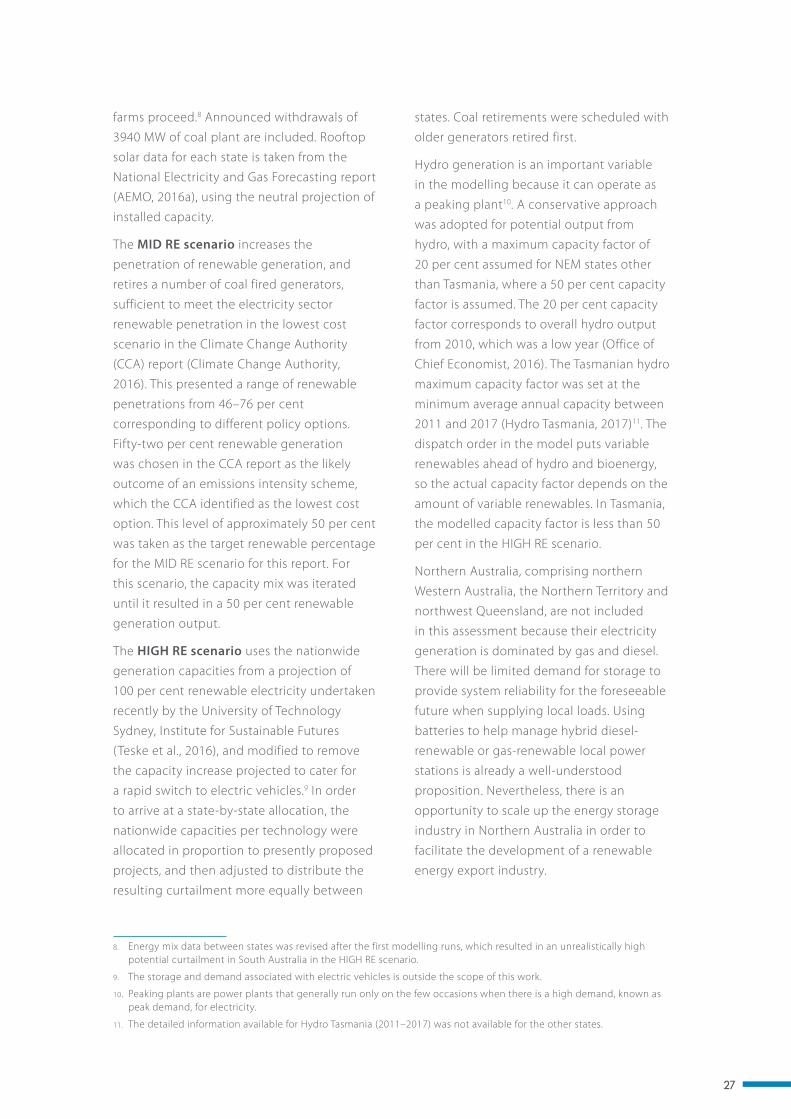
1.1 Energy Storage Scenarios for Australia
The three energy scenarios chosen to
provide an envelope of the potential
storage requirements by 2030 are (1) a “low
renewables scenario” (LOW RE) scenario; (2)
a scenario that delivers moderate growth of
renewable energy (MID RE); and (3) a high
renewable (HIGH RE) scenario. The overall
capacity mix by scenario is shown in Figure 6
and capacities by state shown in Figure 7.
Generation capacity mix in gigawatt (GW) has
been used as input to the scenario modelling.
The amount of renewable electricity
generated (GWh) is a modelling output, as it
depends on both the hourly demand and the
order that different generation types are used
or dispatched. In the three scenarios (LOW RE,
MID RE and HIGH RE) the modelled output
of renewable energy, including energy from
variable and dispatchable renewable sources,
accounts for, respectively, approximately
35 per cent, 50 per cent and 75 per cent of
electricity generation at 2030. Individual state
percentages vary from 20 per cent to 100 per
cent in the LOW RE scenario, and from 54 per
cent to 100 per cent in the HIGH RE scenario.
The LOW RE scenario has been derived from
the AEMO generation information for each
state, including committed and proposed
projects. In this scenario, it is assumed that
50 per cent of proposed wind, solar, and gas
projects proceed, with the exception that
in South Australia only the committed wind
Figure 6: Total generation capacity by scenario in 2030
120
100
80
60
40
20
0
Capa
city (
‘000
MW
)
2017 LOW RE MID RE HIGH RE
Concentrated solar power
PV, utility
PV, rooftop
Wind
Bioenergy
Hydro power
Gas, open cycle gas turbine
Gas
Coal
Figure 7: Generation capacity, scenarios by state
35
30
25
20
15
10
5
0
Capa
city (
‘000
MW
)
2017LOW RE
MID RE
HIGH RE
New South Wales Queensland South Australia Tasmania Victoria South West Interconnected System of Western Australia
2017LOW RE
MID RE
HIGH RE2017
LOW REMID RE
HIGH RE2017
LOW REMID RE
HIGH RE2017
LOW REMID RE
HIGH RE2017
LOW REMID RE
HIGH RE
PV, utility
PV, rooftop
Wind
Bioenergy
Hydro power
Gas, open cycle gas turbine
Gas
Coal
Concentrated solar power
27
farms proceed.8 Announced withdrawals of
3940 MW of coal plant are included. Rooftop
solar data for each state is taken from the
National Electricity and Gas Forecasting report
(AEMO, 2016a), using the neutral projection of
installed capacity.
The MID RE scenario increases the
penetration of renewable generation, and
retires a number of coal fired generators,
sufficient to meet the electricity sector
renewable penetration in the lowest cost
scenario in the Climate Change Authority
(CCA) report (Climate Change Authority,
2016). This presented a range of renewable
penetrations from 46–76 per cent
corresponding to different policy options.
Fifty-two per cent renewable generation
was chosen in the CCA report as the likely
outcome of an emissions intensity scheme,
which the CCA identified as the lowest cost
option. This level of approximately 50 per cent
was taken as the target renewable percentage
for the MID RE scenario for this report. For
this scenario, the capacity mix was iterated
until it resulted in a 50 per cent renewable
generation output.
The HIGH RE scenario uses the nationwide
generation capacities from a projection of
100 per cent renewable electricity undertaken
recently by the University of Technology
Sydney, Institute for Sustainable Futures
(Teske et al., 2016), and modified to remove
the capacity increase projected to cater for
a rapid switch to electric vehicles.9 In order
to arrive at a state-by-state allocation, the
nationwide capacities per technology were
allocated in proportion to presently proposed
projects, and then adjusted to distribute the
resulting curtailment more equally between
8. Energy mix data between states was revised after the first modelling runs, which resulted in an unrealistically high potential curtailment in South Australia in the HIGH RE scenario.
9. The storage and demand associated with electric vehicles is outside the scope of this work.
states. Coal retirements were scheduled with
older generators retired first.
Hydro generation is an important variable
in the modelling because it can operate as
a peaking plant10. A conservative approach
was adopted for potential output from
hydro, with a maximum capacity factor of
20 per cent assumed for NEM states other
than Tasmania, where a 50 per cent capacity
factor is assumed. The 20 per cent capacity
factor corresponds to overall hydro output
from 2010, which was a low year (Office of
Chief Economist, 2016). The Tasmanian hydro
maximum capacity factor was set at the
minimum average annual capacity between
2011 and 2017 (Hydro Tasmania, 2017)11. The
dispatch order in the model puts variable
renewables ahead of hydro and bioenergy,
so the actual capacity factor depends on the
amount of variable renewables. In Tasmania,
the modelled capacity factor is less than 50
per cent in the HIGH RE scenario.
Northern Australia, comprising northern
Western Australia, the Northern Territory and
northwest Queensland, are not included
in this assessment because their electricity
generation is dominated by gas and diesel.
There will be limited demand for storage to
provide system reliability for the foreseeable
future when supplying local loads. Using
batteries to help manage hybrid diesel-
renewable or gas-renewable local power
stations is already a well-understood
proposition. Nevertheless, there is an
opportunity to scale up the energy storage
industry in Northern Australia in order to
facilitate the development of a renewable
energy export industry.
10. Peaking plants are power plants that generally run only on the few occasions when there is a high demand, known as peak demand, for electricity.
11. The detailed information available for Hydro Tasmania (2011–2017) was not available for the other states.
8. Energy mix data between states was revised after the first modelling runs, which resulted in an unrealistically high potential curtailment in South Australia in the HIGH RE scenario.
9. The storage and demand associated with electric vehicles is outside the scope of this work.
10. Peaking plants are power plants that generally run only on the few occasions when there is a high demand, known as peak demand, for electricity.
11. The detailed information available for Hydro Tasmania (2011–2017) was not available for the other states.
28
1.2 Energy Storage Technologies and their Projected Costs
Six different energy storage technologies were
analysed (see Appendix 1). These included
three types of batteries (advanced lead acid,
lithium-ion (Li-ion) and zinc bromine (Zn-
Br)), compressed air energy storage (CAES),
pumped hydro energy storage (PHES),
concentrated solar power (CSP) molten salt
storage, and power-to-gas conversion. This
selection is based on the assumption that
only very large amounts of energy storage will
be useful for power system reliability, so only
those technologies with the best prospects of
being used for large-scale energy storage in
Australia by 2030 have been included.
The biggest challenge associated with
performing cost comparisons of energy
storage technologies is formulating a metric
that can standardise the cost comparison
while taking into account the different
imperatives of storage that each technology is
designed to meet. This is particularly difficult
for utility-scale storage solutions such as PHES
and CAES, whose costs cannot be generalised
because they are site-specific (IRENA, 2012;
Luo et al., 2014).
Energy storage specialists have approached
costing in two ways – by performing
profitability analyses of the technologies
(Locatelli, Palerma & Mancini, 2015; Parra et al.,
2016), or by calculating a discounted cost per
unit of discharged electricity (denominated in
$A/kWh or $A/MWh) known as the levelised
cost of energy storage (LCOS) (Julch, 2016),
which is effectively the levelised cost of
energy discharged from storage. LCOS is used in this study, and is defined as the total lifetime cost of an investment divided by the cumulative energy generated out of the storage medium by this investment
(Pawel, 2014). While LCOS has been used
extensively in recent literature for energy
storage cost analysis (Julch, 2016; Pawel,
2014; Zakeri & Syri, 2015) it is believed
that this is the first such Australian study
published. When considering the energy
reliability requirement, LCOS is considered
an appropriate metric as it assigns a cost
based on energy cycling through the storage
medium. Nevertheless, a different calculation
may be required to assess and compare the
costs of storage for the provision of grid
services, such as frequency regulation. The
LCOS does not measure the value of energy
storage to any given stakeholder group, but
provides a method for comparing the costs
associated with alternative energy storage
technologies. LCOS cannot be compared directly to levelised cost of energy (LCOE). As such, it is not useful to compare storage options to generation options without additional in-depth analysis.
The key inputs to the LCOS calculation are
the capital cost of the equipment, costs
associated with operations and maintenance,
the cost of the electricity to be stored, and
the technical parameters associated with the
technology, such as round-trip efficiency.12
Many of these parameters vary according to
the use case, and in particular, whether the
storage is behind or in front of the meter. The
comparisons in this report assume storage is
in front of the meter.
Data for capital costs and technical
specifications were sourced from primary
research and literature. Technical data, such
as depth of discharge (the degree to which a
battery can discharge relative to its capacity)
and round-trip efficiency, was obtained from
the literature.
12. Energy storage consumes electricity (‘charging’), saves it in some manner and then delivers it back (‘discharging’) to the consumer or electricity grid. The ratio of energy put in (in kWh, MWh or GWh, depending on the scale of the storage plant) to the energy delivered back from the storage plant is the round-trip efficiency, expressed as a percentage (%). The higher the round-trip efficiency, the less energy is lost due to storage and thus the more efficient the system is as whole.
12. Energy storage consumes electricity (‘charging’), saves it in some manner and then delivers it back (‘discharging’) to the consumer or electricity grid. The ratio of energy put in (in kWh, MWh or GWh, depending on the scale of the storage plant) to the energy delivered back from the storage plant is the round-trip efficiency, expressed as a percentage (%). The higher the round-trip efficiency, the less energy is lost due to storage and thus the more efficient the system is as whole.
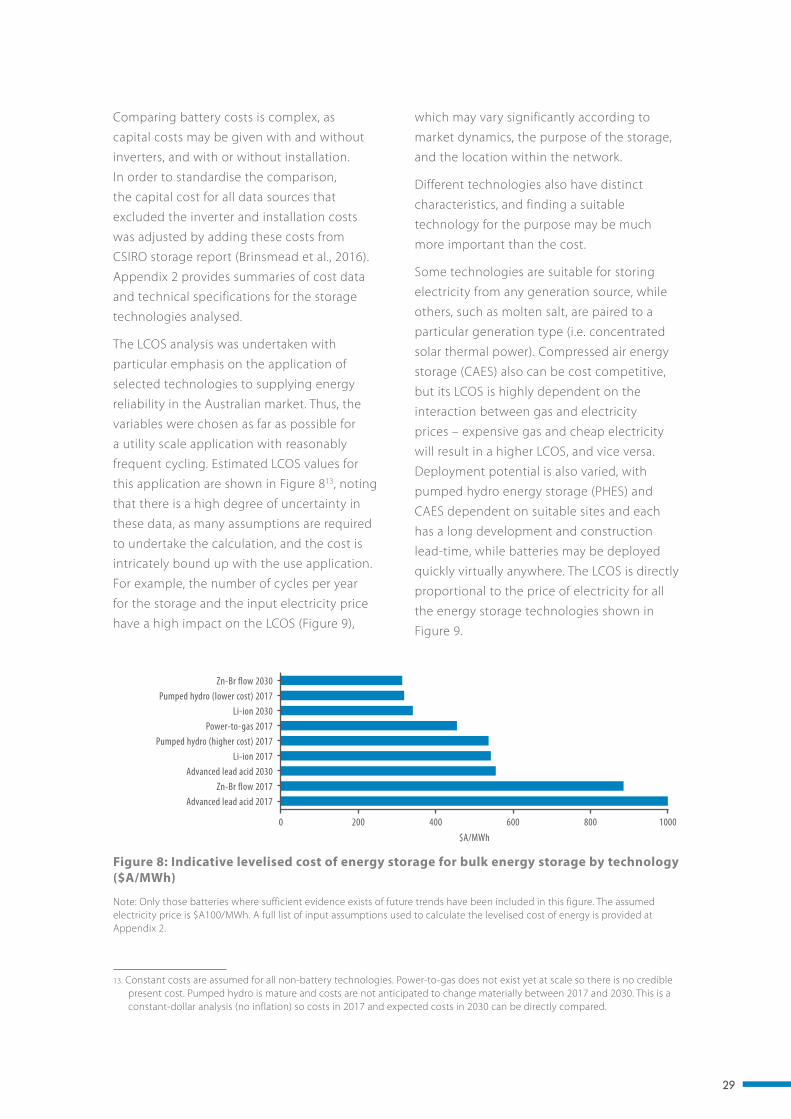
29
Comparing battery costs is complex, as
capital costs may be given with and without
inverters, and with or without installation.
In order to standardise the comparison,
the capital cost for all data sources that
excluded the inverter and installation costs
was adjusted by adding these costs from
CSIRO storage report (Brinsmead et al., 2016).
Appendix 2 provides summaries of cost data
and technical specifications for the storage
technologies analysed.
The LCOS analysis was undertaken with
particular emphasis on the application of
selected technologies to supplying energy
reliability in the Australian market. Thus, the
variables were chosen as far as possible for
a utility scale application with reasonably
frequent cycling. Estimated LCOS values for
this application are shown in Figure 813, noting
that there is a high degree of uncertainty in
these data, as many assumptions are required
to undertake the calculation, and the cost is
intricately bound up with the use application.
For example, the number of cycles per year
for the storage and the input electricity price
have a high impact on the LCOS (Figure 9),
13. Constant costs are assumed for all non-battery technologies. CAES costs are derived from the two existing plants (which are not new) and, therefore, there has been no scale up of this technology so constant costs are assumed. Power-to-gas does not exist yet at scale so there is no credible present cost. Pumped hydro is mature and costs are not anticipated to change materially between 2017 and 2030. This is a constant-dollar analysis (no inflation) so costs in 2017 and expected costs in 2030 can be directly compared.
which may vary significantly according to
market dynamics, the purpose of the storage,
and the location within the network.
Different technologies also have distinct
characteristics, and finding a suitable
technology for the purpose may be much
more important than the cost.
Some technologies are suitable for storing
electricity from any generation source, while
others, such as molten salt, are paired to a
particular generation type (i.e. concentrated
solar thermal power). Compressed air energy
storage (CAES) also can be cost competitive,
but its LCOS is highly dependent on the
interaction between gas and electricity
prices – expensive gas and cheap electricity
will result in a higher LCOS, and vice versa.
Deployment potential is also varied, with
pumped hydro energy storage (PHES) and
CAES dependent on suitable sites and each
has a long development and construction
lead-time, while batteries may be deployed
quickly virtually anywhere. The LCOS is directly
proportional to the price of electricity for all
the energy storage technologies shown in
Figure 9.
Figure 8: Indicative levelised cost of energy storage for bulk energy storage by technology ($A/MWh)
Zn-Br flow 2030Pumped hydro (lower cost) 2017
Li-ion 2030Power-to-gas 2017
Pumped hydro (higher cost) 2017Li-ion 2017
Advanced lead acid 2030Zn-Br flow 2017
Advanced lead acid 2017
$A/MWh10004000 800200 600
Note: Only those batteries where sufficient evidence exists of future trends have been included in this figure. The assumed electricity price is $A100/MWh. A full list of input assumptions used to calculate the levelised cost of energy is provided at Appendix 2.
13. Constant costs are assumed for all non-battery technologies. Power-to-gas does not exist yet at scale so there is no credible present cost. Pumped hydro is mature and costs are not anticipated to change materially between 2017 and 2030. This is a constant-dollar analysis (no inflation) so costs in 2017 and expected costs in 2030 can be directly compared.

30
Li-ion 2030
Zn-Br flow 2030
Pumped hydro (lower cost) 2030
Pumped hydro (higher cost) 2030
1.3 Modelling of System Reliability and Security
The modelling was designed to provide the
minimum credible analysis to estimate an
energy storage requirement for reliability,
accounting for:
• The characteristics of the technologies
• The existing energy mix in Australia and its
potential changes until 2030
• Major interconnectors between states
(which are separate market regions).
The distinctly different approaches taken
by each jurisdiction means that this report
must apply a separate analyse to each in
order to gauge the reliability and security
requirements for energy storage.
1.3.1 Reliability and security requirements
Understanding reliability, the ability to meet
demand, requires a time-series model of
available energy sources and energy demand.
A model with minimum complexity to study
power system reliability is based on an hourly
analysis of supply and demand in each state. The
key sources of variability are wind generation
and solar generation. Demand-controllable
generation sources, along with energy storage,
are dispatched to meet any demand that is not
supplied by wind and solar generation. Hourly
resolution is sufficient to resolve mismatches
in supply and demand that would influence
energy reliability, and, if sustained, would
make it difficult to meet demand.
Because system reliability is limited by any
supply constraint, the analysis of storage
requirements depends on statistical extremes
and is sensitive to the selection of input data,
in particular the choice of year for wind and
solar data. To model the storage requirement
for system reliability, the year with the most
extended period of low wind – 2010 – was
selected from the available data set (2003–
2010). This was done by calculating the longest
period for which wind output was lower than
20 per cent of the rated capacity (see Figure 10).
The low wind output should result in the
greatest requirement for energy reliability
storage. Given that solar irradiance is
influenced by the same weather systems that
determine the wind, solar energy output is
partially correlated with wind energy output.
Hence, the same year of data was used for
both resources to ensure that the model
accounted for this correlation.
Figure 9: Changes in levelised cost of energy storage (LCOS) plotted against changes in electricity price. As shown, LCOS (2030) is proportional to the price of electricity for the energy storage technologies included.
1000
800
600
400
200
0
$A/M
Wh
Electricity price ($A/MWh)0 100 200 300 400
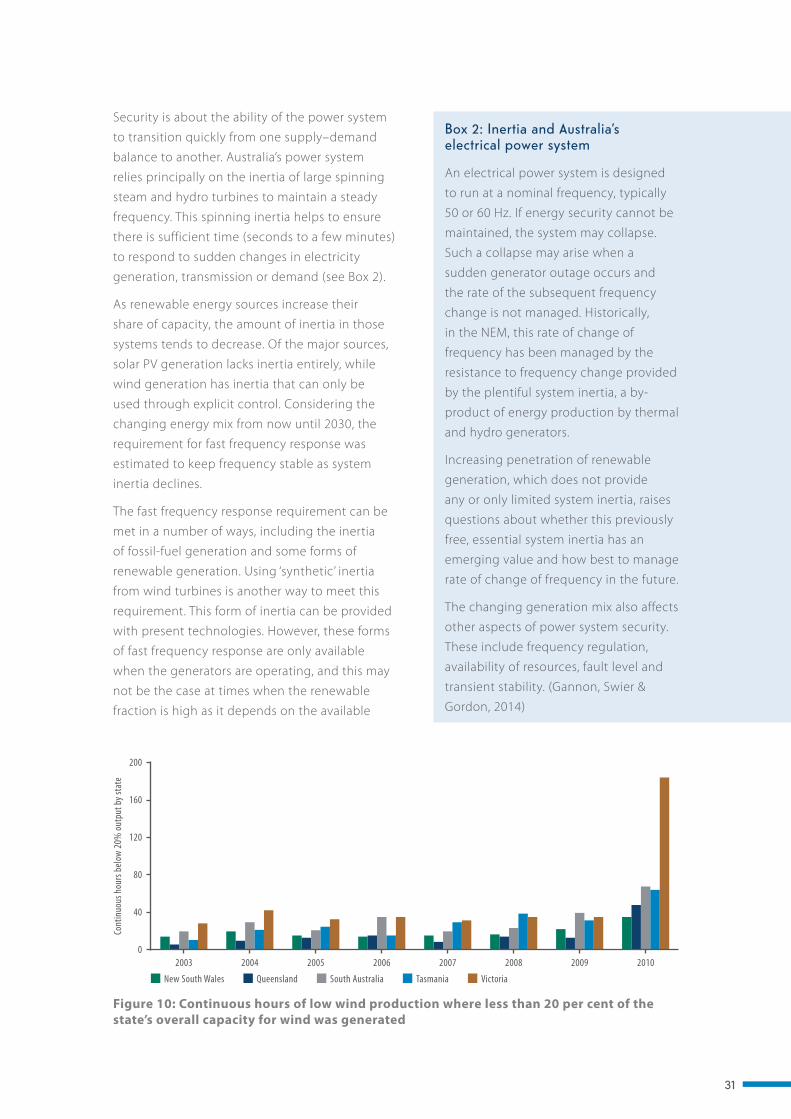
31
Security is about the ability of the power system
to transition quickly from one supply–demand
balance to another. Australia’s power system
relies principally on the inertia of large spinning
steam and hydro turbines to maintain a steady
frequency. This spinning inertia helps to ensure
there is sufficient time (seconds to a few minutes)
to respond to sudden changes in electricity
generation, transmission or demand (see Box 2).
As renewable energy sources increase their
share of capacity, the amount of inertia in those
systems tends to decrease. Of the major sources,
solar PV generation lacks inertia entirely, while
wind generation has inertia that can only be
used through explicit control. Considering the
changing energy mix from now until 2030, the
requirement for fast frequency response was
estimated to keep frequency stable as system
inertia declines.
The fast frequency response requirement can be
met in a number of ways, including the inertia
of fossil-fuel generation and some forms of
renewable generation. Using ‘synthetic’ inertia
from wind turbines is another way to meet this
requirement. This form of inertia can be provided
with present technologies. However, these forms
of fast frequency response are only available
when the generators are operating, and this may
not be the case at times when the renewable
fraction is high as it depends on the available
Figure 10: Continuous hours of low wind production where less than 20 per cent of the state’s overall capacity for wind was generated
200
160
120
80
40
0
Cont
inuo
us h
ours
belo
w 20
% ou
tput
by s
tate
2003 2004 2005 2006 2007 2008 2009 2010
VictoriaSouth Australia TasmaniaQueenslandNew South Wales
Box 2: Inertia and Australia’s electrical power system
An electrical power system is designed
to run at a nominal frequency, typically
50 or 60 Hz. If energy security cannot be
maintained, the system may collapse.
Such a collapse may arise when a
sudden generator outage occurs and
the rate of the subsequent frequency
change is not managed. Historically,
in the NEM, this rate of change of
frequency has been managed by the
resistance to frequency change provided
by the plentiful system inertia, a by-
product of energy production by thermal
and hydro generators.
Increasing penetration of renewable
generation, which does not provide
any or only limited system inertia, raises
questions about whether this previously
free, essential system inertia has an
emerging value and how best to manage
rate of change of frequency in the future.
The changing generation mix also affects
other aspects of power system security.
These include frequency regulation,
availability of resources, fault level and
transient stability. (Gannon, Swier &
Gordon, 2014)
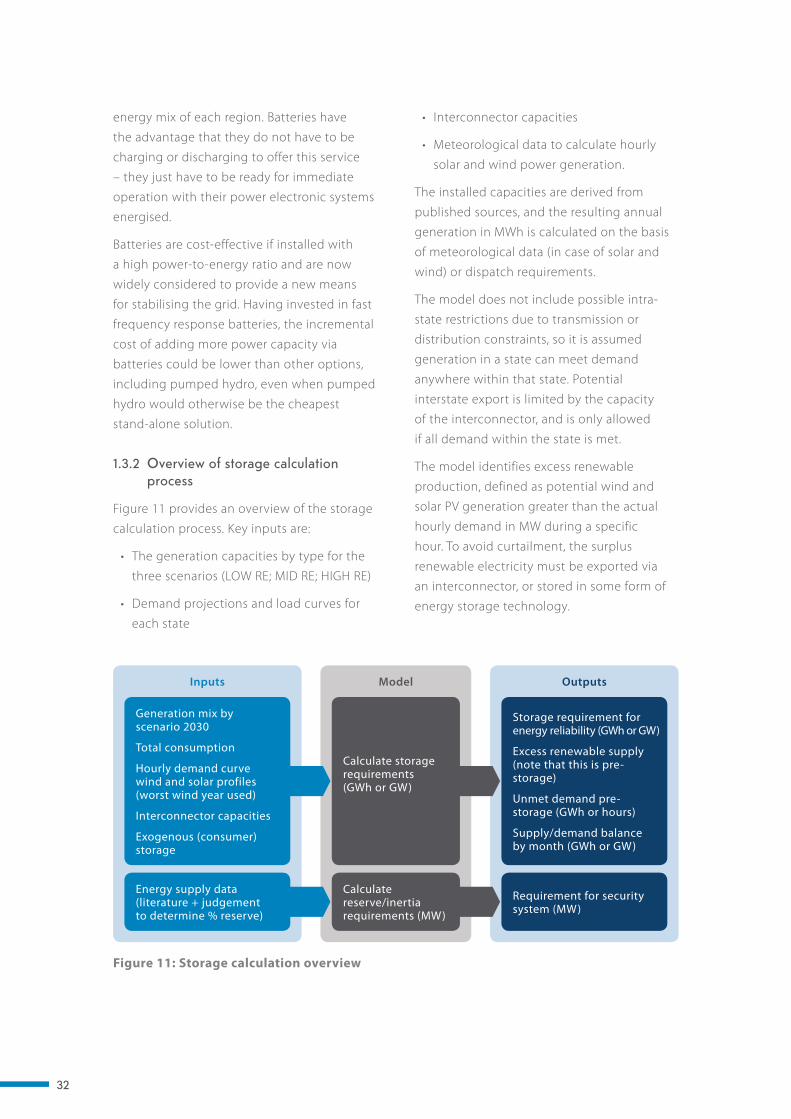
32
energy mix of each region. Batteries have
the advantage that they do not have to be
charging or discharging to offer this service
– they just have to be ready for immediate
operation with their power electronic systems
energised.
Batteries are cost-effective if installed with
a high power-to-energy ratio and are now
widely considered to provide a new means
for stabilising the grid. Having invested in fast
frequency response batteries, the incremental
cost of adding more power capacity via
batteries could be lower than other options,
including pumped hydro, even when pumped
hydro would otherwise be the cheapest
stand-alone solution.
1.3.2 Overview of storage calculation process
Figure 11 provides an overview of the storage
calculation process. Key inputs are:
• The generation capacities by type for the
three scenarios (LOW RE; MID RE; HIGH RE)
• Demand projections and load curves for
each state
• Interconnector capacities
• Meteorological data to calculate hourly
solar and wind power generation.
The installed capacities are derived from
published sources, and the resulting annual
generation in MWh is calculated on the basis
of meteorological data (in case of solar and
wind) or dispatch requirements.
The model does not include possible intra-
state restrictions due to transmission or
distribution constraints, so it is assumed
generation in a state can meet demand
anywhere within that state. Potential
interstate export is limited by the capacity
of the interconnector, and is only allowed
if all demand within the state is met.
The model identifies excess renewable
production, defined as potential wind and
solar PV generation greater than the actual
hourly demand in MW during a specific
hour. To avoid curtailment, the surplus
renewable electricity must be exported via
an interconnector, or stored in some form of
energy storage technology.
Figure 11: Storage calculation overview
Inputs Outputs
Calculate storage requirements (GWh or GW)
Calculate reserve/inertia requirements (MW)
Model
Generation mix by scenario 2030
Total consumption
Hourly demand curve wind and solar profiles (worst wind year used)
Interconnector capacities
Exogenous (consumer) storage
Storage requirement for energy reliability (GWh or GW)
Excess renewable supply (note that this is pre-storage)
Unmet demand pre-storage (GWh or hours)
Supply/demand balance by month (GWh or GW)
Energy supply data (literature + judgement to determine % reserve)
Requirement for security system (MW)
33
Within the model, excess renewable
production accumulates through the dispatch
order. If storage is present, it will charge
within the limits of the input capacity. If no
storage is included, this potential excess
renewable production is reported as “potential
curtailment” (pre-storage).
Although not brought explicitly into the
modelling, energy storage installed for other
uses is considered as potentially available
to meet a storage requirement for power
system reliability or security. For example,
it has been assumed that a large amount of
behind-the-meter consumer battery storage
will be installed by 2030, independent of NEM
system requirements. As another example,
while electric vehicles are likely to create
considerable electric energy demand by
2030, they come with storage. Provided their
charging regimes are managed to some
degree, their impact on energy supply and
additional energy storage requirement can
be ignored at a first level of approximation.
Nevertheless, manufacturers should consider
this issue as they are designing grid-support
functions into their vehicles and charging
stations.
1.3.3 Modelling limitations
The model developed for this report is not a
power system model of Australia’s electricity
grid and cannot simulate consumer or
generator behaviour. Nevertheless, it does
carry out an hour-by-hour calculation of the
energy supply balance and calculates the
storage required to compensate for extended
low supply periods. Key limitations are:
• The model does not take account of
distribution or transmission constraints. If
there is variable renewable generation in
the system, it can go into any utility scale
storage in front of the meter, providing the
storage is not fully charged.
• For those dispatchable technologies
(namely hydro and bioenergy) where a
maximum capacity factor over the year
is imposed, this is achieved by reducing
the effective load continuously until
that capacity factor is achieved. This is a
simplification, but would tend to increase
any storage requirement.
• Interconnectors can only connect one step
(e.g. surplus wind from South Australia
coming into Victoria cannot supply New
South Wales).
• All scenarios have been calculated with
the same dispatch order14 to achieve
comparable results, but in order to
calculate the storage requirement, storage
(other than consumer storage) has been
put last in the dispatch order. In the
real world, storage is likely to overlap
considerably with dispatchable generation,
as increasing cycle numbers reduce the
levelised cost of energy storage. This
means curtailment should be lower in
the real world compared to model results.
1.3.4 Modelled results – storage requirements for system reliability and security
Table 3 shows the energy storage
requirements indicated by this study for the
NEM as a whole. Quantity of energy (GWh)
(highlighted in red) is most important for
system reliability, while system security
requires near-instantaneous delivery of
power (GW) to compensate for sudden
shocks to system operation. A summary of
Australian Energy Market Operator generation
information for system reliability and security
on a state-by-state basis in the NEM is
provided in Appendix 3.
14. An instruction issued by system management to an electricity generator.
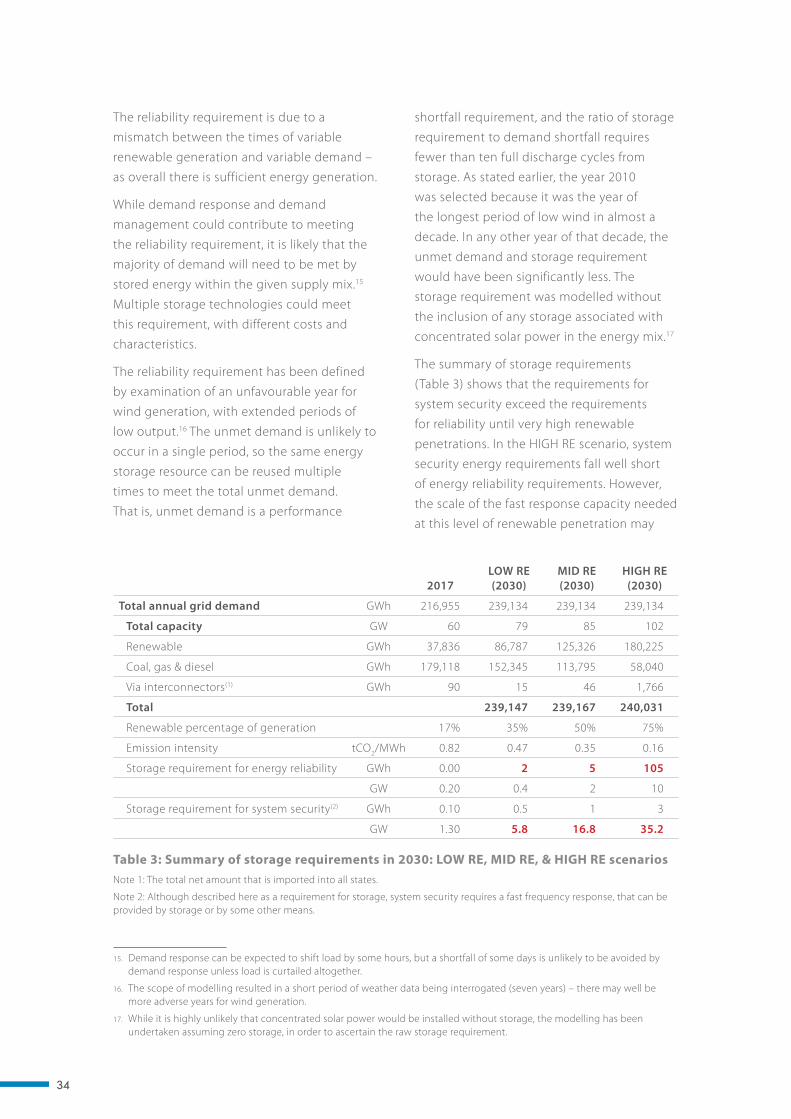
34
shortfall requirement, and the ratio of storage
requirement to demand shortfall requires
fewer than ten full discharge cycles from
storage. As stated earlier, the year 2010
was selected because it was the year of
the longest period of low wind in almost a
decade. In any other year of that decade, the
unmet demand and storage requirement
would have been significantly less. The
storage requirement was modelled without
the inclusion of any storage associated with
concentrated solar power in the energy mix.17
The summary of storage requirements
(Table 3) shows that the requirements for
system security exceed the requirements
for reliability until very high renewable
penetrations. In the HIGH RE scenario, system
security energy requirements fall well short
of energy reliability requirements. However,
the scale of the fast response capacity needed
at this level of renewable penetration may
17. While it is highly unlikely that concentrated solar power would be installed without storage, the modelling has been undertaken assuming zero storage, in order to ascertain the raw storage requirement.
The reliability requirement is due to a
mismatch between the times of variable
renewable generation and variable demand –
as overall there is sufficient energy generation.
While demand response and demand
management could contribute to meeting
the reliability requirement, it is likely that the
majority of demand will need to be met by
stored energy within the given supply mix.15
Multiple storage technologies could meet
this requirement, with different costs and
characteristics.
The reliability requirement has been defined
by examination of an unfavourable year for
wind generation, with extended periods of
low output.16 The unmet demand is unlikely to
occur in a single period, so the same energy
storage resource can be reused multiple
times to meet the total unmet demand.
That is, unmet demand is a performance
15. Demand response can be expected to shift load by some hours, but a shortfall of some days is unlikely to be avoided by demand response unless load is curtailed altogether.
16. The scope of modelling resulted in a short period of weather data being interrogated (seven years) – there may well be more adverse years for wind generation.
Table 3: Summary of storage requirements in 2030: LOW RE, MID RE, & HIGH RE scenarios Note 1: The total net amount that is imported into all states.
Note 2: Although described here as a requirement for storage, system security requires a fast frequency response, that can be provided by storage or by some other means.
15. Demand response can be expected to shift load by some hours, but a shortfall of some days is unlikely to be avoided by demand response unless load is curtailed altogether.
16. The scope of modelling resulted in a short period of weather data being interrogated (seven years) – there may well be more adverse years for wind generation.
17. While it is highly unlikely that concentrated solar power would be installed without storage, the modelling has been undertaken assuming zero storage, in order to ascertain the raw storage requirement.
2017LOW RE (2030)
MID RE (2030)
HIGH RE (2030)
Total annual grid demand GWh 216,955 239,134 239,134 239,134
Total capacity GW 60 79 85 102
Renewable GWh 37,836 86,787 125,326 180,225
Coal, gas & diesel GWh 179,118 152,345 113,795 58,040
Via interconnectors(1) GWh 90 15 46 1,766
Total 239,147 239,167 240,031
Renewable percentage of generation 17% 35% 50% 75%
Emission intensity tCO2/MWh 0.82 0.47 0.35 0.16
Storage requirement for energy reliability GWh 0.00 2 5 105
GW 0.20 0.4 2 10
Storage requirement for system security(2) GWh 0.10 0.5 1 3
GW 1.30 5.8 16.8 35.2
35
mean a relatively small additional investment
would enable storage for security to provide
a significant contribution to meeting the
reliability requirement. Assuming batteries
meet the security requirement, scaling those
to provide an hour of storage (a common
configuration) could reduce the need for
energy reliability by a third.
Energy security can be met by several means.
The traditional approach is to maintain a
sufficient level of generation by turbines
continually rotating in synchrony with the
grid frequency. Through the inertia of their
spinning masses, they resist rapid changes
in frequency that are caused by contingency
events. This synchronous generation can be
provided by fossil fuels and some renewable
technologies (hydro, biomass, geothermal,
or concentrated solar power). Wind turbines
can also apply the inertia from their spinning
blades to frequency support, called ‘synthetic’
inertia because it is mediated by power
electronics.
Batteries can make an important contribution
to replacing inertia with fast frequency
response that performs the same function.
They are cost effective in this role because the
energy requirement is small. Table 3 shows
the power requirement for system security,
assuming it is entirely provided by energy
storage. The corresponding energy capacity
requirement allows that fast frequency
response should be provided for only five
minutes, by which time regular “recovery”
frequency control ancillary services resources
are online (see Box 3).
Fraunhofer Institute (Pape et al., 2014) also
concluded that the requirements for fast
response dominate in Germany until very
high penetrations of renewable energy
generation, and that energy reliability storage
is relatively low even at penetrations of 50 per
cent renewable energy. Australia is fortunate,
compared to Northern European countries, in
Box 3: Would batteries have prevented the South Australian blackout on 28 September 2016?
It’s reasonable to ask whether fast frequency
response resources such as grid-scale
batteries would have prevented the
blackout that followed storm damage to
the SA transmission system in September
2016. The resulting voltage disturbance
caused 315 MW of wind generation to
disconnect, and the flow on the Heywood
interconnector from Victoria increased to
between 850 and 900 MW to make up the
difference. This flow exceeded the design
limit of 600 MW, and the interconnector’s
protection system opened the circuit
to prevent damage, resulting in rapid
frequency collapse.
Wind generation could have been part of
a solution. Had the correct fault settings
been in place to ride through the voltage
disturbance, the more recently installed
wind turbines could themselves have
provided synthetic inertia with suitable
control settings.
Other forms of fast frequency response
would have bought time for other
generation resources to come online.
With 600 MW of fast responding batteries,
corresponding to the interconnector as
the largest single component of SA supply,
the loss of generation would have been
almost instantly compensated. Conversely,
the loss of the interconnector at any other
time could also be compensated. At today’s
storage prices, some $A800 million would
provide up to two hours of supply from
these batteries, ample time to respond to
the contingency by ramping up reserve
generation. So, it is likely that with sufficient
fast responding batteries, the blackout
would have been prevented or much
less widespread.
36
technologies could make a large contribution
to reducing potential curtailment, although
this could also be achieved through power-
to-gas storage.
If concentrated solar power is to make up any
of the generation mix, molten salt storage is
likely to also contribute, as the additional cost
of adding storage is low. This has not been
factored into the calculations in this report,
as the objective was to determine “raw”
storage requirements.
Assuming the entire energy reliability
requirement was to be met by PHES, costs
to meet this requirement for the HIGH RE
scenario would be in the order of $A43 billion
(noting that this does not allow for the
contribution from whatever solutions are
used for system security). However, it is highly
likely that a proportion of this requirement
will be met by batteries for quick response
(i.e. security requirements), or by molten
salt storage associated with concentrated
solar power, which is cheaper on a per MWh
LCOS basis.
Should the entire requirement for system
security be met by two-hour batteries,
costs at 2030 prices would be $A22 billion
for the HIGH RE scenario. For context,
network capital spending in the NEM is
$A5–6 billion each year based on the current
Regulatory Investment Notices, equating to
approximately $A70 billion total if this level of
expenditure is continued annually to 2030.
Solutions required for system security will
also mitigate some of the need for energy
reliability, and vice versa. Assuming that two-
hour batteries are used to meet the security
requirement, and the remaining reliability
requirement was met by PHES, the total cost
would be $A36.5 billion.
There are other ways to meet both of these
requirements, and the costs provided for
these technologies are merely an example
that the seasonal mismatch between supply
and demand is slight. This means that energy
storage for reliability may be required for a
matter of days or weeks, rather than months.
1.3.5 The effect of interconnectors
Interconnectors play an important role in
providing system reliability. The option
of doubling the existing interconnector
capacities rather than installing storage was
tested for the HIGH RE and MID RE scenarios
by running the energy reliability model with
existing interconnector capacities doubled.
The storage requirement went down by
15 GWh (14 per cent) in the HIGH RE scenario,
and by 1 GWh (less than 1 per cent) in the
MID RE scenario.
Increasing interconnectors would be a capital-
intensive undertaking, and this report has
not attempted to compare the costs with
installing storage. Nevertheless, in the HIGH
RE scenario, curtailment is a significant issue
prior to installation of storage. This may be
more effectively addressed by bulk storage
technologies rather than interconnectors,
because there may be a large overlap in
periods of over- and under-production from
renewable energy generators in adjacent
states.
1.4 Technology Options for Storage Requirements
There are many alternatives for meeting the
storage requirements in each of the scenarios,
and the actual mix of storage or other
technologies used will depend on market
dynamics, policy settings and consumer
preferences.
Considering the LCOS estimates provided,
it is likely that larger scale options, such as
PHES, will be the lowest cost for bulk energy
storage. There is approximately 128 GWh
of PHES potential identified in the NEM –
98 GWh within the lower cost range. These
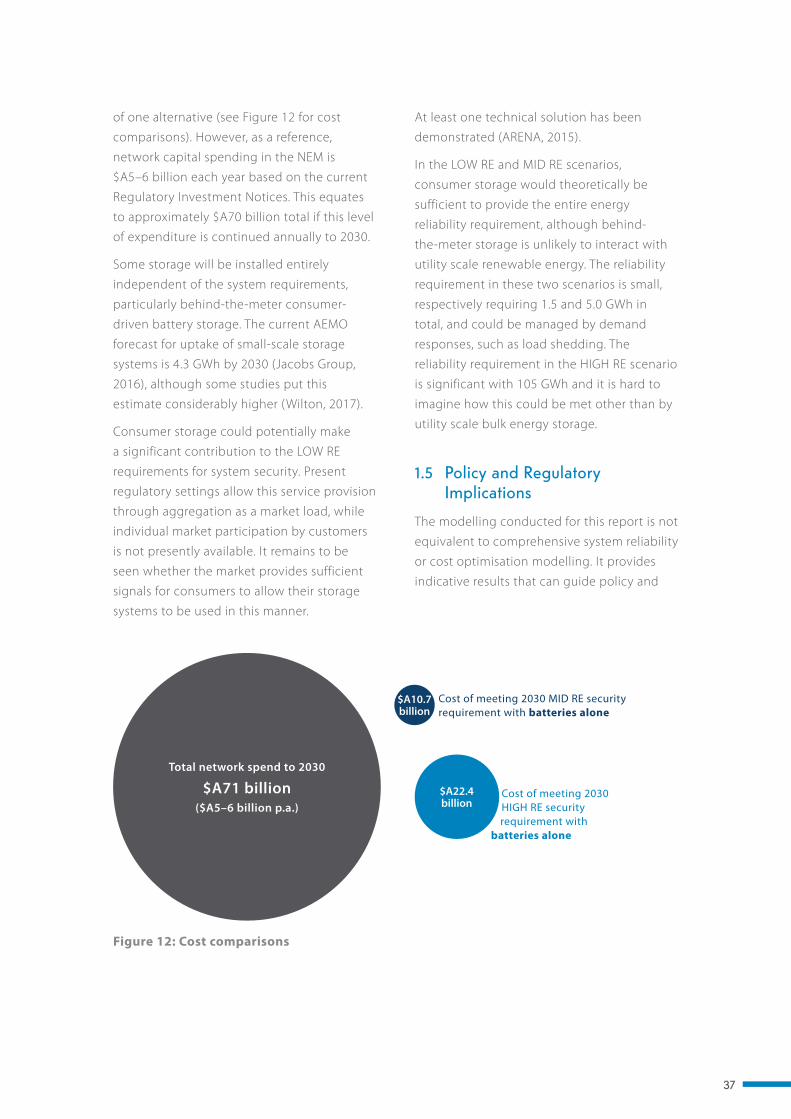
37
of one alternative (see Figure 12 for cost
comparisons). However, as a reference,
network capital spending in the NEM is
$A5–6 billion each year based on the current
Regulatory Investment Notices. This equates
to approximately $A70 billion total if this level
of expenditure is continued annually to 2030.
Some storage will be installed entirely
independent of the system requirements,
particularly behind-the-meter consumer-
driven battery storage. The current AEMO
forecast for uptake of small-scale storage
systems is 4.3 GWh by 2030 (Jacobs Group,
2016), although some studies put this
estimate considerably higher (Wilton, 2017).
Consumer storage could potentially make
a significant contribution to the LOW RE
requirements for system security. Present
regulatory settings allow this service provision
through aggregation as a market load, while
individual market participation by customers
is not presently available. It remains to be
seen whether the market provides sufficient
signals for consumers to allow their storage
systems to be used in this manner.
At least one technical solution has been
demonstrated (ARENA, 2015).
In the LOW RE and MID RE scenarios,
consumer storage would theoretically be
sufficient to provide the entire energy
reliability requirement, although behind-
the-meter storage is unlikely to interact with
utility scale renewable energy. The reliability
requirement in these two scenarios is small,
respectively requiring 1.5 and 5.0 GWh in
total, and could be managed by demand
responses, such as load shedding. The
reliability requirement in the HIGH RE scenario
is significant with 105 GWh and it is hard to
imagine how this could be met other than by
utility scale bulk energy storage.
1.5 Policy and Regulatory Implications
The modelling conducted for this report is not
equivalent to comprehensive system reliability
or cost optimisation modelling. It provides
indicative results that can guide policy and
Figure 12: Cost comparisons
Total network spend to 2030
$A71 billion($A5–6 billion p.a.)
Cost of meeting 2030 MID RE security requirement with batteries alone
Cost of meeting 2030 HIGH RE security requirement with
batteries alone
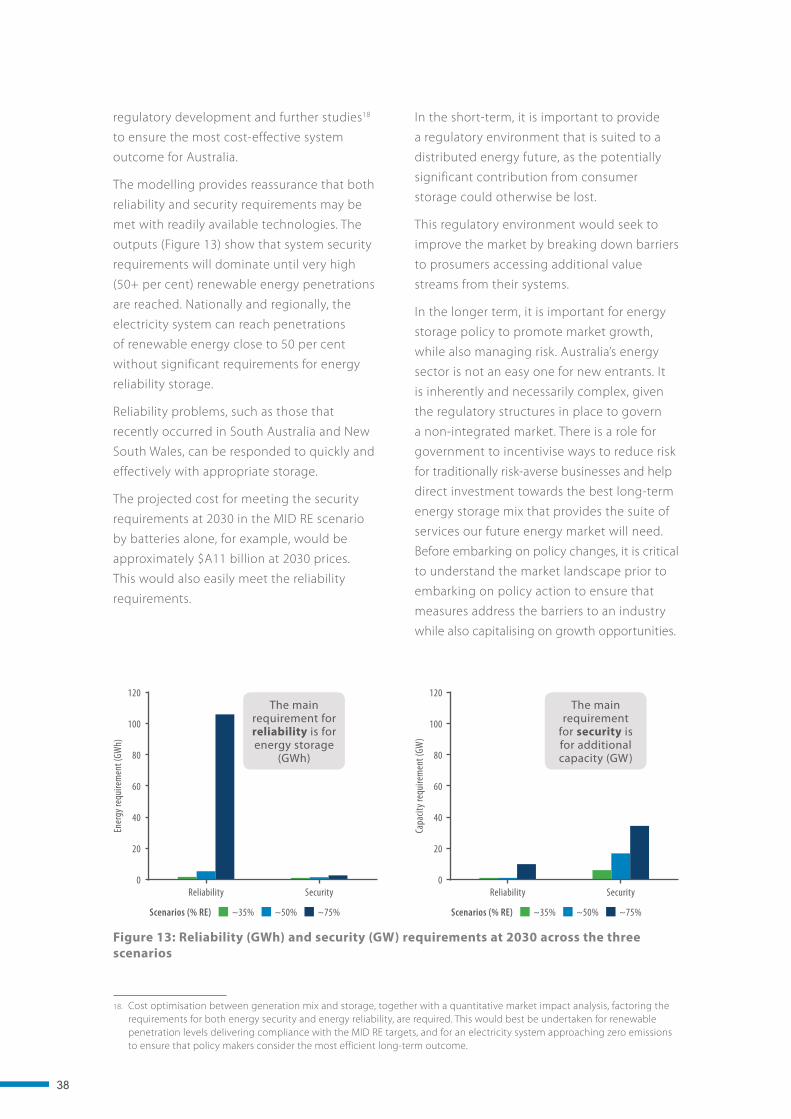
38
regulatory development and further studies18
to ensure the most cost-effective system
outcome for Australia.
The modelling provides reassurance that both
reliability and security requirements may be
met with readily available technologies. The
outputs (Figure 13) show that system security
requirements will dominate until very high
(50+ per cent) renewable energy penetrations
are reached. Nationally and regionally, the
electricity system can reach penetrations
of renewable energy close to 50 per cent
without significant requirements for energy
reliability storage.
Reliability problems, such as those that
recently occurred in South Australia and New
South Wales, can be responded to quickly and
effectively with appropriate storage.
The projected cost for meeting the security
requirements at 2030 in the MID RE scenario
by batteries alone, for example, would be
approximately $A11 billion at 2030 prices.
This would also easily meet the reliability
requirements.
18 Cost optimisation between generation mix and storage, together with a quantitative market impact analysis, factoring the requirements for both energy security and energy reliability, are required. This would best be undertaken for renewable penetration levels delivering compliance with the MID RE targets, and for an electricity system approaching zero emissions to ensure that policy makers consider the most efficient long-term outcome.
In the short-term, it is important to provide
a regulatory environment that is suited to a
distributed energy future, as the potentially
significant contribution from consumer
storage could otherwise be lost.
This regulatory environment would seek to
improve the market by breaking down barriers
to prosumers accessing additional value
streams from their systems.
In the longer term, it is important for energy
storage policy to promote market growth,
while also managing risk. Australia’s energy
sector is not an easy one for new entrants. It
is inherently and necessarily complex, given
the regulatory structures in place to govern
a non-integrated market. There is a role for
government to incentivise ways to reduce risk
for traditionally risk-averse businesses and help
direct investment towards the best long-term
energy storage mix that provides the suite of
services our future energy market will need.
Before embarking on policy changes, it is critical
to understand the market landscape prior to
embarking on policy action to ensure that
measures address the barriers to an industry
while also capitalising on growth opportunities.
Figure 13: Reliability (GWh) and security (GW) requirements at 2030 across the three scenarios
120
100
80
60
40
20
0
Ener
gy re
quire
men
t (GW
h)
Reliability Security
Capa
city r
equi
rem
ent (
GW)
Reliability Security
120
100
80
60
40
20
0
The main requirement for reliability is for energy storage
(GWh)
The main requirement
for security is for additional capacity (GW)
~50%~35% ~75%Scenarios (% RE) ~50%~35% ~75%Scenarios (% RE)
18. Cost optimisation between generation mix and storage, together with a quantitative market impact analysis, factoring the requirements for both energy security and energy reliability, are required. This would best be undertaken for renewable penetration levels delivering compliance with the MID RE targets, and for an electricity system approaching zero emissions to ensure that policy makers consider the most efficient long-term outcome.

39
1.6 Key Findings
1. There is a near-term requirement to strengthen energy security19 in NEM jurisdictions. Maintaining acceptable energy security levels for customers will dominate energy reliability20 requirements until well in excess of 50 per cent renewable energy penetration.21
• Batteries are cost-effective for system
security when installed with a high power-
to-energy ratio, noting that there are other
ways to strengthen system security (e.g.
installation of more fast start gas turbines
use of spinning reserve in wind turbines,
and demand response or load shedding
measures).
19 “System security” is the ability to deliver near-instantaneous power (GW) for short periods (seconds to minutes) as fast frequency response to withstand sudden changes or contingency events in electricity generation, such as failure of a large generator or loss of a transmission line.
20 “System reliability” is the ability to meet electrical energy demand (GWh) at all times now and in future.
21 Ensuring system reliability and system security is a core function of the Australian Energy Market Operator. (AEMO).
2. At an aggregated national level22, Australia can reach penetrations of 50 per cent renewable energy without a significant requirement for storage to support energy reliability.
• Installing the levels of storage power
capacity (GW) required for security creates
the opportunity to expand energy stored
(GWh) capacity for reliability at a lower
marginal cost than would otherwise be the
case.
• Despite significant development and
construction time, pumped hydro energy
storage (PHES) is presently the cheapest
way to meet reliability requirements.
Projections indicate that the most cost-
effective energy storage options available
in 2030 will be PHES, lithium-ion batteries
and zinc bromine batteries. These all have
similar levelised cost of storage, depending
on the PHES sites selected and uncertainty
in reduction of battery costs.
22 The storage requirements differ at a state level.
19. “System security” is the ability to deliver near-instantaneous power (GW) for short periods (seconds to minutes) as fast frequency response to withstand sudden changes or contingency events in electricity generation, such as failure of a large generator or loss of a transmission line.
20. “System reliability” is the ability to meet electrical energy demand (GWh) at all times now and in future.
21. Ensuring system reliability and system security is a core function of the Australian Energy Market Operator. (AEMO).
22. The storage requirements differ at a state level.
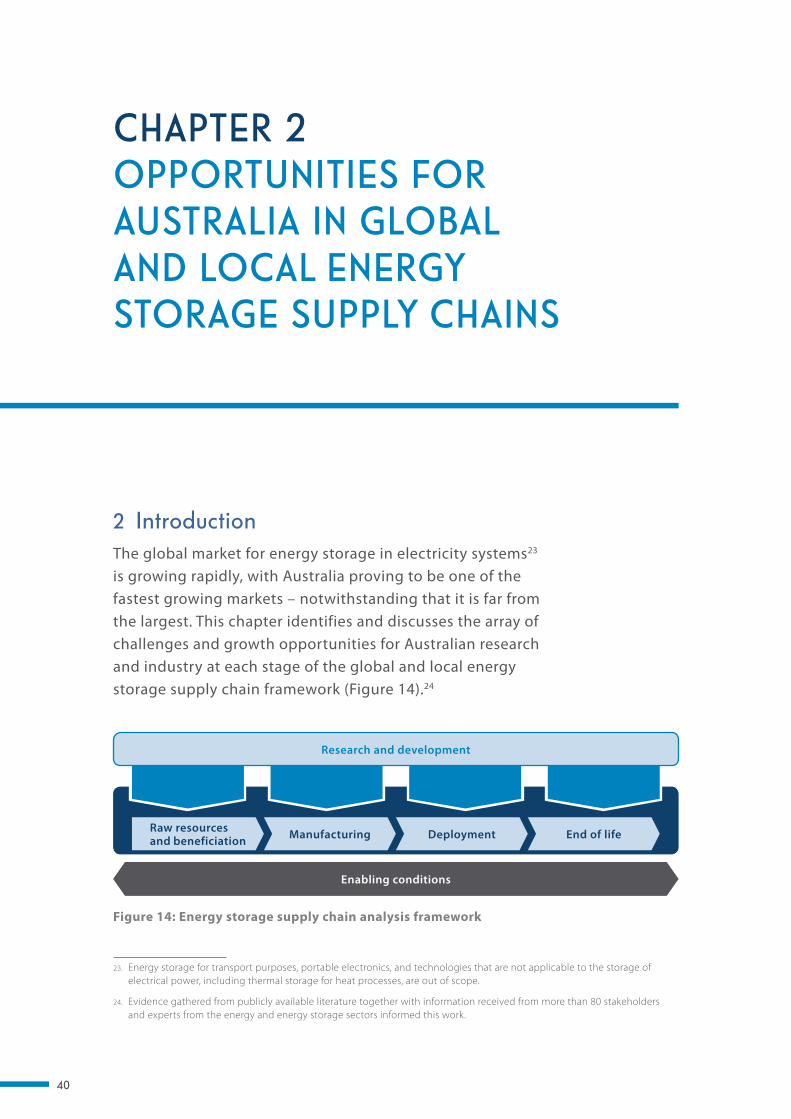
40
CHAPTER 2 OPPORTUNITIES FOR AUSTRALIA IN GLOBAL AND LOCAL ENERGY STORAGE SUPPLY CHAINS
2 IntroductionThe global market for energy storage in electricity systems23 is growing rapidly, with Australia proving to be one of the fastest growing markets – notwithstanding that it is far from the largest. This chapter identifies and discusses the array of challenges and growth opportunities for Australian research and industry at each stage of the global and local energy storage supply chain framework (Figure 14).24
23 Energy storage for transport purposes, portable electronics, and technologies that are not applicable to the storage of electrical power, including thermal storage for heat processes, are out of scope.
24 Evidence gathered from publicly available literature together with information received from more than 80 stakeholders and experts from the energy and energy storage sectors informed this work.
23. Energy storage for transport purposes, portable electronics, and technologies that are not applicable to the storage of electrical power, including thermal storage for heat processes, are out of scope.
24. Evidence gathered from publicly available literature together with information received from more than 80 stakeholders and experts from the energy and energy storage sectors informed this work.
Figure 14: Energy storage supply chain analysis framework
Raw resources and beneficiation Manufacturing Deployment End of life
Enabling conditions
Research and development
41
2.1 Research and Development
2.1.1 Emerging energy storage technologies and Australia’s research strengths
Research is very active in the energy storage field – globally and locally. Current
trends include high-volume production of clean hydrogen and ammonia, optimising
concentrated solar thermal storage, improving batteries, and developing new
battery technologies.
Australia has research strengths and there are industry opportunities in some
of the most promising emerging energy storage technologies including:
• Hydrogen, which can be sustainably produced by using electricity generated
via renewable energy to split water (electrolysis).
– There is strong, but as yet unfulfilled, demand for clean hydrogen in
countries such as Korea and Japan that have limited domestic energy
resources (Cross-ministerial Strategic Innovation Promotion Program, 2015).
– Hydrogen production using Australia’s abundant renewable resources
(particularly our high levels of sunshine) provide a significant export
opportunity as well as absorbing excess power production from
renewable resources when system demand is low.
42
– Opportunities will also be created for
new technologies to more efficiently
produce, store, and use hydrogen and
ammonia25. While ammonia synthesis
and cracking are established processes,
they are inefficient and expensive.
– Australian researchers are working
on high efficiency electrochemical
approaches to ammonia synthesis,
improvements to the efficiency
and cost of hydrogen synthesis and
transport processes, and the direct
combustion of ammonia.
• Next generation batteries, where Australia is
competing with well-funded international
programs26. Nonetheless, Australian
research groups are performing at or
above world standard in this field and with
strategic investment and prioritisation
could capitalise on market opportunities.
– As the market and technologies
develop, opportunities are arising
for batteries that are cheaper, safer,
more sustainable, and have better
performance characteristics than
current technologies.
– Lithium-ion is the most popular battery
chemistry. Australian researchers27 are
developing new generations of lithium-
ion batteries as well as emerging
technologies including metal-air
batteries, sodium-based batteries,
and next-generation flow batteries.
25 To ensure safety and reduce volume, hydrogen can be converted to ammonia for transport. It is subsequently converted back to hydrogen (ammonia cracking) for use in fuel cells or electric vehicles.
26 The United States’ Advanced Research Projects Agency-Energy (ARPA-E) Program, and the German Government’s energy transition program.
27 ANSTO’s Australian Centre for Neutron Scattering, CSIRO’s Centre for Hybrid Energy Systems and Stored Energy Integration Facility (CSIRO, 2016a), and the Deakin-CSIRO BatTRI-Hub.
Research is also underway on the use of
metals such as aluminium, magnesium
and calcium.
– Ionic liquid and solid-state
technologies appear to hold promise
for next generation batteries.
- Significant research activity is
underway in Australia – both
public sector and industry – and
Australian researchers are established
international leaders in the ionic
liquids field as applied to next
generation battery technologies.
- First generation lithium metal
solid-state batteries based on
solid polymer electrolytes are
commercially available through
the Bollore Group28. Australian
researchers have established
strengths in polymer chemistry and
polymer electrolytes that could
contribute to next generation solid-
state batteries.
• Advanced thermal energy storage systems,
where Australian companies Vast Solar,
Graphite Energy and 1414 Degrees
have developed novel thermal energy
storage systems that can be used to
supply industrial grade heat or generate
electricity. The round-trip efficiencies are
much lower than batteries or pumped
hydro energy storage systems,29 but
thermal energy storage is expected to be
28 For deployment in vehicles (Jolly, Cres & Dimitriadis, 2015) and also in hot climates such as Australia and Africa for stationary energy storage due to increased safety and stability compared with Li-ion.
29 The 1414 Degrees prototype, which builds on IP developed by CSIRO and stores energy in molten silicon (1414 Degrees, 2016) achieved 31 per cent efficiency for electricity (1414 Degrees, 2017).
25. To ensure safety and reduce volume, hydrogen can be converted to ammonia for transport. It is subsequently converted back to hydrogen (ammonia cracking) for use in fuel cells or electric vehicles.
26. The United States’ Advanced Research Projects Agency-Energy (ARPA-E) Program, and the German Government’s energy transition program.
27. ANSTO’s Australian Centre for Neutron Scattering, CSIRO’s Centre for Hybrid Energy Systems and Stored Energy Integration Facility (CSIRO, 2016a), and the Deakin-CSIRO BatTRI-Hub.
28. For deployment in vehicles (Jolly, Cres & Dimitriadis, 2015) and also in hot climates such as Australia and Africa for stationary energy storage due to increased safety and stability compared with Li-ion.
29. The 1414 Degrees prototype, which builds on IP developed by CSIRO and stores energy in molten silicon (1414 Degrees, 2016) achieved 31 per cent efficiency for electricity (1414 Degrees, 2017).
43
cheaper than batteries, highly scalable
in capacity and power, and not have the
location constraints of pumped hydro
energy storage.
– Although purely thermal energy
storage is outside the scope of this
report, improved thermal energy
management in domestic, commercial
and industrial applications has
great potential to improve energy
productivity and reduce greenhouse
gas emissions from the broader energy
sector30.
Australia’s strength in research and
development in these fields, and particularly
its world-leading electrochemistry researchers,
is recognised as providing excellent
opportunities in the energy storage supply
chain31. Public sector organisations that work
in energy storage technologies include:
Australian National University
The Australian Centre of Excellence
for Electromaterials Science
The Australian Nuclear Science and
Technology Organisation (ANSTO)
The Australian Solar Thermal Research
Institute
CSIRO
Curtin University
Griffith University
Monash University
Queensland University of Technology
University of Adelaide
30 Monash University is developing IPon intermediate temperature (100–200 °C) phase change materials that can store large amounts of roof top solar-thermal for use in domestic and small commercial use.
31 The Excellence in Research for Australia (ERA) evaluation identifies 11 Australian universities involved in energy storage research as having engineering and materials chemistry research performance that is above or well above world standard (ERA score 4–5; Australian Research Council, 2015).
University of Melbourne
University of New South Wales
University of Queensland
University of Sydney
University of Technology Sydney
University of Wollongong
Information on the energy storage research
conducted by these organisations is provided
in Appendix 4.
2.1.2 Australia’s R&D success stories and challenges
Australia has had a number of successful
energy storage R&D outcomes (see Box 4).
Although these are mostly small scale,
particularly in economic terms, it is notable
that they have occurred where there has been
collaboration between research groups and
industry.
Nevertheless, evidence gathered during
consultations indicated a number of
challenges to overcome if energy storage R&D
in Australia and commercialisation of resulting
intellectual property (IP) are to continue to be
successful. These include:
• A need for greater collaboration between
researchers and industry – for example,
new models for IP ownership, flexibility
of business models to incorporate new
technologies, and establishment of
domestic and international sector hubs
to facilitate collaboration.
30. Monash University is developing IP on intermediate temperature (100–200 °C) phase change materials that can store large amounts of roof top solar-thermal for use in domestic and small commercial use.
31. The Excellence in Research for Australia (ERA) evaluation identifies 11 Australian universities involved in energy storage research as having engineering and materials chemistry research performance that is above or well above world standard (ERA score 4–5; Australian Research Council, 2015).
44
Box 4: Successful energy storage R&D outcomes
The UltraBattery – this CSIRO-developed
hybrid battery combines a super-
capacitor and lead-acid battery in a
single unit and has been successfully
commercialised by Australian company
Ecoult (CSIROpedia, 2005).
A commercialisation agreement
between Redback Technologies (an
Australian energy storage company) and
the University of Queensland (UQ) that
enables direct access by Redback to UQ
researchers and their energy storage
technologies (Swan, 2016).
Commercialisation by SupraG Energy (a
Monash University spinout company) of
graphene super-capacitors that allow
a three-fold increase in energy storage
capacity (Monash University, 2016).
Development of batteries for submarines
by PMB Defence Engineering – including
main storage batteries for the Collins
Class submarines (PMB Defence, 2017).
BatTRI-Hub (Deakin University and
CSIRO) – a world class research centre
focused on the development of next
generation battery technologies
with the aim of growing the battery
manufacturing industry in Australia
(Deakin Research, 2016).
Aquahydrex – a spinout company from
the Australian Centre of Excellence for
Electromaterials Science – formed to
develop a technology using solar energy
to produce hydrogen from seawater
(Goldie, 2012).
• Systemic issues in research-industry
collaboration (not specific to energy storage
alone) impeding commercialisation of
technologies in Australia32. For example, the
vanadium redox flow battery was invented in
Australia in 1985 (Skyllas-Kazacos, Rychick, &
Robins, 1988), but was commercialised and
manufactured in China, Germany, Japan, the
United Kingdom and the USA because there
was limited interest in commercialising the
technology in Australia.
• Analysis of the optimum size, location, and
operation of energy storage, as applied
to Australia’s energy grids, is necessary to
improve cost effectiveness of these systems,
(Australian Academy of Science, 2016). This
includes improving energy efficiency transfer
into and from storage.
• A lack of funding to take developments to full
commercial potential. Although several grant
funding schemes exist in Australia, the high
failure rate of applicant companies with non-
commercial technologies delays development
of research to a stage that attracts commercial
involvement33.
2.2 Raw Resources and Beneficiation
2.2.1 Mineral resources and beneficiation (value-adding)
Due to the abundance of natural Resources,
Australia has the opportunity to contribute
to the supply chain for a number of energy
storage technologies. Increased demand for
mineral resources required for energy storage
will, however, largely be dependent on the
technologies that are most successful in end-use
markets over the coming decades.
32 These issues are being targeted via Australian Government initiatives such as the National Innovation and Science Agenda.
33 The Small Business Innovation Research program in the US specifically identifies and targets this gap. Australia is piloting a similar scheme as the Business Research and Innovation Initiative (Commonwealth of Australia, 2016a).
32. These issues are being targeted via Australian Government initiatives such as the National Innovation and Science Agenda (NISA).
33. The Small Business Innovation Research program in the US is a mechanism that specifically identifies and targets this gap. Australia is piloting a similar scheme as the Business Research and Innovation Initiative (Commonwealth of Australia, 2016a).
45
A range of mineral resources is required
for the production of energy storage
technologies. Those used in current
generations of batteries include lithium, lead,
cobalt, nickel, and zinc, while those identified
as essential for emerging energy storage
technologies include vanadium, manganese,
aluminium, iron, magnesium, phosphorous,
potassium and graphite. Australia holds the
world’s largest economic demonstrated
resources (EDR34) of iron ore, lead, nickel,
and zinc. Its bauxite (aluminium oxide),
cobalt, lithium, magnesite (magnesium ore),
manganese ore, tin, and vanadium EDR are
all ranked in the top five worldwide (Britt
et al., 2016). Details on Australia’s mineral
resources and the companies involved in their
production and processing are provided in
Appendix 5.
The most significant raw material opportunity
for Australia is in lithium. Should car
manufacturers invest heavily in electric
vehicles and demand rises in distributed and
behind-the-meter energy storage markets
(Navigant Research, 2016a), lithium-ion
batteries will be a key technology for at
least the next decade. Forecasts by Goldman
Sachs estimate the lithium-ion battery
market (electric vehicles only) to be worth
US$40 billion by 2025 (Sanderson, Hancock &
Lewis, 2017). Tesla’s decision to significantly
increase production to 35 GWh/year of
lithium-ion battery cells by 2018 (Tesla, 2017)
together with growth plans of Chinese,
Korean and Japanese lithium-ion battery
manufacturers demonstrates the increasing
demand for lithium over the coming years.
Australia is currently the biggest supplier of
lithium (Britt et al., 2016).
34 EDR includes Joint Ore Reserves Committee Proved and Probable Ore Reserves as stated in company annual reports and reports to the Australian Securities Exchange, as well as indicated and measured resources.
Secondary processing of raw materials has
been declining in Australia, with one of the
major contributing factors being the high cost
of energy. Nonetheless, a small number of
Australian companies are involved in lithium
processing and opportunities for value-
adding for export of higher value products
(e.g. lithium salts, lithium metal, electrode
materials) are being pursued .
2.2.2 Pumped hydro resources
The viability of pumped hydro energy storage
is strongly dependent on locating sites with
suitable geographic characteristics, including
upper and lower reservoirs that have an
appropriate elevation difference (Hearps et
al., 2014). These can be river-based or off-
river at locations such as hilly regions, along
coastlines, or even at decommissioned mine
sites (Blakers, 2015). Land use and water
requirements for PHES have the potential to
negatively influence the social license for the
technology if environmental and water use
impacts are not appropriately managed.
In addition to three sites in the Snowy
Mountains and Queensland, many locations in
Australia have been identified as suitable for
PHES (see Box 5). The Australian Renewable
Energy Agency (ARENA) funded Atlas of
Pumped Hydro Energy Storage study currently
being developed by ANU, ElectraNet, and
VTara Energy Group, aims to identify more
potential sites for off-river pumped hydro
projects (Vorrath, 2016a).
34. EDR includes Joint Ore Reserves Committee Proved and Probable Ore Reserves as stated in company annual reports and reports to the Australian Securities Exchange, as well as indicated and measured resources.
46
Box 5: Examples of Australian pumped hydro energy storage projects
Manufacturing of high-value, low-volume
energy storage solutions can provide
opportunities for Australian industry35.
The only battery manufacturing currently
underway is by PMB Defence in South
Australia, which manufactures batteries for
submarines, including the Collins Class battery
system (PMB Defence, 2017).
Opportunities also exist for local assembly
using imported cells to build battery packs
(including balance of system management)
required for electricity network applications
operating under Australian ambient
conditions.
Other high margin opportunities include
customised solutions for niche applications
or novel technology developments
commercialised from Australian IP, such as the
concentrated solar power system developed
and demonstrated by Vast Solar (Vast Solar,
2016) and the silicon-based thermal energy
storage system developed by 1414 Degrees
for industrial and grid applications (1414
35 CSIRO’s advanced manufacturing roadmap recognised customised high-margin solutions as a growth opportunity for Australian businesses (CSIRO, 2016b).
2.3 Manufacturing
The 2016 Global Manufacturing
Competitiveness Index shows Australia’s
manufacturing competitiveness ranking
declined from 16th to 21st over three years
(Deloitte, 2016). This decline has been
attributed to issues such as high labour and
energy costs, distance from key markets, and
lack of access to growth capital – issues which
are just as relevant to the manufacture of
energy storage and associated technologies.
2.3.1 Local energy storage manufacturing
Battery cell manufacturing is developing at
a rapid pace globally. Attempts to compete
against global manufacturers in established
technologies will pose great challenges for
Australian industry. Australia should look for
opportunities in manufacturing where it has
competitive strength such as in high-value,
low-volume energy storage solutions for
niche applications as well as technologies and
software for system integration and control.
The Kidston PHES Project (250 MW) is an
example of an off-river pumped hydro site.
This project uses the disused Kidston Gold
Mine in northern Queensland, which has large
suitable pits(Genex Power, 2016). Construction
of the project is expected to commence in
late 2017, pending financial arrangements.
Energy Australia has proposed a 100–200 MW
coastal PHES project for South Australia that
would use the ocean as its lower reservoir
thus alleviating potential environmental and
social concerns of its water dependency.
ARENA has awarded $A450,000 to Energy
Australia to fund the feasibility study
(Reid, 2017).
In March 2017, the Commonwealth
Government announced that it would invest
up to $A2 billion dollars into the expansion
of the Snowy Mountains Hydro Scheme.
Badged as Snowy Mountains Scheme 2, the
expansion proposes the addition of 2,000 MW
of renewable energy to the scheme’s current
output of 4,100 MW. Four options, using
existing dams, are under consideration – these
include use of the Tantangara and Talbingo
reservoirs. (Coorey, 2017)
35. CSIRO’s Advanced Manufacturing Roadmap recognised customised high-margin solutions as a growth opportunity for Australian businesses (CSIRO, 2016b).
47
Degrees, 2017). Energy storage solutions
that address issues specific to Australian
conditions may also facilitate creation of
markets in the electricity grids of developing
nations (e.g. high temperature environments,
fringe of grid or off-grid systems).
A lack of confidence36 in achieving
commercial manufacturing success in
Australia reflects a somewhat common
attitude across many knowledge-intensive
industry sectors – that is, Australia has a
challenge in translating R&D and IP strengths
into commercial applications. The most recent
audit of the innovation system has found that
there is no inherent or fundamental reason
why this should be the case (Innovation
and Science Australia, 2016), but given the
historical systemic difficulty in this area, a
suite of policy and cultural changes will be
required to facilitate improved performance.
Notwithstanding the challenges of competing
against global manufacturers there is still
36 Stakeholder interviews.
Box 6: Commercialisation through international partnerships
Ecoult has partnered with international
manufacturing companies in key markets
including the USA and India to produce the
CSIRO developed UltraBattery (an advanced
lead acid battery technology) (ARENA, 2017a).
RedFlow has commercialised a zinc bromide
flow battery technology. Despite basing
their R&D operation in Australia, Redflow has
outsourced the manufacture of their products
to a global company to allow for scalable
manufacturing and the ability to have greater
proximity to key markets (Redflow, 2017).
Gelion – a spin off company from the
University of Sydney – has partnered with
Armstrong Energy (a London headquartered
company) focused on solar energy at
utility scale. The initial target market for
Gelionbatteries (which differ from zinc
brominein that they use a gel instead of
a liquid) is for storage in residential and
commercial buildings (Vorrath, 2016b).
Australian company Nano Nouvelle has
developed a tin anode for lithium-ion
batteries that uses nanotechnology toimprove
battery performance. A key design goal for the
electrode was its compatibility with existing
battery technologies and manufacturing
processes to make it easy for manufacturers to
adopt the technology (Nano-Nouvelle, 2016).
interest in the development of a local battery-
manufacturing sector. Australian Vanadium
and its subsidiary, VSun Energy, have
expressed an intention to develop a vertically
integrated vanadium flow battery operation
in Australia. If successful, they will mine
vanadium and produce vanadium electrolyte
for use in their own batteries. This project is
currently in a capital-raising phase.
2.3.2 Participation in global supply chains
Incremental improvements in established
energy storage technologies are unlikely
to offer significant local manufacturing
opportunities. Australian companies have
demonstrated success in commercialising
Australian IP through international
partnerships and through contributing their
technologies and IP to different components
of energy storage systems (see Box 6).
Although most examples provided have been
small scale, identifying opportunities in global
36. Stakeholder interviews.
48
energy storage value chains will be essential
for most companies in the Australian energy
storage industry.
2.3.3 Technology for energy storage integration and control
Australia is widely viewed as a test bed for the
impacts and benefits of distributed energy
storage due to its rapid energy storage market
growth – 356 per cent growth between 2014
and 2015 (China Energy Storage Alliance,
2016). Developing technology solutions that
allow for the integration and coordination of
energy storage and other distributed energy
resources provide a key opportunity for
Australian industry and researchers.
Australia has greater competitive advantages
and potential for manufacturing success
in the hardware and software systems that
will be required for smart management and
integration of energy storage systems37.
A number of industry stakeholders consulted
noted the potential for improved use of
data, data analytics and system modelling
to manage Australia’s energy systems. The
application of modern information and
communications technologies including
cloud computing, machine learning, and the
internet-of-things is allowing the creation of
smart systems that can optimise customers’
energy use and provide benefits to the
electricity grid by reacting to price signals
from energy utilities. Australian companies
such as Reposit, GreenSync, Redback,
Selectronic, and Evergen are leading the
development and deployment of smart
technologies for the integration and control
of distributed energy systems (e.g. solar
and storage) in Australia. The technologies
developed by these companies, typically
allow for greater transparency and control
37 Stakeholder interviews.
of energy and storage use (e.g. Evergen, 2016;
GreenSync, 2016; Reposit, 2017).
The energy storage market is competitive, and
although systems integration and design have
been identified as a significant opportunity for
Australia, the industry will need to act quickly
to compete with international companies
such as AutoGrid and Sunverge Energy in the
USA, Sonnen in Germany and multinational
technology companies such as ABB, GE and
Siemens.
2.4 Deployment
Energy storage is recognised as a key enabling
component of future energy grids with high
penetrations of renewable energy (Australian
Academy of Science, 2016; IRENA, 2017). The
deployment of energy storage systems within
Australia’s energy sector offers significant
scope for economic and environmental
benefit. Companies that retail and install
energy storage solutions (usually batteries
coupled with solar PV systems) for residential
and commercial customers are an early
example of industry growth in the energy
storage sector. Another key growth area is
in off-grid deployments, where high costs of
diesel generation are providing an economic
incentive to install solar PV and energy
storage solutions. As discussed in Chapter 1,
there is also a growing appreciation of the
importance of grid-scale energy storage
deployments to support system reliability
and security.
2.4.1 Distributed energy storage and system integration
Australia is seeing rapid uptake of energy
storage systems. This is predominantly due
to the high penetration of solar PV and the
end of a number of feed-in tariff schemes.
37. Stakeholder interviews.
49
Australia is expected to have one of the
highest penetrations of energy storage
globally (China Energy Storage Alliance,
2016; IHS Markit, 2016). It also has weakly
connected networks spread over vast
distances. Because of these factors,
opportunities exist for the deployment of
new grid solutions that integrate energy
storage and distributed energy resources
to help address the energy trilemma.
The design of smart grids, microgrids,
embedded networks and off-grid solutions
provide an opportunity for Australia to
contribute to the energy storage supply
chain.
Due to their high efficiencies and relatively
small size, batteries are expected to remain
the dominant technology for distributed
and behind-the-meter energy storage
solutions. Lithium-ion batteries are the
most popular technology for these markets
(Navigant Research, 2016a).
The Essential Services Commission (2016)
in Victoria has analysed the electricity
network to assess the energy and network
value of distributed generation. This
research indicates that distributed energy
generation could provide value to the
network by alleviating network congestion
and that network value can be optimised
with the addition of storage and smart
control systems.
Network businesses and utilities are
considering the opportunities and
challenges that energy storage technologies
pose to their business models. Grants and
allowances have enabled utilities and
network businesses to undertake trials and
demonstration projects to develop expertise
in distributed-energy-resources-based
systems and improve their ability to adapt
to the transforming market (see Box 7).
38. Sandfire Resources successfully commissioned a solar and storage system at the DeGrussa mine in June 2016. The project which includes 6 MW of lithium-ion battery storage is expected to cut approximately 20 per cent off their annual diesel consumption (Sandfire Resources NL, 2016).
Microgrids and standalone power systems are
anticipated to be an important energy supply
solution especially for remote and fringe-of-
grid communities in Australia. There is also
interest in applying energy storage with
solar PV systems to offset the high costs of
diesel generation in remote areas38. Expertise
38 Sandfire Resources successfully commissioned a solar and storage system at the DeGrussa mine in June 2016. The project, which includes 6 MW of lithium-ion battery storage, is expected to cut approximately 20 per cent off their annual diesel Consumption (Sandfire Resources NL, 2016).
Box 7: Utility and network businesses – demonstration and trials
AGL’s virtual power plant trial in SA: aims to
demonstrate the ability to centrally manage
and monitor 1,000 solar PV and battery
systems (a total of 5 MW/7 MWh energy
storage) for both consumer and network
benefit (AGL, 2016).
Microgrid trials undertaken by AusNet
Services and other distribution networks:
demonstrate the feasibility for communities
to generate, store and share their renewable
energy using local grid infrastructure (AusNet
Services, 2016).
Fringe of grid solutions: Ergon Energy has
developed an energy storage system (Grid
Utility Support System) to improve reliability
for fringe of grid customers serviced by single
wire earth return (SWER) networks. This system
is able to reduce the load on a SWER and
improve the voltage at the end of the network
at significantly lower cost than traditional
augmentation (Ergon Energy, 2016).
SA Power Networks’ battery storage trial:
100 batteries installed in a three-year trial in
Salisbury in Adelaide’s northern suburbs.
The trial uses smart systems to manage
power generated by household solar panels,
and supplies the grid with excess energy
to manage network issues, especially those
caused by adverse weather conditions (SA
Power Networks, 2016).
50
developed from the design and integration
of storage and renewable generation for
standalone off-grid systems is expected to be
of interest to small and remote communities
in the Asia-Pacific region.
2.4.2 Grid-scale energy storage
The Renewable Energy Target (RET ) is driving
increased penetrations of variable renewable
energy in Australia’s electricity networks,
yet there is no significant policy driver to
provide firm and dispatchable energy from
renewable sources. Recent energy security
issues have, however, driven increased interest
and growing recognition of the potential of
energy storage to contribute to the reliability
and security of Australia’s electricity market39.
Pumped Hydro Energy Storage (PHES) – Australia
has over 1.5 GW of PHES connected to the
NEM. Although no large-scale PHES facilities
have been built in Australia in the past 30
years (AECOM, 2015) it is expected to remain
the most cost effective option for large-
scale energy storage (>100 MW) for some
time. PHES projects are estimated to create
between 2.75–5.5 full time equivalent jobs per
MW in direct job creation for the length of the
project (Navigant Consulting, 2009).
The challenge to PHES deployment is the
perception of competing land and water
usage issues (social licence); and the large
costs and length of time required for their
development, making private investment in
PHES unlikely without risk mitigation efforts
by government (see Box 8).
Compressed Air Energy Storage (CAES) – There
are just two underground CAES deployments
in operation globally and there appears to
be little interest in the development of CAES
or liquid air energy storage in Australia.
39 In February 2017, ARENA and CEFC were asked to focus on encouraging the development of flexible capacity and large-scale storage projects in Australia (ARENA, 2017b).
Underground CAES requires specific
geological structures and above ground
compressed air storage has been abandoned
by the USA-based start-ups who were leading
its development (St. John, 2015).
39. In February 2017, ARENA and CEFC were asked to focus on encouraging the development of flexible capacity and large-scale storage projects in Australia (ARENA, 2017b).
Box 8: Major Expansion of the Snowy Hydro Scheme – “Snowy Hydro 2”
In March 2017, the Commonwealth
Government announced that it would
invest up to $A2 billion dollars into the
expansion of the Snowy Mountains Hydro
Scheme. Badged as Snowy Mountains
Scheme 2, the expansion proposes the
addition of 2,000 MW of renewable
energy to the scheme’s current output
of 4,100 MW. The extra capacity, to be
pumped into the national electricity
market, will be enough to power 500,000
additional homes. It will employ pumped-
hydro technology that involves using
water to drive turbines and then pumping
the water back up a hill to a storage dam.
The original snowy scheme was built
between 1949 and 1974. It currently
comprises 16 dams, 145 km of tunnels,
80 km of pipes and aqueducts. It is
operated by Snowy Hydro Limited, an
unlisted public company which is 58 per
cent owned by NSW, 29 per cent owned
by Victoria and 13 per cent owned by the
Commonwealth.
A feasibility study expected to conclude
at the end of 2017 will examine various
sites, following which a detailed cost
estimate will be prepared. The Australian
Government has suggested that work
would commence on the scheme shortly
after conclusion of the feasibility study.
(Coorey, 2017)
51
Concentrated Solar Power (CSP) – The
deployment of CSP provides an opportunity
to capitalise on Australia’s significant research
investments (the ASTRI program, Vast Solar,
1414 degrees) and its abundant sunshine
Deployment of a large-scale demonstration
plant will be an important step for any of
these new CSP technologies to demonstrate
their operational and economic viability.
Grid-scale Battery Storage – Government
supported trials are helping to develop
knowledge of this form of energy storage,
which will help to improve the economics of
grid scale battery deployments. These include:
• The Victorian government recently
announced that it intends to run a tender
for deployment of a 20 MW battery system
to support the network and enhance
opportunities for the integration of new
solar and wind generation (Minister for
Energy Environment Climate Change, 2017).
• Australian solar and storage company
ZEN Energy intends to develop a large-
scale (50 MW, 50 MWh) battery project
in Port Augusta (SA) to support their
solar developments. The company is also
exploring the potential for a 100–150 MW
plant to address grid security issues (ZEN
Energy, 2017).
• SA has outlined plans to spend $A510
million to “keep the lights on”. The plan
includes $A150 million to encourage the
development of a 100 MW battery storage
plant and $A360 million to build and
operate a new gas power plant to help
stabilise its electricity system (CNBC, 2017).
Global energy storage projections by Navigant
Research suggest that deployments of energy
storage for grid and ancillary services will
reach more than 20 GW by 2025. Companies
such as AES Energy Storage, Tesla, RES Group,
S&C Electric, Siemens, GE, and LG are amongst
global leaders supplying grid scale battery
storage solutions (Navigant Research, 2016b).
2.4.3 Renewable hydrogen and ammonia
Australia’s abundant sunshine makes it an
optimal environment to produce hydrogen
using solar energy. Synthesis and export of
hydrogen from renewable sources is a major
opportunity for Australia. This opportunity is
partly driven by Japan’s recent investment and
national economic strategy directed towards
hydrogen projects, including hydrogen-
powered vehicles and fuel cells (Cross-
ministerial Strategic Innovation Promotion
Program, 2015).
Hydrogen gas is difficult to transport due
to its low density; instead, it is proposed
that hydrogen is converted to ammonia
for transport, and then converted back
to hydrogen for use. Australia possesses
significant expertise and infrastructure from
the export of liquified natural gas (LNG),
which could be used or converted for
ammonia transport. The export of renewable
hydrogen is reliant on improving the
efficiency and cost of hydrogen synthesis
and transport (discussed in 2.1.1).
Australian industry promotion body
Renewable Hydrogen is driving the creation
of a pilot plant to generate solar energy
in the Pilbara region of Western Australia
(Turner, 2015). The solar energy generated
will be stored as hydrogen and could then
be shipped in the form of liquid hydrogen,
ammonia or liquefied synthetic gas to Japan,
Korea, and other parts of Asia (Renewable
Hydrogen, 2014).
Ammonia production is already taking
place in Australia. Yara Pilbara Fertilisers
operates an ammonia production plant in
the Burrup Peninsula, Western Australia.
Ammonia at the Yara plant is produced
using natural gas as a hydrogen source,
rather than renewable sources, and
ammonia is exported primarily for fertiliser
production (WA Country Hour, 2017).
52
2.5 End of Life
The scenarios in Chapter 1 for utility scale
storage to meet security and reliability
requirements predict a strong uptake
of batteries. This uptake together with
significant behind-the-meter battery storage
(approximately 4.5 GWh) and batteries from
electric vehicles (which this report did not
address) has led to the identification of end-
of-life recycling and repurposing as a potential
opportunity for Australia, in particular for
lithium-ion batteries. The Australian Energy
Storage Roadmap states “appropriate
arrangements for the safe disposal or recycling
of end-of-life [energy storage] systems – product
stewardship – is vital to maintaining community
support and industry integrity” (Clean Energy
Council, 2015). Despite the growing number
of batteries being used, only lead-acid
batteries are recycled in Australia.
2.5.1 Strengths and opportunities
Increased battery recycling and repurposing is
promoted by the Australian Battery Recycling
Initiative, and was identified as a potential
opportunity in Australia during consultation
with industry stakeholders. Apart from
lead-acid batteries, used batteries are being
collected in Australia and sent overseas for
recycling. Several valuable components,
including metals, can be extracted from
retired batteries and the export of these
components to battery-manufacturing
countries could add significant value to the
energy storage supply chain (see Box 9 for
Australian companies working on recycling).
2.5.2 Challenges
The lack of recycling regulations for batteries,
the relatively small number of batteries
available for recycling and the current
economics of material recovery are the
primary reason for a lack of battery recycling
facilities in Australia. As the battery industry in
Australia grows, so too will the opportunities
for local recycling and repurposing. The
economics of material recovery will benefit
from research, technology improvements, an
increase in the cost of recoverable materials or
the imposition of tariffs on export.
In Australia, batteries lighter than 5 kg
were listed as a priority for consideration of
possible product stewardship approaches
in 2015, but have not yet been regulated
(Department of the Environment and Energy,
2015). Battery recycling regulations would
decrease the environmental impact of toxic
battery chemicals in landfill, and may lead to
the establishment of a battery recycling or re-
use market in Australia.
Box 9: Australian companies working on recycling
PF Metals commenced a trial project in
resource recovery from lithium-ion batteries
in August 2015. From the trial, they developed
a method of extracting 95 per cent of the
batteries’ valuable components, but are not
yet recycling these batteries commercially.
(PF Metals, 2017)
Relectrify is working on technology to
repurpose retired electric vehicle batteries
for use in household energy storage to deliver
more affordable residential energy storage
solutions (Relectrify, 2016). Its financial
viability is dependent on an increase
in electric vehicle uptake.
53
2.6 Enabling Conditions
A key focus of stakeholder consultations
undertaken for this report was to identify the
enabling conditions that would underpin
economic, social and environmentally
beneficial growth for the Australian energy
storage industry, and successful research
outcomes in Australian research institutions.
Recurrent themes amongst the responses
included strategic governance, improved
energy market design and regulation, driving
investment and improving access to capital,
and enhanced coordination and collaboration
between stakeholders.
2.6.1 Energy market design and regulatory frameworks
Energy markets around the world are seeking
solutions to the energy trilemma of energy
security, equity and sustainability. The
Independent Review into the Future Security
of the National Electricity Market aims to
address these issues (Finkel et al., 2016).
Increasing the amount of energy storage
in the electricity system should not be
a primary goal of an electricity market’s
design. However, increased energy storage
is seen as a likely outcome of implementing
mechanisms that incentivise least cost
decarbonisation of the electricity system
while maintaining system security and
reliability.
The Independent Review’s report notes the
potential of energy storage technologies
to contribute to the security and reliability
of Australia’s national electricity market in a
number of ways.
2.6.2 Government policy and initiatives
Stable and integrated energy and climate
change policy – policy uncertainty (e.g. climate
policy and energy policy are not sufficiently
linked) is a barrier to attracting investment
in energy technologies generally. A unified
climate and energy policy, informed on the
basis of independent expert evidence, is an
essential enabler of investment in Australian
energy storage applications.
Strategic government leadership – A number
of countries have recognised the importance
of energy storage to their energy systems,
and have implemented long-term strategic
plans and targeted support for research and
industry development. A national, long-term
strategic plan focused on resolving the energy
trilemma in the Australian electricity sector
will support such investment.
Government support for industry development
and innovation – Australian governments
have implemented a number of initiatives
to support industry development. Those
with particular relevance to energy storage
include grant funding (ARENA), subsidies for
energy storage installation, support for start-
ups, direct procurement, and the R&D tax
incentive. Funding programs and incentives
that exist to support industry development
and research opportunities in energy storage
would benefit from national leadership and
enhanced coordination.
2.6.3 Access to venture capital and finance
Limited access to capital during the growth
stage of a company is seen by industry as
a key reason for high growth technology
companies leaving Australia (Fitzsimmons,
2015). Access to early stage venture capital
54
can be challenging in Australia based on
a sentiment that Australian investors have
a low appetite for risk. The introduction of
tax incentives for investors in early stage
innovative companies announced in the
Australian Government’s National Innovation
and Science Agenda (Commonwealth of
Australia, 2016b) is seen as a mechanism to
support early stage ventures in Australia,
albeit at a smaller scale to the UK’s successful
Seed Enterprise Investment Scheme. On
the other hand, the finance sector suggests
that there is no shortage of finance for
projects with appropriate risk and return
profiles. However, projects that require
large investments and have significant
development times – such as PHES – are
particularly challenging to finance.
Government efforts to mitigate investment
risks can help to enable greater private
investment in high capital projects, such
as PHES systems. The 2017 International
Renewable Energy Agency (IRENA) report,
Rethinking Energy, notes that: “limited public
funds need to be used in a way that maximises
the mobilisation of private finance … this
means a shift from traditional public financial
instruments (e.g. grants and loans) toward risk
mitigation instruments such as guarantees that
cover political, currency and power-offtake risks”
(IRENA, 2017).
The Clean Energy Finance Corporation (CEFC)
is a positive initiative with great potential to
stimulate growth in the energy storage sector.
In September 2016, the CEFC made a $A10
million commitment to help establish a Clean
Energy Seed Fund to be managed by Artesian
Venture Capital. The fund aims to invest a
total of $A20 million in 30–50 high growth
potential startups over the next 4–5 years.
Energy storage is one of the sectors that this
fund intends to target (Clean Energy Finance
Corporation, 2016).
2.6.4 Strategic coordination and collaboration
Challenges with industry-research collaboration
are not unique to the energy storage sector.
It is widely recognised that Australia has
strengths in research and knowledge creation,
but does not perform as well in the transfer
and application of knowledge (Innovation
and Science Australia, 2016).
Greater value and impact from Australian
energy storage research initiatives could
be achieved through establishment of
collaborative research hubs (BatTRI-
Hub, ACES and ASTRI are examples of
successfully operating hubs) targeting
industry collaboration; strategic international
collaborations; and funding with major
international programs.
55
2.7 Key Findings
3. Australia is well placed to participate in global energy storage supply chains. Business opportunities will arise, given appropriate policy decisions at State and Commonwealth levels, and incentives for actors across those supply chains.
• Australia has abundant raw mineral
resources for batteries (most notably
lithium), but could capture greater value
through beneficiation (i.e. value-adding to
the raw mineral resources).
• Australian companies and researchers
are commercialising their energy storage
intellectual property (software and
hardware for battery integration, design
and deployment of off-grid energy supply
and micro-grids, and battery technology
and components) through international
and global partnerships.
• Australia has abundant resources (e.g.
solar), appropriately skilled workforces
and established supply chain relationships
to generate renewable hydrogen and
ammonia at the volumes required to
supply potential export markets, such as
Japan and Korea.
4. Australia’s research and development performance in energy storage technologies is world class; but it would benefit from strategic focus and enhanced collaboration.
• Australia is recognised as conducting
world-leading research in several
energy storage disciplines including
electrochemistry, materials development
and materials processing for advanced
batteries, and power system design and
modelling.
• Deriving the full return-on-investment
from this research requires improved
research translation through national
and international industry-research
collaboration and commercialisation.
5. The availability of private sector risk capital and profitable revenue streams for Australian energy storage start-ups and projects is a challenge for new ventures, as is policy uncertainty.
• Profitable revenue streams from energy
markets together with consistent, stable
and integrated energy and climate policies
will be essential to drive investment in
energy storage and other technology
solutions that support decarbonisation
of the electricity system while ensuring
system security and consumer equity.
• Technology-neutral market-based
reforms will be required to address these
challenges at least cost.
56
CHAPTER 3 ENVIRONMENTAL BENEFITS AND RISKS FROM ENERGY STORAGE UPTAKE
3 IntroductionLow-carbon technologies in energy systems provide climate change mitigation and reduce pollution. It is important to assess the full lifecycle of any new technology to identify potential negative impacts, including unforeseen negative environmental and social consequences.
Energy storage technologies are
considered essential to future renewable
energy systems. However, they may have
high resource requirements and significant
environmental and social impacts that
need to be appropriately managed before
a sustainable energy system can be
realised.
Five stationary energy storage technology
groups were reviewed for this report:
• Battery technologies: lithium-ion, lead-
acid, sodium-based chemistries and
flow batteries
• PHES
• CAES
• Hydrogen energy storage
• Concentrated solar power with thermal
energy storage (CSP TES).
3.1 Impact Assessment Framework
An impact assessment framework was developed
based on a streamlined lifecycle approach
to identify environmental and social impact
“hotspots” along the supply chain (Ellingsen et al.,
2016). The criteria are defined according to the
environmental, social and safety impact categories.
The framework is intentionally broad to enable
a comparison of the diversity of energy storage
technologies, which are at different levels of
maturity. Impacts along the entire supply chain
have been examined.
A detailed techno-economic assessment is
outside of the scope of this report. Hence, the
impacts that are highlighted as “hotspots” require
additional research or intervention. The full
Impact Assessment Framework is provided
as a table in Appendix 6.
57
3.1.1 Environmental and social impacts
The aim was to identify key “hotspots” rather
than quantify the environmental impacts.
Thus, a traditional environmental life cycle
assessment (E-LCA) was not considered
appropriate in the context of this report. A
strong emphasis on qualitative impacts was
considered, for example where an E-LCA has
a value for water use or human toxicity. A
deficiency of E-LCA is that it does not provide
location specific information – such as the
impact of water use on the environment or
the human health effects that may occur at
mining sites in various regions.
In the framework, resource depletion is
considered in the impact categories of
material intensity and recyclability. Climate
change impacts are considered in the
category of lifecycle GHG emissions, while
the environmental health40 category looks at
damage to ecosystems and human health,
including typical Life Cycle Assessment (LCA)
criteria of land use, water use, human toxic
effects, biodiversity and other pollutants.
Importantly, lifetime energy efficiency,
recyclability and supply chain criticality
categories – environmental and economic
impacts associated with vulnerability to
shortages of raw materials – have been
added to the scope of the LCA (see Box 10
for definitions).
The main impact categories of Social
Life Cycle Assessment (S-LCA) have been
simplified to focus on the categories of
human rights and health and safety (see
Box 10 for definitions), where the main
stakeholder groups considered are workers,
consumers and local community. Where
appropriate, supply chain stakeholders
and society as a whole are also considered
(Benoît & Mazijn, 2009).
40 The environmental health category includes health impacts on workers and communities, for example those arising from heavy metal contamination during mining.
40. The environmental health category includes health impacts on workers and communities, for example those arising from heavy metal contamination during mining.
58
Box 10: Definitions for S-LCA
Lifetime energy efficiency – different
efficiency measures vary in their importance
depending on the application of the
technology. Thus, no single measure is
universally appropriate. For example, for long-
duration storage (weeks or months) the self-
discharge rate (how quickly a storage device
loses its stored energy when not in use) is
very important. For efficiency when in use the
round-trip efficiency (a measure of the ratio
of the energy retrieved from the battery to
the energy put into the system) is important
because a higher round-trip efficiency
reduces the technology uptake requirement
and emissions. It is also important to consider
the expected lifetime of a storage technology
as this, coupled with round-trip efficiency,
determines the total energy that can be
stored and released over the lifetime, with
implications for minimising total resource
requirements and associated impacts.
Recyclability – For recyclability, the end-of-life
recycling rate of products, current technical
recycling potential and material value for
recycling have been considered. A material
with a lower recycled content compared to
end-of-life recycling rate reflects growing
demand for the material and shows the limit
to recycling’s ability to contribute to meeting
total demand (UNEP, 2011).
Supply chain criticality – Material “criticality”
can be measured in various ways. Supply risk
is based on a combination of substitutability,
end-of-life recycling rate and the proportion
of producing countries that have poor
governance. Criticality is dynamic over time
in response to changes in technology and
geopolitics. Qualitative aspects of the supply
chain have been reviewed, including the
major uses of materials and the potential
impact this could have on supply for energy
storage technologies. Where information
exists, the major countries and corporations
involved and their share of the global supply
chain are included.
Human rights – This category is focused on
workers and the local community as the
main stakeholder groups. For workers, the
main issues included child labour, a ‘fair’
salary, working hours, forced labour, equal
opportunities and discrimination, and social
benefits or security. For the local communities,
the focus was on access to resources, cultural
heritage, safe and healthy living conditions,
respect for indigenous rights, community
engagement, local employment and secure
living conditions.
Health and safety – This focus is on
impacts for workers along the supply chain
(particularly in manufacturing, installation,
maintenance and end-of-life) and consumers.
Health and safety impacts during the mining
phase are addressed in the human rights
criteria, as they relate to broader issues of
working conditions and child labour.
3.2 Impact Assessment
It is challenging to make direct comparison
across the technology groups – owing to
different technology characteristics, technical
maturities, and potential applications at
different scales. Nevertheless, a comparison
is useful to flag impact “hot spots”, to help
inform future research, and to support the
development of priority mitigation and
management strategies.
3.2.1 Lifecycle energy efficiency
Lifecycle energy efficiency is important
because a high efficiency maintained
59
over a longer than expected lifetime
minimises energy losses, technology uptake
requirements and associated impacts.
Lithium-ion batteries perform well with a high
average round-trip efficiency (~90 per cent)
compared to lead-acid (~80 per cent) and
flow batteries (~75 per cent). For comparison,
the efficiency of conventional electricity
transmission and distribution systems in
Australia is approximately 90 per cent on
average.
PHES has the highest round-trip efficiency
(75–80 per cent) of high-volume bulk energy
storage technologies and also has the longest
lifetime of all technologies: between 50 and
150 years. The expected lifetimes for lithium
batteries are also slightly longer than, for
example, lead-acid and flow batteries, but
are still short in comparison to bulk storage
technologies.
Hydrogen-to-power performs poorly (20 per
cent) against other technologies when
considering lifecycle energy efficiency.
3.2.2 Lifecycle greenhouse gas emissions
The carbon intensity of the energy mix in
the use phase of its lifecycle has the biggest
impact on overall lifecycle GHG. However, as
energy systems transition to more renewable
sources, the emissions contributed by material
extraction and manufacturing processes
become more significant.
In terms of the current high carbon-intensity
of Australia’s energy grid, the technologies
with a high round-trip efficiency, such as
lithium-ion, perform relatively well. For bulk
energy storage, PHES performs the best
whilst CAES does not perform as well as
other technologies as it is typically integrated
with natural gas combustion resulting in
CO2 emissions that impact on lifecycle GHG
emissions. Hydrogen-to-power is also not
highly ranked when considering impact on
lifecycle GHG emissions, but the flexibility
of hydrogen in terms of end-use could
support the decarbonisation of heat, power,
transport and industrial processes. There is
also potential for large-scale long-distance
renewable energy export.
It is difficult to directly compare CSP with TES
lifecycle emissions because these systems
generate electricity as well as provide energy
storage, but within the system the thermal
storage component contributes a very small
amount to the overall emissions.
3.2.3 Supply chain criticality
Supply chain criticality not only considers
geological availability of resources, but also
potential supply chain vulnerabilities and
risks associated with economic, technological,
social or geopolitical factors. It provides
insights for understanding technology
development trends and enabling new
opportunities for industry and research.
Lithium-ion batteries have the highest level
of supply chain criticality owing to the
use of cobalt, natural graphite, fluorspar,
phosphate rock and lithium. The different
lithium-ion battery chemistries, in particular
nickel manganese cobalt oxide (NMC)
chemistry, have a higher level of supply chain
criticality owing to the supply risk of cobalt.
Half of world cobalt production is from the
Democratic Republic of Congo (DRC) and the
vast majority of the world’s resources are in
the DRC and Zambia.
The security of supply of antimony used in
certain lead-acid batteries and vanadium for
Vanadium Redox Flow batteries (VRB) are also
potentially of concern. Polymer Exchange
Membrane (PEM) electrolysis technology for
hydrogen production uses platinum catalysts
that are identified as critical on the basis of
supply chain constraints. For CSP TES plants,
there are no issues in terms of material
60
criticality of the Thermal Energy Storage (TES)
materials (nitrate salts) although there are
potential constraints on supply of silver and
cerium for CSP. None of the materials used for
PHES or CAES is considered critical to supply
chains.
3.2.4 Material intensity
Material intensity is an important metric
owing to the high use of non-renewable
resources in energy storage technologies. In
general, battery storage technologies have
a higher material intensity compared to the
other technologies reviewed. Lithium-ion
batteries have a relatively high energy density
that makes them less material intense than
the alternative battery technologies (there are
significant differences between the lithium-
ion chemistries). The material intensity of
CSP is relatively high compared to other
renewable generation technologies, however
the molten nitrate salts used for thermal
storage are abundant.
3.2.5 Recyclability
With energy storage technologies, there is the
potential to alleviate high material intensity
through recycling, reuse, or remanufacturing.
Low recyclability highlights a need to develop
new infrastructure and technology and
stewardship approaches. Lead-acid batteries
are the only battery technology to have a
high level of recycling in Australia (90 per
cent) as recycling offers a return to recyclers.
New batteries are typically manufactured with
60–80 per cent recycled content.
While most lithium-ion batteries are
technically recyclable, there is neither the
economic driver nor a policy incentive
for recycling in Australia. As the market
grows for energy storage batteries, so will
the hazardous waste stream that – as with
lead-acid batteries – can become a resource
recovery opportunity. There are other niche
resource recovery pathways for batteries
under development, for example the potential
for ‘rebirthing’ batteries from electric vehicles
at the end-of-first-life, for use in stationary
energy storage. For hydrogen storage, there
are established pathways (although not
located in Australia) for platinum catalyst
recycling capable of achieving high recovery
efficiencies (greater than 95 per cent).
Recycling is well established for the major
materials used for PHES, CAES and CSP with
TES and the long lifetimes for these bulk
storage technologies reduces the need
for recycling.
3.2.6 Environmental health
Damage to ecosystems or human health
along the supply chain can undermine the
benefits of moving to a renewable energy
system. As batteries are a material intense
technology they have the most significant
impacts. These impacts vary depending on
the location of mining, processing, end-
of-life management, and differences in
technology, production pathways and local
environmental and social standards. The most
significant impacts from mining can include
contamination of air, water and soil. The
cobalt mining area of the DRC is one of the
top ten most polluted places in the world due
to heavy metal contamination of air, water
and soil, leading to severe health impacts
both for miners and surrounding communities
(Narendrula et al., 2012).
In the case of bulk storage technologies,
whilst PHES has a relatively large land and
infrastructure footprint the impacts can be
minimised through location in areas that
have already been modified (for example
existing reservoirs, away from conservation
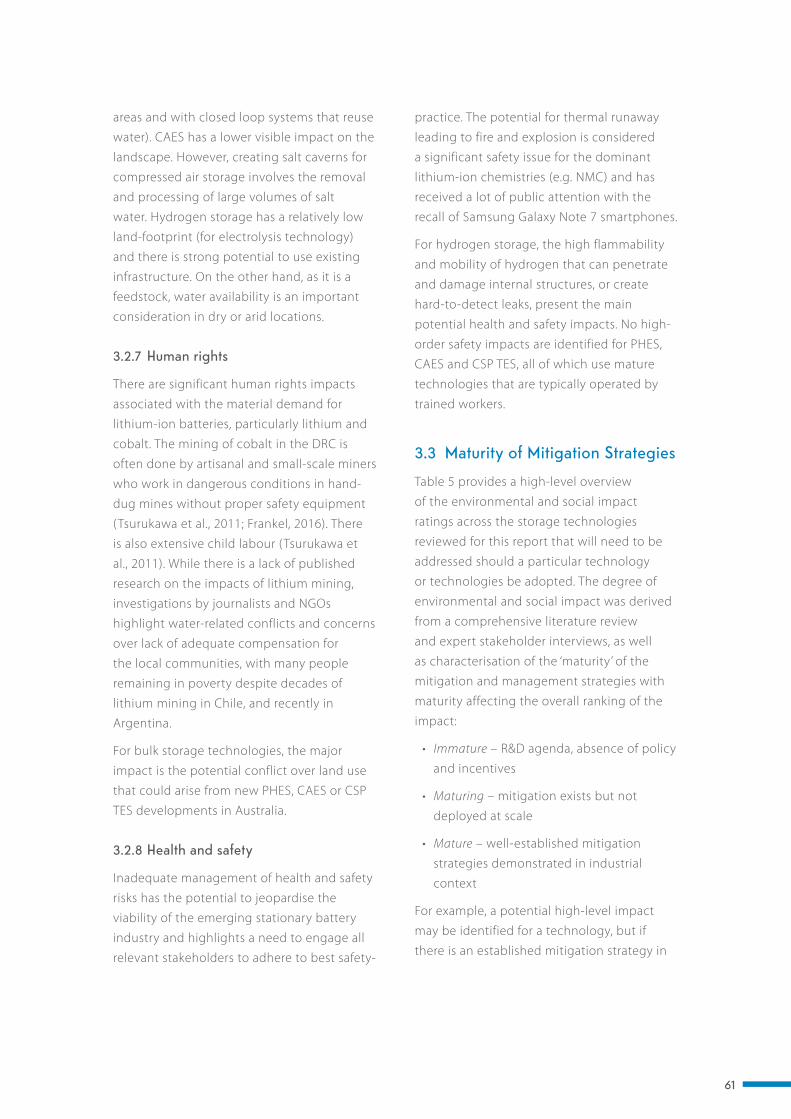
61
areas and with closed loop systems that reuse
water). CAES has a lower visible impact on the
landscape. However, creating salt caverns for
compressed air storage involves the removal
and processing of large volumes of salt
water. Hydrogen storage has a relatively low
land-footprint (for electrolysis technology)
and there is strong potential to use existing
infrastructure. On the other hand, as it is a
feedstock, water availability is an important
consideration in dry or arid locations.
3.2.7 Human rights
There are significant human rights impacts
associated with the material demand for
lithium-ion batteries, particularly lithium and
cobalt. The mining of cobalt in the DRC is
often done by artisanal and small-scale miners
who work in dangerous conditions in hand-
dug mines without proper safety equipment
(Tsurukawa et al., 2011; Frankel, 2016). There
is also extensive child labour (Tsurukawa et
al., 2011). While there is a lack of published
research on the impacts of lithium mining,
investigations by journalists and NGOs
highlight water-related conflicts and concerns
over lack of adequate compensation for
the local communities, with many people
remaining in poverty despite decades of
lithium mining in Chile, and recently in
Argentina.
For bulk storage technologies, the major
impact is the potential conflict over land use
that could arise from new PHES, CAES or CSP
TES developments in Australia.
3.2.8 Health and safety
Inadequate management of health and safety
risks has the potential to jeopardise the
viability of the emerging stationary battery
industry and highlights a need to engage all
relevant stakeholders to adhere to best safety-
practice. The potential for thermal runaway
leading to fire and explosion is considered
a significant safety issue for the dominant
lithium-ion chemistries (e.g. NMC) and has
received a lot of public attention with the
recall of Samsung Galaxy Note 7 smartphones.
For hydrogen storage, the high flammability
and mobility of hydrogen that can penetrate
and damage internal structures, or create
hard-to-detect leaks, present the main
potential health and safety impacts. No high-
order safety impacts are identified for PHES,
CAES and CSP TES, all of which use mature
technologies that are typically operated by
trained workers.
3.3 Maturity of Mitigation Strategies
Table 5 provides a high-level overview
of the environmental and social impact
ratings across the storage technologies
reviewed for this report that will need to be
addressed should a particular technology
or technologies be adopted. The degree of
environmental and social impact was derived
from a comprehensive literature review
and expert stakeholder interviews, as well
as characterisation of the ‘maturity’ of the
mitigation and management strategies with
maturity affecting the overall ranking of the
impact:
• Immature – R&D agenda, absence of policy
and incentives
• Maturing – mitigation exists but not
deployed at scale
• Mature – well-established mitigation
strategies demonstrated in industrial
context
For example, a potential high-level impact
may be identified for a technology, but if
there is an established mitigation strategy in
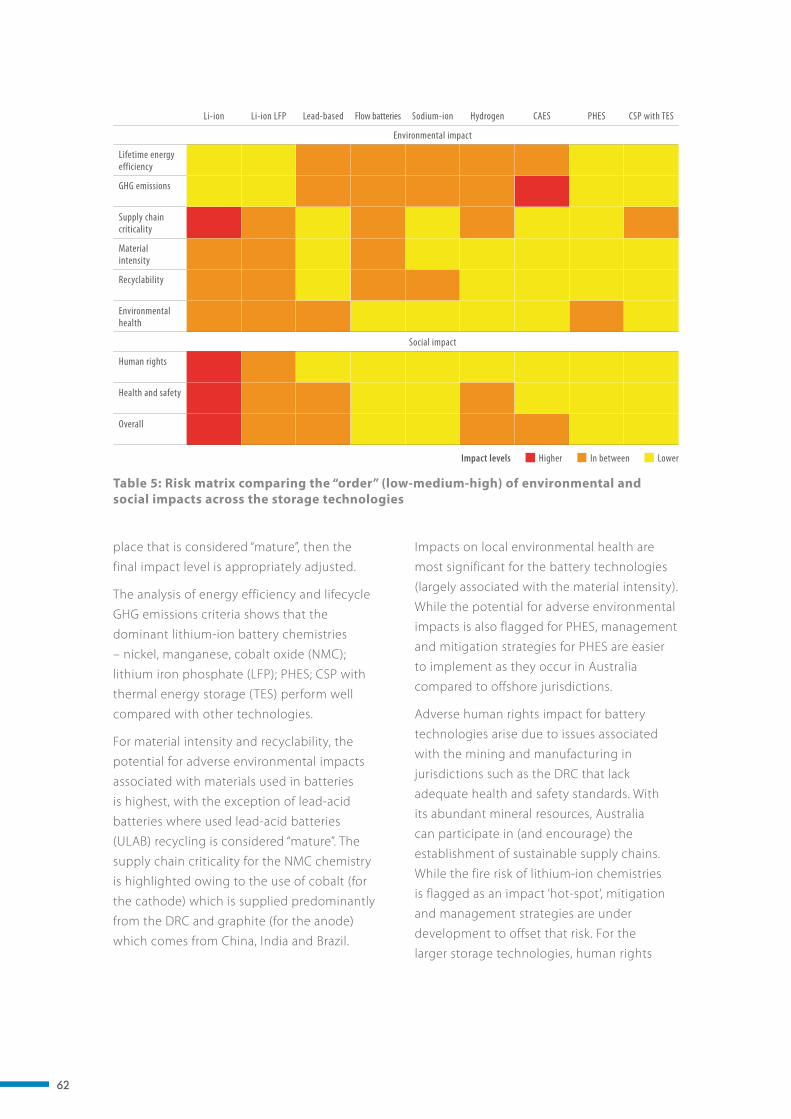
62
place that is considered “mature”, then the
final impact level is appropriately adjusted.
The analysis of energy efficiency and lifecycle
GHG emissions criteria shows that the
dominant lithium-ion battery chemistries
– nickel, manganese, cobalt oxide (NMC);
lithium iron phosphate (LFP); PHES; CSP with
thermal energy storage (TES) perform well
compared with other technologies.
For material intensity and recyclability, the
potential for adverse environmental impacts
associated with materials used in batteries
is highest, with the exception of lead-acid
batteries where used lead-acid batteries
(ULAB) recycling is considered “mature”. The
supply chain criticality for the NMC chemistry
is highlighted owing to the use of cobalt (for
the cathode) which is supplied predominantly
from the DRC and graphite (for the anode)
which comes from China, India and Brazil.
Impacts on local environmental health are
most significant for the battery technologies
(largely associated with the material intensity).
While the potential for adverse environmental
impacts is also flagged for PHES, management
and mitigation strategies for PHES are easier
to implement as they occur in Australia
compared to offshore jurisdictions.
Adverse human rights impact for battery
technologies arise due to issues associated
with the mining and manufacturing in
jurisdictions such as the DRC that lack
adequate health and safety standards. With
its abundant mineral resources, Australia
can participate in (and encourage) the
establishment of sustainable supply chains.
While the fire risk of lithium-ion chemistries
is flagged as an impact ‘hot-spot’, mitigation
and management strategies are under
development to offset that risk. For the
larger storage technologies, human rights
Table 5: Risk matrix comparing the “order” (low-medium-high) of environmental and social impacts across the storage technologies
Li-ion Li-ion LFP Lead-based Flow batteries Sodium-ion Hydrogen CAES PHES CSP with TES
Environmental impact
Lifetime energy efficiency
GHG emissions
Supply chain criticality
Material intensity
Recyclability
Environmental health
Social impact
Human rights
Health and safety
Overall
LowerImpact levels In betweenHigher
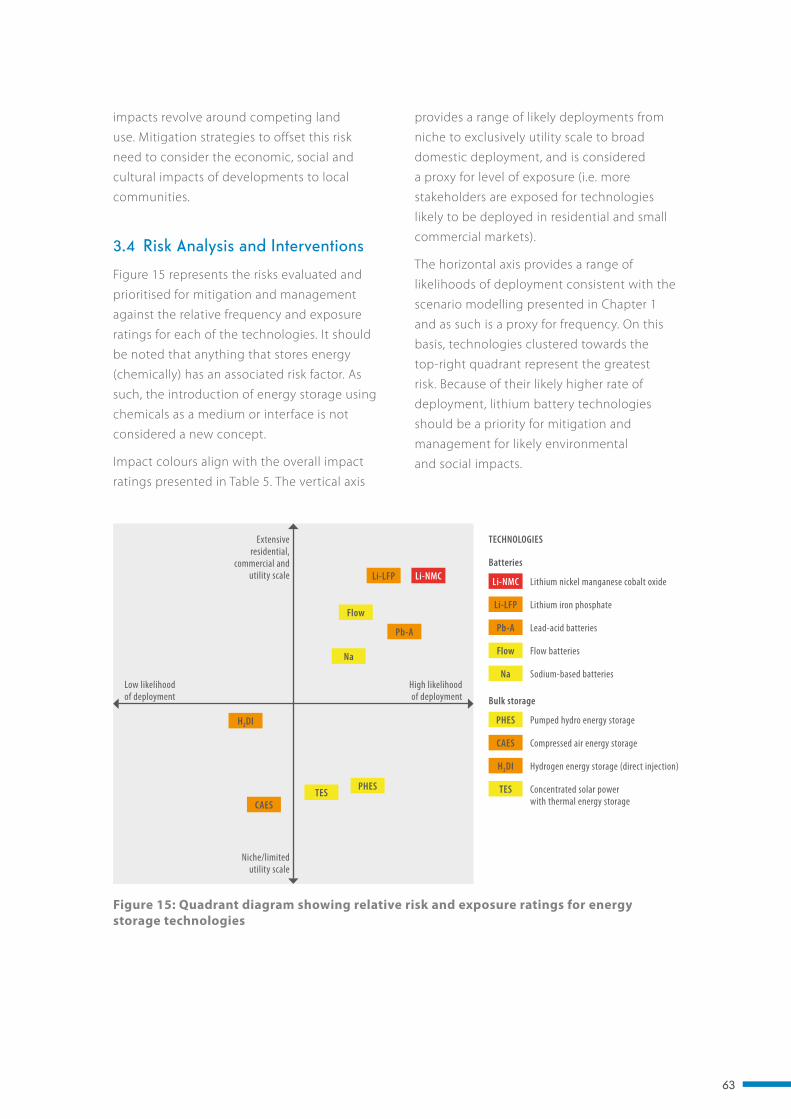
63
impacts revolve around competing land
use. Mitigation strategies to offset this risk
need to consider the economic, social and
cultural impacts of developments to local
communities.
3.4 Risk Analysis and Interventions
Figure 15 represents the risks evaluated and
prioritised for mitigation and management
against the relative frequency and exposure
ratings for each of the technologies. It should
be noted that anything that stores energy
(chemically) has an associated risk factor. As
such, the introduction of energy storage using
chemicals as a medium or interface is not
considered a new concept.
Impact colours align with the overall impact
ratings presented in Table 5. The vertical axis
provides a range of likely deployments from
niche to exclusively utility scale to broad
domestic deployment, and is considered
a proxy for level of exposure (i.e. more
stakeholders are exposed for technologies
likely to be deployed in residential and small
commercial markets).
The horizontal axis provides a range of
likelihoods of deployment consistent with the
scenario modelling presented in Chapter 1
and as such is a proxy for frequency. On this
basis, technologies clustered towards the
top-right quadrant represent the greatest
risk. Because of their likely higher rate of
deployment, lithium battery technologies
should be a priority for mitigation and
management for likely environmental
and social impacts.
Lithium nickel manganese cobalt oxide
Batteries
Li-NMCLi-NMC
Lithium iron phosphateLi-LFP
Li-LFP
Lead-acid batteriesPb-APb-A
Flow batteriesFlow
Flow
Sodium-based batteriesNa
Na
TECHNOLOGIES
Pumped hydro energy storage
Bulk storage
PHES
PHES
Compressed air energy storageCAES
CAES
Hydrogen energy storage (direct injection)H2DI
H2DI
Concentrated solar power with thermal energy storage
TESTES
Low likelihood of deployment
High likelihood of deployment
Niche/limited utility scale
Extensive residential,
commercial and utility scale
Figure 15: Quadrant diagram showing relative risk and exposure ratings for energy storage technologies
64
Priority focal points for intervention include:
Engage the emerging battery energy storage industry stakeholders to ensure their adherence to best practice for safety.
• The current focus of safety risk mitigation
strategies prioritise installation, which is
logical given the status of the emerging
battery energy storage industry. The
main initiatives include the development
of installation guidelines, installation
standards, efforts towards establishing
a national energy register, and efforts
to align Australian initiatives with
international product standards.
• Engage with the industry to adopt best
practice as a standard is developed and
evolves. In the absence of any regulatory
levers, the Clean Energy Council has
implemented “battery endorsement” for
PV accredited installers. Some industry
stakeholders are advocating for changes
to state and territory electrical safety
standards to ensure a more enduring
(potentially regulatory) solution that
encourages industry engagement and
adherence to safety standards.
The development of stewardship approaches for responsible end-of-life management.
• Stationary storage batteries could present
a significant waste management challenge
or resource recovery opportunity in the
coming decades. As there is no economic
or policy driver in place, encouraging
investment in end-of-life management
infrastructure is a priority. Chapter 2
identifies that opportunities for the
creation of a recycling and repurposing
industry will grow as the battery energy
storage industry grows.
• Establishing a product stewardship scheme
requires multiple points of intervention
along the supply chain (retail, installation,
deinstallation, end-of-life) highlighting the
need to engage a range of stakeholders. A
stakeholder with expertise in this area (and
consulted as part of information gathering)
identified the opportunity to align efforts
to improve end-of-life management with
complementary ongoing efforts to
ensure safety:
– Installation and deinstallation represent
a shared opportunity for ensuring
safety and establishing pathways for
responsible end-of-life management;
– Making the cost of end-of-life
transparent at the point of sale (as
opposed to the point of disposal) leads
to better end-of-life management
outcomes; and
– Consistent approaches to stakeholder
engagement and awareness-raising
through, for example, protocols for
information transmission along the
supply chain and consistency in
signage and labelling.
• There is a strong rationale for action now
rather than in ten years when the first
installations reach end-of-life.
Encourage the development of sustainable supply chains for metals.
• Australian governments and companies
can take a leading role in putting
sustainable supply chains on the global
agenda by supporting initiatives, including
ethical sourcing and corporate social
responsibility, mining and chain-of-
custody standards such as that developed
for the steel industry (Australia led the
development of the Steel Stewardship
Forum), national sustainable supply chain
legislation, increased rates of recycling
and reuse, and new research to address
the lack of data characterising supply
chain impacts, criticality, and the best
approaches for mitigation.
65
3.5 Key Findings
6. A high uptake of battery storage has a potential for significant safety, environmental and social impacts that would undermine its net benefits.
• The development of safety standard is
required given anticipated rapid uptake
of batteries.
• As an early market “test bed” for batteries,
Australia has an opportunity to promote
and lead development of sustainable
supply chains from mining to disposal.
This would use Australia’s expertise in
sustainable mining to lead and support the
development of international standards.
• There are opportunities for consumers
to influence commercial behaviour
globally through improved awareness of
the environmental and social impacts of
battery development.
7. Unless planned for and managed appropriately, batteries present a future waste management challenge.
• Australia has an opportunity to play a
product stewardship role to ensure the
sustainable repurposing of used electric
vehicle batteries and recycling of all
batteries.
• Focused development of recycling
infrastructure and technology will be
crucial and provides an opportunity for
industry development and job growth.
66
CHAPTER 4 SOCIAL DRIVERS AND BARRIERS TO UPTAKE OF ENERGY STORAGE
to consider energy storage opportunities
such as batteries (Agnew & Darguschm, 2017;
Colmar Brunton, 2015).
With the large-scale deployment of energy
storage still in its infancy, it is timely to
consider and understand how consumers,
industry and policy makers are responding
to energy storage technologies. The growing
international trend to move towards clean
reliable energy – most often supplied by
renewables – indicates that the emergent
energy storage industry is poised for a
transformation. Responses to storage
technologies will be location specific (see
Box 11) and will be influenced by a range
of factors.
The absence of long-term renewable energy
targets and a widening social inequality has
raised concerns about the distribution of solar
energy production. Uniform tariffs that are
not means tested or that might regressively
tax low socio-economic and vulnerable
groups are seen to, in effect, provide subsidies
or “middle class welfare” for more affluent
demographics (Nelson, Simshauser & Nelson,
2012; Simpson & Clifton, 2016).
There is concern that electricity prices will
become an increasing financial burden for
households. The cessation of several generous
feed-in tariff schemes has led to concerns
about increased electricity prices. In response
to these concerns, Australians are beginning
4 IntroductionOver the past decade, Australian households, utilities, investors and governments have spent some $A40 billion, in nominal terms, on clean energy investment (Bloomberg New Energy Finance, 2016). This investment contributed to solar PV installations growing from 8 MW to 5,400 MW, or approximately 9 per cent of current electricity generation capacity (Australian PV Institute, 2016). The growth has occurred largely in the residential sector and has been supported through various state and commonwealth schemes including generous feed-in tariffs and Renewable Energy Certificates.
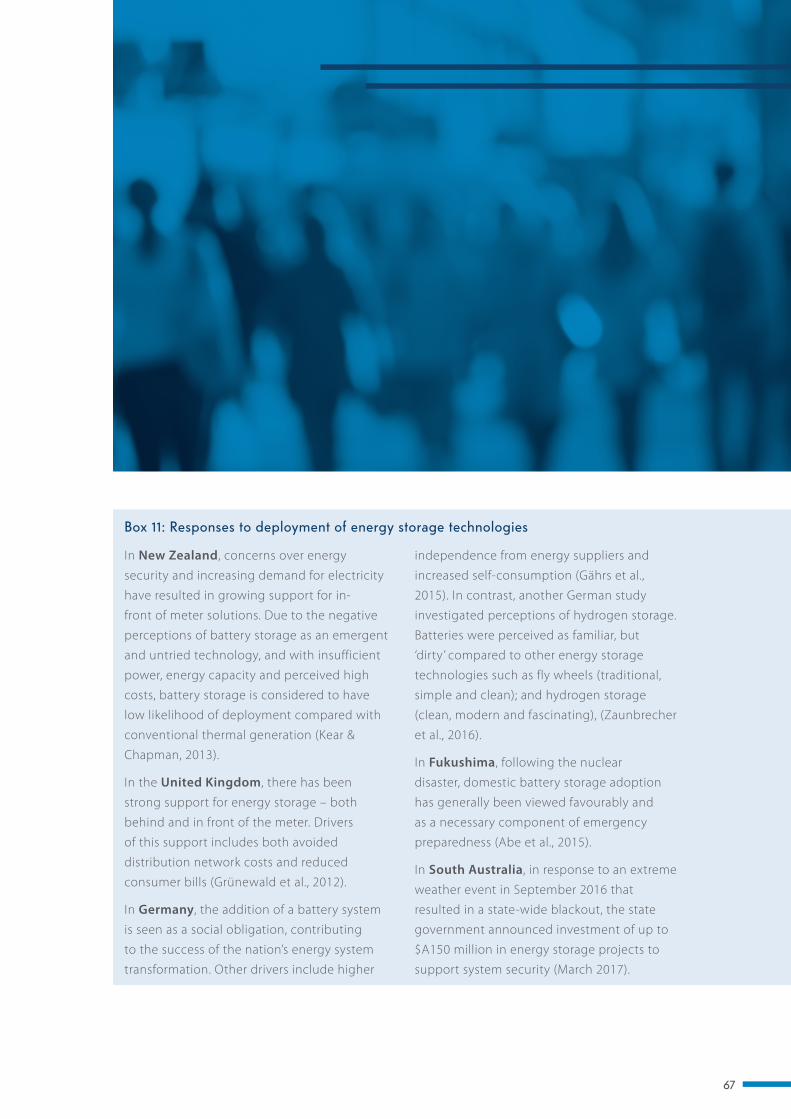
67
Box 11: Responses to deployment of energy storage technologies
In New Zealand, concerns over energy
security and increasing demand for electricity
have resulted in growing support for in-
front of meter solutions. Due to the negative
perceptions of battery storage as an emergent
and untried technology, and with insufficient
power, energy capacity and perceived high
costs, battery storage is considered to have
low likelihood of deployment compared with
conventional thermal generation (Kear &
Chapman, 2013).
In the United Kingdom, there has been
strong support for energy storage – both
behind and in front of the meter. Drivers
of this support includes both avoided
distribution network costs and reduced
consumer bills (Grünewald et al., 2012).
In Germany, the addition of a battery system
is seen as a social obligation, contributing
to the success of the nation’s energy system
transformation. Other drivers include higher
independence from energy suppliers and
increased self-consumption (Gährs et al.,
2015). In contrast, another German study
investigated perceptions of hydrogen storage.
Batteries were perceived as familiar, but
‘dirty’ compared to other energy storage
technologies such as fly wheels (traditional,
simple and clean); and hydrogen storage
(clean, modern and fascinating), (Zaunbrecher
et al., 2016).
In Fukushima, following the nuclear
disaster, domestic battery storage adoption
has generally been viewed favourably and
as a necessary component of emergency
preparedness (Abe et al., 2015).
In South Australia, in response to an extreme
weather event in September 2016 that
resulted in a state-wide blackout, the state
government announced investment of up to
$A150 million in energy storage projects to
support system security (March 2017).

68
There is considerable uncertainty facing
the energy storage sector. In Australia, this
uncertainty includes the energy policy discord
between national and state jurisdictions as
well as the lack of a national standard for
residential lithium-ion batteries, in particular
regarding system design, battery enclosure
ventilation, maintenance testing performance
and system documentation (Standards
Australia, 2016).
The uptake of energy storage has the
potential to blur distinctions between the
once clear boundaries of ‘products’ and
‘services’ for the energy and other sectors.
This may result in the creation of further
complexity for consumers, where the risk of
rapid market development could possibly
“erode existing ombudsman jurisdiction,
effectiveness and reputation” (Benevenuti,
2016). This is in contrast with the Australian
Energy Market Commission’s (AEMC) view that
battery storage and “the functions it performs
are not different to other types of technology
and can be accommodated within the existing
regulatory framework”, where “competitive
market frameworks currently in place will allow
consumer preferences to drive how the sector
develops” (AEMC, 2015). Notwithstanding
these mixed messages and policy uncertainty,
the development and implementation of
energy storage solutions is already underway
globally and is expected to see strong
similarities in adoption with other smart
grid enabling technologies.
4.1 Socio-technical Uptake of Other Smart Grid Technologies
A number of lessons can be drawn from
the previous roll out of energy related
technologies and initiatives – solar PV cells,
smart meters, changing tariff structures
through cost reflective pricing and energy
efficiency – when considering the potential
uptake of energy storage in Australia. Each
of these has relevance as they represent
new technologies and innovations that
have challenged the way that householders
use and interact with their home energy41.
Lessons can also be learned from the different
financial structures that have incentivised
or constrained market penetration. A
summary of the key findings from research
documenting societal responses to these
issues follows.
4.1.1 Solar PV
The path dependency of societal solar
uptake has changed significantly within
Australia in the past two decades and can be
characterised into three eras – Pre-FiT (feed-
in tariff ), Premium FiT and Low FiT – where
each is influenced by different demographic
variables and attitudes towards solar (see
Figure 16). The influence of the various
incentive schemes that promoted PV can
help to inform considerations regarding
finance options for energy storage at both the
individual and community level.
Understanding the drivers and uptake of
solar PV helps to inform considerations for
storage uptake in a number of ways. Many
respondents believe the early market for
battery storage in Australia will mostly benefit
households with existing solar PV that are:
• experiencing a recent loss in their
premium FiTs and are now facing the true
cost of electricity within their jurisdictions.
• early adopters of technology who
invested in solar and are therefore likely
to be interested in the emergent battery
technologies.
41 Just as consumers were challenged by the introduction of motor vehicles onto roads that had been established for the horse and cart.
41. Just as consumers were challenged by the introduction of motor vehicles onto roads that had been established for the horse and cart.
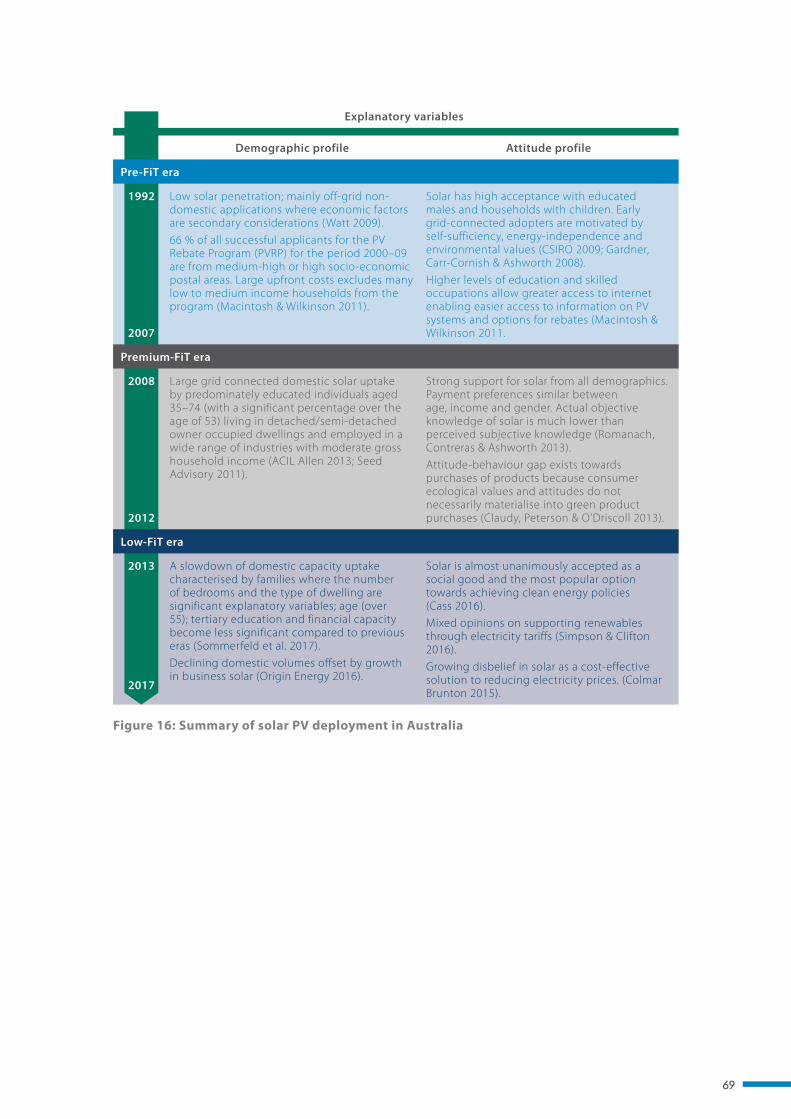
69
2017
2012
2008
1992 Low solar penetration; mainly off-grid non-domestic applications where economic factors are secondary considerations (Watt 2009).66 % of all successful applicants for the PV Rebate Program (PVRP) for the period 2000–09 are from medium-high or high socio-economic postal areas. Large upfront costs excludes many low to medium income households from the program (Macintosh & Wilkinson 2011).
Solar has high acceptance with educated males and households with children. Early grid-connected adopters are motivated by self-sufficiency, energy-independence and environmental values (CSIRO 2009; Gardner, Carr-Cornish & Ashworth 2008).Higher levels of education and skilled occupations allow greater access to internet enabling easier access to information on PV systems and options for rebates (Macintosh & Wilkinson 2011.
Large grid connected domestic solar uptake by predominately educated individuals aged 35–74 (with a significant percentage over the age of 53) living in detached/semi-detached owner occupied dwellings and employed in a wide range of industries with moderate gross household income (ACIL Allen 2013; Seed Advisory 2011).
Strong support for solar from all demographics. Payment preferences similar between age, income and gender. Actual objective knowledge of solar is much lower than perceived subjective knowledge (Romanach, Contreras & Ashworth 2013). Attitude-behaviour gap exists towards purchases of products because consumer ecological values and attitudes do not necessarily materialise into green product purchases (Claudy, Peterson & O’Driscoll 2013).
A slowdown of domestic capacity uptake characterised by families where the number of bedrooms and the type of dwelling are significant explanatory variables; age (over 55); tertiary education and financial capacity become less significant compared to previous eras (Sommerfeld et al. 2017). Declining domestic volumes offset by growth in business solar (Origin Energy 2016).
Solar is almost unanimously accepted as a social good and the most popular option towards achieving clean energy policies (Cass 2016). Mixed opinions on supporting renewables through electricity tariffs (Simpson & Clifton 2016). Growing disbelief in solar as a cost-effective solution to reducing electricity prices. (Colmar Brunton 2015).
Demographic profile Attitude profile
Low-FiT era
Premium-FiT era
Pre-FiT era
Explanatory variables
Figure 16: Summary of solar PV deployment in Australia
2007
2013
70
4.1.2 Smart meters
Advanced metering infrastructure or smart
meters, enables two-way communication of
information about energy use. It is considered
to be critical infrastructure for successful
deployment of battery storage, cost reflective
pricing and support for energy reliability
within distribution networks.
Despite their potential, the forced
government roll out of smart meters in
Victoria resulted in the deployment of
this technology being less positive than
experienced in other jurisdictions. This was
complicated by growing compatibility,
privacy, security and cost concerns post
implementation (Hess, 2014; Lamech, 2014).
In contrast to this local, and similar USA
experience, a UK Department of Energy &
Climate Change survey indicated that the
majority of customers with smart meters
held little to no concern about them, with
only a few indicating that they had been
disadvantaged enough to desire changes
to their devices (DECC, 2015). Feedback also
indicates that after an early engagement
period with devices, long-term usage dropped
off considerably as they lost their novelty
factor, indicating that for smart meters to have
long-term impact, consumers would have to
adopt behind the meter automation software.
4.1.3 Cost reflective pricing
A key element that may facilitate battery
storage uptake is the adoption of cost
reflective pricing and changing patterns of
demand42. Recent evidence suggests that
there is growing support among Australians
for more cost-reflective pricing (Deloitte, 2013;
42 With existing flat rate tariffs there is little motivation for shifting load with batteries (Khalilpour & Vassallo, 2016).
Hall, Jeanneret & Rai, 2016) even as large
differences exist in support of different tariff
structures depending on demographic factors
such as income, education, household type
and rental status (Stenner et al., 2015).
Irrespective of perceived support and
interest for cost reflective pricing, electricity
consumption for most of the Australian
population still remains price inelastic and
relatively unresponsive to price signals
(Hobman et al., 2016). With the institution
of different tariff structures – irrespective of
demand response – this price inelasticity
ultimately produces winners and losers across
households that may create social inequality
concerns for policy makers (Simshauser &
Downer, 2014).
4.1.4 Energy efficiency measures
Energy efficiency measures across Australia
have been critical in reducing electricity
consumption nationwide (Energetics, 2016).
Although there has been a strong drive by
governments and utilities around the world
to promote energy efficiency behaviours, this
has met with mixed results that have mainly
stemmed from gaps between “actual” and
“expected” financial benefits derived from
those measures. This is because rising energy
prices often outweigh expected savings; or
the scope of the intervention is insufficient to
significantly relieve worries about fuel costs
(Chan & Ma, 2016). Unlike other enabling
technologies, household attitudes can
often be predictors of adoption of energy
efficient behaviours, whereas perceived
social pressures to engage or not engage in a
particular behaviour, together with the extent
43. With existing flat rate tariffs there is little motivation for shifting load with batteries (Khalilpour & Vassallo, 2016).
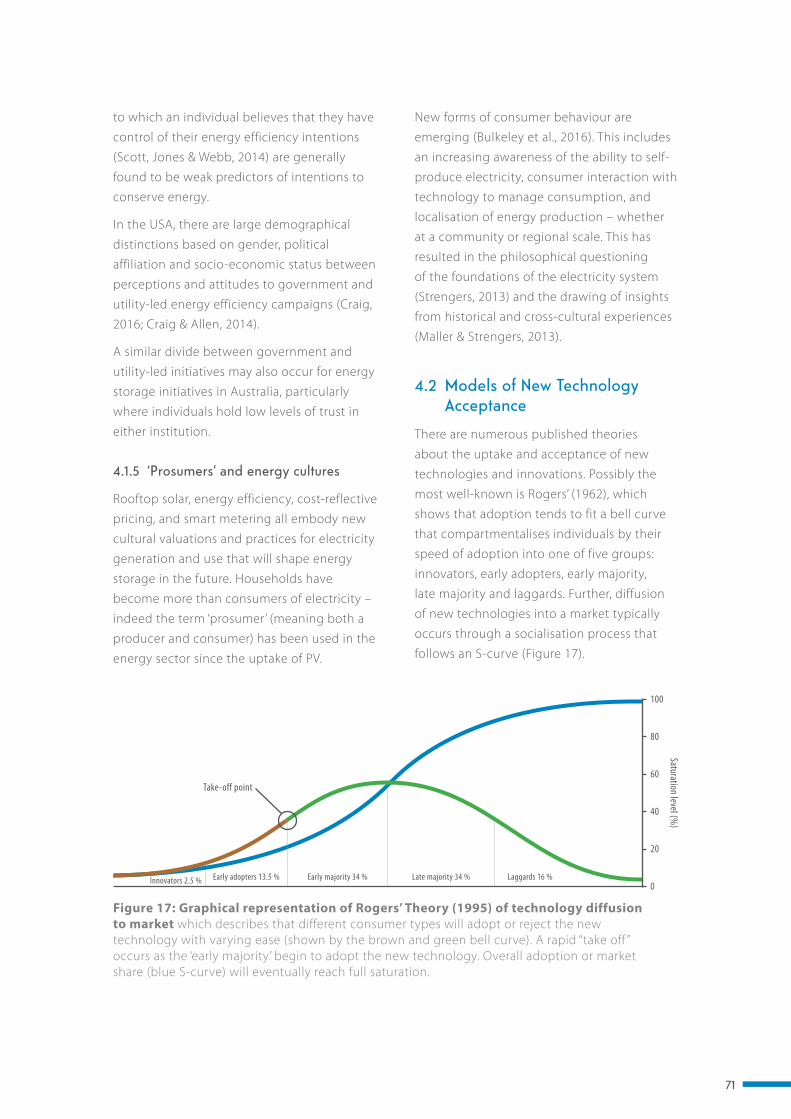
71
to which an individual believes that they have
control of their energy efficiency intentions
(Scott, Jones & Webb, 2014) are generally
found to be weak predictors of intentions to
conserve energy.
In the USA, there are large demographical
distinctions based on gender, political
affiliation and socio-economic status between
perceptions and attitudes to government and
utility-led energy efficiency campaigns (Craig,
2016; Craig & Allen, 2014).
A similar divide between government and
utility-led initiatives may also occur for energy
storage initiatives in Australia, particularly
where individuals hold low levels of trust in
either institution.
4.1.5 ‘Prosumers’ and energy cultures
Rooftop solar, energy efficiency, cost-reflective
pricing, and smart metering all embody new
cultural valuations and practices for electricity
generation and use that will shape energy
storage in the future. Households have
become more than consumers of electricity –
indeed the term ‘prosumer’ (meaning both a
producer and consumer) has been used in the
energy sector since the uptake of PV.
New forms of consumer behaviour are
emerging (Bulkeley et al., 2016). This includes
an increasing awareness of the ability to self-
produce electricity, consumer interaction with
technology to manage consumption, and
localisation of energy production – whether
at a community or regional scale. This has
resulted in the philosophical questioning
of the foundations of the electricity system
(Strengers, 2013) and the drawing of insights
from historical and cross-cultural experiences
(Maller & Strengers, 2013).
4.2 Models of New Technology Acceptance
There are numerous published theories
about the uptake and acceptance of new
technologies and innovations. Possibly the
most well-known is Rogers’ (1962), which
shows that adoption tends to fit a bell curve
that compartmentalises individuals by their
speed of adoption into one of five groups:
innovators, early adopters, early majority,
late majority and laggards. Further, diffusion
of new technologies into a market typically
occurs through a socialisation process that
follows an S-curve (Figure 17).
Figure 17: Graphical representation of Rogers’ Theory (1995) of technology diffusion to market which describes that different consumer types will adopt or reject the new technology with varying ease (shown by the brown and green bell curve). A rapid “take off ” occurs as the ‘early majority’ begin to adopt the new technology. Overall adoption or market share (blue S-curve) will eventually reach full saturation.
100
80
60
40
20
0
Saturation level (%)
Laggards 16 %Late majority 34 %Innovators 2.5 % Early adopters 13.5 % Early majority 34 %
Take-off point
72
The next two strongest determinants
for intention to act favourably are the
perceived costs and benefits. Those negative
determinants of an intention to act are
the perceived negative effects of risk, and
lack of trust in the industry. The TAF model
provides useful insights that can be applied
at the householder level to understand likely
attitudes towards energy storage, in particular
battery storage. A number of the variables
explained in the TAF model were used to
inform the national survey undertaken as part
of this report (see Section 4.3).
4.3 Methodology
A mixed methodology was used to better
understand societal attitudes towards storage
in Australia.
• Interviews were undertaken with stakeholders
who had background knowledge and
experience with energy storage.
– Overall 17 telephone interviews with
19 participants were undertaken with
representatives from government,
industry, academia and community
service organisations (CSO).
• Focus groups were conducted with a cross
section of the public.
– 58 participants (40 per cent male).
• A national survey43 was undertaken (Q & A
Research)44 across a representative sample
of the Australian public (N=1,015).
– Key characteristics of the sample
matched those of the Australian
population including age and gender,
proportion of the sample from each
state and territory and employment
status (ABS 2011). There was an equal
split across gender and across three age
brackets of 18 to 34 years, 35 to
54 years and 55 plus years.
43. Survey questions are available in the Consultant’s Report on the ACOLA website <www.acola.org.au>.
44 <https://qandaresearch.com.au>.
Willingness to adopt a technology is
influenced by a number of characteristics
including awareness, interest, evaluation
and trials of the technology. Based on these
evaluations – either positive or negative
– individuals choose to accept or reject a
technology. If they choose to adopt and
implement the technology, they will seek
supportive statements to confirm that their
choice is a good one (continued support for
the technology reinforces further adoption).
If, however, an individual receives negative
messages, they are likely to discontinue with
that technology – while if an individual first
rejects a technology and finds supportive
messages relating to their decision, that
rejection will continue. However, in the
absence of support for rejection, the
individual may ultimately adopt that
technology.
More recently, social psychology has been
used to explain and predict the social
acceptance of pro-environmental innovations.
Understanding why consumers support or
resist sustainable technology during the
early phase of introduction can lead to more
acceptable designs and implementation
(Huijts, Molin & van Wee, 2014) and
more effective, targeted information and
communication strategies (Huijts, Molin &
Steg, 2012; Zaunbrecher et al., 2016).
One of the more advanced theories on
the identification of causal links between
intention and acceptance is the technology
acceptance framework (TAF) (Huijts et al.,
2013; Huijts, Molin & Steg, 2012; Huijts, Molin
& van Wee, 2014). This model has shown that
a person’s normal behaviour is the strongest
predictor of intention to act in favour of
or against a technology, highlighting its
importance in determining pro-environment
action.
43. Survey questions are available in the Consultant’s Report on the ACOLA website <www.acola.org.au>.
44. <https://qandaresearch.com.au>.
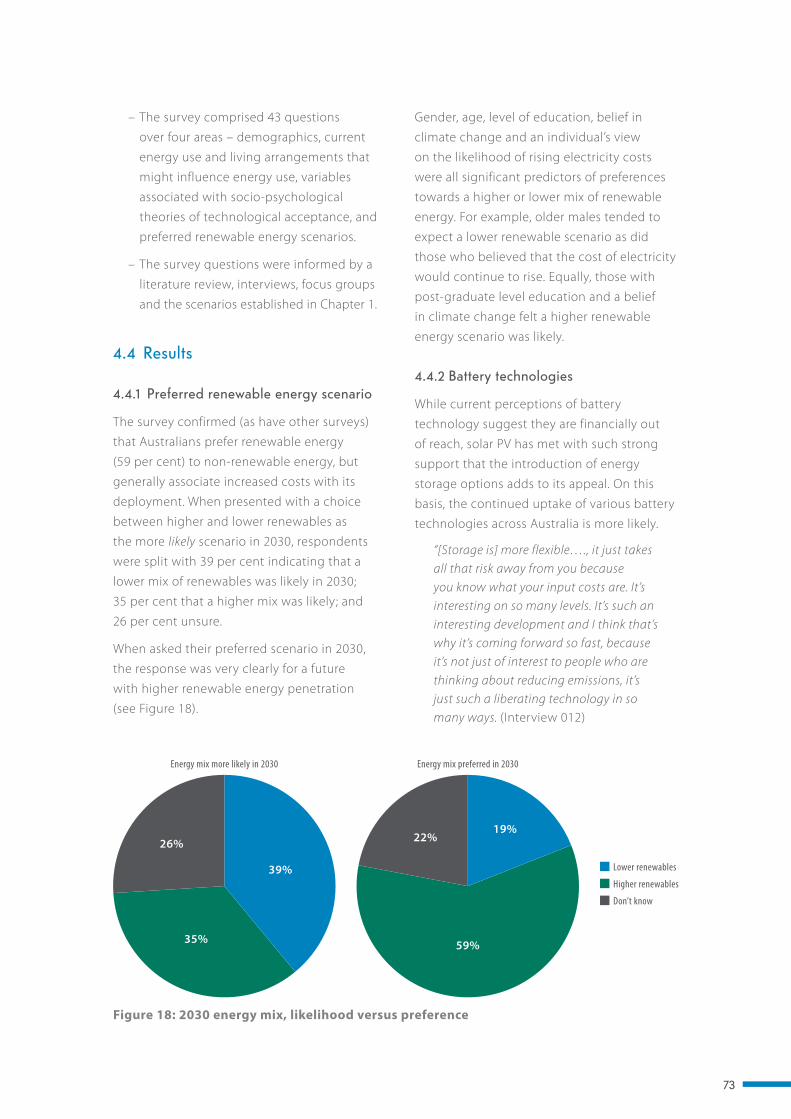
73
– The survey comprised 43 questions
over four areas – demographics, current
energy use and living arrangements that
might influence energy use, variables
associated with socio-psychological
theories of technological acceptance, and
preferred renewable energy scenarios.
– The survey questions were informed by a
literature review, interviews, focus groups
and the scenarios established in Chapter 1.
4.4 Results
4.4.1 Preferred renewable energy scenario
The survey confirmed (as have other surveys)
that Australians prefer renewable energy
(59 per cent) to non-renewable energy, but
generally associate increased costs with its
deployment. When presented with a choice
between higher and lower renewables as
the more likely scenario in 2030, respondents
were split with 39 per cent indicating that a
lower mix of renewables was likely in 2030;
35 per cent that a higher mix was likely; and
26 per cent unsure.
When asked their preferred scenario in 2030,
the response was very clearly for a future
with higher renewable energy penetration
(see Figure 18).
Gender, age, level of education, belief in
climate change and an individual’s view
on the likelihood of rising electricity costs
were all significant predictors of preferences
towards a higher or lower mix of renewable
energy. For example, older males tended to
expect a lower renewable scenario as did
those who believed that the cost of electricity
would continue to rise. Equally, those with
post-graduate level education and a belief
in climate change felt a higher renewable
energy scenario was likely.
4.4.2 Battery technologies
While current perceptions of battery
technology suggest they are financially out
of reach, solar PV has met with such strong
support that the introduction of energy
storage options adds to its appeal. On this
basis, the continued uptake of various battery
technologies across Australia is more likely.
“[Storage is] more flexible…., it just takes all that risk away from you because you know what your input costs are. It’s interesting on so many levels. It’s such an interesting development and I think that’s why it’s coming forward so fast, because it’s not just of interest to people who are thinking about reducing emissions, it’s just such a liberating technology in so many ways. (Interview 012)
Figure 18: 2030 energy mix, likelihood versus preference
Lower renewables
Higher renewables
Don’t know
26%
35%
39%
22%19%
59%
Energy mix more likely in 2030 Energy mix preferred in 2030
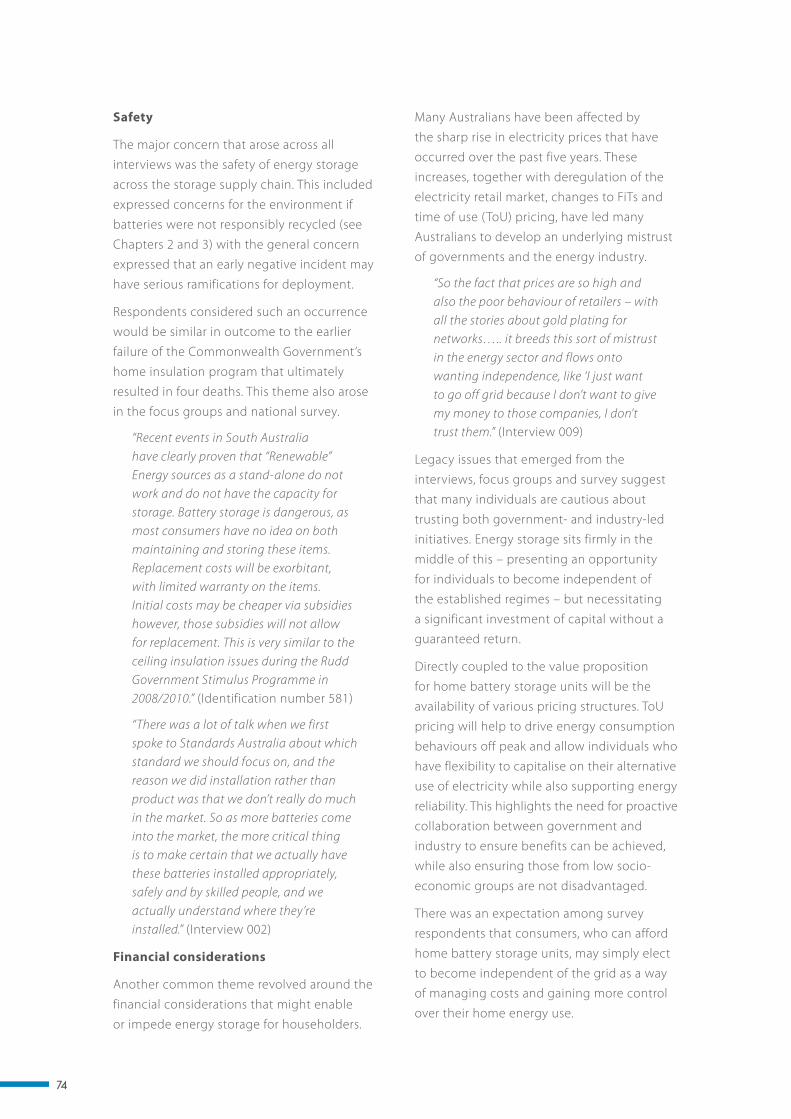
74
Safety
The major concern that arose across all
interviews was the safety of energy storage
across the storage supply chain. This included
expressed concerns for the environment if
batteries were not responsibly recycled (see
Chapters 2 and 3) with the general concern
expressed that an early negative incident may
have serious ramifications for deployment.
Respondents considered such an occurrence
would be similar in outcome to the earlier
failure of the Commonwealth Government’s
home insulation program that ultimately
resulted in four deaths. This theme also arose
in the focus groups and national survey.
“Recent events in South Australia have clearly proven that “Renewable” Energy sources as a stand-alone do not work and do not have the capacity for storage. Battery storage is dangerous, as most consumers have no idea on both maintaining and storing these items. Replacement costs will be exorbitant, with limited warranty on the items. Initial costs may be cheaper via subsidies however, those subsidies will not allow for replacement. This is very similar to the ceiling insulation issues during the Rudd Government Stimulus Programme in 2008/2010.” (Identification number 581)
“There was a lot of talk when we first spoke to Standards Australia about which standard we should focus on, and the reason we did installation rather than product was that we don’t really do much in the market. So as more batteries come into the market, the more critical thing is to make certain that we actually have these batteries installed appropriately, safely and by skilled people, and we actually understand where they’re installed.” (Interview 002)
Financial considerations
Another common theme revolved around the
financial considerations that might enable
or impede energy storage for householders.
Many Australians have been affected by
the sharp rise in electricity prices that have
occurred over the past five years. These
increases, together with deregulation of the
electricity retail market, changes to FiTs and
time of use (ToU) pricing, have led many
Australians to develop an underlying mistrust
of governments and the energy industry.
“So the fact that prices are so high and also the poor behaviour of retailers – with all the stories about gold plating for networks….. it breeds this sort of mistrust in the energy sector and flows onto wanting independence, like ‘I just want to go off grid because I don’t want to give my money to those companies, I don’t trust them.” (Interview 009)
Legacy issues that emerged from the
interviews, focus groups and survey suggest
that many individuals are cautious about
trusting both government- and industry-led
initiatives. Energy storage sits firmly in the
middle of this – presenting an opportunity
for individuals to become independent of
the established regimes – but necessitating
a significant investment of capital without a
guaranteed return.
Directly coupled to the value proposition
for home battery storage units will be the
availability of various pricing structures. ToU
pricing will help to drive energy consumption
behaviours off peak and allow individuals who
have flexibility to capitalise on their alternative
use of electricity while also supporting energy
reliability. This highlights the need for proactive
collaboration between government and
industry to ensure benefits can be achieved,
while also ensuring those from low socio-
economic groups are not disadvantaged.
There was an expectation among survey
respondents that consumers, who can afford
home battery storage units, may simply elect
to become independent of the grid as a way
of managing costs and gaining more control
over their home energy use.
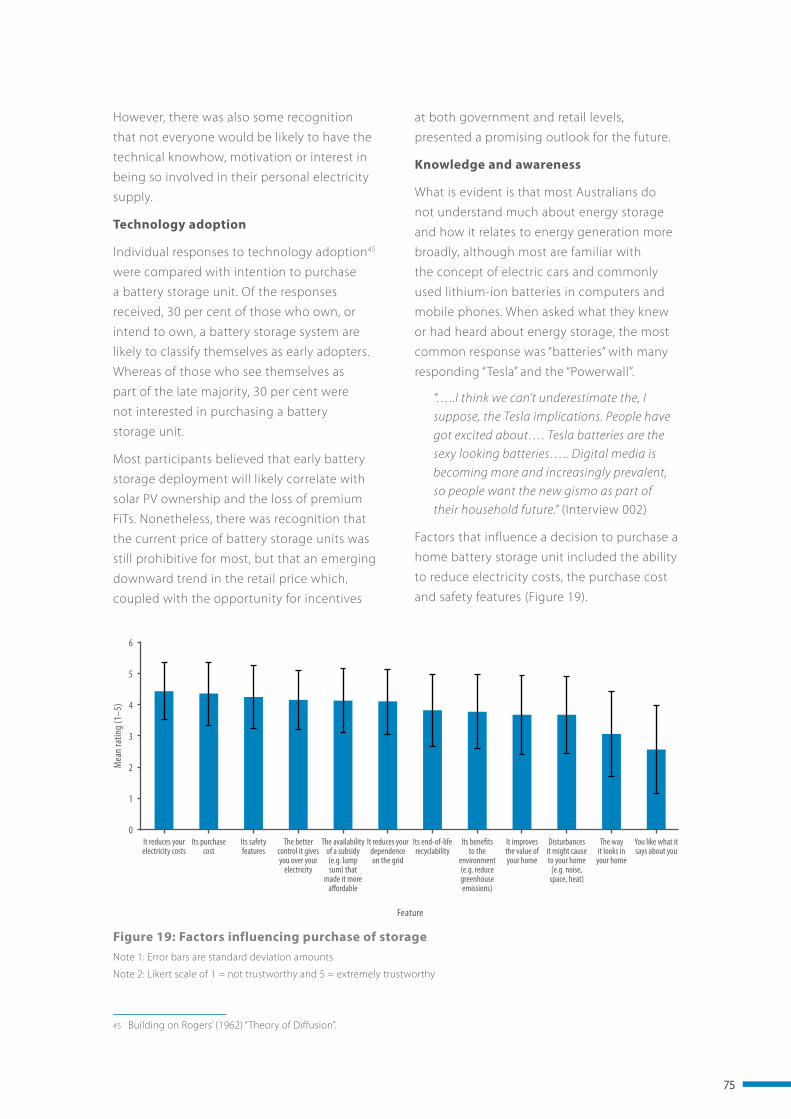
75
However, there was also some recognition
that not everyone would be likely to have the
technical knowhow, motivation or interest in
being so involved in their personal electricity
supply.
Technology adoption
Individual responses to technology adoption45
were compared with intention to purchase
a battery storage unit. Of the responses
received, 30 per cent of those who own, or
intend to own, a battery storage system are
likely to classify themselves as early adopters.
Whereas of those who see themselves as
part of the late majority, 30 per cent were
not interested in purchasing a battery
storage unit.
Most participants believed that early battery
storage deployment will likely correlate with
solar PV ownership and the loss of premium
FiTs. Nonetheless, there was recognition that
the current price of battery storage units was
still prohibitive for most, but that an emerging
downward trend in the retail price which,
coupled with the opportunity for incentives
45 Building on Rogers’ (1962) “Theory of Diffusion”.
at both government and retail levels,
presented a promising outlook for the future.
Knowledge and awareness
What is evident is that most Australians do
not understand much about energy storage
and how it relates to energy generation more
broadly, although most are familiar with
the concept of electric cars and commonly
used lithium-ion batteries in computers and
mobile phones. When asked what they knew
or had heard about energy storage, the most
common response was “batteries” with many
responding “Tesla” and the “Powerwall”.
“…..I think we can’t underestimate the, I suppose, the Tesla implications. People have got excited about…. Tesla batteries are the sexy looking batteries….. Digital media is becoming more and increasingly prevalent, so people want the new gismo as part of their household future.” (Interview 002)
Factors that influence a decision to purchase a
home battery storage unit included the ability
to reduce electricity costs, the purchase cost
and safety features (Figure 19).
45. Building on Rogers’ (1962) “Theory of Diffusion”.
Figure 19: Factors influencing purchase of storage
6
5
4
3
2
1
0
Mea
n ra
ting
(1–5
)
Feature
It reduces your electricity costs
Its purchase cost
Its safety features
The better control it gives you over your
electricity
The availability of a subsidy (e.g. lump sum) that
made it more affordable
It reduces your dependence on the grid
Its end-of-life recyclability
Its benefits to the
environment (e.g. reduce greenhouse emissions)
It improves the value of your home
Disturbances it might cause to your home
(e.g. noise, space, heat)
The way it looks in
your home
You like what it says about you
Note 1: Error bars are standard deviation amounts
Note 2: Likert scale of 1 = not trustworthy and 5 = extremely trustworthy
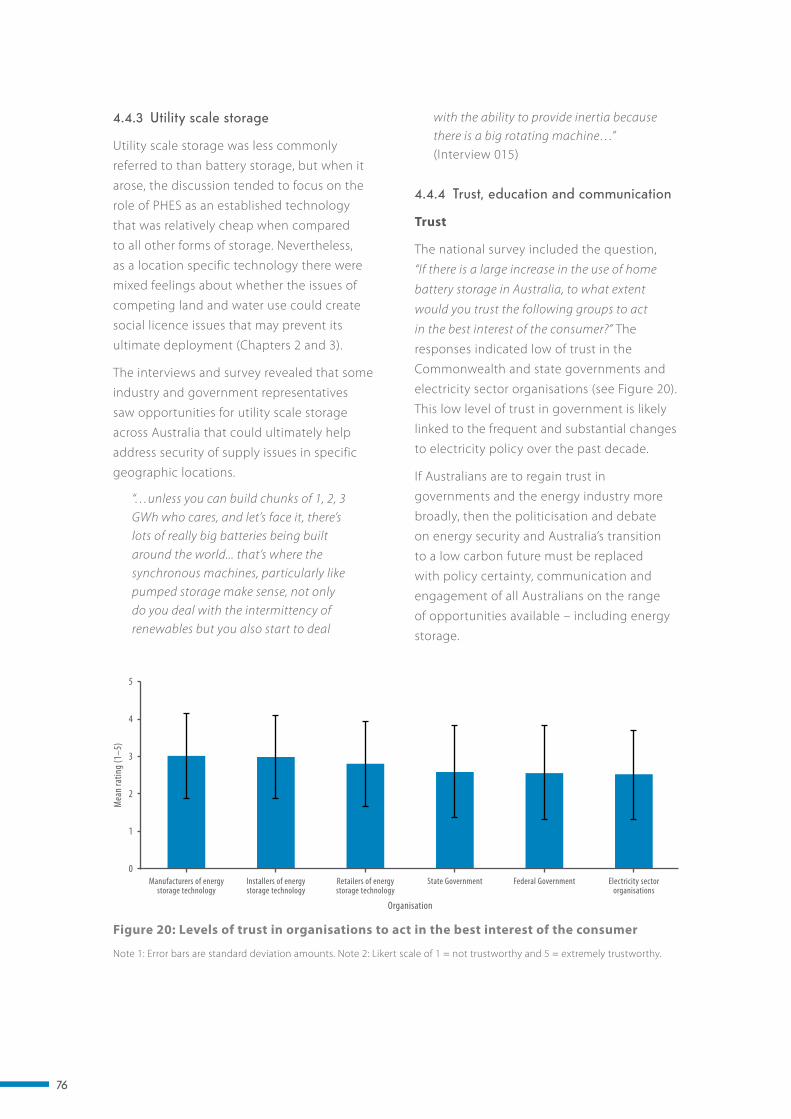
76
4.4.3 Utility scale storage
Utility scale storage was less commonly
referred to than battery storage, but when it
arose, the discussion tended to focus on the
role of PHES as an established technology
that was relatively cheap when compared
to all other forms of storage. Nevertheless,
as a location specific technology there were
mixed feelings about whether the issues of
competing land and water use could create
social licence issues that may prevent its
ultimate deployment (Chapters 2 and 3).
The interviews and survey revealed that some
industry and government representatives
saw opportunities for utility scale storage
across Australia that could ultimately help
address security of supply issues in specific
geographic locations.
“…unless you can build chunks of 1, 2, 3 GWh who cares, and let’s face it, there’s lots of really big batteries being built around the world... that’s where the synchronous machines, particularly like pumped storage make sense, not only do you deal with the intermittency of renewables but you also start to deal
with the ability to provide inertia because there is a big rotating machine…” (Interview 015)
4.4.4 Trust, education and communication
Trust
The national survey included the question,
“If there is a large increase in the use of home
battery storage in Australia, to what extent
would you trust the following groups to act
in the best interest of the consumer?” The
responses indicated low of trust in the
Commonwealth and state governments and
electricity sector organisations (see Figure 20).
This low level of trust in government is likely
linked to the frequent and substantial changes
to electricity policy over the past decade.
If Australians are to regain trust in
governments and the energy industry more
broadly, then the politicisation and debate
on energy security and Australia’s transition
to a low carbon future must be replaced
with policy certainty, communication and
engagement of all Australians on the range
of opportunities available – including energy
storage.
Figure 20: Levels of trust in organisations to act in the best interest of the consumer
5
4
3
2
1
0
Mea
n ra
ting
(1–5
)
Organisation
Manufacturers of energy storage technology
Installers of energy storage technology
Retailers of energy storage technology
State Government Federal Government Electricity sector organisations
Note 1: Error bars are standard deviation amounts. Note 2: Likert scale of 1 = not trustworthy and 5 = extremely trustworthy.
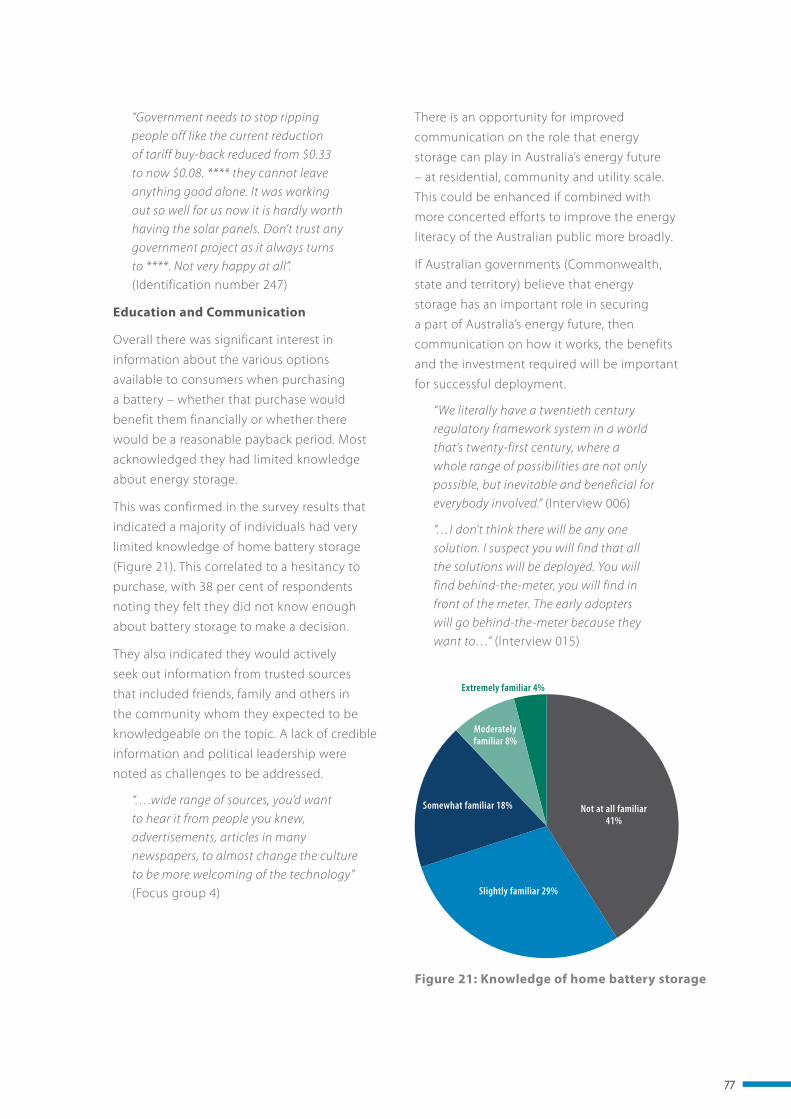
77
“Government needs to stop ripping people off like the current reduction of tariff buy-back reduced from $0.33 to now $0.08. **** they cannot leave anything good alone. It was working out so well for us now it is hardly worth having the solar panels. Don’t trust any government project as it always turns to ****. Not very happy at all”. (Identification number 247)
Education and Communication
Overall there was significant interest in
information about the various options
available to consumers when purchasing
a battery – whether that purchase would
benefit them financially or whether there
would be a reasonable payback period. Most
acknowledged they had limited knowledge
about energy storage.
This was confirmed in the survey results that
indicated a majority of individuals had very
limited knowledge of home battery storage
(Figure 21). This correlated to a hesitancy to
purchase, with 38 per cent of respondents
noting they felt they did not know enough
about battery storage to make a decision.
They also indicated they would actively
seek out information from trusted sources
that included friends, family and others in
the community whom they expected to be
knowledgeable on the topic. A lack of credible
information and political leadership were
noted as challenges to be addressed.
“….wide range of sources, you’d want to hear it from people you knew, advertisements, articles in many newspapers, to almost change the culture to be more welcoming of the technology” (Focus group 4)
There is an opportunity for improved
communication on the role that energy
storage can play in Australia’s energy future
– at residential, community and utility scale.
This could be enhanced if combined with
more concerted efforts to improve the energy
literacy of the Australian public more broadly.
If Australian governments (Commonwealth,
state and territory) believe that energy
storage has an important role in securing
a part of Australia’s energy future, then
communication on how it works, the benefits
and the investment required will be important
for successful deployment.
“We literally have a twentieth century regulatory framework system in a world that’s twenty-first century, where a whole range of possibilities are not only possible, but inevitable and beneficial for everybody involved.” (Interview 006)
“…I don’t think there will be any one solution. I suspect you will find that all the solutions will be deployed. You will find behind-the-meter, you will find in front of the meter. The early adopters will go behind-the-meter because they want to…” (Interview 015)
Figure 21: Knowledge of home battery storage
Slightly familiar 29%
Moderately familiar 8%
Somewhat familiar 18%
Extremely familiar 4%
Not at all familiar 41%
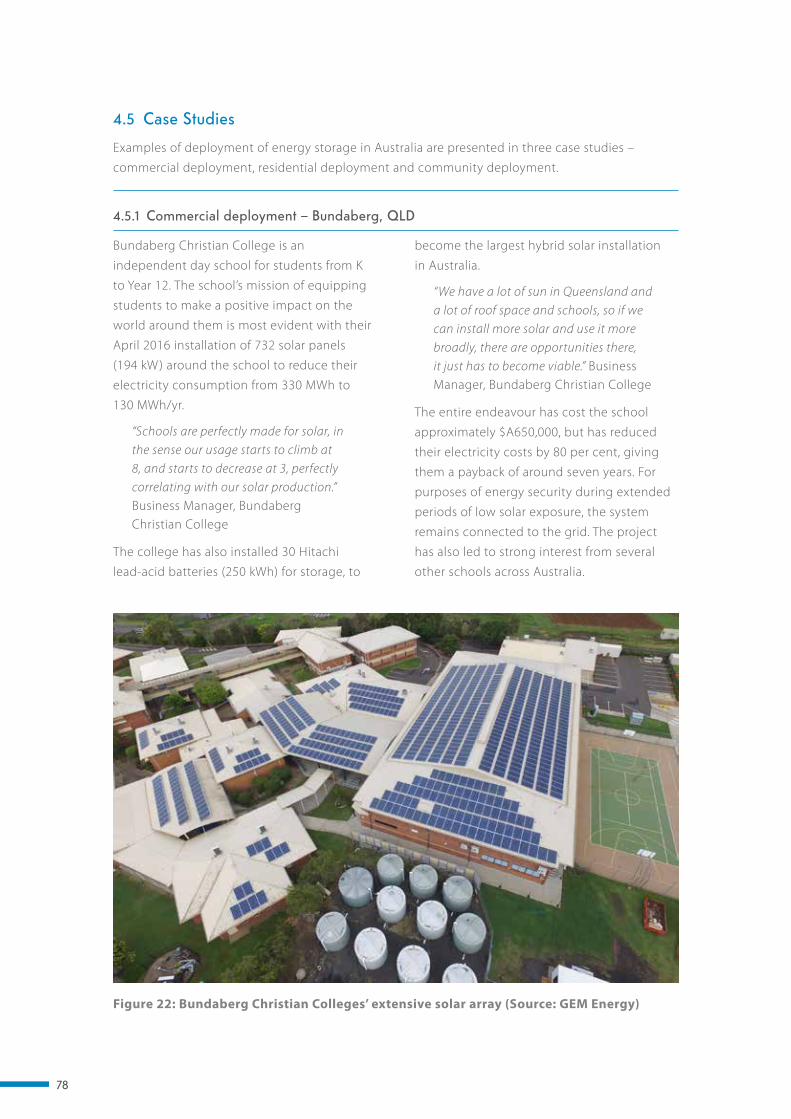
78
4.5 Case Studies
Examples of deployment of energy storage in Australia are presented in three case studies –
commercial deployment, residential deployment and community deployment.
become the largest hybrid solar installation
in Australia.
“We have a lot of sun in Queensland and a lot of roof space and schools, so if we can install more solar and use it more broadly, there are opportunities there, it just has to become viable.” Business Manager, Bundaberg Christian College
The entire endeavour has cost the school
approximately $A650,000, but has reduced
their electricity costs by 80 per cent, giving
them a payback of around seven years. For
purposes of energy security during extended
periods of low solar exposure, the system
remains connected to the grid. The project
has also led to strong interest from several
other schools across Australia.
Figure 22: Bundaberg Christian Colleges’ extensive solar array (Source: GEM Energy)
4.5.1 Commercial deployment – Bundaberg, QLD
Bundaberg Christian College is an
independent day school for students from K
to Year 12. The school’s mission of equipping
students to make a positive impact on the
world around them is most evident with their
April 2016 installation of 732 solar panels
(194 kW) around the school to reduce their
electricity consumption from 330 MWh to
130 MWh/yr.
“Schools are perfectly made for solar, in the sense our usage starts to climb at 8, and starts to decrease at 3, perfectly correlating with our solar production.” Business Manager, Bundaberg Christian College
The college has also installed 30 Hitachi
lead-acid batteries (250 kWh) for storage, to
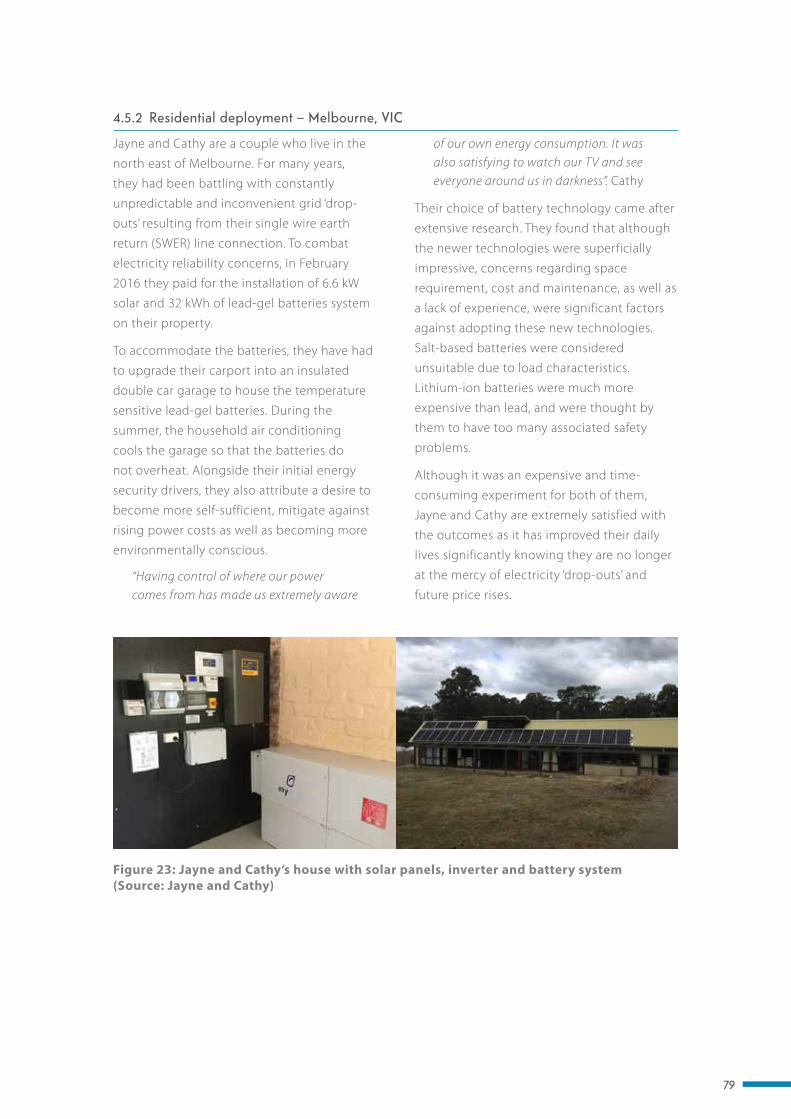
79
4.5.2 Residential deployment – Melbourne, VIC
of our own energy consumption. It was also satisfying to watch our TV and see everyone around us in darkness”. Cathy
Their choice of battery technology came after
extensive research. They found that although
the newer technologies were superficially
impressive, concerns regarding space
requirement, cost and maintenance, as well as
a lack of experience, were significant factors
against adopting these new technologies.
Salt-based batteries were considered
unsuitable due to load characteristics.
Lithium-ion batteries were much more
expensive than lead, and were thought by
them to have too many associated safety
problems.
Although it was an expensive and time-
consuming experiment for both of them,
Jayne and Cathy are extremely satisfied with
the outcomes as it has improved their daily
lives significantly knowing they are no longer
at the mercy of electricity ‘drop-outs’ and
future price rises.
Figure 23: Jayne and Cathy’s house with solar panels, inverter and battery system (Source: Jayne and Cathy)
Jayne and Cathy are a couple who live in the
north east of Melbourne. For many years,
they had been battling with constantly
unpredictable and inconvenient grid ‘drop-
outs’ resulting from their single wire earth
return (SWER) line connection. To combat
electricity reliability concerns, in February
2016 they paid for the installation of 6.6 kW
solar and 32 kWh of lead-gel batteries system
on their property.
To accommodate the batteries, they have had
to upgrade their carport into an insulated
double car garage to house the temperature
sensitive lead-gel batteries. During the
summer, the household air conditioning
cools the garage so that the batteries do
not overheat. Alongside their initial energy
security drivers, they also attribute a desire to
become more self-sufficient, mitigate against
rising power costs as well as becoming more
environmentally conscious.
“Having control of where our power comes from has made us extremely aware

80
4.5.3 Community deployment – Perth, WA
community, but they virtually deposit and
withdraw credits in the battery through
excess rooftop solar production for a small
subscription cost of $A11/month (36 cents
per day) by participating in the specifically
designed time-of-use peak demand saver
plan trial. This allows them to bank excess
rooftop solar production when the sun is
shining, that would otherwise flow to the
market. These banked production units can
then be withdrawn during the evening when
household consumption generally peaks, but
the solar panels are not producing electricity.
The facility allows residents to virtually
increase their self-consumption of solar and
reduce their overall electricity bills.
Figure 24: Alkimos community storage battery container (Source: Synergy)
On the surface, Alkimos Beach is a typical
northern suburb of Perth, not too dissimilar
from the numerous community developments
across Australia, thriving with young families
and working households.
The Alkimos Beach battery storage trial is
led by Synergy in collaboration with Alkimos
Beach development partners Lendlease
and LandCorp with additional funding from
ARENA. These organisations have collaborated
to trial an innovative approach to community
battery storage at Alkimos – virtual energy
storage (Figure 24).
Residents are not directly connected to the
shipping-container sized battery (1.2 MWh
of lithium-ion batteries) that abuts their

81
The ‘virtual account’ is reset at the end of each
day. Excess solar credits do not roll over, but
are accumulated and settled at the Renewable
Energy Buyback scheme rate (7 c/kWh) at the
end of the billing period. Where credits are
exhausted prior to the end of the peak period,
residents are charged the relevant time-of-use
rate of 48 c/kWh during peak events (4 pm –
8 pm). This is considerably higher than the
Peak Demand Saver Plan off-peak rate of
26 c/kWh that they would be charged during
any other part of the day.
By comparison, customers on the standard
home plan tariff are charged 26 cents all day,
every day. The Peak Demand Saver plan model
provides a financial incentive to match excess
solar production during the day with evening
electricity consumption.
Cost saving was a significant factor in participating in the trial. We have been able to save 50 per cent on our electricity bills. At the same time, we have learnt how to use our appliances around the new rules, because it is a little different now with a battery as opposed to before. But luckily for us, the big behaviour change was actually when we got the solar panels, with the battery you have a little bit more flexibility, but obviously you have to know how it works. It’s not just set and forgot, there are rules behind it, mostly coming from the power provider. Alkimos Beach Resident 1
The project has not been without challenges.
Last year, Perth experienced an atypically
along, cold and rainy winter, which affected
the residents’ solar credit production.
This meant that residents often were not
producing enough credits to offset their
increased energy consumption. As a result,
some residents noticed their bills had
increased.
Last winter we noticed that our electricity bill had gone up almost 80 %. But we weren’t surprised because we had noticed that our heating had gone up because of the long cold winter. It also rained a lot, so we were not producing a lot of solar, unfortunately. But that’s something you can’t control. Other than that, we have been satisfied with the trial. Alkimos Beach Resident 2
It might seem counterintuitive for Synergy,
as an electricity gentailer (a company that
is an electricity generator and retailer), to
participate in a trial that reduces customers’
electricity bills. However, it is part of a bigger
plan to save money by reducing infrastructure
spending, which can then be passed on to the
customer as well as trialling innovative and
relevant products to meet customer needs.
82
Key Findings
8. Australians are deeply concerned by the sharp rise in electricity prices and affordability. They hold governments and energy providers directly responsible for the perceived lack of affordability.
• Deregulation of the electricity market,
changes in feed in tariff schemes (fits) and
other time of use (ToU) tariffs have led
to an underlying general mistrust of the
government and energy providers. Focus
group participants believe that individual
consumers who can afford home battery
storage units may elect to become
independent of the grid to avoid rising
energy costs.
9. Energy storage is not a well-known concept in the community and there are concerns that a lack of suitable standards at the household level will affect safety.
• A majority of respondents surveyed said
they did not know enough to make an
informed decision about whether to
purchase a home battery storage unit.
• Although a battery storage installation
standard is currently under development,
there is concern that an early negative
incident may have serious ramifications
for household deployment, with many
in focus groups referring to the “Home
Insulation Program” failure.
• “Pumped hydro” was recognised by
some of those surveyed in the general
community as an established utility scale
technology, but that possible “social
licence” issues may arise due to the
perception of competing land use and a
potential lack of available water.
• There is an opportunity for governments
to increase the Australian public’s
knowledge and awareness of energy
systems (from energy generation through
to storage – at utility and consumer
levels).
10. Australians favour a higher renewables mix by 2030 particularly PV and wind, with significant energy storage deployed to manage grid security.
• The majority of those surveyed suggested
they would look to government to play a
role in the future energy mix but lacked
confidence that their preference for
higher renewables would be achieved
without consistent energy policies.
83
Australians favour a higher renewables mix by 2030, particularly PV and wind,
with significant energy storage deployed to
manage grid security

84
CHAPTER 5 CONCLUSIONS
Australia is undergoing an unprecedented transformation in the electricity sector. Encouraged by Commonwealth, state and territory technology-specific energy policies since the mid-2000s, Australian consumers and businesses have already invested in new generation technologies (principally renewables), taking control of their energy use and supply and supporting action on climate change. In this decentralised, yet integrated, 21st century energy future, storage provides a vital link between generation and consumption that allows for greater penetration of utility scale and distributed renewable energy generation.
There is a legitimate role for governments
to provide strategic direction by ensuring
the right policy settings are enacted to drive
growth in energy storage in the national
interest. Leadership in energy policy and the
deployment of energy storage can promote
innovation, investment, the establishment of
new (and growth of existing) high technology
industries and increased or new energy
exports. A proactive approach will provide the
opportunity for Australia to lead and facilitate
re-skilling of workforces and employment
across all levels of the value chain from
mining and manufacturing through to
consumer spending.
Recent extreme weather events have led to
acknowledgement by governments, industry
and consumers of the role of battery storage
in ensuring energy security.
This report has identified that:
• There is a near-term requirement to
strengthen Australia’s energy security
in NEM jurisdictions and maintaining
acceptable energy security levels for
customers will dominate over energy
reliability requirements until well
in excess of 50 per cent renewable
energy penetration.
– Pumped Hydro Energy Systems (PHES)
are expected to remain the most cost
effective option for large-scale energy
storage (greater than 100 MW) for some
time. In addition to the announcement
that the Snowy Mountains scheme will
be expanded, a number of sites have
been identified throughout Australia as
suitable for PHES.
85
– Due to their high efficiencies and
relatively small size, batteries are
expected to remain the dominant
technology for distributed and
behind-the-meter energy storage
solutions. While not the only way of
strengthening system security they are
cost-effective when installed with a
high power-to-energy ratio.
• The differential between current tariff
structures for buying grid electricity
and selling self-generated (rooftop
PV) electricity is strongly encouraging
investment in battery systems by
consumers and industry.
• Australia is well placed to participate in
global energy storage supply chains and
business opportunities will arise, given
appropriate policy decisions at state and
Commonwealth levels.
– Australia has abundant raw material
resources for batteries, but could
capture greater benefits through
value adding.
– Australian companies and researchers
are seeking opportunities to
commercialise their energy
storage technologies.
86
– Australia has abundant renewable
resources (solar), appropriately skilled
workforces and established supply
chain relationships to generate
renewable hydrogen and ammonia at
the volumes required to supply export
markets, such as Japan and Korea.
• Australia can play a leading role in
product stewardship in the development
of standards for battery storage,
sustainable supply chains from mining
to manufacturing, and the sustainable
repurposing and recycling of all batteries.
– The development of recycling
infrastructure and technology will
support industry development and
jobs growth.
• Australians are deeply concerned by
the sharp rise in electricity prices and
affordability and hold governments and
energy providers responsible for the
perceived lack of affordability.
• Energy storage is not a well-known
concept in the community and concerns
exist at the lack of suitable standards at the
household level.
• Australians favour a higher renewables mix
by 2030 – particularly PV and wind, with
significant energy storage deployed to
manage grid security.
This work provides reassurance that both
reliability and security requirements can
be met with readily available storage
technologies. Notwithstanding, the market
and technologies for energy storage and its
integration into electricity networks
continue to evolve. With additional time
and resources, the findings of this report
would be strengthened by further work
into, for example:
• The optimum balance of generation,
storage and interconnection, taking into
account both cost optimisation and the
long-term strategic opportunities for
Australia.
• The role of ‘prosumers’ including their
effects on the market, the system (equity
and pricing concerns) and on their
potential contribution to the energy
transformation that is underway.
• The broader question of public literacy, as
Australians’ knowledge of, and attitudes
towards, energy storage will shape its
acceptance and adoption.
• A deeper analysis of opportunities for
growth of a substantial energy storage
industry in Australia.
Using a traditional strengths, weaknesses,
opportunities and threats (SWOT) approach to
review the internal and external environments
for energy storage in Australia, a preliminary
analysis, based on the findings in this report
is summarised in Table 6.
Given these internal and external
environmental factors, it is important for
energy storage policy to promote market
growth to capitalise in strength and
opportunity, while also managing risk to
mitigate against weaknesses and threats.
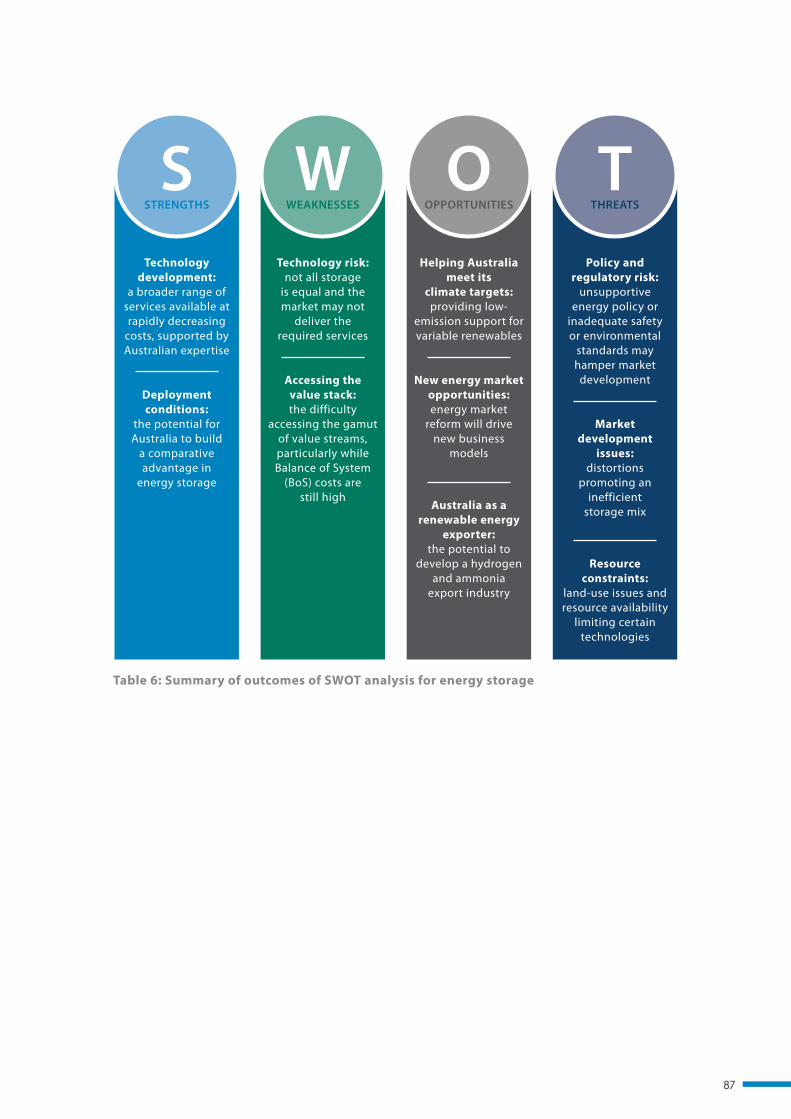
87
Table 6: Summary of outcomes of SWOT analysis for energy storage
Technology development:
a broader range of services available at rapidly decreasing
costs, supported by Australian expertise
Deployment conditions:
the potential for Australia to build
a comparative advantage in
energy storage
Technology risk: not all storage
is equal and the market may not
deliver the required services
Accessing the value stack: the difficulty
accessing the gamut of value streams, particularly while Balance of System
(BoS) costs are still high
Helping Australia meet its
climate targets: providing low-
emission support for variable renewables
New energy market opportunities: energy market
reform will drive new business
models
Australia as a renewable energy
exporter: the potential to
develop a hydrogen and ammonia
export industry
Policy and regulatory risk:
unsupportive energy policy or
inadequate safety or environmental
standards may hamper market
development
Market development
issues: distortions
promoting an inefficient
storage mix
Resource constraints:
land-use issues and resource availability
limiting certain technologies
SSTRENGTHS
WWEAKNESSES
OOPPORTUNITIES
TTHREATS
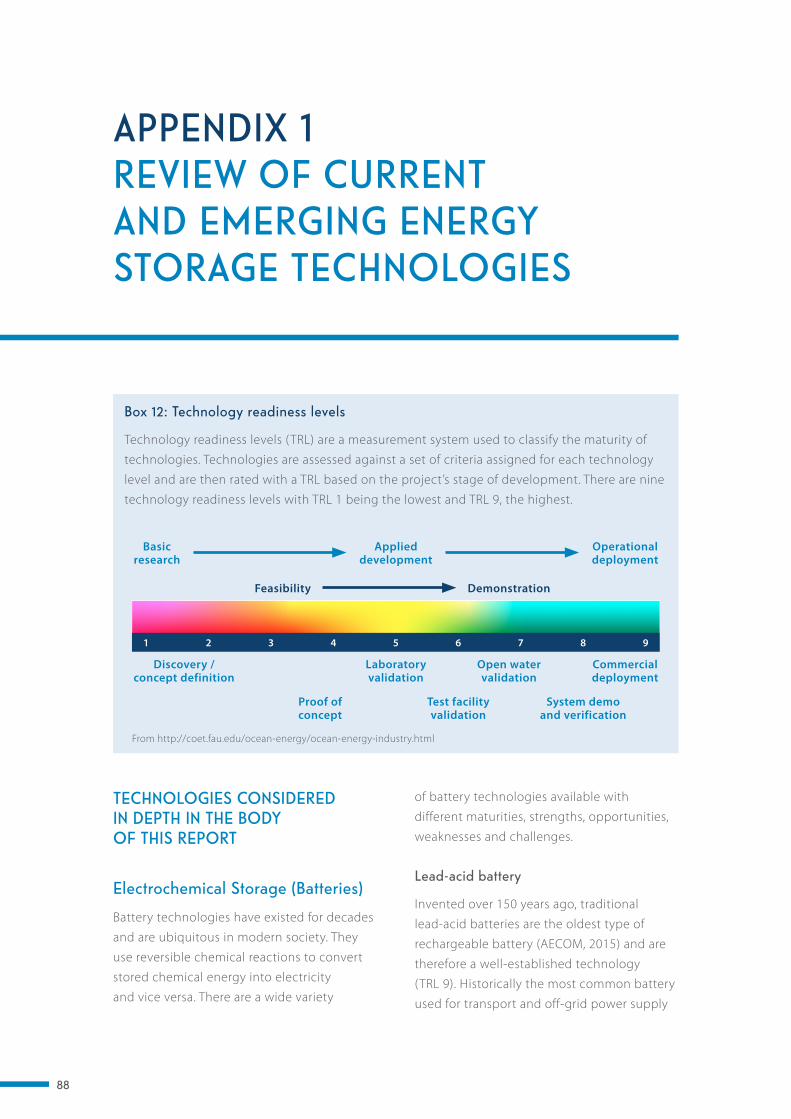
88
APPENDIX 1 REVIEW OF CURRENT AND EMERGING ENERGY STORAGE TECHNOLOGIES
TECHNOLOGIES CONSIDERED IN DEPTH IN THE BODY OF THIS REPORT
Electrochemical Storage (Batteries)
Battery technologies have existed for decades
and are ubiquitous in modern society. They
use reversible chemical reactions to convert
stored chemical energy into electricity
and vice versa. There are a wide variety
of battery technologies available with
different maturities, strengths, opportunities,
weaknesses and challenges.
Lead-acid battery
Invented over 150 years ago, traditional
lead-acid batteries are the oldest type of
rechargeable battery (AECOM, 2015) and are
therefore a well-established technology
(TRL 9). Historically the most common battery
used for transport and off-grid power supply
Box12
Technologyreadinesslevels(TRL)areameasurementsystemusedtoclassifythematurityoftechnologies.TechnologiesareassessedagainstasetofcriteriaassignedforeachtechnologylevelandarethenratedwithaTRLbasedontheproject’sstageofdevelopment.ThereareninetechnologyreadinesslevelswithTRL1beingthelowestandTRL9,thehighest.
Fromhttp://coet.fau.edu/ocean-energy/ocean-energy-industry.html
ItisintendedtositattheverytopofAppendix1toexplaintechnologyreadinesslevels.
Feasibility Demonstration
Basic research
Discovery / concept definition
Proof of concept
Laboratory validation
Test facility validation
Open water validation
System demo and verification
Commercial deployment
Applied development
Operational deployment
1 2 3 4 5 6 7 8 9
From http://coet.fau.edu/ocean-energy/ocean-energy-industry.html
Box 12: Technology readiness levels
Technology readiness levels (TRL) are a measurement system used to classify the maturity of
technologies. Technologies are assessed against a set of criteria assigned for each technology
level and are then rated with a TRL based on the project’s stage of development. There are nine
technology readiness levels with TRL 1 being the lowest and TRL 9, the highest.
89
applications, lead-acid batteries are quickly
losing ground to modern technologies such
as lithium-ion (Li-ion) batteries. Lead-acid
batteries have been coupled with solar, wind
and off-grid systems and are considered a
cheap and reliable storage source.
More recently, advanced lead acid batteries
have been developed with new electrode
materials, such as replacing one of the lead
electrodes with a carbon electrode to enable
extended use at an intermediate state of
charge. These batteries are well suited to
both charging and discharging, which is
appropriate for supply-demand balancing
applications in power systems, such as
system stability services. It is possible to use
advanced lead acid batteries for simultaneous
bulk energy shifting and fast balancing.
Nevertheless, it is still desirable to operate the
battery within a 50 % range of state of charge,
for example between 25 % and 75 %, to avoid
premature ageing.
Weaknesses and Challenges
The technology has a markedly lower cycle
lifetime and depths of discharge compared
with other battery types. Lead-acid batteries
have low energy density compared with
competing technologies, and need to be
kept in a charged state. Lead-acid batteries
also use toxic heavy metals and corrosive
acids (Cavanagh et al., 2015, AECOM, 2015).
Typical batteries have 70–90 per cent round-
trip efficiencies and have a lifetime of around
5–15 years (AECOM, 2015). However, emerging
hybrid technologies, such as the UltraBattery
developed by CSIRO, are increasing
efficiencies, lifetimes and improved partial
state-of-charge operability.
Strengths and Opportunities
Lead-acid batteries are cheap, have wide
commercial availability and low self-discharge.
They also have a rapid recycling rate
(Cavanagh et al., 2015).
Lithium-ion (Li-ion) battery
Lithium-ion (Li-ion) batteries are the dominant
technology for small-scale energy storage such as
phones and laptops, and are increasingly being
used for electric vehicles, back-up power supplies
and domestic storage (AECOM, 2015). Increasing
scale and volume of manufacturing by major
companies is driving large cost reductions, which
are expected to continue. Li-ion technologies
are becoming a common replacement for
lead-acid batteries and are soon expected to
be the dominant battery technology for most
applications (AECOM, 2015). The technology
is still developing and has considerable
potential for applications. Research is focused
on the improvement of lifetime and cycling.
There are many Li-ion variants with different
characteristics and with varying levels of
feasibility for widespread use. Some of the
different chemistries used are:
• Li-iron phosphate (LiFePO4)
• Li-titanate (LT )
• Li-cobalt oxide (LCoO2)
• Li-manganese oxide (LMO)
• Li-nickel manganese cobalt (NMC)
• Li polymer
• Li-metal polymer (LMP)
• Li-Air
• Li-sulfur (Li-S)
The different types of Li batteries have varying
technology readiness levels (TRLs); some
of these, such as Li-air and Li-S, are still in
research and development stage.
Conversely, the LMP battery is a mature
technology (TRL 9) that is being used in
electric vehicles, including public transport,
in Europe. This has been commercialised by
companies such as Bolloré, who have also
developed LMPs which are broadly used for
stationary applications.

90
Weaknesses and Challenges
A major challenge for the technology is that only
one-third of lithium reserves are economically
recoverable. Safety is the other serious issue
in Li-ion technology. Most of the metal oxide
electrodes are thermally unstable and cells can
overheat and ignite To minimise this risk, Li-ion
batteries are equipped with a monitoring unit
to avoid overcharging and over-discharging.
Operating temperatures for these batteries must
be kept below 60 °C, and battery performance
significantly declines at higher temperatures.
Strengths and Opportunities
Li-ion batteries have high round-trip
efficiencies, ranging from 85–98 per cent
and have lifetimes of 5–15 years depending
on manufacturing and treatment (Cavanagh
et al., 2015, AECOM, 2015). They are
rechargeable, have high energy density, low
self-discharge and high charging efficiency.
Li-ion batteries have plummeted in cost over
the last decade, making this technology
competitive with lead-acid batteries. Nearly
any discharge time (from seconds to weeks)
can be realised, which makes them a very
flexible storage technology. Lithium can also
be completely recycled, and considerable
opportunity exists for developing more
economically viable recycling technologies
(AECOM, 2015). There is considerable
opportunity for Australia to adopt Li-ion
battery technology for use in transport to
reduce carbon dioxide (CO2) emissions.
Flow batteries
Unlike conventional batteries, the energy
in flow batteries is stored in one or more
electroactive species, which are dissolved
in liquid electrolytes that are stored in tanks
external to the battery and pumped through
electrochemical cells, which convert chemical
energy to electricity (Cavanagh et al., 2015). The
power capacity of a flow battery is controlled
by the are and design of the electrochemical
cell, and the energy capacity is dependent on
the volume of the storage tanks.
Flow battery technology has several utility
applications, including time shifting, network
efficiency, and off-grid use. These batteries
are also suitable for connection to renewables
and time-shifting at the industrial and
residential scale.
There are two mains types of flow batteries:
zinc bromine (Zn-Br) batteries and vanadium
redox batteries (VRB).
• Zinc bromine (Zn-Br) batteries consist of
two electrode surfaces and two electrolyte
flow streams that are separated by a
micro-porous film. These batteries were
developed in the 1970s by NASA and have
recently been commercialised in Australia
by Redflow. This technology is mature
(TRL 9).
• Vanadium redox batteries (VRB) store
energy using vanadium redox couples,
which are permanently dissolved in
sulfuric acid electrolyte solutions. The first
vanadium redox battery was demonstrated
in the late 1980s, and they have been used
commercially for over eight years (Energy
Storage Association, 2016), making them
an established technology (TRL 8).
Weaknesses and Challenges
These batteries have environmental and
safety issues associated with the toxicity
of vanadium and leaching of bromine. The
higher voltage and oxidative V5+ electrolyte
in VRBs puts chemical stress on the cell
electrodes, membranes, and fluid handling
components of the battery cell. Expensive
91
ion-exchange membranes are needed to
reduce losses from cross-membrane transport
(Energy Storage Association, 2016).
Zinc bromine technology requires regular
maintenance of mechanical parts, such as
pumps, throughout the battery lifetime. These
batteries have a lower energy density than
other batteries, are costly, and require external
power to operate.
Strengths and Opportunities
An advantage of flow batteries over
conventional batteries is that while the
converter stays the same size for a given
power density, additional storage tanks can
be added to hold more electrolyte. This allows
the duration of power supply to be readily
extended from a hours to a day or more.
(Aneke and Wang, 2016).
Zinc bromine batteries can theoretically be
100 per cent discharged every day, for more
than 2000 cycles. Vanadium redox batteries
have a high cell voltage, which creates a higher
power and energy density, making these
systems useful for grid storage. Vanadium
is readily available, and can be recovered
from various waste products (Energy Storage
Association, 2016). There is opportunity to
optimise the design of the membranes used
in these batteries. These batteries are scalable,
tolerant to overcharge and over-discharge,
and are safer than Li-ion batteries.
Mechanical Storage
Pumped Hydro Energy Storage (PHES)
PHES accounts for over 99 per cent of bulk
energy storage capacity worldwide (Energy
Storage Council, 2015). Australia has over
1.5 GW of PHES connected to the NEM and
it is a well-established technology (TRL 9);
however, no large-scale pumped hydro
facilities have been built in Australia during
the last 30 years (AECOM, 2015). Among
the largest PHES facilities are the 600 MW
Tumut-3 and 240 MW Shoalhaven facilities in
New South Wales, and the 500 MW Wivenhoe
facility in Queensland (Hearps et al., 2014).
In PHES systems, large volumes of water are
pumped from a lower to an upper reservoir,
thus converting electrical energy into
gravitational potential energy. When energy
is required, the water is allowed to flow from
the upper to the lower reservoir and drive a
turbine that generates electricity.
Weaknesses and Challenges
PHES is limited by the availability of suitable
geological structures. There is potential
for environmental impact and social
license problems with PHES developments.
Depending on the location and water source,
PHES can also be affected by drought and
evaporative water losses.
Strengths and Opportunities
PHES is the most mature form of bulk energy
storage technology available and it is also
the cheapest. Electrical energy from PHES is
synchronous with the grid, which has inherent
benefits for network security and stability. It
is suitable for centralised large-scale storage
applications. There may be potential for salt-
water based applications of PHES (Hearps
et al., 2014) and innovative solutions such
as the Kidston Hydro project which intends
to repurpose an abandoned gold mine site.
Blakers (2015) argues that there are many
suitable locations for the development of
new off-river PHES systems in Australia.
92
Thermal Storage
Molten salts
Molten salts are solid at room temperature
and atmospheric pressure, but become liquid
when heated (International Energy Agency,
2014). Molten salt is often used to store
heat in concentrated solar thermal facilities
for use in generating electricity (AECOM,
2015). As electricity is required, molten salt
is dispatched from the storage tank through
a heat exchanger to create steam, which
powers a conventional steam turbine (Solar
Reserve, 2016).
Molten salt storage is often combined with
concentrated solar thermal (CST ), which uses
reflectors to focus sunlight into concentrated
heat energy (Clean Energy Council, 2013).
Concentrated solar thermal is a proven
technology, which was first implemented
in California in 1984 (Clean Energy Council,
2013). There are several examples of CST
operating in Australia, including two
large-scale plants: one in Kogan Creek in
Queensland, and one that has been added
to the Liddell coal-fired power plant in New
South Wales (Hinkley et al., 2016).
Weaknesses and Challenges
Molten salt storage is currently limited to
concentrated solar power applications;
however, the technology is still developing
in Australia (AECOM, 2015). The high
temperature required for liquefying salts
poses technical issues for other components
in the system. If salts are allowed to solidify
(below 200 °C), serious mechanical problems
arise (International Energy Agency, 2014).
These systems therefore require further
development to address this issue. A
disadvantage of CST is the hazard associated
with the use of reflectors to concentrate
sunlight. Incorrect alignment of these
reflectors results in focusing the sunlight on
the wrong part of the system and has resulted
in fires, including one at the Ivanpah Solar
Power Facility, California, in May 2016.
Strengths and Opportunities
The benefit of concentrated solarthermal
over photovoltaic (PV) solar is that energy
stored as heat is a reliable source of electricity
that can be used for peak or baseload
electricity demand (Clean Energy Council,
2013). An advantage of molten salt systems
is that the salts do not need replacing for
the entire life of the plant. The salts are a
mixture of sodium nitrate and potassium
nitrate, allowing application as a high-grade
fertiliser following decommission of the plant
(Solar Reserve, 2016). Molten salt is relatively
efficient for storage of heat and is able to
store large amounts of energy for up to 15
hours (AECOM, 2015). These systems have the
potential to provide high-density, low cost,
and high-cycle energy storage (International
Energy Agency, 2014).
Opportunities exist for the development of
system materials that are able to perform in
the high temperatures required to keep salts
molten.
93
Chemical Storage
Power-to-gas
Chemical storage systems use electricity to produce hydrogen by water electrolysis (Cavanagh et al., 2015b). In these systems, electricity is recovered by using the hydrogen to power a generator or fuel cell. Hydrogen can be stored in bulk or transported as a pressurised gas or a cryogenic liquid. Alternatively, it can be upgraded to higher-order gases, such as ammonia. However, any of these processes for storing or transporting the hydrogen increase costs and reduce the round-trip efficiency.
Power-to-gas technology is useful for storage of energy from variable renewable energy sources, and may therefore be useful for integration of renewable energy into the electricity grid. This storage system is still being developed, and is currently in demonstration (Walker et al., 2016). As part of their successful bid to the ACT Government’s Next Generation Renewables Auction, Neoeon Australia in collaboration with Siemens has committed to installing a 1.25 MW hydrogen electrolyser capable of producing enough hydrogen to power up to 1000 vehicles per year by the end of 2018. They are also partnering with Hyundai to deliver a refuelling station and 20 hydrogen fuel-cell vehicles (ACT Department of Environment and Planning Directorate, 2016).
Weaknesses and Challenges
Energy use and conversion losses during electrolysis, methanation (in the case of synthetic natural gas), storage, transport, and power generation, mean that power- to-gas technology has a low round-trip efficiency (Cavanagh et al., 2015b). Another disadvantage of gas storage is the size of the tanks that are required, although technologies
such as solid-state hydrogen storage may address this. Additionally, high pressures are necessary, and discharge times are limited to minutes to hours, meaning this technology is not suitable to applications requiring fast discharge. The significant volumes of water required for the electrolysis process also require consideration.
Strengths and Opportunities
Hydrogen can easily hold large quantities of energy, provided enough storage capacity is available. An advantage of using synthetic natural gas to store energy is that it can be pumped into the existing gas grid infrastructure. Power-to-gas technology has the potential to be developed further for the future use of electrolytic hydrogen for fuel cell vehicles, ancillary services, bulk energy storage, commercial energy storage, bulk energy storage, and utility transmission and distribution (Walker et al., 2016). The development of solid-state hydrogen storage offers a potential compact and safe storage option (Materials Energy Research Laboratory in Nanoscale, 2016). Hydrogen can be stored in metal hydrides, magnesium-based alloys, carbon-based materials, chemical hydrides, and boron compounds by either physical adsorption or by forming chemical bonds (Singh et al., 2015). Hydrogen can be released for use by changing the temperature of the solid (Singh et al., 2015). However, there are not yet any storage materials available that have high hydrogen storage capacity, reversible discharging and charging cycles, and fast discharging and charging rates with minimal energy required for hydrogen release and charge (Singh et al., 2015). The development of solid-state hydrogen storage offers a potential compact and safe storage option (Materials Energy Research Laboratory in nanoscale, 2016).
94
OTHER CURRENT AND EMERGING STORAGE TECHNOLOGIES MENTIONED IN THIS REPORT
Electrochemical Storage (Batteries)
Nickel-based batteries
Nickel-based batteries are well-developed
(TRL 9) and are widely used in a variety of
commercial products since their introduction
in approximately 1915. Nickel-based batteries
are used in computer and medical equipment
and electric vehicles, however, they are
increasingly being replaced by Li-based
batteries in vehicles (Cavanagh et al., 2015b).
Lithium-ion batteries have also largely
replaced nickel-based batteries for use
in mobile devices. Nickel-based batteries
include:
• Nickel cadmium (NiCd) battery
• Nickel metal hydride (NiMh) battery
• Nickel zinc (NiZn) battery
Weaknesses and Challenges
Use of this technology is declining in
Australia, due to the introduction of more
advanced and affordable Li-ion batteries.
Nickel-cadmium batteries are prohibited for
consumer use due to the toxicity of cadmium,
and are used only for stationary applications
in Europe (Cavanagh et al., 2015b). Other
disadvantages of these batteries include a
high self-discharge rate and environmental
issues during disposal.
Strengths and Opportunities
Nickel-cadmium batteries are the only
batteries that function at very low
temperatures (-20 to -40 °C), and have a
higher power density, energy density, and
cycle capability compared to lead-acid
batteries (Cavanagh et al., 2015b).
Nickel metal hydride batteries have similar
capabilities to Ni-Cd batteries, except they
have a significantly lower maximal nominal
capacity, much higher energy densities and
a quick response time.
Sodium-based batteries
There are several types of sodium-based
batteries. The two most common types are
summarised below.
• Sodium-sulfur (Na-S) battery
Na-S batteries are classified as ‘high-
temperature’ and ‘liquid-electrolyte-flow’
batteries, which require operation above
300 °C to keep the sodium and sulfur
molten. They have been used for large-
scale grid support, most commonly in
the USA and Japan. This technology is
currently being tested (TRL 6).
• Sodium-metal halide (Na-NiCl2) battery
Sodium-metal halide batteries were
originally developed for application in
electric vehicles, and are used for bulk
storage with daily energy cycling (TRL 8).
In Australia, Na-NiCl2 batteries have been
developed specifically for the evolving grid
storage market, and a molten salt battery
generator has been developed for the mining
industry, although it is uncertain whether the
latter is currently being used (Cavanagh et
al., 2015b). Na-NiCl2 batteries have also been
developed for residential use for time shifting
of renewable energy, making energy available
to the consumer as required.
Sodium-ion technology is quickly evolving,
with developmental projects being run by
Fardion in the UK, Aquion in the USA, and
at the University of Wollongong (sponsored

95
by the Australian Renewable Energy Agency
(ARENA)). The Aquion battery is a significant
advance as it uses salt water as the battery
electrolyte. This water-based system is safer
than lithium-ion batteries because it is able
to self-moderate its temperature; it is not
possible for internal reactions to exceed
100 °C because at this temperature the water
will evaporate creating open circuit conditions
(Aquion Energy, 2016). These Aquion batteries
are also environmentally friendly and contain
no toxic chemicals (Aquion Energy, 2016).
Weaknesses and Challenges
Contrary to the low temperature conditions
required for Aquion batteries, high
temperatures are required for sodium-sulfur
batteries because the solid-state electrolyte
(beta-alumina) is only sufficiently conductive
above 300 °C. T his creates challenges for
encasing materials and sealing (Cavanagh
et al., 2015b). Faradion have addressed this
challenge by developing a sodium-ion
(Na-ion) battery with improved thermal
stability which is able to be transported safely.
For Na-NiCl2 batteries, the main inconvenience
is that the components take 12–15 hours to
heat up and become operational (Gallo et
al., 2016). Electric heaters on the inner and
bottom side of Na-S batteries are required to
maintain temperatures over 290 °C during
periods of extended standby, causing self-
discharge losses of up to 20 per cent per day
(Gallo et al., 2016).
Strengths and Opportunities
The main advantages of these batteries
are that they can operate at extreme
temperature conditions without the need
for air conditioning. They also have a long-
life cycle and require little maintenance. The
high operating temperature (300 °C for Na-S
and 270–350 °C for Na-NiCl2), recharging
time (9 hours for Na-S and 6–8 hours for Na-
NiCl2), and energy density of these batteries
make them useful for storage in large-scale
systems (Cavanagh et al., 2015b). Sodium-
based batteries are efficient, have a large
storage capacity, and provide a prompt and
precise response. This technology has been
developing quickly worldwide during the
past five years; research efforts are focusing
on lower temperature operation due to
problems the high temperature causes with
packaging and sealing. Sodium-ion batteries
have potential to be a real competitor for grid
storage especially where energy density (size
and weight of battery) are less important.
Sodium is abundant, which makes these
batteries cheaper and ensures security of
supply of materials in the longer run.
Metal-air
Metal-air batteries use the oxidation of
a metal by air to produce electricity. The
batteries can use aluminium, magnesium,
zinc and lithium. Metal-air batteries
produce electricity when the air electrode is
discharged by catalysts that produce hydroxyl
ions in the liquid electrolyte (Aneke and
Wang, 2016). Currently, the only technically
feasible metal-air battery is a zinc-air battery
with a theoretical specific energy of 1.35 kWh/
kg (excluding oxygen). This technology is still
under research and development, therefore
there is no active usage of these batteries
in Australia (Cavanagh et al., 2015b). The
batteries are being optimised by companies
such as Phinergy in Israel, and Fuji Pigment
in Japan.
Weaknesses and Challenges
Metal-air batteries have low efficiency (50 per
cent) and are able to achieve relatively few
cycles (currently only one cycle for Mg-air).
96
The major challenge surrounding these
batteries is avoiding damage to the electrolyte
and cathode from naturally occurring CO2,
and the formation of Zn dendrite (Aneke and
Wang, 2016). Recharging metal-air batteries
involves mechanically removing the battery
and replacing spent materials, and is therefore
difficult and inefficient.
Strengths and Opportunities
These batteries are compact, inexpensive, and
environmentally friendly. Metal-air batteries
are rechargeable by mechanically replacing
the consumed metal, or by electrically
recharging in some developers’ models.
The anodes typically used in these batteries
(zinc and aluminium) are commonly available
metals with a high energy density.
Hybrid batteries
Hybrid batteries combine batteries and
supercapacitors. Supercapacitors are energy
storage devices with low specific energy,
a high life cycle, and high specific power
relative to batteries. Supercapacitors are
typically used in battery-powered vehicles
in order to increase the battery lifetime and
keep the system voltage above a certain value
(Hemmati and Saboori, 2016). An example
of a hybrid battery is the CSIRO-developed
UltraBattery, which combines a supercapacitor
with a lead-acid battery (Australian Academy
of Science, 2016). This battery has been
commercialised by Australian company Ecoult,
and is used in wind and solar farms for output
smoothing. A hybrid battery has also been
developed by Carnegie Mellon University
and produced by Aquion Energy.
This device uses ion intercalation (the
reversible inclusion of a molecule or
ion) in the electrode to allow cells to be
stacked to high voltages without requiring
control circuitry (Australian Academy of
Science, 2016). A Li-ion capacitor hybrid
is also commercially available (JM Energy
Corporation, 2016). This is a hybrid
electrochemical energy storage device which
combines the intercalation mechanism of a
lithium-ion battery with the cathode of an
electric double-layer capacitor. This results in
a higher energy density than a supercapacitor
alone.
Weaknesses and Challenges
Combining a battery and supercapacitor
makes control and energy management
more difficult than for a single energy storage
system. These batteries are relatively new,
and require further research and electrical
engineering to advance their functionality
(Hemmati and Saboori, 2016).
Strengths and Opportunities
The supercapacitor deals with sudden and
large changes in discharge and charge better
than a battery, and the battery is able to store
charge for longer than a capacitor (Australian
Academy of Science, 2016). Combining the
supercapacitor and battery allows for a
higher energy density, higher voltage,
and higher efficiency.
These systems are designed to be safe
and inexpensive.
Emerging battery chemistries
Research is focused on the development
of new battery chemistries including
Al-, Ca-, and Mg-based energy storage
technologies, which employ the conventional
electrolytes used in Li-ion technology
(Ponrouch et al., 2016). This research is being
conducted by industry as well as academia;
97
Australian energy technology company
LWP Technologies began development of
an aluminium-graphene-oxygen battery in
June 2016, which they predict will compete
with Li-ion batteries. However, emerging
battery chemistries are unlikely to be
commercialised for some time and will face
significant challenges in competing with well-
established batteries.
Thermal Storage
Liquid air energy storage
Liquid air energy storage uses electricity
to cool air until it liquefies, stores the
liquid air in a tank, and then returns the
airto a gaseous state and uses the gas to
operate a turbine, generating electricity.
These energy storage systems are a long-
duration and large-scale technology that
can harness low-grade waste heat or cold
from co-located industrial processes such
as thermal generation plants and steel
mills (Energy Storage Association, 2016).
Weaknesses and Challenges
The efficiency of these storage systems
is relatively low (40 – 70 per cent) (Aneke
and Wang, 2016). The technology is still
developing and further improvement of the
liquefaction process and use of compression
heat during the power generation stage is
required to improve efficiency.
Strengths and Opportunities
An advantage of liquid air energy storage is
that liquid air occupies 1/700th of the volume
taken up by gaseous air (Aneke and Wang,
2016). This results in the storage of a large
quantity of air in small containment. These
energy storage systems have long lifetimes
(30+ years) and draw on well-established
technologies, with known costs and
performance, ensuring a low technology
risk (Aneke and Wang, 2016).
Thermo-chemical Storage
Ammonia dissociation-recombination energy storage
Ammonia-based thermochemical storage
systems have been developed for use with
concentrating solar power systems.
Thermochemical storage involves a reversible
reaction to store energy in chemical bonds.
In the case of ammonia dissociation and
recombination, solar energy is used to
dissociate ammonia (NH3) into nitrogen (N2)
and hydrogen (H2). When required, these
stored gases are recombined to synthesise
ammonia, giving off heat to power a turbine
and generate electricity. The reaction of
nitrogen and hydrogen to form ammonia is
the basis of the Haber-Bosch process, which
is exothermic.
Weaknesses and Challenges
These energy storage systems are technically
ready for demonstration, however, it
is unclear if this technology would be
economically competitive with other energy
storage options, particularly due to the high
pressures required for storage (10–30 MPa;
Dunn et al., 2016). Ammonia dissociation-
recombination storage shows potential for
24-hour baseload operation, but slow ramp
rates for the synthesis reactors indicate that
the technology would not cope with variable
loads.
98
Strengths and Opportunities
One advantage of this storage system is a
simple separation of elements which makes
solar reactors particularly easy to control. Also
by operating above the ambient temperature
saturation pressure of ammonia, the ammonia
fraction in storage is present largely as a
liquid. Therefore, automatic phase separation
of ammonia and the dissociated hydrogen
and nitrogen is enabling a common storage
volume to be used. Ammonia-based storage is
also able to take advantage of the more than
100 years of industrial experience with the
Haber-Bosch process.
Hybrid Energy Storage Systems
Compressed air energy storage hybrids
These hybrid technologies combine
compressed air energy storage (CAES) with
supercapacitors, superconducting magnetic
energy storage (SMES) systems, or flywheels
(Hemmati and Saboori, 2016). These storage
systems are proposed to smooth wind turbine
output fluctuations (CAES-supercapacitor and
CAES-flywheel), and provide both long- and
short-term storage options (CAES-SMES).
Fuel cell hybrids
In addition to fuel cell-battery storage
systems, hybrid fuel cell storage systems
include fuel cell-supercapacitor and fuel cell-
SMES Fuel cell-supercapacitor storage systems
have been proposed for electric vehicles and
renewable resources integration (Hemmati
and Saboori, 2016).
Fuel cell-SMES combine fast response, low
capacity storage with slow response, high
capacity storage devices. These systems are
proposed for handling large variations in
energy storage, which may be suitable for
integrating large scale renewable resources
into the grid (Hemmati and Saboori, 2016).
These storage systems are in research and
design stage and have not yet been piloted.
Mechanical Storage
Compressed Air Energy Storage (CAES)
CAES systems store energy by compressing
ambient air and storing it at high pressure in
underground geological structures such as
caverns, aquifers and abandoned mines. The
compression of the air generates a lot of heat
which must be removed before storage. When
the stored energy is required the compressed
air is released, re-heated, and used to drive a
turbine to create electricity. Current systems
use natural gas to heat the expanding
gas; however, adiabatic systems are being
developed that will store the heat removed
from the pressurised air and use it to reheat
the expanding air.
Adiabatic CAES systems have the potential to
increase the efficiency of CAES and remove
the need for combustion of fossil fuels. A pilot
plant, planned by a German-led international
consortium, is scheduled to start operations in
2018 (Energy Storage Association, 2016).
99
Isothermal CAES is a developing technology
in which the pressure-volume curve of
the air during compression and expansion
is controlled to resemble an isotherm.
This process wastes less energy, increases
efficiency, and reduces capital costs relative
to adiabatic CAES (Energy Storage Association,
2016). Australia has no deployments of CAES
technology (Cavanagh et al., 2015b).
Weaknesses and Challenges
CAES typically requires geological structures
suitable for storing high-pressure gas.
Conventional CAES systems have low round-
trip efficiencies and require the combustion
of fuel (typically natural gas) to offset the
temperature loss experienced during
re-expansion of the air.
Strengths and Opportunities
Conventional CAES is an established
technology (TRL 9) that is capable of storing
significant amounts of energy. Australia
is well-positioned geologically for CAES.
Technology improvements such as the
development of adiabatic CAES (currently TRL
4) and modular, scalable and above ground
CAES have been predicted to drive significant
growth in CAES installations worldwide
(Navigant Research, 2013).
ENERGY STORAGE TECHNOLOGIES NOT COVERED IN THIS REPORT
Technologies such as flywheels,
supercapacitors, superconducting magnetic
energy storage are not discussed in detail
here as they are only able to store energy for
short periods and are beyond the scope of
the report. Energy storage technologies that
are not applicable to the storage of electrical
power, including thermal storage for heat
processes, are also not covered.
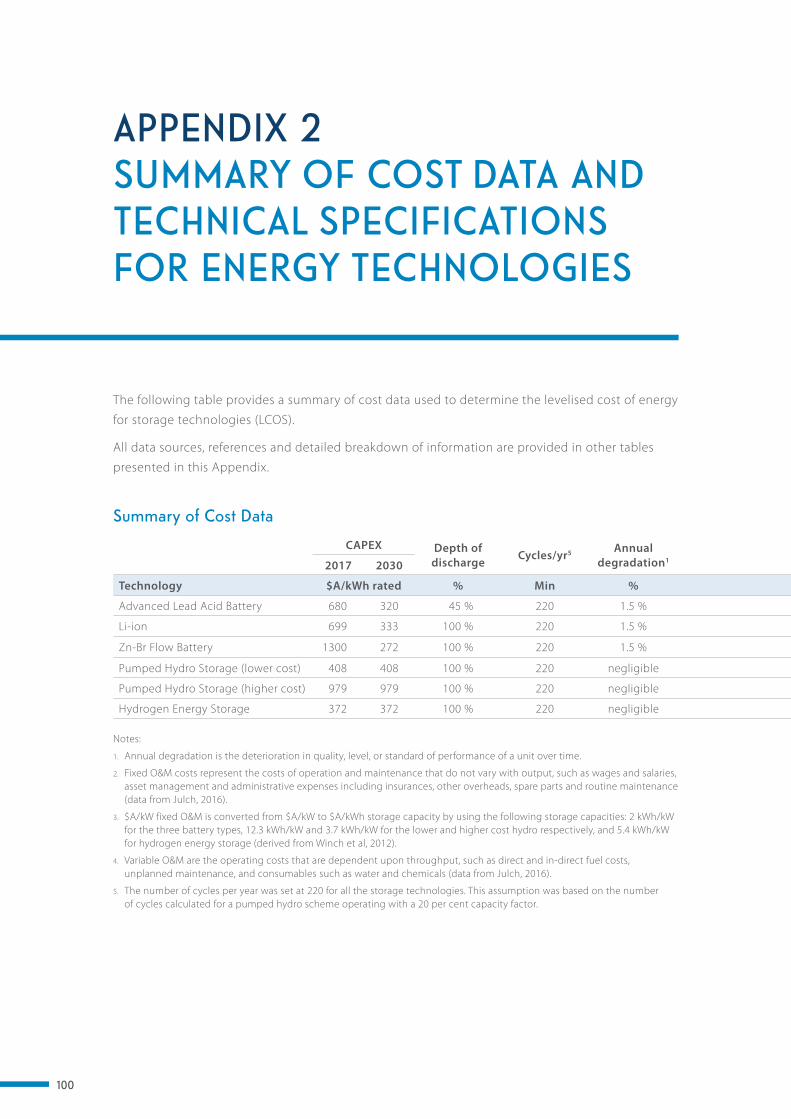
100
APPENDIX 2 SUMMARY OF COST DATA AND TECHNICAL SPECIFICATIONS FOR ENERGY TECHNOLOGIES
The following table provides a summary of cost data used to determine the levelised cost of energy
for storage technologies (LCOS).
All data sources, references and detailed breakdown of information are provided in other tables
presented in this Appendix.
Summary of Cost Data
CAPEX Depth of discharge Cycles/yr5 Annual
degradation1 Fixed O&M2 Variable O&M4 Round-trip efficiency Project lifetime2017 2030
Technology $A/kWh rated % Min % $A/kW/yr3 $A/kWh/yr3 $A/kWh throughput/ year % years
Advanced Lead Acid Battery 680 320 45 % 220 1.5 % 4.8 2.4 0.0048 94 % 15
Li-ion 699 333 100 % 220 1.5 % 9.8 4.9 0.0030 93 % 15
Zn-Br Flow Battery 1300 272 100 % 220 1.5 % 6.1 3.1 0.0009 75 % 15
Pumped Hydro Storage (lower cost) 408 408 100 % 220 negligible 6.5 0.5 0.0003 76 % 40
Pumped Hydro Storage (higher cost) 979 979 100 % 220 negligible 6.5 1.8 0.0003 76 % 40
Hydrogen Energy Storage 372 372 100 % 220 negligible 36.4 6.7 0.0043 40 % 20
Notes:
1. Annual degradation is the deterioration in quality, level, or standard of performance of a unit over time.
2. Fixed O&M costs represent the costs of operation and maintenance that do not vary with output, such as wages and salaries, asset management and administrative expenses including insurances, other overheads, spare parts and routine maintenance (data from Julch, 2016).
3. $A/kW fixed O&M is converted from $A/kW to $A/kWh storage capacity by using the following storage capacities: 2 kWh/kW for the three battery types, 12.3 kWh/kW and 3.7 kWh/kW for the lower and higher cost hydro respectively, and 5.4 kWh/kW for hydrogen energy storage (derived from Winch et al, 2012).
4. Variable O&M are the operating costs that are dependent upon throughput, such as direct and in-direct fuel costs, unplanned maintenance, and consumables such as water and chemicals (data from Julch, 2016).
5. The number of cycles per year was set at 220 for all the storage technologies. This assumption was based on the number of cycles calculated for a pumped hydro scheme operating with a 20 per cent capacity factor.
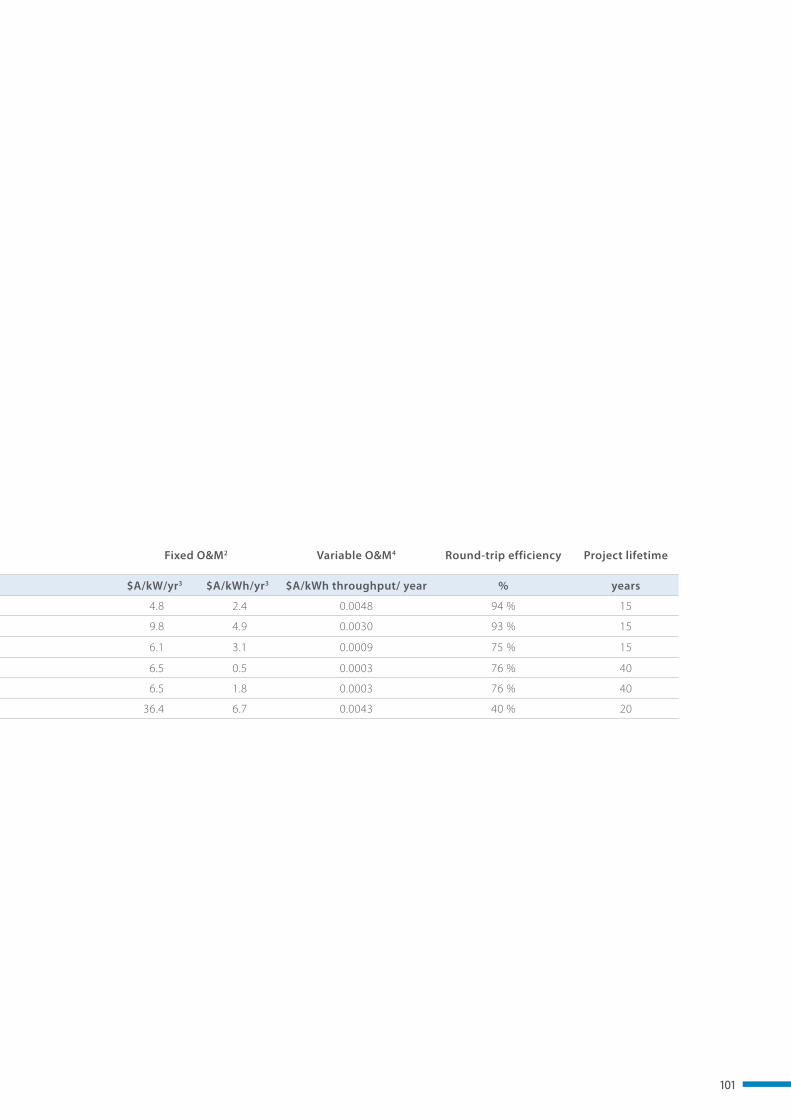
101
The following table provides a summary of cost data used to determine the levelised cost of energy
for storage technologies (LCOS).
All data sources, references and detailed breakdown of information are provided in other tables
presented in this Appendix.
Summary of Cost Data
CAPEX Depth of discharge Cycles/yr5 Annual
degradation1 Fixed O&M2 Variable O&M4 Round-trip efficiency Project lifetime2017 2030
Technology $A/kWh rated % Min % $A/kW/yr3 $A/kWh/yr3 $A/kWh throughput/ year % years
Advanced Lead Acid Battery 680 320 45 % 220 1.5 % 4.8 2.4 0.0048 94 % 15
Li-ion 699 333 100 % 220 1.5 % 9.8 4.9 0.0030 93 % 15
Zn-Br Flow Battery 1300 272 100 % 220 1.5 % 6.1 3.1 0.0009 75 % 15
Pumped Hydro Storage (lower cost) 408 408 100 % 220 negligible 6.5 0.5 0.0003 76 % 40
Pumped Hydro Storage (higher cost) 979 979 100 % 220 negligible 6.5 1.8 0.0003 76 % 40
Hydrogen Energy Storage 372 372 100 % 220 negligible 36.4 6.7 0.0043 40 % 20
Notes:
1. Annual degradation is the deterioration in quality, level, or standard of performance of a unit over time.
2. Fixed O&M costs represent the costs of operation and maintenance that do not vary with output, such as wages and salaries, asset management and administrative expenses including insurances, other overheads, spare parts and routine maintenance (data from Julch, 2016).
3. $A/kW fixed O&M is converted from $A/kW to $A/kWh storage capacity by using the following storage capacities: 2 kWh/kW for the three battery types, 12.3 kWh/kW and 3.7 kWh/kW for the lower and higher cost hydro respectively, and 5.4 kWh/kW for hydrogen energy storage (derived from Winch et al, 2012).
4. Variable O&M are the operating costs that are dependent upon throughput, such as direct and in-direct fuel costs, unplanned maintenance, and consumables such as water and chemicals (data from Julch, 2016).
5. The number of cycles per year was set at 220 for all the storage technologies. This assumption was based on the number of cycles calculated for a pumped hydro scheme operating with a 20 per cent capacity factor.
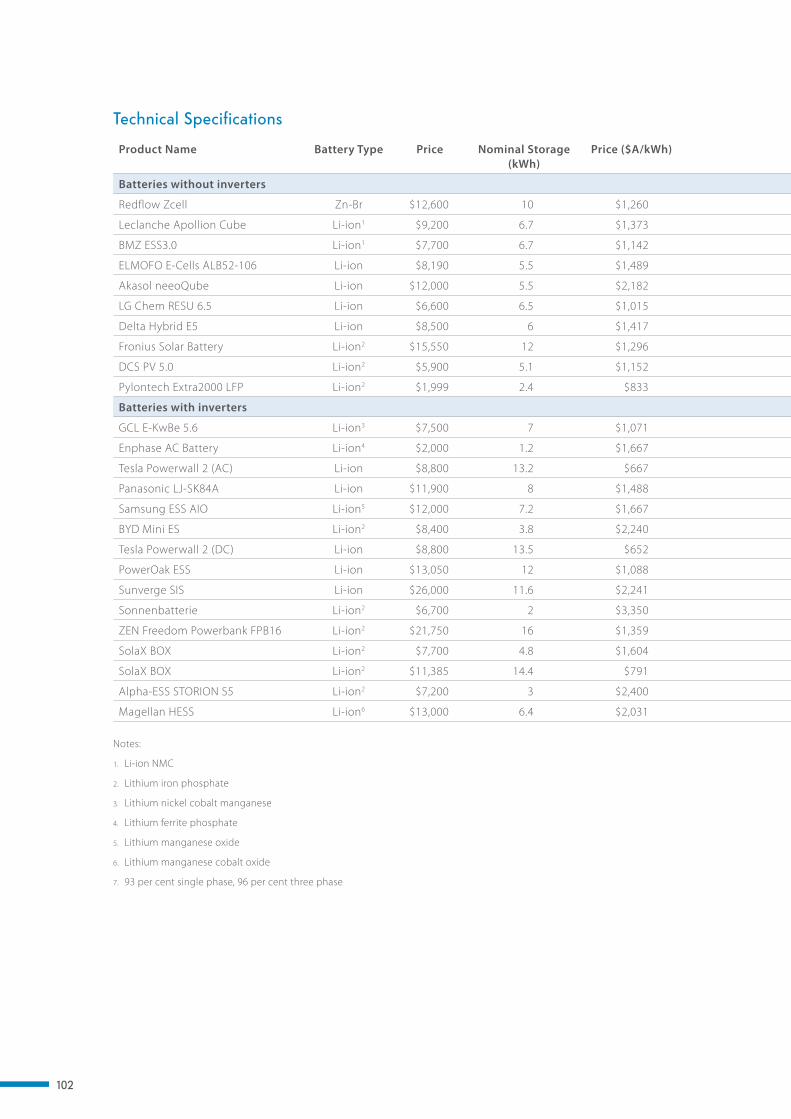
102
Product Name Battery Type Price Nominal Storage (kWh)
Price ($A/kWh) Usable Storage (kWh)
Power (kW)
Cycle Life Depth of Discharge (%)
Round-trip Efficiency Warranty (years)
Batteries without inverters
Redflow Zcell Zn-Br $12,600 10 $1,260 10 3 3,650 100 80 % 10
Leclanche Apollion Cube Li-ion1 $9,200 6.7 $1,373 5.4 3.3 5,000 80 97 % 7
BMZ ESS3.0 Li-ion1 $7,700 6.7 $1,142 5.4 8 5,000 80 97 % 10
ELMOFO E-Cells ALB52-106 Li-ion $8,190 5.5 $1,489 4.4 5 8,000 80 96 % 10
Akasol neeoQube Li-ion $12,000 5.5 $2,182 5 5 7,000 90 98 % 10
LG Chem RESU 6.5 Li-ion $6,600 6.5 $1,015 5.9 4.2 3,200 90 95 % 10
Delta Hybrid E5 Li-ion $8,500 6 $1,417 4.8 3 6,000 80 90 % 5
Fronius Solar Battery Li-ion2 $15,550 12 $1,296 9.6 4 8,000 80 >90 % 5
DCS PV 5.0 Li-ion2 $5,900 5.1 $1,152 5.1 5 5,000 100 99 % 10
Pylontech Extra2000 LFP Li-ion2 $1,999 2.4 $833 1.9 2 4,000 80 TBD 5
Batteries with inverters
GCL E-KwBe 5.6 Li-ion3 $7,500 7 $1,071 5.6 3 2,000 80 95 % 7
Enphase AC Battery Li-ion4 $2,000 1.2 $1,667 1.1 0.26 7,300 95 96 % 10
Tesla Powerwall 2 (AC) Li-ion $8,800 13.2 $667 13.2 5 n/a 100 89 % 10
Panasonic LJ-SK84A Li-ion $11,900 8 $1,488 8 2 3,650 100 93 % 10 – 7
Samsung ESS AIO Li-ion5 $12,000 7.2 $1,667 6.5 4 6,000 90 95 % 5
BYD Mini ES Li-ion2 $8,400 3.8 $2,240 3 3 6,000 80 98 % 10
Tesla Powerwall 2 (DC) Li-ion $8,800 13.5 $652 13.5 5 n/a 100 91.80 % 10
PowerOak ESS Li-ion $13,050 12 $1,088 9.8 3 6,000 80 TBD 5
Sunverge SIS Li-ion $26,000 11.6 $2,241 9.9 5 8,000 85 96 % 10
Sonnenbatterie Li-ion2 $6,700 2 $3,350 2 1.5 10,000 100 93–96 %7 10
ZEN Freedom Powerbank FPB16 Li-ion2 $21,750 16 $1,359 14.4 5 6,000 90 TBD 5
SolaX BOX Li-ion2 $7,700 4.8 $1,604 3.8 4.6 4,000 80 97 % 5
SolaX BOX Li-ion2 $11,385 14.4 $791 11.5 5 4,400 80 97 % 5
Alpha-ESS STORION S5 Li-ion2 $7,200 3 $2,400 2.7 5 8,000 90 95 % 5
Magellan HESS Li-ion6 $13,000 6.4 $2,031 5.8 5 4,000 90 97 % 5
Notes:
1. Li-ion NMC
2. Lithium iron phosphate
3. Lithium nickel cobalt manganese
4. Lithium ferrite phosphate
5. Lithium manganese oxide
6. Lithium manganese cobalt oxide
7. 93 per cent single phase, 96 per cent three phase
Technical Specifications
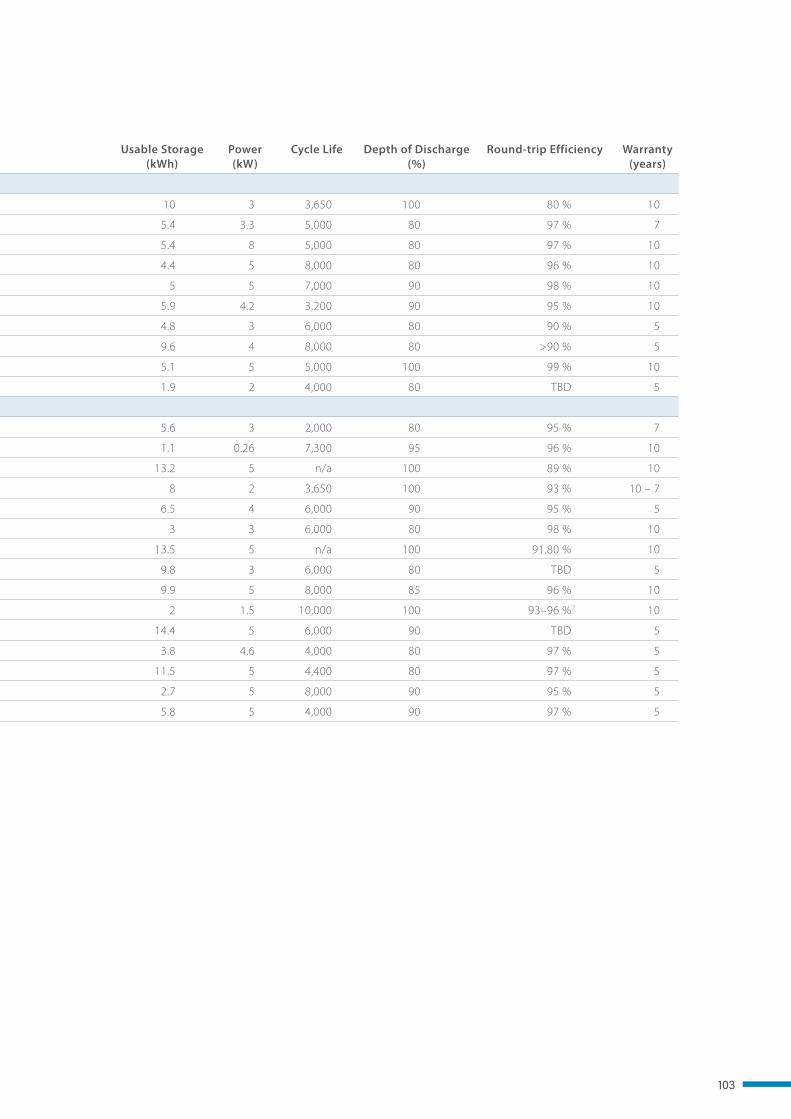
103
Product Name Battery Type Price Nominal Storage (kWh)
Price ($A/kWh) Usable Storage (kWh)
Power (kW)
Cycle Life Depth of Discharge (%)
Round-trip Efficiency Warranty (years)
Batteries without inverters
Redflow Zcell Zn-Br $12,600 10 $1,260 10 3 3,650 100 80 % 10
Leclanche Apollion Cube Li-ion1 $9,200 6.7 $1,373 5.4 3.3 5,000 80 97 % 7
BMZ ESS3.0 Li-ion1 $7,700 6.7 $1,142 5.4 8 5,000 80 97 % 10
ELMOFO E-Cells ALB52-106 Li-ion $8,190 5.5 $1,489 4.4 5 8,000 80 96 % 10
Akasol neeoQube Li-ion $12,000 5.5 $2,182 5 5 7,000 90 98 % 10
LG Chem RESU 6.5 Li-ion $6,600 6.5 $1,015 5.9 4.2 3,200 90 95 % 10
Delta Hybrid E5 Li-ion $8,500 6 $1,417 4.8 3 6,000 80 90 % 5
Fronius Solar Battery Li-ion2 $15,550 12 $1,296 9.6 4 8,000 80 >90 % 5
DCS PV 5.0 Li-ion2 $5,900 5.1 $1,152 5.1 5 5,000 100 99 % 10
Pylontech Extra2000 LFP Li-ion2 $1,999 2.4 $833 1.9 2 4,000 80 TBD 5
Batteries with inverters
GCL E-KwBe 5.6 Li-ion3 $7,500 7 $1,071 5.6 3 2,000 80 95 % 7
Enphase AC Battery Li-ion4 $2,000 1.2 $1,667 1.1 0.26 7,300 95 96 % 10
Tesla Powerwall 2 (AC) Li-ion $8,800 13.2 $667 13.2 5 n/a 100 89 % 10
Panasonic LJ-SK84A Li-ion $11,900 8 $1,488 8 2 3,650 100 93 % 10 – 7
Samsung ESS AIO Li-ion5 $12,000 7.2 $1,667 6.5 4 6,000 90 95 % 5
BYD Mini ES Li-ion2 $8,400 3.8 $2,240 3 3 6,000 80 98 % 10
Tesla Powerwall 2 (DC) Li-ion $8,800 13.5 $652 13.5 5 n/a 100 91.80 % 10
PowerOak ESS Li-ion $13,050 12 $1,088 9.8 3 6,000 80 TBD 5
Sunverge SIS Li-ion $26,000 11.6 $2,241 9.9 5 8,000 85 96 % 10
Sonnenbatterie Li-ion2 $6,700 2 $3,350 2 1.5 10,000 100 93–96 %7 10
ZEN Freedom Powerbank FPB16 Li-ion2 $21,750 16 $1,359 14.4 5 6,000 90 TBD 5
SolaX BOX Li-ion2 $7,700 4.8 $1,604 3.8 4.6 4,000 80 97 % 5
SolaX BOX Li-ion2 $11,385 14.4 $791 11.5 5 4,400 80 97 % 5
Alpha-ESS STORION S5 Li-ion2 $7,200 3 $2,400 2.7 5 8,000 90 95 % 5
Magellan HESS Li-ion6 $13,000 6.4 $2,031 5.8 5 4,000 90 97 % 5
Notes:
1. Li-ion NMC
2. Lithium iron phosphate
3. Lithium nickel cobalt manganese
4. Lithium ferrite phosphate
5. Lithium manganese oxide
6. Lithium manganese cobalt oxide
7. 93 per cent single phase, 96 per cent three phase
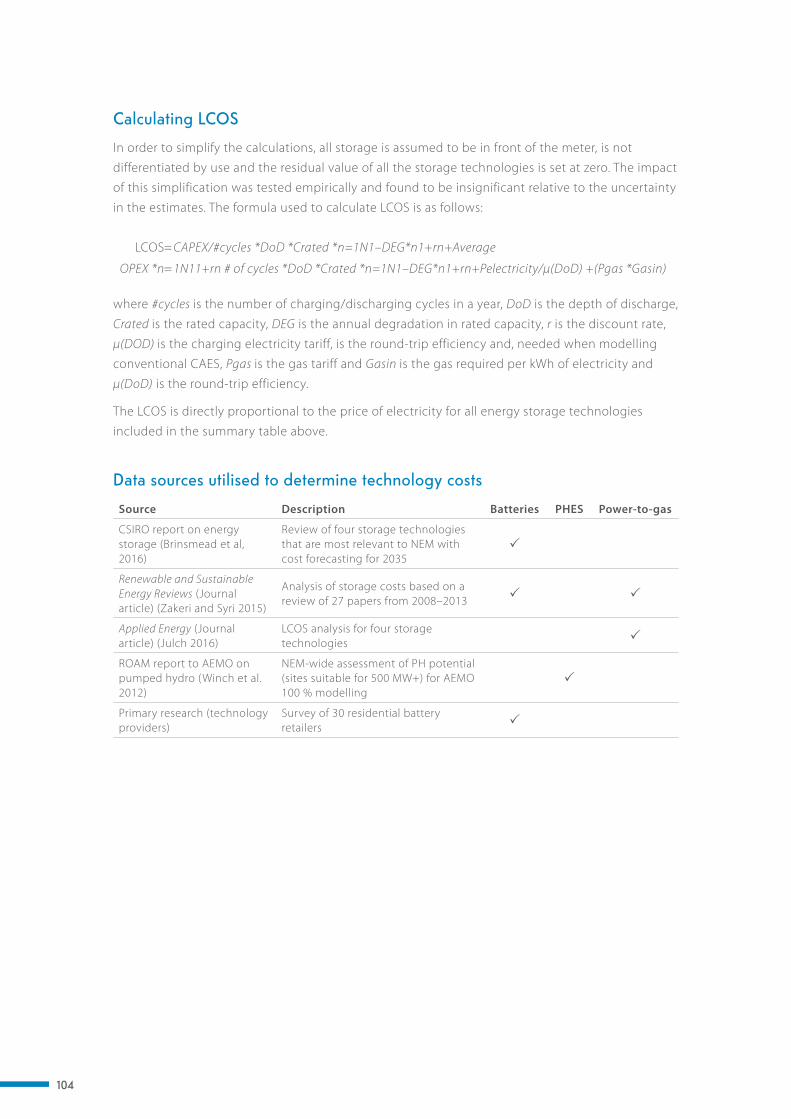
104
Calculating LCOS
In order to simplify the calculations, all storage is assumed to be in front of the meter, is not
differentiated by use and the residual value of all the storage technologies is set at zero. The impact
of this simplification was tested empirically and found to be insignificant relative to the uncertainty
in the estimates. The formula used to calculate LCOS is as follows:
LCOS= CAPEX/#cycles *DoD *Crated *n=1N1–DEG*n1+rn+Average
OPEX *n= 1N11+rn # of cycles *DoD *Crated *n=1N1–DEG*n1+rn+Pelectricity/μ(DoD) +(Pgas *Gasin)
where #cycles is the number of charging/discharging cycles in a year, DoD is the depth of discharge,
Crated is the rated capacity, DEG is the annual degradation in rated capacity, r is the discount rate,
μ(DOD) is the charging electricity tariff, is the round-trip efficiency and, needed when modelling
conventional CAES, Pgas is the gas tariff and Gasin is the gas required per kWh of electricity and
μ(DoD) is the round-trip efficiency.
The LCOS is directly proportional to the price of electricity for all energy storage technologies
included in the summary table above.
Data sources utilised to determine technology costs
Source Description Batteries PHES Power-to-gas
CSIRO report on energy storage (Brinsmead et al, 2016)
Review of four storage technologies that are most relevant to NEM with cost forecasting for 2035
Renewable and Sustainable Energy Reviews (Journal article) (Zakeri and Syri 2015)
Analysis of storage costs based on a review of 27 papers from 2008–2013
Applied Energy (Journal article) (Julch 2016)
LCOS analysis for four storage technologies
ROAM report to AEMO on pumped hydro (Winch et al. 2012)
NEM-wide assessment of PH potential (sites suitable for 500 MW+) for AEMO 100 % modelling
Primary research (technology providers)
Survey of 30 residential battery retailers
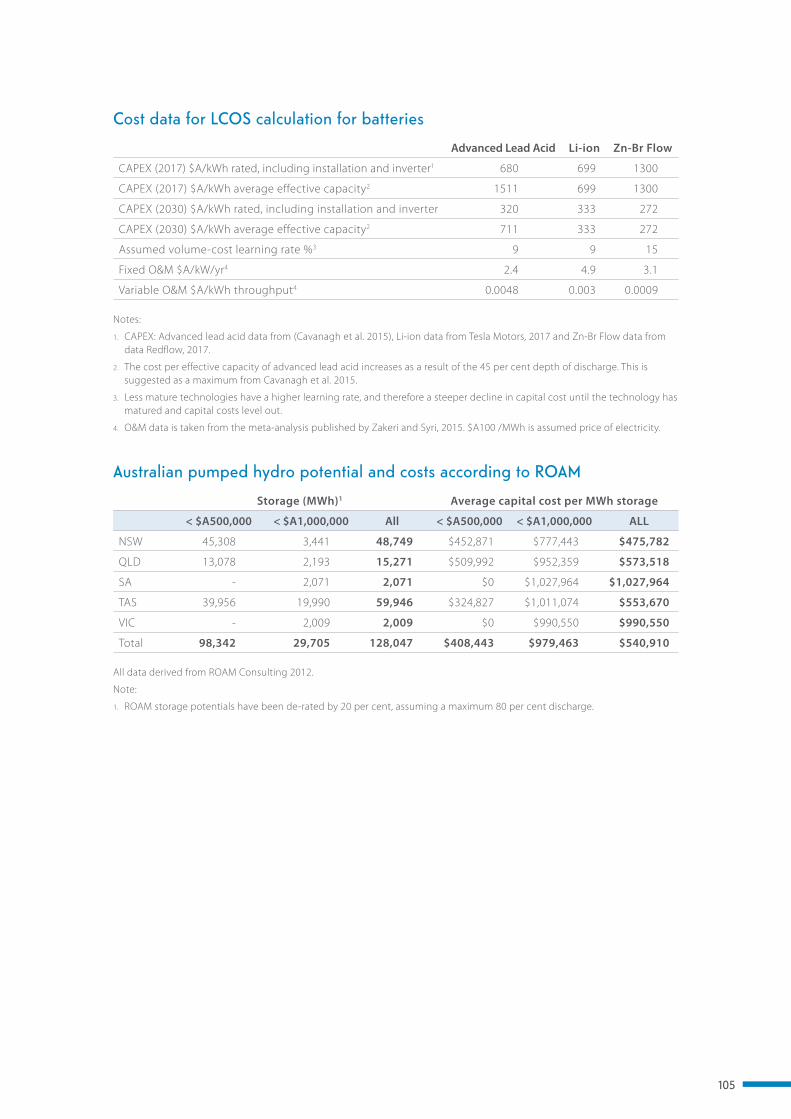
105
Cost data for LCOS calculation for batteries
Advanced Lead Acid Li-ion Zn-Br Flow
CAPEX (2017) $A/kWh rated, including installation and inverter1 680 699 1300
CAPEX (2017) $A/kWh average effective capacity2 1511 699 1300
CAPEX (2030) $A/kWh rated, including installation and inverter 320 333 272
CAPEX (2030) $A/kWh average effective capacity2 711 333 272
Assumed volume-cost learning rate %3 9 9 15
Fixed O&M $A/kW/yr4 2.4 4.9 3.1
Variable O&M $A/kWh throughput4 0.0048 0.003 0.0009
Notes:
1. CAPEX: Advanced lead acid data from (Cavanagh et al. 2015), Li-ion data from Tesla Motors, 2017 and Zn-Br Flow data from data Redflow, 2017.
2. The cost per effective capacity of advanced lead acid increases as a result of the 45 per cent depth of discharge. This is suggested as a maximum from Cavanagh et al. 2015.
3. Less mature technologies have a higher learning rate, and therefore a steeper decline in capital cost until the technology has matured and capital costs level out.
4. O&M data is taken from the meta-analysis published by Zakeri and Syri, 2015. $A100 /MWh is assumed price of electricity.
Australian pumped hydro potential and costs according to ROAM
Storage (MWh)1 Average capital cost per MWh storage
< $A500,000 < $A1,000,000 All < $A500,000 < $A1,000,000 ALL
NSW 45,308 3,441 48,749 $452,871 $777,443 $475,782
QLD 13,078 2,193 15,271 $509,992 $952,359 $573,518
SA - 2,071 2,071 $0 $1,027,964 $1,027,964
TAS 39,956 19,990 59,946 $324,827 $1,011,074 $553,670
VIC - 2,009 2,009 $0 $990,550 $990,550
Total 98,342 29,705 128,047 $408,443 $979,463 $540,910
All data derived from ROAM Consulting 2012.
Note:
1. ROAM storage potentials have been de-rated by 20 per cent, assuming a maximum 80 per cent discharge.
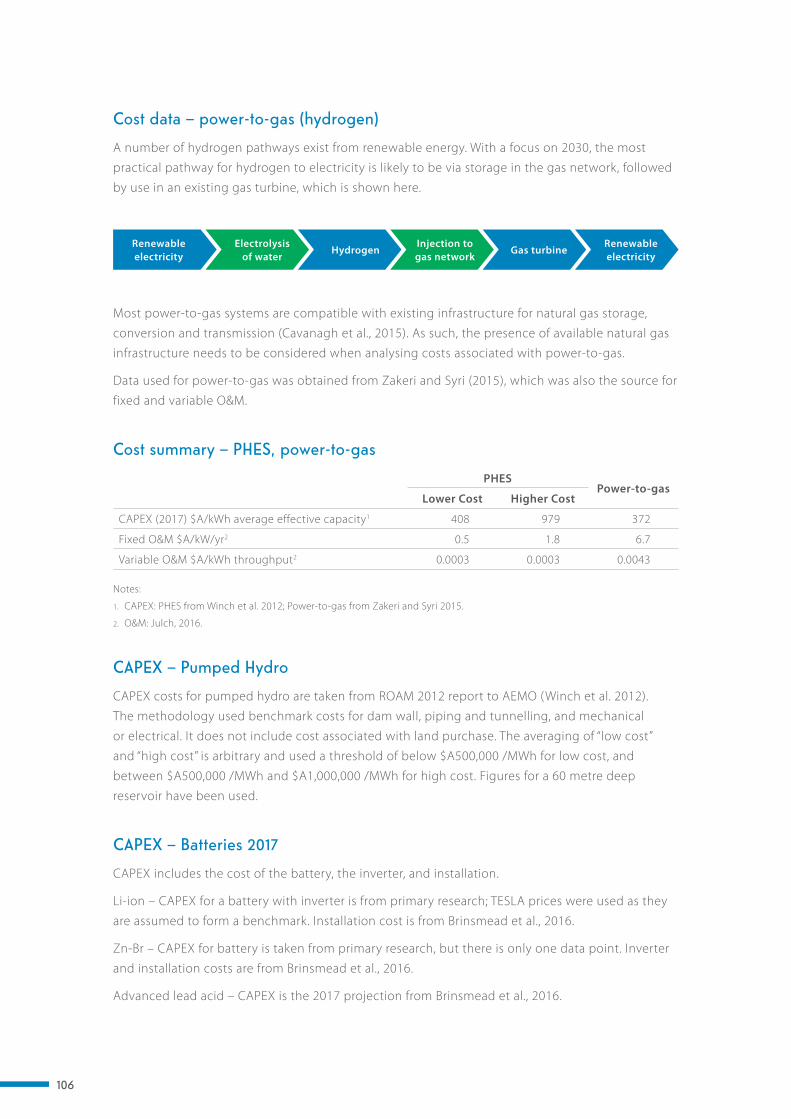
106
Cost data – power-to-gas (hydrogen)
A number of hydrogen pathways exist from renewable energy. With a focus on 2030, the most
practical pathway for hydrogen to electricity is likely to be via storage in the gas network, followed
by use in an existing gas turbine, which is shown here.
Most power-to-gas systems are compatible with existing infrastructure for natural gas storage,
conversion and transmission (Cavanagh et al., 2015). As such, the presence of available natural gas
infrastructure needs to be considered when analysing costs associated with power-to-gas.
Data used for power-to-gas was obtained from Zakeri and Syri (2015), which was also the source for
fixed and variable O&M.
Cost summary – PHES, power-to-gas
PHES Power-to-gas
Lower Cost Higher Cost
CAPEX (2017) $A/kWh average effective capacity1 408 979 372
Fixed O&M $A/kW/yr2 0.5 1.8 6.7
Variable O&M $A/kWh throughput2 0.0003 0.0003 0.0043
Notes:
1. CAPEX: PHES from Winch et al. 2012; Power-to-gas from Zakeri and Syri 2015.
2. O&M: Julch, 2016.
CAPEX – Pumped Hydro
CAPEX costs for pumped hydro are taken from ROAM 2012 report to AEMO (Winch et al. 2012).
The methodology used benchmark costs for dam wall, piping and tunnelling, and mechanical
or electrical. It does not include cost associated with land purchase. The averaging of “low cost”
and “high cost” is arbitrary and used a threshold of below $A500,000 /MWh for low cost, and
between $A500,000 /MWh and $A1,000,000 /MWh for high cost. Figures for a 60 metre deep
reservoir have been used.
CAPEX – Batteries 2017
CAPEX includes the cost of the battery, the inverter, and installation.
Li-ion – CAPEX for a battery with inverter is from primary research; TESLA prices were used as they
are assumed to form a benchmark. Installation cost is from Brinsmead et al., 2016.
Zn-Br – CAPEX for battery is taken from primary research, but there is only one data point. Inverter
and installation costs are from Brinsmead et al., 2016.
Advanced lead acid – CAPEX is the 2017 projection from Brinsmead et al., 2016.
Renewable electricity
Electrolysis of water
HydrogenInjection to gas network
Gas turbineRenewable electricity

107
CAPEX – Batteries 2030
The Brinsmead et al., 2016 forward projection (cost reduction) from 2017 to 2030 was used
to derive the 2030 CAPEX from current prices.
Cost reduction is a combination of the volume-cost learning rate, and projected installation
numbers both globally and domestically. Learning rate is defined as the cost reduction for every
doubling in installation. It uses the assumption that technology costs come down very steeply
at early stage development, as doubling is relatively easy to achieve when the base level is very
low. Zn-Br is at a much earlier development stage than either Li-ion or Zn-Br, and the CSIRO report
(Brinsmead et al., 2016) projects much steeper price drops for this technology. It is also plausible
that Li-ion has accelerated along the reduction curve because Tesla has reduced their costs in
anticipation of sales, which will incentivise other companies to reduce their costs in competition.
CAPEX – Compressed air
CAPEX includes the average cost from Zakeri and Syri (2015), which separates costs into the power
conversion system (PCS) and the storage section. Capital costs are separated into the charging
system, the discharge system, and the storage section.
Technical input data for the LCOS calculations (all technologies)
Advanced Lead Acid Li-ion Zn-Br Flow PHES Power-to-gas
Depth of Discharge (%) 45 100 100 100 100
Round-trip Efficiency (%) 94 93 75 76 32
Average effective capacity (%) 90 90 90 100 100
Project Lifetime (yrs) 15 15 15 40 20
Sources 1 2 3 4 5
Sources:
1. Cavanagh et al., 2015.
2. Tesla Motors, 2016.
3. Zn-Br Flow data from Redflow, 2017.
4. Winch et al., 2012.
5. Julch, 2016; Zakeri & Syri, 2015.
Financial input to LCOS calculations
Discount rate 8 %
Average electricity price 0.1 $A/kWh
Average gas cost 0.060 $A/kWh
1 EUR $1.42 AUD
1 USD $1.32 AUD
All values are 2017 dollars.
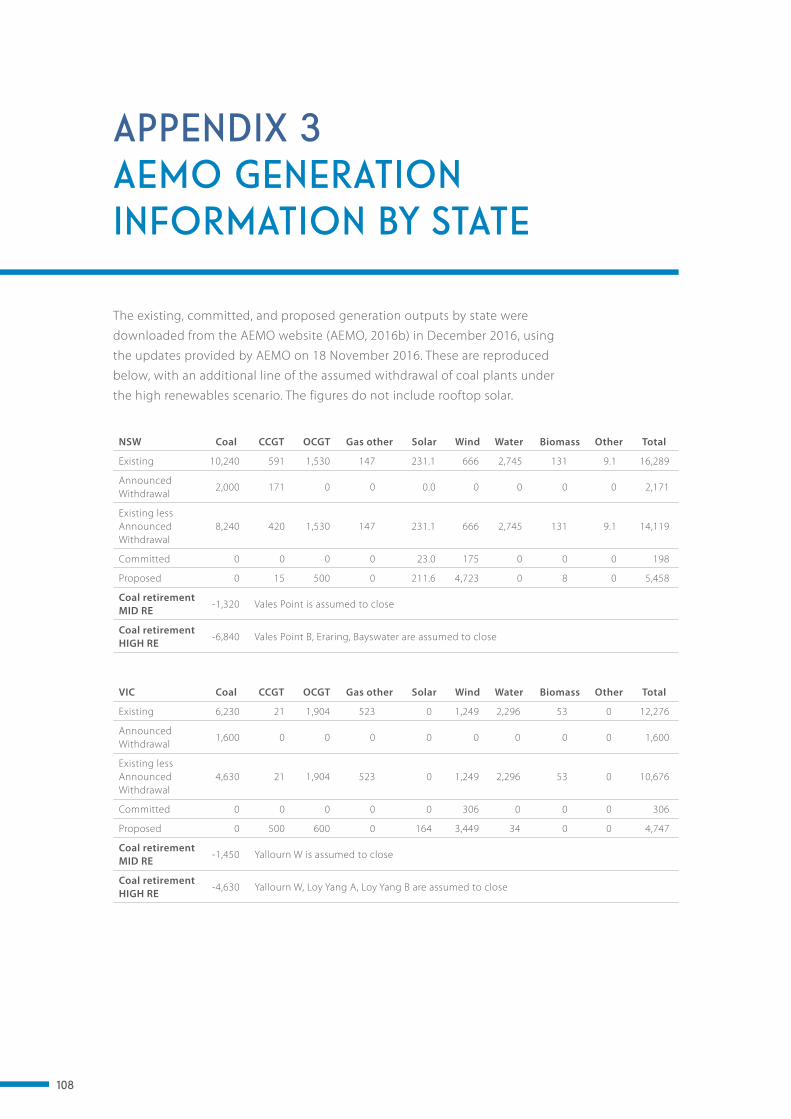
108
APPENDIX 3 AEMO GENERATION INFORMATION BY STATE
NSW Coal CCGT OCGT Gas other Solar Wind Water Biomass Other Total
Existing 10,240 591 1,530 147 231.1 666 2,745 131 9.1 16,289
Announced Withdrawal
2,000 171 0 0 0.0 0 0 0 0 2,171
Existing less Announced Withdrawal
8,240 420 1,530 147 231.1 666 2,745 131 9.1 14,119
Committed 0 0 0 0 23.0 175 0 0 0 198
Proposed 0 15 500 0 211.6 4,723 0 8 0 5,458
Coal retirement MID RE
-1,320 Vales Point is assumed to close
Coal retirement HIGH RE
-6,840 Vales Point B, Eraring, Bayswater are assumed to close
VIC Coal CCGT OCGT Gas other Solar Wind Water Biomass Other Total
Existing 6,230 21 1,904 523 0 1,249 2,296 53 0 12,276
Announced Withdrawal
1,600 0 0 0 0 0 0 0 0 1,600
Existing less Announced Withdrawal
4,630 21 1,904 523 0 1,249 2,296 53 0 10,676
Committed 0 0 0 0 0 306 0 0 0 306
Proposed 0 500 600 0 164 3,449 34 0 0 4,747
Coal retirement MID RE
-1,450 Yallourn W is assumed to close
Coal retirement HIGH RE
-4,630 Yallourn W, Loy Yang A, Loy Yang B are assumed to close
The existing, committed, and proposed generation outputs by state were
downloaded from the AEMO website (AEMO, 2016b) in December 2016, using
the updates provided by AEMO on 18 November 2016. These are reproduced
below, with an additional line of the assumed withdrawal of coal plants under
the high renewables scenario. The figures do not include rooftop solar.
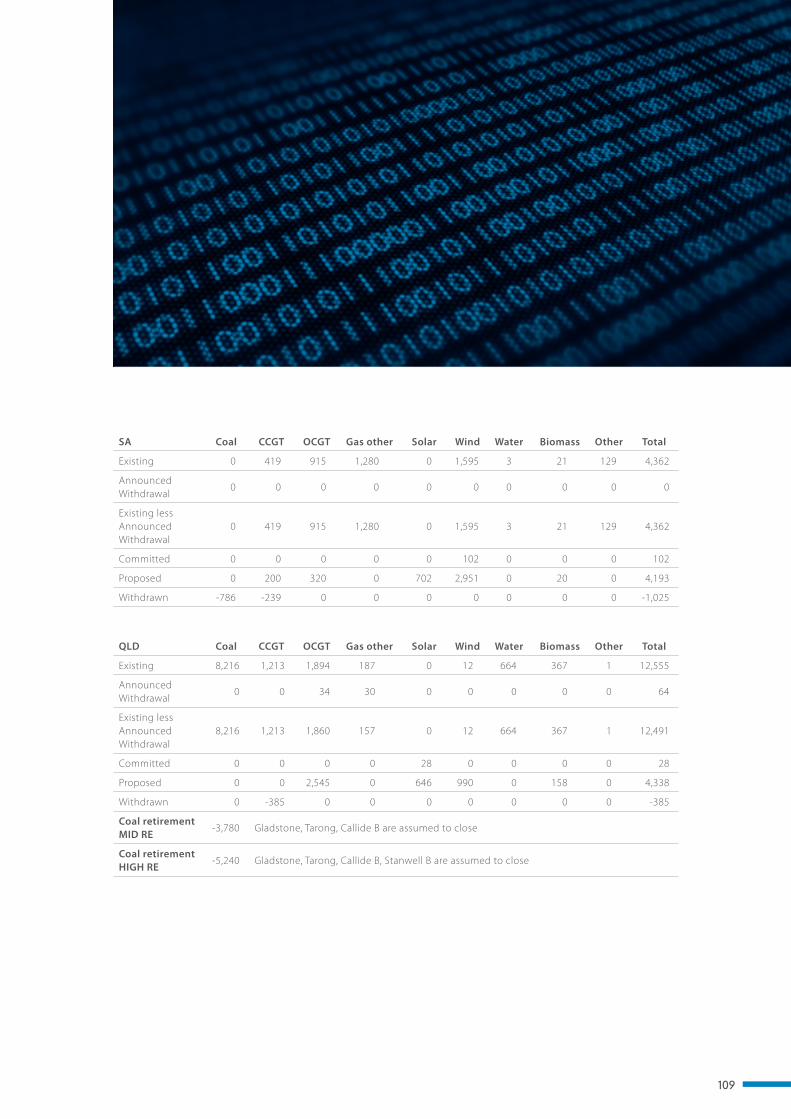
109
SA Coal CCGT OCGT Gas other Solar Wind Water Biomass Other Total
Existing 0 419 915 1,280 0 1,595 3 21 129 4,362
Announced Withdrawal
0 0 0 0 0 0 0 0 0 0
Existing less Announced Withdrawal
0 419 915 1,280 0 1,595 3 21 129 4,362
Committed 0 0 0 0 0 102 0 0 0 102
Proposed 0 200 320 0 702 2,951 0 20 0 4,193
Withdrawn -786 -239 0 0 0 0 0 0 0 -1,025
QLD Coal CCGT OCGT Gas other Solar Wind Water Biomass Other Total
Existing 8,216 1,213 1,894 187 0 12 664 367 1 12,555
Announced Withdrawal
0 0 34 30 0 0 0 0 0 64
Existing less Announced Withdrawal
8,216 1,213 1,860 157 0 12 664 367 1 12,491
Committed 0 0 0 0 28 0 0 0 0 28
Proposed 0 0 2,545 0 646 990 0 158 0 4,338
Withdrawn 0 -385 0 0 0 0 0 0 0 -385
Coal retirement MID RE
-3,780 Gladstone, Tarong, Callide B are assumed to close
Coal retirement HIGH RE
-5,240 Gladstone, Tarong, Callide B, Stanwell B are assumed to close

110
TAS Coal CCGT OCGT Gas other Solar Wind Water Biomass Other Total
Existing 0 0 178 0 0 308 2,281 5 0 2,772
Announced Withdrawal
0 0 0 0 0 0 0 0 0 0
Existing less Announced Withdrawal
0 0 178 0 0 308 2,281 5 0 2,772
Committed 0 0 0 0 0 0 0 0 0 0
Proposed 0 0 0 0 0 329 0 0 0 329
Withdrawn 0 -208 0 0 0 0 0 0 0 -208
South West Interconnected System
Coal CCGT Gas/gas & diesel peaking
Gas other Solar Wind Water Biomass Other Total
Existing 1,778 876 1,242 880 4 86 0 16 176 5,058
Announced Withdrawal
340 340
Existing less Announced Withdrawal
1,438 876 1,242 880 4 86 0 16 176 4,718
ADDITIONAL INFORMATION (not from AEMO)
Proposed 1001 5002 600
Coal retirement MID RE
-874 Muja is assumed to close
Coal retirement HIGH RE
-874 Muja is assumed to close
Notes:
1. 100 MW Cunderdin Solar.
2. 100 MW Pacific Hydro proposal for Lancelin; <http://www.pacifichydro.com.au/english/projects/development-construction/nilgen-wind-farm>; 300 MW Dandaragan <http://dandaraganwindfarm.com.au>; 100 MW Badgingarra.
111
APPENDIX 4 AUSTRALIAN ORGANISATIONS INVOLVED IN ENERGY STORAGE
The Australian National University’s (ANU)
Energy Change Institute conducts research
on fuel cells, energy nanomaterials, PHES, and
solar thermal energy storage. Researchers in
the College of Engineering and Computer
Science at ANU, together with researchers
at the University of Sydney and industry
partners, were recently awarded an ARENA
grant to develop network aware co-ordination
algorithms and capabilities for residential
energy storage on Bruny Island (Consort,
2016).
The Australian Centre of Excellence for Electromaterials Science (ACES) has energy
storage projects (including metal-air batteries,
the electrolysis of water hydrogen, and
nitrogen reduction to ammonia) based at
Monash University, Deakin University and the
University of Wollongong.
The Australian Nuclear Science and Technology Organisation (ANSTO) is
working on the development of new materials
for use in molten salt reactor systems, and is
involved in research on concentrated solar
thermal, hydrogen energy storage, lithium
batteries, and fuel cells.
The Australian Solar Thermal Research Initiative (ASTRI) is an eight-year international
collaboration between research institutions
and industry, including CSIRO, ARENA,
Flinders University, University of South
Australia, ANU, The University of Adelaide,
Queensland University of Technology (QUT),
and The University of Queensland (UQ),
investigating concentrated solar thermal
power technologies.
CSIRO has experience with a range of energy
storage technologies including various
battery chemistries, supercapacitors, fuel cells,
and hydrogen energy storage.
The Future Grid Research Program by
the University of Sydney. The program is
conducting research that draws together
engineering, economic and policy aspects
of grid development and optimisation. The
four major areas of focus are – improved
understanding of different loads, generation
sources and energy storage on system
security (University of Sydney); grid planning
and co-optimisation of electricity and gas
networks (University of Newcastle); Economics
of alternative network development paths
and estimates of total cost and price impacts
(University of Queensland); and Policy
measures and regulatory changes to facilitate
a smooth transition to a decarbonised future
grid (University of New South Wales). The
program is supported by an industry group
comprising senior executives from the
energy sector.
112
Curtin University’s Fuels and Energy
Technology Institute is investigating the
properties of hydrogen storage materials
suitable for transport applications such as
cars, high temperature hydrogen storage
materials suitable for heat storage in
concentrated solar power (CSP) applications,
and the properties of hydrogen storage
materials suitable for CSP, static and heavy
transport applications (Curtin University,
2016). Additionally, Curtin’s Hydrogen Storage
Research Group (HSRG) aims to produceviable
new hydrogen storage materials that will
meet the ground transportation and static
applications associated with a transition to a
solar hydrogen economy.
Deakin University’s Institute for Frontier
Materials investigates new battery chemistries
such as metal-air and sodium-based batteries,
as well as improving the performance of
existing technologies. In 2016, Deakin
established the Battery Technology Research
and Innovation Hub (BatTRI-Hub) as a joint
venture with CSIRO. BatTRI-Hub collaborates
with industry groups to develop new battery
technologies for manufacturing in Australia
(Deakin Research, 2016).
Griffith University is developing a forecast-
based energy storage scheduling and
operation system for better load balancing
and management of energy supply from solar
photovoltaics (Bennett, Stewart, & Lu, 2015).
Monash University’s Energy Materials
and Systems Institute (MEMSI) has world-
leading graphene supercapacitor experience,
including spinoff company SupraG. Monash
also has active research programs in
magnesium- and aluminium-based batteries,
and hosts the Energy Program of the ARC
Centre of Excellence for Electromaterials
Science (ACES), which is developing chemical
energy storage technologies including
nitrogen reduction to ammonia.
PMB Defence develops and manufactures
batteries for submarines, including the Collins
Class battery system (PMB Defence, 2017).
Redflow developed the world’s smallest zinc
bromine flow battery, which can be scaled for
a number of applications (Redflow, 2016).
The Queensland University of Technology
have a microgrid facility for trialling energy
storage technologies (Queensland University
of Technology, 2016), and have active research
in graphene supercapacitors, and optimisation
of metal-air and lithium metal phosphate
batteries.
The University of Adelaide’s Australian
Energy Storage Knowledge Bank is an ARENA-
funded energy storage research hub that trials
energy storage technologies, with a focus on
system design and integration.

113
The University of Melbourne’s Melbourne
Energy Institute conducts research into
pumped hydro, hydrogen storage, and liquid
air energy storage.
The University of New South Wales’ (UNSW)
Material Energy Research Laboratory in
Nanoscale (MERLin) is researching metal-
air batteries, sodium-based batteries, and
hydrogen storage, including the EnergyH
Project. This is a crowd-funded project to
support research and commercialisation of
hydrogen-based energy technologies.The
vanadium redox flow battery was invented
at the University of New South Wales by
Emeritus Professor Maria Skyllas-Kazacos, FTSE.
The University of Queensland researchers
investigate energy storage through the
application of a RedFlow zinc bromine flow
battery to their UQ solar array, including
systems integration and monitoring (The
University of Queensland, 2016).
The University of Sydney houses the
Australian Institute for Nanoscale Science
and Technology. A flagship program of
this institute is nano-engineered reversible
energy storage. Gelion, a spin out from the
ihas successfully partnered with London-
headquartered company, Armstrong Energy.
The University of Technology Sydney
Centre for Clean Energy Technology includes
research efforts on advanced battery
technologies, supercapacitors, hydrogen
production and storage, fuel cells, and
graphene applications for energy storage.
The University of Wollongong Institute for
Superconducting and Electronic Materials
is building a pilot-scale sodium battery
production facility to develop battery packs
for testing in residential and industrial settings
(University of Wollongong, 2016). They also
undertake research in lithium-ion air batteries,
potassium-ion batteries, hydrogen storage,
and anode materials.
Vast Solar is an Australian company
undertaking R&D on concentrated solar
thermal power (CSP) technologies. It has an
operational 6 MW pilot scale CSP in NSW
with intentions to expand this to a 30 MW
commercial-scale plant, which would be
Australia’s first (Vast Solar, 2016).
114
APPENDIX 5 EXISTING AND EMERGING RAW RESOURCES
Existing Mineral Resource Opportunities
The following raw resources are used
in the energy storage market.
Lithium
Currently, the most significant raw material
opportunity for Australia is in lithium.
Lithium-ion batteries are one of the most
popular energy storage technologies,
especially for distributed and behind-the-
meter energy storage markets (Navigant
Research, 2016a). Tesla’s intention to
significantly increase production to 35 GWh/
yr of lithium-ion battery cells by 2018 (Tesla,
2017) is but one example demonstrating the
increasing demand for lithium. Kingsnorth
(2015) estimated 10–15 per cent average
annual growth in lithium demand for batteries
between 2015 and 2025, contributing to a
total lithium demand of 350–400 ktpa in 2025
(up from 150–170 ktpa in 2015).
Australia is the world’s largest single supplier
of lithium, with lithium deposits accounting
for just over 11 per cent of the world’s
Economic Demonstrated Resources (EDR),
ranking fourth globally after Chile, China,
and Argentina (Britt et al., 2016). The world’s
largest and highest grade spodumene
(LiAlSi2O6) deposit, Greenbushes, is located
in Western Australia and hosts 82 per cent
of Australia’s lithium EDR (Britt et al., 2016).
This mine is operated by Australian mining
company Talison Lithium.
Lithium Australia has developed a new
process, Sileach, which is predicted to
reduce the cost of processing lithium from
spodumene and recycled lithium (Griffin,
2017). The process also has the potential to
reduce by-products and waste, and has low
energy consumption. The Sileach process is
expected to be operating at a commercial
scale by 2018 (Griffin, 2017).
A new lithium plant to be installed in
Kwinana, Western Australia, will process
concentrate from the Greenbushes mine,
commencing production in late 2018 (Tianqi
Lithium, 2016). This will be exported primarily
for use in lithium battery manufacturing. The
Kwinanaplant is owned by Chinese company
Tianqi Lithium, but is expected to create up to
615 jobs locally (Tianqi Lithium, 2016).
An additional lithium chemical plant is
undergoing commercial and technical
feasibility assessment by Australian companies
Neometals Ltd and Mineral Resources Ltd
(Neometals, 2016). The plant would be located
in the Eastern Goldfields of Western Australia,
and would use lithium from the Mt Marion
mine to produce lithium hydroxide for use in
battery cathode production (Neometals, 2016).
115
Lead
Lead is a component of lead-acid batteries.
Australia has the largest lead EDR, accounting
for 40 per cent of world resources, and is the
second largest producer of lead after China
(US Geological Survey, 2017). There are18 lead
mines operating throughout Australia (Britt et
al., 2016). These include world-class deposits
such as the Broken Hill lead-zinc-silver mine
operated by Australian company Perilya, and
the Cannington mine in northern Queensland,
which is operated by Australian company
South32 and is one of the largest producers of
lead in the world.
Smelting and refining of lead takes place at
Port Pirie, South Australia, operated by Swiss
company Nyrstar. This plant is being upgraded
to an advanced multi metals processing and
recovering facility, with support from the
South Australian Government (Nyrstar, 2015).
Cobalt
Cobalt is commonly used as a cathode in
lithium-ion batteries. In 2015 and 2016, China
was the world’s largest consumer of cobalt,
with almost 80 per cent of its consumption
in the energy storage industry (US Geological
Survey, 2017). This presents a significant
opportunity for Australia, as the national
cobalt resource is 15 per cent of the world’s
resource, second only to Congo (Britt et al.,
2016; US Geological Survey, 2017).
Australian cobalt usually occurs in association
with nickel and is mostly mined in Western
Australia. Emerging mining company Cobalt
Blue, a subsidiary of Broken Hill Prospecting,
plans to capitalise on the demand for cobalt
in the energy storage industry by developing
one of the world’s largest undeveloped cobalt
resources, the Thackaringa Cobalt Project near
Broken Hill in NSW (Macdonald-Smith, 2017).
Nickel
Nickel is used in nickel-based batteries, as well
as some lithium battery chemistries. Australia
has the largest nickel EDR, accounting for
24 per cent of the world’s total resource, and
is ranked second for nickel production after
the Philippines (US Geological Survey, 2017).
Australia’s nickel resources are contained in
both primary and secondary weathered mineral
resources, the majority of which occur in
Western Australia (Britt et al., 2016). BHP Billiton
subsidiary Nickel West operates two of these
nickel mines, as well as the Kalgoorlie nickel
smelter, Kwinana nickel refinery, and Kambalda
nickel concentrator (BHP Billiton, 2005).
Zinc
Zinc is used in flow batteries, such as
Redflow’s zinc bromide battery technology,
and could be used in metal-air batteries.
Australia is the second largest producer of
zinc, and has the largest zinc EDR in the world
at 31 per cent (Britt et al., 2016). Queensland
hosts 56 per cent of the nation’s zinc EDR,
primarily in the Mount Isa Basin (Britt et al.,
2016). Australian companies mining zinc
include Perilya and South32.
Zinc smelters are located in Hobart in
Tasmania, Port Pirie in South Australia, and
Townsville in Queensland. These are operated
by Swiss company Nyrstar and Korean
company Sun Metals. Nyrstar’s Hobart plant
isbeing upgraded to treat more complex
concentrates, with financial support from the
Tasmanian Government (Nyrstar, 2015).
116
Potential Mineral Resource Opportunities
The raw resources listed below have been
identified as essential for emerging energy
storage technologies, and could present
economic opportunities for Australia,
depending on which storage technologies are
commercialised.
Vanadium
Vanadium can be used in redox flow batteries.
Australia’s vanadium EDR ranks fourth in the
world but there is currently no production
(Britt et al., 2016). Australian company
Australian Vanadium Ltd is evaluating their
tenements, including the Gabanintha deposit
in Western Australia, with plans to leverage
opportunities within the emerging battery
storage market. Australian Vanadium has
established a pilot vanadium electrolyte
production plant and has aspirations for
vertically integrated operations (Australian
Vanadium, 2016).
Manganese
Manganese can be used in lithium manganese
oxide, and lithium nickel manganese cobalt
oxide batteries. Australia’s manganese EDR is
the world’s third largest, behind South Africa
and Ukraine (US Geological Survey, 2017).
These resources are located in the Northern
Territory and Western Australia (Britt et
al., 2016), including the South32-owned
Groote Eylandt manganese mine. A fall in
the manganese price led to the suspension
of operations at manganese mines in Bootu
Creek in the Northern Territory and Woodie
Woodie in Western Australia in late 2015,
and early 2016, respectively. Groote Eylandt
manganese ore is shipped to South32’s
Tasmanian Electro Metallurgical Company
manganese alloy plant for beneficiation.
Australian mining equipment, technology,
and services (METS) company Mesa Minerals
Limited has developed and is attempting
to commercialise improved manganese
processing technologies suitable for
producing “consistently high purity, low cost
electrolytic manganese dioxide suitable for use
in the manufacture of both alkaline and lithium-
ion batteries” (Mesa Minerals Limited, 2017).
Aluminium
Aluminium is required for aluminium-air
batteries and as high purity foil for current
collectors in lithium-ion batteries. Australia
has the second largest bauxite (aluminium
ore) EDR in the world after the Republic of
Guinea (US Geological Survey, 2017). In 2015,
Australia was the leading producer of bauxite,
the second largest producer of alumina,
and the sixth largest producer of aluminium
(Britt et al., 2016). Most of Australia’s bauxite
resources are located in Cape York in
Queensland, Gove in the Northern Territory,
and the Darling Range in Western Australia
(Britt et al., 2016).
Historically, Australia has been involved in
many aspects of the aluminium industry,
including refining, smelting, and semi-
fabrication. However, some of these
processing operations have become
economically unviable in recent years due to
operation costs. This led to the closure of the
Kurri Kurri (New South Wales) and Point Henry
(Victoria) aluminium smelters, and the Gove
alumina refinery (Northern Territory) between
2012 and 2014. As a result, several new
operations are shipping bauxite overseas.
Iron
Iron is required for iron-air and nickel-iron
batteries. Australia has the largest iron ore
EDR in the world, with 28 per cent of the
global total (US Geological Survey, 2017).
117
Most of this (89 per cent) is located in the
Pilbara region of Western Australia (Britt et
al., 2016). In addition, Australia has several
large magnetite depositsthat are mined for
contained iron (Britt et al., 2016). The largest
companies producing iron ore in Australia are
BHP Billiton, Fortescue Metals and Rio Tinto.
Magnesium
Certain chemistries of advanced lithium-ion
and metal-air batteries require magnesium.
Australia has the fifth largest EDR of
magnesite (magnesium ore) in the world,
but is only a minor magnesium producer
(US Geological Survey, 2017). Magnesium
is produced at Belgian company Sibelco’s
Queensland mining and processing
operations, and at the Causmag International
(owned by Indian company Excel Colour
and Frits Ltd.) Thuddungra mine in New
South Wales. Queensland hosts the majority
(56 per cent) of Australia’s inferred magnesite
resource, followed by South Australia (35 per
cent), and Tasmania (5 per cent).
Phosphorous
Phosphorus can be used in anodes for
advanced lithium-ion batteries. Australia
has less than 2 per cent of the world’s
EDR of phosphate rock (phosphorate and
guano; Britt et al., 2016). The Georgina Basin
in Queensland and the Northern Territory
contain the majority of Australia’s phosphate
rock and 90 per cent of contained P2O5 (Britt
et al., 2016). Production is also taking place on
Christmas Island and in South Australia.
The Phosphate Hill mine in western
Queensland is the largest source of phosphate
rock in Australia. This mine is operated
by Incitec Pivot Limited, which uses the
phosphate to make fertiliser.
Potassium
Potassium can be used in metal-air batteries
or as potassium nitrate for concentrated
solar thermal energy storage. Canada has the
largest potassium resource (US Geological
Survey, 2017). Australia has only minor
potassium in mineral form (Britt et al., 2016),
which is being explored mainly in Western
Australia by Australian companies such as
Reward Minerals, Rum Jungle Resources,
Salt Lake Potash Ltd, and Parkway Minerals.
However, there are large reserves of
potassium associated with Australia’s solar
salt production from sea water and brines
(e.g. Rio Tinto, 2017). This potassium is treated
as a waste by-product because the cost of
recovery is not currently economic. A change
in the potassium value chain could allow
Australia to use the solar salt resource and
become a large potassium producer using
flow sheets that are used in solar salt fields in
the United States and China.
Graphite
Graphite has the potential to be used for
thermal energy storage, and in graphene-
based batteries. The leading producers of
graphite are China, India, and Brazil (US
Geological Survey, 2017). Turkey has the
largest graphite resource, followed by the
United States (US Geological Survey, 2017).
Australia’s EDR of graphite is relatively minor
compared with other nations, and is located
in Western Australia and South Australia
(Geoscience Australia, 2014). There are no
graphite mining operations in Australia.
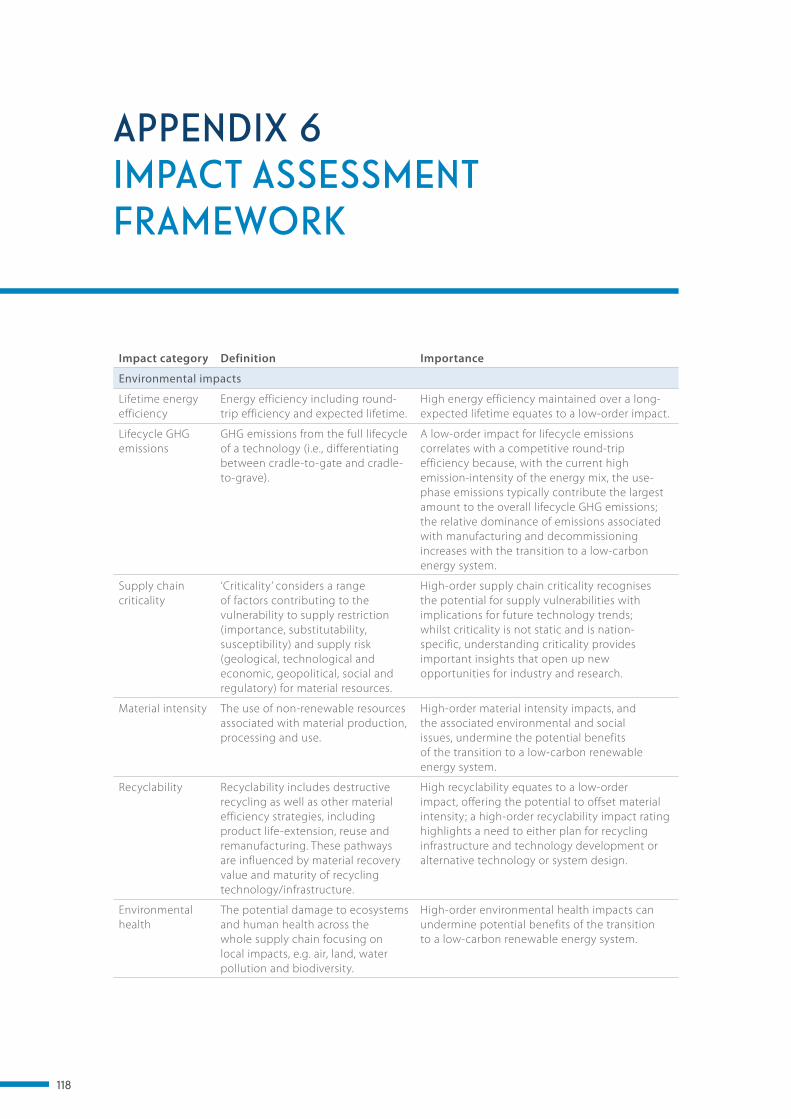
118
APPENDIX 6 IMPACT ASSESSMENT FRAMEWORK
Impact category Definition Importance
Environmental impacts
Lifetime energy efficiency
Energy efficiency including round-trip efficiency and expected lifetime.
High energy efficiency maintained over a long-expected lifetime equates to a low-order impact.
Lifecycle GHG emissions
GHG emissions from the full lifecycle of a technology (i.e., differentiating between cradle-to-gate and cradle-to-grave).
A low-order impact for lifecycle emissions correlates with a competitive round-trip efficiency because, with the current high emission-intensity of the energy mix, the use-phase emissions typically contribute the largest amount to the overall lifecycle GHG emissions; the relative dominance of emissions associated with manufacturing and decommissioning increases with the transition to a low-carbon energy system.
Supply chain criticality
‘Criticality’ considers a range of factors contributing to the vulnerability to supply restriction (importance, substitutability, susceptibility) and supply risk (geological, technological and economic, geopolitical, social and regulatory) for material resources.
High-order supply chain criticality recognises the potential for supply vulnerabilities with implications for future technology trends; whilst criticality is not static and is nation-specific, understanding criticality provides important insights that open up new opportunities for industry and research.
Material intensity The use of non-renewable resources associated with material production, processing and use.
High-order material intensity impacts, and the associated environmental and social issues, undermine the potential benefits of the transition to a low-carbon renewable energy system.
Recyclability Recyclability includes destructive recycling as well as other material efficiency strategies, including product life-extension, reuse and remanufacturing. These pathways are influenced by material recovery value and maturity of recycling technology/infrastructure.
High recyclability equates to a low-order impact, offering the potential to offset material intensity; a high-order recyclability impact rating highlights a need to either plan for recycling infrastructure and technology development or alternative technology or system design.
Environmental health
The potential damage to ecosystems and human health across the whole supply chain focusing on local impacts, e.g. air, land, water pollution and biodiversity.
High-order environmental health impacts can undermine potential benefits of the transition to a low-carbon renewable energy system.
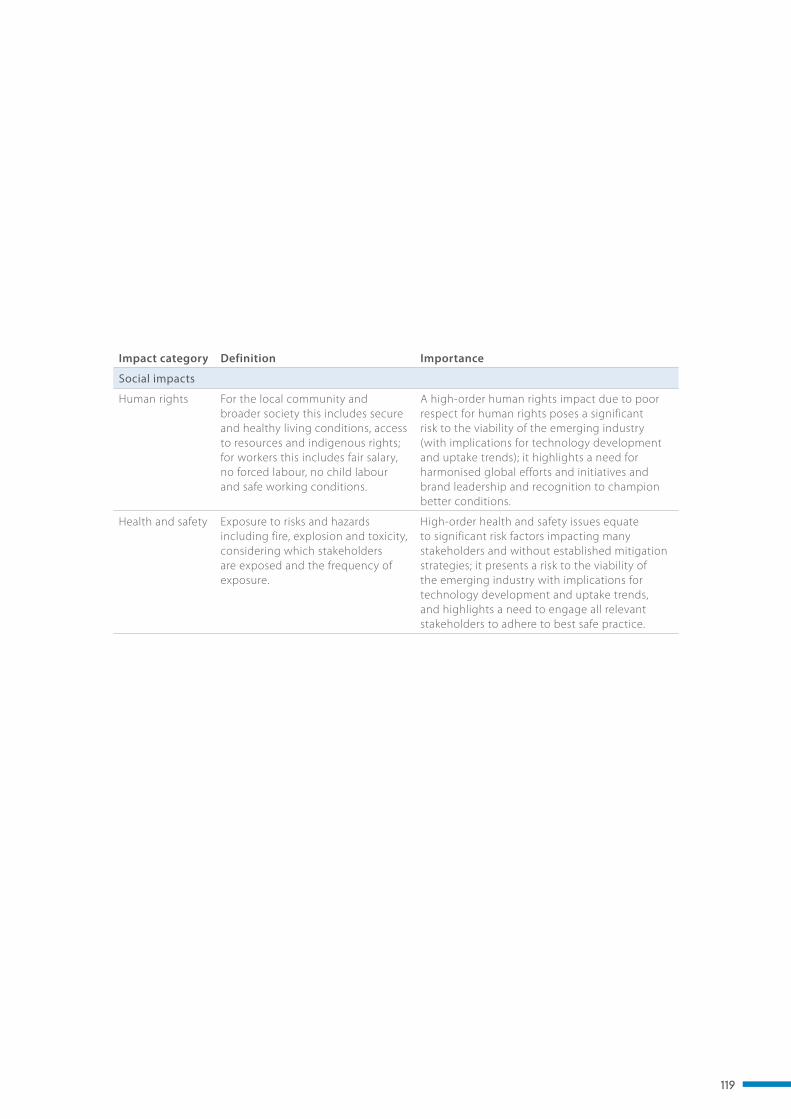
119
Impact category Definition Importance
Social impacts
Human rights For the local community and broader society this includes secure and healthy living conditions, access to resources and indigenous rights; for workers this includes fair salary, no forced labour, no child labour and safe working conditions.
A high-order human rights impact due to poor respect for human rights poses a significant risk to the viability of the emerging industry (with implications for technology development and uptake trends); it highlights a need for harmonised global efforts and initiatives and brand leadership and recognition to champion better conditions.
Health and safety Exposure to risks and hazards including fire, explosion and toxicity, considering which stakeholders are exposed and the frequency of exposure.
High-order health and safety issues equate to significant risk factors impacting many stakeholders and without established mitigation strategies; it presents a risk to the viability of the emerging industry with implications for technology development and uptake trends, and highlights a need to engage all relevant stakeholders to adhere to best safe practice.
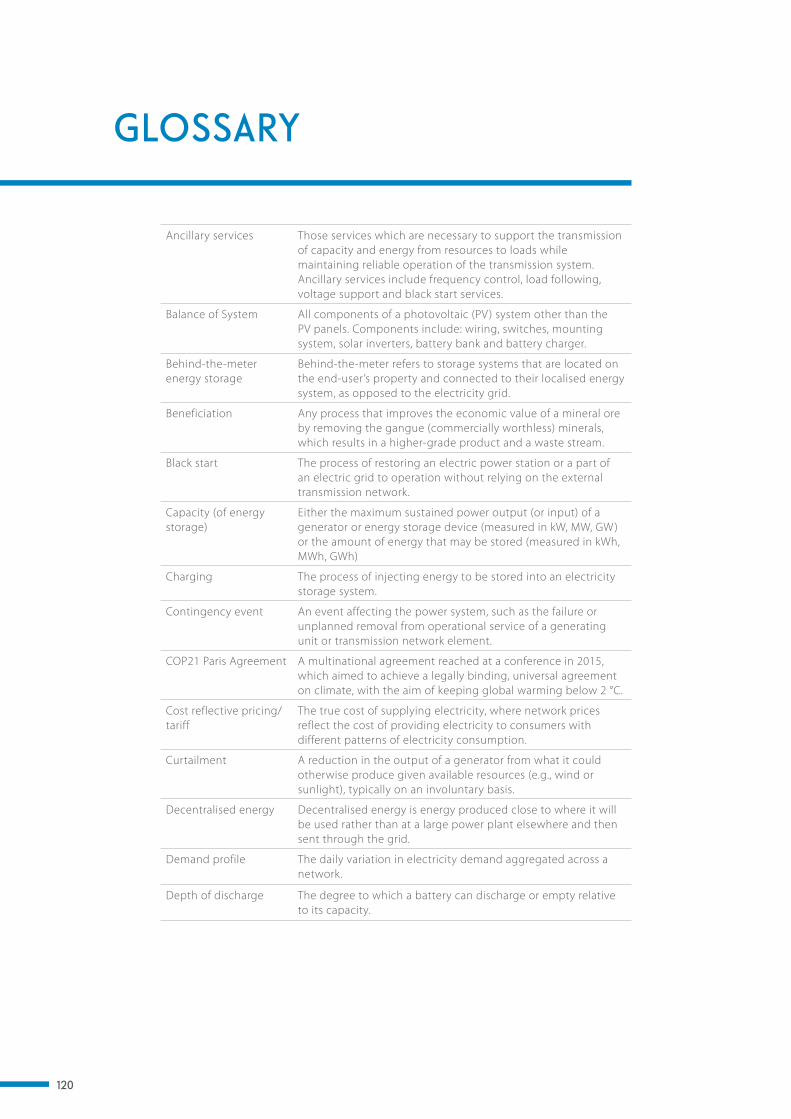
120
Ancillary services Those services which are necessary to support the transmission of capacity and energy from resources to loads while maintaining reliable operation of the transmission system. Ancillary services include frequency control, load following, voltage support and black start services.
Balance of System All components of a photovoltaic (PV) system other than the PV panels. Components include: wiring, switches, mounting system, solar inverters, battery bank and battery charger.
Behind-the-meter energy storage
Behind-the-meter refers to storage systems that are located on the end-user’s property and connected to their localised energy system, as opposed to the electricity grid.
Beneficiation Any process that improves the economic value of a mineral ore by removing the gangue (commercially worthless) minerals, which results in a higher-grade product and a waste stream.
Black start The process of restoring an electric power station or a part of an electric grid to operation without relying on the external transmission network.
Capacity (of energy storage)
Either the maximum sustained power output (or input) of a generator or energy storage device (measured in kW, MW, GW) or the amount of energy that may be stored (measured in kWh, MWh, GWh)
Charging The process of injecting energy to be stored into an electricity storage system.
Contingency event An event affecting the power system, such as the failure or unplanned removal from operational service of a generating unit or transmission network element.
COP21 Paris Agreement A multinational agreement reached at a conference in 2015, which aimed to achieve a legally binding, universal agreement on climate, with the aim of keeping global warming below 2 °C.
Cost reflective pricing/tariff
The true cost of supplying electricity, where network prices reflect the cost of providing electricity to consumers with different patterns of electricity consumption.
Curtailment A reduction in the output of a generator from what it could otherwise produce given available resources (e.g., wind or sunlight), typically on an involuntary basis.
Decentralised energy Decentralised energy is energy produced close to where it will be used rather than at a large power plant elsewhere and then sent through the grid.
Demand profile The daily variation in electricity demand aggregated across a network.
Depth of discharge The degree to which a battery can discharge or empty relative to its capacity.
GLOSSARY
121
Discharging The process of retrieving energy that has been stored in an electricity storage system.
Distributed energy resources (DER)
Smaller power sources and controllable demand that help to manage supply and demand on local networks, and that can be aggregated to provide services to the wider interconnected electricity grid. As the electricity grid continues to modernise, DER such as storage and advanced renewable technologies can help facilitate the transition to a smarter grid.
Distributed energy storage
Smaller power storage systems that store energy later use to help manage supply and demand on local networks.
Embedded networks A small electricity network that distributes and sells electricity exclusively to homes or businesses within a specific property or areas (e.g. an apartment building, shopping complex, caravan park).
Emissions abatement A strategy for mitigating greenhouse gas emissions
Energy efficiency Using less energy to provide the same or improved output.
Energy reliability The ability to meet electrical energy demand (GWh) at all times and in future.
Energy security The ability to deliver near-instantaneous power (GW) as fast frequency response (FFR) to withstand sudden changes or contingency events in electricity generation (e.g. failure of a large generator), transmission (loss of a transmission line) or demand.
Energy Trilemma Comprises:
Energy security, which encompasses factors such as the reliability of infrastructure;
Energy equity, which relates to how accessible and affordable the energy supply is across a population; and
Environmental sustainability, which considers the development of renewable and low carbon sources.
Environmental health The potential damage to ecosystems and human health across the whole supply chain focusing on local impacts, e.g. air, land, water pollution and biodiversity.
Fast Frequency Response (FFR)
The rapid injection of power or relief of loading that helps stop a decline of system frequency during power disturbances.
Feed-in tariffs (FiT ) A payment for electricity fed into the supply grid from a renewable energy source, such as wind or solar panels.
Frequency regulation A centrally managed control process to maintain frequency on a continuous basis.
122
Frequency variation The change over time of the deviation from assigned frequency of a power supply system.
Fringe of grid The parts of an interconnected electricity grid that are furthest from centralised energy sources. Energy storage and other distributed energy resources can have high value in fringe of grid applications, helping to maintain high quality and reliable electricity supply to parts of the network that are more difficult and costly to supply.
Front of meter Front of meter refers to storage systems that are located on the grid side of an end-user’s property.
Gentailer A company that is both an electricity generator and retailer.
Gigawatt (GW) A unit of power equal to one billion (109) watts.
Gigawatt hours (GWh) Unit of energy representing one billion watt hours (equivalent to one million kilowatt hours). Gigawatt hours are often used as a measure of the output of large electricity power stations.
Greenhouse gas (GHG) emissions
Emission of atmospheric gases that contribute to climate change by absorbing infrared radiation.
Hydrogen energy storage direct injection (H2DI)
Direct injection into the gas grid.
HIGH RE High renewable energy.
Inertia The ability of large masses in steam and hydro turbines to keep spinning to maintain a steady frequency. This continued spinning allows sufficient time (seconds to a few minutes) for the system to respond to sudden changes in electricity generation, transmission or demand.
Insolation Incoming solar radiation that reaches the earth’s surface.
Levelised costs of energy storage
A summary measure of the overall competiveness of different generating technologies. They represent the per kilowatt-hour cost (in present dollars) of building and operating a generating plant over an assumed financial life and duty cycle.
Lifecycle GHG emissions
The greenhouse gas (GHG) emissions from the full lifecycle of a technology.
Lifetime energy efficiency
Energy efficiency giving consideration to important statistics including round-trip efficiency and expected lifetime.
Load following Adjusting a power plant’s power output as demand for electricity fluctuates throughout the day.
Load shedding When there is insufficient electricity available to meet demand, it may be necessary to interrupt supply to some areas. This is generally done to prevent the failure of the entire system when unexpectedly high demand or contingency events strain capacity.
Low FiT Representing FiTs less than 10 c/kWh, most offered by retailers and typically post-2014.
123
Material intensity The use of non-renewable resources associated with material production, processing and use.
Micro-grid A localised collection of interconnected electricity loads and sources that can connect to the wider electricity grid and also disconnect from the grid and function autonomously. Also known as a mini-grid.
MID RE A scenario with a renewable energy uptake approximate to Australia’s commitments at COP21.
National Electricity Market (NEM)
The Australian wholesale electricity market that covers the electrically connected states and territories of eastern and southern Australia, and the associated synchronous electricity transmission grid.
Network management The operation, administration, maintenance, and provisioning of networked systems. Network management is essential to command and control practices and is generally done from a network operations centre.
Network service provider
A registered party that owns, leases, or operates an electricity network and is registered.
Off grid Systems that do not use or depend on public utilities and network infrastructure for the supply of electricity.
Path dependency The tendency of a past or traditional practice or preference to continue even if better alternatives are available.
Peaking plant Power plants that generally run only on the few occasions when there is high demand, known as peak demand, for electricity.
Pre-FiT Representing pre-2008 when the PV Rebate Program was available.
Premium FiT Representing FiTs of more than 40 c/kWh, typically from 2009–2012.
Price inelastic A market for an item in which the price of the product has no bearing on the supply or demand for it.
Prosumer A producer and user of electricity. Various types of prosumers exist – residential prosumers produce electricity at home – mainly through solar photovoltaic panels on their rooftops; citizen-led energy cooperatives or housing associations; commercial prosumers whose main business activity is not electricity production, and public institutions such as schools or hospitals.
Pumped hydro energy storage (PHES)
A type of hydroelectric energy storage used by electric power systems for load balancing. The method stores energy in the form of gravitational potential energy of water, pumped from a lower reservoir to a higher one.
Reliability of supply Two factors ensure reliability of supply – system reliability and system security. Ensuring reliability and security is a core function of the Australian Electricity Market Operator and the regulations that underpin that market.
124
Renewable energy certificates
A measurement of renewable energy that can be traded or sold.
Renewable energy integration
Incorporating renewable energy, distributed generation, energy storage, thermally activated technologies, and demand response into the electric distribution and transmission system.
Round-trip efficiency Energy storage consumes electricity (‘charging’), saves it in some manner and then delivers it back (‘discharging’) to the consumer or electricity grid. The ratio of energy put in to the energy delivered back from the storage plant is the round-trip efficiency, expressed as a percentage. The higher the round-trip efficiency, the less energy is lost due to storage and thus the more efficient the system.
Single wire earth return (SWER)
A single wire transmission line that supplies single-phase electric power from an electrical grid to remote areas.
Smart grid An electricity supply network that uses digital communications technology to detect and react to local changes in usage.
Smart meter An electronic device that records consumption of electric energy in intervals of an hour or less and communicates that information at least daily back to the utility for monitoring and billing. Smart meters enable two-way communication between the meter and the central system.
Spinning reserve The extra generating capacity that is available by increasing the power output of generators that are already connected to the power system. For most generators, this increase in power output is achieved by increasing the torque applied to the turbine’s rotor.
Subjective norms The perceived social pressure to engage or not in a particular behaviour.
Supply chain criticality ‘Criticality’ considers a range of factors contributing to the vulnerability to supply restriction (importance, substitutability, susceptibility) and supply risk (geological, technological).
125
Synchronous generation
Generation whose operation is tightly synchronised to the operating frequency of the power system. The rotating parts of synchronous generating units spin at a rate that divides exactly into the system frequency (in Australia) of 50 Hz or 3,000 revolutions per minute.
System reliability The ability of the electricity system to provide an adequate supply of electrical energy (GWh) at all times of the day, the year and in future years.
System security The ability to deliver near-instantaneous power (GW) as fast frequency response (FFR) to withstand sudden changes or contingency events in electricity generation (e.g. failure of a large generator), transmission (loss of a transmission line) or demand.
Tariff The pricing structure a retailer applies to customers for their energy consumption comprises two parts: a fixed charge for daily supply to a premise and a variable charge for the amount of energy used.
UltraBattery A hybrid, long-life lead-acid energy storage device. It combines the fast charging rates of an ultracapacitor technology with the energy storage potential of a lead-acid battery technology in a hybrid device with a single common electrolyte
Ultracapacitor A high-capacity capacitor with values much higher than other capacitors (but lower voltage limits) that bridge the gap between electrolytic capacitors and rechargeable batteries.
Variable generation A generating unit whose output is non-dispatachable due to its fluctuating nature, including, for example, solar generators, wave turbine generators, wind turbine generators and hydro generators without any material storage capability.
Voltage support The ability to produce or absorb reactive power and the ability to maintain a specific voltage level under both steady-state and post-contingency operating conditions subject to the limitations of the resource’s stated reactive capability.
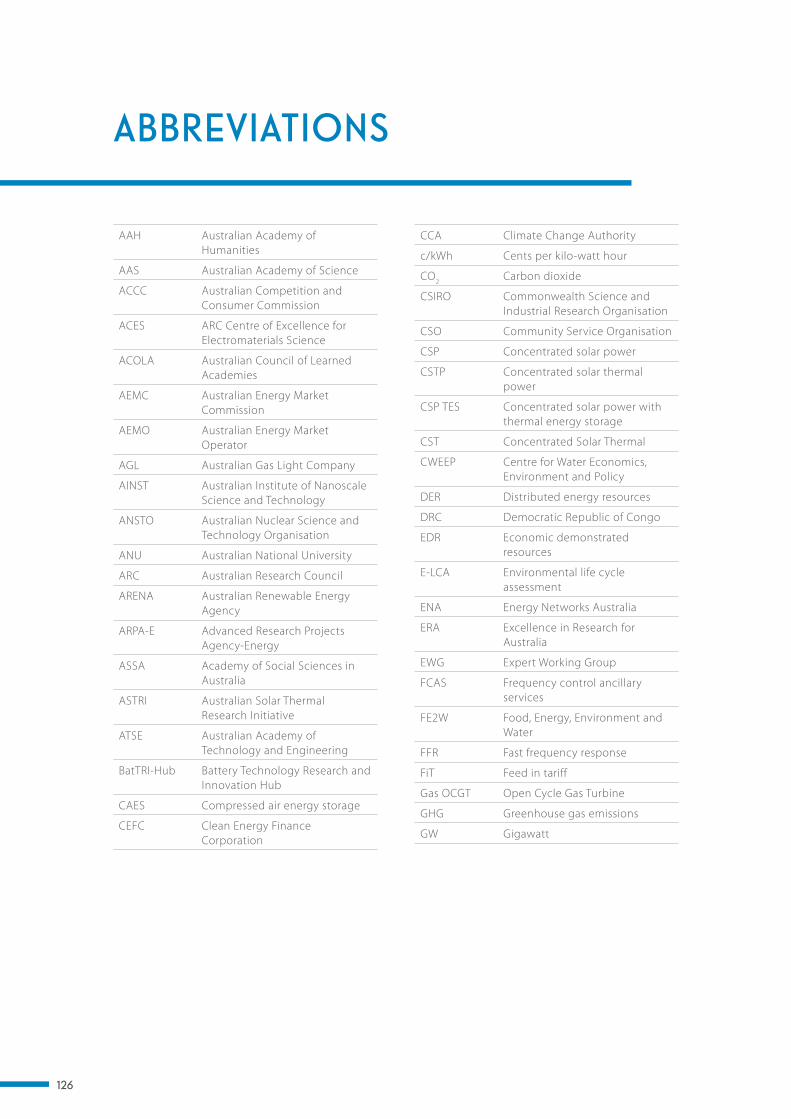
126
AAH Australian Academy of Humanities
AAS Australian Academy of Science
ACCC Australian Competition and Consumer Commission
ACES ARC Centre of Excellence for Electromaterials Science
ACOLA Australian Council of Learned Academies
AEMC Australian Energy Market Commission
AEMO Australian Energy Market Operator
AGL Australian Gas Light Company
AINST Australian Institute of Nanoscale Science and Technology
ANSTO Australian Nuclear Science and Technology Organisation
ANU Australian National University
ARC Australian Research Council
ARENA Australian Renewable Energy Agency
ARPA-E Advanced Research Projects Agency-Energy
ASSA Academy of Social Sciences in Australia
ASTRI Australian Solar Thermal Research Initiative
ATSE Australian Academy of Technology and Engineering
BatTRI-Hub Battery Technology Research and Innovation Hub
CAES Compressed air energy storage
CEFC Clean Energy Finance Corporation
ABBREVIATIONS
CCA Climate Change Authority
c/kWh Cents per kilo-watt hour
CO2 Carbon dioxide
CSIRO Commonwealth Science and Industrial Research Organisation
CSO Community Service Organisation
CSP Concentrated solar power
CSTP Concentrated solar thermal power
CSP TES Concentrated solar power with thermal energy storage
CST Concentrated Solar Thermal
CWEEP Centre for Water Economics, Environment and Policy
DER Distributed energy resources
DRC Democratic Republic of Congo
EDR Economic demonstrated resources
E-LCA Environmental life cycle assessment
ENA Energy Networks Australia
ERA Excellence in Research for Australia
EWG Expert Working Group
FCAS Frequency control ancillary services
FE2W Food, Energy, Environment and Water
FFR Fast frequency response
FiT Feed in tariff
Gas OCGT Open Cycle Gas Turbine
GHG Greenhouse gas emissions
GW Gigawatt
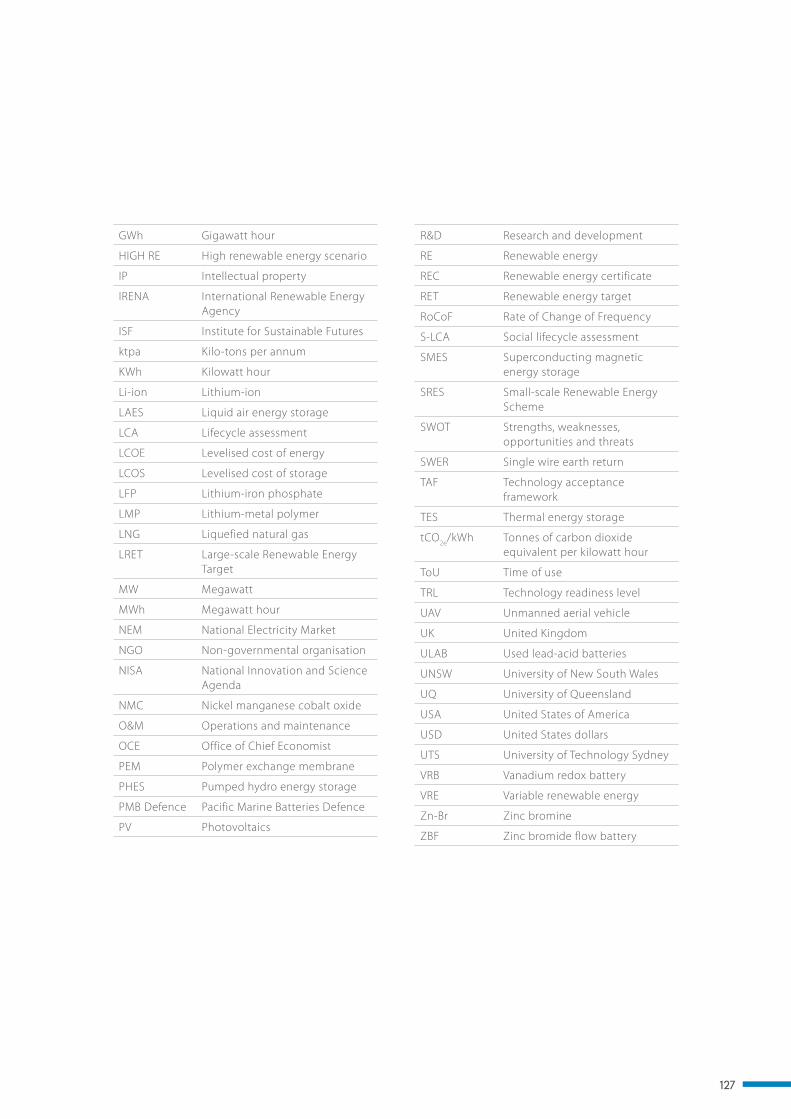
127
GWh Gigawatt hour
HIGH RE High renewable energy scenario
IP Intellectual property
IRENA International Renewable Energy Agency
ISF Institute for Sustainable Futures
ktpa Kilo-tons per annum
KWh Kilowatt hour
Li-ion Lithium-ion
LAES Liquid air energy storage
LCA Lifecycle assessment
LCOE Levelised cost of energy
LCOS Levelised cost of storage
LFP Lithium-iron phosphate
LMP Lithium-metal polymer
LNG Liquefied natural gas
LRET Large-scale Renewable Energy Target
MW Megawatt
MWh Megawatt hour
NEM National Electricity Market
NGO Non-governmental organisation
NISA National Innovation and Science Agenda
NMC Nickel manganese cobalt oxide
O&M Operations and maintenance
OCE Office of Chief Economist
PEM Polymer exchange membrane
PHES Pumped hydro energy storage
PMB Defence Pacific Marine Batteries Defence
PV Photovoltaics
R&D Research and development
RE Renewable energy
REC Renewable energy certificate
RET Renewable energy target
RoCoF Rate of Change of Frequency
S-LCA Social lifecycle assessment
SMES Superconducting magnetic energy storage
SRES Small-scale Renewable Energy Scheme
SWOT Strengths, weaknesses, opportunities and threats
SWER Single wire earth return
TAF Technology acceptance framework
TES Thermal energy storage
tCO2e/kWh Tonnes of carbon dioxide equivalent per kilowatt hour
ToU Time of use
TRL Technology readiness level
UAV Unmanned aerial vehicle
UK United Kingdom
ULAB Used lead-acid batteries
UNSW University of New South Wales
UQ University of Queensland
USA United States of America
USD United States dollars
UTS University of Technology Sydney
VRB Vanadium redox battery
VRE Variable renewable energy
Zn-Br Zinc bromine
ZBF Zinc bromide flow battery
128
REFERENCES
1414 Degrees 2016, ‘1414 Degrees ready to play a part in Adelaide’s path to carbon neutrality [Press release]’, 1414 Degrees, accessed from <http://1414degrees.com.au/1414-degrees-carbon-neutrality-adelaide/>.
1414 Degrees 2017, ‘1414 Degrees’, accessed from <http://1414degrees.com.au/>.
Abe, N, Ishio, J, Katatani, T & Mukai, T 2015, ‘Consumer Perceptions and Acceptance of PV Systems with Energy Storage’, in Solar Energy Storage, pp. 273–288. DOI 10.1016/b978-0-12-409540-3.00012-8.
ACIL Allen 2013, ‘Drivers of Domestic PV Uptake: Characteristics of households with solar photovoltaic systems’, Canberra, accessed from <http://www.acilallen.com.au/cms_files/ACILAllenSolarPhotovoltaic2013.pdf>.
ACT Department of Environment and Planning Directorate 2016, Next Generation Renewables Auction: Local Investment Outcomes.
AECOM 2015, ‘Energy Storage Study: Funding and Knowledge Sharing Priorities’, accessed from <http://arena.gov.au/files/2015/07/AECOM-Energy-Storage-Study.pdf>.
AEMC 2015, ‘Integration of Energy Storage Regulatory Implications Final Report’, accessed from <http://www.aemc.gov.au/Major-Pages/Technology-impacts/Documents/AEMC-Integration-of-energy-storage,-final-report.aspx>.
AEMO 2016a, ‘National Electricity Forecasting Report’, accessed from <https://www.aemo.com.au/-/media/Files/Electricity/NEM/Planning_and_Forecasting/NEFR/2016/2016-National-Electricity-Forecasting-Report-NEFR.pdf>.
AEMO 2016b, ‘Generation Information’, accessed November 18, 2016, from <http://www.aemo.com.au/Electricity/National-Electricity-Market-NEM/Planning-and-forecasting/Generation-information>.
AGL 2016, ‘AGL launches world’s largest solar virtual power plant battery demonstration to benefit customers’, accessed from <https://www.agl.com.au/about-agl/media-centre/article-list/2016/august/agl-launches-world-largest-solar-virtual-power-plant>
Agnew, S & Dargusch, P 2017, ‘Consumer preferences for household-level battery energy storage’, Renewable and Sustainable Energy Reviews, vol. 75, pp. 609–617, accessed from <http://www.sciencedirect.com/science/article/pii/S1364032116307559>.
Aneke, M & Wang, M 2016, ‘Energy storage technologies and real life applications – A state of the art review’, Applied Energy, vol. 179, pp. 350–377, accessed from <http://www.sciencedirect.com/science/article/pii/S0306261916308728>.
Aquion Energy 2016, ‘The advantages of aqueous hybrid ion batteries over lead acid batteries’, accessed from <http://info.aquionenergy.com/hs-fs/hub/147472/file-1571003425-pdf/2_Collateral/AHI_vs_Lead_Acid_White_Paper.pdf?t=1457466044777>.
ARENA 2015, ‘Tesla and Reposit Power Team up with ARENA Supported Storage Solution’, accessed from <http://arena.gov.au/news/tesla-and-reposit-power-team-up-with-arena-supported-storage-solution/>.
ARENA 2017a, ‘Cutting-edge battery tech coming of age with ARENA’s help [Press release]’, accessed from <https://arena.gov.au/media/cutting-edge-battery-tech-coming-of-age-with-arenas-help>.
ARENA 2017b, ‘ARENA and CEFC support solutions for certainty of energy supply, including flexible capacity and large scale energy storage [Press release]’, accessed from <https://arena.gov.au/media/arena-and-cefc-support-solutions-for-certainty-of-energy-supply-including-flexible-capacity-and-large-scale-energy-storage/>.
AusNet Services 2016, ‘AusNet Services launches groundbreaking community mini grid trial [Press release]’, accessed from <https://ausnetservices.com.au/-/media/Files/AusNet/Media-Releases/Final-2016/160419-Mooroolbark-trial-launch--FINAL.ashx>.
129
Australian Academy of Science 2016, ‘Energy for Australia in the 21st Century: The central role of electricity’, accessed from <https://www.science.org.au/support/analysis/reports/future-science-energy-australia-21st-century-central-role-electricity>.
Australian Academy of Technology and Engineering 2013, ‘Green Growth Energy: Industry Opportunities for Australia’, accessed from <https://www.atse.org.au/atse/content/publications/reports/energy/green-growth-energy.aspx>.
Australian PV Institute 2016, ‘Solar Map, funded by the Australian Renewable Energy Agency’, accessed November 28, 2016, accessed from <http://pv-map.apvi.org.au/analyses>.
Australian Research Council 2015, ‘State of Australian University Research 2015–16’, accessed from <http://era2015.arc.gov.au/downloads/ARC03966_ERA_ACCESS_151130.pdf>.
Australian Vanadium 2016, ‘Australian Vanadium prepares for electrolyte processing pilot plant [Press release]’, accessed from <http://australianvanadium.com.au/wp-content/uploads/2015/02/Proactive-251016.pdf>.
Benevenuti, J 2016, ‘Consumer access to external dispute resolution in a changing energy market’, accessed from <https://www.ewon.com.au/page/media-center/news/updates/consumer-access-to-external-dispute-resolution>.
Bennett, CJ, Stewart, RA & Lu, JW 2015, ‘Development of a three-phase battery energy storage scheduling and operation system for low voltage distribution networks’, Applied Energy, vol. 146, pp. 122–134, accessed from <http://www.sciencedirect.com/science/article/pii/S0306261915001841>.
Benoît, C & Mazijn, B 2009, ‘Guidelines for Social Life Cycle Assessment of Products’, accessed from <http://www.unep.fr/shared/publications/pdf/DTIx1164xPA-guidelines_sLCA.pdf>.
BHP Billiton 2005, ‘BHP Billiton Locations Map’, accessed from <http://www.bhpbilliton.com/-/media/bhp/documents/investors/reports/2005/2005bhpbillitonlocationsmap.pdf?la=en>.
Blakers, A 2015, ‘Pumped Hydro Energy Storage and the Renewable Energy Revolution’, accessed from <http://pvsec-26.com/sites/uat.gsipvsec26.site.gsi.sg/files/Paper.pdf>.
Bloomberg New Energy Finance 2016, ‘Six Energy Policy Issues Australia Must Address’, in Australian Clean Energy Summit 2016, Sydney.
Brinsmead, TS, Graham, P, Hayward, J, Ratnam, EL & Reedman, L 2016, ‘Future Energy Storage Trends: An Assessment of the Economic Viability, Potential Uptake and Impacts of Electrical Energy Storage on the NEM 2015–2035’, CSIRO, accessed from <http://www.aemc.gov.au/Major-Pages/Integration-of-storage/Documents/CSIRIO-Future-Trends-Report-2015.aspx>.
Britt, AF, Summerfield, D, Senior, AB, Roberts, D, Kay, P, Hitchman, A, Champion, DC, Huston, D, Sexton, M, Schofield, A, Simpson, R & Smith, ML 2016, ‘Australia’s Identified Mineral Resources 2016’, accessed from <http://www.ga.gov.au/metadata-gateway/metadata/record/100121%0A>.
Bulkeley, H, Powells, G & Bell, S 2016, ‘Smart grids and the constitution of solar electricity conduct’, Environment and Planning A, vol. 48, no. 1, pp. 7–23, accessed from <http://dx.doi.org/10.1177/0308518X15596748>.
Cass, D 2016, ‘Securing renewables: How batteries solve the problem of clean electricity’, accessed from <http://www.tai.org.au/content/securing-renewables-how-batteries-solve-problem-clean-electricity>.
Cavanagh, K, Ward, JK, Behrens, S, Bhatt, AI, Ratnam, EL, Oliver, E & Hayward, J 2015, ‘Electrical energy storage: technology overview and applications’, CSIRO, accessed from <http://www.aemc.gov.au/getattachment/7ff2f36d-f56d-4ee4-a27b-b53e01ee322c/CSIRO-Energy-Storage-Technology-Overview.aspx>.

130
Chan, C & Ma, T 2016, ‘Energy Efficiency Housing in South Australia – A Gap Analysis between the Expected and Actual Benefits’, Procedia Engineering, vol. 164, pp. 446–452, accessed from <http://linkinghub.elsevier.com/retrieve/pii/S1877705816339844>.
China Energy Storage Alliance 2016, ‘Energy Storage White Paper 2016’, accessed from <https://static1.squarespace.com/static/55826ab6e4b0a6d2b0f53e3d/t/57fca7d1d482e9a1f3824d6b/1476176035042/CNESA+White+Paper+2016+ENwm.pdf>.
Claudy, MC, Peterson, M & O’Driscoll, A 2013, ‘Understanding the Attitude-Behavior Gap for Renewable Energy Systems Using Behavioral Reasoning Theory’, Journal of Macromarketing, vol. 33, no. 4, pp. 273–287, accessed from <http://journals.sagepub.com/doi/abs/10.1177/0276146713481605>.
Clean Energy Council 2013, ‘Concentrated Solar Thermal Energy Fact Sheet’, accessed from <https://www.cleanenergycouncil.org.au/dam/cec/technologies/concentrated-solar-thermal/fact-sheets/Concentrated-Solar-Thermal-Fact-Sheet.pdf>.
Clean Energy Council 2015, ‘Australian Energy Storage Roadmap’, accessed from <http://www.cleanenergycouncil.org.au/cec/policy-advocacy/storage-roadmap>.
Clean Energy Finance Corporation 2016, ‘Clean Energy Seed Fund taps into innovation’, accessed from <http://www.cleanenergyfinancecorp.com.au/case-studies/clean-energy-seed-fund-taps-into-innovation.aspx>.
Climate Change Authority 2016, ‘Policy Options for Australia’s Electricity Supply Sector. Special Review Research Report’, accessed from <http://climatechangeauthority.gov.au/reviews/special-review/special-review-electricity-research-report>.
CNBC 2017, ‘South Australia’s plans to fix its power crisis could involve Elon Musk’, accessed from <http://www.cnbc.com/2017/03/13/south-australias-plans-to-fix-its-power-crisis-could-involve-elon-musk.html>.
Colmar Brunton 2015, ‘Queensland Household Energy Survey 2015: Insights Report’, accessed from <https://www.energex.com.au/__data/assets/pdf_file/0003/362685/Queensland-Household-Energy-Survey-2015.pdf>.
Commonwealth of Australia 2016a, ‘Business Research and Innovation Initiative’, accessed from <http://www.innovation.gov.au/page/business-research-and-innovation-initiative>.
Commonwealth of Australia 2016b, ‘Tax incentives for investors | National Innovation and Science Agenda’, accessed from <http://www.innovation.gov.au/page/tax-incentives-investors>.
Consort 2016, ‘Consort Bruny Island Battery Trial’, accessed from <http://brunybatterytrial.org/>.
Coorey, P 2017, ‘Federal Government to pour $A2 billion into major snowy hydro expansion’, Australian Financial Review, accessed from <http://www.afr.com/news/politics/federal-government-to-pour-2bn-into-major-snowy-hydro-expansion-20170315-guyo3r>.
Craig, CA 2016, ‘Energy consumption, energy efficiency, and consumer perceptions: A case study for the Southeast United States’, Applied Energy, vol. 165, pp. 660–669, accessed from <http://www.sciencedirect.com/science/article/pii/S0306261915016426>.
Craig, CA & Allen, MW 2014, ‘Enhanced understanding of energy ratepayers: Factors influencing perceptions of government energy efficiency subsidies and utility alternative energy use’, Energy Policy, vol. 66, pp. 224–233, accessed from <http://www.sciencedirect.com/science/article/pii/S0301421513010975>.
Cross-ministerial Strategic Innovation Promotion Program 2015, Energy Carriers, accessed from <http://www.jst.go.jp/sip/pdf/SIP_energycarriers2015_en.pdf>.
CSIRO 2009, ‘Intelligent Grid: A value proposition for distributed energy in Australia’, accessed from <www.aph.gov.au/DocumentStore.ashx?id=1fb6cc0b-94a5-467a-a5b0-e0a85acd9d36>.
CSIRO 2016a, ‘Stored Energy Integration Facility’, accessed May 16, 2016, from <http://www.csiro.au/en/Research/EF/Areas/Facilities/SEIF>.
CSIRO 2016b, ‘Advanced Manufacturing – A Roadmap for unlocking future growth opportunities for Australia’, accessed from <http://www.csiro.au/en/Do-business/Futures/Reports/Advanced-manufacturing-roadmap>.
CSIROpedia 2005, ‘Supercapacitors’, accessed from <https://csiropedia.csiro.au/supercapacitors/>.

131
Curtin University 2016, ‘Fuels and Energy Technology Institute Research’, accessed from <http://energy.curtin.edu.au/research/>.
Deakin Research 2016, ‘Battery research powers up at Deakin [Press release]’, accessed from <http://www.deakin.edu.au/research/research-news/articles/battery-research-powers-up-at-deakin>.
DECC 2015, ‘Smart Metering Early Learning Project: Consumer survey and qualitative research’, accessed from <https://www.gov.uk/government/uploads/system/uploads/attachment_data/file/407545/5_Smart_Metering_Early_Learning_Project_-_Consumer_survey_and_qual_research_-_Technical_Report_FINAL.pdf>.
Deloitte 2013, ‘Online Consumer Survey Report’, accessed from <http://talkingpower.com.au/wordpress/wp-content/uploads/SAPN-Consumer-Survey-Report-1.0.pdf>.
Deloitte 2016, ‘2016 Global Manufacturing Competitiveness Index’, accessed from <https://www2.deloitte.com/global/en/pages/manufacturing/articles/global-manufacturing-competitiveness-index.html>.
Department of the Environment and Energy 2015, ‘2015-2016 product list’, accessed from <https://www.environment.gov.au/protection/national-waste-policy/product-stewardship/legislation/product-list-2015-16>.
Dunn, R, Lovegrove, K & Burgess, G 2016, ‘A review of ammonia-based thermochemical energy storage for concentrating solar power’, Proceedings of the IEEE, vol. 100, no. 2, pp. 391–400.
Ellingsen, LA-W, Hung, CR, Majeau-Bettez, G, Singh, B, Chen, Z, Whittingham, MS & Stromman, AH 2016, ‘Nanotechnology for environmentally sustainable electromobility’, Nat Nano, vol. 11, no. 12, pp. 1039–1051, accessed from <http://dx.doi.org/10.1038/nnano.2016.237>.
Energetics 2016, ‘Modelling and analysis of Australia’s abatement opportunities. Report to the Department of the Environment’, accessed from <https://www.environment.gov.au/system/files/resources/b8540c8a-8a31-4aba-a8b5-63cc46466e33/files/modelling-and-analysis-australias-2030-abatement-opportunities.pdf>.
Energy Storage Association 2016, ‘Energy Storage Technologies’, accessed September 14, 2016, from <http://energystorage.org/energy-storage/energy-storage-technologies>.
Energy Storage Council 2015, ‘Global Energy Storage Market Overview & Regional Summary Report’, accessed from <https://neca.asn.au/sites/default/files/media/state_nsw/News%20&%20Views/ESC%20Global%20Energy%20Storage%20Report_2015.pdf>.
Ergon Energy 2016, ‘GUSS rolls out to edge of grid customers’, accessed from <https://www.ergon.com.au/about-us/news-hub/talking-energy/technology/ergon-battery-energy-storage-systems-roll-out>.
Essential Services Commission 2016, ‘The Network Value of Distributed Generation: Distributed Generation Inquiry Stage 2 Draft Report’, accessed from <http://www.esc.vic.gov.au/wp-content/uploads/2016/11/Distributed-Generation-Inquiry-Stage-Two-Draft-Report-Network-Value-20161110.pdf>.
European Parliament Think Tank 2016, ‘Electricity “Prosumers”’, accessed February 19, 2017, from <http://www.europarl.europa.eu/thinktank/en/document.html?reference=EPRS_BRI(2016)593518>.
Evergen 2016, ‘Evergen: Our system’, accessed from <https://www.evergen.com.au/our-system/>.
Finkel, A, Moses, K, Munro, C, Effeney, T & O’Kane, M 2016, ‘Preliminary Report of the Independent Review into the Future Security of the National Electricity Market’, accessed from <http://www.environment.gov.au/energy/publications/energy-market-preliminary-report>.
Fitzsimmons, C 2015, ‘How venture capital sucks our best growth companies to the US’, Australian Financial Review, accessed from <http://www.afr.com/business/how-venture-capital-sucks-our-best-growth-companies-to-the-us-20150831-k9zcv>.
Frankel, TC 2016, ‘The Cobalt pipeline’, Washington Post, accessed from <https://www.washingtonpost.com/graphics/business/batteries/congo-cobalt-mining-for-lithium-ion-battery/>.
Gährs, S, Mehler, K, Bost, M & Hirschl, B 2015, ‘Acceptance of Ancillary Services and Willingness to Invest in PV-storage-systems’, Energy Procedia, vol. 73, pp. 29–36, accessed from <http://linkinghub.elsevier.com/retrieve/pii/S1876610215013223>.

132
Gallo, AB, Simões-Moreira, JR, Costa, HKM, Santos, MM & Moutinho dos Santos, E 2016, ‘Energy storage in the energy transition context: A technology review’, Renewable and Sustainable Energy Reviews, vol. 65, pp. 800–822, accessed from <http://www.sciencedirect.com/science/article/pii/S1364032116303562>.
Gannon, M, Swier, G & Gordon, R 2014, ‘Emerging Rate-of-Change-of-Frequency Problem in the NEM: Best-practice Regulatory Analysis of Options’, University of Melbourne, Melbourne, vol. 31.
Gardner, J, Carr-Cornish, SG & Ashworth, PN 2008, ‘Exploring the acceptance of a domestic distributed energy market in Australia’, Australasian Journal of Environmental Management, vol. 15, no. 2, pp. 93–103, accessed from <http://dx.doi.org/10.1080/14486563.2008.9725189>.
Genex Power 2016, ‘The Kidston Hydro Project’, accessed from <http://www.genexpower.com.au/the-kidston-pumped-storage-hydro-project-250mw.html>.
Geoscience Australia 2014, ‘Australia’s Identified Mineral Resources 2013’, Canberra, accessed from <http://dx.doi.org/10.11636/1327-1466.2013>.
Giddens, A 1984, ‘The Constitution of Society: Outline of the Theory of Structuration’, The Polity Press, Cambridge, accessed from <https://books.google.com.au/books?id=x2bf4g9Z6ZwC>.
Goldie, B 2012, ‘“AquaHydrex” company a commercial first for Innovation Campus [Press release]’, accessed from <http://media.uow.edu.au/news/UOW138920.html>.
Graham, P 2017, ‘The solar panel and battery revolution: How will your state measure up?’, CSIRO blog, accessed from <https://blog.csiro.au/solar-panel-battery-revolution-will-state-measure/>.
GreenSync 2016, ‘GreenSync: Our technology’, accessed from <https://www.greensync.com.au/greensync-technology/>
Griffin, A 2017, ‘Investor Presentation – 121 Mining Investment – Cape Town’, accessed from <https://lithium-au.com/wp-content/uploads/2017/02/LIT-Investor-Presentation_06022017.pdf>.
Grünewald, PH, Cockerill, TT, Contestabile, M & Pearson, PJG 2012, ‘The socio-technical transition of distributed electricity storage into future networks—System value and stakeholder views’, Energy Policy, vol. 50, pp. 449–457, accessed from <http://www.sciencedirect.com/science/article/pii/S0301421512006337>.
Hall, NL, Jeanneret, TD & Rai, A 2016, ‘Cost-reflective electricity pricing: Consumer preferences and perceptions’, Energy Policy, vol. 95, pp. 62–72, accessed from <http://www.sciencedirect.com/science/article/pii/S0301421516302117>.
Hargreaves, T, Nye, M & Burgess, J 2013, ‘Keeping energy visible? Exploring how householders interact with feedback from smart energy monitors in the longer term’, Energy Policy, vol. 52, pp. 126–134, accessed from <http://www.sciencedirect.com/science/article/pii/S0301421512002327>.
Hearps, P, Dargaville, R, McConnell, D, Sandiford, M, Forcey, T & Seligman, P 2014, ‘Opportunities for Pumped Hydro Energy Storage in Australia’, accessed from <http://energy.unimelb.edu.au/__data/assets/pdf_file/0007/1526587/Opps-for-pumped-hydro-in-Australia.pdf>.
Hemmati, R & Saboori, H 2016, ‘Emergence of hybrid energy storage systems in renewable energy and transport applications – A review’, Renewable and Sustainable Energy Reviews, vol. 65, pp. 11–23, accessed from <http://www.sciencedirect.com/science/article/pii/S1364032116302374>.
Hess, DJ 2014, ‘Smart meters and public acceptance: comparative analysis and governance implications’, Health, Risk & Society, vol. 16, no. 3, pp. 243–258, accessed from <http://dx.doi.org/10.1080/13698575.2014.911821>.
Hinkley, J, Hayward, JA., McNaughton, R, Edwards, J & Lovegrove, K 2016, ‘Concentrating Solar Fuels Roadmap: Final Report’, CSIRO, accessed from https://arena.gov.au/assets/2016/05/Concentrating-Solar-Fuels-Roadmap-Final-Report-CSIRO.pdf.
Hobman, E V., Frederiks, ER, Stenner, K & Meikle, S 2016, ‘Uptake and usage of cost-reflective electricity pricing: Insights from psychology and behavioural economics’, Renewable and Sustainable Energy Reviews, vol. 57, pp. 455–467, accessed from <http://www.sciencedirect.com/science/article/pii/S1364032115015270>.

133
Huijts, NMA, De Groot, JIM, Molin, EJE & van Wee, B 2013, ‘Intention to act towards a local hydrogen refueling facility: Moral considerations versus self-interest’, Transportation Research Part A: Policy and Practice, vol. 48, pp. 63–74, accessed from <http://www.sciencedirect.com/science/article/pii/S0965856412001450>.
Huijts, NMA, Molin, EJE & Steg, L 2012, ‘Psychological factors influencing sustainable energy technology acceptance: A review-based comprehensive framework’, Renewable and Sustainable Energy Reviews, vol. 16, no. 1, pp. 525–531, accessed from <http://www.sciencedirect.com/science/article/pii/S136403211100428X>.
Huijts, NMA, Molin, EJE & van Wee, B 2014, ‘Hydrogen fuel station acceptance: A structural equation model based on the technology acceptance framework’, Journal of Environmental Psychology, vol. 38, pp. 153–166, accessed from <http://www.sciencedirect.com/science/article/pii/S0272494414000115>.
Hydro Tasmania 2017, ‘Energy Storage – Historical Data’, accessed from <https://www.hydro.com.au/water/energy-data>.
IHS Markit 2016, ‘Global Grid-Connected Energy Storage Capacity to Double in 2016, IHS Markit Says’, accessed from <http://news.ihsmarkit.com/press-release/technology/global-grid-connected-energy-storage-capacity-double-2016-ihs-markit-says>.
Innovation and Science Australia 2016, ‘Performance Review of the Australian Innovation, Science and Research System 2016’, accessed from <https://industry.gov.au/Innovation-and-Science-Australia/Documents/ISA-system-review/index.html>.
International Energy Agency 2014, ‘Technology Roadmap: Energy Storage’, accessed from <https://www.iea.org/publications/freepublications/publication/TechnologyRoadmapEnergystorage.pdf>.
IRENA 2012, ‘Hydropower. Renewable Energy Technologies: Cost Analysis Series’, vol. 1, no. 3/5, accessed from <https://hub.globalccsinstitute.com/sites/default/files/publications/138178/hydropower.pdf>.
IRENA 2017, ‘Rethinking Energy’, accessed from <http://www.irena.org/DocumentDownloads/Publications/IRENA_REthinking_Energy_2017.pdf>.
Jacobs Group 2016, ‘Projections of Uptake of Small-Scale Systems’, Report for the Australian Energy Market Operator, accessed from <https://www.aemo.com.au/-/media/Files/Electricity/NEM/Planning_and_Forecasting/NEFR/2016/Projections-of-uptake-of-smallscale-systems.pdf>.
JM Energy Corporation 2016, ‘Front runner of Lithium Ion Capacitor’, accessed from <http://www.jmenergy.co.jp/en/>.
Jolly, D, Cres, Y & Dimitriadis, S 2015, ‘Vincent Bolloré’s Long Bet on Solid-State Batteries for Electric Cars’, The New York Times, accessed from <https://www.nytimes.com/2015/06/13/business/international/vincent-bollores-long-bet-on-solid-state-batteries-for-electric-cars.html>.
Jülch, V 2016, ‘Comparison of electricity storage options using levelized cost of storage (LCOS) method’, Applied Energy, vol. 183, pp. 1594–1606, accessed from <http://www.sciencedirect.com/science/article/pii/S0306261916312740>.
Kear, G & Chapman, R 2013, ‘‘Reserving judgement’: Perceptions of pumped hydro and utility-scale batteries for electricity storage and reserve generation in New Zealand’, Renewable Energy, vol. 57, pp. 249–261, accessed from <http://www.sciencedirect.com/science/article/pii/S0960148113000402>.
Khalilpour, KR & Vassallo, A 2016, ‘Technoeconomic parametric analysis of PV-battery systems’, Renewable Energy, vol. 97, pp. 757–768, accessed from <http://www.sciencedirect.com/science/article/pii/S0960148116305225>.
Kingsnorth, D 2015, ‘Australia: A Reliable and Diverse Source of Lithium for the Expanding Battery Market’, Paper presented at the Neometals AGM, Perth, accessed from <http://newagemetals.com/wp-content/uploads/LI-DJK-Presentation-160304.pdf>.
Korte, R 2016, ‘ESCRI-SA: Energy Storage for Commercial Renewable Integration – South Australia’, Paper presented at the Electricity Storage Future Forum 2016.
Lamech, F 2014, ‘Self-reporting of symptom development from exposure to radiofrequency fields of wireless smart meters in Victoria, Australia: a case series’, Alternative therapies in health and medicine, vol. 20, no. 6, pp. 28–38, accessed from <https://www.ncbi.nlm.nih.gov/pubmed/25478801>.

134
Liebreich, M 2016, ‘EMEA Future of Energy Summit’, Bloomberg New Energy Finance, London.
Locatelli, G, Palerma, E & Mancini, M 2015, ‘Assessing the economics of large Energy Storage Plants with an optimisation methodology’, Energy, vol. 83, pp. 15–28, accessed from <http://www.sciencedirect.com/science/article/pii/S0360544215000742>.
Lovegrove, K, Watt, M, Passey, R, Pollock, G, Wydre, J, Dowse, J 2012, Realising the Potential of Concentrating Solar Power in Australia (Full Report). Prepared by IT Power (Australia) for the Australian Solar Institute.
Luo, X, Wang, J, Dooner, M, Clarke, J & Krupke, C 2014, ‘Overview of Current Development in Compressed Air Energy Storage Technology’, Energy Procedia, vol. 62, pp. 603–611, accessed from <http://linkinghub.elsevier.com/retrieve/pii/S1876610214034547>.
Macdonald-Smith, A 2017, ‘Conflict-free cobalt play banks of battery boom [Press release]’, Australian Financial Review, accessed from <http://www.afr.com/business/mining/conflictfree-cobalt-play-banks-on-battery-boom-20161221-gtfvh2>.
Macintosh, A & Wilkinson, D 2011, ‘Searching for public benefits in solar subsidies: A case study on the Australian government’s residential photovoltaic rebate program’, Energy Policy, vol. 39, no. 6, pp. 3199–3209, accessed from <http://www.sciencedirect.com/science/article/pii/S030142151100187X>.
Maller, C & Strengers, Y 2013, ‘The global migration of everyday life: Investigating the practice memories of Australian migrants’, Geoforum, vol. 44, pp. 243–252, accessed from <http://www.sciencedirect.com/science/article/pii/S001671851200187X>.
Materials Energy Research Laboratory in Nanoscale 2016, ‘About Hydrogen Energy’, Materials Energy Research Laboratory in nanoscale at UNSW, accessed October 11, 2016, from <http://www.merlin.unsw.edu.au/energyh/about-hydrogen-energy>.
Mesa Minerals Limited 2017, ‘Mesa Minerals Limited’, accessed from <http://mesaminerals.com.au/>.
Minister for Energy Environment Climate Change 2017, ‘Australia’s Largest Battery To Be Built In Victoria [Press release]’, accessed from <http://www.premier.vic.gov.au/australias-largest-battery-to-be-built-in-victoria/>.
Monash University 2016, ‘SupraG – Energy Storage’, accessed from <http://www.monash.edu/industry/success-stories/suprag-energy-storage>.
Nano-Nouvelle 2016, ‘Nano-Nouvelle set to ride lithium battery boom [Press release]’, accessed from <http://nanonouvelle.com.au/nano-nouvelle-set-ride-lithium-battery-boom/>.
Narendrula, R, Nkongolo, KK & Beckett, P 2012, ‘Comparative soil metal analyses in Sudbury (Ontario, Canada) and Lubumbashi (Katanga, DR-Congo)’, Bulletin of Environmental Contamination and Toxicology, vol. 88, no. 2, pp. 187–192.
Navigant Consulting 2009, ‘Job Creation opportunities in Hydropower: Final Report’, accessed from <http://anf5l2g5jkf16p6te3ljwwpk.wpengine.netdna-cdn.com/wp-content/uploads/2010/12/NHA_JobsStudy_FinalReport.pdf>.
Navigant Research 2013, ‘Compressed Air Energy Storage’, accessed from <https://www.navigantresearch.com/media/compressed-air-energy-storage-to-grow-dramatically-over-the-next-decade>.
Navigant Research 2016a, ‘Energy Storage Tracker 3Q16’, accessed from <https://www.navigantresearch.com/research/energy-storage-tracker-3q16>.
Navigant Research 2016b, ‘Energy Storage for the Grid and Ancillary Services’, accessed from <https://www.navigantresearch.com/research/energy-storage-for-the-grid-and-ancillary-services>.
Nelson, T, Simshauser, P & Nelson, J 2012, ‘Queensland Solar Feed-In Tariffs and the Merit-Order Effect: Economic Benefit, or Regressive Taxation and Wealth Transfers?’, Economic Analysis and Policy, vol. 42, no. 3, pp. 277–301, accessed from <http://linkinghub.elsevier.com/retrieve/pii/S0313592612500305>.
Neometals 2016 ‘Partners eye downstream lithium processing for Kalgoorlie [Press release]’, accessed from <http://www.neometals.com.au/reports/682-MM300916.pdf>.
Nyrstar 2015, ‘Nyrstar Hobart secures multi-metals future [Press release]’, accessed from <http://www.nyrstar.com/investors/en/news/Pages/1937558.aspx>.

135
Office of Chief Economist (OCE) 2016, ‘Australian Energy Update 2016’, accessed from <http://www.environment.gov.au/energy/publications/australian-energy-update-2016>.
Origin Energy 2016, ‘Growth of business solar’, paper presented to Australian Clean Energy Summit 2016, Sydney.
Pape, C, Gerhardt, N, Härtel, P, Scholz, A, Schwinn, R, Drees, T, Maaz, A, Sprey, J, Breuer, C, Moser, A, Sailer, F, Reuter, S & Müller, T 2014, Roadmap Speicher – ‘Speicherbedarf Für Erneuerbare Energien – Speicheralternativen – Speicheranreiz – Überwindung Rechtlicher
Hemmnisse’, accessed from <http://www.fvee.de/fileadmin/publikationen/Politische_Papiere_FVEE/14.IWES_Roadmap-Speicher/14_IWES-etal_Roadmap_Speicher_Langfassung.pdf>.
Parra, D, Norman, SA, Walker, GS & Gillott, M 2016, ‘Optimum community energy storage system for demand load shifting’, Applied Energy, vol. 174, pp. 130–143, accessed from <http://www.sciencedirect.com/science/article/pii/S0306261916305438>.
Pawel, I 2014, ‘The Cost of Storage – How to Calculate the Levelized Cost of Stored Energy (LCOE) and Applications to Renewable Energy Generation’, Energy Procedia, vol. 46, pp. 68–77, accessed from <http://linkinghub.elsevier.com/retrieve/pii/S1876610214001751>.
PF Metals 2017, ‘PF Metals: Scrap Metal Recyclers’, accessed from <http://www.pfmetals.com.au/>.
PMB Defence 2017, ‘A World Class Battery for World Class Submariners’, accessed from <http://www.pmbdefence.com/images/PMBCorporateBrochure.pdf>.
Ponrouch, A, Frontera, C, Barde, F & Palacin, MR 2016, ‘Towards a calcium-based rechargeable battery’, Nature Materials, vol. 15, no. 2, pp. 169–172, accessed from <http://dx.doi.org/10.1038/nmat4462>.
Queensland University of Technology 2016, ‘QUT & Sumitomo Electric to trial cutting-edge solar/battery technologies for Qld [Press release]’, accessed from <https://www.qut.edu.au/news/news?news-id=111776>.
Redflow 2017, ‘Flex, Redflow’s Contract Manufacturer – Redflow’, accessed from <http://redflow.com/about-us/commercial-manufacturing-flex/>.
Reid, K 2017, ‘Pumped hydro power station ideal for SA Spencer Gulf site, EnergyAustralia says’, ABC News, accessed from <http://www.abc.net.au/news/2017-02-22/pumped-hydro-power-in-spencer-gulf-energy-australia/8292596>.
Relectrify 2016, ‘Relectrify: Making Energy Storage Affordable’, accessed from <http://www.relectrify.com/>.
Renewable Hydrogen 2014, ‘Submission to Northern Australia Taskforce Green Paper on Developing Northern Australia: Pilbara Renewable Hydrogen Export Project (PRHEP)’, accessed from <http://www.northernaustralia.gov.au/sites/prod.office-northern-australia.gov.au/files/files/renewableh2.docx>.
Reposit 2017, ‘Reposit: Key Features’, accessed from <http://www.repositpower.com/features/>.
Rio Tinto 2017, ‘Lake MacLeod’, accessed from <http://www.riotinto.com/australia/lake-macleod-13453.aspx>.
ROAM Consulting, 2012, ‘ROAM 2012 Pumped Storage Sites (Excel Spreadsheet)’, accessed from <http://www.climatechange.gov.au/>.
Rogers, E 1962, Diffusion of Innovations 1st Edition., The Free Press, New York, NY.
Rogers, E 1995, Diffusion of Innovations 4th Edition., The Free Press, New York, NY.
Romanach, L, Contreras, Z & Ashworth, PN 2013, ‘Australian householders’ interest in the distributed energy market’, CSIRO, accessed from <http://apvi.org.au/wp-content/uploads/2013/11/CSIRO-Survey-Report.pdf>.
SA Power Networks 2016, ‘100th battery installed in Salisbury battery storage trial [Press release]’, accessed from <https://www.sapowernetworks.com.au/public/download.jsp?id=59691>.
Sanderson, H, Hancock, T & Lewis, L 2017, ‘China charging ahead in electric car battery market’, Australian Financial Review, accessed from <http://www.afr.com/business/energy/china-charging-ahead-in-electric-car-battery-market-20170307-gut27y>.
Sandfire Resources NL 2016, ‘Degrussa Solar Power Project’, accessed from <http://www.sandfire.com.au/operations/degrussa/solar-power-project.html>.

136
Scott, FL, Jones, CR & Webb, TL 2014, ‘What do people living in deprived communities in the UK think about household energy efficiency interventions?’, Energy Policy, vol. 66, pp. 335–349, accessed from <http://www.sciencedirect.com/science/article/pii/S0301421513011130>.
Seed Advisory 2011, ‘SRES Uptake: Postcode Demographics and Penetration Rates Final Report to the Australian Energy Markets Commission’, accessed from <http://www.aemc.gov.au/getattachment/a3157c70-7188-44d1-9c5e-dcc2f168d9f1/Seed-Advisory-report-on-the-demographic-characteri.aspx>.
Simpson, G & Clifton, J 2016, ‘Subsidies for residential solar photovoltaic energy systems in Western Australia: Distributional, procedural and outcome justice’, Renewable and Sustainable Energy Reviews, vol. 65, pp. 262–273, accessed from <http://www.sciencedirect.com/science/article/pii/S1364032116302933>.
Simshauser, P & Downer, D 2014, ‘On the inequity of flat-rate electricity tariffs’, AGL Applied Economic and Policy Research, Working Paper No.41, accessed from <http://aglblog.com.au/wp-content/uploads/2014/07/No.41-On-the-inequity-of-tariffs.pdf>.
Singh, S, Jain, S, PS, V, Tiwari, AK, Nouni, MR, Pandey, JK & Goel, S 2015, ‘Hydrogen: A sustainable fuel for future of the transport sector’, Renewable and Sustainable Energy Reviews, vol. 51, pp. 623–633, accessed from <http://www.sciencedirect.com/science/article/pii/S1364032115006127>.
Skyllas-Kazacos, M, Rychick, M & Robins, R 1988, ‘All-vanadium redox battery’, Google Patents, accessed from <https://www.google.com.au/patents/US4786567>.
Solar Reserve 2016, ‘Molten Salt Energy Storage’, accessed from <http://www.solarreserve.com/en/technology/molten-salt-energy-storage>.
Sommerfeld, J, Buys, L, Mengersen, K & Vine, D 2017, ‘Influence of demographic variables on uptake of domestic solar photovoltaic technology’, Renewable and Sustainable Energy Reviews, vol. 67, pp. 315–323, accessed from <http://www.sciencedirect.com/science/article/pii/S1364032116305032>.
Standards Australia 2016, ‘Energy Storage Standards Consultation Paper 1’, accessed from <http://www.standards.org.au/OurOrganisation/News/Documents/Standards%20Australia%20Energy%20Storage%20Consultation%20Paper.pdf>.
Stanes, E, Klocker, N & Gibson, C 2015, ‘Young adult households and domestic sustainabilities’, Geoforum, vol. 65, pp. 46–58, accessed from <http://www.sciencedirect.com/science/article/pii/S0016718515001797>.
Stenner, K, Frederiks, E, Hobman, E & Meikle, S 2015, Australian Consumers Likely Response to Cost-Reflective Electricity Pricing, CSIRO, accessed from <http://cmd.org.au/wp-content/uploads/2015/08/CSIRO-Report-Consumer-Response-to-Cost-Reflective-Electricity-Pricing.pdf>.
Strengers, Y 2013, Smart energy technologies in everyday life: Smart Utopia?, Springer, accessed from <https://link.springer.com/book/10.1057%2F9781137267054>.
St. John, J 2015, ‘SustainX to Merge with General Compression, Abandon Above-Ground CAES Ambitions’, Greentech Media, accessed from <https://www.greentechmedia.com/articles/read/sustainx-to-merge-with-general-compression-abandon-above-ground-caes-ambiti>.
Swan, D 2016, ‘Redback signs UQ solar deal’, accessed from <http://www.theaustralian.com.au/business/technology/redback-signs-uq-solar-deal/news-story/633e90c27c62929f17efdab79e07a011>.
Teske, S, Dominish, E, Ison, N & Maras, K 2016, ‘100 % Renewable Energy for Australia. Decarbonising Australia’s Energy Sector within One Generation. Report Prepared by ISF for GetUp! and Solar Citizens’, accessed from <https://www.uts.edu.au/sites/default/files/article/downloads/ISF_100%25_Australian_Renewable_Energy_Report.pdf>.
Tesla 2017, ‘Battery Cell Production Begins at the Gigafactory’, accessed from <https://www.tesla.com/en_AU/blog/battery-cell-production-begins-gigafactory>.
The University of Queensland 2016, ‘Next-generation Battery Storage [Press release]’, accessed from <http://solar-energy.uq.edu.au/power-systems-engineering>.
Tianqi Lithium 2016, ‘Kwinana Plant [Press release]’, accessed from <http://www.tianqilithium.com/en/base-detail.aspx?ContentID=6&t=59>.

137
Tsurukawa, N, Prakash, S & Manhart, A 2011, ‘Social impacts of artisanal cobalt mining in Katanga, Democratic Republic of Congo’, Öko-Institut eV – Institute for Applied Ecology, Freiburg, accessed from <http://resourcefever.com/publications/reports/OEKO_2011_cobalt_mining_congo.pdf>.
Turner, R 2015, ‘Company aims to capture Pilbara sunlight in hydrogen, ship it to Japan’, ABC News, accessed from <http://www.abc.net.au/news/2015-11-12/renewable-hydrogen-plans-to-export-pilbara-sunlight-to-japan/6935906>.
Tuttle, DP, Gülen, G, Hebner, R, King, CW, Spence, DB, Andrade, J, Wible, JA, Baldwick, R & Duncan, R 2016, ‘The History and Evolution of the U.S. Electricity Industry. White Paper’, UTEI/2016-05-2, accessed from <http://energy.utexas.edu/files/2016/09/UTAustin_FCe_History_2016.pdf>.
UNEP 2011, ‘Recycling Rates of Metals – A Status Report’, A Report of the Working Group on the Global Metal Flows to the International Resource Panel, accessed from <http://internationalresourcepanel.org/reports/recycling-rates-metals>.
University of Wollongong 2016, ‘Research and industry combine to develop renewable energy storage [Press release]’, accessed from <http://media.uow.edu.au/releases/UOW212989.html>.
US Geological Survey 2017, ‘Mineral Commodity Summaries 2017’, accessed from <https://minerals.usgs.gov/minerals/pubs/mcs/2017/mcs2017.pdf>.
Vast Solar 2016, ‘Project Description: Vast Solar’s Commercial Scale Future – Proposed 30MW CSP Plant with Thermal Energy Storage’, accessed from <http://www.vastsolar.com/portfolio-items/vast-solars-commercial-scale-future-proposed-30mw-cst-plant-with-thermal-energy-storage/>.
Vorrath, S 2016a, ‘ANU to map pumped hydro storage potential to back wind and solar [Press release]’, accessed from <http://reneweconomy.com.au/anu-to-map-pumped-hydro-storage-potential-to-back-wind-and-solar-17542/>.
Vorrath, S 2016b, ‘Australian gel-based battery technology attracts major UK finance’, accessed from <http://reneweconomy.com.au/australian-gel-based-battery-technology-attracts-major-uk-finance-73407/>.
WA Country Hour 2017, ‘Remote ammonia plant shipping fertiliser to the world’, ABC News, accessed from <http://www.abc.net.au/news/2016-12-27/remote-ammonia-plant-shipping-fertiliser-to-the-world/8149448>.
Walker, SB, Mukherjee, U, Fowler, M & Elkamel, A 2016, ‘Benchmarking and selection of Power-to-Gas utilizing electrolytic hydrogen as an energy storage alternative’, International Journal of Hydrogen Energy, vol. 41, no. 19, pp. 7717–7731, accessed from <http://www.sciencedirect.com/science/article/pii/S0360319915022570>.
Watt, M 2009, ‘National Survey Report of PV Power Applications in Australia 2008’, International Energy Agency, accessed from <http://apvi.org.au/wp-content/uploads/2014/04/2008-PV-in-Australia-Report.pdf>.
Wilton, A 2017, Australia Behind the Meter PV and Storage Forecast.
Winch, D, Rose, I, Bean, R, Riesz, T & Giacomantonio, C 2012, ‘ROAM Report on Pumped Storage Modelling for AEMO 100 % Renewables Project’, accessed from < http://www.environment.gov.au/system/files/resources/d67797b7-d563-427f-84eb-c3bb69e34073/files/100-percent-renewables-study-modelling-outcomes-report.pdf>.
World Energy Council 2016, ‘World Energy Trilemma Report 2016, Defining Measures to Accelerate the Energy Transition’, accessed from <https://www.worldenergy.org/publications/2016/world-energy-trilemma-2016-defining-measures-to-accelerate-the-energy-transition/>.
Zakeri, B & Syri, S 2015, ‘Electrical energy storage systems: A comparative life cycle cost analysis’, Renewable and Sustainable Energy Reviews, vol. 42, pp. 569–596, accessed from <http://www.sciencedirect.com/science/article/pii/S1364032114008284>.
Zaunbrecher, BS, Bexten, T, Wirsum, M & Ziefle, M 2016, ‘What is Stored, Why, and How? Mental Models, Knowledge, and Public Acceptance of Hydrogen Storage’, Energy Procedia, vol. 99, pp. 108–119, accessed from <http://linkinghub.elsevier.com/retrieve/pii/S1876610216310633>.
ZEN Energy 2017, ‘ZEN Energy Announces the Big Battery Project’, accessed from <https://www.zenenergy.com.au/zen-energy-announces-the-big-battery-project/>.
138
EXPERT WORKING GROUP
Dr Bruce Godfrey FTSE
Bruce’s career has been built in business,
innovation investment, government and
technology development fields. His current
role is as CEO of Australian Scientific
Instruments Pty Ltd, an Australian National
University-owned scientific instruments
manufacturing and exporting company.
He has focused on the advancement
and commercialisation of technologies
(particularly new energy technologies ranging
from solar cells to fuel cells to low emission
coal utilisation), investment readiness of
products and companies, and innovation
policy and programs.
He has served on a number of AusIndustry
and other government agency innovation
funding and advisory committees, including
most recently as Chair of ARENA’s Advisory
Panel until mid-2014. He currently is a
Member of AusIndustry’s R&D Tax Incentive
Committee.
A Fellow of the Australian Academy of
Technology and Engineering (ATSE), he is
Chair of ATSE’s Energy Forum.
Professor Robyn Dowling
Robyn Dowling is Professor of Urbanism and
Associate Dean Research in the University of
Sydney School of Architecture, Design and
Planning, a position she took up in 2016.
Prior to that she was at Macquarie University,
where she initiated the institution’s Bachelor
of Planning program and was the inaugural
head of the Department of Geography
and Planning. She holds a B.Ec (Hons)
from the University of Sydney, and MA and
PhD degrees from the University of British
Columbia, Canada. She is currently an editor
of Transactions, Institute of British Geographers.
Robyn’s research focuses on contemporary
transformations in patterns of life for urban
households, and urban policy responses to
environmental challenges and technological
disruptions. Currently this involves a focus
on energy in commercial office spaces,
technological alternatives to the private car
like car sharing and autonomous vehicles,
and the implementation of smart city
strategies. This research has been supported
by a number of ARC-funded projects and has
appeared in over 80 published papers.
Professor Maria Forsyth FAA
Maria Forsyth graduated with a PhD in
Chemistry from Monash University, Australia
in 1990 and received a Fulbright Postdoctoral
Fellowship to work on lithium and sodium
battery electrolytes at Northwestern
University in Evanston, USA. She returned
to Australian in 1993 and shortly thereafter
joined the Department of Materials
Engineering at Monash University as a
lecturer, being promoted to Professor in 2002.
She moved to Deakin University in 2010 to
start a new group as Chair in Electromaterials
and Corrosion Sciences which has now grown
139
to more than fifty researchers including young
academics, research fellows and PhD students.
Maria currently holds positions as the
Associate Director of the ARC Australian
Centre for Electromaterials Science and
Deputy Director of the Institute for Frontier
Materials at Deakin University. She has served
on several editorial boards and is currently
senior editor for Journal of Physical Chemistry
letters. She was elected to the Australian
Academy of Sciences in 2015 and has received
the Galileo Galilee award for her contributions
to the Polymer Electrolyte and energy storage
field, The Australasian Corrosion Medal for her
work in the corrosion mitigation as well as an
Australian Laureate Fellowship to undertake
research in the area of novel energy materials.
Her research informs the broad field of
materials science, particularly as it applies
to energy storage and corrosion. She is a
leader in the area of transport properties
of materials and has had significant impact
in both theoretical and applied areas.
Specifically, she has focused on developing
novel electromaterials for safe batteries and
environmentally friendly corrosion inhibitors
and on understanding the phenomenon
of charge transport at metal/electrolyte
interfaces and within electrolyte materials.
She is passionate about clean energy,
educating the next generation of scientific
and technological leaders in this area
and facilitating the creation of innovative
technologies in Australia.
Professor R. Quentin Grafton FASSA GAICD
Quentin Grafton is Professor of Economics,
Chairholder UNESCO Chair in Water
Economics and Transboundary Water
Governance and Director of the Centre for
Water Economics, Environment and Policy
(CWEEP) at the Crawford School of Public
Policy at the Australian National University. He
is a Fellow of the Academy of Social Sciences
in Australia, an Adjunct Professor at the
National University of Singapore, Honorary
Professor at Lincoln University and President
(2017–18) of the Australasian Agricultural and
Resource Economics Society.
Quentin previously served as Chief Economist
and Foundation Executive Director of the
Australian Bureau of Resources and Energy
Economics (2011–2013). Quentin currently
serves as the Director of the Food, Energy,
Environment and Water (FE2W) Network
which he helped found in 2014, as Editor in
Chief of Policy Forum.net that was established
in 2014 and as Executive Editor of the Global
Water Forum which he founded in 2010. He
has served in various advisory roles, including
as Chair of the International Geothermal
Expert Group (2013–14) and Chair of the
Social and Economics Reference Panel of
the Murray-Darling Basin Commission (2008–
2009). He has previously contributed advice to
Expert Working Groups of two ACOLA studies:
Project 6 Engineering Energy: Unconventional
Gas Production and Project 7 Australia’s
Agricultural Future.

140
ACKNOWLEDGEMENTS
ACOLA and the Expert Working Group offer their sincere gratitude
to the principal consultants, experts and research assistants who
have contributed to this report, and to the many stakeholders
who provided input to the project through interviews, workshops,
consultation sessions and surveys.
Special thanks go to ARENA for both its financial and in-kind support.
The intellectual contributions made by Dan Sturrock and Scott
Beltman were greatly valued.
ACOLA and the Expert Working Group would like to gratefully
acknowledge the significant contributions of Irene Wyld for her
diligence and support in developing this report.
The ACOLA Secretariat, and in particular Dr Lauren Palmer and Dr
Angus Henderson, also made significant contributions to supporting
the EWG and managing the research project.
Further details of the extensive consultation can be found under
Evidence Gathering. The views expressed in the report do not
necessarily reflect the views of the individuals or organisations listed..
141
142
EVIDENCE GATHERING
Consultants Reports
All input reports can be accessed on the
ACOLA website <www.acola.org.au>.
Phase 1 Report
Banfield, D, Rayner, J. 2016 Energy Storage:
Opportunities and Challenges of Deployment in
Australia, Australian Academy of Technology
and Engineering (ATSE)
Work Package 1
Rutovitz, J, James, G, Teske, S, Mpofu, S,
Usher, J, Morris, T, Alexander, D. 2017 Storage
Requirements for Reliable Electricity in Australia,
UTS: Institute for Sustainable Futures
Work Package 2
Banfield, D, Finch, E, Wenham, M. 2017
Research and Industry Opportunities and
Challenges, Australian Academy of Technology
and Engineering (ATSE)
Work Package 3
Florin, N, Dominish, E. 2017 Sustainability
Evaluation of Energy Storage Technologies, UTS:
Institute for Sustainable Futures
Work Package 4
Ashworth, P, Sehic, S, Harris, J. 2017
Understanding the Socio-economic and Socio-
technical impacts of Energy Storage, The
University of Queensland
Stakeholder Consultations
Work Package 2
Through a combination of interviews
and written responses to discussion
questions, ATSE received input from over 80
representatives and experts from the energy
and energy storage sectors. These included
representatives from government, industry,
finance, research, not-for-profit and industry
associations. Input was also received from
a number of ATSE’s expert Fellows. Direct
input was received from representatives of
the following stakeholder organisations (note
that some interviewees requested that their
organisation was not listed):
1414 Degrees
ACT Government
AECOM
Australian Energy Market Commission (AEMC)
Australian Energy Market Operator (AEMO)
AGL
ARC Centre of Excellence for Electromaterials Science (ACES)
Australian Renewable Energy Agency (ARENA)
Australian Energy Storage Alliance
Australian National University (ANU)
Australian Nuclear Science and Technology Organisation (ANSTO)
Clean Energy Council
CSIRO
Curtin University
Deakin University
Defence Science and Technology Group
Department of Environment and Energy
143
Department of Industry, Innovation and Science
Ecoult
Energy Networks Australia (ENA)
Energy Storage Council
Enirgi Group
Ergon Energy
Gelion
General Electric
Genex Power
Geoscience Australia
GreenSync
Igniteer
Imagine Intelligent Materials
IT Power – Testing the Performance of Batteries
Marchment Hill Consulting
Monash University
Nano Nouvelle
NSW Government
Redback Technologies
Relectrify
Renewable Hydrogen P/L
SA Department of Premier and Cabinet
SA Power Networks
Siemens
Tesla Energy Australia
University of New South Wales (UNSW)
University of Queensland (UQ)
University of Technology Sydney (UTS)
University of Wollongong
VAST Solar
VSun
Yara
Zen Energy
Work Package 3
Interviews were undertaken with a mix
of stakeholders including government
representatives, academics, not-for-profit
organisations and industry (including energy
utilities, manufacturers, retailers).
Government (4)
• Two from Commonwealth and two from State
Industry (6)
• Two recyclers, two utilities, one manufacturer and one retailer
Not-for-profit (5)
• Two energy, two recycling and one environmental organisation
Academics (5)
• Three experts on technology development (batteries, CSP and hydrogen)
• One on material criticality and one on recycling
Work Package 4
Telephone interviews – key representatives
from across the energy sector.
Focus Groups – Brisbane (2) and Melbourne (4)
involving participants across all ages.
A National Survey – 1015 participants.
144
REVIEW PANEL
This report has been reviewed by an independent panel of experts. Members of this review panel
were not asked to endorse the report’s conclusions and findings. The Review Panel members
acted in a personal, not organisational, capacity and were asked to declare any conflicts of interest.
ACOLA gratefully acknowledges their contribution.
Professor John Loughhead OBE FREng FTSE
Professor John Loughhead is Chief Scientific
Adviser at the UK’s Department for Business,
Energy and Industrial Strategy. He was
previously Executive Director of the UK Energy
Research Centre and prior to that Corporate
Vice President of the ALSTOM group. John
is also a Fellow of the Royal Academy of
Engineering and chair of its Engineering
Policy Committee.
John’s professional career has been
predominantly in industrial research and
development for the electronics and electrical
power industries, including advanced, high
power industrial gas turbines, new energy
conversion systems, spacecraft thermal
management, electrical and materials
development for electricity generation and
transmission equipment.
He is Past-President of the UK’s Institution
of Engineering and Technology, Fellow of
the Australian Academy of Technology and
Engineering (ATSE), Fellow of the Royal
Academy of Engineering, Professor of
Engineering at Cardiff University and Fellow of
Queen Mary University of London.
Dr Thomas Maschmeyer FAA FTSE
Dr. Thomas Maschmeyer, is Professor of
Chemistry and serves as Founding Director of
the Australian Institute of Nanoscale Science
and Technology (AINST) and of the Laboratory
of Advanced Catalysis for Sustainability
(School of Chemistry). He is Honorary
Distinguished Professor at the University of
Cardiff and Honorary CSIRO Research Fellow.
In 2011 he was elected (the youngest and as
only the second Australian resident) Foreign
Member of the Academia Europea, as well as
Fellow of the Australian Academy of Sciences
(AAS), the Australian Academy of Technology
and Engineering (ATSE) and the Royal
Australian Chemical Institute (RACI). In 2014
he was elected Fellow of the Royal Society of
NSW (Australia’s oldest scientific society).
He is Founding Chairman of Gelion (2015),
a new high performance battery university
spin-out, and co-founder of the low carbon/
renewables start-ups Ignite Energy Resources
(2006) and Licella (2007) and was one of the
founding Professors of Avantium (2001), a
Dutch High-tech company, now with 160+
employees.
145
He serves on the editorial/advisory boards of
nine international journals and on the external
advisory boards of the top catalysis institute
of both the UK (Cardiff ) and China (Dalian).
He has received many awards, including the
New South Wales Science and Engineering
Award for Renewable Energy Innovation
(2013), the RACI Weickhardt Medal for
Economic Contributions through Chemistry
(2012), the Royal Australian Chemical Institute
(RACI) Applied Research Award (2011), the
Le Févre Prize of the Australian Academy of
Sciences for Outstanding Basic Research in
Chemistry by a Scientists under 40 (2007).
Professor Libby Robin FAHA
Libby Robin FAHA, is Professor at the Fenner
School of Environment and Society, and
Convenor of the Australian Environmental
Humanities Hub. She is Affiliated Professor
of the KTH Royal Institute of Technology
Stockholm and the National Museum of
Australia. She is a member of the Scientific
Advisory Board of the Rachel Carson Center
for Environment and Society, Ludwig-
Maximilian University (LMU). She is a
prizewinning historian with 16 books and
over 100 articles and chapters, including The
Future of Nature (2013, Yale), Natural Resources
and Environmental Justice (2017, CSIRO) and,
forthcoming, The Environment: A History (Johns
Hopkins).


H O R I Z O NS C A N N I N G