Embed Size (px)
DESCRIPTION
The Role of Energy Efficiency in the Northwest. Tom Eckman Manager, Conservation Resources Northwest Power and Conservation Council Presented October 20, 2005 to Maine Public Utilities Commission. To Understand the Present, You Need to Know Our Past. - PowerPoint PPT Presentation
Citation preview

Northwest Power and ConservationCouncil
The Role of Energy EfficiencyThe Role of Energy Efficiencyin the Northwestin the Northwest
Tom EckmanTom Eckman
Manager, Conservation ResourcesManager, Conservation Resources
Northwest Power and Conservation CouncilNorthwest Power and Conservation CouncilPresented October 20, 2005Presented October 20, 2005
toto
Maine Public Utilities CommissionMaine Public Utilities Commission

slide 2
Northwest Power and ConservationCouncil
To Understand the To Understand the Present, You Need to Present, You Need to
Know Our PastKnow Our Past
slide 3
Northwest Power and ConservationCouncil
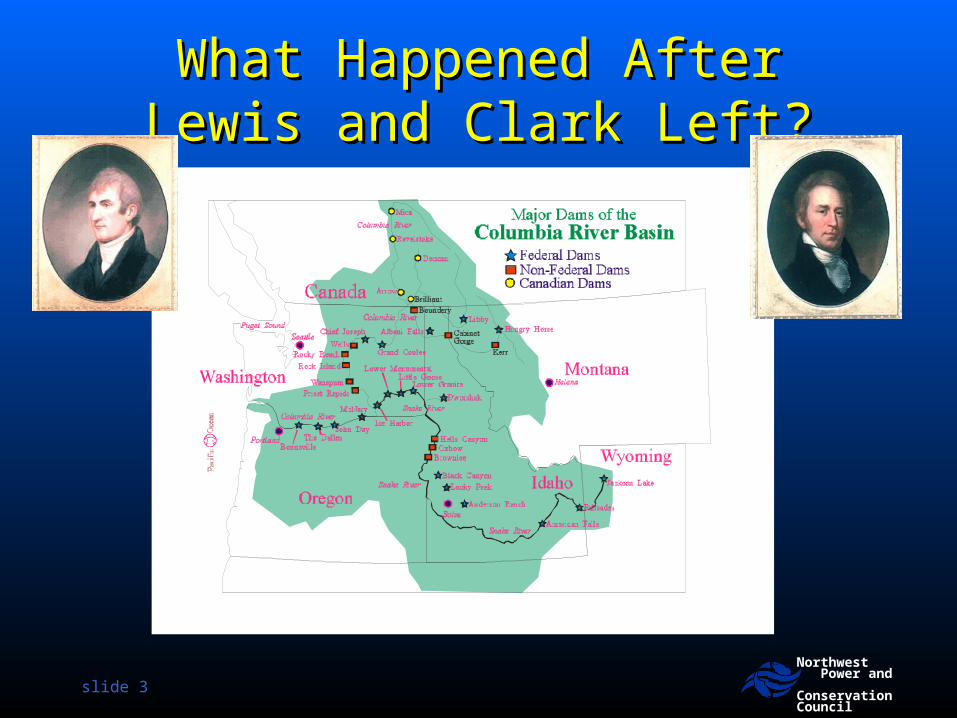
What Happened AfterWhat Happened AfterLewis and Clark Left?Lewis and Clark Left?

slide 4
Northwest Power and ConservationCouncil
The First Three “Eras” of Power The First Three “Eras” of Power Planning in the PNWPlanning in the PNW
““New Deal” Mysticism New Deal” Mysticism (1930-1950)(1930-1950)– Politicians plan using “chicken entrails and crystal Politicians plan using “chicken entrails and crystal
balls” balls” legislatelegislate what’s needed and when what’s needed and when
Engineering Determinism Engineering Determinism (1950- 1970)(1950- 1970)– Engineers, using graph paper and rulers Engineers, using graph paper and rulers scheduleschedule the the
next power plantsnext power plants
Economic Determinism Economic Determinism (1970 to April 27, (1970 to April 27, 1983)1983)– Economist, using price elasticity's Economist, using price elasticity's slowslow the engineer’s the engineer’s
construction schedules construction schedules

slide 5
Northwest Power and ConservationCouncil
Actions Taken in Response to “Engineering Actions Taken in Response to “Engineering and Economic Determinist’s” Forecastsand Economic Determinist’s” Forecasts
Utilities planned and/or started construction Utilities planned and/or started construction on 28 coal and nuclear power plants to be on 28 coal and nuclear power plants to be completed over a 20-year period.completed over a 20-year period.
Native American tribes sued the state and Native American tribes sued the state and federal government over loss of salmonfederal government over loss of salmon
Environmental groups sued Bonneville Environmental groups sued Bonneville Power Administration over plans to turn the Power Administration over plans to turn the Columbia River into “Wave World”Columbia River into “Wave World”

slide 6
Northwest Power and ConservationCouncil
Impact of Actions Taken in Response to Impact of Actions Taken in Response to “Engineering and Economic Determinist’s “Engineering and Economic Determinist’s
Forecasts and PlansForecasts and Plans

slide 7
Northwest Power and ConservationCouncil
Reaction to Impact of Actions Taken in Reaction to Impact of Actions Taken in Response to “Engineering and Economic Response to “Engineering and Economic
Determinist’s Forecasts and PlansDeterminist’s Forecasts and Plans
Terminate or mothball 9 Terminate or mothball 9 nuclear and 5 coal plants at nuclear and 5 coal plants at a cost to the region’s a cost to the region’s consumers of more than $7 consumers of more than $7 billion. billion.
Motivate the region’s Motivate the region’s politicians, utilities, larger politicians, utilities, larger industries and public interest industries and public interest groups to accept the “deals” groups to accept the “deals” embodied in the embodied in the Northwest Northwest Power and Conservation Power and Conservation Planning Act of 1980Planning Act of 1980

slide 8
Northwest Power and ConservationCouncil
The Fourth Era -The Fourth Era - Northwest Power and Conservation Northwest Power and Conservation
Planning Act of 1980 (PL96-501)Planning Act of 1980 (PL96-501) Authorized States of ID, OR, MT and WA to form an Authorized States of ID, OR, MT and WA to form an
“interstate compact” (aka, the “Council”)“interstate compact” (aka, the “Council”) Directed the Council to develop 20-year load forecast and Directed the Council to develop 20-year load forecast and
resource plan (“The Plan”) and update it every 5 - yearsresource plan (“The Plan”) and update it every 5 - years– To assure the region of an To assure the region of an adequate, efficient and reliable power adequate, efficient and reliable power
systemsystem– To provide for the development of the To provide for the development of the least costleast cost mix of resources mix of resources**– Conservation (energy efficiency) deemed highest priority resourceConservation (energy efficiency) deemed highest priority resource
equivalent to generation with a 10% cost advantage over power equivalent to generation with a 10% cost advantage over power generating resourcesgenerating resources
Mandated Mandated public involvementpublic involvement in Council’s planning process. in Council’s planning process.
*Federally mandated “least cost integrated resource planning” on *Federally mandated “least cost integrated resource planning” on regional basisregional basis

slide 9
Northwest Power and ConservationCouncil
Council Planning Process Council Planning Process and Plansand Plans
Longest Running “Integrated Resource Longest Running “Integrated Resource Planning Process” in the CountryPlanning Process” in the Country
Serves as “Regional Lens” through Serves as “Regional Lens” through which state Commissions view utility which state Commissions view utility IRPs (and other resource development)IRPs (and other resource development)– Regional resource adequacyRegional resource adequacy– Resource cost-effectivenessResource cost-effectiveness– Conservation/Efficiency goalsConservation/Efficiency goals

slide 10
Northwest Power and ConservationCouncil
How Has It Worked?How Has It Worked?
Fundamentally changed utility resource planningFundamentally changed utility resource planning– Council’s independent view of resource adequacy in Council’s independent view of resource adequacy in
first Plan led Bonneville and the region’s utilities first Plan led Bonneville and the region’s utilities terminate WNP 4&5, Skagit 1&2 and defer and terminate WNP 4&5, Skagit 1&2 and defer and ultimately cancel WNP 1&3, Creston 1&2, etc.ultimately cancel WNP 1&3, Creston 1&2, etc.
– Oregon and Washington Commissions adopted “least-Oregon and Washington Commissions adopted “least-cost” planning requirements for investor-owned cost” planning requirements for investor-owned utilities, Idaho and Montana have since followedutilities, Idaho and Montana have since followed
– First Council “Action Plan” Called on Bonneville and First Council “Action Plan” Called on Bonneville and the Region’s Utilities to Develop Conservation to the Region’s Utilities to Develop Conservation to Reduce Year 2002 Loads by Between 5 – 17%Reduce Year 2002 Loads by Between 5 – 17%
» Let’s See How This WorkedLet’s See How This Worked

How a PNW Kilowatt-Hour Gets SavedHow a PNW Kilowatt-Hour Gets Saved
Bonneville Power
Administration
PublicUtilities
InvestorOwnedUtilities
Northwest Powerand Conservation
Council
StateRegulatory
Commissions Northwest EnergyEfficiencyAlliance
SBC Admn.SBC Admn.Energy Trust of OregonEnergy Trust of Oregon
& NWEnergy (MT)& NWEnergy (MT)
RegionalTechnical
Forum
End Use ConsumersEnd Use Consumers
Markets, Markets, Codes & Codes & StandardsStandards
= = Policy Policy RecommendationsRecommendations
= Technical= TechnicalRecommendationsRecommendations
= Program= ProgramFundingFunding
= Conservation= ConservationProgramsPrograms
= Market TransformationPrograms/Projects
The “Plan”The “Plan”
= = Policy Policy
= Rate= Rate RevenuesRevenues

slide 12
Northwest Power and ConservationCouncil
PNW Energy Efficiency PNW Energy Efficiency AchievementsAchievements1978 - 20041978 - 2004
0
500
1,000
1,500
2,000
2,500
3,000
Avera
ge M
egaw
att
s
1978 1982 1986 1990 1994 1998 2002
BPA and Utility Programs Alliance ProgramsState Codes Federal Standards
Since 1978 Utility & BPA Since 1978 Utility & BPA Programs, Energy Codes & Programs, Energy Codes & Federal Efficiency Standards Have Federal Efficiency Standards Have Produced Nearly 3000 aMW of Produced Nearly 3000 aMW of Savings.Savings.
slide 13
Northwest Power and ConservationCouncil
So What’s 3000 aMW?So What’s 3000 aMW?
It was enough electricity to serve the It was enough electricity to serve the entireentire states of Maine and New states of Maine and New Hampshire Hampshire plusplus 50% of Vermont in 50% of Vermont in 20042004
It Saved the PNW Region’s Consumers It Saved the PNW Region’s Consumers Nearly Nearly $1.25 billion$1.25 billion in 2004 in 2004

slide 14
Northwest Power and ConservationCouncil
Energy Efficiency Resources Energy Efficiency Resources Significantly Reduced Projected PNW Significantly Reduced Projected PNW
Electricity SalesElectricity Sales
14,000
16,000
18,000
20,000
22,000
24,000
1980 1985 1990 1995 2000
Avera
ge M
eg
aw
att
s
Medium High ForecastMedium LowMedium High Minus ConservationActual

slide 15
Northwest Power and ConservationCouncil
PNW Average Residential Electricity PNW Average Residential Electricity Use/Customer Use/Customer
11000
11500
12000
12500
13000
13500
14000
1990 1992 1994 1996 1998 2000 2002
Avera
ge
Annual U
se/C
ust
om
er
(kW
h)

slide 16
Northwest Power and ConservationCouncil
Energy Efficiency Met Nearly 40% of Energy Efficiency Met Nearly 40% of PNW Regional Firm Sales Growth PNW Regional Firm Sales Growth
Between 1980 - 2003Between 1980 - 2003
61%
39%
Generation Conservation

slide 17
Northwest Power and ConservationCouncil
Regional Utility Energy Efficiency Acquisitions Regional Utility Energy Efficiency Acquisitions Have Helped Balance Loads & ResourcesHave Helped Balance Loads & Resources
0
20
40
60
80
100
120
140
160
1978 1982 1986 1990 1994 1998 2002
Conse
rvati
on A
cquis
itio
ns
(aM
W)
Response to West Coast
Energy CrisisResponse to NW
Recession
Response to “Restructuring
Discussions”
Creating Mr. Toad’s Wild Ride for the PNW’s Energy Efficiency IndustryCreating Mr. Toad’s Wild Ride for the PNW’s Energy Efficiency Industry

slide 18
Northwest Power and ConservationCouncil
Utility Acquired Energy Efficiency Has Been Utility Acquired Energy Efficiency Has Been A BARGAIN!A BARGAIN!
$0
$10
$20
$30
$40
$50
$60
$70
$80
$90
$100
May
-96
Nov-9
6
May
-97
Nov-9
7
May
-98
Nov-9
8
May
-99
Nov-9
9
May
-00
Nov-0
0
May
-01
Nov-0
1
May
-02
Nov-0
2
May
-03
Nov-0
3
May
-04
Nov-0
4
May
-05
Wh
ole
sale
Ele
ctri
city
Pri
ce (
20
00
$/M
WH
)
Levelized Cost of EfficiencyAcquisitionsWholesale Market Price

slide 19
Northwest Power and ConservationCouncil
So Much for the Past, So Much for the Past, What’s AheadWhat’s Ahead

55thth Plan Relies on Conservation and Renewable Plan Relies on Conservation and Renewable
Resources to of Meet Load GrowthResources to of Meet Load Growth**
0
500
1000
1500
2000
2500
3000
3500
4000
4500
5000
2004 2008 2012 2016 2020 2024
Year
Inst
alle
d C
apaci
ty (
MW
or
aM
W)
Conservation (aMW) Wind (MW) DR (MW)SCGTurbine (MW) CCGTurbine (MW) Coal (ICG) (MW)
**Actual future conditions (gas prices, CO2 control, conservation accomplishments) will Actual future conditions (gas prices, CO2 control, conservation accomplishments) will change resource development schedulechange resource development schedule

slide 21
Northwest Power and ConservationCouncil
Cost-Effective and Achievable Cost-Effective and Achievable Conservation Should Meet Over 45% of Conservation Should Meet Over 45% of
PNW Load Growth from 2005-2025*PNW Load Growth from 2005-2025*
0
5 0 0
1 0 0 0
1 5 0 0
2 0 0 0
2 5 0 0
3 0 0 0
C o s t - E ff e c t iv e P o t e n t ia l( a M W in 2 0 2 5 )
A g r i c u l t u r a l S e c t o r - 8 0 a M W
N o n - D S I I n d u s t r i a l S e c t o r - 3 5 0 a M W
C o m m e r c i a l S e c t o r N o n - B u i l d i n g M e a s u r e s - 4 2 0 a M W
H V A C , E n v e l o p e & R e f r i g e r a t i o n - 3 7 5 a M W
N e w C o m m e r c i a l B u i l d i n g L i g h t i n g - 2 2 0 a M W
E x i s t i n g C o m m e r c i a l B u i l d i n g s L i g h t i n g - 1 3 0 a M W
R e s i d e n t i a l S p a c e C o n d i t i o n i n g - 2 4 0 a M W
R e s i d e n t i a l L i g h t i n g - 5 3 0 a M W
R e s i d e n t i a l W a t e r H e a t i n g - 3 2 5 a M W
R e s i d e n t i a l A p p l i a n c e s - 1 4 0 a M W
*Medium Load Forecast *Medium Load Forecast Loads & Market PricesLoads & Market Prices

slide 22
Northwest Power and ConservationCouncil
Regional Near-Term Conservation Regional Near-Term Conservation Targets (2005-2009) = 700 aMWTargets (2005-2009) = 700 aMW
0
20
40
60
80
100
120
140
160
2005 2006 2007 2008 2009
Reso
urc
e (
aM
W)
Residential - Lost Opportunity
Commercial - Lost Opportunity
I rrigated Agriculture - Non LostOpportunity
Industrial - Non Lost Opportunity
Residential - Non Lost Opportunity
Commercial - Non Lost Opportunity

Northwest Power and ConservationCouncil
Why Should We?Why Should We?
What’s Behind the 5What’s Behind the 5thth Plan’s Plan’s Conservation Targets?Conservation Targets?

PNW Portfolio Planning – Scenario Analysis on SteroidsPNW Portfolio Planning – Scenario Analysis on Steroids
0%
2%
4%
6%
8%
10%
12%
14%
16%
0.0% 1.0% 2.0% 3.0% 4.0% 5.0%
Annual Load Growth
Pro
bab
ilit
y (
%)
0%
2%
4%
6%
8%
10%
12%
14%
16%
18%
0% 1% 2% 3% 4% 5%
Real Natural Gas Escalation Rate% )
Pro
bab
ilit
y (
%)
0%
5%
10%
15%
20%
25%
30%
3.27% 3.80% 3.85% 3.93% 2.50%
Nominal Annual Electricity Price Escalation Rate
Pro
babilit
y (
%)
0
20
40
60
80
100
120
98
467
705
842
1,06
9
1,19
1
1,28
3
1,33
5
1,35
3
1,37
3
1,65
0
Resource Potential
Levelized C
ost
0%2%4%6%8%
10%12%14%16%18%20%
Carbon Tax Implementation Date
Pro
bab
ilty
(%
)
0
5000
10000
15000
20000
25000
1925 1930 1935 1940 1945 1950 1955 1960 1965 1970 1975
Hydrosytem Year
Cap
acit
y (
MW
)
0%2%4%6%8%
10%12%14%16%18%20%
Pro
bab
ilit
y
$0 $6 $12 $18 $24 $30 $36
Carbon Tax
Frequency Chart
Dollars
Mean = $689.000
.011
.022
.032
.043
0
10.75
21.5
32.25
43
($3,509) ($1,131) $1,247 $3,625 $6,003
1,000 Trials 1,000 Displayed
Portfolio Portfolio Analysis Analysis ModelModel
$35,500
$36,000
$36,500
$37,000
$37,500
$23,500 $24,000 $24,500 $25,000
NPV System Risk (2004$Millions)
NP
V S
yste
m C
ost
(20
04
$M
illio
ns)
Efficient FrontierEfficient Frontier
NPV System Cost

slide 25
Northwest Power and ConservationCouncil
Plans Along the Efficient Frontier Permit Plans Along the Efficient Frontier Permit Trade-Offs of Costs Against RiskTrade-Offs of Costs Against Risk
$35,500
$36,000
$36,500
$37,000
$37,500
$23,600 $23,800 $24,000 $24,200 $24,400 $24,600
NPV System Cost (Millions)
NPV
Syst
em
Ris
k (
Mill
ions)
Least Risk
Least Cost
slide 26
Northwest Power and ConservationCouncil
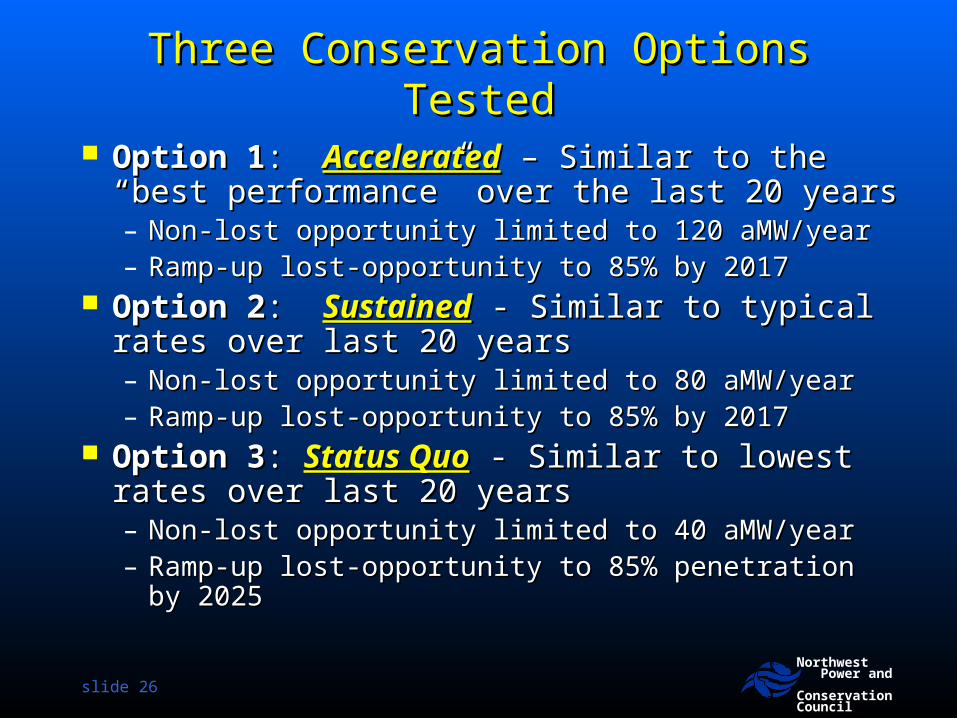
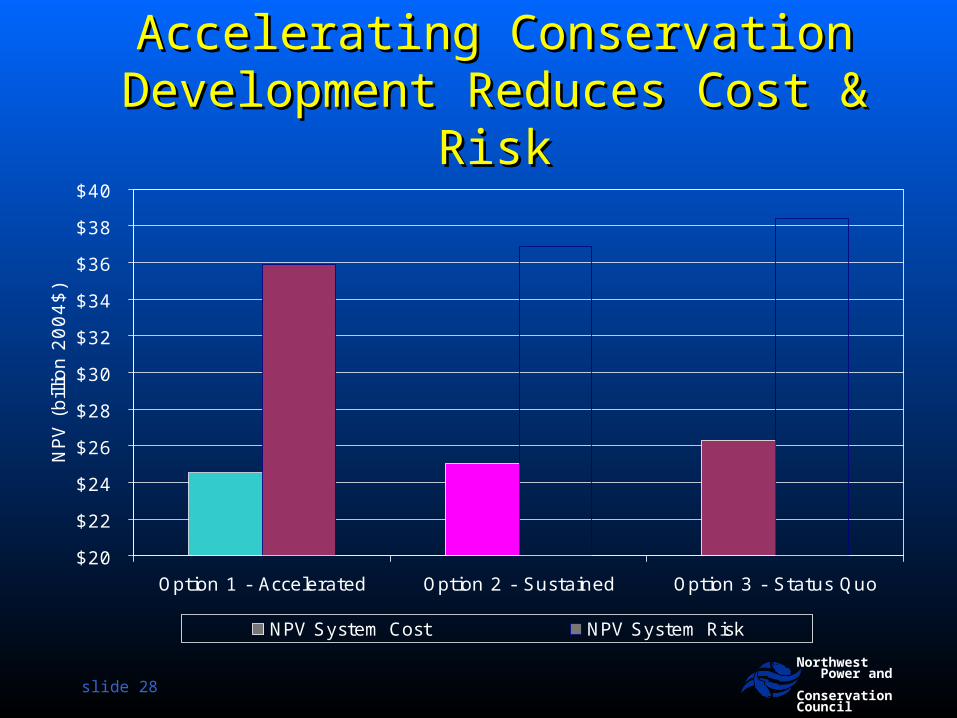
Three Conservation Options TestedThree Conservation Options Tested
Option 1Option 1: : AcceleratedAccelerated – Similar to the “best – Similar to the “best performance” over the last 20 yearsperformance” over the last 20 years– Non-lost opportunity limited to 120 aMW/yearNon-lost opportunity limited to 120 aMW/year– Ramp-up lost-opportunity to 85% by 2017Ramp-up lost-opportunity to 85% by 2017
Option 2Option 2: : SustainedSustained - Similar to typical rates over - Similar to typical rates over last 20 yearslast 20 years– Non-lost opportunity limited to 80 aMW/yearNon-lost opportunity limited to 80 aMW/year– Ramp-up lost-opportunity to 85% by 2017Ramp-up lost-opportunity to 85% by 2017
Option 3Option 3: : Status QuoStatus Quo - Similar to lowest rates over - Similar to lowest rates over last 20 yearslast 20 years– Non-lost opportunity limited to 40 aMW/yearNon-lost opportunity limited to 40 aMW/year– Ramp-up lost-opportunity to 85% penetration by 2025Ramp-up lost-opportunity to 85% penetration by 2025
slide 27
Northwest Power and ConservationCouncil
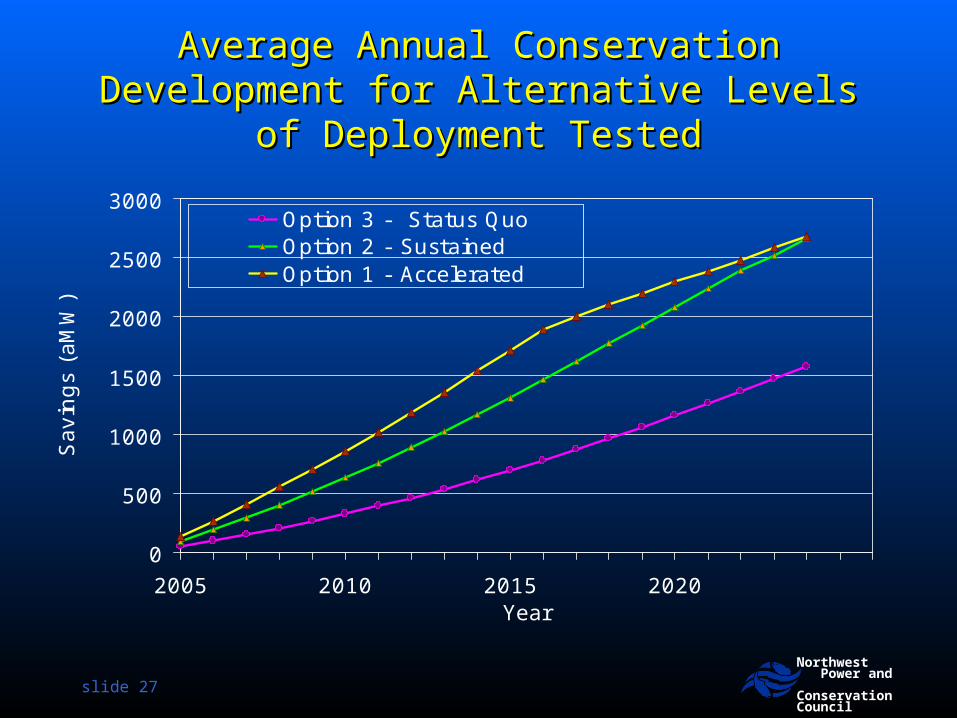
Average Annual Conservation Average Annual Conservation Development for Alternative Levels of Development for Alternative Levels of
Deployment TestedDeployment Tested
0
500
1000
1500
2000
2500
3000
2005 2010 2015 2020Year
Savin
gs
(aM
W)
Option 3 - Status QuoOption 2 - SustainedOption 1 - Accelerated
slide 28
Northwest Power and ConservationCouncil
Accelerating Conservation Accelerating Conservation Development Reduces Cost & Development Reduces Cost &
RiskRisk
$20
$22
$24
$26
$28
$30
$32
$34
$36
$38
$40
Option 1 - Accelerated Option 2 - Sustained Option 3 - Status Quo
NPV
(bill
ion
20
04
$)
NPV System Cost NPV System Risk

slide 29
Northwest Power and ConservationCouncil
WECC Carbon Dioxide Emissions WECC Carbon Dioxide Emissions Reductions for Alternative Reductions for Alternative
Conservation TargetsConservation Targets
0
10
20
30
40
50
60
70
80
Mill
ion T
ons
over
20 y
ears
Option 1 - Accelerated Option 2 - Sustained Option 3 - Status Quo

slide 30
Northwest Power and ConservationCouncil
Why Energy Efficiency Reduces Why Energy Efficiency Reduces System Cost and RiskSystem Cost and Risk
It’s A Cheap (avg. 2.4 cents/kWh TOTAL It’s A Cheap (avg. 2.4 cents/kWh TOTAL RESOURCE COST) Hedge Against Market RESOURCE COST) Hedge Against Market Price SpikesPrice Spikes
It has value even when market prices are It has value even when market prices are low low
It’s Not Subject to Fuel Price RiskIt’s Not Subject to Fuel Price Risk It’s Not Subject to Carbon Control RiskIt’s Not Subject to Carbon Control Risk It’s Significant Enough In Size to Delay It’s Significant Enough In Size to Delay
“build decisions” on generation“build decisions” on generation

slide 31
Northwest Power and ConservationCouncil
The Plan’s Targets Are A The Plan’s Targets Are A Floor, Not a CeilingFloor, Not a Ceiling
When we took the “ramp rate” constraints off the portfolio model it developed
1500 aMW1500 aMW
of Energy Efficiency in 2005

slide 32
Northwest Power and ConservationCouncil
Where Are We Getting Where Are We Getting The Savings?The Savings?

slide 33
Northwest Power and ConservationCouncil
Sources of Savings by SectorSources of Savings by Sector
Industrial 350 aMW
12%
Irrigation 80 aMW3%
Commercial 1105 aMW
39%
Residential 1340 aMW
46%

Major Sources of Efficiency ResourceMajor Sources of Efficiency Resource
1.7 1.7
1.2
4.3
1.5
3
5.2
3.4
1.8
3.4
2.2
0
100
200
300
400
500
600
700
Res. C
FLs
Indu
stria
l
New C
om. L
ight
ing
HP W
ater
Hea
ters
AC/DC C
onve
rter
s
New C
om. H
VAC
Res. C
loth
es W
ashe
rs
Exist
. Com
. HVAC
Exist
. Com
. Light
ing
Exist
. Com
. Equ
ipm
ent
Exist
.Com
. Inf
rastru
ctur
e
Ach
ieve
able
Pote
nti
al (
MW
a)
0.0
1.0
2.0
3.0
4.0
5.0
6.0
Ave
rage
Leve
lized
Cost
(C
ents
/kW
h)

slide 35
Northwest Power and ConservationCouncil
Implementation Implementation ChallengesChallenges

slide 36
Northwest Power and ConservationCouncil
Plan Plan Conservation Action ItemsConservation Action Items
Ramp up “Lost Opportunity” conservationRamp up “Lost Opportunity” conservation» Goal => 85% penetration in 12 years Goal => 85% penetration in 12 years » 10 to 30 MWa/year 2005 through 200910 to 30 MWa/year 2005 through 2009
Accelerate the acquisition of “Non-Lost Accelerate the acquisition of “Non-Lost Opportunity” resourcesOpportunity” resources
» Return to acquisition levels of early 1990’sReturn to acquisition levels of early 1990’s» Target 120 MWa/year next five yearsTarget 120 MWa/year next five years
Employ a mix of mechanismsEmploy a mix of mechanisms» Local acquisition programs (utility, SBC Administrator & Local acquisition programs (utility, SBC Administrator &
BPA programs)BPA programs)» Regional acquisition programs and coordinationRegional acquisition programs and coordination» Market transformation venturesMarket transformation ventures

slide 37
Northwest Power and ConservationCouncil
The Total Resource Acquisition Cost* of The Total Resource Acquisition Cost* of 55thth Plan’s Conservation Targets Plan’s Conservation Targets
2005 – 2009 = $1.64 billion2005 – 2009 = $1.64 billion
$0
$50
$100
$150
$200
$250
$300
$350
$400
2005
2006
2007
2008
2009
Tota
l R
eso
urc
e C
ost
s(M
illio
ns
20
00
$)
Residential - Lost Opportunity
Commercial - Lost Opportunity
I rrigated Agriculture - Non LostOpportunity
Industrial - Non Lost Opportunity
Residential - Non Lost Opportunity
Commercial - Non Lost Opportunity
*Incremental capital costs to install measure plus program administration costs estimated at 20% of capital.

slide 38
Northwest Power and ConservationCouncil
PNW Utilities Now Invests Less Than 2% of PNW Utilities Now Invests Less Than 2% of Their Retail Sales Revenues in Energy Their Retail Sales Revenues in Energy
EfficiencyEfficiency
0.0%
1.0%
2.0%
3.0%
4.0%
5.0%
6.0%
1991 1992 1993 1994 1995 1996 1997 1998 1999 2000 2001 2002 2003 2004
Con
serv
ati
on
In
vest
men
ts (
mill
ion
20
00
$)

Meeting the Plan’s Efficiency Targets Will Meeting the Plan’s Efficiency Targets Will Likely Require Increased Regional InvestmentsLikely Require Increased Regional Investments
$0
$50
$100
$150
$200
$250
$300
$350
Average 1991-2004
Average 2001-2004
Estimated UtilityCost of 2005
Target
Estimated UtilityCost of 2009
Target
Uti
lity I
nvest
men
ts (
mill
ion
20
00
$)
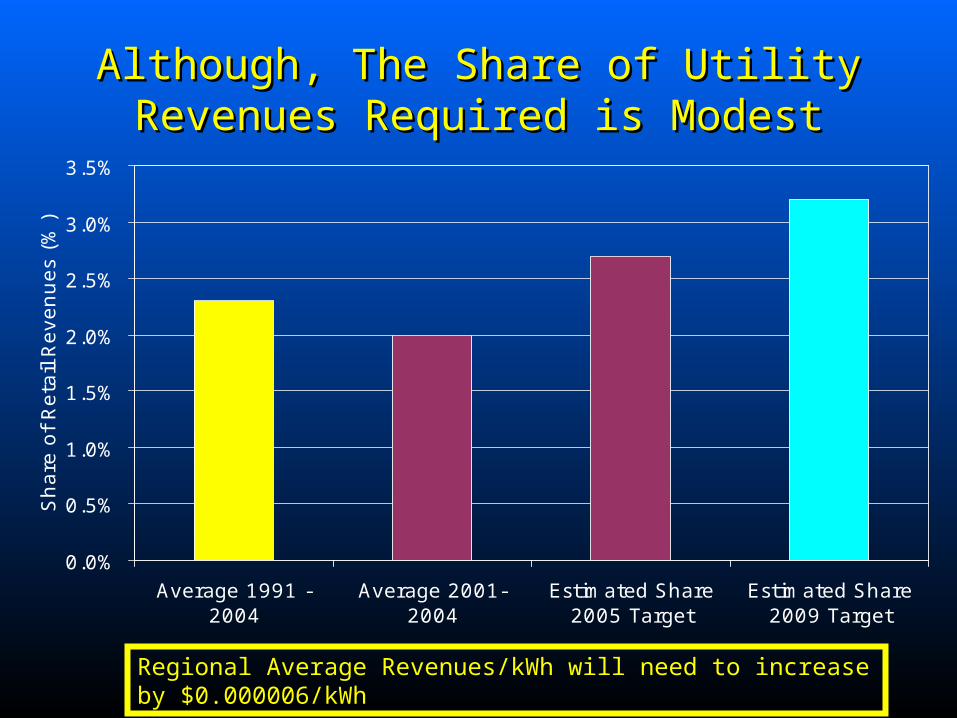
Although, The Share of Utility Although, The Share of Utility Revenues Required is ModestRevenues Required is Modest
0.0%
0.5%
1.0%
1.5%
2.0%
2.5%
3.0%
3.5%
Average 1991 -2004
Average 2001-2004
Estimated Share2005 Target
Estimated Share2009 Target
Sh
are
of
Reta
il R
even
ues
(%)
Regional Average Revenues/kWh will need to increase by $0.000006/kWh

slide 41
Northwest Power and ConservationCouncil
SummarySummary The 5th Plan’s Goal IsThe 5th Plan’s Goal Is To Make The To Make The
InefficientInefficient Use of Electricity . . . Use of Electricity . . .– ImmoralImmoral– IllegalIllegal– UnprofitableUnprofitable
If We Fail Both If We Fail Both CostsCosts and and Risk Risk Will Be HigherWill Be Higher

slide 42
Northwest Power and ConservationCouncil
Backup SlidesBackup Slides

slide 43
Northwest Power and ConservationCouncil
Cumulative 1978 - 2004 Efficiency Cumulative 1978 - 2004 Efficiency Achievements by SourceAchievements by Source
Alliance Programs185 aMW
6%
State Codes560 aMW
19%
Federal Standards545 aMW
19%
BPA and Utility Programs1635 aMW
56%

slide 44
Northwest Power and ConservationCouncil
Total PNW Annual Energy Efficiency Total PNW Annual Energy Efficiency Achievements Have Been Growing, Largely Due Achievements Have Been Growing, Largely Due To The Impact of Energy Codes and StandardsTo The Impact of Energy Codes and Standards
0
50
100
150
200
250
300
1978 1980 1982 1984 1986 1988 1990 1992 1994 1996 1998 2000 2002 2004
Con
serv
ati
on
Acq
uis
itio
ns
(aM
W)
Federal Standards
State Codes
Alliance Programs
BPA,Utility and SBC Administrator Programs

slide 45
Northwest Power and ConservationCouncil
Maine’s Electric Sales Maine’s Electric Sales 1,360 aMW in 2004 1,360 aMW in 2004
Industrial400 aMW
42%
Commercial470 aMW
30%
Residential490 aMW
28%
Source: US DOE/EIA

slide 46
Northwest Power and ConservationCouncil
Maine Residential Electricity Use per Maine Residential Electricity Use per Customer Declined in the 1990sCustomer Declined in the 1990s
… But Recently It’s Been Increasing… But Recently It’s Been Increasing
0
1,000
2,000
3,000
4,000
5,000
6,000
7,000
8,000
1990 1992 1994 1996 1998 2000 2002
Avera
ge
Annual U
se/C
ust
om
er
(kW
h)

slide 47
Northwest Power and ConservationCouncil

slide 48
Northwest Power and ConservationCouncil
Efficiency Maine Projected Efficiency Maine Projected InvestmentsInvestments

slide 49
Northwest Power and ConservationCouncil
The Share of PNW Retail Electricity Sales The Share of PNW Retail Electricity Sales Revenues Invested In Energy Efficiency Has Revenues Invested In Energy Efficiency Has
Declined Since The Early 1990’sDeclined Since The Early 1990’s
$0.0$1.0$2.0$3.0$4.0$5.0$6.0$7.0$8.0$9.0
$10.0
1991
1992
1993
1994
1995
1996
1997
1998
1999
2000
2001
2002
2003
2004
Tota
l R
eta
il Ele
ctri
city
Sale
s R
evenue
(bill
ion 2
000$)
Revenues Invested In EfficiencyRevenues Dedicated to Other Costs
slide 50
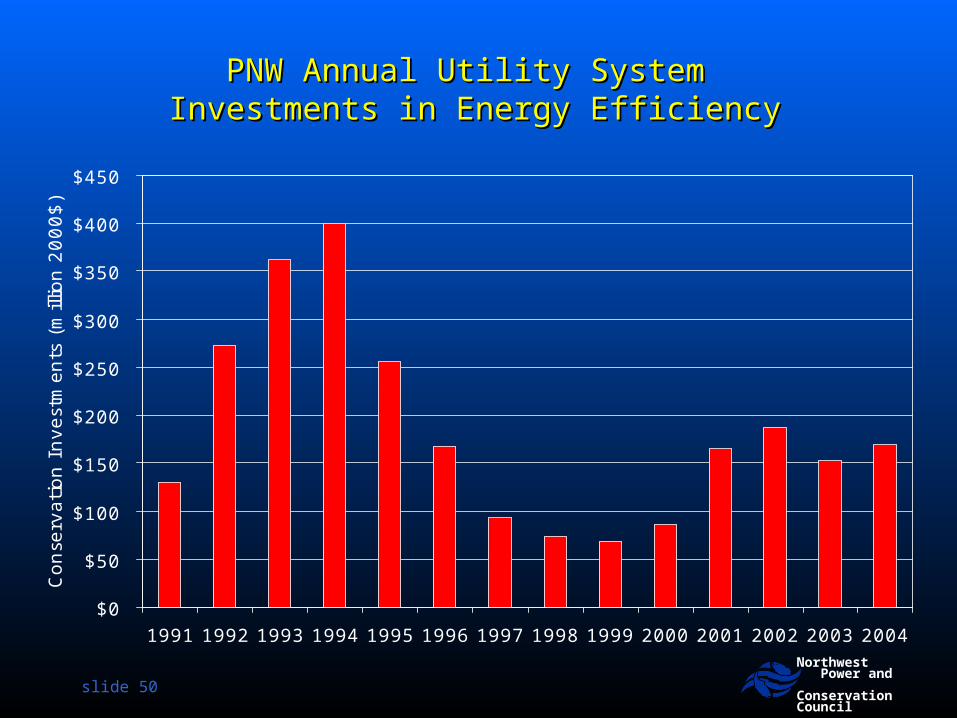
Northwest Power and ConservationCouncil
PNW Annual Utility System PNW Annual Utility System Investments in Energy EfficiencyInvestments in Energy Efficiency
$0
$50
$100
$150
$200
$250
$300
$350
$400
$450
1991 1992 1993 1994 1995 1996 1997 1998 1999 2000 2001 2002 2003 2004
Con
serv
ati
on
In
vest
men
ts (
mill
ion
20
00
$)

slide 51
Northwest Power and ConservationCouncil
The “First Year” Cost ($/aMW) of Utility Acquired The “First Year” Cost ($/aMW) of Utility Acquired Energy Efficiency Has DeclinedEnergy Efficiency Has Declined
$0.00
$0.50
$1.00
$1.50
$2.00
$2.50
$3.00
$3.50
$4.00
$4.50
1991 1992 1993 1994 1995 1996 1997 1998 1999 2000 2001 2002 2003 2004
Con
serv
ati
on
Cost
/aM
W (
mill
ion
20
00
$)

slide 52
Northwest Power and ConservationCouncil
PNW Utilities Have Gotten More Efficient at Acquiring PNW Utilities Have Gotten More Efficient at Acquiring Energy Efficiency - Cost Are Now Below $15 MWHEnergy Efficiency - Cost Are Now Below $15 MWH
$0
$5
$10
$15
$20
$25
$30
$35
$40
1991 1992 1993 1994 1995 1996 1997 1998 1999 2000 2001 2002 2003 2004
Leveliz
ed C
on
serv
ati
on
Cost
(m
illio
n/M
Wh
20
00
$)

slide 53
Northwest Power and ConservationCouncil
Utility Acquired Energy Efficiency Has Been Cost-Utility Acquired Energy Efficiency Has Been Cost-Competitive with Market PurchasesCompetitive with Market Purchases
$0
$100
$200
$300
$400
$500
$600
May
-96
Nov-9
6
May
-97
Nov-9
7
May
-98
Nov-9
8
May
-99
Nov-9
9
May
-00
Nov-0
0
May
-01
Nov-0
1
May
-02
Nov-0
2
May
-03
Nov-0
3
May
-04
Nov-0
4
May
-05
Wh
ole
sale
Ele
ctri
city
Pri
ce (
20
00
$/M
WH
)
Wholesale Market Price
Levelized Cost of EfficiencyAcquisitions

Comparing Plans for System Comparing Plans for System Cost and RiskCost and Risk
NPV Power System Cost (billions)
Like
lihood
(Pro
bab
ility
)
12.5 15 17.5 20 22.5 25 27.5 30 32.5 35
Risk = Mean NPV of 90th Percentile
10
System Cost = Mean NPV across all futures

slide 55
Northwest Power and ConservationCouncil
Space of feasible Space of feasible solutionssolutions
Efficient Frontier = Least Cost Efficient Frontier = Least Cost Plans for Given Level of RiskPlans for Given Level of Risk
Incre
asin
g R
isk
Incre
asin
g R
isk
Increasing CostIncreasing Cost
Alternative Alternative Risk LevelsRisk Levels
Efficient Frontier

slide 56
Northwest Power and ConservationCouncil
Insights from 5Insights from 5thth Plan Portfolio Analysis – Plan Portfolio Analysis – Diverse Portfolios Decrease Risk, but Diverse Portfolios Decrease Risk, but
Increase CostIncrease Cost
Space of feasible Space of feasible solutionssolutions
Efficient Efficient FrontierFrontier
Increasing CostIncreasing CostIn
cre
asin
g R
isk
Incre
asin
g R
isk
Rely on the marketRely on the market
CCCT & SCCTCCCT & SCCT
Mix of Conservation, Mix of Conservation, Renewables, coal and Renewables, coal and SCCTSCCT

slide 57
Northwest Power and ConservationCouncil
Residential Sector Target = 1340 aMWResidential Sector Target = 1340 aMW
0
200
400
600
800
1,000
1,200
1,400
Avera
ge M
egaw
att
s
Residential Space Conditioning - 245aMW
Residential Lighting - 630 aMW
Residential Water Heating - 285 aMW
Residential Appliances - 140 aMW

slide 58
Northwest Power and ConservationCouncil
Regional Residential Sector Realistically Regional Residential Sector Realistically Achievable Potential for AppliancesAchievable Potential for Appliances
Clothes Washers - 135
aMW75%
Dishwashers - 10 aMW
6%
Refrigerators - 35 aMW
19%

slide 59
Northwest Power and ConservationCouncil
Regional Residential Sector Realistically Regional Residential Sector Realistically Achievable Potential for Water HeatingAchievable Potential for Water Heating
Efficient Tanks29%
95 aMWWaste Water
Heat Recovery4%
15 aMW
Heat Pump Water Heaters
67%225 aMW

slide 60
Northwest Power and ConservationCouncil
Regional Residential Sector Realistically Regional Residential Sector Realistically Achievable Potential for Space Achievable Potential for Space
ConditioningConditioningNew Construction -
Shell Measures 40 aMW
16%
Duct Sealing & System
Commissioning & Controls 15 aMW
6%
Weatherization60 aMW
24%
Heat Pump Upgrades 55 aMW
22%
Heat Pump Conversions
75 aMW32%

slide 61
Northwest Power and ConservationCouncil
Commercial Sector Target = 1105 aMWCommercial Sector Target = 1105 aMW
0
200
400
600
800
1,000
1,200
Avera
ge M
egaw
att
s
Infrastructure
Equipment
Envelope
Lighting
HVAC

slide 62
Northwest Power and ConservationCouncil
Regional Non-Building Resource Regional Non-Building Resource Potential = 430 aMWPotential = 430 aMW
0
20
40
60
80
100
120
140
160S
ew
age
Tre
atm
em
t
Wate
rTre
atm
ent
LED
Tra
ffic
Sig
nals
Netw
ork
ed
PC
Managem
ent
Pack
aged
Refr
igera
tion
Pow
er
Supplie
s
LED
Exit
Sig
ns
Avera
ge M
egaw
att
s

slide 63
Northwest Power and ConservationCouncil
0
100
200
300
400
500
600
New and Replacement Retrofit
MW
a in
202
5
Equipment
Refrigeration
Envelope
Lighting
HVAC
Cost-Effective Commercial Conservation Potential Cost-Effective Commercial Conservation Potential in 2025 For Building Lighting, HVAC & Equipment- in 2025 For Building Lighting, HVAC & Equipment-
Regional = 950 aMWRegional = 950 aMW

slide 64
Northwest Power and ConservationCouncil
Irrigated Agriculture Sector Target = Irrigated Agriculture Sector Target = 80 aMW80 aMW
0
10
20
30
40
50
60
70
80
90
Avera
ge M
egaw
att
s
Replace Pumps, Nozzles &Gaskets
Replace Nozzles & Gaskets
Convert Center Pivots fromMedium to Low Pressure
Convert Center Pivots from Highto Low Pressure

slide 65
Northwest Power and ConservationCouncil
Industrial Sector Target = Industrial Sector Target = 350 aMW350 aMW
Estimate of 5% of 2025 forecast loadsEstimate of 5% of 2025 forecast loads 350 aMW at 1.7 cents per kWh350 aMW at 1.7 cents per kWh Process controls, drive systems, lighting, Process controls, drive systems, lighting,
refrigeration, compressed air, etcrefrigeration, compressed air, etc Potential is a function of the ongoing Potential is a function of the ongoing
changes in region’s industrial mixchanges in region’s industrial mix

slide 66
Northwest Power and ConservationCouncil
Utility* Efficiency Acquisition Plans for 2005 Are Utility* Efficiency Acquisition Plans for 2005 Are Close to 5Close to 5thth Plan Targets Plan Targets
0
20
40
60
80
100
120
2005 5th Plan Target 2005 Utility Acquistion Plan
Conserv
ati
on L
evels
(M
Wa)
*Targets for 15 Largest PNW Utilities. These utilities represent approximately 80% of regional load.
slide 67
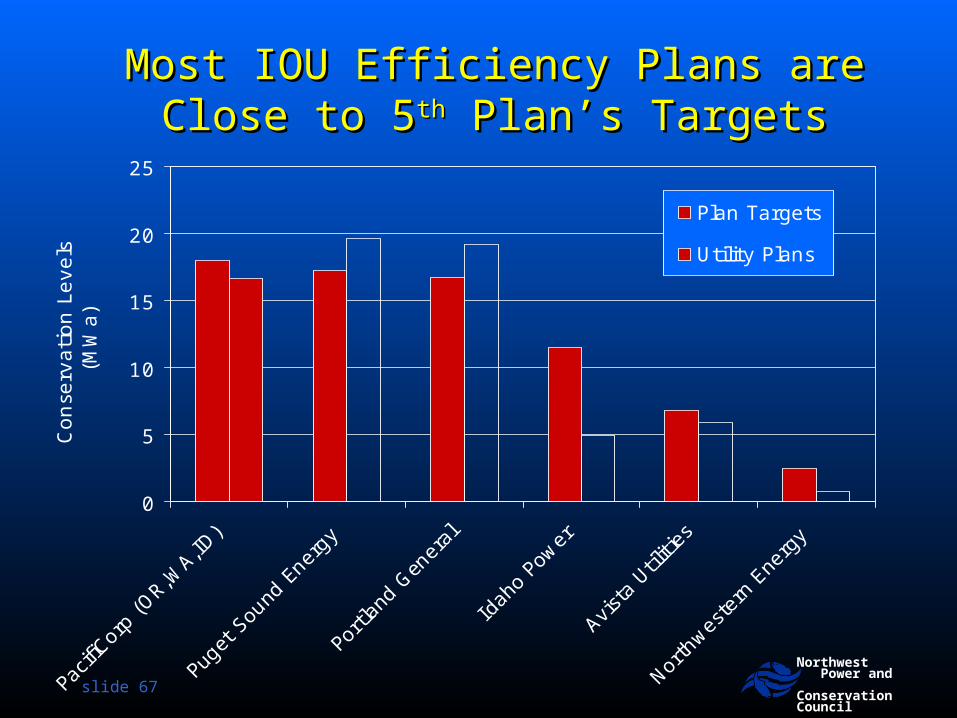
Northwest Power and ConservationCouncil
Most IOU Efficiency Plans are Close Most IOU Efficiency Plans are Close to 5to 5thth Plan’s Targets Plan’s Targets
0
5
10
15
20
25
Pacifi
Corp
(OR,W
A,ID)
Puge
t Sou
nd E
nerg
y
Portland
Gen
eral
Idah
o Po
wer
Avist
a Util
ities
North
weste
rn E
nerg
y
Con
serv
ati
on
Levels
(M
Wa)
Plan Targets
Utility Plans
slide 68
Northwest Power and ConservationCouncil
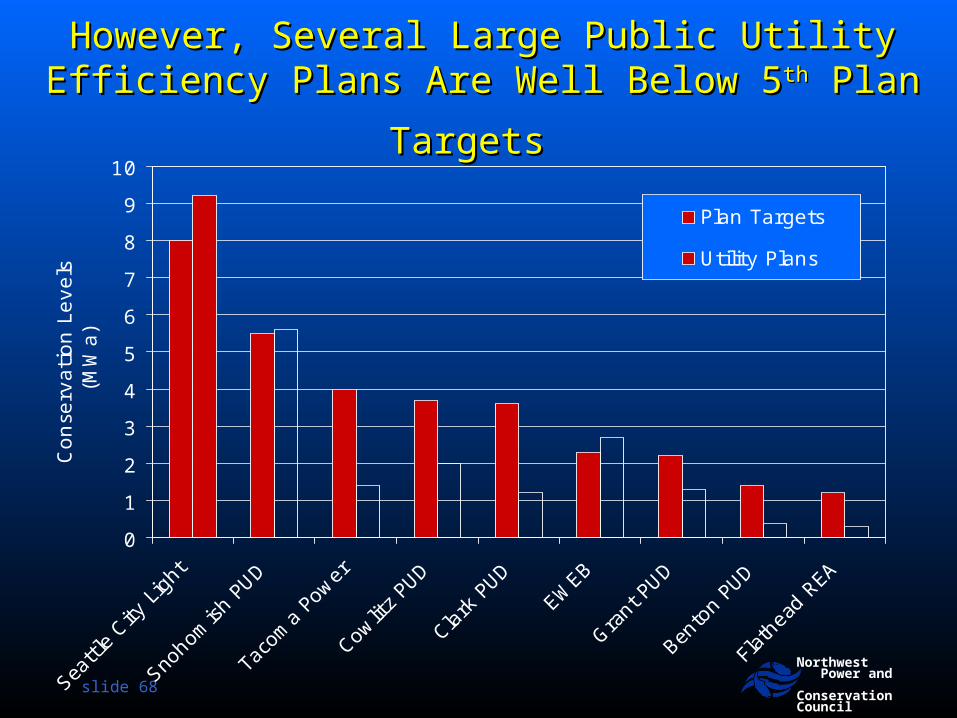
However, Several Large Public Utility Efficiency However, Several Large Public Utility Efficiency
Plans Are Well Below 5Plans Are Well Below 5thth Plan Targets Plan Targets
0
1
2
3
4
5
6
7
8
9
10
Seattl
e City
Lig
ht
Snoho
mish
PUD
Taco
ma
Power
Cowlit
z PU
D
Clark
PUD
EWEB
Grant
PUD
Bento
n PU
D
Flat
head
REA
Con
serv
ati
on
Levels
(M
Wa)
Plan Targets
Utility Plans