Embed Size (px)
Citation preview

r-......
-3
The Rice CrisisMaRkeTs, Pol iC ies and Food seCuRiTy
ediTed by david dawe
‘This book, with chapters from many prominent experts, presents new evidence from the recent rice price crisis
and draws lessons for preventing the next crisis. It is a unique set of references on global food security
and the world rice market.’shenggen Fan, director General,
international Food Policy Research institute (iFPRi)
‘This book is a must-read for those who wish to understand the world rice market, trade policies and food security concerns.
It provides a careful and detailed analysis of the causes and consequences of the 2007 and 2008 global rice crisis. It is written by knowledgeable experts from the key
rice economy nations.’Professor eric J. wailes, university of arkansas, usa
The recent escalation of world food prices – particularly for cereals – prompted mass public indignation and demonstrations in many
countries, from the price of tortilla flour in Mexico to that of rice in the Philippines and pasta in Italy. The crisis has important implications for future government trade and food security policies, as countries re-evaluate their reliance on potentially more volatile world markets to augment domestic supplies of staple foods.
This book examines how government policies caused and responded to soaring world prices in the particular case of rice, which is the world’s most important source of calories for the poor. Comparable case studies of policy reactions in different countries (principally across Asia, but also including the USA and Africa) provide the understanding necessary to evaluate the impact of trade policy on the food security of poor farmers and consumers. They also provide important insights into the concerns of developing countries that are relevant for future international trade negotiations in key agricultural commodities. As a result, more appropriate policies can be put in place to ensure more stable food supplies in the future.
david dawe is a Senior Economist at the Food and Agriculture Organization (FAO) of the United Nations. A graduate of Harvard University, he has studied the Asian rice economy for more than 20 years, including 15 years resident in the Philippines, Indonesia and Thailand.
Agriculture and Food / Economics / Development
publ ishing for a susta inable future
w w w . e a r t h s c a n . c o . u k
pu
blish
ing
for a su
stainab
le fu
ture
ww
w.e
arth
sca
n.c
o.u
k
Earthscan strives to minimize its impact on the environment
The Rice Crisised
iTed
by
dav
id d
aw
e

The Rice Crisis
ES_RC_9-8 18/8/10 20:23 Page i

ES_RC_9-8 18/8/10 20:23 Page ii

The Rice CrisisMarkets, Policies and Food Security
Edited by David Dawe
London • Washington, DC
Published byThe Food and Agriculture Organization of the United Nations
andEarthscan
ES_RC_9-8 23/8/10 09:11 Page iii

First published in 2010 by Earthscan and FAO
Copyright © FAO, 2010
The designations employed and the presentation of material in this information product donot imply the expression of any opinion whatsoever on the part of the Food and AgricultureOrganization of the United Nations (FAO) concerning the legal or development status of anycountry, territory, city or area or of its authorities, or concerning the delimitation of itsfrontiers or boundaries. The mention of specific companies or products of manufacturers,whether or not these have been patented, does not imply that these have been endorsed orrecommended by FAO in preference to others of a similar nature that are not mentioned.
The views expressed in this information product are those of the author(s) and do not necessarily reflect the views of FAO.
All rights reserved. FAO encourages the reproduction and dissemination of material in thisinformation product. Non-commercial uses will be authorized free of charge, upon request.Reproduction for resale or other commercial purposes, including educational purposes, mayincur fees. Applications for permission to reproduce or disseminate FAO copyright materials,and all queries concerning rights and licences, should be addressed by e-mail [email protected] or to the Chief, Publishing Policy and Support Branch, Office of KnowledgeExchange, Research and Extension, FAO, Viale delle Terme di Caracalla, 00153 Rome, Italy.
Earthscan Ltd, Dunstan House, 14a St Cross Street, London EC1N 8XA, UKEarthscan LLC, 1616 P Street, NW, Washington, DC 20036, USA
Earthscan publishes in association with the International Institute for Environment andDevelopment
For more information on Earthscan publications, see www.earthscan.co.uk or write to [email protected]
ISBN 978-1-84971-134-0 (Earthscan)978-92-5-106443-6 (FAO)
Typeset by MapSet Ltd, Gateshead, UKCover design by Susanne Harris
A catalogue record for this book is available from the British Library
Library of Congress Cataloging-in-Publication Data
The rice crisis : markets, policies and food security / edited by David Dawe. — 1st ed.p. cm.
Based on papers presented at a workshop organized by FAO in Chiang Mai, Thailand, Feb.9-12, 2009.Includes bibliographical references and index.ISBN 978-1-84971-134-01. Rice trade. 2. Rice—Prices—Government policy. 3. Food supply. I. Dawe, David
Charles.HD9066.A2R527 2010338.1'7318—dc22
2010005931
At Earthscan we strive to minimize our environmental impacts and carbon footprint throughreducing waste, recycling and offsetting our CO2 emissions, including those created throughpublication of this book. For more details of our environmental policy, seewww.earthscan.co.uk.
Printed and bound in the UK by MPG Books,an ISO 14001 accredited company. The paper used is FSC certified.
ES_RC_9-8 24/8/10 18:06 Page iv

Contents
Foreword by Kostas Stamoulis viiPreface ixList of contributors xiList of figures and tables xiiiList of acronyms and abbreviations xxi
PART I – INTRODUCTION
1 Food Crises Past, Present (and Future?): Will We Ever Learn? 3C. Peter Timmer and David Dawe
PART II – OVERVIEW: THE WORLD RICE MARKET AND TRADE POLICIES
2 The World Rice Market Crisis of 2007–2008 15David Dawe and Tom Slayton
3 Did Speculation Affect World Rice Prices? 29C. Peter Timmer
4 Trade-Related Policies to Ensure Food (Rice) Security in Asia 61Alexander Sarris
PART III – POLICY RESPONSES IN TRADITIONALIMPORTING COUNTRIES
5 Volatility in Rice Prices and Policy Responses in Bangladesh 91Mahabub Hossain and Uttam Deb
6 Indonesia’s Rice Policy and Price Stabilization Programme: Managing Domestic Prices during the 2008 Crisis 109Agus Saifullah
7 Rice Crisis in the Philippines: Why Did it Occur and What Are its Policy Implications? 123Arsenio M. Balisacan, Mercedita A. Sombilla and Rowell C. Dikitanan
ES_RC_9-8 18/8/10 20:23 Page v

8 West African Experience with the World Rice Crisis, 2007–2008 143Jenny C. Aker, Steven Block, Vijaya Ramachandran and C. Peter Timmer
9 Rice in Africa: Will Imports Continue to Grow? 163Ousman Gajigo and Glenn Denning
PART IV – POLICY RESPONSES IN TRADITIONALEXPORTING COUNTRIES
10 The Political Economy of Thailand’s Rice Price and Export Policies in 2007–2008 191Nipon Poapongsakorn
11 The Vietnamese Rice Industry during the Global Food Crisis 219Pham Hoang Ngan
12 Rice Production in Cambodia: Will Exports Continue to Grow? 233Sushil Pandey and Humnath Bhandari
PART V – POLICY RESPONSES IN CHINA AND INDIA
13 How China Stabilized Grain Prices during the Global Price Crisis 255Cheng Fang
14 Rice Policies in India in the Context of the Global Rice Price Spike 273Ashok Gulati and Monica Dutta
PART VI – POLICY RESPONSES IN THE DEVELOPED COUNTRIES
15 Japan’s Rice Policy and its Role in the World Rice Market: Japan Should Act as a Watchdog 299Shoichi Ito
16 The ‘Diplomatic Crop’, or How the US Provided Critical Leadership in Ending the Rice Crisis 313Tom Slayton
PART VII – CONCLUSION
17 Can the Next Rice Crisis Be Prevented? 345David Dawe
Index 357
vi THE RICE CRISIS
ES_RC_9-8 18/8/10 20:23 Page vi

Foreword
The spike in food prices in 2007–2008 was the biggest spike on world foodmarkets since the world food crisis of 1973–1975. Poor people often spend asmuch as 40 per cent of their incomes on staple foods – thus, a large price shockis a major blow to the effective purchasing power of those who are foodinsecure, and the crisis caused great hardship to them in many countriesaround the world. But food prices on world markets eventually declined in thesecond half of 2008, and although domestic prices remain higher than beforethe crisis in some countries, the crisis has largely passed. Since large food pricespikes seem to occur about once every 30 to 35 years, is there any scope for ananalysis now? What is the usefulness of analysing the most recent world foodcrisis now if we don’t have to deal with a similar crisis until 2040?
While it is true that large price spikes on world markets have occurredrelatively infrequently in the past, there is some reason to think this maychange in the future. First, biofuel demand has strengthened linkages betweenworld energy and agricultural markets. Because world energy markets are somuch larger than world agricultural markets, they may drive agriculturalmarkets in the future. And world energy markets have historically been muchmore volatile than world food markets, creating the possibility that world foodmarkets will become more volatile in the future. Second, climate change isexpected to result in an increased frequency of severe climatic events that mayreverse the historical trend of the past few decades to more stable cerealproduction and yields. Thus, it is important to understand more about themost recent world food crisis to help us potentially deal better with similarshocks that may occur in the future.
While there were price surges for all three of the world’s major cereals (rice,wheat and maize) in the years 2006 to 2008, it is widely acknowledged that thespike in world rice prices had a fundamentally different explanation from thespikes in wheat and maize prices. Thus, while the world rice crisis wasundoubtedly shaped to some extent by the same broad events that contributedto price spikes in other world food markets, the world rice economy took on adynamic of its own, especially in early 2008. In particular, government policieswere crucial, both in terms of their ‘spill-over’ effects on world markets, and interms of their heterogeneous effects on domestic prices.
ES_RC_9-8 18/8/10 20:23 Page vii

With a view to designing better policies, and in response to the needsexpressed by many countries to learn how to deal more appropriately withshocks to international markets in an increasingly globalized environment, theFood and Agriculture Organization of the United Nations (FAO) hassupported both a workshop and the publication of this book that gatherstogether insights from many different experts from around the world. Theworkshop brought together participants from a wide range of organizations:private traders, research institutes, international organizations and governmentagencies responsible for policy implementation. The book explores in detail thewide range of different policies employed by various countries before, duringand in the immediate aftermath of the rice crisis. Different policies led to differ-ent results, thereby providing invaluable lessons for the future about dealingwith food price shocks. It is my hope that this publication will contribute to amore informed debate on issues that are of fundamental importance to thefood security of the hundreds of millions of undernourished people around theglobe.
Kostas StamoulisDirector, Agricultural Development Economics Division
Food and Agriculture Organization of the United Nations
viii THE RICE CRISIS
ES_RC_9-8 18/8/10 20:23 Page viii

Preface
World rice prices spiked in early 2008, with prices tripling in the span of just afew months. This crisis on the world market led to surges in domestic riceprices in many countries, leading to substantial effects on the poor in countrieswhere rice is the staple food for consumers and the crop most widely grown byfarmers.
Because rice is such an important crop for the world’s poor, FAO felt that itwas important to understand the origins of the world rice crisis, the nature ofdomestic policy responses to the crisis, and to attempt to answer the question‘Can the next rice crisis be prevented?’. In order to achieve these objectives,FAO convened a workshop in Chiang Mai, Thailand, in February 2009 thatgathered together many different types of experts on the rice economy. Thisbook has its origins in the discussions held during that workshop.
The purpose of the book is to stimulate and facilitate informed discussion.Given the effects of the world rice crisis on the poor, such debate is essential tohelping countries manage such crises better in the future. But none of the state-ments in the book necessarily represent an official position of FAO, or anyother organization that participated in the workshop.
One group of experts who participated in the workshop make their livingin the international rice trade. While the rice traders who joined the workshopdid not contribute any papers to this book, they did make presentations to thegroup during the workshop and contributed many important insights duringthe discussions. In this regard, a tremendous vote of thanks is due to VichaiSriprasert, Sumeth Laomoraphorn and Porntiwa Tanaphong for keeping every-one’s feet firmly planted on the ground.
The other experts at the workshop hailed from a wide range of research,policy and government organizations around the world at both internationaland national levels. These experts prepared draft presentations or papersspecifically for this workshop, but then updated and revised them substantiallyafterwards in order to create this book. Thanks are due to these people whocontributed their time, expertise and knowledge of various aspects of theworld’s rice economy to this book. Thanks are also due to several authoritieswho shared their expertise during the workshop but did not contribute a paperto this volume: Zhou Hui (State Administration of Grain, China) and Dr Park
ES_RC_9-8 18/8/10 20:23 Page ix

Dong-Kyu (Korea Rural Economic Institute).The workshop would not have run as smoothly as it did without the excel-
lent planning and logistical support provided over the span of several months,before, during and after the workshop, by Truchai Sodsoon of FAO’s RegionalOffice for Asia and the Pacific and Juejan Tangtermthong of the Agriculturaland Food Marketing Association for Asia and the Pacific (AFMA). Theirsupport is very gratefully acknowledged. Editorial support from Adam Barclayin preparing some of the chapters is also gratefully acknowledged.
The workshop would not have been held at all without the intellectualsupport and encouragement from He Changchui, Deputy Director General forOperations at FAO; Hiroyuki Konuma, Assistant Director General andRegional Representative of FAO’s Regional Office for Asia and the Pacific(RAP); Kostas Stamoulis, Director of FAO’s Agricultural DevelopmentEconomics Division (ESA) in Rome; Keith Wiebe, Deputy Director of ESA;Jairo Castaño, Senior Statistician at FAO RAP; and Dorjee Kinlay, Economistin ESA, who first suggested that we hold a workshop on this topic. Their inputsare sincerely valued.
Financial support from FAO, and from the organizations that allowed theirstaff members to take time off from their other duties and supported theirtravel in whole or in part, was very much appreciated by all the participants.
Finally, I would like to thank my family for their love and support, and fortolerating my continuing interest in anything to do with rice.
x THE RICE CRISIS
ES_RC_9-8 18/8/10 20:23 Page x

List of Contributors
Jenny C. Aker, Assistant Professor of Development Economics, FletcherSchool, Tufts University, Boston, Massachusetts, USA. Contact [email protected]
Arsenio Balisacan, Professor, School of Economics, University of thePhilippines Diliman, Quezon City, Philippines. Contact [email protected]
Humnath Bhandari, Post-Doctoral Fellow, Social Sciences Division,International Rice Research Institute, Los Baños, Philippines. Contact [email protected]
Steven Block, Associate Professor of International Economics, Fletcher School,Tufts University, Boston, Massachusetts, USA. Contact [email protected]
David Dawe, Senior Economist, Agricultural Development EconomicsDivision, FAO, Rome, Italy. Contact at [email protected]
Uttam Kumar Deb, Head, Research Division, Centre for Policy Dialogue,Dhaka, Bangladesh. Contact at [email protected]
Glenn Denning, Professor of Professional Practice, School of International andPublic Affairs and the Earth Institute, Columbia University, New York, NewYork, USA. Contact at [email protected]
Rowell Dikitanan, Research Assistant, Research and DevelopmentDepartment, Southeast Asian Regional Center for Graduate Study andResearch in Agriculture (SEARCA), Los Baños, Philippines. Contact [email protected]
Monica Dutta, Research Analyst, International Food Policy Research Institute(IFPRI), New Delhi, India. Contact at [email protected]
Cheng Fang, Economist, Trade and Markets Division, FAO, Rome, Italy.Contact at [email protected]
ES_RC_9-8 18/8/10 20:23 Page xi

Ousman Gajigo, Economist, Development Research Group, World Bank,Washington, DC, USA. Contact at [email protected]
Ashok Gulati, Director in Asia, International Food Policy Research Institute(IFPRI), New Delhi, India. Contact at: [email protected]
Pham Hoang Ngan, Deputy Director, Information Center for Rural andAgricultural Development, Institute of Policy and Strategy for Agriculturaland Rural Development, Ministry of Agricultural and Rural Development,Hanoi, Viet Nam. Contact at [email protected],[email protected]
Mahabub Hossain, Executive Director, Bangladesh Rural AdvancementCommittee (BRAC), Dhaka, Bangladesh. Contact [email protected]
Shoichi Ito, Professor and International Food Policy Economist, Faculty ofAgriculture, Kyushu University, Fukuoka, Japan. Contact [email protected]
Sushil Pandey, Senior Economist, Social Sciences Division, International RiceResearch Institute, Los Baños, Philippines. Contact [email protected]
Nipon Poapongsakorn, President, Thailand Development Research Institute,Bangkok, Thailand. Contact at: [email protected]
Vijaya Ramachandran, Senior Fellow, Center for Global Development,Washington, DC, USA. Contact at [email protected]
Agus Saifullah, Expert Staff, Badan Urusan Logistik (Bulog), Jakarta,Indonesia. Contact at [email protected]
Alexander Sarris, Director, Trade and Markets Division, FAO, Rome, Italy.Contact at [email protected]
Tom Slayton, Founding Publisher and owner of The Rice Trader, USA.Contact at [email protected]
Mercedita Sombilla, Manager, Research and Development Department,Southeast Asian Regional Center for Graduate Study and Research inAgriculture (SEARCA), Los Baños, Philippines. Contact [email protected]
C. Peter Timmer, Professor Emeritus, Harvard University, USA. Contact [email protected]
xii THE RICE CRISIS
ES_RC_9-8 18/8/10 20:23 Page xii
List of Figures and Tables
Figures
2.1 Monthly inflation-adjusted rice prices, January 2000 to September 2007 16
2.2 Timeline of key events in the world rice crisis 193.1 Annual average percentage increase in rice yields and
population between successive rolling five-year periods in rice-producing Asia 33
3.2 Demand factors contributing to food price formation since 2000 373.3 Granger causality test: Euro/US$ ⇒ Brent crude 443.4 Granger causality test: Euro/US$ ⇒ corn (maize) 463.5 Granger causality test: Euro/US$ ⇒ hard wheat 463.6 Granger causality test: Euro/US$ ⇒ rice 473.7 Granger causality test: Oil (Brent) ⇒ corn (maize) 483.8 Granger causality test: Oil (Brent) ⇒ palm oil 483.9 Granger causality test: Soft wheat ⇒ corn (maize) 493.10 Granger causality test: Corn (maize) ⇒ soft wheat 503.11 Granger causality test: Hard wheat ⇒ rice 503.12 Granger causality test: Hard wheat ⇐ rice 513.13 Long-run trend in real rice prices, 1900–2008 533.14 Long-run trend in real wheat price, 1900–2008 533.15 Long-run trends in real maize prices, 1900–2008 544.1 Recent export rice prices 634.2 Real prices of bulk food commodities, 1957–2008 644.3 Historic volatility and nominal international price for rice 684.4 Coefficients of variation of regional and global production of
rice since 1961 694.5 Global ending stocks of rice and stock to utilization ratios for
the whole world and for the world without China 704.6 Policy actions adopted by a sample of 77 developing countries
to deal with high international food commodity prices 724.7 Projected population growth rates to 2017 744.8 Projected GDP growth rates for Asia and the world 75
ES_RC_9-8 18/8/10 20:23 Page xiii

4.9 Projected real international prices of food commodities in the medium term 75
4.10 Projections of net grain imports in Asia and the Pacific 764.11 China: Projections of net exports of milled rice 764.12 India: Projections of net exports of milled rice 774.13 Indonesia: Projections of net imports of milled rice 774.14 Philippines: Projections of net imports of milled rice 784.15 Thailand: Projections of net exports of milled rice 784.16 Viet Nam: Projections of net exports of milled rice 794.17 Least-developed Asia (Laos, Myanmar, Cambodia, plus nine
smaller countries): Projections of net exports of rice 795.1 Trends in rice area harvested in Bangladesh, financial years
1971–1972 to 2008–2009 935.2 Trends in rice (paddy) production in Bangladesh, financial
years 1971–1972 to 2008–2009 935.3 Trends in rice (paddy) yield in Bangladesh, financial years
1971–1972 to 2008–2009 945.4 Trends in milled rice imports by Bangladesh, financial
years 1972–1973 to 2008–2009 965.5 Comparison of domestic rice prices in Bangladesh, Delhi
and Bangkok, January 2004 to June 2009 985.6 Relationship between domestic wholesale and retail price of
coarse rice with MEP declared by India 1005.7 Trends in monthly retail, wholesale and farm-level real prices
of coarse rice in Bangladesh, January 2003 to June 2009 1015.8 Trends in marketing margins of coarse rice in Bangladesh,
January 2003 to June 2009 1025.9 Trends in inflation (moving average), July 2001 to June 2009 1035.10 Trends in real agricultural wages in Bangladesh, January 2003
to February 2009 1035.11 Trends in real prices of fertilizers in Bangladesh, 2002–2003
to 2008 1076.1 International and domestic wholesale rice prices, 2000–2008 1126.2 Real rice price movement: Paddy, wholesale and retail
2000–2008 (Rp/kg) 1126.3 Production, rice price, GPP and urea price, 2000–2008 1177.1 Domestic rice price (farm, wholesale and retail) movements,
2007, 2008 and January to August 2009 1257.2 Paddy and milled rice annual/monthly average prices in the
Philippines, 1990–2008 1277.3 Trends in rice production, demand and population, and per
capita consumption and per capita income, Philippines 1287.4 Food consumption trends over time 1297.5 Distribution of food expenses by income class, 2006 1297.6 Poverty reduction performance versus the MDG target 131
xiv THE RICE CRISIS
ES_RC_9-8 18/8/10 20:23 Page xiv

7.7 Monthly relative distribution of production, imports and farm-gate prices in the Philippines, 2000 and 2002 134
7.8 Land and labour productivity growth in the agriculture sector 1368.1 Evolution of rice consumption and production in West Africa 1458.2 International versus domestic prices of imported rice,
October 2003–June 2008 1548.3 Millet versus imported rice prices in selected countries,
October 2003–June 2008 1568.4 Local vs imported rice prices in selected countries 1588.5 Rice trade policy and world prices in Senegal 1599.1 Paddy rice production in sub-Saharan Africa by sub-region 1659.2 Paddy rice production, area harvested and yield in
sub-Saharan Africa 1689.3 Paddy rice yield by sub-region 1689.4 Average per capita milled rice consumption, weighted by
population 1719.5 Distribution of urbanization rates in sub-Saharan Africa in
1965 and 2000 1729.6 Total consumption growth and urbanization 1739.7 Production and consumption of milled rice in sub-Saharan
Africa, 1962–2005 1759.8 Rice imports in sub-Saharan Africa 1769.9 Production and consumption by sub-region 1779.10 Rice imports forecast by sub-region 18410.1 The organization of the paddy pledging programme 19310.2 Percentage of the benefits of the paddy pledging programme
accruing to farm income deciles, 2006–2007 19810.3 Trends in paddy 5% prices and Hom Mali paddy prices 20010.4 Seasonal price indices of paddy 5% brokens and Hom Mali 20110.5 World prices of rice, wheat and maize 20510.6 Volume of monthly rice exports, January 2005–January 2009 21010.7 Export prices of Thai and Vietnamese rice 21110.8 Rice export and index of government rice stock 21311.1 Viet Nam’s paddy planted area, 1976–2008 22211.2 Viet Nam’s paddy production, 1976–2008 22211.3 Viet Nam’s paddy yield, 1976–2008 22311.4 MRD ordinary paddy and rice price movements and world
rice prices, 2008 22612.1 Trends in area and production of rough rice, Cambodia,
1960–2008 23612.2 Trends in yield of rough rice, Cambodia, 1960–2008 23712.3 Per capita production of rough rice, Cambodia, 1960–2008 23812.4 Rice exports from Cambodia, 1960–2008 23912.5 Trade flow of paddy and rice in Cambodia 24112.6 Monthly nitrogen fertilizer price index, Cambodia, 2007–2008 243
LIST OF FIGURES AND TABLES xv
ES_RC_9-8 18/8/10 20:23 Page xv

12.7 Monthly wholesale price of high-quality milled rice, Cambodia, 2005–2009 244
12.8 Scenario analysis of the growth of exportable surplus in Cambodia, 2010–2020 247
13.1 China’s CPI and food price index, January 2003 to November 2008 256
13.2 Non-price government support, 2005–2008 25913.3 China’s rice area, yield and production index, 1991–2008 26113.4 Rice production and domestic utilization, 2005–2008 26113.5 World rice prices, China’s grain export policies and rice exports 26313.6 Fertilizer exports and trade policies 26513.7 Ratio of ending stocks to domestic utilization 26613.8 Domestic and world prices of rice, January 2004 to
December 2008 26613.9 Domestic and world prices of wheat, January 2004 to
December 2008 26713.10 Domestic and world prices of maize, January 2004 to
December 2008 26813.11 Domestic and world prices of soybeans, January 2004 to
December 2008 26813.12 Income (including subsidies) per hectare 27013.13 Income (including subsidies) per ton 27014.1 Spike in the global rice price 27414.2 All-India average retail prices of rice (Rs/kg) 27714.3 Global production of three key staples 27814.4 Share in global rice production and percentage share in global
rice production (TE 2008–2009) 27814.5 Share in global rice stocks and percentage share in global rice
stocks (TE 2008–2009) 27914.6 Nominal and real minimum support prices for common
paddy and wheat 28014.7 Food grain stocks versus norm requirement 28414.8 Export bans on rice 29015.1 Per capita consumption of rice for Japan, Chinese province of
Taiwan, Republic of Korea and China, 1961–2008 30015.2 Structure and share of rice production costs in Japan, 2006 30115.3 Weekly wholesale prices of rice in Japan, 1990–2009 30215.4 Annual retail prices of milled rice in Tokyo, 1991–2008 30215.5 Monthly retail prices of milled rice in Tokyo, 2007–2008 30315.6 Budget for increases in food self-sufficiency rate for livestock feed 30415.7 Strategic countermeasures against the global food shortage 30515.8 Rice imports to Japan, 1980–2008 30615.9 US milled rice prices by type, 1979–2007 30715.10 Monthly prices of milled rice, USA 30816.1 US rice outlays, 1981–2008 (million $) 319
xvi THE RICE CRISIS
ES_RC_9-8 18/8/10 20:23 Page xvi

17.1 World rice prices adjusted for inflation (monthly, January 1962 to April 2009) and a lagged five-year moving average 351
Tables
3.1 Significance of Granger causality tests for various commodities and the exchange rate between the euro and US dollar 52
3.2 Long-run relationships among rice, wheat and maize prices, 1900–2008 52
5.1 Trends in area, production and yield of rice (paddy) in Bangladesh, 1971–1972 to 2007–2008 92
5.2 Per capita consumption of rice, 2005 975.3 Consumption of different food items in Bangladesh,
1983–1984 to 2005 975.4 Distribution of food grains under PFDS in Bangladesh,
2006–2007 to 2008–2009 1066.1 The development of GPP, domestic prices and world rice prices 1116.2 Subsidized rice (RASKIN) distribution 2006–2008 1156.3 Rice production by crop season, 2007–2008 1166.4 The distribution of rice production in Indonesia, 2005–2008 1186.5 Rice price movements and BULOG rice distribution during
lean seasons, 2006–2008 1196.6 Ratio of procurement against RASKIN requirement, 2007–2008 1217.1 Domestic rice price movements: Growth rates and coefficients
of variation 1267.2 Extent of food deprivation in the Philippines, by income level 1327.3 Extent of food deprivation in the Philippines, by occupation 1327.4 Estimates of TFP growth for selected Asian countries,
1981–2001 1367.5 Potential yield and yield gaps in rice in the Philippines 1388.1 Area, yield and production of rice in selected West African
Countries, 1961–2006 1478.2 Imports of rice in selected West African countries, 1961–2006 1488.3 Consumption and self-sufficiency of rice in selected West African
countries, 1961–2006 1498.4 Cumulative percentage changes in real rice prices, the last
quarter of 2003 to the last quarter of 2007 1528.5 Levels and changes in nominal prices (CFA) for millet, domestic
and imported rice, the last quarter of 2003 to the second quarter of 2008 153
8.6 Correlation of international and domestic rice prices before and during the crisis 155
8.7 Correlation of domestic millet and rice prices before and during the crisis 157
LIST OF FIGURES AND TABLES xvii
ES_RC_9-8 18/8/10 20:23 Page xvii

8.8 Correlation of domestic and imported rice prices before and during the crisis 157
9.1 Rice producers in sub-Saharan Africa 1669.2 Regression results with paddy rice production and rice yield
as dependent variables 1679.3 Countries with highest per capita rice consumption 1709.4 Average consumption growth rates by sub-region 1709.5 Urbanization rates in other regions 1739.6 Regression results (sub-Saharan African countries) for the
determinants of per capita rice consumption 1749.7 Imports (milled rice terms in metric tons) 17610.1 Planted area, paddy production and volume of paddy
under the pledging programme 19510.2 Cost of the pledging programmes, 2004–2006 19710.3 Seasonal price indices 20211.1 Viet Nam’s monthly rice exports, 2008 22411.2 Urea prices in An Giang province, MRD, Viet Nam, 2003–2008 22711.3 Paddy production, planted area and yield, Viet Nam, 2005–2008 22811.4 Paddy production, planted area and yield, MRD, 2005–2008 22911.5 Winter–spring paddy production cost in An Giang province,
MRD, 2006–2008 23012.1 Basic indicators, selected ASEAN countries 23412.2 Rough rice average area, yield and production, selected
ASEAN countries, 2005–2007 23512.3 Percentage rice area by ecosystem, selected ASEAN countries 23512.4 Percentage annual growth rates of rice area, yield and
production, Cambodia, 1960–2008 23712.5 Percentage annual growth rate of rice area, yield and production,
by season, Cambodia, 1998–2007 23812.6 Percentage rice area under improved varieties, Cambodia, 2002 23812.7 Marketing margin of paddy from farmer to trader, Cambodia 24212.8 Nitrogen–paddy price ratio, Cambodia, 2004–2008 24212.9 Cost of rice production, Cambodia and Thailand 24312.10 Parameters used in the food balance equation, Cambodia 24612.11 Required yield levels by 2020 under assumed area growth
rates, Cambodia 24712.12 Infrastructure development status, selected ASEAN countries 24813.1 China: Domestic agriculture and trade policies, 2001–2008 25813.2 Government floor price for grains in 2004–2009 25813.3 China’s international trade in cereals and soybeans,
2004–2008 26413.4 Average production costs, subsidies and profits in paddy
rice production, 2003–2008 26914.1 Compound growth rates of area, production and yield of
principal crops during 1990–2000 and 2000–2007 276
xviii THE RICE CRISIS
ES_RC_9-8 18/8/10 20:23 Page xviii

14.2 Percentage of levy on common milled rice in various states, 2008–2009 282
14.3 Production, procurement, stocks and off-take of rice and wheat 285
15.1 Agricultural situation in Japan, 1965 and 2005 30316.1 US rough rice production by region 31516.2 US rice exports 31616.3 Top US rice food aid markets 31816.4 US exports, GSM programmes 32016.5 US and Thai FOB export prices 32116.6 US Rice supply and distribution 32216.7 US farm-gate prices for paddy 32416.8 US exports to major destinations 32516.9 US Production and exports 33316.10 US rice exports by programme 33416.11 US government outlays on rice 33617.1 Volatility of real (inflation-adjusted) commodity prices 346
LIST OF FIGURES AND TABLES xix
ES_RC_9-8 18/8/10 20:23 Page xix

ES_RC_9-8 18/8/10 20:23 Page xx

List of Acronyms andAbbreviations
AFET Agricultural Futures Exchange of ThailandAFMA Agricultural and Food Marketing Association for Asia and the
PacificAFSR ASEAN Food Security ReserveARI Africa Rice InitiativeASEAN Association of Southeast Asian NationsBAAC Bank for Agriculture and Agricultural CooperativesBULOG Badan Urusan LogistikCAGR compound average growth rateCARP Comprehensive Agrarian Reform ProgramCBOT Chicago Board of TradeCCP Cabinet Committee on PricesCCT conditional cash transferCFA Communauté financière d’Afrique (Financial Community
of Africa)CGD Center for Global DevelopmentCIMMYT International Maize and Wheat Improvement CenterCIP Central Issue PriceCNF cost and freightCPI consumer price indexCRS Catholic Relief ServicesCRTC Council on Rice Trade CooperationCV coefficient of variationDAP diammonium phosphateEAERR East Asia Emergency Rice ReserveECA Essential Commodity ActEEP Export Enhancement ProgramEP Essential PriorityES exportable surplusESA Agricultural Development Economics Division (FAO)FAF Farmer Assistance Fund
ES_RC_9-8 18/8/10 20:23 Page xxi

FAO Food and Agriculture Organization of the United NationsFAPRI Food and Agriculture Policy Research InstituteFCI Food Corporation of IndiaFCMO Farmers’ Central Market OrganizationFFE Food for Education FFW Food for WorkFIELDS Fertilizer, Infrastructure and Irrigation, Extension and
Education, Loans, Drying and other Post-harvest Facilities,and Seeds
FM Flour MillsFOB free on boardFPC Fair Price CardGATT General Agreement on Tariffs and TradeGDP gross domestic productGFI government financial institutionGPP government purchase priceG-to-G government-to-governmentGR Gratuitous ReliefGVA gross value addedHCMC Ho Chi Minh CityHH householdICB international commodity bodyIEA International Energy AgencyIFAD International Fund for Agricultural DevelopmentIFPRI International Food Policy Research InstituteIGG intergovernmental groupIMF International Monetary FundIRFSS international rice food security systemIRRI International Rice Research InstituteLEI Large Employee IndustriesLGU local government unitMA minimum accessMAFF Ministry of Agriculture, Forestry and FisheriesMARD Ministry of Agriculture and Rural DevelopmentMDG Millennium Development GoalMEP minimum export priceMLR minimum lending rateMMA minimum market accessMOC Ministry of CommerceMOIT Ministry of Industry and TradeMOMAGRI Mouvement pour une Organisation Mondiale de l’Agriculture
(Movement for a World Agriculture Organization )MoP muriate of potashMOU memorandum of understandingMRD Mekong River Delta
xxii THE RICE CRISIS
ES_RC_9-8 18/8/10 20:23 Page xxii

MSP minimum support price MSR minimum stock requirementMV modern varietyNFA National Food AuthorityNPC nominal protection coefficientNRA nominal rate of assistanceOECD Organisation for Economic Co-operation and DevelopmentOMS Open Market SalesON Office du NigerONASA Office Nationale de la Securite Alimentaire (Benin) OP Other PriorityOPEC Organization of the Petroleum Exporting CountriesOREC Organization of Rice Exporting CountriesORS Office Riz-Segou PDS Public Distribution SystemPFDS Public Food Grain Distribution SystemPM prime ministerPRRS porcine reproductive and respiratory syndromePWO Public Warehouse OrganizationRAP Regional Office for Asia and the Pacific (FAO)RER real exchange rateRMA Rice Millers’ AssociationRMR regular milled riceRRD Red River DeltaSBS simultaneous-buy-and-sellSIMA Systeme d’Informations sur le Marche Agricole (Niger)SIM-C System d’Information sur les Marches Cerealiers (Burkina Faso)TE triennium endingTFP total factor productivityTPDS Targeted Public Distribution SystemTR Test ReliefTSP triple superphosphateURAA Uruguay Round Agreement on AgricultureUSDA United States Department of AgricultureUSTR United States Trade RepresentativeVAR vector autoregressiveVAT value added taxVFA Viet Nam Food AssociationVGD Vulnerable Group DevelopmentVGF Vulnerable Group FeedingWARDA West African Rice Development AuthorityWFP World Food Programme (United Nations)WMR well-milled riceWTO World Trade Organization
LIST OF ACRONYMS AND ABBREVIATIONS xxiii
ES_RC_9-8 18/8/10 20:23 Page xxiii

ES_RC_9-8 18/8/10 20:23 Page xxiv

Part I
INTRODUCTION
ES_RC_9-8 18/8/10 20:23 Page 1

ES_RC_9-8 18/8/10 20:23 Page 2

1
Food Crises Past, Present (and Future?): Will We Ever Learn?
C. Peter Timmer and David Dawe
The world rice market ran amok in late 2007 and 2008. Prices spiralled asexporters restricted supplies to the market in order to protect their ownconsumers from shortages. Importers scrambled for supplies to stabilize theirown markets. For several months in early 2008 it looked as though historicprice levels would be reached even when adjusted for inflation. In the end,additional supplies were located (but not used), the panic subsided, and riceprices fell sharply to the trend they had been on since recovery began from thelows in 2002.
What happened? Why? Can a repeat be avoided? This volume seeks toanswer those questions through a series of global market overviews andspecific country analyses. This attempt at such an assessment is not asambitious as the two classic studies of the world rice economy, Wickizer andBennett (1941) and Barker and Herdt (1985). But a quarter century haselapsed since the Barker and Herdt study and the world rice economy haschanged significantly since then. Even a partial reassessment is timely.
The debate over food crises
World food crises over the past two centuries have triggered a standard debateeach time: how much can the market be relied on to provide food security and
ES_RC_9-8 18/8/10 20:23 Page 3

how much should the government intervene on behalf of this objective? Thedebate has increased in sophistication over time. But so too have the numbersof food-insecure people – the total exceeds 1 billion hungry in mid-2009 (FAO,2009). Each food crisis seems to stimulate a surge of government and donoractivity on behalf of increased food production and better safety nets for thepoor.
At the same time, market forces also respond, choking off demand (witnessthe 1 billion hungry people) and leading to investments in new agriculturaltechnologies that have relentlessly pushed down staple grain prices over thelong run. Since 1900, the inflation-adjusted price of rice has declined 1.37 percent per year, corn by 1.25 per cent per year, and wheat by 1.05 per cent peryear.
The ‘role of the state’ in sectoral and overall growth is an old debate(Timmer, 1991). The key elements have always been over provision of infra-structure, development of human capital through education and public health,investments in research and technology, and ‘picking winners’ by supportingparticular sectors (agriculture versus industry) or industries (manufacturingversus finance, automobiles versus banks).
Within an industry, and especially within the food and agricultural sector,the question has tended to revolve around ‘price policy’ broadly construed,that is, government interventions into input and output prices through subsidies, taxes and trade policies that influence the prices of imports andexports (Timmer, 1986). If a particular product, food for example, is deemedto be meritorious, its inputs should be subsidized and its output supported. Of course, this argument runs immediately into the conflicting interests ofproducers and consumers of a commodity in the same economy, raising the‘food price dilemma’ as a fundamental problem for government policy(Timmer et al, 1983).
Food crises force governments and donors to confront this dilemma in a painful and visible way. High food prices signal the scarcity of food toproducers, consumers and governments alike. The almost universal response isa shift in policy sentiment toward greater intervention by governments onbehalf of increasing food production, lowering food prices, and providingmore reliable access by poor households to food.
All of these interventions come at a cost, however, and there is a gradualreturn to basic market forces as the crisis recedes and governments withdrawboth financially and in policy activism. Historically, these market forces havepushed food prices so low that investments in productivity-enhancing researchand infrastructure become unprofitable. Without these investments, growth insupply falls behind growth in demand, and the stage is set for another foodcrisis (Timmer, 1995). Gardner (1979) points out that the three price spikesseen between 1910 and 1980 seemed to occur about every three decades. Thefood crisis of 2007–2008 followed 35 years after the crisis in 1972–1973. Willwe never learn?
4 INTRODUCTION
ES_RC_9-8 18/8/10 20:23 Page 4

The food crisis in 1972–1973
In mid-1972, policy analysts were feeling pretty good about the global foodsituation. The deep pessimism generated by two failed monsoons over theIndian subcontinent in 1965 and 1966, with all their attendant politicaltensions between India and the US, had given way to optimistic hopes for a‘Green Revolution’ in rice and wheat, sparked by new ‘miracle’ seeds releasedin the mid-1960s from the International Rice Research Institute (IRRI) and theInternational Maize and Wheat Improvement Center (CIMMYT). With newseed technologies, investments in rural infrastructure and irrigation facilities,and construction of modern fertilizer factories wherever natural gas was avail-able cheaply, it looked as though the world food economy was set for an era ofrising productivity and cheaper food. Real rice prices on the Thai exportmarket fell 57 per cent between October 1967 and April 1972.
These declining prices meant that very early in the Green Revolution therewas professional concern over the ‘generations of problems’ that might occurwhen increased food production at the farm level needed to be sold into anunprepared marketing infrastructure (Falcon, 1970). The worries over thedistributional dimensions of successful rice and wheat intensificationprogrammes, when larger farmers had easier access to finance and inputs, tookfor granted the reality of higher productivity (Johnston and Cownie, 1969).From the start, the generation, dissemination and impact of the GreenRevolution was considered to be a public sector (and donor) activity andresponsibility, with the private sector primarily seen as responding to the newopportunities being generated by public sector investments and policies(Timmer, 1976, 1986).
The smooth rise in rice production was not to be. A widespread droughtduring the summer months of 1972, caused by a large-scale El Niño event,sharply reduced the dry-season rice crops throughout Southeast Asia,especially in Indonesia, Thailand and the Philippines. Domestic prices startedto rise, and there was a scramble for supplies after thinking just months earlierthat the Green Revolution had made most importing countries self-sufficient inrice. By April, 1973, Thailand, the world’s leading rice exporter, banned riceexports altogether.
For a very scary nine months, there was no world rice market. When itreopened in January 1974, Thai export prices in real terms were four timestheir level in early 1972. The episode was scary because countries dependenton rice imports to support domestic food security were suddenly left on theirown. Large importing countries, such as Indonesia and India, resolved toincrease rice production to achieve self-sufficiency, and have never trustedthe world market for supplies of rice since then, despite active engagementwith it.
The bad weather spread around the world, sharply affecting wheat andcorn crops in the northern hemisphere in the autumn of 1972. All told, afterthe 1972 harvests were in, world coarse grain production fell by 16 million
FOOD CRISES PAST, PRESENT (AND FUTURE?) 5
ES_RC_9-8 18/8/10 20:23 Page 5

tons, rice production by 14 million tons, and wheat production by 8 milliontons. Because increases on trend of production, to meet demand from agrowing population and increased consumption from more affluent diets, wereabout 33 million tons, the total shortfall in 1972 was about 70 million tons.This shortfall was almost 8 per cent of consumption.
The world food crisis of 1972–1973 was rooted in a severe weather shockto global grain production, although subsequent policy actions in the US andthe Soviet Union exacerbated the problem and triggered the price explosion(Falcon and Timmer, 1974). The timing is now forgotten, but the Organizationof the Petroleum Exporting Countries’ (OPEC) decision on 15 October 1973to embargo oil exports to the US and Europe came after the sharp increase ingrain prices.
High oil prices were not a contributing factor to the world food crisis in1972–1973. Indeed, one justification OPEC offered for the higher crude oilprices was its desire to catch up with the increases in food prices. If anything,the causation went in the other direction, from food prices to oil prices. Afteroil prices went up, fertilizer prices also rose sharply, so the food and energyeconomies became more tightly linked after 1974 (Timmer, 1975, 1976). Atthe World Food Conference in Rome in November 1974 there was consider-able concern over availability of fertilizer and the ability of poor countries (andfarmers) to afford it (Talbot, 1977). The ‘seed-fertilizer revolution’ dependedon cheap fertilizer.
The food crisis in 2007–2008
Fast forward to mid-2007. Grain prices had been gradually rising in real termsfor five years, and a 50 per cent spurt in corn prices between August 2006 andFebruary 2007 showed how nervous grain markets had become. Crude oilprices had doubled since 2004. From December, 2006, oil prices rose veryrapidly – from US$60 per barrel to $80 per barrel in just six months. Foodpolicy analysts were holding their breath, waiting for the trigger to send pricesspiralling into another world food crisis.
The trigger never materialized. Still, the food crisis happened anyway, afairly clear result of self-fulfilling expectations. To be sure, there was a smalldecline – 0.7 per cent – in food grain production from the 2007 harvest, butthis decline was entirely due to a 3.9 per cent decline in wheat production. Bothrice and coarse grain production actually increased in 2007.
With supplies for near-term delivery tight, wheat prices started risingsharply in May 2007. They were followed by corn prices later in the year, asdemand for ethanol production in the US put pressure on available supplies.Stocks of both wheat and coarse grains fell sharply during 2007 to levelsrelative to use that had not been seen since the mid-1970s. There was a clearcase for higher wheat prices because of the 2007 production shortfall, and forhigher corn prices because of mandated demand for biofuel production(Naylor and Falcon, 2008).
6 INTRODUCTION
ES_RC_9-8 18/8/10 20:23 Page 6

The actual price panic that resulted, however, had little rationale in thefundamentals of supply and demand. Speculative fervour spread from thecrude oil and metals markets to agricultural commodity markets (Timmer,2008). Prices spiked, first for wheat, then for corn. And then they collapsedwhen the speculative bubble burst. Prices peaked for wheat in February 2008,then again in June for corn, and in July for crude oil.
These commodities are very actively traded in organized futures andoptions markets. Granger causality testing on daily prices for these commodi-ties between 2000 and 2008 showed strong price linkages, presumablyintermediated by financial speculators, for extended periods of time, and nolinkages at other times (Timmer, 2009).
These Granger causality results were presented on 26 January 2009, to aWorld Food Programme (WFP) seminar in Rome on ‘Food, Finance and theFuture: Is Food Just Another Financial Instrument?’. The argument was madein the seminar that new financial instruments, especially commodity swaps thatwere underwritten by leading banks, pension funds and hedge funds, had led tothe ‘financialization’ of agricultural commodity markets. An active discussionwith the WFP participants showed that the consequences for food security arestill poorly understood. See also Munier and Briand (2009) for further analysisof the financialization of agricultural commodity prices.
There is a clear case to be made that the sudden spike in wheat and cornprices was due to financial speculation. The role of financial speculation in the formation of agricultural commodity prices (as opposed to its role inmanaging risk from price movements) is highly controversial in the economicsprofession. For example, Wright (2009) argues that there is no mechanism bywhich added speculative investments in futures markets can cause prices onspot markets to increase unless these investments affect consumptiondecisions and resulting storage balances, and ‘there is no credible evidence’this has happened. Wright (2009) does not consider the possibility that higherfutures prices themselves might affect expectations, and ‘localized’ storagedecisions, among market agents who are not actively engaged in organizedcommodity markets. The discussion of the industrial organization of theworld rice economy (see Chapter 3 in this book) argues that these localizeddecisions contributed directly to the speculative spike in rice prices during the2007–2008 food crisis.
Why rice?
The trick is to explain what happened to rice prices in 2007 and 2008. Futuresmarkets for rice are thinly traded, and there is little opportunity for financialspeculation in rice prices. The supply and demand fundamentals for rice weresupportive of the gradual increase in world prices from their lows in 2001, butproduction had been increasing steadily, stocks relative to use had beenincreasing since 2003, and supplies available for export were adequate fornormal demand.
FOOD CRISES PAST, PRESENT (AND FUTURE?) 7
ES_RC_9-8 18/8/10 20:23 Page 7

Rice stocks in India and China had been reduced sharply between the late1990s and the early 2000s as a conscious policy of both governments. Withworld prices low and declining, and very high storage costs being incurred,these stock reductions seemed entirely appropriate. As rice prices began to riseafter the lows in 2002, rice stocks also began to increase again. This stockhold-ing behaviour is entirely consistent with modern ‘supply of storage’ theories(Williams and Wright, 1991; Timmer, 2009).
There was no reason to expect a sudden surge in rice prices and, indeed,there was no surge until late in 2007. The timing is hard to explain, as riceprices started their rapid increase only shortly before the peak in wheat prices.Once the spiral started, however, rice prices then shot up far more rapidly thanhad wheat or corn prices, to a relatively higher peak in May 2008. The riceprice explosion was the reason for much of the public anxiety about thewelfare impact of the world food crisis because so many of the world’s poor arerice consumers. No lessons from the food crisis are of much relevance withoutunderstanding how this price spiral happened (and how it was stopped). Thatis the subject of this volume.
Asian rice policy during the crisis
The origin of this book lies in a workshop organized by FAO in Chiang Mai,Thailand, from 9–12 February 2009, which brought together a number of ricespecialists to discuss ‘what went wrong with the world rice market?’. Thesessions placed individual country experiences in the context of what happenedin the world market itself. This book has been developed from the paperspresented at the workshop, with two additional contributions commissionedespecially for this volume (papers on the Philippines and the US).
Three overview chapters focus on the global market. Dawe and Slaytonpresent an insider’s view of how policies pursued by individual countries led tothe crisis in the world rice market in 2007–2008. The Timmer paper, bycontrast, uses basic analytical models and time-series data to address the roleof speculation in the formation of rice prices. The third chapter in thisoverview section, by Alexander Sarris, reviews the history of rice trade andpresents suggestions for how to change trade regimes to improve food security.
The country discussions are grouped into four categories: traditionalimporters, traditional exporters, the ‘giant’ countries of China and India, anddeveloped countries – Japan and the US.
There were sharp contrasts among the importing countries. The chapterby Hossain and Deb shows that domestic prices in Bangladesh rose substan-tially in the months before the world market crisis, although the crisis thensent prices even higher as Bangladesh tried to import from India. Farmersresponded to the higher prices with a record boro crop, and domestic priceseventually began to fall in the face of this additional production coupled withlower prices on the world market. Indonesia, by contrast, was largely self-sufficient in rice in 2008. Indeed, as the chapter by Saifullah shows, Indonesia
8 INTRODUCTION
ES_RC_9-8 18/8/10 20:23 Page 8

actually banned the export of rice in an effort to calm expectations aboutprice increases, a move that was successful. The chapter by Balisacan,Sombilla and Dikitanan shows that the Philippines also experienced sharpincreases in domestic prices, and highlights the lack of long-term investmentin efficient rice production that has left the country highly exposed to worldmarkets.
Two chapters present the rice import story for Africa. The chapter by Aker,Block, Ramachandran and Timmer focuses on short-run policy responses inseveral West African countries. Historically, these countries had been reason-ably successful at stabilizing their domestic rice prices, but the movements in2008 were so large that much of the increase was passed into local markets,angering consumers. These countries were vulnerable to the world marketbecause of their high dependency on imports. Indeed, the continent has becomea large player in the world rice market, taking about a third of availablesupplies in the past several years. The chapter by Gajigo and Denning arguesthat import dependence in sub-Saharan Africa will probably continue to grow,despite favourable conditions for increased rice production.
Domestic prices increased sharply not only in many importing countries,but also in exporting countries. The chapter by Poapongsakorn on Thailandfocuses on the political economy of domestic rice production and trade.Because Thailand is by far the world’s leading exporter, its policy decisions hadimportant implications for the world rice market, including its discussions offorming a rice exporters’ cartel. The chapter by Pham discusses how Viet Nam,as a major exporter, benefited from higher prices. Despite higher fertilizerprices, higher rice prices meant improved incentives for farmers, whoresponded with increased production. The benefits to farmers were short-lived,however, as domestic prices collapsed in the second half of 2008. Cambodiahas returned to the world rice economy as an exporter after several decades ofisolation and reconstruction. The chapter by Pandey and Bhandari shows thatprices also increased in Cambodia and highlights the obstacles to increasingCambodia’s exports, especially in the areas of grain quality, processing, trans-portation and links to major buyers.
China and India are the giants of the rice world, producing and consumingmore than half the world’s output. Until 2008, both countries had been signifi-cant exporters of rice, but both countries reduced exports during the crisis. Thechapters by Fang on China and by Gulati and Dutta on India explain thereasons for these changes in export policies and show that, along withIndonesia, they were able to contain domestic price increases by restrictinginternational trade.
The rich Asian countries were largely spared any impact from the worldrice crisis because their domestic prices were already so high that even thesharp spike did not create parity with world prices. The chapter by Ito arguesthat Japan should play a more active role in stabilizing the world rice market,and discusses this role in the context of political pressures that keep Japaneserice prices very high. The role of the US in helping to pop the speculative
FOOD CRISES PAST, PRESENT (AND FUTURE?) 9
ES_RC_9-8 18/8/10 20:23 Page 9

bubble by agreeing to allow Japanese re-exports of imported rice is discussedby Slayton.
This book helps provide an improved understanding of what happened(and why) on both world and domestic markets during the rice crisis of2007–2008. The next step, using further analysis and political discussion, is toidentify feasible policies that can be implemented to return world rice prices tolower and more stable levels with a view to improving food security for thebillions of people who rely on rice as their staple food or as a key source offamily income.
ReferencesBarker, R. and Herdt, R. W. (with Rose, B.) (1985) The Rice Economy of Asia,
Resources for the Future, Washington, DCFalcon, W. P. (1970) ‘The Green Revolution: Generations of problems’, American
Journal of Agricultural Economics, vol 52, pp698–710Falcon, W. P. and Timmer, C. P. (1974) ‘War on hunger or new Cold War?’, Stanford
Magazine, Fall/Winter, pp4–9, 64FAO (Food and Agricultural Organization of the United Nations) (2009) The State of
Food Insecurity in the World, FAO, RomeGardner, B. L. (1979) Optimal Stockpiling of Grain, Lexington Books, LexingtonJohnston, B. F. and Cownie, J. (1969) ‘The seed-fertilizer revolution and labor force
absorption’, American Economic Review, vol 59, pp569–582Munier, B. and Briand, A. (2009) ‘Agricultural market uncertainty and
financialization: A micro-disequilibrium macro-equilibrium integrated model’,MOMAGRI Working Paper No 2009-1 (29 May), presented at the Workshop onAgricultural Price Volatility, Sorbonne Business School, 4–5 June 2009, Paris
Naylor, R. and Falcon, W. P. (2008) ‘Our daily bread’, The Boston Review,September/October, pp13–18
Talbot, R. (1977) The World Food Problem and US Food Politics and Policies:1972–1976: A Readings Book, Iowa State University Press, Ames, IO
Timmer, C. P. (1975) ‘Interaction of energy and food prices in LDCs’, AmericanJournal of Agricultural Economics, vol 57, no 2 (May), pp219–224
Timmer, C. P. (1976) ‘Fertiliser and food policy in LDCs’, Food Policy, vol 1, no 2(February), pp143–154
Timmer, C. P. (1986) Getting Prices Right: The Scope and Limits of Agricultural PricePolicy, Cornell University Press, Ithaca, NY
Timmer, C. P. (ed) (1991) Agriculture and the State: Growth, Employment, andPoverty in Developing Countries, Cornell University Press, Ithaca, NY
Timmer, C. P. (1995) ‘Getting agriculture moving: Do markets provide the rightsignals?’, Food Policy, vol 20, no 5 (October), pp455–472
Timmer, C. P. (2008) ‘The causes of high food prices,’ in Asian Development Outlook Update, September, Asian Development Bank, Manila, the Philippines,pp72–93
Timmer, C. P. (2009) Rice Price Formation in the Short Run and the Long Run: TheRole of Market Structure in Explaining Volatility, Center for Global Development,Working Paper 172, May, pp1–46
10 INTRODUCTION
ES_RC_9-8 18/8/10 20:23 Page 10

Timmer, C. P., Falcon, W. P. and Pearson, S. R. (1983) Food Policy Analysis, JohnsHopkins University Press for the World Bank, Baltimore
Wickizer, V. D. and Bennett, M. K. (1941) The Rice Economy of Monsoon Asia, FoodResearch Institute, Stanford University, Stanford, CA, in cooperation with theInstitute of Pacific Relations
Williams, J. C. and Wright, B. D. (1991) Storage and Commodity Markets, CambridgeUniversity Press, Cambridge
Wright, B. D. (2009) ‘International grain reserves and other instruments to addressvolatility in grain markets: Issues and options’, Technical Background Paper for theWorld Grain Forum, May, Russia, University of California, Berkeley
FOOD CRISES PAST, PRESENT (AND FUTURE?) 11
ES_RC_9-8 18/8/10 20:23 Page 11

ES_RC_9-8 18/8/10 20:23 Page 12

Part II
OVERVIEW: THE WORLD RICE MARKET
AND TRADE POLICIES
ES_RC_9-8 18/8/10 20:23 Page 13

ES_RC_9-8 18/8/10 20:23 Page 14

2
The World Rice Market Crisis of 2007–2008
David Dawe and Tom Slayton
Introduction
Between October 2007 and April 2008, a span of just six months, worldmarket rice prices for Thai 100%B tripled, from $335 per ton to over $1000per ton, reaching the highest level ever recorded in nominal terms. Even duringthe world food crisis of 1973–1975, world rice prices had never doubledwithin six months, much less tripled. More than any other event, this pricesurge brought tremendous media attention to the world food crisis of2007–2008.
It is important to note that, after adjusting for inflation, peak prices in2008 were well below the levels reached during the world food crisis in1973–1975. Indeed, in real terms, the average price in 2008 was not even halfof the average price during those three years. Even more strikingly, the peak in2008 (again in real terms) was below the price in 74 of the 82 years between1900 and 1981!1 This shows how much real world rice prices have declinedover the longer term (see Chapter 3).
While the historical perspective is interesting and important, the world ricemarket crisis of 2007–2008 led to substantial surges in domestic rice prices in
ES_RC_9-8 18/8/10 20:23 Page 15

many countries around the world (Dawe and Morales-Opazo, 2009), which inmost countries led to substantial adverse impacts on the welfare of the poor(Ivanic and Martin, 2008; Zezza et al, 2008; Dawe et al, 2010). Because rice isthe most important source of calories for the world’s poor, the world ricemarket crisis was probably the most serious shock to world food security in theprevious 25 years. Thus, it is an event well worth explaining.
For the previous 20 years, the world rice market had been relatively stable(Dawe, 2002) and, as late as September 2007, it seemed as though the worldrice market would not be subject to the price surges seen on the world maizeand wheat markets: world maize prices increased 54 per cent from August2006 to February 2007, followed by an increase in world wheat prices of 125per cent from May 2007 to March 2008.
While world rice prices nearly doubled in nominal terms between thetrough reached in April 2001 ($170 per ton for Thai 100%B) and September2007 ($333 per ton), the gain in real terms was just 67 per cent, and, moreimportant, the rise had been very steady and gradual, especially compared tolater events (see Figure 2.1). Because the rise was gradual and from a very lowstarting point (the lowest real price since at least 1900), and because manyAsian governments stabilize domestic prices, the price increase on worldmarkets between 2001 and 2007 did not lead to substantial domestic priceincreases (Dawe, 2008a). But the world price increases that began in October2007 were too large and too rapid for most countries to neutralize. The objec-tive of this chapter is to describe and explain what happened to the world ricemarket during this time.
16 OVERVIEW: THE WORLD RICE MARKET AND TRADE POLICIES
Figure 2.1 Monthly inflation-adjusted rice prices, January 2000 to September 2007
Note: Data refer to Thai 100B% FOB (free on board).Source: FAO (2009b) for rice prices, IMF (2009) for US consumer price index.
0
50
250
300
350
M1 200
0
M7 200
0
M1 200
1
M7 200
1
M1 200
2
M7 200
2
M1 200
3
M7 200
3
M1 200
4
M7 200
4
M1 200
5
M7 200
5
M1 200
6
M7 200
6
M1 200
7
M7 200
7
2007
US
dolla
rs p
er to
n
100
150
200
ES_RC_9-8 18/8/10 20:23 Page 16

Rice market fundamentals were not the cause
The crisis in the world rice market in 2007–2008 was not caused by adverseshocks to rice production or low rice stocks. First, FAO estimates that worldrice production increased from 635.2 million tons of paddy in 2005–2006(FAO, 2007) to 642.1 million tons in 2006–2007 (FAO, 2009a), an increase of1.1 per cent. While not a large increase, it is similar to the rate of populationgrowth in Asia, which is the main driver of demand as per capita rice consump-tion is declining in most countries and is generally stagnant in others.2 In thesubsequent two years, once world and domestic prices began to increase, worldrice production increased by 2.9 and 4.1 per cent, much greater than the rate ofpopulation growth.
Second, the world rice stock to use ratio was roughly constant in the threeyears (2004–2005, 2005–2006 and 2006–2007) preceding the crisis, at 18 percent. It is true that the world rice stock to use ratio was much higher in earlieryears (for example 37 per cent in 2000–2001), but this was almost exclusivelydue to very high levels of China’s stocks, which reached levels that exceededannual use on several occasions in the late 1990s (i.e. a stock to use ratio ofgreater than 100 per cent) before they were considerably reduced (Dawe,2009).3 China is often an important rice exporter, but it is difficult to arguethat the decline in China’s rice stocks from 1999–2000 to 2003–2004 (severalyears before the crisis) caused the world rice market upheaval in 2007–2008,especially as the decline in stocks did not lead to any major change in China’sinternational trade flows.
In line with the favourable world rice production and stock situationsnoted above, it is also important to note that world rice trade increased duringthe crisis. World rice trade in the first four months of 2008, when pricesincreased by more than 150 per cent, was 20 per cent higher than in the firstfour months of 2007 (Slayton and Timmer, 2008). Thus, there were amplesupplies available on world markets. The favourable situation as regardsproduction, stocks and trade strongly suggests that factors other than basicmarket fundamentals were at work.
Several factors external to the rice sector, however, arguably set the stagefor the rice crisis. Rising oil prices since 2004, a weak US dollar, and biofuelmandates and tariffs all contributed to rising maize and soybean prices, and a4.7 per cent weather-induced decline in world wheat production from2005–2006 to 2006–2007 led to a 67 per cent increase in world wheat pricesfrom May to September 2007. These price increases for petroleum, maize,soybeans and wheat created an atmosphere of concern and thus contributed tothe policy decisions by key rice trading countries, both exporters andimporters. It was these policy decisions that led to a substantially larger andmore rapid price increase on the world rice market than on world maize andwheat markets, and the next section of this chapter discusses these policydecisions in more detail.
THE WORLD RICE MARKET CRISIS OF 2007–2008 17
ES_RC_9-8 18/8/10 20:23 Page 17

Policies, uncertainty and ‘rational panic’4
While maize markets had to contend with biofuel policies and mandates(which added to demand), and wheat prices had to contend with bad weather(which reduced supply), there was no similar fundamental challenge that ricemarkets had to contend with (other than policies). Rice is also barely traded onfutures markets, removing another factor that arguably influenced maize andwheat markets (Gilbert, 2009; see also Chapter 3). Thus, policies and panic arethe only plausible explanation for why rice prices increased so much more, andso much faster, than maize and wheat prices. The thin nature of the world ricemarket, and the large role that governments play in it, make the world ricemarket more vulnerable to such occurrences.
The atmosphere of uncertainty on world commodity markets noted abovecreated incentives for policymakers to secure additional supplies as soon aspossible. While such an approach might be rational for an individual country,it serves to propel prices higher in a vicious circle if all countries implementsimilar policies. Such policy decisions also create further uncertainty withincountries, and can easily cause individual producers, traders and consumers toengage in hoarding. While the action of any one individual is irrelevant,Timmer in Chapter 3 shows that the cumulative effect when millions of house-holds behave in this fashion can be quite substantial. Eventually marketfundamentals will take hold, and when they did, the bubble popped. Inaddition to this ‘rational panic’, the manner in which the demand wasexpressed (for example supplies were purchased at prices well above then-existing market prices) also contributed to the crisis.
While many countries changed their trade policies during the crisis, thefocus here is on three countries that played especially important roles giventheir large roles in the world rice trade. In 2007, India and Viet Nam were theworld’s second and third largest rice exporters, and the Philippines was theworld’s largest rice importer. While shipments from Thailand (the world’slargest exporter) played an essential role in preventing even greater pricesurges, several statements by its government officials unnerved the market.
India
As noted above, the situation in the world rice market up until September 2007was relatively stable, despite the volatility in other commodity markets. But, on9 October 2007, India banned exports of non-Basmati rice (see Figure 2.2).This was a key decision from a country that, from 2002 to 2006, suppliedabout 17 per cent of the world market. This ban was replaced three weeks laterwith a series of ever-higher minimum export prices (MEPs) that were set wellabove world price levels.5 India then once again reverted to an outright ban on1 April 2008. In the wake of these decisions to restrict exports by the world’ssecond largest exporter in 2007, the world market price for Thai 100%Bincreased from $335 per ton in October to $481 per ton in February 2008, anincrease of 43 per cent in four months, before soaring further in March and
18 OVERVIEW: THE WORLD RICE MARKET AND TRADE POLICIES
ES_RC_9-8 18/8/10 20:23 Page 18

April as additional policy decisions in other countries exacerbated the uncer-tainty (see below).
India’s decision to restrict rice exports had its roots in weather-relateddamage to its 2006 wheat crop and resulting wheat imports in 2006–2007(April–March) of 6.7 million tons, the highest level in more than 30 years.Furthermore, world wheat prices were rising rapidly in mid-2007.Continuation of high levels of wheat imports was thus both expensive andpolitically problematic in the run-up to provincial and national elections.6 As aresult, India bartered rice for wheat by reducing both wheat imports and riceexports. This stabilized aggregate national cereal supplies and eliminated theneed for wheat imports.
It should be noted that some exemptions to the ban/MEP were permitted,especially to Bangladesh. For example, India on 1 December 2007, agreed tosupply Bangladesh with 500,000 tons under a government-to-government (G-to-G) contract and two months later agreed to a price of $399 cost and freight(CNF) (the CNF price includes the cost of the rice plus the freight costs forshipment to the destination port). India, however, supplied only 100,000 tonsat this price and eventually the balance was contracted at $430 CNF on 3 April2008. The latter contracts provided for shipment within 60 days of the openingof the letters of credit, but the shipments were only completed in December2008.
THE WORLD RICE MARKET CRISIS OF 2007–2008 19
Figure 2.2 Timeline of key events in the world rice crisis
Note: Price data are weekly, Thai 100%B FOB (FAO, 2009b). Quoted Philippines prices are converted from Viet Nam 25% brokens CNF to Thai 100%B FOB by using freight costs of $30 per ton, financing costs of $10 per ton, and the average quality differential between Thai 100%B and Viet Nam 25% from March 2007 to February 2008 of $40 per ton (the quality differential is calculated based on data in FAO, 2009a). Source: As specified in the Note plus event details from Slayton (2009)
0
250
750
1000
1250
05.01
.2007
16.02
.2007
30.03
.2007
11.05
.2007
22.06
.2007
03.08
.2007
14.09
.2007
26.10
.2007
07.12
.2007
18.01
.2008
29.02
.2008
11.04
.2008
23.05
.2008
04.07
.2008
15.08
.2008
26.09
.2008
07.11
.2008
19.12
.2008
US
dolla
rs p
er to
n
India bans non-Basmati exports 9 Oct
Viet Nam bans new export sales 5 Feb
Philippines pays more than $700 per ton at 11 March tender
Philippines pays $1200 per ton at 17 April tender
Thailand revives OREC proposal 30 April
Thailand publicly considers export restrictions 17 March
Leaked report that US will not object to Japanese
exports 14 May
500
ES_RC_9-8 18/8/10 20:23 Page 19

During the six-month period between October 2007 and March 2008,official statistics indicate over 2.5 million tons of non-Basmati were exportedfrom India. Even after non-Basmati exports were once again banned on 1April, shipments continued – above and beyond those exceptions allowed forthe G-to-G sale to Bangladesh and sales agreed upon to Bhutan, Sri Lanka andothers. From April to December, India exported 905,000 tons of non-Basmati,bringing calendar year 2008 movement to over 2.0 million tons, or 3.2 milliontons below year-earlier shipments.
Although trade did not stop completely, the export restrictions createdsubstantial uncertainty in the market, especially because the duration of therestrictions was not clear (the restrictions had still not been lifted as ofNovember 2009). Informed observers generally expected a substantial shortfallin Indian exports.7 There is little doubt that the uncertain nature of the restric-tions, both in terms of the temporal duration and the magnitude of theexpected export shortfall, made importers nervous.
Viet Nam
Rice production in Viet Nam is spread over three seasons, with the winter-spring crop being the largest and the one that recharges the country’s exportablesurplus. The government regulates the quantity of rice exports, and, in a typicalyear, the export sales quota has been reached by late summer. A new quota isthen not issued until the eve of the harvest of the winter–spring crop in theMekong River Delta (MRD), which typically begins in late February. At thispoint in time, it is relatively clear how large the winter–spring harvest will be,and thus easier to set an export quota while still ensuring that domestic supplieswill be adequate. Between late summer and late February, the execution ofpreviously approved contracts is allowed, but new sales are not.
In 2007, the export sales quota was reached by 21 July and no furthersupplements to the quota were issued. Thus, while there was an export salesban in place in Viet Nam before that in India, this ban was anticipated and didnot substantially disrupt the international rice trade nor create added uncer-tainty.
The situation changed in early 2008, however. New export sales were onceagain allowed from mid-January, but they were only allowed for two and a halfweeks before the government banned new sales due to fears over unseasonablycold weather in the Red River Delta. Initially, it was not clear how long theprohibition was to last. Traders were eventually advised that the ban would belifted by the end of April, but this was subsequently extended through to June,and then was only lifted after a large G-to-G sale was negotiated with thePhilippines. These actions added to uncertainty in the market.
Negotiations between Viet Nam and the Philippines
Despite the ostensible ban on new sales, Vinafood 2 (a state-owned exporter)and selected provincial food exporters were permitted to participate in the
20 OVERVIEW: THE WORLD RICE MARKET AND TRADE POLICIES
ES_RC_9-8 18/8/10 20:23 Page 20

National Food Authority’s (NFA) December 2007 and January 2008 tendersfor imported rice. (The NFA is the state-owned rice importer in thePhilippines.) These tenders resulted in contracts for over 700,000 tons, ofwhich about 620,000 tons were scheduled for first quarter arrival in thePhilippines. The level of arrivals scheduled for the first quarter was higher thancould be delivered given limited carry-over stocks in Viet Nam and the fact thatthe winter–spring harvest in the MRD does not begin until late February,making it difficult to ship such large volumes to Manila before the end ofMarch. In the event, only about 320,000 tons were actually delivered duringthe first quarter. Furthermore, the price paid in the January tender was about$70 per ton higher than that paid in the December tender, despite much smallerincreases in both local Vietnamese and Thai export prices during that time.
In March and April, the Philippines continued to put out more largetenders. More important, however, it agreed to pay the increasingly high pricesbeing quoted by Viet Nam, even though they were above market levels.8 Whilegovernment stocks were low in the Philippines, private stocks (which constitutethe bulk of total stocks) were estimated to be ample, and official forecasts werefor a record dry-season crop. The eventual outcome for the 2008 dry-seasoncrop (which is harvested January to June, with the bulk occurring in Marchand April), was an increase of 5.8 per cent over the previous record set in 2007.Domestic prices did increase from January to February, but the increase was inline with what would be expected based on normal seasonal patterns. Thus,there were no signs of a crisis in the Philippines when the 11 March tender wassigned, although domestic prices did soar soon afterwards.
Despite the solid market fundamentals in the Philippines, it agreed at the11 March tender to buy 25 per cent brokens at a price of $716 CNF, almost 50per cent above the previous sales price, far above prevailing prices in the MRD,and $150 per ton above prices in the spot market. Then, nine days before the17 April tender, NFA announced that there would be another large tender inearly May. This announcement contributed to higher prices and lower quanti-ties offered at the April tender, when NFA bought about 365,000 tons,including 80,000 tons of Viet 25% at an average CNF price of $1200 per ton,$484 higher than the sales price of just one month earlier and again higher thanthe spot market.
These tenders fuelled speculation and higher prices in both the MRD and inthe Philippines, as well as globally. When news of the April sales circulatedwithin the MRD, local traders – including those involved in trading othercommodities – jumped into the market as buyers and within a week there was arun on rice in Ho Chi Minh City (HCMC). Within the course of a two-dayperiod, local prices doubled as rice disappeared from the markets within the city(prices subsequently fell quickly from these peaks). Monthly national averagewholesale rice prices increased in the Philippines by 7 per cent in March,another 18 per cent in April, and by a further 19 per cent from April to July.
During this time, the Philippines made repeated efforts to commerciallytender for US rice, even though the delivered prices would be very high given
THE WORLD RICE MARKET CRISIS OF 2007–2008 21
ES_RC_9-8 18/8/10 20:23 Page 21

the usual premium for US rice and the higher freight rates entailed by thelonger shipping distance. The President also publicly pursued a memorandumof understanding (MOU) with Thailand for more rice deliveries. These actions,coupled with the acceptance of the high Vietnamese prices offered at thetenders, conveyed the impression that the Philippines would be willing to payalmost any price for rice imports. This very inelastic demand is difficult toreconcile with the large dry season harvest, which has accounted for 42 percent of the annual harvest in recent years. Furthermore, it is not clear why thetenders were so large, or why a subsequent tender in May required a sovereignguarantee. Both of these conditions made it more difficult to procure rice atcompetitive prices from a wide array of traders.9
Thailand
While a number of countries restricted exports during the crisis, Thailand, inthe end, never did. For six consecutive months beginning with October 2007,monthly Thai exports topped 1.0 million tons and during the subsequentfour months sailings averaged 914,000 tons. Indeed, over the 12 monthsending in September 2008, Thailand exported more than 11.7 million tons.10
Without these exports, it is hard to imagine how high world prices wouldhave gone.
Nevertheless, Thai policies and statements also contributed to the uncer-tainty in the world market. In February 2008, the head of the Ministry ofCommerce’s Public Warehouse Organization called for the newly electedgovernment to auction off half a million tons of its 2.1 million tons of stocks.Thai exporters were in favour of this proposal, but the government kept almostall of its stocks off the market. In mid-March, the Vice-Minister of Commercewas quoted as saying that the government was considering imposition ofexport restrictions for the first time in more than a generation (Bangkok Post,2008). Then, on 28 March, the Minister urged farmers not to sell as hepredicted prices would reach $1000/ton by June (he did not specify whether hewas referring to prices of Jasmine rice or 100%B). Thailand later insisted thatit would not restrict exports and, indeed, it did not, but the threat of suchaction added to market uncertainty.
In late April, the Thai government resurrected a proposal that Thailand,Viet Nam, Cambodia and Myanmar create a rice exporter cartel, theOrganization of Rice Exporting Countries (OREC). Not surprisingly, thisproposal heightened market fears, and the Philippines and internationalorganizations such as the Asian Development Bank came out against theproposal. The cartel plan was endorsed by Cambodia’s prime minister, butworld public opinion forced Thailand to withdraw the proposal on 6 May –just one week after it had been unveiled (USDA, 2008b).
22 OVERVIEW: THE WORLD RICE MARKET AND TRADE POLICIES
ES_RC_9-8 18/8/10 20:23 Page 22

Government stockpiling, more export restrictions, the media and international organizations
In addition to efforts by the Philippines to stockpile rice, other countries madesimilar moves. Malaysia, for example, announced plans in mid-January 2008to increase Bernas’ stock levels sixfold from two weeks (92,000 tons) to threemonths (550,000 tons).11 Nigeria announced plans to increase imports by anextra 500,000 tons and build up its strategic reserve by the end of 2008. Whilethese plans failed to materialize after world prices reversed direction, the state-ments of intent contributed to sending prices higher.
Exporters other than India, Viet Nam and Thailand also contributed tomarket uncertainty. Egypt suspended exports in mid-January, and the banremained in place for almost a month, although it was then replaced with anexport tax of more than $50 per ton. By the end of March, a ban was back inplace, due to expire in October. In early June, however, the ban was extendedto April 2009. China delayed issuance of export quotas during the crisis, andshipped out only 56,000 tons at the peak of the market during April–June2008, down from 170,000 tons during the same period one year earlier, despiteholding substantial stocks.12 And Cambodia also temporarily banned exports,although this ban was not as strict or effective as many thought (see nextparagraph).
The media also played a role through superficial reporting of some of theexport restrictions. For example, Cambodia’s decision in late March 2008 toban exports was given more play in the popular press than was warrantedgiven its actual impact. Not only was the ban temporary (two months), but itwas also soon largely lifted. About two-thirds of Cambodia’s exports are madevia Viet Nam, and the ban on shipments by the three eastern-most provinceswas lifted within two weeks of the original announcement. Further, Cambodiais a very minor exporter – USDA (2009) estimates its annual exports averagedabout 330,000 tons from 2004–2005 to 2006–2007 – and movement out ofthe country probably had largely occurred before the ban was announced(most of Cambodia’s shipments occur around the beginning of the calendaryear immediately after its main crop is harvested). Finally, the Cambodian–Vietnamese border is very porous and enforcement of the edict was probablydifficult.
Similarly, at the peak of the crisis in late April it was reported that Brazil –(also a minor exporter – USDA (2009) reports its exports over the precedingthree years as averaging just over 250,000 tons) had banned all rice exports.Within a few days, it was clarified that this only involved government-heldstocks, but most buyers probably did not hear of this distinction.
Finally, statements by key officials of well-known international organiza-tions forecast higher prices. While understandable on one level given thedeclining funds devoted to agricultural development during the past 20 years,such statements are viewed by many as authoritative and contribute to marketjitters (see Chapter 14 for specific examples of such statements).
THE WORLD RICE MARKET CRISIS OF 2007–2008 23
ES_RC_9-8 18/8/10 20:23 Page 23

In sum, a series of government actions in India, Viet Nam, the Philippines,Thailand and other countries created substantial uncertainty in the world ricemarket.13 These policy decisions collectively created a speculative bubble thatencouraged farmers, traders and consumers to hoard rice, further increasingprices.14
The bubble pops
The first two weeks of May brought two natural disasters: Cyclone Nargisstruck Myanmar’s Irrawaddy Delta on 3 May and a strong earthquake joltedSichuan province in China on 12 May. Initial estimates of losses due to CycloneNargis were placed at 2 million tons of paddy, although these estimates eventu-ally proved to be too high.
But, around the same time, the Philippines aborted its 5 May tender asthere was only one bidder (Vinafood 2; at least two bids are legally required inorder to execute a purchase), and that one did not meet the sovereign guaran-tee requirement that the Philippines imposed. Four days later, the Philippinespublicly disclosed that it was negotiating with Japan for 60,000 tons of itsdomestic rice. That same day, the Center for Global Development (CGD)released a paper arguing that world rice prices could be reduced drastically andquickly if the US would allow Japan to export some or all of its 1.5 milliontons of imported rice (Slayton and Timmer, 2008). The paper also pointed outthat Thailand and China had large stocks available for export.
US Congressional Committee hearings on the food crisis were held on 14May, and that evening Bloomberg news quoted an unnamed US trade officialthat the US would not object if Japan were to release its stocks. That week, USrice futures prices fell for four straight days, and rice futures prices in Thailandbegan a 29 per cent decline from 13 May to 3 June. The Philippines announcedon 19 May that Japan might provide it with 250,000 tons, including 200,000tons of imported rice. On 21 May, major Thai exporting companies began toonce again provide daily price quotations, a long-standing practice they hadsuspended in February. At a high-level conference at FAO on 2 June, Japanpledged to export over 300,000 tons of imported rice. In the event, Japan neverdid export the rice that it pledged; indeed, rice exports in 2008 were only117,000 tons, less than in 2007. But the mere prospect of this additional ricebeing released onto world markets seemed to have been sufficient to reverse theupward momentum of prices. According to weekly FAO (2009b) data, Thai100%B rice prices peaked in the second half of May at more than $1000 per tonFOB and slid downward from there. The decline in rice prices thus occurredeven though oil prices were still rising (they did not peak until early July).
NFA then concluded a G-to-G deal with Viet Nam for 600,000 tons inmid-June, and signalled that it had met its import demands for the year, and afew days later Viet Nam lifted its export ban. Thailand had also indicated thatit was considering unloading some of its stocks. These events helped reverse thedominant bullish market psychology that held sway just several weeks earlier.
24 OVERVIEW: THE WORLD RICE MARKET AND TRADE POLICIES
ES_RC_9-8 18/8/10 20:23 Page 24

This downward momentum was eventually sustained by larger macroeco-nomic forces and the financial and economic crisis. Freight rates, as measuredby the Baltic Dry Index, began a sharp decline that saw rates decline 94 percent from early June to the end of the year. World oil prices peaked at amonthly average of $133 per barrel of West Texas Intermediate in July, andurea prices peaked in August. For the remainder of the year, cereal pricesdeclined substantially. By December, average monthly prices for rice, wheatand maize had all declined by 45 to 50 per cent from their peaks earlier in theyear.
Conclusions
While free markets do not always deliver optimal price stability, the world ricecrisis of 2007–2008 was not due to a failure of free markets: governmentpolicy decisions were decisive in sparking and fuelling the crisis. The world ricemarket is particularly vulnerable in this regard because it is relatively thinlytraded15 and because of the large role played by governments in the interna-tional trade that does take place. Government interventions by many countries,including major exporters and importers, created uncertainty and encouragedhoarding and panic on the part of other governments, farmers, traders andconsumers. The role of state-owned enterprises was particularly problematicduring the crisis due to their lack of transparency in conducting trade. Whilethe private sector is not transparent either, its activities are constrained bycompetitive forces, which is not true for governments.
The world market price crisis eventually led to domestic price surges in anumber of countries, examples of which are discussed in other chapters of thisbook. These increases in domestic prices caused severe hardship for many poorconsumers, who in most of these countries dominate the lowest parts of theincome distribution. These consequences underline the need to improve thefunctioning of the world rice market in times of crisis.
While governments will most likely continue to play an important role inthis market, this role needs to be more transparent and predictable, and shouldbe tempered by a much greater role for the private sector (see the concludingchapter of this book). Such relatively simple changes would most likely havebeen sufficient to avoid the crisis that occurred, even in the absence of othermeasures that have been discussed (for example regional stocks, larger nationalstocks, virtual reserves).
Notes1 Seven of the eight exceptions were during the depth of the Great Depression and
the three years immediately prior to the 1973–1975 world food crisis.2 It should be noted, however, that world and Asian rice production have been
growing at rates slower than Asian population growth since 1990 (Dawe, 2008b).This is a serious medium- to long-term problem, but does not change the fact thatsudden production shortfalls did not spark the world rice crisis. The slow long-
THE WORLD RICE MARKET CRISIS OF 2007–2008 25
ES_RC_9-8 18/8/10 20:23 Page 25

term growth of yield (and production) relative to population was most likelyresponsible for the gradual climb in rice prices from 2001 to 2007 (see Chapter 3).
3 The stock releases in China stabilized domestic consumption in the face of largedeclines in production for both rice (19 per cent) and wheat (24 per cent) between1999 and 2003. The production declines were due primarily to large declines inarea harvested in the face of increased labour scarcity.
4 The discussion in this section draws heavily on Slayton (2009).5 The first MEP on 31 October was set at $425 or $100/ton above prevailing
Pakistani 25%, but in late December it was raised to $500 – $150/ton above FOBKarachi values. On 9 March 2008, the MEP was boosted to $650 or $190 overPakistani 25% quotes.
6 There were elections in several important states such as Madhya Pradesh,Rajasthan, Chhattisgargh and Delhi in late 2007 and the national election in 2008.Traditionally, food inflation plays a significant role in deciding the electionoutcome as high food prices impact the livelihood of aam aadmi (common man)who spend more than half of their income on food.
7 The US Department of Agriculture (USDA) initially forecast a 1.8 million tondecline in exports (USDA, 2007), but revised this to a decline of 3.5 million tons asthe magnitude of India’s 2008 export volume became apparent (USDA, 2008a).
8 This same practice of paying above market levels continued into 2009 (Reuters,2009).
9 Viet Nam’s policy of limiting domestic participation in the NFA tenders also helpedto propel world prices higher.
10 This was 3.1 millions tons above the export levels averaged during 2002–2006.11 Bernas is Malaysia’s sole rice importer.12 China’s annual export quotas for rice are typically only decided by the National
Development & Reform Commission about one month after the end of the lunarNew Year celebrations. As of late April 2008, however, a senior official was quotedas saying export quotas for 2008–2009 still had not been issued (ChinaKnowledge, 2008).
13 Other government actions fuelled speculation in domestic markets, but thoseactions are not discussed in this chapter, which focuses on the world market. Formore details, see Slayton (2009).
14 It might be objected that the data on stocks do not show a large increase during thistime. However, FAO and USDA, the two main sources of stock data, only maintaindata on an annual basis. Furthermore, the quality of the data is acknowledged to below given the difficulties of convincing market participants to provide accurateinformation, and this difficulty would be amplified in a crisis situation where somegovernments threatened severe penalties (for example life imprisonment) for hoard-ing or speculation. The volume of stocks held by billions of small consumers acrossAsia is another large source of uncertainty (see Chapter 3).
15 During the period 2000–2007, world exports constituted 7, 13 and 20 per cent ofproduction for rice, maize and wheat, respectively.
AcknowledgementsThe authors would like to thank Keith Wiebe for helpful comments.
26 OVERVIEW: THE WORLD RICE MARKET AND TRADE POLICIES
ES_RC_9-8 18/8/10 20:23 Page 26

ReferencesBangkok Post (2008) ‘Ministry may put cap on rice export prices’, 18 March,
Bangkok PostChina Knowledge (2008) ‘China continues to export rice this year’, 24 April,
www.chinaknowledge.com/Newswires/News_Detail.aspx?type=1&NewsID=14798 Dawe, D. (2002) ‘The changing structure of the world rice market, 1950–2000,’ Food
Policy, vol 24, no 4, pp355–370Dawe, D. (2008a) ‘Have recent increases in international cereal prices been transmitted
to domestic economies? The experience in seven large Asian countries’, Agriculturaland Development Economics Division (ESA) Working Paper 08-03, Food andAgricultural Organization, Rome, www.fao.org/es/esa/en/pubs_wp.htm
Dawe, D. (2008b) ‘Running out of steam: One cause of today’s high rice prices isslowing productivity growth – suggesting it is time to step up investment in interna-tional agricultural research’, Rice Today, vol 7, no 3, p41
Dawe, D. (2009) ‘The unimportance of “low” world grain stocks for recent worldprice increases’, Agricultural and Development Economics Division (ESA) WorkingPaper 09-01, Food and Agricultural Organization, Rome,www.fao.org/es/esa/en/pubs_wp.htm
Dawe, D. and Morales-Opazo, C. (2009) ‘How much did developing country domesticstaple food prices increase during the world food crisis? How much have theydeclined?,’ Agricultural and Development Economics Division (ESA) Working Paper09-09, Food and Agricultural Organization, Rome,www.fao.org/es/esa/en/pubs_wp.htm
Dawe, D., Block, S., Gulati, A., Huang, J. and Ito, S. (2010) ‘Domestic rice price andmarketing policies’, in Pandey, S. (ed) Rice in the 21st Century Global Economy:Strategic Research and Policy Issues for Food Security, International Rice ResearchInstitute, Metro Manila
FAO (Food and Agriculture Organization of the United Nations) (2007) Rice MarketMonitor, December, FAO, Rome, www.fao.org/es/esc/en/15/70/highlight_71.html
FAO (2009a) Rice Market Monitor, September, FAO, Rome, www.fao.org/es/esc/en/15/70/highlight_71.html
FAO (2009b) ‘International commodity prices online’, FAO, Rome,www.fao.org/es/esc/prices/PricesServlet.jsp?lang=en
Gilbert, C. (2009) ‘Understanding spikes and speculation in agricultural commoditymarkets’, paper presented to the Experts’ Meeting on ‘Institutions and Policies toManage Global Market Risks and Price Spikes in Basic Food Commodities’, 26–27 October, FAO, Rome
IMF (International Monetary Fund) (2009) ‘International Financial Statistics online’,IMF, Washington, DC, www.imf.org/external/data.htm
Ivanic, M. and Martin, W. (2008) ‘Implications of higher global food prices for povertyin low-income countries’, Agricultural Economics, vol 39, pp405–416
Reuters (2009) ‘Philippines bought rice above market prices’, 3 July, www.flex-news-food.com/pages/24668/Philippines/rice/philippines-bought-rice-above-market-prices.html
Slayton, T. (2009) ‘Rice crisis forensics: How Asian governments carelessly set theworld rice market on fire’, Center for Global Development Working Paper 163,March, Center for Global Development, Washington, DC
THE WORLD RICE MARKET CRISIS OF 2007–2008 27
ES_RC_9-8 18/8/10 20:23 Page 27

Slayton, T. and Timmer, C. P. (2008) ‘Japan, China and Thailand can solve the ricecrisis – but US leadership is needed’, Center for Global Development, Washington,DC, May, www.cgdev.org/content/publications/detail/16028/
USDA (United States Department of Agriculture) (2007) ‘India grain and feed quarterlylock-up report: November’, GAIN Report number IN7103, USDA, Washington,DC, www.fas.usda.gov/gainfiles/200710/146292819.pdf
USDA (2008a) ‘India grain and feed quarterly lock-up report: May’, GAIN Reportnumber IN8045, USDA, Washington, DC, www.fas.usda.gov/gainfiles/200805/146294541.pdf
USDA (2008b) ‘Thailand grain and feed OREC: May’, GAIN Report number TH8071,USDA, Washington, DC, www.fas.usda.gov/gainfiles/200805/146294568.pdf
USDA (2009) ‘Production, supply and distribution online’, USDA, Washington, DC,www.fas.usda.gov/psdonline/psdquery.aspx
Zezza, A., Davis, B., Azzarri, C., Covarrubias, K., Tasciotti, L. and Anriquez, G.(2008) ‘The impact of rising food prices on the poor’, FAO ESA Working Paper 08-07, FAO, Rome, ftp://ftp.fao.org/docrep/fao/011/aj284e/aj284e00.pdf
28 OVERVIEW: THE WORLD RICE MARKET AND TRADE POLICIES
ES_RC_9-8 18/8/10 20:23 Page 28

3
Did Speculation Affect World Rice Prices?
C. Peter Timmer
Introduction
Did speculation affect the formation of rice prices during the rapid escalationof prices in world markets late in 2007 and early in 2008? Although debated atthe time, in retrospect – after the sudden collapse of most commodity pricesand the rapid decrease in rice prices between June and August – the answer iseasy: of course it did. The questions now are how much, through what mecha-nisms, what will happen as these influences unwind, and how is the story forrice different from other commodities?
To answer these questions, this chapter1 addresses four separate topics,each linked to the others by basic mechanisms of price formation. Simplesupply and demand models are a start and are developed in the next section.The difference between short-run responses to prices changes and thoseresponses after full adaptation is possible in the long run, is crucial and theconceptual model highlights the importance of these differences for under-standing current prices. History matters.
But storage and price expectations also become important for storablecommodities in the short run – the length of time the commodity can be stored– a year or so for rice. A model of the ‘supply of storage’, a staple of commod-ity market analysis for more than half a century, is used to understand the
ES_RC_9-8 18/8/10 20:23 Page 29

factors affecting price expectations, and price formation, in the short run. Thismodel is very powerful in its ability to explain hoarding behaviour and subse-quent impact on prices.
The supply of storage model is less successful in explaining the impact onspot market prices of futures market prices that are driven by ‘outside’ specula-tors, i.e. those who have no interests in owning the actual commodity but areinvesting solely on the basis of expected price changes on futures markets. Therole of outside speculators in commodity price formation is an old debate,although one that has usually not included rice because of the thinness of ricefutures markets.
Next, this debate over the role of speculation is revived in an effort tounderstand the impact of financial factors and actors on commodity priceformation using very short-run prices and Granger causality analysis, for awide range of financial and commodity markets, including rice. These resultsare highly preliminary, but are also very provocative. Speculative money seemsto surge in and out of commodity markets, strongly linking financial variableswith commodity prices during some time periods. But these periods are oftenshort and the relationships disappear entirely for long periods of time. Thelinks between financial markets and commodity markets are not simple nor arethey stable. Much more research is needed to understand both the short-runand long-run linkages between financial and (food) commodity markets.
Finally, the chapter addresses the long-run relationship between prices ofthe three basic cereal staples, rice, wheat and corn (maize), since 1900. It isclear there has been a long-run decline in the prices of all three cereals. There isa basic commonality in this decline, as all three commodities have trend pricedeclines of more than 1.0 per cent per year over the past century. Further, thisdecline accelerated after the mid-1980s, again for apparently common reasons.Only the recent run-up in cereal prices in 2007–2008 returned them to thelong-run downward trend. Despite these common features, however, andimportant cross-commodity linkages, price formation for rice has severalunique dimensions that are also worthy of further study.
The analytics of what causes high food prices
Understanding causation implies an empirically refutable model of mecha-nisms of action. For food prices, this means an analytical model based onsupply and demand mechanisms with equilibrium prices derived from basiccompetitive forces. There are many such models in existence (IFPRI, FAPRI,MOMAGRI, FAO, USDA), but none that address the specific issues in thischapter (Munier, 2008; Trostle, 2008).
Here we seek to understand the contribution from a wide range of basiccauses to price formation for three important staple food grains – rice, wheatand corn.2 Some of these causes may be exogenous, for example weathershocks or legislated mandates for biofuel usage. But many will be endogenous,for example responses of producers and consumers to prices themselves,
30 OVERVIEW: THE WORLD RICE MARKET AND TRADE POLICIES
ES_RC_9-8 18/8/10 20:23 Page 30

perhaps even policy responses of governments to prices. Export bans for rice asa way to prevent domestic food price inflation are an obvious example(Brahmbhatt and Christiaensen, 2008; Slayton and Timmer, 2008; Slayton,2009).
The model of price formation developed here attempts to incorporate all ofthese factors in a rigorous enough way to bring data to bear on answering thekey question: what caused the recent run-up in world market prices for thesebasic commodities, and why did prices come down so sharply? For several ofthe factors, the answers remain more impressionistic than statistical, but wepush the statistical approach as far as it will go (perhaps too far; see theGranger causality tests below).
A simple model of price formation to use as a heuristic device
Consider the most basic model of commodity price formation that is capable ofilluminating our problem:
Dt = f(at Pt, srd, Pt�n, lrd) = atPtsrd Pt�n
lrd
St = g(bt Pt, srs, Pt�n, lrs) = btPtsrs Pt�n
lrs
where Dt = demand for the commodity during time t; St = supply of thecommodity during time t; f and g = functional forms for demand and supplyfunctions, respectively; at = time-dependent shifters of the demand curve; bt = time-dependent shifters of the supply curve; Pt = equilibrium market priceduring time t; Pt�n = market price during some previous time period t�n; and,srd, srs, lrd and lrs = indicators that demand and supply responses will varydepending on whether they are in the short run sr or long run lr. In the specifi-cation below, these will be short-run and long-run supply and demandelasticities.3
In short-run equilibrium, Dt = St. For simplicity (and the ability to workdirectly with supply and demand elasticities), assume the demand and supplyfunctions are Cobb-Douglas. Then:
logat + srd logPt + lrd logPt�n = logbt + srs logPt + lrslog Pt�n
Solving for the equilibrium price P:
logPt + [logbt � logat] / [srd � srs] + log Pt�n [lrs � lrd] / [srd � srs]
Taking first differences to see the factors that explain a change in price from t�1 to t reveals a somewhat complicated result:
dlogPt ={[logbt � logbt�1] / [logat � logat-1]} / [srd � srs] +[logPt�n � logPt�(n+1)][lrs � lrd] / [srd � srs],
DID SPECULATION AFFECT WORLD RICE PRICES? 31
ES_RC_9-8 18/8/10 20:23 Page 31

where dlogPt = the percentage change in price from time period t�1 to timeperiod t (for relatively small changes). This is what we are trying to explain.What ‘causes’ changes in dlogPt? Why are food prices high (or low)?
To answer these questions, it helps to simplify the equation. Let SR = thenet short-run supply and demand response srd � srs, which is always negativebecause srd < 0 and srs > 0. Let LR = the net long-run supply and demandresponse lrs � lrd, which is always positive, for similar reasons (note that thedemand coefficient is subtracted from the supply coefficient in this case, theopposite from the short-run coefficients above). Let dlogbt = logbt � logbt-1,which for small changes is the percentage change in the supply shifters. Letdlogat = logat � logat�1, which for small changes is the percentage change in thedemand shifters. Finally, let dlogPt�n = logPt�n � logPt�(n+1), which for smallchanges is the percentage change in the commodity price for some specifiednumber of time periods in the past, for example, five or ten years (after whichthe long-run producer and consumer responses to price have been fullyrealized).4
Combining all of these new definitions, we have a simpler equationexplaining percentage changes in commodity prices:
Per cent change in Pt = [per cent change in bt � per cent change in at]/SR + [per cent change in Pt�n] LR/SR
The ‘surprising’ result is how simple the answer appears to be. There are fourkey drivers:
1 the relative size of changes in at to bt, i.e. factors shifting the demand curverelative to factors shifting the supply curve;
2 the relative size of short-run supply and demand elasticities (srs and srd);3 the relative size of long-run supply and demand elasticities (lrs and lrd);4 how large the price change was in earlier time periods.
Why the analytics matter
A simple numerical example, with plausible parameters, shows the power ofthis ‘explanatory’ equation. Assume the following numerical parameters forpurposes of illustration:
srd = �0.10
srs = +0.05
lrd = �0.30
lrs = +0.50
These values imply that SR = �0.15 and LR = 0.80.
32 OVERVIEW: THE WORLD RICE MARKET AND TRADE POLICIES
ES_RC_9-8 18/8/10 20:23 Page 32

The short-run elasticities assumed here are quite low, but realistic forannual responses. Demand responds 1 per cent for a 10 per cent change inprice; supply only responds by half a per cent to a similar 10 per cent pricechange (the signs, of course, are negative for demand and positive for supplyresponses).
The long-run elasticities are also on the low side of econometric estimates,but again, seem realistic for a world facing increasing resource constraints.Although some estimates of long-run supply response are quite high, approach-ing unity or higher, these were estimated for time periods when acreageexpansion was significant and fertilizer usage was just becoming widespread(Peterson, 1979). In principle, these long-run elasticities are net of the short-run elasticities.
Assume, as seems to be the case since the early 2000s, that demand drivershave been larger than supply drivers. A reasonable estimate is that demand hasbeen shifting out by 3.0 per cent per year and supply shifting out just 1.5 percent per year. A (partial) example of such a growing imbalance betweendemand (population growth) and supply (yields) for rice in Asia is shown inFigure 3.1. Finally, assume that prices in the past have been ‘low’, so thechange in Pt�n is �10.0 per cent. What do all these parameters mean for currentprice change?
DID SPECULATION AFFECT WORLD RICE PRICES? 33
Figure 3.1 Annual average percentage increase in rice yields and populationbetween successive rolling five-year periods in rice-producing Asia
Note: The figure shows the annual average percentage change in yields and population. For example, the data for1969 are the change between 1965 and 1969 and 1960 and 1964. Rice-producing Asia is an aggregate of 17large Asian countries (Bangladesh, Cambodia, China, Democratic People’s Republic of Korea, India, Indonesia,Japan, Laos, Malaysia, Myanmar, Nepal, Pakistan, Philippines, Republic of Korea, Sri Lanka, Thailand and VietNam).Source: Raw data from USDA for yields and FAO for population. Chart from Dawe (2008c)
0%
1.0%
2.0%
3.0%
4.0%
1969
1971
1973
1975
1977
1979
1981
1983
1985
1987
1989
1991
1993
1995
1997
1999
2001
2003
2005
2007
Population
Rice yields
ES_RC_9-8 18/8/10 20:23 Page 33

Plugging these values into the price change equation yields the followingresult:
Per cent change in Pt = [1.5 per cent � 3.0 per cent] / �0.15 + [�10.0 per cent] 0.80/�0.15 = [10.0 per cent] + [53.3 per cent]= 63.3 per cent higher
This is a very dramatic result. The imbalance between ‘current’ supply anddemand drivers causes the price to rise by 10 per cent, but the historically low prices (and ‘only’ a 10 per cent decline in the earlier period) cause current prices to be 53 per cent higher, as the long-term, lagged response fromproducers and consumers to these earlier low prices has a very large quantita-tive impact. Much of the slow run-up in food prices from 2003 to 2007 wouldseem to be caused by producers and consumers gradually responding (i.e.reflecting their ‘long-run’ responses) to earlier episodes of low prices,especially from the late 1990s until about 2003. For example, between 1996and 2001 the real price of rice declined by 14.7 per cent per year!
Over long periods of time, the first driver is clearly most important – howfast is the demand curve shifting relative to the supply curve? At the level ofgenerality specified in this model, the actual underlying causes of these shiftsdo not matter. All that matters is the net result. If the demand curve is shiftingoutward by 3 per cent per year, and the supply curve is shifting out by just 1.5per cent per year, the difference of 1.5 per cent per year will push priceshigher, by an amount determined by net short-run supply and demand elasticities with respect to price. The ‘simple’ fact is that commodity pricechanges are driven by the net of aggregate supply and demand trends, nottheir composition.
It is important to realize that the analytical model of price formation makesa sharp distinction between factors that shift the demand and supply curves(the at and bt coefficients) and the responsiveness of farmers and consumers tochanges in the market price (the srs and srd coefficients), which show up asmovements along the supply and demand curve.
Analytically, the distinction is very clear, but empirically it is often hard totell the difference. If farmers use more fertilizer in response to higher grainprices, should this count as part of the supply response or as a supply shifter? Ifgovernments and donor agencies restrict their funding of agricultural researchbecause of low grain prices, is the resulting lower productivity potential asmaller supply shifter a decade later or a long-run response to prices? Whateverthe labels, it is important to understand the causes.
The composition of changing demand and supply trends
This ambiguity can be a serious problem because it is the composition ofchanging demand and supply trends that we are seeking to understand, even
34 OVERVIEW: THE WORLD RICE MARKET AND TRADE POLICIES
ES_RC_9-8 18/8/10 20:23 Page 34

quantify, as a way to understand the causes of changes in food prices. The listof possible factors is long. For demand, it includes (in order of predictability):
1 population (driven by demographic transition, fertility, mortality, famine);2 income growth (driven by economic policy, trade, technology, governance):
– direct consumption,– indirect consumption through livestock feeding or industrial utiliza-
tion;3 income distribution (driven by globalization, food prices, agricultural
growth, structural transformation);4 biofuel demands (driven by political mandates and the price of petroleum):
– direct demand for maize and vegetable oils,– ripple effects on other commodities;
5 US dollar depreciation (most commodities on world markets are priced indollars);
6 food prices (endogenous, driven by supply/demand balance and technicalchange; impact felt through the demand elasticities);
7 private stockholding:– commercial (driven by price expectations and supply of storage),– household (driven by price panics and hoarding);
8 public stockholding (driven by buffer stock policy):– trade policy,– procurement policy;
9 financial speculation:– futures/options markets and ‘sophisticated’ speculators,– role of commodity index funds available to general investors.
For supply, the list is not so long, but the factors may be even more difficult tounderstand and quantify:
1 area expansion:– irrigation and cost of water,– deforestation and environmental costs,– ‘benign’ area expansion in Africa and Latin America?5
2 yield growth:– availability and costs of inputs:
– fertilizer costs,– energy costs,– sustainability issues,
– seed technology and the genetically modified organisms (GMO)debate,
– management improvements/farmer knowledge;3 variability:
– weather,– change.
DID SPECULATION AFFECT WORLD RICE PRICES? 35
ES_RC_9-8 18/8/10 20:23 Page 35

It would be desirable to put quantitative weights on each of the supply anddemand factors in terms of their role in causing price changes for key foodcommodities: rice, wheat, corn. Other researchers are attempting to do thesame thing. The main debates have been over how much biofuels and financialspeculation caused the sharp run-up in food and oil prices in 2007 and early2008, after allowance is made for rising demand for basic commodities inrapidly growing developing countries, especially China and India.
A paper by Don Mitchell, Senior Commodity Economist at the WorldBank, for example, caused a furore when it was ‘leaked’ to the press in July: hisfinding was that perhaps three-quarters of the run-up in grain prices wascaused by US policy toward ethanol production from corn (Mitchell, 2008).6
At the same time, the US Secretary of Agriculture was arguing publicly, at theFAO Food Summit in June, that biofuel production played only a minor role inhigh food prices – 2–3 per cent. Somebody is wrong.
The point is that these are contentious issues with no clearly acceptedmethodology for resolving them, a point also stressed by Abbot et al (2008,p8, emphasis added): ‘The factors driving current food price increases arecomplex. We make no attempt to calculate what percentage of price changesare attributable to the many disparate causes, and, indeed, think it is impossi-ble to do so.’
The simple model here reveals why. If, for example, population growth isadding 1.5 per cent per year to demand for a staple food grain, income growthis adding 0.5 per cent per year to direct demand for that grain, and indirectdemand via livestock feeding is adding 1.0 per cent per year, demand isgrowing by 3 per cent per year. If, at the same time, supply is growing by 1.5per cent per year (0.5 per cent from area expansion and 1.0 per cent fromannual yield growth, for example), the net result is that aggregate demandgrowth exceeds aggregate supply growth by 1.5 per cent per year and this willput upward pressure on the equilibrium price of this food grain. Even if laggedprices had been in long-run equilibrium until demand shifters started tooutstrip supply shifters, just this imbalance of 1.5 per cent per year leads toprice increases of 10 per cent per year with the assumed short-run supply anddemand elasticities. Between 2001 and 2006, real rice prices increased over 8per cent per year on world markets.
What can simple supply and demand models say about the explosion of food prices?
There is no meaningful way to say what element of demand is growing ‘toofast’ so long as each of the components of demand growth is growing relativelysteadily. Indeed, the ‘blame’ for rising grain prices can equally be laid at supplygrowth that is ‘too slow’. Market clearing prices are driven by the aggregate ofsupply and demand in that market at a point in time. Prices themselves cannotreveal the underlying composition of those supplies and demands (the origin ofthe classical ‘identification problem’).
36 OVERVIEW: THE WORLD RICE MARKET AND TRADE POLICIES
ES_RC_9-8 18/8/10 20:23 Page 36

This perspective on formation of market prices presents a conundrum. The‘slow and steady’ shifters of both supply and demand can explain gradualincreases in prices, such as seen from the early-2000s until late 2007 (see Figure3.2). The lagged response to earlier periods of low prices can explain someacceleration in these prices, especially for rice and wheat. But the explosion infood prices late in 2007 and in the first half of 2008 clearly requires additionalexplanation involving factors not incorporated in the simple model of priceformation just outlined. Much of the additional ‘analytical’ explanation ofshort-run price movements will be provided from the supply of storage model,with its focus on links between inventory movements and price expectationsthat can be expressed in futures markets.
The supply of storage model and short-run price behaviour
The link between the supply of grain held in storage and prices in both spotand futures markets has long been the subject of analytical attention (Working,1933, 1948, 1949; Keynes, 1936; Kaldor, 1939; Brennen, 1958; Telser, 1958;Cootner, 1960, 1961; Weymar, 1968; Williams and Wright, 1991). The basic‘supply of storage’ model that has emerged from this theoretical and empiricalwork is the foundation for understanding short-run price behaviour forstorable commodities (Houthakker, 1987). It stresses the interrelated behav-iour of speculators and hedgers as they judge inventory levels in relation to use.The formation of price expectations is the key to this behaviour.
DID SPECULATION AFFECT WORLD RICE PRICES? 37
Figure 3.2 Demand factors contributing to food price formation since 2000
Source: Timmer (2008a)
Long-run decline Recovery
Depreciation of US$
Speculation
Demand in India/China, etc.
Mandates for biofuels in US/Europe
Y
Food
pric
e
2000 2001 2002 2003 2004 2005 2006 2007 2008 2009
ES_RC_9-8 18/8/10 20:23 Page 37

The basic supply of storage model
The basic supply of storage model is a simple extension of the supply/demandmodel already used here. The formulation here follows Weymar’s presentation,with three behavioural equations and one identity (error terms are omitted forsimplicity):
Ct = fc (Pt,PtL) (3.1)
Ht = fh (Pt,PtL) (3.2)
(Pt* � Pt) = fp(It) (3.3)
It = It�1 + Ht � Ct (3.4)
Where C = consumption, P = price, PL= lagged price, H = production (harvest),I = inventory, and P*= expected price at some point in the future. According toWeymar (1968, p28):
The first two equations, indicating the dependency of consump-tion and production on current and/or lagged price, reflecttraditional micro economic theory. While other variables mayappear in these relationships (e.g. consumer income, governmentsupport levels), their exclusion here will not affect the discussionthat follows. [The third equation] represents the ‘supply ofstorage’ curve … and reflects the notion that the amount of acommodity that people are willing to carry in inventory dependson their expectations as to future price behavior. If they feel thatthe price will increase substantially, they will be willing to carryheavier inventories (supply more storage) than would otherwisebe the case. Because the inventory level is in fact determined bythe identity expressed in [the fourth equation], the supply ofstorage function can be used to explain the gap between thecurrent price and price expectations in terms of the current inven-tory level.
Thus the relationship between current inventories and current price helpsexplain price expectations, and vice versa. These price expectations can then beexpressed in prices on futures markets. The actual working out of this theoryempirically requires a close understanding of the behaviour of market partici-pants – farmers, traders, processors and end users (consumers) – in their role ashedgers or speculators. The current controversy over the role of ‘outside’speculators – investors who are not active participants in the commoditysystem – has many precursors in the history and analysis of commodity priceformation on futures markets (see, for example, the Telser-Keynes debatereviewed by Cootner, 1960).
38 OVERVIEW: THE WORLD RICE MARKET AND TRADE POLICIES
ES_RC_9-8 18/8/10 20:23 Page 38

The empirical relevance of the supply of storage model
The empirical difficulty in using the supply of storage model to understandshort-run price behaviour is having current information on inventory levels.This is not such a severe problem when virtually all the commodity storage is incommercial hands, as with cocoa or wheat, and stock levels for such commodi-ties are reported regularly or can be estimated fairly accurately. For acommodity such as rice, however, that is mostly grown by smallholders, ismarketed by a dense network of small traders and processors, and is purchasedby consumers in a readily storable form (milled rice), stock levels can change atany or all levels of the supply chain, and there are virtually no data available onthese inventory levels.
For the purposes here, the main advantage of the supply of storage modelis its ability to build conceptual links between long-run supply and demandtrends, where basic models of producers and consumers provide operationalguidelines to decision-making and price formation, and very short-runmovements in prices that often seem totally divorced from supply and demandfundamentals. Because long-run trends are gradually built up from short-runobservations, these links are crucial for understanding price behaviour even inthe long run.
The key, then, to making the supply of storage model operational in theshort run is to use it to gain insight on formation of price expectations. In thevery short run, from day to day or week to week, these expectations seem to bedriven by a combination of price behaviour for commodities broadly and thespecifics of individual commodities. Broad commodity price trends arecaptured by the International Monetary Fund’s (IMF) commodity price index,the Economist price index, or the Goldman-Sachs commodity price index, forexample. Thus, traders operating in any one specific commodity market, suchas oil, corn or wheat, will be following closely the broader price movements forall commodities (Sanders and Irwin, 2008). These broad price movements seemto be driven by basic macroeconomic forces such as rates of economic growth,the value of international currencies, especially the US dollar, and relative infla-tion rates (Timmer, 2008a).
But traders are also following closely the specifics of the commodity aswell. Here inventories (especially relative to actual use for consumption) arethe key to price formation, once the harvest/supply situation for the crop isestablished. Clearly, the analytics of price behaviour for oil or metals begin tolook quite different from the analytics of food commodities at this stage, asseasonal production and the inherent need to store the commodity for daily usethroughout the year drive inventory behaviour via the supply of storage.
Typically, commodities for which inventory data are reasonably reliabletend to have their short-run prices driven by unexpected supply behaviour,whereas commodities with poor data on inventories, especially where signifi-cant inventories can be in the hands of millions of small agents – farmers,traders, consumers – tend to have their extremes in price behaviour generated
DID SPECULATION AFFECT WORLD RICE PRICES? 39
ES_RC_9-8 18/8/10 20:23 Page 39

by rapidly changing price expectations themselves, and consequent hoarding ordishoarding of the commodity.
The short-run price dynamics for rice thus look significantly different fromwheat or corn, partly because of the different industrial organization of therespective commodity systems. There are surprisingly few studies of individualcommodity systems that are set within this broader macroeconomic andorganizational framework (see Timmer, 1987, for an exception). The worldfood crisis in 2008 provides ample rationale for major new studies within thisframework for all of the major food commodities.
These studies would generate considerable insight into why the short-runprice dynamics for different commodities are so different, especially thevarying roles of financial markets in accommodating, even driving, these pricedynamics. However, long-run price relationships across commodities, and thusthe dynamics of price trends over extended periods of time, are likely to belittle influenced by the industrial organization of the commodity system andmore influenced by changing relative technologies and tastes. These long-runrelationships are analysed in the final section of this paper.
Why the difference in market structure for rice matters in short-run price formation
Experience with world rice prices since the middle of the decade illustrates theimportance of market structure to short-run price dynamics. The actualproduction/consumption balance for rice has been relatively favourable since2005, with rice stocks to use ratios improving slightly. This stock build-up wasa rational response to the very low stocks seen at the middle of the decade andto gradually rising rice prices – exactly what the supply of storage modelpredicts. Short-run substitutions in both production and consumption betweenrice and other food commodities are limited, and until late 2007, it seemed thatthe rice market might ‘dodge the bullet’ of price spikes seen in the wheat, cornand vegetable oil markets. The lack of a deeply traded futures market for ricealso made financial speculation less attractive.
But the world rice market is very thin, trading just 6–7 per cent of globalproduction. While this is a significant improvement over the 4–5 per centtraded in the 1960s and 1970s, it still leaves the global market subject to largeprice moves from relatively small quantity moves.
The global rice market is also relatively concentrated, with Thailand, VietNam, India, the US and Pakistan routinely providing nearly four-fifths ofavailable supplies. Only in the US is rice not a ‘political commodity’ from aconsumer’s perspective (although it certainly is a political commodity forproducers in the US). All Asian countries show understandable concern overaccess of their citizens to daily rice supplies. Both importing and exportingcountries watch the world market carefully for signals about changingscarcity, while simultaneously trying to keep their domestic rice economystable.
40 OVERVIEW: THE WORLD RICE MARKET AND TRADE POLICIES
ES_RC_9-8 18/8/10 20:23 Page 40

As concerns grew in 2007 that world food supplies were limited andprices for wheat, corn and vegetable oils were rising, several Asian countriesreconsidered the wisdom of maintaining low domestic stocks for rice.7 ThePhilippines, in particular, tried to build up their stocks to protect againstshortages going forward. Of course, if every country – or individual consumer– acts the same way, the hoarding causes a panic and extreme shortage inmarkets, leading to rapidly rising prices. Even US consumers are not immunefrom this panic, as indicated by the ‘run’ on bags of rice at Costco and Sam’sClub in April 2008. Such price panics have been fairly common over the past50 years, but the hope was that deeper markets, more open trading regimes,and wealthier consumers able to adjust more flexibly to price changes hadmade markets more stable.8 It turns out this was wishful thinking, as the pricerecord for rice shows.
After an acceleration started in September 2007 in the gradual priceincreases seen for half a decade, concern over the impact of higher rice prices inexporting countries, especially India, Viet Nam and Thailand, started to trans-late into talk, and then action, on export controls.9 Importing countries,especially the Philippines, started to scramble for supplies. Fears of shortagesspread and a cumulative price spiral started that fed on the fear itself.
The trigger for the panic was provided by inter-commodity price linkages.In India, the 2007 wheat harvest was damaged by drought and disease – as inso many other parts of the world. Thus the National Food Authority had lesswheat for public distribution. Importing as much wheat as in 2006 (nearly 7million tons) would be too expensive (both economically and politically)because of the high wheat price in world markets, so the NFA announced itneeded to retain more rice from domestic production.
Barriers were put on rice exports in September – India is the second largestrice exporter in the world, 5 million tons in 2007 – and eventually an outrightban on exports of non-Basmati rice from India was announced in February2008. Other rice-exporting countries followed, as rice prices started to spike.
The newly elected populist government in Thailand did not want consumerprices for rice to go up, and the commerce minister openly discussed exportrestrictions from Thailand – the world’s largest rice exporter, 9.5 million tonsin 2007. On 28 March 2008, rice prices in Thailand jumped $75 per ton. Pricescontinued to skyrocket until it cost over $1100 per ton in April. This is thestuff of panics.
Low and declining rice stocks have been held accountable for the risingprices, with the argument that rice consumption has outpaced rice productionfor a number of years since 2000 (a mathematical inevitability if rice stocks arefalling). Rice stocks in China have come down over the past decade, but thatwas a sensible response to growing reliance on trade as the buffer, and to lowerprices in world markets. There has been little change in rice stocks in the rest ofthe world – indeed, the stocks to use ratio has been rising since 2005. Holdingrice stocks in tropical conditions is extraordinarily expensive, so a smootherflow of rice internationally reduces this wasteful stockholding.
DID SPECULATION AFFECT WORLD RICE PRICES? 41
ES_RC_9-8 18/8/10 20:23 Page 41

Now that the exporting countries are clearly willing to put bans on riceexports to protect their own consumers, nearly all countries will be forced toresort to domestic stockpiles. That is a real tragedy for poor consumers and foreconomic growth – capital tied up in funding inventories is not very productivein stimulating productivity growth.
The psychology of hoarding behaviour is important in explaining why riceprices suddenly shot up starting in late 2007. Financial speculation seems tohave played only a small role (partly because futures markets for rice are verythinly traded). Instead, decisions by millions of households, farmers, tradersand some governments sparked a sudden surge in demand for rice and changedthe gradual increase in rice prices from 2002 to 2007 into an explosion. Thiswas ‘precautionary’ demand even if not ‘speculative’ demand, to employ thelanguage Keynes (1936) used in the debate over the role of speculative demandin the supply of storage.
A rough calculation of the effect of household hoarding of rice shows thepotential. Assume that 1 billion households consume 1 kilogram (kg) of rice aday (for a total consumption of 365 million tons, for the year, which is theright magnitude). Assume they keep a one-week supply in their pantry, or 7kgper household, which is 7 million tons of household stocks in total. Thisquantity probably varies by income class, with the very poor buying hand tomouth, and better-off households storing more just for convenience. Whenprices start to rise, or the newspapers/TV start talking about shortages of rice,each household, acting independently, decides to double its own storage, thusbuying an additional 7kg per household. This means the world rice marketneeds to supply an additional 7 million tons of rice over a short period (a fewweeks …). This quantity is about one quarter of total annual internationaltrade in rice (recent levels have been 27–30 million tons per year).
Roughly 7 million tons is just the added demand from households.Farmers, traders, rice millers and even governments will also want to holdmore stocks in these circumstances. As an example, the Government ofMalaysia announced that it was doubling the size of the national buffer stockheld by Bernas, even though it had to pay extremely high prices to do so. ThePhilippines increased its government-held stocks. Indonesia tripled its level ofbuffer stocks, from 1.0 to 3.0 million tons.
To determine the impact on prices, short-run supply and demand parame-ters from the analytical model developed above can be inserted into the pricedetermination mechanism: �0.1 for demand and 0.05 for supply. With a 25per cent increase in short-run demand on the world market (suddenly), theworld price will have to rise by 167 per cent to get a new equilibrium. That iswhat happened – panicked hoarding caused the rice price spike.
Fortunately, a speculative run can be ended by ‘pricking the bubble’ anddeflating expectations. Once the price starts to drop, the psychology reverseson hoarding behaviour by households, farmers, traders and even governments.When the Government of Japan announced in May, after considerable interna-tional urging, that it would sell 300,000 tons of its surplus ‘WTO’ (World
42 OVERVIEW: THE WORLD RICE MARKET AND TRADE POLICIES
ES_RC_9-8 18/8/10 20:23 Page 42
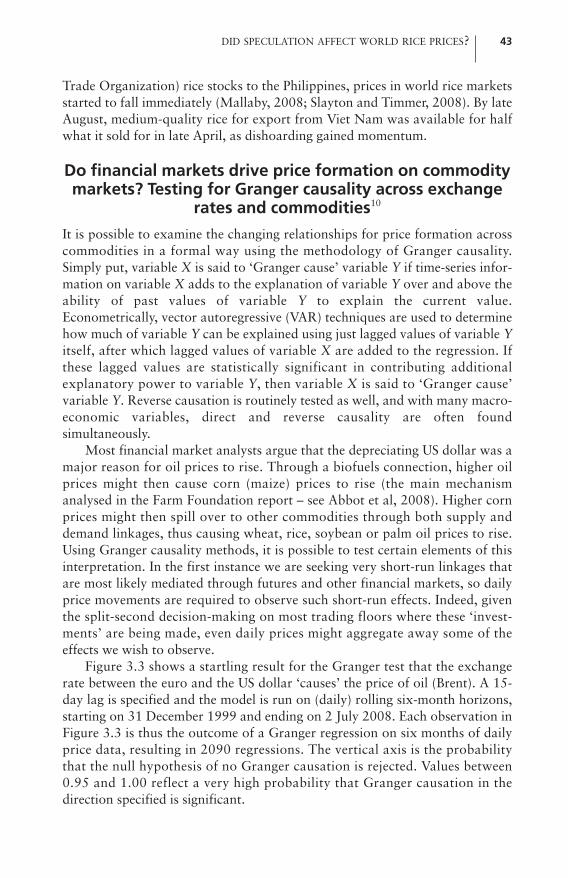
Trade Organization) rice stocks to the Philippines, prices in world rice marketsstarted to fall immediately (Mallaby, 2008; Slayton and Timmer, 2008). By lateAugust, medium-quality rice for export from Viet Nam was available for halfwhat it sold for in late April, as dishoarding gained momentum.
Do financial markets drive price formation on commoditymarkets? Testing for Granger causality across exchange
rates and commodities10
It is possible to examine the changing relationships for price formation acrosscommodities in a formal way using the methodology of Granger causality.Simply put, variable X is said to ‘Granger cause’ variable Y if time-series infor-mation on variable X adds to the explanation of variable Y over and above theability of past values of variable Y to explain the current value.Econometrically, vector autoregressive (VAR) techniques are used to determinehow much of variable Y can be explained using just lagged values of variable Yitself, after which lagged values of variable X are added to the regression. Ifthese lagged values are statistically significant in contributing additionalexplanatory power to variable Y, then variable X is said to ‘Granger cause’variable Y. Reverse causation is routinely tested as well, and with many macro-economic variables, direct and reverse causality are often foundsimultaneously.
Most financial market analysts argue that the depreciating US dollar was amajor reason for oil prices to rise. Through a biofuels connection, higher oilprices might then cause corn (maize) prices to rise (the main mechanismanalysed in the Farm Foundation report – see Abbot et al, 2008). Higher cornprices might then spill over to other commodities through both supply anddemand linkages, thus causing wheat, rice, soybean or palm oil prices to rise.Using Granger causality methods, it is possible to test certain elements of thisinterpretation. In the first instance we are seeking very short-run linkages thatare most likely mediated through futures and other financial markets, so dailyprice movements are required to observe such short-run effects. Indeed, giventhe split-second decision-making on most trading floors where these ‘invest-ments’ are being made, even daily prices might aggregate away some of theeffects we wish to observe.
Figure 3.3 shows a startling result for the Granger test that the exchangerate between the euro and the US dollar ‘causes’ the price of oil (Brent). A 15-day lag is specified and the model is run on (daily) rolling six-month horizons,starting on 31 December 1999 and ending on 2 July 2008. Each observation inFigure 3.3 is thus the outcome of a Granger regression on six months of dailyprice data, resulting in 2090 regressions. The vertical axis is the probabilitythat the null hypothesis of no Granger causation is rejected. Values between0.95 and 1.00 reflect a very high probability that Granger causation in thedirection specified is significant.
DID SPECULATION AFFECT WORLD RICE PRICES? 43
ES_RC_9-8 18/8/10 20:23 Page 43

1 Ja
n 20
00 -
1 Ja
n 20
01 -
1 Ja
n 20
02 -
1 Ja
n 20
03 -
1 Ja
n 20
04 -
1 Ja
n 20
05 -
1 Ja
n 20
06 -
1 Ja
n 20
07 -
1 Ja
n 20
08 -
caus
eo
o
As Figure 3.3 demonstrates, there are several lengthy intervals when theexchange rate seems to be ‘causing’ the price of oil – at least seven intervals ofmore than two months just between 2000 and 2008. But there are also manyintervals when there seem to be no linkages at all between the two markets. Ifthe question is, ‘did the depreciation of the US dollar cause high oil prices?’, theanswer seems to be, ‘it depends on when you look, but 36 per cent of the timethe answer is yes’. No model that assumes a stable relationship between thetwo variables can possibly capture this behaviour. To understand it, we almostcertainly need to understand behaviour in financial markets and especially theformation of price expectations on the part of traders in these markets, includ-ing markets for commodities.
Price expectations are hard to measure (much less forecast), but the supplyof storage model tells us they are likely to be influenced most by volatileelements in both the supply and demand for the commodity. From this perspec-tive, the most volatile element behind the sudden and sharp run-up in foodcommodity prices was likely to have been the ‘hot money’ in search of the nextinvestment boom, after the crash in tech stocks and then real estate derivatives(and before the financial system itself crashed). The source of this hot moneywas the massive liquidity infusion provided by the US Federal Reserve Systemas it sought to stave off (unsuccessfully, as it turns out) a recession caused bycollapsing real estate values and subsequent threats to the nation’s financial
44 OVERVIEW: THE WORLD RICE MARKET AND TRADE POLICIES
Figure 3.3 Granger causality test: Euro/US$⇒Brent crude
Note: The Granger causality test is applied to daily rolling six-month data starting from 31 December 1999 to 2July 2008, a total of 2090 separate regressions. A 15-day lag is specified in the VAR regressions. The symbol ⇒indicates the direction of causality being tested. In this particular example, 36 per cent of the observations aresignificant at the 0.05 level or better, i.e. the significance level is 95 per cent or above, as plotted in Figure 3.3.Source: Author’s calculations
ES_RC_9-8 18/8/10 20:23 Page 44

system (see Frankel, 2006).This money had to go somewhere (as long as investors were still willing to
take risks). Thus the real trigger for the spike in food prices in 2007 seems tohave been speculative behaviour on the part of large investment/hedge fundswith hundreds of billions of dollars looking for an arena with potential forasset price appreciation. The combination of a rapidly falling dollar, movementof investment funds into commodities, especially petroleum and then on toother commodities, was the trigger needed for commodity markets to explode.The Bank of International Settlements in Basel estimates that hundreds ofbillions of dollars were invested in commodity funds in late 2007 and early2008, and until June 2008, they all were betting on higher prices.
As noted already, rice prices in world markets did not follow these earlyprice booms in oil, wheat and corn, mostly because the venues for speculationin rice price movements by ‘outside’ investors in futures and options marketsare extremely limited for rice. For example, average daily trading volumes inDecember 2008 on the Chicago Board of Trade for corn and wheat futurescontracts were 132 times the daily volume for (rough) rice. Daily volume foroptions contracts for corn and wheat were 557 times those for (rough) rice.
These tiny trading volumes mean it is not possible for major participants inworld rice trade to routinely use futures and options markets to manage theirprice risks. In reverse, ‘outside’ speculators have very limited instruments toparticipate in or drive movements in rice prices. Still, formation of rice pricescan be significantly influenced, especially in the short run, by price behaviourin other related commodity markets because prices in these other marketsinfluence how the millions of small-scale participants in the rice system formtheir own expectations about rice prices. As was seen in late 2007 and early2008, these expectations can be self-fulfilling.
Exchange rates driving food commodity prices
Of course, the depreciating dollar does not need to act through oil prices aloneto affect commodity prices; it can also directly impact these prices. In themedium run, both supply and demand adjustments by producers andconsumers to changes in the value of the US dollar relative to their own domes-tic currency cause the US dollar price of most commodities to rise when thedollar falls. These price changes can be explained by the ‘fundamentals’ ofsupply and demand.
In the very short run, however, in daily price formation, a declining dollarseems likely to stimulate financial speculation in commodity markets, thusestablishing a direct price link even before producers and consumers have hada chance to adjust. Figures 3.4 and 3.5 show how these connections come andgo between the euro/US$ rate and corn (maize) and hard wheat prices respec-tively. We still do not know why these short-run speculative connections getestablished for shorter or longer periods of time, and then disappear altogetherfor extended periods of time.
DID SPECULATION AFFECT WORLD RICE PRICES? 45
ES_RC_9-8 18/8/10 20:23 Page 45

1 Ja
n 20
00 -
1 Ja
n 20
01 -
1 Ja
n 20
02 -
1 Ja
n 20
03 -
1 Ja
n 20
04 -
1 Ja
n 20
05-
1 Ja
n 20
06 -
1 Ja
n 20
07 -
1 Ja
n 20
08-
caus
e
Cr>
Nra
- fs
-
*Cr.
.
1Jan
200
0
1Jan
200
1
1Jan
200
2
1 Ja
n 20
03
1 Ja
n 20
04
1Jan
200
5
1 Ja
n 20
06
1 Ja
n 20
07
1 Ja
n 20
08
caus
e oo
o.c
o
46 OVERVIEW: THE WORLD RICE MARKET AND TRADE POLICIES
Figure 3.4 Granger causality test: Euro/US$⇒corn (maize)
Note: Please see notes in Figure 3.3. In this particular example, 30 per cent of the observations are significant atthe 0.05 level or better, i.e. the significance level is 95 per cent or above, as plotted in Figure 3.4.Source: Author’s calculations
Figure 3.5 Granger causality test: Euro/US$⇒hard wheat
Note: Please see notes in Figure 3.3. In this particular example, 36 per cent of the observations are significant atthe 0.05 level or better, i.e. the significance level is 95 per cent or above, as plotted in Figure 3.5.Source: Author’s calculations
ES_RC_9-8 18/8/10 20:23 Page 46

1 Ja
n 20
00-
1 Ja
n 20
01 -
1 Ja
n 20
02 -
1 Ja
n 20
03 -
1 Ja
n 20
04 -
1 Ja
n 20
05-
1 Ja
n 20
06-
1 Ja
n 20
07-
1 Ja
n 20
08-
caus
e
oir)
ren.
ta -
It is especially difficult to explain these short-run price linkages for rice (seeFigure 3.6). For long periods of time the euro/US$ rate seems to drive the priceof Thai rice. This may simply be a factor of the Thai baht being linked to theappreciation of the euro, with the US dollar price of Thai rice being converteddirectly from the baht wholesale price.11
Cross-commodity linkages
One broad hypothesis underlying the various explanations for sharply higherfood prices on world markets has been the link between oil prices and foodcommodity prices. As Timmer (2008a) puts it, if high oil prices are here to stay,high food prices are here to stay. The logic of this connection, through biofuelproduction, depends on medium- to long-run responses by producers andconsumers to the profitability of converting corn or vegetable oils into ethanolor biodiesel.12 But again, financial speculators can see this longer-run potentialand convert it into short-run price behaviour by investing in futures markets(and other more exotic derivatives). Figures 3.7 and 3.8 show how the oil pricedrives the daily formation of maize and palm oil prices. Again, we need tounderstand why the periods of strong price linkages come and go.
Most commodity analysts think the main connection between the maizemarket and wheat market comes through livestock feeding, with soft wheatserving as a very close substitute for maize in many feed rations. Figures 3.9and 3.10 test in which direction this linkage tends to run in the very short run.
DID SPECULATION AFFECT WORLD RICE PRICES? 47
Figure 3.6 Granger causality test: Euro/US$⇒rice
Note: Please see notes in Figure 3.3. In this particular example, 47 per cent of the observations are significant atthe 0.05 level or better, i.e. the significance level is 95 per cent or above, as plotted in Figure 3.6.Source: Author’s calculations
ES_RC_9-8 18/8/10 20:23 Page 47

1 Ja
n 20
00 -
1 Ja
n 20
01 -
1 Ja
n 20
02 -
1 Ja
n 20
03 -
1 Ja
n 20
06 -
1 Ja
n 20
07 -
1 Ja
n 20
08 -
caus
e
1.-
_-
.;
.4te
-r
".
1 Ja
n 20
04 -
1 Ja
n 20
05 -
;.
. -
1 Ja
n 20
00 -
I Jan
200
1 -
1 Ja
n 20
02 -
1 Ja
n 20
03 -
1 Ja
n 20
04 -
1 Ja
n 20
05 -
1 Ja
n 20
06 -
1 Ja
n 20
07 -
1 Ja
n 20
08 -
caus
e
F'
o
42:
a'4
2-:"
..1.A
..
... -
....
,
..
..._
..
.....
rat
48 OVERVIEW: THE WORLD RICE MARKET AND TRADE POLICIES
Figure 3.7 Granger causality test: Oil (Brent)⇒corn (maize)
Note: Please see notes in Figure 3.3. In this particular example, 26 per cent of the observations are significant atthe 0.05 level or better, i.e. the significance level is 95 per cent or above, as plotted in Figure 3.7.Source: Author’s calculations
Figure 3.8 Granger causality test: Oil (Brent)⇒palm oil
Note: Please see notes in Figure 3.3. In this particular example, 27 per cent of the observations are significant atthe 0.05 level or better, i.e. the significance level is 95 per cent or above, as plotted in Figure 3.8.Source: Author’s calculations
ES_RC_9-8 18/8/10 20:23 Page 48

O
revc
ause
1 Ja
n 20
00 -
;%
d%1
Jan
2001
-Z
1 Ja
n 20
02 -
.
1 Ja
n 20
03 -
1 Ja
n 20
04
1 Ja
n 20
05
.Ja
r1
Jan
2006
Z.2
:712
...7
-.:..
.1,¡
;ce"
""-
1 Ja
n 20
07--
337
-
-'54-
Is-
5,"
1 Ja
n 20
08."
',,.'v
?7 m
Visually, it seems like soft wheat had more of an impact on maize prices before2004 (Figure 3.9), with maize having more of an impact on soft wheat afterthen (Figure 3.10). Such a change would be consistent with the argument thatbiofuel demand for maize in the US after 2005 became a much more importantdriver of maize prices. Formal confirmation of this hypothesis is part of theongoing research.
What explains rice price behaviour, in terms of cross-commodity linkages?Normally, rice behaves as a ‘special’ commodity, driven mostly by national andinternational balances for the commodity itself, with relatively weak connec-tions to other commodities (Dawe, 2008a, 2008b, 2008c). Rice is not used forlivestock feed or biofuel production, except in very unusual circumstances. TheJapanese, for example, allow their imported rice required by WTO commit-ments to deteriorate in storage, and then feed it to livestock.
But there are substantial regions in Asia where rice competes with wheat inconsumption. Over the long run, commodity analysts expect rice and wheatprices to reflect this substitution and exhibit a relationship that captures theopportunity cost of producing each commodity (at the long-run margin).Although this relationship is likely to be stable only in the long run, with verysubstantial divergences from year to year, it is apparently important enough forshort-run commodity traders to factor wheat prices into expectations aboutrice prices, and vice versa. Figures 3.11 and 3.12, respectively, show theepisodes when short-run prices of hard wheat drive rice prices, and when riceprices are driving the prices of hard wheat.
DID SPECULATION AFFECT WORLD RICE PRICES? 49
Figure 3.9 Granger causality test: Soft wheat⇒corn (maize)
Note: Please see notes in Figure 3.3. In this particular example, 24 per cent of the observations are significant atthe 0.05 level or better, i.e. the significance level is 95 per cent or above, as plotted in Figure 3.9.Source: Author’s calculations
ES_RC_9-8 18/8/10 20:23 Page 49

o ;4C
.:4"
_
. attr
f;
._.,v
444T _JA
rj
caus
eo
' a)
1 Ja
n 20
00 -
1 Ja
n 20
01 -
1 Ja
n 20
02 -
1 Ja
n 20
03 -
1 Ja
n 20
04 -
1 Ja
n 20
05-
ace:
1 Ja
n 20
06-
."4
'-
1 Ja
n 20
07-
ta.
1 Ja
n 20
08
1 Ja
n 20
00 -
1 Ja
n 20
01
1 Ja
n 20
02
1 Ja
n 20
03
1 Ja
n 20
04
1 Ja
n 20
05
1 Ja
n 20
06
1 Ja
n 20
07
1 Ja
n 20
08
o
"
caus
e
-a'I
:7.:
50 OVERVIEW: THE WORLD RICE MARKET AND TRADE POLICIES
Figure 3.10 Granger causality test: Corn (maize)⇒soft wheat
Note: Please see notes in Figure 3.3. In this particular example, 37 per cent of the observations are significant atthe 0.05 level or better, i.e. the significance level is 95 per cent or above, as plotted in Figure 3.10.Source: Author’s calculations
Figure 3.11 Granger causality test: Hard wheat⇒rice
Note: Please see notes in Figure 3.3. In this particular example, 33 per cent of the observations are significant atthe 0.05 level or better, i.e. the significance level is 95 per cent or above, as plotted in Figure 3.11.Source: Author’s calculations
ES_RC_9-8 18/8/10 20:23 Page 50
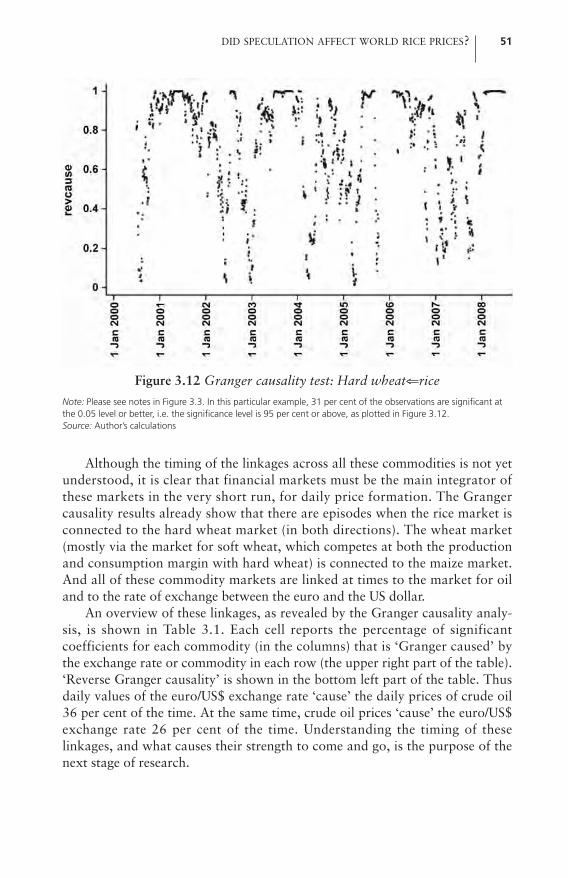
O
revc
ause br
)èø
1 Ja
n 20
00-
1 Ja
n 20
01-4
1"
1.:
'
1 Ja
n 20
02-
.
_2
1 Ja
n 20
03 -
t:1
Jan
2004
-
1 Ja
n 20
05-
- D
- ,-
-m--
,,
1 Ja
n 20
06-
:
1 Ja
n 20
07-
r -:
1 Ja
n 20
08Although the timing of the linkages across all these commodities is not yet
understood, it is clear that financial markets must be the main integrator ofthese markets in the very short run, for daily price formation. The Grangercausality results already show that there are episodes when the rice market isconnected to the hard wheat market (in both directions). The wheat market(mostly via the market for soft wheat, which competes at both the productionand consumption margin with hard wheat) is connected to the maize market.And all of these commodity markets are linked at times to the market for oiland to the rate of exchange between the euro and the US dollar.
An overview of these linkages, as revealed by the Granger causality analy-sis, is shown in Table 3.1. Each cell reports the percentage of significantcoefficients for each commodity (in the columns) that is ‘Granger caused’ bythe exchange rate or commodity in each row (the upper right part of the table).‘Reverse Granger causality’ is shown in the bottom left part of the table. Thusdaily values of the euro/US$ exchange rate ‘cause’ the daily prices of crude oil36 per cent of the time. At the same time, crude oil prices ‘cause’ the euro/US$exchange rate 26 per cent of the time. Understanding the timing of theselinkages, and what causes their strength to come and go, is the purpose of thenext stage of research.
DID SPECULATION AFFECT WORLD RICE PRICES? 51
Figure 3.12 Granger causality test: Hard wheat⇐rice
Note: Please see notes in Figure 3.3. In this particular example, 31 per cent of the observations are significant atthe 0.05 level or better, i.e. the significance level is 95 per cent or above, as plotted in Figure 3.12.Source: Author’s calculations
ES_RC_9-8 18/8/10 20:23 Page 51

Long-run price relationships among the staple cereals
As noted, most commodity market analysts think there is a long-run relation-ship among the prices of staple grains, based on commodity substitutions inboth production and consumption (Timmer et al, 1983). Mitchell (2008), forexample, argues that wheat prices historically have averaged about 60–80 percent of the price of rice (and thus were far ‘too high’ in early 2007, reflectingspeculative pressures in the wheat market). Table 3.2 presents results fromanalysing the long-run relationship between prices of the three basic cerealstaples, rice, wheat and corn (maize), since 1900.
It is clear there has been a long-run decline in the prices of all three cereals– there is a basic commonality in this decline, as all three commodities havetrend price declines of more than 1.0 per cent per year. Further, this declineaccelerated after the mid-1980s, again for apparently common reasons (see
52 OVERVIEW: THE WORLD RICE MARKET AND TRADE POLICIES
Table 3.1 Significance of Granger causality tests for various commodities andthe exchange rate between the euro and US dollar
EU/US Crude oil Corn Hard Soft Rice Palm oilFX rate wheat wheat
EU/US FX rate — 36 30 36 42 47 36Crude oil 26 — 26 ? ? ? 27Corn 35 49 — 45 37 ? ?Hard wheat 28 ? 38 — ? 33 ?Soft wheat 19 ? 24 ? — 27 ?Rice 30 ? ? 31 36 — ?Palm oil 43 28 ? ? ? ? —
Note: Granger causality for each pair is tested horizontally. Reverse Granger causality is tested vertically. See textfor an example. A question mark (?) indicates the statistical analyses have not yet been conducted.Source: Author’s calculations
Table 3.2 Long-run relationships among rice, wheat and maize prices,1900–2008
Rice Wheat MaizeIndependent variable 1 2 3 4 5 6
Constant 31.5944 11.5888 26.0225 2.2670 29.9852 5.8011(t-stat) (16.7) (3.9) (16.5) (1.1) (17.2) (2.6)
Time13 �0.0134 �0.0053 �0.0105 �0.0005 �0.0125 �0.0027(t-stat) (14.1) (4.0) (13.0) (0.6) (14.1) (2.7)
Log rice price — — — 0.1910 — 0.1345(t-stat) (3.2) (1.9)
Log wheat price — 0.4728 — — — 0.7661(t-stat) (3.2) (9.3)
Log maize price — 0.2569 — 0.5909 — —(t-stat) (1.9) (9.3)Adj. R sq 0.645 0.771 0.609 0.857 0.645 0.869
Note: Dependent variable is logarithm of price in all regressions. Source: Data from Eberstadt (2008), analysis by author
ES_RC_9-8 18/8/10 20:23 Page 52

Figures 3.13, 3.14 and 3.15). Even the recent run-up in cereal prices in2007–2008 barely returned them to the long-run downward trend. From thefigures it is clear that, relative to these trends, wheat and maize prices rosemore sharply than did rice prices. It is also clear from Table 3.2 and Figures3.13–3.15 that price formation for rice has several unique dimensions that areworthy of further study.
DID SPECULATION AFFECT WORLD RICE PRICES? 53
Figure 3.13 Long-run trend in real rice prices, 1900–2008
Source: Data from Eberstadt (2008), analysis by author
4.0
4.5
5.0
5.5
6.5
1900 1960 1980 2000 2020
Log
pric
e
6.0
1920 1940
Figure 3.14 Long-run trend in real wheat price, 1900–2008
Source: Data from Eberstadt (2008), analysis by author
4.0
4.5
5.0
5.5
6.5
1900 1960 1980 2000 2020
Log
pric
e
6.0
1920 1940
ES_RC_9-8 18/8/10 20:23 Page 53

Two basic models of long-run price formation are tested in Table 3.2 foreach of the three basic food cereals, rice, wheat and maize. The first askssimply what the long-run time trend in real prices is, without further explana-tory variables (Equations 1, 3 and 5). There can be no mistaking the sharpdownward trend, either econometrically in Table 3.2 or visually from Figures3.13, 3.14 and 3.15 (where the fitted trends are shown against the raw data).The trend decline for rice is 1.34 per cent per year, for maize it is 1.25 per centper year, and for wheat it is 1.05 per cent per year. The difference between thetrend decline for rice and wheat is significant at the 5 per cent level. Somethinghas been driving rice prices down faster than wheat prices over the pastcentury. The difference between the simple trend decline for rice and maize isnot significant. The very simplicity of this trend analysis, of course, precludesany attempt at explaining why there are differences in trends.
The second model is slightly more sophisticated and starts to address theissue of differences in price formation among the three cereals (Equations 2, 4and 6). This model still tests for the existence of a time trend, but now thetrend estimate for the price of each commodity is (statistically) controlled forthe prices of the other two commodities in the same year.14 The results areactually quite dramatic. The downward time trend for wheat disappearsaltogether, with rice prices (coefficient = 0.19) and maize prices (coefficient =0.59) both having a highly significant impact on wheat prices.
Maize prices behave in a similar but less dramatic fashion. The time trendis only �0.27 per cent per year, although it is statistically significant. Riceprices have only a marginal impact on maize prices, with a coefficient of 0.13that is not significant at the 5 per cent level. Wheat prices, however, have a very
54 OVERVIEW: THE WORLD RICE MARKET AND TRADE POLICIES
Figure 3.15 Long-run trends in real maize prices, 1900–2008
Source: Data from Eberstadt (2008), analysis by author
4.0
4.5
5.0
5.5
6.5
1900 1960 1980 2000 2020
Log
pric
e
6.0
1920 1940
ES_RC_9-8 18/8/10 20:23 Page 54

large impact on long-run maize prices (confirming the short-run results seen inthe Granger causality tests), with a coefficient of 0.77 that is highly significant.
Although somewhat related to wheat and maize prices, rice prices clearlyhave a different pattern of price formation. The impact of maize prices on riceprices is only marginally significant (as was the case in reverse). Wheat priceshave a modest impact which is statistically significant. Comparing the sum ofthe two coefficients for each of the three regressions is revealing: the sum forrice (of the maize and wheat coefficients) is 0.73, with an average t-statistic ofonly 2.6. The total for wheat (of the rice and maize coefficients) is 0.78, withan average t-statistic of 6.3. Maize prices are best explained by the other twocommodity prices: the sum of the coefficients is 0.90, with an average t-statisticof 5.6. Clearly, rice prices exhibit substantial independence from maize andwheat prices. This conclusion is also borne out by the adjusted R-squaredcoefficients for each of the price regressions: rice is ‘only’ 0.77 whereas bothmaize and wheat are 0.86.
Most significantly, the exogenous time trend for real rice prices, even aftercontrolling for the impact of wheat and maize prices, continues to be substan-tial and negative, with a significant coefficient of �0.53 per cent per year. Evenif maize and wheat prices remained stable in real terms, rice prices would belower by more than 40 per cent after a century.
There would seem to be two implications of these statistical results. First,both maize, and especially rice, prices, have been driven down by powerfulexogenous factors, even after controlling for the general decline in the prices ofthe other grains. Presumably differential technological change is the maindriver of these negative time trends, although demand growth for rice mayhave been slower over the long run than for wheat. Because of its role inlivestock feeding, however, the demand for maize has grown the fastest of thethree cereals, yet it still has a small but significant downward trend in price,after allowing for the general decline in cereal prices. This pattern suggests thatdifferential technological change is probably the main driver of prices over thelong run.
Second, rice prices clearly have a life of their own. This is seen in the strongdownward time trend, when tested alone, in the continued significance of adownward trend when allowance is made for the prices of wheat and maize,and for the relatively small explanatory power of the fully specified pricemodel that allows for these other prices. What causes these long-run differ-ences in price trends?
For the short run, the answer would seem to lie in market structure. It hasalready been established here that one unique dimension of short-run rice priceformation stems from the highly unusual industrial organization of the world’srice economy, with many small producers, traders, retailers and consumershandling a product that is storable at each stage.
The supply of storage model, in turn, argues that this highly decentralizedstorage capacity is subject to changes in price expectations on the part ofparticipants all along the supply chain. These expectations become self-fulfill-
DID SPECULATION AFFECT WORLD RICE PRICES? 55
ES_RC_9-8 18/8/10 20:23 Page 55

ing and lead to episodes of panic buying, and subsequent destocking, whichsharply destabilize actual prices. Because no one has data on the size of ricestocks in the hands of these multitudinous market participants, their impact onrice price formation is virtually impossible to predict ahead of time. Rice reallyis ‘different’ in the short run.
Does this difference in market structure also account for the difference inlong-run price trends between rice and the other two staple food grains, cornand wheat? Only to a limited extent. The faster downward trend in rice prices,even holding constant the prices of wheat and corn, argues that the long-runequilibrium between supply and demand for rice is shifting down faster thanfor corn and wheat. Faster technological change for rice could push the supplycurve out faster. Slower population growth in rice-consuming countries, and afaster transition to very low, even negative Engel coefficients for rice, couldaccount for slower demand growth. Changing consumer tastes could also be afactor.
But the greater variance in the downward trend for rice (the lower R-squared) does suggest that market structure has long-run significance as well asshort-run significance. The political economy of high variance in world riceprices is well understood – it leads countries to retreat into autarky, and dumptheir own instability into a smaller world rice market. One consequence of thisdrive for self-sufficiency among rice importers is larger overall production thanwould be expected in a world of free trade. This added production should alsocontribute to a long-run decline in world prices.
Breaking into this vicious circle, seen clearly in the price spike in late 2007and early 2008, will require binding agreements, perhaps even contracts,between rice importers and exporters over multi-year periods, not just forshort-run trade. Because there seem to be virtually no national or internationalpressures for such binding agreements, rice is likely to remain a ‘different’commodity for decades to come.
Notes1 A review of the causes of high food prices in Asian economies appeared in Timmer
(2008a) and an early version of this analytical perspective was presented in Timmer(2008b).
2 Price formation for palm oil is also analysed to some extent because of its role inmeeting biodiesel mandates in Europe.
3 In an empirical specification, the long-run price elasticities would be net of theshort-run elasticities.
4 It would be possible to specify this model with specific time lags that add up to thelong-run response, and such an approach would improve the empirical validity ofthis model. The purpose here, however, is to clarify a conceptual point, that histori-cal prices have current significance because of both behavioural and technologicallags in the response by producers and consumers to these prices.
5 ‘Benign’ refers to expansion of cropped area that is environmentally sustainableand not a significant contributor to long-run climate change.
56 OVERVIEW: THE WORLD RICE MARKET AND TRADE POLICIES
ES_RC_9-8 18/8/10 20:23 Page 56

6 An early draft and PowerPoint presentation based on Mitchell’s research wereunequivocal that about three-quarters of the run-up in food prices through late2007 was due to US biofuel mandates. The subsequent World Bank Research Paper(Mitchell, 2008) is somewhat more hedged.
7 What follows is a very brief overview of the ‘fire’ in the world rice market from late2007 until mid-2008. See Slayton (2009) for a detailed analysis and chronology.
8 The prospect of more stable markets for rice from these forces was raised inTimmer (1991).
9 It is almost amusing that Indonesia announced a ban on rice exports early in 2008,before its main rice harvest started in March. Historically, Indonesia has been theworld’s largest rice importer, surpassed only recently by the Philippines, and no onein the world rice trade was looking to Indonesia for export supplies. But there wasa rationale to the announcement by the minister of trade – it signalled thatIndonesia would not be needing imports and was thus not vulnerable to theskyrocketing prices in world markets. The calming effect on domestic rice marketparticipants meant that little of the hoarding behaviour seen in Viet Nam and thePhilippines was evidenced in Indonesia.
10 This part of the chapter is very much research in progress and thus raises far morequestions than it answers.
11 The ‘daily’ rice price used in this analysis is Thai 5% brokens, FOB Bangkok. Theofficial source for this price, the Thai Board of Trade, only issues it on a weekly basis,and even then the official price quotes are often significantly different from the pricesat which actual trades are taking place. One simple indicator of how ‘different’ theworld rice market is from the corn and wheat markets is that there is no daily, trans-parent, reliable price quotation for rice exports from any of the major origins.
12 There has been a long-standing link between energy prices and the price of foodcommodities because of links from the supply side – irrigation costs, fertilizer costs,cultivation costs, transportation costs and processing costs all are significantlyinfluenced by energy costs (Timmer, 1984).
13 Because the price terms are in logarithms, the coefficient on the time variable canbe interpreted as the annual per cent ‘trend’ change in the dependent variable.Thus, in Equation 1, the annual rate of decrease in rice prices is estimated to be1.34 per cent per year, before allowance is made for the impact of price changes forother staple food commodities. Holding constant the prices of wheat and maize ineach year, the trend decrease in rice prices drops to just 0.53 per cent per year. Asimilar interpretation holds for the time coefficients for the other commodities.
14 Technically this assumes that the prices are independent of each other in the sameyear, which is obviously not true if their price formation is determinedsimultaneously from a common set of exogenous factors. This not a seriousproblem here, where the issue is simply the impact of the other commodity priceson the ‘exogenous’ time trend. Introducing lagged values would solve theeconometric problem without changing the results discussed here.
AcknowledgementsI would like to thank David Dawe, Tom Slayton and participants at a World FoodProgramme seminar in Rome on ‘Food, Finance and the Future: Is Food Just AnotherFinancial Instrument?’ for helpful comments. Robin Kraft at CGD provided essentialresearch assistance. The views, and mistakes, expressed are my own.
DID SPECULATION AFFECT WORLD RICE PRICES? 57
ES_RC_9-8 18/8/10 20:23 Page 57

ReferencesAbbott, P. C., Hurt, C. and Tyner, W. E. (2008) What’s Driving Food Prices? Farm
Foundation Issue Report (FFIR), Oak Brook, IL, available atwww.farmfoundation.org/news/articlefiles/404-FINAL WDFP REPORT 7-28-08.pdf
Brahmbhatt, M. and Christiaensen, L. (2008) Rising Food Prices in East Asia:Challenges and Policy Options, World Bank, Washington, DC,http://siteresources.worldbank.org/EASTASIAPACIFICEXT/Resources/EA_Rising_Food_Prices050508.pdf
Brennan, M. J. (1958) ‘The supply of storage’, American Economic Review, vol 48, no1, pp50–72
Cootner, P. H. (1960) ‘Returns to speculators: Telser vs. Keynes’, Journal of PoliticalEconomy, vol 68 (August), pp396–404
Cootner, P. H. (1961) ‘Common elements in futures markets for commodities andbonds’, American Economic Review, vol 31 (May), pp173–183
Dawe, D. (2008a) ‘A note on the (un)importance of world grain stocks for recentworld price movements’, FAO, Rome
Dawe, D. (2008b) ‘Lost in transmission’, Rice Today, July–September, InternationalRice Research Institute, Los Baños, Philippines, pp13–15,www.irri.org/publications/today/pdfs/7-3/RT_Lost_in_Transmission.pdf
Dawe, D. (2008c) ‘Running out of steam’, Rice Today, July–September, InternationalRice Research Institute, Los Baños, Philippines, p41,www.irri.org/publications/today/pdfs/7-3/RT_Running_out_of_Steam.pdf
Eberstadt, N. (2008) ‘Today’s “global food crisis” in the mirror of long term develop-ment trends’, presented to US Department of State (November 12), AmericanEnterprise Institute, Washington, DC
Frankel, J. (2006) The Effect of Monetary Policy on Real Commodity Prices, NBERWorking Paper No 12713, National Bureau of Economic Research, Cambridge, MA
Houthakker, H. (1987) ‘Futures trading’, in Eatwell, J., Milgate, M. and Newman, P.(eds) The New Palgrave: A Dictionary of Economics, Volume 2, MacMillan Press,London, pp447–449
Kaldor, N. (1939) ‘Speculation and economic stability’, Review of Economic Studies,vol VII (October), pp1–27
Keynes, J. M. (1936) The General Theory of Employment, Interest, and Money,Harcourt Brace Publishing, New York
Mallaby, S. (2008) ‘Rice and baloney: Irrational policies the world over are making thefood crisis worse’, The Washington Post, 18 May, pA-17
Mitchell, D. (2008) ‘A note on rising food prices’, Policy Research Working Paper WPS4682, World Bank, Washington, DC
Munier, B. R. (2008) ‘An X-ray of the risk module within the MOMAGRI model’,April, MOMAGRI, Paris
Peterson, W. (1979) ‘International farm prices and the social cost of cheap food’,American Journal of Agricultural Economics, vol 61, no 1, pp12–21
Sanders, D. H. and Irwin, S. H. (2008) ‘Futures imperfect’, New York Times, 20 July,p12wk,www.nytimes.com/2008/07/20/opinion/20irwinsanders.html?_r=1&oref=slogin
Slayton, T. (2009) ‘Rice crisis forensics: How Asian governments carelessly set theworld rice market on fire’, Center for Global Development Working Paper 163,
58 OVERVIEW: THE WORLD RICE MARKET AND TRADE POLICIES
ES_RC_9-8 18/8/10 20:23 Page 58

Center for Global Development, Washington, DC, www.cgdev.org/content/publications/detail/1421260/
Slayton, T. and Timmer, C. P. (2008) ‘Japan, China and Thailand can solve the ricecrisis – but US leadership is needed’, CGD Notes, May, Center for GlobalDevelopment, Washington, DC
Telser, L. G. (1958) ‘Futures trading and the storage of cotton and wheat’, Journal ofPolitical Economy, vol 66 (June), pp233–255
Timmer, C. P. (1984) ‘Energy and structural change in the Asia-Pacific region: Theagricultural sector’, in Bautista, R. M. and Naya, S. (eds) Energy and StructuralChange in the Asia-Pacific Region: Papers and Proceedings of the Thirteenth PacificTrade and Development Conference, Philippine Institute for Development Studiesand the Asian Development Bank, Manila, pp51–72
Timmer, C. P. (ed) (1987) The Corn Economy of Indonesia, Cornell University Press,Ithaca, NY
Timmer, C. P. (1991) ‘Food price stabilization: Rationale, design, and implementation’,in Perkins, D. H. and Roemer, M. (eds) Reforming Economic Systems, HarvardInstitute for International Development, Harvard University, Harvard UniversityPress, Cambridge, MA, pp219–248 and pp456–459
Timmer, C. P. (2008a) ‘Causes of high food prices’, in Asian Development OutlookUpdate, Asian Development Bank, Manila, pp73–94
Timmer, C. P. (2008b) ‘Causes of high food price’, plus Technical Annexes, ADBEconomics Working Paper Series No 128 (October), Asian Development Bank,Manila
Timmer, C. P., Falcon, W. P. and Pearson, S. R. (1983) Food Policy Analysis, JohnsHopkins University Press for the World Bank, Baltimore, MD
Trostle, R. (2008) ‘Global agricultural supply and demand: Factors contributing to therecent increase in food commodity prices’, Economic Research Service, OutlookReport No WRS-0801, USDA, Washington, DC,www.ers.usda.gov/Publications/WRS0801/WRS0801.pdf
Weymar, F. H. (1968) The Dynamics of the World Cocoa Market, MIT Press.Cambridge, MA
Williams, J. C. and Wright, B. D. (1991) Storage and Commodity Markets, CambridgeUniversity Press, Cambridge, UK
Working, H. (1933) ‘Price relations between July and September wheat futures atChicago since 1885’, Wheat Studies, vol 9 (March), pp187–238
Working, H. (1948) ‘Theory of the inverse carrying charge in futures markets’, Journalof Farm Economics, vol 30 (February), pp1–28
Working, H. (1949) ‘The theory of the price of storage’, American Economic Review,vol 31 (December), pp1254–1262
DID SPECULATION AFFECT WORLD RICE PRICES? 59
ES_RC_9-8 18/8/10 20:23 Page 59

ES_RC_9-8 18/8/10 20:23 Page 60

4
Trade-Related Policies to EnsureFood (Rice) Security in Asia
Alexander Sarris
Introduction
The sudden and unpredictable large increases (spikes) of many internationallytraded food commodity prices in late 2007 and early 2008 caught all marketparticipants, as well as governments, by surprise and led to many short-termpolicy reactions that may have worsened the price rises. Many governments,think-tanks and individual analysts called for improved international mecha-nisms to prevent and/or manage sudden food price rises. Similar calls forimproved disciplines of markets were made during almost all previous marketprice bursts, but were largely abandoned after the spikes passed. The financialcrisis that started to unravel in 2008 has coincided with sharp commodity pricedeclines, and food commodities have followed this general trend. The pricevolatility has been considerable. For instance, in February 2008, internationalwheat, maize and rice price indices stood higher than the same prices inNovember 2007, namely only three months earlier, by 48.8, 28.3 and 23.5 percent respectively. In November 2008, the same indices stood at �31.9, �3.2and 52.3 per cent higher respectively, compared to November 2007. In otherwords within one year these food commodity prices had increased very sharplyin the first part of the year, and subsequently declined (except rice) equallysharply. Clearly such volatilities of world prices create much uncertainly
ES_RC_9-8 18/8/10 20:23 Page 61

among all market participants, and make both short- and longer-term planningvery difficult for all.
Rice is a particularly sensitive commodity for countries in Asia as itprovides the basic food, and hence is the basic wage good, for the bulk of Asianpopulations, both rural and urban. Hence the sharp price rises in world riceprices were of particular concern to policymakers. Because of its importance,rice is the object of considerable policy focus of all Asian governments, and riceprice stability is a major objective. It is understandable that the recent suddenrice price spikes caused much alarm among Asian policymakers. The majorconcern was not only price rises, but most importantly access to sufficientsupplies to satisfy basic food needs. In response there have been calls forvarious types of interventions or arrangements to prevent future rice pricespikes and assure supplies in times of crises. The purpose of this chapter is todiscuss policies, both single country and also possible multi-country arrange-ments, to prevent future rice price spikes and to assure smooth flows ofsupplies to rice-importing countries.
The recent rice price spike is not unique. In the food commodity marketsthere have been four periods of sudden price increases (and subsequentdeclines), before the most recent one, in the last 40 years (1973–1975,1978–1979, 1986–1987 and 1995), although only the one of 1973–1975 wasof comparable magnitude to the recent spike. Recently international foodcommodity prices have declined sharply and unpredictably from their peaks ofearly 2008. How can one interpret these sharp food commodity price swings,and is the recent one unusual?
There have been many analyses of the recent food price surges (Abbott etal, 2008; Baltzer et al, 2008; Helbling et al, 2008; Mitchell, 2008; Schnepf,2008; Trostle, 2008; von Braun et al, 2008). Recently Headey and Fan (2008)made an assessment of all the various explanations and factors that have beenproposed to explain the food price surge of late 2007 and 2008, and found thatamong the many factors proposed only a few are consistent with the underly-ing facts of the crisis. The rice market developments have also been the objectof some recent analyses (for example Brahmbhatt and Christiaensen, 2008),and the reasons indicated there seem different from the reasons for the otheragricultural commodity price spikes.
The plan of the chapter is as follows. First a brief review of the recent ricemarket upheaval is attempted. Then we discuss some rice market instability aswell as medium-term projections of the world rice economy with a focus onAsia. We then examine policies to improve rice market performance and toassure smooth flow of supplies, culminating with a concrete proposal for aninstitutional structure and arrangement to assure mutual market confidence.
The recent rice price spike in perspective
Figure 4.1 indicates the evolution of monthly nominal international prices ofthe main traded rice commodities since 2006. It can be seen firstly that, after a
62 OVERVIEW: THE WORLD RICE MARKET AND TRADE POLICIES
ES_RC_9-8 18/8/10 20:23 Page 62
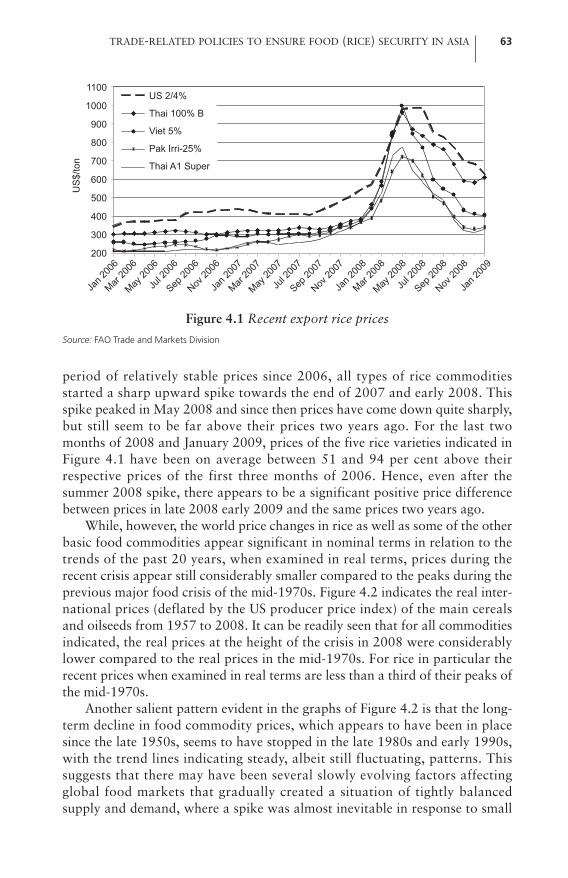
period of relatively stable prices since 2006, all types of rice commoditiesstarted a sharp upward spike towards the end of 2007 and early 2008. Thisspike peaked in May 2008 and since then prices have come down quite sharply,but still seem to be far above their prices two years ago. For the last twomonths of 2008 and January 2009, prices of the five rice varieties indicated inFigure 4.1 have been on average between 51 and 94 per cent above theirrespective prices of the first three months of 2006. Hence, even after thesummer 2008 spike, there appears to be a significant positive price differencebetween prices in late 2008 early 2009 and the same prices two years ago.
While, however, the world price changes in rice as well as some of the otherbasic food commodities appear significant in nominal terms in relation to thetrends of the past 20 years, when examined in real terms, prices during therecent crisis appear still considerably smaller compared to the peaks during theprevious major food crisis of the mid-1970s. Figure 4.2 indicates the real inter-national prices (deflated by the US producer price index) of the main cerealsand oilseeds from 1957 to 2008. It can be readily seen that for all commoditiesindicated, the real prices at the height of the crisis in 2008 were considerablylower compared to the real prices in the mid-1970s. For rice in particular therecent prices when examined in real terms are less than a third of their peaks ofthe mid-1970s.
Another salient pattern evident in the graphs of Figure 4.2 is that the long-term decline in food commodity prices, which appears to have been in placesince the late 1950s, seems to have stopped in the late 1980s and early 1990s,with the trend lines indicating steady, albeit still fluctuating, patterns. Thissuggests that there may have been several slowly evolving factors affectingglobal food markets that gradually created a situation of tightly balancedsupply and demand, where a spike was almost inevitable in response to small
TRADE-RELATED POLICIES TO ENSURE FOOD (RICE) SECURITY IN ASIA 63
Figure 4.1 Recent export rice prices
Source: FAO Trade and Markets Division
US
$/to
n1100
1000
900
800
700
600
500
400
300
200
Jan 2
006
Mar 20
06
May 20
06
Jul 2
006
Sep 20
06
Nov 20
06
Jan 2
007
Mar 20
07
May 20
07
Jul 2
007
Sep 20
07
Nov 20
07
Jan 2
008
Mar 20
08
May 20
08
Jul 2
008
Sep 20
08
Nov 20
08
Jan 2
009
US 2/4%
Thai 100% B
Viet 5%
Pak Irri-25%
Thai A1 Super
ES_RC_9-8 18/8/10 20:23 Page 63

shocks. Several of these factors have been discussed and analysed by manyauthors and think-tanks, as well as FAO. They include the following:
1 Growing world demand for basic food commodities, due to growth inemerging economies, such as China and India. This development has beentouted considerably by many observers, but in fact it has been occurringgradually for several years and cannot account for the sudden price spikes.Furthermore, the rate of growth of these countries’ demand or utilizationof cereals, the most widely consumed and traded food commodities, forfood, feed and other non-biofuel uses, has been decreasing rather thanincreasing. In fact this is compatible and predicted by conventionaleconomic wisdom, which indicates that as incomes rise, the demand forbasic foods rises by less than the rise in incomes.
2 Demand of cereals for biofuel production. It is true that a significantamount of production of maize in the US, oilseeds in the European Unionand sugar in Brazil have been utilized for biofuel production, often withhelp from a variety of support policies and mandated alternative energytargets. This has also been occurring over a number of recent years andaccounts for a significant portion of market demand for these commodi-ties, as well as, via substitution, for indirect demand for several othercommodities that compete for the same resources, such as land. As this hasbeen occurring for some time, and helped keep prices increasing and strongoverall, it is unlikely to have been a major factor for the sudden pricespikes, albeit it may have had amplifying effects in an already tight market.As rice, however, is not a biofuel stock, the influence on the rice market ismost likely to have been indirect, through demand substitution effects.
64 OVERVIEW: THE WORLD RICE MARKET AND TRADE POLICIES
WheatRice
MaizeSoybeans
1400
1200
1000
800
600
400
200
0
1957
1960
1963
1966
1969
1972
1975
1978
1981
1984
1987
1990
1993
1996
1999
2002
2005
2008
Infla
tion-
adju
sted
US
$/to
n
Figure 4.2 Real prices of bulk food commodities, 1957–2008
Source: FAO Trade and Markets Division
ES_RC_9-8 18/8/10 20:23 Page 64
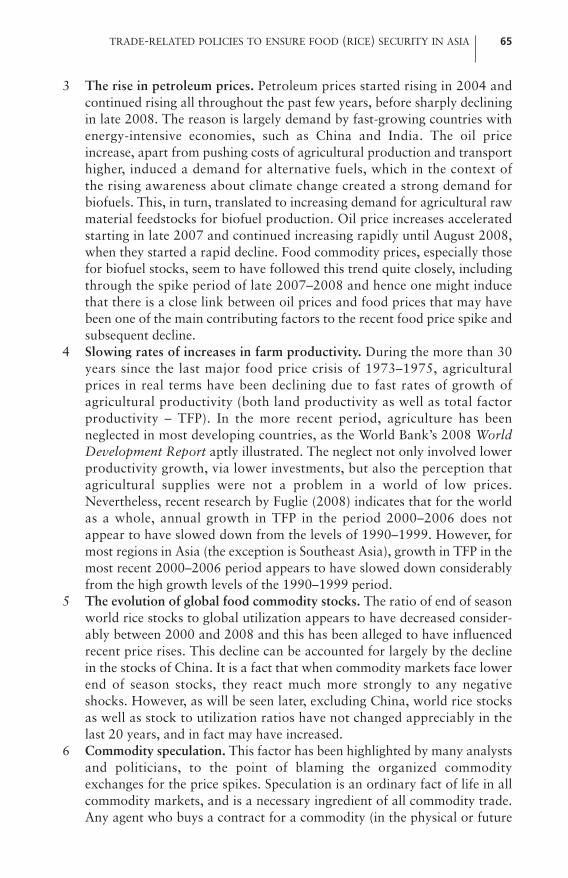
3 The rise in petroleum prices. Petroleum prices started rising in 2004 andcontinued rising all throughout the past few years, before sharply decliningin late 2008. The reason is largely demand by fast-growing countries withenergy-intensive economies, such as China and India. The oil priceincrease, apart from pushing costs of agricultural production and transporthigher, induced a demand for alternative fuels, which in the context of the rising awareness about climate change created a strong demand forbiofuels. This, in turn, translated to increasing demand for agricultural rawmaterial feedstocks for biofuel production. Oil price increases acceleratedstarting in late 2007 and continued increasing rapidly until August 2008,when they started a rapid decline. Food commodity prices, especially thosefor biofuel stocks, seem to have followed this trend quite closely, includingthrough the spike period of late 2007–2008 and hence one might inducethat there is a close link between oil prices and food prices that may havebeen one of the main contributing factors to the recent food price spike andsubsequent decline.
4 Slowing rates of increases in farm productivity. During the more than 30years since the last major food price crisis of 1973–1975, agriculturalprices in real terms have been declining due to fast rates of growth ofagricultural productivity (both land productivity as well as total factorproductivity – TFP). In the more recent period, agriculture has beenneglected in most developing countries, as the World Bank’s 2008 WorldDevelopment Report aptly illustrated. The neglect not only involved lowerproductivity growth, via lower investments, but also the perception thatagricultural supplies were not a problem in a world of low prices.Nevertheless, recent research by Fuglie (2008) indicates that for the worldas a whole, annual growth in TFP in the period 2000–2006 does notappear to have slowed down from the levels of 1990–1999. However, formost regions in Asia (the exception is Southeast Asia), growth in TFP in themost recent 2000–2006 period appears to have slowed down considerablyfrom the high growth levels of the 1990–1999 period.
5 The evolution of global food commodity stocks. The ratio of end of seasonworld rice stocks to global utilization appears to have decreased consider-ably between 2000 and 2008 and this has been alleged to have influencedrecent price rises. This decline can be accounted for largely by the declinein the stocks of China. It is a fact that when commodity markets face lowerend of season stocks, they react much more strongly to any negativeshocks. However, as will be seen later, excluding China, world rice stocksas well as stock to utilization ratios have not changed appreciably in thelast 20 years, and in fact may have increased.
6 Commodity speculation. This factor has been highlighted by many analystsand politicians, to the point of blaming the organized commodityexchanges for the price spikes. Speculation is an ordinary fact of life in allcommodity markets, and is a necessary ingredient of all commodity trade.Any agent who buys a contract for a commodity (in the physical or future
TRADE-RELATED POLICIES TO ENSURE FOOD (RICE) SECURITY IN ASIA 65
ES_RC_9-8 18/8/10 20:23 Page 65

markets) with the intention of selling it later for a profit can be considereda speculator. Organized commodity exchanges are important institutionsfor both market transparency as well as the transfer of market risk fromphysical markets to speculators, and they guarantee transactions via theunderlying clearing houses. It is no coincidence that they have evolved andgrown over a period of more that two centuries, as they have beenperceived as important institutions for managing market risks. The adventof large investments by commodity funds in recent years has raised newissues about the utility of the organized exchanges as risk transfer mecha-nisms, and about the role of unfettered speculation in persistent price rises.Detailed analyses of recent events (Gilbert, 2010) have suggested that thereis weak evidence that such investments have contributed to the commodityprice boom. However, rice does not have significant organized futuremarkets, as rice is a highly differentiated crop, so financial speculation inthe rice market seems not to be a major reason for the recent price spike.
7 Macroeconomic factors. While most commodity market analysts look forcommodity-specific fundamental factors to explain individual commodityprice spikes, there are systemic macroeconomic factors that affect allcommodities that have been very influential. The recent commodity boomhas involved most traded commodities and not only agricultural ones. Oneof the key factors that fuelled such a boom seems to have been a period ofeasy money and loose regulation of financial transactions, which resultedin a fast expansion of global financial liquidity, a weak US dollar and lowinterest rates. It is notable that the previous large commodity boom of1973–1975 was also preceded by a period of expanding global liquidityfuelled by large US external deficits and loose monetary policies, much likein recent years. It has been shown by research (Abbott, et al, 2008;Mitchell, 2008) that US dollar depreciation has contributed around 20 percent to increases in food prices. Frankel (2008), in turn, has made theargument that low interest rates, themselves induced by monetary expan-sion, encourage portfolio shift into commodities, and also discouragestockholding, therefore, contributing to commodity price rises. Given thatthe commodity boom of early 2008 came to an abrupt stop in late 2008,followed by subsequent strong price declines in the wake of the globalfinancial crisis, without substantial changes in the underlying commoditymarket fundamentals, this suggests that macroeconomic factors wereimportant in the recent boom.
The important point to highlight is that most of these factors were slow indeveloping over several years, but cumulatively they created a situation oftightly balanced world supply and demand for many agricultural commodities.Furthermore, they made the demand for the agricultural commodities veryprice inelastic. The demand curve for agricultural (and other commodities) isprice elastic when there are ample supplies (from both production and stocks)but becomes very inelastic when the overall supplies are small. As indicated
66 OVERVIEW: THE WORLD RICE MARKET AND TRADE POLICIES
ES_RC_9-8 18/8/10 20:23 Page 66

above, both the reduction of global stocks and the macro factors that fuelleddemand growth pushed the supply–demand balance of most food agriculturalcommodities into a territory where small shocks or small changes in percep-tions could have had very strong price effects. In fact the food productionshocks that happened were small, exemplified by the fact that global grainproduction declined by only 1.3 per cent in 2006, but then increased by 4.7 percent in 2007, and a further 4.8 per cent in 2008, despite the fact that some ofthe major exporting countries such as Australia experienced very sharpnegative production shocks (of the order of 50–60 per cent in both 2005 and2006). Such production shocks are rather normal in global food commoditymarkets, and have occurred on a similar scale several times in the past withoutcausing price spikes. In the rice market, world production in 2007 hardlychanged from production in 2006, and in 2008 it increased by 2.4 per centcompared to 2007, hardly alarming figures. It then appears that productionshocks were not the main factor driving the commodity markets, but rathersome of the other factors indicated above.
A factor that seems to have contributed considerably to the recent short-term price spikes is hoarding tendencies and policies affecting the normal flowof commodities. It is well known that the reaction of many private agents aswell as governments at the onset of price rises was destabilizing, in the sensethat their actions fuelled the demand for current supplies, led by fears ofimpending basic commodity shortages. In other words, when market agentsrealized that there were inadequate buffers in the global markets to ensuresmooth supply flows, they started to behave atomistically, to ensure their ownsmooth supply flow. This created panic buying and hoarding, even when theunderlying conditions did not justify it, thus creating the price spikes. The caseof the global rice market is a good case in point, where, despite adequate globalproduction and supplies, uncoordinated government actions, such as exportrestrictions, starting with that of India in October 2007, and then followed byexport restrictions of Egypt, Viet Nam and China, created a short-term hoard-ing panic and a scramble for available import supplies. The realization inmid-2008 that the situation was not as critical as many thought, led to theopposite effect and a sharp price decline followed.
The evolution of rice market price instability and underlying factors
In the context of the events of the last two years, it is interesting to examine theevolution of world market price volatility. Figure 4.3 plots the indices ofannualized historic volatilities (estimated by normalized period to periodchanges of market prices1) of nominal international prices of rice (averages ofthe various rice prices exhibited earlier) over the previous five decades. TheFigure also exhibits the nominal international rice on the basis of which theindices of volatility are determined. The reason for the juxtaposition of the twotypes of information is to examine visually the relationship between the level of
TRADE-RELATED POLICIES TO ENSURE FOOD (RICE) SECURITY IN ASIA 67
ES_RC_9-8 18/8/10 20:23 Page 67

600Nominal pricesVolatility
500
400
o
'Er) 3000_
u)
200
100
0.60
0.50
0.40
030
0.20
0_10
o 0.00
commodity prices and the market volatility. It has been known for a long time,since Samuelson’s classic article (Samuelson, 1957), that in periods of pricespikes, overall supplies are tight and market volatility should be higher, hencethe expectation is that during periods of price spikes the index of marketvolatility should exhibit a rise as well.
A most notable first characteristic of the graphs in Figure 4.3 is thathistoric volatility (as an index of market instability) of rice, while quitevariable, appears not to have grown during the past five decades, althoughthere were notable short-term peaks in 1993–1994 and 2007/2008. Also, whilethere appears to be no clear correlation between volatility and the underlyinginternational price in the 1973–1975 period, there seems to be a strongrelationship in the most recent 2007/2008 period. While these observations arejust visual and need to be corroborated with appropriate econometric analysis,they raise some questions about the alleged positive relationship between thelevel of prices and the level of volatility.
In the section above, the factors that may have contributed to the recentprice spike were reviewed. The discussion in this section concerns the factorsthat are considered as important in affecting market volatility as expressed byprice volatilities.
There are two factors that traditionally have been considered the mainones in influencing agricultural market price instability. These are the variabil-ity of production and the level of end of previous period stocks. The morevariable is agricultural production, the more one expects to observe largeperiod to period price variations, namely larger volatility. In the same vein, thesmaller the end of season stocks, the more any new market developments arelikely to affect prices, and hence the more variable is market price.
68 OVERVIEW: THE WORLD RICE MARKET AND TRADE POLICIES
Figure 4.3 Historic volatility and nominal international price for rice
Source: FAO Trade and Markets Division
ES_RC_9-8 23/8/10 16:27 Page 68

Figure 4.4 exhibits trends in the coefficients of variation of annual produc-tion of rice computed for four 10-year periods ending in 1999, as well as themost recent period 2000–2006, and for the five continents, as well as the worldas a whole. The data indicate the magnitude of year-to-year variability ofagricultural production relative to the ten-year average of the relevant period,in order to ascertain whether there appear to be any discernible trends invariability.2
Global paddy rice production variability appears to have declined overtime. The trend is similar in all continents, except Oceania, which, however,accounts for only 0.1 per cent of global paddy production. It thus appears thatone of the main traditional factors that affect price volatility, namely produc-tion variability has become less important over the previous 50 years. Hencethis factor, if anything, implies lower overall market volatility.
Turning to end of season stock levels, Figure 4.5 exhibits the end of seasonglobal rice stocks both absolutely and as a share of total utilization, and alsothe same figures without China for the past 20 years. The first observation isthat global end of season stocks of rice do not appear to have been in2007–2008 much smaller in absolute levels than in earlier periods, notably theearly to mid-1990s. Stocks increased considerably and reached a peak around2000–2001 and then started declining. The decline continued until 2004–2005and these trends occurred both with and without China. After 2005 stocksappear to have increased in absolute terms.
Turning to stock to utilization ratios, the most interesting observation fromFigure 4.5 is that the ratios seem to follow the same patterns and turning points
TRADE-RELATED POLICIES TO ENSURE FOOD (RICE) SECURITY IN ASIA 69
Figure 4.4 Coefficients of variation of regional and global production of rice since 1961
Source: Computed from FAO data
0.8
0.7
0.6
0.5
0.4
0.3
0.2
0.1
01961–1969 1970–1979 1980–1989 1990–1999 2000–2006
Africa
America
Asia
Europe
Oceania
World
ES_RC_9-8 18/8/10 20:23 Page 69

both with as well as without China. Also, although there appears to be anegative trend in the ratio of stocks to utilization for the world, when oneexamines the whole 30-year period from 1979 onwards, there is no markednegative trend for the ratios if China is excluded from the world total. In factfor rice, the ratios for the world as well as without China exhibit a slightpositive trend.
However, China is an important producing and trading country, accountingfor 29 per cent of global paddy rice production. It also, and for the most recentyears for which data is available (2007–2008), accounts for 53 per cent ofglobal rice stocks. It is clear that, irrespective of whether the Chinese authoritiesuse stocks for domestic market stabilization or for managing their netexport/imports of basic food commodities (the two are not independent fromeach other), the size of Chinese stocks, as well as changes thereof, may affect theglobal trade picture and price expectations, and hence possibly global prices.
Turning now to the newer factors affecting market volatility, the most diffi-cult to analyse is the influence of commodity traders in organized exchanges.The reason that this is very difficult is that the classification of traders ascommercial (namely those who have an interest in the actual physical commod-ity) and non-commercial that has been adopted in several large exchanges, andon the basis of which some data can be compiled, is not representative of theactual intentions and positions of financial funds, as well as other non-
70 OVERVIEW: THE WORLD RICE MARKET AND TRADE POLICIES
Figure 4.5 Global ending stocks of rice and stock to utilization ratios for thewhole world and for the world without China
Note: s-t-u-r: stock to utilization ratioSource: FAO Trade and Markets Division
Total closing stocks Clos. stocks excl. China s-t-u-r for World
Mill
ion
tons
180
160
140
120
100
80
60
40
20
0
40
35
30
25
20
15
10
5
0
Per
cen
t
s-t-u-r for World excl. China19
79/19
80
1981
/1982
1983
/1984
1985
/1986
1989
/1990
1987
/1988
1991
/1992
1993
/1994
1995
/1996
1997
/1998
1999
/2000
2001
/2002
2003
/2004
2005
/2006
2007
/2008
ES_RC_9-8 18/8/10 20:23 Page 70

commercial actors (Gilbert, 2010). If one examines the participation ofcommercial and non-commercial traders in total open interest in the ChicagoBoard of Trade (CBOT) and in selected futures contracts, then it appears thatthe share in open interest of non-commercial traders increased considerably inall CBOT markets between 2005 and 2008, and this is the period of the finan-cial boom. However, this simple contemporaneous development is not a proofof causality. The question is whether the undoubted increase in participation ofnon-commercial traders in the organized futures and other derivative marketsaffected the market fundamentals, and in particular the level of prices andvolatility. There is very little research on this issue, but some recent empiricalanalysis by Gilbert (2010) and a policy brief by the Conference Board ofCanada (CBC, 2008) seem to suggest that it is price volatility that attracts non-commercial and other financial traders, and not the other way around.
A lot has been said about the influence of the unstable exchange rate of theUS dollar on commodity markets. It is a fact that in recent years the US$exchange rate has varied considerably against the currencies of other majortrading countries. For instance the US$ depreciated against the euro by morethan 30 per cent between 2003 and 2007. It is also the case, albeit not obviousthat since the prices of most internationally traded agricultural commoditiesare quoted in US$, a US$ depreciation has a considerable influence on US$prices of traded commodities. FAO has estimated that a 10 per cent US$ depre-ciation against all currencies, ceteris paribus, could have a 3.5 per centupwards influence on global rice commodity prices. Clearly then it appearsthat the instability of the US$ exchange rates must have contributed signifi-cantly to market price volatility. Given recent global financial and productiondevelopments, the huge international financial flows they imply from agentslooking for safe havens, it is likely that this instability will continue in thefuture, and hence this is likely to continue affecting adversely commoditymarket volatilities.
Apart from the instability of the US$, macroeconomic instability is likely tohave contributed considerably to commodity markets instability. Gilbert(2010) in his empirical analysis finds that both money supply as well as grossdomestic product (GDP) seem to Granger cause commodity prices. The influ-ence may be indirect, for instance through interest rates, as Frankel (2008) hasalready indicated. The current financial crisis does not bode well for monetarystability, especially given the significant monetary expansion that is likely tofollow the fiscal stimulus packages now envisioned in most large economies.Hence it is likely that macroeconomic factors will continue adding instabilityto world commodity markets.
The price of petroleum was already alluded to as an important determinantof agricultural commodity prices, especially for those commodities that can beutilized as biofuel production feedstocks. Schmidhuber (2006) has shown thatwhen petroleum prices are in a certain price range, then oil prices and biofuelfeedstock prices seem to be much more strongly correlated. Several analystshave attributed significant influence on agricultural commodity prices of petro-
TRADE-RELATED POLICIES TO ENSURE FOOD (RICE) SECURITY IN ASIA 71
ES_RC_9-8 18/8/10 20:23 Page 71

leum prices, coupled with biofuel policies (for example Abbott, et al, 2008;Mitchell, 2008). Despite the rapid fall of petroleum prices in late 2008 andearly 2009, the underlying demand for oil in the medium term is real and likelyto increase (OECD-FAO, 2008). This is likely to induce a continuing linkagebetween petroleum prices and biofuel feedstock prices, albeit not during allperiods. As oil prices are likely to be quite unstable given the uncertainties inglobal economic growth, this most likely will induce instability of the agricul-tural commodity markets, both for those products that are directly related tobiofuels, such as maize, sugar and rapeseed, and for commodities that aresubstitutes in production.
The final factor that is likely to affect commodity market volatility iscountry policy actions and reactions to external events. The commodity scareof 2007–2008 and the publicity it received made many governments overreact,by measures that were not always effective at achieving their stated objectives.Figure 4.6 compiled from a FAO survey of government actions in 77 develop-ing countries during the 2007–2008 period, tabulates the type of measures thatwere undertaken in response to the global price rises. The first observation isthat there are only a few countries whose governments did nothing in responseto the global commodity crisis. The second observation is that countries in EastAsia and South Asia appear to have been among the most active in interveningin their domestic markets to avert possible negative consequences of interna-tional price rises.
72 OVERVIEW: THE WORLD RICE MARKET AND TRADE POLICIES
Figure 4.6 Policy actions adopted by a sample of 77 developing countries todeal with high international food commodity prices
Source: FAO Trade and Markets Division
100%
80
60
40
20
0
% o
f cou
ntrie
s ca
rryi
ng o
ut p
olic
y ac
tion
Africa East Asia Europe andCentral Asia
Latin Americaand Caribbean
Middle East and
North Africa
South Asia
Reduce taxes on food grainsIncrease supply using food grain stocksExport restrictionsPrice controls/consumer subsidiesNone
ES_RC_9-8 18/8/10 20:23 Page 72

Market volatility may offer opportunities for speculators, but it is certainlyproblematic for the participants in the physical markets. Given the size of therecent international price variations during a single year (sharp increases in late2007 and early 2008 and equally sharp price decreases in late 2008), manygovernments and market agents are rightfully questioning whether this type ofextreme market volatility might continue in the future. In this context thefollowing thoughts may be useful in assessing the future prospects for marketvolatility.
First, it will take some time for food stocks to be replenished, especially ifunusual weather events continue to occur over the next few seasons. Despitethe fact that prices have come down from their peaks of 2008 and that globalproduction seems to have responded positively to the crisis, the decline inprices may discourage many farmers from further production increases, andgovernments from productive investments. Hence, stock replenishment may bea slow process, implying that the markets will be tightly balanced for sometime to come. With the financial crisis hitting on top of the food crisis, finan-cing will also be scarce for all investments, and this will include investments instocks. However, low interest rates may make stock replacement easier.
Biofuel demand is likely to be important for some time if petroleum pricesstay high. With the global financial and now economic crisis lowering overallpetroleum demand, this looks like a less pressing issue, but petroleum pricesare highly uncertain, and hence it is not clear that they will come downstrongly and persistently. Hence, biofuel demand is likely to stay strong,especially since mandates are likely to stay and investments made in biofuel-producing plants will not be easy to just abandon. Finally, biofuel demand islikely to stay until more energy-efficient new generation biofuels that do notcompete with land resources for food production become widely availablecommercially, and this is not likely to happen for several more years.
The overall conclusion then is that the global food commodity markets arelikely to stay volatile in the next few years, until stocks are replenished, petro-leum prices stabilize and the global financial crisis works itself out. An addedrisk is that the efforts currently made to renew emphasis on agricultural invest-ments to boost productive efficiency, especially in developing agriculture-dependent countries, may be derailed by the probably short-lived hiatus of lowglobal food commodity prices. This calls for a continuing watch on global foodmarkets and developments.
The medium-term outlook for rice in Asia
The medium-term outlook for the world rice economy seems quite bright foreconomies in Asia. According to projections performed by the Organisation forEconomic Co-operation and Development (OECD) and FAO (OECD-FAO,2008) population growth rates in the world are projected to slow down in thenext ten years, with the population growth rate in Asia to slow down to about1.1 per cent (see Figure 4.7). At the same time GDP growth rates are also
TRADE-RELATED POLICIES TO ENSURE FOOD (RICE) SECURITY IN ASIA 73
ES_RC_9-8 18/8/10 20:23 Page 73

projected to slow down, but Asia GDP growth is still projected to grow at ahigher pace than that of the rest of the world (see Figure 4.8). World produc-tion is expected to keep up with demand for food commodities, and this willimply that the real prices of all food commodities will resume their downwardtrend, but because of new demands such as those from biofuels, as well asprojected high prices for petroleum, the real prices in the next ten years formost agricultural food commodities are likely to stay above their levels of theearly 2000s (see Figure 4.9).
Concerning annual growth in global demand for rice, this is likely to beclose to zero for developed countries, and only about 1 per cent for developingcountries. While global annual rice production growth is projected to stayslightly below 1 per cent, world trade is expected to expand faster and at a rateclose to 2.5 per cent. Asia in particular is projected to increase its net exports ofrice (see Figure 4.10).
Figures 4.11–4.17 indicate the projections of the net trade positions for themain Asia rice-trading economies. It can be seen that China and India areprojected to maintain but not expand their net trade export positions of rice.Indonesia and Philippines are likely to increase their net imports, whileThailand, Viet Nam and the least-developed Asia countries are expected toexpand their net exports.
74 OVERVIEW: THE WORLD RICE MARKET AND TRADE POLICIES
Figure 4.7 Projected population growth rates to 2017
Source: FAO Trade and Markets Division
0.0%
0.5%
1.0%
1.5%
2.0%
2.5%
3.0%1998–2007
2008–2017
Africa Asia andPacific
Europe Latin Americaand Caribbean
NorthAmerica
DevelopedOceania
World
ES_RC_9-8 18/8/10 20:23 Page 74
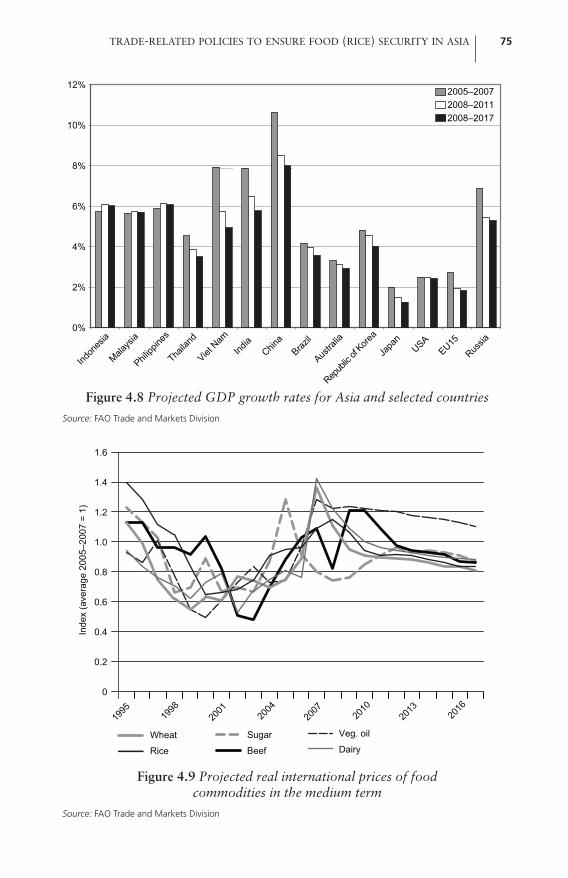
TRADE-RELATED POLICIES TO ENSURE FOOD (RICE) SECURITY IN ASIA 75
Figure 4.8 Projected GDP growth rates for Asia and selected countries
Source: FAO Trade and Markets Division
Figure 4.9 Projected real international prices of food commodities in the medium term
Source: FAO Trade and Markets Division
0%
2%
4%
6%
8%
10%
12%
Indon
esia
Malays
ia
Philipp
ines
Thaila
nd
Viet N
amInd
iaChin
aBraz
il
Austra
lia
Repub
lic of
Korea
Japa
nUSA
EU15Rus
sia
2005–20072008–20112008–2017
1.6
1.4
1.2
1.0
0.8
0.6
0.4
0.2
0
Wheat
Rice
1995 19
9820
01 2004
2007 20
1020
13 2016
Sugar
Beef
Veg. oil
Dairy
Inde
x (a
vera
ge 2
005–
2007
= 1
)
ES_RC_9-8 18/8/10 20:23 Page 75

76 OVERVIEW: THE WORLD RICE MARKET AND TRADE POLICIES
Figure 4.11 China: Projections of net exports of milled rice
Source: FAO Trade and Markets Division
Mill
ion
MT
50
40
30
20
10
0
–10
–20
1986
1989
1992
1995
1998
2001
2004
2007
2010
2013
2016
WheatRiceCoarse grain
–3
–2
–1
0
1
2
3
4
1990
1991
1992
1993
1994
1995
1996
1997
1998
1999
2000
2001
2002
2003
2004
2005
2006
2007
2008
2009
2010
2011
2012
2013
2014
2015
2016
2017
Mill
ion
MT
Figure 4.10 Projections of net grain imports in Asia and the Pacific
Source: FAO Trade and Markets Division
ES_RC_9-8 18/8/10 20:23 Page 76

TRADE-RELATED POLICIES TO ENSURE FOOD (RICE) SECURITY IN ASIA 77
Figure 4.12 India: Projections of net exports of milled rice
Source: FAO Trade and Markets Division
Figure 4.13 Indonesia: Projections of net imports of milled rice
Source: FAO Trade and Markets Division
0
1
2
3
4
5
6
7
1990
1991
1992
1993
1994
1995
1996
1997
1998
1999
2000
2001
2002
2003
2004
2005
2006
2007
2008
2009
2010
2011
2012
2013
2014
2015
2016
2017
Mill
ion
MT
–1
0
1
2
3
4
5
6
7
1990
1991
1992
1993
1994
1995
1996
1997
1998
1999
2000
2001
2002
2003
2004
2005
2006
2007
2008
2009
2010
2011
2012
2013
2014
2015
2016
2017
Mill
ion
MT
ES_RC_9-8 18/8/10 20:23 Page 77

78 OVERVIEW: THE WORLD RICE MARKET AND TRADE POLICIES
Figure 4.14 Philippines: Projections of net imports of milled rice
Source: FAO Trade and Markets Division
Figure 4.15 Thailand: Projections of net exports of milled rice
Source: FAO Trade and Markets Division
–0.5
0
0.5
1.0
1.5
2.0
2.5
1990
1991
1992
1993
1994
1995
1996
1997
1998
1999
2000
2001
2002
2003
2004
2005
2006
2007
2008
2009
2010
2011
2012
2013
2014
2015
2016
2017
Mill
ion
MT
0
2
4
6
8
10
12
14
1990
1991
1992
1993
1994
1995
1996
1997
1998
1999
2000
2001
2002
2003
2004
2005
2006
2007
2008
2009
2010
2011
2012
2013
2014
2015
2016
2017
Mill
ion
MT
ES_RC_9-8 18/8/10 20:23 Page 78

TRADE-RELATED POLICIES TO ENSURE FOOD (RICE) SECURITY IN ASIA 79
Figure 4.16 Viet Nam: Projections of net exports of milled rice
Source: FAO Trade and Markets Division
Figure 4.17 Least-developed Asia (Laos, Myanmar, Cambodia, plus ninesmaller countries): Projections of net exports of milled rice
Source: FAO Trade and Markets Division
0
1
2
3
4
5
6
7
1990
1991
1992
1993
1994
1995
1996
1997
1998
1999
2000
2001
2002
2003
2004
2005
2006
2007
2008
2009
2010
2011
2012
2013
2014
2015
2016
2017
Mill
ion
MT
–1.0
–0.5
0
0.5
1.0
1.5
2.0
1990
1991
1992
1993
1994
199519
9619
9719
9819
9920
0020
0120
0220
0320
0420
0520
0620
0720
0820
0920
1020
1120
1220
1320
1420
1520
1620
17
Mill
ion
MT
ES_RC_9-8 18/8/10 20:23 Page 79

Policies to improve international rice market performance and to assure supplies
It is normal in a period of commodity price spikes for governments and privateagents alike to call for policies to assure smooth flows of supplies and avoidcommodity crises. It would be better, of course, to discuss and plan for suchpolicies before the actual spikes happen, but spikes, nevertheless, increasepublic awareness of the inadequacies of existing insurance mechanisms, andhence boost efforts to create and maintain such systems. The real issue,however, is what type of policies and institutions are effective and economicalin managing commodity market instability and avoiding price spikes.
There is no doubt that a major aspect of any commodity price spike is afast and sudden erosion of confidence in the workings of the market, bothnational and international, with the result that an uncoordinated scramble forindividual (by private and public agents alike) protection leaves all worse off.What kind of institution can ensure confidence in global markets and assuresmooth flows of supplies? Most proposals call for some kind of marketmanagement and control, ranging from coordination of either national orglobal stocks to indirect market interventions via so-called ‘virtual stocks’ inorganized exchanges. However, most such proposals suffer from the fact thatany policy that purports to control or manage fundamentals of a commoditymarket cannot manage the actions of myriads of private market actors, whichis a feature of all agricultural markets. It is only in commodities with very fewsuppliers, such as petroleum, where effective market management is possible,and even then considerable coordination is needed, which is not politically oreconomically easy and invites non-collaboration or non-participation. Thehistory of international commodity control that was attempted after thecommodity boom and subsequent crash of 1973–1975 is not very encouragingand successful, and confined to public market management schemes like thoseof the European Union, which have proved to be very expensive for implemen-tation at the global level.
Alternatively, the main way to ensure confidence in a particular commoditymarket is to have an adequate supply of ‘reserves’, much like a national orinternational financial system needs financial reserves to meet customer needs.The fundamental difference, however, between a global system of financialreserves and management (exemplified by the IMF) and a global system ofcommodity reserves, is that financial reserves can be created essentially out ofnothing and based on the ability of governments to tax their own current andfuture citizens (this is the basic power of central banks), while commodityreserves cannot be created out of thin air. In fact in all previous commoditybooms there were many calls to institute commodity reserves of some form,which, however, were not heeded when prices were low and markets wellsupplied, and priorities for allocations of public money shifted to other moreimmediate concerns. Clearly any form of ‘insurance’ is much costlier after amajor disaster than before it, but perceptions about the need for insurance are
80 OVERVIEW: THE WORLD RICE MARKET AND TRADE POLICIES
ES_RC_9-8 18/8/10 20:23 Page 80

strongest only after a disaster, not before it. It is this fundamental problem ofwhat psychologists call ‘cognitive failure’ that must be overcome at a globallevel if the world is to be assured of an institutional structure that will avoidagricultural commodity price spikes and ensure smooth flows of food to all.
Concerning the rice market, there have been considerable discussionsamong Asian and the Association of Southeast Asian Nations (ASEAN3)countries and regional analysts concerning food security, and in particular ricemarket security and assurance of supplies. For instance Bello (2005) indicatesthat there is enough rice in ASEAN countries to ensure smooth supplies if freetrade is allowed among ASEAN member countries. The ASEAN Secretariat hasprepared a discussion paper outlining options for an ASEAN integrated foodsecurity policy (ASEAN Secretariat, 2008). The basic components of that arean ASEAN Food Security Reserve (AFSR) and an East Asia Emergency RiceReserve (EAERR), which is basically an expansion of the ASFR to include thethree other East Asia countries. As it currently stands the ASFR, which wasfirst established in 1979, is composed of only 87,000 tons, distributed amongASEAN countries, and supposedly to be used in emergencies. However, and asis the case with all multilateral reserve schemes, it is rather hard to defineprecisely what an emergency is, and specify precise conditions under whichstock releases can be made. Furthermore, the amount currently envisioned isvery small compared to the possible emergency and other market stabilizationneeds of ASEAN or ASEAN plus three.
The problem facing many Asian countries, which rely considerably on riceas a basic food security commodity, is that there is no unique policy with whichto manage the domestic market for rice. To simplify the conceptual discussion,given that a government has specific rice price objectives for consumers andproducers, to ensure food security and satisfy diverse consumer and producerconcerns, and given domestic production of rice, one can derive an additional‘supply’ of the commodity that is needed to satisfy the domestic objectives.This additional supply can be obtained through either imports and exports orthrough stock releases and/or accumulation. The basic rice food securityproblem of the government is how to ensure this additional supply at minimumcost. If imports/exports and stocks are publicly controlled, then the govern-ment problem is a more direct one, in the sense that it has to simply decide onquantities of net imports and stock changes. If the rice trade, however, is in thehands of the private sector then the government problem is a more complicatedone as the government in this case has to adopt indirect measures to providethe right incentives for the private traders to act in accordance with publicpolicy objectives. Private agents will invariably act in a speculative manner inanticipation of profits from price movements, and this makes the problem ofmarket management and control much more difficult.
Neither of the above two problems is easy, and this is why Asian govern-ments have adopted a mixture of policies to maintain domestic rice marketobjectives in the face of international price and availability variations. Theproblem, which became acute in the recent rice price spike, was that each
TRADE-RELATED POLICIES TO ENSURE FOOD (RICE) SECURITY IN ASIA 81
ES_RC_9-8 18/8/10 20:23 Page 81

government acted individualistically, in order to assure domestic policy objec-tives, with confidence in the international market breaking down, and theseuncoordinated individualistic policies ended up destabilizing the globalmarkets, making national concerns and overreactions further justified. Theconclusion is that any system that is to prevent global price spikes mustenhance confidence that adequate supplies can be obtained through the inter-national market or through some kind of mutual agreement. The question ofhow to assure rice food security then is how one can build such a system.
To this end the following suggestions are proposed:
1 An enhanced system of market information. It is clear that many wrongmarket policies are adopted because of lack of adequate information aboutmany market variables. In the run-up to the recent food crisis manygovernments adopted a variety of measures, most of doubtful effectiveness,and some which made the market more unstable and induced furthermeasures by others in an effort to protect individual markets. Apart frominformation about supplies and flows, a most important source of weakmarket information concerns the levels of public and private stocks. It isfelt that better information about production and especially of stocks couldconsiderably enhance the ability of decision-makers, both public andprivate, to plan and act accordingly.
2 Enhanced transparency of trade policies. The current Agreement onAgriculture in the WTO does not prevent governments from reducing orbanning exports, or changing trade policy measures such as tariffs in avariable state-dependent manner up to the ‘bound’ tariff rates. However, whatis of considerable concern to trade participants is the unpredictability of tradepolicy changes. A system of timely advance notice of agricultural trade policymeasures affecting the supply of agricultural exports and the demand forimports, and even disciplines on some such measures that may be detrimentalto markets could be made a part of the Doha Round agreement.
3 A forum for regular exchange of information and policies relating to thefood market is important for global food security. Such fora exist today asthey were created in response to previous crises, but they meet very irregu-larly and they are not designed for rapid trade policy review. For instancethe FAO Committee of Commodity Problems was created exactly for thispurpose in the past and meets every two years. The various internationalcommodity bodies (ICBs) and intergovernmental groups of commodities(IGGs) were created even before the previous food crisis of the 1970s andstill function today, but with very infrequent meetings. If the need is forfora that can be convened at short notice and meet much more regularly,then some rethinking of the current international commodity architectureis in order. For instance one can think of additional regional or other multi-lateral institutions, and in the Asia region there is a variety of such foraavailable that could fulfil the need for regular exchange of information andpolicies among concerned members.
82 OVERVIEW: THE WORLD RICE MARKET AND TRADE POLICIES
ES_RC_9-8 18/8/10 20:23 Page 82

4 A system of mutual assurances of smooth supplies. The major problem ofglobal food price spikes is that it is basically a problem of breakdown ofconfidence. One effective way to assure continuity of supplies is by somekind of long-term contract between interested parties. In other words onecountry could enter into a multi-year, bilateral or multilateral agreementwith another country or group of countries for the supply or import of aminimum quantity or a range of quantities of rice. Many countries facedwith problems of supply for instance have been seeking to assurethemselves of regular supplies with such long-term contracts. Recentnewspaper stories have mentioned counter trade barter deals (for instancewheat for petroleum), deals of leasing of land and investment in foodproduction with the commitment to export to the investing country, etc. Itis easy to think of such long-term contracts involving the provision of riceby Asian exporting countries to Asian importing countries. The problemwith any such international contract is its enforcement. In other words,while within a national territory and legal system, there are normally legalsystems to enforce contracts, this is not usually the case when it comes tocontracts between sovereign states or governments. For instance a majorstrength of the organized commodity exchanges is that there exists forevery exchange, and sanctioned by law, a clearing house, which basicallymakes sure that all contracts traded on the exchange are completed andenforced. It is for this purpose, for instance, that to conduct any transac-tion in an organized exchange both parties to the contract must post a‘bond’ in the form of a margin on the amount of the transaction. Theaccumulation of all these margins by the clearing house ensures that allclaims against the various underlying contracts are met. Clearly unlesssome similar system of enforcement is instituted, it is difficult to envisionthat any system of international contracts is enforceable. To this end, thenthe following is proposed.
An international rice food security system
The proposal below stems from the considerations above, as well as from therealization that unless there is some kind of international cooperation, anyconfidence-building system will not function properly. The following elementscould form the ingredients of an international rice food security system(IRFSS).
A system of bilateral or multilateral multi-year agreements orcontracts for rice trade These contracts could be negotiated among interested countries and wouldprovide the framework within which supplies could be assured within certainquantity bands. In other words, the contracts do not have to specify exactquantities and prices but ranges of quantities and state contingent prices, basedon some kind of objective criteria. However, such contracts would provide the
TRADE-RELATED POLICIES TO ENSURE FOOD (RICE) SECURITY IN ASIA 83
ES_RC_9-8 18/8/10 20:23 Page 83

framework within which a country could ensure another country of exportsupplies (to be performed by public or private traders) and similarly anotherone could assure itself of import provisions. The exact terms of each transac-tion in a given year, for example price, would be dependent on the state of thethen prevailing market, but the contracts would ensure that quantities could beexchanged.
In cases where trade is in the hands of public agencies, the execution ofcontracts can be ensured. However, in the rice market most trade is donethrough the private sector. Hence it is difficult to envision ‘contracts’ betweensovereign states unless they can control the actions of the private sector, andthis may be impossible. In such cases, the main purpose of such contracts oragreements would be to ensure the markets that there will be no public inter-ventions to prevent trade from occurring. In other words, state-to-state‘contracts’ could be negotiated in the form of binding each other to not inter-vene in the rice trade up to certain levels of quantities or prices. Suchagreements, in fact could be entered in some kind of binding commodityarrangement.
There are international examples of such collaborative schemes. Forinstance the International Energy Agency (IEA) has developed protocols forinternational collaboration in assuring supplies to an IEA member countrywhose import market has been disrupted. Such protocols could form perhapsthe basis for similar protocols and contracts for rice supply guarantees, underthe aegis, for instance of some kind of multilateral institution.
A system of ‘reserves’ to back the contracts negotiatedJust like in the case of a clearing house in an organized exchange, the bilateralor multilateral contracts discussed above would need to be guaranteed againstnon-performance by some kind of ‘margin’. It is proposed that this role couldbe played on the one hand by an amount of domestic rice reserves in the case ofthe exporter who enters the transaction, and on the other hand by an amountof monetary reserves in the case of an importer who is the other party to thetransaction. In other words and as an example, if two governments sign a ten-year contract according to which one would accept the obligation to providethe other annually with 200,000 tons of rice at some kind of market-basedprices, then the exporting country would commit to keep a certain percentageof this quantity (for instance 5 per cent or 10,000 tons) in storage, as part ofthe agreement. This stock could provide some guarantee for possible non-performance of the traders of the exporting country. While, of course 5 percent of the flow export demand held in stock will not satisfy a much larger flowdemand in any one year (for example 5000 tons could not satisfy the full200,000 ton commitment of the exporter), such stocks, which would be heldpublicly, would be additional to all other privately held stocks and could possi-bly better smooth the flow of supplies. Furthermore, it would provide somebuffer against calls for government intervention to prevent exports in a periodof tight markets.
84 OVERVIEW: THE WORLD RICE MARKET AND TRADE POLICIES
ES_RC_9-8 18/8/10 20:23 Page 84

The physical stocks could be kept in the national territory of the exportingcountry, but could be committed through some kind of warehouse receipt,guaranteed by the government of the exporting country to a multilateral clearinghouse type of institution. This, in turn could be some regional institution, orsecretariat, that would be agreed by all concerned. Similarly the importingcountry to the contract could pledge a certain amount of ‘money reserves’, againin the form of some kind of IOU or paper receipt. These IOUs, whether in physi-cal or money form, could become negotiable.
The rationale for such a system comes from the history of the organizationof the current nationally organized commodity exchanges. The originalimpetus to these exchanges was a system of forward contracts that were madebetween interested parties, backed by a system of warehouse receipts, which inturn became negotiable and evolved into the current system of futurescontracts in the various organized exchanges.
An enhanced system of emergency reservesSuch a system currently exists at least in ASEAN and is under consideration inASEAN plus three. The rationale of such a system is appropriate in the sensethat it is not envisioned that it will influence the markets of the relevant riceproduct. As such, this system is to supplement the market-based systemproposed above and is to operate outside such a system. However, in order forsuch a system to function properly, the nature of emergencies must be specifiedmuch more concretely than in the current agreement, and also the rules ofrelease and replenishment must also be worked out in more detail. If such rulesremain vague, then the effectiveness of the reserve is compromised. Given thatin an emergency situation, and if monetary resources are available, supplies canbe obtained relatively fast for delivery to emergency areas, the logic of why onemay need additional emergency reserves must be reconsidered. Such a logic,however, has been known for some time (for example see Sarris, 1985) andrelies on the idea of timeliness of emergency relief, and whether emergencystocks can improve on this timeliness. Hence, in this case and given that anemergency reserve has already been instituted in Asia, what one needs isfurther elaboration of the conditions for release and replenishment.
The ingredients of the system proposed above, some of which already exist,would not alter the fundamentals of the rice market, which is one of the mainstumbling blocks with most proposals that rely on market manipulation. Itrelies on enhancing transparency and confidence, while at the same time provid-ing some kind of guarantees for international contract enforcement throughinternational cooperation. It is this lack of international cooperation that wasevident in the past and that has been shaken in the recent food crisis. Unless,however, one targets the underlying causes of the breakdown of the system,which as indicated have to do with the breakdown of mutual confidence, onecannot hope to enhance the food security-related performance of the global ricemarket. The ideas and proposals above are aimed at stimulating an informeddebate on the relevant issues.
TRADE-RELATED POLICIES TO ENSURE FOOD (RICE) SECURITY IN ASIA 85
ES_RC_9-8 18/8/10 20:23 Page 85
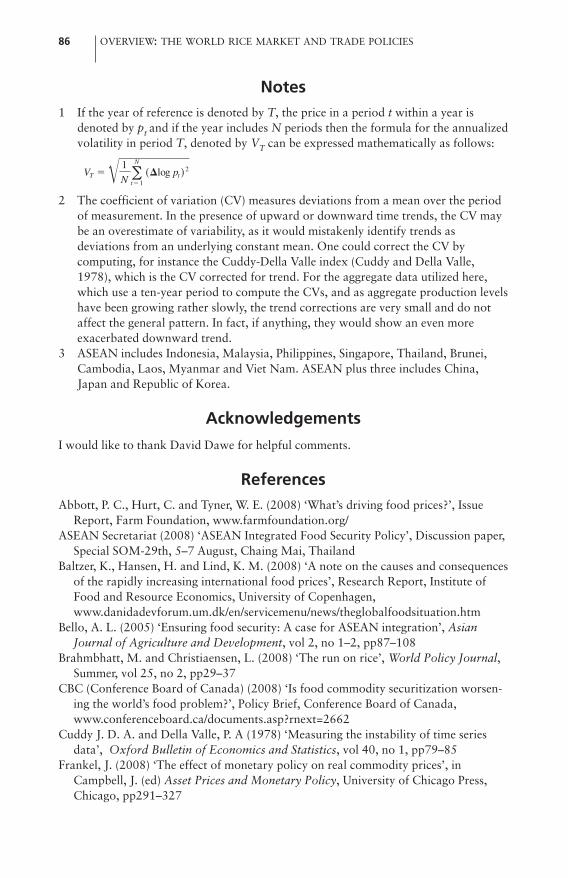
Notes1 If the year of reference is denoted by T, the price in a period t within a year is
denoted by pt and if the year includes N periods then the formula for the annualizedvolatility in period T, denoted by VT can be expressed mathematically as follows:
2 The coefficient of variation (CV) measures deviations from a mean over the periodof measurement. In the presence of upward or downward time trends, the CV maybe an overestimate of variability, as it would mistakenly identify trends asdeviations from an underlying constant mean. One could correct the CV bycomputing, for instance the Cuddy-Della Valle index (Cuddy and Della Valle,1978), which is the CV corrected for trend. For the aggregate data utilized here,which use a ten-year period to compute the CVs, and as aggregate production levelshave been growing rather slowly, the trend corrections are very small and do notaffect the general pattern. In fact, if anything, they would show an even moreexacerbated downward trend.
3 ASEAN includes Indonesia, Malaysia, Philippines, Singapore, Thailand, Brunei,Cambodia, Laos, Myanmar and Viet Nam. ASEAN plus three includes China,Japan and Republic of Korea.
Acknowledgements
I would like to thank David Dawe for helpful comments.
ReferencesAbbott, P. C., Hurt, C. and Tyner, W. E. (2008) ‘What’s driving food prices?’, Issue
Report, Farm Foundation, www.farmfoundation.org/ ASEAN Secretariat (2008) ‘ASEAN Integrated Food Security Policy’, Discussion paper,
Special SOM-29th, 5–7 August, Chaing Mai, ThailandBaltzer, K., Hansen, H. and Lind, K. M. (2008) ‘A note on the causes and consequences
of the rapidly increasing international food prices’, Research Report, Institute ofFood and Resource Economics, University of Copenhagen,www.danidadevforum.um.dk/en/servicemenu/news/theglobalfoodsituation.htm
Bello, A. L. (2005) ‘Ensuring food security: A case for ASEAN integration’, AsianJournal of Agriculture and Development, vol 2, no 1–2, pp87–108
Brahmbhatt, M. and Christiaensen, L. (2008) ‘The run on rice’, World Policy Journal,Summer, vol 25, no 2, pp29–37
CBC (Conference Board of Canada) (2008) ‘Is food commodity securitization worsen-ing the world’s food problem?’, Policy Brief, Conference Board of Canada,www.conferenceboard.ca/documents.asp?rnext=2662
Cuddy J. D. A. and Della Valle, P. A (1978) ‘Measuring the instability of time seriesdata’, Oxford Bulletin of Economics and Statistics, vol 40, no 1, pp79–85
Frankel, J. (2008) ‘The effect of monetary policy on real commodity prices’, inCampbell, J. (ed) Asset Prices and Monetary Policy, University of Chicago Press,Chicago, pp291–327
VT � � 1
N∑N
t�1(�log pt )
2
86 OVERVIEW: THE WORLD RICE MARKET AND TRADE POLICIES
ES_RC_9-8 23/8/10 16:28 Page 86

Fuglie, K. O. (2008) ‘Is a slowdown in agricultural productivity growth contributing toa rise in commodity prices?’, Agricultural Economics, vol 39, Supplement,pp431–441
Gilbert, C. L. (2010) ‘Commodity speculation and commodity investment’, inCommodity Market Review, 2009–10, FAO, Rome
Headey, D. and Fan, S. (2008) ‘Anatomy of a crisis: The causes and consequences ofsurging food prices’, Agricultural Economics, vol 39, Supplement, pp375–391
Helbling, T., Mercer-Blackman, V. and Cheng, K. (2008) ‘Commodities boom: Ridinga wave’, Finance Development, vol 45, pp10–15
Mitchell, D. (2008) ‘A note on rising food prices’, Policy Research Working Paper No.4682, World Bank, Washington, DC
OECD-FAO (Organisation for Economic Co-operation and Development and Foodand Agriculture Organization of the United Nations) (2008) Agricultural Outlook2008–2017, OECD-FAO, Paris and Rome
Samuelson, P. A. (1957) ‘Intertemporal price equilibrium: A prologue to the theory ofspeculation’, Weltwirtschaftliches Archiv, vol 79, pp181–219; reprinted in P. A.Samuelson, Collected Scientific Papers (ed. J. E. Stiglitz)
Sarris, A. H. (1985) ‘Degree of reliance on national food stocks and imports’, in WorldFood Security: Selected Themes and Issues, Economic and Social DevelopmentPaper No 53, FAO, Rome
Schmidhuber, J. (2006) ‘Impact of an increased biomass demand use on agriculturalmarkets, prices, and food security: A longer-term perspective’, InternationalSymposium of Notre Europe, Paris, www.fao.org/es/esd/biomassnotreEurope.pdf
Schnepf, R. (2008) ‘High agricultural commodity prices: What are the issues?’, CRSReport for Congress, Congressional Research Service, Washington, DC,http://assets.opencrs.com/rpts/RL34474_20080506.pdf
Trostle, R. (2008) ‘Global agricultural supply and demand: Factors contributing to therecent increase in food commodity prices’, ERS Report WRS-0801, EconomicResearch Service, USDA, Washington, DC, www.ers.usda.gov/publications/wrs0801
von Braun, J., Akhter, A., Asenso-Okyere, K., Fan, S., Gulati, A., Hoddinott, J.,Pandya-Lorch, R., Rosegrant, M. W., Ruel, M., Torero, M., van Rheenen, T. andvon Grebmer, K. (2008) ‘High food prices: The what, who, and how of proposedpolicy actions’, IFPRI Policy Brief, IFPRI, Washington, DC, www.ifpri.org/PUBS/ib/foodprices.asp
TRADE-RELATED POLICIES TO ENSURE FOOD (RICE) SECURITY IN ASIA 87
ES_RC_9-8 18/8/10 20:23 Page 87

ES_RC_9-8 18/8/10 20:23 Page 88

Part III
POLICY RESPONSES INTRADITIONAL IMPORTING
COUNTRIES
ES_RC_9-8 18/8/10 20:23 Page 89

ES_RC_9-8 18/8/10 20:23 Page 90

5
Volatility in Rice Prices and PolicyResponses in Bangladesh
Mahabub Hossain and Uttam Deb
Introduction
In recent times the world has witnessed unprecedented volatility in the prices ofmajor staple foods such as rice and wheat. As a net importer of food grains,Bangladesh was seriously affected by the surge in world rice prices thatoccurred between September 2007 and April 2008, as rice is the dominantfood staple accounting for over 90 per cent of total consumption. The domesticprice increased by nearly 65 per cent during 2007–2008. This food price infla-tion led to considerable erosion in the purchasing power of the poor who spendover half of their income on rice, and has threatened to undermine the progressmade toward achieving the Millennium Development Goal (MDG) targets onreducing hunger and poverty. Since September 2008 prices have declined andby April 2009 reached a level lower than the cost of production, threateningfarmers’ incentives to produce.
This chapter is organized as follows. The next section gives an overview ofBangladesh’s achievements in production and availability of food grains, toprovide the background behind the surge in rice prices. Then there is a compar-ative picture of the trend in rice prices in Bangladesh compared to the worldmarket. The chapter subsequently describes the immediate policy response ofthe government to contain the crisis. The chapter concludes that the govern-
ES_RC_9-8 18/8/10 20:23 Page 91

ment will have to make a fine balance in protecting the interests of low-incomeconsumers and commercial farmers.
Production and availability of food grains
Bangladesh reached its land frontier in the 1960s. The reports of agriculturalcensuses show a continuous decline in arable land by 1 per cent per year due toalternative use of land for housing, industrialization and infrastructure develop-ment. Bangladesh has made good progress in reducing population growth. The2001 population census recorded a growth of 1.4 per cent per year compared toabout 3.0 per cent in the 1970s. But due to the expanded base, the population isstill growing by about 2 million every year. The country needs to increase riceproduction 0.5 million tons annually to meet the growing demand.
Bangladesh has made commendable progress in increasing the productionof staple food grains despite an extreme scarcity of land resources. Rice areaincreased only marginally from 9.3 million ha in 1971–1972 to 10.6 million hain 2007–2008 (see Table 5.1 and Figure 5.1), but production nearly tripledfrom 14.6 to 43.2 million tons over this period (see Figure 5.2). The progresswas particularly notable since the late 1980s when the government introduceda policy of gradual deregulation of markets and liberalization of trade inagricultural machinery and inputs. The change in policies promoted massiveprivate-sector investment in groundwater irrigation that fuelled rapid diffusionof high-yielding rice varieties. The growth in rice production accelerated from2.2 per cent per year during 1970–1990 to 3.4 per cent during 1991–2008.Over 80 per cent of the growth in production came from the increase in yielddue to technological progress.
There are three different rice-growing seasons in Bangladesh: aus, amanand boro. The aus crop is an upland pre-monsoon crop with low yields, theaman crop is a rainfed monsoon crop, and the boro crop is a dry-seasonirrigated crop. Most of the increase in production and productivity has beendue to expansion of the boro crop, as well as higher yields for this crop.Traditionally, boro used to be grown in extreme low-lying lands in depressedbasins, but it has undergone a substantial transformation due to increasedtapping of groundwater. The boro area expanded from 0.86 million ha in1971–1972 to 2.45 million ha in 1989–1990 and further to 4.61 million ha in2007–2008. The yield of boro increased marginally during the 1980s, but then
92 POLICY RESPONSES IN TRADITIONAL IMPORTING COUNTRIES
Table 5.1 Trends in area, production and yield of rice (paddy) in Bangladesh,1971–1972 to 2007–2008
1971–1972 1989–1990 2007–2008
Area (million ha) 9.28 10.41 10.57Yield (tons/ha) 1.57 2.54 4.08Production (million tons) 14.59 26.43 43.18
Source: Bangladesh Bureau of Statistics
ES_RC_9-8 18/8/10 20:23 Page 92

VOLATILITY IN RICE PRICES AND POLICY RESPONSES IN BANGLADESH 93
Figure 5.1 Trends in rice area harvested in Bangladesh, financial years1971–1972 to 2008–2009
Source: Prepared by authors, based on data from Bangladesh Bureau of Statistics
12
10
8
6
4
2
0
1971
–197
2
1973
–197
4
1975
–197
6
1977
–197
8
1979
–198
0
1981
–198
2
1983
–198
4
1985
–198
6
1987
–198
8
1989
–199
0
1991
–199
2
1993
–199
4
1995
–199
6
1997
–199
8
1999
–200
0
2001
–200
2
2003
–200
4
2005
–200
6
2007
–200
8
Mill
ion
hect
ares
Aus Aman Boro Total Rice
Figure 5.2 Trends in rice (paddy) production in Bangladesh, financial years1971–1972 to 2008–2009
Source: Prepared by authors, based on data from Bangladesh Bureau of Statistics
50
45
40
35
30
25
20
15
10
5
0
1971
–197
2
1973
–197
4
1975
–197
6
1977
–197
8
1979
–198
0
1981
–198
2
1983
–198
4
1985
–198
6
1987
–198
8
1989
–199
0
1991
–199
2
1993
–199
4
1995
–199
6
1997
–199
8
1999
–200
0
2001
–200
2
2003
–200
4
2005
–200
6
2007
–200
8
Mill
ion
tons
Aus Aman Boro Total Rice
ES_RC_9-8 18/8/10 20:23 Page 93

increased substantially from to 3.67 tons per hectare (t/ha) in 1994/1995 to5.78t/ha by 2007–2008 (see Figure 5.3). The recent increase in yield was due togradual adoption of second-generation modern varieties (MVs) BRRI dhan 28and 29 that have a 1.0 to 1.5t/ha yield advantage over the first-generation MVsand hybrids. The adoption of these varieties has now almost reached theceiling. The expansion of boro area and the increase in yield accounted fornearly 85 per cent of the increase in rice production during the 1980–2009period.
Boro, however, is a highly input-intensive crop. Almost 20 per cent of thevalue of the crop goes on the payment for irrigation water. For boro cultivation,the farmer uses chemical fertilizers at almost double the amount used in otherseasons. With the increase in the price of diesel (used for operating shallow tubewells) and non-nitrogen fertilizers, the unit cost of production of boro rice hasincreased substantially. As a result, the cultivation of boro has become lessprofitable than aman, the traditional monsoon-season rainfed rice crop.
Farmers have started adopting hybrid rice in the boro season to furtherincrease yield and reduce the unit cost of rice cultivation. At the farm level,hybrid rice has a 1.5t/ha yield advantage compared to inbred rice varieties.Adoption has remained slow, however, because seed costs are three timeshigher than inbred rice varieties, and because of inferior grain quality forwhich the hybrid rice fetches a lower price in the market.
94 POLICY RESPONSES IN TRADITIONAL IMPORTING COUNTRIES
Figure 5.3 Trends in rice (paddy) yield in Bangladesh, financial years1971–1972 to 2008–2009
Source: Prepared by authors, based on data from Bangladesh Bureau of Statistics
0
1.50
3.00
4.50
6.00
1971
-72
1973
-74
1975
-76
1977
-78
1979
-80
1981
-82
1983
-84
1985
-86
1987
-88
1989
-90
1991
-92
1993
-94
1995
-96
1997
-98
1999
-00
2001
-02
2003
-04
2005
-06
2007
-08
Pad
dy Y
ield
(t/h
a)
Aus Aman Boro Total Rice
ES_RC_9-8 18/8/10 20:23 Page 94

Rice grown in the aman season accounted for nearly 60 per cent of riceproduction in the 1970s. The growth in yield for this crop variety has remainedsluggish. The average yield for the MVs at the farmer’s field is about 4.0t/ha inthe aman season compared to 5.5t/ha in the boro season. The yield is lowerbecause of high cloud cover and low sunshine levels, which reduces photosyn-thesis. The high humidity in the monsoon season also exposes the aman plantto insect and disease pressures. The monsoon has become more erratic inrecent years due to climate change, exposing the crop to both droughts andsubmergence from heavy rains, which in turn result in substantial yield losses.Due to the high risks of cultivation, subsistence farmers are discouraged fromadopting the input-intensive improved varieties and they use inputs in subopti-mal amounts, which further lower yields. Development and diffusion of MVstolerant to submergence, drought and soil salinity will be needed for furtherincreases in rice production in the aman season.
Food availability is augmented by domestic production and import ofwheat, a minor food staple in Bangladesh. Wheat was an insignificant crop atthe time of independence with a level of production of only 65,000 tons.Production expanded rapidly since the mid-1970s due to the availability ofhigh-yielding MVs and the low cost of irrigation. The production of wheatreached its peak of about 1.84 million tons in 1999–2000. Since then, wheathas started to be replaced by hybrid maize, another new crop in Bangladesh.The production of maize is more profitable than wheat and is more suitable foragro-ecological conditions in Bangladesh. Maize also has the advantage of anassured market due to rising demand for feed from the fast-growing poultryindustry. As a result, wheat production declined to only 0.85 million tons by2008–2009.
Bangladesh used to get a substantial amount of food aid from developedcountries. The availability of food aid fluctuated from 1.5 to 2.0 million tonsduring the 1970s and 1980s, most of which was wheat. Food aid has declinedsubstantially since the early 1990s in response to the critique that food aiddepressed domestic food prices and incentives for farmers to increase produc-tion. The private sector has, however, started importing wheat to meet thegrowing demand from urban consumers, which has partly offset the decline infood aid. In 2008–2009, the import of wheat by the private sector reachedabout 2.0 million tons.
Despite the favourable trends in domestic production, Bangladesh is notyet self-sufficient in cereal grains. Besides the import of wheat, the deficit indomestic production is met through commercial import of rice. Until themid-1990s, Bangladesh imported mostly from Thailand, Pakistan, the USand Viet Nam but, since 1995, India has been the main trading partner.Other countries exporting rice to Bangladesh in recent years includeMyanmar, Pakistan, Thailand and Viet Nam. Imports from India increasedbecause (1) it is quicker and cheaper to bring rice from India; (2) it is possiblefor importers to bring in small quantities of rice by road; and (3) Indiaexports parboiled rice, which is preferred by most Bangladeshis (Deb et al,
VOLATILITY IN RICE PRICES AND POLICY RESPONSES IN BANGLADESH 95
ES_RC_9-8 18/8/10 20:23 Page 95

2009). The import of rice increases substantially in years following poorharvests from floods and droughts. Bangladesh imported over 3.0 milliontons of rice and wheat during 1987–1988, 1998–1999 and 2004–2005 – allthese years followed devastating floods (see Figure 5.4). Rice imports got aboost from a change in policy in 1993 when the government removed the banon import of rice and wheat by the private sector. The private-sector importof rice reached a peak at 2.6 million tons (nearly 10 per cent of domesticconsumption) in 1998–1999, and fluctuates widely from year to yeardepending on the size of the rice harvest.
The availability and access of food grains, the major elements of foodsecurity, have improved substantially over the past two decades. In 2005, thelevel of rice consumption was 477 grams per person per day in rural areas and389g in urban areas. At these levels, the poorest in society have exceeded thequantity of rice required for balanced nutrition (see Tables 5.2 and 5.3). Inurban areas per capita consumption of rice declined between 1991 and 2005indicating that the middle- and high-income groups have started reducing riceconsumption in favour of a more diversified diet (see Table 5.3). The averagelevel of per capita rice consumption in Bangladesh is one of the highest inAsia.
96 POLICY RESPONSES IN TRADITIONAL IMPORTING COUNTRIES
Figure 5.4 Trends in milled rice imports by Bangladesh, financial years1972–1973 to 2008–2009
Source: Prepared by authors, based on data from Bangladesh Bureau of Statistics
0
500
1000
1500
2000
2500
3000
3500
1972
–197
3
1974
–197
5
1976
–197
7
1978
–197
9
1980
–198
1
1982
–198
3
1984
–198
5
1986
–198
7
1988
–198
9
1990
–199
1
1992
–199
3
1994
–199
5
1996
–199
7
1998
–199
9
2000
–200
1
2002
–200
3
2004
–200
5
2006
–200
7
2008
–200
9
Private sector importPublic commercial import
Food aid Th
ousa
nd to
ns
ES_RC_9-8 18/8/10 20:23 Page 96

Trends in rice prices
The domestic price of rice in Bangladesh was higher than that on the worldmarket in the 1970s, 1980s and early 1990s. During the early 1970s, the worldexperienced a similar surge in food prices. The price of rice in the world marketincreased from $147 per ton in 1972 to $542 per ton in 1974. The price in theBangladesh market rose to even higher levels from $316 per ton in 1972 to$826 per ton in 1974. The rapid surge in prices led to severe food insecurityculminating in famine during late 1974. A positive supply response, however,helped prices come down to a more normal level of $250 per ton in 1976, bothin the global and the Bangladesh markets. Since then the rice price in the worldmarket has been fluctuating at around $300 per ton with a downward trendduring the early 1980s and in the late 1990s. The rice market in Bangladeshfollowed the same trend as in the world market, with prices remaining higherby an average of 40 per cent in the 1980s, and by 20 per cent during the early1990s. By the late 1990s, however, the domestic price was generally at the
VOLATILITY IN RICE PRICES AND POLICY RESPONSES IN BANGLADESH 97
Table 5.2 Per capita consumption of rice, 2005
Income quintile group Rice as % of Per capita consumption consumption expenditure of rice (kg/person/year)
Rural Urban Rural Urban
First (poorest) 52 42 152 150Second 46 38 172 156Third 40 33 179 145Fourth 34 26 188 143Fifth (richest) 31 20 196 132All groups 40 28 174 142
Source: Bangladesh Bureau of Statistics (2005)
Table 5.3 Consumption of different food items in Bangladesh, 1983–1984 to 2005 (g/person/day)
Food item Minimum Rural area Urban areaintake required for balanced 1983– 1991– 2000– 2005 1983– 1991– 2000– 2005
nutrition 1984 1992 2001 1984 1992 2001
Rice 390 421 481 479 477 351 416 383 389Wheat 100 65 42 18 12 79 55 40 28Veg. & potatoes 225 140 176 193 221 179 209 198 228Pulses 30 26 17 15 13 22 22 19 19Oils & fats 20 7 9 11 11 11 16 18 18Fish 45 29 32 37 40 39 48 42 50Meat & eggs 34 10 12 14 18 22 20 34 32Milk 30 22 18 29 32 34 23 32 36
Sources: Bangladesh Bureau of Statistics (series), Report of the Household Income and Expenditure Survey, variousyears. Bangladesh National Nutrition Council for the norm of minimum food intake required for balanced nutri-tion, as cited in the unpublished report of the National Commission of Agriculture set up in the late 1990s.
ES_RC_9-8 18/8/10 20:23 Page 97

same level as in the world market. The other notable feature of the price trendis that the fluctuation of prices around the trend was less pronounced inBangladesh than in the world market. Since September 2004, rice prices inBangladesh have been lower than in Thailand (5 per cent broken rice), whichserves as the location for world price quotations (see Figure 5.5). Rice prices inBangladesh are usually higher than those in India (Delhi), but have shown amixed pattern in recent years.
The price in the world rice market reached a minimum at $174 per ton in2001. Since then the price has been rising due to a slowdown in the growth ofrice production. As technological progress reached a plateau in the irrigatedecosystem, the major rice-growing countries in Asia experienced a drasticdecline in the growth of rice yields. Since the demand for rice continued togrow, the deficit in demand was met by drawing down rice stocks. By 2004,world rice stocks had reached the lowest level since the food crisis in the 1970s.The depletion in rice stocks along with export restrictions led to an upwardmovement in prices, with the FOB export price of 5 per cent brokens parboiledrice increasing from $208 per ton in January 2004 to $384 per ton inDecember 2007 and then to an all time high of $1047 per ton in May 2008.
98 POLICY RESPONSES IN TRADITIONAL IMPORTING COUNTRIES
Figure 5.5 Comparison of domestic rice prices in Bangladesh, Delhi and Bangkok, January 2004 to June 2009
Source: Department of Agricultural Marketing, Bangladesh; Thai Rice Exporters Association; Thailand and Ministryof Consumer Affairs, Food and Public Distribution; Government of India
0
200
400
600
800
1000
1200
Jan 2
004
Wholesale prices of coarse rice inBangladeshWholesale prices of parboiled rice inDELHI
FOB prices of 5% broken parboiledrice in Bangkok
Apr 20
04
Jul 2
004
Oct 20
04
Jan 2
005
Apr 20
05
Jul 2
005
Oct 20
05
Jan 2
006
Apr 20
06
Jul 2
006
Oct 20
06
Jan 2
007
Apr 20
07
Jul 2
007
Oct 20
07
Jan 2
008
Apr 20
08
Jul 2
008
Oct 20
08
Jan 2
009
Apr 20
09
US
$/to
n
ES_RC_9-8 18/8/10 20:23 Page 98

Slayton (2009) observed that international rice prices were directly influencedby trade restrictions and speculative buying by countries such as thePhilippines. In Bangladesh’s domestic market, the increase in prices wassmaller, although still substantial, increasing from $225 per ton in January2004 to $318 per ton in November 2007, and then further to an all-time highof $462 per ton in April 2008.
Bangladesh still had a substantial deficit in food grains when the recentprice hike hit the country in 2007. The technological progress in the irrigatedsystem was approaching the ceiling, with irrigation coverage reaching abouttwo-thirds of cultivated land, and complete adoption of modern varieties onlands with access to irrigation. The expansion of production under the rainfedsystem was constrained by unfavourable growing environments, the high riskin rice farming due to frequent exposure to natural disasters, and non-avail-ability of technologies tolerant to climatic stresses. In 2007, the deficit fromdomestic production was accentuated with substantial loss of rice productionfrom two successive floods in July and September, and a devastating cyclonethat hit the southwestern coast on 15 November. It is estimated that the loss inrice production from these natural disasters reached nearly 2.5 million tons,nearly 10 per cent of domestic consumption.
A loss of similar magnitude also occurred during the devastating flood of1998. But during that year the private sector was able to meet the deficit byimporting rice from across the border in India. At that time, India had accumu-lated a substantial stock of food grains and was eager to offload it byencouraging traders to export. The Indian situation with regard to foodsurplus and rice export policy was different in 2007–2008, however. On 9October 2007, India’s Cabinet Committee on Economic Affairs decided to banexports of non-basmati rice. On 25 October 2007, the same Committeedecided to reverse the export ban, but instead set an MEP of $425 per ton forexport in the global market, a price that was well above then prevailing levels.The MEP subsequently increased to $505 per ton on 27 December 2007, $650per ton on 19 March 2008, and $1000 per ton for non-basmati rice on 28March 2008 (at that stage, the MEP for basmati rice was raised to $1200 perton). Finally, India introduced a ban on rice exports on 1 April 2008, whichwas still in force as of late 2009. As India raised its MEPs, Thailand followedsuit by raising prices for its exports. Other countries, including Viet Nam,Cambodia and Egypt followed India in banning rice exports. The domesticprice of rice in Bangladesh in both retail and wholesale markets increasedsharply along with the ever higher MEPs announced by India (see Figure 5.6).
The ban of rice exports by India and the rapid increase in the price in theworld market affected imports by the private sector. To the extent that rice wasavailable, traders were apprehensive whether they could make a profit byimporting rice at such high prices when the government policy is to keep pricesunder control through intervention in the food market and subsidized fooddistribution to the low-income groups. With the Indian border closed, thetraders imported small amounts through informal channels from Myanmar,
VOLATILITY IN RICE PRICES AND POLICY RESPONSES IN BANGLADESH 99
ES_RC_9-8 18/8/10 20:23 Page 99

where the price was still low. The stock of food grains held by the governmentfell to less than 500,000 tons due to relief operations in the aftermath of thefloods and cyclone. The Government of Bangladesh made a special agreementwith the Indian government to import 500,000 tons, but it took a long time toagree upon the price. The first lot of imports (about 120,000 metric tons) fromIndia arrived in April 2008 when the bumper boro harvest (due to a massivesupply response) was about to reach the market. The rest of the amount(380,000 metric tons) was delivered after July 2008.
The evolution of monthly wholesale and retail coarse rice prices inBangladesh experienced three main phases between January 2003 and June 2009(see Figure 5.7). From January 2003 to January 2007, rice prices were relativelysteady in real terms, although between September 2004 and April 2005 pricesincreased 21 per cent. Nevertheless, the price in January 2007 was lower than itwas in January 2003. In the second phase (January 2007 to April 2008), pricesincreased sharply by 79 per cent in real terms. Finally, in the third phase (April2008 to June 2009), prices collapsed back to the levels prevailing during the firstphase. The increase in prices stopped with the arrival of a large boro harvest inApril that caused prices to decline temporarily. Prices increased again in Julyhowever, before steadily declining for the next year. By June 2009 they hadreached the same level as in February 2007 at the start of the surge in prices. InMay and June 2009, the farm-gate price of rice was below the cost of production.
Higher retail and wholesale rice prices were clearly transmitted to farmers(see Figure 5.7), and it is evident from the figure that paddy price movements
100 POLICY RESPONSES IN TRADITIONAL IMPORTING COUNTRIES
Figure 5.6 Relationship between domestic wholesale and retail price of coarserice with MEP declared by India
Source: Department of Agricultural Marketing, Bangladesh; Thai Rice Exporters Association; Thailand and Ministryof Consumer Affairs, Food and Public Distribution; Government of India
0
5
10
15
20
25
30
35
40
Jan 2
007
Wholesale price Retail price $650 $1000
$425
$505
Pric
e (T
k/kg
)
Jul 2
008
May 20
08
Jan 2
008
Mar 20
07
May 20
07
Jul 2
007
Sep 20
07
Nov 20
07
Mar 20
08
Jan 2
009
Mar 20
09
Sep 20
08
Nov 20
08
ES_RC_9-8 18/8/10 20:23 Page 100

were highly correlated with movements in both wholesale and retail markets.Paddy prices rose throughout 2007, even when the aman harvest arrived in themarket, and reached a record level in nominal terms of Taka19.60 per kg inMarch 2008. This indicates that farmers benefited from the rise in consumerprices, and the higher prices provided incentives to increase rice production byexpanding area and increasing the adoption of improved varieties, includinghybrid rice. The increase in the profitability in rice farming led to a bumperboro harvest of 17.8 million tons of milled rice in 2008, compared to 15million tons in 2007. Although the bumper boro harvest did not immediatelylead to a complete rollback of prices, the increased supply was able to stopfurther price increases.
Trends in the marketing margin of coarse rice in Bangladesh are reported inFigure 5.8. (We define the marketing margin as the difference between thewholesale price and the farm-gate price, in milled rice terms and deflated by theCPI to adjust for inflation.) While the marketing margin fluctuated over time,there is no clear trend, and indeed, the margin seemed to decline slightly duringthe rapid increase in prices, even becoming negative in some cases. Wholesaleand retail coarse rice prices also generally moved together, with no clear trendin this margin over time.
Since rice is a major item in the consumer basket, the rapid surge in pricecontributed to substantial inflationary pressure in the economy. Bangladeshwas enjoying low annual inflation rates of less than 6 per cent during the earlyyears of the 2000s (just 1.9 per cent in July 2001) but inflation exceeded 6 per
VOLATILITY IN RICE PRICES AND POLICY RESPONSES IN BANGLADESH 101
Figure 5.7 Trends in monthly retail, wholesale and farm-level real prices ofcoarse rice in Bangladesh, January 2003 to June 2009
Note: Prices are adjusted for inflation; farm prices are in rice terms.Source: Prepared by authors, based on data from the Directorate of Agricultural Marketing
0
10
20
30
40
Jan-
03M
ar-0
3M
ay-0
3Ju
l-03
Sep
-03
Nov
-03
Jan-
04M
ar-0
4M
ay-0
4Ju
l-04
Sep
-04
Nov
-04
Jan-
05M
ar-0
5M
ay-0
5Ju
l-05
Sep
-05
Nov
-05
Jan-
06M
ar-0
6M
ay-0
6Ju
l-06
Sep
-06
Nov
-06
Jan-
07M
ar-0
7M
ay-0
7Ju
l-07
Sep
-07
Nov
-07
Jan-
08M
ar-0
8M
ay-0
8Ju
l-08
Sep
-08
Nov
-08
Jan-
09M
ar-0
9M
ay-0
9
Con
stan
t 200
8 Ta
ka p
er k
g m
illed
rice
Retail Wholesale Farm
ES_RC_9-8 18/8/10 20:23 Page 101

cent starting in late 2004 (see Figure 5.9). High growth in consumer pricescontinued and then began to rise steeply by the middle of 2007, continuing intothe middle of 2008 due to hikes in the prices of rice, edible oil and diesel fuel,eventually reaching an annual rate of 10.0 per cent in March 2008. SinceOctober 2008, however, general inflation started to decline, and reached 6.7per cent in June 2009. From July 2001 until October 2003, food inflation atthe national level was lower than non-food inflation, but since that time thesituation has reversed. The highest rate of food inflation of 12.6 per cent was inSeptember 2008, but this gradually declined to 7.2 per cent in June 2009. Thehighest rate of non-food price inflation of 7.35 per cent was in February 2008,and this gradually declined to 5.26 per cent in February 2009, after which itrose again slightly.
The inflationary pressure has had an adverse impact on food securitythrough reduction in purchasing power and income erosion. Particularlyaffected was the fixed-income group, the low-paid government servants andthe industrial workers in urban areas. Other low-income groups, such as trans-port operators, petty traders in the informal market and agricultural labourerswere initially adversely affected since they spend almost half of their income onrice. But later they were able to increase their earnings as wages increased. Innominal terms, the agricultural wage rate increased from about Taka111 perday in October 2007 to about Taka148 per day by February 2009, an increaseof 28 per cent in real terms (see Figure 5.10). This increase in wages was veryimportant for the poorest of the poor and allowed Bangladesh to avoid the
102 POLICY RESPONSES IN TRADITIONAL IMPORTING COUNTRIES
Figure 5.8 Trends in marketing margins of coarse rice in Bangladesh, January 2003 to June 2009
Source: Authors’ calculations, based on data from Bangladesh Bureau of Statistics
–3
–1
0
1
3
4
5Ja
n 20
03
Jul 2
003
Jan
2004
Jul 2
004
Jan
2005
Jul 2
005
Jan
2006
Jul 2
006
Jan
2007
Jul 2
007
Jan
2008
Jul 2
008
Jan
2009
Con
stan
t 200
8 Ta
ka p
er k
g m
illed
rice
ES_RC_9-8 18/8/10 20:23 Page 102

VOLATILITY IN RICE PRICES AND POLICY RESPONSES IN BANGLADESH 103
Figure 5.9 Trends in inflation (moving average), July 2001 to June 2009
Source: Bangladesh Bureau of Statistics
0
2
4
6
8
10
12
14
1 Ju
l 200
11
Nov
200
11
Mar
200
21
Jul 2
002
1 N
ov 2
002
1 M
ar 2
003
1 Ju
l 200
31
Nov
200
31
Mar
200
41
Jul 2
004
1 N
ov 2
004
1 M
ar 2
005
1 Ju
l 200
51
Nov
200
51
Mar
200
61
Jul 2
006
1 N
ov 2
006
1 M
ar 2
007
1 Ju
l 200
71
Nov
200
71
Mar
200
81
Jul 2
008
1 N
ov 2
008
1 M
ar 2
009
National Non-FoodNational FoodNational General
Per
cen
t
Figure 5.10 Trends in real agricultural wages in Bangladesh, January 2003 to February 2009
Source: Prepared by authors, based on data from Bangladesh Bureau of Statistics
0
25
75
150
Jan-
03M
ar-0
3M
ay-0
3Ju
l-03
Sep
-03
Nov
-03
Jan-
04M
ar-0
4M
ay-0
4Ju
l-04
Sep
-04
Nov
-04
Jan-
05M
ar-0
5M
ay-0
5Ju
l-05
Sep
-05
Nov
-05
Jan-
06M
ar-0
6M
ay-0
6Ju
l-06
Sep
-06
Nov
-06
Jan-
07M
ar-0
7M
ay-0
7Ju
l-07
Sep
-07
Nov
-07
Jan-
08M
ar-0
8M
ay-0
8Ju
l-08
Sep
-08
Nov
-08
Jan-
09
Con
stan
t 200
8 Ta
ka p
er d
ay
50
100
125
ES_RC_9-8 18/8/10 20:23 Page 103

serious food insecurity and famine that many influential civil society personali-ties thought might occur.
Several studies, however, showed that the increase in food pricescontributed to a set back in achieving the MDG targets for reduction inpoverty. One analysis of the impacts of high food prices on poverty (Rahman etal, 2008) revealed that 8.5 per cent of the total population, or 12.1 millionpeople, fell below the poverty line between January 2005 and March 2008.Another study by Raihan et al (2008), reported that headcount povertydeclined from 40 per cent in 2004–2005 to 39.4 per cent in 2006, but increasedto 41.5 per cent in 2006–2007 and increased further to 45.9 per cent in2007–2008. A joint study conducted by the Food and AgricultureOrganization of the United Nations and World Food Programme (FAO/WFP,2008) quantified the impacts of price hikes on food security in Bangladesh.According to this study, as a result of rising food prices and general inflation,the number of food insecure (those with caloric intake less than2122kcals/person/day) increased by 7.5 million to reach 65.3 million.Furthermore, the number of people who are severely food insecure (those withcaloric intake of less than 1805kcals/person/day) grew by 6.9 million, to reacha total of 34.7 million.
Policy responses
The government has taken several measures to tackle the price hike. Theseinclude active participation in food grain markets, expanded operations ofexisting safety net programmes and provision of incentives for increasing riceproduction.
The government has long intervened in food grain markets in order toreduce price fluctuations and to provide safety nets to food-insecure people.The government declares a procurement price for rice and wheat at which itprocures grains from the market. This is not a floor price, so the governmentdoes not purchase unlimited quantities of rice at that price. Procurement isdone mainly from surplus-producing areas. As a percentage of total produc-tion, it has been very low at less than 4 per cent during the past 15 years. Thelow procurement made it difficult to influence market prices, but it was helpfulto procure rice for the safety net programmes.
The government used to import wheat and rice from world markets tobuild stocks with which it operated a public food grain distribution system.The objective was to provide relief during natural disasters, distribute subsi-dized food to special target groups (for example army, police, prison inmates)and operate a safety nets programme for the poor. During the 1980s, thegovernment had a capacity to hold stocks in public sector-operated warehousesof nearly 1.8 million tons of food grains. Over time, however, the governmenthas scaled down these operations with the elimination of the rationing system,a reduced size of the public works programme, and the transfer of responsibil-ity for commercial food grains imports to the private sector. Thus, food stocks
104 POLICY RESPONSES IN TRADITIONAL IMPORTING COUNTRIES
ES_RC_9-8 18/8/10 20:23 Page 104

were reduced from about 1.5 million tons in the 1980s to 0.6 million tons inrecent years (compared to total consumption of 27 million ton of milled rice, ofwhich about 10 to 12 million tons are transacted in the market). However, thegovernment still maintains several safety net and social protectionprogrammes, and participates in open-market sales at times of abnormally highprices. The government’s capacity to influence the market with such smalloperations is limited, however.
To encourage imports and discourage exports during the period of risingprices, the government took some trade policy measures. On 8 March 2007,the government eliminated existing tariffs on the import of rice, wheat andother essential items (crude edible oil, lentils, onion, matar dal and chola dal).In addition, commercial importers were no longer required to renew valueadded tax (VAT) registration on an annual basis. The government also bannedthe export of non-scented rice for six months effective from 6 May 2008,which was later extended for another six months (i.e. up to 6 May 2009). Theban was allowed to lapse momentarily, but it was reinstated for another sixmonths, effective 22 May 2009.
To ensure food security for the lower-income groups who were hard hit bythe price hike, the government’s main strategy was to increase the allocation ofrice and wheat under the Public Food Grain Distribution System (PFDS),which has two channels. One channel, the monetized channel, sells rice andwheat through several programmes: Essential Priority (EP), Other Priority(OP), Large Employee Industries (LEI), Flour Mills (FM), Open Market Sales(OMS) and Fair Price Card (FPC). The other main channel (non-monetized)does not involve sales, but includes targeted safety net programmes such asFood for Work (FFW), Test Relief (TR), Gratuitous Relief (GR), VulnerableGroup Development (VGD), Vulnerable Group Feeding (VGF) and Food forEducation (FFE). Because of limited stocks, the government could increase thetotal PFDS allocation in 2007–2008 by only 6.7 per cent, to 1.56 million tons(see Table 5.4). This amount was too small to have an impact on market prices.
The government also allowed the paramilitary force to operate OMS ofessential commodities, including rice, at subsidized prices to urban consumers.However, the amount sold through OMS was just 268,000 tons in 2007–2008,less than the 408,000 tons sold in 2006–2007. Amid concerns over furtherprice increases, the government decided to scale up operation of food distribu-tion in the fiscal year 2008–2009, and kept an adequate allocation for thispurpose in the budget. In order to increase stocks, the government aimed toprocure 1.2 million tons of rice and 300,000 tons of paddy from the domesticmarket in addition to importing wheat from the world market. The procure-ment price was fixed at Taka18 per kg for paddy and Taka28 for rice.Although the cost of production of rice has increased substantially due tohigher price of fertilizers, irrigation and labour, a paddy procurement price atthis level provided enough incentives for farmers to expand production. As aresult, the government was successful in distributing more food grains throughthe PFDS in 2008–2009. The total amount of distribution increased to 2.13
VOLATILITY IN RICE PRICES AND POLICY RESPONSES IN BANGLADESH 105
ES_RC_9-8 18/8/10 20:23 Page 105

million, which was 36.5 per cent higher than actual distribution in 2007–2008(see Table 5.4).
The government also introduced a new programme entitled ‘100 DaysEmployment Generation Scheme’ in the 2008–2009 budget with an allocationof Taka20,000 million to generate 200 million person-days of employment forthe ultra-poor and marginal farmers in rural areas. The programme targetedsevere poverty-stricken areas such as the Monga (seasonal food insecure)affected areas in the Northwest, areas prone to river erosion and Char areas(newly emerged areas in the river bed).
Much more effective was the government’s proactive policy to boostagricultural production, which extended to several different inputs: credit,irrigation and fertilizer. The Bangladesh Bank issued a directive to commercialbanks to increase disbursement of agricultural credit to meet the workingcapital needs of small and marginal farmers, particularly targeting areasaffected by the floods and the cyclone. Many private sector commercial banks(which did not have their branches in rural areas) channelled agricultural creditthrough NGOs engaged in micro-credit operations. The disbursement ofagricultural credit in financial year 2007–2008 (Taka61.67 billion) was 16.51
106 POLICY RESPONSES IN TRADITIONAL IMPORTING COUNTRIES
Table 5.4 Distribution of food grains under PFDS in Bangladesh, 2006–2007to 2008–2009 (thousand tons)
Channel Financial year Financial year Financial year 2006–2007 2007–2008 2008–2009
PricedEssential Priority (EP) 260.3 209.5 219Other Priority (OP) 21.0 20.6 22Large Employee Industries (LEI) 14.8 12.3 10Open Market Sales (OMS) 407.9 268.0 195Flour Mills (FM) 2.0 - -Fair Price Card (FPC) - - -Other - - -Subtotal 706.0 510.4 446
Non-pricedFood for Work (FFW)* 121.7 154.3 395Test Relief (TR) 148.2 75.9 368Vulnerable Group Development (VGD) 147.3 267.7 279Vulnerable Group Feeding (VGF) 230.2 187.6 507Gratuitous Relief (GR) 33.5 38.2 43VGF (Relief) 231.0**
Others 73.7 95.1 92Subtotal 756.2 1049.8 1684
Total 1462.2 1560.2 2130
Note: * includes direct distribution of wheat by World Vision International; ** In 2007–2008, 231 thousandmillion tons of food grain was distributed as VGF relief (Saudi grant) through non-priced channels. Source: Food Planning and Monitoring Unit, Ministry of Food and Disaster Management
ES_RC_9-8 18/8/10 20:23 Page 106

per cent higher than the total disbursement of agricultural credit in 2006–2007(Taka52.93 billion). The government also provided (for the first time) asubsidy on diesel used in irrigation. It was provided directly to farmers andamounted to Taka2500 million in 2007–2008. The 20 per cent subsidy forelectricity used in irrigation was also continued.
The government also maintained a subsidy on urea fertilizers (implementedat the border) despite the rapid rise in its price on the world market. Indeed, thesubsidy on urea increased to nearly 80 per cent of the procurement cost, anddue to the very high level of subsidy, the government had to ration distributionof urea fertilizer with the help of public administrators (deputy commissioners,Upazila Nirbahi officers, agriculture officers). As a result, domestic urea priceswere relatively stable (see Figure 5.11). In contrast to urea, the prices of triplesuperphosphate (TSP) and muriate of potash (MoP) fertilizer increased rapidlybecause world prices of these commodities increased sharply and all importsare done through the private sector. The higher prices had a negative impact onuse of non-urea fertilizers.
These measures, coupled with high paddy prices and favourable weather(frequent rains saved irrigation costs and eased moisture stress from droughts),led to a nearly 18 per cent increase in the production of rice during the boroseason. The additional production compensated for the reduced aman produc-tion in the previous season.
VOLATILITY IN RICE PRICES AND POLICY RESPONSES IN BANGLADESH 107
Figure 5.11 Trends in real prices of fertilizers in Bangladesh, 2002–2003 to 2008
Source: Prepared by authors, based on data from Bangladesh Bureau of Statistics
0
20
40
60
80
2002–03 2003–04 2004–05 2005–06 2006–07 2007–08 Jun–08 Aug–08
Con
stan
t 200
8 Ta
ka p
er k
g
Urea TSP MoP
ES_RC_9-8 18/8/10 20:23 Page 107

Conclusions
The huge surge in rice prices in the world market between October 2007 andApril 2008 contributed to higher domestic prices in Bangladesh. The abnormalincrease in price was a bane for low-income consumers, but it was a boon torice farmers who have long suffered from unfavourable terms of trade. Farmersresponded positively by adopting improved technology, exploiting excesscapacity, and fitting in another crop in the cropping system by adopting shortermaturity varieties and delaying planting of the boro crop. The supply responseled to a substantial increase in production despite the increase in prices of someinputs.
Bangladesh experienced successive good harvests not only in the boro 2008crop, but also in the following pre-monsoon (aus), monsoon-season crop(aman) and then again in the boro 2009 crop. The total harvest reached almost32 million tons of milled rice, substantially higher than demand even afteraccounting for seed, feed and waste. The favourable supply situation putdownward pressure on prices since December 2008, with paddy prices fallingby 30 per cent in two months. Those who held rice stocks in the expectation ofbenefiting from further price increases started releasing it to minimize losses.This put further downward pressure on prices, and, as a result, the domesticprice reached a level in May–June 2009 that was lower than the cost of produc-tion. Urgent action is required to ensure a minimum price that will provide atleast 10 per cent profit to the farmers. Failure to do this will hamper futureproduction growth. The familiar cobweb problem points to the role of govern-ment in maintaining a fine balance in protecting the interests of low-incomeconsumers and commercial farmers. To this end, linking up governmentprocurement programmes with social safety net programms, particularly thePFDS, will be needed.
ReferencesBangladesh Bureau of Statistics (2005) Report of the Household Income and
Expenditure Survey, Bangladesh Bureau of Statistics, DhakaDeb, U., Hossain, M. and Jones, S. (2009) Rethinking Food Security Strategy: Self-
sufficiency or Self-reliance, UK Department for International Development (DFID),Dhaka
FAO/WFP (Food and Agriculture Organization of the United Nations and World FoodProgramme) (2008) Crop and Food Supply Assessment Mission to Bangladesh.Special Report, FAO and WFP, Rome
Rahman, M., Bhattacharya, D., Shadat, W. B. and Deb, U. (2008) Recent Inflation inBangladesh: Trends, Determinants and Impact on Poverty, Centre for PolicyDialogue (CPD), Dhaka
Raihan, S., Haque, A. K. I., Khan, I. A. and Chowdhhury, R. (2008) ‘Updating povertyestimates in Bangladesh: A methodological note’, Bangladesh Economic Outlook,vol 1, no 4, pp1–3
Slayton, T. (2009) Rice Crisis Forensics: How Asian Governments Carelessly Set theWorld Rice Market on Fire, Working Paper No 163, Center for GlobalDevelopment, Washington, DC
108 POLICY RESPONSES IN TRADITIONAL IMPORTING COUNTRIES
ES_RC_9-8 18/8/10 20:23 Page 108

6
Indonesia’s Rice Policy and PriceStabilization Programme:Managing Domestic Prices
during the 2008 Crisis
Agus Saifullah
Introduction
Rice in Indonesia is a strategic commodity that deeply influences the economy,social issues, employment, rural development and politics. The rice sector,including production, processing, trade and supporting sectors such as trans-portation, is a major source of employment. However, the majority of riceproducers are subsistence and small-scale farmers. A 2003 survey byIndonesia’s Central Statistics Agency (BPS, 2003) estimated the number offarm households at 25.4 million, an estimated 13.7 million of which ownedless than 0.3ha of land. Farm households, especially those with a largemarketed surplus, are vulnerable to price fluctuations, particularly when paddyprices plunge during the main harvest season. Without sufficient governmentattention paid to paddy farmers’ income, rice production will be disrupted andeventually affect rice supplies from domestic sources.
Poverty and food insecurity are problems that require close attention inIndonesia. Millions of poor families living in rural areas are among the mostvulnerable to rice price instability. Within this income group, approximately 63
ES_RC_9-8 18/8/10 20:23 Page 109

per cent of their expenditure is on food, of which almost 20 per cent is on rice.In addition, rice still constitutes about 4 per cent of the consumer price index(CPI). Thus, changes in rice prices influence the inflation rate and overalleconomic growth. This situation underscores the importance of keeping riceprices stable at an affordable level for the people.
The political nature of the rice industry complicates the development ofrice policy, which must be carefully implemented by taking into accountvarious interests as well as potential impacts and obstacles (such as therequired budget). It is important to strike the right balance between severalobjectives, such as the protection of small farmers and poor consumers, theimpact on other players in the industry (such as millers, retailers and traders),and the effect on economic stability.
This chapter discusses the rice policy and operational activities implementedby the Indonesian government and its efforts to maintain price stability in thedomestic market when rice prices soared on the world market in 2007–2008.
Rice policy and price movements
The Indonesian government formulated its rice policy through a PresidentialInstruction. The policy is intended to guarantee food security through theavailability of an adequate amount of rice, improved physical access throughfunctioning market mechanisms and distribution by the government, andenhanced economic access through improved farmer incomes and consumerpurchasing power.
The policy established a strong basis for the development of a government-managed food security system that uses domestic procurement, stocks,distribution for poor households, and government reserves for emergencies andnatural disasters. Such a food security system functions as an instrument forprotecting farmers and poor families by maintaining price stability and encour-aging efficient market mechanisms.
The effectiveness of Indonesia’s rice policy was challenged in early 2007when consumer prices increased by around 25 per cent and in 2008 wheninternational prices jumped significantly above domestic prices. In response,the government made concerted efforts to control domestic price stability andguarantee food for poor households. At the same time, there was a need toprovide farmers with production incentives in the light of increased interna-tional prices.
One major challenge for the government was to determine the domesticprice level that would provide incentives for producers (many of whom aresmall-scale paddy farmers) but keep rice affordable for consumers. Thus, theprice level and the methods used for price stabilization are sensitive issues interms of rice policy.
One mechanism used to stabilize prices is the government purchase price(GPP). Several factors are considered by the government in setting the GPP,including paddy production costs, the world rice price and market situation,
110 POLICY RESPONSES IN TRADITIONAL IMPORTING COUNTRIES
ES_RC_9-8 18/8/10 20:23 Page 110

and possible effects on consumer prices and inflation. The GPP for paddy isusually determined with the aim of giving farmers a 20–30 per cent profitabove their production costs. In addition, the GPP has also been set to corre-spond with international price movements.
Table 6.1 shows that during 2002–2008, the GPP for rice increased byabout 74 per cent in nominal value. The rice price at wholesale market (PasarInduk Cipinang Jakarta) recorded an increase of 52 per cent, while world riceprices (Thai 5 per cent FOB) recorded an increase of 348 per cent. However, ifcalculated until year 2007 the GPP increase was only around 62 per cent,domestic rice price around 46 per cent and world rice price only 65 per cent.
Over the seven years from 2002 to 2008, domestic rice price fluctuationhas stayed within normal boundaries. During this period, as shown in Figure6.1, nominal domestic rice prices have been relatively stable compared withworld prices. The CV of domestic prices for rice variety IR I (in Indonesianrupiah/kg) was 32 per cent, while that for Thai 5 per cent broken (in $/ton,FOB) was 52 per cent. The CV for the world price calculated in import parityterms (in Rp/kg) was 48 per cent.
Looking at the seasonal cycle, the domestic rice price tends to decreaseduring the main harvest season from March to May. The price moves up againduring the lean season, beginning in October until the next harvest season.However, in 2002–2004, there were irregularities in the seasonal pricemovement, with prices during the lean season below those of the harvestseasons (see Figure 6.2).
According to Sawit and Lokollo (2007), this phenomenon can be attrib-uted to an import surge during this period. In 2000–2003, the private sectorwas free to import rice so long as it paid import duties. Total imports reachedaround 5.27 million tons, or an average of 1.31 million TONS per year. Paddyprices fell below the GPP level about 43 per cent of the time. Meanwhile, riceprices during the lean season were 2–10 per cent lower than rice prices atharvest time.
INDONESIA’S RICE POLICY AND PRICE STABILIZATION PROGRAMME 111
Table 6.1 The development of GPP, domestic prices and world rice prices
Year GPP milled rice Rice prices at 5 per cent Thai Time when (Rp/kg) wholesale market rice prices GPP
IR I (Rp/kg) ($/MT, FOB) is valid
2002 2470 3425 192 January2003 2790 2935 201 January2004 2790 2880 213 January2005 2790 3028 293 March2006 3550 4357 291 January2007 4000 5000 317 April2008 4300 5217 862 AprilChanges (%) 2002–2008 74 52 3482002–2007 62 46 65
Source: Data from BULOG
ES_RC_9-8 18/8/10 20:23 Page 111

112 POLICY RESPONSES IN TRADITIONAL IMPORTING COUNTRIES
Figure 6.1 International and domestic wholesale rice prices, 2000–2008
Note: Domestic wholesale price is price at Pasar Induk Cipinang, Jakarta. Thai 5 per cent import parity price(Rp/kg) = Thai 5 per cent FOB* Exchange rate + Freight & Insurance 7.5 per cent + Tariff + Handling and 5 percent margin.
12,000
10,000
8000
6000
4000
2000
0
Jan 2
000
Jan 2
001
Jan 2
002
Jan 2
003
Jan 2
004
Jan 2
005
Jan 2
006
Jan 2
007
Jan 2
008
Thai 15% Rp/KgDomestic (IR III) Rp/Kg
Rp/
kg
Jul 2
008
Jul 2
007
Jul 2
006
Jul 2
005
Jul 2
004
Jul 2
003
Jul 2
002
Jul 2
001
Jul 2
000
4000
3500
3000
2500
2000
1500
1000
500
0
Jan 2
000
Jan 2
001
Jan 2
002
Jan 2
003
Jan 2
004
Jan 2
005
Jan 2
006
Jan 2
007
Jan 2
008
Retail (Medium)Wholesale (IR III)Paddy (GKP)
Jul 2
000
Jul 2
001
Jul 2
002
Jul 2
003
Jul 2
004
Jul 2
005
Jul 2
006
Jul 2
007
Jul 2
008
Infla
tion
adju
sted
Rp/
kg
Figure 6.2 Real rice price movement: Paddy, wholesale and retail 2000–2008 (Rp/kg)
Note: Price is deflated by monthly CPI, base of June 2002.
ES_RC_9-8 18/8/10 20:23 Page 112

The surge in rice imports in 2002–2003 continued to keep domestic riceprices weak until 2004. To reduce the impact of rice imports on prices at thefarm level, in 2004 the government imposed an import policy with an openand closed system corresponding to the seasonal cycle. Now, rice imports arestrictly limited and can only be executed by Badan Urusan Logistik (BULOG,the Indonesian Bureau of Logistics) following the issuance of import licencesby the Ministry of Trade. The private sector has retained permission toimport speciality rice varieties, which account for less than 1 per cent ofdomestic consumption. Under this new import policy, domestic pricesincreased and paddy prices fell below the GPP during the main harvestseason just 15 per cent of the time in 2005 and 10 per cent of the time in2006–2008.
Managing domestic rice prices
The world rice price crisis started in late 2007 and prices soared until mid-2008. The rapid threefold increase of rice prices from $325 per tons in October2007 to more than $1000 per tons in May 2008 was not predictable. Factorscontributing to the price increase included expectations of demand outstrip-ping supply in the long term, imposition of export restrictions by majorexporting countries, limited supply of some crops (especially wheat), increasingoil prices, use of food crops for biofuel purposes, the weakening of the USdollar and panic buying and hoarding (Lancon, 2008). Although decliningworld rice stocks and climate change were not the main factors, they may haveinfluenced the market to a small extent. FAO (2009) estimates good worldpaddy production of 660 million tons in 2007, increasing further to 683million tons in 2008.
Initially there were many predictions that rice prices would remain high inthe long term. However, world prices decreased sharply for several monthsafter reaching their peak in May. In December 2008, prices were around $550per ton for Thai 5 per cent broken and around $400 per ton for Vietnameserice (5 per cent brokens).
The world rice price increase had different impacts on different countries.Hasan and Yustika (2008) suggest that the varying impacts were influenced bythe food security condition in the country, the stabilization policy imposed, thecondition of infrastructure and the macroeconomic situation. In mostcountries, domestic rice prices increased by 20–100 per cent over the periodfrom March 2007 to March 2008, leading to increases in the overall inflationrate and food security problems. However, the impact in Indonesia wasrelatively benign – rice prices remained stable.
There were three important factors behind Indonesia’s stable rice prices in2007–2008: an appropriate rice policy and policy response to the crisis, a largeincrease in food production, and the effectiveness of BULOG operations tomaintain available rice stocks and provide access for the people.
INDONESIA’S RICE POLICY AND PRICE STABILIZATION PROGRAMME 113
ES_RC_9-8 18/8/10 20:23 Page 113

Government policy
Indonesia experienced a sharp rice price increase during the 1998 Asianeconomic crisis. At that time, the government implemented several keymeasures including market operation policies,1 subsidized rice distribution forpoor families (the RASKIN programme2) and an open import policy. Theamount of rice distributed by BULOG reached around 300,000 tons permonth, or more than 10 per cent of consumption needs. Rice imports werefully open under a tariff system. These measures eventually restored the stabil-ity of rice prices at the consumer level.3
Rice price stability was disrupted again at the beginning of 2007 because ofa delayed paddy planting season and a reduced level of BULOG rice distribu-tion during the 2006–2007 lean season (November to February) after thegovernment reduced the rice allocation for poor families from 15kg/household(HH)/month in 2006 to 10kg/HH/month in 2007.
The impact was a significant rice price increase starting at the end of 2006and continuing until the beginning of 2007. The level of BULOG stock (lessthan 1 million tons) was relatively low, which negatively affected marketoperations. Meanwhile, rice imports could not be readily executed becausethey were banned for certain months of the year.
Increasing rice prices during the 2006–2007 lean season pushed thegovernment to try to ensure price stabilization during the 2007–2008 leanseason. Accordingly, the government imposed several new policies:
• In mid-2007 the government increased the duration of rice distribution forpoor families from 10 months to 11 months. In addition, the governmentalso distributed additional rice targeted to poor families from December2007 to January 2008. These policies were designed to reduce demand forrice in the market.
• The imposition of a time limit for BULOG rice imports (which wererequired to be completed by July 2007) was revised. In 2007, importscould be executed freely at any time and directed to ports in rice-deficitareas all across Indonesia. This helped BULOG to distribute its stock asrequired and strengthened government stocks. Such assured rice importsalso helped reduce trader speculation. BULOG rice imports reached about1.2 million tons in 2007.
• The government made efforts to stabilize the price of other food commodi-ties, such as soybean, palm oil and wheat flour. There was also aprogramme of direct cash transfers for poor families designed to alleviatethe economic impacts of the increase in fuel prices implemented by thegovernment in November 2007.
Relatively stable rice prices at the end of 2007 laid the foundations for stabilityin 2008. However, to mitigate the global rice price crisis, the governmentimposed several new policies in 2008. These policies, which also aimed to
114 POLICY RESPONSES IN TRADITIONAL IMPORTING COUNTRIES
ES_RC_9-8 18/8/10 20:23 Page 114

strengthen food security and price stabilization, included the following:
• In February 2008, import tariffs for rice were reduced from Rp530/kg toRp450/kg. Imports were also facilitated for other commodities includingsoybeans and wheat.
• To guarantee the domestic rice supply, rice exports (which can only beexecuted by BULOG) were to be allowed only if the availability of rice fordomestic uses was deemed sufficient and rice price stability would not bedisrupted. Rice trade monitoring at the borders was improved in order todeter smuggling.
• The Presidential Decree on Rice Policy Year 2008 emphasized economicstability as a top priority. Due to the influential role of rice in the inflationrate, maintenance of rice price stability was very important. Nevertheless,the GPP for rice had to be increased in 2008 to give incentive to ricefarmers. However, the increase (around 7.5 per cent for milled rice andabout 10 per cent for paddy) was kept low enough to avoid large upwardpressure on prices for consumers.
• The rice allocation for poor families4 was increased twice in response to theworld rice price crisis (see Table 6.2). In early January 2008, the rice alloca-tion for poor families was 10kg/HH/month for ten months (about 1.91million tons per year in total). In February 2008, the allocation wasincreased to 15kg/HH/month for ten months (about 2.77 million tons peryear). As prices jumped even further, the duration of rice allocations wasincreased in April 2008 to 12 months (3.34 million tons per year).
• To prepare for natural disasters or other emergencies and to maintainstable prices, the government boosted its rice reserves in 2008 from204,000 tons to 352,000 tons.
• A fuel price increase was delayed until after the main harvest season inorder to avoid increases in transport costs that might disrupt marketing ofthe crop and to facilitate distribution of stocks from surplus to deficitregions. Thus, for example, during the 2008 harvest season, the inter-insular rice trade from the rice-producing area of Pare-Pare (SouthSulawesi) increased by 10,000–12,000 tons per month (a 40–50 per centincrease over the previous year). The fuel price increase was eventuallyannounced by the government in May 2008.
INDONESIA’S RICE POLICY AND PRICE STABILIZATION PROGRAMME 115
Table 6.2 Subsidized rice (RASKIN) distribution 2006–2008
Description 2006 2007 2008January February April
Total allocation (million metric tons 1.62 1.74 1.91 2.77 3.34Number of poor HH (millions) 10.83 15.78 19.10 19.10 19.10Allocation/poor HH/month (kg) 15 10 10 15 15Duration (months) 10 11 10 10 12Budget (Rp000 billion) 5.32 6.28 11.66
Source: Central Bureau of Statistics – Bapenas (various years, 2006–2008)
ES_RC_9-8 18/8/10 20:23 Page 115

Increasing domestic rice production
In 2007 and 2008 there were substantial increases in domestic rice productionof 5.0 per cent and 5.5 per cent, respectively. When world rice prices reachedtheir peak in April and May 2008, Indonesia was in the midst of its mainharvest season. Adequate rice supplies at this time ensured that peopleremained calm and thus contributed to stable rice prices in the short term. InIndonesia, the global price crisis did not lead to any significant price increasesat the consumer level.
On the contrary, BULOG made efforts to absorb large seasonal surplusesso that farm-gate prices did not fall below the GPP. During the January–April2008 harvest season, rice production increased by about 25.6 per cent overthat of 2007 (see Table 6.3). The seasonal surpluses, as well as the fact that theharvest came earlier in 2008 than in 2007, made it easier for BULOG toprocure the volumes necessary to maintain adequate stock levels across thecountry for the entire year.
Some of the last few years’ increase in rice production can be attributed tohigher domestic prices that have given farmers the incentive to increase theirproductivity. In addition, the subsidized price of urea fertilizer (Rp1200/kg)was kept constant from 2006 to 2008 (see Figure 6.3). The price in 2004–2005was Rp1050/kg.
The favourable rice to urea price ratio has contributed to increased ureause in rice farming. An increase in paddy cultivation intensity was alsosupported by ample water from good rainfall and increased use of high-qualityseed. All of these factors contributed to the increase in production.
According to data from the Indonesian Department of Agriculture, therewas a considerable increase in 2007–2008 in the use of subsidized fertilizers forfood crops and distribution of subsidized high-quality rice seed. In addition, in2008 the government initiated a gradual change in the distribution of subsi-dized fertilizers, from appointed retailers who sell fertilizer to farmers to direct
116 POLICY RESPONSES IN TRADITIONAL IMPORTING COUNTRIES
Table 6.3 Rice production by crop season, 2007–2008
Year Variable January– May– September– January–April August December December
2007 Harvest area (million hectares) 4.89 4.61 2.64 12.14Yield (tons/hectare) 4.56 4.79 4.83 4.71Production (million tons paddy) 22.33 22.08 12.76 57.15
2008 Harvest area (million hectares) 5.74 4.21 2.39 12.34Yield (tons/hectare) 4.88 4.95 4.78 4.88Production (million tons paddy) 28.02 20.84 11.42 60.28
Change Harvest area (%) 17.3 �8.7 �9.5 1.6Yield (%) 7.1 3.3 �1.1 3.8Production (%) 25.6 �5.6 �10.5 5.5
Source: Central Bureau of Statistics – BPS (2008)
ES_RC_9-8 18/8/10 20:23 Page 116

distribution to farmers through farmer associations.The total amount of fertilizer use (including urea, SP-36, ZA and NPK)
during the periods of October–December 2007 and January–September 2008increased by 13.6 per cent and 7.6 per cent respectively compared with thesame periods one year earlier. For compound fertilizers (NPK), the increaseduring the period of January–September 2008 was 56 per cent. The totalamount of fertilizer used from October 2007 to September 2008 was around6.7 million tons compared with about 6.1 million tons in the same period oneyear earlier.
In 2008 the government distributed free high-quality seed directly to eligi-ble farmers through farmer associations. The government sets the criteria foreligible farmers entitled to the subsidy. Under this model, farmer associationspropose the amount of seed required to local agriculture officers and also givethe names of farmers, the farm area and the time of distribution. Localgovernment is responsible for selecting the eligible farmers and appointingfarmer associations. The distribution itself is handled by the seed industry (i.e.PT Sang Hyang Seri and PT Pertani), which distributes directly to the fields.Local government is responsible for ensuring that the seeds reach the farmerseffectively.
This policy contributed to the increased use of high-quality seeds, whichwere planted on 55 per cent of the harvested area in 2008. In the years prior to2008, high-quality seeds were typically used on around 37 per cent of theharvest area. High seed prices and lack of availability in those earlier yearsmeant that many farmers produced their own seed.
INDONESIA’S RICE POLICY AND PRICE STABILIZATION PROGRAMME 117
Figure 6.3 Production, rice price, GPP and urea price, 2000–2008
0
5
10
15
20
25
30
35
40
20000
1000
2000
3000
4000
5000
6000
Rice production million ton (milled rice) (left axis)GPP rice (right axis)Retail price (rice) (right axis)Urea price (right axis)
2002 2004 2006 2008
Rup
iah
per k
ilogr
am
Mill
ion
tons
of m
illed
rice
ES_RC_9-8 18/8/10 20:23 Page 117

Availability of water was another factor contributing to the productionincrease in 2007–2008. The Meteorology and Geophysics Agency (BMKG)reported that water availability in 2007–2008 was quite good, allowing animprovement in the paddy cultivation index (the number of crops planted peryear). Data from the Department of Public Works showed that the water eleva-tion for major basins in the main production areas in Java was generallynormal. 8 out of 12 major basins had higher water surface elevation during thedry season in September 2008 compared with September 2007 (the differenceranged between 0.9 and 26.3 metres), while the water surface elevation of theother four basins was lower. With sufficient water, some regions’ paddy culti-vation index increased from once to twice a year and other regions’ indexincreased from twice a year to five times in two years.
The rate of production increase outside Java was higher than on Java in2007, resulting in improved distribution and inter-regional availability (seeTable 6.4). While Java still accounts for more than half of total production,substantial increases have occurred in other regions including Sulawesi,Kalimantan and Nusa Tenggara (the northern part of Sumatra was an excep-tion, with production falling due to the competition of paddy with the oil palmplantation area). The large production increase in Sulawesi came predomi-nantly from the main producing areas in South Sulawesi; in Kalimantan theincrease came mainly from West and South Kalimantan. Production increasesin almost every province helped maintain price stability by meeting localdemand and supplementing rice supplied by BULOG for the allocationprogramme and the government rice reserve.
BULOG operational strategy
To ensure food security in the midst of the uncertain world rice situation, theIndonesian government increased the amount of subsidized rice for poorfamilies. The amount of rice distributed under this programme almost doubledfrom 1.74 million tons to 3.34 million tons to cover all poor families, based ona 2007 BPS survey (Bappenas, various years, 2006–2008) (see Table 6.2). As
118 POLICY RESPONSES IN TRADITIONAL IMPORTING COUNTRIES
Table 6.4 The distribution of rice production in Indonesia, 2005–2008 (%)
Region 2005 2006 2007 2008
Sumatra 23.4 22.4 23.4 22.5Java 54.9 55.0 53.3 53.6Nusa Tenggara 4.8 5.3 5.0 5.3Kalimantan 6.6 6.9 7.5 7.4Sulawesi 9.8 9.9 10.4 10.9Total Indonesia 100 100 100 100Total production 54.15 54.45 57.16 60.28(million tons dry paddy)
Source: Central Bureau of Statistics – BPS (2008)
ES_RC_9-8 18/8/10 20:23 Page 118

the increase covered all regions, it necessitated not only an increase in theamount of total rice supplies acquired by BULOG, but also efficient distribu-tion to all regions.
The actions required according to the new programme were not easy forBULOG. To carry out the tasks and avert possible problems, BULOG had toimplement various policies and operational strategies including the following:
• defence of the GPP;• maintenance of sufficient stocks to meet operational requirements and the
government rice reserve for emergency and price-stabilization purposes;• maintenance of adequate stocks across all regions;• efficient distribution of rice to poor families every month;• maintenance of people’s trust in the government’s ability to guarantee food
security and stabilize prices.
Given the uncertain world rice situation at the beginning of 2008, stabilizingprices during the lean season threatened to be a difficult task. To guarantee ricefor the poor and to help reduce market pressure, BULOG needed to distributesufficient rice in a timely fashion. Consequently, BULOG distributed about664,000 tons of rice – more than double the previous year’s total (see Table6.5). Most of the rice was distributed to the poor under the RASKINprogramme and through targeted market operations requested by local govern-ment. In February 2008, BULOG distribution reached 281,000 tons or about11 per cent of monthly rice consumption. Rice was delivered by BULOG tomore than 40,000 village distribution points and handed directly to each eligi-ble poor household.
Though rice prices in the lean season were quite stable, BULOG still facedthe challenge of fulfilling RASKIN rice distributions that had been increased toabout 270,000 tons per month for the whole year. BULOG had to provideenough stock to fulfil the obligation set in February 2008. This was very diffi-cult given that the world rice price was still increasing and domestic riceproduction in 2008 was uncertain. Under these uncertain conditions BULOGhad to secure sufficient rice, maintain timely distribution and keep pricesstable.
Over the previous 20 years, BULOG’s highest domestic procurement hadbeen 2.5 million tons, a figure reached only a handful of times. Nonetheless,
INDONESIA’S RICE POLICY AND PRICE STABILIZATION PROGRAMME 119
Table 6.5 Rice price movements and BULOG rice distribution during lean seasons, 2006–2008
Period November February Changes Total rice Average (Rp/kg) (Rp/kg) (%) distribution BULOG
November– stock February (MT) (MT)
2006–2007 4272 4862 13.8 311,953 809,7372007–2008 4695 4951 5.4 664,039 1,431,269
ES_RC_9-8 18/8/10 20:23 Page 119

BULOG had no other choice because relying on imports would be very costlyand politically sensitive. Therefore, to maintain regular rice distribution for thepoor, BULOG had to increase domestic rice procurement.
Initially the target for domestic procurement was set at 2.43 million tons tomeet the subsidized rice allocation determined in January 2008. Preparation forprocurement was carried out earlier and in a flexible manner to ensure it was inline with market developments. Consequently, procurement started in February(two months earlier than in 2007). The aim was to reach the targets by July. InApril 2008, the government decided to increase the duration of the subsidizedrice distribution programme from 10 months to 12 months (taking total alloca-tions to 3.34 million tons). With relatively good harvest progress across allregions, BULOG thus increased its planned procurement to 2.8 million tons.
The expansion of the duration of rice distribution for poor householdshelped keep rice prices stable in 2008. With the government guaranteeingsupply for the poor during the lean season, the potential for speculation wasreduced. Therefore the private sector was reluctant to hold stocks in anticipa-tion of a substantial price increase.
To reduce the pressure on warehouse capacity in the main producing areas,BULOG offered price incentives to boost procurement and stock levels in rice-deficit areas. To do this, the buying price in deficit areas was set at aroundRp100–300/kg higher than the price in surplus areas. The difference was basedon covering transportation costs with the aim of enticing rice into the area.BULOG also purchased high-quality rice in order to minimize future storagelosses.
These mechanisms allowed BULOG to surpass its second procurementtarget of 2.8 million tons and subsequently set a higher target of 3.1 milliontons with the aim of achieving this by December 2008 (procurement in manyrice-producing areas occurred for most of the year). By the end of December2008, total domestic procurement was 3.2 million tons. BULOG’s heavyprocurement added to demand, thereby helping to maintain prices at aprofitable level for farmers. Indeed, the average market paddy price during themain harvest season was about 9 per cent above the government purchaseprice.
The increased procurement that occurred throughout the country increasedstocks and improved their spatial distribution. The ratio of procurement todistribution improved in Kalimantan, Sulawesi and eastern Indonesia (Table6.6). At the national level, BULOG rice stocks in May 2008 reached 2 milliontons, compared with 1.57 million tons in January 2008 even though BULOGdistributed up to 1.2 million tons of rice over that period.
Since local procurement in deficit areas cannot meet distribution needs forthe entire year, local shortages were covered from surpluses in areas such asEast Java, South Sulawesi and West Nusa Tenggara. BULOG routinely distrib-utes rice from surplus areas to deficit areas in order to ensure that local stocklevels do not fall below the minimum stock requirement (MSR) of three to sixmonths’ distribution.
120 POLICY RESPONSES IN TRADITIONAL IMPORTING COUNTRIES
ES_RC_9-8 18/8/10 20:23 Page 120

The high levels of procurement and rice distribution to poor families deliv-ered considerable benefits to farmers and consumers. With 2008’s good mainharvest, there was considerable potential for depressed prices at the farm level.Given the high world rice prices at that time, it would have been ironic if farm-level prices in Indonesia were low. In this context, it was crucial for BULOG todefend farm-level prices in order to keep farmers calm and to increase ricestocks by absorbing the surplus harvest. Indeed, during the main harvestseason, farm-level prices were maintained at or above the GPP. Another benefitof the high procurement was the multiplier effects of the cash purchases byBULOG, which totalled around Rp14 trillion and stimulated rural economicactivity.
In terms of distribution, the ample supplies procured by BULOG laterhelped ensure smooth distribution to poor families each month and helpedkeep prices stable during the lean season. Further, having adequate stocks inevery region reduced the potential for speculation because it was known thatBULOG could intervene in the market at any time.
BULOG also kept the public informed of its operational progress and thelevel of rice supplies through the print and electronic media and meetings withvarious organizations. This information dissemination helped people remaincalm and not worry about price fluctuations in the midst of the world rice pricecrisis. In addition, the abundant and early harvest and subsequent procurementmade imports unnecessary, thereby avoiding controversy with farmers.
Conclusion
The 2008 world rice price crisis, during which international rice prices tripledwithin a few months, showed that rice prices are influenced not only by stockand production levels, but also by events outside the rice sector such as oilprices, exchange rates, political decisions and speculation. Fears of risingdomestic prices pushed many countries to secure their food requirements inways (export bans, reduced import tariffs) that placed great pressure on theworld rice market.
INDONESIA’S RICE POLICY AND PRICE STABILIZATION PROGRAMME 121
Table 6.6 Ratio of procurement against RASKIN requirement, 2007–2008
Region Procurement RASKIN Ratio of procurement (thousand MT) distribution against RASKIN
(thousand MT)2007 2008 2007 2008 2007 2008 Change
(%)
Sumatra 158.9 208.1 364.4 687.7 0.44 0.30 �30.6Java 1277.9 2210.2 946.9 1764.8 1.35 1.25 �7.2Kalimantan 24.8 75.4 92.4 174.4 0.27 0.43 61.0Sulawesi 269.3 533.4 131.3 250.2 2.05 2.13 4.0Eastern 85.0 178.7 196.8 353.3 0.43 0.51 17.1IndonesiaTotal 1766.0 3205.9 1731.8 3230.3 1.02 0.99 �2.7
ES_RC_9-8 18/8/10 20:23 Page 121

The world rice market strongly influences food security and rice pricestability in Indonesia. Therefore, the world rice market is a key considerationin the formulation of rice policy, especially in determining a GPP that keepsdomestic prices in line with world prices in the long run. In addition, worldprices need to be considered in determining export and import policies thataddress both farmers’ and consumers’ interests. At the same time, to lessen theimpact of world rice price instability, domestic food security needs to beimproved by increasing domestic food production, distributing rice to the poorand promoting an efficient private marketing system that encourages people tomanage their own food security.
Indonesia did not change its policies substantially during the world ricecrisis in 2008. Nevertheless, the government increased the amount of subsi-dized rice distribution to poor families and augmented the government ricereserve for emergency situations and price stability purposes. These policieswere effective because they were supported by an increase in rice production(that made imports unnecessary) and effective procurement operations.Information dissemination to the public also reduced the potential for specula-tion, panic and hoarding.
Notes1 Market operations are non-targeted injections of government-owned rice into the
markets in order to stabilize prices.2 RASKIN comes from the words beras miskin in Bahasa Indonesia, meaning ‘rice
for the poor.’3 The import surge placed downward pressure on paddy prices at the farm level, and
this continued during 2000–2003. This situation created new problems that causedthe government to revise its rice import policy.
4 Based on a survey conducted by the Central Bureau of Statistics in late 2007(Bappenas, various years, 2006–2008), 19.1 million poor families were determinedto be eligible to receive rice allocations. BPS provided the name and the address ofpoor households in every village; before 2008 the number of families receivingassistance was based on data provided by National Board for Family Planning.
ReferencesBappenas (various years, 2006–2008) ‘Rencana Kerja Pemerintah’ (Government Workplan)BPS (Badan Pusat Statistik) (2003) ‘Sensus Pertanian’ (Agricultural Census), BPS, Jakarta.BPS (2008) ‘Beberapa Penjelasan Berkaitan Dengan Produksi Padi ARAM III’, BPS,
JakartaFAO (Food and Agriculture Organization of the United Nations) (2009) Rice Market
Monitor, vol XII, no 1, February, www.fao.org/es/ESC/en/15/70/highlight_71.htmlHasan, M. F. and Yustika, E. (2008) ‘Situasi Pangan Kedepan dan Kebijakan
Ketahanan Pangan’, Majalah Pangan, no 51/XVII, July–SeptemberLancon, F. (2008) Rice Price Surge, Lesson Learnt and Prospect, International Rice
Conference, Congress Papers, Chiang Mai, Thailand Sawit, M. H. and Lokollo, E. M. (2007) ‘Rice import surge in Indonesia’, ICASEPS
and AAI, Bogor
122 POLICY RESPONSES IN TRADITIONAL IMPORTING COUNTRIES
ES_RC_9-8 26/8/10 09:11 Page 122
7
Rice Crisis in the Philippines: Why did it Occur and What are
its Policy Implications?
Arsenio M. Balisacan, Mercedita A. Sombilla and Rowell C. Dikitanan
Introduction
Rice is a commodity of great importance to the Filipino people, not only as amajor staple but also as a principal source of livelihood. It is no surprise that arice crisis, such as that of 2007–2008, poses a serious threat to household foodsecurity, most particularly among the destitute, as well as to overall social andpolitical stability.
This chapter describes the evolution of the 2007–2008 rice crisis in thecountry and aims to answer two basic questions: why did it occur and how cana similar crisis be averted in the future? The chapter is divided into fivesections. The first section briefly describes the nature of the rice crisis in thePhilippines, particularly the evolution of prices and its implications forconsumers and producers. The second section revisits the rice economy fromthe perspective of the country’s objective of achieving food security and reducing hunger and poverty. The third section describes the government’sresponse to the crisis, particularly its aggressive rice importation and intensi-fied rice production enhancement programmes. The fourth section claims that
ES_RC_9-8 18/8/10 20:23 Page 123

the country’s twin failures to invest in productivity-enhancing measures and tocorrect the weakness of its rice policy regime have stifled the country’sresiliency to food crisis. Finally, the chapter stresses the key policy lessons andrecommendations for achieving household food security and reducing thecountry’s vulnerability to rice crises.
The rice price crisis in the Philippines
World prices of grains started a slow ascent as early as late 2006. The risebecame relatively rapid beginning in the last quarter of 2007. Wheat pricesreached their peak around March and April 2008. For rice and maize, the peakoccurred around June and July 2008, respectively. The section that followspresents an analysis of domestic rice price movements during the food pricecrisis and discusses the comparative changes in rice prices at the farm, whole-sale and retail levels.
Domestic price movements
The trends in domestic rice prices for 2007, 2008 and January to August 2009were broadly similar at farm, wholesale and retail levels (see Figure 7.1 for thetrends for regular milled rice (RMR) – the trends for well-milled rice (WMR)are very similar and are not shown). Prices in 2007 were relatively stable: thedifference between maximum and minimum weekly RMR prices wasPhP1.55/kg for farm prices, PhP2.09/kg for wholesale prices, and PhP2.12/kgfor retail prices. This price band increased significantly in 2008 to PhP6.10/kg,PhP12.94/kg and PhP13.49/kg respectively for farm prices, wholesale pricesand retail prices. Narrower bands returned in 2009 at PhP2.65/kg at farmlevel, PhP3.51/kg at wholesale level and PhP3.21/kg at retail level.
Figure 7.1 also clearly indicates that prices have remained at relativelyhigher levels in 2009 compared to those before the crisis. The average farmprice of regular milled rice rose by 32 per cent during the period, fromPhP10.75/kg in 2007 to PhP13.39/kg in 2008 and PhP14.21/kg in (January toAugust) 2009. The proportionate increases in the average wholesale and retailprices of RMR were even higher than those for farm prices, as both registered a38 per cent increase from 2007 to (January to August) 2009.
Growth rates and price variabilityThe 2007–2009 period can be divided into three phases: pre-crisis (January2007 to February 2008); crisis (March 2008 to September 2008); and post-crisis (October 2008 to August 2009). Table 7.1 shows, by phase, the rate ofprice change over the period and the CV during the period for both RMR andWMR. Growth rates were relatively low during the pre-crisis phase and allprices (farm, wholesale and retail) moved roughly in the same proportion. Bythe end of the pre-crisis phase, average prices in February 2008 were about 10per cent higher in nominal terms than in February 2007 at farm, wholesale andretail levels. During the crisis phase, prices rose across the board in just four
124 POLICY RESPONSES IN TRADITIONAL IMPORTING COUNTRIES
ES_RC_9-8 18/8/10 20:23 Page 124

RICE CRISIS IN THE PHILIPPINES 125
Figure 7.1 Domestic rice prices, 2007, 2008 and January to August 2009, (a) farm, (b) wholesale and (c) retail
Source: Department of Agriculture, Bureau of Agricultural Statistics (DA-BAS)
18
16
14
12
10
8
6
4
2
0
PhP/
kg
Jan
Feb Mar Apr May Jun
2007 2008 2009
Jul
Aug Sep Oct Nov Dec
40
35
30
25
20
15
10
5
0
PhP/
kg
Jan
Feb Mar Apr May Jun
2007 2008 2009
Jul
Aug Sep Oct Nov Dec
40
35
30
25
20
15
10
5
0
Jan
Feb Mar Apr May Jun
2007 2008 2009
Jul
Aug Sep Oct Nov Dec
PhP/
kg(a)
(b)
(c)
ES_RC_9-8 18/8/10 20:23 Page 125

months – compared with February, prices in June were about 50 per centhigher at all three levels of the marketing system. Prices started a steep dropsometime in July and stabilized in October 2008. However, by the end of theyear, price levels were higher than those prior to the crisis. While the peak priceincreases were similar across farm, wholesale and retail prices, the annualaverage ratio of retail to farm-gate prices was higher in 2008 than in 2007. Allprices rose slightly from October 2008 to the third quarter of 2009.
The CV estimates are similar for all types of rice during the pre-crisisperiod. Variability increased during the crisis period. The magnitude of theCVs dropped drastically in the post-crisis period, but those for farm priceswere still much higher than for wholesale and retail prices.
Three things can be concluded from the analysis of the price movements.First, wholesale and retail prices increased more rapidly than farm pricesduring the crisis period. While farmers did benefit from price increases, theydid not benefit as much as they would have if price changes were the same asthey were at retail and wholesale levels. This poor price transmission to farmprices (relative to retail prices) is also indicated in Figure 7.2, which plots pricetrends of the Thai rice price (25 per cent brokens), the Philippine wholesaleprice of RMR and Philippine farm-gate prices. Second, the greater volatility offarm-gate prices (as indicated by the CVs), especially after the crisis, willdefinitely have effects on the decision-making processes of farmers. Third,while rice prices stabilized in 2009, they stabilized at a higher level than in2007 and may stay at this level in the coming years. This will benefit net riceproducers (who are relatively few in number) but will harm net rice consumers(those who consume more rice than they produce).
Centrality of rice among Filipinos
The significance of rice in the diet of Filipinos suggests that a rice crisis willhave profound effects.
126 POLICY RESPONSES IN TRADITIONAL IMPORTING COUNTRIES
Table 7.1 Domestic rice price movements: Growth rates and coefficients of variation
Growth rates (% per week) Coefficient of variation
Farm Pre-crisis Crisis Post-crisis Pre-crisis Crisis Post-crisis
Palay (dry)/WMR 0.25 0.31 0.19 3.97 11.98 7.29Palay (ordinary)/RMR 0.18 0.65 0.02 3.94 12.24 6.90WholesaleWMR 0.22 0.73 0.06 3.39 11.17 4.00RMR 0.23 0.58 0.12 3.37 12.09 5.49RetailWMR 0.18 0.87 0.00 3.22 11.29 2.45RMR 0.19 0.71 0.09 3.29 11.60 4.55
Source: Raw data from DA-BAS
ES_RC_9-8 18/8/10 20:23 Page 126

Rice consumption among Filipinos
Rice remains the country’s basic staple food. Total apparent demand, based onthe Food Balance Sheet, has risen steadily over time owing primarily to thecontinued high rate of population growth (about 2 per cent per year) andsecondarily to an increasing level of per capita intake, especially since 2000(see Figure 7.3). Rice production increases have lagged behind apparentdemand, necessitating larger imports to make up the difference.
As can be noted from Figure 7.3, annual per capita consumption of ricehovered around 90–92kg in the 1980s and 1990s. It then gradually rose to anaverage of 113kg per capita at the turn of the century, and has continued toincrease in recent years. The rise in per capita rice intake took place despitegrowth in per capita income (although income growth was relatively slow).Historical consumption patterns in Asia and elsewhere suggest that as incomerises, food intake becomes more diversified, usually away from the basic staple(in the case of the Philippines, rice and, in some areas, corn) in favour of bread,pasta or noodles, meat, fish, fruit and vegetables. This does not seem to havehappened in the Philippines, however. Figure 7.4 shows trends in daily percapita intake of rice and other foods based on the National Nutrition Surveys(NSO, 2006). Intake of cereals, of which rice forms the bulk, rose in 2003,while intake of other food items, except meat and dairy products, remainedroughly constant or even declined.
Two factors account for this trend in the country. One is the continued lowlevel of per capita income. Although real per capita GDP increased by about 25
RICE CRISIS IN THE PHILIPPINES 127
Figure 7.2 Paddy and milled rice annual/monthly average prices in thePhilippines, 1990–2008
Source: DA-BAS and FAO database
40
35
30
25
20
15
10
5
0
1990
1991
1992
1993
1994
1995
199619
9719
9819
9920
0020
0120
0220
0320
0420
0520
0620
07
Jan 2
008
Feb 2
008
Mar 20
08
Apr 20
08
May 20
08
Jun 2
008
Jul 2
008
Aug 20
08
Sep 20
08
Oct 20
08
Thai rice export 25% brokensRegular milled rice wholesale price (M. Manila)Paddy farm-gate price (Phils)
Pric
es (P
hP/k
g)
ES_RC_9-8 18/8/10 20:23 Page 127

per cent between the early 1990s and mid-2000s, average per capita income($2956, in PPP) is still low compared with that of Thailand ($7061) andMalaysia ($11,678), where noticeable shifts in food consumption patterns,including a reduction in per capita rice consumption, have taken place. Adownturn in per capita rice intake is also evident in Republic of Korea andChina, where significant increases in per capita income have been sustainedover many years.
The other factor is the relatively high inequality of income and wealth inthe Philippines. For low-income families, rice still constitutes the biggest andcheapest source of energy. Figure 7.5 shows that the poorest income groupspends a considerably greater proportion of total income on food and oncereals in comparison to other income classes, although in absolute terms thehighest income group spends a much larger amount on food. Among thehighest income group, expenditures on cereals in 2006 account for only 6 percent of food expenditures. In contrast, the two lowest income groups spendabout a quarter of their food expenditures on cereals.
128 POLICY RESPONSES IN TRADITIONAL IMPORTING COUNTRIES
Figure 7.3 Trends in (a) rice production, demand and population, and (b) percapita consumption and per capita income, Philippines
Source: DA-BAS, Philippine Rice Research Institute (PhilRice), National Statistics Office (NSO), National StatisticalCoordinating Board (NSCB)
Thou
sand
tons
14,000
12,000
10,000
8000
6000
4000
2000
0
1980
1982
1984
1986
1988
1990
1992
1994
1996
1998
2000
2002
2004
2006
2008
Pop
ulat
ion
(mill
ions
)
100
80
60
40
20
0
Population (millions)
Demand
Production
Per capita intake (kg/cap)
1985
PhP
16,000
14,000
12,000
10,000
8000
6000
4000
2000
0
kg/c
ap
140
120
100
80
60
40
20
0
1980
1982
1984
1986
1988
1990
1992
1994
1996
1998
2000
2002
2004
2006
2008
Per capita income (1985, PhP)(b)
(a)
ES_RC_9-8 18/8/10 20:23 Page 128
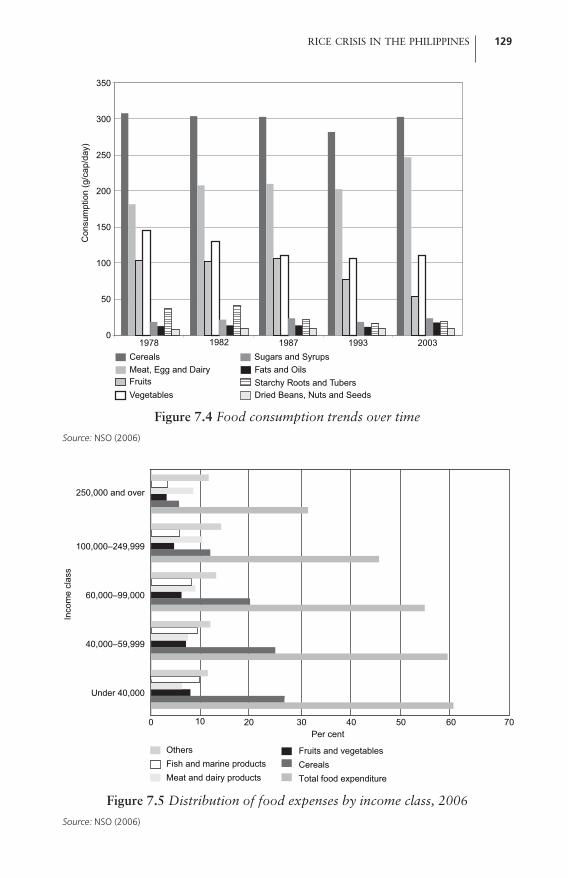
RICE CRISIS IN THE PHILIPPINES 129
Figure 7.4 Food consumption trends over time
Source: NSO (2006)
Con
sum
ptio
n (g
/cap
/day
)350
300
250
200
150
100
50
0
Dried Beans, Nuts and SeedsStarchy Roots and TubersFats and OilsSugars and Syrups
VegetablesFruitsMeat, Egg and DairyCereals
1978 1982 1987 1993 2003
Figure 7.5 Distribution of food expenses by income class, 2006
Source: NSO (2006)
Per cent
250,000 and over
100,000–249,999
60,000–99,000
40,000–59,999
Under 40,000
0 10 20 30 40 706050
OthersFish and marine productsMeat and dairy products
Fruits and vegetablesCerealsTotal food expenditure
Inco
me
clas
s
ES_RC_9-8 18/8/10 20:23 Page 129

Commoditization of rice
Most Filipinos are net buyers of rice. Based on a household survey by the SocialWeather Station, 84 per cent of Filipinos nationwide buy the rice they consume(World Bank, 2001). In urban areas the proportion is 93 per cent, rising to 95per cent in Metro Manila. But even in rural areas, 71 per cent of householdsacquire the rice they eat from the market.
Using data from the 1997 Family Income and Expenditures Survey (FIES),Balisacan (2000) estimated net rice consumption as a percentage of totalconsumption for different deciles of the population ranked by income (thebottom decile is the poorest 10 per cent of the population). If a given decileproduces more rice than it consumes, that group will be net producers or, alter-natively, will have negative net rice consumption (with the extra rice being soldon the market). Those who are net rice producers benefit from higher farmprices, while net rice consumers are hurt by higher retail prices.
Balisacan (2000) found that the bottom two deciles of the population werenet rice consumers, i.e. they consumed more rice than they produced. For thebottom decile (decile 1), the share was approximately +7.5 per cent, whereasfor the second decile it was about +2 per cent. The middle of the distribution,that is, deciles 4 to 8, was net rice producers because production exceedsconsumption for these groups on average. Because net rice consumers are hurtby higher prices, these data show that the poorest of the poor were hurt by therice crisis. Net rice producers are helped by higher prices, however, so themiddle of the income distribution benefited on average (the benefits accrued torural rice farmers with a surplus, not the urban middle class).
Persistent poverty, deepening malnutrition and hunger and eroding indicators of human well-being
The Philippines has not made good strides in improving its poverty situation,partly because of the slow pace of economic growth. In addition, povertyincidence has increased in recent years even as the economy grew modestly (seeFigure 7.6), suggesting a worsening income distribution. At current expecta-tions of medium-term economic growth and considering ‘business as usual’,the Philippines is unlikely to achieve its MDG targets for poverty reduction.
Balisacan (2001) observed that households that experienced adverse effectsfrom the Asian financial crisis in the late 1990s (increased prices, reducedearnings), as well as the El Niño phenomenon (at least for some regions), camedisproportionately from the bottom of the income distribution. These house-holds responded differently to the crisis and to the El Niño event depending ontheir attributes, the most important of which were pre-crisis living standardsand location. His examination of household panel data revealed that theprobability of households changing their eating patterns, taking children out ofschool or increasing their working hours was inversely related to their pre-crisis living standard. It thus appears that an economy-wide shock, such as thefood crisis and global financial crisis of the late 2000s, tends to systematically
130 POLICY RESPONSES IN TRADITIONAL IMPORTING COUNTRIES
ES_RC_9-8 18/8/10 20:23 Page 130

ao
35
30
25
15
14
1991 1%/4 /OW 20/X1 2003 2/36 3:07 201120:G20V 2011 2D12 2013 20/ 4 2015
e
A,`a
6. Actual (official)
MDG goal
-4- Projected
hit hardest the poorest groups in society. Balisacan (2001) further observedthat the probability of receiving assistance/relief from the public sector or fromother households was not significantly related to pre-crisis living standards.This suggests that during an economy-wide crisis, social safety nets, whetherfrom formal or informal sources, do not have a pro-poor bias.
In this context, a rise in the price of rice is equivalent to a drop in real incomefor net consumers of rice, and this drop in income can be especially damaging tothe poor. Such a drop in income not only increases the number of poor peoplebut also pushes people deeper into poverty and hunger. With less money avail-able, the poor are forced to spend less on essential needs such as health care andnutritious (protein- and vitamin-rich) food – essential for good health, especiallyfor children and pregnant women. Families may even pull children out of school,thus threatening future generations with ongoing poverty.
Block et al (2004) found that when rice prices increased in the late 1990s inrural Central Java, Indonesia, mothers in poor families responded by reducingtheir caloric intake in order to better feed their young children, leading to anincrease in maternal wasting. Even worse, purchases of more nutritious foodswere reduced in order to afford the more expensive rice. In turn, this led to ameasurable decline in blood haemoglobin levels in young children and in theirmothers. This malnutrition induced by high rice prices increases ‘the likelihoodof potentially irreparable developmental damage to young children’ (Block etal, 2004). The same trends seem to be happening in the Philippines, as theresults of the National Nutrition Survey conducted in 2003 indicated deepen-
RICE CRISIS IN THE PHILIPPINES 131
Figure 7.6 Poverty reduction performance versus the MDG target
Source: Mapa and Balisacan (2009)
ES_RC_9-8 23/8/10 16:29 Page 131

ing hunger and malnutrition. The proportion of food-deprived people wasestimated at 87 per cent among the lowest quintile and 59 per cent in the nextlowest. These people are mostly from the agricultural sector, the farmers inparticular who accounted for about 52 per cent of the food-deprivedconstituents by occupational category (see Tables 7.2 and 7.3). In addition,significant nutrient deficiencies (especially iron, calcium and vitamin A) werenoted in the same survey.
Philippine government response to the food crisis
In response to the rising domestic prices, the Philippine government formulateda plan of action to mitigate the adverse impacts of the crisis, and providedfunding support of PhP330 billion to implement its Economic ResiliencyProgram. Some of the actions taken include the scaling-up of quick-disbursinghigh-impact projects, particularly the Ginintuang Masaganang Ani (a riceproduction enhancement programme); increasing rice imports to ensure avail-ability and accessibility of the staple food; and enjoining the support of privatecompanies and citizens in cushioning the impact of the crisis.
132 POLICY RESPONSES IN TRADITIONAL IMPORTING COUNTRIES
Table 7.2 Extent of food deprivation in the Philippines, by income level
Income level Proportion of households in each quintile who are food deprived (%)
Quintile 1 (poorest) 87Quintile 2 59Quintile 3 37Quintile 4 19Quintile 5 (richest) 3
Source: NSO (2000)
Table 7.3 Extent of food deprivation in the Philippines, by occupation
Items Proportion of households in each activity/occupation who are food deprived (%)
ActivityAgriculture 52Non-agriculture 30No activity 30
OccupationGovernment officials 24Professionals 17Clerks, service workers, shop sales workers 26Labourers/unskilled workers 46Farmers 52Traders and related workers 37Plant and machine operators and assemblers 31No occupation 30
Source: NSO (2000)
ES_RC_9-8 18/8/10 20:23 Page 132

FIELDS
One of the key programmes launched in the first quarter of 2008 to beef uprice production was the so-called FIELDS (Fertilizer, Infrastructure andIrrigation, Extension and Education, Loans, Drying and other Post-harvestFacilities, and Seeds) programme. Funding for FIELDS of PhP44 billion was tocome from the proposed PhP330 billion fiscal stimulus programme thatincluded funding for the hiring of additional teachers, policemen, soldiers anddoctors; for repair and rehabilitation of government buildings; for purchase ofsupplies and equipment; and for the implementation of previously authorizedbut otherwise unfunded projects. The amount from the stimulus package wassupposed to be additional budget over and above what had been appropriatedfor the agriculture agencies. However, in practice, the programme’s initialimplementation was sourced from the already-approved budget allocation.
FIELDS was (and is) the government’s primary vehicle for attaining self-sufficiency in rice by 2013. Specifically, the FIELDS programme components,and the corresponding budgets, include:
• provision of subsidized fertilizer and micronutrients, PhP0.5 billion; • rehabilitation and restoration of irrigation facilities, PhP6 billion; • farm-to-market roads and other rural infrastructure, PhP6 billion; • extension, education and training, and research and development, PhP5
billion; • agricultural credit, PhP15 billion; • post-harvest facilities, PhP2 billion; and • hybrid and certified seed production and subsidy, PhP9.2 billion.
A recent rapid assessment indicates that the concept of providing farmers theneeded support in an integrated manner to increase production growth issound (Department of Agriculture, 2009). Moreover, with the local govern-ment units (LGUs) as conduits, the programme is expected to be responsive tolocal needs since the LGUs have the familiarity with issues and problemsrelated to their farming sub-sector. There are some weaknesses noted in theimplementation of the programme that should be rectified to ensure the attain-ment of rice production goals. First, sustained implementation may be difficultbecause the LGUs often cannot come up with counterpart funding. Second,weak coordination among agencies involved in the programme results in slowdelivery of the needed support, for example repair and rehabilitation of irriga-tion facilities, availability of certified seeds, easier access to loans. In addition,there is weak policing and enforcement of regulations, for example ensuringgood quality certified seeds. The third weakness is the inefficiency of ricemarketing due to poor condition of roads and other infrastructure facilities;ineffective NFA procurement and distribution operations; and domination ofprivate traders that take advantage of the vulnerability of farmers.
RICE CRISIS IN THE PHILIPPINES 133
ES_RC_9-8 18/8/10 20:23 Page 133

Increased importation of rice
In recent years, rice imports to even out supply and stabilize prices haveincreased. The Philippines is now the world’s biggest importer of rice, withaverage yearly purchases of about 2 million tons in the three years of2006–2008. For 2010, the government is planning to import close to 3 milliontons of rice. The huge volume of imports is prompted by an expected shortfallof domestic rice availability vis-à-vis domestic requirements. There are seriousconcerns, however, about the accuracy of the domestic supply and demandestimates. These estimates are derived from food balance sheets that incorpo-rate many assumptions about feed, seed, waste and processed non-food use.These assumptions can quickly change, especially with the rapid developmentof local and global markets (NSCB, 2009). It should be further noted that someof the supply and demand estimates utilize data from censuses, householdsurveys and special studies, many of which are undertaken on an infrequentbasis. Moreover, detailed studies that measure consumption directly are hardto come by.
134 POLICY RESPONSES IN TRADITIONAL IMPORTING COUNTRIES
Figure 7.7 Monthly relative distribution of production, imports and farm-gate prices in the Philippines, 2000 and 2002
Source: DA-BAS and ASEAN Food Security Information System (AFSIS) Database
10.5
10.0
9.5
9.0
8.5
8.0
7.5
30
25
20
15
10
5
0
Farmgate PriceRice ImportsPalay Production
Jan
Feb Mar Apr May Jun Ju
lAug Sep Oct Nov Dec
Per c
ent
PhP/
kg
2000
10.5
10.0
9.5
9.0
8.5
8.0
7.5
30
25
20
15
10
5
0Ja
nFeb Mar Apr May Ju
n Jul
Aug Sep Oct Nov Dec
Per c
ent
PhP/
kg
2002
ES_RC_9-8 18/8/10 20:23 Page 134
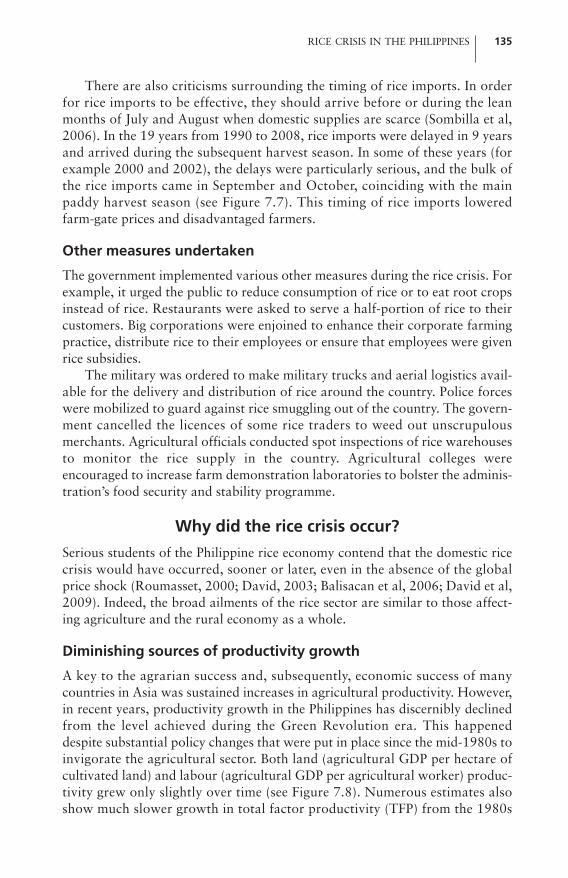
There are also criticisms surrounding the timing of rice imports. In orderfor rice imports to be effective, they should arrive before or during the leanmonths of July and August when domestic supplies are scarce (Sombilla et al,2006). In the 19 years from 1990 to 2008, rice imports were delayed in 9 yearsand arrived during the subsequent harvest season. In some of these years (forexample 2000 and 2002), the delays were particularly serious, and the bulk ofthe rice imports came in September and October, coinciding with the mainpaddy harvest season (see Figure 7.7). This timing of rice imports loweredfarm-gate prices and disadvantaged farmers.
Other measures undertaken
The government implemented various other measures during the rice crisis. Forexample, it urged the public to reduce consumption of rice or to eat root cropsinstead of rice. Restaurants were asked to serve a half-portion of rice to theircustomers. Big corporations were enjoined to enhance their corporate farmingpractice, distribute rice to their employees or ensure that employees were givenrice subsidies.
The military was ordered to make military trucks and aerial logistics avail-able for the delivery and distribution of rice around the country. Police forceswere mobilized to guard against rice smuggling out of the country. The govern-ment cancelled the licences of some rice traders to weed out unscrupulousmerchants. Agricultural officials conducted spot inspections of rice warehousesto monitor the rice supply in the country. Agricultural colleges were encouraged to increase farm demonstration laboratories to bolster the adminis-tration’s food security and stability programme.
Why did the rice crisis occur?
Serious students of the Philippine rice economy contend that the domestic ricecrisis would have occurred, sooner or later, even in the absence of the globalprice shock (Roumasset, 2000; David, 2003; Balisacan et al, 2006; David et al,2009). Indeed, the broad ailments of the rice sector are similar to those affect-ing agriculture and the rural economy as a whole.
Diminishing sources of productivity growth
A key to the agrarian success and, subsequently, economic success of manycountries in Asia was sustained increases in agricultural productivity. However,in recent years, productivity growth in the Philippines has discernibly declinedfrom the level achieved during the Green Revolution era. This happeneddespite substantial policy changes that were put in place since the mid-1980s toinvigorate the agricultural sector. Both land (agricultural GDP per hectare ofcultivated land) and labour (agricultural GDP per agricultural worker) produc-tivity grew only slightly over time (see Figure 7.8). Numerous estimates alsoshow much slower growth in total factor productivity (TFP) from the 1980s
RICE CRISIS IN THE PHILIPPINES 135
ES_RC_9-8 18/8/10 20:23 Page 135

onward, compared to other countries in the region (see Table 7.4) suggestingthat the growth slowdown in agriculture is to a large extent a true productivityslowdown, rather than a shift in resources out of agriculture.
The TFP estimates reported in Table 7.4 suggest that technological changein the Philippines has been limited since the 1980s. This is due to a lack ofinvestment in technologies appropriate to the country’s resource constraints,socio-economic conditions and physical environments. The country’s invest-ments in agricultural research and related activities, for example, have
136 POLICY RESPONSES IN TRADITIONAL IMPORTING COUNTRIES
Figure 7.8 Land and labour productivity growth in the agriculture sector
Source: DA-BAS and FAO Database
Table 7.4 Estimates of TFP growth for selected Asian countries, 1981–2001
(1) (2) (3) (4)
Philippines �0.3 0.4 �1.3 0.1Bangladesh 1.3 1.1India 2.4 �1.1Pakistan 2.5 2.7Cambodia 2.0Indonesia �0.4 �1.1 1.5Laos 2.5Malaysia 1.4 1.5Thailand 1.1 1.4 0.9Viet Nam 3.3 1.0China 4.8 3.6
Sources: (1) Avila and Evenson (2004): 1981–2001; (2) FAO (2004): 1980–2000; (3) Cororaton and Caparas (1999):1981–1996; (4) Mundlak et al (1997): Philippines 1980–1998, Indonesia 1981–1988, Thailand 1981–1995
25,000
20,000
15,000
10,000
5000
0
Labour Productivity (PhP/worker)Land Productivity (PhP/ha)
1994
1995
1996
1997
1998
1999
2000
2001
2002
2003
2004
2005
2006
2007
2008
PhP
(198
5 pr
ices
)
ES_RC_9-8 18/8/10 20:23 Page 136

remained at a low level of 0.1 per cent of the country’s gross value added(GVA) in agriculture over the past ten years. This is far below the 1 per centlevel recommended for developing countries and very much lower than the 2 to3 per cent observed in many countries. In the case of China, whose agriculturalproductivity has been growing at rates much faster than most countries in Asia,investments in research and development rose from 0.4 per cent of GVA in the1990s to 0.8 per cent in the mid-2000s (Huang et al, 2006). Likewise, invest-ments in support services have been insufficient, particularly those fordeveloping infrastructure and institutions that would reduce the cost of doingbusiness in rural areas and that would diversify the rural economy.
Slow growth of employment opportunities
Rapid growth of productive employment opportunities outside of agriculture isa typical feature of a vibrant economy. This has occurred in most of the majoreconomies of Southeast and East Asia, but not in the Philippines. Particularlyneglected have been the development and growth of labour-intensive industriesthat can absorb excess farm labour. Neither has the private sector made aggres-sive investments to support agriculture-based enterprises in rural areas becausethese are regarded as too risky for the level of profits that can be created. Withfew employment opportunities outside of agriculture, small farm householdshave tended to expand farming to more marginal lands. This movementcontributes to natural resource degradation, which, in a vicious cycle, makes itmore difficult to increase agricultural productivity.
High population growth
The Philippines population growth rate still stands at around 2 per cent perannum, while those of its neighbours have declined substantially to well below2 per cent a year. From a macroeconomic perspective, this difference in thepatterns of population growth between the Philippines and its neighbours isthe single most important factor contributing to the much slower incomegrowth and poverty reduction in the Philippines (Mapa and Balisacan, 2004).For rice in particular, the twin forces of rapid population growth and low riceproductivity growth have meant that rice consumption growth has increasinglyoutpaced rice production growth, thereby necessitating increased rice imports.
Key constraints to strengthening the rice sector
Several studies have pointed out the constraints to strengthening the rice sectorin the Philippines, including Balisacan et al (2006).
Closing yield gapsAverage gaps in rice yields across the country currently range from about 5tons per hectare in the wet season to about 6 tons per hectare in the dry season.The gaps are attributable to various factors, including climatic (wet and dryseasons), biological (poor seeds, weeds, pests), physical (soil nutrients, water
RICE CRISIS IN THE PHILIPPINES 137
ES_RC_9-8 18/8/10 20:23 Page 137
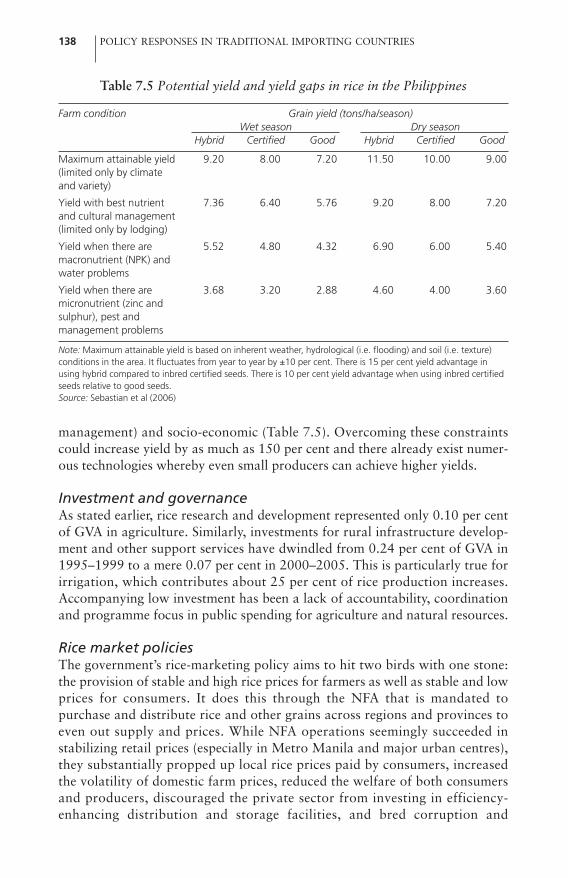
management) and socio-economic (Table 7.5). Overcoming these constraintscould increase yield by as much as 150 per cent and there already exist numer-ous technologies whereby even small producers can achieve higher yields.
Investment and governanceAs stated earlier, rice research and development represented only 0.10 per centof GVA in agriculture. Similarly, investments for rural infrastructure develop-ment and other support services have dwindled from 0.24 per cent of GVA in1995–1999 to a mere 0.07 per cent in 2000–2005. This is particularly true forirrigation, which contributes about 25 per cent of rice production increases.Accompanying low investment has been a lack of accountability, coordinationand programme focus in public spending for agriculture and natural resources.
Rice market policiesThe government’s rice-marketing policy aims to hit two birds with one stone:the provision of stable and high rice prices for farmers as well as stable and lowprices for consumers. It does this through the NFA that is mandated topurchase and distribute rice and other grains across regions and provinces toeven out supply and prices. While NFA operations seemingly succeeded instabilizing retail prices (especially in Metro Manila and major urban centres),they substantially propped up local rice prices paid by consumers, increasedthe volatility of domestic farm prices, reduced the welfare of both consumersand producers, discouraged the private sector from investing in efficiency-enhancing distribution and storage facilities, and bred corruption and
138 POLICY RESPONSES IN TRADITIONAL IMPORTING COUNTRIES
Table 7.5 Potential yield and yield gaps in rice in the Philippines
Farm condition Grain yield (tons/ha/season)Wet season Dry season
Hybrid Certified Good Hybrid Certified Good
Maximum attainable yield 9.20 8.00 7.20 11.50 10.00 9.00(limited only by climate and variety)
Yield with best nutrient 7.36 6.40 5.76 9.20 8.00 7.20and cultural management (limited only by lodging)
Yield when there are 5.52 4.80 4.32 6.90 6.00 5.40macronutrient (NPK) and water problems
Yield when there are 3.68 3.20 2.88 4.60 4.00 3.60micronutrient (zinc and sulphur), pest and management problems
Note: Maximum attainable yield is based on inherent weather, hydrological (i.e. flooding) and soil (i.e. texture)conditions in the area. It fluctuates from year to year by ±10 per cent. There is 15 per cent yield advantage inusing hybrid compared to inbred certified seeds. There is 10 per cent yield advantage when using inbred certifiedseeds relative to good seeds. Source: Sebastian et al (2006)
ES_RC_9-8 18/8/10 20:23 Page 138

institutional sclerosis (Roumasset, 2000; AGILE, 2000; David, 2003; Dawe etal, 2006; Sombilla et al, 2006; David et al, 2009). Government spending interms of financial subsidies to maintain such operations amounted to overPhP6.3 billion in the late 1990s. This expense was far greater than the PhP1billion provided to agricultural research and development in rice during thatsame period. In more recent years, the total fiscal cost (direct governmentoutlay) of the NFA rice subsidy, net of tax expenditures, amounted to PhP5billion in 2007 (roughly 0.08 per cent of GDP) and PhP43 billion in 2008 (0.6per cent of GDP). These subsidies represented 29 per cent and 70 per cent ofthe total budget for the country’s social protection programmes in 2007 and2008, respectively (Manasan, 2009). The total effective cost of the NFA ricesubsidy programme, as estimated by Jha and Mehta (2008), was actually muchhigher, at PhP19 billion in 2007 and PhP69 billion in 2008. The authorsestimate that for every peso given to the poor, the country spends about twopesos. The cost–benefit ratio was 1.50 in 2007 and 2.21 in 2008.
Land reformWeak property rights on land have limited farmers’ access to the credit neededto obtain inputs for their farm operations. The uncertainties created by theslow implementation of agrarian reform, particularly the negative effects of theComprehensive Agrarian Reform Program (CARP) provisions pertaining toland ownership ceilings and transferability on land consolidation and thecollateral value of agricultural land, have effectively inhibited private invest-ments in agriculture and in the rural areas (World Bank, 2009).
Rural financePrivate commercial banks finance commercial agriculture but avoid fundingsmallholder agriculture because of perceived risks, information asymmetry,high transaction costs and financially unviable projects. A growing number ofmicrofinance institutions provide loans to small borrowers but they are notkeen on extending larger and longer-term loans for investment in machineryand other equipment that enhance labour productivity. Government financialinstitutions (GFIs), such as the Land Bank of the Philippines and Quedancor,face the huge challenge of becoming more strategic and catalytic institutions inrural financial markets. Thus, smallholder agriculture continues to rely mostlyon informal credit markets, which charge high interest rates, to finance theirsimple investment requirements.
Rice extensionWeak research–extension linkages, absence of adequate technical support bythe Department of Agriculture to LGUs with weak technical capacity and atop-down approach to extension delivery have been major impediments to theprovision of a client-responsive rice extension system. Weak governance in theprovision of agricultural support services by the LGUs due to transitionalproblems in the decentralization process has aggravated the situation.
RICE CRISIS IN THE PHILIPPINES 139
ES_RC_9-8 18/8/10 20:23 Page 139

Some policy recommendations to secure rice in the Philippines
Long-term food security will remain an important goal for the Philippinesregardless of the occurrence of a food crisis. There are both short-termmeasures to facilitate faster recovery from the crisis and medium- and long-term measures to get agriculture back on track towards more sustainablegrowth that generates significant welfare improvements, especially in the ruralsector.
Short- and medium-term measures
Key short-term measures to help poor and vulnerable households overcome thenegative impact of the food price crisis include the expansion of conditionalcash transfers (CCTs) complemented with a targeted rice subsidy programmein depressed and conflict areas. The provision of such safety nets and socialsafety protection measures will help avoid hunger and poverty. Theseprogrammes are essential in the short run despite their large fiscal costs.
Another key measure would be to make more grain available by reducingtariffs and bringing in more private traders to participate in the importing andmarketing of rice. NFA’s responsibility needs to be streamlined to focus oneffective buffer stock management and it should abandon the price supportpolicy. More accurate estimation of imports and buffer stocks should be basedon data and other parameters that are updated more regularly and handledmore carefully.
Long-term measures
Various analyses on the food price crisis clearly suggest that it was the result ofa long-term imbalance between demand and supply: production growth hasbeen too slow to keep pace with demand growth, despite the fact that demandgrowth has slowed due to reduced population growth and trends towardsdiversification of the diet. As the root cause of the problem is largely on thesupply side, the long-term solution requires measures that correct this supply-side problem.
In this regard, the Philippines should enhance its investment in long-termsources of productivity growth, with special attention to:
• continuing development of rice technologies appropriate for local condi-tions, especially in view of climate change, such as stress-tolerant varietiessuitable for cultivation in areas with abiotic problems (for exampledrought, floods);
• creating incentives for human resource development and maintaining andimproving research facilities;
• overhauling the rice extension programmes from their top-down, centrallydirected approach to one that is LGU-led and linked to research systems;
140 POLICY RESPONSES IN TRADITIONAL IMPORTING COUNTRIES
ES_RC_9-8 18/8/10 20:23 Page 140

innovative mechanisms involving civil society organizations and the privatesector can deliver technologies and information more effectively than theusual formal extension systems based on the traditional mode of technol-ogy transfer;
• investing in irrigation development but focusing more on the rehabilitationof existing systems rather than on construction of new large-scale irriga-tion systems, and on small-scale systems including the facilitation ofprivately owned shallow tube wells;
• reducing the ‘cost of doing business’ by investing in connectivity (trans-port, electricity, telecommunication) and removing efficiency-inhibitingregulatory measures.
ReferencesAGILE (2000) Strategic Reorganization of the National Food Authority for the New
Millennium, report submitted to USAID, January, ManilaAvila, D. A. and Evenson, R. (2004) Total Factor Productivity Growth in Agriculture:
The Role of Technological Capital, Economic Growth Center Paper, Yale University,New Haven
Balisacan, A. M. (2000) ‘Growth, inequality and poverty reduction in the Philippines:A re-examination of evidence’, University of the Philippines, Quezon City
Balisacan, A. M. (2001) ‘Poverty profile in the Philippines: An update and reexamina-tion’, Philippine Review of Economics, vol 38, pp16–51
Balisacan, A. M., Sebastian, L. S. and Associates (2006) Securing Rice, ReducingPoverty: Challenges and Policy Directions, Southeast Asian Regional Center forGraduate Study and Research in Agriculture, Los Baños, Laguna
Block, S., Kiess, L., Webb, P., Kosen, S., Moench-Pfanner, R., Bloem, M. W. andTimmer, C. P. (2004) ‘Macro shocks and micro outcomes: Child nutrition duringIndonesia’s crisis’, Economics & Human Biology, vol 2, no 1, pp21–44
Cororaton, C. B. and Caparas, M. T. (1999) Total Factor Productivity: Estimates forthe Philippine Economy, Discussion Paper 99-06, Philippine Institute forDevelopment Studies, Manila
David, C. C. (2003) ‘Agriculture,’ in Balisacan, A. M. and Hill. H. (eds) ThePhilippines Economy: Development, Policies and Challenges, Oxford UniversityPress and Ateneo de Manila University Press, New York and Quezon City,pp175–218
David, C. C., Intal, P. and Balisacan, A. M. (2009) ‘The Philippines,’ in Anderson, K.and Martin, W (eds) Distortions to Agricultural Incentives in Asia, World Bank,Washington, DC, pp223–254
Dawe, D., Moya, P. and Casiwan, C. (eds) (2006) Why Does Philippines Import Rice:Meeting the Challenge of Trade Liberalization, IRRI, PhilRice, Los Baños
Department of Agriculture (2009) Rapid Appraisal of the Performance of FIELDSProject, Technical Report, Department of Agriculture, Quezon City
FAO (Food and Agriculture Organization of the United Nations) (2004) State of Foodand Agriculture 2004, FAO, Rome
Huang, J., Zhang, L. and Rozelle, S. (2006) ‘China’s agriculture under trade liberalization:Past performance, future prospects and policy implications’, paper presented at the 5thAsia Pacific Agriculture Policy Forum, Jeju, Republic of Korea, 14–15 September
RICE CRISIS IN THE PHILIPPINES 141
ES_RC_9-8 18/8/10 20:23 Page 141
Jha, S. and Mehta, A. (2008) Effectiveness of Public Spending: The Case of Rice andSubsidies in the Philippines, ADB Working Paper No 138, ADB, Philippines
Manasan, R. G. (2009) Reforming Social Protection Policy: Responding to the GlobalFinancial Crisis and Beyond, Discussion Paper Series No 2009-22, PhilippineInstitute for Development Studies, Makati, Philippines
Mapa, D. S. and Balisacan, A. M. (2004) ‘Quantifying the impact of population oneconomic growth and poverty: The Philippines in an East Asian context,’ in Sevilla,L. A. (ed) The Ties that Bind: Population and Development in the Philippines, 2ndedition, Asian Institute of Management-Policy Center, Makati City, pp157–191
Mapa, D. S. and Balisacan, A. M. (2009) The Population-Poverty Nexus: ThePhilippines in Comparative East Asian Context, The University of the PhilippinesPress, Diliman, Quezon City, Philippines
Mundlak, Y., Larsen, D. and Butzer, R. (1997) The Determinants of AgriculturalProduction: A Cross-Country Analysis’, Policy Research Working Paper No 1827,World Bank, Washington, DC
NSCB (National Statistical Coordinating Board) (2009) ‘Technical notes on foodbalance sheet estimation in the Philippines’, www.nscb.gov.ph/technotes/fbs_tech.asp.
NSO (National Statistics Office) (2000) Family Income and Expenditure Survey, NSO,www.census.gov.ph
NSO (2006) Family Income and Expenditure Survey, NSO, www.census.gov.phRoumasset, J. (2000) ‘Market friendly food security: Alternatives for restructuring
NFA’, unpublished paper, Department of Economics, University of Hawaii,Honolulu
Sebastian, L. S., Bordey, F. and Alpuerto, V. L. E. B. (2006) ‘Research andDevelopment’, in Balisacan, A. M., Sebastian, L. S. and Associates (eds) SecuringRice, Reducing Poverty: Challenges and Policy Directions, Southeast AsianRegional Center for Graduate Study and Research in Agriculture, Los Baños,Laguna, Philippines, pp39–69
Sombilla, M. A., Lantican, F. A. and Beltran, J. C. (2006) ‘Marketing and distribution’,in Balisacan, A. M., Sebastian, L. S. and Associates (eds) Securing Rice, ReducingPoverty: Challenges and Policy Directions, Southeast Asian Regional Center forGraduate Study and Research in Agriculture, Los Baños, Laguna, Philippines,pp213–238
World Bank (2001) Philippines: Filipino Report Card on Pro-poor Services,Environment and Social Development Sector Unit, East Asia and Pacific Region,World Bank Manila Office, Pasig City
World Bank (2009) ‘Land reform, rural development, and poverty in the Philippines:Revisiting the agenda’, Technical Report, World Bank Manila Office, Pasig City
142 POLICY RESPONSES IN TRADITIONAL IMPORTING COUNTRIES
ES_RC_9-8 18/8/10 20:23 Page 142

8
West African Experience with theWorld Rice Crisis, 2007–2008
Jenny C. Aker, Steven Block, Vijaya Ramachandran and C. Peter Timmer
Introduction
Historically, rice production in Africa has tended to be low-yielding, geograph-ically dispersed and uncompetitive against low-cost Asian imports, even when protected by high freight costs and substantial trade barriers.Skyrocketing prices in world markets, however, were a shock to Africanconsumers, producers and governments alike, and numerous initiatives havebeen announced to stimulate rice production on the continent (Inter-réseauxDéveloppement Rural, 2008).
Although most African countries produce at least small amounts of rice,we focus here on the rice economy of West Africa and its response to the2007–2008 food crisis. The West African rice industry has deep historicalroots. The West African Rice Development Authority (WARDA) was foundedin 1971. The classic commodity-system analysis of the West African riceeconomy by Pearson et al was published in 1981. The IRRI has undertakencollaborative research on rice varieties suitable for West African conditions fordecades.
Despite this long history, the West African rice economy (with the excep-tion of Nigeria) has shown surprisingly little progress over the past
ES_RC_9-8 18/8/10 20:23 Page 143

half-century, and has become increasingly dependent on imports to meetrapidly growing consumer demand, especially in urban areas. Although grownefficiently by small farmers, a successful rice economy needs sophisticatedengagement from governments to develop the economies of scale and scopethat permit a low-cost rice system. This engagement has largely been missing inWest Africa.
Research and extension, rural infrastructure, a stable marketing environ-ment and a broad base of consumer demand all depend to a greater or lesserdegree on effective government investments and policies. Asian governmentslearned long ago how to provide these essentials if they were to survive andtheir economies to grow. Not a single West African country has sustained suchinvestments and policies for more than a few years at a time. This lack ofinvestment, along with geographic, technological and market constraints, hasresulted is an import-dependent region, where urban demand for cheap rice hasoverwhelmed local production capacity. Without sustained government invest-ment in West African’s rural economy, and its rice economy in particular, riceimports have dominated consumption.
When international rice prices were relatively low, rice imports did not poseeconomic or political problems for West African governments. Extremelyexpensive imports reverse that equation. This chapter addresses the response tothat reversal. As already noted, farmers, consumers, investors, donors and WestAfrican governments have all taken notice of the new price environment. Thefirst response in most countries was to lower or remove import barriers for riceto protect consumers. But this response quickly shifted as Senegal and several ofits neighbours announced various strategies to spur domestic rice production inresponse to high international prices.1 This might be risky, as the world ricemarket is notoriously volatile, and the price spike in 2008 has turned out to bequite short-lived. Will West Africa’s new-found interest in stimulating local riceproduction survive a return to cheap rice in world markets?
We address that question in the remainder of this chapter. The next sectionpresents a historical review of trends in the West African rice sector, afterwhich we will assess the impact of world rice prices on domestic prices, primar-ily at the consumer level. This involves understanding the mechanisms of pricetransmission from world markets to domestic markets, and the efficiency ofdomestic rice marketing. Finally, we discuss policy responses to rice priceincreases, examining how responses to recent fluctuations compare to those ofthe past.
Recent trends for rice in West Africa2
Rice production in West Africa has doubled since 1985, yet rice consumptionhas increased even more rapidly, resulting in a growing shortfall of local riceproduction. This increasing dependence on imports has left West African riceconsumers – mainly those located in urban markets – increasingly vulnerable tovolatility in world rice markets. Though the extent of import dependence varies
144 POLICY RESPONSES IN TRADITIONAL IMPORTING COUNTRIES
ES_RC_9-8 26/8/10 09:13 Page 144
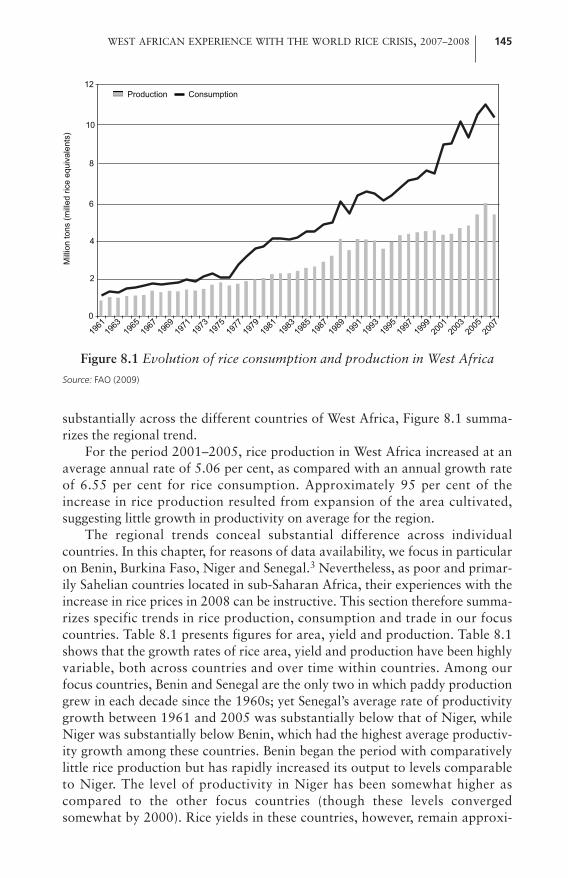
substantially across the different countries of West Africa, Figure 8.1 summa-rizes the regional trend.
For the period 2001–2005, rice production in West Africa increased at anaverage annual rate of 5.06 per cent, as compared with an annual growth rateof 6.55 per cent for rice consumption. Approximately 95 per cent of theincrease in rice production resulted from expansion of the area cultivated,suggesting little growth in productivity on average for the region.
The regional trends conceal substantial difference across individualcountries. In this chapter, for reasons of data availability, we focus in particularon Benin, Burkina Faso, Niger and Senegal.3 Nevertheless, as poor and primar-ily Sahelian countries located in sub-Saharan Africa, their experiences with theincrease in rice prices in 2008 can be instructive. This section therefore summa-rizes specific trends in rice production, consumption and trade in our focuscountries. Table 8.1 presents figures for area, yield and production. Table 8.1shows that the growth rates of rice area, yield and production have been highlyvariable, both across countries and over time within countries. Among ourfocus countries, Benin and Senegal are the only two in which paddy productiongrew in each decade since the 1960s; yet Senegal’s average rate of productivitygrowth between 1961 and 2005 was substantially below that of Niger, whileNiger was substantially below Benin, which had the highest average productiv-ity growth among these countries. Benin began the period with comparativelylittle rice production but has rapidly increased its output to levels comparableto Niger. The level of productivity in Niger has been somewhat higher ascompared to the other focus countries (though these levels convergedsomewhat by 2000). Rice yields in these countries, however, remain approxi-
WEST AFRICAN EXPERIENCE WITH THE WORLD RICE CRISIS, 2007–2008 145
Figure 8.1 Evolution of rice consumption and production in West Africa
Source: FAO (2009)
0
8
10
12
1961
1963
1965
1967
1969
1971
1973
1975
1977
1979
1981
1983
1985
1987
1989
1991
1993
1995
1997
1999
2001
2003
2005
2007
Mill
ion
tons
(mill
ed ri
ce e
quiv
alen
ts)
Production Consumption
2
4
6
ES_RC_9-8 18/8/10 20:23 Page 145

mately one half of the levels common in Asia, though the latter benefits fromsubstantially greater shares of irrigated production.
Table 8.2 addresses trends and levels of rice imports. These data reflectsubstantial variations over time within countries, as well as substantial varia-tions across our four focus countries. For example, the 1970s saw rapidgrowth in both the quantity and value of rice imports into Burkina Faso andNiger, followed in the 1980s by falling quantities and values of rice imports inNiger. The clearest pattern to emerge from Table 8.2 pertains to the value ofrice imports as a share of total merchandise imports. These figures trendsteadily upward in Benin, Burkina Faso and Niger between 1961 and 2007. By2001–2007, Benin’s import share exceeded that of Senegal, which had beenhigher than in the other countries throughout the period, though with no trendover time.
Table 8.3 summarizes growth rates and levels of rice consumption withinthese countries, presenting as well the share of caloric intake accounted for byrice and trends in each country’s rice self-sufficiency ratio. The yearly averagesindicate clearly the dominant role of rice in Senegalese diets. Senegal’s percapita rice consumption remains substantially greater than that of our otherfocus countries. Since the 1960s, per capita rice consumption has increasedconsistently in Burkina Faso, with particularly rapid increases in Benin, whilerice has retained its secondary status among staple grains in Niger (wheremillet and sorghum dominate) and its primary status in Senegal.
The rice self-sufficiency ratios reported in the bottom panel of Table 8.3summarize the production, consumption and trade data presented above.4
Niger has reported surpluses since 2001. Yet these surplus conditions havebeen the exception among our focus countries. Senegal, the largest riceconsumer in this group, is highly import-dependent, with a self-sufficiencyratio declining from about 25 per cent in the 1960s to nearly 15 per cent by2006. Similarly, the rapid increases in Benin’s rice consumption have outpacedits production growth, resulting in the lowest self-sufficiency ratio among thisgroup of countries. With the exception of Senegal, rice consumption in thesecountries is primarily focused in the urban centre, and/or in the main growingregions along the river basins.
As reflected in Figure 8.1, the growth rate of West Africa’s rice consump-tion has consistently outpaced its growth in rice production. In our focuscountries, nearly all increases in rice production – particularly since 1970 –have resulted from extensification rather than productivity growth. In general,these trends suggest that the rice sector of these countries faces substantialchallenges in the foreseeable future. In particular, the growing dependence onimports suggests potentially severe consequences for urban consumers in an eraof rapid price increases in world rice markets. Two broad concerns follow: (1)What are the potential welfare effects for consumers and producers of recentdramatic increases in food prices (especially rice)?; and (2) How much of therecent increase in international rice prices has been transmitted into domesticrice markets in the region?
146 POLICY RESPONSES IN TRADITIONAL IMPORTING COUNTRIES
ES_RC_9-8 18/8/10 20:23 Page 146

Table 8.1 Area, yield and production of rice in selected West African Countries, 1961–2006
Annual growth rate Yearly averages1961– 1971– 1981– 1991– 2001– 1961– 1961– 1971– 1981– 1991– 2001– 2006 1970 1980 1990 2000 2005 2005 1970 1980 1990 2000 2005 est.
Harvested rice paddy area (ha)Benin 4.51 10.6 �0.73 13.86 �0.11 6.26 2323 7058 7036 12,636 26,667 26,901Burkina Faso �2.6 �0.84 �4.02 9.61 �1.56 0.30 41,807 38,177 24,166 37,014 51,032 106,000Niger 7.6 3.5 0.97 �4.41 �7.64 0.85 11,359 19,380 21,853 22,307 24,272 23,000Senegal 2.85 0.92 1.94 0.41 3.02 1.70 82,604 75,384 71,612 74,662 86,067 85,037
Rice paddy yield (tons/ha)Benin 14.62 �3.56 4.39 6.01 7.24 5.57 0.68 1.54 1.19 1.71 2.39 2.64Burkina Faso 5.21 3.74 2.96 1.57 �3.38 2.62 0.86 1.02 1.72 2.1 1.81 1.78Niger 12.26 �5.43 6.33 2 2.94 3.70 1.83 1.62 2.6 2.93 3.07 2.85Senegal �0.74 1.77 2.42 0.57 4.68 1.41 1.27 1.19 1.98 2.35 2.52 2.24
Rice paddy production (tons)Benin 19.79 6.67 3.64 20.71 7.13 12.08 1686 10,822 8317 22,953 63,655 70,972Burkina Faso 2.48 2.87 �1.18 11.33 �4.89 2.90 34,889 38,660 40,783 77,176 92,497 189,176Niger 20.78 �2.12 7.36 �2.49 �4.92 4.68 22,145 30,547 56,847 63,209 73,480 65,661Senegal 2.09 2.71 4.4 0.98 7.84 3.13 106,591 92,831 141,131 174,598 218,403 190,493
Source: WARDA (2008)
ES_RC_9-8 18/8/10 20:23 Page 147

Table 8.2 Imports of rice in selected West African countries, 1961–2006
Annual growth rate Yearly averages1961– 1971– 1981– 1991– 2001– 1961– 1961– 1971– 1981– 1991– 2001– 2006 1970 1980 1990 2000 2005 2005 1970 1980 1990 2000 2005 est.
Quantity of rice imported (tons)Benin 4.7 3.4 12.5 �18.7 42.3 11.0 5366 8663 49,448 163,306 382,748Burkina Faso �6.9 51.6 14.5 10.4 �21.6 12.0 2935 11,378 65,418 137,740 164,678Niger �35.5 69.6 �1.1 15.3 2.2 14.9 1090 9205 34,735 58,672 194,650Senegal 2.8 7.2 0.6 5.3 3.9 4.3 145,514 223,974 352,561 462,763 831,616
Value of rice imports (thousands US$)Benin 7.8 7.6 10.9 -19.2 52.1 12.2 872 2301 14,440 49,798 111,988Burkina Faso �9.0 59.5 15.1 7.4 -4.3 13.5 455 4007 20,768 44,471 39,261Niger �23.3 77.6 �5.2 12.0 9.0 16.5 146 3838 14,300 20,382 56,488Senegal 5.2 15.1 �0.1 8.9 12.5 6.3 17,027 48,121 79,554 109,689 228,139
Value of rice imports as a share of total merchandise imports 1961–2007
Benin 2.2% 1.1% 4.1% 8.4% 12.8% 8.1%Burkina Faso 1.1% 2.3% 5.5% 8.2% 3.4% 5.0%Niger 0.4% 1.8% 3.8% 5.1% 7.9% 5.1%Senegal 9.8% 7.9% 7.6% 8.4% 8.0% 8.1%
Source: FAO (2009); IMF (2009) for data on merchandise imports
ES_RC_9-8 18/8/10 20:23 Page 148

Table 8.3 Consumption and self-sufficiency of rice in selected West African countries, 1961–2006
Annual growth rate Yearly averages1961– 1971– 1981– 1991– 2001– 1961– 1961– 1971– 1981– 1991– 2001– 2006 1970 1980 1990 2000 2005 2005 1970 1980 1990 2000 2005 est.
Rice and rice product total consumption (tons)Benin 7.39 3.41 9.09 �3.06 46.87 8.95 5889 12,613 45,142 93,197 233,964 395,527Burkina Faso 1.94 11.45 10.22 4.68 �5.91 5.63 23,258 33,588 95,379 158,857 174,200 155,003Niger 16.08 9.18 4.16 �1.12 �14.24 4.71 13,604 27,082 70,008 65,526 45,962 31,136Senegal 3.9 7.63 3.6 3.25 0.11 4.10 201,805 271,909 438,061 596,501 818,204 839,844
Rice and rice product consumption per capita (kg/yr)Benin 5.31 0.9 5.27 �4.96 32.7 5.08 2.37 4.06 10.71 15.69 31.62 45.7Burkina Faso �0.07 8.78 7.39 1.99 �7.87 3.15 4.7 5.32 11.78 15.1 12.99 10.86Niger 12.51 5.97 0.82 �4.6 �15.85 1.51 3.59 5.46 10.38 7.17 3.54 2.31Senegal 1.16 4.59 0.33 �0.48 �2.28 0.99 54.59 55.01 66.73 63.73 72.54 68.81
Rice share of caloric intake (%)Benin 4.59 0.26 2.92 2.94 27.65 5.45 1.21 2.04 5.05 5.32 11.04 17Burkina Faso �1.73 7.87 1.97 3.59 �34.09 �1.19 2.78 3.23 5.57 5.21 4.65 0.47Niger 10.03 5.22 1.72 �3.69 �16.51 1.12 1.81 2.49 4.78 4.47 4.56 2.97Senegal �0.06 4.48 �0.33 2.53 �0.47 1.42 21.66 23.73 28.13 27.96 30.94 31.55
Self-sufficiency ratio (%)Benin 11.55 3.15 �5 24.52 �27.06 4.60 18.99 61.76 13.37 18.29 23.22 12.02Burkina Faso 0.53 �7.7 �10.34 6.35 1.08 �2.36 102 84.19 33.15 31.85 35.73 81.77Niger 4.05 �10.35 3.07 �1.39 10.87 0.18 105 84.86 54.56 64.5 110.44 141.29Senegal �1.74 �4.58 0.77 �2.2 7.72 �0.86 37 24.7 21.76 19.77 17.89 15.2
Source: WARDA (2008)
ES_RC_9-8 18/8/10 20:23 Page 149

Attempting to address the first of these questions, a team of researchers atthe World Bank, led by Quentin Wodon, has produced a series of countrystudies on the effects of high food prices on various poverty indicators in WestAfrica.5 These studies, which appeared in September and October 2008, sharea methodological approach that extrapolates from household data to simulatethe effect of price changes on poverty outcomes. Their simulation resultssuggest that a 50 per cent increase in the price of rice could increase theheadcount index of poverty (in the worst case) by 3.4 percentage points inSenegal, and (in the best case) by 1.2 percentage points in Burkina Faso, whererice plays the smallest role in consumption. Yet even this small increase inBurkina Faso’s headcount index of poverty implies an addition of over 122,000to the population living in poverty. In Senegal, a 3.4 percentage point increasein the headcount index implies an absolute increase of approximately 437,000people living in poverty. These simulations further suggest that much of theburden of increased food prices would fall on those who were poor to beginwith, with the most severe effects falling on the poorest.
Transmission of international prices into domestic rice markets
In practice, the magnitude of the impact of rapid increases in the internationalprice of rice depends directly on the extent to which those increases are trans-mitted to domestic markets. The previous sections have described the dramaticprice fluctuations in global rice markets since 2000, as well as recent trends inthe rice sector in West Africa and the potential welfare consequences of highfood prices in these countries. It is clear that high food prices have the potentialto increase both poverty and perhaps malnutrition in the region. Senegal inparticular may be particularly vulnerable to rapid increases in rice prices. Thus,it is critical to assess the extent to which recent fluctuations in global rice priceshave been transmitted into domestic markets in West Africa.
The extent of transmission is important for two reasons. First, it is domes-tic, not world, prices that affect the welfare of poor consumers and farmers.Second, the magnitude of price transmission will influence the extent to whichadjustments by producers and consumers help stabilize world pricemovements. These adjustments (reduced consumption, increased production)will only take place if world prices are transmitted to domestic prices (Imai etal, 2008). Finally, domestic price changes can also have implications for thepolitical stability of governments in West Africa. In fact, numerous demonstra-tions and riots took place in capital cities of West Africa in response to higherfood prices, with large-scale riots taking place in Burkina Faso (22 February2008; UNOCHA 2008a), Cameroon, Guinea, Côte d’Ivoire (31 March 2008)and Senegal (31 March 2008; UNOCHA 2008b).
The link between rice price increases and conflict is more than a theoreticalconcern for West Africa. The surge in rice prices in 1979 contributed toLiberia’s descent into chaos, sparking riots and a political crisis that led to the
150 POLICY RESPONSES IN TRADITIONAL IMPORTING COUNTRIES
ES_RC_9-8 18/8/10 20:23 Page 150

coup that brought Samuel Doe to power and the onset of a decade-long civilwar in the 1990s. Liberia and Sierra Leone are both emerging from protractedcivil conflicts, and price increases and riots can be risk factors for bothcountries (UNOCHA, 2008c).
The extent of price transmission is a function of two key variables: (1) theexchange rate at which US dollar prices are converted to domestic currencyprices; and (2) trade policies at the border, which restrict (or enhance) the flowof commodities. The time horizon of adjustment is a third factor, as normalmarketing lags as well as policy interventions delay the immediate transmissionof international prices into domestic economies (though the longer there is asubstantial difference between the two prices, the more pressure there is forconvergence).
Exchange rate effects6
Even before the dramatic surge in prices in 2008, world market prices hadincreased substantially in real US dollar terms. Comparing the last quarter of2007 with the last quarter of 2003, world market prices increased 56 per centfor rice, 91 per cent for wheat, 40 per cent for maize and 107 per cent for urea(a primary source of nitrogen in fertilizer). During that time, the US dollardepreciated substantially against the currencies of several large rice-exportingcountries, putting upward pressure on world prices quoted in dollars.7
Real exchange rate (RER) appreciation vis-à-vis the US dollar, to the extentthat it occurs, will neutralize some of the impact of increased prices in US dollarterms. Thus, in assessing the extent to which increases in the international priceof rice were transmitted to domestic markets in West Africa, we must first calcu-late the change in each country’s real exchange rate, calculated as:
%�RERi = %�ei + %�GDPDeflUS – %�CPIi (1)
where RERi is the real exchange rate for country i, ei is the country’s nominalexchange rate, CPI is the consumer price index and the GDPDefl is the GDP ofthat country deflated by US prices.
Since each of the focus countries presented in this chapter (Benin, BurkinaFaso, Niger and Senegal) is a member of the Communauté financière d’Afrique(CFA; Financial Community of Africa) Zone – thus sharing a common currencythat is fixed relative to the euro – they experienced the same 14 per cent nominalappreciation against the US dollar between 2003 and 2007. Since domestic infla-tion in these countries was both similar across countries (owing to the regulationof monetary policy within the CFA Zone) and approximately equal to the rate ofinflation in the US (the change in the US GDP deflator over this period was 12.8per cent), the price effects essentially cancel out, leaving these countries with areal exchange rate appreciation of approximately 14 per cent (roughly equivalentto their nominal appreciation). Real appreciation over this period thus tended tomitigate the effects of increases in the international price of imports.
WEST AFRICAN EXPERIENCE WITH THE WORLD RICE CRISIS, 2007–2008 151
ES_RC_9-8 18/8/10 20:23 Page 151

The next step in assessing the pass-through to domestic markets of a givenreal increase in the dollar-denominated international price of rice is to filterthat increase through the change in each country’s RER, resulting in the realchange in the domestic-currency-denominated international price of rice. Thiseffect is presented in column 2 of Table 8.4. For the CFA Zone countries, thereal domestic-currency-denominated increase in international rice pricesranged from 41–45 per cent.
Table 8.4 builds on the changes in the world price of rice in domesticcurrency terms described above (column 2) to then address the extent to whichWest African governments permitted the 56 per cent increase in the dollar-denominated international price of rice to pass through to domestic consumers.Column 3 uses domestic rice market data from the market information systemsof selected countries to show the percentage increase between 2003 and 2007in the real retail price of imported rice in capital cities.8 To the extent theincrease in domestic prices (column 3) is less than the domestic-currency-denominated world price (column 2), it reflects government intervention tostem the impact of increased international prices on domestic markets. Clearly,in the four countries for which we have domestic market price data, the combi-nation of RER appreciation and government interventions provided asubstantial buffer between international and domestic rice markets in theperiod leading up to the crisis.
Column 4 presents the proportion of the dollar price increase thatremained net of the exchange rate effects, while (for selected countries) column5 presents the proportion of the dollar price increase that remained net of boththe exchange rate effects and the effects of each country’s border price interven-tions. As is evident from the fact that the numbers in column 5 are much lessthan those in column 4, most of the buffering of domestic rice markets fromthe dramatic increase in international prices was the result of border priceinterventions, rather than an artefact of RER appreciation. In each case forwhich we have domestic price data, approximately two-thirds of the pass-through effect is the result of border price interventions (a topic to which wereturn below).
152 POLICY RESPONSES IN TRADITIONAL IMPORTING COUNTRIES
Table 8.4 Cumulative percentage changes in real rice prices, the last quarter of 2003 to the last quarter of 2007
Country (1) (2) (3) (4) (5) World price World price Domestic price World price pass- Total DC pass
(US$) (DC) (DC) through from through =exchange rate = (2)/(1) (3)/(1)
Benin 56 41.5 6.75 74 12Burkina Faso 56 44.5 8.6 79 15Niger 56 42 11.0 75 19.6Senegal 56 41.5 10.6 74 18.9
Note: DC = domestic currency.Source: IMF, SIMA/Niger, SIM-C Burkina Faso, ONASA/Benin, and OMS-Senegal
ES_RC_9-8 18/8/10 20:23 Page 152

Table 8.5 Levels and changes in nominal prices (CFA) for millet, domestic and imported rice, the last quarter of 2003 to the second quarter of 2008
(1) (2) (3) (4) (5) (6) (7) (8) (9)Mean price Mean price % change Mean price Mean price % change % change Mean quarterly Mean quarterly Q4/2003 Q3/2007 Q4/2003–Q3/2007 Q4/2007 Q2/2008 Q4/2007– Q4/2003– growth rate, growth rate,
Q2/2008 Q2/2008 Q4/2003– Q4/2007–Q3/2007 (%) Q2/2008 (%)
Benin millet 233.3 256.67 10.0 291.67 350 20.0 50.0 0.64 9.54imported rice 321.67 345 7.3 388.34 425 9.4 32.1 0.47 4.61 domestic rice 255 345 35.3 368.34 2.04
Burkina Faso millet 111.7a 139.36 24.8 149.88 171.3 14.3 53.3 1.49 6.91 imported rice 247.9a 270.34 9.1 296.67 351.04 18.3 41.6 0.58 8.78
Niger millet 125.67 171 36.1 158 205 29.7 63.1 2.07 13.91 imported rice 275 306.34 11.4 343.67 362 5.3 31.6 0.72 2.63 domestic rice 220.67 245b 11.0 0.70
Senegal millet 144.67 217 50.0 236.67 249.34 5.4 72.4 2.74 2.64 imported rice 200 238 19.0 250 300 20.0 50.0 1.17 9.54 domestic rice 190.34 231 21.4 239.67 289 20.6 51.8 1.30 9.81
Note: a = Q1/2004; b = Q4/2006Sources: Niger: Systeme d’Informations sur le Marche Agricole (SIMA); Benin: ONASA (Office Nationale de la Securite Alimentaire); Burkina Faso: System d’Information sur les MarchesCerealiers (SIM-C); Senegal: Ministry of Agriculture, market surveys
ES_RC_9-8 18/8/10 20:23 Page 153

We gain further insights into the nature of commodity markets in ourcountries and the effects of the crisis by comparing several sets of prices: (1)world versus domestic prices of imported rice; (2) the price of millet versus theprice of imported rice; and (3) the price of imported versus domesticallyproduced rice. We begin simply by summarizing the levels and changes in theprices of millet, imported rice and domestic rice before and during the crisis.Table 8.5 presents the data.
For most of the cases presented in Table 8.5, the rate of increase in nominalprices accelerated dramatically between the last quarter of 2007 and the secondquarter of 2008 (as compared with the quarterly average growth rate for the15 quarters from the last quarter of 2003 to the third quarter of 2007). Theapparently large role for border price interventions noted above is reinforcedby comparing in nominal prices the time series of the international rice pricewith the domestic prices of imported rice, as in Figure 8.2.
Figure 8.2 shows international rice prices (free on board) as compared withimported retail rice prices in the capital cities of several West African countries:Cotonou (Benin), Ouagadoudou (Burkina Faso), Niamey (Niger) and Dakar(Senegal). While imported rice prices follow international prices, the correla-tion is not perfect. Average correlations between international and thedomestic prices of imported rice in Senegal, Burkina Faso, Niger and Beninwere 0.70, 0.67, 0.46 and 0.55, respectively, between 2003 and 2008.
154 POLICY RESPONSES IN TRADITIONAL IMPORTING COUNTRIES
Figure 8.2 International versus domestic prices of imported rice, October 2003–June 2008 (CFA franc/kg)
Sources: Niger: Systeme d’Informations sur le Marche Agricole (SIMA); Benin: ONASA (Office Nationale de laSecurite Alimentaire); Burkina Faso: System d’Information sur les Marches Cerealiers (SIM-C); Senegal: Ministry ofAgriculture, market surveys.
0
100
200
300
400
500
Oct-03
Dec-03
Feb-0
4
Apr-04
Jun-0
4
Aug-04
Oct-04
Dec-04
Feb-0
5
Apr-05
Jun-0
5
Aug-05
Oct-05
Dec-05
Feb-0
6
Apr-06
Jun-0
6
Aug-06
Oct-06
Dec-06
Feb-0
7
Apr-07
Jun-0
7
Aug-07
Oct-07
Dec-07
Feb-0
8
Apr-08
Jun-0
8
Aug-08
Oct-08
Dec-08
WorldBeninNiger
Burkina FasoSenegal
CFA
fran
c/kg
ES_RC_9-8 18/8/10 20:23 Page 154

Imported rice prices in these countries have been strikingly stable during thisperiod, primarily due to: (1) import tax regimes; and (2) floor/ceiling prices.9
The increases in imported rice prices in 2004–2005 in Burkina Faso and Nigerwere primarily due to regional droughts and food crises during that year.During that time, staple food prices (millet and sorghum) were the highest onrecord, and in some cases consumers switched to rice – thereby increasingdemand for rice and increasing prices.
On average, imported rice prices in West Africa followed the surge in inter-national rice price increases in late 2007 and early 2008. In many cases, thisincrease actually preceded the international rice price increase, starting inAugust/September 2007 in most West African countries, whereas the interna-tional rice price increase did not seem to begin until late 2007 or early 2008.One potential reason for this increase in West Africa is the increases in shippingcosts. Virtually all of the rice imported into West Africa originates in Asia.During the months from February 2007 to November 2007 (for example theperiod when we observe increasing domestic prices in advance of the increasedinternational price), the Baltic Dry Goods Index more than doubled.10 Thisincrease could have reduced the demand for imports, thus contributing toincreased domestic prices by reducing available supplies. In any case, it is clearthat in the face of the dramatic surge in the international price beginning in late2007, these countries were unable to afford sufficient import subsidies toprotect domestic rice consumers from world markets.
However, these average correlations conceal an interesting break point atthe beginning of the rapid increase in world prices. Table 8.6 demonstrates thatthe West African governments had little trouble stabilizing domestic rice pricesduring the long period of stable or declining international prices (prior to thelast quarter of 2007); yet, the pattern of price correlations changes sharplywhen international prices surged in late 2007.
The dramatic increases in the correlations between the international riceprices domestic prices for imported rice reinforces the conclusion that mostgovernments in West Africa were either unprepared for, or incapable ofcontaining, the dramatic surge in international rice prices.11 The only excep-tion was Niger, where the correlation actually decreased as compared with theprevious period. As Niger has a rice price stabilization scheme, this suggeststhat the government did not change its price ceiling when international riceprices changed, thereby lowering the correlation between the two.
WEST AFRICAN EXPERIENCE WITH THE WORLD RICE CRISIS, 2007–2008 155
Table 8.6 Correlation of international and domestic rice prices before and during the crisis
Q4/2003–Q3 2007 Q4/2007–Q2/2008
Senegal 0.32 0.83Burkina Faso 0.12 0.77Niger 0.46 �0.07Benin �0.01 0.65
ES_RC_9-8 18/8/10 20:23 Page 155

Price transmission across commodities within countries
In addition to price transmission between international and domestic importedrice prices, there are two additional questions that are important for assessingthe impact of international rice price increases in West Africa: (1) Do fluctua-tions in domestic prices of imported rice spill over into market prices for staplefood crops (such as millet)?; and (2) Do fluctuations in domestic prices ofimported rice spill over into market prices for domestically produced rice?
Transmission of price shocks across commodities could result from substi-tution in both production and consumption. One might posit, for example,that following an increase in the price of rice, consumers would substituteaway from rice towards millet. Similarly, producers might substitute awayfrom producing millet towards rice (although in practice, such substitution inproduction is highly unlikely, as the production systems for both are quitedistinct). Millet is a rainfed crop that requires limited amounts of rainfall,whereas rice is either produced in upland or lowland (swamp) areas, requiringsubstantial amounts of water. Either substitution (consumption being morelikely) would tend to transmit the increased rice price into increased milletprices. Figure 8.3 compares millet and imported rice prices for Senegal, Benin,Burkina Faso and Niger.
156 POLICY RESPONSES IN TRADITIONAL IMPORTING COUNTRIES
Figure 8.3 Millet versus imported rice prices in selected countries, October 2003–June 2008 (CFA franc/kg)
Sources: Niger: Systeme d’Informations sur le Marche Agricole (SIMA); Benin: ONASA (Office Nationale de laSecurite Alimentaire); Burkina Faso: System d’Information sur les Marches Cerealiers (SIM-C); Senegal: Ministry ofAgriculture, market surveys.
CFA
fran
c/kg
600
500
400
300
200
100
0
Oct 20
03
Aug 20
04
Jun 2
005
Apr 20
06
Feb 20
07
Dec 20
07
600
500
400
300
200
100
0
Oct 20
03
Aug 20
04
Jun 2
005
Apr 20
06
Feb 20
07
Dec 20
07
CFA
fran
c/kg
600
500
400
300
200
100
0
Oct 20
03
Aug 20
04
Jun 2
005
Apr 20
06
Feb 20
07
Dec 20
07
600
500
400
300
200
100
0
Oct 20
03
Aug 20
04
Jun 2
005
Apr 20
06
Feb 20
07
Dec 20
07
Benin
Millet
Rice
Niger
Millet
Rice
Burkina Faso
Millet
Rice
Senegal
Millet
Rice
ES_RC_9-8 18/8/10 20:23 Page 156

Figure 8.3 shows that, in general, there is not a strong correlation betweenimported rice and millet prices in these countries. Millet prices fluctuate highlyon an inter- and intra-annual basis (coinciding with the harvest), and appear tobe highly correlated across the Sahelian countries (Burkina Faso, Niger andSenegal). While each of these countries experienced drought and a milletproduction shock in 2004–2005, this only appears to have affected rice pricesin Burkina Faso and Niger, where millet is relatively more important forproducer and consumer welfare. It is notable, however, that rice prices havebeen consistently above millet prices in all four countries, with the exception of2004–2005 in Benin.
Similar to our previous analyses, we also find a structural break in thepattern of correlations between rice and millet prices in these markets beforeand during the rice price crisis. Table 8.7 illustrates the substantial increases inthe correlations of millet and rice prices in domestic markets – again with theexception of Niger – before and during the crisis. These data are retail rice andmillet prices in the capital cities, where consumers may have greater opportuni-ties to substitute across commodities. Thus, the increased correlations duringthe crisis suggest that urban consumers may have substituted towards milletwhen rice prices surged, thus driving up millet prices, as well.
Figure 8.4 addresses the question of whether fluctuations in domesticprices of imported rice spill over into market prices for domestically producedrice (comparing within the same local markets in Senegal and Benin).
Figure 8.4 suggests a greater degree of correlation in general between localand imported rice prices within countries as compared with correlationsbetween millet and imported rice. This seems plausible, as local and importedrice are much closer substitutes in consumption than imported rice and millet.Yet, here too, we find a substantial difference in these correlations before andduring the crisis, as illustrated in Table 8.8.
Comparing levels, rather than correlations, imported rice acts as a price
WEST AFRICAN EXPERIENCE WITH THE WORLD RICE CRISIS, 2007–2008 157
Table 8.8 Correlation of domestic and imported rice prices before and during the crisis
Q4/2003–Q3/2007 Q4/2007–Q2/2008
Senegal 0.62 0.98Benin 0.66 0.86
Table 8.7 Correlation of domestic millet and rice prices before and during the crisis
Q4/2003–Q3/2007 Q4/2007–Q2/2008
Senegal 0.54 0.71Burkina Faso 0.13 0.72Niger 0.66 0.52Benin �0.04 0.72
ES_RC_9-8 18/8/10 20:23 Page 157

ceiling on local rice in Niger, Senegal and Benin. This suggests that border priceinterventions on rice may be a powerful tool in shaping incentives facingdomestic rice producers in these countries, although they may not be sufficientto increase rice yields and production.
Historical trade policy responses to rice price fluctuations
In examining the policy implications of the recent surge in world rice prices, itis useful to review countries’ border price policy reactions to past fluctuationsin world prices. A new data set, recently released by the World Bank’sDistortions to Agricultural Incentives Project, includes nominal rates of assis-tance (NRAs) for rice for a broad cross-section of countries since the early1960s (World Bank, 2009). Among our focus countries, this data set includesonly Senegal. The NRA is the percentage difference between the domestic priceand the border price of a commodity. Positive NRAs indicate that governmentsare intervening to protect domestic producers of the import-competingcommodity by taxing imports; negative NRAs indicate import subsidies toprotect consumers by lower domestic prices below border prices.
Figure 8.5 illustrates the trade policy responses of governments in Senegalto historical fluctuations in the price of rice on world markets. The left-hand
158 POLICY RESPONSES IN TRADITIONAL IMPORTING COUNTRIES
0
50
100
150
200
250
300
350
400
450
500
Oct 20
03
Dec 20
03
Feb 20
04
Apr 20
04
Jun 2
004
Aug 20
04
Oct 20
04
Dec 20
04
Feb 20
05
Apr 20
05
Jun 2
005
Aug 20
05
Oct 20
05
Dec 20
05
Feb 20
06
Apr 20
06
Jun 2
006
Aug 20
06
Oct 20
06
Dec 20
06
Feb 20
07
Apr 20
07
Jun 2
007
Aug 20
07
Oct 20
07
Dec 20
07
Feb 20
08
Apr 20
08
Jun 2
008
Niger, localNiger, importedBenin, local
Benin, importedSenegal, localSenegal, imported
CFA
fran
c/kg
Figure 8.4 Local vs imported rice prices in selected countries (CFA franc/kg)
Sources: Niger: Systeme d’Informations sur le Marche Agricole (SIMA); Benin: ONASA (Office Nationale de laSecurite Alimentaire); Burkina Faso: System d’Information sur les Marches Cerealiers (SIM-C); Senegal: Ministry ofAgriculture, market surveys.
ES_RC_9-8 18/8/10 20:23 Page 158

axis scales constant world rice prices (the export price for 5 per cent brokenThai) in CFA Zone francs, and the right-hand axis scales the NRA for rice. It isclear that Senegalese governments have generally used trade policy to counter-act fluctuations in world rice prices, thus tending to stabilize domestic prices.The most striking example of this tendency occurred in response to the globalfood crisis of 1973, during which time world rice prices tripled. In response,Senegal dramatically altered its rice trade policy. In 1972, Senegal was taxingrice imports at the rate of nearly 29 per cent. In response to the 1973 pricespike, Senegal subsidized rice imports, reducing them to 60 per cent belowworld prices, clearly using trade policy as a tool to help stabilize domesticmarkets for its staple grain.
The sudden increase in the CFA-denominated world price of rice in 1994reflects primarily the 100 per cent devaluation of the CFA franc that year. Thedevaluation acted as a substitute for import tariffs, which fell simultaneously.Subsequent to 1995, the fluctuations in Senegal’s rice tariffs were substantiallyreduced relative to the previous period. This may relate to economic reforms inSenegal. Until 1995, the state’s price stabilization fund maintained a monopolyon rice imports. Subsequent to 1995, rice imports in Senegal were privatized.
Despite these historical precedents for using border price interventions tocounteract international price fluctuations, it appears that the recent upsurge ininternational rice prices was simply too great for the governments of WestAfrica’s rice-importing countries to contain. This failure reflects the new
WEST AFRICAN EXPERIENCE WITH THE WORLD RICE CRISIS, 2007–2008 159
Figure 8.5 Rice trade policy and world prices in Senegal
Source: Source: Rice prices from International Rice Research Institute; nominal rate of assistance data are fromAnderson and Valenzuela (2008)
Rea
l CFA
fran
cs/k
g400
350
300
250
200
150
100
50
0
1961
1963
1965
1967
1969
1971
1973
1975
1977
1979
1981
1983
1985
1987
1989
1991
1993
1995
1997
1999
2001
2003
2005
–1
–0.5
0
0.5
1
1.5
2
Real world rice price (left axis)Nominal rate of assistance (right axis)
NR
A fo
r ric
e
ES_RC_9-8 18/8/10 20:23 Page 159

dependence of West Africa in particular and sub-Saharan Africa more broadlyon rice imports to meet rapidly rising demand. With imports now a significantshare of total consumption, as Denning and Gajigo (2009) document, it is nolonger logistically or financially possible for most African countries to isolatethemselves from the world market. Although this dependence grows out of thecheaper rice available in the world market compared with domestic produc-tion, and is thus good for consumers, it does come with the added cost ofexposure to price fluctuations in the world market. Most of these fluctuationsmust now be passed on to domestic consumers and, with considerable lags andvariation, to domestic rice producers.
Policy responses to recent rice price increases
West African governments reacted to the rapid increase in international riceprices in a variety of ways, none of which appears to have been greatly effectivein mitigating the impact of international price increases on their domesticmarkets.12 The most common response was to eliminate pre-existing tariffsand value-added taxes on imported rice. Senegal initiated rice import subsidiesbeginning in 2008, adding to the fiscal strain caused by eliminating a signifi-cant source of government revenue. As public anger mounted in the face ofcontinued increases in rice prices (along with the prices of other commodities),governments in Guinea, Mali, Burkina Faso and Senegal reacted by attemptingto fix consumer rice prices, and by prohibiting exports (though, in practice,their ability to implement this policy was limited).
In addition to trade policies, governments across the region (Burkina Faso,Mali, Niger and Senegal) attempted to use the rice price crisis of 2008 as anopportunity to reinvigorate domestic rice production, as higher internationalprices appeared to increase the competitiveness of their domestic producers. InSenegal, for example, the government initiated the Big Agricultural Offensivefor Food and Abundance (GOANA), promising to dedicate over two-thirds ofthe programme’s $792 million budget to subsidizing the purchase of fertilizers,seeds and pesticides. GOANA’s target was to produce in the next season500,000 tons of rice – 2.5 times more than the current production. Similarly,the Malian government implemented a ‘Rice Initiative’, which provided inputsubsidies for rice. Finally, the Emergency Rice Initiative for Africa waslaunched in late 2008, providing assistance to rice-growing countries in Africain four major areas: seed; fertilizer; best-bet technologies; and post-harvest andmarketing. This initiative was launched jointly by the Africa Rice Center(WARDA), FAO, IFDC, Catholic Relief Services (CRS) and International Fundfor Agricultural Development (IFAD) (AllAfrica.com, 2008). Nevertheless,these initiatives focus primarily on increased production, rather than process-ing and marketing, which are important determinants of domestic rice prices.In addition, the rapid decline in international rice prices during late 2008 callsinto question the sustainability of these initiatives.
160 POLICY RESPONSES IN TRADITIONAL IMPORTING COUNTRIES
ES_RC_9-8 18/8/10 20:23 Page 160

Summary and conclusions
Rice consumption in West Africa has increased rapidly over the past decade,substantially outpacing the growth rate of local production. The importance ofrice in local consumption and production varies widely across countries in theregion. Coastal countries in particular, have been largely dependent on low-cost Asian exports to meet the growing gaps between production andconsumption. For those countries in which per capita rice consumption issubstantial (Senegal in particular, but also Mali and Benin), the rice crisis of2007–2008 was a severe shock, with potential consequences for both under-nutrition and poverty.
In recent decades, governments in the region tended to intervene in tradewith the goal of buffering consumers from international market price fluctua-tions. This objective presented little challenge during the long period of stableor declining international rice prices. Between 2003 and 2007, rice consumersin Senegal, Benin, Burkina Faso and Niger saw only a small share of thegradual increases in international prices. However, the dramatic surge in inter-national rice prices during 2007–2008 undermined these efforts, asgovernments in the region had neither the financial nor the physical capacity toprovide sufficient quantities of rice to consumers at pre-crisis prices.
Governments across West Africa responded to the crisis, first by reducingor eliminating rice import tariffs. Several countries also responded by prohibit-ing cereals exports. Though costly to the governments, these efforts wereinsufficient to buffer domestic consumers from the increase in internationalprices. Senegal went further, subsidizing rice consumption in 2008. In addition,Senegal and other countries announced plans to reinvigorate domestic riceproduction in the face of high prices. While these initiatives have taken differ-ent forms in different countries, the steep decline in international rice prices inlate 2008 calls into question the sustainability of these efforts, however wellintentioned by the governments.
Notes1 Senegal’s response to the crisis, dubbed the Big Agricultural Offensive for Food and
Abundance (GOANA), promised to dedicate over two-thirds of the programme’s$792 million budget to subsidizing the purchase of fertilizers, seeds and pesticides.Similarly, the Malian government implemented a ‘Rice Initiative’, which providedinput subsidies for rice.
2 This section draws heavily on WARDA (2008).3 These countries, collectively, account for approximately 10 per cent of West
Africa’s total rice production (excluding Nigeria) in 2001–2005. The two othercountries with significant rice production and consumption are Mali and Nigeria.
4 The self-sufficiency ratio is defined here as the share of locally produced rice intotal rice supply.
5 This series of studies is summarized in Wodon et al (2008).6 This section draws on Dawe (2008) for its methodology.
WEST AFRICAN EXPERIENCE WITH THE WORLD RICE CRISIS, 2007–2008 161
ES_RC_9-8 18/8/10 20:23 Page 161

7 In fact, this depreciation is one cause of the recent high commodity prices.8 These prices are either the domestic price of imported rice or the price of local rice
in the market nearest to the urban centre. They are not national averages.9 As members of UEMOA (West African Economic and Monetary Union), these
countries share a common external tariff, although in practice the tariff for ricevaries across countries.
10 The Baltic Dry Goods Index is a global index of freight costs.11 This is consistent with the conclusion reached by Inter-réseaux Développement
Rural (2008).12 This discussion is based on reporting by analysts from Oxfam and Fewsnet in Inter-
réseaux Développement Rural (2008).
ReferencesAllAfrica.com (2008) ‘Emergency rice initiative launched to help countries severely hit
by soaring prices’, http://allafrica.com/stories/200806180893.htmlAnderson, K., and Valenzuela, E. (2008) Estimates of Distortions to Agricultural
Incentives, 1955 to 2007, core database at www.worldbank.org/agdistortions.Dawe, D. (2008) ‘Have recent increases in international cereal prices been transmitted
to domestic economies? The experience in seven large Asian countries’, Agriculturaland Development Economics Division (ESA) Working Paper 08-03, FAO, Rome
Denning, G. and Gajigo, O. (2009) ‘Rice in Africa: Will imports continue to grow?’,mimeo prepared for a Workshop on the World Rice Crisis, Chiang Mai, February
FAO (Food and Agriculture Organization of the United Nations) (2009) ‘FAOStat’,online statistical database, http://faostat.fao.org/default.aspx
Imai, K., Gaiha, R. and Thapa, G. (2008) ‘Transmission of world commodity prices todomestic commodity prices in India and China’, (June) School of Social Sciences(Economics), University of Manchester, Manchester
IMF (International Monetary Fund) (2009) International Financial Statistics, variousissues, IMF, Washington, DC, www.imf.org/external/data.htm
Inter-réseaux Développement Rural (2008) Inter-réseaux Développement Rural,June–August, no 42, www.inter-reseaux.org/rubrique.php3?id_rubrique=8/
Pearson, S. R., Stryker, J. D. and Humphreys, C. P. (1981) Rice in West Africa: Policyand Economics, Stanford University Press, Stanford, CA
UNOCHA (United Nations Office for the Coordination of Humanitarian Affairs)(2008a) ‘Burkina Faso: Food riots shut down main towns’,www.irinnews.org/Report.aspx?ReportId=76905
UNOCHA (2008b) ‘Senegal: Heavy handed response to food protesters’,www.irinnews.org/report.aspx?ReportID=77539
UNOCHA (2008c) ‘Liberia: Government links rising food prices to conflict risk’,www.irinnews.org/Report.aspx?ReportId=77932
WARDA (West African Rice Development Authority) (2008) 2007 Rice Trends, WestAfrica Rice Development Authority, Cotonou, Benin
Wodon, Q., Tsimpo, C., Backiny-Yetna, P. , Joseph, G., Adoho, F. and Coulombe, H.(2008) Potential Impact of Higher Food Prices on Poverty: Summary Estimates fora Dozen West and Central African Countries, World Bank Policy Research WorkingPaper No 4745, October, World Bank, Washington, DC
World Bank (2009) ‘Distortions to Agricultural Incentives dataset’,www.worldbank.org/agdistortions
162 POLICY RESPONSES IN TRADITIONAL IMPORTING COUNTRIES
ES_RC_9-8 18/8/10 20:23 Page 162

9
Rice in Africa: Will ImportsContinue to Grow?
Ousman Gajigo and Glenn Denning
Introduction
Rice is becoming an important food staple in Africa. Over the past decades, itsconsumption has grown rapidly not only in the Western African region whereit has long been a traditional staple food, but also in other sub-regions. Thegrowth rate of production has not kept up with consumption. Paddy riceproduction went from 3.7 million metric tons in 1965 to approximately 17million tons in 2007 (around 11 million tons in equivalent milled rice), follow-ing an average annual growth rate of 3.8 per cent (http://faostat.fao.org,2009). Consumption, by contrast, went from 2.5 million tons in 1965 to 15million tons milled rice in 2006, following an annual growth rate of 4.8 percent. This growth in consumption has been driven mainly by populationgrowth, increasing urbanization rates and rising incomes. As a consequence ofthese differences in levels and growth of production and consumption, theregion has become a major rice importer in the world market. In 2006, sub-Saharan Africa imported 8 million tons and accounted for about one-third ofglobal rice imports.
The region’s low production and relatively high imports greatly expose itto fluctuations in the global food market. This was brought into sharp focusduring the recent global food crisis. Virtually all countries in the region regis-tered precipitous increases in food prices in general and rice in particular. For
ES_RC_9-8 18/8/10 20:23 Page 163

example in Kigali, rice prices increased by about 43 per cent and in Nigeriancities by about 40 per cent. Several countries in Western Africa even experi-enced some social unrest in urban areas.
The food crisis has forced a re-examination of investment plans andpolicies by governments, donors and other stakeholders. The trend for riceimport growth in the region will depend largely on how production changes incoming decades. Specifically, investments made and policies adopted byindividual countries will be the major determinants of whether the region willcontinue to be acutely affected by price surges in exporting countries (mainly inAsia) in the future.
In this chapter we examine the factors that are most likely to affect thefuture pattern of rice imports to sub-Saharan Africa. The next section providesan overview of the trends in rice production and yield in all sub-regions of sub-Saharan Africa. We then provide information on consumption and its majordeterminants. This section leads to the analyses of sub-regional imports andtheir trends. Given the major significance of the region in the global rice trade,we discuss some of the policy responses to the recent food crisis. Our lastsection provides some forecast scenarios on rice imports, given regional trendsin consumption and production.
Production
There was a fourfold increase in paddy rice production in sub-Saharan Africa1
between 1961 and 2007 from approximately 3.14 million tons to 17 milliontons. This represents an average annual growth rate of about 3.7 per cent forsub-Saharan Africa over this time period (4.7 per cent for Western Africa, 2.7per cent for Eastern Africa, 4.5 per cent for Southern Africa and 3.6 per centfor Central Africa).2
While the overall regional growth rate is impressive relative to Asia (theaverage annual growth rates of paddy rice production of East and SoutheastAsia between 1962 and 2003 are 2.2 per cent and 3.1 per cent respectively), itstarted from a low level relative to other regions.3 Rice production in the entirecontinent never exceeded that of either Thailand or Viet Nam in any given yearover this time period. As a share of total world output, the sub-Saharan Africapaddy rice production went from 1.5 per cent in the 1961 to 2.6 per cent in2007.
Within the continent, there are significant sub-regional variations both inlevel and growth rates of production (see Figure 9.1). Rice production byCentral and Southern Africa is minor compared to Western and Eastern Africa.These latter sub-regions had comparable levels of production in the 1960s and1970s but production in the Western sub-region began to expand at a farhigher rate than all other sub-regions beginning in the 1980s.
The top rice producers in Western Africa from 2000–2007 were Nigeria,Guinea, Mali, Côte d’Ivoire and Sierra Leone (see Table 9.1). In 2007, thesecountries accounted for approximately 88 per cent of the rice production in
164 POLICY RESPONSES IN TRADITIONAL IMPORTING COUNTRIES
ES_RC_9-8 18/8/10 20:23 Page 164

Western Africa amounting to a total of 8.4 million tons of paddy rice. Withinthis group of countries, Nigeria experienced the fastest average annual growthwhile Sierra Leone showed the lowest.
Madagascar is the most important rice producer in Eastern Africa,accounting for about 70 per cent of the sub-region’s production in 2007 (3.6million tons). This country showed an average annual growth rate of produc-tion of about 2 per cent between 1962 and 2007.
In Central Africa, the Democratic Republic of Congo is the largest riceproducer. The country produced 315,000 tons in 2007, though this is a signifi-cant drop in production from the 1990s. Between 1962 and 2007, the countryhad an average annual growth rate of 4.5 per cent.
Mozambique is by far the largest producer in Southern Africa. In 2007, itproduced about 196,000 tons, representing about 86 per cent of the sub-region’s total rice production. While experiencing wild swings in growth rates,mainly as a result of civil conflict, the average annual growth was 5.4 per centbetween 1962 and 2007.
Farming in the region is largely rainfed. This fact implies a majorconstraint on the level of production of all cereal crops since rainfall is erraticand unpredictable. Drought occurrence in the region is frequent. Therefore, thepresence of irrigation technology is a significant factor in explaining variationin rice production in the region. Most recent estimates show that only 2 percent of agricultural land area in sub-Saharan Africa is equipped for irrigation(http://faostat.fao.org, 2009),4 which corresponds to a little over 4 per cent of
RICE IN AFRICA: WILL IMPORTS CONTINUE TO GROW? 165
Figure 9.1 Paddy rice production in sub-Saharan Africa by sub-region
Source: http://faostat.fao.org, 2009
Mill
ion
MT
10
8
6
4
2
0
1961
1963
1965
1967
1969
1971
1973
1975
1977
1979
1981
1983
1985
1987
1989
1991
1993
1995
1997
1999
2001
2003
2005
2007
Southern AfricaCentral AfricaEastern AfricaWestern Africa
ES_RC_9-8 18/8/10 20:23 Page 165

166 POLICY RESPONSES IN TRADITIONAL IMPORTING COUNTRIES
Table 9.1 Rice producers in sub-Saharan Africa
Production Average Area (ha) Yield Average yield(metric tons) annual yield (ton/ha) (ton/ha)
2007 growth of 2007 2007 2000–2007production
1962–2007 (%)
WESTERN AFRICA 9,525,004 4.72 5,706,924 1.67 1.58Nigeria 4,677,400 11.40 3,000,000 1.56 1.43Guinea 1,401,592 4.42 788,771 1.78 1.74Mali 955,300 7.10 377,000 2.53 2.17Côte d’Ivoire 677,000 4.05 345,000 1.96 1.93Sierra Leone 650,000 3.44 630,000 1.03 1.03Ghana 242,000 7.53 120,000 2.02 2.12Senegal 215,212 10.18 79,718 2.70 2.49Liberia 154,800 3.10 120,000 1.29 1.07Burkina Faso 123,000 5.74 50,000 2.46 1.98Guinea-Bissau 88,700 3.63 65,000 1.36 1.40Benin 78,800 13.76 27,000 2.92 2.45Mauritania 77,000 16.77 18,000 4.28 4.30Niger 70,000 6.87 22,435 3.12 3.25Gambia 40,000 5.21 19,000 2.11 1.93Togo 74,200 6.51 45,000 1.65 2.09
EASTERN AFRICA 5,237,500 2.72 2,162,300 2.42 1.96Madagascar 3,596,000 2.07 1,300,000 2.77 2.41Tanzania 1,240,000 9.66 665,000 1.86 1.95Uganda 162,000 15.84 119,000 1.36 1.45Burundi 69,500 11.94 21,000 3.31 3.26Kenya 66,000 4.24 18,500 3.57 3.65Rwanda 44,000 71.20 10,000 4.40 3.73Sudan 30,000 27.55 7600 3.95 2.95Comoros 17,000 1.58 14,000 1.21 1.21Ethiopia 13,000 2.48 7200 1.81 1.82
CENTRAL AFRICA 537,700 3.58 568,900 0.95 0.94Congo, D.R. 315,000 4.48 418,000 0.75 0.75Chad 129,000 17.13 80,000 1.61 1.28Cameroon 49,000 11.57 40,000 1.23 1.68Central African Republic 33,000 8.70 15,000 2.20 1.96Angola 9300 7.58 13,500 0.69 1.05Congo 1300 �0.34 1900 0.68 0.68Gabon 1100 8.34 500 2.20 2.03
SOUTHERN AFRICA 309,787 4.48 272,200 1.14 1.02Mozambique 196,000 5.44 204,000 0.96 0.91Malawi 91,500 12.93 52,500 1.74 1.57Zambia 18,317 21.01 14,000 1.31 1.29South Africa 3200 0.78 1400 2.29 2.29Zimbabwe 600 13.71 250 2.40 2.36Swaziland 170 �1.29 50 3.40 3.40
Source: http://faostat.fao.org, 2009
ES_RC_9-8 18/8/10 20:23 Page 166

arable land. Since rice is especially dependent on water, irrigation not onlyallows countries to expand the area planted but also the yield per hectare.
We carried out a simple regression to further estimate the impact of irriga-tion technology on rice output and yield in sub-Saharan Africa. The panel dataregression output is presented in Table 9.2. Controlling for rice area harvestedand per capita income, both total rice paddy production (in metric tons) andyield (tons/ha) are significantly correlated with the proportion of agriculturalland equipped for irrigation. For example, a doubling of average proportion ofthe area irrigated (that is, going from 2.5 per cent to 5 per cent) can increasepaddy rice production by 54,593 tons to 86,724 tons and yields from 1 to 2.4tons/ha, holding area harvested and income per capita constant.
Rice yields have not increased greatly across the region over the past fourdecades (see Figure 9.2). Our analysis shows that 70 per cent of productiongrowth came from expansion in area harvested, while the rest came from yieldgrowth. Western Africa showed the highest rate of annual increase in areaharvested (3.5 per cent) and Eastern Africa the lowest (2.1 per cent) between1962 and 2007. The average yield (tons/ha) in the region between 2000 and2007 is 1.67 (1.56 for Western Africa, 0.92 for Central Africa, 2.25 forEastern Africa and 1.07 for Southern Africa) (see Figure 9.3). In contrast,average rice yields between 2000 and 2007 for Asia, China, India, Myanmar,Pakistan, Thailand and Viet Nam are 4.06, 6.23, 3.03, 3.61, 3.04, 3.74 and4.66 respectively.
The low rice yield is a specific example of generally unimpressive cerealproductivity in the region. The introduction of high-yielding varieties and theapplication of fertilizers in some Asian countries resulted in high increases in
RICE IN AFRICA: WILL IMPORTS CONTINUE TO GROW? 167
Table 9.2 Regression results with paddy rice production (columns 1 and 2)and rice yield (columns 3 and 4) as dependent variables
Fixed effect Random effect Fixed effect Random effect1 2 3 4
Proportion of agricultural 3468993.00*** 2183738.00*** 95.52*** 39.79***
land irrigated (598690.20) (458770.40) (12.46) (5.92)Area harvested for rice 1.47*** 1.49*** �0.0000002 �0.0000001
(0.02) (0.01) (0.0000002) (0.0000002)Real GDP per capita �8.49*** �5.85** 0.0001** 0.0001***
(2.63) (2.40) (0.00003) (0.00003)Constant �2983.40 �2453.64 0.97*** 1.33***
(6073.11) (16210.57) (0.11) (0.17)R2 (within) 0.87 0.87 0.05 0.05R2 (between) 0.93 0.95 0.37 0.39R2 (overall) 0.92 0.93 0.17 0.18Observations 1428 1428 1395 1395Countries 36 36 36 36
Note: *significant at 10 per cent, **significant at 5 per cent, *** significant at 1 per cent. Standard errors are inparentheses. Only sub-Saharan African countries are included and the data covers the period 1961 to 2005.Production is in tons; yield is in tons per hectare.Source: Raw GDP data from Penn World Table (2008). All other data from FAO (2009)
ES_RC_9-8 18/8/10 20:23 Page 167

168 POLICY RESPONSES IN TRADITIONAL IMPORTING COUNTRIES
Figure 9.2 Paddy rice production, area harvested and yield in sub-Saharan Africa
Source: http://faostat.fao.org, 2009
20
15
10
5
0
1961
1963
1965
1967
1969
1971
1973
1975
1977
1979
1981
1983
1985
1987
1989
1991
1993
1995
1997
1999
2001
2003
2005
2007
Yield (MT/Ha)area harvested (Ha)production (MT)
Are
a (m
illio
n ha
) and
pro
duct
ion
(mill
ion
MT)
2.0
1.5
1.0
0.5
0
Yie
ld (M
T/ha
)
Figure 9.3 Paddy rice yield (metric tons/ha) by sub-region
Source: http://faostat.fao.org, 2009
3.0
2.5
2.0
1.5
1.0
0.5
0
1961
1963
1965
1967
1969
1971
1973
1975
1977
1979
1981
1983
1985
1987
1989
1991
1993
1995
1997
1999
2001
2003
2005
2007
Southern AfricaEastern AfricaCentral AfricaWestern Africa
MT/
ha
ES_RC_9-8 18/8/10 20:23 Page 168

yield in cereals such as rice, wheat and maize. Total fertilizer consumption(N+P2O5+K20) in the region in 2006 was 1 million tons compared to 67million tons in Asia (FAO, 2009).
While new varieties of rice (NERICA) that are considered to be adapted tolocal conditions have been introduced by WARDA, the distribution of this newvariety only started in 1996 in Guinea and Côte d’Ivoire (WARDA, 2006). In asurvey of 1,500 farmers in Côte d’Ivoire, Diagne (2006) found that only 4 percent of the sample adopted NERICA varieties. Among those exposed to thenew variety, the adoption rate was 27 per cent. Recently, there has been a pushto accelerate the dissemination of NERICA varieties in the region. The AfricaRice Initiative (ARI) was created in 2001 within WARDA to serve as thechannel for NERICA promotion. The pilot countries for this initiative areBenin, Ghana, The Gambia, Guinea, Mali, Nigeria and Sierra Leone.
Consumption
Much more striking than the growth in production is the growth in riceconsumption in sub-Saharan Africa. As a result, rice production levels in theregion are increasingly lagging behind consumption levels. As in production,there is a lot of variation within the sub-region in terms of both the level ofconsumption and its growth rates.
Western Africa has the region’s highest level of consumption (see Figure9.4). The five largest rice-consuming countries (in absolute terms) in the sub-region are Nigeria, Côte d’Ivoire, Senegal, Guinea and Mali and combined theyrepresent 77 per cent of the sub-region’s total consumption in 2003 of 8.5million tons (milled rice). The average annual growth rate of consumptionlevels was 5.6 per cent between 1962 and 2003 in the whole sub-region.Western Africa also has the highest per capita rice consumption: 44kg in 2003.The top five rice-consuming countries in the region from 2000–2003 (see Table9.3) were Guinea Bissau (86kg/person), Sierra Leone (83kg/person), Guinea(76kg/person), Senegal (74kg/person), and Côte d’Ivoire (60kg/person). Riceconsumption is not high in all of Western Africa, however, and rice caloriesupply as a percentage of total calorie supply is highly variable in the sub-region. Between 2000 and 2005, the top five countries in this category wereSierra Leone (44 per cent), Senegal (32 per cent), Guinea Bissau (31 per cent),Guinea (28 per cent) and Côte d’Ivoire (27 per cent). During this time period,Niger had the lowest percentage at 2 per cent.
Eastern Africa is second to Western Africa in terms of consumption levels.In this sub-region, Madagascar, the largest rice producer, is also the largest riceconsumer, accounting for about 61 per cent of the sub-region’s consumption. Italso has the highest per capita rice consumption in sub-Saharan Africa, withthe average person consuming 97kg per year (see Table 9.3), comparable to percapita rice consumption in Asian countries such as the Philippines andThailand, where it is slightly over 100kg per person per year. The above figurefor Madagascar fell from per capita consumption of over 120kg/year in the
RICE IN AFRICA: WILL IMPORTS CONTINUE TO GROW? 169
ES_RC_9-8 18/8/10 20:23 Page 169

1970s and 1980s. The sub-region’s average growth rate of consumption was3.4 per cent between 1962 and 2003 (see Table 9.4).
Central and Southern Africa had almost identical levels of overall riceconsumption between the 1960s and 1990s. While the production level ofSouthern Africa overtook that of Central Africa in the early 1990s, the percapita consumption of the latter is now higher, driven by large consumptiongrowth in Cameroon and Gabon. The largest per capita rice-consumingcountries in Southern Africa are the island countries of Mauritius (59kg perperson in 2003) and Seychelles (33kg per person in 2003). The average annualgrowth rates of consumption for Central and Southern Africa between 1962and 2003 were 5.8 per cent and 5.3 per cent respectively.
While most of the rice grown in the region is the Asian type (Oryza sativa)and increasingly the new NERICA varieties,5 Western Africa also has a nativerice species (Oryza glaberrima). Archaeological and linguistic evidence point toits domestication around 3000 years ago (Porteres, 1970), somewhere in thearea between the modern-day Mali, the Senegambia6 region and the GuineaCoast. The Asian type was introduced by Portuguese traders around the 16thcentury (Linares, 2002). This was around the same time that groundnuts wereintroduced (Brooks, 1975). This latter development did not dramatically alterthe quantity of rice consumption at the time. Its consumption changed whenindustrialization in Europe created demand for groundnuts as a raw material
170 POLICY RESPONSES IN TRADITIONAL IMPORTING COUNTRIES
Table 9.3 Countries with highest per capita rice consumption
Per capita consumption (kg/year)Countries Average 2000–2003
Madagascar 97Guinea-Bissau 86Sierra Leone 83Guinea 76Senegal 74Côte d’Ivoire 64Mauritius 61Comoros 57Liberia 54Cape Verde 50
Source: FAO (2009)
Table 9.4 Average consumption growth rates by sub-region (%)
1962– 1970– 1980– 1990– 2000– 1962–1970 1980 1990 2000 2003 2003
Central Africa 9.1 5.9 6.2 1.5 7.8 5.8Eastern Africa 3.2 4.2 3.7 3.1 4.8 3.4Southern Africa 2.4 5.5 3.7 5.0 10.7 5.3Western Africa 6.4 8.2 4.7 3.7 4.5 5.6Sub-Saharan Africa 4.9 6.5 4.3 3.4 5.2 4.8
Source: http://faostat.fao.org, 2009
ES_RC_9-8 18/8/10 20:23 Page 170

in the manufacturing of soap in the 19th century. While introduced by thePortuguese, France was initially the biggest recipient of groundnut exportsfrom the area including territories that were colonized by Britain. Unlike manysoap manufacturers in Britain that relied primarily on palm oil (mainly fromNigeria) to make soap, the French manufacturers depended more on ground-nuts (mainly from the Senegambia area). Groundnut became the mostimportant cash crop in the sub-region, especially among the Sahelian countriesas its demand grew (Burkhill, 1901; Weil, 1984).7 The widespread adoption ofgroundnut came at the expense of local cereals such as millet and sorghum(Lançon and Benz, 2007). Historical accounts on the production of groundnutshow a steep increase in the middle of the 19th century. For example, ground-nut (with shells) exports from The Gambia went from 47 metric tons in 1835to 11,095 tons in 1851 (Brooks, 1975). Since millet and sorghum were notwidely traded internationally, there are no available records of their productionand trade going that far back. However, given the rapid increase over such atime period in production in groundnut in response to demand, it seems likelythat agricultural land was reallocated from other crops (principally millet andsorghum) rather than expansion into new farmlands. To ensure that foodsecurity was not compromised, the French facilitated rice imports from theircolonies in Southeast Asia. The importance of groundnuts as a cash crop andthe continued increase in rice consumption continues to this day in many WestAfrican countries. For example, Senegal today is one of the largest riceconsumers and groundnut exporters in the region.
RICE IN AFRICA: WILL IMPORTS CONTINUE TO GROW? 171
Figure 9.4 Average per capita milled rice consumption, weighted by population
Source: http://faostat.fao.org, 2009
kg/p
erso
n/yr
35
30
25
20
15
10
5
0
Southern Africa
Eastern AfricaCentral Africa
Western Africa
1965 1975 1985 1995 2000 2003
ES_RC_9-8 18/8/10 20:23 Page 171

-
co
C -r6 20 40
i
do% of Population Living in Urban Areas
kernel = epanechnikov, bandwidth r- 0.0506
1965
2000
vs.
14%'s
so
do
Many other factors became important starting around the period ofindependence (from the mid-1960s) that increasingly determined the continuedgrowth in consumption of rice in sub-Saharan Africa. Among them, urbaniza-tion has long been recognized as the key variable in driving rice consumption(Leon and Curonisy, 1981; Senauer et al, 1986). Consumption preferences shifttowards rice and away from other local grains as households move to urbanareas. As Figure 9.5 shows, the urbanization rates across the sub-SaharanAfrican region are increasing with an increasing number of countries exceeding50 per cent urbanization rate. These urbanization rates are comparable to Asiathough much less than the Americas and Europe (see Table 9.5). The primaryreason usually advanced for the shift towards rice in urban areas is that relativeto other locally grown cereals, rice sold to final consumers is easier to prepare.For example, households purchase rice that is already milled while a lot ofmillet sold in the West African sub-region is not milled8 (even when milled,millet preparation is still more time-consuming than rice). Therefore, as house-holds move away from the farm into cities and engage in non-agriculturalactivities, the higher opportunity cost of time biases consumption towards lesstime-consuming cereals such as rice and wheat. Evidence across several Africancountries shows strong differences between rural and urban areas in riceconsumption. Reardon (1993) shows that the difference in urban versus ruralrice consumption (rice share of cereal consumed) is 41 per cent versus 1–6 percent in Burkina Faso, 57 per cent versus 4–8 per cent in Mali and 55 per centversus 1–17 per cent in Niger.
172 POLICY RESPONSES IN TRADITIONAL IMPORTING COUNTRIES
Figure 9.5 Distribution of urbanization rates in sub-Saharan Africa in 1965 and 2000
Note: The density on the y axis can be interpreted as the frequency.Source: National level data from FAOStat
ES_RC_9-8 18/8/10 20:23 Page 172

We present some graphical evidence that illustrates the relationshipbetween urbanization and rice consumption. In Figure 9.6, we can observe thepositive correlation between the growth rates of consumption and the urbanpopulation between 1962 and 2003. The positive effect of urbanization on riceconsumption also shows up in a regression of growth in per capita consump-tion on growth in the urban population (analysis not shown).
To further analyse the relationship between urbanization and rice demand,we run a simple panel data regression that allows us to control for other impor-tant variables such as national income since an increasing portion of riceconsumed is imported. The regression uses panel data covering all sub-SaharanAfrican countries from 1961 to 2003. Our dependent variable is per capitaconsumption (kg/person/year). In this parsimonious regression, we also
RICE IN AFRICA: WILL IMPORTS CONTINUE TO GROW? 173
Table 9.5 Urbanization rates in other regions (%)
1965 1975 1985 1995 2005
Africa 21 25 30 35 40Americas 62 67 71 75 79Asia 21 23 29 34 40Europe 59 65 68 72 73
Figure 9.6 Total consumption growth and urbanization
Note: Excluded countries are Ethiopia, Eritrea and Namibia for lack of data. The equation for the trend line is y = �2.55 + 2.32x and the R2 is 0.16.Source: http://faostat.fao.org, 2009
Angola
BotswanaBenin
Cape Verde
Congo
Guinea
KenyaMalawi
MauritaniaMozambique
Nigeria
Sao Tome and Principe
Zambia
Sudan
40
30
20
10
0
Tanzania, United Republic of
Uganda
Zimbabwe
Average annual percentage growth in urban population (1962–2003)
Aver
age
annu
al p
erce
ntag
e gr
owth
in ri
ce c
onsu
mpt
ion
(196
2–20
03)
2 4 6 8 10
Rwanda
Swaziland
Burundi
Seychelles
Lesotho
Gabon
Togo
Djibouti
Cameroon
MaliZaire
Central African Republic
Ghana
Comoros
Nigeria
MUS
STPSenegalGOD GNB
MadagascarEMB
CIVTCDRFA
Trend line
ES_RC_9-8 18/8/10 20:23 Page 173

included total population. The results are presented in Table 9.6 (both fixedand random effect estimates). Both estimations show a statistically strong andsignificant relationship between urbanization and consumption. Specifically, aone percentage point increase in urbanization rate is associated with anincrease of per capita rice consumption by 0.43kg per person per year holdingother variables constant. Therefore, a 10 percentage point increase (forexample, going from 40 per cent to 50 per cent urbanization rate) in urbaniza-tion rate increases per capita consumption by 4.3kg per year. The effect of percapita income levels is not statistically significant. The size of the country, interms of total population, also does not have strong effect on per capita riceconsumption once we control for urbanization and per capita GDP.
Not surprisingly, the effect of urbanization varies significantly across sub-regions. When the regression (fixed effect estimation) is done by sub-region, wefind that the a percentage point increase in urbanization increases per capitaconsumption by 0.42kg, 0.05kg, 0.17kg and 0.50kg in Central, Eastern,Southern and Western sub-regions respectively.
In addition to urbanization, income is likely to play a role in the increasedconsumption of rice. In most of the region, crops such as millet, sorghum,maize and cassava provide the bulk of the calorie supply among rural subsis-tence farmers. But as incomes increase from surplus production, thesehouseholds tend to diversify their diets by purchasing imported rice (Ross,1982).
174 POLICY RESPONSES IN TRADITIONAL IMPORTING COUNTRIES
Table 9.6 Regression results (sub-Saharan African countries) for thedeterminants of per capita rice consumption
Fixed effect Random effect1 2
Total population 0.0001* 0.00001(0.00003) (0.00004)
Per cent urban 0.43*** 0.43**
(2.80) (2.78)Real GDP per capita �0.0001 �0.0001
(0.0002) (0.0002)Constant 13.04*** 12.54***
(0.78) (4.67)R2 (within) 0.17 0.17R2 (between) 0.02 0.02R2 (overall) 0.03 0.03Observations 1699 1699Countries 43 43
Note: Ethiopia, Eritrea and Somalia are not included in the analysis because of missing data points for many years.*significant at 10 per cent, **significant at 5 per cent, ***significant at 1 per cent. The dependent variable is percapita rice consumption (kg/person/year). Standard errors are in parentheses.Source: http://faostat.fao.org; Penn World Table, 2008; http://esa.un.org/unpp/index.asp
ES_RC_9-8 18/8/10 20:23 Page 174

Imports
When local production falls short of consumption, imports must fill the gap.The preceding discussion on consumption and production and their growingdivergent trends gives an indication of the importance of imports (see Figure9.7). Total rice imports in sub-Saharan Africa went from about half a milliontons in 1961 to 8 million tons in 2006 (see Figure 9.8). This represented anaverage annual growth rate of about 8 per cent. Sub-Saharan Africa’s role inthe international rice market is out of proportion to its relative size in globaltrade in general. The region’s share of world imports increased from 9 per centin 1961 to 31 per cent in 2006.
Sub-regional patterns in imports are similar to that of consumption.Western Africa is by far the largest rice importer accounting for 60 per cent ofsub-Saharan Africa’s imports in 2005 (70 per cent in 2001). The leadingimporters in this sub-region (in order) are Nigeria, Senegal, Côte d’Ivoire andGhana (see Table 9.7). Together, these countries accounted for about 60 percent (3.1 million tons) of the sub-region’s total imports (5.2 million tons). Theaverage annual growth rate of imports in the sub-region was 10 per cent from1962 to 2005, though this growth rate has fallen to 5 per cent since 1980.
South Africa is the biggest importer in the Southern Africa sub-region witha little over 0.8 million tons of imports in 2006, which represented about 59per cent of the area’s total imports that year. Other significant importers in the
RICE IN AFRICA: WILL IMPORTS CONTINUE TO GROW? 175
Figure 9.7 Production and consumption of milled rice in sub-Saharan Africa, 1962–2005
Note: To get equivalent milled rice, we used conversion factor of 0.67 from paddy to milled rice. Source: http://faostat.fao.org, 2009
Mill
ion
MT
14
12
10
8
6
4
2
0
1961
1963
1965
1967
1969
1971
1973
1975
1977
1979
1981
1983
1985
1987
1989
1991
1993
1995
1997
1999
2001
2003
Consumption (MT)Production (MT)
ES_RC_9-8 18/8/10 20:23 Page 175

sub-region are Mozambique and Mauritius. The average annual growth rate ofimports in the sub-region between 1962 and 2006 is 5.7 per cent, which is onlyslightly below that of the consumption growth rate.
The two low-importing sub-regions are Central and Eastern Africa. Thebiggest importer in Central Africa by far is Cameroon, accounting for about 75per cent of the sub-region’s rice imports. The two big importers in EasternAfrica are Madagascar and Kenya. Between 2000 and 2006, these twocountries recorded almost identical volumes in rice imports, representing 53per cent of imports in the sub-region in 2006. All sub-regions show significantupward trajectories in imports, suggesting continued growth in the future.
176 POLICY RESPONSES IN TRADITIONAL IMPORTING COUNTRIES
Figure 9.8 Rice imports in sub-Saharan Africa
Source: http://faostat.fao.org, 2009
Table 9.7 Imports (milled rice terms in metric tons)
Countries Average 2000–2005
Nigeria 1,329,836Senegal 763,274South Africa 702,741Côte d’Ivoire 677,125Ghana 347,678Cameroon 285,858Kenya 250,309Guinea 220,102Madagascar 193,417Burkina Faso 182,408
Source: http://faostat.fao.org, 2009
MT
6
5
4
3
2
1
0
1961
1963
1965
1967
1969
1971
1973
1975
1977
1979
1981
1983
1985
1987
1989
1991
1993
1995
1997
1999
2001
2003
2005
Western Africa rice importsSouthern Africa rice importsEastern Africa rice importsCentral Africa rice imports
ES_RC_9-8 18/8/10 20:23 Page 176

Figure 9.9 shows a clear picture of the time path of production andconsumption in the different sub-regions. Between 1961 and the mid-1970s,imports in Western Africa were low as consumption and production werealmost equal. And from the late 1970s to the mid-1990s, imports while high,did not show high growth rates. The proximate reason for the high growth rateof imports over the past 15 years was the result of consumption greatlyoutstripping production during this time period. The situation in CentralAfrica is quite similar to that of the Western sub-region, except that the volumein the former is just a fraction of the latter. Southern Africa has always been animporter over this time period, as Figure 9.9 shows, but the sub-region alsobegan to experience some growth in imports beginning in the mid-1970s. Thesub-region that has a different experience is Eastern Africa. For the most of theperiod under consideration, the area’s production has exceeded consumption.The main reason behind this is the high level of production by Madagascar andthe relatively low per capita rice consumption of other countries. Madagascaris also the only country in this sub-region with the capacity to export anysignificant amount of rice and the main destination of its exports are the neigh-bouring island countries of Comoros, Mauritius and Seychelles. However, eventhis sub-region is beginning to see imports, and consumption has overtakenproduction.
RICE IN AFRICA: WILL IMPORTS CONTINUE TO GROW? 177
Figure 9.9 Production and consumption of milled rice by sub-region
Note: To get equivalent milled rice, we used conversion factor of 0.67 from paddy to milled rice.Source: http://faostat.fao.org, 2009
MT
(mill
ion)
10
8
6
4
2
0
3.0
2.5
2.0
1.5
1.0
0.5
0
1.4
1.2
1.0
0.8
0.6
0.4
0.2
0
0.90.80.70.60.50.40.30.20.1
0
Western Africa
Production
Consumption
Eastern Africa
Production
Consumption
Southern Africa
Production
Consumption
Central Africa
Production
Consumption
1961
1965
1969
1973
1977
1981
1985
1989
1993
1997
2001
1961
1965
1969
1973
1977
1981
1985
1989
1993
1997
2001
1961
1965
1969
1973
1977
1981
1985
1989
1993
1997
2001
1961
1965
1969
1973
1977
1981
1985
1989
1993
1997
2001
MT
(mill
ion)
ES_RC_9-8 18/8/10 20:23 Page 177

Determinants of rice imports
It is highly likely that the upward trend in imports will continue, as consump-tion will continue to rise with population growth and urbanization. Otherfactors will also contribute, including the persistence of habit formation thatmakes the demand for rice relatively price-inelastic, the lower quality of locallygrown rice compared to imported rice, non-competitiveness of other locallygrown cereals, poor infrastructure and exchange rate polices. While per capitarice consumption has started to decline in some Asian countries (Ito et al,1989), that does not appear to be happening in Africa, nor is it likely to in thefuture, as per capita incomes in Africa are still well below those at which percapita consumption started to decline in countries such as Japan and Republicof Korea.
Lack of responsiveness to price
The lack of responsiveness to price in the region was demonstrated when theCFA franc was devalued from 50 to 100 CFA francs per French franc in 1994.With the exception of Guinea, all former French colonies in Western andCentral Africa use the CFA currency,9 which is currently pegged to the euro (itused to be pegged to the French franc). Some of the biggest rice-consumingcountries (Senegal and Côte d’Ivoire, for example) in the region are CFAmember countries. A massive devaluation of the currency means that the priceof imported rice is substantially increased. One would therefore expect that theimportation of rice would be significantly reduced in the relevant countrieseither due to reduced demand because of a shift to locally grown cereals and/orhigher local rice production. However none of the CFA countries experiencedany significant drop in rice imports with devaluation. What seems to havehappened was that the composition of a typical urban food basket changed.Specifically, the consumption of meat and other items were reduced while theconsumption of rice barely changed (Diagana et al, 1999). It is true that somepolicies implemented at the time moderated the adverse effect of the currencydevaluation on consumers. For example, Senegal reduced its import duties onrice when the currency devaluation went into effect. However, the degree of thedevaluation was so large that imports in CFA countries should have shown anoticeable decline as long as the demand for rice was not completely inelastic.Furthermore, with the exception of Mali, no CFA country showed a significantincrease in production of locally grown rice. It therefore appears that onceshifts of preferences and taste towards rice occur, the habit becomes almostimpervious to even large policy shocks.
The price inelasticity of demand for rice is not restricted to CFA countries.In a case study of rice imports in Ghana, Nigeria and Senegal, Lançon and Benz(2007) found that the international price of rice is not a major determinant ofchanges in rice imports even in Ghana and Nigeria.
178 POLICY RESPONSES IN TRADITIONAL IMPORTING COUNTRIES
ES_RC_9-8 18/8/10 20:23 Page 178
Lower quality of locally grown rice
The level of post-harvest handling or processing of locally grown rice does notalways produce rice equal in quality (at least to local consumers) to importedrice from Asia. Not only is the quality likely to be relatively low, but it is alsounpredictable (WARDA, 2006). A survey of rice consumers in Nigeria showscleanliness, taste and grain shape, among other attributes, as reasons manyconsumers prefer imported rice over domestically produced rice (Lançon et al,2003). Thus, increasing the quantity of locally grown rice is only part of thetask in making the region less reliant on imports. Quality must be improved aswell to increase the competitiveness of local varieties.
The importance of this factor is hard to quantify, however, because thereare many varieties produced locally across different countries and differenttypes of rice varieties are also imported. Indeed, imported rice is not alwayspreferred to local rice. Some countries may be at an advantage because of localaffinity for certain local varieties independent of the level of post-harvesthandling or processing. For example, both Mali and Guinea produce a localvariety of rice that receives a price premium (WARDA, 2006). Similarly, inNigeria, consumers who prefer domestically produced rice cite taste as one ofthe reasons for their choice (Lançon et al, 2003).
Therefore comparing prices between imported and domestically producedrice must be done very carefully in order to be informative. In The Gambia, forexample, the price of imported rice (CIF) exceeded the price of domesticallyproduced rice between 1990 and 2000 on average by 6 per cent, while between2001 and 2004 the price of domestically produced rice was higher by 8 percent (Ministry of Agriculture, 2007).
Poor infrastructure
The demand for a product is partly a function of the price of its substitutes.While it is true that other locally grown cereals such as sorghum, millet andmaize are far from perfect substitutes for rice, they have the potential to bemore serious competitors to rice than they are currently. One of the mainreasons for this lack of competitiveness concerns the state of infrastructure inthe region. The lack of good roads creates a ‘tax’ on the locally grown crops,even though the actual distance between production sites in rural areas and themain consumption areas in urban centres is small. In some cases, this ‘tax’ is sohigh that some crops effectively become non-tradable within the country.While the removal of this infrastructural tax would not necessarily make manyof these cereals as important as rice among urban consumers, it no doubt hasan effect beyond just the margin. For example, one can observe significantprice differentials between cities separated by only a few hundred miles. Forexample, the average price of maize in Eldoret, Kenya in December 2008 was$230/ton while the average price in the same month in Mombasa was $336/ton(www.ratin.net/priceinfo.asp; in December 2008, $1=Ksh79). And in Nigeria,
RICE IN AFRICA: WILL IMPORTS CONTINUE TO GROW? 179
ES_RC_9-8 18/8/10 20:23 Page 179

the price difference in rice between Dekina and Ilorin, at a distance of 200km,is 20 per cent (Akpokodje et al, 2001).
Exchange rates
Since rice commodity trade is denominated in US dollars, the exchange ratebetween a country’s currency and dollars will determine the import bill for andthe effective price faced by the country (Lançon and Benz, 2007). Unlike manysub-Saharan country currencies, the CFA franc has been mostly appreciatingagainst the US dollar because its value is pegged to the euro. Consequently, thedomestic currency price of imports has increased less rapidly in CFA countriesthan in some other countries in the region or on the world market. If the euro(and thus the CFA franc) continues to appreciate against the dollar, thenimport bills will rise less rapidly than they otherwise would have. However,these exchange rate movements may have little effect on demand, as it wasargued earlier that rice demand seems to be price-inelastic in the region.
Global food crisis, social unrest and policy responses
Given the increasing reliance of the region on rice imports, it is not surprisingthat sub-Saharan Africa was especially hard-hit during the global food crisis. InTanzania (Dar es Salaam), the price of rice went from $435 per ton in July2007 to $746 in July 2008. In Uganda (Kampala), the same quantity wentfrom $504 to $1062 over the same time period. In Rwanda (Kigali), rice pricewent from $764 to $1209 over the same period (RATIN, 2008). Countries inother sub-regions registered similar increases in prices over the same timeperiod.
Not surprisingly, social unrest erupted in early 2008 in several urbancentres in the region because of the heavy dependence of urban dwellers onimported rice. In February, riots occurred in Burkina Faso, Cameroon andMozambique. The following month, riots occurred in Senegal (UNOCHA,2008a). Social unrest would have spread to more countries and increased inmagnitude in the above countries had many of them not come up with policiesto address the precipitous increase in food prices. The policies taken differ onthe basis of existing policies at the time and the capacity of local production.Because of the large number of affected countries in the region, we focus hereonly on major rice-consuming and rice-importing countries: Nigeria, Mali,Madagascar, Burkina Faso, Senegal and Cameroon.
As prices started to soar, the Government of Nigeria committed N80billion ($678 million) to increase importation of rice from Thailand in early2008. In addition, the government made the decision to release 11,000 tons ofrice from the country’s Federal Government Strategic Reserve to augment anearlier release of 40,000 tons. Import duties on rice, which at the time stood at50 per cent, were suspended for six months (May to October 2008)(Government of Nigeria, 2008). However, the cabinet also approved thedoubling of the Strategic Grain Reserve to 600,000 tons by the end of 2008.
180 POLICY RESPONSES IN TRADITIONAL IMPORTING COUNTRIES
ES_RC_9-8 18/8/10 20:23 Page 180

Building up stocks during time of crisis, or even announcing the intention to doso, increases demand and puts upward pressure on prices.
In addition to the above short-term measures, the Nigerian governmentplanned the disbursement of about N10 billion ($85 million) from the rice levyas loans to farmers in order to boost local production. This loan programmewas planned to have a repayment period of 15 years with an annual interestrate of 4 per cent. Furthermore, the government also announced that it wasputting aside N200 billion ($1.7 billion) for the development of a NationalFood Security Program for the period 2008–2011 to further boost the produc-tion of grains in the country. These are medium- to long-term plans, and itremains to be seen if there will be any significant effects on production.
The country with one of the biggest potentials to increase rice productionin sub-Saharan Africa is Mali. In 2008, the Government of Mali instituted anational programme called Initiative du Riz (The Rice Initiative) in response tothe food crisis (Ministère de l’agriculture, 2008). The plan called for increasedrice production through intensification by improving irrigation technology andeasing farmers’ access to improved seeds and fertilizers.
The main irrigated rice areas of the country are in areas along the Niger Riverand the government agencies in charge of them are Office du Niger (ON) andOffice Riz-Segou (ORS).10 ON is a much bigger project than ORS (104,000haversus 35,400ha).11 Together, these areas account for about a third of total culti-vated rice area in the country. Average rice yield in 2008 was 5 tons/ha in ONareas and 1.95 tons/ha in ORS areas (Office du Niger, 2008a, b). This differencein yield between the two areas is mainly attributed to the difference in irrigationtechnology.12 The rice intensification plan in ORS areas included upgrading irriga-tion technology from flood irrigation to controlled irrigation through theinstallation of pumps and easing access to fertilizer for farmers. ON already hasadvanced irrigation equipment so the government’s intensification plans in thisarea mainly focus on making fertilizer accessible to farmers.
Similar to Nigeria’s agreement with Thailand, the Senegalese governmentannounced that it entered into a bilateral agreement with the Government ofIndia to guarantee imports of 600,000 tons of rice annually for six years. TheGovernment of Senegal chose the six-year timeframe to allow it to develop aplan for self-sufficiency in rice. Senegal also signed a deal with Cambodia toimport 120,000 tons in 2009. Like Nigeria, Cameroon also announced thelifting of import taxes (5 per cent at the time) on rice in March 2008(UNOCHA, 2008b).
Some countries in the region that have large local production capacity,some of which are normally exported to neighbouring countries, decided toban exports. These countries were Madagascar and Mali (and to a muchsmaller extent, Burkina Faso). In the case of Mali, the enforcement of theexport ban was not successful because of its long borders and limited adminis-trative capacity. The government estimated that large quantities of rice wereexported to Senegal, Guinea and Niger in 2008 (Ministère de l’agriculture,2008).
RICE IN AFRICA: WILL IMPORTS CONTINUE TO GROW? 181
ES_RC_9-8 18/8/10 20:23 Page 181

With the exception of Nigeria’s National Food Security Program and itslong-term credit scheme and the Government of Mali’s Rice Initiative, itappears that none of the highlighted countries’ policy responses extendedbeyond emergency short-term measures. Relaxation of import duties, exportbans and bilateral agreements to guarantee imports do not address long-termfood deficits. Lack of policies that are designed to increase local productionsuggests that sub-Saharan Africa will remain a major rice importer in thecoming decades.
Forecasting regional imports for the next two decades
Based on what we know about production and consumption in sub-SaharanAfrica, it is possible to make a crude forecast of the region’s rice imports for thenext two decades. Because of the small size and heterogeneous nature of differ-ent countries, predictions at the level of individual countries are not likely to beinformative. We therefore provide our forecast by sub-region.
We used historical rates of production growth to forecast future produc-tion for the next two decades. Key factors that influence production (forexample irrigation) are not registering significant growth in the region. Forexample, the proportion of agricultural area irrigated has slightly fallen inWestern and Southern Africa between 2000 and 2005 and has only increasedmarginally in Central and Eastern Africa. Considering (1) the slow pace ofofficial development assistance growth in sub-Saharan Africa, despite theGleneagles commitments to double aid to Africa, (2) the high capital cost ofirrigation development, and (3) the current global economic downturn result-ing in reduced government revenues and foreign direct investment, it isreasonable to assume that expansion in irrigation will be low over the comingten years, and that future growth of production will not accelerate substan-tially beyond rates of historical growth.13
To forecast the growth of consumption, we first forecast urban populationbecause urbanization is one of the biggest determinants of rice consumption.Based on historical urbanization rates, we forecast urbanization rates for thefour sub-regions of sub-Saharan Africa. We then used UN population forecasts(UN, 2009) to forecast urban populations.
Next, we forecast the ratio of total consumption to urban population. Weused this ratio rather than per capita consumption (the ratio of consumption tototal population) because it is the urban population that determines riceconsumption across countries and over time. The ratio of rice consumption tourban population has been relatively constant in sub-regions with relativelyhigh consumption (Western and Eastern Africa14) and is forecast to remain soin the future. In Central and Southern Africa, where consumption is relativelylow, this ratio is increasing slowly, and we forecast that it continues to do so inthe future at the same rate as in the past. Multiplication of the forecasted urbanpopulation by the forecasted ratio of consumption to urban population thusgives forecasted consumption. While the urban population is not the only
182 POLICY RESPONSES IN TRADITIONAL IMPORTING COUNTRIES
ES_RC_9-8 18/8/10 20:23 Page 182

determinant of rice consumption, the relatively stable ratio of total consump-tion to urban population allows us to make a simple and clear forecast.
Our projections in all sub-regions suggest faster growth in consumptionthan in production. This difference implies strong and continued growth inimports of rice in all sub-regions in the next two decades. Our projections (seeFigure 9.10) of rice imports were obtained by taking the difference betweenconsumption and production in each sub-region. While this may seem toocrude, it is important to note that most countries in the region do not exportrice. Among the few countries that do, they are likely to export only to neigh-bouring countries. Therefore estimates of sub-regional imports can beapproximated by taking the difference between consumption and production.We estimate 19.6 million tons (milled equivalent) of imports by 2030. Thiswould represent an average annual growth rate of 5.3 per cent between 2007and 2030.
The volume of imports in Western, Central, Eastern and Southern Africawere 4.9 million tons, 0.69 million tons, 1.47 million tons and 1.18 milliontons respectively in 2006, the latest year for which we have data. To keepimports at this level for the next two decades, the various sub-regions wouldrequire very high production growth rates, assuming consumption followshistorical trends. For Western Africa, paddy rice production would have toexceed 27 million tons in 2030, which is significantly higher than theforecasted volume of 18 million tons. This would require a sustained annualgrowth rate of at least 5 per cent between 2008 and 2030. And to make thesub-region self-sufficient (zero rice imports), production would have toincrease at an annual rate of 6 per cent for the next two decades if consumptionfollows the forecasted level. In Central Africa, production would need to be 3.1million tons versus the forecasted level of 0.77 million tons to keep importsunchanged from 2005. And the average annual growth rate of productionwould have to be 9 per cent for the sub-region to be self-sufficient if consump-tion stays at the above forecasted level. In Eastern Africa, production wouldhave to reach 13.1 million tons instead of the forecasted 8.1 million tons forimports to remain unchanged from 2005. In Southern Africa, paddy riceproduction would have reach 1.9 million tons instead of 0.58 million tons.
Unprecedented growth rates in production would have to be sustained inall sub-regions for such production levels to be realized. Southeast Asiancountries such as Thailand and Viet Nam sustained average annual growthrates of rice production of 2.7 per cent and 3.0 per cent respectively from 1962to 2007 starting from much higher levels of production. Considering thecurrent level of fertilizer usage, irrigation technology and the fact that anincreasing amount of land being used is marginal, the growth rates needed tomaintain the current import levels or achieve self-sufficiency are very likely tobe out of reach in all sub-regions. Thus, the international rice trade will be ofcontinued importance for sub-Saharan Africa for at least the next two decades.
At the same time, just because the above growth rates are unprecedenteddoes not mean they are unattainable in some specific settings. The dependence
RICE IN AFRICA: WILL IMPORTS CONTINUE TO GROW? 183
ES_RC_9-8 18/8/10 20:23 Page 183
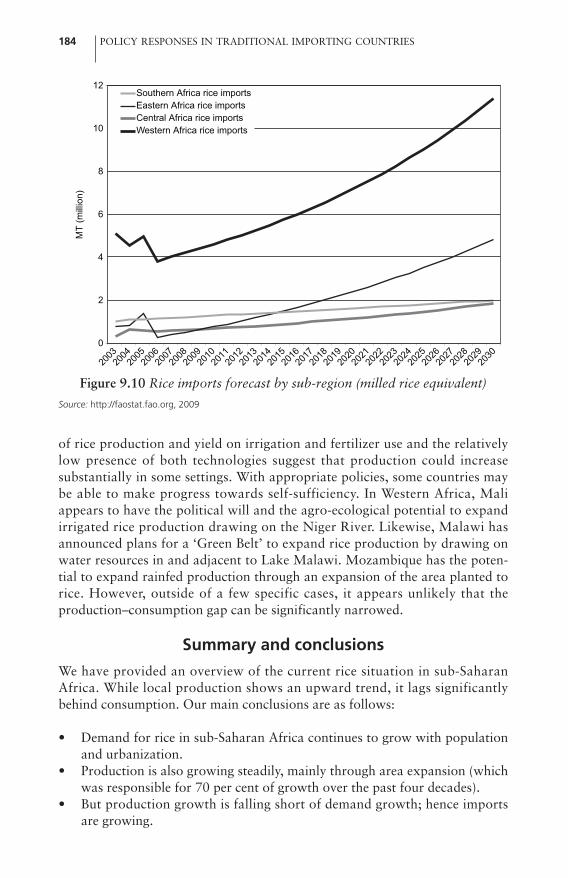
of rice production and yield on irrigation and fertilizer use and the relativelylow presence of both technologies suggest that production could increasesubstantially in some settings. With appropriate policies, some countries maybe able to make progress towards self-sufficiency. In Western Africa, Maliappears to have the political will and the agro-ecological potential to expandirrigated rice production drawing on the Niger River. Likewise, Malawi hasannounced plans for a ‘Green Belt’ to expand rice production by drawing onwater resources in and adjacent to Lake Malawi. Mozambique has the poten-tial to expand rainfed production through an expansion of the area planted torice. However, outside of a few specific cases, it appears unlikely that theproduction–consumption gap can be significantly narrowed.
Summary and conclusions
We have provided an overview of the current rice situation in sub-SaharanAfrica. While local production shows an upward trend, it lags significantlybehind consumption. Our main conclusions are as follows:
• Demand for rice in sub-Saharan Africa continues to grow with populationand urbanization.
• Production is also growing steadily, mainly through area expansion (whichwas responsible for 70 per cent of growth over the past four decades).
• But production growth is falling short of demand growth; hence importsare growing.
184 POLICY RESPONSES IN TRADITIONAL IMPORTING COUNTRIES
MT
(mill
ion)
12
10
8
6
4
2
0
2003
2004
2005
2006
2007
2008
2009
2010
2011
2012
2013
2014
2015
2016
2017
2018
2019
2020
2021
2022
2023
2024
2025
2026
2027
2028
2029
2030
Southern Africa rice importsEastern Africa rice importsCentral Africa rice importsWestern Africa rice imports
Figure 9.10 Rice imports forecast by sub-region (milled rice equivalent)
Source: http://faostat.fao.org, 2009
ES_RC_9-8 18/8/10 20:23 Page 184

• Sub-Saharan Africa imports 31 per cent of the world’s traded rice (2005),60–70 per cent of which goes to Western Africa.
• Low irrigation coverage, high fertilizer costs and poor transport infrastruc-ture constrained the supply response to recent higher rice prices.
• Public and private investment in irrigation showed no signs of increasinggreatly even before the current financial crisis. Investments, if they materi-alize, will be costly and there will be long lags before production increases.
• The production growth rates required to hold imports at current levels arevery high. To reduce imports at the regional or sub-regional level, highlyimprobable growth rates would need to be achieved.
• Even with optimistic projections of a strong supply response in sub-Saharan Africa, the region will remain a major market for Asian rice forthe foreseeable future.
Notes1 We include South Africa in our sub-Saharan Africa category because its pattern of
rice consumption, production and imports do not greatly differ from neighbouringcountries. Sub-Saharan Africa explicitly excludes several North African countries,including Egypt, which is a major rice producer and consumer.
2 Central Africa is comprised of Angola, Cameroon, Central African Republic, Chad,Republic of Congo, Democratic Republic of Congo, Equatorial Guinea, Gabon andSao Tome. Eastern Africa is comprised of Burundi, Comoros, Djibouti, Eritrea,Ethiopia, Kenya, Madagascar, Rwanda, Somalia, Sudan, Tanzania and Uganda.Southern Africa is comprised of Botswana, Lesotho, Malawi, Mauritius,Mozambique, Namibia, Seychelles, South Africa, Swaziland, Zambia andZimbabwe. Western Africa is comprised of Benin, Burkina Faso, Cape Verde, Côted’Ivoire, Gambia, Ghana, Guinea, Guinea-Bissau, Liberia, Mali, Mauritania, Niger,Nigeria, Senegal, Sierra Leone and Togo.
3 In the FAOStat database, as of time of writing, production and area data go from1961 to 2007, consumption data go from 1961 to 2003, trade data (imports andexports) go from 1961 to 2006, and population data go to 2006.
4 The proportion of rice cultivated area that is irrigated is much higher than thisfigure. According to WARDA (2006), 17 per cent of cultivated rice area is irrigatedcompared to 57 per cent in Asia.
5 New Rice for Africa (NERICA) is an inter-specific cultivar of rice developed byWARDA. NERICA was created by crossing O. glaberrima and O. sativa.
6 Senegambia is the area within Western Africa covered by the modern nation statesof The Gambia and Senegal.
7 Groundnut is not an important crop in all West African countries. The agro-ecological zone best suited to groundnut production in the sub-region is the areabetween the Sahel and Guinea Savanna (8 to 13 degrees North latitude) (Ndjeungaet al, 2000). As a consequence, groundnut production in southern Nigeria, Benin,Togo, most of Ghana, southern Côte d’Ivoire, Liberia, Guinea Bissau and SierraLeone are much smaller relative to other West African countries. These areas fallmostly south of the optimal agro-ecological zones.
8 In most traditional processing methods, millet must be ground into millet flourbefore it is ready for cooking. However, millet flour cannot be stored long because
RICE IN AFRICA: WILL IMPORTS CONTINUE TO GROW? 185
ES_RC_9-8 18/8/10 20:23 Page 185

it has a tendency to turn rancid quickly due to chemical changes when the hull orbran is removed (FAO, 1995). For example, experimental evidence in Nigeriashowed that the quality of millet flour deteriorates after only two months ofstorage due mainly to chemical changes (Ocheme, 2007). By contrast, threshedmillet that is still protected by the hull, shows no changes and registers no changein quality beyond three months of storage (Ocheme, 2007).
9 The two sub-regions are served by different central banks. Though both currenciesare called the CFA franc, they are different. They are convertible one-to-one.
10 ON was created by the French colonial government in 1932 and ORS was createdby the Malian government in 1972 (Ministère de l’agriculture, 2008).
11 The total potential rice area under ON is 2 million hectares but there are nomedium-term plans to expand the area irrigated beyond 104,000ha because offunding limitations.
12 ON uses control irrigation, while ORS uses flood irrigation with limited control.13 For example, despite the fact that the potential irrigable area under ON in Mali is 2
million hectares, the Government of Mali has no medium-term plan that involvesexpansion of irrigated area from the current 104,000ha due to financingconstraints.
14 The trend of the ratio of total consumption to urban population depends on thetime period considered for the East African sub-region. From 1961 to 1992, thisratio fell steadily from 129 to 45. It has, however, held steady at this value sincethen. We base our forecast on the steady trend since 1992.
AcknowledgementsWe thank Belay Begashaw for comments and suggestions. We are grateful to DavidDawe for numerous comments and critiques that have improved the chapter.
ReferencesAkpokodje, G., Lançon, F. and Erenstein, O. (2001) ‘The Nigerian rice economy in a
competitive world: Constraints, opportunities and strategic choices’, WARDA,Bouake, Côte d’Ivoire
Brooks, G. E. (1975) ‘Peanuts and colonialism: Consequences of the commercializationof peanuts in West Africa, 1830–1870’, Journal of African History, vol 16, no 1,pp29–54
Burkhill, H. (1901) ‘Groundnut or peanut’, Royal Botanical Gardens, Kew, 1901, vol178, pp175–200
Diagana, B., Akindes, F., Savadogo, K., Reardon, T. and Staatz, J. (1999) ‘Effects of theCFA franc devaluation on urban food consumption in West Africa: Overview andcross-country comparisons’, Food Policy, vol 24, no 5, pp465–478
Diagne, A. (2006) ‘Diffusion and adoption of NERICA rice varieties in Côte d’Ivoire’,The Developing Economies, vol 44, no 2, pp208–231
FAO (Food and Agricultural Organization of the United Nations (1995) ‘Sorghum andmillets in human nutrition’, FAO Food and Nutrition Series, no 27, FAO, Rome
FAO (2009) FAOStat online database, http://faostat.fao.orgGovernment of Nigeria (2008) ‘Circular on clearance of imported rice’, 16 June,
available at www.customs.gov.ng/Publications/getPublication.php?id=38
186 POLICY RESPONSES IN TRADITIONAL IMPORTING COUNTRIES
ES_RC_9-8 18/8/10 20:23 Page 186

Ito, S., Peterson, E. and Grant, W. (1989) ‘Rice in Asia: Is it becoming an inferiorgood?’, American Journal of Agricultural Economics, vol 71, pp32–42
Lançon, F. and Benz, H. D. (2007) ‘Rice imports in West Africa: Trade regime and foodpolicy formulation’, European Association of Agricultural Economists Conference,Montpelier, France
Lançon, F., Erenstein, O., Akande, S. O., Titilola, S. O., Akpokodje, G. and Ogendele,O. O. (2003) ‘Imported rice retailing and purchasing in Nigeria: A survey’ WARDA,Abidjan, Côte d’Ivoire
Leon, A. and Curonisy, D. (1981) ‘La Alimentación en el Peru’, Fundación FriedrichEbert, Universidad del Pacífico, Lima, Peru
Linares, O. F. (2002) ‘African rice (Oryza Glaberrima): History and future potential’,Proceedings of the National Academy of Sciences, vol 99, no 25, pp16360–16365
Ministère de l’agriculture (2008) ‘Plan de Campagne Agricole 2009/10’, DirectionNationale d’Agriculture, Bamako, Mali
Ministry of Agriculture (2007) ‘Gambia import surge study’, Department of Planning,Banjul, The Gambia
Ndjeunga, J., Kumar, K. A. and Ntare, B. R. (2000) ‘Comparative analysis of seedsystems in Niger and Senegal’, SAT eJournal, ICRISAT, Patancheru
Ocheme, O. B. (2007) ‘Effect of storage of millet flour on the quality and acceptabilityof millet flour porridge (Enyiokwolla)’, Journal of Food Technology, vol 5, no 3,pp215–219
Office du Niger (2008a) ‘Point de L’approvisionnement en Engrais ChimiqueCampagne’, Republic du Mali
Office du Niger (2008b) ‘Statistiques de Base’, Segou, Republic du MaliPenn World Table (2008) Penn World Table, University of PennsylvaniaPorteres, R. (1970) ‘Primary cradles of agriculture in the African continent’, in Fage,
J. D. and Olivier, R. A. (eds) Papers in African Prehistory, Cambridge UniversityPress, Cambridge, pp43–58
RATIN (Regional Agricultural Trade Intelligence Network) (2009) ‘Monthly pricedata’, www.ratin.net/priceinfo.asp
Reardon, T. (1993) ‘Cereals demand in the Sahel and potential impacts of regionalcereals protection’, World Development, vol 21, no 1, pp17–35
Ross, C. G. (1982) ‘A village-level study of producer grain transactions in ruralSenegal’, African Studies Review, vol 25, no 4, pp65–84
Senauer, B., Sahn, D. and Alderman, H. (1986) ‘The effect of the value of time on foodconsumption patterns in developing countries: Evidence from Sri Lanka’, AmericanJournal of Agricultural Economics, vol 68, no 4, pp920–927
UN (United Nations) (2009) ‘World Population Prospects: 2008 Revision populationdatabase’, http://esa.un.org/unpp/index.asp.
UNOCHA (United Nations Office for the Coordination of Humanitarian Affairs)(2008a) ‘Senegal: Heavy handed response to food protesters’,www.irinnews.org/report.aspx?ReportID=77539
UNOCHA (2008b) ‘Cameroon: Lifting of import taxes fails to reduce food prices’,www.irinnews.org/Report.aspx?ReportId=77971.
WARDA (West African Rice Development Authority) (2006) ‘NERICA Compendium’,WARDA, Cotonou
Weil, P. M. (1984) ‘Slavery, groundnuts, and European capitalism in the Wuli Kingdomof Senegambia, 1820–1930’, Research in Economic Anthropology, vol 6,pp77–119
RICE IN AFRICA: WILL IMPORTS CONTINUE TO GROW? 187
ES_RC_9-8 18/8/10 20:23 Page 187

ES_RC_9-8 18/8/10 20:23 Page 188

Part IV
POLICY RESPONSES INTRADITIONAL EXPORTING
COUNTRIES
ES_RC_9-8 18/8/10 20:23 Page 189

ES_RC_9-8 18/8/10 20:23 Page 190

10
The Political Economy of Thai Rice Price and Export
Policies in 2007–2008
Nipon Poapongsakorn
Introduction
The rice price spike in the first five months of 2008, which resulted in panicand food riots in many poor countries, was triggered by the export bans of twomajor rice-exporting countries (India and Viet Nam) and aggravated by thePhilippines’ buying behaviour (Dawe and Slayton, Chapter 2, this book). SinceThailand, the world’s largest rice exporter, did not impose any export restric-tions, its rice exports surged to record levels of more than 0.9 million tons permonth for the first seven months of 2008.
Despite the surge in world prices, the Thai government did not exploit theopportunity to sell a portion of its 2.1 million tons rice stock. It also decided toincrease the guarantee price for its paddy pledging programme to a record of14,000 baht per ton for the 2008 dry-season crop. This chapter explains therationale behind the government decisions and qualitatively assesses the impactof these policies.
After this introduction, the second part briefly discusses the history of riceprice and export policies before 2007. The paddy pledging programme, whichwas the main rice price policy since 2001–2002, and its impact is qualitatively
ES_RC_9-8 18/8/10 20:23 Page 191

analysed in the third part. The fourth part describes rice price and exportpolicies in 2007–2008, followed by an analysis of their impact is the followingsection.
Brief history of rice price and export policies
The major change in government agricultural policy occurred in 1986 when apro-consumer policy was replaced by a pro-producer policy (Siamwalla andPoapongsakorn, 1995; Poapongsakorn and Isvilanond, 2008). The exporttaxes and restrictions that penalized farmers were eliminated, resulting in amore or less neutral nominal rate of protection for exportable crops, althoughsome import-competing crops such as oil palm retain some protection (Warrand Kahpaiboon, 2007). Since then the government has increased agriculturalsubsidies through the agricultural pledging programme,1 with the paddy pledg-ing programme as the most important instrument in terms of budget. Thegovernment has also attempted to implement an export cooperation policywith several major rice-exporting countries.
The paddy pledging programme
The paddy pledging policy was first introduced in the 1981–1982 croppingseason. Its main objective was to provide soft loans for farmers who wanted todelay sale of their crops. Since 2001–2002, the objective has been changed ‘tosupport price and increase farmers’ income’.
Objective and operation of the programmeThe programme allows the farmers who want to delay sale of their crops toobtain a soft loan from the Bank for Agriculture and Agricultural Cooperatives(BAAC) using their paddy (unmilled rice) as the collateral (or ‘pledge’). In theinitial years of the programme, before 2001–2002, farmers could borrow lessthan 100 per cent of the paddy target price, which was supposed to be themarket price during the harvesting period. Up until the loan is due, farmers canchoose to either redeem or forfeit their collateral paddy, depending on the levelof the market price relative to ‘the pledging price’.
There are two ways to borrow: (1) farmers can borrow directly fromBAAC and keep the pledged paddy as the ‘pledge’ (or collateral) in storagefacilities on their own farms (barn-house pledging); or (2) farmers who do nothave storage facilities can also borrow by bringing their paddy to ‘centralwarehouses’. This is the so-called ‘warehouse deposit slip’ paddy pledgingscheme that is handled by the Public Warehouse Organization (PWO) and theFarmer Central Market Organization (FCMO).
The government provides the interest subsidy for the farmers and alsosubsidizes the operation of the paddy pledging programme and rice sales asfollows:
192 POLICY RESPONSES IN TRADITIONAL EXPORTING COUNTRIES
ES_RC_9-8 18/8/10 20:23 Page 192
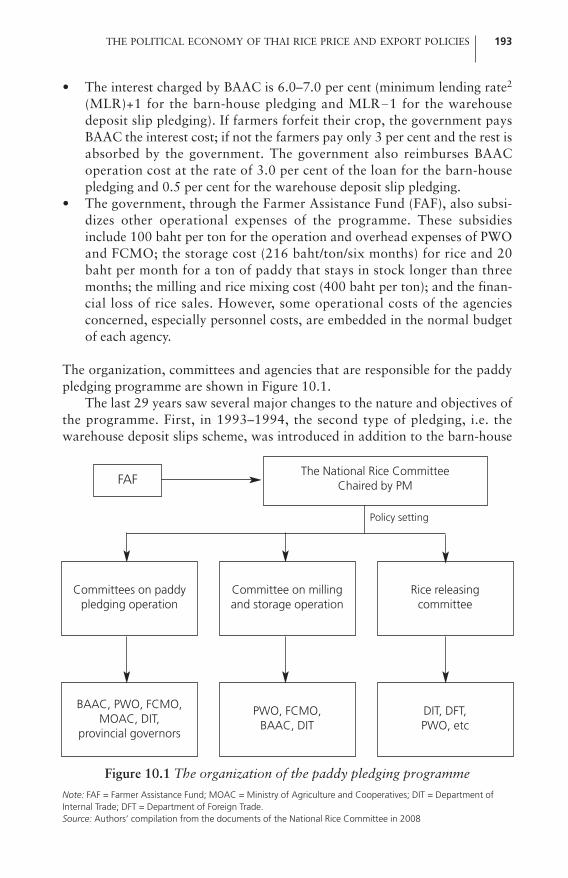
• The interest charged by BAAC is 6.0–7.0 per cent (minimum lending rate2
(MLR)+1 for the barn-house pledging and MLR�1 for the warehousedeposit slip pledging). If farmers forfeit their crop, the government paysBAAC the interest cost; if not the farmers pay only 3 per cent and the rest isabsorbed by the government. The government also reimburses BAACoperation cost at the rate of 3.0 per cent of the loan for the barn-housepledging and 0.5 per cent for the warehouse deposit slip pledging.
• The government, through the Farmer Assistance Fund (FAF), also subsi-dizes other operational expenses of the programme. These subsidiesinclude 100 baht per ton for the operation and overhead expenses of PWOand FCMO; the storage cost (216 baht/ton/six months) for rice and 20baht per month for a ton of paddy that stays in stock longer than threemonths; the milling and rice mixing cost (400 baht per ton); and the finan-cial loss of rice sales. However, some operational costs of the agenciesconcerned, especially personnel costs, are embedded in the normal budgetof each agency.
The organization, committees and agencies that are responsible for the paddypledging programme are shown in Figure 10.1.
The last 29 years saw several major changes to the nature and objectives ofthe programme. First, in 1993–1994, the second type of pledging, i.e. thewarehouse deposit slips scheme, was introduced in addition to the barn-house
THE POLITICAL ECONOMY OF THAI RICE PRICE AND EXPORT POLICIES 193
FAFThe National Rice Committee
Chaired by PM
Rice releasingcommittee
Committee on millingand storage operation
Committees on paddypledging operation
DIT, DFT,PWO, etc
PWO, FCMO, BAAC, DIT
BAAC, PWO, FCMO,MOAC, DIT,
provincial governors
Policy setting
Figure 10.1 The organization of the paddy pledging programme
Note: FAF = Farmer Assistance Fund; MOAC = Ministry of Agriculture and Cooperatives; DIT = Department ofInternal Trade; DFT = Department of Foreign Trade.Source: Authors’ compilation from the documents of the National Rice Committee in 2008
ES_RC_9-8 18/8/10 20:23 Page 193

pledging programme. The change not only benefited farmers who did not havebarn houses, but also the rice mills that had paddy warehouses. Theprogramme was extended to cover dry-season paddy in 2001, benefiting boththe well-to-do farmers and the rice millers in the irrigated areas. The thirdchange – and the most important one – was the increase in the pledging price.Though the loan rate was increased gradually from 80 per cent of the targetprice to 90 per cent in 1990–1991 and 95 per cent in 1998–1999, the majorshift occurred during 2001–2002 and 2005–2006 when the Thaksin govern-ment increased the loan to 100 per cent of the target price. In addition, thepledging price has been raised to 120–130 per cent of the market price. Theprogramme, therefore, has been changed to a ‘de facto price support’programme, although its name and the pledging procedure have remained thesame. Thus, in practice, most farmers sell their paddy to the government.
However, the military-appointed Surayud government that came to powerfollowing the September 2006 coup temporarily switched the programme tothe traditional paddy pledging programme in 2006–2007 by lowering thepledging price by 8.5–12 per cent from 6700–7100 baht per ton in 2005–2006(Matichon Daily, 2006).
Performance of the paddy pledging policyThe volume of pledged paddy increased from a few thousand tons in the earlyyears to 8.65 million tons in the wet season of 2004–2005 (see Table 10.1).Dry-season pledging peaked in 2008 when the pledging price was set at therecord of 14,000 baht per ton. In the early years when pledging prices werebelow market prices, the share of pledged paddy in total production wasrelatively small, ranging from 2.9 per cent to 8.2 per cent, with the only excep-tion being 1992–1993. The share surged after 2001–2002 and peaked at 38per cent for the 2004–2005 wet-season paddy and 44.8 per cent for the2007–2008 dry-season paddy. Consequently, the government’s rice stock hasjumped markedly (as is discussed later), and the government has recentlybecome the country’s largest rice trader.
The export cartel policy
In the past, most officials at the Ministry of Commerce (MOC) believed thatrice exporters adopted a ‘price-cutting strategy’ with each other, resulting inexport prices of Thai rice that were too low. The government thus adopted ameasure that ultimately forced the exporters to collude for many years. EveryWednesday, the Chamber of Commerce Subcommittee on Rice fixed the‘export price’ at which all exporters had to sell. Any exporters who failed tosell at such prices would not receive an export licence from the MOC.Although all exporters quoted the posted price for their rice, they rebated theprice difference to their buyers in the black market (Na Ranong andTriamworakul, 2002). Therefore, the measure was totally meaningless.
Low export prices of rice in more recent years (for example 1997–1998)were claimed to be evidence supporting the MOC’s hypothesis that Thai
194 POLICY RESPONSES IN TRADITIONAL EXPORTING COUNTRIES
ES_RC_9-8 18/8/10 20:23 Page 194

exporters were involved in price cutting. As a result, the Thaksin governmentintroduced the rice export cooperation strategy in October 2002. The govern-ment invited ministers from five major rice-exporting countries (Viet Nam,India, Pakistan and China, as well as Thailand) to a meeting and established aCouncil on Rice Trade Cooperation (CRTC) – effectively intended as a ricecartel.
The objectives of the Council policy were to exchange information andopinions on the world rice situation so that the governments could adoptappropriate policies (such as setting reasonable minimum export prices) tostabilize rice prices. However, there were no agreements on measures to limitproduction and planting area in member countries. The Thai MOC announcedat a press conference that the cooperation would enable Thailand to sell rice atprices at least 30 per cent higher than they otherwise would be.
Except for occasional information exchange, the intended cooperationnever materialized, which was not surprising given that economic theorysuggests that such a policy is unlikely to work. Unlike OPEC, which can effec-tively regulate oil supply, the Thai government cannot regulate their farmers,let alone the supply response of farmers in other countries. A rice cartel cannot
THE POLITICAL ECONOMY OF THAI RICE PRICE AND EXPORT POLICIES 195
Table 10.1 Planted area, paddy production and volume of paddy under the pledging programme
Production Wet-season Paddy under Production Dry-season Paddy under of paddy paddy under the pledging of paddy paddy under the pledging (Million the pledging programme (Million the pledging programmetons) programme (%) tons) programme (%)
(Million tons) (Million tons)
1988–1989 17.88 0.52 2.9 3.38 - -1989–1990 18.48 1.08 5.9 2.12 - -1990–1991 14.9 0.8 5.4 2.29 - -1991–1992 17.52 1.06 6.1 2.88 - -1992–1993 17.3 3.38 19.6 2.62 - -1993–1994 16.48 1.2 7.3 1.96 - -1994–1995 18.16 1.4 7.7 2.95 - -1995–1996 17.73 1.18 6.7 4.29 - -1996–1997 17.78 0.87 4.9 4.55 - -1997–1998 18.79 0.79 4.2 4.79 - -1998–1999 18.66 0.68 3.6 4.34 - -1999–2000 19.02 0.7 3.7 5.16 - -2000–2001 19.79 1.62 8.2 6.06 0.1498 -2001–2002 22.41 4.3 19.2 5.62 1.0708 -2002–2003 21.57 3.59 16.6 6.43 2.04 31.72003–2004 23.14 2.54 11.0 6.33 0.86 13.62004–2005 22.65 8.65 38.2 5.89 0.8 13.62005–2006 23.36 5.3 22.7 6.75 2.17 32.22006–2007 22.84 1.29 5.6 6.8 1.64 24.02007–2008 23.31 0.24 1.0 8.79 3.93 44.82008–2009 23.71 4.55 19.2 - - -
Source: Office of Agricultural Economics (www.oae.go.th) and Department of Internal Trade (www.dit.go.th)
ES_RC_9-8 18/8/10 20:23 Page 195

have much monopolistic power because of the high price elasticity of worlddemand. In addition, although Thailand is the world’s largest rice exporter, itsshare in world production is only 5 per cent.
Impact of the paddy pledging programme
There are six possible ways to assess the paddy pledging programme:
1 the financial cost of the programme; 2 the extent to which it helps poor farmers; 3 the impact on rice prices, especially seasonal price movements; 4 the impact on the structure of the rice market; 5 the political economy of rice policy and rent-seeking behaviour; and 6 the effects on the competitiveness of rice exports. The first five of these are
discussed here, while the last issue is discussed later.
Costs of the programme
Data limitations make it extremely difficult to measure the financial costs ofthe programme. Although the Farmer Assistance Fund is responsible for aconsolidated financial report to the government, the report has never beenmade public. Each responsible agency has its own report system and financialreports, most of which are not publicly disclosed. Thus, a rigorous estimate ofthe financial costs of the paddy pledging programme is beyond the scope of thischapter. Instead, estimates will be quoted from various sources.
The financial costs consist of:
1 the difference between the paddy pledging price and the rice selling price(when the government releases the rice);
2 the interest subsidy for farmers’ loans and lending operations by BAAC; 3 the subsidy of the rice sale operation that includes storage and milling costs
and overhead cost of the PWO; and 4 other minor operational expenses incurred by the responsible government
agencies.
Previous studies estimated that the annual costs of the paddy pledgingprogramme were 10.1–18.3 billion baht during the 2004–2005 to 2006–2007period (Isvilanond, 2007). A newspaper columnist reported the financial costfor the 2004–2005 to 2005–2006 cropping seasons in Table 10.2.
It is not clear what kinds of costs are included in the above estimates.However, the estimates clearly confirm that the cost depends on the pledgingprices relative to the target (or market) prices. The cost in the 2004/05 wetseason was higher than that in 2005/06 because the volume of pledged paddywas 3.3 million tons higher in 2004/05, thanks to the higher pledging pricewhich began in 2001/02. Since the pledging price was higher than the targeted(or market) price, the farmers pledged more paddy and had less incentive to
196 POLICY RESPONSES IN TRADITIONAL EXPORTING COUNTRIES
ES_RC_9-8 18/8/10 20:23 Page 196

redeem their crop when the loan fell due. This also explained why the budgetfor the programme jumped from 3.3 billion baht in 1999 to 30 billion baht in2001.
So far there is no reliable estimate of the loss from government rice sales. ASpecial Committee on the Study of the Paddy Pledging Program in 2007(Department of Internal Trade) estimated that the monetary cost of the2005–2006 programme was 4901.74 million baht or 935.4 baht per ton ofpaddy,3 and the loss from rice sale was 5,663.7 million baht, for a totalmonetary cost to the taxpayers of 10,565.44 million baht. These estimateswere incomplete because they did not include the cost of milling paid to themillers in a form of in-kind payment of 1,310.54 million baht and the interestcost of the government’s outstanding debt. In addition, the government had notyet sold all the rice obtained in 2005–2006 at the time of the study.
In November–December 2008, the government decided to sell 2.696million tons of the old stock acquired between 2004 and 2007. An informedsource at PWO told the newspapers that the loss from the sale could have beenas high as 30 billion baht in 2008.
The author’s estimate of the economic cost of the 2005–2006 pledgingprogramme (which included the 42,300 million baht loan value for the 5.2478million tons of pledged paddy) was 51,758.26 million baht as of 31 March2009.4 According to PWO and BAAC, revenue from rice sales as of 31 March2009 was 25,254.62 million baht, revenue from paddy sales was 7208.13million baht, and the market value of the residual stock was 165.51 millionbaht. Therefore, the loss after sales was 19,130 million baht,5 or 3645.3 bahtper ton of paddy. Note that the farmers in the pledging programme receive aprice subsidy (the difference between the pledging price and the market paddyprice) of 1360 baht per ton (equal to about 37 per cent of the loss). Thereforethe programme is very costly. In addition to the price support subsidy (1360baht per ton), the taxpayers incur an additional expense of 2285.29 baht perton to run the intervention programme.
Does the paddy pledging programme benefit poor farmers?
One rationale for the paddy pledging programme is that it helps poor farmers.A study by Poapongsakorn and Isvilanond (2008) argues that this is a mythbecause only 4.5 per cent of the benefit (measured by the value of the paddypledged by the farmers) was received by the poorest two deciles of farm house-
THE POLITICAL ECONOMY OF THAI RICE PRICE AND EXPORT POLICIES 197
Table 10.2 Cost of the pledging programmes, 2004–2006
Year/season Cost (million baht)
2004–2005 wet season 95742005 dry season 9042005–2006 wet season 59942006 dry season 1811
Source: [email protected]
ES_RC_9-8 18/8/10 20:23 Page 197

holds in 2006. The richest 20 per cent of farm households received as much as35 per cent. The distribution of the programme benefits are particularlyskewed in favour of well-to-do farmers in the dry season (see Figure 10.2).
There are two reasons why most benefits of the programme are capturedby the rich farmers. First, the poor farmers, especially those in the Northeast,have little surplus rice to sell as most rice production is for their own consump-tion. Only those who have a marketable surplus benefit from the programme,and most of the marketable surplus is owned by the wealthier farmers. Second,the benefits of the dry-season paddy pledging programme only go to the richfarmers in the irrigated areas, most of which are in the Central Plains andUpper North. Only 5 per cent of irrigated areas are in the poor northeasternregion.
Impacts of the paddy pledging programme on farm prices
Theoretically speaking, the paddy pledging programme should increase thefarm price in the harvest period and depress the market price later in the seasonwhen the government releases the rice in the market. The programme shouldalso raise the overall level of prices because the target price is set above themarket price.
Studies in the 1990s found that, except for a few years, the programme didnot have any significant impact on farm-gate prices because the interventionwas too small (Siamwalla, 1994; Sriboonjitta, 1998). However, there has been
198 POLICY RESPONSES IN TRADITIONAL EXPORTING COUNTRIES
0
2
4
6
8
10
12
14
16Wet seasonDry season
1 2 3 4 5 6 7 8 9 10Income decile
Per c
ent
Figure 10.2 Percentage of the benefits of the paddy pledging programme accruing to farm income deciles, 2006–2007
Note: The assumption is that the benefit that each farm household receives from the pledging programme is thesame as its share of marketable surplus of paddy.Source: Calculated from National Statistics Office’s Socio-economic Survey, 2006
ES_RC_9-8 18/8/10 20:23 Page 198

no study that assesses the impact of the higher pledging price since 2001–2002.This chapter uses the seasonal price index method to assess this impact, usingfarm price data obtained from the Office of Agricultural Economics. Estimatesare made for three periods: 1984–1991, which covers the period before theintroduction of the paddy pledging programme in 1987 and the early years ofthe programme when the intervention was very small; 1992–2000, when thepledging price was below market prices; and 2001–2008, when the pledgingprices were higher than market prices (except in the 2006–2007 season). Threetypes of paddy in the wet season are analysed: 5 per cent paddy, 25 per centpaddy and Hom Mali (or jasmine) paddy. Two sets of estimates are presented,one using nominal prices and one using real prices (nominal prices adjusted forinflation using the consumer price index with a base year of 2000).
Price trendsIn nominal terms, paddy prices were increasing until 1998, after which theystarted to fall for a few years before resuming their upward trend. In real terms,paddy prices reached a trough in 2001, after which they began to trendupwards before soaring to a 25-year high during the crisis (see Figures 10.3aand 10.3b). Several factors may explain the upward trend since 2001, butperhaps the most important one is the increase in pledged paddy prices thatstarted at that time. In terms of price variability, the CV of prices for the2001–2008 period was higher than that in the 1984–1991 and 1992–2000periods. The uncertainty over the government’s policy on selling its rice stocksfrom the pledging programme may contribute to the greater price fluctuationsin recent years.
Seasonality of pricesAccording to Figure 10.4 the seasonality pattern has changed markedly overtime. First, the month with the seasonal peak has changed.6 In the past(1984–2000), paddy prices reached their peak in the month immediately beforethe new harvest, August or September. In recent years, however, the peak hasbeen in April. Second, the slope of the seasonal price movement has flattened,resulting in smaller seasonal price movements, which can be seen in Figure10.4 and is confirmed by the lower CV of seasonal factors in the most recenttime period (see Table 10.3).
There are two main reasons for the changing seasonality of prices. First,the spread of high-yielding rice varieties and an increase in cropping intensityhas resulted in paddy harvests being spread more evenly over the year, exceptfor February to April. Second, the paddy pledging programme may also havehad an influence. April is the last month of the pledging programme (except inthe Southern region, where little rice is grown), and by this time most of thesupplies of pledged paddy are in the hands of the government. Since thegovernment does not typically plan to sell its rice right after the end of thepledging programme, there is a relative tightness of supplies, leading to higherprices around April.
THE POLITICAL ECONOMY OF THAI RICE PRICE AND EXPORT POLICIES 199
ES_RC_9-8 18/8/10 20:23 Page 199

200 POLICY RESPONSES IN TRADITIONAL EXPORTING COUNTRIES
Figure 10.3 Trends in (a) paddy 5% prices and (b) Hom Mali paddy prices(centred moving averages)
Source: Office of Agricultural Economics
Bah
t per
ton
12,000
10,000
8000
6000
4000
2000
0
Jan-
84
Jan-
85
Jan-
86
Jan-
87
Jan-
88
Jan-
89
Jan-
90
Jan-
91
Jan-
92
Jan-
93
Jan-
94
Jan-
95
Jan-
96
Jan-
97
Jan-
98
Jan-
99
Jan-
00
Jan-
01
Jan-
02
Jan-
03
Jan-
04
Jan-
05
Jan-
06
Jan-
07
Jan-
08
Jan-
09
RealNominal
Jan-
84
Jan-
85
Jan-
86
Jan-
87
Jan-
88
Jan-
89
Jan-
90
Jan-
91
Jan-
92
Jan-
93
Jan-
94
Jan-
95
Jan-
96
Jan-
97
Jan-
98
Jan-
99
Jan-
00
Jan-
01
Jan-
02
Jan-
03
Jan-
04
Jan-
05
Jan-
06
Jan-
07
Jan-
08
Jan-
09
Bah
t per
ton
14,000
12,000
10,000
8000
6000
4000
2000
0
RealNominal
(a)
(b)
ES_RC_9-8 18/8/10 20:23 Page 200

Impact on the structure of the rice market
The higher pledging price has resulted in an increasing government role in therice sector. It not only increases the budget for the programme, but also resultsin an increasing amount of rice that the government has to store, mill and sell.According to Table 10.1, the amount of pledged paddy was as high as 38 percent of wet-season paddy production in 2004–2005 and 44 per cent of dry-season production in 2008. The government, therefore, is now the country’slargest buyer and seller of rice, leading to at least three consequences.
THE POLITICAL ECONOMY OF THAI RICE PRICE AND EXPORT POLICIES 201
Figure 10.4 Seasonal price indices of (a) paddy 5% brokens and (b) Hom Mali
Source: Office of Agricultural Economics
Inde
x110
105
100
95
90
85Jan Feb Mar Apr May Jun Jul Aug Sep Oct Nov Dec
Inde
x
110
105
100
95
90
85Jan Feb Mar Apr May Jun Jul Aug Sep Oct Nov Dec
1984–19911992–20002001–2008
(a)
(b) 1984–19911992–20002001–2008
Table 10.3 Seasonal price indices
Paddy 5% Khao Dok Mali (KDML)1984– 1992– 2001– 1984– 1992– 2001–1991 2000 2008 1991 2000 2008
Peak month August September April September February AprilTrough month December April December November December December(Max–min) of 17.9 9.8 8.3 16.2 18.2 13.1seasonal factorsCV of seasonal factors 5.9 3.7 2.9 5.3 5.3 4.2
Source: Data from Office of Agricultural Economics
ES_RC_9-8 18/8/10 20:23 Page 201

First, the rice markets are now less competitive. The increase in the share ofpledged paddy has reduced the supply of paddy to be handled by the market,thus reducing the number of local rice traders and central paddy marketsoperated by private operators (Isvilanond and Naiwikul, 2006).
Second, the government lacks the necessary facilities to handle severalmillion tons of rice and thus relies upon the services of the rice mills andexporters, paying attractive fees for storage and milling services. Since thegovernment needs only 500–600 out of more than a few thousand medium-and large-scale mills,7 rice millers who want to participate in the programmemust lobby hard with government officials. By paying high rates for millingservices, the pledging programme has distorted the market and created anuneven playing field in the milling business. Although comprehensive data aredifficult to obtain, it appears that the milling industry has become moreconcentrated. Certainly, the rice export sector has become more concentratedin the hands of four to six large exporters. In 2005, only one exporter was ableto win government rice sales, and the real owner of the company is believed tobe the wife of an influential politician.
Political economy of the paddy pledging programme: a qualitative impact assessment
The paddy pledging programme has generated huge economic rents, especiallyin recent years. Before 2001–2002, the rent was limited because the volume ofpledged paddy was small. The large increase in pledging prices since2001–2002 has not only resulted in a larger subsidy for the farmers, but alsohigher rent for those involved in the pledging programme, especially the ricemillers, exporters and politicians. This section argues that the real motive ofthe paddy pledging programme is to increase the rents that accrue to pleasevarious interest groups and help politicians get re-elected.
Rents accrue through several channels. Farmers receive the interest subsidy,as well as the difference between the market price and the target price. Ricemillers receive milling fees and do not need to borrow money to procure paddy,since the government does it for them. Exporters receive storage fees, as well asthe difference between the export price and the successful bidding price offeredfor government rice. Since 2001, all of these rents increased substantially afterpledging prices were set at a level higher than market prices. These rents aretypically captured by well-to-do farmers, farmer associations and cooperatives,and large millers and exporters. Of course, some of these rents are shared withpoliticians.
It was shown earlier that most of the benefits from the difference betweenthe market price and the pledging price of paddy go to well-to-do farmers inirrigated areas. But the high pledging price also benefits the rice millers as wellas farmer cooperatives who engage in the warehouse deposit slip pledgingprogramme (which accounts for 70 per cent of the total amount of pledgedpaddy). They reap substantial benefit from the difference between the pledging
202 POLICY RESPONSES IN TRADITIONAL EXPORTING COUNTRIES
ES_RC_9-8 18/8/10 20:23 Page 202

prices and the market prices by purchasing the paddy from the farmers at themarket price before the programme starts or from the small farmers who find itinconvenient to sell their paddy to the programme. The large farmers andmillers then obtain loans from the pledging programme using the farmers’identification. Other benefits to the millers include the fees for their storage,milling and rice-mixing services for the programme. There is also evidence thatsome of the rice millers and warehouse owners who provide the storage servicefor the programme illegally sold the government paddy and rice from the stockand refilled their warehouses later when the government wanted to sell rice.Hundreds of rice millers were sued by the PWO based on such claims.
The large economic rents available have led to much wasteful spending.For example, the rice millers who want to participate in the programme mustmeet minimum requirements for milling and storage capacity, and thus need toinvest in order to meet these requirements. Titapiwatanakun (2006) finds thatbetween 1987 and 2005, the investment per rice mill increased from 0.86million baht to 1.62 million baht, while the investment to labour ratioincreased from 0.4 million baht to 0.73 million baht. This over-investment isvery wasteful of scarce resources – indeed, if the pledging programme were tobe eliminated, hundreds of rice mills and silos would go bankrupt.
In addition to lobbying to join the programme, some rice mill owners haveestablished a network of rice mills that holds greater bargaining power with thegovernment. This explains why there are only 400–600 millers (out of 39,887rice mills in 2005) who have registered to join the programme. In addition, somenon-participating rice mills lobby to ship paddy to participating mills in anotherprovince, which can lead to wasteful expenditure on transport. The programmealso has a negative impact on rice quality, which is discussed more below.
The rent that goes to rice exporters who win the auction of governmentrice is the difference between the export prices and the bidding price. There areseveral tactics that the exporters employ to maximize rents. Secretive bid collu-sion among the bidders is one common tactic, and it can be inferred from thefollowing facts: (1) the winner of the big lots always comes from the samesmall group; (2) the bidding prices of all bidders are unrealistically low relativeto export prices; and (3) there were occasional news reports that the durationbetween the bid announcement and the closing date for bid submission was tooshort (Matichon Online, 4 November 2008). Some exporters lobby the govern-ment to change its terms of sale after the bid. Another tactic is to bid for ricefrom old stocks at low prices. Such bids allow exporters to make large profitsby bribing the officials who control the stock for access to the better qualityrice from the new stock. Since the sale contracts usually give the bid winners upto six months to pay for the rice, this amounts to a free loan for severalmonths. Finally, some bureaucrats and politicians involved in the programmealso capture parts of the rent by changing the regulations or granting specialexemptions to certain rice millers and exporters.
The paddy pledging programmes are plagued with corruption chargesevery year. In 2006, there were more than 200 millers who were charged by the
THE POLITICAL ECONOMY OF THAI RICE PRICE AND EXPORT POLICIES 203
ES_RC_9-8 18/8/10 20:23 Page 203

PWO for violation of contracts and fraud, and 50 millers were blacklisted. Yetthere were attempts to pardon some of them, arguing that without them therewould be too few rice mills to carry out the paddy pledging programme. Anexporter who won the biggest rice bid in 2005–2006 and defaulted on its loanfrom the commercial banks was sued by the PWO for violation of contract. In2008, the company changed its name and successfully bid again for govern-ment rice. This is not surprising because it is well known that the rice millersand exporters who do business with the government have strong political tiesor are politicians themselves.
Despite the widespread corruption and negative effects on the rice industry,there has not been strong public opposition against the policy. Most taxpayersignorantly support the policy because they believe that the policy helps poorfarmers – when the reality, as we have seen, is quite the opposite. In addition,the public has never been informed of the magnitude of the actual costs andlosses of the programme. The politicians have incentives to make theprogramme as opaque as possible because it has become one of the most effec-tive means of using public money to win re-election. Ultimately, since the rentsare distributed to many participants in the rice trade at the expense ofdispersed taxpayers who do not have full knowledge of the programme, thereare no reasons for politicians to eliminate the pledging policy.
The rice price spike and responses by the Thaigovernment: Price and export policies in 2007–20088
Rice prices were relatively stable until the beginning of 2008 when a dramaticspike occurred (see Figure 10.5). There are three possible reasons that explainthis spike. First, a supply shock in the wheat market in 2006, caused by severalconsecutive years of Australian drought, led to effects in the rice market becauserice and wheat are substitutes, especially in India and China. Wheat pricessurged in October 2006 and almost reached the same level as the rice price inOctober 2007 (see Figure 10.5). Second, export bans in India and Viet Nam ledto a large reduction in supplies on the world market. Third, strong buying bythe Philippines fuelled speculation and hoarding around the world (see Chapter2 of this book for more details on the world rice crisis). As supplies dried upfrom other origins, Thailand responded with record levels of exports. To under-stand the performance of Thai exports, one needs to examine the differentpolicies adopted by the two different Thai governments between 2006 and2008. Below, we argue that without the minimal intervention policy imple-mented by the Surayud government in 2006–2007, the rice price spike mighthave lasted longer than the five months it did.
The 2006–2007 policy of the bureaucracy-led government
After the military coup in September 2006, the bureaucracy-led governmentreverted to the traditional price pledging policy by reducing the pledging price
204 POLICY RESPONSES IN TRADITIONAL EXPORTING COUNTRIES
ES_RC_9-8 18/8/10 20:23 Page 204
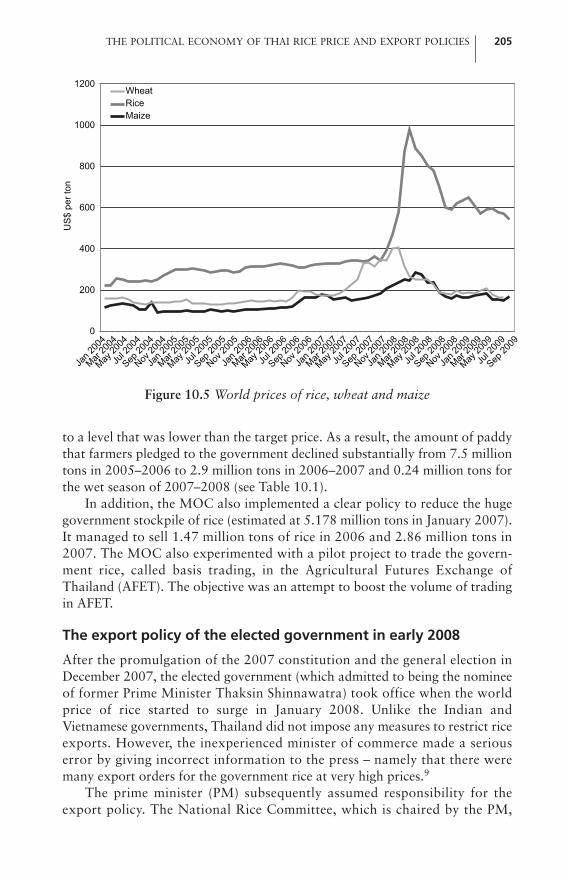
to a level that was lower than the target price. As a result, the amount of paddythat farmers pledged to the government declined substantially from 7.5 milliontons in 2005–2006 to 2.9 million tons in 2006–2007 and 0.24 million tons forthe wet season of 2007–2008 (see Table 10.1).
In addition, the MOC also implemented a clear policy to reduce the hugegovernment stockpile of rice (estimated at 5.178 million tons in January 2007).It managed to sell 1.47 million tons of rice in 2006 and 2.86 million tons in2007. The MOC also experimented with a pilot project to trade the govern-ment rice, called basis trading, in the Agricultural Futures Exchange ofThailand (AFET). The objective was an attempt to boost the volume of tradingin AFET.
The export policy of the elected government in early 2008
After the promulgation of the 2007 constitution and the general election inDecember 2007, the elected government (which admitted to being the nomineeof former Prime Minister Thaksin Shinnawatra) took office when the worldprice of rice started to surge in January 2008. Unlike the Indian andVietnamese governments, Thailand did not impose any measures to restrict riceexports. However, the inexperienced minister of commerce made a seriouserror by giving incorrect information to the press – namely that there weremany export orders for the government rice at very high prices.9
The prime minister (PM) subsequently assumed responsibility for theexport policy. The National Rice Committee, which is chaired by the PM,
THE POLITICAL ECONOMY OF THAI RICE PRICE AND EXPORT POLICIES 205
Figure 10.5 World prices of rice, wheat and maize
US
$ pe
r ton
1200
1000
800
600
400
200
0
Jan 2
004
Mar 20
04
May 20
04
Jul 2
004
Sep 20
04
Nov 20
04
WheatRiceMaize
Jan 2
005
Mar 20
05
May 20
05
Jul 2
005
Sep 20
05
Nov 20
05
Jan 2
006
Mar 20
06
May 20
06
Jul 2
006
Sep 20
06
Nov 20
06
Jan 2
007
Mar 20
07
May 20
07
Jul 2
007
Sep 20
07
Nov 20
07
Jan 2
008
Mar 20
08
May 20
08
Jul 2
008
Sep 20
08
Nov 20
08
Jan 2
009
Mar 20
09
May 20
09
Jul 2
009
Sep 20
09
ES_RC_9-8 18/8/10 20:23 Page 205

established a new subcommittee to handle rice exports, replacing the oldcommittee that had been under the responsibility of the MOC. The PMappointed a senior official from his own office as chairman and one of hisclosest aides to be a key member of the subcommittee.
There were several attempts by the PM, Mr Samak Soonthonravej, and hisaide to sell government rice. First, Samak offered to sell rice to the Philippinegovernment. According to senior officials, the PM wanted the Philippinegovernment to buy Thai rice without participating in an open auction. Sincethe Philippine government is required to sign an MOU with any country thatwants to sell rice to the Philippines, the Philippine Secretary of Agriculturebegan negotiations and the drafting of an MOU (which needed approval fromthe Philippine cabinet) with senior Thai officials. For unknown reasons, theMOU was never submitted for approval. One possible explanation is thatwhile the senior officials attempted to organize a group of five major Thaiexporters (who always won government rice auctions) to negotiate a riceexport deal with the Philippine government, the PM’s aide wanted anotherexporter to sell the government rice. This may explain why Thailand ultimatelyfailed to sell rice to the Philippines. Another possible explanation was that theThai private exporters could not obtain the sovereign guarantee required bythe Philippines, because Thai laws prohibit the Thai government from guaran-teeing private business dealings.10
Next, the PM’s aide pushed for a G-to-G rice sale by the PWO but againfailed because the Chairman of the Rice Release Committee, who was also thepermanent secretary of the PM’s Office, and the PM’s aide did not have theexperience required to successfully carry out a G-to-G sale without help fromexperienced senior MOC officials – who were excluded from the deal. Thecommittee could not rely on the PWO, which lacked a board of directors andchief executive officer at the time.11 Unhappy with such failure, the PMpublicly criticized in parliament the performance of some senior MOCofficers.12
In April 2008, the Malaysian government also wanted to buy 500,000 tonsof rice from the Thai government. The PM agreed to sell it at a ‘friendship’price. Since the senior official at the Department of Foreign Trade did not wantto sell rice to Malaysia at a low price, the Department encouraged privateexporters to negotiate directly with the Malaysian government. Theseexporters successfully exported only 250,000 tons before the world rice pricestarted to decline in May and the Vietnamese government lifted the export ban.
Aside from the Philippine and Malaysian rice deals, Thailand did not havea rice export policy during the tenure of the Samak government (which endedin September 2008). It was not clear why the government failed to capitalize onits 2.1 million tons of rice stock by selling rice to Thai exporters when worldprices were extremely high. One possible reason is that the government wasworried about high domestic rice prices. Had all the government stock beenexported, the domestic rice price would have surged even more than it did andreinforced prevailing inflationary pressure (Thailand experienced inflation of
206 POLICY RESPONSES IN TRADITIONAL EXPORTING COUNTRIES
ES_RC_9-8 18/8/10 20:23 Page 206
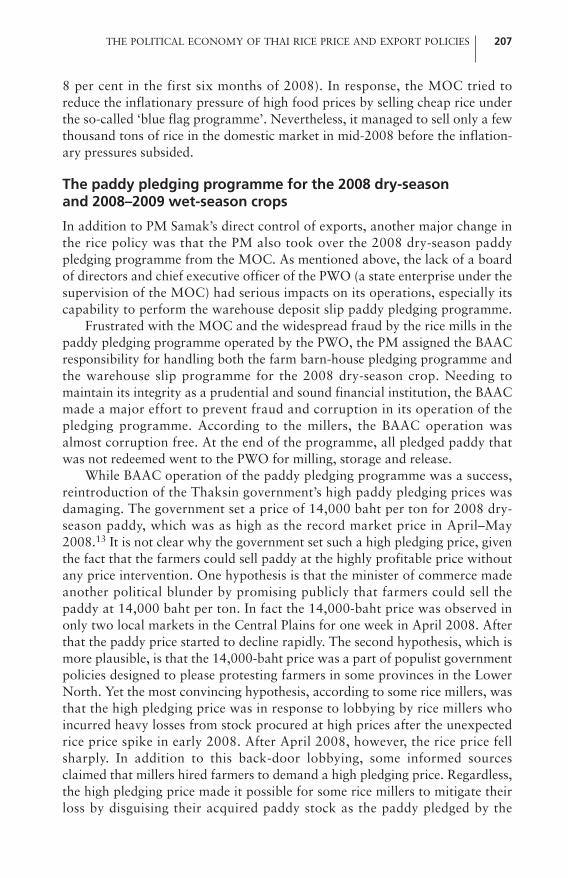
8 per cent in the first six months of 2008). In response, the MOC tried toreduce the inflationary pressure of high food prices by selling cheap rice underthe so-called ‘blue flag programme’. Nevertheless, it managed to sell only a fewthousand tons of rice in the domestic market in mid-2008 before the inflation-ary pressures subsided.
The paddy pledging programme for the 2008 dry-season and 2008–2009 wet-season crops
In addition to PM Samak’s direct control of exports, another major change inthe rice policy was that the PM also took over the 2008 dry-season paddypledging programme from the MOC. As mentioned above, the lack of a boardof directors and chief executive officer of the PWO (a state enterprise under thesupervision of the MOC) had serious impacts on its operations, especially itscapability to perform the warehouse deposit slip paddy pledging programme.
Frustrated with the MOC and the widespread fraud by the rice mills in thepaddy pledging programme operated by the PWO, the PM assigned the BAACresponsibility for handling both the farm barn-house pledging programme andthe warehouse slip programme for the 2008 dry-season crop. Needing tomaintain its integrity as a prudential and sound financial institution, the BAACmade a major effort to prevent fraud and corruption in its operation of thepledging programme. According to the millers, the BAAC operation wasalmost corruption free. At the end of the programme, all pledged paddy thatwas not redeemed went to the PWO for milling, storage and release.
While BAAC operation of the paddy pledging programme was a success,reintroduction of the Thaksin government’s high paddy pledging prices wasdamaging. The government set a price of 14,000 baht per ton for 2008 dry-season paddy, which was as high as the record market price in April–May2008.13 It is not clear why the government set such a high pledging price, giventhe fact that the farmers could sell paddy at the highly profitable price withoutany price intervention. One hypothesis is that the minister of commerce madeanother political blunder by promising publicly that farmers could sell thepaddy at 14,000 baht per ton. In fact the 14,000-baht price was observed inonly two local markets in the Central Plains for one week in April 2008. Afterthat the paddy price started to decline rapidly. The second hypothesis, which ismore plausible, is that the 14,000-baht price was a part of populist governmentpolicies designed to please protesting farmers in some provinces in the LowerNorth. Yet the most convincing hypothesis, according to some rice millers, wasthat the high pledging price was in response to lobbying by rice millers whoincurred heavy losses from stock procured at high prices after the unexpectedrice price spike in early 2008. After April 2008, however, the rice price fellsharply. In addition to this back-door lobbying, some informed sourcesclaimed that millers hired farmers to demand a high pledging price. Regardless,the high pledging price made it possible for some rice millers to mitigate theirloss by disguising their acquired paddy stock as the paddy pledged by the
THE POLITICAL ECONOMY OF THAI RICE PRICE AND EXPORT POLICIES 207
ES_RC_9-8 18/8/10 20:23 Page 207

farmers, using farmers’ identities.As a consequence of the high pledging price, 3.93 million tons (44.8 per
cent of the 2008 dry-season paddy) went into the pledging programme, thehighest percentage on record. Government rice stocks swelled to more than 4million tons in October 2008, one month before the harvesting of the wet-season crop. There were also news reports that some traders smuggled paddyfrom Cambodia, Laos and Myanmar to take advantage of the high prices inThailand, meaning that some of the subsidy was given to farmers and tradersin those countries. The recorded volume of dry-season pledged paddy in 2008had a negative impact on Thai exports because almost half of the dry-seasoncrop went into government stocks (see below for more details).
Policies in late 2008
In September 2008, PM Samak was forced out of office by the constitutionalcourt verdict on a conflict-of-interest charge. Mr Somchai Wongsawad, fromthe same party as Samak, was elected by the parliament as the new PM. Thenew minister of commerce successfully asked the new PM to transfer theresponsibility of running the wet-season pledging programme back to the PWOand the authority for rice sales back to the MOC. However, there wereconflicts between the commerce minister, who wanted to maintain the highpledging price, and the new deputy prime minister, who supervised theeconomic ministries, including the Ministry of Finance.
The minister of commerce pushed for the pledging price of 14,000 baht perton for the 2008–2009 wet-season crop. There was a rumour that the politi-cians tried to make deals with some rice mill owners by offering them contractsto participate in the pledging programme in exchange for 2000–3000 baht forevery ton of pledged paddy. The 3000-baht bribe was possible only if thepledging price was set at 14,000 baht per ton, given the market price of9000–10,000 baht. But the National Rice Committee decided to set the pledg-ing price at 12,000 baht per ton, thanks to the insistence of the deputy primeminister, a former banker, who was highly concerned about the huge fiscal costof the programme.
The pledging price of 12,000 baht was still attractive relative to the declin-ing market price, however. Many rice millers lobbied politicians to allow themto procure paddy under the pledging programme from nearby provinces thathad few mills. As a result, about 4.55 million tons of paddy were pledged,accounting for 19.2 per cent of the 2008–2009 wet-season crop, the largestwet-season quantity in three years.
By the third quarter of 2008, the Farmer Assistance Fund ran out of fundsbecause, while the amount of dry-season pledged paddy surged to 3.93 milliontons, the government failed to sell any rice from its stock. Since the BAAC didnot obtain any debt repayment from the Farmer Assistance Fund, it did nothave additional capital to lend to the farmers in the 2008–2009 wet-seasonpledging programme. The government, therefore, was forced to ask the BAAC
208 POLICY RESPONSES IN TRADITIONAL EXPORTING COUNTRIES
ES_RC_9-8 18/8/10 20:23 Page 208
to borrow money from commercial banks to finance its interventionprogramme in the wet season of 2008–2009. The loan was 110 billion bahtfrom four commercial banks in which the government was the largest share-holder, at the interest rate of MLR�1.5, and guaranteed by the government.
In October and November, however, the minister of commerce decided torelease government rice, which was very unusual because it was the harvestingperiod and thus the sale could have negatively affected the market price ofpaddy. On 5 November, the government decided to sell 1.59 million tons to thehighest bidders. A second authorization to approve further sales of 1.106million tons came on 28 November, a few days before the constitutional courtruling to disband four government coalition parties. The average bidding pricewas substantially lower than the existing FOB price (8100 baht versus 20,904baht per ton), resulting in heavy losses as discussed above. The press alsoreported that there were irregularities in the bidding procedure (MatichonDaily, 2008). Six exporters were awarded contracts. One of them, believed tobe the same company that won the single largest export bid in 2006, breachedthe contract and defaulted on loans from several commercial banks. Otherirregularities surfaced later.14 The Ministry of Commerce set up a committee todetermine whether there were any irregularities in the bidding process. Theinvestigation involved only some senior officers at the PWO.
The deputy PM also proposed a new policy measure to induce the farmersin the pledging programme to sell their rice on the AFET. This policy was notimplemented because the government was forced out by the court decision todisband three parties on 2 December 2008.
The impacts of government policies and the rice price spike
Because of the spike of world rice prices in early 2008 and the export restric-tions in Thailand’s two major competitors (India and Viet Nam), Thailand wasable to export more than 10 million tons in 2008. How did Thailand manageto export so much rice? This section also assesses the impacts of the pledgingprogramme and government stocks on the competitiveness of Thai riceexports, as well as the impact of higher world rice prices on supply responseand agricultural wages.
How did Thailand manage to export 10 million tons of rice in 2008?
Despite the failure of the Samak government to sell rice to the Philippinegovernment and the lack of a clear policy to release rice from its stocks, Thairice exports reached a record level of more than 0.9 million tons per month inthe first seven months of 2008, with total annual export of more than 10million tons (see Figure 10.6). This was in large part due to the policy of theprevious government led by General Surayud Chulanont. In June 2007, the
THE POLITICAL ECONOMY OF THAI RICE PRICE AND EXPORT POLICIES 209
ES_RC_9-8 18/8/10 20:23 Page 209
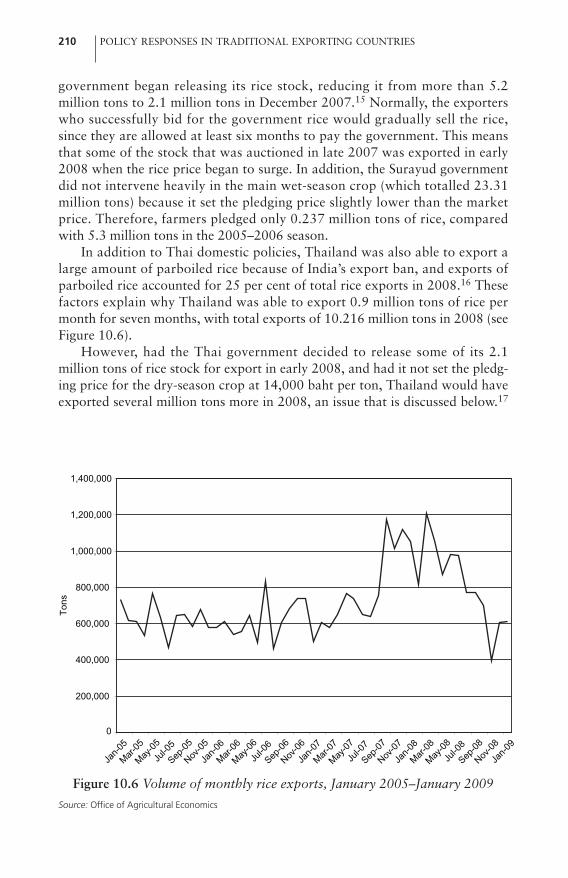
government began releasing its rice stock, reducing it from more than 5.2million tons to 2.1 million tons in December 2007.15 Normally, the exporterswho successfully bid for the government rice would gradually sell the rice,since they are allowed at least six months to pay the government. This meansthat some of the stock that was auctioned in late 2007 was exported in early2008 when the rice price began to surge. In addition, the Surayud governmentdid not intervene heavily in the main wet-season crop (which totalled 23.31million tons) because it set the pledging price slightly lower than the marketprice. Therefore, farmers pledged only 0.237 million tons of rice, comparedwith 5.3 million tons in the 2005–2006 season.
In addition to Thai domestic policies, Thailand was also able to export alarge amount of parboiled rice because of India’s export ban, and exports ofparboiled rice accounted for 25 per cent of total rice exports in 2008.16 Thesefactors explain why Thailand was able to export 0.9 million tons of rice permonth for seven months, with total exports of 10.216 million tons in 2008 (seeFigure 10.6).
However, had the Thai government decided to release some of its 2.1million tons of rice stock for export in early 2008, and had it not set the pledg-ing price for the dry-season crop at 14,000 baht per ton, Thailand would haveexported several million tons more in 2008, an issue that is discussed below.17
210 POLICY RESPONSES IN TRADITIONAL EXPORTING COUNTRIES
0
200,000
400,000
600,000
800,000
1,000,000
1,200,000
1,400,000
Jan-0
5
Mar-05
May-05
Jul-0
5
Sep-05
Nov-05
Jan-0
6
Mar-06
May-06
Jul-0
6
Sep-06
Nov-06
Jan-0
7
Mar-07
May-07
Jul-0
7
Sep-07
Nov-07
Jan-0
8
Mar-08
May-08
Jul-0
8
Sep-08
Nov-08
Jan-0
9
Tons
Figure 10.6 Volume of monthly rice exports, January 2005–January 2009
Source: Office of Agricultural Economics
ES_RC_9-8 18/8/10 20:23 Page 210

Impact of the paddy pledging programme on rice quality and export competitiveness
The paddy pledging programme affects the competitiveness of Thai riceexports in three ways. First, since 2001 the higher pledging prices have madeThai rice more expensive than Vietnamese rice (see Figure 10.7; notice that theprice gap between Thai and Vietnamese rice declined in 2007 when the pledg-ing programme offered lower prices relative to the market). Second, stock andrelease policies also affect competitiveness. As shown in the previous section,the seasonal price index reaches its peak in April, two months after the harvest,because most rice is still in government stock and at this time the governmentdoes not want to release rice, fearing that it will depress the market price. Thehigh domestic price in the first quarter coincides with the winter–spring harvestin Viet Nam (the crop that provides most of its exportable supplies), givingVietnamese exporters an advantage at this crucial time. Third, the paddypledging programme also affects the quality of Thai rice. For decades, Thai ricehas been of higher quality than that of its neighbours because the Thai riceindustry has been exposed to the competitive pressures of the world market forcenturies and has been subject to a lesser degree of government intervention.Thus, it has in the past been in the interest of farmers, traders and exporters tosell high-quality rice and so receive the highest possible prices (Thai Rice,2008). The pledging programme has gradually reduced the incentives toprovide high-quality rice as now farmers and traders are able to produce and
THE POLITICAL ECONOMY OF THAI RICE PRICE AND EXPORT POLICIES 211
Figure 10.7 Export prices of Thai and Vietnamese rice
Source: FAO
700
600
500
400
300
200
100
0
Viet 25%Thai 25%
2004 2005 2006 2007 2008
US
$ pe
r ton
ES_RC_9-8 18/8/10 20:23 Page 211

trade low-quality paddy to the government at high prices. The government isnow the largest trader in the rice market, and its impact on the market shouldnot be underestimated.
The impact of government stock on rice exports
Because of the increasing volume of pledged paddy (see Table 10.1), thegovernment rice stock has swollen, displacing private stocks. The pledgedpaddy for both wet and dry seasons jumped to 8.45 million tons in2004–2005, declined slightly to 7.47 million tons in 2005–2006, but increasedagain to 8.48 million tons in 2008–2009. Normally the stock will rise duringthe pledging periods, i.e. November–April and May–July, and fall thereafter asthe government begins releasing rice from its stock. But in 2005 the commerceminister put a brake on rice sales, resulting in rice stocks that were nearly fourtimes higher in 2005 than in 2003. This situation raised two interestingquestions: What is the government’s strategy for releasing rice from its stock?And how does the government stock affect rice exports?
It can be argued that the objective of the rice release policy is for thegovernment to minimize its loss from rice sales by releasing rice from its stockwhen the world rice price is high.18 In addition, the government will not releaserice during the harvest period or when the world rice price is low. Yet, if it doesnot release rice, the stock will accumulate, affecting the liquidity of the FarmerAssistance Fund which is responsible for the financing of the pledgingprogramme. However, sometimes the government is willing to hold more stockeven if it has to borrow more money for the pledging programme, as was seenin 2008–2009.
The decision to release rice from the stock is the responsibility of the minis-ter of commerce, with final approval coming from the National RiceCommittee. Before 2007, the bureaucracy-led subcommittee was responsiblefor the rice auction, although decisions had to be approved by the minister andthe National Rice Committee. In 2007, the minister of commerce took chargeof the auction process, thus blurring the separation of power between thebureaucrats and the politicians. However, the deputy minister successfully soldseveral million tons of rice in a transparent and corruption-free process,although there were some irregularities in the October–November 2008 ricebids.
The existing rice release and stock policies have two major consequences.First, the decision process is tedious and time consuming. Sometimes thegovernment is reluctant to release rice despite unreasonably high levels ofstock, possibly because both the politicians and bureaucrats responsible forrice sales are under public pressure not to sell rice at too low a price. Keepingrice in stock is politically safer than selling it at a low price and incurring a loss.As a result, some of the stock will be kept for so long that it deterioratescompletely, which will affect both the quantity and quality of rice exports.Second, the policies create conflict between the bureaucrats who are responsi-
212 POLICY RESPONSES IN TRADITIONAL EXPORTING COUNTRIES
ES_RC_9-8 18/8/10 20:23 Page 212

ble for rice bidding and the minister who not only has the power to authorizethe sale but also controls the subcommittee on rice release.19
How does the rice stock affect rice exports? One hypothesis is that anincrease in government stock, which displaces private stock, will have anegative effect on exports, and vice versa. For example, after the governmentfinalized the sale contract of 2.7 million tons of its rice stock in November2008, the monthly rice export jumped from 0.437 million tons in Novemberand 0.598 million tons in December 2008 to 1.02 million tons in January2009.
To test this hypothesis, we estimated a simple regression, using the level ofgovernment stock to explain rice exports. Indeed, there is a strong negativecorrelation between government stocks and exports (see Figure 10.8). In theshort term, a 10 per cent increase in stock will decrease exports by 6.4 per cent.Of more serious concern is that, in the long term, the 10 per cent increase instock reduces exports by 13 per cent, implying that the stock policy is a wasteof real resources as rice quality deteriorates to the point that it has no value.
One implication is that the pledging programme, together with the stockpolicy, will affect the welfare of Thai consumers and consumers in rice-import-ing countries. For example, in the first six months of 2008 when world riceprices were exceptionally high, the Thai government failed to release its 2.1million tons of rice stock. Moreover, the additional stock of 4.5 million tons ofpledged paddy from the 2008 dry season also had an adverse effect on riceexports in the last four months of 2008. Exports dropped sharply from 0.89
THE POLITICAL ECONOMY OF THAI RICE PRICE AND EXPORT POLICIES 213
Figure 10.8 Rice export and index of government rice stock
Source: Department of Foreign Trade, Thailand and Public Warehouse Organization, Ministry of Commerce, Thailand
0
20
40
60
80
100
120
140
160
180
Jan 0
6
Mar 06
May 06
Jul 0
6
Sep 06
Nov 06
Jan 0
7
Mar 07
May 07
Jul 0
7
Sep 07
Nov 07
Jan 0
8
Mar 08
May 08
Jul 0
8
Sep 08
Nov 08
0
200,000
400,000
600,000
800,000
1,000,000
1,200,000
1,400,000Stock IndexExports
Sto
ck in
dex
Exp
orts
(ton
s)
ES_RC_9-8 18/8/10 20:23 Page 213

million tons in July to 0.437 million tons and 0.598 million tons in Novemberand December 2008, respectively (see Figure 10.6). Such policy worsens bothglobal welfare and that of the Thais.
The impact of higher rice prices on supply response and agricultural wages
A key short-term impact of the higher rice prices in early 2008 was an increasein planted area. Dry-season planted area in 2008 increased by 27 per cent,while wet-season planted area in 2008–2009 increased by 0.8 per cent.However, part of the increase in production in the 2008–2009 wet-season cropmay be attributed to farmers’ expectation that the government will maintainthe high price of paddy pledging. In mid-2008 there was political pressure forthe government to set the pledging price at 14,000 baht per ton, the same priceas had been set for the dry-season crop (eventually, the price was set at 12,000baht per ton, as described earlier).
The high price of rice also had a visible effect on agricultural wages in thefirst half of 2008. The nominal agricultural monthly wage jumped from 3319baht the last in quarter of 2007 to 3639 baht in the first quarter of 2008 (anincrease of 9.6 per cent), although it then fell slightly to 3600 baht in thesecond quarter of 2008.
Summary and conclusions
This study analysed rice price and export policies in 2007–2008 and provideda quantitative and qualitative assessment of the impacts of Thailand’s paddypledging programme. After an abolition of agricultural export taxes in 1986,the paddy pledging policy has become the cornerstone of Thailand’s agricul-tural policy. The increase in pledging prices to levels higher than those of themarket has not only resulted in a huge fiscal burden, but also altered thepattern of seasonal price movements; negatively affected the competitiveness ofrice exports; reduced incentives for farmers, millers and exporters to enhancerice quality; distorted the rice market; and induced widespread rent-seekingactivities among farmers, rice millers, exporters and politicians, which in turnhas generated much waste of valuable resources. The pledging programme hashad some positive impact on farm prices during the harvesting season, thusbenefiting farmers who do not participate in the programme. However, thebenefits to farmers are not expected to offset the high financial and social costsdiscussed in this chapter.
After reviewing the 2007–2008 pricing and export policies, the studyassessed their impact on exports. The Samak government failed to capitalize onthe rice price spike of 2008, despite the existence of sizeable governmentstocks. Instead, the government chose to increase the pledging price of paddyto a record of 14,000 baht per ton for the 2008 dry-season crop in order toplease politically influential farmers and rice millers at a huge fiscal cost to thepublic. The record pledging price also negatively affected domestic rice prices
214 POLICY RESPONSES IN TRADITIONAL EXPORTING COUNTRIES
ES_RC_9-8 18/8/10 20:23 Page 214

and thus Thai rice exports in the last four months of 2008. The study alsofound that increases in government rice stocks, which are a direct consequenceof higher pledging prices, are negatively correlated with exports.
Nevertheless, Thailand was one of two major rice-exporting countries thatwere able to meet world demand during the 2008 rice price spike, thanks to theminimal intervention policy of the bureaucracy-led government in 2006–2007and the release of rice from government stock in late 2007.
The high rice prices in early 2008 also had a significant impact on agricul-tural wages, dry-season paddy production in 2008, and wet-season productionin 2008–2009. The record high ‘pledging price’ policy raises serious concernsabout the possibility of future reform of the price policy, e.g. the proposal ofoption insurance to replace the pledging programme. The high pledging pricesare now perceived by farmers as an entitlement, and have raised demands byfarmers who grow crops other than rice for unrealistically high pledging pricesfor their products. It will be difficult for any government, even fiscally conserv-ative ones, to resist the political pressure to maintain high pledging prices. Thefact that the paddy pledging programme has increasingly been abused by politi-cians as a means to provide financial and political support for their re-electionalso serves to make reform more difficult.
Notes1 The programme is similar to the US government loan-rate programme.2 The MLR is similar to the prime lending rate, and indicates the rate at which banks
lend to preferred customers.3 Note that the monetary cost does not include the total value of loans provided to
the farmers who pledged their paddy. Only the interest cost to the government isincluded.
4 The costs include (1) the pledging paddy loan provided by BAAC; (2) the expensesfor BAAC’s operations (3 per cent for the barn-house pledging and 0.5 per cent forthe warehouse deposit slip pledging); (3) the overhead expenses for PWO; (4) thecosts of paddy storage, milling, mixing and transportation paid to the rice millers;(5) the rental cost for rice storage and the loss of rice value as a result of storage;and (6) the costs of farmer registration and campaigning.
5 Note that the sale price was very low compared with the FOB price in the monthof auction, resulting in high economic rent for the bid winners and a greater lossfor the pledging programme. For example, the winning bid price for 5 per centwhite rice in the November 2008 auction was 11,236.5 baht per ton, while theequivalent export price at that time (the FOB price adjusted appropriately for themarketing margin) was 18,044 baht per ton. The rent (6807.5 baht per ton),which is the difference between the two prices, is shared between the bid winners(exporters) and the politicians and bureaucrats who are responsible for the ricebid.
6 It is interesting to note that the month with the lowest paddy price (December) hasnot changed. This is because it is the month with the year’s largest harvest.
7 In 2005, there were 39,887 rice mills in Thailand, most of which were very small.8 This section is drawn heavily from Siamwalla (2009) and Poapongsakorn (2010).
THE POLITICAL ECONOMY OF THAI RICE PRICE AND EXPORT POLICIES 215
ES_RC_9-8 18/8/10 20:23 Page 215

9 In fact, the correct information provided by a senior officer was that there were alarge number of orders for Thai rice received by Thai exporters.
10 There was a rumour that Thai politicians might have had an implicit deal withPhilippine politicians not to out-compete the Vietnamese bid.
11 The commerce minister failed to appoint a new board of directors of PWO toreplace the old board, most of whom resigned in February 2008. The absence of aboard affected the operation of PWO in at least two important ways. First, thePWO could not appoint a new chief executive officer to replace the one whoresigned in February 2008. Second, without the board, the operation of PWO wasseverely limited to routine functions. Most policy-related work has to be authorizedby the board.
12 One of his groundless criticisms was that some senior officers might have obtainedpersonal gain by helping the exporters to export rice.
13 Both the decision to give BAAC responsibility for the pledging programme and thesetting of a high pledging price were supported by the minister of finance, who wasthe most influential minister in the cabinet.
14 According to an informed source in the National Rice Committee, in its February2009 meeting an MOC official reported that the amount of rice loss (due to qualitydeterioration) rose sharply from 5 per cent of total stock as reported in late 2008,to about 40 per cent in February 2009. One plausible explanation is that some ofthe 2009 dry-season rice stock was exported in place of the 2005–2006 rice thatwas listed on the export bids. This is because most of the rice stock older than twoyears would have totally deteriorated.
15 The bureaucracy-led government sold 1.476 million tons of rice in 2006 and 2.864million tons in 2007. The sale in 2007 consisted of 2.15 million tons of white riceand 0.694 million tons of Dok Mali (jasmine) rice. Most of the rice sold in 2007was that procured through the 2004–2005 and 2005–2006 interventionprogrammes.
16 The Indian ban had a strong impact on the FOB price of parboiled rice, whichjumped from 12,326 baht per ton in January 2008 to a peak of 28,068 baht, andremained at more than 22,063 baht until November 2008 when it declined to18,532 baht.
17 The high pledging prices of paddy (as well as cassava and maize) resulted in anincreasing flow of these products from Thailand’s neighbouring countries includingCambodia, Laos and Myanmar. But there is no estimate of the volume broughtillegally into the programme, so it is difficult to say how much of Thailand’s riceexports in 2008 came from other countries.
18 Even rent-seeking politicians are under public pressure to sell rice at the highestpossible prices.
19 In the 2008 rice bids, a senior official at PWO was accused of wrongdoing despiteacting as she was instructed.
ReferencesIsvilanond, S. (2007) ‘Shaking the invisible hand’, an interview by Bob Hill, Rice
Today, October–December, pp26–31Isvilanond, S. and Naiwikul, O. (2006) ‘Producing high value Thai agricultural
products’, paper presented at the Bank of Thailand seminar, Bangkok, 7 July
216 POLICY RESPONSES IN TRADITIONAL EXPORTING COUNTRIES
ES_RC_9-8 18/8/10 20:23 Page 216

Matichon Daily (2006) ‘18 billion baht and paddy pledging’, Jord Pai Prachachuencolumn by Woot Sara, Matichon Daily, 2 November
Matichon Daily (2008) ‘News on government rice sale’ Matichon Daily, 17 December
Na Ranong, V. and Triamworakul, S. (2002) ‘Export cooperation in agriculture: A casestudy of rubber and rice in Thailand’, TDRI Year-end Conference-2002 on ‘Facingthe Challenges from Globalization’, Ambassador Hotel, Pattaya, November
Poaponsakorn, N. (2010) ‘A study of the rice intervention measures and corruptionprevention policy’, Research report prepared for the National Anti-CorruptionCommission, Thailand Development Research Institute
Poapongsakorn, N. and Isvilanond, S. (2008) ‘Key policy issues in the Thai rice indus-try: Myth, misguided policies and critical issues’, presented at the IRRI Rice PolicyForum, Los Baños, The Philippines, 18–19 February
Siamwalla, A. (1994) ‘An assessment of impact of price intervention programme in therice markets, 1992–3’, TDRI White Paper, No 7, Thailand Development ResearchInstitute, Bangkok
Siamwalla, A. (2009) ‘The rice price spike of 2008’, speech at the Foreign PressAssociation, Bangkok, 10 July 2009
Siamwalla, A. and Poapongsakorn, N. (1995) Agriculture and MacroeconomicPolicies: A Thai Case Study, FAO Expert Consultation on Monitoring the Impact ofStructural Adjustment Programme on the Agricultural Sector, Phuket, Thailand
Sriboonjitta, S. (1998) ‘The effect of paddy pledging policy on rice price: Statisticalevidence during 1979–1997’, Economic Journal of Chiang Mai University, vol 2, no 5, pp119–128
Thai Rice (2008) ‘An interview with Ammar Siamwalla’, Thai Rice, July–August,pp67–69
Titapiwatanakun, B. (2006) ‘Market liberalization and its relationship with marketstructure, conduct and performance of selected food processing industry inThailand’, a report prepared for ESCAP
Warr, P. and Kohpaiboon, A. (2007) ‘Distortions to agricultural incentives inThailand’, Agricultural Distortions Research Project Working Paper, World Bank,Washington, DC
THE POLITICAL ECONOMY OF THAI RICE PRICE AND EXPORT POLICIES 217
ES_RC_9-8 18/8/10 20:23 Page 217

ES_RC_9-8 18/8/10 20:23 Page 218

11
The Vietnamese Rice IndustryDuring the Global Food Crisis
Pham Hoang Ngan
Governance of and recent trends in the rice sector in Viet Nam
Institutions
Of all Viet Nam’s agricultural products, rice is the most important and politi-cally sensitive consumption good. Thus, the government monitors bothinternational and domestic rice price movements and uses trade policy tomaintain tight control over rice exports and input subsidies (for example fertil-izer, insecticide). Although the nation’s economy is now driven largely by the‘invisible hand’, it is agreed that government interventions are needed in thisarea in order to ensure social stability. This was especially deemed to be trueduring the turbulent period of the global rice price crisis in 2008.
In Viet Nam, the Ministry of Agriculture and Rural Development(MARD), Ministry of Industry and Trade (MOIT) and Viet Nam FoodAssociation (VFA) play key roles in the rice industry. In addition, two state-owned enterprises – the Northern Food Corporation (Vinafood 1) and theSouthern Food Corporation (Vinafood 2) – play key roles in rice marketing.
The VFA is an organization of enterprises involved in producing, process-ing and trading of food and agricultural products. Although membership inVFA is voluntary and its operations are funded by members’ profits, the
ES_RC_9-8 18/8/10 20:23 Page 219

Association is authorized to issue regulations on registration and implementa-tion of rice export contracts1 and is responsible for setting a floor price onexport contracts.
Normally, MARD and MOIT are responsible only for overseeing the riceindustry’s smooth operations and providing forecasts on prices, demand andsupply. In 2008, however, the two ministries intervened boldly when theybanned rice exports from late March to June. In the context of a global foodcrisis, the ministries explained that such decisive movement was necessary forthe nation’s food security.
Overview of food security policies
Significant recent developments in the world rice market and Viet Nam’s devel-opment have placed the country’s rice industry in a new position. First, thecountry’s average rice export prices soared, reaching a high of around$1000/ton in June. As a result, Viet Nam’s domestic rice prices increasedsharply, to a high of about 20,000 Vietnamese dong (VND)/kg ($1.3/kg) in lateApril 2008, thus lowering the living standards of the poor. Second, there hasbeen increased competition for land and water between rice production andindustrial crops as well as industrial and urban development. Between 2001and 2007, more than 500,000ha of farmland were converted into industrialparks. In 2008 alone, more than 125,000ha of rice fields were lost. On 18April 2008, the Vietnamese prime minister issued Decision No 391/QD-TTgon the review and inspection of the management and use of land for five years,with a focus on rice fields. Third, the cost of farm inputs for rice productionhas increased significantly, adversely affecting farm incomes and rural financialperformance. MARD has been assigned the task of developing policy aimed atensuring national food security and managing rice land.
Since the beginning of reforms in 1986, food security policies went throughtwo phases. In the first phase, emphasis was placed on striving to ensure suffi-cient food supplies at the national level. In the second phase, an effort wasmade to ensure that food supply was greater than domestic demand to allowfor exports. Important policies implemented during this phase include the 1993land law, which assigned responsibility to various authorities for administeringland use. Rice cultivation area increased quite rapidly due to multi-cropping(i.e. higher cropping intensity). Increased food production targets were alsoachieved through policies encouraging expansion of land area, supportinghigher yields through greater use of inputs and mechanization, and investing ininfrastructure for irrigation and rural transportation.
Current food security policies have been established at three different levels(national, regional and household) and include:
• allowing free trade and establishing distribution systems for rice transac-tions nationwide;
• maintaining 4 million hectares of rice cultivation land to meet fooddemand based on population growth;
220 POLICY RESPONSES IN TRADITIONAL EXPORTING COUNTRIES
ES_RC_9-8 18/8/10 20:23 Page 220

• creating conditions that help farmers in mountainous areas to diversifyactivities and widen their agricultural commodity production;
• balancing production and domestic demand in order to estimate rice-exporting targets from the beginning of the year;
• banning or restricting rice exports if necessary to ensure food security;• extending rice import–export rights for domestic private traders.
Trends in rice production
Viet Nam’s rice area changes from 1976 to 2007 can be divided into threephases. In the period 1976–1989, planted area and production of paddyremained stable at a low level: paddy planted area was less than 6 millionhectares (see Figure 11.1), and production was lower than 19 million tons (seeFigure 11.2). In the period of Doi Moi (Renovation) from 1990 to 1999,planted area and production of paddy grew dramatically, from 6 millionhectares in 1990 to 7.66 million hectares in 1999, which at that time was arecord high. In 1998, Viet Nam’s production of paddy exceeded 30 milliontons for the first time – an increase of nearly 60 per cent compared with 1990’s19 million tons.
From 2000 to 2007, paddy planted area generally decreased but annualpaddy production managed to increase slightly due to increased yields, andproduction hovered around 36 million tons from 2004 to 2007. Over thisperiod, planted area of paddy fell by nearly 300,000ha, with declines in allparts of the country except for the Northwest Highlands and CentralHighlands. Planted area declined the most in the Red River Delta (RRD), down105,000ha, followed by the Mekong River Delta (MRD) with a reduction of62,000ha. This reduction in planted area was mostly caused by a fall in thearea planted to the mua crop (the third crop of the year), as farmers shifted outof this season due to its low yields (see Figure 11.3). Among the three crops,yield of the winter–spring crop has always been the highest. The yield of themua paddy crop has generally been the lowest, but it has improved consider-ably in recent years, and in 2006, mua yields were slightly higher than those ofthe summer–autumn crop.
Although farmers’ profit from rice planting has improved, in the rangeVND8–10 million/ha per year depending on locality, it is less profitable thanmany other crops. Therefore, MRD farmers have adopted crop rotations onpaddy soil. Several crops or fish are grown in rotation with rice: fish, shrimp,vegetables and fruit. These rotations, which help to break the monoculture ofrice planting, reduce pests and diseases in the field and have achieved higheconomic returns of VND15–70 million/ha per year.
The paddy–fish rotation has achieved income of VND40–45 million/ha peryear and profit of VND20–25 million/ha per year. The paddy–shrimp rotationis adopted on saline soils where it is difficult to irrigate in the dry season butthere is abundant water in the rainy season. This rotation achieves annualincome of VND45–55 million/ha and annual profit of VND25–39 million/ha.
THE VIETNAMESE RICE INDUSTRY DURING THE GLOBAL FOOD CRISIS 221
ES_RC_9-8 18/8/10 20:23 Page 221

In the rice–vegetables/fruit rotation, farmers cultivate crops such as watermel-ons, cucumber or pumpkin after harvesting the winter–spring rice crop andbefore planting the summer–autumn rice crop. This model achieves annualincome of VND35–70 million/ha and annual profit of VND15–40 million/ha.
222 POLICY RESPONSES IN TRADITIONAL EXPORTING COUNTRIES
Figure 11.1 Viet Nam’s paddy planted area, million ha, 1976–2008
Note: WS indicates winter–spring crop; SA indicates summer–autumn crop; Mua is the third crop. Source: Raw data from www.agro.gov.vn
0
2
4
6
8
197619
7719
7819
7919
8019
8119
8219
8319
8419
8519
8619
8719
8819
8919
9019
9119
9219
9319
9419
9519
9619
9719
9819
9920
0020
0120
0220
0320
0420
0520
0620
0720
08
Mill
ions
of h
ecta
res
WS SA Mua Total
Figure 11.2 Viet Nam’s paddy production, million tons, 1976–2008
Note: WS indicates winter–spring crop; SA indicates summer–autumn crop; Mua is the third crop. Source: Raw data from www.agro.gov.vn
0
10
20
30
40
197619
7719
7819
7919
8019
8119
8219
8319
8419
8519
8619
8719
8819
8919
9019
9119
9219
9319
9419
9519
9619
9719
9819
9920
0020
0120
0220
0320
0420
0520
0620
0720
08
Mill
ions
of t
ons
(pad
dy e
quiv
alen
ts)
WS SA Mua Total
ES_RC_9-8 18/8/10 20:23 Page 222

Rice shock in 2008: Policies, exports and domestic prices
Viet Nam’s export policies and trends in domestic rice prices and exports
In the first six months of 2008, VFA and MOIT regulated rice exports asnormal by setting up export targets for the whole year as well as per quarter2
and setting guidelines on minimum export price and volume for each month.3
VFA also registered and assigned rice export volumes and prices for rice-exporting companies. From January to the middle of March 2008, domesticrice prices were relatively stable in the MRD at around VND6600/kg (seeFigure 11.4), although there was a relatively small increase in February becauseof the Lunar New Year celebrations. In the RRD market, ordinary rice pricefollowed the same general trend, standing at about VND6225/kg in Januaryand increasing to VND7225/kg in February for the Lunar New Year. In thefirst two months of the year, Viet Nam exported 459,000 tons of rice worth$190.1 million at an average price of $414 per ton (see Table 11.1).
World rice prices gathered further momentum in March, increasing to over$600/ton by the end of the month, up from $385/ton in January. Ordinary riceprices in Viet Nam’s domestic market also began to increase more substantiallyin March, although the increases were less than those on world markets. Theordinary rice price in Can Tho in the MRD increased slightly to VND7400/kg,VND600/kg higher than in February. In the RRD, the ordinary rice priceincreased to nearly VND9000/kg, VND1000/kg more than in February. It was
THE VIETNAMESE RICE INDUSTRY DURING THE GLOBAL FOOD CRISIS 223
Figure 11.3 Viet Nam’s paddy yield, ton/ha, 1976–2008
Note: WS indicates winter–spring crop; SA indicates summer–autumn crop; Mua is the third crop. Source: Raw data from www.agro.gov.vn
0
2
4
5
7
197619
7719
7819
7919
8019
8119
8219
8319
8419
8519
8619
8719
8819
8919
9019
9119
9219
9319
9419
9519
9619
9719
9819
9920
0020
0120
0220
0320
0420
0520
0620
0720
08
Tons
per
hec
tare
(pad
dy e
quiv
alen
ts)
WS SA Mua All
ES_RC_9-8 18/8/10 20:23 Page 223

in March that Viet Nam made a series of changes to rice export regulations.MOIT directed the VFA to reduce the export target to 3.5–4 million tons forthe whole of 2008, compared with the earlier target of 4.5–5 million tons.MOIT also decided to temporarily halt the signing of new rice export contractswith the aim of ensuring domestic food security, especially given a long periodof cold weather in the first two months of the year that damaged winter–springcrops in the northern provinces.4
In late April 2008, domestic rice prices in the MRD became extremelyvolatile, doubling over the course of a weekend and then falling back to someextent (although not to their original level). A key reason for the price rises washoarding and speculation based on anticipated higher prices, and the ensuingpanic buying by worried consumers. Some rice outlets halted sales and manypeople not usually in the business of trading rice became involved, such asvinegar and coffee merchants and warehouse owners. Even the owners offishing boats collected and sold rice illegally in neighbouring countries. Thestate did not have the tools and institutions to regulate rice purchases anddistribution, or to implement effective policies to stabilize the domestic market.At the same time, the private sector neglected to invest in and build its retailsystem.
On 27 April 2008, the prime minister promulgated a decision (Official Note612) to guide rice purchases according to the government’s plan to ensure suffi-cient rice for both domestic consumption and exports, to stabilize rice suppliesthroughout the country, and to avoid shortages in the domestic market.Supermarket chains such as Coop Mart and Big C supplied an additional 200tons of rice to its supermarket affiliates in Ho Chi Minh City, Bien Hoa, DaNang and Hanoi at prices that were slightly lower than the prices reachedduring the peak of the panic. Despite these measures, rice prices increased by
224 POLICY RESPONSES IN TRADITIONAL EXPORTING COUNTRIES
Table 11.1 Viet Nam’s monthly rice exports, 2008
Month Export quantity Export value Average export (thousand tons) (million US$) unit value (US$/ton)
(1) (2) (3)
January 131 51.0 389February 328 139.1 424March 558 255.0 457April 657 371.2 565May 560 444.1 793June 210 211.1 1005July 350 339.9 971August 361 289 801September 442 259 586October 300 144 480November 287 135 470December 437 180 412Total 4621 2818.4 610
Source: (1)-(2) General Department of Viet Nam Customs, (3) = (2)/(1)
ES_RC_9-8 18/8/10 20:23 Page 224

about 50 per cent from the end of April to the end of May, from VND7400/kgto more than VND11,000/kg. Farm prices also increased substantially duringthis time, from VND5100/kg to about VND6500/kg. This is a large increase injust one month, but it was less than the increase in retail prices.
In May and June, Viet Nam’s freeze on the signing of new rice exportcontracts continued, although there were 770,000 tons of rice exports duringthese months that were due to earlier contracts. These exports brought thetotal rice export volume for the first six months of 2008 to 2.4 million tons.The peak average export unit value was $1005 per ton in June, but thequantity of exports delivered in this month was less than the quantitiesexported in March and April (see Table 11.1). Note that the monthly exportunit values for Viet Nam typically correspond to world prices about twomonths earlier, as there is a lag between negotiation of the contract (when theprice is set) and delivery of the physical rice. During the crisis, despite theexport restrictions, there were strong connections between world prices anddomestic prices, especially those in the MRD. Indeed, the temporary ban onnew rice export contracts from 25 March to 30 June failed to lower Viet Nam’sdomestic prices.
Beginning in early June, domestic rice and paddy price began to decline asworld prices started to fall and it became clear that harvests of thewinter–spring crop in the country’s two key rice-producing regions were plenti-ful. On 21 July, the government announced a progressive export tax, rangingfrom a minimum VND500,000/ton (around $30/ton at prevailing exchangerates) for an export price of $600/ton, to a maximum VND2.9 million/ton($175/ton) for export prices of $1300/ton and higher. This announcement,made in the context of decreasing world rice prices, served to slow purchasesby export companies and thus rapidly pulled down domestic prices. In the firsthalf of August, paddy prices in the MRD reached about VND4500/kg, downabout 30 per cent from the peak in late May, indicating that rice farmers wereaffected more than any other industry players by the new tax policy.
As prices continued to fall from 21 July into early August, the Ministry ofFinance decided to stimulate prices for the farmer, and on 15 August raised theminimum taxable price to $800/ton. It also expanded credits and preferentialinterest rates for business enterprises to make rice purchases. Thus, govern-ment spending on rice exporters increased at the same time that the tax paid byrice-trading enterprises fell. In the wake of the reduction in export taxes, farmprices did improve in the MRD, from around VND4500/kg in the middle ofAugust to VND5000/kg by the end of the month, an increase of more than 10per cent. The increase in farm prices was short-lived, however, and by the endof September prices were back to the levels prevailing before the reduction inexport taxes.
In November 2008, in order to strengthen exports, the governmentannounced a ‘rescue policy’, which abolished the rice export tax and liberal-ized exports (traders were no longer required to register exports with the VFA).But in the wake of the US financial crisis and falling commodity prices on
THE VIETNAMESE RICE INDUSTRY DURING THE GLOBAL FOOD CRISIS 225
ES_RC_9-8 18/8/10 20:23 Page 225

world markets, the new policy failed to increase prices. Trading enterprisesfound it difficult to access new markets and establish new contracts. In thedomestic market, new harvests combined with slow purchases resulted in asharp increase in the quantity of rice that needed to be stored. By the end of2008, farm prices were roughly in line with levels prevailing in March.
Trends in domestic fertilizer prices
World market prices for urea, the most important fertilizer for rice farmers,increased steadily beginning in 2003. By 2006, prices were 50 per cent higherin real terms than in 2003. Prices then surged in 2007 and 2008 – betweenAugust 2007 and August 2008, prices nearly tripled for both urea anddiammonium phosphate (DAP). They then declined sharply beginning inSeptember.
These international price movements affected Vietnamese domestic prices(see Table 11.2). For urea, prices increased by 70 per cent in real terms betweenMarch 2006 and the peak in July 2008. Given the lag between pricemovements on international and local markets, Vietnamese agriculturalmaterials suppliers started lowering fertilizer prices substantially at the end ofOctober.
226 POLICY RESPONSES IN TRADITIONAL EXPORTING COUNTRIES
Figure 11.4 MRD ordinary paddy and rice price movements and world rice prices, 2008
Source: AGROINFO, www.agro.gov.vn
0
275
550
825
1100
1–6 J
an
14–2
0 Jan
28 Ja
n–3 F
eb
11–1
7 Feb
25 Feb
–2 M
ar
10–1
6 Mar
24–3
0 Mar
7–13
Apr
21–2
7 Apr
5–11
May
19–2
5 May
2–8 J
un
16–2
2 Jun
30 Ju
n–6 J
ul
14–2
0 Jul
28 Ju
l–3 A
ug
11–1
7 Aug
25–3
1 Aug
8–14
Sep
22–2
8 Sep
6–12
Oct
20–2
6 Oct
3–9 N
ov
17–2
3 Nov
1–7 D
ec
15–2
1 Dec
0
3000
6000
9000
12000
US
$ pe
r ton
VN
D p
er k
g
Thai 100%B (left axis)Paddy Can Tho (right axis)
Milled rice retail Can Tho (right axis)Viet 5% brokens (left axis)
Halt signing of new export contracts, 25 Mar–30 Jun
Progressive rice export tax announced 21 Jul
Minimum taxable export price raised 15 Aug
Rice export tax abolished November
ES_RC_9-8 18/8/10 20:23 Page 226

At the same time that urea prices were increasing, so were paddy prices.Thus, the price ratio of urea fertilizer to paddy fluctuated around a generallyflat trend during 2007 and 2008. When the price ratio is constant while paddyprices are rising, this leads to greater profits for farmers because materialinputs such as fertilizer account for only a fraction of total crop revenue.Indeed, Table 11.5 shows that farm profitability for the winter–spring crop inAn Giang increased in 2008 despite a decline in yields of 5 per cent. However,fertilizer prices soared at the onset of the 2008 summer–autumn crop, and bythe time farmers harvested that crop, paddy prices had declined sharply. Thus,for that crop, farmers were caught between high urea prices at planting timeand low paddy prices at harvest time.
What happened to farmers during the crisis?
Supply response
The increasing paddy prices in 2008 encouraged farmers to plant more crops,especially in the MRD (Viet Nam’s largest producer of rice for export). Theplanted area of the MRD’s summer–autumn and mua (autumn–winter) cropsincreased by 8 and 4 per cent respectively, compared to 2007 (see Tables 11.3and 11.4). In some MRD provinces, such as An Giang, this increase wassupported by local authorities, which provided funds for irrigation channels tocover an additional 1000ha of autumn–winter crop. In other key rice-produc-ing provinces of the MRD, such as Dong Thap, Tien Giang, Vinh Long and BacLieu, local farmers actively expanded autumn–winter rice crops onto land theyhad previously used for other cash crops and aquaculture.
However, as noted earlier, the implementation of the rice export tax regula-tions coupled with declining prices on world markets resulted in a sharp dropin paddy and rice prices in the MRD beginning in July 2008. The recordsummer–autumn crop strained the available storage space, and the export taxencouraged trading enterprises to cut their purchases. Domestic paddy prices
THE VIETNAMESE RICE INDUSTRY DURING THE GLOBAL FOOD CRISIS 227
Table 11.2 Urea prices in An Giang province, MRD, Viet Nam, 2003–2008
Month 2003 2004 2005 2006 2007 2008
January 3000 3000 3300 3975 4920 6050February 3000 3000 3425 4200 5000 6350March 3000 3000 3746 3800 4725 7000April 3000 3250 3700 3900 4700 7650May 3000 3300 3700 4080 4960 7800June 3000 NA 3700 NA 5000 8000July 3000 NA 3450 NA 5000 9000August 3000 NA 3400 NA 5050 8500September 3000 NA 3400 NA 5200 8300October 3000 NA 3400 NA 5200 7250November NA NA 3400 NA 5575 6000December NA NA 3400 NA 5800 5833
Source: AGROINFO, IPSARD-MARD, www.agro.gov.vn
ES_RC_9-8 18/8/10 20:23 Page 227

fell from mid-July until mid-August, when they reached around VND4400/kg— about the same as in late February–early March 2008. Given the high inputprices, average production costs in August were about VND3000–3500/kg.The low paddy prices, high input costs and sluggish sales due to weak exportdemand prevented MRD farmers from expanding the autumn–winter crop tomeet the target of 470,000ha, although the planted area of 392,000ha was stillthe highest level in the MRD in the previous four years.
Total area planted to rice for all of 2008 reached 7.4 million hectares, or200,000ha more than in 2007 (an increase of 2.7 per cent). The national
228 POLICY RESPONSES IN TRADITIONAL EXPORTING COUNTRIES
Table 11.3 Paddy production, planted area and yield, Viet Nam, 2005–2008
2005 2006 2007 2008
Production (thousand tons)Winter–spring 17,332 17,588 17,024 18,324Summer–autumn 10,436 9694 10,141 11,361Mua 8065 8567 8778 8946Total 35,833 35,850 35,943 38,631
Area (thousand ha)Winter–spring 2942 2996 2988 3013Summer–autumn 2349 2317 2204 2369Mua 2037 2012 2016 2018Total 7328 7325 7207 7400
Yield (ton/ha)Winter–spring 5.89 5.87 5.70 6.08Summer–autumn 4.44 4.18 4.60 4.80Mua 3.96 4.26 4.36 4.43Average 4.89 4.89 4.99 5.22
Source: GSO (2008)
Table 11.4 Paddy production, planted area and yield, MRD, 2005–2008
2005 2006 2007 2008
Production (thousand tons)Winter–spring 9077 8998 9072 9833Summer–autumn 8797 7839 8291 9272Mua 1425 1392 1315 1577Total 19,299 18,229 18,679 20,682
Area (thousand ha)Winter–spring 1479 1500 1507 1527Summer–autumn 1975 1910 1799 1940Mua 372 364 377 392Total 3826 3774 3683 3859
Yield (ton/ha)Winter–spring 6.14 6.00 6.02 6.44Autumn–winter 3.83 3.83 3.49 4.02Mua 4.45 4.10 4.61 4.78Average 5.04 4.83 5.07 5.36
Source: GSO (2008)
ES_RC_9-8 18/8/10 20:23 Page 228

average yield was 5.22 tons/ha, up 4.7 per cent from 4.99 tons/ha in 2007. Thecombination of expanded rice area and increased yield in 2008 resulted in anall-time record for rice production of 38.6 million tons, up 2.7 million tons(7.3 per cent) from 2007. This was more than 2 million tons higher than theoriginal target of 36 million tons and was much faster than the rate of popula-tion growth of approximately 1.2 per cent. As a result, Viet Nam was able toachieve both food security and export targets in 2008.
The winter–spring crop is the most important crop in the country, account-ing for nearly half of annual production. In 2008, winter–spring rice area, yieldand production for the whole country all increased in comparison with 2007,although the increase in area was very small. The yield of winter–spring ricesurged substantially, averaging 6.1 tons/ha, an increase of 6.8 per cent. Thehigher yields made the major contribution to a production increase of 1.3million tons, a 7.6 per cent gain compared with the previous year.
The total 2008 area of summer–autumn rice was 2.4 million hectares,nearly all of which is in the southern part of the country. For the 2008summer–autumn crop, many farmers strictly followed the process of ‘3decreases, 3 increases’,5 resulting in high yields and production. Thiscontributed to an increase in yields of 4.2 per cent. Coupled with an expansionin area of 7.5 per cent, total production for the country in 2008 reached 11.4million tons, up 1.2 million tons (12 per cent) over that of 2007. Southernprovinces produced 10.5 million tons and northern provinces contributed theremainder.
The area planted to the third-crop, or ‘tenth-month’, rice for the wholecountry in 2008 totalled 2.0 million hectares, with an average yield of 4.4tons/ha. These figures represented increases of 0.1 per cent and 1.8 per centcompared with 2007. Sown areas in the 2008 third crop in the MRD increasedsubstantially, reaching 392,000ha. This represented an increase of 15,000haover 2007 as farmers expanded rice area in response to rising prices during thefirst months of 2008.
Rice production cost and profit: The case of An Giang Province, MRD
Rice production in Viet Nam utilizes a lot of labour and few machines.Expenditure on labour usually makes up the biggest proportion of the totalcost of rice production (about one-third for the An Giang winter–spring cropsof 2005–2006, 2006–2007 and 2007–2008; see Table 11.5). The share oflabour would be even higher if unpaid family labour were included in the costsaccording to its opportunity cost. A study using data from the late 1990s(Moya et al, 2004) found that family labour input in the MRD was six timeshired labour input. In the RRD, it was nearly 25 times hired labour input.
Agricultural wages have been increasing in recent years, as large-scalemigration from rural areas to urban areas has reduced the supply of labour.Furthermore, MRD farmers have recently been seeding immediately after
THE VIETNAMESE RICE INDUSTRY DURING THE GLOBAL FOOD CRISIS 229
ES_RC_9-8 18/8/10 20:23 Page 229

harvest in order to avoid epidemic diseases in paddy. As a result, labour forcutting paddy has become scarcer and wages paid to workers have increasedsharply. During the harvest of the 2007 winter–spring crop, the payment forworkers cutting paddy in An Giang was VND900,000/ha – almost twice asmuch as that of the previous crop. In 2008, this figure increased further toVND1.2–1.4 million/ha. Many provinces have thus increased the level ofmechanization used in paddy harvests.
In the MRD, farmers usually use four types of fertilizer: urea, DAP, K fertil-izer and NPK that combines all three macronutrients. Farmers typically apply400kg/ha of fertilizer or more during the winter–spring crop. Fertilizer expen-diture has tended to increase in recent years due to rising prices. The highfertilizer prices of 2007 and 2008 meant that fertilizer costs overtook hiredlabour as the biggest expense for farmers (again, ignoring the value of familylabour). For the 2008 winter–spring crop, fertilizer costs accounted for 43 percent of total cash costs.
For the 2008 winter–spring crop, the average paddy price wasVND3700/kg, 57 per cent higher than in the same period in 2007. Averageproduction costs were around VND2650/kg, 64 per cent higher than in 2007.Farmers recorded an average profit of about VND1050/kg – more than 40 percent higher than in 2007 (around VND740/kg). Profits account for about 30per cent of gross revenues, with expenditures accounting for the other 70 percent.
Lessons
The government’s biggest success in managing the domestic rice market in2008 was in ensuring national food security at the same time as reaping
230 POLICY RESPONSES IN TRADITIONAL EXPORTING COUNTRIES
Table 11.5 Winter–spring paddy production cost in An Giang province,MRD, 2006–2008
No Item 2006 2007 2008
I Physical cost 5,033,800 6,680,650 10,568,6741 Seed VND/ha 435,000 483,600 936,0002 Fertilizer VND/ha 2,043,800 3,269,050 6,691,3903 Pesticide VND/ha 1,460,000 1,710,000 1,758,5174 Irrigation cost VND/ha 495,000 528,000 576,0005 Other cost in cash VND/ha 600,000 690,000 606,767
II Labour cost (excluding VND/ha 2,799,000 3,116,000 4,764,667household labour cost)
III Total cost VND/ha 7,832,800 9,796,650 15,333,341IV Average yield Kg/ha 5900 6100 5792V Paddy production cost VND/kg 1328 1606 2647VI Paddy price VND/kg 2050 2350 3700VII Profit VND/kg 722 744 1053
Profit VND/ha 4,262,200 4,538,350 6,097,059
Source: An Giang Department of Agricultural and Rural development
ES_RC_9-8 18/8/10 20:23 Page 230

commercial profits from international rice trading by taking advantage ofsoaring world prices in May and June. Viet Nam’s economy and farmerscompeted actively in world markets and reacted quickly to internationalmarket events.
In general, market mechanisms are applied to paddy production but not totrading. Indeed, a number of governmental agencies direct and manage ricetrading in Viet Nam, including the Prime Minister’s Office, MOIT, MARD,Ministry of Finance, the Viet Nam Food Association and the State Bank of VietNam. These authorities, which set rice export volumes and determine otherrelated policies every quarter, can intervene in the functioning of the market inresponse to changes in international markets. However, at times their decisionsare not well informed due to a lack of market analyses and reliable forecasts.These weaknesses are caused partly by a lack of financial and humanresources, but the current regime of rice trade management in Viet Nam is alsoa key factor.
The VFA leads all rice export enterprises but focuses mostly on largecontracts signed at governmental levels. In this way, export volumes and pricesare planned from the beginning of the year. However, this way of doing businesstends to be inefficient for both state-run and private companies, especiallymedium and small enterprises, and makes it difficult to react to changes inmarket conditions. Exporters pay most of their attention to their annual exportquotas and export contracts signed by the government, and not to marketanalyses and forecasts. In addition, paddy producers lack good market informa-tion and are unable to participate knowledgeably in volatile markets.
Viet Nam’s rice trade needs improved market research, analysis andforecasts, in conjunction with better monitoring of paddy supplies and worldsupply–demand balances. While rice-exporting countries such as Thailandtook advantage of increased export prices, Vietnamese enterprises remainedpassive because of short-term decisions to restrict exports and vary rice exporttaxes. This style of management prevents market players from developing andexecuting well-planned strategies and capturing business opportunities. Thegovernment prefers to subsidize large enterprises (most of which are state-owned) through bank credits. Such policies have little effect on improving thelives of farmers working in their paddy fields. In addition, these policiesencourage enterprises to look for handouts rather than increase their competi-tiveness.
The large rice trading enterprises also do not invest in domestic retaildistribution systems, making markets more vulnerable to speculation. Whenrice prices peaked in 2008, several enterprises held large volumes of rice(more than 10,000 tons were held by the Binh Tay Food Company, 9000 tonsby the Satake Company, 150,000 tons by the Northern Food Corporationand 446,000 tons by the Southern Food Corporation). Yet, without theirown distribution systems, they were not able to provide rice to consumers ontime.
THE VIETNAMESE RICE INDUSTRY DURING THE GLOBAL FOOD CRISIS 231
ES_RC_9-8 18/8/10 20:23 Page 231

Notes1 Decision No 5/QD/HHLTVN issued on 26 March 2008.2 Document 1746/MOIT – Import and Export Guidelines for Viet Nam’s rice export
in 2008 – was signed by Mr Nguyen Thanh Bien, Deputy Minister of MOIT on 5March 2008. Under these guidelines, MOIT entrusted the VFA to implement riceexports in quarters: Quarter I/2008 export 700,000–800,000 tons; Quarter IIexport 1,300,000–1,500,000 tons; Quarter III export 1,300,000–1,400,000 tonsand Quarter IV export 700,000–800,000 tons.
3 In January, 2008, the minimum prices for rice-exporting contracts were $385/tonfor 5 per cent broken rice and $360/ton for 25 per cent broken rice. Prices inMarch 2008 were more than $400/ton for 5 per cent broken rice.
4 Prime Minister Nguyen Tan Dung released document 78/TB-VPCP, signed on 25March 2008.
5 ‘3 decreases’ are decreases in expenditure per unit of area, fertilizer use, and thenumber of pesticide applications; ‘3 increases’ are increases in yield, quality andprofit.
ReferencesAGROINFO (2008) ‘World rice markets after rice planting increases’.AGROINFO (2008) ‘Perspectives for Viet Nam’s agro-products and inputs market in
the financial crisis of 2008’.AGROINFO (2008) ‘Rice special reports: Viet Nam’s rice market in early 2008 and
perspectives’.IPSARD (2008) ‘Assessment of impacts of world rice price movements and trade
policies on domestic rice prices in early 2008’.MARD (2008) ‘National food security to 2020, vision to 2030’.Moya, P. F., Dawe, D., Pabale, D., Tiongco, M., Chien, N. V., Devarajan, S., Djatiharti,
A., Lai, N. X., Niyomvit, L., Ping, H. X., Redondo, G. and Wardana, P. (2004) ‘Theeconomics of intensively irrigated rice in Asia’, in Dobermann, A., Witt, C. andDawe, D. (eds) Increasing the Productivity of Intensive Rice Systems through Site-Specific Nutrient Management, Science Publishers Inc. and International RiceResearch Institute (IRRI), Enfield, NH and Los Baños, pp29–58
232 POLICY RESPONSES IN TRADITIONAL EXPORTING COUNTRIES
ES_RC_9-8 18/8/10 20:23 Page 232

12
Rice Production in Cambodia:Will Exports Continue to Grow?
Sushil Pandey and Humnath Bhandari
Introduction
The food crisis of 2008 has renewed the interest of countries in increasing riceproduction to meet domestic needs and to gain from the opportunities forexpanded exports. In the Mekong delta, Thailand and Viet Nam are well-established rice-exporting countries and are the two top rice exporters in theworld. Cambodia, which is situated in the Mekong basin between these twomajor exporters, also has the potential to participate in the export market in asignificant way, although its export performance in the past four or fivedecades has been poor due to several constraints. Indeed, in the 1950s,Cambodia was one of the world’s leading rice exporters. In the wake of thefood crisis, the Royal Government of Cambodia is renewing its efforts to re-establish the country as an important exporter of rice.
The main objective of this chapter is to provide an initial analysis of thefuture rice export potential of Cambodia. After a long period of low produc-tion and shortages of rice spanning over two decades, Cambodia becameself-sufficient in rice in 1995. Cambodia started exporting rice in 2002 afterbeing absent from the rice export market for over 25 years. Current riceexports are estimated by USDA (2009) to be about 0.5 million tons of rice inmilled equivalent, although some government sources indicate exports to beabout 1.4 million tons in milled equivalent (AFSIS, 2010).
ES_RC_9-8 18/8/10 20:23 Page 233

The basic approach taken in this chapter is to examine the potential forexport in terms of supply-side considerations. The lack of reliable data on thequantity of export, export destinations and the prices received necessitates suchan approach. In addition, a substantial proportion of export from Cambodia isinformal, with rice flowing across the borders to Thailand and Viet Nam. Thisprivate trade takes place mainly in the form of rough rice (unmilled) soon afterthe harvest. The Cambodian rice market is closely linked with the rice marketsof Thailand and Viet Nam due to this informal export.
The chapter is organized as follows. The major features of the Cambodiarice economy in relation to those of its neighbouring exporting countries arefirst discussed. This is followed by an analysis of the rice production andexport trends of Cambodia. The structure of the rice marketing systems andmarketing costs, and trends in prices are subsequently discussed. Estimates ofthe exportable surplus under three alternative scenarios on production growthare then presented. The final section consists of a discussion of majorconstraints to future export growth and strategies to address those constraints.
Characteristics of the Cambodian rice economy
Cambodia is a small country situated in the Mekong delta between Thailandand Viet Nam. The economy of Cambodia is closely linked with that of thesecountries. Of the three countries, it has the lowest population of 14.7 millionand the lowest population density of 79 persons/square kilometre (see Table12.1). However, the Cambodian population is increasing quickly and thegrowth rate is 1.7 per cent per annum. It is also the poorest of the threecountries in terms of per capita income and has the highest poverty ratio.
Rice is an important crop of Cambodia and it occupies over 90 per cent ofthe total cultivated area. Overall, agriculture contributes 29 per cent to GDPand employs 75 per cent of the total labour force (World Factbook, 2009). Interms of rice production, the total rice output of Cambodia is relatively small(see Table 12.2). Production is about a fifth relative to Thailand and a sixthrelative to Viet Nam. This difference in production arises from both smallerarea and lower yield. The average rice yield in Cambodia (2.5t/ha) is about ahalf of that in Viet Nam (4.9t/ha). It is interesting to note that despite the lower
234 POLICY RESPONSES IN TRADITIONAL EXPORTING COUNTRIES
Table 12.1 Basic indicators, selected ASEAN countries
Indicators Unit Cambodia Thailand Viet Nam
Total populationa Million 14.7 64.3 88.5Population growtha % annual 1.7 0.7 1.3Population densityb Persons/sq. km 79 123 268Per capita rice productionc Kg/person 461 489 429Average farm sized ha/HH 1.33 3.16 0.71Per capita incomee US$/person (2007) 550 3400 770National poverty ratiob % (2005) 34.7 9.8 19.5
Sources: Data from a UNFPA (2008); b ADB (2008); c USDA (2009); d FAO (2009b); e World Bank (2009).
ES_RC_9-8 18/8/10 20:23 Page 234

yield and smaller rice area, rice production per capita (461kg rough rice) inCambodia is quite similar to that of Thailand and Viet Nam. Such a high levelof current per capita production is an indication of Cambodia’s promisingpotential for rice export.
Relative to its neighbours, almost all (92 per cent) of the rice area inCambodia is rainfed (see Table 12.3). The irrigated area accounts for onlyabout 8 per cent of the total rice area in Cambodia. This contrasts with VietNam where irrigated area accounts for over 50 per cent of the total rice area.
The above brief comparative analysis highlights important contrastsbetween Cambodia and the two major rice-exporting countries. An expansionof rice area and/or an increase in yield would have to be the major determi-nants of the future rice export potential of Cambodia. Rising food demandfrom the relatively small but rapidly growing population of Cambodia couldbe a factor constraining future export potential.
Rice production systems and production trends
Rice is grown in both the wet and dry seasons in Cambodia. Wet-season rice isplanted in July/August and harvested in December/January and accounts forover 80 per cent of the total rice area. With the spread of modern photoperiodinsensitive rice varieties, there is now some expansion of area under the earlywet season (planting in July/August followed by harvest in October/November). No official data are available on the area under early wet seasonbut it has been estimated to be approximately 400,000ha (Young et al, 2001).
Dry-season rice is grown under irrigated conditions mainly duringJanuary/February to May/June. However these planting/harvesting periods arenot clearly demarcated with considerable overlaps due to diversity of rice sub-ecosystems and the farmer practice of staggered planting (Javier, 1997). In
RICE PRODUCTION IN CAMBODIA 235
Table 12.2 Rough rice average area, yield, and production, selected ASEAN countries, 2005–2007
Rice Unit Cambodia Thailand Viet Nam
Area 1000ha 2499 10,034 7277Yield t/ha 2.53 2.96 4.93Production 1000t 6326 29,731 35,853
Source: Data from USDA (2009)
Table 12.3 Percentage rice area, by ecosystem, selected ASEAN countries
Ecosystem type Cambodia Thailand Viet Nam
Irrigated 8 22 54Rainfed 90 77 40Upland 2 1 6
Source: Data from IRRI (2006)
ES_RC_9-8 18/8/10 20:23 Page 235

2007, rice area in the dry season was approximately 344,000ha or about 13per cent of the total rice area. The share of dry-season rice in total productionwas about 20 per cent due to its slightly higher yield than that of wet-seasonrice. The yield of dry-season rice in 2007 was 3.96t/ha or 64 per cent higherthan that of wet-season rice (2.41t/ha).
The provinces growing most of the rice in Cambodia are located in thenorthwestern and southeastern parts of the country. Banteay Meachey andBattambang are the two major northwestern provinces that account for about22 per cent of the total rice area in the country. These provinces are locatedalong the Thai border. In the southeastern areas bordering Viet Nam, the majorrice-growing provinces are Kompong Cham, Kandal, Preyveng and Takeo. Theproduction of dry-season rice is mainly located in the southeast with these fourprovinces accounting for over 70 per cent of the total dry-season rice area.
The rice production trend in Cambodia has undergone important changesduring the past five decades. There are four distinct trends (see Figure 12.1).Between 1960 and 1970, rice production was on an upward trend but withhigh year-to-year variability. During this period, the rice area was more or lessconstant at around 2 million hectares, with yield growth being the maincontributor of the production growth. Rice production decreased sharplyduring the 1970s as much of the rice land was left uncultivated during theKhmer Rouge regime. Rice production picked up slowly after the fall of theKhmer Rouge regime and continued to increase at a modest rate up until 1994.The main source of production growth during 1980–1994 was growth in ricearea while the yield remained below 1.5t/ha.
There was a major break in the trend in 1995 with the production growthincreasing at the average rate of 5.7 per cent per annum during 1995–2008 (see
236 POLICY RESPONSES IN TRADITIONAL EXPORTING COUNTRIES
Figure 12.1 Trends in area and production of rough rice, Cambodia, 1960–2008
Source: Data from USDA (2009)
8
7
6
5
4
3
2
1
0
Are
a (m
illio
n ha
), P
rodu
ctio
n (m
illio
n to
ns)
1960 20001965 1970 1975 1980 1985 1990 1995 2005 2010
Production
Area
ES_RC_9-8 18/8/10 20:23 Page 236

Table 12.4). Overall, the yield growth rate increased from 0.6 per cent per yearduring 1960–1994 to 3.2 per cent per year during 1995–2008 (see Figure12.2).
A number of factors contributed to this impressive growth in production,the major one being technological. Photoperiod-insensitive improved varietiessuch as IR66 were increasingly adopted, especially in the early wet season andthe dry season. Similarly, the adoption of higher-yielding traditionalCambodian varieties identified through pure-line selection spread rapidlyduring this period. The use of better-quality seeds, expansion of dry-season ricearea, and increased extension efforts were some of the other major reasons forthis rapid increase in production (Young et al, 2001). Dry-season productionincreased at the rate of 8.4 per cent per annum driven mainly by the areagrowth (see Table 12.5). Expansion of irrigation facilities and the availabilityof improved photoperiod-insensitive varieties were the main reasons for theexpansion of dry-season rice. Almost all of the dry-season rice area now isunder improved photoperiod-insensitive varieties (see Table 12.6). Such
RICE PRODUCTION IN CAMBODIA 237
Table 12.4 Percentage annual growth rates of rice area, yield and production, Cambodia, 1960–2008
Period Area Yield Production
1960–1994 �1.05 0.58 �0.461995–2008 2.5 3.2 5.71960–2008 0.4 1.5 1.9
Source: Data from USDA (2009)
Figure 12.2 Trends in yield of rough rice, Cambodia, 1960–2008
Source: Data from USDA (2009)
3.0
2.5
2.0
1.5
1.0
0.5
0
Yiel
d (t/
ha)
1960
1964
1968
1972
1976
1980
1984
1988
1992
1996
2000
2004
2008
ES_RC_9-8 18/8/10 20:23 Page 237

improved varieties (mainly IR66) are also grown widely in the early wetseason. However, photoperiod-sensitive traditional varieties are predominantin the main wet season.
The trend in per capita rice production follows the trend in total riceproduction. After a dramatic drop to below 100kg of rough rice per capita in1974, it is now approaching the pre-Khmer Rouge level of around 450kg ofrough rice per capita (see Figure 12.3). Although Cambodia exported riceduring 1960s, the export ceased completely as rice production dipped belowthe domestic requirement. Cambodia ceased rice exports for almost 25 yearsduring 1975–2001. With the rise in per capita production over time, Cambodia
238 POLICY RESPONSES IN TRADITIONAL EXPORTING COUNTRIES
Table 12.5 Percentage annual growth rate of rice area, yield, and production, by season, Cambodia, 1998–2007
Season Area Yield Production
Wet season 2.9 3.4 6.4Dry season 4.9 3.5 8.4Total 3.2 3.6 6.8
Source: Data from MAFF (2009)
Table 12.6 Percentage rice area under improved varieties, Cambodia, 2002
Crop season Area under improved variety (%)
Wet season 14Dry season 97Early wet season 88Total 48
Source: Agrifood Consulting International (2002)
Figure 12.3 Per capita production of rough rice, Cambodia, 1960–2008
Source: Data from USDA (2009)
600
500
400
300
200
100
0
Per
cap
ita p
rodu
ctio
n (k
g/ca
pita
)
1960 20001965 1970 1975 1980 1985 1990 1995 2005 2010
ES_RC_9-8 18/8/10 20:23 Page 238

emerged as an exporter again in 2002 and has been expanding the exportquantity (see Figure 12.4).
Rice marketing systems
The rice marketing system of Cambodia has some unique features resultingfrom several factors. These factors include a close integration of theCambodian rice market with the markets of Thailand and Viet Nam, limitedfacilities for rice drying and milling, poorly developed transportation infra-structure, small marketable surplus of farmers, and grain quality differencesbetween the northwestern and southeastern production zones. Some of thesemajor features of the Cambodian rice markets are summarized below.
Cambodia is connected to the global market mainly through informalchannels, although some trade takes place through formal channels. Cambodiahas a long history of an informal cross-border rice trade with Thailand andViet Nam. This trade takes place mainly in the form of paddy rice through anetwork of local paddy collectors and paddy brokers. This informal trade hascontinued to thrive as it provides an important flexible outlet for surpluses. Inthe northwest region, paddy rice is transported overland to neighbouring Thaiprovinces. In the southeast region, paddy rice is similarly transported to VietNam but mainly on barges and boats. The main reason for export in the formof paddy rather than as milled rice is the limited and poorly developed post-harvest facilities (drying, storage and milling) in Cambodia. After millingacross the border, part of this rice is imported back into Cambodia. Due to theinformal nature of this market, reliable estimates of the quantity traded are notavailable. Regulation and formalization of this long-established marketoperated mainly by paddy collectors and brokers is difficult along the porousCambodian borders.
RICE PRODUCTION IN CAMBODIA 239
Figure 12.4 Rice exports (in milled equivalent) from Cambodia, 1960–2008
Source: Data from USDA (2009)
0.6
0.5
0.4
0.3
0.2
0.1
0
Ric
e ex
port
(mill
ion
tons
in m
illed
equ
ival
ent)
1960 20001965 1970 1975 1980 1985 1990 1995 2005 2010
ES_RC_9-8 18/8/10 20:23 Page 239

Cambodia also has a small formal rice export market oriented towardsexporting high-quality organic rice to niche markets. This export trade isdominated by large well-connected exporters who export high-quality milledrice mainly to Singapore, Malaysia and Europe, where Cambodian ricecommands a price premium. Even for this formal export that takes placemainly through the ports of Phnom Penh and Sihanoukville, inconsistencies indata collected by various agencies involved makes it difficult to derive areliable estimate. The quantity of this formal export, estimated to be around50,000 tons in 2002 (Agrifood Consulting International, 2002) is now proba-bly around 200,000 tons of milled rice.
Local paddy collectors who collect paddy from farmers are importantplayers in the supply chain. They collect small quantities of paddy fromfarmers and sell subsequently either to paddy brokers or to commercial ricemills. Paddy brokers in turn sell to Thai/Vietnamese rice traders. Commercialrice mills process paddy into rice for sale to wholesalers and retailers, mainlyfor the domestic market. Often, commercial mills also act as brokers and selltheir paddy stock directly to Thai/Vietnamese traders.
Farmers mostly sell small quantities of rice to local collectors soon afterharvest. The average quantity sold per farmer (for those who have marketablesurplus) has been estimated to be around 1.6 tons (Agrifood ConsultingInternational, 2002). A consequence of bulking of these small quantities bycollectors is that the paddy collected is often of mixed varieties resulting inmore broken grains and lower grain quality during milling. Much of the wet-season rice sold commercially is hence classified as ‘mixed variety’. Onlyvarieties such as Somali, Phkar Khney, Neang Minh and IR66 are marketed ona specific-variety basis.
The trade flow of rice and paddy is described schematically in Figure 12.5.Good quality rice such as Somali, Phkar Khney and Neang Minh that aremostly grown in the northwest region find their way into Thailand as paddythrough informal channels. Some of these varieties are also milled locally andtransported by road to Phnom Penh and other centres of population in the eastof the country. In addition, unofficial imports of Thai jasmine rice also findtheir way into Phnom Penh through the same route. Informal exports from thesoutheastern province to Viet Nam are dominated by IR66, which is grownmainly in the dry season. This variety finds an easy market in Viet Nam. Theofficial export of milled rice from Cambodia is channelled through the ports ofPhnom Penh and Sihanoukville.
The informal rice market linking Cambodia with the two large markets ofThailand and Viet Nam means that Cambodia is essentially a price taker. Theprice of Cambodian rice is basically set by market forces outside its borders inThailand and Viet Nam. The price received by farmers for paddy is based onthe derived demand taking into account the marketing costs. The regionalvariations in price for rice varieties that are exported informally are mainlyexplained by the marketing costs.
240 POLICY RESPONSES IN TRADITIONAL EXPORTING COUNTRIES
ES_RC_9-8 26/8/10 09:14 Page 240
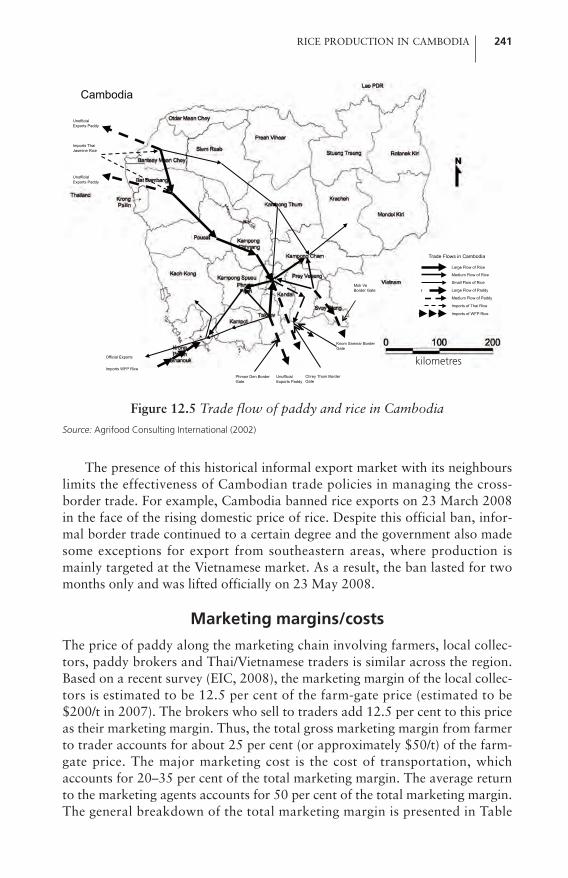
ElanYmy Mew Oh,
K.enpong Thum
Pant
Ksoh Kona
_..)N, rk . Chhn" MOWN ch..nTh.."1----:
Klimpcmg &VW l' F-.,.--- R.F. -
pp,h
Keschsh
Leo MDR
SOCPCOIKM
oloo 200
kilometers
s
, Robinek
-
rpiterVeen Omyr
rSurnNet
Free, Voahr
D.tD.borç
TNUerdKftergPe
The presence of this historical informal export market with its neighbourslimits the effectiveness of Cambodian trade policies in managing the cross-border trade. For example, Cambodia banned rice exports on 23 March 2008in the face of the rising domestic price of rice. Despite this official ban, infor-mal border trade continued to a certain degree and the government also madesome exceptions for export from southeastern areas, where production ismainly targeted at the Vietnamese market. As a result, the ban lasted for twomonths only and was lifted officially on 23 May 2008.
Marketing margins/costs
The price of paddy along the marketing chain involving farmers, local collec-tors, paddy brokers and Thai/Vietnamese traders is similar across the region.Based on a recent survey (EIC, 2008), the marketing margin of the local collec-tors is estimated to be 12.5 per cent of the farm-gate price (estimated to be$200/t in 2007). The brokers who sell to traders add 12.5 per cent to this priceas their marketing margin. Thus, the total gross marketing margin from farmerto trader accounts for about 25 per cent (or approximately $50/t) of the farm-gate price. The major marketing cost is the cost of transportation, whichaccounts for 20–35 per cent of the total marketing margin. The average returnto the marketing agents accounts for 50 per cent of the total marketing margin.The general breakdown of the total marketing margin is presented in Table
RICE PRODUCTION IN CAMBODIA 241
Figure 12.5 Trade flow of paddy and rice in Cambodia
Source: Agrifood Consulting International (2002)
Unofficial Exports Paddy
Unofficial Exports Paddy
Imports Thai Jasmine Rice
Official Exports
Imports WFP Rice
Phmon Den Border Gate
Unofficial Exports Paddy
Chrey Thom Border Gate
Knom Samnar Border Gate
Mok Va Border Gate
Large Flow of Rice
Medium Flow of Rice
Small Flow of Rice
Large Flow of Paddy
Medium Flow of Paddy
Imports of Thai Rice
Imports of WFP Rice
Trade Flows in Cambodia
Cambodia
kilometres
ES_RC_9-8 18/8/10 20:23 Page 241

12.7. Although the share of fees (official and unofficial) estimated in the surveyby EIC seems reasonable at less than 10 per cent, other reports have indicatedthat these costs (especially the informal fees) can be much higher, accountingfor as much as 50 per cent of the total marketing costs (Agrifood ConsultingInternational, 2002).
The data presented indicate that the net profit margin of trader and trans-port costs combined account for 65–85 per cent of the total marketing costs.As Cambodia is a price taker in the export market to Thailand/Viet Nam,farmers are likely to gain from improvements in marketing systems that reducethese costs.
Cost of production and comparative advantage
Although the rice prices increased in the early part of 2008, the input costs alsoincreased quite sharply. The cost of fertilizers almost tripled between January2008 and November 2008 (see Figure 12.6). This led to a substantial increase inthe nitrogen–paddy price ratio, despite the rise in the price of rice (see Table12.8).The retail price of diesel, commonly used for powering agriculturalmachinery, increased by 80 per cent between January 2007 and May 2008(MoC, 2008). In Cambodia, the cost of power for land preparation and the costof fertilizers account for over two-thirds of the cash cost of production (DAI,2008). Hence, increases in these costs would have reduced the gains inprofitability of rice production resulting from the price rise, although the overallprofitability after the price rise is most likely higher than before as purchasedinput costs typically account for a small proportion of the gross revenue.
242 POLICY RESPONSES IN TRADITIONAL EXPORTING COUNTRIES
Table 12.7 Marketing margin of paddy from farmer to trader, Cambodia
Items % of total marketing margin
Profit margin of collector/broker 44–49Transport cost 22–34Labour 13–14Materials 6–9Fees (official and unofficial) 7–9
Source: Data from Economic Institute of Cambodia (EIC, 2008)
Table 12.8 Nitrogen–paddy price ratio, Cambodia, 2004–2008
Nitrogen price Paddy price Nitrogen–paddy Year (Riel/kg) (Riel/kg) price ratio
2004 2227 547 4.12005 2718 620 4.42006 2821 588 4.82007 3088 741 4.22008 6321 1094 5.8All 3435 718 4.8
Source: Data from Ministry of agriculture, forestry and fishery (MAFF, 2009)
ES_RC_9-8 18/8/10 20:23 Page 242

The flow of informal trade from Cambodia to Viet Nam and to Thailand isan indication of a relatively low cost of production in Cambodia. A compara-tive analysis of costs of production data indicates that the cost of production inCambodia is substantially lower than in Thailand (see Table 12.9). There areno explicit subsidies on inputs/outputs on rice production and Cambodia hasadopted a floating exchange rate with no major trade barriers. Hence, in theabsence of any major distortions in the market, these comparative cost differ-ences are also likely to reflect the economic comparative advantage of riceproduction in Cambodia. In fact, estimates of domestic resource costs indicatea clear comparative advantage of Cambodia in rice production (AgrifoodConsulting International, 2002). The low cost of labour in Cambodia is likelyto be the main source of this comparative advantage.
Rice price trends and impact of price rise on the poor
The market price of paddy varies according to location, variety and time.There is a seasonal effect, with the price of paddy being lowest during the mainharvest months December/January and picking up slightly during the lean
RICE PRODUCTION IN CAMBODIA 243
Source: Data from MAFF (2009)
Figure 12.6 Monthly nitrogen fertilizer price index, Cambodia, 2007–2008
Jan 2
007
Feb 20
07
May 20
07
Jul 2
007
Sep 20
07
Nov 20
07
Jan 2
008
Mar 20
08
May 20
08
Jul 2
008
Sep 20
08
Nov 20
08
300
250
200
150
100
50
Pric
e in
dex
(Jan
uary
200
7 =
100)
Table 12.9 Cost of rice production, Cambodia and Thailand
Paddy production cost Cambodia Thailand % difference
Cost ($/ha) 168 220 �31Cost($/t) 89 105 �18
Source: Konishi (2003)
ES_RC_9-8 18/8/10 20:23 Page 243

months of June/July. The paddy and rice prices also are spatially highly corre-lated across the production zones indicating that transportation/processingcosts determine the price differences. Price differences between provinces aresmall and the correlation of the Cambodian price with Vietnamese and Thaiprices is high (Chan et al, 2007).
Price of milled rice also varies according to location, variety and time. InJune 2008, the average wholesale price of the highest grade rice (Somali,Domali) in Cambodia was 75 per cent more than that of the lowest grade(IR66). As IR66 is mainly grown in the southeastern province andSomali/Domali in northeastern provinces, the spatial price differences can beexplained to a certain extent by the grain quality factor.
Taking the price of high-quality Somali rice in Phnom Penh as an example,there has been an upward trend in rice price over time, with the price increas-ing substantially in 2008 in response to the food crisis (see Figure 12.7). Thenominal price of Somali rice increased by 90 per cent in May 2008, relative toits price in May 2007. The price came down subsequently but the rice price inNovember 2008 was still 30 per cent higher than the corresponding price inNovember 2007. Depending on the rice quality, the price increases in thePhnom Penh market between May 2007 and May 2008 were in the range90–120 per cent (CDRI, 2008).
Price increases in the provincial markets were much smaller than inPhnom Penh. According to a survey conducted by CDRI, increases in the priceof milled rice in provincial markets were in the range 25–40 per cent betweenNovember 2007 and May 2008 (CDRI, 2008). The prices in the provincialmarkets refer mainly to poorer quality rice such ‘mixed variety’ or IRvarieties.
244 POLICY RESPONSES IN TRADITIONAL EXPORTING COUNTRIES
Figure 12.7 Monthly wholesale price of high-quality milled rice (Somali),Cambodia (rice store Oreusey), 2005–2009
Source: Data from MAFF (2009)
2005 2006 2007 2008
Jan Feb Mar Apr May Jun Jul Aug Sep Oct Nov Dec
4000
3500
3000
2500
2000
1500
1000
500
0
Mill
ed ri
ce p
rice
(Rie
l/kg)
ES_RC_9-8 18/8/10 20:23 Page 244

The prices have now come down from these peak levels with the cooling-off of the international market. However, the January 2009 prices for goodquality rice (Somali and Phkar Khney) were still 30–50 per cent above theJanuary 2008 prices. This gap is much smaller in the case of the poor qualityrice.
There is no question that the sharp rise in rice prices during 2008 wouldhave had a major adverse impact on poverty in 2008. The increase in the wagerate by 35–67 per cent during 2008, as compared to 2007, lessened the impactof such price rise to a certain degree. Daily wages increased from 6000–10,000riels in 2007 to 10,000–13,500 riels in 2008 (CDRI, 2008). Nevertheless, notall poor people were able to benefit from wage rate increases due to limitedemployment opportunities. Those who were unable to increase their total realincome in proportion to the rise in rice price were adversely affected.
The poor in Cambodia, like in several other poor rice-consuming countriesof Asia with low per capita incomes, spend a substantial amount of theirincome on purchased food. Food consumption (including own production)accounts for about 70 per cent of the total expenditure for the bottom quintilesin Cambodia (FAO, 2009a). Small farmers, rural landless labourers and theurban poor belong mostly to this income quintile. The expenditure share ofpurchased food in total food consumption among the bottom income quintileis 64 per cent (MoP, 2007). For the poor, rice is a major food item purchased.Assuming that purchased rice accounts for about 75 per cent of the total costof the purchased food, the total expenditure share of purchased rice will beabout 34 per cent. A 50 per cent increase in the price of rice is thus equivalentto about 17 per cent drop in real incomes. This is a substantial drop for peoplewho have a very low income to start with. Based on the poverty elasticityestimates for Cambodia provided in Ivanic and Martin (2008), a 50 per centrise in rice price translates into an increase in poverty incidence by 2.5 percent-age points (or an increase in the number of poor by 400,000). This is asubstantial increase in poverty, even if some of these poor people may havemoved back above the poverty line with the subsequent fall in rice prices.
A field-based analysis of the impact of the rice price rise in Cambodiaconducted in June 2008 points to various mechanisms deployed by householdsto cope with the price rise (CDRI, 2008). Households were reported to havecut back their food intake. This threatens their nutritional status and worsenstheir health, leading to potential chronic adverse impact.
The rise in rice prices, of course, benefited those farmers who hadmarketed surplus to sell. Even for these farmers, the gain in income from theprice rise was eroded by a substantial increase in input costs, mainly that ofthe fuel and fertilizers. It is likely that farmers who invested in these costlyinputs for the wet-season rice production of 2008 in the hope of making gainsfrom higher rice prices lost out due to the substantially lower price of rice atharvest.
RICE PRODUCTION IN CAMBODIA 245
ES_RC_9-8 18/8/10 20:23 Page 245

Potential for export from Cambodia
It is believed that Cambodia currently exports around 0.5 million tons ofmilled equivalent in terms of paddy rice. The largely informal nature of theexport across the border to Viet Nam and Thailand makes it difficult to get areliable estimate of exports.
For estimating the future export potential, the approach taken here is toproject the exportable surplus based on a food balance equation. Exportablesurplus is defined as the quantity of rice (expressed in milled rice) that could beexported after satisfying the domestic consumption needs, setting aside aquantity for use as seeds and taking into account post-harvest losses (lossesduring post-harvest operations, including the milling). The exportable surplus(ES) in a given year is estimated using the following equation:
ES = Production � Consumption � post-harvest losses �seeds kept for next year
For estimating the ES, the beginning and ending stocks are not considered, asany stock accumulated could be potentially used for exports.1 The parametersused in the food balance equation are presented in Table 12.10. These datarepresent the best guesstimates of the parameters applicable to Cambodia andwere culled from various publications.
As mentioned earlier, rice production has been increasing quite rapidlyespecially in recent years. Three scenarios for production growth wereassumed, low (2 per cent per year), medium (4 per cent per year) and high (6per cent per year). The production growth may result from a combination ofarea and yield growth.
The scenario on the growth of ES is presented in Figure 12.8. The ES by2020 would be about 2.7 million tons of milled rice for the medium-growthscenario. Cambodia will have the exportable surplus of 4 million tons only if ahigh production growth rate of around 6 per cent per year can be maintained.However, if the production growth is modest at 2 per cent per year, Cambodiawill have about 1.5 million tons of ES by 2020. Roughly, the ES increases byabout 1 million tons for each 2 percentage point growth in production. Thus,
246 POLICY RESPONSES IN TRADITIONAL EXPORTING COUNTRIES
Table 12.10 Parameters used in the food balance equation, Cambodia
Parameters Unit Value
Milling ratioa % 60Seed rateb kg/ha 100Post-harvest lossc % 15Per capita consumption (milled rice)d kg/yr 143Population growth ratee %/yr 1.7
Source: Data from a IRRI (2009), b FAO (2000), c Agrifood Consulting International (2002), d FAO (2009c), e World Bank (2009)
ES_RC_9-8 18/8/10 20:23 Page 246

progress in technological improvement in rice production/processing will bethe key to growth in future export potential of Cambodia.
The production growth mentioned above may be achieved by a combina-tion of area and yield growth. Yield levels that need to be achieved by 2020 areestimated under two alternative area growth rates. For a lower area growthrate of 1 per cent per year, the required yield levels in 2020 are 2.9t/ha, 3.7t/haand 4.6t/ha, respectively for generating low, medium and high levels ofexportable surplus (see Table 12.11). If the area growth rate of 2 per cent peryear can be maintained, the corresponding yield growth rates will need to belower. Obviously, a more aggressive programme of research and developmentwould be needed to increase the ES when the anticipated area growth ismodest.
Constraints to and strategies for rice export growth
The rice export industry of Cambodia is basically at an early stage of develop-ment. There have been very few policy-induced distortions in the market and
RICE PRODUCTION IN CAMBODIA 247
Figure 12.8 Scenario analysis of the growth of exportable surplus inCambodia, 2010–2020
Source: Author’s estimation
Table 12.11 Required yield levels by 2020 under assumed area growth rates, Cambodia
Area growth rate Required yield levels by 2020 (t/ha)(% per year) Low exportable Medium exportable High exportable
surplus surplus surplus
1 2.9 3.7 4.62 2.6 3.3 4.1
Exp
orta
ble
surp
lus
(mill
ion
tons
)5
4
3
2
1
02010 2015 2020
2% production growth
4% production growth
6% production growth
ES_RC_9-8 18/8/10 20:23 Page 247

the major constraints are infrastructural, institutional and technological. The current practice of exporting paddy, rather than milled rice, to
Thailand and Viet Nam has evolved mainly due to inadequacy of infrastruc-tures needed for post-harvest operations such as drying, storage and milling.These facilities are well established across the border in Thailand and VietNam. As a result, there is a natural tendency to export wet paddy across theborder soon after harvest. In addition to physical losses in the grain and qualitydeterioration that takes place in the process, Cambodia also loses out on theopportunity for potential gains from value additions.
There are two major milling systems in Cambodia. Commercial millsprocess paddy primarily for domestic and export markets. The capacity ofthese mills varies from 500–700kg/hour to over 1200kg/hour. Custom mills aresmall operations in the villages that process paddy primarily for localconsumption. These custom mills account for almost 70 per cent of the totalmilling capacity in the country (JICA, 2001). The technology used by thesecustom mills is old with much equipment being obsolete, resulting in highmilling losses. In addition, the overall cost of milling in Cambodia is high dueto high energy costs, as Cambodian mills operate mostly using diesel or diesel-generated electricity.
Another major infrastructural constraint is poor transport and handlingfacilities. In comparison to Thailand and Viet Nam, Cambodia fares poorly interms of the road quality, railway facilities and port traffic (see Table 12.12).Decades of war and a lack of investments have resulted in deterioration of thetransport infrastructures although rehabilitation of major highways in recentyears is improving the situation. The cost of transport is still a major compo-nent of the marketing cost as described earlier.
The handling/loading facilities in the ports in Phnom Penh andSihanoukville are also limited and the costs are high. It has been reported thatthe vessel loading charges in Sihanoukville are more than double that inYangoon (Konishi, 2003).
Major institutional constraints to development of the rice export industryare related to the overall weak governance of the public institutions, overlap-ping institutional jurisdiction, poor coordination and lack of transparency(MoC, 2006). These institutional weaknesses increase the transaction costs torice exporters substantially. In addition, informal costs throughout the exportprocess (transporting from mill to the port and final loading in the vessel) canbe quite substantial and informal payments have been estimated to be as much
248 POLICY RESPONSES IN TRADITIONAL EXPORTING COUNTRIES
Table 12.12 Infrastructure development status, selected ASEAN countries
Infrastructure Cambodia Thailand Viet Nam
% paved road (2001) 16 98 25Railway density (km/1000 square km) 3.5 7.9 7.8Port traffic (million metric tons) 2 163 89
Source: MoC (2006)
ES_RC_9-8 18/8/10 20:23 Page 248

as 50 per cent of the transportation cost from the mill to the ship (AgrifoodConsulting International, 2002). The indirect cost of entry into the formalexport industry can also be quite substantial, thus restricting the entry to a fewwell-connected traders.
In the context of rice exports, an important constraint is the difficulty inestablishing a brand name in the face of well-established competitive exportindustries of Thailand and Viet Nam. The total formal volume of export fromCambodia is quite small relative to those of Thailand and Viet Nam. Given theweaknesses in the supply chain mentioned above, it is difficult for Cambodia toestablish a brand name and ensure a regular and stable supply of high-qualityrice to international markets.
Technological constraints relate to the supply-side issues. Although riceproduction increased rapidly during the past decade, the overall rice yield isstill quite low, indicating that improved technologies are not yet widely used.Constraints may be biophysical, with rice production suffering from drought,submergence and other related factors. Despite some increases in investment inirrigation, rice production is mainly rainfed with production having highspatial and temporal variability. Agricultural research and extension capacity isconstrained due to low investments, although there have been some improve-ments in recent years.
The constraints discussed above suggest several strategic thrusts that areneeded to strengthen and expand the rice export industry of Cambodia.Keeping the production growth high to continue to increase surplus for exporthas to be a key component of the strategy. Cambodia can potentially exportbetween 3 and 4 million tons of milled rice by 2020 if the production growthrate of 4–6 per cent per year can be achieved. Clearly, substantial increases ininvestments will be needed in agricultural research, technology development,agricultural infrastructure and extension to achieve such an expansion inexports.
A two-pronged strategy for promoting rice export could help Cambodiabenefit from the structure of its export market. The first prong of this strategyconsists of establishing a brand name for Cambodian rice in European andother markets where high-quality organic rice commands a price premium.There is some brand recognition for Cambodian rice in this regard in theEuropean markets already and Cambodia could enjoy preferential treatmentsfor its export under the EU policy of ‘Everything-but-Arms’. Establishing sucha brand name will effectively create a niche market for Cambodian rice in theface of stiff competition from major rice exporters in Thailand and Viet Nam.Suitable standards and certification systems need to be established for this, inaddition to institutional reforms to improve the functioning of the supplychain.
The second prong of the strategy is to improve the returns from the exist-ing trade in medium- and low-quality rice. Currently, Cambodia is not able tobenefit from potential value addition due to the practice of exporting paddysoon after the harvest. Being a small producer, the existing market linkage with
RICE PRODUCTION IN CAMBODIA 249
ES_RC_9-8 18/8/10 20:23 Page 249

Thailand and Viet Nam will continue to remain important for Cambodia. ButCambodia can gain substantially from value addition through investments inpaddy drying, storage and milling technologies, and marketing infrastructure.While some of these investments are within the purview of the private sector,the role of the public sector is to create an enabling environment throughclearly defined and enforceable rules and regulations, and the provision ofinformation.
Improvements in the overall institutional set-up for transparency andbetter governance throughout the rice value chain system are critically impor-tant to reduce the transaction costs, and thereby promote the rice industry ingeneral and the rice export market in particular. Such institutional reforms willalso facilitate formalization and better management of the border trade in ricewith Thailand and Viet Nam.
Conclusions
Cambodia has re-emerged as an important rice-exporting country after a longabsence of over 20 years from the export market. Its re-emergence as anexporting country was driven mainly by the rapid production growth madepossible by the spread of improved rice technology. Given the current lowyield, considerable opportunity exists for Cambodia to further expand riceproduction and generate more exportable surplus, provided adequate invest-ments are made in agricultural technology and infrastructures.
A two-pronged long-term strategy for the development of the rice exportindustry is needed as Cambodia currently has two major types of exportmarkets. A firm establishment of the Cambodian brand name in the nichemarket for high-quality organic rice can provide a major competitive advan-tage relative to neighbours. This could be a major avenue for future growth inexport earning as demands for such organic products are likely to increase overtime. In addition to technological support for production of such rice, credibleand efficient grading and certification standards need to be established. Thesecond prong consists of gaining from Cambodia’s traditional export ofmedium- to low-quality rice to Thailand and Viet Nam through increasedvalue addition along the supply chain. Substantial investments in paddy drying,storage and milling technologies, and marketing infrastructures would beneeded for such value addition. In addition, institutional reforms are needed toreduce transaction costs and make the whole process of rice transport, process-ing and trade an efficient one. Given current low income levels, poorinfrastructure, limited investment capacity of the public sector, and a poorgovernance capacity, these are major but not insurmountable challenges.
Note1 Stock data are not currently available for Cambodia to enable inclusion of stock
accumulation or depletion in the food balance equation.
250 POLICY RESPONSES IN TRADITIONAL EXPORTING COUNTRIES
ES_RC_9-8 18/8/10 20:23 Page 250

AcknowledgementsAssistance from Martin Gummert, David Dawe and Tom Slayton in collecting therequired information and making comments to improve the paper is gratefullyacknowledged.
ReferencesADB (Asian Development Bank) (2008) Basic Statistics 2008, Economics and
Development Resource Center, ADB, ManilaAFSIS (ASEAN Food Security Information System) (2010) online statistical database,
http://afsis.oae.go.th/x_sources/display-db.php?m_id=2&tablelist=13Agrifood Consulting International (2002) ‘Rice value chain study: Cambodia’, A
report prepared for the World Bank by Agrifood Consulting International, PhnomPenh
CDRI (Cambodia Development Resource Institute) (2008) ‘Impact of high food pricesin Cambodia’, A survey report, CDRI, Phnom Penh
Chan, B., Kann, V., Yem, S. and Young, M. (2007) ‘Cambodia’s rice export promotionin post-WTP accession’, Under TARP project supported by USAID, ASEAN andInternational Organization Department, Ministry of Commerce, Phnom Penh
DAI (Development Alternatives Inc) (2008) ‘Cambodia SME development in selectedagri-sectors/value chains’, A final report prepared for International FinanceCorporation/Mekong Private Sector Development Facility (IFC/MPDF), DAI,Agriculture Development International (ADI), and International DevelopmentEnterprises (IDE), Phnom Penh
EIC (Economic Institute of Cambodia) (2008) ‘Price distortions in Cambodia: A casestudy of paddy, maize and soybeans’, A background paper prepared for the WorldBank, EIC, Phnom Penh
FAO (Food and Agriculture Organization of the United Nations) (2000) FAO/WFPCrop and Food Supply Assessment Mission to Cambodia: A Special Report,Economic and Social Development Department, FAO, Rome
FAO (2009a) ‘Rural Income Generating Activities (RIGA) database’, FAO, Rome,www.fao.org/es/ESA/riga/english/index_en.htm
FAO (2009b) ‘World Census of Agriculture 2000’, online database, Statistics Division,FAO, Rome, www.fao.org/economic/ess/world-census-of-agriculture/en
FAO (2009c) ‘FAOSTAT: FAO online statistical database’, FAO, Rome,http://faostat.fao.org
IRRI (International Rice Research Institute) (2006) Bringing Hope, Improving Lives:Strategic Plan, 2007–2015, IRRI, Manila
IRRI (2009) ‘IRRI World Rice Statistics’, online database, Social Sciences Division,IRRI, Manila, http://beta.irri.org/solutions/index.php?option=com_content&task=view&id=250
Ivanic, M. and Martin, W. (2008) ‘Implications of higher global food prices for povertyin low-income countries’, Policy Research Working Paper No 4594, DevelopmentResearch Group, World Bank, Washington, DC
Javier, E. L. (1997) ‘Rice ecosystems and varieties’, in Nesbitt, H. J. (ed) RiceProduction in Cambodia, IRRI, Manila, pp39–82
JICA (2001) ‘The study on improvement of marketing system and post harvest qualitycontrol of rice in Cambodia: Final report’, Japan International Cooperation Agency
RICE PRODUCTION IN CAMBODIA 251
ES_RC_9-8 18/8/10 20:23 Page 251

(JICA); Ministry of Commerce and Ministry of Agriculture, Forestry, and Fisheries,Royal Government of Cambodia, Phonm Penh, Cambodia.
Konishi, Y. (2003) ‘Towards a private sector-led growth strategy for Cambodia:Volume I – Value chain analysis’, A report prepared for the World Bank, GlobalDevelopment Solutions Inc (GDS), Reston, VA
MAFF (Ministry of Agriculture, Forestry, and Fisheries) (2009) ‘Wholesale price data’,Cambodian Agricultural Market Information Service (CAMIS) – MAFF, PhnomPenh
MoC (Ministry of Commerce) (2006) ‘Cambodia national export strategy 2007-2010’,final draft, MoC and International Trade Center, UNCTAD/WTO, Phnom Penh
MoC (2008) ‘Weekly business roundup, various issues in 2007 and 2008’, MoC,Phnom Penh
MoP (Ministry of Planning) (2007) Cambodian Socioeconomic Survey 2004, NationalInstitute of Statistics, MoP, Phnom Penh
UNFPA (United Nations Population Fund) (2008) The State of the World Population2007, UNFPA, New York
USDA (United States Department of Agriculture) (2009) ‘Production, Supply, andDistribution (PSD) online database’, Foreign Agricultural Services (FAS) of USDA,Washington, DC, www.fas.usda.gov/psdonline.
World Bank (2009) Country Profile. Key Development Data and Statistics, WorldBank, Washington, DC
World Factbook (2009) ‘The World Factbook’, online, Central Intelligence Agency(CIA) of the USA, CIA, Washington, DC, https://www.cia.gov/library/publications/the-world-factbook
Young, D., Raab, R., Martin, R., Sin, S., Leng, B., Abdon, B., Mot, S. and Seng, M.(2001) Economic Impact Assessment of the Cambodia-IRRI-Australia Project,Cambodian Agricultural Research and Development Institute (CARDI), PhnomPenh
252 POLICY RESPONSES IN TRADITIONAL EXPORTING COUNTRIES
ES_RC_9-8 18/8/10 20:23 Page 252

Part V
POLICY RESPONSES IN CHINA AND INDIA
ES_RC_9-8 18/8/10 20:23 Page 253

ES_RC_9-8 18/8/10 20:23 Page 254

13
How China Stabilized Grain Pricesduring the Global Crisis
Cheng Fang
Introduction
China has been transformed from a largely centrally planned economy into amarket-driven economy since the early 1980s. While markets and marketforces have become increasingly important to China’s grain and rural economy,government intervention remains significant in agriculture. The Government ofChina places self-sufficiency in food and/or food security as top national prior-ities (Lohmar and Gale, 2008). The major food policy objectives of the Chinesegovernment in recent years include food (especially rice, wheat and maize)production, stabilization of prices, a secure urban food supply and higher farmincomes.
Price stability has always been important to China’s government, andmany Chinese people remember the devastating hyperinflation at the end ofWorld War II. When the objective of price stability conflicts with other objec-tives, China’s leaders usually choose to pursue price stability.
China experienced a trend of rising food prices and overall inflation begin-ning in 2007. In December 2007, the CPI was 6.6 per cent higher than a yearearlier, and food prices were 17 per cent higher (see Figure 13.1). The prices ofmeat and eggs increased particularly rapidly in 2007, by 31.7 per cent and 21.8per cent respectively. Among different types of meat, pork (the staple meat in
ES_RC_9-8 18/8/10 20:23 Page 255

China) prices rose significantly during the third quarter of 2007 compared tothe same period in 2006, with increases of up to 98 per cent in Liaoningprovince, 81 per cent in Sichuan province and 62 per cent in Guangdongprovince (FAO/GIEWS, 2007). The pork price increase was a result of asubstantial reduction in China’s 2007 pig numbers due to an outbreak of theporcine reproductive and respiratory syndrome (PRRS) disease, also known asblue ear disease in China.
In international markets, wheat prices increased particularly sharply begin-ning in May 2007 and spilled over to rice markets as India placed exportrestrictions on rice (see Chapter 14). Rice prices then began to rise during thelast quarter of 2007 and surged in the first half of 2008 (see Chapter 2).
Large increases in international food prices have become a key concern forpolicymakers in China, especially as China’s economy becomes more open inthe aftermath of its WTO accession in 2001. Despite the declining importanceof the agricultural sector to the overall economy, food still accounts for a largeshare of total expenditures in China (36 per cent of urban budgets and 43 percent of rural budgets in 2007).
Faced with soaring international food and fuel prices and inflationarypressures in 2007, the central government intervened to increase grain produc-tion and stabilize domestic grain prices. These interventions can be groupedinto three main categories:
256 POLICY RESPONSES IN CHINA AND INDIA
Figure 13.1 China’s CPI and food price index, January 2003 to November 2008
Source: China National Bureau of Statistics
140
130
120
110
100
90
80
70
Jan-0
3
Apr-03
Jul-0
3
Oct-03
Jan-0
4
Apr-04
Jul-0
4
Oct-04
Jan-0
5
Apr-05
Jul-0
5
Oct-05
Jan-0
6
Apr-06
Jul-0
6
Oct-06
Jan-0
7
Apr-07
Jul-0
7
Oct-07
Jan-0
8
Apr-08
Jul-0
8
Oct-08
Janu
ary
2006
=100
CPI
Food
ES_RC_9-8 18/8/10 20:23 Page 256

1 policies to support grain production and farmers’ income, including higherminimum procurement prices for rice and wheat, increased subsidies(direct payments, seeds, farm machinery, fuel and fertilizers), and revisedplans to develop grain-based biofuel production;
2 tightened grain and fertilizer export policies, including withdrawal ofrebates of VAT that encouraged maize and rice exports and biofuel produc-tion, introduction of temporary export taxes on grains and fertilizers, andintroduction of a grain export licence;
3 grain stock and marketing interventions, including an increase in state-controlled grain reserves through temporary procurement of rice andmaize and transportation subsidies to move surplus grains from the north-east provinces to deficit areas of the country.
These policy measures stabilized domestic grain prices and increased grainavailability in China. However, these measures were costly for China anddistorted world markets. The following sections of this chapter provide thedetails of these measures and their impacts on markets and food security. Somelessons learned from China’s experience are discussed.
Grain production support programmes and supply response
Table 13.1 provides a summary of China’s major agricultural domestic andtrade policies since 2001. Some of these (for example tariff rate quotas) wereimplemented in response to WTO accession, but many of the policies listed inTable 13.1 were initiated in response to a 2.8 per cent annual decline in China’sgrain area (rice, wheat and maize) from 1998 to 2003. In 2003, wheat outputdeclined to its lowest level since the mid-1980s, and the area harvested fell toits lowest level since 1950. These developments led to importation of 10million tons of wheat in 2003. In response, China implemented a series ofpolicies including the elimination of taxes on agricultural land, direct paymentsto grain farmers and adjustments to price support programmes in 2004. In2005, a subsidy for the purchase of farm machinery was implemented and adirect subsidy for farm use of fuel and fertilizers was added in 2006. Withrising food prices, earlier policies were intensified and new policies were added.
Price support increased in 2008
In response to a general decline in cereal production since 1998 and sharp risesin grain prices in late 2003, the government initiated a minimum price schemein 2004 as an incentive to increase production of rice and wheat. The minimumprices in 2004 for early rice and japonica rice were announced at RMB1400per ton and RMB1500 per ton respectively, and remained unchanged in 2005,2006 and 2007. However, in 2008, the central government increased the floorprice by RMB100 per ton for early indica rice, RMB140 per ton for japonica
HOW CHINA STABLILIZED GRAIN PRICES DURING THE GLOBAL CRISIS 257
ES_RC_9-8 18/8/10 20:23 Page 257

rice, RMB100 for white wheat, and RMB160 for red/mixed wheat ascompared to the previous year. In 2009, the government announced a furtherincrease of rice and wheat floor prices, by 15 and 16 per cent respectively (seeTable 13.2).
Non-price government support programmes doubled in 2008
Non-price government support programmes include direct payments, seedsubsidies, subsidies for farm machinery, and subsidies for farm use of fuel andfertilizers. The funds allocated to support these programmes are summarized inFigure 13.2. The support levels have been increased substantially year by year
258 POLICY RESPONSES IN CHINA AND INDIA
Table 13.2 Government floor price for grains in 2004–2009 (RMB per ton)
2004 2005 2006 2007 2008 2009
RiceEarly indica (paddy) 1400 1400 1400 1440 1540 1800
($173)Japonica (paddy) 1500 1500 1500 1500 1640 1900
($186)WheatWhite wheat no no 1440 1440 1540 1740Red/mixed wheat no no 1380 1380 1440 1660
Source: USDA (2008, 2009)
Table 13.1 China: Domestic agriculture and trade policies, 2001–2008
Policy/effective year 2001 2002 2003 2004 2005 2006 2007 2008
Accession to WTO xTariff rate quotas x x x x x x x xSeed subsidies x x x x x x x xDirect payments to grain farmers x x x x xPrice support programmes x x x x xElimination of taxes on agricultural land x x x x xSubsidy for the purchase of farm machinery x x x xVAT exemption for farm use of seed and fertilizers x x xDirect subsidy for farm use of fuel and fertilizers x x xElimination of the 13 per cent VAT rebate on ethanol exports x xElimination of VAT rebate on grain exports xGrain export taxes xFertilizer export duties xGrain domestic transportation subsidies x
ES_RC_9-8 18/8/10 20:23 Page 258

to sustain grain production. Total aggregated subsidies in these programmes in2008 reached RMB95 billion (approximately $4.8 billion), double the previousyear and over 3.5 times the amount granted in 2006. On a per hectare basis,total subsidies increased from $51 per hectare in 2006 to $166 in 2008 and ona per ton basis, they increased from $10 in 2006 to about $33 in 2008.
Direct payments to grain farmersDirect payments to farmers were initiated on a trial basis in 2002 in the majorgrain-producing provinces of Anhui, Henan, Hubei and Jilin, and implementa-tion began nationally in 2004. Implementation varies by province, with someproviding the subsidy based on planted area and others based on quantityproduced. The payment rates vary across provinces, but in 2004 the averageprogramme payment was 150RMB/ha with total payments estimated atRMB11.6 billion. By 2008, the total grain direct payment had increased toRMB15.1 billion in 2008.
Seed subsidy and farm machinery subsidyWith the objective of increasing production, China has subsidized farmers forthe cost of purchasing improved quality soybean seeds since 2002. This schemewas extended to wheat, maize and rice in 2004. The combined value of theseed subsidy for wheat, rice, corn and soybean was RMB12.1 billion in 2008,up 80 per cent from 2007.
The government programme to subsidize the purchase of farm machineryis implemented at the provincial level, and local governments decide on thetypes of machines and models eligible for the subsidy. Total subsidies in 2008were estimated at RMB4 million, double the level in 2007.
HOW CHINA STABLILIZED GRAIN PRICES DURING THE GLOBAL CRISIS 259
Figure 13.2 Non-price government support, 2005–2008
Source: Based on data from MOA of China and USDA/FAS
100
80
60
40
20
02005 2006 2007 2008
billi
on Y
uan
Direct payment
Seeds subsidy
Machinery subsidy
Fertilizer/fuel subsidy
ES_RC_9-8 18/8/10 20:23 Page 259

Comprehensive subsidy on fuel and fertilizerStarted in 2006, this programme intends to partially compensate farmers forprice increases in fuel, fertilizer and other agricultural inputs. In 2007, thecomprehensive subsidy on fuel and fertilizer for grain farmers totalledRMB63.8 billion, up 130 per cent from the previous year.
Agricultural subsidies and the WTOFollowing 15 years of negotiations, China became a WTO member inDecember 2001. The Uruguay Round Agreement on Agriculture (URAA)classified price supports as an ‘amber-box’ trade-distorting policy, the use ofwhich should be limited. As part of its WTO commitments, China agreed thatthe value of its trade-distorting amber-box support for agriculture would notexceed 8.5 per cent of its total value of agricultural output (China’s de minimisexemption). The 8.5 per cent annual threshold based on China’s crop outputvalue in 2001 amounted to $14 billion (Fang et al, 2002), and subsidies in2008 were close to this level.
However, the URAA placed no limits on ‘green-box’ subsidies, which do notdirectly distort trade. These subsidies include government-supported research,disease control, infrastructure and policy subsidies for certain grain marketingand promotion services. The green-box category also includes income supportpayments made directly to farmers that do not stimulate production, assistanceto help farmers restructure agriculture, and environmental and regional assis-tance programmes. In China, infrastructure services (a major part of generalservices) and public stockholding for food security purposes account for the twolargest components within the green box. China’s direct payments can also beclassified as ‘green-box’ subsidies, so it seems that China did not exceed the deminimis limit in 2008. Further, as world fuel and fertilizer prices declined in late2008 and 2009, the value of these subsidies will also decline.
Grain output has been steadily rising for several years
The increased prices and government subsidies have encouraged farmers toplant more rice, wheat and maize. The total grain (rice, wheat and maize) areain 2008 reached 81.9 million hectares, 3.9 per cent above the previous five-year average. Output of the three grains in 2008 reached a record of 406.7million tons, 17.6 million tons or 4.5 per cent above the previous year, markingthe fifth consecutive year that output increased. Higher grain production wasachieved in spite of natural disasters and difficult domestic and internationaleconomic environments.
Out of the total grain output in 2008, rice accounted for 132 million tons,with an increase of 4.8 million tons from the previous year, reflecting bothlarger area and higher yields per hectare. As with total grains, rice output hasbeen steadily rising (see Figure 13.3), especially in northeast China, the majorrice surplus region in the country. Output of wheat was 112.5 million tons in2008, 2.6 million tons over that in the previous year, while maize output was162 million tons, 10.2 million tons larger.
260 POLICY RESPONSES IN CHINA AND INDIA
ES_RC_9-8 18/8/10 20:23 Page 260

The increases in grain production have been sufficiently rapid to generatesurpluses over domestic utilization. In 2007, the surplus of production overdomestic utilization (including food, feed, seeds, waste and other uses) was 2.7million tons of rice, 9 million tons of wheat and 7 million tons of maize (seeFigure 13.4 for rice). In 2008, the surpluses were 6.5 million tons of rice, 10.5million tons of wheat, and 9.5 million tons of maize.
HOW CHINA STABLILIZED GRAIN PRICES DURING THE GLOBAL CRISIS 261
1.2
1.1
1.0
0.9
0.8
0.7
1991
Inde
xAreaProductionYield
1992
1993
1994
1995
1996
1997
1998
1999
2000
2001
2002
2003
2004
2005
2006
2007
2008
Figure 13.4 Rice production and domestic utilization, 2005–2008
Source: Raw data from FAO/GIEWS (2009b)
133,000
132,000
131,000
130,000
129,000
128,000
127,000
126,000
125,000
124,000
123,0002005 2006 2007 2008
Thou
sand
tons
ProductionDomestic utilization
Figure 13.3 China’s rice area, yield and production index, 1991–2008
Note: 1991 = 1.Source: Raw data from FAO/GIEWS (2009b)
ES_RC_9-8 18/8/10 20:23 Page 261

Grain and fertilizer export restrictions and trade response
Although grain production had increased for four straight years, and althoughgrain prices were not a factor in the surge of domestic food prices in 2007,China implemented a series of trade policy measures to restrain grain andfertilizer exports. These measures included removal of VAT rebates thatencouraged exports of maize, rice and biofuel products, the introduction oftemporary export taxes on grains and fertilizers, a ban on grain exportlicences, and special duties on fertilizer exports.
Removal of the VAT rebate on cereal exports
A VAT for domestic products was introduced in 1994 under the taxationreforms. The VAT rate for agricultural products is 13 per cent, 4 percentagepoints lower than the VAT rate generally applied to other products. VAT is notcollected from the primary producers of agricultural products, but from theprimary purchasers of agricultural products. The VAT liability is calculated as‘output VAT’ (13 per cent of the sales value of agricultural products) minus the‘input VAT’ (10 per cent of purchase value of agricultural products).
The export rebate (or VAT rebate) has been part of tax incentive policyimplemented to encourage exports of all categories of commodities since the1980s. Over the years, the Chinese government made adjustments to the taxcategory to control the trading of certain categories of commodities. Prior to20 December 2007, exports of wheat, paddy rice, milled rice, corn, othercereals, soybeans, and their derived flour by-products were entitled to a 13 percent rebate of their declared export value at the port. This export subsidyconstituted the bulk of the profit for grain traders. On 20 December 2007,however, the Chinese government removed the export rebate on theseproducts. (The VAT rebate for export of vegetable oils was also eliminated on13 June 2008.) These adjustments were aimed at containing food price infla-tion that otherwise might have been transmitted to the domestic economy fromworld markets.
The removal of the rebate reportedly severely cut traders’ profit marginsexcept for a few commodities in some high-end markets with comparativelyhigh profit margins. In the case of average quality rice exports to the develop-ing world, the loss of the rebate severely affected traders’ profits. For wheatflour, the removal of the rebate made flour exports to Southeast Asiancountries significantly less price competitive.
Export taxes on grains and their flour products
Prior to becoming a WTO member, China provided export subsidies for maizeand rice as a means of easing the downward pressure on domestic prices, whichwas brought about by large domestic production surpluses. China was obligedto cease all export subsidies in 2002 in line with its WTO accession commit-ments.
262 POLICY RESPONSES IN CHINA AND INDIA
ES_RC_9-8 18/8/10 20:23 Page 262

Effective in January 2008, provisional export duties on wheat, buckwheat,barley and oats were imposed by the central government to further discourageexports. The export tax rates ranged from 5 per cent to 25 per cent, with therates for wheat and wheat flour at 20 per cent and 25 per cent, respectively. Theexport tax rate for maize, paddy rice, milled rice and soybeans was 5 per centand the rate for flour products from corn, rice and soybean was 10 per cent.
State trade and export licence management
Since 1990, China has used a system of state trading for exports of certaincommodities, aiming to maintain stable prices of strategic agriculturalcommodities and ensure adequate supplies of inputs to state-run processingindustries. State trading was permitted to be retained for rice, maize, soybeans,tea, cotton and silk in China’s WTO accession agreement. Through the use ofstate trading for exports, China was able to control exports of rice, maize andsoybeans during the global food price crisis in 2007–2008.
Exports of wheat, maize and rice flour products were subject to exportlicence management beginning January 2008. The licence regime is intended tocap the export volume of such products in case flour product exports were stillviable despite the high export tax rate. China also imposed export quotas onflour made of wheat, maize and rice. Figure 13.5 shows the timing of thesegrain export measures relative to international rice price trends. The exportcontrols were imposed right before the surge of world rice prices and effec-tively insulated China’s domestic rice market from the world markets. Inaddition to control of exports, China also stepped up wheat and maize salesfrom state reserves to prevent domestic prices from rising.
HOW CHINA STABLILIZED GRAIN PRICES DURING THE GLOBAL CRISIS 263
Figure 13.5 World rice prices, China’s grain export policies and rice exports
Source: Raw data from EST/FAO (2009) and FAO/GIEWS (2009b)
1500
1200
900
600
300
0
Jan-
06Fe
b-06
Mar
-06
Apr
-06
May
-06
Jun-
06Ju
l-06
Aug
-06
Sep
-06
Oct
-06
Nov
-06
Dec
-06
Jan-
07Fe
b-07
Mar
-07
Apr
-07
May
-07
Jun-
07Ju
l-07
Aug
-07
Sep
-07
Oct
-07
Nov
-07
Dec
-07
Jan-
08Fe
b-08
Mar
-08
Apr
-08
May
-08
Jun-
08Ju
l-08
Aug
-08
Sep
-08
Oct
-08
Nov
-08
Dec
-08
Thou
sand
tons
(exp
orts
), U
S$
per t
on (p
rices
)
Rice exports World rice prices
Jan 2007: Removal of VAT rebate on ethanol exports
20 Dec 2007: Removal of VAT rebate on rice, wheat and maize exports
Jan 2008: Export taxes on and licensing for rice, wheat and maize exports
Dec 2008: Removal or reduction of export taxes
ES_RC_9-8 18/8/10 20:23 Page 263
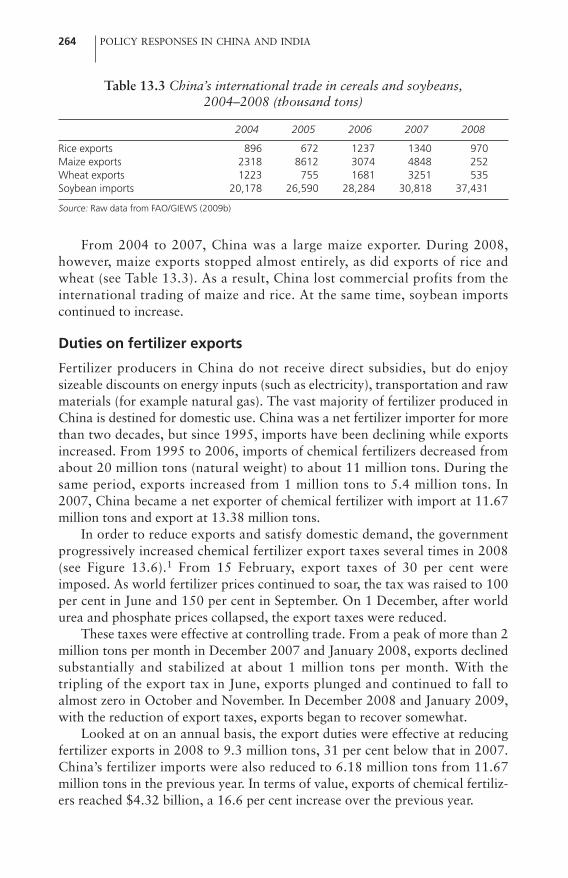
From 2004 to 2007, China was a large maize exporter. During 2008,however, maize exports stopped almost entirely, as did exports of rice andwheat (see Table 13.3). As a result, China lost commercial profits from theinternational trading of maize and rice. At the same time, soybean importscontinued to increase.
Duties on fertilizer exports
Fertilizer producers in China do not receive direct subsidies, but do enjoysizeable discounts on energy inputs (such as electricity), transportation and rawmaterials (for example natural gas). The vast majority of fertilizer produced inChina is destined for domestic use. China was a net fertilizer importer for morethan two decades, but since 1995, imports have been declining while exportsincreased. From 1995 to 2006, imports of chemical fertilizers decreased fromabout 20 million tons (natural weight) to about 11 million tons. During thesame period, exports increased from 1 million tons to 5.4 million tons. In2007, China became a net exporter of chemical fertilizer with import at 11.67million tons and export at 13.38 million tons.
In order to reduce exports and satisfy domestic demand, the governmentprogressively increased chemical fertilizer export taxes several times in 2008(see Figure 13.6).1 From 15 February, export taxes of 30 per cent wereimposed. As world fertilizer prices continued to soar, the tax was raised to 100per cent in June and 150 per cent in September. On 1 December, after worldurea and phosphate prices collapsed, the export taxes were reduced.
These taxes were effective at controlling trade. From a peak of more than 2million tons per month in December 2007 and January 2008, exports declinedsubstantially and stabilized at about 1 million tons per month. With thetripling of the export tax in June, exports plunged and continued to fall toalmost zero in October and November. In December 2008 and January 2009,with the reduction of export taxes, exports began to recover somewhat.
Looked at on an annual basis, the export duties were effective at reducingfertilizer exports in 2008 to 9.3 million tons, 31 per cent below that in 2007.China’s fertilizer imports were also reduced to 6.18 million tons from 11.67million tons in the previous year. In terms of value, exports of chemical fertiliz-ers reached $4.32 billion, a 16.6 per cent increase over the previous year.
264 POLICY RESPONSES IN CHINA AND INDIA
Table 13.3 China’s international trade in cereals and soybeans, 2004–2008 (thousand tons)
2004 2005 2006 2007 2008
Rice exports 896 672 1237 1340 970Maize exports 2318 8612 3074 4848 252Wheat exports 1223 755 1681 3251 535Soybean imports 20,178 26,590 28,284 30,818 37,431
Source: Raw data from FAO/GIEWS (2009b)
ES_RC_9-8 18/8/10 20:23 Page 264

Grain stock and marketing interventions
The Government of China operates a grain floor price programme, wherebyfarmers in designated provinces may sell their output to SinoGrain2 whenmarket prices drop below the price floor. In the past several years, many wheatfarmers sold wheat to the government since the market price fell below thefloor price at harvest time. During the three years from 2006 to 2008, the state-designated grain storage companies purchased on average 34 per cent of totalwheat production. The procured volumes of rice and maize were much smallerthan those for wheat, however. In 2008, SinoGrain purchased 11.8 milliontons of rice (paddy) and 8.5 million tons of maize in the northeasternprovinces, approximately 5–6 per cent of total national production in bothcases.
As a result of five straight years of bumper harvests and export restrictions,China’s grain ending stocks in 2008 increased significantly. They increased by5.4 million tons of rice, 8.6 million tons of wheat and 7.1 million tons of maizefrom levels that were already relatively high compared to the previous fewyears. From 2004 to 2009, the ratio of ending stock to domestic utilization inChina increased from 45 per cent to 54.5 per cent for rice and from 48 per centto 76 per cent for wheat (see Figure 13.7). These ratios are over three times aslarge as those for the rest of the world, highlighting the importance theGovernment of China places on national food security.
Many countries pursued similar strategies of building up stocks during thecrisis. Such a strategy will tend to put upward pressure on prices, but China
HOW CHINA STABLILIZED GRAIN PRICES DURING THE GLOBAL CRISIS 265
Figure 13.6 Fertilizer exports and trade policies
Source: Raw data from CGAC (2009)
3000
2500
2000
1500
1000
500
0
Jan-0
7
Feb-07
Mar-07
Apr-07
May-07
Jun-0
7Ju
l-07
Aug-07
Sep-07
Oct-07
Nov-07
Dec-07
Jan-0
8
Feb-08
Mar-08
Apr-08
May-08
Jun-0
8Ju
l-08
Aug-08
Sep-08
Oct-08
Nov-08
Dec-08
Jan-0
9
Thou
sand
tons
Feb 2008: 30% export tax
June 2008: 100% export tax
Sept 2008: 150% export tax
ES_RC_9-8 18/8/10 20:23 Page 265

was able to avoid substantial domestic price increases (see next section) due tothe fact that output has been increasing for several years and because of exportrestrictions that prevented the grain from flowing to world markets.
266 POLICY RESPONSES IN CHINA AND INDIA
70
60
50
40
30
20
10
02004/2005 2005/2006 2006/2007 2007/2008 2008/2009
China-milled rice
China-wheatChina-maizeWorld (exl China)-milled riceWorld (exl China)-wheat
World (exl China)-maize
Per
cen
t
Figure 13.8 Domestic and world prices of rice, January 2004 to December 2008
Note: World prices are for Thai100%B. Indica rice price is the average of wholesale prices in Hunan, Hubei,Jiangxi and Anhui. Japonica rice price is the average of wholesale prices in Heilongjiang and Anhui. Source: Raw data from FAO/GIEWS (2009a)
7000
6000
5000
4000
3000
2000
1000
0
Jan-0
4
Mar-04
May-04Ju
l-04
Sep-04
Nov-04
Jan-0
5
Mar-05
May-05Ju
l-05
Sep-05
Nov-05
Jan-0
6
Mar-06
May-06Ju
l-06
Sep-06
Nov-06
Jan-0
7
Mar-07
May-07Ju
l-07
Sep-07
Nov-07
Jan-0
8
Mar-08
May-08Ju
l-08
Sep-08
Nov-08
RM
B p
er to
n
China indica rice China japonica rice World rice (Thai 100%B)
Figure 13.7 Ratio of ending stocks to domestic utilization
Source: Raw data from FAO/GIEWS (2009b)
ES_RC_9-8 18/8/10 20:23 Page 266

Domestic grain prices stabilized, agricultural trade balance worsens
After two decades of historically low prices, grain prices surged from 2006 to2008. For rice, the price of Thai 100%B second grade, FOB Bangkok (thebenchmark price for rice in international markets) in May 2008 reached amonthly peak of $963/ton, about 2.5 times as high as its level in January 2008and almost triple its level in May 2007. By contrast, the domestic price of ricein China rose by only 9 per cent (in nominal terms) for japonica and 12 percent for indica rice from May 2007 to May 2008 (see Figure 13.8). While riceprices in China in May 2007 were almost the same as that for the Thai 100%B(FOB price), they were only about 40 per cent of Thai prices in May 2008.
China also avoided domestic price surges for wheat and maize (see Figures13.9 and 13.10), even though world prices of those food commoditiesincreased considerably. Average domestic prices for wheat and maize were only17 and 23 per cent higher, respectively, in 2008 than in 2006, compared withincreases of 51 and 61 per cent on world markets (in Chinese yuan terms).
In contrast, the soybean market in China is integrated into the worldmarket and soybeans trade was not controlled. Therefore, the domesticsoybeans price in China experienced a similar surge as that on the worldmarket, as can be clearly seen in Figure 13.11. Domestic soybean prices rose by86 per cent from 2006 to 2008, while world soybean prices (US No 1, Yellow,US Gulf) price increased by 75 per cent in Chinese yuan terms.
HOW CHINA STABLILIZED GRAIN PRICES DURING THE GLOBAL CRISIS 267
Figure 13.9 Domestic and world prices of wheat, January 2004 to December 2008
Note: World prices are for US No 2, Hard Red Winter ordinary protein, FOB US Gulf. Domestic price is average ofwholesale prices in Hebei, Shangdong, Anhui and Henan. Source: Raw data from FAO/GIEWS (2009a)
0
1000
2000
3000
4000
Jan-0
4
Mar-04
May-04Ju
l-04
Sep-04
Nov-04
Jan-0
5
Mar-05
May-05Ju
l-05
Sep-05
Nov-05
Jan-0
6
Mar-06
May-06Ju
l-06
Sep-06
Nov-06
Jan-0
7
Mar-07
May-07Ju
l-07
Sep-07
Nov-07
Jan-0
8
Mar-08
May-08Ju
l-08
Sep-08
Nov-08
RM
B p
er to
n
China wheat World wheat (USA)
ES_RC_9-8 18/8/10 20:23 Page 267

268 POLICY RESPONSES IN CHINA AND INDIA
Figure 13.11 Domestic and world prices of soybeans, January 2004 to December 2008
Note: World prices are for US No 1, Yellow, FOB US Gulf. Domestic price is the average of wholesale prices inLiaoning and Heilongjiang. Source: Raw data from FAO/GIEWS (2009a)
0
1500
3000
4500
6000
Jan-0
4
Mar-04
May-04Ju
l-04
Sep-04
Nov-04
Jan-0
5
Mar-05
May-05Ju
l-05
Sep-05
Nov-05
Jan-0
6
Mar-06
May-06Ju
l-06
Sep-06
Nov-06
Jan-0
7
Mar-07
May-07Ju
l-07
Sep-07
Nov-07
Jan-0
8
Mar-08
May-08Ju
l-08
Sep-08
Nov-08
RM
B p
er to
n
China soybeans World soybeans
Figure 13.10 Domestic and world prices of maize, January 2004 to December 2008
Note: World prices are for US No 2, Yellow, FOB US Gulf. Domestic price is for yellow maize, average of wholesaleprices in Liaoning, Jilin. Heilongjiang and Inner Mongolia. Source: Raw data from FAO/GIEWS (2009a)
0
500
1000
1500
2000
Jan-0
4
Mar-04
May-04Ju
l-04
Sep-04
Nov-04
Jan-0
5
Mar-05
May-05Ju
l-05
Sep-05
Nov-05
Jan-0
6
Mar-06
May-06Ju
l-06
Sep-06
Nov-06
Jan-0
7
Mar-07
May-07Ju
l-07
Sep-07
Nov-07
Jan-0
8
Mar-08
May-08Ju
l-08
Sep-08
Nov-08
RM
B p
er to
n
China maize World maize (USA)
ES_RC_9-8 18/8/10 20:23 Page 268

The restrictions on grain exports resulted in a loss of fiscal revenue andexport earnings, especially given the high prices on world markets. At the sametime, soybean imports increased in quantity terms even though world pricesincreased. Total oilseed and vegetable oils imports increased over 100 per cent,while pork imports increased by 1300 per cent during the first half of 2008. Asa result, China experienced a negative trade balance in agriculture for the firsttime in years (USDA, 2008a).
Profitability of crop production increased
Table 13.4 presents the national average cost of production, subsidies and netreturns in paddy production in China from 2003 to 2008. The table is based ondata from annual farm household surveys conducted by China’s Price Bureauin cooperation with many other agencies, including the Ministry of Agricultureand Ministry of Domestic Trade.
Subsidies for paddy production increased from 240 yuan per hectare in2006 to 344 yuan in 2007 and 690 yuan in 2008, an increase of 450 yuan perhectare in two years. During the same two years, however, input costsincreased by 1122 yuan per hectare. Furthermore, grain prices were stableduring this period, as shown above.
Nevertheless, profitability increased during this time due to increasedyields per hectare. In 2008, the average paddy yield was a record 6.93 tons perhectare, 6.4 per cent above that in 2006. The higher yields led to higher grossreturns and higher profits. Net returns increased from 3043 yuan per hectare in2006 to 3371 yuan in 2007 and 3630 yuan in 2008. A similar conclusion holdson a per ton basis: net returns per ton increased from 465 yuan in 2006 to 499yuan in 2007 and 521 yuan in 2008.
Farmers’ profits increased for rice, wheat and maize during the globalprice surge in 2007 and 2008, but the profitability of producing soybeans
HOW CHINA STABLILIZED GRAIN PRICES DURING THE GLOBAL CRISIS 269
Table 13.4 Average production costs, subsidies and profits in paddy riceproduction (real terms, deflated by CPI 2000 = 1), 2003–2008
2003 2004 2005 2006 2007 2008
Per hectare (yuan/ha)Value of output 7641 10,585 9643 9979 10,364 11,239Total cost of production 6195 6506 6934 7177 7336 8299Income without subsidies 1447 4079 2709 2803 3028 2940Subsidies �93 102 124 240 344 690Income with subsidies 1354 4181 2832 3043 3371 3630
Per metric ton (yuan/ton)Value of output 1246 1565 1492 1525 1535 1614Total cost of production 1010 962 1073 1097 1086 1192Income without subsidies 236 603 419 428 448 422Subsidies �15 15 19 37 51 99Income with subsidies 221 618 438 465 499 521
Source: Raw data from China National Development and Reform Commission (NDRC)
ES_RC_9-8 18/8/10 20:23 Page 269
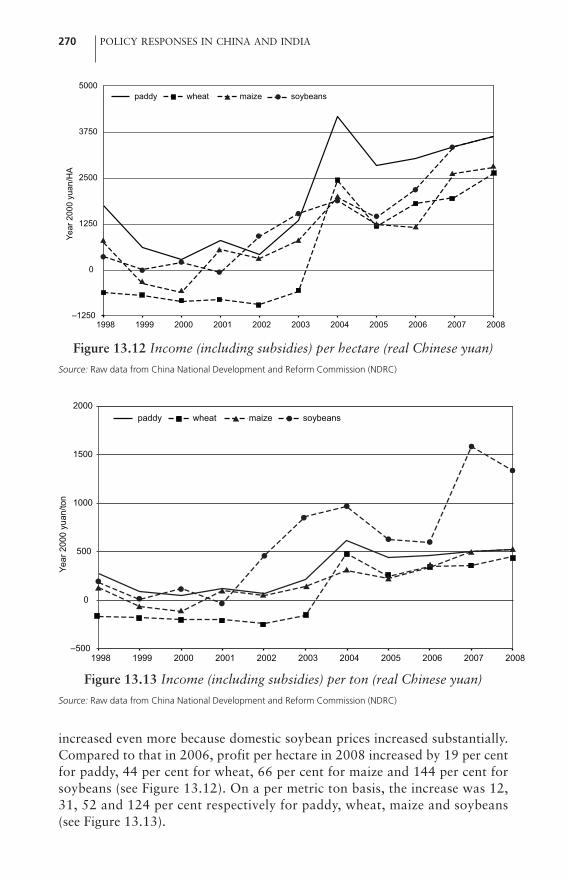
increased even more because domestic soybean prices increased substantially.Compared to that in 2006, profit per hectare in 2008 increased by 19 per centfor paddy, 44 per cent for wheat, 66 per cent for maize and 144 per cent forsoybeans (see Figure 13.12). On a per metric ton basis, the increase was 12,31, 52 and 124 per cent respectively for paddy, wheat, maize and soybeans(see Figure 13.13).
270 POLICY RESPONSES IN CHINA AND INDIA
Figure 13.12 Income (including subsidies) per hectare (real Chinese yuan)
Source: Raw data from China National Development and Reform Commission (NDRC)
–1250
0
1250
2500
3750
5000
1998 1999 2000 2001 2002 2003 2004 2005 2006 2007 2008
Year
200
0 yu
an/H
A
paddy wheat maize soybeans
Figure 13.13 Income (including subsidies) per ton (real Chinese yuan)
Source: Raw data from China National Development and Reform Commission (NDRC)
–500
0
500
1000
1500
2000
1998 1999 2000 2001 2002 2003 2004 2005 2006 2007 2008
Year
200
0 yu
an/to
n
paddy wheat maize soybeans
ES_RC_9-8 18/8/10 20:23 Page 270

Lessons learned
The major factor that contributed to grain market stability in China during theworld food crisis was a long-term policy of support for grain production. Afterexperiencing a wheat shortage in 2003, China implemented a series of produc-tion programmes to protect farmland and to promote agricultural productivityand farm incomes. During the global food price surge, China significantlyincreased support to grain production and achieved a fifth consecutive year-on-year increase in grain production in 2008. China’s experience has clear policyimplications for food security: the government should increase investment inthe agricultural sector, including expansion of rural infrastructure, to promoteagricultural productivity. Despite increased costs of production, especially forfertilizer, Chinese farmers’ net income in producing rice, wheat, maize andsoybeans increased due to both increased productivity and significantlyincreased subsidies.
Strong export controls imposed by China on grains and fertilizers wereanother key factor in stabilizing China’s staple grain prices during the worldfood crisis. Although such controls did not violate WTO rules (Cheng, 2008;Sharma and Konandreas, 2008), they were not without cost to both China andthe world. These short-run trade policies may limit the scope for longer-termagricultural development since farmers were not able to take advantage ofhigher food prices. World grain prices would not have increased as much ifChina had participated more in world grain trade during the crisis, especiallygiven China’s large grain stocks relative to domestic utilization. China alsogave up financial benefits by not taking advantage of soaring world prices.
An enhanced market information and early warning system will be veryimportant for China to make timely and effective policies. The recent globalfood price crisis exposed the weaknesses of China’s statistical information,database and warning/monitoring system on food security. Improving China’sagricultural information system and enhancing its ability to monitor andanalyse markets is essential for policymakers and stakeholders in China todevelop strategies that prevent instabilities in domestic food supply and adaptto trends in international grain markets. In addition, the core policies thatChina uses to promote food security – agricultural production support, tradepolicies and grain reserves – are intended to protect all consumers, especiallythose in urban populations, and are not well targeted to the poor. Safety netprogrammes targeting people vulnerable to food insecurity are urgentlyneeded.
Enhanced regional and international collaboration are critical inaddressing the problem of high world food prices (Brahmbhatt andChristiaensen, 2008). The G8 leaders statement on Agriculture and FoodSecurity, adopted at the G8 meeting of agricultural ministers in Cison diValmarino (Italy), 18–20 April 2009, highlighted the importance of reject-ing protectionism and encouraging the development of local, regional andinternational integrated agricultural markets. China is the world’s largest
HOW CHINA STABLILIZED GRAIN PRICES DURING THE GLOBAL CRISIS 271
ES_RC_9-8 18/8/10 20:23 Page 271

agricultural producer and consumer of major staple foods and has becamean increasingly important player in world food markets since its accessionto the WTO in 2001. As a large country, China could play an important rolein regional and global cooperation to take collective action to deal withregional/global food crises.
Notes1 The tax covered most fertilizers, but did not include organics or high-value fertiliz-
ers.2 SinoGrain is a state enterprise (including provincial counterparts) responsible for
holding grain reserves.
ReferencesBrahmbhhatt, M. and Christiaensen, L. (2008) ‘Rising food prices in East Asia:
Challenges and policy options’, World Bank, Washington, DC, mimeograph CGAC (Customs General Administration of China) (2009) ChinaCustomsStat website,
www.chinacustomsstat.comCheng, F. (2008) ‘China: Shadow WTO agricultural domestic support notifications’,
IFPRI Discussion Paper 00793, International Food Policy Research Institute,September 2008
EST/FAO (2009) ‘International commodity prices’, www.fao.org/es/esc/prices/PricesServlet.jsp?lang=en&ccode=2300
Fang, C., Tuan, F. and Zhong, F. (2002) ‘How might China protect its agriculturalsector?’ China’s Food and Agriculture: Issues for the 21st Century, Fred Gale (ed),ERS/USD Bulletin Number 775 (April)
FAO/GIEWS (2007) ‘Crop prospects and food situation’, no 6, DecemberFAO/GIEWS (2009a) ‘National basic food prices-data and analysis tool’,
www.fao.org/giews/pricetoolFAO/GIEWS (2009b) ‘Country commodity balance sheet’, FAO, Rome, ItalyLohmar, B. and Gale, F. (2008) ‘Who will China feed?’, Amber Waves, vol 6, no 3Sharma, R. and Konandreas, P. (2008) ‘WTO provisions in the context of responding
to soaring food prices’, FAO Commodity and Trade Policy Research Working PaperNo 25, FAO, Rome
USDA (2008) GAIN Report (CH8012): China, Peoples Republic of, Grain and FeedAnnual 2008, Foreign Agricultural Service, USDA, Washington, DC
USDA (2009) GAIN Report (CH9013): China, Peoples Republic of, Grain and FeedAnnual 2009, Foreign Agricultural Service, USDA, Washington, DC
272 POLICY RESPONSES IN CHINA AND INDIA
ES_RC_9-8 18/8/10 20:23 Page 272

14
Rice Policies in India in theContext of the Global Rice
Price Spike
Ashok Gulati and Monica Dutta
Backdrop and key issues
The volcanic eruption in rice prices (see Figure 14.1) in the global market,rising from $385/ton1 (January 2008) to $962.6/ton (May 2008) and thendeclining to about $582/ton (December 2008), has aroused keen interestamong policy analysts and policymakers regarding the reasons behind such aroller-coaster ride of rice prices. Was this just a one-time blip or was it a part ofthe so-called ‘global food crisis’ that many experts predicted will stay with usfor years to come?2 Was it due to a sharp drop in production at the global levelor have there been any structural changes in the rice demand–supply equationsover time in the world? Several scholars have been trying to understand thisphenomenon and respond to the underlying factors that led to this type of asituation. Rice was not the only commodity to have experienced such a highvolatility in prices, but it showed the highest peak (an increase of 150 per centfrom January to May 2008) as compared to other commodities such as wheatand maize.3
A wide range of studies have been conducted by several internationalorganizations such as International Food Policy Research Institute (von
ES_RC_9-8 18/8/10 20:23 Page 273

Braun, 2008c), Asian Development Bank (ADB, 2008a), OECD-FAO (2008),Abbott et al (2008) and the World Bank (2008), which look at the issue ofrising food prices. The reasons cited by these consist of both the demand-sidefactors (such as rising fuel prices, changing dietary patterns, rising demand forbiofuels, and income and population growth) as well as the supply-sidefactors (such as agricultural production shocks, restrictive market and tradepolicy, lack of technological innovation in agriculture and declining stocks offood grains).
This chapter attempts to see whether this abrupt price rise was driven byany structural change in demand and supply factors, with a focus on India; orwas it just a result of certain policy actions such as export bans by India, Chinaand Viet Nam? The restrictions on exports were undertaken as a knee-jerkreaction to the uncertainty and fear that gripped the policymakers in responseto reports coming from several institutions of the impending food crisis that islikely to stay for a longer period ahead,4 and this fear got multiplied severaltimes by the vibrant media across the world.5 The focus of this chapter is India;and in trying to understand why India put an export ban on rice (Gulati andGupta, 2007), which presumably triggered a chain reaction leading to a sharpspike of rice price in the international market, an understanding of the politicaleconomy and the psyche of the policymakers of India is essential. For this, oneneeds to dig a little deeper in the rice economy of India within the context ofoverall importance of food grains, especially wheat and rice, and the need tofeed a population of 1.1 billion.
Accordingly, the next section introduces the Indian rice market in thebackdrop of a global context, giving its relative share in production, trade etc.Then the chapter provides a view of the global rice market. We then delvedeeper into the nature of government policies and intervention in the ricemarkets in India. These rice policies, which range from minimum support price
274 POLICY RESPONSES IN CHINA AND INDIA
Figure 14.1 Spike in the global rice price
Source: FAO (2008)
0
250
500
750
1000Ja
n-05
Mar
-05
May
-05
Jul-0
5
Sep
-05
Nov
-05
Jan-
06
Mar
-06
May
-06
Jul-0
6
Sep
-06
Nov
-06
Jan-
07
Mar
-07
May
-07
Jul-0
7
Sep
-07
Nov
-07
Jan-
08
Mar
-08
May
-08
Jul-0
8
Sep
-08
Nov
-08
Jan-
09
Mar
-09
May
-09
Jul-0
9
Sep
-09
US
$/to
n
Rice (White Rice, Thai 100%)Wheat (US No 2, HRW)Maize (US No 2, Yellow)
ES_RC_9-8 18/8/10 20:23 Page 274

(MSP) for the output, levy on rice millers and huge subsidization of inputs suchas fertilizer, power and water, create a complex structure of incentives for thefarmers. Government also intervenes by heavy procurement, stocking anddistributing rice at subsidized rates through the Targeted Public DistributionSystem (TPDS), the nature and degree of which is also discussed. In order tounderstand the overall impact of these myriad sets of policies on the overallincentives of the farmers in an open-economy framework, the protectioncoefficients of rice over a longer period (1981–2005) are then presented. Thenan attempt is made to look into the role of India in flaring the rice prices.Finally, the chapter chalks out the way forward with a view to reform theIndian rice sector that can lead to its faster growth, higher efficiency and betterenvironmental sustainability.
The Indian rice market
Rice is the key dietary staple for many Indians and much of the crop grown inthe country is used to feed the domestic population. In India, rice occupied43.7 million hectares, around 23 per cent (highest among all other crops) of thetotal gross cropped area of 192.8 million hectares in 2005–2006 (Governmentof India, 2004–2008). At the global level, rice was grown over 157 millionhectares in 2007 and India’s share (of 44 million hectares) turned out to beabout 28 per cent of the total world paddy rice area (FAOStat, 2008). In termsof rice production, India’s share (with 97.5 million tons) of 22 per cent in2008–2009 stands only next to China with 130.5 million tons (30 per cent ofglobal production of 435 million tons in 2008) (FAS/USDA, 2008). Asia is themajor producer in the world rice market with a share of 86.5 per cent of theworld output of rice in 2008–2009. The Asian market is dominated by Chinawith a share of 35 per cent, followed by India, which produced 26 per cent ofthe total Asian output in 2008–2009. The productivity of Indian rice (paddy)has been lower in comparison to other nations such as China and Japan. It hada paddy yield of 3.21t/ha as opposed to a yield of 6.35t/ha for China and6.54t/ha for Japan in 2007 (FAOStat, 2008).
Within India, rice production6 fluctuates due to climatic factors. Rice,however, is the most important food crop in India with a share of 42 per centin the total food grain production in 2007–2008. The yield of rice (notpaddy), though low by international standards, increased from 1901kg/ha in2000–2001 to 2203kg/ha in 2007–2008 (an increase of 16 per cent over theseven-year period). India experienced a record crop of rice in 2007–2008. Thekey factor contributing to this was a rise in the rice productivity rather thanan increase in area harvested. The yield of rice increased by 3.4 per cent in2007–2008, whereas rice area harvested declined by 0.1 per cent in2007–2008 (Government of India, 2004–2008). Uttar Pradesh, West Bengaland Andhra Pradesh7 are the key rice-producing states in India, althoughmuch of the surplus for procurement comes from Punjab, Haryana andAndhra Pradesh.
RICE POLICIES IN INDIA IN THE CONTEXT OF THE GLOBAL RICE PRICE SPIKE 275
ES_RC_9-8 18/8/10 20:23 Page 275

Table 14.1 gives a picture of change in rice area, production and yield vis-à-vis wheat, the next most important crop in the Indian context, since 1990. Itmay be noted that during the last seven years or so, since 2000–2001, rice yieldin India has been increasing at an annual compound average growth rate(CAGR) of 2 per cent, while wheat yield growth has been dismal (0.08 per centper year).
India has always been one of the key rice-exporting nations. The exports ofrice (both basmati and non-basmati) from India have exhibited an increasingtrend from 2005–2006 onwards with India exporting 6.4 million tons of rice in2007–2008 (Government of India, 2009). With a rising trend in growth ratesof area, production and yield of rice, there was no supply-side constraintevident in the Indian market that could account for this flaring of the globalrice price. On the domestic front, retail rice prices exhibited a rising trendthroughout the period from January 2007 to January 2009 (see Figure 14.2).The rise was of a greater extent immediately after the restrictions were imposedon rice exports through the MEP in October 2007.8 This rise might have beenthe result of the hike in the MSP. The MSP for common paddy increased by 20per cent in 2007–2008 over 2006–2007, and it was raised further by another14 per cent in 2008–2009. However, the issue price under the PublicDistribution System (PDS) remained constant throughout the time period. Thereason for granting this hefty increase in the MSP was the hike in the interna-tional rice price. Though domestic prices rose, the increase was very nominal incomparison to global prices; the all-India average retail price of rice increasedby a meagre 9.5 per cent from January 2008 to May 2008, as opposed to a 150per cent hike in the global rice prices over the same time span. This shows thatthere were strong political and economic factors at play in the economy so asto prevent the transmission of high international prices to the domestic market,discussed in later sections of the chapter.
India is a major player in the world market of rice and any policy changesintroduced by the Indian government to ensure price stability and food securitywithin the nation are bound to have significant repercussions on the interna-tional market.
276 POLICY RESPONSES IN CHINA AND INDIA
Table 14.1 Compound growth rates of area, production and yield of principalcrops during 1990–2000 and 2000–2007
Crop 1990–1991 to 1999–2000 2000–2001 to 2007–2008Area Production Yield Area Production Yield
Rice 0.68 2.02 1.34 �0.14 1.87 2.00Wheat 1.72 3.57 1.83 1.29 1.36 0.08
Note: Base: Triennium ending 1981–1982 = 100. The growth rates for 1990–2000 and for 2000–2008 arecompound annual growth rates.Source: Government of India (2004–2008)
ES_RC_9-8 18/8/10 20:23 Page 276

The global rice market
Rice is a very thinly traded commodity, with only about 7 per cent of worldproduction being traded, as against wheat or maize, where the world trade as apercentage of production was 19 per cent and 12 per cent respectively in 2007(FAS/USDA, 2008). The major rice exporters include countries such asThailand, Viet Nam and India. In 2007–2008, India exported 6.4 million tonsof rice (Government of India, 2009), perhaps the highest since exports ofcommon rice began in 1994.
Figures 14.3 to 14.5 show the global production of key staples, the share ofnations in global rice production and in global rice stocks, along with theirpercentage shares, for the triennium ending (TE) 2008–2009.
It is well evident from the figures that there was neither any decline in theglobal rice production, nor in the global rice stocks in the last five years,2004–2005 to 2008–2009. This trend is also reflected in the case of India,where the percentage share in global rice production was 22.3 for TE2008–2009. In terms of share in the total global rice stocks, India exhibited arising trend in the last five years with a percentage share of 16.5 for TE2008–2009. With no supply-side constraints, the critical question still remainsunanswered as to what triggered the volcanic eruption in the global rice price?
RICE POLICIES IN INDIA IN THE CONTEXT OF THE GLOBAL RICE PRICE SPIKE 277
Jan-0
7
Mar-07
May-07 Ju
l-07
Sept-0
7
Nov-07
Jan-0
8
Mar-08
May-08
Jul-0
8
Sept-0
8
Nov-08
Jan-0
9
Rs
per k
g18
16
14
12
10
8
6
4
2
0
Figure 14.2 All-India average retail prices of rice (Rs/kg)
Note: Data for each month are as reported in the final week of the month.Source: Ministry of Consumer Affairs, Food and Public Distributionhttp://fcainfoweb.nic.in/Prices_Application/weekly_prices/san_report_ave.asp
ES_RC_9-8 18/8/10 20:23 Page 277
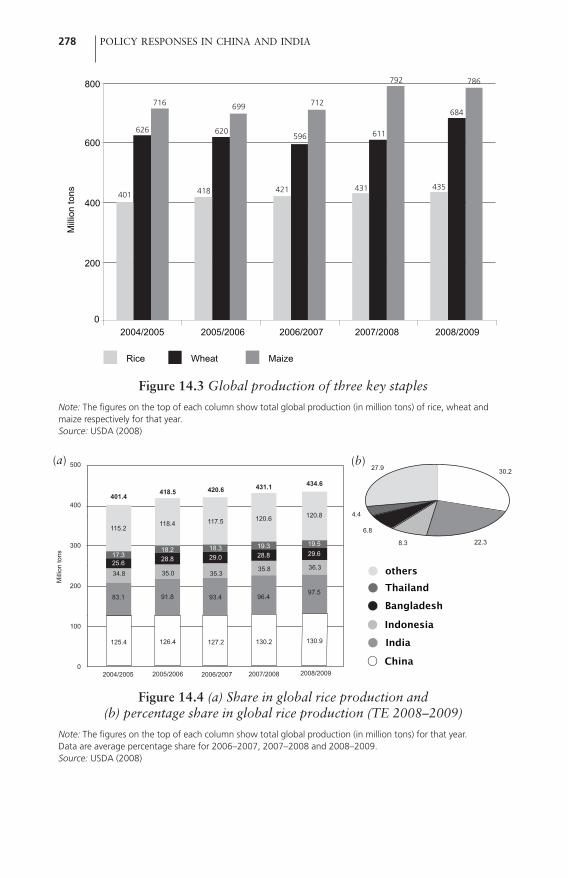
278 POLICY RESPONSES IN CHINA AND INDIA
Figure 14.3 Global production of three key staples
Note: The figures on the top of each column show total global production (in million tons) of rice, wheat andmaize respectively for that year.Source: USDA (2008)
Figure 14.4 (a) Share in global rice production and(b) percentage share in global rice production (TE 2008–2009)
Note: The figures on the top of each column show total global production (in million tons) for that year.Data are average percentage share for 2006–2007, 2007–2008 and 2008–2009.Source: USDA (2008)
0
200
400
600
800
2004/2005 2005/2006 2006/2007 2007/2008 2008/2009
Mill
ion
tons
Rice Wheat Maize
China
India
Indonesia
Bangladesh
Thailand
2004/2005 2005/2006 2006/2007 2007/2008 2008/2009
500
400
300
200
100
0
Mill
ion
tons
others
125.4 126.4 127.2 130.2 130.9
83.1 91.8 93.4 96.497.5
34.8 35.0 35.335.8 36.3
25.6 28.8 29.0 28.8 29.617.318.2 18.3 19.3 19.5
115.2118.4 117.5 120.6 120.8
401.4418.5 420.6 431.1 434.6
30.2
22.38.3
6.8
4.4
27.9(a) (b)
401
716
626
418
699
620
421
712
596
431
792
611
435
786
684
ES_RC_9-8 18/8/10 20:23 Page 278
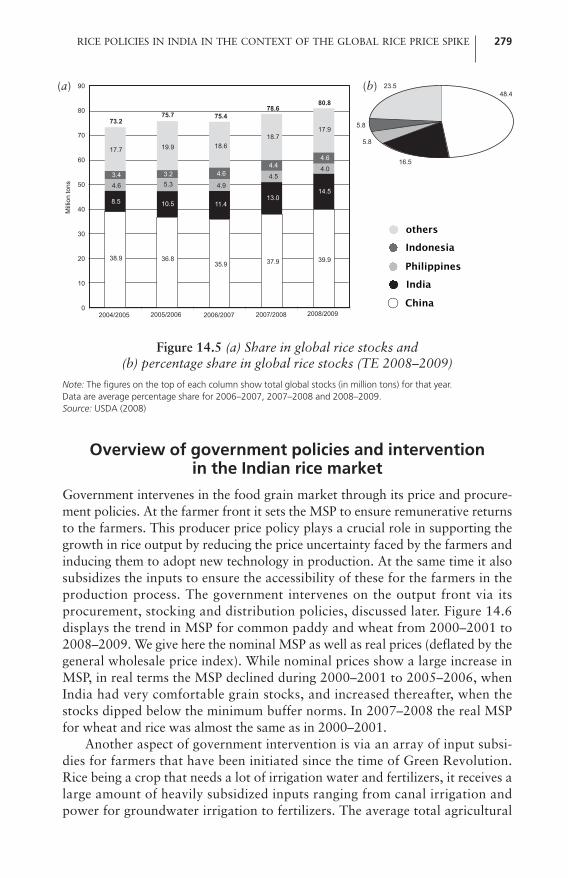
Overview of government policies and intervention in the Indian rice market
Government intervenes in the food grain market through its price and procure-ment policies. At the farmer front it sets the MSP to ensure remunerative returnsto the farmers. This producer price policy plays a crucial role in supporting thegrowth in rice output by reducing the price uncertainty faced by the farmers andinducing them to adopt new technology in production. At the same time it alsosubsidizes the inputs to ensure the accessibility of these for the farmers in theproduction process. The government intervenes on the output front via itsprocurement, stocking and distribution policies, discussed later. Figure 14.6displays the trend in MSP for common paddy and wheat from 2000–2001 to2008–2009. We give here the nominal MSP as well as real prices (deflated by thegeneral wholesale price index). While nominal prices show a large increase inMSP, in real terms the MSP declined during 2000–2001 to 2005–2006, whenIndia had very comfortable grain stocks, and increased thereafter, when thestocks dipped below the minimum buffer norms. In 2007–2008 the real MSPfor wheat and rice was almost the same as in 2000–2001.
Another aspect of government intervention is via an array of input subsi-dies for farmers that have been initiated since the time of Green Revolution.Rice being a crop that needs a lot of irrigation water and fertilizers, it receives alarge amount of heavily subsidized inputs ranging from canal irrigation andpower for groundwater irrigation to fertilizers. The average total agricultural
RICE POLICIES IN INDIA IN THE CONTEXT OF THE GLOBAL RICE PRICE SPIKE 279
Figure 14.5 (a) Share in global rice stocks and(b) percentage share in global rice stocks (TE 2008–2009)
Note: The figures on the top of each column show total global stocks (in million tons) for that year.Data are average percentage share for 2006–2007, 2007–2008 and 2008–2009.Source: USDA (2008)
China
India
Philippines
Indonesia
others
2004/2005 2005/2006 2006/2007 2007/2008 2008/2009
90
80
70
60
50
40
30
20
10
0
Mill
ion
tons
38.9 36.835.9 37.9 39.9
8.5 10.5 11.413.0
14.54.6 5.3 4.9
4.54.0
3.4 3.2 4.64.4
4.617.7 19.9 18.6
18.717.9
73.275.7 75.4
78.680.8
23.5
5.8
5.8
16.5
48.4(a) (b)
ES_RC_9-8 18/8/10 20:23 Page 279
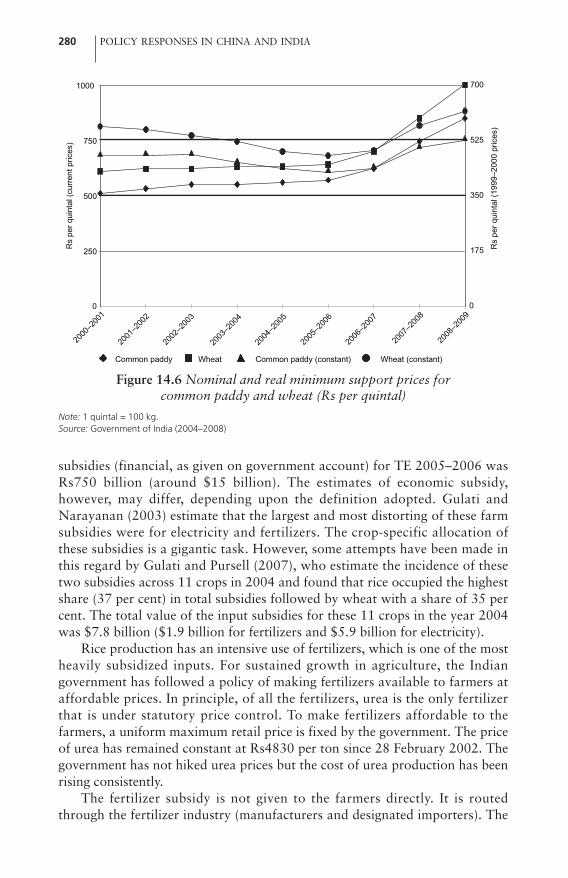
subsidies (financial, as given on government account) for TE 2005–2006 wasRs750 billion (around $15 billion). The estimates of economic subsidy,however, may differ, depending upon the definition adopted. Gulati andNarayanan (2003) estimate that the largest and most distorting of these farmsubsidies were for electricity and fertilizers. The crop-specific allocation ofthese subsidies is a gigantic task. However, some attempts have been made inthis regard by Gulati and Pursell (2007), who estimate the incidence of thesetwo subsidies across 11 crops in 2004 and found that rice occupied the highestshare (37 per cent) in total subsidies followed by wheat with a share of 35 percent. The total value of the input subsidies for these 11 crops in the year 2004was $7.8 billion ($1.9 billion for fertilizers and $5.9 billion for electricity).
Rice production has an intensive use of fertilizers, which is one of the mostheavily subsidized inputs. For sustained growth in agriculture, the Indiangovernment has followed a policy of making fertilizers available to farmers ataffordable prices. In principle, of all the fertilizers, urea is the only fertilizerthat is under statutory price control. To make fertilizers affordable to thefarmers, a uniform maximum retail price is fixed by the government. The priceof urea has remained constant at Rs4830 per ton since 28 February 2002. Thegovernment has not hiked urea prices but the cost of urea production has beenrising consistently.
The fertilizer subsidy is not given to the farmers directly. It is routedthrough the fertilizer industry (manufacturers and designated importers). The
280 POLICY RESPONSES IN CHINA AND INDIA
Figure 14.6 Nominal and real minimum support prices for common paddy and wheat (Rs per quintal)
Note: 1 quintal = 100 kg.Source: Government of India (2004–2008)
0
250
500
750
1000
2000
–200
1
2001
–200
2
2002
–200
3
2003
–200
4
2004
–200
5
2005
–200
6
2006
–200
7
2007
–200
8
2008
–200
90
175
350
525
700
Rs
per q
uint
al (c
urre
nt p
rices
)
Rs
per q
uint
al (1
999–
2000
pric
es)
Common paddy Wheat Common paddy (constant) Wheat (constant)
ES_RC_9-8 18/8/10 20:23 Page 280

urea subsidy is given under a group retention price scheme, which is basically acost plus pricing system for urea manufacturers with some norms of technicalefficiency. For phosphate and potash fertilizers (DAP and MoP), there is a flat-rate subsidy given to manufacturers and importers. Such a system of fertilizersubsidy, especially for urea, is neither very transparent nor encourages invest-ments or efficiency in the industry. As a result, the production of fertilizer hasremained stagnant since 2001. However, its demand has been increasing. Thishas led to imports increasing from 2.1 million tons in 2000–2001 to 6.8million tons in 2007–2008. India imported 4.5 million tons of DAP and 3.5million tons of urea until October 2008, largely contributing to the subsidy bill(Centad, 2009). Besides providing a direct subsidy to the manufacturers, thegovernment has also issued fertilizer bonds worth Rs75 billion (August 2007)to finance the subsidy burden.
In 2006–2007, the actual subsidy on fertilizers was Rs260 billion asagainst a budgetary allocation of Rs173 billion. In 2007–2008, the actual billrose to Rs503 billion against an allocation of Rs245 billion. And in2008–2009, the fertilizer subsidy was expected to touch Rs100 billion (roughly$20 billion). Since, every time over the last three years, the actual subsidy billturned out to be higher than what was provisioned in the budget, the govern-ment came up with a novel idea of issuing government bonds to fertilizer unitsfor a part of the subsidy (almost half in 2008–2009). These bonds arereimbursable over a period of time. This financial innovation helps the govern-ment to spread the fertilizer subsidy payments over a period of time. Ureanormally comprises about 60 to 70 per cent of the fertilizer subsidy bill. Heavysubsidization of nitrogen in relation to phosphate and potash has led to anunbalanced use of N, P and K. While the recommended ratio between N, P andK, is 4:2:1, the actual ratio in Punjab was 20:6:1 and in Haryana 30:9:1 in2005–2006 (IPNI, 2008). Acknowledging this fact, the finance minister in July2009 promised to move towards a uniform nutrient-based subsidization,which will pave the way for direct subsidy to farmers. Indeed, the governmentintroduced a nutrient-based fertilizer subsidy (NBS) for decontrolled P&Kfertilizers, effective 1 April 2010. The subsidy will be based on the nutrients(i.e. N, P, K, and S) contained in the decontrolled P&K fertilizers alreadycovered under the scheme (Government of India, 2010a).
Ensuring remunerative returns for the produce and input subsidization arenot the only avenues for government intervention. The government also inter-venes heavily in outputs.
Procurement, stocking and distribution policies
Besides intervening through price policy measures and input schemes, thegovernment intervenes at the consumer end via its procurement, stocking anddistribution policies. The procurement policy of the government consists of acompulsory levy on the rice millers under the Essential Commodity Act (ECA)of 1955. The Food Corporation of India (FCI) procures grains for the central
RICE POLICIES IN INDIA IN THE CONTEXT OF THE GLOBAL RICE PRICE SPIKE 281
ES_RC_9-8 18/8/10 20:23 Page 281

pool through a ‘levy’ system on rice millers, whereby the rice mills are obligedto sell a certain proportion of their milled rice (which can go as high as 75 percent in Punjab) to the state agency at a predetermined price, which is oftenlower than the market price.9 Under the ECA, the state governments can alsorestrict farmer’s sales to mandis (wholesale market yards set up by government)by imposing movement restrictions.10 Almost half of the total procurement forthe central pool is purchased as milled rice through this levy system. The openmarket sales are restricted until levy commitments are filled. The percentage oflevy is fixed by the state government with the approval of the central govern-ment on the basis of requirements of the central pool, domestic consumptionand the marketable surplus. The levy percentage varies from state to state (seeTable 14.2) depending upon the existing local conditions of surplus produc-tion, the storage constraints with FCI and the open market availability of riceat lower price. The rice levy system heavily distorts the market as it restricts themovement of rice across states on private account.
The food thus procured is stored and distributed at subsidized prices tomeet the consumption needs of the poor via the PDS. The governmentmaintains stocks of rice and wheat, and under the PDS it supplies a proportionof cereals required by poor consumers at prices lower than the market prices.Stocking of food grains supposedly ensures stability in domestic prices, anddistribution of food under PDS supposedly assures availability of food grainsto the poorer sections of society at subsidized rates. In addition to this, FCI alsoresorts to open market sales of food grain buffer stocks at below market pricesto dampen the local market prices.
Rice along with wheat is the key food grain that is procured by FCI.11 Riceprocurement hovered around 26 million tons each year during 2005–2006 and2006–2007. In 2006–2007, however, government stocks of wheat fell short ofbuffer stock norms, and about 6 million tons of wheat was imported. Althoughrice was in surplus, and India exported 4.7 million tons of rice that year, yet thefear of food shortage weighed heavily on policymakers’ minds and the MSP (innominal current prices) for common paddy was raised by as much as 37 percent during the two-year period, 2006–2007 to 2008–2009 (from Rs6200/tonto Rs8500/ton) (Financial Express, 2008). To maximize procurement of rice, arestriction on exports of non-basmati rice was also imposed on 9 October
282 POLICY RESPONSES IN CHINA AND INDIA
Table 14.2 Percentage of levy on common milled rice in various states,2008–2009
Quantum of levy (%)
Andhra Pradesh 75 Haryana 75 Punjab 75 Uttar Pradesh 60 West Bengal 50
Source: http://fcamin.nic.in
ES_RC_9-8 18/8/10 20:23 Page 282

2007. The procurement of rice is high in the states of Punjab, Haryana, UttarPradesh and Andhra Pradesh, which together account for roughly 70 per centof the all-India procurement of rice. The procurement of rice as a percentage ofproduction increased from 25.5 per cent in 2003–2004 to 27 per cent in2007–2008, and procurement of rice as a proportion of marketed surplus12
shot up from 31 per cent in 2003–2004 to 41 per cent in 2005–2006. To ensureadequate food grain supplies for the government’s procurement operations, alarge number of restrictions were also imposed on private traders by theGovernment of India and state governments. These restrictions includedcontrols on movement, storage, exports, imports and access to trade credit. Forexample the central government’s Cabinet Committee on Prices (CCP) on 31March 2008 urged all state governments to impose the stock limit norms sothat the prices of essential commodities do not rise on account of shortagescaused by hoarding (Thaindian News, 2008).
One of the prime purposes of procuring rice and wheat for the central poolis to maintain buffer stocks. The central pool is supposed to hold sufficientstocks to meet any emergency arising from possible droughts, floods, cropfailures, etc. It also maintains stocks to enable open-market interventions incase of price hike. FCI enhances food grain supply in the lean season as pergovernment instructions to prevent rises in open-market prices. Until 1999 thebuffer stock of food grains remained close to the norm requirement. After1999, however, the stock levels were well beyond the norm owing to goodharvests and domestic prices being higher than the export parity prices due to acollapse in the global prices resulting from the East Asian crisis. The decline ineffective off-take from TPDS also contributed to the accumulation of grainstocks, which peaked in 2002 (Gulati et al, 2003). These stocks were eased in2003–2004 because of low procurement following a drought in 2002–2003,combined with relatively high off-take of food grains for the relief operations.The food grain stocks remained higher than the buffer requirement until July2005, by which time all the existing stocks had been liquidated. The stock offood grains on 1 July 2005 was 24.6 million tons, consisting of 14.5 milliontons of wheat and 10.1 million tons of rice against the norm of 26.9 milliontons. Starting from 2005, arrangements were made once again to add to thefood grains stocks by importing about 6 million tons of wheat. But in 2007,when global rice price crisis erupted, the stocks of rice in July and October2007 were only a notch above the norm (see Figure 14.7). However, during thesame months, wheat stocks were a notch lower than the norm. For wheat andrice together, stocks in July and October 2007 were neither precariously lownor too comfortable, but just hovered around the norm. So the export restric-tions did not stem from stocks being very low within the country in October2007. In subsequent months, the stock position of food grains (rice and wheat)improved significantly. In August 2008 it was 31 million tons comprising of8.3 million tons of rice and 23 million tons of wheat, which increased to 35million tons by December 2008, and by July 2009, it was 52.5 million tons,against a norm of 26.9 million tons (Government of India, 2010b). It may be
RICE POLICIES IN INDIA IN THE CONTEXT OF THE GLOBAL RICE PRICE SPIKE 283
ES_RC_9-8 18/8/10 20:23 Page 283

noted that the covered storage capacity with FCI is about 25 million tons.Given all this, it seems India will be back to ‘excessive’ stocks, putting pressureon the storage facilities and leading to large wastages, unless the governmentfinds some way to consume or export some of these stocks.
Besides maintaining buffer stocks, the food grains procured by the FCI arealso used to provide food to the poor via the TPDS.13 This system is supposedto help the most vulnerable sections of the society to get food grains at reason-able prices (half the economic cost14). FCI issues wheat and rice to stategovernments/agencies at uniform Central Issue Prices (CIPs)15 for distributingfood grains to the poor under the PDS. From 1997, when TPDS was intro-duced, the food grains were allocated at separate prices for people below the
284 POLICY RESPONSES IN CHINA AND INDIA
Figure 14.7 Food grain stocks versus norm requirement
Source: Economic Survey (several issues); data for April 2009–2010 is from FCI,http://fciweb.nic.in/stock_management/stock_management.htm
30
25
20
15
10
5
0
Mill
ion
tons
Rice Stock Rice Norm
2005 2006 2007 2008 2009
Wheat Stock Wheat Norm
30
25
20
15
10
5
0
Mill
ion
tons
Apr Jul Oct Jan Apr Jul Oct Jan Apr Jul Oct Jan Apr Jul Oct Jan Apr
2005 2006 2007 2008 2009Apr Jul Oct Jan Apr Jul Oct Jan Apr Jul Oct Jan Apr Jul Oct Jan Apr
ES_RC_9-8 18/8/10 20:23 Page 284

poverty line and those above the poverty line. This was supposed to improvethe outreach of the subsidy programme and help contain the food subsidy billof the Government of India. From 2001–2002 onwards, the nominal CIPs haveremained stable, though in real terms16 one can observe a decline from2001–2002 to 2007–2008. Table 14.3 gives the production, procurement,stocks and off-take of rice and wheat from 2000–2001 to 2007–2008. Itdemonstrates the fact that following the drought year of 2002–2003, there wasa decline in the stocks of rice and wheat. From 2004–2005 onwards there hasbeen a fall in the food grains procured for distributing to the poor. The govern-ment procures 20 per cent to 27 per cent of the total production of rice andwheat (see Table 14.3).17
Beyond emergency relief, India also implements social protection measuressuch as the National Rural Employment Guarantee Scheme, Food for WorkScheme and Public Distribution System that help mitigate the risk of highprices for the poor people. Some states have also announced schemes such asproviding rice at Rs1/kg or Rs3/kg to help families below the poverty line.18 Allthese safety nets have seen gradual expansion from 2006–2007 to 2008–2009.Besides these consumer-oriented schemes, there is also the National FoodSecurity Mission on the production side, which was launched in 2007 to specif-ically aim at increasing production of rice by 10 million tons, wheat by 8million tons and pulses by 2 million tons by 2011–2012.
RICE POLICIES IN INDIA IN THE CONTEXT OF THE GLOBAL RICE PRICE SPIKE 285
Table 14.3 Production, procurement, stocks and off-take of rice and wheat
Production Procurement Stocks Total (2) as a (4) as a (3) as a (3) as a (1) (2) (3) off-take % of (1) % of (1) % of (1) % of
(4) required norms
2000–2001 154.7 37.6 42.2 18.8 24.3 12.2 27.3 173.92001–2002 166.1 42.8 61.7 32.9 25.8 19.8 37.1 253.82002–2003 137.6 35.5 63 49.6 25.8 36.0 45.8 259.32003–2004 160.7 36.6 35.2 49.2 22.8 30.6 21.9 144.72004–2005 151.8 40.8 29.9 41.5 26.9 27.3 19.7 123.12005–2006 161.1 41.5 24.5 42.1 25.8 26.1 15.2 91.42006–2007 169.2 35.5 19.3 36.7 20.9 21.7 11.4 71.72007–2008 174.8 37.1 23.9 27.3a 21.2 15.6 13.7 88.8
Note: The data on production, procurement, stocks and total off-take are for total rice and wheat, and aremeasured in million tons. Procurement of rice is from October to September and for wheat is from April to March.Off-take data are from April to March and the stocks are as of 1 July for each year. a off-take data for 2007–2008are from April to DecemberSource: Government of India (1999–2008)
ES_RC_9-8 18/8/10 20:23 Page 285
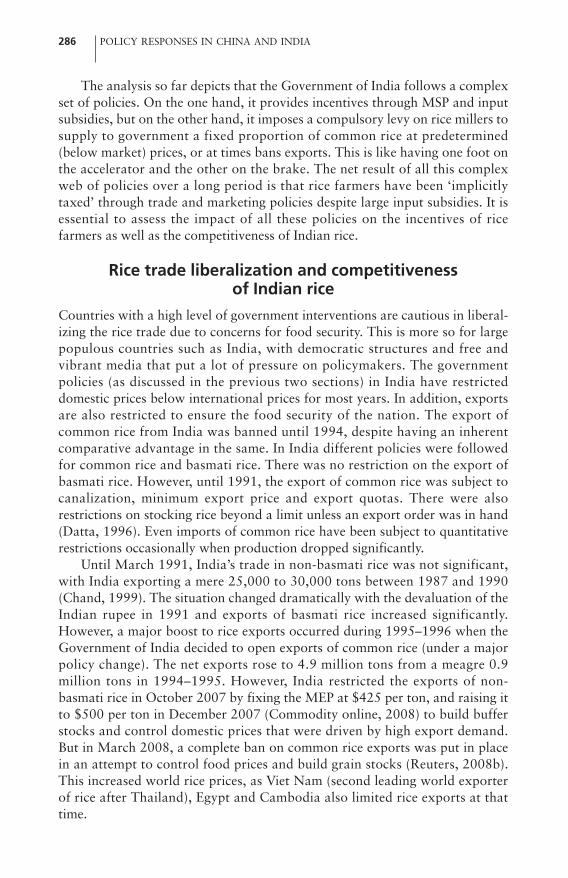
The analysis so far depicts that the Government of India follows a complexset of policies. On the one hand, it provides incentives through MSP and inputsubsidies, but on the other hand, it imposes a compulsory levy on rice millers tosupply to government a fixed proportion of common rice at predetermined(below market) prices, or at times bans exports. This is like having one foot onthe accelerator and the other on the brake. The net result of all this complexweb of policies over a long period is that rice farmers have been ‘implicitlytaxed’ through trade and marketing policies despite large input subsidies. It isessential to assess the impact of all these policies on the incentives of ricefarmers as well as the competitiveness of Indian rice.
Rice trade liberalization and competitiveness of Indian rice
Countries with a high level of government interventions are cautious in liberal-izing the rice trade due to concerns for food security. This is more so for largepopulous countries such as India, with democratic structures and free andvibrant media that put a lot of pressure on policymakers. The governmentpolicies (as discussed in the previous two sections) in India have restricteddomestic prices below international prices for most years. In addition, exportsare also restricted to ensure the food security of the nation. The export ofcommon rice from India was banned until 1994, despite having an inherentcomparative advantage in the same. In India different policies were followedfor common rice and basmati rice. There was no restriction on the export ofbasmati rice. However, until 1991, the export of common rice was subject tocanalization, minimum export price and export quotas. There were alsorestrictions on stocking rice beyond a limit unless an export order was in hand(Datta, 1996). Even imports of common rice have been subject to quantitativerestrictions occasionally when production dropped significantly.
Until March 1991, India’s trade in non-basmati rice was not significant,with India exporting a mere 25,000 to 30,000 tons between 1987 and 1990(Chand, 1999). The situation changed dramatically with the devaluation of theIndian rupee in 1991 and exports of basmati rice increased significantly.However, a major boost to rice exports occurred during 1995–1996 when theGovernment of India decided to open exports of common rice (under a majorpolicy change). The net exports rose to 4.9 million tons from a meagre 0.9million tons in 1994–1995. However, India restricted the exports of non-basmati rice in October 2007 by fixing the MEP at $425 per ton, and raising itto $500 per ton in December 2007 (Commodity online, 2008) to build bufferstocks and control domestic prices that were driven by high export demand.But in March 2008, a complete ban on common rice exports was put in placein an attempt to control food prices and build grain stocks (Reuters, 2008b).This increased world rice prices, as Viet Nam (second leading world exporterof rice after Thailand), Egypt and Cambodia also limited rice exports at thattime.
286 POLICY RESPONSES IN CHINA AND INDIA
ES_RC_9-8 18/8/10 20:23 Page 286

Trade liberalization provides a whole new range of opportunities to anynation and to make the maximum benefit from these challenges, India needs totake measures to enhance its competitiveness. Trade liberalization provides awhole new range of opportunities to any nation. To make the maximumbenefit from these challenges, India needs to take measures in enhancing itscompetitiveness. To assess the price competitiveness of a commodity, thenominal protection coefficient (NPC),19 measured under both the importableand exportable hypotheses, is a useful measure.20
Rice has been largely competitive on an importable basis since its NPC hasbeen below unity for most years. Indeed, the domestic price of rice (in constant1980 rupees) was below the import (parity) reference price in almost all yearsduring the period 1965–2004. In fact, even under the exportable hypothesis,India has had export competitiveness in rice: the domestic price has been belowthe export reference price during most of the period, with 1986–1987 and1999–2004, years of low prices on global markets, being exceptions.(Including input subsidies in the measures of competitiveness changes the storyonly marginally).
The removal of export bans on non-basmati rice and liberalizing theexports of basmati rice by eliminating the MEP in 1994 helped India to liberateagriculture from government controls and improve export volumes. Followingthe East Asian Crisis of 1997, global rice prices dropped owing to weakeneddemand from Asian importers. In the face of this sharp drop in world riceprices, the domestic price of rice in India was well above the international priceand this led to large domestic accumulation of stocks. In spite of its competi-tiveness, India’s exports were stunted by the decline in world rice price.However, exports picked up again after November 2000, when India began tosubsidize internal and international freight and other costs of marketingexports to neutralize high subsidization by the US. Following this, the interna-tional rice prices gradually climbed back to their long-term levels and Indiaregained its export competitiveness in rice.
The question that arises is that if India is import/export competitive inmost of the years and had good production and sufficient rice stocks, then whydoes it not follow a liberal trade policy? What would happen to its overallwelfare if India liberalizes trade in rice? Studies (for example Jha andSrinivasan, 2004; Polaski et al, 2008; Sahay and Chattopadhyay, 2008) havedealt with this question of impact of trade liberalization on the Indianeconomy and the broad conclusion is that trade liberalization of one sector(rice) per se would not impact the economy to a great extent. The positiveimpact of the removal of trade restrictions is felt when it is carried out for theentire agricultural sector as a whole. This benefit is amplified if combined withother beneficial measures such as reduction in transportation costs along withthe removal of trade barriers. This would require an increase in agriculturalinvestment and better infrastructure for growth. The poverty ratio (measuredby the headcount ratio) also declines when trade restrictions on all agriculturalcommodities are removed.
RICE POLICIES IN INDIA IN THE CONTEXT OF THE GLOBAL RICE PRICE SPIKE 287
ES_RC_9-8 18/8/10 20:23 Page 287

So far the analysis does not indicate any major supply shortfall or demandpressure in the global rice market that could have led to the tremendous hike inrice prices in 2008. Then why was the export ban imposed in 2008?
The global rice price spike: Why and how India stoked the fire?
The sudden rise in global commodity prices in 2007 led to serious concernamong several international organizations. Several reports of internationalorganizations and comments from international experts on the food price crisisgenerated fear in the global arena that this rise was not a short-term phenome-non, but was likely to stay for many more years.21 This fear of impending foodcrisis was multiplied several times by the overcautious media.22 As a result,each nation undertook policy measures to insulate its domestic economy fromthe adverse impacts of the food price hike. India, along with other majortrading nations, implemented such policies. The key instrument used to restoredomestic price stability was the ban on rice exports. But the main question is,was this a rational move?
A look at the global production and stocks of rice (see Figures 14.4a and14.5a) from 2004–2005 to 2008–2009 shows that on the whole there wasneither a major decline in the production of global rice nor a decline in stocksof rice. The scenario remains the same for India also. Indian production of ricealso continuously increased during this period (see Table 14.3). Hence, itbecomes imperative to investigate the causes for the trade restrictive measuresadopted by India. What seems a plausible explanation for this is that theseresulted from a ‘fear psychosis’ generated in the international market. In2006–2007 India had huge wheat imports of 6 million tons, although it wasexporting about 4.7 million tons of rice in the same time period. This gaveIndia a reason to worry about the food security scenario in the country. Theexport bans were undertaken as a knee-jerk reaction to this fear23 and this infact triggered a chain reaction, whereby other major exporting nations such asChina and Viet Nam (see Figure 14.8) also imposed export bans. As a result,the global rice prices shot through the roof. Figure 14.8 depicts how exportrestrictions were imposed by different rice-exporting nations, which created asupply shortage in the global rice market leading to the hike in the world riceprice.
The fear psychosis reached a new high in March 2008 when all thecountries imposed bans on rice exports. These export restrictions by rice tradingnations were followed by emergency buying by several importing nations suchas the Philippines, further restricting global rice supplies. It can be observed thatthese wrong policy responses by rice-exporting nations aggravated the existingcrisis by reducing producer incentives, increasing price volatility and uncertaintyin the international rice market. However, one cannot put the entire blame onlyon Indian policymakers. The policy measures were initiated only as a prelimi-nary response to stabilize the domestic economy.
288 POLICY RESPONSES IN CHINA AND INDIA
ES_RC_9-8 18/8/10 20:23 Page 288
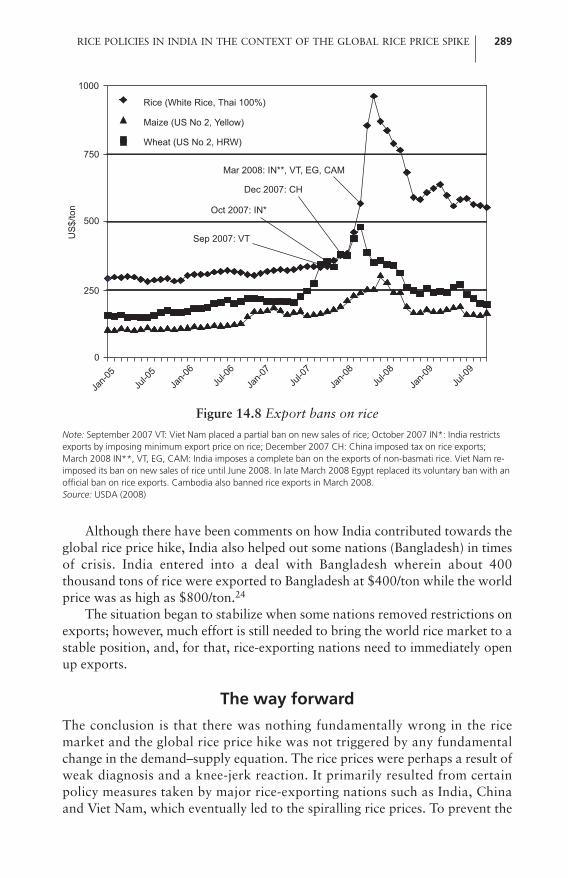
Although there have been comments on how India contributed towards theglobal rice price hike, India also helped out some nations (Bangladesh) in timesof crisis. India entered into a deal with Bangladesh wherein about 400thousand tons of rice were exported to Bangladesh at $400/ton while the worldprice was as high as $800/ton.24
The situation began to stabilize when some nations removed restrictions onexports; however, much effort is still needed to bring the world rice market to astable position, and, for that, rice-exporting nations need to immediately openup exports.
The way forward
The conclusion is that there was nothing fundamentally wrong in the ricemarket and the global rice price hike was not triggered by any fundamentalchange in the demand–supply equation. The rice prices were perhaps a result ofweak diagnosis and a knee-jerk reaction. It primarily resulted from certainpolicy measures taken by major rice-exporting nations such as India, Chinaand Viet Nam, which eventually led to the spiralling rice prices. To prevent the
RICE POLICIES IN INDIA IN THE CONTEXT OF THE GLOBAL RICE PRICE SPIKE 289
Figure 14.8 Export bans on rice
Note: September 2007 VT: Viet Nam placed a partial ban on new sales of rice; October 2007 IN*: India restrictsexports by imposing minimum export price on rice; December 2007 CH: China imposed tax on rice exports;March 2008 IN**, VT, EG, CAM: India imposes a complete ban on the exports of non-basmati rice. Viet Nam re-imposed its ban on new sales of rice until June 2008. In late March 2008 Egypt replaced its voluntary ban with anofficial ban on rice exports. Cambodia also banned rice exports in March 2008.Source: USDA (2008)
0
250
500
750
1000
Rice (White Rice, Thai 100%)
Wheat (US No 2, HRW)
Maize (US No 2, Yellow)
Jan-0
5Ju
l-05
Jan-0
6Ju
l-06
Jan-0
7Ju
l-07
Jan-0
8Ju
l-08
Jan-0
9Ju
l-09
US
$/to
n
Sep 2007: VT
Oct 2007: IN*
Dec 2007: CH
Mar 2008: IN**, VT, EG, CAM
ES_RC_9-8 18/8/10 20:23 Page 289

conditions from deteriorating further as a result of the fear generated by theglobal food crisis, there was a need for the markets to open up and liberalizetrade. But on the contrary they became more and more protective. The netresult was a spike in the global rice price.
A country such as India wanted to protect its own poor consumers in thewake of reports of impending ‘food crisis’, but that resulted in flaring globalrice prices. Being a major player in the global rice market, any policy measuresby India to restrict rice exports have serious repercussions in the global market.India needs to look forward towards reformulating its policies so as tostrengthen the efficiency of its rice sector, which can lead to its faster growthand greater environmental sustainability. There have been debates on thespecific reforms that needs to be initiated ranging from MSP reform, decentral-ization of the PDS, and introduction of food stamps as policy goals (Jha et al,2007). The first and foremost task perhaps is to contain the costs of procure-ment, distribution and storage operations of rice by FCI, which would helpreduce the budgetary costs of the government to a great extent.Decentralization would increase the role of private traders and help reducethese costs. The system of levy on rice needs to be abolished. The reform ofECA would be of great help in devising policies to induce investment. Anotherpolicy measure could be the de-linking of the procurement price from the MSP.The MSP, which is used as a protection against price risk, ought to be decou-pled from using it to augment farmer income. The FCI’s role should be toprovide emergency buffer stock. The PDS, part of its function, could be gradu-ally eliminated with the expansion of a food coupon system to allow the poorto purchase food from the market at the prevailing market prices.
Attempts should be made with regard to developing options that wouldprevent a similar crisis in the future by rendering export bans illegal underWTO. An export tax (with trigger points) could be a better option, if at all,rather than an export ban, to restrict rice outflow from the country in case ofshortages. The procurement of grains could be through a tendering processfrom the private sector, for desired quantities and delivery points, usingcompetitive bids. This would enable non-distortion of market prices and wouldalso enable cost minimization. More specifically, steps could be taken tostrengthen the global food system in the long run by undertaking a fast impactfood production system and scaling up investments in agricultural research anddevelopment.
Some measures have already been initiated in this regard by the Indiangovernment. In 2007, India announced a new Agricultural Development Planto spend around $6.1 billion over four years, increasing spending on irrigationby 80 per cent in 2008–2009. Also in 2007 a National Food Security Missionwas introduced. But there are many more avenues that need to be furtherexplored. Developing more innovative measures would enable long-termsustainability of the rice sector in particular and the global rice economy ingeneral.
290 POLICY RESPONSES IN CHINA AND INDIA
ES_RC_9-8 18/8/10 20:23 Page 290

Notes1 The data on rice (white rice, Thai 100%) are from FAO (2008). Although by
December 2008, the Thai rice price was being quoted at around $600/ton, therewere reports that in January 2009 the Philippines bought about 1 million tons ofrice (of lower quality) from Viet Nam at a price lower than $400 per ton.
2 ‘The rise in prices of food commodities all over the world is not going to ease in theshort term …’ declared FAO’s Director General Jacques Diouf (Press Trust of India,2008); ‘Although the credit crunch has lowered the price of food … the stage is setfor the next food crisis’ said IFPRI Director General Joachim von Braun (2008b);‘The recent surge in world food prices is already creating havoc … worse is yet tocome’ declared Jeffrey Sachs (2008).
3 Wheat (US No 2, HRW) prices rose by 28 per cent from January 2008 to March2008 and maize prices rose by 45 per cent from January 2008 to June 2008. If onelooks at wheat prices from January to May 2008, they declined by 7 per cent andthere was a further decline by 34 per cent from May to December 2008. Maize (USNo 2, Yellow) prices rose by 21 per cent from January to May 2008 and thendeclined by 40 per cent from May to December 2008.
4 ‘The commodity price spikes witnessed in the last couple of years are exceptionalwhen viewed from the perspective of the last decade’ (OECD-FAO, 2008); ‘Thetrend in high food prices will likely persist over the next few years, if not longer.The era of cheap food … may thus be over’ (ADB, 2008b); ‘The observed increase… not a temporary phenomenon’ (World Bank, 2008).
5 ‘The present crisis reflects long-run factors which will likely not disappear, saysProfessor Jagdish Bhagwati’ (Altman, 2008); ‘On average over the coming 10-yearperiod nominal prices for cereals are expected to be 35 per cent higher’ (Reuters,2008a).
6 The compound annual growth rate for area harvested was 0.4 per cent for theperiod 1970–1971 to 2007–2008. The rates of growth for rice production andyield were 2.25 per cent and 1.83 per cent respectively over the same time period.
7 West Bengal, Andhra Pradesh and Uttar Pradesh produced roughly 16 per cent, 13per cent and 12 per cent of all-India rice output respectively, during 2005–2007.
8 Domestic retail rice prices rose by 22 per cent from October 2007 to August 2008.9 This is particularly true for those varieties that fetch a good price in export
markets. In 2008–2009, for example, the levy price for sona masuri variety inAndhra Pradesh was almost 30 per cent below the domestic market price of thesame variety. This is despite the fact that exports were banned and domestic priceswere somewhat depressed. If the markets are too depressed in a year of surplusproduction, and the open market price tends to sink below the MSP, then the levyprice generally acts as a floor. It is calculated by taking into account the MSP ofpaddy plus milling costs, and some margin for the rice miller.
10 Restrictions were also imposed on the intrastate or interstate movement of paddyvia the State Paddy/Rice (restrictions and movement) Order to support theGovernment of India’s price stabilization programme.
11 Procurement of food grains is done by the FCI at the MSP under the currentsystem.
12 Marketed surplus constitutes about 60 per cent of total rice production(Government of India, 2004–2008).
13 The PDS was restructured as the TPDS in June 1997 to focus specifically on the
RICE POLICIES IN INDIA IN THE CONTEXT OF THE GLOBAL RICE PRICE SPIKE 291
ES_RC_9-8 18/8/10 20:23 Page 291

poor.14 Economic costs consist of the procurement and distribution costs of FCI.15 CIPs are deliberately fixed below the economic costs of procuring food grains to
keep food within the reach of the poor. The difference between the issue price andeconomic cost is borne by the central government through the food subsidy budget.
16 The real CIP is the nominal CIP divided by the wholesale price index (all commodi-ties) with 1993–1994 as the base year.
17 Procurement as a percentage of marketed surplus (which is almost 60 per cent ofproduction) is much higher.
18 Chhattisgarh introduced a Rs3/kg rice scheme on 1 April 2007 (Igovernment,2009). Tamil Nadu launched the Rs1/kg rice scheme in September 2008 (Mid-day,2008).
19 The nominal protection coefficient is the ratio of the domestic price to the worldreference price of the commodity (Hoda and Gulati, 2008).
20 Under the importable hypothesis, the domestic price of a commodity is comparedwith its import parity price and under the exportable hypothesis the comparison isbetween the domestic price and the export parity price (Hoda and Gulati, 2008).
21 Professor Jagdish Bhagwati stated that the 2008 food crisis is different from the onein 1972 and is likely to stay unless addressed differently. Specifically, long-termpolicy actions will need to be taken to combat the price rise. Professor Jeffrey Sachsalso opined that the current high prices of food are likely to rule for a long time andpolicy intervention would require more yield-raising techniques and open markettrading among nations rather than restrictive trade policies of the nations (Altman,2008). Dr Joachim von Braun commented, ‘At the moment, high and unstable foodprices look like that they are here to stay for some time – perhaps years’ (vonBraun, 2008a). FAO Director General, Jacques Diouf was quoted in April 2008 assaying, ‘The rise in prices of food commodities all over the world is not going toease in the short term in view of supply-demand situation’ (Hindu Business Line,2008). Vikram Nehru, Chief Economist for World Bank’s East Asia & PacificRegion also stated in April 2008, ‘We believe that higher food prices are going tostay at least another two years before they begin to decline, but they will remain atelevated levels till well about say 2015’ (Australian Broadcasting Corporation,2008). While most of these statements were based on their best judgements derivedfrom whatever little hurried research was available on this topic at that time, itcreated fear in India, which paved the way for export restrictions.
22 Just some of the headlines reported were: ‘Food prices: Cheap no more’ (TheEconomist, 2007); ‘Rising food prices may be here to stay’, (Blogging Stocks,2007); ‘Forget oil, the new global crisis is food’, (Financial Post, 2008); ‘Foodcrisis: Soaring prices are causing hunger around the world’, (Washington Post,2008); ‘India and the global food crisis’, (Business Week, 2008); ‘Wrong responseaggravates Asia food crisis: ADB Report’, (Economic Times, 2008); ‘Long era ofcheap food is over’, (BBC News, 2008).
23 It is important to note here that electioneering in India could also have beenresponsible to some extent in driving these policy changes.
24 However, with prominent informal trade between the two nations, there areinstances of private traders hoarding food grains, selling imported rice at highprices within the nation and hence making it extremely difficult to contain domesticprices.
292 POLICY RESPONSES IN CHINA AND INDIA
ES_RC_9-8 18/8/10 20:23 Page 292

ReferencesAbbott, P., Hurt, C. and Tyner, W. E. (2008) ‘What’s driving food prices?’, Farm
Foundation Issue Report, July, www.agecon.purdue.edu/papers/outlook/whats_driving_food.pdf
ADB (Asian Development Bank) (2008a) ‘Food prices and inflation in developing Asia:Is poverty reduction coming to an End?’, www.adb.org/Documents/reports/food-prices-inflation/default.asp
ADB (2008b) ‘Soaring food prices: Response to the crisis’, www.adb.org/Documents/Papers/soaring-food-prices/default.asp
Altman, D. (2008) ‘Managing globalization: Dealing with the global food crisis’,International Herald Tribune, 7 May, http://blogs.iht.com/tribtalk/business/globalization/?p=712
Australian Broadcasting Corporation (2008) ‘World Bank warns of looming foodcrisis’, 14 April, www.radioaustralia.net.au/programguide/stories/200804/s2216758.htm
BBC News (2008) ‘Long era of cheap food is over’, 29 May, http://news.bbc.co.uk/2/hi/business/7425078.stm
Blogging Stocks (2007) ‘Rising food prices may be here to stay’, 4 December,www.bloggingstocks.com/2007/12/04/rising-food-prices-may-be-here-to-stay/
Business Week (2008) ‘India and the global food crisis’, Business Week, 14 April,www.businessweek.com/globalbiz/blog/eyeonasia/archives/2008/04/india_and_the_g.html
Centad (2009) ‘Fertilizer subsidy likely to touch Rs1,02,000 cr this fiscal year: Secy’, 2 January, www.centad.org/tradenews_884.asp
Chand, R. (1999) ‘Effects of trade liberalization on agriculture in India: Commodityaspects’, Working Paper No 45, September, CGPRT Centre, Bogor, Indonesia
Commodity online (2008) ‘India to export rice despite ban’, 25 January,www.commodityonline.com/news/India-to-export-rice-despite-ban-5115-3-1.html
Datta, S. K. (1996) ‘India’s trade prospects in rice’, in R. Chand and T. Haque (eds)Vision of India’s Rice Trade, Proceedings 2, National Centre for AgriculturalEconomics and Policy Research, New Delhi
Economic Times (2008) ‘Wrong response aggravates Asia food crisis: ADB Report’,Economic Times, 9 May, http://economictimes.indiatimes.com/articleshow/3025645.cms
The Economist (2007) ‘Food prices: Cheap no more’, The Economist, December,www.economist.com/displaystory.cfm?story_id=10250420
FAO (Food and Agriculture Organization of the United Nations) (2008) ‘FAO database’,international prices of commodities, www.fao.org/es/esc/prices/PricesServlet.jsp
FAOStat (2008) ‘FAOStat’, www.fao.orgFAS/USDA (2008) ‘Grain: World markets and trade’, Circular Series, FG 12-08,
December, FAS/USDA, Washington, DC, www.fas.usda.gov/grain/circular/2008/12-08/grainfull12-08.pdf
Financial Express (2008) ‘Government announces bonus on paddy MSP’, FinancialExpress, 17 October, www.financialexpress.com/news/govt-announces-bonus-on-paddy-msp/374284/
Financial Post (2008) ‘Forget oil, the new global crisis is food’, Financial Post, 7 January, www.financialpost.com/story.html?id=213343
RICE POLICIES IN INDIA IN THE CONTEXT OF THE GLOBAL RICE PRICE SPIKE 293
ES_RC_9-8 18/8/10 20:23 Page 293

Government of India (1999–2008) ‘Economic Survey’, 1999/2000–2007/2008,Ministry of Finance, New Delhi
Government of India (2004–2008) Agricultural Statistics at a Glance, various issues,Ministry of Agriculture, New Delhi
Government of India (2009) Agricultural Statistics at a Glance 2009, Ministry ofAgriculture, New Delhi
Government of India (2010a) ‘Fertilizer subsidy for urea not expected to increase dueto impending hike in urea prices from 1st April’, Union Ministry of Chemicals andFertilizers, Press Information Bureau, Mumbai,http://pibmumbai.gov.in/scripts/detail.asp?releaseId=E2010PR399
Government of India (2010b) Economic Survey 2009/10, Ministry of Finance, NewDelhi
Gulati, A. and Gupta, K. (2007) ‘Restrictions on rice exports: An offshoot of archaicpolicy mindset’, The Economic Times, 26 October
Gulati, A. and Narayanan, S. (2003) Subsidy Syndrome in Indian Agriculture, OxfordUniversity Press, New Delhi
Gulati, A., Pursell, G. and Mullen, K. (2003) Indian Agriculture since the Reforms:Performance, Policy Environment, and Incentives, IFPRI, Washington, DC
Gulati, A. and Pursell, G. (2009) ‘India and other south Asian countries’, in K.Anderson (ed) Distortions to Agricultural Incentives: A Global Perspective,1955–2007, Palgrave Macmillan and World Bank, Washington, DC, pp389–415
Hindu Business Line (2008) ‘No short-term relief in world food prices: FAO’,www.thehindubusinessline.com/2008/04/10/stories/2008041051341100.htm.
Hoda, A. and Gulati, A. (2008) WTO Negotiations on Agriculture and DevelopingCountries, Oxford University Press, New Delhi
Igovernment (2009) ‘Rice at Rs2 per kg in Chattisgarh after LS polls’, 17 March,www.igovernment.in/site/Rice-at-Rs-2-per-kg-in-Chattisgarh-after-LS-polls/
IPNI (International Plant Nutrition Institute) (2008)http://www.ipni.net/ppiweb/india.nsf/$webindex/4AD3F70FE86D66E7652571E9001325E8?opendocument&navigator=state+of+balanced+fertilisation
Jha, S., Srinivasan, P. V. and Landes, M. (2007) ‘Indian wheat and rice sector policiesand the implications of reform’, Economic Research Report, No. 41, USDA,Washington, DC
Jha, S. and Srinivasan, P. V. (2004) ‘Achieving food security in a cost effective way:Implications of domestic deregulation and reform under liberalized trade’,Discussion Paper No 67, International Food Policy Research Institute, Washington,DC
Mid-day (2008) ‘TN offers rice for Rs1 per kg’, 16 September, www.mid-day.com/news/2008/sep/160908-Tamil-Nadu-Chief-Minister-M-Karunanidhi-ration-card-PDS-shops.htm.
OECD-FAO (Organization for Economic Co-operation and Development and Foodand Agriculture Organisation of the United Nations) (2008) Agricultural Outlook2008–2017, OECD, FAO, Rome
Polaski, S., Kumar, G., McDonald, S., Panda, M. and Robinson, S. (2008) India’sTrade Policy Choices, Carnegie Endowment for International Peace, Washington,DC
Press Trust of India (2008) ‘Food prices to remain high, more riots feared: FAO’,Business Standard, 29 January, www.business-standard.com/india/storypage.php?autono=319632
294 POLICY RESPONSES IN CHINA AND INDIA
ES_RC_9-8 18/8/10 20:23 Page 294

Reuters (2008a) ‘Food prices to stay high in next decade – OECD/FAO’, 22 May,www.flex-news-food.com/pages/16648/Food/food-prices-stay-high-next-decade-oecdfao.html (accessed 12 October 2008)
Reuters (2008b) ‘India not considering easing rice export ban – commerce secretary’,27 May, http://in.reuters.com/article/businessNews/idINIndia-33783420080527
Sachs, J. (2008) ‘Surging food prices mean global instability’, Scientific American, June,www.indiaenvironmentportal.org.in/files/3_5.doc
Sahay, N. and Chattopadhyay, S. (2008) ‘Assessing the macroeconomic and welfareimpacts of global rice trade liberalization for India’, in M. A Razzaque and E.Laurent (eds) Global Rice and Agricultural Trade Liberalization, Poverty andWelfare Implications for South Asia, Commonwealth Secretariat 2008 andAcademic Foundation
Thaindian News (2008) ‘Delhi government imposes limits on food grain stocking’, 14 April, Thaindian News, www.thaindian.com/newsportal/business/delhi-government-imposes-limits-on-food-grain-stocking_10037937.html
USDA (United States Department of Agriculture) (2008) ‘Perspective on the global ricesituation’, Economic Research Service, 30 April, www.ers.usda.gov/news/ricecoverage.htm.
Von Braun, J. (2008a) ‘Responding to the world food crisis: Getting on the right track’,IFPRI 2007–2008 Annual Report Essay, September,www.ifpri.org/publication/responding-world-food-crisis-getting-right-track
Von Braun, J. (2008b) ‘The food crisis isn’t over’, Nature, 456, p701www.nature.com/nature/journal/v456/n7223/full/456701a.html
Von Braun, J., Sheeran, J. and Ngongi, N. (2008c) Responding to the Global FoodCrisis: Three Perspectives, International Food Policy Research Institute,Washington, DC
Washington Post (2008) ‘Food crisis: Soaring prices are causing hunger around theworld’, The Washington Post, 14 March, www.washingtonpost.com/wp-dyn/content/article/2008/03/13/AR2008031303347.html
World Bank (2008) ‘Rising food prices: Policy options and World Bank response’,World Bank Background Note, World Bank, Washington, DC,http://siteresources.worldbank.org/NEWS/Resources/risingfoodprices_backgroundnote_apr08.pdf
RICE POLICIES IN INDIA IN THE CONTEXT OF THE GLOBAL RICE PRICE SPIKE 295
ES_RC_9-8 18/8/10 20:23 Page 295

ES_RC_9-8 18/8/10 20:23 Page 296

Part VI
POLICY RESPONSES IN THEDEVELOPED COUNTRIES
ES_RC_9-8 18/8/10 20:23 Page 297

ES_RC_9-8 18/8/10 20:23 Page 298

15
Japan’s Rice Policy and its Role inthe World Rice Market:
Japan Should Act as a Watchdog
Shoichi Ito
Introduction
The Japanese reactions to the global price spikes on world grain markets in2007–2008 were quite straightforward. The country became seriouslyconcerned about its low food self-sufficiency rate of 40 per cent (in calorieterms), which is the lowest among the developed countries. The mass mediaattacked the government over ‘insecure’ food supplies and tried to promotedomestic production. The Ministry of Agriculture, Forestry and Fisheries(MAFF) responded positively to these complaints, adjusting its budget to givemore emphasis to increasing domestic production. Thus, even in a developedcountry where information on food supplies and the ability to import it arequite sufficient, people are calling for a return to increased domestic supply.
This chapter describes the background of Japan’s current rice situationalong with the issues that were debated during the recent period of high foodprices, and the tentative new budget for the fiscal year 2009–2010 is comparedwith the previous year’s budget. The chapter also describes Japan’s quest forimproved food security in the future – a compelling topic given that a numberof Japanese people were affected by food insecurity in the wake of the globalfood-price turmoil that took place in 2008.
ES_RC_9-8 18/8/10 20:23 Page 299

Key issues in the Japanese rice economy
Declining rice consumption
Per capita rice consumption in Japan has been decreasing since the 1960s (seeFigure 15.1). The downward trend has been so large that total consumption ofrice has declined despite an increased population, from 12 million tons (milledrice terms) in the early 1960s to slightly over 8 million tons in 2008. The ricesituation in Japan has been well documented and indicated by Ito et al (1989);Smil (2004); Ito and Kako (2005); Ito et al (2006); and Ito et al (2007). Giventhe high domestic prices that discourage exports, declines in rice productionappeared to be necessary. Thus, as early as 1971, the Japanese governmentintroduced, for the first time in the country’s history, a rice diversionprogramme designed to stabilize the domestic market price by taking rice landout of production (see below). Further, 1995 saw the introduction of minimumaccess rice imports under a WTO agreement, requiring Japan to import acertain amount of rice each year. While rice farmers have been forced to cutproduction, rice imports have reached around 0.767 million tons (brown-ricebasis) per year (about 10 per cent of total consumption).
Rice diversion programmeJapan’s rice diversion programme, in force since 1971, pays rice producers tokeep a certain proportion of their land fallow each year in order to control ricesupply and thus stabilize the domestic market price. Under these circum-stances, some farmland, much of which used to be paddy fields, has beenabandoned and become useless for production. The area of disused land hasbeen increasing across the country, creating an annoyance for the governmentthrough media criticism. From 0.22 million hectares in 1990, the area of
300 POLICY RESPONSES IN THE DEVELOPED COUNTRIES
Figure 15.1 Per capita consumption of milled rice for Japan, Chinese provinceof Taiwan, Republic of Korea and China, 1961–2008
Source: Ito (2009)
0
50
100
150
200
1961
1963
1965
1967
1969
1971
1973
1975
1977
1979
1981
1983
1985
1987
1989
1991
1993
1995
1997
1999
2001
2003
2005
2007
kg/c
ap/y
ear
Japan China, province of TaiwanRepublic of Korea China
ES_RC_9-8 18/8/10 20:23 Page 300

discarded land reached almost 0.4 million hectares in 2005, and this becameone of the main policies attacked by the media. The rice diversion programmehas caused farmers to gradually give up producing rice on less productivefarmlands, often in mountainous areas but also in lowland areas.
Japan’s low level of food self-sufficiency is a serious concern from themedia’s point of view. The term ‘food crisis’ appeared so frequently in mediareports in 2008 that a large portion of the population believed a food crisis wasinevitable and many citizens began to feel that domestic food production mustbe increased. The minister of agriculture, Mr Ishiba, suggested that the foodself-sufficiency rate should be increased to around 50 per cent. One of the firstproposals for increasing self-sufficiency was to revert discarded farmland backto production.
The cost of food production in Japan is generally quite high. In the case ofrice, which remains the staple food despite the decline in its consumption, thecosts were more than $3000 per ton in 2007, although this figure has declinedslowly over the last six years. Due to small farm sizes and relatively expensivefarm equipment, mechanization is not as advanced as it is in the US and themore economically developed countries of Europe. Accordingly, the largestportion of total costs is for labour (35 per cent) (see Figure 15.2). The cost forfarm equipment (almost 19 per cent of total costs) is next, followed by rent andland charges at 11 per cent. Many Japanese farmers generate income from off-farm jobs.
Retail prices of rice in 2008
Wholesale prices of high-quality rice varieties rose sharply in 2008. The pricefor Koshihikari, for example, increased from ¥15,000 per 60kg of brown ricein December 2007 to ¥21,000 in August 2008 – a 40 per cent jump in eight
JAPAN’S RICE POLICY AND ITS ROLE IN THE WORLD RICE MARKET 301
Figure 15.2 Structure and share of rice production costs in Japan, 2006
Source: MAFF (2007)
Labour35.4%
Other depreciation
10.5%Machine
depreciation18.8%
Nursery 3.2%
Fertilizer 6.7%
Energy 3.2%
Land improvement and Irrigation 4.9%
Rent and charges11.3%
Chemicals 6.0%
ES_RC_9-8 18/8/10 20:23 Page 301

months (see Figure 15.3). Wholesale prices for lower quality varieties also rosesubstantially.
However, retail prices actually decreased in 2008 relative to 2007 (seeFigure 15.4). On a monthly basis in 2008, the price of Koshihikari rose from¥512 per kg in January to ¥528 in August – an increase of only 3 per cent (seeFigure 15.5). By December, Koshihikari was ¥530 per kg, an almost negligibleincrease. The retail prices of lower quality blended rice decreased from ¥380per kg in December 2007 to ¥364 in January 2008, then even further to ¥359in May before increasing to ¥371 in August. Blended rice finished the year at¥373 but never recovered its 2007 price level.1
302 POLICY RESPONSES IN THE DEVELOPED COUNTRIES
Figure 15.3 Weekly wholesale prices of rice in Japan, 1990–2009
Source: Japanese Financial Times
50
40
30
20
10
01990 1999
(100
0 ye
n/60
kg)
Sasanishiki from MiyagiAkitakomachi from AkitaHitomebore from MiyagiKirara397 from HokkaidoKoshihikari from Niigata
1993 crop failure
2001
Seasonal Weekly
MA rice starts, 1995
2000 2002 2003 2004 2005 2006 2007 2008 2009
Figure 15.4 Annual retail prices of milled rice in Tokyo, 1991–2008
Source: www.stat.go.jp/data/kouri/3.htm
0
200
400
600
800
1991
1992
1993
1994
1995
1996
1997
1998
1999
2000
2001
2002
2003
2004
2005
2006
2007
2008
Koshihikari
Yen
/kg
blended rice
ES_RC_9-8 18/8/10 20:23 Page 302

The response to increasing wholesale prices in 2008 was a key factorbehind the paradoxical fall in retail prices during the same period. Retailers,worried that higher prices would drive away customers, made efforts to cutcosts in other sectors in order to keep rice prices down. Heavy competitionbetween retailers meant that the price failed to recover to even the average levelof 2007. As a result of retail competition and the fact that Japan’s domesticprices were much higher than even the peak reached on world markets, the riceprice spike in the global market had minimal influence on Japan’s domesticmarket. Instead, high wheat prices were the major concern for consumers, withhigh corn prices affecting livestock producers.
Japan’s declining agricultural sector
Despite much concern (coming mainly from the media), the food price spikesexperienced in 2008 were actually very minor, especially for rice at the retaillevel in Japan. Nevertheless, a majority of Japanese people remain worriedabout a future food crisis. Decreases in farmland and the number of producersas well as large increases in the average age of farmers have aggravated thefeelings of pessimism (see Table 15.1). Between 1965 and 2005, farmlanddecreased from 6 million hectares to 4.69 million hectares, the number of farm
JAPAN’S RICE POLICY AND ITS ROLE IN THE WORLD RICE MARKET 303
Figure 15.5 Monthly retail prices of milled rice in Tokyo, 2007–2008
Source: www.stat.go.jp/data/kouri/3.htm
Table 15.1 Agricultural situation in Japan, 1965 and 2005
1965 2005 Change
Farmland (million hectares) 6 4.69 �22%Farm households (millions) 5.66 2.85 �50%Farm labourers (millions) 11.51 3.35 �71%Main operators (millions) 8.94 2.24 �75%Main operators, aged 65 or over (%) 19.5 57.4 Tripled in 20 years
Note: Data for main operators aged 65 and over refers to 1985, not 1965.Source: MAFF (2008)
300
350
400
450
500
550
600
blended rice
Yen
/kg Koshihikari
Jan-0
7
Feb-07
Mar-07
Apr-07
May-07
Jun-0
7
Jul-0
7Aug
-07
Sep-07
Oct-07
Nov-07
Dec-07
Jan-0
8
Feb-08
Mar-08
Apr-08
May-08
Jun-0
8
Jul-0
8Aug
-08
Sep-08
Oct-08
Nov-08
Dec-08
ES_RC_9-8 18/8/10 20:23 Page 303

households fell from 5.7 million to 2.8 million, the number of farm labourersdropped from 11.5 million to 3.4 million, and the percentage of farm operatorsaged 65 years or over increased from 19.5 per cent to 57.4 per cent. Thesefigures paint a picture of agriculture in decline that has shocked many ordinaryJapanese people.
A new Japanese budget for food policies
The fiscal year starts in April in Japan, and government officials launch thefinal stage of negotiations with the Ministry of Finance as early as May for thenext fiscal year in order to finalize budgets by December. In 2008, muchnegotiation took place between ministries in the context of serious concernabout the so-called food crisis and the country’s low level of self-sufficiency infood production. The MAFF budget for fiscal year 2009–2010, finalized inDecember 2008, was ¥2.56 trillion ($25.6 billion). This was 2.3 per centsmaller than the previous year’s budget, in line with long-term plans forbudgetary cuts.
Despite the budget cut, the ability to promote domestic food productionwas increased dramatically. Because most of Japan’s feed grain is imported,increases in feed production are a way to increase food self-sufficiency. Thebudget for ‘Promotion for raw feed-stuff production’ increased by almost 30per cent from ¥1.82 billion in 2008 to ¥2.35 billion for 2009 (see Figure 15.6).A budget for ‘Feed production for the dairy farm’ was also increased by around18 per cent from ¥5.45 billion in 2008 to ¥6.45 billion in 2009.
The 2009–2010 budget also places a strong emphasis on utilization ofdiscarded farmland. A new programme, ‘Emergency project for revivingdiscarded land’, was introduced with a 2009 budget as high as ¥23 billion.This effectively provides about $600 per hectare of discarded farmland. In thecase of rice, production costs per hectare were slightly over $15,000 in 2007.This figure is likely to be much higher for discarded farmland, given that manyof these areas have been neglected because of their inefficiency.
304 POLICY RESPONSES IN THE DEVELOPED COUNTRIES
Figure 15.6 Budget for increases in food self-suficiency rate for livestock feed
Source: MAFF (2009)
2009200820092008200920082009200820092008 11.058
9.2715.446
6.4465.4045.404
00.25
1.8222.346Promotion for raw feedstuff
production
Promotion for ecological feeding
Paddy for livestock programme
Feed production for the dairy farm
Support for the newdairy famers
Billion yen
ES_RC_9-8 18/8/10 20:23 Page 304

MAFF has set a plan to increase the self-sufficiency rate from the current40 per cent to 45 per cent by 2015. However, the whole budget of theemergency project would cover production costs for much less than 1 per centof the discarded farmland. Efforts for increases in the self-sufficiency rate inJapan will be very costly and difficult to achieve.
Given global trends and Japan’s situation, the government, through MAFF,wants to develop a much stronger survey and research system for global foodsupply and demand to mitigate supply shocks. A budget for the project ‘Surveyfor food supply and demand in the world’ was to be increased 50 per cent from¥0.12 billion in 2008 to ¥0.18 billion in 2009 (see Figure 15.7). Japan’sresearch in this area has not been strong, with MAFF obtaining much of itsinformation from the USDA and other international organizations. Thegovernment now wants Japan to have its own independent analysis. Thebudget for increasing exports of domestic agricultural products was alsoincreased 33 per cent from ¥0.6 billion in 2008 to ¥0.8 billion in 2009.
Foreign aid has also received increased funding, at least in some areas.Budgets for ‘Support for lowland rice production in Africa’ and ‘Support forSouth-to-South aid for production enhancement’ have been increased. Indeed,the Japanese government has committed to fund projects that will help Africadouble its rice production by 2018 (see below).
Japan’s actions for the global rice market
The Japanese government is in a position to contribute substantially to a morestable global rice market. Aid for African rice production is one example.However, in many ways Japan’s current actions are ineffective. This sectiondescribes international programmes such as minimum access (MA) riceimports and the East Asia Emergency Rice Reserve (EAERR) programme, aswell as the aid programme for African rice production.
JAPAN’S RICE POLICY AND ITS ROLE IN THE WORLD RICE MARKET 305
Survey and analysis of globalfood supply and demand
Support for lowland riceproduction in Africa
Support for South-to-South aidfor production enhancement
Export enhancement
2009
2008
2009
2008
2009
2008
2009
2008
0 0.25 0.5 0.75 1
Billion yen
Figure 15.7 Strategic countermeasures against the global food shortage
Source: MAFF (2009)
ES_RC_9-8 18/8/10 20:23 Page 305

Minimum access rice importsThe Japanese rice market was closed until 1995 when the General Agreementon Tariffs and Trade (GATT) Uruguay Round of Negotiations led to anopening up of the market (see Figure 15.8). Under the MA agreement, Japanwas required to import about 0.4 million tons (brown-rice basis) in 1995,increasing to 0.767 million tons in 2000. Since then the same annual volumehas been imported. Large imports in 1994 were due to a massive crop failure in1993.
There were two main effects of the Japanese MA rice imports in 1995.First, Japanese domestic rice prices fell substantially (see Figure 15.3). Second,global japonica rice prices soared relative to those of indica rice (see Figure15.9). Before 1995, prices of US indica rice (produced mainly in Arkansas) andUS japonica rice (produced mainly in California) were similar in the US ricemarkets. Since Japan began MA imports in 1995, mostly of japonica varieties,the prices of California japonica rice have been consistently more expensivethan those of Arkansas indica rice.
The Japanese government has honoured the WTO agreement since 2000,importing 0.767 million tons (on a brown-rice basis) every year (equivalent to0.68 million tons of milled rice, which consists of 0.58 million tons of ordinaryrice and 0.1 million tons of simultaneous-buy-and-sell (SBS) rice). Even in2008, the full amount was procured toward the end of the fiscal year, althoughtight supply in 2007 meant that year’s procurement fell about 10 per centshort. (In 2007, the SBS rice was imported in full at 0.1 million tons.) TheJapanese government finds it difficult to sell the MA rice and spends as muchas ¥25 billion ($250 million) to manage the imports each year. Further, if Japanwere to import ‘unnecessary’ rice at high prices, pushing prices even higher atthe expense of needier countries reliant on imports, the Japanese government
306 POLICY RESPONSES IN THE DEVELOPED COUNTRIES
Figure 15.8 Rice imports to Japan, 1980–2008
Source: Ito (2008)
3000
2500
2000
1500
1000
500
01980 1982 1984 1986 1988 1990 1992 1994 1996 1998 2000 2002 2004 2006 2008
Thou
sand
tons
mill
ed ri
ce
ES_RC_9-8 18/8/10 20:23 Page 306

would be criticized heavily. This was the situation during the first half of the2008 fiscal year, though the substantial decline in international prices duringthe second half of the year made it much easier to import the MA volumes.
Rice exporters such as Thailand and the US may not agree with theJapanese government’s reluctance to fulfil the MA quota when global prices arehigh. There has been much debate in Japan over whether or not the importquota must be fulfilled each year regardless of prevailing market conditions. Itis agreed that under ordinary circumstances the quota must be honoured, butunder conditions of tight supply and demand many in Japan feel that the MAagreement should be dealt with differently. Given that rice exporters did verywell in 2008, Japanese imports during such a period of high prices would haveserved only to help exporting countries at the expense of poorer importingcountries.
Japan imports primarily japonica rice from California. This helps explainwhy California rice market prices remained high while the indica rice marketsin the southern US plunged along with the Bangkok market prices (see Figure15.10). (Other factors included Egypt’s export ban, continued drought inAustralia, and delays by China in setting its export quota.) Japan’s strongdemand for Californian rice helps to keep Californian rice prices high.
The East Asia Emergency Rice Reserve programme
The EAERR was initiated by the Japanese government in 2004. The idea is thatall members of ASEAN plus three (Japan, China and Republic of Korea) jointlyorganize a rice emergency reserve. Under the plan, each country earmarks an
JAPAN’S RICE POLICY AND ITS ROLE IN THE WORLD RICE MARKET 307
1976
–77
1977
–78
1978
–79
1979
–80
1980
–81
1981
–82
1982
–83
1983
–84
1984
–85
1985
–86
1986
–87
1987
–88
1988
–89
1989
–90
1990
–91
1991
–92
1992
–93
1993
–94
1994
–95
1995
–96
1996
–97
1997
–98
1998
–99
1999
–00
2000
–01
2001
–02
2002
–03
2003
–04
2004
–05
2005
–06
2006
–07
2007
–08
Arkansas long grainCalifornia medium grainCalifornia short grain
($/c
wt,
bagg
ed)
30
25
20
15
10
5
0
Figure 15.9 US milled rice prices by type, 1979–2007
Notee: 1cwt = 100lbs = 45.36kg.Source: Ito (2009)
ES_RC_9-8 18/8/10 20:23 Page 307
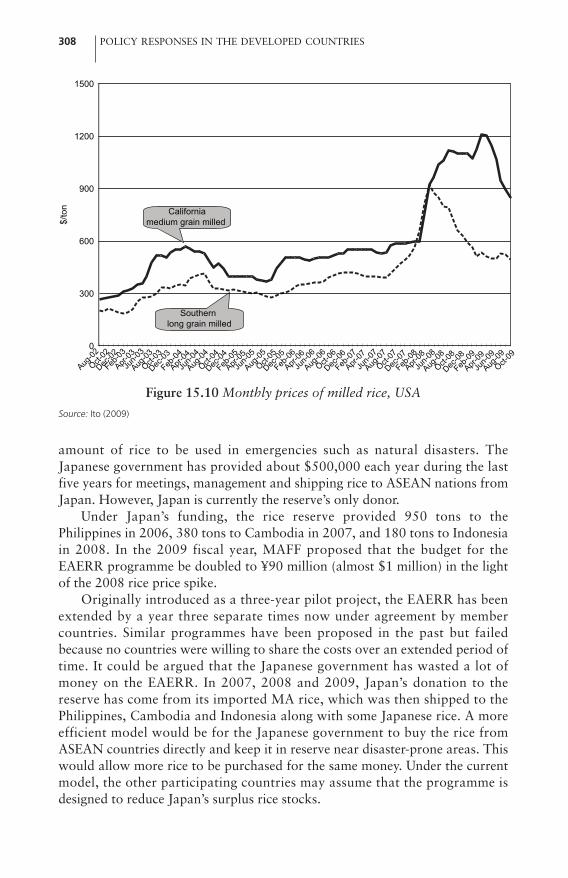
amount of rice to be used in emergencies such as natural disasters. TheJapanese government has provided about $500,000 each year during the lastfive years for meetings, management and shipping rice to ASEAN nations fromJapan. However, Japan is currently the reserve’s only donor.
Under Japan’s funding, the rice reserve provided 950 tons to thePhilippines in 2006, 380 tons to Cambodia in 2007, and 180 tons to Indonesiain 2008. In the 2009 fiscal year, MAFF proposed that the budget for theEAERR programme be doubled to ¥90 million (almost $1 million) in the lightof the 2008 rice price spike.
Originally introduced as a three-year pilot project, the EAERR has beenextended by a year three separate times now under agreement by membercountries. Similar programmes have been proposed in the past but failedbecause no countries were willing to share the costs over an extended period oftime. It could be argued that the Japanese government has wasted a lot ofmoney on the EAERR. In 2007, 2008 and 2009, Japan’s donation to thereserve has come from its imported MA rice, which was then shipped to thePhilippines, Cambodia and Indonesia along with some Japanese rice. A moreefficient model would be for the Japanese government to buy the rice fromASEAN countries directly and keep it in reserve near disaster-prone areas. Thiswould allow more rice to be purchased for the same money. Under the currentmodel, the other participating countries may assume that the programme isdesigned to reduce Japan’s surplus rice stocks.
308 POLICY RESPONSES IN THE DEVELOPED COUNTRIES
1500
1200
900
600
300
0
Aug-02
Oct-02
Dec-02
Feb-03
Apr-03Ju
n-03
$/to
n Californiamedium grain milled
Southern long grain milled
Aug-03
Oct-03
Dec-03
Feb-04
Apr-04Ju
n-04
Aug-04
Oct-04
Dec-04
Feb-05
Apr-05Ju
n-05
Aug-05
Oct-05
Dec-05
Feb-06
Apr-06Ju
n-06
Aug-06
Oct-06
Dec-06
Feb-07
Apr-07Ju
n-07
Aug-07
Oct-07
Dec-07
Feb-08
Apr-08Ju
n-08
Aug-08
Oct-08
Dec-08
Feb-09
Apr-09Ju
n-09
Aug-09
Oct-09
Figure 15.10 Monthly prices of milled rice, USA
Source: Ito (2009)
ES_RC_9-8 18/8/10 20:23 Page 308

It may also be better for the EAERR programme to set up a reserve offunds instead of rice, so that rice can be purchased when a natural disasteractually happens (a physical rice reserve is costly to maintain). Such a systemshould be developed within the framework of the global rice market system.
Aid for African rice
The Japanese government has committed to double its ODA budget for Africafrom 2008 to 2012 (Ministry of Foreign Affairs, Japan, TICAD IV, ActionPlan, 30 May 2008). This programme aims to boost agricultural development,production and marketing as well as infrastructure, trade, investment andtourism. For rice in particular, the target is to double production in Africa by2018.
The Government of Japan has committed to donate a total of ¥37 billion(approximately $370 million) to African countries over five years. As much as¥26 billion (approximately $260 million) of this is to be spent on agriculture.Besides the donation, the Japanese government will also loan up to $4 billionto African countries over the same period. Rice technology from Thailand willbe involved as a part of the South-to-South project.
Increased rice production in Africa should help stabilize the global ricemarket. However, if supply increases and demand diminishes, consequent lowrice prices may discourage sustainable increases in African rice production inthe future.
Conclusions
Japan should act as a watchdog for the global rice market
Rice consumers in many countries suffered from high prices in 2008, althoughprices eased, beginning in the second half of the year. Since 2007, the prices ofcommodities such as rice, wheat, corn and soybeans have tended to echo themovement of oil prices due to new linkages between energy and agriculturalmarkets (Ito et al, 2009). In the case of corn, which is now being used for ethanolproduction, oil prices directly influence corn prices. In addition, corn and theother major grains such as wheat and rice can be substituted with one another forfood and feed uses. Because of these links between energy markets and agricul-tural markets, speculation in oil prices can spill over into food markets.
Speculation was exacerbated by export controls imposed by the majorexporting countries. India was the first to restrict rice exports, and its exportsdeclined from over 6 million tons in 2007 to less than 3 million tons in 2008.Subsequently, Viet Nam, the second largest rice exporter after Thailand,banned rice exports by the private sector in early 2008. Despite the ban’s inten-tion of protecting domestic consumers from higher prices, Vietnamesedomestic prices increased sharply toward the end of May 2008.
These export restrictions kept the world rice market in a more fragile andunreliable state than the markets for corn, wheat and soybeans, for which there
JAPAN’S RICE POLICY AND ITS ROLE IN THE WORLD RICE MARKET 309
ES_RC_9-8 18/8/10 20:23 Page 309

were fewer export restrictions among the largest exporting countries. Thus,one impact of the rice price crisis was that the favourable reputation of the riceexport market was tarnished severely. By late 2008, rice exports, which hadbeen very reliable up until late 2007 despite the main exporters being develop-ing countries, were viewed as unreliable. Accordingly, many rice-importingcountries appeared to reduce their reliance on world markets and instead focuson policies oriented to increasing domestic production, further impairing thereliability of international trade (Nguyen et al, 2008).
It could be argued that Japan, as a major rice importer, has a responsibilityto act strongly against such export restrictions as those imposed by Viet Nam.These restrictions came despite Viet Nam holding enough rice to continueexports as normal, suggesting some exploitation of a volatile internationalmarket. If a similar situation occurs again, Japan could act to dissuade suchbehaviour by threatening to postpone rice imports from the offendingcountries for a few years. Also, as a developed country, Japan should establishthe capacity to export rice for aid to needy countries particularly duringperiods of restrictions by major exporting countries and high market prices. Inshort, Japan should act as a watchdog for the global rice market and take anyimmediate appropriate action required to normalize the market.
Need for increasing demand for rice
While short-term price spikes are important issues to be dealt with, long-termtrends are also of critical importance. One important long-term issue is theeffects of low prices on farmer incentives, with wheat providing an example.After world wheat production reached a record 589 million tons in 1990, ittook seven years to set a new record of 610 million tons in 1997. It tookanother seven years after that before a new record of 626 million tons was setin 2004. Global production then decreased until 2007 before a new record of683 million tons was set in 2008, marking a huge jump over 2007’s produc-tion. The history of wheat over the past two decades suggests that productionhas been strongly influenced by market prices. Falls in wheat prices between1990 and 1995 and between 1997 and 2002 discouraged producers globally.
A similar situation occurred in rice after 1999, when global production hita record high at 409 million tons (milled basis), the first time it had ever topped400 million tons. However, it took six years until 2005 to set a new record at418 million tons, a very small increase over the previous record. Indeed, globalmarket prices plunged during this period, removing incentives for producers toincrease production. This is closely related to the declining rice consumptionseen in many Asian countries (see Figure 15.1).
In many Asian countries where rice is one of the main agriculturalproducts, it is becoming increasingly difficult to keep people on the land.Younger people in particular tend to migrate away from rural to urban areas,and their parents often encourage them to find jobs in the cities. The unprof-itable nature of agriculture in many rural areas is a deterrent to staying on the
310 POLICY RESPONSES IN THE DEVELOPED COUNTRIES
ES_RC_9-8 18/8/10 20:23 Page 310

farm, and the growth in production of unprofitable crops may not keep upwith the growth of global population.
In addition, per capita consumption has been declining in many Asiancountries. If this situation continues, total global consumption – which is stillrising – may decrease in the future. In fact, global wheat consumptionstagnated throughout the 1990s. Although the global population continues togrow, consumption of certain crops will not necessarily increase.
These factors – lower prices for farmers, migration to urban areas anddeclining per capita demand – pose problems for rice, which is the major cropin Asian agriculture. A decline in rice production would be detrimental forAsian agriculture. Indeed, this has been the case in Japan, the Chinese provinceof Taiwan and Republic of Korea. It is quite reasonable, therefore, to use ricefor ethanol and feed in order to stimulate new demand. Higher prices of riceencourage rice producers around the world, and this has been seen in theincreased production in 2008.
One of Japan’s roles in the Asian rice industry must be to help develop newdemand and support other countries in terms of technology and investments.Agricultural development is a key factor in alleviating poverty in Asia, since themajority of the poor people live in the rural areas in the Asian developingcountries. With Japanese people now concerned about domestic food supply,the government is opting to increase domestic production. In addition, there isa lot of potential to increase rice production globally, as evidenced by remark-able increases in yields in many countries over the past few decades. Efforts toincrease domestic production in Japan, however, should be limited only to thelevel of individual farmers in the light of consumer preference for domesticproducts. It would be wasteful to subsidize the recultivation of discardedfarmland that is economically inefficient and agriculturally costly. Any moneythat might go toward such subsidies should be spent on foreign aid andresearch for developing both new demand and new technologies that can beapplied in other countries throughout the world.
Note1 The CPI did not increase substantially during 2008. While the July 2008 CPI was
about 2.5 per cent higher than in July 2007, the December 2008 CPI was onlyabout 0.2 per cent higher than in December 2007.
ReferencesEconomic Research Service (US Department of Agriculture), Rice Outlook,
http://usda.mannlib.cornell.edu/MannUsda/ Ito, S. (2008) ‘World food statistics and graphics’, http://worldfood.apionet.or.jpIto, S. (2009) ‘World grain prices and graphs’, Department of Agricultural and
Resource Economics, Faculty of Agriculture, Kyushu University, Japan http://worldfood.apionet.or.jp/pricechart/Indexriceprice.html
Ito, S. and Kako, T. (2005) ‘Rice in the world verging on a grave crisis’, Farming Japan,vol 39, no 5, pp10–33
JAPAN’S RICE POLICY AND ITS ROLE IN THE WORLD RICE MARKET 311
ES_RC_9-8 18/8/10 20:23 Page 311

Ito, S., Wesley, E., Peterson, F. and Grant, W. R. (1989): ‘Rice in Asia: Is it becoming aninferior good?’, American Journal of Agricultural Economics, vol 71, pp32–42
Ito, S., Abdullah, A. B. and Cai, J. (2006) ‘A new perspective for the policies on globalfood supply and demand: The case of weakening demand for rice in Asia’, Journalof Rural Problem, vol 42, no 3, pp253–262
Ito, S., Kubo, T. and Kuwabara, T. (2007) ‘Weakening demand for rice in asia and foodeducation law of Japan’, Rural Review, vol 34, no 2, pp5–22
Ito, S., Cuong, N. H., Kubo, T. and Bounnad, C. (2009) ‘Characteristics ofinternational grain price movements under the high oil prices’, Journal of RuralAgriculture, vol 45, no 2, pp191–196
MAFF (Ministry of Agriculture, Forestry and Fisheries of Japan) (2007) ‘Statistics ofagriculture, forestry and fisheries, 2006’, www.maff.go.jp/j/tokei/kouhyou/noukei/einou_kobetu/index.html#r5, www.maff.go.jp/j/tokei/kouhyou/noukei/seisanhi_nousan/pdf/seisanhi_kome_08.pdf
MAFF (2008) ‘The White Paper for food, agriculture and rural life 2007’ (Shokuryou,Nougyou, Nouson no Doukou), p16
MAFF (2009) ‘Japan: Overview of MAFF budget’ (Nourin suisan yosan no gaiyou),January
Nguyen, C., Kubo, T., Bounnad, C., Kuwabara, T. and Ito, S. (2008) ‘Is rice export banbeneficial to the domestic consumers?’, presented at the Kyushu Society ofAgricultural Economics Conference, Miyazaki, Japan, 26–28 September 2008
Lee, S. M. (2008) ‘Agro-food and rural policy reform towards the brighter transforma-tion of Asia-Pacific agriculture’, in Proceedings of the 7th Asia Pacific AgriculturePolicy Forum, Seoul, Republic of Korea, 7–9 September 2008, pp37–52
Smil, Vaclav (2004): ‘Feeding the World: How much more rice do we need?’ WorldRice Research Conference 2004, Tsukuba, Japan, 5–7 November, pp1–3
USDA (US Department of Agriculture) (2008) PSD Online, September,www.fas.usda.gov/psdonline/psdDownload.aspx
312 POLICY RESPONSES IN THE DEVELOPED COUNTRIES
ES_RC_9-8 18/8/10 20:23 Page 312

16
The ‘Diplomatic Crop’ or How theUS Provided Critical Leadership in
Ending the Rice Crisis
Tom Slayton
Introduction
Rice is aptly characterized as the ‘diplomatic crop’ in Dan Morgan’s Merchantsof Grain (1979). International politics have often played a key role in themodern world rice market and in the decade after the first world rice crisis in1972–1974, G-to-G contracts were increasingly important.1 Politics wereparamount, as well, in the most recent world rice crisis.
While India, Viet Nam and the Philippines played central roles in initiatingand exacerbating the world rice crisis of 2008, the US, Thailand and Indonesiaprovided critical leadership to help quiet the raging market. Thailand, ofcourse, continued to allow unfettered exports, resulting in an extra 3.1 milliontons being shipped out during the nine-month period ending June 2008compared to one year earlier.2 Less well known was the Indonesian govern-ment efforts in April to urge Japan to give priority consideration to ship rice tothe Philippines before filling its needs later in the year.
This chapter, however, focuses on the role played by the US in defusing thecrisis. Not only did the US supply an extra 0.4 million tons to the world marketduring the crisis, but – at the height of the crisis – signalled Japan that it could
ES_RC_9-8 18/8/10 20:23 Page 313

delay making WTO-mandated purchases and urged the release of unneededgovernment-owned stocks to the Philippines and others on favourable terms.Given the contentious history of US–Japan negotiations over rice,Washington’s policy moves were both surprising and devoid of self-interest.Indeed, the policy moves were made expeditiously, despite opposition frompart of the US rice industry.
Before the events of 2008 are discussed, however, it is useful to providebackground information on when and where rice is produced in the US and theparamount role that US government programmes have played in the develop-ment of the rice industry in the modern era. Starting with a preferential tradeagreement negotiated with Cuba in the 1930s, the US rice industry’s growthinto a major world rice exporter, in large measure, was the result of its politicalclout in Washington, DC. In the crop year prior to passage of the legislationestablishing the PL 480 programme in 1954 (which was subsequently renamedFood for Peace in 1961), US rice exports declined to 453,000 tons due to thecombination of high price supports and uncompetitive freight costs.3 From thelate 1950s through to the 1970s, US government export programmes were afactor in close to 50 per cent of all exports (Mears, 1975; Schnepf and Just,1995). The US overtook Thailand as the world’s largest rice exporter in 1967and exports from the 1980 harvest reached a record 3.1 million tons. As thequantities of food moving under the food aid programmes were drasticallyreduced and uncompetitive prices once again took a toll in the first half of the1980s, the rice industry – together with cotton – in 1985 pioneered the subsi-dies involved in the ‘marketing loan’ programme, which sustained exports atelevated levels.4
From a peak of 1.2 million tons in fiscal year 1972 or about two out ofevery three tons shipped overseas, inflation and declining political supporttook a toll on the food aid budget overall and the quantity of rice financed forexport.5 By fiscal year 2008, rice shipments as food aid declined to below95,000 tons and accounted for only 3 per cent of all exports. Declining worldprices served to propel US rice programme costs to a high of $1.8 billion infiscal year 1999. Outlays in subsequent years contracted due to the combina-tion of rising world prices and – beginning in 2003 – a less aggressiveimplementation of the marketing loan programme resulting in direct budgetaryoutlays for rice falling sharply, reaching a low of $301 million in fiscal year2008.
Background
The Setting
The US harvests a single rice crop each year, which is centred into two growingregions: the Gulf (Arkansas, Texas, Louisiana, Mississippi and Missouri) andCalifornia (see Table 16.1).6 Indica varieties are planted in the Gulf (southern)states, while japonica is grown in California. Arkansas is the largest producing
314 POLICY RESPONSES IN THE DEVELOPED COUNTRIES
ES_RC_9-8 18/8/10 20:23 Page 314

state, accounting for just under half of the total harvest. California providesover one-fifth of the output. Rice is planted between March and April in thesouthern US with harvesting beginning in late July in Texas and coastalLouisiana and progressing north, ending in October in Arkansas and Missouri.In California, planting takes place in April–May, with harvesting betweenSeptember and November. Because nearly all rice acreage is irrigated, fieldyields are among the highest in the world.
While US rice farmers produce a crop that is less than 2 per cent of theworld output, the US is one of the top five exporters of rice, typically account-ing for 10–12 per cent of world exports.
Export markets built via food aid and other government programmes
While rice was first introduced into colonial Virginia in the early 1600s andcommercial exports began around 1686 (Holder and Grant, 1979), US ricesales overseas became substantial only during the last 75 years and largelybecause of the myriad of government programmes, for example food aid,export credits and credit guarantees, and, most recently, the marketing loan.Constrained by acreage allotments7 and lower Asian prices, US exports werelimited until the years leading up to World War II. Beginning in 1933, thedomestic rice industry persuaded the US Congress to expand the import quotafor Cuban sugar in return for Havana giving preferential import tariffs for USrice. This, combined with Japan’s conquests and the civil war in China disrupt-ing the world rice trade, resulted in a fourfold rise in US exports to Cubabetween 1937 and 1939 to over 90,000 tons, making it by far the largestcommercial overseas market – accounting for about two-thirds of all USexports.8 During World War II, acreage restrictions were lifted, escalatingproduction goals were set, and the US government and its wartime alliesbecame major buyers of US rice (Dethloff, 1988). By the last year of the war,US rice exports approached 325,000 tons – over 80 per cent above thatshipped prior to the US entering World War II (see Appendix, Table 16.9).
THE ‘DIPLOMATIC CROP’ 315
Table 16.1 US rough rice production by region (million tons)
Total Gulf California
2000 8.7 6.7 2.02001 9.8 8.0 1.72002 9.6 7.6 1.92003 9.1 7.3 1.82004 10.5 8.2 2.32005 10.1 8.3 1.82006 8.8 7.0 1.82007 9.0 7.0 2.02008 9.2 7.3 2.0
Source: USDA, Rice Situation and Outlook, various issues and years
ES_RC_9-8 18/8/10 20:23 Page 315

Given the widespread destruction and disorder in Europe and Asia, thepost-war environment, too, was conducive to expanded export opportunitiesfor the US rice industry. As Table 16.2 illustrates, overseas shipments in thefive-year period following the war (crop years 1945–1949) climbed to anaverage of 428,000 tons. The ongoing US aid shipments to Japan and commer-cial sales to Cuba were augmented by additional food aid exports to theRepublic of Korea following Pyongyang’s invasion of the south in June 1950.Between 1932 and 1954, US rice production had jumped from 850,000 tons to2.9 million tons. These prosperous and expansive years for US rice farmers andmillers came to an abrupt end in 1954 when bumper crops were harvested inAsia and unsold surpluses were forfeited to the US government, which, in turn,successively and substantially reduced the acreage on which it was willing toprovide benefits. Between 1954 and 1957, the government reduced acreageallotments by half and plantings plunged to 555,000ha (Dethloff, 1988).
Fortuitously, US rice farmers and millers had friends in high places inWashington, DC. Under the seniority system, southern politicians dominatedcongressional committees, with the result that the rice industry enjoyed consid-erable government largesse during the latter half of 20th century.
It is not hard to figure out the reason for the privileged positionof the rice business in American agriculture. It is only necessaryto examine the roster of powerful congressional committee chair-men – the ‘southern barons’ – who ran Congress in the 1950s and1960s. The barons were friends of rice. There was Wilbur Millsof Arkansas, chairman of the House Ways and MeansCommittee; J. William Fulbright of the same state, chairman ofthe Senate Foreign Relations Committee, W. R. Poage of Texas,
316 POLICY RESPONSES IN THE DEVELOPED COUNTRIES
Table 16.2 US rice exports (milled basis)
Period Exports (thousand metric tons)
1930–1934 921935–1939 1071940–1944 2311945–1949 4281950–1954 6311955–1959 7841960–1964 11491965–1969 16941970–1974 17581975–1979 22491980–1984 24421985–1989 24431990–1994 25611995–1999 26942000–2004 3422
Note: August to July crop year basis.Source: USDA, Rice Situation and Outlook, various issues and years
ES_RC_9-8 18/8/10 20:23 Page 316
chairman of the House Agriculture Committee; Otto Passman ofLouisiana, chairman of the Foreign Operations (foreign aid)Subcommittee of the House Appropriations Committee; AllenEllender of Louisiana, chairman of the Senate Appropriations[sic] Committee; and Russell Long of the same state, chairman ofthe Senate Finance Committee. It was said that Wilbur Millsnever wrote a tax bill without getting something for rice. Ricewas a small crop, but the people who raised it and milled itshowed that they were as good at cultivating political support asat cultivating rice. (Morgan, 1979)9
Recognizing the critical importance that politics would play in the viability ofthe industry, the US Rice Millers’ Association (RMA) opened an office inWashington, DC in 1958 and moved its headquarters there four years later.
Food aid programmes in the post-World War II period played a key role inbuilding the US rice industry into a world powerhouse. Or, as former RMAPresident J. Stephen Gabbert observed (personal communication, 2009),‘During the 1960s and 70s, the rice industry was capitalized by PL-480 sales toIndia, Vietnam, Cambodia, and ROK [Republic of Korea]’. Following 0.3million tons in fiscal year 1956, food aid shipments the following year morethan doubled to 822,000 tons or about 69 per cent of all exports (Mears,1975). When PL 480 sailings the next year plunged almost 600,000 tons, therice industry realized that they needed to roll up their sleeves:
The next year the ramifications of the law became clear to ricepeople. As was usual in government programs, it had beendesigned with wheat and cotton surpluses in mind, but the riceindustry [realized it] could become an excellent vehicle formarketing rice overseas through both government and commer-cial channels. (Dethloff, 1988)
During fiscal years 1956–1959, 1.5 million tons of rice was shipped as food aid– representing three out of every five tons exported – as part of the geo-politicalcompetition with the Soviet Bloc. The Indian subcontinent, Indonesia andRepublic of Korea were the main destinations, receiving 45 per cent of allexports (see Table 16.3). But the volumes moving were highly variable and itwas another ten years before the volume of rice moving under the PL 480 andother aid programmes would come close to the bumper fiscal year 1957 level:
With the assistance of Senators J. William Fulbright and AllenEllender and Congressmen E. C. Gathings and T. A. Thompson,the industry mounted a policy offensive that produced the firstmulti-year commodity agreement … India agreed [in 1960] tobuy 1 million tons over the next four years through PL 480programmes. (Mears, 1975)
THE ‘DIPLOMATIC CROP’ 317
ES_RC_9-8 18/8/10 20:23 Page 317

This proved fortuitous as Cuba, still the largest overseas commercial market,stopped buying US rice that year for political reasons.
During the first half of the 1960s, 2.56 million tons was provided as foodaid – almost one out every two tons exported – with India, Indonesia andBangladesh the leading destinations. Limited tonnages during this period wereprovided to South Viet Nam, but the quantities became a torrent as the USmilitary involvement deepened. In the decade before South Viet Nam fell in1975, over 3.5 million tons of US rice was shipped to that nation. With halfdestined for Viet Nam, 3.41 million tons of rice were shipped as food aidduring the second half of the 1960s or about 42 per cent of the total sailings.Indonesia, once again, was the second largest recipient, but India replacedBangladesh as number three. Bolstered by the massive food aid volumes, theUS overtook Thailand as the world’s largest exporter in 1967 and retained thatrank in eight of the next nine years.10
Both concessional and commercial rice exports soared during the 1970s.The latter was fuelled by Asian crop shortfalls in 1972–1973 and the new-found petro-dollar wealth of the OPEC members after the 1973 oil crisis.Almost 5.0 million tons of rice was shipped as food aid during the first half ofthe decade, accounting for close to 60 per cent of all exports. After South VietNam fell, rice’s importance as ‘the diplomatic crop’ was devalued as itsnational security support lessened. Indonesia then became the largest singlerecipient for rice PL 480 shipments. Indonesia imported over 1.25 million tonsof US rice aid during 1976–1979.
With the retirements of the ‘southern barons’ in the mid-1970s (andchanges in the congressional seniority rules), it was virtually inevitable that therice industry’s out-sized influence in the US government would wane. Initially,however, this decline was buffered by the continued influence in Washington,DC of Connell Rice and Sugar (a New Jersey-based rice exporter thatdominated the PL 480 rice market) and the adept RMA leadership of J.Stephen Gabbert.11 With Connell leading the way in Congress and Gabbert
318 POLICY RESPONSES IN THE DEVELOPED COUNTRIES
Table 16.3 Top US rice food aid markets (million tons)
Fiscal years Quantity Countries
1956–1959 1.5 Bangladesh, Indonesia, India, Republic of Korea1960–1964 2.6 India, Indonesia, Bangladesh1965–1969 3.4 South Viet Nam, Indonesia, India, Republic of Korea1970–1974 5.0 South Viet Nam, Republic of Korea, Indonesia, Cambodia1975–1979 2.9 Indonesia, Bangladesh, Republic of Korea, Portugal1980–1984 2.0 Indonesia, Philippines, Peru, Bangladesh1985–1989 2.2 Bangladesh, Philippines, Republic of Korea, Guinea1990–1994 1.3 Jamaica, Liberia, Ivory Coast, Russia1995–1999 1.3 Indonesia, Jamaica, Jordan, Côte d’Ivoire2000–2004 1.5 Indonesia, Philippines, Uzbekistan
Note: The table lists the top destinations taking at least 100,000 tons during a five-year time frame.Source: Mears (1975) for 1956–1973; USDA-USAID, Annual Report Food for Peace and International Food AidReport, various issues and years for 1974–2004; USDA (1991) for 1978–1989
ES_RC_9-8 18/8/10 20:23 Page 318
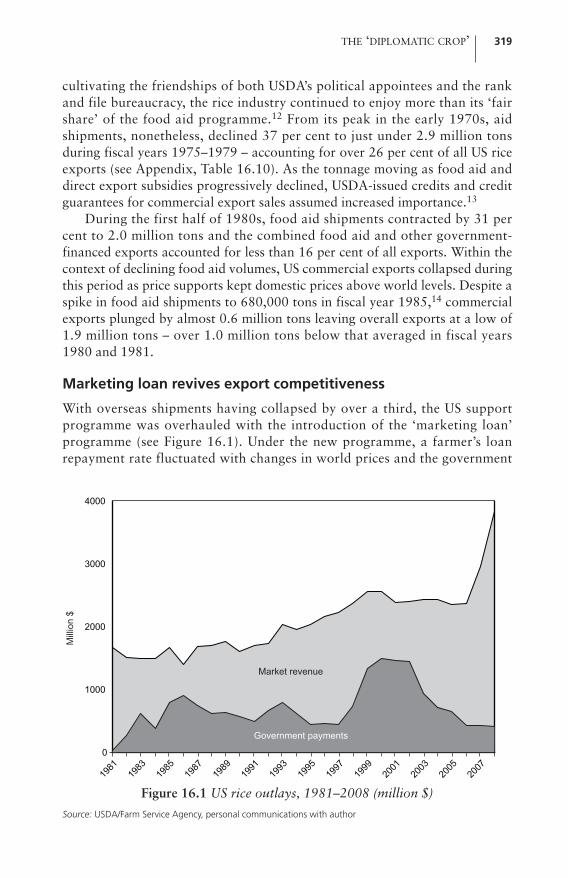
cultivating the friendships of both USDA’s political appointees and the rankand file bureaucracy, the rice industry continued to enjoy more than its ‘fairshare’ of the food aid programme.12 From its peak in the early 1970s, aidshipments, nonetheless, declined 37 per cent to just under 2.9 million tonsduring fiscal years 1975–1979 – accounting for over 26 per cent of all US riceexports (see Appendix, Table 16.10). As the tonnage moving as food aid anddirect export subsidies progressively declined, USDA-issued credits and creditguarantees for commercial export sales assumed increased importance.13
During the first half of 1980s, food aid shipments contracted by 31 percent to 2.0 million tons and the combined food aid and other government-financed exports accounted for less than 16 per cent of all exports. Within thecontext of declining food aid volumes, US commercial exports collapsed duringthis period as price supports kept domestic prices above world levels. Despite aspike in food aid shipments to 680,000 tons in fiscal year 1985,14 commercialexports plunged by almost 0.6 million tons leaving overall exports at a low of1.9 million tons – over 1.0 million tons below that averaged in fiscal years1980 and 1981.
Marketing loan revives export competitiveness
With overseas shipments having collapsed by over a third, the US supportprogramme was overhauled with the introduction of the ‘marketing loan’programme (see Figure 16.1). Under the new programme, a farmer’s loanrepayment rate fluctuated with changes in world prices and the government
THE ‘DIPLOMATIC CROP’ 319
Figure 16.1 US rice outlays, 1981–2008 (million $)
Source: USDA/Farm Service Agency, personal communications with author
0
1000
2000
3000
4000
1981
1983
1985
1987
1989
1991
1993
1995
1997
1999
2001
2003
2005
2007
Market revenue
Government payments
Mill
ion
$
ES_RC_9-8 18/8/10 20:23 Page 319

absorbed huge losses.15 With the introduction of the marketing loanprogramme, ‘the export price differential between the US and Thailanddeclined drastically, from a high of $260 in early 1985 to less than $105 by lateApril 1986 and below $53 by August 1986’ (Childs et al, 1994). With therenewed export competitiveness and large GSM-102 guarantees to Iraq,16
overall rice exports surged as the US regained market share. Exports during thefive-year period beginning in fiscal year 1986 averaged over 2.3 million tons.
The new farm policy, though, allowed the government to resume itsretrenchment in the quantity of rice moving as food aid. Despite the 1985spike, rice moving under direct government subsidies (including food aidprogrammes) fell to 19 per cent of all exports in the 1980s. During this period,‘[t]otal rice shipments under export credit guarantee programs peaked in fiscal1989 at 826,000 tons, with Iraq importing 530,000 tons and Mexico 108,000tons under GSM 102’ (USDA, 1999) (see Table 16.4).
Turbo-charging exports during the first half of the 1990s was the ExportEnhancement Program (EEP) which was set up ‘to help US exporters meetcompetitors’ prices in subsidized markets. Under the EEP, ‘exporters [were]awarded bonus certificates redeemable for [government] -owned commodities,enabling them to sell … at prices below those of the US market’ (USDA,1999).17 At the height of the programme in fiscal years 1992–1993, 671,000tons of commercial rice exports received EEP subsidies. Almost 1.1 milliontons of rice were exported under the EEP to medium grain markets which hadbeen importing rice from the EU – in East Europe, the former Soviet Union,Algeria and the Middle East.
In the 1990s, food aid declined to less than 13 per cent of all rice exports,levelling off at 260,000 tons per annum. Whereas most of the rice shippedduring the first 35 years of the PL 480 programme was destined for Asianmarkets, African and Latin American destinations grew in importance duringthe 1990s.18 Rice shipments benefiting from the GSM credit guaranteeprogrammes also declined in the 1990s to average less than 285,000 tons perannum, more than one-third below that moving in the 1980s. By 2000–2004,these programmes accounted for only 8 per cent of the total rice exports as theoverall budget for Title I was further reduced. The primary PL 480 rice destina-
320 POLICY RESPONSES IN THE DEVELOPED COUNTRIES
Table 16.4 US exports, GSM programmes
Fiscal years Quantity (thousand tons)
1965–1969 2061970–1974 4281975–1979 2151980–1984 15331985–1989 27301990–1994 12131995–1999 1361
Source: Schnepf and Just (1995) for 1965–1989; USDA, Rice Situation and Outlook, various issues and dates, for1990–1999
ES_RC_9-8 18/8/10 20:23 Page 320

tions during this period were Indonesia, the Philippines and Uzbekistan. Withthe last rice programmed under Title I occurring in fiscal year 2006 (to thePhilippines), only limited tonnages are moving as grant aid. In fiscal year 2008,for example, less than 95,000 tons was shipped as food aid (only 3 per cent ofthe total exports) – destined for 26 different countries (USDA, 2009).
Overall US rice exports rose during the first half of the 1990s, averagingover 2.7 million tons. Notwithstanding a winding-down of the EEPprogramme, US rice overseas sales during the second half of the 1990s rose byalmost 0.4 million tons to 3.1 million tons as USDA more aggressively imple-mented the marketing loan programme (see Table 16.5). As a result, directoutlays to farmers – which had averaged over $460 million in fiscal years1995–1997 – climbed to $747 million in 1998 and topped a record $1.8 billionin 1999 as world prices declined sharply (see Appendix, Table 16.11).
Despite a quiet policy decision in 2003 to less aggressively implement themarketing loan programme in an effort to minimize expenditures, decliningworld prices resulted in direct payments to rice farmers averaging over $1.25billion during fiscal years 2000–2004 as exports rose by a further 500,000 tonsto average 3.6 million tons. Rising world prices and the continuation of thispolicy allowing US export prices to be less competitively priced drove riceprogramme costs even lower in recent years. During fiscal years 2005–2006,direct payments to rice farmers were slashed to average below $540 million peryear. Even further declines occurred in the subsequent years, such that in fiscalyear 2008 payments hit a low of $301 million – the lowest nominal level in 20years.
THE ‘DIPLOMATIC CROP’ 321
Table 16.5 US and Thai FOB export prices ($ per ton)
Year No 2/4%LG Thai 100%B Difference
1990 339 275 641991 384 301 831992 341 276 641993 332 248 831994 383 290 941995 350 333 171996 423 350 731997 441 313 1281998 417 313 1041999 334 250 842000 267 205 622001 263 175 882002 248 198 502003 285 200 852004 371 245 1262005 317 290 272006 394 311 832007 436 335 1012008 782 695 87
Source: The Rice Trader for 1990–2005; FAO for 2006–2008
ES_RC_9-8 18/8/10 20:23 Page 321

A look at the US rice balance sheet
Over the last ten years, domestic demand has averaged 55 per cent of thecombined production, imports and net stock changes (see Table 16.6).Excluding pet foods, per capita consumption was 11kg during 2007–2008(USA Rice Federation, 2009) – little changed since 2000 (USA Rice Federation,2008a).
The US has been importing rising quantities of aromatic rice (Thai jasmineand basmati from India and Pakistan), glutinous rice and medium-grain rice(destined for Puerto Rico).
In recent years, the US has been the world’s third or fourth largest exporter.Major markets include Mexico and Central America, the Caribbean, Canadaand Saudi Arabia for long-grain rice. Turkey, Japan, Republic of Korea andJordan are important medium grain markets. Exports of rough rice have beenplaying an increasing role in overall exports, accounting recently for 36 percent of total rice exports. Mexico and Central America are the largest marketsfor US rough rice, almost exclusively long grain.
Rocky rice relations with Japan
Rice has been a sore point in US–Japan relations for the last three decades.After World War II, Japan was briefly a market for US rice. Due to increasinglyprotectionist policies, however, Japan closed its market to imports and beganto produce surpluses, which it periodically dumped onto the world market.Japan’s subsidized exports of 564,000 tons in 1979 prompted the US RMA tofile a Section 301 trade complaint with the US Trade Representative (USTR) inApril of the following year arguing that Japanese rice exports were receiving a$2000/ton subsidy as Japan’s domestic prices were ten times the world marketprice. Following bilateral negotiations, Japan agreed to limit its exports duringfiscal years 1980–1983 and to hold periodic bilateral discussions on its exportplans (United States House of Representatives, 1986).
322 POLICY RESPONSES IN THE DEVELOPED COUNTRIES
Table 16.6 US Rice supply and distribution (million tons, milled basis)
Stocks Production Imports Total supply Exports Domestic use
1998–1999 0.9 5.8 0.3 7.0 2.7 3.61999–2000 0.7 6.5 0.3 7.5 2.8 3.82000–2001 0.9 5.9 0.3 7.2 2.6 3.72001–2002 0.9 6.7 0.4 8.0 3.0 3.82002–2003 1.2 6.5 0.5 8.2 3.9 3.52003–2004 0.8 6.4 0.5 7.7 3.3 3.72004–2005 0.8 7.5 0.4 8.6 3.5 3.92005–2006 1.2 7.1 0.5 8.9 3.7 3.82006–2007 1.4 6.3 0.7 8.3 2.9 4.12007–2008 1.3 6.3 0.8 8.4 3.3 4.12008–2009 0.9 6.5 0.6 8.1 3.0 4.1
Source: USDA/Foreign Agriculture Service Production, Supply and Distribution Online, www.fas.usda.gov/psdonline/psdHome.aspx
ES_RC_9-8 26/8/10 09:14 Page 322

In 1986, the RMA filed a Section 301 petition seeking to open Japan’s ricemarket with an import quota of 2.5 per cent of the domestic market, but inOctober the US government rejected the petition, indicating that it wouldpursue the goal during the Uruguay Round of trade negotiations under theGATT, which had been launched one month earlier. In September 1988, withJapan showing no willingness in the trade round to open up its market and onthe eve of the presidential election, the US rice industry filed a second Section301 trade complaint calling for the US government to force Japan to open upits rice market to imports. Within six weeks, however, the petition was againrejected, with the USTR arguing that the GATT was the more appropriateforum (Morrison and Villareal, 1991). In December 1993, after the USsignalled that it would accept a Section 301 trade complaint if Tokyo was notforthcoming in the GATT, Japan finally agreed to open its market with anannual import quota of 379,000 tons beginning 1 April 1995.19 This quotawas to rise to 758,000 tons by April 2000. On 21 December 1998, however,Japan availed itself of a provision under Annex 5 of the Uruguay Round accordand reduced the quantity of rice it was required to import. Under the revisedpolicy, duty-free imports in 1999 were limited to 644,000 tons (instead of the682,000 tons which would have been required under the original UruguayRound agreement) and subsequent import-free purchases levelled off at682,000 tons (76,000 tons below that originally specified in 1993) until a newagreement is negotiated.
Japan has increasingly chafed under its import obligations resulting incontentious bilateral discussions as it exploited imprecise language used in theoriginal agreement. Where the US sought to reach the Japanese kitchen with itsrice, Tokyo kept the rice the government purchased in storage for several yearsuntil it was disposed of as starch, animal feed or shipped abroad as grant aid.Import arrivals before 1 April (the beginning of the new Japanese fiscal year)became shipment from the origins, which later became purchases to beconcluded during the fiscal year. Increasing quantities of brokens werepurchased instead of whole grain rice and so on.
2008 rice crisis
US harvest rises less than 3 per cent, but farmers reap prices up 31 per cent
While Thai rice prices rose threefold between the beginning of 2008 and thepeak of the market during April–May, US long-grain exports prices rose lessthan 95 per cent, falling short of the highs recorded in Bangkok.20 At the verytime that the rise in world prices was accelerating, the US rice crop was beingplanted in March–May. Expecting that the elevated prices would last, sowingsrose 8 per cent to 1.2 million hectares. Over half of the increased acreageoccurred in two states: Louisiana and Arkansas. In Arkansas, plantingsrebounded from the year-earlier low as farmers switched out of feed grains
THE ‘DIPLOMATIC CROP’ 323
ES_RC_9-8 26/8/10 09:14 Page 323

and, to a lesser extent, cotton. The increase in Louisiana appears to have comeat the expense of cotton and feed grains, but there was some acreage inundatedby hurricanes in 2006 that was only brought back into production in 2008(personal communications with rice extension experts Dr Bobby Coats of theUniversity of Arkansas and Dr Johnny Saichuk of Louisiana State University).
While the California crop acreage declined by almost 3 per cent, plantingsin the South rose by over 11 per cent. With field yields falling 5 per cent tobelow 7.7 tons/ha because of damage resulting from two hurricanes and lessthan ideal growing conditions, US production in 2008 increased by only 2.7per cent. While world prices fell precipitously during the second half of theyear, the decline for US growers was a short-lived single month. According toUSDA, the season average price for the 2008 crop was over $370/ton – 31 percent above that received for the 2007 harvest (see Table 16.7).
US exports increase by 247,000 tons
Reflecting a steep drawdown in carry-over stocks, US rice exports rose by 0.4million tons during September 2007 through to June 2008. On a calendar yearbasis, US exports rebounded to over 3.25 million tons in 2008, almost aquarter of a million tons over the year-earlier low (see Table 16.8). The increasewas primarily driven by a 220,000 ton increase in liftings by Venezuela as aresult of its poor domestic policy decisions. Further, with Manila payingexorbitant prices in its tenders and desperate to secure rice wherever it could,the Philippines bought commercially almost 80,000 tons of US rice – anunprecedented occurrence as typically higher US FOB values are compoundedby significant freight premiums. Including food aid, overall US exports to thePhilippines increased by 55,000 tons in 2008. Benefiting from India’s virtualabsence in the parboiled non-basmati market after Delhi’s April 2008 exportban and relatively uncompetitive Thai prices during the second quarter, USshipments to South Africa (a major market through the 1990s) rose by almost
324 POLICY RESPONSES IN THE DEVELOPED COUNTRIES
Table 16.7 US farm-gate prices for paddy ($ per ton)
2007 2008 Change
January 229 273 44February 223 278 55March 220 300 79April 225 322 97May 220 351 130June 220 364 143July 223 370 148August 223 399 176September 225 373 148October 245 399 154November 260 428 168December 258 410 152Average 231 355 125
Source: USDA, Rice Situation and Outlook, 2009
ES_RC_9-8 18/8/10 20:23 Page 324

20,000 tons. These increases in long-grain rice sales were moderated by signifi-cant declines in purchases elsewhere in Latin America and contracts signed byIraq.
With Tokyo, Seoul and Taipei curtailing their purchases in the face ofsoaring medium-grain values, which continued to climb after long-grain pricesturned lower at mid-year, US exports to Japan and the Chinese province ofTaiwan fell by 30,000 tons and 40,000 tons, respectively. These declines weremore than offset by a modest upturn in shipments to Jordan and a nearly115,000 tons increase in sailings to Turkey – which could not source its normalvolumes out of Egypt due to that origin’s export restrictions.
Panic briefly flares in US
With the WFP warning of a ‘silent tsunami’, the panic gripping many Asianmarkets spread to the US in late April. Talk of the ‘world food crisis’ and rising
THE ‘DIPLOMATIC CROP’ 325
Table 16.8 US exports to major destinations (thousand tons)
Country 1990– 1995– 2000– 2005 2006 2007 2008 % change 1994 1999 2004 2007 to
average average average 2008
North America 819 1260 1624 2230 2194 2107 1963 �6.83Canada 133 168 185 236 233 237 232 �2.11Central America 82 209 398 536 383 510 444 �12.94Cuba — — 58 144 132 60 9 �85.0Haiti 113 183 247 329 311 277 287 3.6Mexico 151 285 501 556 585 607 577 �4.8
South America 214 267 122 36 9 14 232 **
Brazil 134 92 78 * * * * �27.6
EUa 302 323 304 279 195 96 99 3.1
Middle East 520 478 297 686 521 449 478 6.5Iran 60 44 2 — — — 31 **
Iraq 44 — 16 288 381 223 54 �75.8Jordan 42 49 16 93 31 69 75 8.7Saudi Arabia 190 139 119 118 81 127 131 3.2Turkey 140 196 120 119 13 2 115 **
Africa 452 257 255 243 174 166 181 9.0Ghana 22 59 90 127 88 86 60 �30.2South Africa 121 107 49 * — 1 20 **
Asia 144 322 582 636 513 502 610 21.51Indonesia 8 66 68 * 1 1 1 70.8Japan 103 213 311 432 330 303 273 �9.9Republic of Korea 2 1 33 14 59 66 97 47.0Philippines * 7 56 53 67 34 89 **
Chinese province of Taiwan 1 1 51 40 36 65 25 �61.5
TOTAL 2416 2753 3129 3840 3288 3007 3254 8.2
Note: a data through to 2004 are for EU-15; 2005–2006 are for EU-25; 2007–2008 are for EU-27. * Less than500 tons. ** Change is greater than 100 per cent.Source: US Census Bureau data, as adjusted by author through to 2005
ES_RC_9-8 18/8/10 20:23 Page 325

food prices became a staple on the cable news programmes and their 24-hournews loop. Reacting to panic buying, Costco and Sam’s Club stores (the twobiggest warehouse retail chains) in California began to restrict sales of rice tocounter hoarding. It was reported that some Sam’s Club stores were limitingcustomers to four 20-pound bags at a time (New York Times, 2008). Presscoverage of the restrictions, in turn, heightened the media frenzy and resultedin some additional runs on stores in New York and elsewhere, prompting theUS Rice Federation to issue a formal statement that there was no shortage ofrice in the domestic market (USA Rice Federation, 2008b).
While the magnitude is by no means certain, it appears that the overseasFilipino community may have played a role in spreading the panic from Asianmarkets to the US Filipino-Americans, who have long shipped balikbayanboxes (care packages of food and other consumer items) to their relatives backin the Philippines. These packages are filled with items that are often purchasedat Costco and are shipped by freight forwarders who pay a standard tax perbox to the Philippines Bureau of Customs – regardless of the contents and sizeof the box. With images of the long food lines in Manila and commercial riceimports subject to government licences, some of the balikbayan box companiesurged their customers to ship rice either separately or as part of the contents ofthe box. Reportedly, some customers used loose rice to fill the empty spaces oftheir boxes (information in this paragraph from personal communications withVictor Leviste, Agricultural Attaché, Embassy of the Philippines).
US plays midwife to deliver world from rice crisis
Given the disputes between the US and Japan over the last 30 years, it is notsurprising that the initial rice enquiries by both Indonesia and the Philippinesin the spring of 2008 were rebuffed. In both instances, Tokyo indicated that itwould consider the requests only if Manila and Jakarta declared ‘emergencies’– which politically was a non-starter. On 21 April, Indonesia was advised bythe Japanese Embassy in Jakarta that it was only willing to entertain a requestfor small tonnages under its Kennedy Round grant aid programme – unlessJakarta made a formal request for food assistance to the WFP and only if therice could be made under terms that were consistent with ‘international agree-ments such as WTO agreements’.21 No promises were made and BULOG wasadmonished not to delay as the volume available was limited and was given afood aid request form to fill out. In the case of the Philippines, Japan sought tosidestep a potential dispute with the US by offering instead to consider sendinglocally produced rice to the Philippines.
Friends of Indonesia and the Philippines in the US counselled that this wasan extraordinary situation and that the US government could be persuaded tonot object to Japan releasing its stocks of imported rice. Acting on this advice,Indonesia’s minister of trade made a representation to US AmbassadorCameron Hume in late April 2008 about the potential need to have access toJapan’s stocks.
326 POLICY RESPONSES IN THE DEVELOPED COUNTRIES
ES_RC_9-8 18/8/10 20:23 Page 326

On 9 May, the CGD issued the op-ed paper, ‘Japan, China and Thailandcan solve the rice crisis – but US leadership is needed’ (Timmer and Slayton,2008). In addition to the US government, the paper was aimed at other policy-makers in Washington (World Bank), as well as in New York (the UN) andRome (FAO) to either persuade the countries with excess stocks to make therice available to the world market or to get India and Viet Nam to change theirtrade policies.
The six-page paper argued that the causes of the ‘rice crisis’ were differentfrom that of the global ‘food crisis’ (export restrictions in India and Viet Namand imprudently aggressive buying by the Philippines) and the proposedsolution was straightforward (Japan, China or Thailand needed to releaseextra supplies into the market). Unlike the analyses and plans offered byothers, the diagnosis of the problem and the prescription were cogent and do-able. And the media, Congress and public loved it.22
The Bush White House had earlier convened two inter-agency workingcommittees to grapple with how to deal with the food crisis and within USDAa special task force had been established. Early in 2008, for example, several ofthe US embassies were instructed to make démarches to those governmentsthat had banned food exports. The diagnosis and prescription contained in theCGD paper had been made to a senior USDA official travelling in SoutheastAsia in late April and to US Ambassador Hume. The USDA official subse-quently urged the Philippines to revise NFA’s buying modus operandi andbrought up the idea of Japan re-exporting its stocks in one of the inter-agencycommittees. Apparently the proposal was viewed favourably by the StateDepartment, but USDA – having fought hard to open the Japanese rice market– felt that this was a policy reversal that should only be made deliberately andafter considering the industry’s views. Within the USDA bureaucracy, the issuewas extremely sensitive, perhaps because the views of the department’s politi-cal leadership were unknown. Critical among these views were those of DeputyUndersecretary Ellen Terpstra who was president of the US Rice Federationfrom 1998 until 2002.
To outsiders, though, it appeared that the US bureaucracy was in a discus-sion rather than decision-making stage. The authors of the CGD report – aretired rice trade expert operating out of his basement office in Alexandria,Virginia and a college professor in California – were manning an audaciouspublic relations campaign and coordinating the CGD briefing of congressionalstaffs. The result was a tsunami of public opinion that quickly convinced USpolicymakers to urge Japan to release its rice stocks.
14 May was pivotal
The Wednesday following the release of the CGD paper was busy:
• 0900 hrs – USA Rice Federation met with USDA;• 0930 hrs – Senate Foreign Relations Committee hearing on world food
crisis;
THE ‘DIPLOMATIC CROP’ 327
ES_RC_9-8 18/8/10 20:23 Page 327
• 1000 hrs – House Financial Services Committee hearing on the same topic;• 1330 hrs – Japanese Embassy meets with USDA, USTR and the State
Department about the new US policy on releasing the rice and how torespond to press enquiries.
With one of the two US rice industry trade associations (US Rice Producers’Association) having publicly come out in favour of Japan being able to re-export its stocks, the position of the other group – USA Rice Federation – wastenuous.23 Reportedly, its position was that it was not opposed to the policyshift if Japan were to export both its domestic and imported stocks (possiblyreasoning that the subsidies involved in exporting the former would be prohib-itive) and that in the future the Japanese government’s imported rice should beresold to domestic consumers. The second point was an obvious non-starter,but it was a long-standing federation position and apparently its leadership feltit had no choice but to reiterate it given the views of its rank and file.
With the proposal folded into the testimony of CGD senior fellow ArvindSubramanian in the House hearing, another of those testifying having beenbriefed over the weekend, and questions prepared by CGD for committee staffmembers, congressional interest in the US okaying the release of Japanese ricestocks was piqued.
Japan is very skittish about its rice trade policy and the meeting on 14 Maydid little to alleviate this mood.24 Following inter-agency discussions in theaftermath of the meeting with the USA Rice Federation, Japanese diplomatswere summoned to USDA without any word on why. Reportedly, the threediplomats expected that they were going to receive a tongue-lashing fromForeign Agriculture Service Administrator Michael Yost for not having finishedbuying the Japanese 2007 buying commitment. Instead, the confused diplo-mats were given press talking points labelled ‘Press Points on US reaction topossible release of Japan’s rice stocks’.
The paper noted the current ‘very unusual’ condition of the world ricemarket:
In light of the food price crisis, some have called upon Japan torelease its rice stocks onto the international market. A significantportion of Japan’s rice stocks are made up of foreign riceimported under Japan’s WTO obligations. Because the rice isimported under the terms of the WTO Uruguay RoundAgreement to provide access to Japan’s domestic market, theview of the US has been that, rather than go into governmentstocks, this rice should be consumed in Japan’s domestic market.However, the unique conditions in the rice market this year,coupled with the growing humanitarian and political dimensionsof recent food price increases in developing countries warrantsconsidering extraordinary measures on this occasion to calm theinternational rice market. US officials will be conveying these
328 POLICY RESPONSES IN THE DEVELOPED COUNTRIES
ES_RC_9-8 18/8/10 20:23 Page 328

views to the Government of Japan, and we hope to coordinateour food aid donor efforts in the coming weeks to address theurgent needs around the world.
The paper was deliberately ambiguous about the volume of rice that Japanmight re-export. (To do otherwise might cause heartburn for the US rice indus-try and its supporters on Capitol Hill.) Further, the diplomats were concernedabout just how the two countries would coordinate their food aid efforts andthe fact that the US had not specified what the agenda would be for the follow-up meeting. (This is because USDA had not formulated its policy yet andownership of the issue within the department was lacking.) Later that evening,Bloomberg broke the news, quoting an unnamed ‘US trade official’ as sayingthat the US would not object if Japan were to release its stocks. While thedetails had not been worked out, the US had opened the door for Japan toexport its stocks. All that remained were for the details to be worked out andfor the Fukuda government to walk through that open door.
On 15 May, CGD heralded the news about the new US position and ricefutures prices in Chicago tumbled for the fourth straight day. The Japanesediplomats, however, described the US position as ‘ambiguous’ and driven by aneed to answer press questions. It was suggested that they have a one-on-onemeeting at USDA, as the US side thought it had been very clear. (The Japanesedid not follow this advice.) Later, the same diplomat raised the question ofuncertainty about how much rice the US would countenance. After recheckingwith USDA, one of the CGD experts told him that the ‘door was wide open’even for 1.5 million tons. The same individual later informally told thePhilippines that the US had no objection if Japan were to give Manila up to600,000 tons. (Following informal assurances from USDA, the Philippines on19 May publicly disclosed that Japan might provide it with 200,000 tons ofimported rice (Timmer and Slayton, 2008)).
Fearing a trap, Japan’s MAFF, however, wanted the US Embassy in Tokyoto spell out in writing what the US view was. (As one USDA official quipped, itseemed that Japan was having a hard time accepting ‘yes’ for an answer.)Approximately one week later, US Ambassador Cameron R. Hume, while onhome leave in Washington, is understood to have once again expressed theview that Indonesia had an urgent need to make major import purchases forlate 2008 delivery and how this could further destabilize the world marketunless it could source significant tonnages in Japan.
To allay Japanese concerns, the US ambassador to Tokyo, ThomasScheiffer, issued a written statement on 22 May noting:
The unique conditions in the global rice market this year, coupledwith the growing humanitarian and political dimensions ofrecent food price increases and natural disasters in the region,warrant extraordinary measures to calm the international ricemarket … The United States welcomes the news that Japan is
THE ‘DIPLOMATIC CROP’ 329
ES_RC_9-8 18/8/10 20:23 Page 329

considering extraordinary measures to respond to this uniquelycritical situation. (Schieffer, 2008)
The follow-up meeting
On 23 May, a second meeting was held in Washington, DC between the US andJapan. According to meeting participants, there were three main issuesdiscussed:
1 whether Japan would release stocks of imported rice to help stabilize theworld rice market;
2 whether Japan would re-export its imported rice stocks as food aid orthrough commercial channels for profit; and
3 whether Japan intended to fulfil its TRQ obligation for 2007 in addition toits 2008 quota.
During the course of the discussion, the Japanese reportedly said withoutelaboration that it would not respond favourably to a request by Indonesia for500,000 tons.25
The US expressed support for Japan’s plan to export a portion of itsimported rice stocks to alleviate world hunger and to calm world rice prices,but stressed that it should not be only US rice and that domestic Japanese riceshould also be exported. (From conversations with US participants, it was notclear if the US was urging Tokyo to export its stocks in proportionally equalshares to its inventory.) Reportedly, Japan replied that it did not have aproblem with this concept as it had only received a formal request from thePhilippines to purchase 250,000 tons, including 50,000 tons of domestic rice.(According to Filipino official sources, Manila preferred to purchase the rice,rather than receive it as aid, as it believed that the negotiation and executioncould be arranged much more expeditiously for delivery in August in time tofill an expected shortfall.26) Reportedly, the Japanese side indicated that itmight be willing to export a few hundred thousand tons more, but that nofurther transactions were being contemplated at that time.27 The US sideindicated that the Japanese appeared to resist the idea that their entire 1.5million tons of imported rice would be re-exported, but one of the Japaneseparticipants denied that this was the case.
On the second point, the US said that it preferred that Japan considerproviding the rice through a grant of food aid rather than a sale. If makingfood aid grants were not possible, the US officials discouraged Japan frommaking a profit from the sale of imported rice during times of humanitarianneed, selling it only at its acquisition cost, not including storage andhandling.28
In what were described as ‘frank discussions’, Japan indicated that it didnot plan to buy the 65,000 tons remaining from its 2007 minimum marketaccess (MMA) commitment and that a public statement to that effect might be
330 POLICY RESPONSES IN THE DEVELOPED COUNTRIES
ES_RC_9-8 18/8/10 20:23 Page 330
made that week.29 The US reportedly stressed that this was unacceptable,pointing out that Tokyo’s failure to honour its commitment could underminepurchase commitments by the Chinese province of Taiwan and Republic ofKorea. (Washington subsequently directed that its embassy in Japan make adémarche to head off a public statement by Japan that it would not buy theoutstanding rice or that its sales prices to the Philippines would be made at asubstantial mark-up.) The US side also repeated its earlier suggestion thatTokyo might delay its new purchases until after the upcoming harvest inCalifornia so as to have a minimal bullish effect on prices.
The USTR subsequently issued a public statement that ‘the United Stateswas supportive of Japan’s initiative’ to export 250,000 tons of rice to thePhilippines. Experts at CGD then urged that Japan not only re-export its 1.5million tons of imported stocks, but that, on a one-time basis, it also donate itsrequired 2008 MAFF purchases of 580,000 tons to the WFP and ship itdirectly to third countries (Slayton and Timmer, 2008). This would have savedJapan on double freight and handling costs, prevented a further build-up instocks in Japan, which were costing $144 million per year to store (USDA,2006), and would have satisfied a long-sought Japanese goal. While the sugges-tion was endorsed by a Washington Post editorial (Washington Post, 2008b),it does not appear that the US made this proposal to Japan.
The Epilogue
Ultimately the Philippines did not get the 250,000 tons of rice it requested fromJapan and Tokyo failed to deliver on its promise of exporting ‘over 300,000tons’ as part of its contribution to alleviating the world food crisis. For reasonsthat are entirely unclear, Japan’s offer prices to the Philippines were high,resulting in protracted negotiations. Once NFA had covered its immediateneeds from Viet Nam in early June, Manila no longer needed the rice held byJapan. Reportedly, a number of other countries requested that Japan providerice as food aid, but Tokyo did not make its excess stocks available to them.
Rather than playing a leadership role in helping to solve the world foodcrisis and lessen the huge expense created by its rice holdings, the Japanesegovernment refused to use its excess stock as food aid for reasons that areentirely unclear. Quite possibly its inaction was because the idea of releasing itsstocks had not been developed internally and/or Japanese bureaucrats resentedthe external pressure. In any case, once the public spotlight was off it, Japan’srice exports declined from 122,000 tons in 2007 to less than 117,000 tons in2008. Rather than alleviating world suffering by re-exporting its excess ricestocks, MAFF continued to dispose of its imported rice inventory at highlysubsidized prices to its domestic feed industry.30 Clearly the local feed indus-try’s clout trumped any domestic interest in using the unwanted rice stocks tohelp feed the world’s poor.
The US government, however, played a key role in ‘pricking the ricebubble’ that was gripping the world market in the spring of 2008. The policy
THE ‘DIPLOMATIC CROP’ 331
ES_RC_9-8 18/8/10 20:23 Page 331

embraced by the Bush Administration was made in the face of opposition fromthe US Rice Federation and was made quickly – indeed, at what equates towarp speed in Washington, DC.
Two days after the Philippines disclosed that it was discussing with Japanthe possibility of receiving 200,000 tons of imported rice, Thai exportersresumed their practice of issuing daily export quotations.31 Export priceindications began to slide the following week and gapped $40/ton lower thefirst week of June with the news that the Thai government was offering to sellits stocks to the Philippines. With the news that the Philippines had covered itsneeds in Viet Nam and that country had lifted its export ban, world pricescollapsed further as the market psychology had completely changed.
332 POLICY RESPONSES IN THE DEVELOPED COUNTRIES
ES_RC_9-8 18/8/10 20:23 Page 332

Appendix
Table 16.9 US production and exports (thousand tons)
Crop year Production Exports Crop year Production Exports
Rough Milled Quantity As % Rough Milled Quantity As % production. production
1930 917 642 136 21 1970 3801 2796 1461 52 1931 911 637 140 22 1971 3890 2838 1804 64 1932 850 595 81 14 1972 3875 2828 1726 61 1933 769 538 45 8 1973 4208 3034 1604 53 1934 797 558 58 10 1974 5098 3667 2194 60 1935 805 564 38 7 1975 5824 4099 1732 42 1936 1017 712 51 7 1976 5243 3781 2097 55 1937 1090 763 151 20 1977 4500 3120 2270 73 1938 1072 750 151 20 1978 6039 4271 2431 57 1939 1103 772 142 18 1979 5983 4298 2716 63 1940 1111 778 179 23 1980 6632 4810 3064 64 1941 1048 733 208 28 1981 8287 5979 2695 45 1942 1319 923 221 24 1982 6967 4960 2222 45 1943 1327 929 224 24 1983 4522 3215 2267 71 1944 1405 983 324 33 1984 6296 4382 1960 45 1945 1391 974 364 37 1985 6120 4332 1885 44 1946 1474 1032 390 38 1986 6049 4307 2719 63 1947 1597 1118 415 37 1987 5876 4109 2289 56 1948 1736 1215 457 38 1988 7254 5186 2786 54 1949 1849 1294 515 40 1989 7007 5087 2537 50 1950 1761 1233 418 34 1990 7081 5098 2331 46 1951 2091 1463 764 52 1991 7228 5096 2128 42 1952 2186 1530 798 52 1992 8149 5704 2515 44 1953 2397 1678 721 43 1993 7081 5053 2544 50 1954 2912 2038 453 22 1994 8971 6384 3286 51 1955 2536 1775 593 33 1995 7887 5628 2694 48 1956 2243 1570 1192 76 1996 7783 5453 2488 46 1957 1947 1363 582 43 1997 8301 5750 2755 48 1958 2030 1421 627 44 1998 8367 5798 2730 47 1959 2433 1703 928 54 1999 9345 6502 2804 43 1960 2477 1756 919 52 2000 8658 5941 2590 44 1961 2459 1763 936 53 2001 9764 6714 2954 44 1962 2996 2133 1119 52 2002 9570 6536 3860 59 1963 3188 2295 1385 60 2003 9068 6419 3310 52 1964 3318 2386 1387 58 2004 10,540 7462 3496 47 1965 3460 2497 1418 57 2005 10,108 7105 3661 52 1966 3856 2805 1719 61 2006 8827 6267 2923 47 1967 4054 2950 1816 62 2007 8999 6344 3349 53 1968 4723 3459 1729 50 2008 9241 6515 2993 46 1969 4168 3003 1786 59
Note: For crop years 1930–1940, milling rates are assumed to be 70 per cent. Exports are converted from barrelsusing 162 pounds/barrel for years 1930–1936.Source: For production, ‘The US Rice Industry’ by USDA/ERS for 1930–1958; USDA/NASS ‘Quick Stats’ for1959–2008. For exports, ‘The Rice Situation’ by USDA/BAE for 1930–1936, ‘1936–1960 Rice Situation’ byUSDA/ERS for intervening years to 1959; 1960–2008 from ‘Production, Supply and Demand Database Online’ ofUSDA/FAS
THE ‘DIPLOMATIC CROP’ 333
ES_RC_9-8 18/8/10 20:23 Page 333

Table 16.10 US rice exports by programme (thousand tons)a
Fiscal PL 480b Section Food Food CCC Total EEP c Total Other Total Gov’t.year 416 (b) for for African food programmes exports programmes
Education Progress relief aid specifiedd %
1975 747 0 0 0 0 747 0 747 1467 2214 341976 509 0 0 0 0 509 0 509 1374 1883 271977 676 0 0 0 0 676 0 676 1585 2261 301978 502 0 0 0 0 502 0 502 1695 2197 231979 442 0 0 0 0 442 0 442 1891 2333 19
1980 500 0 0 0 0 500 0 500 2359 2859 171981 320 0 0 0 0 320 0 320 2677 2997 111982 332 0 0 0 0 332 0 332 2444 2776 121983 429 0 0 0 0 429 0 429 1780 2209 191984 366 0 0 0 49 415 0 415 1797 2212 19
1985 500 0 0 0 180 680 0 680 1228 1908 361986 411 0 0 0 0 411 23 434 1803 2237 191987 370 60 0 0 0 430 28 458 1954 2412 191988 338 29 0 0 0 367 120 488 1637 2125 231989 355 0 0 0 0 355 20 375 1875 2250 17
1990 276 0 0 0 0 276 0 276 2222 2502 111991 210 4 0 0 0 214 76 290 2136 2418 121992 229 0 0 16 0 245 358 603 1669 2281 271993 199 0 0 137 0 336 278 614 2188 2713 221994 222 0 0 10 0 232 46 279 2166 2438 11
1995 196 0 0 14 0 209 113 322 3406 3767 91996 179 0 0 12 0 191 0 191 2630 2831 81997 115 0 0 14 0 129 0 129 2436 2564 51998 178 0 0 11 0 189 0 189 3124 3315 61999 542 0 0 45 0 587 0 587 2500 3076 19
ES_RC_9-8 18/8/10 20:23 Page 334

2000 209 147 0 37 0 393 0 393 2923 3315 12
2001 144 30 22 30 0 231 0 231 2835 3066 82002 241 56 32 27 0 356 0 356 3187 3543 102003 263 0 0 47 0 310 0 310 4169 4478 72004 129 0 29 55 0 214 0 214 3484 3699 6
2005 126 0 3 21 0 150 0 150 4108 4258 42006 53 0 15 28 0 96 0 96 3928 4024 22007 97 0 28 11 0 136 0 136 3180 3316 42008 78 0 14 16 0 108 0 108 3938 4046 3
Note: a Exports (programme and non-programme) are reported on a product-weight basis. Programme shipments are assigned appropriate fiscal years. b Titles I, II, and III. c Sales, not actualshipments. d Adjusted for estimated overlap between CCC export credits and EEP shipments. Fiscal year 2008 data are preliminary and overall data as of February 2009. Also, fiscal year1996 EEP figure was incorrectly listed as 23,000 tons, but adjusted to zero based on conversations with USDA/FAS.Source: www.fsa.usda.gov; www.fas.usda.gov.
ES_RC_9-8 18/8/10 20:23 Page 335

Table 16.11 US government outlays on rice ($ millions)
Fiscal year Domestic net Export Exports food Subtotal Totaldirect outlays subsidies aid a
1955 �10 0 4 4 �61956 19 0 48 48 671957 65 0 199 199 2641958 18 0 59 59 771959 32 5 36 40 721960 28 12 98 110 1371961 11 19 101 101 1311962 �2 30 83 83 1111963 20 24 113 113 1571964 13 39 117 117 1691965 12 38 95 95 1451966 10 42 61 61 1121967 8 22 140 140 1701968 9 2 134 134 1451969 43 3 171 171 2171970 25 14 168 168 2061971 24 18 168 168 2091972 �20 25 215 215 2201973 0 22 244 244 2661974 15 * 317 317 3321975 0 0 285 285 2851976 206 0 242 242 4481977 145 0 164 164 3091978 �66 0 149 149 831979 50 0 136 136 1861980 �76 0 194 194 1181981 24 0 169 169 1931982 164 0 117 117 2801983 664 0 130 130 7941984 333 0 129 129 4621985 990 0 172 172 11621986 947 2 86 86 10331987 906 1 84 84 9901988 128 13 101 101 2291989 631 226 150 150 7811990 501 0 105 105 6061991 661 4 105 109 7701992 569 23 131 154 7231993 633 13 87 100 7331994 801 2 116 118 9191995 449 5 50 55 5031996 454 0 80 80 5341997 479 0 60 60 5391998 747 0 72 72 8201999 1801 0 185 185 19862000 1371 0 100 100 14702001 1423 0 53 53 14762002 1085 0 81 81 11662003 1279 0 82 82 13612004 1130 0 69 69 11992005 473 0 58 58 5312006 605 0 31 31 6362007 337 0 36 36 3732008 301 0 55 55 356
Note: * = Less than $50,000. a Includes long-term credit sales.Source: Mears (1975) for prior to 1961 and reported as USDA (CCC) outlays; Schnepf and Just (1995) for1961–1989; USDA/FSA and FAS for 1990–2008
336 POLICY RESPONSES IN THE DEVELOPED COUNTRIES
ES_RC_9-8 18/8/10 20:23 Page 336

Notes1 G-to-G contracts accounted for 2.1 million tons or 41 per cent of all exports by
Thailand, Burma and Pakistan in 1982 and this level increased in 1983 (Slayton,1984).
2 Unfortunately, the Thai government helped to disturb the market by its ill-fatedApril 2008 push to revive a proposed cartel of rice-exporting countries and couldhave helped to lessen the increase in world prices by releasing government-ownedstocks. Unless otherwise noted, all quantities referenced in this chapter are on amilled rice basis and in metric tons.
3 Under the original legislation (which has been amended many times), there weretwo programmes – Title I and Title II. US commodities were exported via Title Iunder long-term dollar concessional credit sales. These might, for example, be aloan involving an initial grace period of say five years during which no repaymentswere owed and subsidized interest rates for repayments over an extended period ofas much as 35 years. Under Title II, the commodities were provided as a grant.
4 Non-recourse loans have long been a key support measure for US farmers. Farmersuse their crop as collateral for the loan that can be repaid within nine months. Atthe end of that period, they must decide either to repay the loan or forfeit thecommodity to USDA. If the farmer forfeits his crop, he retains the loan proceedsand the government has ‘no other recourse’ for repayment. With ‘marketing loan’,part of the repayment amount can be ‘forgiven’ if world prices were calculated byUSDA to be below the initial loan amount.
5 ‘Measured in constant dollars … food aid levels since the mid-1960s havedecreased substantially. From their peak in the mid-1960s, they had declined byhalf by the mid-1970s; they had declined by half again by the mid-1980s; and bythe mid-1990s, they had declined by another third’ (USAID, 1998).
6 Growers in Texas and Louisiana are capable of producing a smaller second, or‘Ratoon’, crop from the roots of the rice plants that remain after combining.
7 To produce sufficient supplies of a particular crop, USDA calculated the amount ofland that would need to be planted and on which it would provide support. An‘acreage allotment’ was an individual farmer’s share of the national target andwould be based on historical production levels (Childs et al, 1994).
8 Through the 1950s, commercial exports were dominated by sales to Cuba. In themarketing year ending 31 July 1959, the US exported over 185,000 tons of rice toCuba. This came to an end in 1960 when relations between the two countriesworsened and Cuba stopped buying US rice (Reid and Gaines, 1974).
9 Senator Allen Ellender was chairman of the Agriculture Committee, 1951–1953 and1955–1971. Wilbur Mills was chairman of the House Ways and Means Committee,1957–1975. Otto Passman was chairman of the pivotal House Appropriationssubcommittee on foreign aid from 1954 until 1976. Other rice industry stalwartsincluded Senator John McClellan of Arkansas who served as chairman of theCommittee on Appropriations, 1972–1977. According to personal communicationswith J. P. Gaines (the RMA executive vice-president, 1962–1976), House Agriculturecommittee members Clark Thompson (rice subcommittee chairman) from Texas andE. C. Gathings of Arkansas also played influential roles on behalf of the industry.
10 In the decade beginning in 1967, only in 1972 did Thailand export more rice thanthe US. The two countries alternated in the number one position during 1977–1980.Thailand regained the coveted position in 1981 and has never relinquished it.
THE ‘DIPLOMATIC CROP’ 337
ES_RC_9-8 18/8/10 20:23 Page 337

11 Gabbert served as RMA’s chief executive officer from 1976 until 1988.12 In fiscal year 1974, rice accounted for 58 per cent of the Title I budget. As wheat
availability improved, rice’s share fell back to 38 per cent of the next year’s budget.13 The decline in PL 480 rice shipments was, at least in part, due to reduced funding
for food aid in general, especially those made under Title I. Beginning in 1956through fiscal year 1980 and in 1984, USDA operated the GSM-5 programmewhere it provided direct loans to overseas buyers of agricultural commodities. Forbudget austerity reasons, the programme was replaced with federal export creditguarantees to US banks. Under the GSM-101 programme, which was in operationduring 1979–1981, USDA provided a guarantee against non-commercial risk suchas import embargoes, freezing of foreign exchange, revolutions and war. In 1981,coverage for commercial risk (the inability to repay for economic reasons) wasadded under GSM-102. GSM-102 covered loans that provided up to three years offinancing. In 1986, the GSM-103 programme was implemented, generally guaran-teeing loans with repayment periods exceeding three years, but not more than tenyears.
14 Government programmes accounted for almost 36 per cent of all exports in fiscalyear 1985.
15 Direct net outlays for rice farmers, which had averaged $435 million annuallyduring five-year period prior to the introduction of the marketing loan, soared to$623 million per year in the each of the two subsequent five-year periods (fiscalyears 1986–1990 and 1991–1995).
16 The GSM-102 credits were part of a diplomatic tilt to Iraq in its war with Iran,which lasted from September 1980 until August 1988. Iraq was extended its firstGSM-102 credit guarantees in 1983, just before the US re-established diplomaticrelations with that country. Thanks in large measure to the credit guarantees, USexports to Iraq doubled from 214,000 tons per annum in calendar years1980–1983 to 439,000 tons averaged during the balance of the decade. As a result,Iraq was the largest market for US rice in the late 1980s.
17 The programme started in May 1985, but the volume of rice moving under EEPwas limited during the first six years of the programme – only 191,000 tons in totalduring fiscal years 1985–1990. By the end of the programme, almost 1.1 milliontons of rice was shipped under EEP.
18 The export volumes using export credit guarantees also declined during the 1990s,reaching a low in fiscal year 1997 of only 89,000 tons, with the result that less than6 per cent of all rice exports moved under various government programmes. Thiscompared to 18 per cent in fiscal year 1995 and was ‘down from 23 per cent infiscal 1994 and well below 41 per cent in 1993 and 43 per cent in 1992’ (USDA,1995).
19 All quantities agreed to by Japan were on a brown-rice basis.20 Whereas No 2/4%LG prices turned lower in May 2008, California export prices
continued to climb, peaking only almost one year later in April 2009.21 Politically this was unacceptable from the Indonesian side, which was publicly
saying that it had a rice surplus in order to calm the domestic market. Similarly, thegovernment in the Philippines was at that time issuing public statements that it hadeverything under control.
22 The Washington Post, for example, ran two editorials (Washington Post, 2008a;Washington Post, 2008b) and an op-ed piece (Mallaby, 2008) on the subject withina span of eight days.
338 POLICY RESPONSES IN THE DEVELOPED COUNTRIES
ES_RC_9-8 18/8/10 20:23 Page 338

23 The USA Rice Federation was formed by the 1994 merger of the RMA, USA RiceCouncil and the US Rice Producers’ Group.
24 The descriptions of the meetings on 14 and 23 May are based on contemporaneousinterviews with the participants and/or their staff.
25 According to a Japanese participant in the meeting, no decision had been made asof that date on Indonesia’s food aid request.
26 This proved to be an erroneous assumption as the Japanese initially set a relativelyhigh price and the negotiations dragged on as declining world values made the priceunattractive.
27 The US and others were later discouraged by Japanese Prime Minister Fukuda’sstatement on 3 June at the FAO food security conference in Rome that Japan would‘release in the near future over 300,000 tons of imported rice’ to the world market.Notwithstanding this pledge, ultimately the negotiations with the Philippines wereinconclusive and Japan’s exports in 2008 declined to below 117,000 tons.
28 Subsequently, the US side indicated that Japan proposed to sell 200,000 tons of itsimported rice to the Philippines at CNF$840, but that the average imported pricesduring 2005–2007 for US material ranged from $431–580, while the Thai-Viet ricecame in at about $100–175 below these levels.
29 Japan took the position that it had tried to fulfil the commitment, but that it hadrefrained from buying in its April tender for fear of propelling world prices higher.(Reportedly, Thai 100%B was offered in its 22 May tender at over $1300/tonFOB.) It also argued that it had exhausted its budget for imports and, that in anycase, the time for buying its 2007 commitment had already lapsed. According tothe trade, Japan subsequently purchased the equivalent of 58,000 tons of US riceand Washington decided not to press Tokyo further.
30 Prior to 2004, the Japanese government released only limited quantities ofimported rice to its domestic feed industry. In the fiscal year ending March 2004,only 13,000 tons of rice was used in compound feed. The following year thisclimbed to 286,000 tons and then rose only modestly in fiscal year 2005. With itsinventory of imported rice ballooning, Japan further increased its disposal efforts inJuly 2006. Imported rice stocks, nonetheless, reached 1.9 million tons in October2006. From this peak, holdings declined to 1.5 million tons in October 2007 asfeed usage surged to an unprecedented 558,000 tons in fiscal year 2007. Despitethe world rice crisis, Japan still disposed of 468,000 tons of imported rice as animalfeed in the following Japanese fiscal year. As a result, its imported rice stocks onOctober 2008 fell to 970,000 tons (USDA-FAS, various years; personal communi-cations with USDA’s Tokyo office).
31 The leading Thai exporters began to refuse to offer daily price indicationsbeginning in late February. On 21 May 2008, they resumed the practice. CapitalRice, the largest exporter, quoted 100%B at $980 FOB as of that date, while AsiaGolden Rice was showing $920.
AcknowledgementsI would like to thank Mark Simone, Mark Rouse and Nathan Childs of USDA, as wellas J. Stephen Gabbert, David Dawe, Wally Falcon and Peter Timmer for helpfulcomments and data. The views, and mistakes, expressed are my own.
THE ‘DIPLOMATIC CROP’ 339
ES_RC_9-8 18/8/10 20:23 Page 339

ReferencesChilds, N., Wailes, E., Livezey, J. and Setia, P. (1994) ‘The US Rice Industry’, AER-700,
Economic Research Service, USDA, Washington, DCDethloff, H. (1988) A History of the US Rice Industry, 1685–1985, A & M University
Press, TexasHolder, S. H. Jr and Grant, W. R. (1979) ‘US Rice Industry’, AER-433, Economics,
Statistics and Cooperative Service, USDA, Washington, DCMallaby, S. (2008) ‘Rice and baloney’, The Washington Post, 19 May, www.
washingtonpost.com/wp-dyn/content/article/2008/05/18/AR2008051801917.html Mears, L. A. (1975) ‘The political economy of rice in the United States’, Food Research
Institute Studies, vol XIV, no 4, pp319–357Morgan, D. (1979) Merchants of Grain, Viking Press, New YorkMorrison, W. M. and Villarreal, M. A. (1991) ‘Japan-US trade: A chronology of major
events, 1980–1990’, Congressional Research Service Report for Congress, 20 June,Washington, DC
New York Times (2008) ‘Warehouse stores restrict rice sales’, New York Times, 24 April, www.nytimes.com/2008/04/24/business/24rice.html?_r=1&adxnnl=1&ref=business&pagewanted=print&adxnnlx=1255802457-xBAJWFhSuRBB6EloWro4LA
Reid, W. M. and Gaines, J. P. (1974) Seventy-five Years with the Rice Millers’Association, 1899–1974, Rice Millers’ Association, Washington, DC
Schieffer, J. T. (2008) ‘Statement by US Ambassador to Japan J. Thomas Schieffer:Responding to Global Food Price Crisis’, 22 May,http://tokyo.usembassy.gov/e/p/tp-20080522-73.html.
Schnepf, R. D. and Just, B. (1995) ‘Rice: Background for 1995 farm legislation’,AER-713, Economic Research Service, USDA, Washington, DC
Slayton, T. (1984) ‘Rice trade and economy of selected Asian countries, 1970 to thepresent’, Foreign Agriculture Circular FG-15-84, Foreign Agricultural Service,USDA, Washington, DC
Slayton, T. and Timmer, P. (2008) ‘Japan, China and Thailand can solve the rice crisis –but US leadership is needed’, CGD Note, Center for Global Development, May
Timmer, C. P. and Slayton, T. (2008) ‘Kudos to Tokyo and Washington on rice sales, Et Tu, Thailand and India?’, 19 May, http://blogs.cgdev.org/globaldevelopment/2008/05/kudos-to-tokyo-and-washington.php
USAID (United States Agency for International Development) (1998) ‘US food aid andsustainable development: Forty years of experience’, USAID Evaluation Highlights#63, USAID, Washington, DC
USA Rice Federation (2008a) ‘Domestic Usage Report 2006/07’,www.usarice.com/doclib/188/231/3588.pdf
USA Rice Federation (2008b) ‘Daily up-to-the-minute news on issues and activities’,www.usarice.com/doclib/122/3213.pdf
USA Rice Federation (2009) ‘Domestic Usage Report 2007/08’,www.usarice.com/doclib/188/231/4135.pdf
USDA (United States Department of Agriculture) (1991) World Grain Situation &Outlook, Supplement 6-91, Foreign Agricultural Service, USDA, Washington, DC
USDA (1995) Rice Situation and Outlook, United States Department of AgricultureEconomic Research Service, December, Washington, DC
340 POLICY RESPONSES IN THE DEVELOPED COUNTRIES
ES_RC_9-8 18/8/10 20:23 Page 340

USDA (1999) Rice Situation and Outlook, United States Department of AgricultureEconomic Research Service, November, Washington, DC
USDA (2006) ‘MAFF needs to reduce stocks of imported rice, Board of Audit says’,Foreign Agricultural Service GAIN Report JA6060, USDA,www.fas.usda.gov/gainfiles/200611/146249430.pdf
USDA (2009) ‘USDA Rice Situation and Outlook Yearbook dataset’, EconomicResearch Service, USDA, http://usda.mannlib.cornell.edu/usda/ers/89001/TABLE26.xls
United States House of Representatives, Committee on Agriculture (1986) ‘Review ofJapan’s policy concerning the importation of rice’, (Serial No. 99-49), Washington,DC, US Government Printing Office
Washington Post (2008a) ‘Release the rice’, 19 May, Washington Post, www.washingtonpost.com/wp-dyn/content/article/2008/05/18/AR2008051801897.html
Washington Post (2008b) ‘Release the rice (II)’, 27 May, Washington Post,www.washingtonpost.com/wp-dyn/content/article/2008/05/26/AR2008052601780.html
THE ‘DIPLOMATIC CROP’ 341
ES_RC_9-8 18/8/10 20:23 Page 341

ES_RC_9-8 18/8/10 20:23 Page 342

Part VII
CONCLUSION
ES_RC_9-8 18/8/10 20:23 Page 343

ES_RC_9-8 18/8/10 20:23 Page 344

17
Can the Next Rice Crisis be Prevented?
David Dawe
Food prices have always fluctuated, and indeed it is important that they do so,at least to some extent, for a variety of reasons (for example to smooth theavailability of supplies over time at a reasonable cost). But there are substantialcosts to food price volatility, both economic and political (Timmer, 1989;Dawe, 2001; Myers, 2006), and the rice crisis brought these costs into sharpfocus. These costs suggest that the optimal level of price stabilization is non-zero.
Indeed, given the costs of fluctuations in staple food prices, Asian govern-ments view management of price volatility as a key policy challenge in the riceeconomy. This is clearly true for developing countries, where rice accounts fora large share of farm income and consumer expenditure, but it is even true inJapan, the most developed country in the region, where much of the reason forthe very high level of prices is the desire for price stabilization (Timmer, 1993).The recent rice crisis will, if nothing else, strengthen the resolve to manage foodprices and reduce reliance on world markets.
Managing food price volatility is likely to become increasingly importantin the near future given the new linkages between oil and maize prices. Thisnew linkage is due to several factors that have converged in the past few years.While technologies that can convert grains to fuel have existed for some time, itis only recently that they have become profitable enough that maize can be
ES_RC_9-8 18/8/10 20:23 Page 345

considered a realistic choice for fuel production. In addition to improvementsin technology, biofuel policies (for example mandates, tariffs) have also playeda key role by lowering the level of oil prices at which maize becomes competi-tive as a source of fuel. Finally, developments in supply and demand in worldoil markets also play a role: if oil prices are at a relatively high level in themedium term due to continued economic growth in developing countries andincreased difficulties in finding new cheap sources of supply, this makes iteasier for grains to be competitive as a source of fuel.
Because biofuels represent additional demand for grain, it is widelyacknowledged that the linkage between agricultural and energy markets willlead to higher grain prices than would otherwise be the case. This is especiallyimportant given that cereal yield growth rates (at least for rice and wheat) havebeen declining and that rapid economic growth in developing countries is likelyto continue, leading to diversified diets and additional feed grain demand.There is thus ample reason to believe that world grain prices will be higher inthe next decade than they were in the late 1990s and early years of this century.
Perhaps more important than the additional demand, however, is the factthat oil prices have historically been much more volatile than grain prices (seeTable 17.1). If grain prices are now linked to oil prices, then we would expectthat grain prices will be more volatile than they have been historically, andindeed, volatility in grain markets has increased in the past two to three years.If world grain prices remain volatile, this will present a major policy challengeto developing countries that want to protect their consumers from price surgesthat have serious effects on income distribution, investment and nutritionaloutcomes. The different policy responses used by different governments duringthe world rice crisis provide some lessons worth considering.
Domestic policy responses during the world rice crisis
As shown in the country chapters, changes in domestic rice prices during thecrisis varied widely across countries within Asia. Domestic prices wererelatively stable in the three largest countries (China, India and Indonesia) andin the developed countries (Japan and Republic of Korea), but prices surged in
346 CONCLUSION
Table 17.1 Volatility of real (inflation-adjusted) commodity prices (%)
Frequency Annual MonthlyMeasure DLMA DLMA DLMA DLMA 2006–
1990–2005 2006–2008 1990–2005 April 2009
CommodityPetroleum 21 29 19 27Rice 14 42 12 26Wheat 14 33 13 26Maize 13 34 12 25
Note: DLMA (deviation from lagged moving average) is the average absolute value (over time) of the rollingpercentage difference between the annual or monthly price and a two-year lagged moving average. Source: Raw data from IMF
ES_RC_9-8 18/8/10 20:23 Page 346

Bangladesh, Thailand, Viet Nam, Cambodia and the Philippines, as well as inseveral West African countries.
There are many factors that could have led to different outcomes acrosscountries. Certainly stabilization policies had an impact, but outcomes mayalso have been influenced by initial baseline price levels, the size of cropharvests, and the ability to enforce policies that depend on closing borders.
While acknowledging the potential importance of all these factors, stabi-lization policies were likely to have been the most important determinant ofdomestic prices in early 2008. First, world prices soared above domesticprices in all of the countries analysed here (other than Japan, where initialdomestic prices were very much higher than world prices). Thus, even ifprices were initially high in some countries, there should still have beenupward pressure on domestic prices from the world market. Second, cropharvests appear to have been good in all of these countries in early 2008.Third, these countries seem to be able to enforce price differentials whendesired: even Indonesia, whose archipelagic nature makes border controldifficult, was able to keep domestic prices 20–50 per cent above world pricesduring 2006 and 2007.
Thus, a further look at policies seems warranted. Clearly, policies arecomplex and differ from one country to another. But one particularly impor-tant policy is the extent to which private sector traders are free to makedecisions regarding the quantity of exports or imports. Among the sevenlargest developing countries examined in this book (including six of the tenlargest developing countries in the world), Thailand and Bangladesh are theonly two that allow the private sector to play such an equilibrating role. This isnot to say that either country has followed a completely free trade policy: inrecent years, Thailand has been active in procuring rice from farmers at pricessubstantially above those that would prevail in a truly free market. Bangladesh,a rice importer, also varies the level of the tariff in response to world marketconditions. Nevertheless, given these constraints, traders are free to export orimport as much as they please. This cannot be said for the other five largecountries discussed here.
What is the consequence of allowing private traders to choose the level ofimports or exports? In essence, this allows domestic prices to adjust fully toworld prices, after taking account of tariffs, transport costs and quality. Ifdomestic prices are lower than world prices, net exports will increase (and viceversa) until equilibrium is re-established via private sector arbitrage. Thus, theincrease in domestic prices in Thailand was approximately the same as theincrease in world prices. In Bangladesh, the increase in domestic prices wassubstantial, but still less than the increase in world prices; the explanation hereis that net exports for Bangladesh are bound at zero due to market imperfec-tions. Because Bangladesh is a more or less consistent importer, there are notestablished mechanisms for assessing the quality of Bangladeshi rice for export;further, it will take time for Bangladeshi private traders to develop a reputationamong international traders that will allow substantial quantities of exports
CAN THE NEXT RICE CRISIS BE PREVENTED? 347
ES_RC_9-8 18/8/10 20:23 Page 347

from that country. In addition, Bangladesh also banned exports from earlyMay. Thus, even when the world price rose above the domestic price in theshort run, there were no exports. Instead, the domestic price was determinedby domestic supply and demand, as opposed to world markets. In this particu-lar case, Bangladesh suffered some domestic production shortfalls due toflooding and typhoon damage in late 2007 that contributed to increases indomestic prices, but an excellent crop in April contributed to a subsequenteasing of domestic prices.
But among the five countries where the government determines thequantity of international trade, why did prices increase substantially in two ofthem (the Philippines and Viet Nam) but not in the other three (China, Indiaand Indonesia)? The most likely explanation here would seem to be that thetwo countries where domestic prices increased were the same two countriesthat were directly involved in the trades that sent world prices soaring inMarch and April.
To understand why this should make a difference, it is first important torealize that neither the Philippines nor Viet Nam were short of supplies duringthis time. While government rice stocks were a bit on the low side in thePhilippines, private sector stocks account for most of total stocks, and thesestocks were ample. Domestic production in 2008 was forecast to be substan-tially above that in 2007, and there were no adverse climatic shocks at the time(there was a 6 per cent increase in domestic production for the first half of2008 compared to the previous record, reached in the first half of 2007).Finally, there were large import contracts being negotiated (and NFA alwayssells its imports into the domestic market at below-market prices). Thus,domestic supplies were adequate in quantity terms. As regards Viet Nam, it isthe world’s second largest exporter with an exportable surplus that is typicallyabout 20 per cent of domestic production, and the export bans it had in placeshould have ensured ample domestic supplies.
Since supplies were ample in both countries, and since neither one allowsthe private sector to fully arbitrage prices between domestic and internationalmarkets, it seems that the most likely explanation for the surge in domesticprices was speculation and panic on the part of domestic farmers, traders andconsumers in those countries. The trades on the international market betweenthe Philippines and Viet Nam in early 2008 were well known to the generalpublic in the Philippines, and in Viet Nam were known at least to thoseinvolved in the rice trade. Indeed, even traders who deal primarily in non-ricecommodities shifted to rice, speculating on further price increases. While inter-national rice traders in China, India and Indonesia were certainly well aware ofthe transactions between the Philippines and Viet Nam, the general populationin those three countries most likely would be less aware of the trades, andwould thus have less reason to panic or speculate. Large government stocks inboth China and India probably also served to discourage speculation, andIndonesia benefited from a good harvest and the fact that the timing of its mainharvest coincided with the rice price surge on world markets. While there was
348 CONCLUSION
ES_RC_9-8 18/8/10 20:23 Page 348

speculative activity in Indonesia (T. Slayton, personal communication, 2008),apparently it was not widespread enough to cause a surge in prices.
In conclusion, trade policy played an important role in moderating theimpact of soaring world prices on domestic rice prices in several countries, butnot all. The fact that trade policy muted the impact on poor consumers in threelarge developing countries suggests that a closer look at the costs and benefitsof trade policy as a complement to safety nets is warranted.
Trade policy as a complement to safety nets
The standard policy advice from most quarters is that the best way to protectpoor consumers from sudden increases in prices is by providing safety nets ofone sort or another.1 Although there are many definitions, such safety nets arebasically ‘non-contributory transfer programs targeted in some manner to thepoor and those vulnerable to poverty and shocks’ (Milazzo and Grosh, 2008).There is a reasonably strong consensus that such approaches are far superior totrade policy instruments such as lowering import tariffs, increasing exporttaxes or instituting export bans in dealing with surges in world market prices.Despite this consensus, many governments used trade policy extensively duringthe world food crisis in addition to safety nets (Demeke et al, 2009).
Both trade policy and targeted safety nets have advantages and disadvan-tages, but much of the discussion surrounding the use of trade policy has failedto consider some of its advantages and has overemphasized its disadvantages.While safety nets are appropriate in many cases, they are not a panacea, and inmany cases trade policy might play an effective role in minimizing the impactsof price fluctuations on poor consumers and farmers, especially in poorcountries.
There is a large literature on safety nets that cannot be summarized here(Grosh et al, 2008). However, practical experience makes clear that effectivesafety nets are difficult to implement for a variety of reasons. It is often hard toidentify the poor, and even if the poor can be identified, it can be expensive toreach all of them. For example, given its poor targeting and losses due tocorruption, Olken (2006) found that a programme of food distribution to thepoor in Indonesia represented a net loss to social welfare, even after givingsubstantially more weight to the poor in society’s utility function.
There may also be community resistance to giving payments to one familythat is below some ultimately arbitrary threshold while another family that isbarely above that threshold does not get any benefits. Indeed, some communi-ties may seek to distribute the benefits relatively equally across households,reducing the efficiency of targeting. Safety nets may also create long-termadverse effects on incentives, as some families perceive the government to beprimarily a source of handouts. Safety nets that are self-targeting to the poor,such as guaranteed employment at a low wage, are the ideal solution, but it isnot always possible to implement such schemes. And even when it is possible,setting an appropriate wage level (not too high, not too low) can be a difficult
CAN THE NEXT RICE CRISIS BE PREVENTED? 349
ES_RC_9-8 18/8/10 20:23 Page 349

decision both in technical and in political terms. Further, safety nets may becaptured by the non-poor in times of crisis, as shown by Ravallion (2002) inArgentina, Bangladesh and India. Finally, safety nets have complex administra-tive and managerial requirements, and are very difficult to implement quicklyduring times of crisis. The ideal solution is to set up the safety net before thecrisis hits, but it can be difficult to gather political support for such anapproach when there is no immediate need. These arguments are not meant tosuggest that there is no role for safety nets in protecting the poor; only that theyhave important limitations. To put it bluntly, there are no examples ofcountries where safety nets made the world food crisis irrelevant to poorconsumers and producers (and it is unlikely that any conceivable design couldhave done so).
What about trade policy as a way to protect poor consumers and farmers?Governments around the world, especially in Asia, use trade policies to stabi-lize domestic rice prices. Some countries lowered import tariffs, while othersraised export taxes (or instituted export bans). Others simply maintainedgovernment monopolies on trade. Indeed, China, India and Indonesia allexperienced domestic rice price increases during the world rice crisis that weremuch less than those experienced on the world market or in neighbouringcountries. As described in the country chapters, all of these countries had traderestrictions that prevented domestic prices from rising substantially during2008, thus reducing the impact of the price surges on poor consumers withintheir own borders. Of course, other countries (the Philippines, Viet Nam) alsohad trade restrictions that were not effective.
There are at least four main objections to using trade restrictions as acomplement to safety nets. It is argued that:
1 trade restrictions reduce economic efficiency;2 trade restrictions are not targeted to the poor and thus waste scarce
resources;3 given the persistence of shocks to world prices, it is not possible to stabilize
domestic prices without substantial fiscal costs4 trade-based domestic stabilization policies destabilize the world market,
thus making it worse for consumers in other countries relative to thecounterfactual of no trade restrictions.
While all of these objections have merit, they are all overstated.In terms of economic efficiency, it is true that trade restrictions reduce
aggregate welfare in a short-run sense: in order to maximize economic welfareit is necessary to let prices fluctuate freely on a month-to-month basis, indeedeven day to day. This is true, however, only in a world without marketfailures. When prices fluctuate for reasons that are not due to changes intechnology and preferences, the information content of prices is reduced.Thus, price stabilization can reduce dynamic efficiency losses (Dawe, 2001).Indeed, Timmer (2002) estimates that the growth benefits of price stabiliza-
350 CONCLUSION
ES_RC_9-8 18/8/10 20:23 Page 350

tion in Indonesia during the 1970s and 1980s outweighed the costs, includingdeadweight losses.
It is also argued that trade restrictions are not targeted to the poor. This istrue, but it misses a key point. A policy to protect the poor should not be evalu-ated on whether it also delivers benefits to the non-poor, but rather on the costsof reaching the poor. If a there is a low-cost policy that delivers benefits to thepoor, and at the same time happens to deliver benefits to the non-poor at zeroor low marginal cost, then the benefits to the non-poor should not be consid-ered a disadvantage (unless society derives utility from reducing the income ofsome of its citizens). Instead, the policy should be evaluated on the basis of itstotal costs relative to the benefits delivered to the poor. A well-implementedtrade policy could have very low costs, and in an economy with reasonablywell-functioning markets, could deliver benefits to nearly all of the poor. Insuch cases where the policy is low cost, it makes sense to minimize the numberof poor people who are excluded from its benefits even if many non-poor alsoreap some benefits.
Another objection to price stabilization policies is that shocks to worldprices exhibit long-lasting persistence, so that stabilizing the domestic price at agiven level will incur substantial fiscal costs that are most likely to be muchgreater than any benefits. Again, this is true, but it assumes that the target priceremains unchanged from year to year. If the target price is allowed to adjust(but slowly) to changes in world prices, then domestic prices can follow thelong-run trend of world prices without being subject to sharp year-to-yearvariability, as shown in Figure 17.1 (which sets the domestic price equal to a
CAN THE NEXT RICE CRISIS BE PREVENTED? 351
Figure 17.1 World rice prices adjusted for inflation (monthly, January 1962 to April 2009) and a lagged five-year moving average
Source: Author’s calculations using raw data from IMF (2009)
3000
2500
2000
1500
1000
500
0
M1
1962
M1
1963
M1
1964
M1
1965
M1
1966
M1
1967
M1
1968
M1
1969
M1
1970
M1
1971
M1
1972
M1
1973
M1
1974
M1
1975
M1
1976
M1
1977
M1
1978
M1
1979
M1
1980
M1
1981
M1
1982
M1
1983
M1
1984
M1
1985
M1
1986
M1
1987
M1
1988
M1
1989
M1
1990
M1
1991
M1
1992
M1
1993
M1
1994
M1
1995
M1
1996
M1
1997
M1
1998
M1
1999
M1
2000
M1
2001
M1
2002
M1
2003
M1
2004
M1
2005
M1
2006
M1
2007
M1
2008
M1
2009
Year
200
8 U
S d
olla
rs p
er to
n
World rice prices Lagged 5 year moving average
ES_RC_9-8 18/8/10 20:23 Page 351

lagged five-year moving average of the world price). Other simple rules are alsopossible – the important thing is to be sure that the target price is not constantbut adjusts over time. Even if the target price adjusts, it is still inevitable that,given a large enough shock, the scheme will eventually collapse in the sensethat it will become bankrupt or will fail to prevent a surge in prices. But suchlong-run inevitability is not necessarily a relevant guide to policy: in the famouswords of Keynes, ‘in the long run we are all dead’. In the short or mediumterm, however, there can be important benefits to price stabilization if thescheme is well run.
Finally, it is also argued that trade-based domestic stabilization policiesshunt price instability from domestic markets to world markets. Again, this istrue. But instability must be absorbed somewhere when there are exogenousshifts in supply or demand in the world food economy. There are a few mainpossible shock absorbers: world market prices, stocks, safety nets or consumerand producer welfare. The policy chosen will determine which of thesevariables acts as the shock absorber.
Free trade is one possible option. This will force producers and consumersto bear the costs of price instability, but if enough countries participated in afree trade area that was well integrated in terms of information, transportationand communication, the price fluctuations that poor consumers would have tobear might be minimal. But there are political problems with such a solution;many countries simply do not want to implement free trade policies. Thismakes free trade a difficult choice for country A if country B might institute adhoc export restrictions. The WTO is an attempt to solve these coordinationproblems, but it has made very little progress in changing rice trade policies indeveloping Asia. Further, if there are still substantial price fluctuations underfree trade, then poor consumers and farmers will be the shock absorbers. Thisis clearly not optimal because the consequences can be permanent shocks tohuman capital even if the price shocks are only temporary.
Implementation or scaling-up of safety nets has a role to play, but as notedearlier they have many shortcomings and are not a panacea. It is possible toabsorb the shocks through changes in stock levels, and clearly there is a role forstocks in smoothing price fluctuations. It should be noted, however, thatnational stocks can be effective at altering domestic prices only in the presenceof trade barriers. Under free trade, stock releases will simply leak out to theworld market.2 In addition, stocks are expensive to hold, especially in tropicalcountries, so there are limits to the size of stocks that can be maintained in acost-effective manner. And the incentives to hold government stocks dissipateover time in the absence of crises. This leaves world market prices as a shockabsorber.
Ideally, world prices would exhibit little volatility, but, as noted earlier,shocks to supply and demand must be absorbed somehow. If the government incountry A uses domestic stabilization policies such as a variable import tariffthat decreases when world prices increase, this can help to stabilize domesticprices in A in the face of a world price shock. But the lower tariff in the face of
352 CONCLUSION
ES_RC_9-8 18/8/10 20:23 Page 352

higher world prices leads to an increase in demand from country A that servesto increase world prices relative to a counterfactual of no change in policy bycountry A. Thus, country A’s stabilization policy increases world market priceinstability for country B. Of course, if country B uses similar stabilizationpolicies, there is no need for this additional instability to be passed through todomestic producers and consumers in country B. The more countries thatimplement such policies, however, the more that world price instability willincrease, potentially causing problems for countries that do not implementstabilization policies. Excessive price volatility on world markets will alsoreduce the information content of those prices and make long-term trends insupply and demand more difficult to discern. Further, there are many instancesof price stabilization programmes being implemented very poorly in actualpractice. They can lead to systematic deviations of domestic prices from worldprices, crowding-out of private sector marketing agents, and corruption. Theseare real costs of domestic price stabilization programmes.
Thus, domestic price stabilization policies have drawbacks as well, just asdo the other alternatives. But ultimately, a choice must be made among severalimperfect policy options: there are no costless solutions. Given that all policyoptions have disadvantages, it is unlikely that exclusive use of any one optionwill be optimal. Domestic price stabilization schemes have some distinctadvantages: they can be implemented at low administrative cost (although thelow-cost options are not always used), and, by using the power of markets,they can reduce the number of poor people who are excluded from the benefits.And it arguably makes more sense for the world market to act as a shockabsorber (i.e. allowing domestic policies to exacerbate world market pricevolatility) than for domestic producers and consumers to be the shockabsorbers. Indeed, until 2008, world rice prices were relatively stable for morethan 20 years, even with the existence of domestic price stabilization policies ina large number of Asian countries. To the extent that one is worried about adecreased information content of world prices due to the implementation ofdomestic price stabilization, one possible solution would be to allow only thepoorest countries to implement such stabilization under the auspices of theWTO.
There is also no doubt that domestic price stabilization policies can beimproved (Dawe, 2007), and better stabilization policies might have allowedthe world rice market to avoid the 2008 price spike. Two major types ofimprovement would seem to be relatively easy to implement. First, the costs ofimplementing policies could be reduced by allowing a greater role for theprivate sector in international trade, subject only to a variable importtariff/export tax system. This would mean less reliance on governmentprocurement, storage and distribution, and it would mean that importdecisions were less likely to be made for non-transparent political reasons thatcan contribute to uncertainty among private traders.
Second, panic and hoarding would be less likely if government policieswere more predictable and less discretionary. This objective could be accom-
CAN THE NEXT RICE CRISIS BE PREVENTED? 353
ES_RC_9-8 18/8/10 20:23 Page 353

plished by using a variable tariff/export tax schedule that stipulates in advancethe tariff/tax as a function of the world price, as opposed to a system where thetariff/tax can be changed in an ad hoc manner at any time for any reason. Forexample, the government could state that the tariff on rice imports would beequal to 45 per cent if world prices are $300 per ton, 25 per cent if world pricesare $400 per ton, 10 per cent if world prices are $500 per ton, and so on (themagnitudes used are purely illustrative). The tariff rate (but not the tariffschedule) would be adjusted at the end of every month based on prevailingworld prices. Such a system would provide the private sector with much morepredictability while simultaneously lowering costs. The administrative costs ofimplementing such a system would be close to zero, while still protectingdomestic consumers and producers from fluctuations in world market pricesand domestic production shocks. Such a variable tariff would entail instabilityin tariff revenues that might be difficult to manage, especially if these tariffswere a substantial portion of government revenue. In many cases, however, thechanges in tariff revenue will be relatively small compared to the overallgovernment budget. And the costs of instability in government budgets must becompared with the costs of instability in the food intake of the poor.
Indonesia has used an export tax on palm oil to stabilize domestic cookingoil prices, but has not attempted a similar scheme for rice imports. Indeed,while such a system is WTO compatible for export taxes, a similar system forimport tariffs is not (Foster and Valdes, 2005). By contrast, ad hoc changes intariff rates are permitted under the WTO provided they remain under thebound rate. It would seem that some changes in the WTO might be desirable totreat export taxes and import tariffs in a similar manner: the current systemdiscourages predictability and adds to uncertainty in times of crisis.
Another alternative would be for importing and exporting nations toengage in long-term forward contracts at pre-agreed prices. Such contractswould serve to make the world market thinner and exacerbate world pricevolatility; in that sense, they are similar to domestic price stabilization. Theywould also need to take account of the fact that some of the international tradeis carried out by private firms, for example in Thailand. Nevertheless, long-term forward contracts would encourage exporters to increase production andprovide more reliable supplies to importing countries, provided that legaluncertainty surrounding contract enforcement could be kept to a minimum.
In conclusion, price volatility seems likely to continue in the medium termas long as there are linkages between grain and energy markets. Price volatilityhas real costs to the poor, and governments will continue to look for ways toreduce these costs. The optimal solution will vary from country to country, andwill most likely involve some combination of targeted safety nets, stocks andtrade policy. While trade policy is viewed by many as controversial, it seemswise to evaluate such programmes on the basis of their costs and benefits inspecific contexts rather than excluding them as an option on a priori grounds.
354 CONCLUSION
ES_RC_9-8 18/8/10 20:23 Page 354

Notes1 The discussion will primarily focus on protecting consumers from sudden price
surges, as opposed to protecting farmers from sudden price declines. This is becausesudden large increases in prices are more common than sudden large decreases(Deaton and Laroque, 1992). However, the arguments presented are equally applic-able to both increases and decreases in prices.
2 Regional or global stocks might address this problem in theory, but the practicalexperience with such schemes has not been heartening. For example, the ASEANrice reserve has formally existed since 1979 but has never been used in actualpractice.
ReferencesDawe, D. (2001) ‘How far down the path to free trade? The importance of rice price
stabilization in developing Asia’, Food Policy, vol 26, pp163–175Dawe, D. (2007) ‘Markets and policy: Instruments for cost-effective stabilization of
staple food prices in Asia’, paper presented at the meeting of the Governance ofAgricultural Commodity Markets Working Group and the High Council forInternational Cooperation seminar on Price Stabilization and Risk Management,January, Paris
Deaton, A. and Laroque, G. (1992) ‘On the behaviour of commodity prices’, Review ofEconomic Studies, vol 59, no 1, pp1–23
Demeke, M., Pangrazio, G. and Maetz, M. (2009) ‘Country responses to the foodsecurity crisis: Nature and preliminary implications of the policies pursued’,www.fao.org/fileadmin/user_upload/ISFP/pdf_for_site_Country_Response_to_the_Food_Security.pdf
Foster, W. and Valdes, A. (2005) ‘The merits of a special safeguard, price floor mecha-nism under Doha for developing countries’, paper prepared for the Workshop onManaging Food Price Instability and Risk, World Bank, Washington, DC, 28February–1 March
Grosh, M., Del Ninno, C., Tesliuc, E. and Ouerghi, A. (2008) ‘For protection andpromotion: The design and implementation of effective safety nets’, World Bank,Washington, DC
IMF (International Monetary Fund) (2009) ‘International Financial Statistics online’,IMF, Washington, DC, www.imf.org/external/data.htm
Milazzo, A. and Grosh, M. (2008) ‘Social safety nets in World Bank lending andanalytical work: FY 2002–2007’, World Bank SP Discussion Paper 0810, WorldBank, Washington, DC
Myers, R. J. (2006) ‘On the costs of food price fluctuations in low-income countries’,Food Policy, vol 31, pp288–301
Olken, B. (2006) ‘Corruption and the costs of redistribution: Micro evidence fromIndonesia’, Journal of Public Economics, vol 90, pp853–870
Ravallion, M. (2002) ‘Who is protected? On the incidence of fiscal adjustment’, WorldBank Working Paper, Washington, DC, http://imf.org/external/np/res/seminars/2002/POVERTY/MR.PDF
Timmer, C. P. (1989) ‘Food price policy: The rationale for government intervention’,Food Policy, vol 14, pp17–42
CAN THE NEXT RICE CRISIS BE PREVENTED? 355
ES_RC_9-8 18/8/10 20:23 Page 355

Timmer, C. P. (1993) ‘Rural bias in the East and Southeast Asian rice economy:Indonesia in comparative perspective’, Journal of Development Studies, vol 29,pp149–176
Timmer, C. P. (2002) ‘Agriculture and economic growth’, in Gardner B. and Rausser G.(eds) Handbook of Agricultural Economics, Volume IIA, North-Holland,Amsterdam, pp1487–1546
356 CONCLUSION
ES_RC_9-8 18/8/10 20:23 Page 356

Abbott, P. C. 36access to rice supplies 4, 40, 62, 96, 110,
113, 132ADB (Asian Development Bank) 22, 274AFET (Agricultural Futures Trading of
Thailand) 205, 209Africa 9, 69, 72, 163–164, 173, 305
aid to 305, 309Emergency Rice Initiative for 160rice production/consumption in 163world food crisis in 163–164see also East Africa; Southern Africa; sub-
Saharan Africa; West AfricaAfrican Rice Initiative (ARI) 169Africa Rice Center 160AFSR (ASEAN Food Security Reserve) 81agricultural colleges 135agricultural commodity markets 7, 66–67,
71–72agricultural credit see loansagricultural employment 102–104, 105, 106,
109agricultural machinery subsidies 258, 259agricultural machinery trade 92agricultural productivity 65, 135–137
and technology 4, 5, 98, 108, 136, 247,248–249, 250, 274, 279
agricultural research 4, 34, 133, 136–137,140
aid 182, 305, 309, 311, 314, 315see also food aid
aman crops 92, 93, 94, 95, 107Andhra Pradesh (India) 275, 282, 283Angola 166, 173animal feed 47–49, 95, 303, 304, 323, 331ARI (African Rice Initiative) 169Arkansas (US) 306, 307, 314, 315, 316,
323–324ASEAN (Association of Southeast Asian
Nations) countries 81, 85, 234–235,307
Asia 5, 62, 69, 72, 127, 161, 171, 173, 325,345
GDP in 73–74, 75least-developed countries 74, 79
medium-term outlook for 73–79net trade positions in 74–79productivity in 135, 146, 167, 275,
310–311Asian Development Bank (ADB) 22, 274Asian economic crisis (1998) 114, 130, 283Asian rice policy 8–10, 62, 80–83aus crops 92, 93, 94, 108Australia 67, 75, 204, 307
BAAC (Bank for Agriculture and AgriculturalCooperatives) 192, 193, 196, 197, 207,208–209
Badan Urusan Logistik see BULOGbalikbayan boxes 326Balisacan, A. M. 130–131, 137Baltic Dry Goods Index 155Bangladesh 8, 19–20, 136, 350
diet/nutrition in 96export bans in 105, 348floods/cyclones in 99, 100, 106food aid to 95, 318food production/availability in 92–97food security/insecurity in 97–99,
102–104100 Days Employment Scheme in 106and India 98, 99, 289inflation/incomes in 101–104market deregulation in 92marketing margin in 101, 102micro-credit in 106–107PFDS/safety net programmes in 104,
105–106, 108population growth in 92private traders in 347–348rice-growing seasons in 92–95rice imports/exports of 95–96, 347–348rice market volatility in 91–108rice policies in 92, 95, 96, 104–108rice prices in 97–104, 108, 347rice production/yields in 92–95, 106–107,
278rice stocks in 98–99, 104, 105, 108
banks 106–107, 139, 192, 209international 22, 45, 65, 150, 274, 327
Index
ES_RC_9-8 26/8/10 12:22 Page 357
Barker, R. 3barn-house pledging 192, 193, 207basis trading 205basmati rice 99, 276, 287, 322Benin
exchange rates in 151–152, 153, 154–155millet/rice import prices in 156–158productivity in 145–146, 147, 166, 169rice consumption in 145, 146, 149, 173rice imports to 146, 148rice policies in 160, 161self-sufficiency ratio/surpluses in 146, 149
Bennett, M. K. 3Benz, H. D. 178bilateral/multilateral agreements 83–84biofuels 6, 17, 35, 36, 65, 74, 262, 274
and maize prices 64, 309, 345–346and oil/petroleum prices 71–72, 73,
345–346see also ethanol
black market 194blended rice 302, 303Block, S. 131border price interventions 152, 154, 158,
159borders, national 23, 99–100, 115, 151,
181, 239, 347boro crops 92–94, 95, 100, 108brand recognition 249, 250Brazil 23, 64, 75, 325Briand, A. 7Britain 171brown rice 301–302, 306BRRI dhan 28/29 varieties 94BULOG strategy (Indonesia) 113, 114, 116,
118–121, 326Burkina Faso
exchange rates in 151–152, 153, 154–155export ban in 181food riots in 150, 180millet/rice import prices in 156–158poverty in 150productivity in 145–146, 147, 166rice consumption in 145, 146, 149, 172rice imports to 146, 148, 176rice policies in 160, 161self-sufficiency ratio/surpluses in 146, 149
Burundi 166, 173
California (US) 306, 307, 308, 314, 315,324, 326, 331
Cambodia 9, 22, 23, 79, 99, 136, 233–250,308
export ban in 241, 286food aid to 317, 318irrigation in 235, 237, 249Khmer Rouge period 236marketing systems in 239–242population growth in 234, 235and post-harvest facilities 239, 248, 250price trends/poverty in 234, 243–246, 347
production costs/comparative advantage in242–243
production systems/trends in 235–239rice economy of 234–235rice exports of 181, 208, 233, 235,
238–241, 246–250rice-growing regions in 236and Thailand/Viet Nam 233, 234, 235,
239, 240–241, 242, 243, 244, 248,249–250
varieties grown in 235, 237–238, 240,244
yield growth in 236–237, 247Cameroon 150, 166, 170, 173, 176, 180Canada 322, 325Can Tho (Viet Nam) 223, 226Cape Verde 170, 173Caribbean 72, 322CARP (Comprehensive Agrarian Reform
Program, Philippines) 139cash transfers 114, 140CBOT (Chicago Board of Trade) 71CCTs (conditional cash transfers) 140Central Africa 164, 165, 166, 168, 182
rice consumption in 170, 174, 177rice imports to 176, 183, 184see also CFA Zone
Central African Republic 166, 173Central America 322, 325cereal see grainCFA (Communauté Financière d’Afrique)
Zone 151–152, 153, 158currency of 178, 180CGD (Center for Global Development) 24,
327, 328, 329, 331Chad 166Char areas (Bangladesh) 106Chicago Board of Trade (CBOT) 71children 131China 8, 36, 75, 255–272, 275
agricultural productivity in 136, 137, 167and CRTC 195export duties in 262–263, 271fertilizer duties in 262, 264–265food security of 255, 265, 271grain export restrictions in 257–264, 266grain production policies in 257–261,
271–272grain production profitability in 269–270,
271meat prices in 255–256oil demand of 65rice consumption in 300rice exports of 9, 23, 67, 74, 76, 263, 307rice/grain stocks of 17, 41, 65, 70, 257,
265–266, 271rice prices in 204, 255, 266, 267, 346, 348rice production in 257, 260–261,
270–271, 278soybean prices in 267, 268, 269surpluses in 261
358 THE RICE CRISIS
ES_RC_9-8 26/8/10 12:22 Page 358

VAT in 258, 262, 263and WTO 256, 260, 262, 272
CIMMYT (International Maize and WheatImprovement Center) 5
CIPs (Central Issue Prices, India) 284–285civil war 150climate change 140climatic constraints 99, 137, 275, 348coarse grain 5–6, 76coarse rice 98, 100, 101, 234, 236, 315, 322colonialism/post-colonialism 170–172commodity funds 66commodity markets 7, 62, 64
boom/crash 45, 66, 80characteristics of 39–40and financial markets 43–56price formation in see food pricesprice indexes 39speculation on see market speculationsupply/demand in see supply/demand
modelsand supply of storage model see supply of
storage modeluncertainty and 18, 19, 20, 22, 23, 24volatility 71–73, 346
commodity reserves 80–81commodity-system analysis 143communications 121Comoros 166, 170, 173, 177competitiveness 160, 178, 179, 209, 287,
319–321Comprehensive Agrarian Reform Program
see CARPconditional cash transfers (CCTs) 140Congo 166, 173Congo, D. R. 166Connell Rice and Sugar 318–319corn see maizecorporations 135corruption 138–139, 202–204, 207–208,
349Côte d’Ivoire 150
rice consumption in 169, 170rice imports to 175, 176, 178, 318rice production in 164–165, 166, 169
Cotonou (Benin) 154CPI (consumer price index) 110, 151credit guarantee programmes 315, 319, 320cropping intensity 220cropping systems 108, 221–222CRTC (Council on Rice Trade Cooperation)
195Cuba 314, 315, 316, 318, 325CV (coefficient of variation) 32, 34, 51,
54–55, 56, 69, 111, 124–126, 199cyclones 24, 99, 100, 106
Dakar (Senegal) 154DAP (diammonium phosphate) 226, 230,
281data issues 39–40, 56, 134, 234
see also market informationdecentralization 139deforestation 35Denning, G. 160Dethloff, H. 317developing countries 72, 73, 74, 137, 345,
347Diagne, A. 169diesel 102, 107, 242, 248diet 6, 96, 126–129, 274
and income 127, 174Doe, Samuel 150domestic rice markets 8, 9, 15–16, 70,
97–104, 346–349buffering of 152, 155, 159, 161and world rice prices 150–160, 161
drought 5, 41, 96, 140, 155, 165, 283
EAERR (East Asia Emergency Rice Reserve)81, 305, 307–309
East Asia 72Eastern Africa
rice consumption in 169–170, 174, 177rice imports to 176, 183, 184rice production in 164, 166, 167, 168,
177, 182economic growth 39, 42economies of scale 144education 131, 133, 135EEP (Export Enhancement Program, US)
320, 321eggs/dairy consumption 97, 129, 255Egypt 23, 67, 99, 286, 307, 325elasticity of demand 178, 196
see also short-/long-run elasticitiesEllender, Allen 317El Niño 130emergency reserves 80–81, 85, 104, 115,
305, 307–309Emergency Rice Initiative for Africa 160employment 245, 285, 301, 349
see also agricultural employmentenvironmental degradation/costs 35, 137environmental sustainability 275ES (exportable surplus) 245–246ethanol 6, 36, 47, 263, 309, 311Ethiopia 166euro 43, 51, 52, 151, 178Europe 72, 170–171, 173European Union (EU) 64, 75, 80, 249, 320,
325exchange rates 43–44, 45–47, 71, 121,
151–155RER appreciation 151–152
exportable surplus (ES) 245–246export bans 23, 31, 41, 42, 67, 105, 121,
160, 181, 191, 204, 274, 309–310export duties 181, 182, 262–264, 265, 271,
347, 352–354export licences 194, 257, 262, 263
INDEX 359
ES_RC_9-8 26/8/10 12:22 Page 359

famine 35, 97FAO (Food and Agriculture Organization, US)
8, 17, 24, 36, 64, 71, 72, 73, 113, 160,274
Committee of Commodity Problems 82Farmer Assistance Fund (FAF) 193,
208–209, 212farmer associations 117farmers 122, 126, 132
communications with 121credit schemes for see loansincentives for 91, 104, 108, 120, 275, 279knowledge of 35off-farm employment of 301payments/subsidies for 259responsiveness of 34rich 198vulnerability of 133, 135
farm-gate prices 100, 101, 116, 126, 134,198–201, 324
FCI (Food Corporation of India) 281–282,283–284, 290
fertilizers 5, 6, 34, 35, 94, 105, 167–169, 181bonds 281costs 185, 230, 242, 243, 271, 301duties 262, 264–265market 226–227subsidies 107, 133, 219, 258, 259, 260,
271, 275, 279, 280–281FIELDS programme (Philippines) 133financial regulation 66fish consumption 97, 127, 129floods 96, 99, 100, 106, 140, 283, 348flour products 263FOB (free on board) prices 24, 98, 209food aid 314, 315, 316, 317–319, 320, 326,
330food commodities see commodity marketsfood crises 3–10, 155
1972–3 5–62007–8 see world food crisis (2007–8)and market forces 3–4and rice prices 7–8state intervention in 4
food price dilemma 4food prices
and conflict 150–151cross-commodity linkages in 47–52and exchange rates 45–47high, causes of 30–37and inflation 102, 103, 255–257long-term trends in 63–64and market characteristics 39–40medium-term projections of 75and oil prices 47, 48, 51, 52, 114, 121,
309policy actions for 72and poverty 150sharp decline in 31, 61, 62short-/long-run elasticities in 31–34,
40–43
simple model of 31–32spikes in 4, 7, 40, 61, 62, 328stabilization, optimal 345supply/demand models of see
supply/demand modelsfood production shocks 67, 104food riots/unrest 150, 164, 180, 191food security 3, 7, 16, 81, 82, 109–110
and distribution systems 105–106household 123and inflation 102–104international system for (IRFSS) 83–85and rice trade 8self-sufficiency see self-sufficiencysee also under specific countries
food stocks 104–105France 171Frankel, J. 66, 71free market 25, 347, 352fruit production 127, 129, 221, 222fuel prices 114, 115, 274
see also dieselfuel subsidies 257, 260Fuglie, K. O. 65Fulbright, J. William 316, 317futures markets 7, 18, 24, 30, 37, 45, 65–66,
329
G8 countries 271Gabbert, J. Stephen 317, 318–319Gabon 166, 170, 173Gajigo, O. 160Gambia 166, 169, 171, 179Gardner, B. L. 4GATT (General Agreement on Tariffs and
Trade) 260, 306, 323, 328GDP (gross domestic product) 71, 73–74,
75, 127–128GFIs (government financial institutions) 139Ghana 166, 169, 173, 175, 176, 178, 325Gilbert, C. L. 71global financial crisis 44–45, 61, 66, 71, 73,
130–131globalization 35glutinous rice 322GMOs (genetically modified organisms) 35GOANA (Big Agricultural Offensive for
Food and Abundance, Senegal) 160governance 138, 139, 248–249, 250government financial institutions (GFIs) 139GPP (government purchase price) 110–111,
113, 119, 122grain consumption 127, 129, 172grain export subsidies 262–263grain prices 6, 25, 30, 36, 255
and biofuel production 64, 346government intervention in 104, 256–257,
265–266, 271long-run relationships in 52–56spikes in 7, 9, 40see also maize prices; wheat market
360 THE RICE CRISIS
ES_RC_9-8 26/8/10 12:22 Page 360

grain production 4, 5–6, 169support/subsidies for 258–260see also maize; wheat
grain stocks 99, 100, 274Granger causality test 7, 30, 43, 44, 46–47,
55, 71Green Revolution 5, 135, 279Grosh, M. 349groundnuts 170–171groundwater 92growing seasons 8, 20–22GSM-102 credit guarantee programme 320G-to-G (government to government)
contracts 19, 20, 24, 206, 313Guinea 150, 160, 176, 181, 318
rice consumption in 169, 170rice production in 164–165, 166, 169, 179
Guinea-Bissau 166rice consumption in 169
Gulati, A. 280GVA (gross value added) 137
Haryana (India) 275, 281, 282, 283HCMC (Ho Chi Minh City, Viet Nam) 21Herdt, R. W. 3high-yielding varieties 167–169hoarding 23, 41, 42, 67, 122, 204, 224, 283,
326, 353Hom Mali rice 199, 201–202human resources 140, 231100 Days Employment Scheme (Bangladesh)
106hunger/malnutrition 4, 131–132, 150hybrid varieties 94
ICBs (international commodity bodies) 82IEA (International Energy Agency) 84IGGs (intergovernmental groups of
commodities) 82IMF (International Monetary Fund) 39import licences 113incomes 35, 163, 174, 192, 209, 271
and diet/nutrition 95–96, 127–128and food expenditure 109–110, 128, 129,
245and inflation 102–104, 214
India 5, 8, 36, 40, 79, 136, 273–290, 350and Bangladesh 98, 99, 289and CRTC 195Essential Commodity Act (ECA, 1955)
281, 290export ban by 18–20, 99–100, 191, 209,
210, 256, 274, 282–283, 286, 289, 309,327
FCI activities 281–282, 283–284, 290fertilizer subsidies in 280–281food aid to 317, 318food security in 286future rice sector reform in 275, 289–290and global rice market 275, 276,
277–279, 286, 288–290, 313
MSP in 274–275, 276, 279, 280, 286oil demand of 65population 274, 286poverty/grain prices in 284–285, 287, 290procurement policy in 281–283, 290protection coefficients in 275, 287rice exports of 9, 24, 41, 67, 74, 76, 95,
181, 276, 277, 286, 322rice/grain stocks in 279, 283–284, 285rice millers’ levy in 275, 281–282, 286rice policies in 274–275, 279–288rice prices in 98, 204, 276, 284–285, 286,
346, 348rice production in 167, 275–276, 285rice trade liberalization in 286–288subsidies in 275, 279–281TPDS in 275, 283, 284, 290wheat production in 274, 276, 280
indica rice 257, 258, 266, 267, 307, 314Indonesia 5, 75, 109–122, 136
BULOG strategy in 113, 114, 116,118–121, 326
fertilizer market in 116–117food aid to 317, 318, 321food production in 113food security/insecurity in 109–110, 114,
115, 122fuel price increases in 114, 115price stabilization in 8–9, 110–115, 118,
120, 122, 347, 351, 354RASKIN programme in 114, 115, 119rice imports/exports 9, 74, 77, 113, 114,
115, 317, 325, 329rice policy in 109–115rice prices in 110–122, 346, 348, 349rice procurement/distribution in 114, 115,
118–121rice production in 116–118, 278rice self-sufficiency of 8rice stocks in 110, 113, 114, 115, 119, 279small-scale farmers in 109and world rice crisis 110, 111, 113,
114–115, 121–122, 313, 326inflation 39, 101–104, 111, 206–207information dissemination/exchange 121,
195, 205see also market information
infrastructure 5, 133, 179–180, 220, 248,249, 250, 271
input intensivity 94insect pests 95, 137institutional framework 62, 80–83,
248–249, 250interest rates 73intergovernmental groups of commodities
(IGGs) 82international commodity bodies (ICBs) 82international contracts 83–84international donors 4, 5International Maize and Wheat Improvement
Center (CIMMYT) 5
INDEX 361
ES_RC_9-8 26/8/10 12:22 Page 361

International Settlements Bank 45investment funds 45Iraq 320, 325IRFSS (international rice food security
system) 83–85IR varieties 244IR I variety 11IR III variety 113IR66 variety 237, 238, 240Irrawaddy Delta (Myanmar) 24irrigation 5, 35, 92, 94, 99, 105, 118, 133,
146, 165–167, 235, 315fuel for 107investment 138, 141, 182, 185, 249subsidies 275, 279
IRRI (International Rice Research Institute)5, 143
Isvilanond, S. 197Ito, S. 300Ivanic, M. 245
Japan 8, 75, 275, 299–311agricultural sector in 303–304discarded land in 300–301, 304and EAERR 305, 307–309food policies budget in 299, 304–305food security/insecurity of 299, 301, 303,
304foreign aid from 305, 309, 311and global rice market 305–310government ministry (MAFF) in 299, 304,
305, 329, 331and MA rice imports 305, 306–307media in 299, 300, 301–302, 303and Philippines see under Philippinesrice consumption in 300–301rice imports to 300, 306–307, 322–323,
325rice prices in 301–303, 322–323, 345,
346, 347rice stocks/surplus of 42–43, 49, 308, 323,
326–330supporting/development role of 310, 311and US 9–10, 19, 24, 306, 307, 313–314,
316, 322–323, 326, 327, 328–331japonica rice 257–258, 266, 267, 306, 307jasmine (Hom Mali) rice 199, 201–202, 322Java (Indonesia) 118, 120, 121, 131Jha, S. 139Jordan 318, 322, 325
Kako, T. 300Kalimantan (Indonesia) 118, 120Kenya 166, 173, 176, 179Kigali (Rwanda) 164Korea, Republic of see ROKKoshihikari variety 301, 302, 303
labour costs 230, 243, 301labour productivity 135, 136, 139Lançon, F. 178
land reform 139land use/productivity 65, 73, 92, 116, 136,
167, 168disused/abandoned land 300–301, 304
Laos 79, 136, 208Latin America 72, 320LGUs (local government units) 133, 139, 140Liberia 150–151, 166, 170, 318livestock feed see animal feedloans 105–107, 133, 139, 197–198,
319–321see also credit guarantee programmes;
marketing loan programme; paddypledging programme
local government 117, 133, 140, 227units (LGUs) 133, 139, 140
locally grown rice 178, 179Lokollo, E. M. 111Louisiana (US) 314, 315, 317, 323–324
Madagascar 165, 176, 180, 181rice production/consumption in 169–170,
173, 177maize 95, 257, 261
consumption 174profitability of 269–270
maize prices 6, 7, 17, 30, 36, 45, 61, 255and biofuel production 64, 309, 345–346and exchange rates 45, 46and government intervention 265and other grain prices 47–49, 51, 52–56,
205, 273, 274, 278–279, 289Malawi 166, 173, 184Malaysia 23, 75, 136, 206
rice consumption in 128Mali 160, 161, 180, 181
rice consumption in 169, 172Rice Initiative scheme in 160, 181, 182rice production in 164–165, 166, 169,
178, 179, 184MA/MMA (minimum access/minimum
market access) 305, 306–307, 308,330–331
market deregulation 92market forces 3–4, 255market information 82, 231marketing loan programme (US) 314, 315,
319–321marketing margin 101, 102market risk 66market speculation 7, 8, 9–10, 24, 29–56,
65–66, 99, 121, 309, 348–349‘outside’ speculators 38, 45, 348and supply of storage model see supply of
storage modelMartin, W. 245Mauritania 166, 173Mauritius 170, 177MDGs (Millennium Development Goals) 91,
130, 131Mears, L. A. 317
362 THE RICE CRISIS
ES_RC_9-8 26/8/10 12:22 Page 362

meat consumption 97, 127, 129, 178,255–256
media 23, 83, 121, 205, 274, 325, 327see also under Japan
Mehta, A. 139MEPs (minimum export prices) 18, 19, 99,
100, 276, 286Mexico 320, 322, 325micro-credit 106–107Middle East 72, 320, 325Milazzo, A. 349milled rice 39, 76–79, 96, 111, 172, 175,
176, 177, 244, 303, 308regular/well (RMR/WMR) 124–126, 127
Millennium Development Goals see MDGsmillet 153, 154, 156–158, 174minimum access see MA/MMAminimum export prices see MEPsminimum stock requirement (MSR) 120minimum support price see MSPMissouri (US) 314, 315Mitchell, Don 36MMA (minimum market access) see
MA/MMAmonetary policies 66, 71Monga areas (Bangladesh) 106monitoring 115, 135, 219, 231monsoons 5, 92, 94Morgan, Dan 313, 316–317MOU (memorandum of understanding) 22Mozambique 165, 166, 173, 180MRD (Mekong River Delta) 20, 21, 221,
223, 224, 225, 226, 227–228An Giang Province (Viet Nam) 227,
229–230MSP (minimum support price) 274–275,
276, 279, 280MSR (minimum stock requirement) 120Munier, B. 7MVs (modern varieties) 94, 95Myanmar 22, 24, 79, 95, 99, 167, 208
Narayanan, S. 280Nargis, Cyclone 24national policies 8, 17, 18–25, 80–83,
104–108natural disasters 24, 99, 115
see also drought; weather eventsNBS (nutrient-based fertilizer subsidy) 281NERICA varieties 169, 170NFA (National Food Authority, Philippines)
21, 24–25, 41, 133, 138–139, 331, 348NGOs (non-governmental organizations)
106–107Niamey (Niger) 154Niger
exchange rates in 151–152, 153, 154–155millet/rice import prices in 156–158productivity in 145–146, 147, 166rice consumption in 145, 146, 149, 169,
172
rice imports to 146, 148, 181rice policies in 160, 161self-sufficiency ratio/surpluses in 146, 149
Nigeria 23, 144National Food Security Program 181, 182rice consumption in 169, 173rice imports to 175, 176, 178, 179–180rice production in 164–165, 166, 169, 179rice stocks of 180–181
NPC (nominal protection coefficient) 287NRAs (nominal rates of assistance) 158, 159Nusa Tenggara (Indonesia) 118, 120nutrient-based fertilizer subsidy (NBS) 281nutrition 96, 131–132
Oceania 69ODA see aidOECD (Organisation for Economic Co-
operation and Development) 73, 274oil palm see palm oiloil prices 6, 7, 17, 25, 35, 36, 43–44
and biofuels 71–72, 345–346and food prices 47, 48, 51, 52, 114, 121,
309see also petroleum prices
Olken, B. 349ON (Office du Niger, Mali) 181OPEC (Organization of Petroleum Exporting
Countries) 6, 195open interest 71open market sales 105, 106, 182options markets see futures marketsOREC (Organization of Rice Exporting
Countries) 22ORS (Office Riz-Segou, Mali) 181Oryza glaberrima 170Oryza sativa 170Ouagadoudou (Burkina Faso) 154
paddy pledging programme (Thailand)191–194, 196–205, 207–208, 214–215
borrowing options in 192budget 197changes in 193–194, 199costs of 196–197and export competitiveness 211–212and FAF (Farmer Assistance Fund) 193,
208–209, 212government losses in 197organizational structure 193performance 194political economy/rent-seeking in 196,
202–204and poor farmers 196, 197–198Public Warehouse Organization in see
PWOand rice market structure 196, 201–202and rice mills 194, 202, 203–204and rice prices 196, 198–201warehouse deposit slip scheme 192,
193–194, 207
INDEX 363
ES_RC_9-8 26/8/10 15:38 Page 363

Pak Irri-25% rice 63Pakistan 40, 95, 136, 322
and CRTC 195rice production in 40, 167
palay rice 126, 134palm oil 48, 114, 171, 192, 354panic buying 41, 56, 67, 122, 224, 325–326parboiled rice 95, 98, 210Pare-Pare (Indonesia) 115Pearson, S. R. 143pests/diseases 95, 137petroleum prices 35, 45, 65
and biofuels 71–72, 73PFDS (Public Food Grain Distribution
System) 105–106, 108Philippines 5, 19, 22, 24, 75, 123–141, 308,
313employment in 137FIELDS programme in 133food aid to 318, 321food consumption in 127–128, 129food security in 123, 124, 135, 140GDP/incomes in 127–129, 130, 137governance in 133, 139government response in 132–135importance of rice in 126–132and Japan 24, 42–43, 313, 314, 326, 329,
330, 331, 332land reform in 139local government/LGUs in 133, 139, 140NFA activities see NFAand panic buying in US 326policy recommendations for 140–141population growth in 127, 137, 140poverty/malnutrition in 123, 130–132reasons for rice crisis in 135–139rice consumption in 126–130, 169rice imports to 21, 24–25, 42–43, 74, 78,
129, 134–135, 137, 325rice prices in 21, 123, 124–126, 347, 348rice production/productivity in 123–124,
135–137rice sector constraints in 137–139rice stocks in 21, 41rural finance in 139speculative buying by 99, 191, 204and Thailand 206and Viet Nam 20–22wheat/maize prices in 124
Phnom Penh (Cambodia) 240, 244, 248photoperiod insensitive varieties 235,
237–238PL 480/Food for Peace programme (US) 314,
317, 318, 320–321Poapongsakorn, N. 197population 6, 17, 73, 74, 92, 127, 137, 140,
182, 184and rice prices 33, 35, 36, 56, 274
pork consumption 255–256post-harvest facilities 133, 239, 248, 250
see also rice mills/millers
potash fertilizers 107, 281poultry industry 95poverty 4, 106, 129, 131–132, 150
reduction 130–131and rice distribution/allocation 114, 115,
118–121and rice prices 16, 102, 150, 245,
284–285safety net policies for see safety net
programmesprice expectations 39–40, 41, 44–45private sector 5, 96, 99–100, 104, 106, 132
imports/exports by 81, 96, 99–100, 104,107, 113, 347
investment 92, 138, 139and rice extension programmes 141stocks held by 120, 348
profitability 99, 101, 108, 120, 310–311protectionism 322–323Public Food Grain Distribution System see
PFDSpublic stockholding 35, 104–105, 260pulses 97, 105, 129, 285Punjab (India) 275, 281, 282, 283purchasing power 102Pursell, G. 280PWO (Public Warehouse Organization,
Thailand) 192, 193, 196, 206, 207, 209sues exporters 203, 204
rainfed rice production 116, 156, 165, 249RASKIN programme (Indonesia) 114, 115,
119rationing systems 104Ravallion, M. 350Reardon, T. 172Red River Delta see RRDregular milled rice (RMR) 124–126, 127rent-seeking 196, 202–204RER (real exchange rate) appreciation
151–152‘reserves’ system 84–85retail rice prices 99, 100–101, 126, 224–225,
301–303rice auctions 203, 206, 209, 212rice consumers/consumption 9, 34, 109–110,
122, 126–130, 310and calorie supply 169, 174forecasts 182–183historical 170–171reductions in 135see also under specific countries
rice exports/imports 5, 8–9, 23, 62,239–241, 306–307, 309–310
constraints on 234, 248–249credit guarantee programmes 315, 319determinants of 178–180and domestic crops 156–158duties on see export dutiesand exchange rates 151–155, 180forecasts 182–184
364 THE RICE CRISIS
ES_RC_9-8 26/8/10 12:22 Page 364

informal/smuggled 115, 135, 181, 208,234, 239, 240, 243
and smooth supply 41, 62, 80, 83–85and timing 135see also under specific countries
rice extension programmes 139, 140Rice Initiative scheme (Mali) 160, 181rice intensification programmes 5, 181rice market 5, 9, 62
characteristics of 39, 55–56crisis in see world rice market crisisand national policies 80–83panic in see panic buyingand rice stocks see rice stocks/reservesstate role in 25, 108vulnerability/thinness of 7, 25, 30, 40, 276
rice marketing systems 133, 138, 144, 219,234, 239–242
margins/costs 241–242rice market volatility 7, 9, 41, 42, 45, 56,
61–73, 81–82, 91–108, 144, 346, 352and commercial/non-commercial traders
70–71and exchange rates 71factors in 64–73and food security 109–110and policy actions 72, 80, 81–82and rice production 68–69and rice stocks 68, 69–70, 73
Rice Millers’ Association see RMArice mills/millers 110, 194, 202, 203–204,
207–208, 248levies on 275, 281–282, 286
rice prices 5, 8–9, 243–246, 350and conflict 150–151domestic see domestic rice marketsand elasticity of demand 178and exchange rates 47and financial markets 43–56and hoarding see hoardinglong term decline of 15, 34, 54, 55in market crisis (2007–8) 3, 7–8, 15–16,
21, 23, 273marketing margin 101, 102and other grain prices 49–51, 52–56,
156–158and paddy pledging programme (Thailand)
198–201and population 33, 35, 36, 56responsiveness to 178and rice stocks 29–30seasonality of 199–201, 243–244sharp decline in 67short-/long-run elasticities in 30, 31–34,
40–43, 52–56speculation on see market speculationstabilization policies 110–115, 118, 152,
155, 159, 347, 349–354statements on/forecasts of 23and supply of storage model see supply of
storage model
wholesale/retail 99, 100–101, 111, 126rice procurement 35, 104, 105, 107, 108,
110, 118–121rice production 6, 105–107
coefficients of variation of 69constraints in 98, 99costs 105intensified 129, 133, 181local 178, 179and rice prices 8, 9, 17, 68–69, 91
rice quality 179, 203, 211–212, 240, 244,245
rice retailers/retail prices 99, 100–101, 110rice stocks 3, 8, 23, 29–30, 39, 40–43, 65,
66, 113for emergencies see emergency reservesglobal system of 80–81, 84–85, 279and market volatility 17, 68, 69–70, 73,
80, 98, 180–181, 352minimum requirement (MSR) 120virtual 80see also paddy pledging programme;
supply of storage modelrice traders 8, 9, 39, 55, 99, 110, 133, 206
commercial/non-commerical 70–71constraints on 248–249, 283governments as 194, 201–202monitoring 115smuggling by 115, 135, 208
rice yields 166–169, 223, 275gaps 137–138growth 35, 36, 92–95, 98and population 33see also under specific countries
RMA (Rice Millers’ Association, US) 317,318–319, 322–323
RMR (regular milled rice) 124–126, 127ROK (Republic of Korea) 75, 307–308, 311,
322, 325, 331, 346food aid to 316, 317, 318rice consumption in 128, 178, 300
RRD (Red River Delta, Viet Nam) 221, 223,229
rural economy 135, 137, 144rural infrastructure 5, 133, 138, 179–180,
185Russia 75, 318, 320Rwanda 164, 166, 173, 180
safety net programmes 104, 105–106, 108,349–354
defined 349impacts of 349–350objections to 350–352
Sahelian countries 145, 171see also Benin; Burkina Faso; Niger;
SenegalSamuelson, P. A. 68Saudi Arabia 322, 325Sawit, M. H. 111SBS (simultaneous-buy-and-sell) rice 306
INDEX 365
ES_RC_9-8 26/8/10 12:22 Page 365

Scheiffer, Thomas 329–330Schmidhuber, J. 71seed certification 133seed distribution 117, 133, 181‘seed-fertilizer’ generation 6seed subsidies 258, 259seed technologies 5, 35self-sufficiency 8, 133, 146, 149, 233, 255,
304Senegal 180
economic reforms in 159exchange rates in 151–152, 153, 154–155GOANA scheme in 160groundnut production in 171millet/rice import prices in 156–158poverty in 150privatization of imports in 159productivity in 144, 145–146, 147, 166rice consumption in 145, 146, 149, 169,
170, 173rice imports to 146, 148, 158–160, 175,
176, 178, 181rice policies in 158–159, 160, 161self-sufficiency ratio/surpluses in 146, 149
Seychelles 170, 177short-/long-run price elasticities 30, 31–34,
40–43, 52–56shrimp production 221Sierra Leone 151
rice consumption in 170rice production in 164–165, 166, 169
simultaneous-buy-and-sell (SBS) rice 306SinoGrain 265Slayton, T. 99, 327small-scale farmers 109, 144, 240, 245
see also subsistence farmersSmil, Vaclav 300smuggling rice 115, 135, 181, 208, 234soap manufacture 171social protection programmes 105, 139, 285soil
nutrients 137, 138salinity 95
Somali variety 240, 244, 245South Africa 166, 175–176, 325South Asia 72Southeast Asia 5, 171Southern Africa
rice consumption in 170, 174, 177rice imports to 175–176, 183rice production in 164, 165, 166, 167,
168, 177, 182South-to-South aid 305, 309soybeans 17, 114, 259, 262, 263, 264, 267,
268, 309profitability of 269–270
stockpiling see hoardingstock to utilization ratios 69–70stress-tolerant varieties 140sub-Saharan Africa 9, 160, 164–185
colonialism/post-colonialism in 170–172
fertilizer consumption in 169global food crisis in 180–182grain consumption in 172groundnut production in 170–171land area harvested in 167, 168, 182policy responses in 180–182rice consumption in 169–174, 182–183rice imports to 163, 175–185rice imports to, forecasting 182–184rice production in 164–169, 182, 184sub-regions of 164–165, 166urbanization in 172–174varieties grown in 169, 170water resources of 165–167yields in 166–169see also CFA Zone
subsidies 4, 105, 107, 115, 116, 139,258–260, 269, 275
buffering of domestic markets 152, 155,159, 161
crop-specific allocation of 280fertilizer 107, 133, 257machinery/fuel 257, 258in paddy pledging programme 192–193,
197, 202, 208and poverty 284–285, 287
subsistence farmers 95, 106, 109, 137, 245substitution 64, 157Sudan 166, 173sugar production 64Sulawesi (Indonesia) 115, 118, 120, 121Sumatra (Indonesia) 118, 121supermarkets/retail chains 224, 326supply chain 39, 55, 240, 249, 250supply/demand models 29, 31–37, 56,
66–67and high food prices 36–37, 63–64, 274short-/long-run elasticities in 31–34,
40–43, 52–56trends/factors in 34–36, 39
supply of storage model 8, 29–30, 37–40,55–56
relevance of 39–40Swaziland 166
Taiwan (China) 300, 311, 324, 331Tanzania 166, 173, 180Targeted Public Distribution System see
TPDStariffs 105, 115taxes 4, 159, 160, 179, 181, 192, 225
export see export dutiesVAT 160, 258, 262, 263
Texas (US) 314, 315, 316TFP (total factor productivity) 65, 135–136Thai rice 47, 111Thai 5% brokens 98, 111, 113Thai 15% brokens 112Thai 25 % brokens 126Thai 100%B variety 15, 24, 63, 226, 266,
267
366 THE RICE CRISIS
ES_RC_9-8 26/8/10 12:22 Page 366

Thai A1 Super rice 63Thailand 5, 8, 40, 75, 136, 191–215,
234–235, 309AFET activities 205, 209export cartel policy 22, 194–196MOC (Ministry of Commerce) 194–195,
205, 206, 207, 208National Rice Committee 193, 205–206,
208, 212paddy pledging programme see paddy
pledging programmeand Philippines 206rice consumption in 128, 169rice export cooperation strategy 195rice exports of 19, 22, 24, 41, 74, 78, 95,
99, 180, 191, 204, 209–210, 213–214rice policies (pre-2007) 192–204rice policies (2007–2008) 204–215, 313,
347rice prices in 98, 198–201, 347rice production/yields in 9, 167, 183, 235,
278rice stocks of 24, 191, 194, 197, 199, 203,
205, 206–210, 212–214Samak government 204–207, 208, 209,
214Somchai government 208–209Surayud government 194, 204–205,
209–210Thaksin government 194, 195and US 320, 321, 323and Viet Nam 191, 195, 204, 209, 211
Timmer, C. P. 4, 327, 350–351Titapiwatanakun, B. 203Togo 166TPDS (Targeted Public Distribution System,
India) 275, 283, 284, 290trade barter deals 83trade-distorting policies 260trade liberalization 286–288trade restrictions 99, 105
see also export banstransparency 25, 66, 82, 212, 281transportation costs 19, 155, 203, 248–249,
314Turkey 322, 325
Uganda 166, 173, 180United States (US) 5, 6, 8, 40, 66, 75, 301
Agriculture Department see USDAbiofuels in 36, 64credit guarantee programmes 315, 319,
320financial crisis in 44–45, 225food aid programmes 314, 315, 316,
317–319, 320, 334–335, 336and Japan see under Japanmarketing loan programme 314, 315,
319–321panic buying in 326and Philippines 21–22
PL 480/Food for Peace programme 314,317, 318, 320–321, 333–334
politics of rice in 316–319rice balance sheet of 322in rice crisis 323–332rice exports of 95, 314, 315–323,
324–325, 333–335rice industry background in 314–323rice market in 24, 41, 63, 71rice production/growing regions in
314–315, 323–324, 333rice trade associations in 326, 327, 328,
332RMA 317, 318–319, 322–323and subsidies/loans 287, 314and Thailand 320, 321, 323and world food crisis 325–326, 327
urbanization 163, 172–174, 182–183, 184,310
urban markets 144, 146, 152, 255urea fertilizers 107, 116, 117, 151, 226–227,
280–281Uruguay Round (WTO/GATT) 260, 306,
323, 328US 2/4% rice 63USDA (United States Agriculture
Department) 23, 30, 233, 305, 319,321, 324
and rice crisis 327, 328, 329US dollar 39, 66
depreciation 17, 35, 44, 45, 71, 151and euro 43, 51, 52and oil prices 43, 51
US Rice Federation 326, 327, 328, 332USTR (United States Trade Representative)
322–323Uttar Pradesh (India) 275, 282, 283Uzbekistan 318, 321
VAT (value-added tax) 160, 258, 262, 263vegetable oils 35, 40, 102, 105, 262, 269vegetables 97, 127, 129, 221, 222VFA (Viet Nam Food Association) 219–220,
223, 231Viet 5% rice 63, 113Viet Nam 25% broken 19Viet Nam 9, 22, 24, 40, 43, 75, 136,
219–231, 234–235, 313crop rotation in 221–222and CRTC 195export ban by 191, 204, 221, 225, 286,
309, 310, 327, 332fertilizer prices in 226–227food aid to 317, 318food security of 220–221, 229, 230–231government ministries (MARD/MOIT)
219, 220, 223, 224, 231Mekong River Delta see MRDNorthern/Southern Food Corporation
219, 231and Philippines 20–22
INDEX 367
ES_RC_9-8 26/8/10 12:22 Page 367

planted area in 220, 221–222, 227–228,229
production costs/profits in 229–230rice exports of 19, 20, 23, 24, 41, 67, 74,
79, 95, 99, 223–226, 229rice prices in 223–226, 347, 348rice production in 167, 183, 221–223, 235rice sector in 219–220and Thailand 191, 195, 204, 209, 211VFA activities 219–220, 223, 224, 231yields in 221, 223, 228, 229, 230
virtual stocks 80
wages see incomesWARDA (West African Rice Development
Authority) 143, 160, 169water resource 118, 137–138, 156, 275
see also irrigationweather events 5, 18, 35, 73, 100, 107, 348
see also climatic constraints; cyclones;floods
welfare effects 146, 149West Africa 9, 143–161, 182
exchange rate effects in 151–155export bans in 160food riots in 150, 164government investment in 144groundnut production in 171millet/rice import prices in 156–158poverty in 150, 161rice consumption in 144, 145, 146, 149,
160, 161, 169, 174, 177rice imports to 144–145, 146, 148,
153–155, 158–160, 161, 175, 176, 183,184, 185
rice prices in 144, 145, 146, 150, 347rice production in 144, 145, 147, 160,
161, 164, 166, 167, 168, 177rice trends in 144–150trade policy responses in 158–160and world rice markets 144, 150–160yields in 143, 145–146, 158see also CFA Zone; and see specific
countriesWest Bengal (India) 275, 282Weymar, F. H. 38WFP (World Food Programme) 7, 325, 331wheat 5–6, 7, 17, 95, 97, 172, 261
intensification programmes 5profitability of 269–270stocks 283–284
wheat market 4, 6, 7, 8, 16, 17, 18, 19, 30,36, 41, 45, 61, 114, 255, 267
and exchange rates 45, 46government intervention in 255, 257–258,
265, 267
imports/exports 96, 105, 257and other grain prices 47–49, 51, 52–55,
205, 289and rice prices 49–51, 204, 273, 274
wholesale rice prices 111, 112, 126, 302and retail prices 99, 100–101
Wickizer, V. D. 3Wodon, Quentin 150women 131World Bank 65, 150, 274, 327World Development Report (World Bank,
2008) 65World Food Conference (Rome, 1974) 6world food crisis (1972–3) 5–6, 159, 313world food crisis (2007–8) 6–10, 41, 220,
263, 271, 273–274, 299, 305, 328and Asian rice policy 8–10impact in Africa 163–164lessons from 345–354and market speculation 7, 40and national policies see national policiesand rice prices 7–8
world rice economy 3, 40–41, 55–56, 62,67–73, 74, 163, 196, 277–279
and domestic rice markets 150–160, 161,227, 263, 274
exchange rates see exchange ratesIndia’s influence on 276, 286, 287,
288–290and international politics 313, 317–319and national policies 80–83, 110–111,
121–122world rice market crisis (2007–8) 3, 15–25,
56, 110, 273bubble pops in 24–25, 331–332external factors in 17and India’s export ban 18–20Philippine policies in 20–22policy decisions and 17, 18–24, 25rice prices in 15–16speculation and see market speculationThai policies in 22timeline of events 19uncertainty and 18, 19, 20, 22, 23, 24–25US and 323–332Viet Nam’s policies in 20and wheat prices 17, 19
Wright, B. D. 7WTO (World Trade Organization) 82, 256,
258, 260, 272, 290, 326, 352, 354rice stocks 42–43, 314, 328
Zambia 166, 173Zimbabwe 166, 173
368 THE RICE CRISIS
ES_RC_9-8 26/8/10 12:22 Page 368