Embed Size (px)
Citation preview

G.C. Manos et al., Int. J. Comp. Meth. and Exp. Meas., Vol. 1, No. 3 (2013) 221–237
© 2013 WIT Press, www.witpress.comISSN: 2046-0546 (paper format), ISSN: 2046-0554 (online), http://journals.witpress.comDOI: 10.2495/CMEM-V1-N3-221-237
THE RESPONSE OF A TWO-DEGREE-OF-FREEDOM DYNAMIC SLIDING SYSTEM SUBJECTED TO UNI-DIRECTIONAL HORIZONTAL DYNAMIC
AND SEISMIC EXCITATIONS
G.C. MANOS, G. KOIDIS & M. DEMOSTHENOUSLaboratory of Experimental Strength of Materials and Structures, Dept. of Civil Engineering, Aristotle University,
Thessaloniki, Greece.
ABSTRACTAn investigation is presented that studies the response of a two-degree-of-freedom dynamic sliding system; that is a single-degree-of-freedom oscillator being fi xed on top of a rigid block that can slide on its supporting shaking table along a horizontal axis when subjected to unidirectional dynamic or earthquake excitations along this horizontal axis. This problem appears to be of interest in predicting the dynamic and earthquake response of superstructures supported on a large foundation block capable of horizontal sliding by means of seismic sliding isolators. Special mock-ups are tested at the shaking table of Aristotle University for this purpose utilizing horizontal simulated earthquake excitations based on prototype earthquake ground motion recordings. The numerical results, which were obtained by a computer software developed for this purpose, are compared with the corresponding experimental measurements. The measured acceleration and displacement responses of the mock-ups appear to be, in all the examined cases, in reasonably good agreement with the numerical predictions. However, in certain cases, the numerically predicted sliding displacement of the rigid block appears to have an offset that differs from the sliding response that was observed during the experiments. This is more pro-nounced when there is no spring linking the rigid block with the shaking table and must be attributed to manufacturing tolerances of the mock-ups. It is demonstrated that the developed software, although it tries to represent such a rather complex problem in a simplifi ed manner, can be useful at the preliminary design stage of structural systems resting on sliding isolators. Results from various experimental and numerical tests demonstrate that the oscillator’s response is generally made smaller by the sliding of the rigid block. This is true for a wide range of frequencies; however, there is a relatively narrow frequency window in which the oscillator’s response is amplifi ed. This frequency window has a peak value that is slightly higher than the oscillator’s eigen-frequency when it is considered to be a single-degree-of-freedom system fi xed at its base.Keywords: Earthquake excitation, numerical simulation, seismic isolation, measurements, sliding rigid block.
1 INTRODUCTIONThis paper presents results from an experimental and numerical investigation that studies the response of a two-degree-of-freedom (2-D.O.F.) dynamic sliding system; that is a single- degree-of-freedom (S.D.O.F.) oscillator being fi xed on top of a rigid block that can slide on its supporting shaking table along a horizontal axis as shown in Fig. 1. Aslam et al. [1] dealt with the sliding or rocking response of a rigid block (without an S.D.O.F. oscillator) subjected to horizontal and vertical base motions without considering in their analysis the difference between the static and dynamic coeffi cients of friction, unlike the present study. They complemented their analysis with a parametric study and a valuable experimental verifi cation. Westermo and Udwadia [2] also studied analytically the sliding dynamic response of a rigid block. Shenton et al. [3] dealt with the complex problem of sliding, rocking, and free-fl ight dynamic response of a rigid block (without an S.D.O.F. oscillator). They considered in their analysis both the static and kinetic coeffi cients of friction as well as two-component excitation

222 G.C. Manos et al., Int. J. Comp. Meth. and Exp. Meas., Vol. 1, No. 3 (2013)
(horizontal and vertical). However, apart from the analytical formulation they did not include either a numerical solution or an experimental verifi cation. Virgin et al. [4] studied the rocking and sliding response of a block under horizontal excitation without considering in their analysis the difference between the static and dynamic coeffi cients of friction, unlike the present study. Demosthenous [5] studied the sliding response of a rigid block considering, as does the present study, the static and dynamic coeffi cients of friction. Moreover, he has developed a numerical solution for this problem together with an experimental verifi cation, using sinusoidal or simulated earthquake excitations. However, he considered only the rigid block without the S.D.O.F. oscillator shown in Fig. 1. He also considered in his formulation both the horizontal and vertical components of the excitation. The present study was also extended to deal both with the horizontal and vertical components of the excitation. Due to laboratory diffi culties, what is presented here is limited at the moment only to the horizontal component of the excitation. Moreover, the present study assumes that no rocking occurs during sliding [6]. The problem shown in Fig. 1 is studied here numerically as well as exper-imentally utilizing a special mock-up (Section 6) manufactured and tested at the shaking table of Aristotle University. The used horizontal shaking table motions were based on either sinusoidal motions, as done by Mostaghel et al. [7], having a variety of frequencies and amplitudes or based on horizontal earthquake excitations as done by Mostaghel and Tanbakuchi in their study of the same problem [8]. However, these works did not consider in their formulation the difference between the static and dynamic coeffi cients of friction, unlike the present study. Moreover, they dealt only analytically with the problem of Fig. 1, by employing actual recordings of prototype earthquake ground motions, as done in this paper, without, however, any experimental validation. In the present study, the laboratory simula-tions of these recordings were measured exactly during testing, and they were used exactly as measured in the subsequent verifi cation of the numerical simulation where the numerical predictions are compared with the measured response. The problem of Fig. 1 is of interest in predicting the dynamic and earthquake response of superstructures on a large foundation block supported on seismic sliding isolators. Krishnamoorthy and Parikh [9] studied the effect of sliding on multi-story frames, considering the constant coeffi cient of friction. Usually, the superstructure, the foundation, and the sliding isolators are numerically simulated
1X (t))t(U
2X (t)
2X (t)&&
2X (t)&
1X (t)&&
1X (t)&
U(t)&&
U(t)&
y
x
H
2H
B
1Spring K
2Spring K
1Damper C
1Block M
2SDOF M
Shaking Table
st dFriction μ ,μ2Damper C
Section A-A
Section B-B
Figure 1: Layout of the problem.

G.C. Manos et al., Int. J. Comp. Meth. and Exp. Meas., Vol. 1, No. 3 (2013) 223
with complex three-dimensional (3D) models that may result in cumbersome numerical analyses when seeking optimum solutions. The present simplifi ed numerical treatment aimed at facilitating this preliminary design stage. Moreover, concern has been voiced on modeling real sliding conditions. Higashino et al. [10] performed a laboratory and in situ study concerned mainly with the durability of sliding isolators and the variability of friction-sliding characteristics with time. The infl uence of the actual sliding conditions are taken into account and discussed here by comparing the numerical predictions with laboratory measurements.
2 PROBLEM LAYOUTFigure 1 shows a rectangular rigid block (Block) initially resting on the fl at horizontal steel platform of a shaking table (Fig. 1, called Table). A linear single-degree-of-freedom oscillator is fi xed on the upper surface of the Block (Fig. 1, called S.D.O.F.). The shaking table moves only in one horizontal direction, thus subjecting the system to uni-directional horizontal excitations. Block movement affects the movement of the S.D.O.F. and vice versa. The contact area between the Block and the shaking table is a horizontal plane where Coulomb friction develops; [µst ⋅ (M1 + M2) ⋅ g is the static friction force and µd ⋅ (M1 + M2) ⋅ g is the dynamic friction force]. The Block of mass M1 is linked to the shaking table with a horizon-tal spring of stiffness K1 and a horizontal damper of damping coeffi cient C1. The S.D.O.F. has stiffness K2 and a coeffi cient of damping C2. Pure horizontal motion for the S.D.O.F. is assumed. With respect to a fi xed coordinate system x and y, the motion of the shaking table is defi ned by the displacement U(t), whereas the corresponding displacement of the Block is X1(t) and that of the S.D.O.F. is X2(t). The velocity and acceleration of the shaking table, the Block, and the S.D.O.F. are
( )U t& and ( )U t&& , ( )1X t& and ( )1X t&& , and ( )2X t& and ( )2X t&& , respec-tively. The sliding Block displacement (relative to the shaking table) is equal to
U(t) – X1(t).
The forces that arise in the system are the following; Fine1 is the inertial force of the Block, Fine2 is the inertial force of the S.D.O.F., Fspr1 is the force at the Spring 1, Fspr2 is the force at the Spring 2 (S.D.O.F. restoring force), Fdam1 is the force at the Damper 1, Fdam2 is the force at the Damper 2 (S.D.O.F. damping force), and Ffr is the Coulomb friction force that, when the Block moves with the shaking table, can take a value from zero to µst ⋅ (M1 + M2) ⋅ g, whereas when the Block slides on the shaking table, it takes the value of µd ⋅ (M1 + M2) ⋅ g. Generally, positive direction to the right and negative to the left is supposed. Rocking phenomena at the Block-Table interface are not investigated here.
3 SLIDING DYNAMIC RESPONSE OF THE RIGID BLOCK ALONEA simplifi ed version of this problem is shown in Fig. 2. where no S.D.O.F. is placed on top of the Block. All the parameters with the relevant symbols given in Section 2 are also valid here. The forces that arise in this rigid block – shaking table dynamic system [11] are shown in Fig. 2.
A special mock-up has been constructed that represents physically the previously stated problem (Fig. 2). It consisted of a rectangular steel block with dimensions 430 mm × 430 mm in plan and a height either 205 mm or 410 mm (upper part of Fig. 2). This Block was simply resting on the steel platform of the shaking table (lower part of Fig. 2) and was restrained in all other directions so that it could move only in the longitudinal horizontal direction. The mass of this sliding Block was either 124 kg or 248 kg. The various important physical parameters for this Block sliding response are measured [12], e.g. the coeffi cients of friction at the contact surface between the Block and the shaking table and the stiffness of the elastic spring. A special series of tests were performed in order to determine the coeffi cient of

224 G.C. Manos et al., Int. J. Comp. Meth. and Exp. Meas., Vol. 1, No. 3 (2013)
friction of the contact surface between the sliding Block and the shaking table. This surface was machined in a special way so that full contact conditions could be ensured between the sliding Block and the steel platform of the shaking table. Moreover, this contact surface was lubricated throughout all experimental sequences [12]. The frequency of the cyclic displacements during these tests varied from 0.1 Hz to 1.0 Hz. The average values for the coeffi cient of friction found from these tests are listed below; they were found not to depend on the frequency of the excitation. A total of 10 tests were performed. When the Block’s mass was equal to 124 kg, the values of the friction coeffi cient were: µst = 0.165, µd = 0.153. When the Block’s mass was equal to 284 kg, the values of the friction coeffi cient were: µst = 0.158, µd = 0.136.
Another series of tests were conducted in order to accurately measure the stiffness K1 of the spring that was employed to link the Block to the shaking table. As was done for measur-ing the coeffi cient of friction, during the tests for measuring the spring stiffness, the frequency of the cyclic displacement was varied from 0.1 Hz to 1.0 Hz. The stiffness of the certifi ed spring with no pre-stress had an average value K1 = 128.6 kN/m. The stiffness of the certifi ed spring with pre-stress had an average value K1 = 143.0 kN/m. The stiffness of the non- certifi ed spring with pre-stress had an average value K1 = 19.4 kN/m. There was no viscous damper used in this mock-up.
3.1 Governing relationships and numerical solution
The following relationships, (1) to (4), govern the sliding of the Block that is linked with a spring (K1) and a damper (C1) to the shaking table when it is subjected to horizontal acceleration. Starting from an initial condition of no motion, in order for the Block to start sliding, the shaking table acceleration must exceed the value given by the following inequality (1)
ine 1 1F M X= − ⋅r
&& , the inertia force
( )spr 1 1F K U X= ⋅ −r
, the spring force
( )dam 1 1F C U X= ⋅ −r
& & , the damping force
fr d 1F M g= ±μ ⋅ ⋅r
, the friction force during sliding
fr st 1F M g= ±μ ⋅ ⋅r
, the friction force when no sliding occurs
Figure 2: Layout of the mock-up of the sliding Block alone without the S.D.O.F. on top.
1X (t))t(U
1X (t)&&
1X (t)&
U(t)&&
U(t)&
y
x
H
B
1Spring K
1Damper C
1Block M
Shaking Table
st dFriction μ ,μ

G.C. Manos et al., Int. J. Comp. Meth. and Exp. Meas., Vol. 1, No. 3 (2013) 225
stU(t) g> μ ⋅&& (1)
In this case, the Block acceleration will be given by eqn (2):
( ) ( ) ( )1 1
1 d 1 1 11 1
K CX (t) g sgn U(t) X (t) U(t) X (t) U(t) X (t)
M M⎡ ⎤= μ ⋅ ⋅ − + ⋅ − + ⋅ −⎣ ⎦
&& & & & & (2)
When the Block is sliding, it is continuously checked for reattachment to the shaking table by examining the absolute value of its velocity relative to the shaking table. If the value of the velocity of the Block relative to the shaking table becomes equal to zero and inequality (3) holds, the Block will keep sliding.
( )1
1 1 st1
KIf U(t) X (t) and U(t) U(t) X (t) g
M− = 0 − ⋅ − > μ ⋅& & && (3)
If the value of the velocity of the Block relative to the shaking table becomes equal to zero and inequality (4) holds, the Block is reattached to the shaking table.
( )1
1 1 st1
KIf U(t) X (t) and U(t) U(t) X (t) g
M− = 0 − ⋅ − ≤ μ ⋅& & && (4)
The above conditions are included in computer software that utilizes a time step-by-step integration process incorporating an iteration scheme to reach acceptable limits of convergence. In this step-by-step integration process, eqns (5) and (6) are used for defi ning the velocity and displacement of the Block at time step ti.
( )i i 1 i 1 i
tX(t ) X(t ) X(t ) X(t )2− −Δ
= + + ⋅& & && && (5)
( )i i 1 i 1 i
tX(t ) X(t ) X(t ) X(t )2− −Δ
= + + ⋅& & (6)
This computer software was next validated (Section 3.2) by numerically simulating the dynamic sliding response of the tested Block and by comparing the response measured in the laboratory with the corresponding numerical predictions. In this numerical simulation, all the important physical parameters of the problem at hand, such as the friction coeffi cients, spring stiffness, Block mass, and the shaking table motion, are the input to this computer software with values found from the laboratory measurements. Thus, the measured sliding response of the mock-up could be directly compared to numerical predictions made by this developed computer software.
3.2 Comparison between experimental measurements and numerical predictions
3.2.1 Test employing sinusoidal excitation 3.5 Hz with certifi ed springThe comparison between predicted and measured Block acceleration and sliding displacement response is presented in Fig. 3a and b, respectively. As can be seen in these fi gures, good agreement is obtained between predicted and measured response.
226 G.C. Manos et al., Int. J. Comp. Meth. and Exp. Meas., Vol. 1, No. 3 (2013)
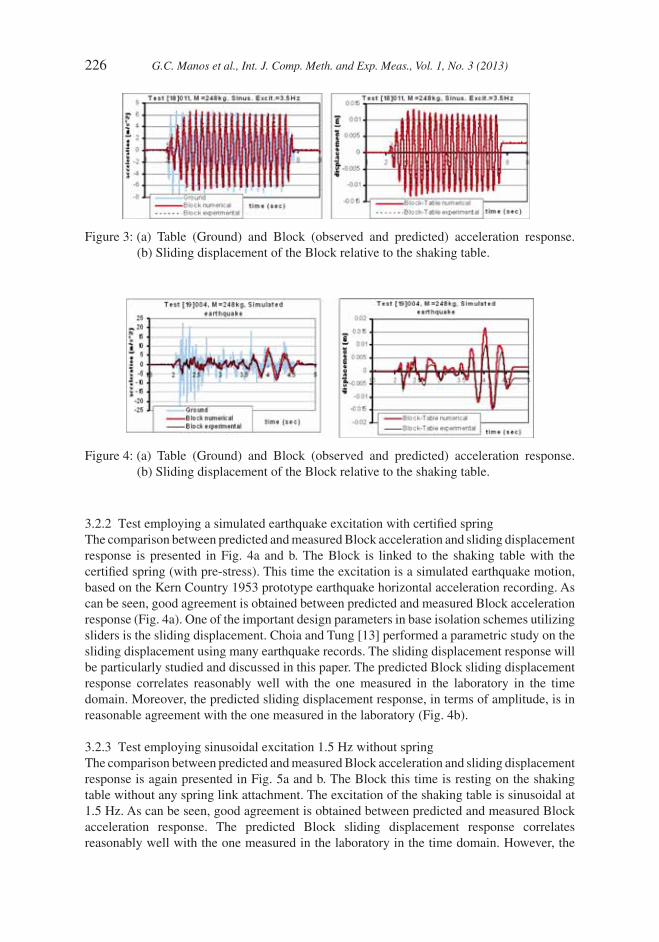
3.2.2 Test employing a simulated earthquake excitation with certifi ed springThe comparison between predicted and measured Block acceleration and sliding displacement response is presented in Fig. 4a and b. The Block is linked to the shaking table with the certifi ed spring (with pre-stress). This time the excitation is a simulated earthquake motion, based on the Kern Country 1953 prototype earthquake horizontal acceleration recording. As can be seen, good agreement is obtained between predicted and measured Block acceleration response (Fig. 4a). One of the important design parameters in base isolation schemes utilizing sliders is the sliding displacement. Choia and Tung [13] performed a parametric study on the sliding displacement using many earthquake records. The sliding displacement response will be particularly studied and discussed in this paper. The predicted Block sliding displacement response correlates reasonably well with the one measured in the laboratory in the time domain. Moreover, the predicted sliding displacement response, in terms of amplitude, is in reasonable agreement with the one measured in the laboratory (Fig. 4b).
3.2.3 Test employing sinusoidal excitation 1.5 Hz without springThe comparison between predicted and measured Block acceleration and sliding displacement response is again presented in Fig. 5a and b. The Block this time is resting on the shaking table without any spring link attachment. The excitation of the shaking table is sinusoidal at 1.5 Hz. As can be seen, good agreement is obtained between predicted and measured Block acceleration response. The predicted Block sliding displacement response correlates reasonably well with the one measured in the laboratory in the time domain. However, the
Figure 3: (a) Table (Ground) and Block (observed and predicted) acceleration response. (b) Sliding displacement of the Block relative to the shaking table.
Figure 4: (a) Table (Ground) and Block (observed and predicted) acceleration response. (b) Sliding displacement of the Block relative to the shaking table.

G.C. Manos et al., Int. J. Comp. Meth. and Exp. Meas., Vol. 1, No. 3 (2013) 227
predicted sliding displacement response, in terms of amplitude, is signifi cantly larger than the one measured in the laboratory. It is interesting to note that the cumulative sliding displacement, which appears as an offset from the initial zero displacement condition in the measurements, is not predicted by the software. This measured cumulative (offset) sliding displacement response may be attributed to manufacturing tolerances, whereby the contact surface between the Block and the shaking table deviates from the ideal horizontal plane.
3.2.4 Test employing simulated earthquake excitation without springThe comparison between predicted and measured Block acceleration response is presented in Fig. 6a, whereas the predicted Block sliding response is presented in Fig. 6b. The Block is resting on the shaking table without employing any spring attachment; however, this time a simulated earthquake excitation is used. As can be seen, good agreement is obtained between the predicted and measured Block acceleration response. The predicted Block sliding displacement response correlates reasonably well with the one measured in the laboratory in the time domain as well as in terms of maximum amplitude. It is again interesting to note that there is a cumulative sliding displacement that appears as an offset from the initial zero displacement condition in the predicted response that is much larger than the one observed during the experiment. This deviation between predictions and measured sliding displacement response may be again attributed, as was done before, to manufacturing tolerances, whereby the contact surface between the Block and the shaking table deviates from the ideal horizontal plane. This may result in somewhat larger maximum friction force in one direction than the maximum friction force in the opposite direction.
Figure 5: (a) Table (Ground) and Block (observed and predicted) acceleration response. (b) Sliding displacement of the Block relative to the shaking table.
Figure 6: (a) Table (Ground) and Block (observed and predicted) acceleration response. (b) Sliding displacement of the Block relative to the shaking table.

228 G.C. Manos et al., Int. J. Comp. Meth. and Exp. Meas., Vol. 1, No. 3 (2013)
The numerical predictions presented in this section confi rm all behavioral observations of the studied Block sliding response, as recorded during this extensive experimental sequence. Deviations between predicted and measured maximum and cumulative sliding displacement response are considerably reduced when a spring connects the rigid block with the shaking table. Inverted pendulum sliding isolators, apart from sliding, possess such a spring balancing force property [14–16]. Based on these observations, the investigation is next extended to deal with the more complex dynamic system described in Section 2; that is the 2-D.O.F. system (Fig. 1), where an S.D.O.F. is fi xed on top of the sliding block.
4 GOVERNING RELATIONSHIPS OF THE 2-D.O.F. SYSTEMThe governing relationships of the 2-D.O.F. sliding system described in Section 1 are stated here. These are an extension of the relationships given in Section 3.1 for the sliding Block alone.
a. When the Block is initially attached to the Table, it is 1 1 1X U, X U, X U= = =& & && && . Sliding will start when the inequality (7) becomes valid:
spr1 dam1 ine1 ine2 frF F F F F+ + + > ⇒r r r r r
(7)
The dynamic equilibrium of the S.D.O.F alone (Section A-A, Fig. 1) results in the following:
( ) ( )1 1 2 1 2 2 1 2 st 1 2M X K X X C X X (M M ) g⋅ + ⋅ − + ⋅ − > μ ⋅ + ⋅&& & & (8)
b. When the Block is sliding from this initial condition, eqns (9) and (10) are valid:
x spr2 dam2 ine2F 0 F F F 0Σ = ⇒ + + = ⇒r r r r
(Section A-A, Fig. 1)
( ) ( )2 2
2 1 2 1 22 2
CX X X X
MΚ
Χ = ⋅ − + ⋅ −Μ
&& & & (9)
x spr1 dam1 ine1 ine2 frF 0 F F F F F 0Σ = ⇒ + + + + = ⇒r r r r r r
(Section B-B, Fig. 1):
( ) ( ) ( )1 1 2 1 2
1 1 1 2 d 11 1 1 1
K C M M MX U X U X X g sgn U X
M M M M+
= ⋅ − + ⋅ − − ⋅ + μ ⋅ ⋅ ⋅ −&& & & && & & (10)
From eqns (9) and (10), acceleration of the Block is given by eqn (11):
( ) ( ) ( ) ( )1 1 2 2 21 1 1 1 2 1 2
1 1 1 2 2
K C M K CX U X U X X X X X ,
M M M M M⎡ ⎤
= ⋅ − + ⋅ − − ⋅ ⋅ − + ⋅ −⎢ ⎥⎣ ⎦
&& & & & &
( )1 2
d 11
M Mg sgn U X
M+
+μ ⋅ ⋅ ⋅ −& & (11)
c. When the Block is reattached to the Table it is 1 1X U, X U= =& & && && . In this case, the acceler-ation of the S.D.O.F. is given by eqn (12). It must be noted that the Block has been

G.C. Manos et al., Int. J. Comp. Meth. and Exp. Meas., Vol. 1, No. 3 (2013) 229
moved on the Table to a position that will be, in general, different from the initial posi-tion of step (a). Thus, the force at spring 1 will have a non-zero value.
x spr2 dam2 ine2F 0 F F F 0Σ = ⇒ + + = ⇒r r r r
(Section A-A, Fig. 1)
( ) ( )2 2
2 1 2 1 22 2
CX X X X
MΚ
Χ = ⋅ − + ⋅ −Μ
&& & & (12)
d While the Block is reattached to the Table, it is 1 1X U, X U= =& & && && . Sliding will start again when the inequality (13) becomes valid:
spr1 dam1 ine1 ine2 frF F F F F+ + + > ⇒r r r r r
(13)
The dynamic equilibrium of the S.D.O.F alone (Section A-A, Fig. 1) results in the following:
( ) ( ) ( )1 1 1 1 2 1 2 2 1 2 st 1 2K U X M X K X X C X X (M M ) g⋅ − − ⋅ − ⋅ − − ⋅ − > μ ⋅ + ⋅&& & & (14)
The above governing equations are utilized in the numerical investigation that is presented in Section 5. These equations will take a somewhat simpler form when there is no spring 1 and damper 1 than the more general case, which was considered here and corresponds to the general layout of the problem depicted in Fig. 1. This relatively simple layout without spring 1 and damper 1, representing a simplifi cation of the general layout shown in Fig. 1, was utilized in the experimental investigation to be discussed next in Section 6.
5 NUMERICAL INVESTIGATION OF THE 2-D.O.F. SYSTEMThe relationships given in Section 4 are the governing differential equations as well as the inequalities that defi ne the sliding slip-stick behavior of the 2-D.O.F. dynamic system under consideration, when it is subjected to unidirectional horizontal U(t)&& acceleration at its base. These governing relationships represent the most general case for the sliding behavior of such a 2-D.O.F. system [2,3,7–9,12]. These governing relationships are included in a computer software with the logical diagram shown in Fig. 7. The solution is reached utilizing a step-by-step time integration process, which is also part of this software.
Figure 7: Flow chart of the numerical solution.
x1 frF F>∑r r
1U X 0− =& &
Initial Adaptation
Yes
No
Sliding
AdaptationYesNo
Yes
No
x1 frF F>∑r r

230 G.C. Manos et al., Int. J. Comp. Meth. and Exp. Meas., Vol. 1, No. 3 (2013)
Starting from an initial condition of no motion, the solution proceeds with this step-by-step time integration process checking through the governing relationships at each time step (i-1). This is done by considering all known parameters of the problem at this step, in order to predict the condition, either slip or stick, of the next step (i) as well as all response parameters at this step.
The following simple numerical integration eqns (15) and (16) are utilized for calculating the velocity and displacement at a time step t1:
( )i i 1 i 1 i
tX(t ) X(t ) X(t ) X(t )2− −Δ
= + + ⋅& & && && (15)
( )i i 1 i 1 i
tX(t ) X(t ) X(t ) X(t )2− −Δ
= + + ⋅& & (16)
At each step (i-1) a number of (j) iterations are performed in order to predict the acceleration of the next time step (i) for either block ( )1X i&& or the S.D.O.F. ( )2X i&& . These target accelera-tions are found by introducing a parameter δ, which is set to a relatively very small value (e.g. δ = 0.00001 m/s2). The following inequalities (17) and (18) are then utilized as a convergence criterion included in the software for a given set of consecutive iterative solutions j-1 and j:
j j 1
1 1X (i) X (i)−− ≤ δ&& && (17)
j j 1
2 2X (i) X (i)−− ≤ δ&& && (18)
Ideally, both these inequalities (17) and (18) must be valid in order to satisfy the convergence of this process and stop at iteration (j) adopting the acceleration values block j
1X (i)&& or S.D.O.F. j
2X (i)&& as the fi nal values for time step (i). Normally, about six iterations are suffi cient to predict the acceleration at a time step (i) with such accuracy (δ). This convergence criterion is usually satisfi ed when the value for δ = 0.00001 m/s2 is larger than the round-off accuracy of the numbers inherent in the numerical solution. An instability in this convergence process is observed only when the Block slides during time step (i-1) and the sign of the relative velocity between the Block and the shaking table predicted at iteration step (j) for time step (i), ( )( )j j
1sgn U i X (i)−& & , is the opposite of the corresponding sign of this relative velocity predicted for time step (i) at iteration step (j-1), ( )( )j 1 j 1
1sgn U i X (i)− −−& & . This instability in the convergence of the numerical solution is dealt with by performing for time step (i) at every iteration step (j) a check of the governing equations that will prove that there is either a stick condition or a sliding condition.
6 EXPERIMENTAL INVESTIGATION OF THE 2-D.O.F. SYSTEMA special mock-up has been constructed (Fig. 8a), which represents the dynamic system depicted in Fig. 1. This mock-up consists of a steel block, with dimensions 0.33 m × 0.53 m × 0.53 m and mass equal to 325 kg. At the upper side of this Block, a vertical rod is fi xed that supports on its top a steel mass varying during the test sequence having values equal to 45 kg, 90 kg, or 201 kg. The steel rod diameter was equal to 14 mm or 20 mm. The mass of the steel rod is negligible compared to the steel mass being supported at its top. This steel mass– vertical steel rod cantilever represents an S.D.O.F. oscillator (Fig. 8a and b). The vertical

G.C. Manos et al., Int. J. Comp. Meth. and Exp. Meas., Vol. 1, No. 3 (2013) 231
distance from the center of the mass of the S.D.O.F. up to the upper side of the block, e.g. the plane where the S.D.O.F. is presumed fi xed, was set equal to 0.44 m or 0.76 m. Through the variation of the mass of the oscillator, and of the diameter and/or height of the steel rod, the eigen-frequency of this S.D.O.F. could take values equal to 1.125 Hz, 1.625 Hz, 1.75 Hz, 2.15 Hz, or 2.65 Hz. The whole dynamic system, that is the S.D.O.F. and the supporting Block, was simply resting on the horizontal plane of the shaking table steel platform utilizing a roller- bearing device placed at the contact surface between the bottom side of the Block and the upper side of the shaking table (Figs 1 and 8b).
As shown in Fig. 8b, the shaking table can move horizontally only in the North-South direction. The Block, through the roller-bearing support could also slide in this longitudinal (North-South) horizontal direction, whereas it was constrained against movement in the transverse horizontal direction (East-West) by special lateral displacement roller ties employed for this purpose. Two distinct types of horizontal motions were introduced to excite the studied dynamic system. The fi rst type of shaking table motion was a horizontal sinusoidal excitation with a frequency varying during tests from 1 Hz to 3.4 Hz and with amplitudes varying during tests from 0.1 m/s2 to 5 m/s2. The frequency and amplitude of this horizontal sinusoidal excitation was kept constant during each test. The second type of shaking table motion was a horizontal excitation that was a laboratory simulation based on the actual horizontal recording of one of the horizontal components of the prototype Kern County California 1953 earthquake. All the physical quantities entering into the problem, such as the mass of the Block, the mass of S.D.O.F., the coeffi cients of friction of the roller-bearing device, the damping coeffi cient of the S.D.O.F. were measured before the experimental sequence commenced. The results reported here were obtained with a mock-up having neither a spring nor a viscous damper connection between the Block and the shaking table (Figs 1 and 8b). Care was taken during the test sequence to prohibit any rocking and uplift of the Block from the supporting roller bearing. A total of 150 sliding tests were performed. In order to defi ne the coeffi cients of friction of the roller-bearing device, special sliding tests were performed when mass M1 of the block was equal to 325 kg. The value for static coeffi cient of friction was found equal to 0.020 and that for the dynamic coeffi cient of friction equal to 0.012. The equivalent viscous damping ratio of the S.D.O.F. had a relatively small value of the order of 1% of critical damping. A number of
Figure 8: (a) Laboratory mock-up. (b) Instrumentation for measuring the excitation as well as the response of the mock-up.
2SDOF M
1Block M
ActuatorDCDTAccelometerAccelometerVelocitymeter
NorthSouth
Shaking TableRoller BearingsRoller Bearings
Shaking Table
S.D.O.F. Oscillator
Rigid Block
South
Steel Rod
North
Roller constraining lateral displacement

232 G.C. Manos et al., Int. J. Comp. Meth. and Exp. Meas., Vol. 1, No. 3 (2013)
displacement, velocity, and acceleration sensors were provided in order to accurately record the characteristics of the exciting shaking table motion as well as the response of both the Block at the center of its mass, its upper side, as well as at the center of the mass of the S.D.O.F. (Fig. 8a and b). A set of displacement transducers recorded the displacement of the shaking table, the Block, and the S.D.O.F. with respect to a motionless coordinate system. In addition, the sliding displacement of the Block (relative to the shaking table) was also measured directly by an additional sensor (Fig. 8b). An automatic data acquisition system with a sampling rate suffi cient for accurately measuring the excitation and the response was utilized during testing.
7 COMPARISON BETWEEN EXPERIMENTAL MEASUREMENTS AND NUMERICAL PREDICTIONS FOR THE 2-D.O.F. SYSTEM
The computer software presented in Section 5 was next validated by numerically simulating the dynamic sliding response of the 2-D.O.F. system of Section 6 and by comparing the response measured in the laboratory with the corresponding numerical predictions. Selective numerical results are presented here and compared with the corresponding experimental measurements. Subsection (7.1) includes results obtained from tests employing sinusoidal excitation, whereas Subsection (7.2) includes results obtained from tests employing simulated earthquake excitations.
7.1 Sinusoidal excitation response
In every test the values of mass of the Block (M1) as well as of mass of the S.D.O.F. (M2) are stated; moreover, the values of the eigen-frequency of the S.D.O.F. together with that of frequency of the sinusoidal horizontal excitation are noted. Figures 9a to 9d depict the
Figure 9: (a) Table (Ground) and Block (observed and predicted) acceleration response. (b) Table (Ground) and S.D.O.F. (observed and predicted) acceleration response. (c) Sliding displacement of the Block (predicted and observed). (d) Displacement of the S.D.O.F. relative to the Block (predicted and observed).

G.C. Manos et al., Int. J. Comp. Meth. and Exp. Meas., Vol. 1, No. 3 (2013) 233
numerical predictions and the experimental measurements for a test with sinusoidal excitation of 1 Hz when the eigen-frequency of the S.D.O.F. was 1.625 Hz (M1 = 325 kg and M2 = 45 kg). As can be seen in Fig. 9a and b, due to sliding of the rigid block, the accelera-tion response of either the Block (Fig. 9a) or the S.D.O.F. (Fig. 9b) are relatively small with no noticeable amplifi cation when compared to the acceleration of excitation. As can be seen in these fi gures, the numerical prediction of either the Block acceleration response (Fig. 9a) or the S.D.O.F. acceleration response (Fig. 9b) are in reasonably good agreement with the corresponding experimental measurements. Similarly, good agreement can also be observed between the numerical predictions and experimental measurements of the Block sliding displacement response (Fig. 9c) or the displacement response of the S.D.O.F. relative to the Block (Fig. 9d). It must be underlined here that the acceleration of the excitation, as recorded by the acceleration sensor placed on the shaking table (Figs 8a and 8b), was directly used as input in the software described in Section 5.
Similar comparison between numerical predictions and measurements can be seen in Figs 10a to 10d. This time, due to the increase of the mass of the S.D.O.F. from 45 kg to 201 kg, the value of the S.D.O.F. eigen-frequency is equal to 1.125 Hz, which is quite close to the excitation frequency that remains the same as before (1.0 Hz). Good agreement can also be observed between the numerical predictions and experimental measurements of both the response of the Block and of the S.D.O.F. (Fig. 10a–d). If sliding was not allowed (fi xed Block) for such an S.D.O.F. system with viscous damping ratio value of the order of 1%, the S.D.O.F. acceleration response would be expected to have an amplifi cation value of the order of 4.22 compared to the acceleration of the excitation. Due to sliding of the rigid Block (Fig. 10c), the acceleration response of either the Block (Fig. 10a) or of the S.D.O.F. (Fig. 10b) do not exhibit noticeable amplifi cation when compared to the acceleration of the excitation,
Figure 10: (a) Table (Ground) and Block (observed and predicted) acceleration response. (b) Table (Ground) and S.D.O.F. (observed and predicted) acceleration response. (c) Sliding displacement of the Block (predicted and observed). (d) Displacement of the S.D.O.F. relative to the Block (predicted and observed).

234 G.C. Manos et al., Int. J. Comp. Meth. and Exp. Meas., Vol. 1, No. 3 (2013)
despite the fact that the excitation frequency is quite close to the eigen-frequency of the S.D.O.F. The displacement of the S.D.O.F. relative to the Block attains maximum value of the order of 11 mm (Fig. 10d), which is larger than the corresponding value during the previous test (6.5 mm, Fig. 9d).
Figures 11a to 11d depict the numerical predictions and the experimental observations for a test with sinusoidal excitation of 2.984 Hz when the eigen-frequency of the S.D.O.F. was 2.687 Hz (M1 = 325 kg and M2 = 201 kg). Good agreement can be observed between the numerical predictions and experimental measurements of the response of the Block as well as the S.D.O.F. (Figs 11a–11d). If sliding was not allowed (fi xed Block), for an S.D.O.F. system with viscous damping ratio value of the order of 1%, the S.D.O.F. acceleration response would be expected to have an amplifi cation value of the order of 4.27 compared to the acceleration of the excitation. Due to sliding of the rigid Block (Fig. 11c), the acceleration response of either the Block (Fig. 11a) or the S.D.O.F. (Fig. 11b) do not exhibit noticeable amplifi cation when compared to the acceleration of the excitation, despite the fact that the excitation frequency is quite close to the eigen-frequency of the S.D.O.F. As also discussed in Section 2.4, it is interesting to note that the cumulative sliding displacements that appear as an offset from the initial zero displacement condition is successfully reproduced by the predicted response only in some cases (Fig. 10c) and not in other cases (Figs 9c and 11c). Possible explanations that are given for this are manufacturing tolerances, where the contact surface between the Block and the shaking table deviates from the ideal horizontal plane, thus resulting in somewhat larger maximum friction force in one direction than the maximum friction force in the opposite direction, as well as the integration scheme that is included in the computer software.
Figure 11: (a) Table (Ground) and Block (observed and predicted) acceleration response. (b) Table (Ground) and S.D.O.F. (observed and predicted) acceleration response. (c) Sliding displacement of the Block (predicted and observed). (d) Displacement of the S.D.O.F. relative to the Block (predicted and observed).

G.C. Manos et al., Int. J. Comp. Meth. and Exp. Meas., Vol. 1, No. 3 (2013) 235
7.2 Simulated horizontal earthquake excitations
Figures 12a to 12d depict the numerical predictions and the experimental observations for a test with simulated earthquake excitation, based on the prototype Kern County 1953 prototype earthquake horizontal acceleration recording.
The comparison between numerical predictions and experimental measurements in the case of simulated earthquake excitation is similar to the one commented upon in Section 6.1 for the sinusoidal excitation. Reasonably good agreement between measured and predicted response for both the Block and the S.D.O.F. can be seen in Figs 12a to 12d.
8 CONCLUSIONSAn investigation has been presented that studies the response of a 2-D.O.F. dynamic sliding system; that is an S.D.O.F. oscillator being fi xed on top of a Block resting on a support that can slide along a horizontal axis. The response of this system is studied when subjected to unidirectional dynamic or earthquake excitations along this horizontal axis. This problem appears to be of interest in predicting the dynamic and earthquake response of superstruc-tures supported on a large foundation block capable of horizontal sliding by means of seismic sliding isolators. Special mock-ups are tested in the present study at the shaking table of Aristotle University for this purpose utilizing horizontal simulated earthquake excitations based on prototype earthquake ground motion recordings. Moreover, numerical results were obtained by a computer software developed for this purpose. They are compared with the
Figure 12: (a) Table (Ground) and Block (observed and predicted) acceleration response. (b) Table (Ground) and S.D.O.F. (observed and predicted) acceleration response. (c) Sliding displacement of the Block (predicted and observed). (d) Displacement of the S.D.O.F. relative to the Block (predicted and observed).

236 G.C. Manos et al., Int. J. Comp. Meth. and Exp. Meas., Vol. 1, No. 3 (2013)
corresponding experimental measurements. The following conclusions can be drawn based on the presented material and the preceding discussion:
• The numerical predictions confi rm all the behavioral observations recorded during the experimental sequence. Due to rigid block sliding, the acceleration response of the rigid block or the S.D.O.F., which is an oscillator with a relatively very low damping ratio value, does not exhibit noticeable amplifi cation when compared to the acceleration of the excitation, despite the fact that the excitation frequency is quite close to the eigen-frequency of the S.D.O.F.
• The numerically predicted rigid block and S.D.O.F. acceleration response is in good agreement with the measured values for all examined cases for both the sinusoidal and the simulated earthquake horizontal excitation of the shaking table.
• The predicted rigid block sliding displacement response exhibited, in some cases, good agreement with the measured values. However, in other cases, signifi cant deviation could be observed between the predicted and measured rigid block sliding displacement response values. The cumulative sliding rigid block displacement, that appears as an offset from the initial zero displacement condition, is successfully reproduced by the predicted response only in some cases.
• These deviations may be attributed to the actual sliding conditions due to manufacturing tolerances of the used mock-ups, whereby the contact surface between the rigid block and the shaking table deviates from the ideal horizontal plane. These actual sliding conditions result in somewhat larger maximum friction force in one direction than the maximum friction force in the opposite direction.
• The observed discrepancies between the measured and numerically predicted maximum sliding and cumulative sliding displacement response values may also be due to the integration scheme included in the computer software.
• These deviations between predicted and measured maximum and cumulative sliding displacement response are considerably reduced with the presence of a spring connecting the rigid block with the shaking table. Inverted pendulum sliding isolators, apart from sliding, possess such a spring balancing force property.
• It is demonstrated that the developed software can yield reasonably accurate predictions of the dynamic and earthquake response of the examined 2-D.O.F. sliding system. It can thus be utilized, in this simplifi ed manner, for the preliminary design of the earthquake response of complex structural systems resting on sliding seismic isolators.
REFERENCES [1] Aslam, M., Godden, W.C. & Scalise, L.G., Sliding response of rigid bodies to earthquake
motions, Rep. No. LBL-368, Lawrence Berkeley Laboratory, University of California, 1975.
[2] Westermo, B. & Udwadia, F., Periodic response of sliding oscillator system to harmonic excitation. Earthquake Engineering and Structural Dynamics, 11, pp.135–146, 1983. doi: http://dx.doi.org/10.1002/eqe.4290110111
[3] Shenton, H.W. & Jones, N.P., Base excitation of rigid bodies, I: Formulation. Engineering Mechanics, ASCE, 117(10), pp. 2286–2306, 1991. doi: http://dx.doi.org/10.1061/(ASCE)0733-9399(1991)117:10(2286)
[4] Virgin, L.N., Aldemir, U., Gavin, H. P., Nichols, J. M. & Plaut, R. H., An investigation of a rocking-sliding block. ASME Design Engineering Technical Conference, 2001.

G.C. Manos et al., Int. J. Comp. Meth. and Exp. Meas., Vol. 1, No. 3 (2013) 237
[5] Demosthenous, M., Experimental and numerical study of the dynamic response of solid or sliced rigid bodies, Ph D Thesis, Dept. of Civil En., Aristotle University, Greece, 1994.
[6] Manos G.C., Demosthenous, M., Hatzigeorgiou, A. & Manou-Evison, J., Study of the dynamic and earthquake behavior of models of ancient columns and colonnades with and without the inclusion of wires with energy dissipation characteristics, proc. 12th WCEE, 2000.
[7] Mostaghel, N. Hejazi, M. & Tanbakuchi, J., Response of sliding structures to harmonic support motion. Earthquake Engineering and Structural Dynamics, 11, pp. 355–366, 1983. doi: http://dx.doi.org/10.1002/eqe.4290110305
[8] Mostaghel, N. & Tanbakuchi, J., Response of sliding structures to earthquake support motion. Earthquake Engineering and Structural Dynamics, 11, pp. 729–748, 1983. doi: http://dx.doi.org/10.1002/eqe.4290110603
[9] Krishnamoorthy, A. & Parikh, S., In-Plane response of a symmetric space frame with sliding supports. International Journal of Applied Science and Engineering, 3(1), pp. 1–11, 2005.
[10] Higashino M., Hamaguchi H., Minewaki S. & Aizawa S., Basic characteristics and durability of low-friction sliding bearings for base isolation. Earthquake Engineering and Engineering Seismology, 4(1), pp. 95–105, 2003.
[11] Chopra, A. K., Dynamics of Structures: Theory and Applications to Earthquake Engineering, Prentice Hall: New Jersey, 1995.
[12] Manos, G.C., Koidis, G. & Demosthenous, M., Investigation of the sliding response of a rigid body system subjected to uni-direction horizontal dynamic and earthquake excitations, proc. 3rd COMPDYN, Corfu: Greece, 2011.
[13] Choia B., and Tung C.C., Estimating sliding displacement of an unanchored body subjected to earthquake excitation. Earthquake Spectra, 18(4), pp. 601–613, 2002. doi: http://dx.doi.org/10.1193/1.1516750
[14] Wang Yen-Po, Chung Lap-Loi, & Liao Wei-Hsin, Seismic response analysis of bridges isolated with friction pendulum bearings. Earthquake Engineering & Structural Dynamics, 27(10), pp. 1069–1093, 1998. doi: http://dx.doi.org/10.1002/(SICI)1096-9845(199810)27:10<1069::AID-EQE770>3.0.CO;2-S
[15] Zayas, V., Low, S.S. & Mahin, S.A., The FPS earthquake resisting system, experimental report, Report No. UCB+EERC-87/01, Berkeley, CA., 1987.
[16] Madden, G.J., Wongprasert, N. & Symans, M. D., Analytical study of an adaptive sliding base isolation system for seismic protection of buildings, Proc. 14th ASCE Eng. Mechanics Conf. U.S.A., 2000.