Embed Size (px)
Citation preview

1
Realizing the Millennium Development Goals through socially inclusive macroeconomic policies
Country Study
Assessing Development Strategies to Achieve the MDGs in
The Republic of Tunisia
Mohamed A Chemingui
Economic Affairs Officer Economic Development and NEPAD Division
Economic Comission for Africa (ECA) United Nations
mcheminguiunecaorg
Marco V Saacutenchez Economic Affairs Officers
Department of Economic and Social Affairs (DESA) United Nations
sanchez-cantillounorg
United Nations Department for Social and Economic Affairs
October 2011
2
This (unedited) report was elaborated as part of the capacity-development project ldquoRealizing the Millennium Development Goals through socially-inclusive macroeconomic policiesrdquo which was implemented by the Development Policy an Analysis Division of the United Nations Department of Economic and Social Affairs (DPADUN-DESA) in close collaboration with the World Bank United Nations Economic Commission for Africa (UN-ECA) and the Regional Bureau for Arab States (RBAS) The overall objective of the project was to strengthen the capacity of policymakers to formulate and evaluate socially-inclusive macroeconomic policies aimed at facilitating the achievement of the MDGs through the adaptation of an integrated modelling framework to country-specific conditions The methodological framework is based on the adaptation of the economy-wide model system known as Maquette for MDGs Simulation (MAMS) ndash a dynamic computable general equilibrium (CGE) model that includes a special module for the ldquoproductionrdquo of services associated with the Millennium Development Goals (MDGs) It also compromises methodologies at the micro level to identify determinants of MDG achievement on the one hand and to quantify effects on poverty and inequality on the other The views and opinions expressed herein are those of the authors and do not necessarily reflect those of the United Nations and the World Bank or their member states copy Realizing the Millennium Development Goals through socially inclusive macroeconomic policies Project (httpwwwunorgendevelopmentdesapolicycapacity_buildinghtml)
3
Abstract
Tunisia was one of the fastest growing economies in the MENA region and managed to divert important amounts of resources to key social sectors before the recent global financing crisis and political revolution unfolded MDG progress was remarkable and even turned out to be immune to the global financing crisis owing to countercyclical public spending The revolution unfolded in late 2010 just when the economy was recovering from the global financing crisis In spite of observed progress this paperrsquos scenario analysis which is based on a computable general equilibrium (CGE) model shows that public spending would need to rise by 57-71 percent of GDP per annum to meet the MDGs in primary education child and maternal mortality and water and sanitation by 2015 Domestic resource mobilization (borrowing or taxation) to finance the new spending would be costly owing to crowding out of private spending in MDG sectors that would require the government to scale up even more spending These financing mechanisms would be economically and politically infeasible at a juncture of political reconstruction and a decline in national savings Should foreign borrowing alone be instead used the government debt would increase 5 percent of GDP or more by 2015 Relying only on grant aid would imply mobilization of US$27-US$39 billion per annum depending on MDG-spending growth after 2011 The mobilization of foreign resources would in any case be unavoidable to pursue an MDG strategy But this strategy should not be expected to act as a catalyst to economic recovery in the short term owing to the macroeconomic trade-offs it would triggermdashand productivity gains from greater MDG achievement would materialize in the longer term The government also needs to engage in more active production sector and labour market policies that enable economic growth and reduce unemployment Fiscal reforms should gradually replace dependency on foreign resources with increased tax revenue and also help to reduce inequality
4
1 Introduction
Before its recent revolution Tunisia had shown to be one of the fastest growing economies in North Africa and the Middle East (MENA) since the 1990s According to the World Bank GNI per capita in current US$ reached 4070 in 2010 which is around three times higher than 30 years ago Indicators of social and economic wellbeing have also improved significantly during the same period Almost all Tunisian children attend school compared to only 80 percent for the MENA region as a whole and female labour participation is high in a regional context In Tunisia more children survive their first few years and life expectancy is higher than the average for both lower-middle-income and MENA countries In 2005 only 38 percent of the population lived in extreme poverty according to the lower national poverty line Inequality has also dropped steadily since the 1990s leading the Gini coefficient to hover around 0400 in 2005 having reached 0409 in 2000 and 0417 in 1995 As a result of these social and economic achievements the Tunisian middle class has expanded to amount for nearly 81 percent of the population development that had no doubt contributed to Tunisiarsquos stability before the recent revolution
Over the past two decades the poor have reaped benefits from the growth strategy
especially through their participation in the labour market and the accumulation of productive assets mainly human capital The growth strategy has been based especially on the development of labour-intensive and export-oriented manufacturing activities through which it has played an important role in accelerating economic activity and increasing employment for low- to middle-skilled workers mainly females Not only has the growth performance been essential in providing job opportunities for the population mainly the poor among them but it has also enabled the government to mobilize resources for financing social spending in order to couple the growth strategy with pro-poor policies Next to higher employment productivity has also enabled more growth during the past two decades Complementarily the diversification of the economy and the crucial role played by domestic demand especially consumptionmdashboosted by inflows of remittances have made it possible to compensate for episodes of less foreign demand since the 1990s
Unsurprisingly then Tunisia has made considerable progress towards the
Millennium Development Goals (MDGs) agreed upon in the 2000 Millennium Declaration of the United Nations Prior to the unfolding of the recent global financing crisis to a lower extent and recent political upheaval mainly Tunisia seemed to be on track to timely meet the majority of the targets at the aggregated national level
Progress in MDG indicators seen up until 2007 is not expected to have slowed
down owing to the global financing crisis that unfolded in the second half of 2008 simply because the government maintained a countercyclical spending policy that also helped to compensate for any reduction in private demand for MDG-related services (ie education health and water and sanitation) This ldquocountercyclicalityrdquo of public policy would come at a price though since for the first time since the mid-1980s Tunisia had opted to allow its budget deficit excluding grants and privatization to hover around 30 percent of GDP in 2009 and 2010 The Tunisian economy grew at a rate of 46 percent in 2008 compared with 63 percent a year earlier and the effects of the global financing crisis continued to be
5
felt in 2009 when the economy grew by 31 percent And just when the economy was showing symptoms of recovery and GDP grew by 38 percent in 2010 a revolution erupted in response to expressed discontent of the population over high rates of unemployment and skill mismatches in the labour marketmdashreflecting inequality of opportunitiesmdash food inflation overwhelming government control and perceived corruption and lack of freedom of speech and other political freedoms and poor living conditions This revolutin has raised new challenges on how the economy would be affected in the short to medium terms and how a fast recovery could be achieved to be back to decent economic growth The latest official estimates show that the economy contracted by 3 percent during the first half of 2011 and the government deficit rose to 5 percent of GDP as resul of lower fiscal receipts and higher social transfers Constitutional amendments could pave the way for a full-blown election and against this backdrop the international donor community has committed to help in the form of loans and grants for political and economic reconstruction Economic growth is expected to resume at a pace of 3 percent more or less by 2012 if the social tensions are resolved and investment is resumed
The countercyclical policies that Tunisia implemented in the midst of the global
financing crisis and their sustainability in times when economic activity is sluggish have been critical to maintaining MDG progress on track Areas where progress had been remarkable before the global financing crisis unfolded include extreme poverty reduction (MDG 1) universal primary education for boys and girls (MDG 2) reduction of child mortality (MDG 4) access to drinking water (MDG 7a) and basic sanitation (MDG 7b) In view of this progress the government had set more ambitions targets for these goals before the revolution unfolded and had added new progress indicators such as for example the quality of education Water and basic sanitaion service delivery had also been shielded against the global financing crisis as this is provided exclusively by two public enterprises with independent budgets and quiennal programs of investments Unfortunately reducing maternal mortality by two thirds (MDG 5) even before the crises presented the greatest challenge for Tunisia and the prospects for this goal to be achieved remain grim The likelihood of achieving this goal will depend on significantly improving access to parental care and reaching out to rural areas The government budget for 2009 and 2010 provided additional resources for improving parental care mainly at the most defavored regions of the country Again it remains to be seen if MDG progress is derailed by the recent political events that as said have stung economic growth in Tunisia and created a marked sense of instability
In view of the above it becomes imperative for Tunisia to have answers to the
following questions is the country on track towards the MDGs when proper consideration is given to the effects of the recent global financing crisis and political upheaval If the answer to this question is no the following additional questions are worth answering how much additional public spending would need to be scaled up to achieve the MDGs What financing mechanisms for the additional public spending requirements would be feasible for Tunisia given the existing macroeconomic constraints What macroeconomic trade-offs would the MDG-financing strategy trigger on the economy And to what extent will increased MDG spending operate as an effective counter-cyclical response to add to the current efforts on the government aiming at economic recovery
6
This paper has been elaborated to respond to these questions using a computable
general equilibrium (CGE) model called MAMS (Maquette for MDG Simulation) which has been calibrated to a Tunisian dataset This model has the unique characteristic of including a module of determinants for MDGs 2 (primary education completion) 4 (child mortality) 5 (maternal mortality) 7a (drinking water coverage) and 7b (basic sanitation coverage) which are here subject to study This model is explained in detail in Lofgren and Diaz-Bonilla (2010) and here only some of its salient features are spelled out MDG 1 (extreme poverty reduction) is an exception in that MAMS does not identify any public spending that can be directly associated with that goal and being a macroeconomic model it further lacks sufficient detailed specifications of the income distribution in order to analyze poverty changes in a rigorous manner In the above said project (see footnote 1) most country applications of MAMS have combined this model and a microsimulation approach that helps to determine how changes in the labour market as generated by MAMS affect poverty and inequality when these changes are imposed into a micro dataset with and without increases in public spending aimed at meeting the other MDGs1 Due to a lack of access to a detailed household survey the microsimulation approach could not be applied for Tunisia Even though MDG 1 had already been met in Tunisia it would have been interesting to determine if this poverty reduction goal would continue to be achieved considering the effects of the global financing crisis and mainly those of the political revolution
The paper includes 5 more sections The main reforms and macroeconomic policy
performance and vulnerabilities of the 1990-2008 period are discussed in section 2 Some reference to the global economic and political crises of the 2009-11 period is also made in this section Section 3 is on social policy aspects and the progress made towards meeting the MDGs and the prospects of achieving the pre-established targets in the future The main principles of MAMS as well as the main steps for implementing it with Tunisian data are explained in the fourth section followed in the same section by the analysis of results generated through different scenarios Finaly section 5 presents the main conclusions and some policy recommendations
2 Reforms and macroeconomic policy performance and vulnerabilities
21 Main economic reforms and policies
The beginning of the implementation of the structural adjustment program (SAP) in mid-1986 represents a turning point in economic policymaking in Tunisia since its independence This program was aimed at (i) preserving the stability of the macroeconomic framework and financial balances (ii) integrating Tunisia into the world economy (iii) redistributing income by reconciling social and economic policies and (iv) widening the middle class and reducing poverty The reforms were expected to boost economic growth that would trickle down in favour of the population in order to improve income levels and employment
1 For more details on this methodology see Vos and Saacutenchez (2010)
7
The SAP has laid out the principle strategic directions of the economy up until the
unfolding of the global financing crisis in late 2008 A key pillar of this programrsquos reforms has been the integration of the Tunisian economy into the world economy The orientation towards the liberalization program has been intensified since the countryrsquos accession to the WTO in 1995 and the implementation of a number of free trade agreements (FTAs) with main partners The association agreement with the European Union (EU) which began to be fully implemented in 2008 represents the major trade agreement signed by Tunisia In parallel a host of programs and economic policy actions aiming at reinforcing competitiveness have been committed during the same period They have sought the consolidation of tax and financial legislations reforms more deregulation of investments trade and prices rebalancing of the roles of the public and private sectors modernisation in the administration of the financial and banking systems improvements in infrastructure and development of human resources and upgrading of firms and production sectors
In spite of the gradual liberalization of trade in manufacturing the offshore export
sector has been benefiting from very generous government incentives since the 1970s up until now particularly a special duty-free regime on imported inputs as well as a corporate income tax holiday for 10 years Policies that have protected capital-intensive activities from competition through a high taxation of imports and a complex system of non-tariff barriers may though have hurt the poor through the development of import-substitution capital intensive-activities rather than labour-intensive activities However the export incentives seem to have corrected these biases to a large extent through fostering the development of labour-intensive light manufacturing sectors that have boosted growth and employment with favourable results in terms of poverty reduction Nonetheless exchange rate policy has not been active in improving the international competitiveness of exports as further explained below
The control of inflation represents an important instrument for fighting poverty in
Tunisia since the income of poor households tends to be less indexed to consumer price changes compared to the income of non-poor households such that it would more likely lose purchasing power faster in tandem with growing consumer prices The Tunisian government managed to keep inflation under control through a better management of monetary and fiscal policies The average inflation rate was close to 5 percent in the 1990s and it declined subsequently to less than 3 percent in the period 2000-07 In 2008 and due to higher food and energy prices inflation rose up to 5 percent but declined in 2009 to 37 percent (IMF 2010) The budget deficit as a share of GDP has also been brought down from an annual average of almost 5 percent in the 1980smdashwhen social spending and generous increases in government salaries resulted in macroeconomic disequilibriamdashto less than 3 percent on average in 2000-08 By 2010 the current account deficit had been brought down to less than 3 percent of GDP way below the record for the 1995-2007 period These results are a clear indication of better macroeconomic management and a more stable macroeconomic environment
8
22 Evolution of the economy since 1990s
Tunisia witnessed good economic performance between 1990 and 2007 GDP grew on average by 39 percent per annum in 1990-95 When reforms matured and their effects became apparent growth went up to 56 percent per annum during the second half of the 1990s and it subsequenly declined slightly to 49 percent per annum during the period 2000-07 As a result of the global financing crisis growth dropped to 45 percent in 2008 and 31 percent in 2009 The economy recovered slightly in 2010 when output grew by 38 percent Up to this point the growth outlook was relatively healthier compared to the dire economic situation that many other parts of the world were facing Nonetheless the political turmoil that erupted in late 2010 and continued to unfold in early 2011 triggered by discontent of the population over unemployment and corruption translated into economic instability and growth deceleration As a result growth has declined by 3 percent during the first half of 2011 and it is expected it will not exceed 1 percent by the end of the year
The positive growth performance achieved up until 2007 had been driven by a development model that combined prudent macroeconomic management and direct government involvement in productive decisions through a complex system of incentives and ad hoc interventions However the effectiveness of this model to further propel growth has been challenged by high unemployment vulnerability to external shocks and low competitition in services sectors The global financing crisis came to make these challenges more apparent and many of the problems were magnified as a result of the revolution clearly the high level of youth unemployment which hovered 25 percent by the end of 2010
Good growth performance in 1990-2007 Tunisia has by and large experienced good growth performance since the past decade with total and per capita GDP growing at an average annual rate of 48 and 72 percent respectively in the period 1990-2007 Growth has not been steady though owing to major shifts in economic policy and external shocks driven by volatility in international prices and changes in the worldrsquos demand for Tunisian exports Furthermore growth has also fluctuated as result of changes in weather conditions particularly the drought of 1990-95 which led to a reduction in agricultural output and increased rural poverty Even so overall GDP per capita rose by about 12 percent per annum during that six-year period The economy was spurred by exports and picked up steam during the second half of the 1990s when it recorded a high increase in per capita GDP of 42 percent per annum that had not been seen since the 1970s
9
Table 1 Tunisia Sectoral composition of GDP 1990-2007 (Percentage)
Sector Average
contribution to GDP
Average annual growth rate
Agriculture Industry - manufacturing - construction - gas electricity and water - mining and quarrying Services
134 292 176 46 62 08
574
28 42 47 58 21 16 56
Source Authorsrsquo estimates based on data from the World Bankrsquos World Development Indicators
The sectoral composition of GDP reveals four major trends for the period 1990-2007 (Table 1) First the services sectormdashwhich accounts for about 57 percent of GDPmdashhas provided the largest contribution Such a result is ascribable mainly to the emergence of new sectors with high potential in the services activities The share of knowledge-intensive activities in GDP for example improved rapidly going up to 203 percent in 2000 from 128 in 1997 These activities include financial services health education data processing telecommunications and services rendered to the companies The advancement of education and health services has been a positive development for MDG achievement Tourism has become a key driver of the Tunisian economy making a significant contribution to GDP but its value-added has grew only by 4 percent on average over the 1990-2007 period compared with more than 10 percent over the 1970s and 1980s In 2009 this sectorrsquos contribution to GDP reached 5 percent and its share to current receipts represented 116 percent Moreover this sector accounted for 450000 jobs in 2009 the equivalent to 12 percent of the employed population
Second output growth in manufacturing has been larger than in the overall industrial sector (47 versus 42 percent on average in 1990-2007) However manufacturingrsquos share in total GDP averaged only 176 percent over the same period which is considered much smaller than in fast growing economies The fastest growth has been seen for electrical and mechanical industries (73 percent on average compared with 39 for textiles and garment industries over the period 1990-2007) Excluding the food industry which to a large extent depends on agricultural domestic output the rest of manufacturing value-added grew by 51 percent in 1990-2007 Manufacturingrsquos share in total employment has nonetheless remained stable at 323 percent in spite of this sectorrsquos GDP growth The textiles and clothing sub-sectors have been the most important employers though their share in total employment has decreased and it is likely to decrease further as a result of growing competition (ETF 2007) However the fast growth of this sector has facilitated the absorption of a large active female population with low skills
Third export-oriented sectors textile and electromechanical equipment industries
in particular have been weakly integrated with the rest of the economy In view of this they have generated low value-added thus limiting their contribution to growth Overall
10
growth has decelerated in traditional manufacturing activities (textiles and clothing) and in activities producing for the domestic market
Fourth agriculturersquos contribution to GDP has fluctuated notably On average it
was 134 percent in 1990-2007 but it has shown to be on average below 10 percent in the period 2005-09
In times when the international economic situation has become unfavourable to Tunisia domestic demand has constituted an important factor for the observed increase in GDP During the past two decades private consumption has intensively contributed to growth and through this it has to some extent compensated for the decline in foreign demand during periods of international crisis such as for example the period when the first gulf war took place in 1991
Private consumption remains the main driver of growth and occupies a central place in Tunisiarsquos development strategy By increasing at an average rate of 47 percent per annum during the period 1990-2007 private consumption accounted for 62 percent of GDP during the same period which is higher than the contribution of exports
In spite of successive privatization plans initiated since the adoption of the SAP
public consumption also remains high at 15 percent of GDP in 2007 compared with 16 percent in 1990 Over the period 1990-2007 public consumption grew by 44 percent per annum and as further shown below this has positively affected progress in terms of meeting the MDGs
Exports are the second driver of growth owing to the export-led growth strategy
that has been implemented since independence in the mid-1950s Oil and other mining products made up for the bulk of exports during the first two decades followed by labour-intensive manufacturing products during the following decades A competitive export-oriented manufacturing sector was developed with participation of foreign firms that were attracted by fiscal incentives The role of this sector continues to be crucial for growth Exports of goods and services grew by 5 percent per annum during the period 1990-2007 which was slighly more than GDP growth during the same period (Table 2) Through such growth pace the average contribution of exports to GDP reached 437 percent over the period 1990-2007 This result was also influenced by an increase in Tunisiarsquos share of the European market and the diversification of markets in general and of products The export supply has been diversifying to high value-added activities in agriculture agribusiness industries mechanical and engineering industries electrical and electronic industries and services
11
Table 2 Tunisia Growth performance and key macroeconomic indicators 1990-
2007 (Period annual averages in percent)
GDP growth rate GDP per capita growth rate Inflation rate Population growth rate Labour force growth rate Domestic demand growth rate Domestic demand as share of GDP Exports growth rate Exports as share of GDP Investment growth rate Investment as share of GDP
48 72 39 13 31 46
776 50
437 40
233
Source Authorsrsquo estimates based on data from the National Institute of Statistics (wwwinsnattn) Note all figures are measured at constant prices
Gross fixed capital formation is the third driver of growth with an average
contribution to GDP estimated at 233 percent during the period 1990-2007 Over the same period total investment increased by 4 percent per annum at constant prices Despite the several policy reforms implemented to increase the role of the private sector in the economy the public sector still plays a crucial role to boost investment The share of public investment in total investment represented 178 percent in 2008 This has been important to maintain relatively sufficient capital stocks for the provision of MDG-related services
In addition to the above factors total factor productivity (TFP) has also contributed to observed growth It accounted for roughly a quarter of GDP growth (including the contribution of human capital) during the period 1980-2000 This contribution went up from 415 percent in 1997-2001 to 469 percent in 2002-06 (Isaksson and Hee Ng 2006) Successive reforms to education and training systems that were aimed at providing both required skills and competencies and a more favourable work environment for better resource use likely boosted productivity This achievement has also likely been driven by better economic performance more exposure to new communication and information technologies as Tunisia has been integrating more into the world economy and more support for research and innovation to diversify products and improve competitiveness
Growth mildly affected by the global financing crisis As said GDP growth rates declined to 45 percent in 2008 and 31 percent in 2009 respectivelly from 64 percent in 2007 This was a clear manifestation of the effects of the global financing crisis on Tunisiarsquos economy However the external position of the country remained solid during the 2008-9 biennium The resilence of tourism receipts and remittances of Tunisian workers from abroad and foreign direct investment (FDI) inflows enabled the country to record confortable reserve levels totaling some US$ 9 billion at end of May 2009 which represent around 56 months of imports (IMF 2009ab) The current account deficit was 42 percent of GDP in 2008 owing to rising imports of commodities and capital goods and it continued to be largely financed by FDI inflows The fiscal
12
position improved markedly in 2008 as the deficit fell to 12 percent of GDP which brought the public debt ratio down to 475 percent of GDP from 581 percent in 2005 At the same time the external debt has continued to decline it went to 537 percent of GDP by late 2008 down from 653 percent in 2005
Tunisia has deployed measures to contain the impact that the global financing crisis has had on its trading partners These measures include a fiscal stimulus package of about 14 percent of GDP and a more accommodating monetary policy by the Central Bank of Tunisia (CBT) The fiscal stimulus package has been geared at supporting the export sector without deliberately boosting internal demand to avoid any deterioration of the trade deficit In response to exporting firms facing a contaction of demand the Tunisian parliament approved a bill in December 2008 that provides for a series of measures to prop up export-oriented businesses including a 50 percent export insurance to be paid for by the government and a 50 percent state reimbursement of social security expenses related to the reduction of working hours (from 48 to 40 per week) This package was revised in June 2009 when the government adopted an amendment that foresees limited relief from corporate tax and VAT for those companies with business volume contracting by more than 15 percent in 2009 However the implementation of this fiscal package was considered to be very slow and therefore it was deemed inefficient (IMF 2009ab) On monetary policy the CBT reduced interest rates implemented policies to increase credit and liquidity in the banking system and doubled its capital to finance small and medium enterprises aiming at boosting domestic investment As a result of this stimulus package the government led the budget deficit before grants and privatization to represent 30 percent of GDP in 2009 from only 1 percent in 2008 while keeping a close eye on macroeconomic stability the external position the public debt ratio and inflation
The economy has reaped benefits from the adoption of the stimulus policies it
managed to grow by 31 percent in 2009 at the same time that most of its main trading partners were witnessing economic recession This relatively good performance was mainly achieved through a better resistance of domestic demand including household consumption and private investment in addition to more government demand Gross fixed capital formation represented 275 percent of GDP in 2009 18 percentage points more than in 2007 and 62 percent of this new investment was contributed by the domestic private sector and 271 percent by FDI Private consumption decelerated notably but it still managed to represent around 62 percent of GDP in 2009 having likely been encouraged by remittances from abroad which declined only by less than 1 percent in local currency compared with their 2008 level The impact of the global financing crisis was mainly manifested in trade In 2009 export and import values (in US$) declined compared to 2008 but the trade deficit fell from -89 percent of GDP in 2008 to -85 in 2009 (IMF 2010) Moreover the overall impact on the current account deficit was also positive as this went down from -38 percent of GDP in 2008 to -28 percent in 2009 owing to net capital inflows and a continued reduction in the foreign debt service Thus the general balance of payments posted an impressive surplus of US$1619 million in 2009 which however represent a slight decline compared with 2008 (US$1662) which helped to boost the level of net assets in foreign currency Facilitated by the absence of additional foreign borrowing the external debt position improved as indicated earlier On the fiscal front in spite of a sharp increase in
13
outlays by the general equalization fund and subsidies for fuel and transport the budget deficit (net of debt service payments and exclusive of privatization and grants) was kept relatively low and it actually went down to only 10 percent of GDP in 2008 owing mainly to higher tax revenues and the rationalization of public expenditure The budget deficit worsen as result of lower economic growth and the adoption of the stimulus program in response to the global financing crisis leveling off at 3 percent of GDP in 2009
The prospects for 2010 were conditioned by uncertainties on the expected global recovery which could particularly have affected exports tourism receipts and workersrsquo remittances from abroad The 2010 budget law maintained a supportive fiscal policy to ensure that the current economic recovery would not be undermined by an early withdrawal of the fiscal stimulus measures introduced in 2009 As said the economy managed to recover by 38 percent in 2010 just to find itself derailed again as a result of the revolution
Growth has been pro-poor Tunisian public policy has targeted growth in tandem with poverty alleviation Integrated rural development programs have been put in place to provide the infrastructure needed to develop agriculture and integrate this sector more with urban areas More investment in education health and birth control programs has helped to increase the quality of human capital significantly both in rural and urban areas The strategy of industrial development based on light manufacturing and export growth as well as the development of tourism has had a high pay-off in terms of employment creation particularly for low-skilled workers The development of other capital-intensive activities such as automobile assembly has however negatively affected efficiency growth job creation and poverty The education strategy pursued in the first two decades after independence (the 1960s and 1970s) was very selective with respect to passing grades and graduating from primary school enabling the availability of a relatively competent civil service and a working force whose recruitment has helped to boost growth and reduce poverty
Six household expenditure surveys have been conducted in Tunisia every five years since 1980 Poverty incidence calculated from them and economic growth figures seem to be highly correlated In this respect five periods can be identified During the period 1980-85 poor economic management and inefficient investment projects undertaken by the public sector resulted in lower economic performance compared to the 1970s However poverty dropped sharply as a result of higher agricultural growth and as the government raised salaries including the minimum wage for farm workers at unprecedented rates and granted record food subsidies The incidence of poverty continued its sharp decline during 1985-90 as the stabilization policies and the SAP were adopted particularly in rural Tunisia where it dropped by as much as six points and agricultural value added continue to grow even though the economic adjustment needed to correct the macroeconomic disequilibria of the first half of the 1990s induced a sharp decline in investment that resulted in a moderate slowdown in growth The reduction of poverty likely was associated with a sharp decline in inequality the Gini coefficient dropped to 040 in 1990 from about 045 in 1985 A third stage 1990-95 witnessed the incidence of rural poverty going up by 27 points for the first time since 1980 while urban poverty declined slightly GDP grew
14
faster than in the previous period but agricultural output contracted due to three consecutive years of drought that put rural poverty on the increase Fourth in the period 1995-2000 rural poverty decreased notably as agricultural output rose and growth accelerated at the fastest pace seen since the late-1970s Lastly in the period 2000-05 poverty continued on the decline in spite of the fact that inequality on the contrary deteriorated In this period rural households were most negatively affected by declining producer prices whereas on the other hand urban households witnessed successive rises in wages and improvements in capital incomes owing to sustained economic growth as further explained below Poverty is expected to increase for 2011 as a consequence of the revolutionrsquos effects on employment and growth
Changes in poverty have been decomposed to gauge the extent to which these have
been explained by variations in mean incomes (growth effect) and income inequality (distribution effect) This kind of analysis allows us to determine if these two factors have worked in the same or the opposite direction and the extent to which growth has been pro-poor Ayadi et al (2005) and Lahouel (2007) have shown that the growth effect has been the major determinant of the continuous reduction in the poverty headcount from 1980 to 2000 The distribution effect has generally been either weak or contrary to the growth effect Complementary evidence is given in the study of Chemingui and Bchir (2008) who found a computed growth elasticity of poverty reduction in the ndash35 to ndash48 range for the 1985-2000 period (that is during that period any 1 percentage point increase in economic growth would reduce the number of poor by 35 to 48 percent)
24 Vulnerabilities and economic constraints
The Tunisian government in all fairness can claim some notable achievements in the area of macroeconomic stabilitymdashhaving tamed inflation and reduced public deficits before the stimulus policies were enactedmdashbut there are still some concerns First Tunisiarsquos tight fiscal policies have permitted to reduce inflation but economic growth may likely have been higher without them Second tight moneraty policy has also led to a persistently overvalued currency making it more difficult for producers to compete with other developing country exporters such as China Third fiscal discipline aimed at controlling the public deficit and the external debt has likely prevented the country from enjoying higher and sustained economic growth through a bolder attempt of scaling up public spending mainly to improve infrastructure Fourth government regulation of many activities represents a real obstacle towards improving domestic competition that would be healthier for economic growth
Health of public finances
The health of the public finances has been fragile to mandatory expenditures Fluctuations in international prices of key commodities such as oil and food have also borne a cost on the government budget and the financial balances of public companies operating in these sectors The phasing out of tariff protection on imports from the EU and other trading partners has also translated into considerable reductions of revenues from duties But
15
reforms to the VAT system and a better collection of taxes on income and profits have allowed the government to compensate for revenue loses (Table 3) Table 3 Tunisia Structure of public revenues 1995-2009 (Percent of total and
GDP)
1995 2000 2005 2009
Percent of tax revenue
- Direct taxes (on income and profit) 239 300 365 398
- Import taxes 228 121 64 45
- VAT 265 332 291 291
- Taxes on consumption 176 176 1533 137
- Other taxes 91 71 126 130
Percent of GDP
- Import taxes 45 24 12 09
- Tax revenue 199 198 206 199
Source National Institute of Statistics of Tunisia (INS in French)
However the government has had to rely relatively more on domestic borrowing to finance its deficit even though the level of national savings is relatively low (Table 4) Domestic borrowing has recently been more seriously constrained though not only because the domestic bond market is relatively underdeveloped but also because workersrsquo remittances from abroad which have come to represent nearly half of national savings have been on the decline since the global financing crisis unfolded and more intensively in 2011 as a result of the revolution and civil war in Libia the main destination of Tunisian migrants Table 4 Tunisia Government deficit borrowing and debt 1995-2009 (Percent of
GDP)
1995 1996 1997 1998 2005 2006 2007 2008 2009
Overall deficit (excluding grants and privatizations)
-45 -51 -42 -28 -32 -36 -31 -10 -30
Overall deficit (including grants and privatizations)
-41 -49 -38 -06 -26 -30 -27 -04 -27
Government borrowing 41 48 38 06 -26 -30 -27 04 27
- Foreign 29 27 24 00 08 -03 -07 02 00
- Domestic 12 21 14 06 18 33 34 02 27
Central government debt 584 606 625 581 583 537 500 433 428
- Foreign 384 365 388 353 210 216 209 170 177
- Domestic 200 241 237 228 372 321 291 263 250
Source INS
16
Maintenance of the budget deficit within tolerable limits has been seen as a precondition to achieve sustained growth and improve the effectiveness of state intervention to support economic and social development For this reason the government has opted to decrease its budget deficit as a percentage of GDP (excluding privatization and grants) with good results had not been for the global financing crisis in response to which stimulus policies put the government deficit back to 3 percent of GDP in 2009 from just 1 percent a year earlier (Table 4) Improvements in the fiscal stance have been possible through reforming taxes to rationalize tax incentives and continue with the progressive reduction of the inclusive tax regime improving the allocation of public resources enhancing the private-public partnership in the field of infrastructure and delivery of some services previously provided solely by the state and limiting fuel subsidies through the continued control of energy use and the progressive adjustment of domestic prices as the economic situation requires This fiscal discipline has translated into a reduction of the government debt to 428 percent of GDP in 2009 from 583 percent in 2005 (Table 4) There remains to be seen if the declining trend of the debt can no longer be sustain owing to the political crisis
External shocks
Tunisiarsquos engagement in trade liberalization introduced two important challenges to the economy There was concern about the likely impact of tariff reductions on tax revenue on the one hand and the possible impact of increased imports on the trade balance and the balance of payments on the other However export promotion policies combined with higher inflows of remittances and FDI enabled a reduction of the current-account deficitmdashto 24 percent of GDP in 2007 from 58 percent in the period 1992-96mdashand an increase in foreign-exchange reserves to be able to cover more than 5 months of imports of goods by late 2007mdashcompared to only 2 months in 1996 Finaly as said foregone import-tariff revenue has been compensated by new revenue resulting from a more sound policy of domestic taxation mainly through reinforcing VAT collection
In addition to trade liberalization Tunisiarsquos economy has been exposed to higher world prices for imported products (mainly food and energy) The relatively high level of diversification has helped the Tunisian economy become less vulnerable to world price shocks Tunisia exports regime is more diversified than in most other MENA countries and it comprises agricultural goods energy some mining products services and various manufactred products
Capital controls for both residents and nonresidents have also allowed the country
to reduce the vulnerability to capital flows More in general good macroeconomic management has permitted Tunisia to more adequately deal with external shocks Starting in 1986 when a sharp fall in oil prices nearly precipitated a balance of payment crisis the authorities have followed consistent stabilization policies and have adopted gradual adjustment measures including through expenditure restraint revenue measures and control of monetary aggregates The exchange rate has been managed flexibly while maintaining overall real stability
17
Economic imbalances and their financing By various indicators Tunisia is a moderately indebted country Total external debt was estimated at 549 percent of GDP by the end of 2007 which is slighly higher than the average annual of 52 percent of GDP of the early 1990s The debt service for principal and interests as a share of exports of goods and services was about 13 percent by the end of 2007 compared to 25 percent on average for the 1990s
To ensure that external balances remain sustainable in the future and avoid higher indeptedness Tunisia is pursuing a three-pronged strategy It is encouraging export development (through the mise agrave niveau or upgrading program) inflows of FDI (including through privatization) and workersrsquo remittances to stengthen foreign-exchange generating capacity It is also trying to deepen the domestic financial markets to ensure adequate budgetary financing from domestic sources Last but not least Tunisia only resorts to international capital markets carefully and strategically in order to maintain its past record as a responsible and reliable debtor that is able to borrow at low emerging market spreads
In the medium term the main risk to Tunisiarsquos external outlook would come from a
failure of this three-pronged strategy A serious deterioration of external balancesmdashthat could be brought about by a concurrent surge in imports from the EU a drop in exports because of weak international demand and domestic competitiveness or less FDI or workersrsquo remittancesmdashwould lead to significantly larger borrowing requirements accompanied by worsening borrowing conditions for emerging economies Not only could this result in an increase of external indebtedness but the external debt profile could also deteriorate through unfavourable rates and terms structure Simulation results presented below however show that the government would need new debt to finance public spending that needs to be scaled up to achieve some MDGs should it find it unfeasible to mobilize resources domestically or unlikely to be fully supported by international donnors
3 Social policy and progress towards the MDGs
31 Evolution and structure of public spending
During the period 1991-2008 public spending (current and capital) averaged 364 percent of GDP compared to 387 percent during the period 1991-2000 Around 48 percent of total budget expenditure has been allocated to current spending Nonetheless the share of current spending increased towards the end of that period and on average reached 49 percent per annum in 2001-08 4 percentage points more than in 1991-2000 All current spendings have grown fast especially salaries and wages which account for the builk of total spending (on average around 66 percent) As a result total current spending increased by 8 percent per annum over the period 2006-08
Since independence the Tunisian government has been paying special attention to
social sectors with a view to improve the social conditions of the population Total public spending on education and health the two main social sectors has however followed an
18
unsteady trend First it fell from 273 percent of total public spending in 1990 to 212 percent in 2000 in order to revert this trend to jump up to 297 percent in 2008 (Table 5) However the share of public spending allocated to the health sector has recorded an impressive decline from over 10 percent during the 1970s and 1980s to a meager 57 percent in 2008 This is the direct result of a voluntary policy of supporting the development of a private health system for which Tunisians have shown growing preference as they have witnessed improved healthcare results Nonetheless as will be shown below the country will still need public interventions to achieve health-related development goals especially that of maternal mortality
Table 5 Tunisia Government spending on transfers and social services 1990-2008 (Percent of total government
spending)
1990 2000 2006 2007 2008
Spending on education 207 160 251 252 240
Spending on health 66 52 61 63 57
Spending on agriculture and water mobilization 61 48 44 41 51
Spending on electrification 41 46 na na na
Food subsidies 88 56 28 27 76
Transfers and other subsidies (energy) 115 159 113 105 123
Source Authorsrsquo calculations based on data from INS
Convinced of the very important repercussions that developing the education sector
may have for human capital investment and unemployment reduction the government has alloted notable amounts of public spending to this sector since independence Primary and seconday education are accessible and free of charge to all individuals while a partial contribution is paid by students at the tertiary level Public spending on education on all education levels has historically been high Its share in total public spending climbed from 207 percent in 1990 to around on average 25 percent over the period 2006-08 Over the period 1990-2008 little more than 91 percent of this spending has been to pay for recurrent activities though which is an indication that infrastructure may be lagging behing in the education sector It is only in 2009 that capital spending increased sharply with the implementation of the fiscal stimulus package of about 14 percent of GDP to invest in public infrastructure health and education and to provide direct support to exporting firms affected by the crisis
Public spending has also been important for agricultural development and water
mobilisation and distribution Most of this spending is alloted for investing in irrigation drainage and reuse of treated wastewater on the one hand and for mobilizing and distributing drinking water on the other The share of public spending alloted to these activities covered about 51 percent of total public spending in 2008 which is about a percentage point below the share of 1990 However it is important to clarify that public spending on mobilization and distribution of safe drinking water is managed by a public enterprise called National Enterprise of Mobilization and Distribution of Water (SONEDE) and a large share of the cost of investments is recovered through periodical bills paid by
19
households Only farmers are paying a small part of the effective cost of distribution of water used for irrigation while investment cost is entirely paid the government
The same effort is also made by the government regarding the production and
distribution of electricity through a public enterprise named Tunisian Enterprise of Electricity and Gas (STEG) which produces and distributes electricity with a full cost-recovery policy from the private sector
The government keeps food subsidies it has granted since the 1970s in order to
maintain domestic food prices at low levels This policy was universal for all household types at the outset until reforms in the 1990s and 2000s allowed for targeting products of basic consumption for the poor Despite the various reforms the cost of this policy represented 76 percent of total government spending in 2008 against only 28 percent in 2006 The high increase in government financial support for household food consumption increased in 2007 and 2008 as result of the food crisis (that is when world food prices of 2008 tripled those of 2000)
Finaly it is important to indicate that the government raised transfers including
social security faster than it increased total expenditure as a result of a challenging progressive reallocation of resources from tradicional social sectors to newer ones In 1980 the government allocated around 75 percent of its resources to social security Two decades later this share had jumped to 159 and 123 percent in 2000 and 2008 respectively and it is expected it will increase owing to the demographic transition of the population
32 Social policy and poverty reduction
Improved living conditions are the main manifestation that social achievements have been at the height of the governmentrsquos commitment to ensure comprehensive development with interdependent dimensions Since independence social policy in Tunisia has been aimed at improving the purchasing power of the population reducing unemployment and poverty improving skills through the development of education and health systems and improving access to social services and gender equality
In the period 1990-2008 peoplersquos incomes benefited from continuous monitoring
facilited by social negotiations the revision of collective agreements reforms to remuneration scales the revision of the minimum wage and the amendment to the labour code The purchasing power of minimum wage workers has been preserved owing to successives revaluations of this wage category At the same time the average purchasing power underwent an improvement of about 2 percentage points annually over the period 1990-2006 due to a continued increase in wages but also to the control of inflation
The government has also intervened intensively to limit the negative repercussions
of economic deregulation on the vulnerable social sectors with the help of a package of social protection instruments Welfare transfers doubled between 1996 and 2005 to adopt such social protection policies with an average cost estimated at 04 percent of GDP (Bibi
20
and Chatti 2007) Also the government continued to subsidize food consumption in spite of the relatively low level of international prices for most agricultural products before the recent food crisis of 2007-08 and even though subsidies have largely decreased since the implementation of the structural adjustment program Since the mid-1990s these subsidies have been more targeted to products consumed by the poor thus contributing significantly to poverty reduction particularly in urban areas The government also implemented many programs of public works to benefit the unemployed poor with a cost estimated at 012 percent of GDP Finally the government is providing almost universal health care to the population with various levels of personal contributions to the real costs of the service delivered The health care system is estimated to cost to the government around 52 percent of the countryrsquos GDP (Bibi and Chatti 2007)
The results recorded in terms of wages incomes and welfare transfers have
improved living conditions Not only has the poverty rate declined as further shown in the below but the share of rudimentary houses has shrunk from 27 percent in 1994 to 08 percent in 2004 and there has been a noticeable 80 percent increase in the rate of household ownership As will also be indicated below the coverage of utility-service indicators (ie drinking water basic sanitation and electrification) has increased notably too particularly in the rural areas
Even though the education system has serious weaknesses it has provided the poor
with significant opportunities to improve their living conditions Several indicators that will be presented below show that there has been remarkable progress in education for example a sharp increase in the average number of years of education among the active population Progress has been higher in coastal regions but this has by and large been shared among the population including regions such as the centre-west where poverty is concentrated
The health system has remained basically public although the private system has
undergone a fast development in recent years as mentioned earlier With the implementation of the National Funds of Health Insurance in 2007 both rich and poor people have the same access to health services and health policy seems to have translated into better health and social security indicators (see next subsection)
Family planning and birth control programs which Tunisia embarked on as early as
the beginning of the 1960s in spite of the fact that this was very unusual for a Muslim country have no doubt played a very important role in moderating population growth over the last three decades from around 3 percent at the beginning of the 1960s to around 11 percent in 2007 This sharp drop in population growth may have had influence on poverty alleviation
Rural development programs have also been a major component of government
policy for the last two decades providing infrastructure water supply electrification roads etc Moreover direct social transfers have been provided for more than 100000 households In 2010 public social expenditures including direct transfers accounted for 18 percent of the GDP
21
33 Evolution of the MDGs over 1990-2005
Tunisia has made considerable progress in achieving MDGs though it may not be fully ready to meet all targets by 2015 under current public spending policies Until 2005 progress in achieving the target of reducing maternal mortality by two thirds was being insufficient and here is where the country faces one of its bigest MDG challenges Areas where progress has on the contrary been remarkable include poverty reduction universal primary education as measured by the primary completion rate for boys and girls and child mortality Progress before the global financing crisis and the political revolution had prompted the government to raise its ambitions to achieve these goals adding new progress indicators such as the quality of education
The Tunisian government has aknowledged that progress at the national level is not
always matched at the sub-regional level where disparities do exist While some regions in the country have experienced remarkable strides in development others are still lagging behind according to the most recent UNDP report available (UNDP 2004) In order to truly address development issues and alleviate poverty for all Tunisians by 2015 more attention would need to be given to the specific challenges facing each of the individual sub-regions A review of progress made in achieiving various of the MDGs and the prospects to achieve them by 2015 is provided in what follows Table 6 shows the progress made in achieving various MDGs until 2005mdashthe base year of a CGE analysis presented in section 4mdashor circa This progress is compared to the targets set for 2015 in order to indicate if based on a linear continuation of past trends Tunisia would seem on track to timely meeting the targets without further policy efforts
Table 6 Tunisia MDG achievement and targets for 2015
1990
(or circa) 2005
(or circa) 2015 target
MDG 1 Poverty headcount ratio (percent of population) - National poverty line - US$125-a-day poverty line (PPP)
67 59
38
25(2000)
34 30
MDG 2 Enrolment rate (percent) - Children aged 6 years - Children aged between 6 and 11 years
963 881
992 (2008-09) 977 (2008-09)
1000 1000
MDG 4 under-five mortality rate (per 1000 live births) 373 221 (2002)
184 (2007)
166
MDG 5 maternal mortality rate (per 100000 live births)
748 548 (2000) 187
MDG 7a Access to clean water (percent of population) 750 978 (2004) 10001 MDG 7b Access to basic sanitation (percent of urban population)
599 (1994)
704 (2002) 783 (2004)
10001
1 A national full coverage target is used in the table and in the policy scenario analysis as further shown below The international target of reducing by half the proportion of the population without coverage (from base year) would be 989 per cent for clean water and 892 percent for basic sanitation in both urban and rural areas Source INS (various publications) World Bank (2007) and UNDP (2004)
22
MDG 1 Eradicate extreme poverty and hunger Social achievements and equity are among Tunisiarsquos greatest assets Not only have these helped ensure internal cohesion but they have also distinguished Tunisia from other countries in the region Pro-poor economic growth and social policies along with lower population growth as indicated earlier have all translated into an impressive record of poverty reduction over the years The incidence of extreme poverty (using the national poverty line) went down from 40 percent in 1960 to 129 percent by 1980 and further down to 67 percent by 1990 (Table 7) This reduction has been possible during a period in which income equality declinedmdashaccording to the Gini coefficient However the rhythm at which extreme poverty incidence had been declining decelerated during the first half of the 1990s when income equality increased The extreme poverty incidence regained its declining trend between 1995 and 2005 where it reached at its lowest level (38 percent) In this period incomes also became more fairly distributed Average per capita expenditures for the lowest decile of the population moved closer to mean expenditures for the country as a whole In absolute terms the number of poor increased from 600000 in 1990 to 690000 in 1995 and fell to 400000 in 2000 (World Bank 2003) Nonetheless many households can be vulnerable to sliding back into poverty as their consumption is closely distributed around the poverty line
As for extreme poverty using the international US$125 a day poverty line it went down from 59 percent in 1990 to 25 percent in 2000 overachieving the 2015 international target of about 30 percent as set for MDG 1 in Table 6 Having also been able to reduce extreme poverty to 38 percent in 2005 as mesured by the national poverty line (Table 7) a decent economic recovery after the global economy crisis and the revolution without any marked deterioration in income inequality would likely take Tunisian to achieve the 34 percent national target by 2015 (Tables 6 and 7) Table 7 Tunisia Poverty incidence and inequality
1 1980-2005
1980 1985 1990 1995 2000 2005
Extreme poverty incidence (percent of the population)
Urban 118 84 73 71 49 19
Rural 141 70 57 49 29 71
Total 129 77 67 62 42 38
Gini coefficient
Urban 0418 0432 0374 0389 0391 na
Rural 0412 0379 0354 0353 0358 na
Total 0455 0453 0401 0417 0409 0400
1 Both poverty incidence and inequality are computed based on consumption per capita data The national extreme poverty line is used to calculate the poverty incidence Source INS
23
MDG 2 Achieve universal primary education The objective of education for all has been consolidated progressively through enourmous efforts since Tunisiarsquos independence Even during the period in which the SAP was introduced did public spending on education remained of paramount importance In 2005 the government spent on education the equivalent to 73 percent of GDP which corresponds to 208 percent of total government expenditures government expenditures on education over the period 1990-2007 vary between 6 and 75 percent of GDP and this share stablized at around 7 percent for 2008-09mdashaccording to the World Bankrsquos World Development Indicators However these efforts have not led to achieving the goal of education for all as the share of students that do not complete the primary cycle though small has not declined as much as expected The adoption of the education reform in July 1991 yielded good results though through guarantying 9 years of basic education for all children aged 6 to 16 allowing a reduction in the dropout rate and increasing schooling of children aged 6 to 122 The enrolment rate for both boys and girls aged 6 passed from around 963 percent in 1990-91 to 99 percent in 1999-2000 and 992 percent in 2008-09 (Table 6) For children aged 6 to 11 the rate of scholling went up from 881 percent in 1990-91 to 971 percent in 1999-2000 and 977 percent in 2008-09 This basically means repetition and dropout are not seriously afflicting primary completion rates in Tunisia
In spite of this achievement the most important setback of this reform seems to be
the decline in the quality of education as increasing the quantity of students has been a priority The illiteracy rate is also still high in Tunisia According to the last results of the general census on population and housing published in 2005 229 percent of the population aged 10 and over is illiterate against 462 percent in 1984 and 317 percent in 1994 However illiteracy in Tunisia is still relatively high among old people The literacy rate for young aged 15 to 24 is estimated at 944 percent in 2004 against 882 percent one decade before
Given observed progress in primary education Tunisia is on track to achieve the
goal of education for all and the country is now improving its education strategy with measures aiming at improving the quality of education through the reinforcement of technical and vocational education training (TVET) However when a more strict measurement is used for MDG 2 for example the on-time completion rate for the cohort of children 6 to 11 the picture changes slightly As further indicated below additional fiscal efforts would be needed to achieve MDG 2 along this more strict measure of progress in schooling MDG 3 Promote gender equality and empower women Since independence Tunisian legislation has also helped to ensure the durability and irreversibility of womenrsquos acquired rights Furthermore these rights have been evolving and adapting constantly to the social changes taking place in the country Hence different
2 The reform introduced in July 1991 stipulated that ldquothe state guarantees free of charge to all school-age children the right to schooling and the maximum equal opportunity to enjoy this right for as long as they are able to regularly attend their schools according to the regulations in forcerdquo
24
amendments to the personal status code promulgated in 1956 and modified in 1993 have been aimed at expurgating all forms of discrimination against women Thus Tunisia is one of the most advanced countries in the region as far as womenrsquos rights are concerned Gender parity is respected in access to health care and education Currently the rates of schooling both at primary and secondary as well as tertiary levels do not discriminate girls who in fact account for more than 50 percent of enrolled students
Moreover the labour market participation is accesible to both males and females
who do receive the same treatment regarding wages and regulations However women only make up for 26 percent of the working population and they tend to be mostly employed by the public sector where their participation is higher than that of males contrary to what is seen in the private sector
MDG 4 Reduce child mortality There has been a significant drop in child mortality over the last decade due to the modernization and coverage of the health system and the various changes occurred in the Tunisian society The continued improvement in living standards as result of declining poverty has been a major determinant of the reduction in the under-five mortality rate which has been systematically diminished from 373 per 1000 live births in 1990 to 184 in 2007 falling short of achieving the MDG target for merely less than 2 deaths per 1000 live births (Table 6) By this measure the country is pretty much on track to achieve MDG 4 by 2015 but this will depend on the ability of the country to reduce the remaining disparities between rural and urban areas in terms of child mortality which are still a major concern for policymakers and for which some extra spending will likely be needed In fact child mortality in rural areas is estimated to double that of urban areas
MDG 5 Reduce maternal mortality In this field policy has been based on the concept of family planning which later on evolved into the concept of mother-and-child health care and which finally included the aspect of reproductive health based on the promotion prevention and management of womenrsquos health in general and the motherrsquos health more in particular The maternal mortality rate was estimated at 548 per 100000 live births in 2000 having systematically fallen by 20 deaths per 100000 live births since 1990 (Table 6) But this progress seems to be insufficient to put the country on track in achieving the 187 maternal mortality rate by 2015 (that is reducing this rate by three quarters between 1990 and 2015) According to UNDP (2004) maternal mortality would only reach 336 per 100000 live births in 2015 if past trends would continue and are linearly extrapolated into the future The main reason behind the lack of progress in reducing maternal mortality is the poor quality of emergency health care and deficient road and transport infrastructure in the rural areas In fact many women who hemorrhaged after giving delivery died while waiting to be transfered to a better-equipped hospital while others reach health centers already too late to be saved Due to these problems a national strategy to reduce maternal mortality had been set up since 1998 This strategy has made it possible to implement a monitoring system for maternal deaths which has enabled improvement of the regional coverage of health centers for
25
preventing and reducing maternal mortality and even so the reduction of maternal mortality continues to be less than required
MDG 7 Ensure environmental sustainability With almost 98 percent of the population having access to safe drinking water Tunisia has made a remarkable improvement towards achieving full coverage moving up from only 75 percent in 1990 (Table 6) The country is pretty much on track to achieve this MDG (7a) but to ensure that such will be the case will depend on the rapidity and efficiency of ongoing investmens to improve the water distribution network in defavored regions3 and getting illegal urbanization under control in both urban and rural areas Tunisiarsquos government has seriously adopted development strategies at its regionsrsquo level to improve the living conditions of its population including through better access to basic public services such as drinking water electrification health services sanitation and education According to the population census for 2004 978 percent of the total population had access to safe drinking water against only 846 percent for the rural population In fact official statistics confirm that disparities still preval among areas and regions of the country with 10 percent of the population leaving in the North West and Centre West having no access to drinking water
Regarding the share of the population with access to the a basic sanitation network official statistics confirm a considerable improvement in this area at the national level from 599 percent in 1994 to 783 percent in 2004 (Table 6) But achieving this MDG (7b) will be more challenging for Tunisia considering that by 2004 there was still a gap of nearly 11 percent of the population without basic sanitation And the problem is that there are still considerable regional variations Coverage of the service varies from 10 percent in some cities of the South to 963 percent in the governorate of Tunis The future progress to meet the target will depend also on ongoing investments that are expected to extend the sanitation network It is worth noting that the connection to a sanitation network is costly and depends on the proximity of the existing network to a given private residence For this reason many households prefer to wait until the number of private residences is large enough to reduce the cost of getting connected to a sanitation network and it is only then that they do request it Thus the achievement of this goal depends also on urbanization policies and the awarness that may be created among households about the health-related importance of taking part of a sanitation network
In all Tunisia will most likely have to scale up public policies to close some
existing MDG gaps that though small their financing may be costly The challenges to achieve MDG 5 seem to be particularly staggering Up to 2009 countercyclical public policies had enabled the country to remain afloat in achieving the MDGs during the global financing crisis But both GDP growth and public spending are expected to decrease in
3 These investments come as part of the ongoing economic and social development plan (2010-14) which the government is implementing through its two concerned public enterprises (ONAS and SONEDE) as well as the Solidarity Fund
26
2010-11 as a result of the political revolution So there also remains to be seen how past progress achieved have been affected by the political crisis
4 Policy scenario analysis
A series of scenarios are evaluated in this section to answer the key questions of this paper clearly what has been the impact of the political crisis on the MDGs The second question is whether under a foreseen economic recovery the country would be expected to achieve the MDGs should it be able to continue with the countercyclical public policies seen before the political crises The mobilization of resources to finance new public spending could face constraints though The economy may not be healthy enough to generate the required level of incomes and savings Externally lenders and investors may sense political uncertainties as risky which leaves the country at the mercy of international donors How much additional public spending would be needed to achieve the MDGs and how this could be financed without triggering unfavourable macro-economic trade-offs to the economy at large would be a third key question Finally what would happen should the countercyclical public policies seen before the political crises not be continued under a foreseen economic recovery path 41 Modelling framework
The MAMS framework is used to address these questions This is a dynamic-recursive CGE model which is described in length in Lofgren and Diaz-Bonilla (2010) The use of a CGE model is justified to the extent that the pursuit of a strategy towards the achievement of the MDGs will likely have strong effects throughout the economy Such strategy would undoubtedly affect demand and supply in the different markets (goods and services factors and foreign exchange) and the related adjustments may imply important trade-offs throughout the period for achieving the MDGs MAMS in particular also takes into consideration the possible synergies between the different goals Such synergies may influence the required expansion of services (for example greater coverage of drinking water supply may reduce the need for health service expansion) or the speed at which the various MDGs are achieved
The strategy adopted to finance the required public spending would also affect the
outcomes For example foreign financing may induce real exchange rate effects while financing through domestic taxes could reduce private consumption demand among other things and domestic borrowing could crowd out credit resources for private investment Tunisian policymakers could thus face important trade-offs depending on the financing of MDG achievement and the space they would have to scale up public spending No doubt increased public spending is essential for achieving the MDGs but adjustments in the real exchange rate real wages and other relative prices may increase the unit costs for achieving the MDGs along with the costs for other sectors or discourage exports thereby widening the external deficit that needs to be financed and so on The productivity gains from greater MDG achievement will take some time to materialize and are thus unlikely to impact growth visibly in the short and medium terms Therefore it is critical that short-run trade-offs not offset potential economic and social gains in the longer run
27
The MAMS framework has been built from a fairly standard CGE framework with
dynamic-recursive features but incorporates a special module which specifies the main determinants of MDG achievement and the direct impact of enhanced public expenditures on MDG-related infrastructure and services (see Lofgren and Diaz-Bonilla 2010) MAMS considers specific targets for achieving universal primary education (MDG 2) reducing under-five and maternal mortality (MDGs 4 and 5) and increasing access to safe water and basic sanitation (MDGs 7a and 7b) In the case of MDG 2 the primary completion rate is the indicator used for universal primary education and this is constructed by the model using data on student behaviour (enrolment repetition graduation) A target is set for completion on time without repetition for the relevant country-specific age cohort for primary school Student behaviour in turn depends on the quality of education (service delivery per student) income incentives (the expected wage premium from education) the under-five mortality rate (a proxy for the health status of the potential student population) household consumption per capita (a proxy for the capacity to pay for education and for opportunity costs) and the level of public infrastructure (a proxy for the effective distance to school) Under-five and maternal mortality are considered to be determined by the availability of public and private health services per capita household consumption per capita the level of public infrastructure (a proxy for the effective distance to health centres and hospitals) and the coverage of water and sanitation services Access to water and sanitation on the other hand depends on household consumption per capita the provision of such services by public or private providers and the level of public infrastructure
The effectiveness of the determinants of MDG achievement follows a non-linear
pattern Logistic functions for the ldquoproductionrdquo of social services are generated in such way that each determinant becomes relatively less effective as progress towards the 2015 target is made These social services may be provided publicly or privately nonetheless it is only new government investment and current expenditures that will lead to a policy-driven increase in the supply of MDG-related services and public infrastructure For this to take place the government has to mobilize sufficient domestic or foreign resources to finance those new investments and expenditures
In the below we tried to answer the above-posed questions by running and
analysing a number of alternative policy scenarios with the application of MAMS with a Tunisian dataset These policy scenarios are compared to a baseline scenario which aims to replicate observed performance and policy stance in recent years The common denominator in each of these policy scenarios is thatmdashunlike in the baselinemdashMDG spending is scaled up in such a way that MDGs 2 4 5 and 7 are achieved by 20154 All these MDG scenarios are performed under alternative financing rules that is to say the required increase in public spending is financed through alternatively increased foreign grant aid foreign borrowing domestic borrowing or taxation These scenarios allow us to assess the MDG-related spending requirements and macroeconomic trade-offs by
4 There are two kinds of policy scenarios one simulates the achievement of each MDG target separately (or two simultaneously as in the case of the health or the sanitation goals) whereas in the other public spending is scaled up as much as required to ensure the simultaneous achievement of all MDG targetsmdashexcluding that of poverty reduction We focus on the second kind of scenarios in this paper
28
comparing results of different MDG achievement and financing settings and those of the baseline scenario
42 Model calibration
The accounting consistency and framework of MAMS and its main structural parameters are provided by a Social Accounting Matrix (SAM) with some of the following especial features (i) separate accounts for public and private activitiescommodities for education (by cycle) health water and sanitation and other public infrastructure are used (ii) capital stocks are included for each government activitymdashto which the national accounts attribute operating surplus (iii) domestic and foreign interest payments are separated from institutional transfers (iv) savings and capital accounts are specified for each institution including the rest of the world (v) in addition to investment demand investment by sector of destination is also specified and (vi) labour is classified by educational level In the particular case of Tunisia the SAM was built for 2005 using official national accounts data from the Central Bank and Tunisian Employment Survey from the National Institute of Statistics
Two-Stage Least Squares (TSLS) and Ordinary Least Squares (OLS) were used to estimate an import-demand function by commodity an export-supply function by commodity and demand functions for factors and intermediate goods by activity in order to estimate the elasticities of substitution (and transformation) used in the model using time series for 1972-2006 for quantity data and price deflators from the Central Bank of Tunisia following specifications used in Saacutenchez (2004) Also a commodity-based expenditure demand function was also estimated to calibrate the Linear Expenditure System (LES) of the model using 6000 observations from National Institute of Statisticsrsquo Household Income and Expenditure Survey (HIES) for 20055 After applying some needed fine-tuning to the initial estimates the elasticity values used for the calibration of the modelrsquos constant-elasticity of substitution and transformation functions and the expenditure system are presented in Appendix A1 Using OLS and a time series for 1971-2007 the elasticity of savings with respect to per-capita income was estimated to be about 095mdashafter controlling for a dummy variable in 1974 (oil shock) an autoregressive and a constant variable A value of as low as 00006 was used for the elasticity of TFP with respect to trade openness based on the study of Chaffai et al (2006) In the absence of data for government capital stocks historical government investment data from the Central Bank of Tunisia a depreciation rate of about 25 percentmdashas used in Ageacutenor et al (2005) for government capital in education health infrastructuremdashand a net profit rate of about
5 Both the construction of the SAM and the estimation of substitution and expenditure elasticities were carried out at the initial stages of the project for which this paper has been prepared by Moncef Youzbachi and Nidhal Ben Cheikh at that moment from respectively the Ministry of Development and International Cooperation and Jameleddine Boumedie from the Tunisian Superior Institute of Statistics and Information Analysis (ESSAI) The SAM suffered minor adjustments by the authors of this paper to update some macroeconomic balances and make it more suitable for the calibration of MAMS The SAM and the estimation results for the elasticities are available upon request to the authors of this paper Using data for 1970-2007 from World Development Indicators (WDI) from the World Bank and the specification that frisch = -36 ypc
-036 (where ypc stands for income per capita) the Frisch parameter for household LES demand was estimated to be equal to -31
29
16 percentmdashas found by Nehru and Dhareshwar (1993) for developing countriesmdashwere used to construct base-year government stock data6
Base-year employment by labour type and activity unemployment by type of
labour and labour force participation rates were obtained from the Tunisian Employment Survey for various years Population data for different cohorts were compiled from the United Nations Population Division Database All other information on national accountsmdashincluding GDP and government consumption growth fiscal accounts and domestic and foreign debt flows and stocksmdashwas obtained from Tunisiarsquos Central Bank
The calibration of the MDG module of MAMS turned out to be more cumbersome
due to lack of data MDG indicators and 2015 targets used in MAMS are consistent with those presented in Table 6 All education related data (enrolment repetition graduation) used to construct the indicator associated with MDG 2 were compiled using NISrsquos data (for primary and secondary) and the Ministry of Education (for tertiary) In this application of MAMS with Tunisian data primary education comprises only 6 grades whereas secondary and tertiary include respectively 7 and 3 grades In other words the new definition whereby the first cycle is basic education and comprises 9 grades is not being used Targeting getting almost all boys and girls in the age cohort to entry and pass all grades of basic education without repetition would be overambitious given the relatively short time span from 2005 (the base year of the model) to 2015 (the target year of the MDGs)
Two additional key pieces of information were used to calibrate the MDG module
in MAMS and more specifically the logistic functions from which MDG indicators are generated including for education On the one hand are the so-called MDG scenario parameters which serve as starting points that help identify a projected outcome for each MDG indicator for an expected year (2010 for MDG 2 given the primary cycle last 6 years and 2015 for all other goals) given a set of values for determinants under whichmdashit is believedmdashthe projected outcome could be achieved The elasticities of the MDGs with respect to its determinants are the other piece of information All this information is also useful in the model to provide the logistic functions with an inflection point from which returns to sector-specific spendingmdashand other determinantsmdashbegin to decrease The model recalculates the initial elasticities in consistency with the shape of the logistic functions
To estimate the MDG scenario parameters we relied heavily on unit cost estimates
and financing gap studies obtained from World Bank (2003) for water and sanitation the World Bankrsquos Road Costs Knowledge System (ROCKS) database for public infrastructure and the World Health Organization (WHO) for mortality rates The student behaviour related determinants are estimated using the data from the UNESCO database We found that public spending per student would barely have to change to achieve the MDGs and this is consistent with the progress shown by completion rates that are publicly
6 It is assumed that over a period of 5 years investment spending has permitted the capital stock to grow at the same real rate as the production of government services using the capital stock in question On the basis of this assumption it is possible to derive capital stocks for the initial year (5 years ago) and the base year
30
available (and the trend for MDG 2 that the model generates as will be seen below) Health spending per-capita would have to be about 43 percent larger between 2005 and 2015 to achieve MDGs 4 and 5 whereas spending in water and sanitation in 2015 would have to be about 23 percent above the value observed in 2005mdashlikely due to existing gaps especially in the rural areas Lastly we found that other public infrastructuremdashnot directly linked to education health and water and sanitationmdashwould have to increase by about 19 percent from 2005 and 2015 in order to achieve the MDGs under study All thesemdashpartial equilibrium or sectoralmdashrequirements are taken and reestimated by MAMS in a general equilibrium setting
Neither data were available to estimate the elasticities of the MDG indicators with
respect to the set of determinants nor no study for Tunisia reports useful parameter values to the knowledge of the authors of this paper To try and overcome this limitation elasticities estimated for Yemen and Jordan and other developing countries (as reported in Saacutenchez and Sbrana 2009ab Sbrana 2009 Lofgren 2010 Kaldewei and Pitterle 2011) were used as starting points Through sensitivity analysis these initial elasticity values were adjusted until given all other information that was being used for the calibration a continuation of the trend shown by MDG indicators since around the year 2000 was being reproduced In the case of MDG 2 as will be seen in the below the model constructs a primary completion rate close to 98 percent for boys and girls aged between 6 and 11 equating this to reported enrolment rates thus assuming that repetition and drop-out rates are nil in Tunisia This may be a strong assumption in the way the model is being calibrated but difficult to be otherwise in view of a lack of official data on primary completion rates
43 Baseline scenarios
Main assumptions Taking real values of 2005 three alternative baseline scenarios were generated for Tunisia once the model was fully calibrated and solved The so-called ldquocountercyclicalrdquo and ldquopro-cyclicalrdquo baseline scenarios assume observed growth rates for both GDP and government consumption in 2006-10 They also project a marked GDP growth deceleration in 2011 owing mostly to the political crisis and subsequently a recovery of GDP at a rate of 55 percent per annum by the end of the simulation period (Figure 1) These two scenarios also show that economic growth was already on the decline since 2008 when the global financing crisis erupted but this crisis barely affected the MDGs during 2008-9 because public spending grew by 46 and 7 percent Both scenarios then include the effects of the global economic and political crises The difference between these two scenarios is in 2010-15 government consumption grows at the GDP growth rate in the pro-cyclical scenario whereas the countercyclical scenario assumes government consumption continues to grow by 7 percent as seen in 2009 Analysis of the countercyclical baseline scenario enables us to respond to how far the government would get in terms of MDG achievement by 2015 should its spending continue to increase at the pace of 2009 What
31
gaps the country would face if government spending rather follows the GDP cycle become apparent when the pro-cyclical and the countercyclical scenarios are compared
A third so-called ldquopre-crisisrdquo baseline scenario is generated to determine what
impact recent political turmoil may have had on the MDGs under certain modelling assumptions For this scenario the GDP growth rate of 2010 (that is 38 percent) before Tunisians witnessed the adverse effects on the political crisis is maintained for 2011-12 GDP grows as in the ldquocrisisrdquo scenarios between 2013 and 2015 Government spending is assumed to trend as in the countercyclical baseline scenario To gauge the effects of the political crisis on the MDGs a comparison between the pre-crisis and the countercyclical scenarios is made This implicitly assumes that the impact of the political crisis on the MDGs is fundamentally transmitted through GDP growthmdashwhich is expected to affect for example household consumption per capita a key determinant of the MDGs Again government spending would not be a transmission mechanism of the political crisis because it is being assumed that continues to grow at the pace observed for 2009
Figure 1 Tunisia Growth rate of real GDP and government consumption in
alternative baseline scenarios 2006-15 (Percent)
63
38
10
55
00
10
20
30
40
50
60
70
80
2006 2007 2008 2009 2010 2011 2012 2013 2014 2015
GDP growth rate - pro-cyclical amp countercyclical baseline scenarios
GDP growth rate - pre-crisis baseline scenario
Gov consumption - pro-cyclical amp pre-crisis baseline scenarios
Gov consumption - countercyclical baseline scenario
Source Central Bank of Tunisia and authorsrsquo assumptions based on a plausible scenario for 2011-15
Notice that both real GDP growth and real government consumption growth are
being imposed on the three baseline scenarios Real GDP growth is merely imposed through a calibration procedure adjusting productivity but GDP is fully endogenous in the model7 This means that for the pre-crisis baseline scenario in particular we are simply
7 GDP growth is driven by factor stocks and efficiency (endogenous and exogenous) parameters investment and depreciation for the different capital types by a combination of demographic factors and the functioning of the educational system for the different labour categories and by an exogenous growth rate for natural resources used in some sectors The aggregate growth trajectory is imposed through the production function
32
assuming that the effects of the political crisis take place through productivity losses without exogenously updating any other parameter Productivity losses affect the level of production and as a result factor employment and household income and consumption per capitamdashthe later being one of the key determinants of the MDGs In the case of government spending it is assumed that consumption and other components of recurrent spending grow at a given rate per annum which is part of the closure rules of the model Government investment spending depends on the demand for capital in the public services sector and this in turn depends on government consumption
Other macroeconomic closure rules used to generate the baseline scenarios are as
follows Government investment spending is covered through current savings and fixed levels of borrowing (domestic and external) and tax rates Any remaining imbalances are covered by foreign transfers from abroad (ie foreign aid) which basically assume their true value as the calibration of the model entailed imposing observed trends for the levels of borrowing and tax revenues The real exchange rate adjusts to clear the current account of the balance of payments Private savings rates adjusts such that private investment equals total savings given a fixed ratio of private investment to GDP
The model distinguishes three types of workers those who have not completed
secondary education (unskilled) those with at least completed secondary education (semi-skilled) and those who have completed some degree in tertiary education (skilled) In all of the scenarios if the unemployment rate by type of worker exceeds a minimum unemployment rate the real wage (with respect to the consumer price index) is equivalent to a ldquoreservation wagerdquo such that the market reaches equilibrium through adjustments in the unemployment rate (or by the same token through changes in the level of employment) If the unemployment rate is at the minimum rate the labour market reaches equilibrium through adjustments in the real wage For other factors (capital and natural resources) equilibrium is given by flexible wages (or rents)
The baseline scenarios reflect the actual aggregate functioning of the Tunisian
economy during the period 2006-10 and project this through 2015mdashbased on existing data available for the preparation of this paper Take for example some results of the pro-cyclical baseline scenario (Table 8) The real exchange rate appreciates on average by 06 percent per annum in the baseline in consistency with more spending in non-tradables (clearly government consumption) though it is worth mentioning that the actual trend of the real exchange rate is not being reproduced as world prices are not updated due to lack of information As a result of this exports fall as a percentage of GDP whereas imports remain on the increasemdashand foreign savings become larger relative to GDP In consistency with past trends government debts decline over time Tax revenue is assumed
The model is first run assuming that the quantity of value added (that is real GDP at factor cost) is exogenous while the exogenous component of the efficiency parameter temporarily becomes endogenous In this run the observed trajectory of real GDP is imposed on the quantity of value added and this is achieved by proportionally scaling the efficiency parameter for all production activities This run becomes the starting point to solve the model again and generate the baseline scenario assuming that the quantity of value added is endogenous and the exogenous component of the efficiency parameter remains exogenous though this is exogenously set to vary yearly to enable reproduction of the observed trajectory of aggregate real GDP growth
33
to remain at around 22 percent after 2010 Foreign transfers to the government increase with respect to the base year to clear the government budget
Table 8 Tunisia Selected macroeconomic and government indicators for the pro-
cyclical baseline scenario 2005-15 (Percent of GDP)
2005 2010 2015
National accounts
Consumption ndash private 634 693 726
Consumption - government 157 166 173
Investment ndash private 129 129 129
Investment - government 96 100 102
Exports 500 398 346
Imports -506 -485 -476
Government
Foreign debt 539 390 319
Domestic debt 28 17 14
Tax revenue 187 219 219
Foreign transfers 08 51 49
Source Authorsrsquo estimates based on application of MAMS for Tunisia
Will the MDGs be achieved under a continuation of public spending policies
If public consumption in 2010-15 continues to grow at the relatively high pace seen in 2009 (that is 7 percent per annum) and public investment follows suit as assumed under the countercyclical baseline scenario progress in achieving the MDGs would be notable but Tunisia would fall short of meeting the targets for primary education mortality rates and water and sanitation coverage by 2015 (Figure 2) The main gaps would be seen for maternal mortality and the coverage of basic sanitation and these would be slightly higher under the public spending assumptions of the pro-cyclical baseline scenario The comparison of the MDG indicator trends of the countercyclical baseline scenario and those of the pre-crisis baseline scenario show that the impact of the political crisis on the MDGs has been modest as it is being assumed that public spending would in any case have continued to grow at a relatively high pace without the political crisis Also the differences between these two scenarios is small in terms of the MDGs because GDP growth which is 42 percent in the countercyclical baseline scenario is only 03 percentage points higher when we assumed a situation without political crisis (Table 9) As a consequence employment is slightly higher and this boots household income and spending moderately As said the later is one of the determinants of the MDGs Private consumption grows by 59 and 63 percent per annum under the countercyclical and pre-crisis baseline scenarios respectively But even though the MDG indicators show very small variations under both scenarios as further shown below such small differences have implications in terms of the additional public spending that would be required to meet the MDG targets
34
Figure 2 Tunisia MDG achievement under the alternative baseline scenarios 2005-
15 (MDG indicators and 2015 targets)
MDG 2 primary completion rate ()
984984
981
9600
9700
9800
9900
10000
2005 2010 2015
target = 999
MDG 5 maternal mortality rate (per 100000 live births)
293
329
289
1500
2000
2500
3000
3500
4000
4500
5000
5500
2005 2010 2015
MDG 4 child mortality rate (per 1000 live births)
173175
173
1500
1600
1700
1800
1900
2005 2010 2015
target = 166
MDG 7a drinking water coverage ( of population)
986987 988
9600
9700
9800
9900
10000
2005 2010 2015
target = 100
MDG 7b basic sanitation coverage ( of population)
866
849
869
7500
8000
8500
9000
9500
10000
2005 2010 2015
Contercyclical baseline scenario
Pro-cyclical baseline scenario
Pre-crisis baseline scenario
target = 100
target = 187
Source Authorsrsquo estimates based on application of MAMS for Tunisia
Table 9 Tunisia GDP consumption and investment in the baseline scenarios 2006-
15 (Percentage annual growth)
countercyclical pro-cyclical pre-crisis
Consumption ndash private 59 59 63
Consumption ndash government 61 43 61
Fixed investment ndash private 51 48 54
Fixed investment - government 78 53 77
GDP at market prices 42 43 45
Source Authorsrsquo estimates based on application of MAMS for Tunisia
35
44 MDG-financing scenarios
Main assumptions The MDG-financing scenarios were generated to make comparisons with themdashrespectivemdashbaseline scenario In these new scenarios public spending increases as much as required to meet the targets for primary education mortality rates and water and sanitation To achieve this some of the closure rules and conditions of the baseline scenarios change Government spending by MDG sector becomes endogenous and no longer increases at a given growth rate as in the baseline scenarios The model remains fully determined (that is the number of endogenous variables is exactly equal to the number of equations) by assuming that the corresponding MDG indicator is exogenous and follows a non-linear trend that given diminishing marginal returns to variations in the MDG determinants leads to fully meeting the targets by 2015 In both baseline and MDG scenarios one financing variable clears the government budget while three other remain fixed and are updated depending on a rule (for example a percentage of GDP can be imposed exogenously on a year-on-year basis) Foreign transfers from abroad (the equivalente to grand aid) clear the government budget in the baseline scenarios as indicated This rule remains unchanged under the MDG scenarios whereby transfers from abroad also finance the additional MDG public spending It does however change when the financing mechanism alternatively is domestic borrowing domestic taxation or foreign borrowing in which case one of these three becomes the clearing variable of the budget Another change in these scenariosmdashwith respect to the baselinesmdashis that the model becomes savings-driven that is private investment adjusts endogenously even as a share of GDP to maintain balance between total savings and total investment How much would it cost to achieve the MDGs
In the MDG-financing scenarios public spending (current and capital) increases endogenously right after the base year of the simulation period in order to achieve the MDGs for primary education child and maternal mortality and water and sanitation In the case of Tunisiarsquos MAMS the base year is 2005 such that public spending scales up starting in 2006 For this reason in this paper the additional public spending required to achieve the MDGs includes what Tunisiarsquos government should have spent but did not spent in 2006-10 to have been fully on track in meeting the MDG targets To this we add the additional spending the government will have to incur in 2011-15 to meet the targets8 Foreign transfers to the government (ftr) domestic direct taxation (tax) foreign borrowing (fb) and domestic borrowing (db) are the financing mechanisms under study and additional public spending required to achieve the MDGs can be much or less depending on the choice of these financing mechanisms
8 The additional public spending requirement to achieve the MDGs is defined as the public spending on MDG-related sectors in the MDG-financing scenarios minus the public spending on MDG-related sectors in the corresponding baseline scenario Annual averages for the additional public spending requirement for 2006-10 and 2011-15 are calculated and subsequently added
36
As can be seen in Table 10 the mortality goals would be the most costly to finance (more than 3 percent of GDP per annum) followed by the primary education goal This is consistent with the earlier analysis in which MDG gaps were presented to be widest for maternal mortality Taking the assumptions of the countercyclical baseline scenario as our first benchmark public spending would need to increase between 57 to 62 percent of GDP per annum in order to achieve the MDGs under study New spending requirements would be little more than 2 percent of GDP for investment thus reflecting the deficient state of infrastructure in the social sectors The cost of financing the MDGs is about 15 percent of GDP higher under the assumptions of the pro-cyclical baseline scenario This may be taken as an indication that a continued effort to maintaining countercyclical spending may pay off in comparison to what the government would have to spend later at an incremental marginal cost if it disrupted spending when GDP was on the decline How feasible it would be for the government to maintain countercyclical spending is the other question that one needs to ask The other finding is that in terms of additional public spending required to achieve the MDGs the effect of the revolution would be very modest (that is around 04 percent of GDP per annum) if public spending continued to be countercyclical If Tunisiarsquos government cannot maintain pre-crisis MDG spending levels and public spending rather falls in 2011 and recovers in 2012 in tandem with GDP as assumed in this scenario analysis the political crisis would make the government incur almost 2 percent of GDP per annum more in spending to meet the MDGs Again it seems that a good strategy to minimize the future cost of achieving the MDGs would be to maintain high public spending growth now in spite of the economic problems that the political crisis may have caused However the mobilization of resources to finance such high countercyclical spending may face constraints that one needs to keep in mind as further explained below Table 10 Tunisia Additional annual public spending requirements to meet the
MDG targets in financing scenarios1
(deviation from baseline scenario
percent of GDP)
Countercyclical Pro-cyclical Pre-crisis
ftr tax fb db ftr tax fb db ftr tax fb db
Primary education 17 18 17 18 23 24 23 25 16 17 16 18
- current 14 14 14 15 17 18 17 18 13 13 13 14
- capital 03 04 03 04 06 07 06 07 03 04 03 04
Health 32 34 32 35 36 39 36 39 30 32 30 33
- current 20 21 20 22 22 24 22 25 19 20 19 21
- capital 12 12 12 12 13 14 13 14 11 12 11 12
Water and sanitation 08 09 08 09 12 13 12 13 07 08 07 08
- current 02 02 02 02 03 03 03 03 02 02 02 02
- capital 06 07 06 07 07 08 07 08 06 06 06 06
Total 57 61 57 62 71 76 71 78 53 57 53 59
- current 36 37 36 39 42 45 42 46 34 35 34 37
- capital 21 23 21 23 26 29 26 29 20 22 20 22
1 Additional public spending and acronyms are defined in the text Source Authorsrsquo estimates based on application of MAMS for Tunisia
37
Macroeconomic trade-offs of MDG financing
In all MDG-financing scenarios the injection of public spending triggers a real exchange rate appreciation (Table 11) This is consistent with the fact that for low- and even middle-income countries like Tunisia large-scale investments for the achievement of the MDGs could meet severe skilled-labour constraints in the short-to-medium run in spite of the high levels of education of the population Public expenditures centred on meeting the MDGs in the form of expanding basic social services in health and education would put intense pressure on a pool of teachers doctors and other trained workers that is likely to be limited Constraints on skilled labour could then lead to upward pressure on the skill premium for such workers which in turn would increase the overall labour costs for the public sector and the cost of achieving the MDGs9 As a result ldquonon-tradablesrdquo such as MDG-related services become relatively more expensive than ldquotradablesrdquo as public spending is scaled up and this translates into a real exchange rate appreciation This penalizes export sectors regardless of the financing mechanism of public spending which in the case of Tunisia affects GDP growth though this trade off is more marked when foreign resources are used owing to the associated inflow of foreing exchange (Table 11) In the MDG-financing scenarios exports grow less than in the baseline and only when foreign resources are used to finance the new public spending would imports increase slightly more than in the baseline (that is merely 01 percentage points per annum) As a result trade volumes in the MDG-financing scenarios increase at a lower pace compared to the baseline scenario In MAMS trade openness is represented by the ratio of trade volumes to GDP and is one of the determinants of factor productivity Thus the deceleration of GDP growth in the MDG-financing scenarios is also explained by a reduction in factor productivity relative to the baseline Higher factor employment in the MDG sectors is insufficient to revert the reduction in GDP
GDP growth is slightly less though when the new public spending is financed through domestic borrowing or increased tax revenues as these financing mechanisms also penalize private spending On one hand borrowing domestically implies the government takes a (larger) share of private savings to finance the budget thus crowding out private investment and as a result private consumption and imports On the other hand increased taxation reduces the amount of disposable income households can spend to consume which subsequently reflects also in reduced private spending and imports Due to the macroeconomic trade-offs it triggers the MDG strategy cannot be expected to bring about a stimulus to the economy in the short term Moreover as said earlier the productivity gains from greater MDG achievement will take some time to materialize and are thus unlikely to impact growth visibly in the short and medium terms Not only would GDP growth be less than in the baseline and foreign-financing scenarios but the reduction in private spending in education and health services in the domestic-financing scenarios would have to be fully compensated by even more public spending to meet the MDG targets Domestic borrowing mainly but also increased taxation to a lesser extent would
9 In fact it was noted that for the highly skilled workers wage growth is about 1 percentage point higher in the MDG financing scenarios compared to the baseline scenarios Wage growth is only slightly higher for the other less skillful workers and it is actually less for the unskilled workers in the scenarios with domestic borrowing and increased taxation where GDP growth decelerates as further explained below
38
push up public spending requirements to meet the MDGs in a range of 04 to 07 percent of GDP per annum (see Table 10)
Table 11 Tunisia Real macroeconomic indicators in MDG-financing scenarios
2006-15 (deviation from baseline scenario percentage annual growth)
Countercyclical Pro-cyclical Pre-crisis
ftr tax fb db ftr tax fb db ftr tax fb db
Absorption 02 -02 02 -02 03 -03 03 -03 02 -02 02 -02
Consumption - private 01 -05 01 -06 00 -08 00 -09 01 -05 01 -06
Consumption - government 13 14 13 14 20 22 20 22 13 14 13 14
Fixed investment - private -01 -04 -01 -03 -01 -05 -01 -04 -01 -04 -01 -03
Fixed investment ndash government 1 25 30 27 29 19 19 19 20 28 30 28 30
Exports -12 -10 -12 -08 -17 -14 -17 -10 -11 -10 -11 -08
Imports 01 -04 01 -05 00 -08 00 -07 01 -04 01 -05
GDP at market prices -02 -03 -02 -03 -02 -04 -02 -03 -02 -03 -02 -03
Total factor employment (index) 01 00 01 00 02 01 02 01 01 00 01 00
Total factor productivity (index) -02 -03 -02 -03 -03 -04 -03 -04 -02 -03 -02 -03
Real exchange rate (index) -05 -03 -05 -02 -06 -02 -06 -02 -05 -02 -05 -02
1 Government fixed investment was calculated for two sub-periods 2006-8 when capital spending is frontloaded to raise capital stocks in MDG sectors and 2009-15 when capital stocks in MDG sectors do not have to increase as much as they are already sufficient for the government to deliver required MDG services The difference between the annual growth rates of government fixed investment for these sub-periods is presented in the table for government fixed investment Source Authorsrsquo estimates based on application of MAMS for Tunisia
Feasibility of MDG financing Not only would domestic borrowing or increased taxation be less desirable financing mechanisms in view of the relatively higher public spending requirements but they would unlikely be feasible options for Tunisia Domestic resources would not easily be mobilized to finance MDG public spending given already low savings that will perhaps be even lower under the expectation that growth would decelerate substantially in 2011 and the economy would start to recover only at a moderate pace in 2012 During this biennium unemployment will likely reach dramatically high levels particularly for the youth and remittancesrsquo inflows will unlikely be increasing Furthermore the domestic debt is fairly small as a percentage of GDP which is not only as a result of fiscal objectives but also an indication that Tunisiarsquos domestic bond market may not be developed enough to allocate domestic savings in amounts that are commensurate to the financing of development goals
Tax revenue was almost 20 percent of GDP in 2009 (Table 3) Not only would this tax burden be considered relatively high for developing country standards but it has also difficult to raise it From 1995 to 2009 tax collection has essentially remained unchanged as percent of GDP Against this backdrop further increases of the tax burden in the midst of forming and consolidating a new political regime and trying to recover economic
39
growth would most likely be politically infeasible and economically undesirable Improving tax collection should be a priority but achieving this will require some time
According to the simulation results tax revenue would need to increase by more
than 6 percentage points of GDP by 2015 in order for the government to be able to finance the new MDG spending under the tax financing scenario that takes the countercyclical baseline as the benchmark (Table 12) As also measured for the new MDG spending (Table 11) this accounts for both the extent to which tax revenue should have increasedmdashbut did not increasemdashin 2006-10 in order to have fully financed the newly required MDG spending and the tax revenue that the government would additional have to raise to continue financing MDG spending until the targets are met by 2015 Tax revenue would even have to be about 4 percentage points of GDP higher if public spending declines in tanden with GDP in 2011mdashas assumed under the pro-cyclical baseline scenario since the MDG gaps to finance under this scenario would be more pronounced
These are macroeconomic constraints that Tunisia would likely face if the
government decides to finance newly required MDG spending through domestic borrowing or increased taxation As explained above these are financing options that would also curtail private spending in MDG-related sectors making the government incur more MDG spending compared to a situation where financing is through resources from abroad Table 12 Tunisia Additional annual foreign aid and tax revenue required to achieve
the MDGs in the corresponding MDG financing scenario1
2011-15
(deviation from baseline scenario percent of GDP)
Tax revenue
(tax financing scenario) Foreign aid
(ftr financing scenario)
Countercyclical baseline 64 64
Pro-cyclical baseline 106 87
Pre-crisis baseline 61 62
1 Additional foreign aid and tax revenue requirements are defined in the text Source Authorsrsquo estimates based on application of MAMS for Tunisia
Tunisia will unavoidably have to rely on foreign resources to reconstruct its political system spur economic growth and finance development goals Given the political changes this country is going through which after constitutional amendments could pave the way for a full-blown election and the good signs that economic growth may pick up steam in 2012 the international donor community has already pledged help
According to the simulation results following the same kind of estimation of additional financing requirements used for tax revenue Tunisia would also need little more than 6 percent of GDP per annum in foreign aid to be able to finance public spending in primary education health and water and sanitation in order to meet the targets by 2015 (Table 12) This public spending is assumed to be countercyclical meaning that as
40
simulated failure to sustain public spending for MDG sectors from 2011 would likely widen MDG gaps and increase the cost of financing the MDGs which tends to be incremental in marginal terms the closer to 2015 In fact taking the conditions of the pro-cyclical baseline scenario as the benchmark we find that almost 9 percent of GDP per annum would be the amount of foreign aid required to be able to finance public spending and meet the MDGs by 2015 This would put required foreign aid to achieve the MDGs under study in the range of US$27 to US$39 billion per annum10 In late May 2011 the G8 group promised US$20 billion to Tunisia and Egypt in loans and grants over the next three years The first tranche of which several billions would presumably go to Tunisia would be disbursed during the second semester of 2011 It would then be quite feasible for Tunisia to achieve the MDGs under study should this help materialize and if part of this is directed to MDG sectors in the next four years Non-concessional loans and other borrowing from abroad would on the contrary be at the cost of accumulating debt but it is perhaps the only other feasible option for Tunisia to mobilize resources for MDG financingmdashalong with using receipts from selling confiscated assets belonging to members of the ousted government as further indicated below Following the trend of 2005-09 the government debt is on the decline in the baseline scenarios and it levels off above 30 percent by 2015 (Figure 3) The government debt would increase to almost 62 percent of GDP under the foreign borrowing scenario that takes the countercyclical spending assumption as the reference path This would not be such unfeasible financing mechanism if the government could live with a debt 6 percentage points of GDP higher than in 2005 It can be seen that under the assumption of pro-cyclical spending for which we already gauged the additional public spending required to achieve the MDGs government debt would be slightly higher compared to the countercyclical baseline scenario reaching almost 74 percent of GDP in 2015 In other words waiting for GDP growth to catch up again in order to resume MDG public spending would not only widen MDG gaps but also as it becomes more costly to achieve the MDGs towards the end of the simulation period it would put the debt burden under unsustainable territory The upshot here is that countercyclical spending reduces the cost of the MDG financing strategy not only in terms of new public spending required but also in terms of debt accumulation compared to a situation where public spending follows GDP downturns that increase the government efforts towards the end of the simulation period Finally the simulation results also show that government indebtedness would have needed to increase by only 3 percentage points of GDP by 2015 compared to 2005 if the political crisismdashas simulated heremdashhad not unfolded
10 Estimates are based on additional foreign aid requirements presented in Table 12 and GDP at current prices (US$443 billion) as recorded in the July 2011 update of IMFrsquos World Economic Outlook
41
Figure 3 Tunisia Government debt in the baseline and foreign-borrowing (fb)
scenarios 2005 2009 2015 (Percent of GDP)
Source Authorsrsquo estimates based on application of MAMS for Tunisia
5 Conclusions and policy recommendations
Before the recent global financing crisis and political revolution Tunisia was one of the fastest growing economies in the MENA region Since the 1990s the country was reaping benefits from various structural reforms a labour-intensive and export-oriented growth strategy the liberalisation of the economy and a prudent management of monetary and fiscal policies This economic model helped to propel growth but the economy remained vulnerable to external shocks and seriously challenged by high unemployment Given that the government has essentially continued the strategy it addopted since the 1960s of providing social transfers and food subsidies to fight poverty and supporting education and health sectors considerable progress in achieving the MDGs had been witnessed before the economic and political crises and some targetsmdashsuch as that of halving extreme poverty from its 1990 levelmdashhad already basically been met In spite of progress lack of access to parental care and insufficient health service delivery in rural areas combined with inadequate transport infrastructure and services have seriously imperiled further reducing maternal mortality An important share of the population also lacks basic sanitation especially in the rural areas
Foreign demand for Tunisianrsquos exports diminished as a result of the global financing crisis and this translated into sluggish growth Even so MDG progress was not interrupted owing to the governmentrsquos countercyclical spending policy Just when the economy started to show symptoms of recovery in 2010 discontent of the population about unemployment and corruption mainly led to a political revolution that has raised challenges at all levels
42
In this study we used a CGE model to perform a scenario analysis with a view to shed light on the prospects and challenges Tunisia faces to achieve the MDGs We showed that progress in achieving the MDGs would continue to be notable if public spending continues to grow as seen before the revolution but the targets for primary education child and maternal mortality and water and sanitation would not be met by 2015 The main gaps would be seen for maternal mortality mainly and basic sanitation to a lower extent MDG progress is found to be slightly less if public spending becomes pro-cyclical and follows the GDP deceleration expected for 2011 The impact of the political crisis on the MDGsmdashprimarily transmitted through less household income and consumption per capitamdashwould be only modest if the government manages to keep MDG spending countercyclical to sluggish GDP growth The global financing crisis did not affect MDG achievement precisely because the government maintained spending growing at high rates in spite of the observed GDP deceleration
Our analysis further showed that in order to meet the MDGs under study by 2015 public spending would need to rise by 57-78 percent of GDP per annummdashdepending on how public spending evolves after the political crisis and the mechanism used to finance it The mortality goals would be the most expensive to finance (32-39 percent of GDP per annum) followed by the primary education goal Little more than half of the newly required spending would be for new investment to compensate for deficiencies in infrastructure Additional resources required would tend to be relatively less if high growth of public spending seen before the revolution is not disrupted which in turn would help to minimize the impact of the political crisis on the MDGs
The injection of additional public spending could result in a small real exchange rate appreciationmdashif skilled-labour supply constraints lead to upward pressure on the skill premium for teachers doctors and other trained workers which in turn increases labour costs for the public sectormdashthat would somewhat penalize exports and economic growth This effect was found to be larger for scenarios in which additional MDG public spending is financed with resources from abroad owing to the inflow of foreign exchangemdashwhich likely are amongst the few financing options at Tunisiarsquos disposal But GDP growth was found to be even slightly less when the new public spending was financed through domestic borrowing or increased tax revenues Domestic borrowing by the government crowds out private investment as a (larger) share of private savings is diverted to finance the budget thus hurting private consumption and imports Increased taxation in turn reduces disposable income which subsequently also translates into reduced private spending and imports In these cases we found the government incurs an extra cost of 04-07 percent of GDP per annum in order to compensate for less private spending in MDG-related sectors And due to these macroeconomic trade-offs the MDG strategy should not be expected to act as a catalyst to stimulate the economy in the short term The productivity gains from greater MDG achievement would take some time to materialize as typically expected from any development strategy
Both domestic borrowing and increased taxation would be less desirable and perhaps infeasible options to finance the newly required MDG spending in Tunisia The revolution has hurt the economy and it would be unthinkable that under such
43
circumstances sufficient national savings could be mobilized to finance MDG public spending Workerrsquos remittances from abroad have been an important source of household savings but also these have been on the decline These two mechanisms of domestic resource mobilization could actually slow down the economic recovery that Tunisians badly need Furthermore Tunisiarsquos domestic bond market is not sufficiently developed to allocate domestic savings in amounts that are commensurate to the required financing of development goals The existing tax burden hovering 20 percent of GDP would also be considered relatively high for developing country standards Using these financing mechanisms in the midst of the formation and consolidation of a new political regime would also likely be politically infeasible
Whether it wants it or not Tunisia will have to rely on foreign resources to reconstruct its political system spur economic growth and finance development goals The use of non-concessional loans and other borrowing from abroad to achieve the MDGs would come at the cost of accumulating debt at levels that may perhaps be considered inconsistent with debt targets According to the scenario analysis performed relying on foreign borrowing alone to finance MDG achievement would push the government debt up to at least 62 percent of GDP by 2015mdashor even more if high growth of public spending seen before the political crisis is disrupted in the short term
Acquiring new debt at such high levels may however be avoided if the international donor community honours recent pledges of grant aid that it has made The donorsrsquo willingness to help Tunisia builds on the expectation that current political changes will translate into constitutional amendments that ultimately pave the way for a full-blown election and economic growth will pick up steam in 2012 According to our scenario analysis Tunisia would need at least little more than 6 percent of GDP per annum in foreign aid compared to what is currently receiving in order to be able to finance public spending required to timely meet the goals in primary education health and water and sanitation without resorting to other sources of financing The required foreign aid to achieve the MDGs would be in the range of US$27 to US$39 billion per annum depending on the pace at which MDG spending grows after the political crisis This would pretty much fall under amounts of aid that the G8 group of rich countries has promised to grant to Tunisia and Egypt
If foreign aid cannot be mobilized in the amounts that would be required to finance
the MDG strategy a combination of this and foreign borrowingmdashof levels that would not compromise debt sustainablitymdashwould be recommended Nevertheless domestic resource mobilization should gradually replace foreign resource mobilization mainly through fiscal reforms that permit to enhance the efficiency of tax collection and by this means broaden the tax base Furthermore the fiscal constraints could be eased if the sale of assets confiscated from members of the ousted government generates resources to finance the achievement of development goals In any case the government will also need to engage in more active production sector and labour market policies in order to raise productivity growth improve production capacity and create more jobs in the economy Only so would the economy really pick up steam and recover and the alarming unemployment levels be
44
reduced The impact of economic growth on poverty reduction could also be enhanced if the said fiscal reforms are progressive and help to reduce inequality
References
Ageacutenor Pierre-Richard Nihal Bayraktar and Karim El Aynaoui 2005 ldquoRoads out of
poverty Assessing the links between aid public investment growth and poverty reductionrdquo World Bank Policy Research Paper 3490
Ayadi M G Boulila M Lahouel and P Montigny (2005) ldquoPro-Poor Growth in Tunisiardquo International Development and Strategies Paris France
Bibi S and R Chatti 2007 ldquoPublic Spending Pro-Poor Growth and Poverty Reduction in Tunisia A Multi-level Analysisrdquo In Ali Abdel Gadir Ali and Shenggen Fan (eds) Public Policy and Poverty Reduction in the Arab Region State of Kuwait The Arab Planning Institute pp 259-319
Chaffai M E Patrick Plane and Dorra Triki Guermazi 2006 ldquoTotal Factor Productivity in Tunisian Manufacturing Sectors Convergence or Catch-up with OECD membersrdquo Working Paper Series The World Bank
Chemingui MA and H Bchir Mohammed 2008 ldquoDoes Multilateral Trade Liberalization Matters for Poverty Reduction in Africardquo Background paper for for the International Policy Analysis Network project (in collaboration with IFPRI) Washington DC
Cornelia Kaldewei y Ingo Pitterle 2011 ldquoBehavioural Factors as Emerging Main Determinants of Child Mortality in Middle-Income Countries A Case Study of Jordanrdquo DESA Working Paper No 103 New York United Nations Department of Economic and Socials Affairs Available from httpwwwunorgesadesapapers2011wp103_2011pdf
ETF (European Training Foundation) 2007 ldquoThe contribution of Human Resources Development to Migration Development in Tunisiardquo Research Report Available from httpwwwetfeuropaeupubmgmtnsf(getAttachment)5CD26BB43A026CD8C12573DB004D8AD2$FileNOTE7B7KG6pdf
IMF 2009a ldquoIMF Executive Board Concludes 2009 Article IV Consultation with Tunisiardquo Washington DC International Monetary Fund
IMF 2009b ldquoStatement of the IMF Mission on the 2009 Article IV Consultation with Tunisiardquo Washington DC International Monetary Fund
IMF 2010 ldquoTunisia 2010 Article IV ConsultationmdashStaff Report Public Information Notice on the Executive Board Discussion and Statement by the Executive Director for Tunisiardquo IMF Country Report No 10282 Washington DC
Isaksson Anders and Thiam Hee Ng 2006 ldquoDeterminants of Productivity Cross-Country Analysis and Country Case Studiesrdquo UNIDO Working Paper Vienna
45
Lahouel MH 2007 ldquoThe Success of Pro-Poor Growth in Rural and Urban Tunisirdquo In T Besley and LJCord (eds) Delivering on the Promise of Pro-Poor Growth
Insights and Lessons from Countries Experiences Palgrave Macmillan and the World Bank pp 199-218
Lofgren Hans and Carolina Diaz-Bonilla 2010a ldquoMAMS An economy-wide model for analysis of MDG country strategies ndash an application to Latin America and the Caribbeanrdquo In Marco V Saacutenchez Rob Vos Enrique Ganuza Hans Lofgren and Carolina Diaz-Bonilla (eds) Public Policies for Human Development Feasible
Financing Strategies for Achieving MDGs in Latin America and the Caribbean London PalgraveMacmillan
Lofgren Hans 2010 ldquoWhat determines the evolution of MDG indicators A Selective Review of the Literaturerdquo Development Prospects Group (DECPG) Washington DC the World Bank (Third Draft September 21)
Nehru Vikram and Ashok Dhareshwar 1993 ldquoA New Database on Physical Capital Stock Sources Methodology and Resultsrdquo Revista de Anaacutelisis Econoacutemica Vol 8 No 1 pp 37-59 June
Saacutenchez Marco V (2004) Rising inequality and falling poverty in Costa Ricarsquos
agriculture during trade reform A macro-micro general equilibrium analysis Maastricht Shaker
Saacutenchez Marco V and Giacomo Sbrana 2009a ldquoDeterminants of attendance in Jordans educationrdquo Technical note prepared for the Project Assessing Development Strategies to Achieve the Millennium Development Goals (MDGs) in the Arab region New York United Nations Department of Economic and Socials Affairs Available from httpwwwunorgendevelopmentdesapolicycapacitycountry_documentsjordan_sanchez_sbrana_2009pdf
Saacutenchez Marco V Rob Vos Enrique Ganuza Hans Lofgren and Carolina Diaz-Bonilla (eds) 2010 Public Policies for Human Development Feasible Financing
Strategies for Achieving MDGs in Latin America and the Caribbean London PalgraveMacmillan
Saacutenchez Marco V and Giacomo Sbrana 2009b ldquoDeterminants of education attainment and development goals in Yemenrdquo Background paper prepared for the Project Assessing Development Strategies to Achieve the Millennium Development Goals (MDGs) in the Arab region New York United Nations Department of Economic and Socials Affairs Available from httpwwwunorgendevelopmentdesapolicycapacityyemenshtml
Sbrana Giacomo 2009 ldquoTechnical note on the determinants of water and sanitation in Yemenrdquo Technical note prepared for the Project Assessing Development Strategies to Achieve the Millennium Development Goals (MDGs) in the Arab region New York United Nations Department of Economic and Socials Affairs Available from httpwwwunorgendevelopmentdesapolicycapacityyemenshtml
UNDP 2004 Rapport national sur les objectifs du milleacutenaires Tunis United Nations Development Programme
46
Vos Rob and Marco V Saacutenchez 2010 ldquoA Non-Parametric Microsimulation Approach to Assess Changes in Inequality and Povertyrdquo International Journal of
Microsimulation 3(1) 8-23 Available from httpwwwmicrosimulationorgIJMV3_1IJM_25pdf
World Bank 2003 ldquoImplementation completion report (CPL-37820 SCL-3782A SCPM-3782S CPL-37830)rdquo Report No 27171 Water Supply and Sewerage Project Finance Private Sector and Infrastructure Group Middle East and North Africa Region Washington DC The World Bank
World Bank 2003 ldquoTunisia Poverty Update Volume I Main Reportrdquo Washington DC
World Bank 2007 ldquoTunisia Country Assistance Strategy Documentrdquo Washington DC
47
Appendix A1 Elasticities of substitution and household expenditure used in the
calibration of MAMS
Substitution between
Factors
1 imports vs domestic
output 2 exports vs domestic
output 2
Expenditure elasticity of
market demand 2
Agriculture and fishing 074 206 111 081
Food processing 147 183 071 081
Construction materials ceramics glass 138 222 303 065
Mechanical and electrical industries 187 217 144 080
Chemicals 145 270 036 081
Textiles clothing and leather 013 172 123 171
Other manufacturing 114 232 214 121
Mining and oil refining 148 135 025 100
Electricity 127 169 (062) 065
Construction 184 059
Trade 159 (062) 100
Transport and communication 164 140 (062) 119
Hotels cafes and restaurants 137 (140) (062) 137
Finance and insurance 070 (140) (062) 313
Private primary education 070 (150) 340 162
Private secondary education 070 (150) (340) 162
Private tertiary education 070 (150) (340) 162
Private health 070 (140) (062) 122
Other private services 130 (150) (340) 098
Water and sanitation 157 (150) (340) 065
Public primary education 070 162
Public secondary education 070 162
Public tertiary education 070 162
Public health 070 122
Public infrastructure 070 100
Other government activities 070 100
1 Elasticities at the activity level 2 Elasticities at the commodity level Note elasticities in parenthesis were adjusted by the authors to ensure a feasible model solution Original estimates are available upon request Source Estimates by Nidhal Ben Cheikh Moncef Youzbachi and Jameleddine Boumedie as part of the project for which this study was elabourated with minor adjustments by the authors to ensure a feasible model solution
48
Appendix A2 Elasticities of the MDGs with respect to their determinants
Spending per-capita
or per-student
Other public infras-tructure
Household consumption
per-capita MDG 4 MDG 7a MDG 7b
Wage incentives
Non-education MDGs
MDG 4 child mortality -0485 -0010 -0100 -0020 -0020
MDG 5 maternal mortality -0864 -0010 -0100 -0005 -0005
MDG 7a drinking water 0100 0000 0010
MDG 7b basic sanitation 0644 0000 0100
Primary education
Entry rate 1100 0000 0250 -0110 0110
Promotion rate 0867 0150 0250 -0087 0087
Secondary education
Promotion rate 0200 0150 0300 -0017 0017
Graduation amp continuation 0100 0150 0300 -0020 0030
Tertiary education
Promotion rate 0137 0150 0250 -0014 0014
Graduation amp continuation 1230 0100 0750 -0015 0030
Source Authorsrsquo estimates as explained in the text
10
growth has decelerated in traditional manufacturing activities (textiles and clothing) and in activities producing for the domestic market
Fourth agriculturersquos contribution to GDP has fluctuated notably On average it
was 134 percent in 1990-2007 but it has shown to be on average below 10 percent in the period 2005-09
In times when the international economic situation has become unfavourable to Tunisia domestic demand has constituted an important factor for the observed increase in GDP During the past two decades private consumption has intensively contributed to growth and through this it has to some extent compensated for the decline in foreign demand during periods of international crisis such as for example the period when the first gulf war took place in 1991
Private consumption remains the main driver of growth and occupies a central place in Tunisiarsquos development strategy By increasing at an average rate of 47 percent per annum during the period 1990-2007 private consumption accounted for 62 percent of GDP during the same period which is higher than the contribution of exports
In spite of successive privatization plans initiated since the adoption of the SAP
public consumption also remains high at 15 percent of GDP in 2007 compared with 16 percent in 1990 Over the period 1990-2007 public consumption grew by 44 percent per annum and as further shown below this has positively affected progress in terms of meeting the MDGs
Exports are the second driver of growth owing to the export-led growth strategy
that has been implemented since independence in the mid-1950s Oil and other mining products made up for the bulk of exports during the first two decades followed by labour-intensive manufacturing products during the following decades A competitive export-oriented manufacturing sector was developed with participation of foreign firms that were attracted by fiscal incentives The role of this sector continues to be crucial for growth Exports of goods and services grew by 5 percent per annum during the period 1990-2007 which was slighly more than GDP growth during the same period (Table 2) Through such growth pace the average contribution of exports to GDP reached 437 percent over the period 1990-2007 This result was also influenced by an increase in Tunisiarsquos share of the European market and the diversification of markets in general and of products The export supply has been diversifying to high value-added activities in agriculture agribusiness industries mechanical and engineering industries electrical and electronic industries and services
11
Table 2 Tunisia Growth performance and key macroeconomic indicators 1990-
2007 (Period annual averages in percent)
GDP growth rate GDP per capita growth rate Inflation rate Population growth rate Labour force growth rate Domestic demand growth rate Domestic demand as share of GDP Exports growth rate Exports as share of GDP Investment growth rate Investment as share of GDP
48 72 39 13 31 46
776 50
437 40
233
Source Authorsrsquo estimates based on data from the National Institute of Statistics (wwwinsnattn) Note all figures are measured at constant prices
Gross fixed capital formation is the third driver of growth with an average
contribution to GDP estimated at 233 percent during the period 1990-2007 Over the same period total investment increased by 4 percent per annum at constant prices Despite the several policy reforms implemented to increase the role of the private sector in the economy the public sector still plays a crucial role to boost investment The share of public investment in total investment represented 178 percent in 2008 This has been important to maintain relatively sufficient capital stocks for the provision of MDG-related services
In addition to the above factors total factor productivity (TFP) has also contributed to observed growth It accounted for roughly a quarter of GDP growth (including the contribution of human capital) during the period 1980-2000 This contribution went up from 415 percent in 1997-2001 to 469 percent in 2002-06 (Isaksson and Hee Ng 2006) Successive reforms to education and training systems that were aimed at providing both required skills and competencies and a more favourable work environment for better resource use likely boosted productivity This achievement has also likely been driven by better economic performance more exposure to new communication and information technologies as Tunisia has been integrating more into the world economy and more support for research and innovation to diversify products and improve competitiveness
Growth mildly affected by the global financing crisis As said GDP growth rates declined to 45 percent in 2008 and 31 percent in 2009 respectivelly from 64 percent in 2007 This was a clear manifestation of the effects of the global financing crisis on Tunisiarsquos economy However the external position of the country remained solid during the 2008-9 biennium The resilence of tourism receipts and remittances of Tunisian workers from abroad and foreign direct investment (FDI) inflows enabled the country to record confortable reserve levels totaling some US$ 9 billion at end of May 2009 which represent around 56 months of imports (IMF 2009ab) The current account deficit was 42 percent of GDP in 2008 owing to rising imports of commodities and capital goods and it continued to be largely financed by FDI inflows The fiscal
12
position improved markedly in 2008 as the deficit fell to 12 percent of GDP which brought the public debt ratio down to 475 percent of GDP from 581 percent in 2005 At the same time the external debt has continued to decline it went to 537 percent of GDP by late 2008 down from 653 percent in 2005
Tunisia has deployed measures to contain the impact that the global financing crisis has had on its trading partners These measures include a fiscal stimulus package of about 14 percent of GDP and a more accommodating monetary policy by the Central Bank of Tunisia (CBT) The fiscal stimulus package has been geared at supporting the export sector without deliberately boosting internal demand to avoid any deterioration of the trade deficit In response to exporting firms facing a contaction of demand the Tunisian parliament approved a bill in December 2008 that provides for a series of measures to prop up export-oriented businesses including a 50 percent export insurance to be paid for by the government and a 50 percent state reimbursement of social security expenses related to the reduction of working hours (from 48 to 40 per week) This package was revised in June 2009 when the government adopted an amendment that foresees limited relief from corporate tax and VAT for those companies with business volume contracting by more than 15 percent in 2009 However the implementation of this fiscal package was considered to be very slow and therefore it was deemed inefficient (IMF 2009ab) On monetary policy the CBT reduced interest rates implemented policies to increase credit and liquidity in the banking system and doubled its capital to finance small and medium enterprises aiming at boosting domestic investment As a result of this stimulus package the government led the budget deficit before grants and privatization to represent 30 percent of GDP in 2009 from only 1 percent in 2008 while keeping a close eye on macroeconomic stability the external position the public debt ratio and inflation
The economy has reaped benefits from the adoption of the stimulus policies it
managed to grow by 31 percent in 2009 at the same time that most of its main trading partners were witnessing economic recession This relatively good performance was mainly achieved through a better resistance of domestic demand including household consumption and private investment in addition to more government demand Gross fixed capital formation represented 275 percent of GDP in 2009 18 percentage points more than in 2007 and 62 percent of this new investment was contributed by the domestic private sector and 271 percent by FDI Private consumption decelerated notably but it still managed to represent around 62 percent of GDP in 2009 having likely been encouraged by remittances from abroad which declined only by less than 1 percent in local currency compared with their 2008 level The impact of the global financing crisis was mainly manifested in trade In 2009 export and import values (in US$) declined compared to 2008 but the trade deficit fell from -89 percent of GDP in 2008 to -85 in 2009 (IMF 2010) Moreover the overall impact on the current account deficit was also positive as this went down from -38 percent of GDP in 2008 to -28 percent in 2009 owing to net capital inflows and a continued reduction in the foreign debt service Thus the general balance of payments posted an impressive surplus of US$1619 million in 2009 which however represent a slight decline compared with 2008 (US$1662) which helped to boost the level of net assets in foreign currency Facilitated by the absence of additional foreign borrowing the external debt position improved as indicated earlier On the fiscal front in spite of a sharp increase in
13
outlays by the general equalization fund and subsidies for fuel and transport the budget deficit (net of debt service payments and exclusive of privatization and grants) was kept relatively low and it actually went down to only 10 percent of GDP in 2008 owing mainly to higher tax revenues and the rationalization of public expenditure The budget deficit worsen as result of lower economic growth and the adoption of the stimulus program in response to the global financing crisis leveling off at 3 percent of GDP in 2009
The prospects for 2010 were conditioned by uncertainties on the expected global recovery which could particularly have affected exports tourism receipts and workersrsquo remittances from abroad The 2010 budget law maintained a supportive fiscal policy to ensure that the current economic recovery would not be undermined by an early withdrawal of the fiscal stimulus measures introduced in 2009 As said the economy managed to recover by 38 percent in 2010 just to find itself derailed again as a result of the revolution
Growth has been pro-poor Tunisian public policy has targeted growth in tandem with poverty alleviation Integrated rural development programs have been put in place to provide the infrastructure needed to develop agriculture and integrate this sector more with urban areas More investment in education health and birth control programs has helped to increase the quality of human capital significantly both in rural and urban areas The strategy of industrial development based on light manufacturing and export growth as well as the development of tourism has had a high pay-off in terms of employment creation particularly for low-skilled workers The development of other capital-intensive activities such as automobile assembly has however negatively affected efficiency growth job creation and poverty The education strategy pursued in the first two decades after independence (the 1960s and 1970s) was very selective with respect to passing grades and graduating from primary school enabling the availability of a relatively competent civil service and a working force whose recruitment has helped to boost growth and reduce poverty
Six household expenditure surveys have been conducted in Tunisia every five years since 1980 Poverty incidence calculated from them and economic growth figures seem to be highly correlated In this respect five periods can be identified During the period 1980-85 poor economic management and inefficient investment projects undertaken by the public sector resulted in lower economic performance compared to the 1970s However poverty dropped sharply as a result of higher agricultural growth and as the government raised salaries including the minimum wage for farm workers at unprecedented rates and granted record food subsidies The incidence of poverty continued its sharp decline during 1985-90 as the stabilization policies and the SAP were adopted particularly in rural Tunisia where it dropped by as much as six points and agricultural value added continue to grow even though the economic adjustment needed to correct the macroeconomic disequilibria of the first half of the 1990s induced a sharp decline in investment that resulted in a moderate slowdown in growth The reduction of poverty likely was associated with a sharp decline in inequality the Gini coefficient dropped to 040 in 1990 from about 045 in 1985 A third stage 1990-95 witnessed the incidence of rural poverty going up by 27 points for the first time since 1980 while urban poverty declined slightly GDP grew
14
faster than in the previous period but agricultural output contracted due to three consecutive years of drought that put rural poverty on the increase Fourth in the period 1995-2000 rural poverty decreased notably as agricultural output rose and growth accelerated at the fastest pace seen since the late-1970s Lastly in the period 2000-05 poverty continued on the decline in spite of the fact that inequality on the contrary deteriorated In this period rural households were most negatively affected by declining producer prices whereas on the other hand urban households witnessed successive rises in wages and improvements in capital incomes owing to sustained economic growth as further explained below Poverty is expected to increase for 2011 as a consequence of the revolutionrsquos effects on employment and growth
Changes in poverty have been decomposed to gauge the extent to which these have
been explained by variations in mean incomes (growth effect) and income inequality (distribution effect) This kind of analysis allows us to determine if these two factors have worked in the same or the opposite direction and the extent to which growth has been pro-poor Ayadi et al (2005) and Lahouel (2007) have shown that the growth effect has been the major determinant of the continuous reduction in the poverty headcount from 1980 to 2000 The distribution effect has generally been either weak or contrary to the growth effect Complementary evidence is given in the study of Chemingui and Bchir (2008) who found a computed growth elasticity of poverty reduction in the ndash35 to ndash48 range for the 1985-2000 period (that is during that period any 1 percentage point increase in economic growth would reduce the number of poor by 35 to 48 percent)
24 Vulnerabilities and economic constraints
The Tunisian government in all fairness can claim some notable achievements in the area of macroeconomic stabilitymdashhaving tamed inflation and reduced public deficits before the stimulus policies were enactedmdashbut there are still some concerns First Tunisiarsquos tight fiscal policies have permitted to reduce inflation but economic growth may likely have been higher without them Second tight moneraty policy has also led to a persistently overvalued currency making it more difficult for producers to compete with other developing country exporters such as China Third fiscal discipline aimed at controlling the public deficit and the external debt has likely prevented the country from enjoying higher and sustained economic growth through a bolder attempt of scaling up public spending mainly to improve infrastructure Fourth government regulation of many activities represents a real obstacle towards improving domestic competition that would be healthier for economic growth
Health of public finances
The health of the public finances has been fragile to mandatory expenditures Fluctuations in international prices of key commodities such as oil and food have also borne a cost on the government budget and the financial balances of public companies operating in these sectors The phasing out of tariff protection on imports from the EU and other trading partners has also translated into considerable reductions of revenues from duties But
15
reforms to the VAT system and a better collection of taxes on income and profits have allowed the government to compensate for revenue loses (Table 3) Table 3 Tunisia Structure of public revenues 1995-2009 (Percent of total and
GDP)
1995 2000 2005 2009
Percent of tax revenue
- Direct taxes (on income and profit) 239 300 365 398
- Import taxes 228 121 64 45
- VAT 265 332 291 291
- Taxes on consumption 176 176 1533 137
- Other taxes 91 71 126 130
Percent of GDP
- Import taxes 45 24 12 09
- Tax revenue 199 198 206 199
Source National Institute of Statistics of Tunisia (INS in French)
However the government has had to rely relatively more on domestic borrowing to finance its deficit even though the level of national savings is relatively low (Table 4) Domestic borrowing has recently been more seriously constrained though not only because the domestic bond market is relatively underdeveloped but also because workersrsquo remittances from abroad which have come to represent nearly half of national savings have been on the decline since the global financing crisis unfolded and more intensively in 2011 as a result of the revolution and civil war in Libia the main destination of Tunisian migrants Table 4 Tunisia Government deficit borrowing and debt 1995-2009 (Percent of
GDP)
1995 1996 1997 1998 2005 2006 2007 2008 2009
Overall deficit (excluding grants and privatizations)
-45 -51 -42 -28 -32 -36 -31 -10 -30
Overall deficit (including grants and privatizations)
-41 -49 -38 -06 -26 -30 -27 -04 -27
Government borrowing 41 48 38 06 -26 -30 -27 04 27
- Foreign 29 27 24 00 08 -03 -07 02 00
- Domestic 12 21 14 06 18 33 34 02 27
Central government debt 584 606 625 581 583 537 500 433 428
- Foreign 384 365 388 353 210 216 209 170 177
- Domestic 200 241 237 228 372 321 291 263 250
Source INS
16
Maintenance of the budget deficit within tolerable limits has been seen as a precondition to achieve sustained growth and improve the effectiveness of state intervention to support economic and social development For this reason the government has opted to decrease its budget deficit as a percentage of GDP (excluding privatization and grants) with good results had not been for the global financing crisis in response to which stimulus policies put the government deficit back to 3 percent of GDP in 2009 from just 1 percent a year earlier (Table 4) Improvements in the fiscal stance have been possible through reforming taxes to rationalize tax incentives and continue with the progressive reduction of the inclusive tax regime improving the allocation of public resources enhancing the private-public partnership in the field of infrastructure and delivery of some services previously provided solely by the state and limiting fuel subsidies through the continued control of energy use and the progressive adjustment of domestic prices as the economic situation requires This fiscal discipline has translated into a reduction of the government debt to 428 percent of GDP in 2009 from 583 percent in 2005 (Table 4) There remains to be seen if the declining trend of the debt can no longer be sustain owing to the political crisis
External shocks
Tunisiarsquos engagement in trade liberalization introduced two important challenges to the economy There was concern about the likely impact of tariff reductions on tax revenue on the one hand and the possible impact of increased imports on the trade balance and the balance of payments on the other However export promotion policies combined with higher inflows of remittances and FDI enabled a reduction of the current-account deficitmdashto 24 percent of GDP in 2007 from 58 percent in the period 1992-96mdashand an increase in foreign-exchange reserves to be able to cover more than 5 months of imports of goods by late 2007mdashcompared to only 2 months in 1996 Finaly as said foregone import-tariff revenue has been compensated by new revenue resulting from a more sound policy of domestic taxation mainly through reinforcing VAT collection
In addition to trade liberalization Tunisiarsquos economy has been exposed to higher world prices for imported products (mainly food and energy) The relatively high level of diversification has helped the Tunisian economy become less vulnerable to world price shocks Tunisia exports regime is more diversified than in most other MENA countries and it comprises agricultural goods energy some mining products services and various manufactred products
Capital controls for both residents and nonresidents have also allowed the country
to reduce the vulnerability to capital flows More in general good macroeconomic management has permitted Tunisia to more adequately deal with external shocks Starting in 1986 when a sharp fall in oil prices nearly precipitated a balance of payment crisis the authorities have followed consistent stabilization policies and have adopted gradual adjustment measures including through expenditure restraint revenue measures and control of monetary aggregates The exchange rate has been managed flexibly while maintaining overall real stability
17
Economic imbalances and their financing By various indicators Tunisia is a moderately indebted country Total external debt was estimated at 549 percent of GDP by the end of 2007 which is slighly higher than the average annual of 52 percent of GDP of the early 1990s The debt service for principal and interests as a share of exports of goods and services was about 13 percent by the end of 2007 compared to 25 percent on average for the 1990s
To ensure that external balances remain sustainable in the future and avoid higher indeptedness Tunisia is pursuing a three-pronged strategy It is encouraging export development (through the mise agrave niveau or upgrading program) inflows of FDI (including through privatization) and workersrsquo remittances to stengthen foreign-exchange generating capacity It is also trying to deepen the domestic financial markets to ensure adequate budgetary financing from domestic sources Last but not least Tunisia only resorts to international capital markets carefully and strategically in order to maintain its past record as a responsible and reliable debtor that is able to borrow at low emerging market spreads
In the medium term the main risk to Tunisiarsquos external outlook would come from a
failure of this three-pronged strategy A serious deterioration of external balancesmdashthat could be brought about by a concurrent surge in imports from the EU a drop in exports because of weak international demand and domestic competitiveness or less FDI or workersrsquo remittancesmdashwould lead to significantly larger borrowing requirements accompanied by worsening borrowing conditions for emerging economies Not only could this result in an increase of external indebtedness but the external debt profile could also deteriorate through unfavourable rates and terms structure Simulation results presented below however show that the government would need new debt to finance public spending that needs to be scaled up to achieve some MDGs should it find it unfeasible to mobilize resources domestically or unlikely to be fully supported by international donnors
3 Social policy and progress towards the MDGs
31 Evolution and structure of public spending
During the period 1991-2008 public spending (current and capital) averaged 364 percent of GDP compared to 387 percent during the period 1991-2000 Around 48 percent of total budget expenditure has been allocated to current spending Nonetheless the share of current spending increased towards the end of that period and on average reached 49 percent per annum in 2001-08 4 percentage points more than in 1991-2000 All current spendings have grown fast especially salaries and wages which account for the builk of total spending (on average around 66 percent) As a result total current spending increased by 8 percent per annum over the period 2006-08
Since independence the Tunisian government has been paying special attention to
social sectors with a view to improve the social conditions of the population Total public spending on education and health the two main social sectors has however followed an
18
unsteady trend First it fell from 273 percent of total public spending in 1990 to 212 percent in 2000 in order to revert this trend to jump up to 297 percent in 2008 (Table 5) However the share of public spending allocated to the health sector has recorded an impressive decline from over 10 percent during the 1970s and 1980s to a meager 57 percent in 2008 This is the direct result of a voluntary policy of supporting the development of a private health system for which Tunisians have shown growing preference as they have witnessed improved healthcare results Nonetheless as will be shown below the country will still need public interventions to achieve health-related development goals especially that of maternal mortality
Table 5 Tunisia Government spending on transfers and social services 1990-2008 (Percent of total government
spending)
1990 2000 2006 2007 2008
Spending on education 207 160 251 252 240
Spending on health 66 52 61 63 57
Spending on agriculture and water mobilization 61 48 44 41 51
Spending on electrification 41 46 na na na
Food subsidies 88 56 28 27 76
Transfers and other subsidies (energy) 115 159 113 105 123
Source Authorsrsquo calculations based on data from INS
Convinced of the very important repercussions that developing the education sector
may have for human capital investment and unemployment reduction the government has alloted notable amounts of public spending to this sector since independence Primary and seconday education are accessible and free of charge to all individuals while a partial contribution is paid by students at the tertiary level Public spending on education on all education levels has historically been high Its share in total public spending climbed from 207 percent in 1990 to around on average 25 percent over the period 2006-08 Over the period 1990-2008 little more than 91 percent of this spending has been to pay for recurrent activities though which is an indication that infrastructure may be lagging behing in the education sector It is only in 2009 that capital spending increased sharply with the implementation of the fiscal stimulus package of about 14 percent of GDP to invest in public infrastructure health and education and to provide direct support to exporting firms affected by the crisis
Public spending has also been important for agricultural development and water
mobilisation and distribution Most of this spending is alloted for investing in irrigation drainage and reuse of treated wastewater on the one hand and for mobilizing and distributing drinking water on the other The share of public spending alloted to these activities covered about 51 percent of total public spending in 2008 which is about a percentage point below the share of 1990 However it is important to clarify that public spending on mobilization and distribution of safe drinking water is managed by a public enterprise called National Enterprise of Mobilization and Distribution of Water (SONEDE) and a large share of the cost of investments is recovered through periodical bills paid by
19
households Only farmers are paying a small part of the effective cost of distribution of water used for irrigation while investment cost is entirely paid the government
The same effort is also made by the government regarding the production and
distribution of electricity through a public enterprise named Tunisian Enterprise of Electricity and Gas (STEG) which produces and distributes electricity with a full cost-recovery policy from the private sector
The government keeps food subsidies it has granted since the 1970s in order to
maintain domestic food prices at low levels This policy was universal for all household types at the outset until reforms in the 1990s and 2000s allowed for targeting products of basic consumption for the poor Despite the various reforms the cost of this policy represented 76 percent of total government spending in 2008 against only 28 percent in 2006 The high increase in government financial support for household food consumption increased in 2007 and 2008 as result of the food crisis (that is when world food prices of 2008 tripled those of 2000)
Finaly it is important to indicate that the government raised transfers including
social security faster than it increased total expenditure as a result of a challenging progressive reallocation of resources from tradicional social sectors to newer ones In 1980 the government allocated around 75 percent of its resources to social security Two decades later this share had jumped to 159 and 123 percent in 2000 and 2008 respectively and it is expected it will increase owing to the demographic transition of the population
32 Social policy and poverty reduction
Improved living conditions are the main manifestation that social achievements have been at the height of the governmentrsquos commitment to ensure comprehensive development with interdependent dimensions Since independence social policy in Tunisia has been aimed at improving the purchasing power of the population reducing unemployment and poverty improving skills through the development of education and health systems and improving access to social services and gender equality
In the period 1990-2008 peoplersquos incomes benefited from continuous monitoring
facilited by social negotiations the revision of collective agreements reforms to remuneration scales the revision of the minimum wage and the amendment to the labour code The purchasing power of minimum wage workers has been preserved owing to successives revaluations of this wage category At the same time the average purchasing power underwent an improvement of about 2 percentage points annually over the period 1990-2006 due to a continued increase in wages but also to the control of inflation
The government has also intervened intensively to limit the negative repercussions
of economic deregulation on the vulnerable social sectors with the help of a package of social protection instruments Welfare transfers doubled between 1996 and 2005 to adopt such social protection policies with an average cost estimated at 04 percent of GDP (Bibi
20
and Chatti 2007) Also the government continued to subsidize food consumption in spite of the relatively low level of international prices for most agricultural products before the recent food crisis of 2007-08 and even though subsidies have largely decreased since the implementation of the structural adjustment program Since the mid-1990s these subsidies have been more targeted to products consumed by the poor thus contributing significantly to poverty reduction particularly in urban areas The government also implemented many programs of public works to benefit the unemployed poor with a cost estimated at 012 percent of GDP Finally the government is providing almost universal health care to the population with various levels of personal contributions to the real costs of the service delivered The health care system is estimated to cost to the government around 52 percent of the countryrsquos GDP (Bibi and Chatti 2007)
The results recorded in terms of wages incomes and welfare transfers have
improved living conditions Not only has the poverty rate declined as further shown in the below but the share of rudimentary houses has shrunk from 27 percent in 1994 to 08 percent in 2004 and there has been a noticeable 80 percent increase in the rate of household ownership As will also be indicated below the coverage of utility-service indicators (ie drinking water basic sanitation and electrification) has increased notably too particularly in the rural areas
Even though the education system has serious weaknesses it has provided the poor
with significant opportunities to improve their living conditions Several indicators that will be presented below show that there has been remarkable progress in education for example a sharp increase in the average number of years of education among the active population Progress has been higher in coastal regions but this has by and large been shared among the population including regions such as the centre-west where poverty is concentrated
The health system has remained basically public although the private system has
undergone a fast development in recent years as mentioned earlier With the implementation of the National Funds of Health Insurance in 2007 both rich and poor people have the same access to health services and health policy seems to have translated into better health and social security indicators (see next subsection)
Family planning and birth control programs which Tunisia embarked on as early as
the beginning of the 1960s in spite of the fact that this was very unusual for a Muslim country have no doubt played a very important role in moderating population growth over the last three decades from around 3 percent at the beginning of the 1960s to around 11 percent in 2007 This sharp drop in population growth may have had influence on poverty alleviation
Rural development programs have also been a major component of government
policy for the last two decades providing infrastructure water supply electrification roads etc Moreover direct social transfers have been provided for more than 100000 households In 2010 public social expenditures including direct transfers accounted for 18 percent of the GDP
21
33 Evolution of the MDGs over 1990-2005
Tunisia has made considerable progress in achieving MDGs though it may not be fully ready to meet all targets by 2015 under current public spending policies Until 2005 progress in achieving the target of reducing maternal mortality by two thirds was being insufficient and here is where the country faces one of its bigest MDG challenges Areas where progress has on the contrary been remarkable include poverty reduction universal primary education as measured by the primary completion rate for boys and girls and child mortality Progress before the global financing crisis and the political revolution had prompted the government to raise its ambitions to achieve these goals adding new progress indicators such as the quality of education
The Tunisian government has aknowledged that progress at the national level is not
always matched at the sub-regional level where disparities do exist While some regions in the country have experienced remarkable strides in development others are still lagging behind according to the most recent UNDP report available (UNDP 2004) In order to truly address development issues and alleviate poverty for all Tunisians by 2015 more attention would need to be given to the specific challenges facing each of the individual sub-regions A review of progress made in achieiving various of the MDGs and the prospects to achieve them by 2015 is provided in what follows Table 6 shows the progress made in achieving various MDGs until 2005mdashthe base year of a CGE analysis presented in section 4mdashor circa This progress is compared to the targets set for 2015 in order to indicate if based on a linear continuation of past trends Tunisia would seem on track to timely meeting the targets without further policy efforts
Table 6 Tunisia MDG achievement and targets for 2015
1990
(or circa) 2005
(or circa) 2015 target
MDG 1 Poverty headcount ratio (percent of population) - National poverty line - US$125-a-day poverty line (PPP)
67 59
38
25(2000)
34 30
MDG 2 Enrolment rate (percent) - Children aged 6 years - Children aged between 6 and 11 years
963 881
992 (2008-09) 977 (2008-09)
1000 1000
MDG 4 under-five mortality rate (per 1000 live births) 373 221 (2002)
184 (2007)
166
MDG 5 maternal mortality rate (per 100000 live births)
748 548 (2000) 187
MDG 7a Access to clean water (percent of population) 750 978 (2004) 10001 MDG 7b Access to basic sanitation (percent of urban population)
599 (1994)
704 (2002) 783 (2004)
10001
1 A national full coverage target is used in the table and in the policy scenario analysis as further shown below The international target of reducing by half the proportion of the population without coverage (from base year) would be 989 per cent for clean water and 892 percent for basic sanitation in both urban and rural areas Source INS (various publications) World Bank (2007) and UNDP (2004)
22
MDG 1 Eradicate extreme poverty and hunger Social achievements and equity are among Tunisiarsquos greatest assets Not only have these helped ensure internal cohesion but they have also distinguished Tunisia from other countries in the region Pro-poor economic growth and social policies along with lower population growth as indicated earlier have all translated into an impressive record of poverty reduction over the years The incidence of extreme poverty (using the national poverty line) went down from 40 percent in 1960 to 129 percent by 1980 and further down to 67 percent by 1990 (Table 7) This reduction has been possible during a period in which income equality declinedmdashaccording to the Gini coefficient However the rhythm at which extreme poverty incidence had been declining decelerated during the first half of the 1990s when income equality increased The extreme poverty incidence regained its declining trend between 1995 and 2005 where it reached at its lowest level (38 percent) In this period incomes also became more fairly distributed Average per capita expenditures for the lowest decile of the population moved closer to mean expenditures for the country as a whole In absolute terms the number of poor increased from 600000 in 1990 to 690000 in 1995 and fell to 400000 in 2000 (World Bank 2003) Nonetheless many households can be vulnerable to sliding back into poverty as their consumption is closely distributed around the poverty line
As for extreme poverty using the international US$125 a day poverty line it went down from 59 percent in 1990 to 25 percent in 2000 overachieving the 2015 international target of about 30 percent as set for MDG 1 in Table 6 Having also been able to reduce extreme poverty to 38 percent in 2005 as mesured by the national poverty line (Table 7) a decent economic recovery after the global economy crisis and the revolution without any marked deterioration in income inequality would likely take Tunisian to achieve the 34 percent national target by 2015 (Tables 6 and 7) Table 7 Tunisia Poverty incidence and inequality
1 1980-2005
1980 1985 1990 1995 2000 2005
Extreme poverty incidence (percent of the population)
Urban 118 84 73 71 49 19
Rural 141 70 57 49 29 71
Total 129 77 67 62 42 38
Gini coefficient
Urban 0418 0432 0374 0389 0391 na
Rural 0412 0379 0354 0353 0358 na
Total 0455 0453 0401 0417 0409 0400
1 Both poverty incidence and inequality are computed based on consumption per capita data The national extreme poverty line is used to calculate the poverty incidence Source INS
23
MDG 2 Achieve universal primary education The objective of education for all has been consolidated progressively through enourmous efforts since Tunisiarsquos independence Even during the period in which the SAP was introduced did public spending on education remained of paramount importance In 2005 the government spent on education the equivalent to 73 percent of GDP which corresponds to 208 percent of total government expenditures government expenditures on education over the period 1990-2007 vary between 6 and 75 percent of GDP and this share stablized at around 7 percent for 2008-09mdashaccording to the World Bankrsquos World Development Indicators However these efforts have not led to achieving the goal of education for all as the share of students that do not complete the primary cycle though small has not declined as much as expected The adoption of the education reform in July 1991 yielded good results though through guarantying 9 years of basic education for all children aged 6 to 16 allowing a reduction in the dropout rate and increasing schooling of children aged 6 to 122 The enrolment rate for both boys and girls aged 6 passed from around 963 percent in 1990-91 to 99 percent in 1999-2000 and 992 percent in 2008-09 (Table 6) For children aged 6 to 11 the rate of scholling went up from 881 percent in 1990-91 to 971 percent in 1999-2000 and 977 percent in 2008-09 This basically means repetition and dropout are not seriously afflicting primary completion rates in Tunisia
In spite of this achievement the most important setback of this reform seems to be
the decline in the quality of education as increasing the quantity of students has been a priority The illiteracy rate is also still high in Tunisia According to the last results of the general census on population and housing published in 2005 229 percent of the population aged 10 and over is illiterate against 462 percent in 1984 and 317 percent in 1994 However illiteracy in Tunisia is still relatively high among old people The literacy rate for young aged 15 to 24 is estimated at 944 percent in 2004 against 882 percent one decade before
Given observed progress in primary education Tunisia is on track to achieve the
goal of education for all and the country is now improving its education strategy with measures aiming at improving the quality of education through the reinforcement of technical and vocational education training (TVET) However when a more strict measurement is used for MDG 2 for example the on-time completion rate for the cohort of children 6 to 11 the picture changes slightly As further indicated below additional fiscal efforts would be needed to achieve MDG 2 along this more strict measure of progress in schooling MDG 3 Promote gender equality and empower women Since independence Tunisian legislation has also helped to ensure the durability and irreversibility of womenrsquos acquired rights Furthermore these rights have been evolving and adapting constantly to the social changes taking place in the country Hence different
2 The reform introduced in July 1991 stipulated that ldquothe state guarantees free of charge to all school-age children the right to schooling and the maximum equal opportunity to enjoy this right for as long as they are able to regularly attend their schools according to the regulations in forcerdquo
24
amendments to the personal status code promulgated in 1956 and modified in 1993 have been aimed at expurgating all forms of discrimination against women Thus Tunisia is one of the most advanced countries in the region as far as womenrsquos rights are concerned Gender parity is respected in access to health care and education Currently the rates of schooling both at primary and secondary as well as tertiary levels do not discriminate girls who in fact account for more than 50 percent of enrolled students
Moreover the labour market participation is accesible to both males and females
who do receive the same treatment regarding wages and regulations However women only make up for 26 percent of the working population and they tend to be mostly employed by the public sector where their participation is higher than that of males contrary to what is seen in the private sector
MDG 4 Reduce child mortality There has been a significant drop in child mortality over the last decade due to the modernization and coverage of the health system and the various changes occurred in the Tunisian society The continued improvement in living standards as result of declining poverty has been a major determinant of the reduction in the under-five mortality rate which has been systematically diminished from 373 per 1000 live births in 1990 to 184 in 2007 falling short of achieving the MDG target for merely less than 2 deaths per 1000 live births (Table 6) By this measure the country is pretty much on track to achieve MDG 4 by 2015 but this will depend on the ability of the country to reduce the remaining disparities between rural and urban areas in terms of child mortality which are still a major concern for policymakers and for which some extra spending will likely be needed In fact child mortality in rural areas is estimated to double that of urban areas
MDG 5 Reduce maternal mortality In this field policy has been based on the concept of family planning which later on evolved into the concept of mother-and-child health care and which finally included the aspect of reproductive health based on the promotion prevention and management of womenrsquos health in general and the motherrsquos health more in particular The maternal mortality rate was estimated at 548 per 100000 live births in 2000 having systematically fallen by 20 deaths per 100000 live births since 1990 (Table 6) But this progress seems to be insufficient to put the country on track in achieving the 187 maternal mortality rate by 2015 (that is reducing this rate by three quarters between 1990 and 2015) According to UNDP (2004) maternal mortality would only reach 336 per 100000 live births in 2015 if past trends would continue and are linearly extrapolated into the future The main reason behind the lack of progress in reducing maternal mortality is the poor quality of emergency health care and deficient road and transport infrastructure in the rural areas In fact many women who hemorrhaged after giving delivery died while waiting to be transfered to a better-equipped hospital while others reach health centers already too late to be saved Due to these problems a national strategy to reduce maternal mortality had been set up since 1998 This strategy has made it possible to implement a monitoring system for maternal deaths which has enabled improvement of the regional coverage of health centers for
25
preventing and reducing maternal mortality and even so the reduction of maternal mortality continues to be less than required
MDG 7 Ensure environmental sustainability With almost 98 percent of the population having access to safe drinking water Tunisia has made a remarkable improvement towards achieving full coverage moving up from only 75 percent in 1990 (Table 6) The country is pretty much on track to achieve this MDG (7a) but to ensure that such will be the case will depend on the rapidity and efficiency of ongoing investmens to improve the water distribution network in defavored regions3 and getting illegal urbanization under control in both urban and rural areas Tunisiarsquos government has seriously adopted development strategies at its regionsrsquo level to improve the living conditions of its population including through better access to basic public services such as drinking water electrification health services sanitation and education According to the population census for 2004 978 percent of the total population had access to safe drinking water against only 846 percent for the rural population In fact official statistics confirm that disparities still preval among areas and regions of the country with 10 percent of the population leaving in the North West and Centre West having no access to drinking water
Regarding the share of the population with access to the a basic sanitation network official statistics confirm a considerable improvement in this area at the national level from 599 percent in 1994 to 783 percent in 2004 (Table 6) But achieving this MDG (7b) will be more challenging for Tunisia considering that by 2004 there was still a gap of nearly 11 percent of the population without basic sanitation And the problem is that there are still considerable regional variations Coverage of the service varies from 10 percent in some cities of the South to 963 percent in the governorate of Tunis The future progress to meet the target will depend also on ongoing investments that are expected to extend the sanitation network It is worth noting that the connection to a sanitation network is costly and depends on the proximity of the existing network to a given private residence For this reason many households prefer to wait until the number of private residences is large enough to reduce the cost of getting connected to a sanitation network and it is only then that they do request it Thus the achievement of this goal depends also on urbanization policies and the awarness that may be created among households about the health-related importance of taking part of a sanitation network
In all Tunisia will most likely have to scale up public policies to close some
existing MDG gaps that though small their financing may be costly The challenges to achieve MDG 5 seem to be particularly staggering Up to 2009 countercyclical public policies had enabled the country to remain afloat in achieving the MDGs during the global financing crisis But both GDP growth and public spending are expected to decrease in
3 These investments come as part of the ongoing economic and social development plan (2010-14) which the government is implementing through its two concerned public enterprises (ONAS and SONEDE) as well as the Solidarity Fund
26
2010-11 as a result of the political revolution So there also remains to be seen how past progress achieved have been affected by the political crisis
4 Policy scenario analysis
A series of scenarios are evaluated in this section to answer the key questions of this paper clearly what has been the impact of the political crisis on the MDGs The second question is whether under a foreseen economic recovery the country would be expected to achieve the MDGs should it be able to continue with the countercyclical public policies seen before the political crises The mobilization of resources to finance new public spending could face constraints though The economy may not be healthy enough to generate the required level of incomes and savings Externally lenders and investors may sense political uncertainties as risky which leaves the country at the mercy of international donors How much additional public spending would be needed to achieve the MDGs and how this could be financed without triggering unfavourable macro-economic trade-offs to the economy at large would be a third key question Finally what would happen should the countercyclical public policies seen before the political crises not be continued under a foreseen economic recovery path 41 Modelling framework
The MAMS framework is used to address these questions This is a dynamic-recursive CGE model which is described in length in Lofgren and Diaz-Bonilla (2010) The use of a CGE model is justified to the extent that the pursuit of a strategy towards the achievement of the MDGs will likely have strong effects throughout the economy Such strategy would undoubtedly affect demand and supply in the different markets (goods and services factors and foreign exchange) and the related adjustments may imply important trade-offs throughout the period for achieving the MDGs MAMS in particular also takes into consideration the possible synergies between the different goals Such synergies may influence the required expansion of services (for example greater coverage of drinking water supply may reduce the need for health service expansion) or the speed at which the various MDGs are achieved
The strategy adopted to finance the required public spending would also affect the
outcomes For example foreign financing may induce real exchange rate effects while financing through domestic taxes could reduce private consumption demand among other things and domestic borrowing could crowd out credit resources for private investment Tunisian policymakers could thus face important trade-offs depending on the financing of MDG achievement and the space they would have to scale up public spending No doubt increased public spending is essential for achieving the MDGs but adjustments in the real exchange rate real wages and other relative prices may increase the unit costs for achieving the MDGs along with the costs for other sectors or discourage exports thereby widening the external deficit that needs to be financed and so on The productivity gains from greater MDG achievement will take some time to materialize and are thus unlikely to impact growth visibly in the short and medium terms Therefore it is critical that short-run trade-offs not offset potential economic and social gains in the longer run
27
The MAMS framework has been built from a fairly standard CGE framework with
dynamic-recursive features but incorporates a special module which specifies the main determinants of MDG achievement and the direct impact of enhanced public expenditures on MDG-related infrastructure and services (see Lofgren and Diaz-Bonilla 2010) MAMS considers specific targets for achieving universal primary education (MDG 2) reducing under-five and maternal mortality (MDGs 4 and 5) and increasing access to safe water and basic sanitation (MDGs 7a and 7b) In the case of MDG 2 the primary completion rate is the indicator used for universal primary education and this is constructed by the model using data on student behaviour (enrolment repetition graduation) A target is set for completion on time without repetition for the relevant country-specific age cohort for primary school Student behaviour in turn depends on the quality of education (service delivery per student) income incentives (the expected wage premium from education) the under-five mortality rate (a proxy for the health status of the potential student population) household consumption per capita (a proxy for the capacity to pay for education and for opportunity costs) and the level of public infrastructure (a proxy for the effective distance to school) Under-five and maternal mortality are considered to be determined by the availability of public and private health services per capita household consumption per capita the level of public infrastructure (a proxy for the effective distance to health centres and hospitals) and the coverage of water and sanitation services Access to water and sanitation on the other hand depends on household consumption per capita the provision of such services by public or private providers and the level of public infrastructure
The effectiveness of the determinants of MDG achievement follows a non-linear
pattern Logistic functions for the ldquoproductionrdquo of social services are generated in such way that each determinant becomes relatively less effective as progress towards the 2015 target is made These social services may be provided publicly or privately nonetheless it is only new government investment and current expenditures that will lead to a policy-driven increase in the supply of MDG-related services and public infrastructure For this to take place the government has to mobilize sufficient domestic or foreign resources to finance those new investments and expenditures
In the below we tried to answer the above-posed questions by running and
analysing a number of alternative policy scenarios with the application of MAMS with a Tunisian dataset These policy scenarios are compared to a baseline scenario which aims to replicate observed performance and policy stance in recent years The common denominator in each of these policy scenarios is thatmdashunlike in the baselinemdashMDG spending is scaled up in such a way that MDGs 2 4 5 and 7 are achieved by 20154 All these MDG scenarios are performed under alternative financing rules that is to say the required increase in public spending is financed through alternatively increased foreign grant aid foreign borrowing domestic borrowing or taxation These scenarios allow us to assess the MDG-related spending requirements and macroeconomic trade-offs by
4 There are two kinds of policy scenarios one simulates the achievement of each MDG target separately (or two simultaneously as in the case of the health or the sanitation goals) whereas in the other public spending is scaled up as much as required to ensure the simultaneous achievement of all MDG targetsmdashexcluding that of poverty reduction We focus on the second kind of scenarios in this paper
28
comparing results of different MDG achievement and financing settings and those of the baseline scenario
42 Model calibration
The accounting consistency and framework of MAMS and its main structural parameters are provided by a Social Accounting Matrix (SAM) with some of the following especial features (i) separate accounts for public and private activitiescommodities for education (by cycle) health water and sanitation and other public infrastructure are used (ii) capital stocks are included for each government activitymdashto which the national accounts attribute operating surplus (iii) domestic and foreign interest payments are separated from institutional transfers (iv) savings and capital accounts are specified for each institution including the rest of the world (v) in addition to investment demand investment by sector of destination is also specified and (vi) labour is classified by educational level In the particular case of Tunisia the SAM was built for 2005 using official national accounts data from the Central Bank and Tunisian Employment Survey from the National Institute of Statistics
Two-Stage Least Squares (TSLS) and Ordinary Least Squares (OLS) were used to estimate an import-demand function by commodity an export-supply function by commodity and demand functions for factors and intermediate goods by activity in order to estimate the elasticities of substitution (and transformation) used in the model using time series for 1972-2006 for quantity data and price deflators from the Central Bank of Tunisia following specifications used in Saacutenchez (2004) Also a commodity-based expenditure demand function was also estimated to calibrate the Linear Expenditure System (LES) of the model using 6000 observations from National Institute of Statisticsrsquo Household Income and Expenditure Survey (HIES) for 20055 After applying some needed fine-tuning to the initial estimates the elasticity values used for the calibration of the modelrsquos constant-elasticity of substitution and transformation functions and the expenditure system are presented in Appendix A1 Using OLS and a time series for 1971-2007 the elasticity of savings with respect to per-capita income was estimated to be about 095mdashafter controlling for a dummy variable in 1974 (oil shock) an autoregressive and a constant variable A value of as low as 00006 was used for the elasticity of TFP with respect to trade openness based on the study of Chaffai et al (2006) In the absence of data for government capital stocks historical government investment data from the Central Bank of Tunisia a depreciation rate of about 25 percentmdashas used in Ageacutenor et al (2005) for government capital in education health infrastructuremdashand a net profit rate of about
5 Both the construction of the SAM and the estimation of substitution and expenditure elasticities were carried out at the initial stages of the project for which this paper has been prepared by Moncef Youzbachi and Nidhal Ben Cheikh at that moment from respectively the Ministry of Development and International Cooperation and Jameleddine Boumedie from the Tunisian Superior Institute of Statistics and Information Analysis (ESSAI) The SAM suffered minor adjustments by the authors of this paper to update some macroeconomic balances and make it more suitable for the calibration of MAMS The SAM and the estimation results for the elasticities are available upon request to the authors of this paper Using data for 1970-2007 from World Development Indicators (WDI) from the World Bank and the specification that frisch = -36 ypc
-036 (where ypc stands for income per capita) the Frisch parameter for household LES demand was estimated to be equal to -31
29
16 percentmdashas found by Nehru and Dhareshwar (1993) for developing countriesmdashwere used to construct base-year government stock data6
Base-year employment by labour type and activity unemployment by type of
labour and labour force participation rates were obtained from the Tunisian Employment Survey for various years Population data for different cohorts were compiled from the United Nations Population Division Database All other information on national accountsmdashincluding GDP and government consumption growth fiscal accounts and domestic and foreign debt flows and stocksmdashwas obtained from Tunisiarsquos Central Bank
The calibration of the MDG module of MAMS turned out to be more cumbersome
due to lack of data MDG indicators and 2015 targets used in MAMS are consistent with those presented in Table 6 All education related data (enrolment repetition graduation) used to construct the indicator associated with MDG 2 were compiled using NISrsquos data (for primary and secondary) and the Ministry of Education (for tertiary) In this application of MAMS with Tunisian data primary education comprises only 6 grades whereas secondary and tertiary include respectively 7 and 3 grades In other words the new definition whereby the first cycle is basic education and comprises 9 grades is not being used Targeting getting almost all boys and girls in the age cohort to entry and pass all grades of basic education without repetition would be overambitious given the relatively short time span from 2005 (the base year of the model) to 2015 (the target year of the MDGs)
Two additional key pieces of information were used to calibrate the MDG module
in MAMS and more specifically the logistic functions from which MDG indicators are generated including for education On the one hand are the so-called MDG scenario parameters which serve as starting points that help identify a projected outcome for each MDG indicator for an expected year (2010 for MDG 2 given the primary cycle last 6 years and 2015 for all other goals) given a set of values for determinants under whichmdashit is believedmdashthe projected outcome could be achieved The elasticities of the MDGs with respect to its determinants are the other piece of information All this information is also useful in the model to provide the logistic functions with an inflection point from which returns to sector-specific spendingmdashand other determinantsmdashbegin to decrease The model recalculates the initial elasticities in consistency with the shape of the logistic functions
To estimate the MDG scenario parameters we relied heavily on unit cost estimates
and financing gap studies obtained from World Bank (2003) for water and sanitation the World Bankrsquos Road Costs Knowledge System (ROCKS) database for public infrastructure and the World Health Organization (WHO) for mortality rates The student behaviour related determinants are estimated using the data from the UNESCO database We found that public spending per student would barely have to change to achieve the MDGs and this is consistent with the progress shown by completion rates that are publicly
6 It is assumed that over a period of 5 years investment spending has permitted the capital stock to grow at the same real rate as the production of government services using the capital stock in question On the basis of this assumption it is possible to derive capital stocks for the initial year (5 years ago) and the base year
30
available (and the trend for MDG 2 that the model generates as will be seen below) Health spending per-capita would have to be about 43 percent larger between 2005 and 2015 to achieve MDGs 4 and 5 whereas spending in water and sanitation in 2015 would have to be about 23 percent above the value observed in 2005mdashlikely due to existing gaps especially in the rural areas Lastly we found that other public infrastructuremdashnot directly linked to education health and water and sanitationmdashwould have to increase by about 19 percent from 2005 and 2015 in order to achieve the MDGs under study All thesemdashpartial equilibrium or sectoralmdashrequirements are taken and reestimated by MAMS in a general equilibrium setting
Neither data were available to estimate the elasticities of the MDG indicators with
respect to the set of determinants nor no study for Tunisia reports useful parameter values to the knowledge of the authors of this paper To try and overcome this limitation elasticities estimated for Yemen and Jordan and other developing countries (as reported in Saacutenchez and Sbrana 2009ab Sbrana 2009 Lofgren 2010 Kaldewei and Pitterle 2011) were used as starting points Through sensitivity analysis these initial elasticity values were adjusted until given all other information that was being used for the calibration a continuation of the trend shown by MDG indicators since around the year 2000 was being reproduced In the case of MDG 2 as will be seen in the below the model constructs a primary completion rate close to 98 percent for boys and girls aged between 6 and 11 equating this to reported enrolment rates thus assuming that repetition and drop-out rates are nil in Tunisia This may be a strong assumption in the way the model is being calibrated but difficult to be otherwise in view of a lack of official data on primary completion rates
43 Baseline scenarios
Main assumptions Taking real values of 2005 three alternative baseline scenarios were generated for Tunisia once the model was fully calibrated and solved The so-called ldquocountercyclicalrdquo and ldquopro-cyclicalrdquo baseline scenarios assume observed growth rates for both GDP and government consumption in 2006-10 They also project a marked GDP growth deceleration in 2011 owing mostly to the political crisis and subsequently a recovery of GDP at a rate of 55 percent per annum by the end of the simulation period (Figure 1) These two scenarios also show that economic growth was already on the decline since 2008 when the global financing crisis erupted but this crisis barely affected the MDGs during 2008-9 because public spending grew by 46 and 7 percent Both scenarios then include the effects of the global economic and political crises The difference between these two scenarios is in 2010-15 government consumption grows at the GDP growth rate in the pro-cyclical scenario whereas the countercyclical scenario assumes government consumption continues to grow by 7 percent as seen in 2009 Analysis of the countercyclical baseline scenario enables us to respond to how far the government would get in terms of MDG achievement by 2015 should its spending continue to increase at the pace of 2009 What
31
gaps the country would face if government spending rather follows the GDP cycle become apparent when the pro-cyclical and the countercyclical scenarios are compared
A third so-called ldquopre-crisisrdquo baseline scenario is generated to determine what
impact recent political turmoil may have had on the MDGs under certain modelling assumptions For this scenario the GDP growth rate of 2010 (that is 38 percent) before Tunisians witnessed the adverse effects on the political crisis is maintained for 2011-12 GDP grows as in the ldquocrisisrdquo scenarios between 2013 and 2015 Government spending is assumed to trend as in the countercyclical baseline scenario To gauge the effects of the political crisis on the MDGs a comparison between the pre-crisis and the countercyclical scenarios is made This implicitly assumes that the impact of the political crisis on the MDGs is fundamentally transmitted through GDP growthmdashwhich is expected to affect for example household consumption per capita a key determinant of the MDGs Again government spending would not be a transmission mechanism of the political crisis because it is being assumed that continues to grow at the pace observed for 2009
Figure 1 Tunisia Growth rate of real GDP and government consumption in
alternative baseline scenarios 2006-15 (Percent)
63
38
10
55
00
10
20
30
40
50
60
70
80
2006 2007 2008 2009 2010 2011 2012 2013 2014 2015
GDP growth rate - pro-cyclical amp countercyclical baseline scenarios
GDP growth rate - pre-crisis baseline scenario
Gov consumption - pro-cyclical amp pre-crisis baseline scenarios
Gov consumption - countercyclical baseline scenario
Source Central Bank of Tunisia and authorsrsquo assumptions based on a plausible scenario for 2011-15
Notice that both real GDP growth and real government consumption growth are
being imposed on the three baseline scenarios Real GDP growth is merely imposed through a calibration procedure adjusting productivity but GDP is fully endogenous in the model7 This means that for the pre-crisis baseline scenario in particular we are simply
7 GDP growth is driven by factor stocks and efficiency (endogenous and exogenous) parameters investment and depreciation for the different capital types by a combination of demographic factors and the functioning of the educational system for the different labour categories and by an exogenous growth rate for natural resources used in some sectors The aggregate growth trajectory is imposed through the production function
32
assuming that the effects of the political crisis take place through productivity losses without exogenously updating any other parameter Productivity losses affect the level of production and as a result factor employment and household income and consumption per capitamdashthe later being one of the key determinants of the MDGs In the case of government spending it is assumed that consumption and other components of recurrent spending grow at a given rate per annum which is part of the closure rules of the model Government investment spending depends on the demand for capital in the public services sector and this in turn depends on government consumption
Other macroeconomic closure rules used to generate the baseline scenarios are as
follows Government investment spending is covered through current savings and fixed levels of borrowing (domestic and external) and tax rates Any remaining imbalances are covered by foreign transfers from abroad (ie foreign aid) which basically assume their true value as the calibration of the model entailed imposing observed trends for the levels of borrowing and tax revenues The real exchange rate adjusts to clear the current account of the balance of payments Private savings rates adjusts such that private investment equals total savings given a fixed ratio of private investment to GDP
The model distinguishes three types of workers those who have not completed
secondary education (unskilled) those with at least completed secondary education (semi-skilled) and those who have completed some degree in tertiary education (skilled) In all of the scenarios if the unemployment rate by type of worker exceeds a minimum unemployment rate the real wage (with respect to the consumer price index) is equivalent to a ldquoreservation wagerdquo such that the market reaches equilibrium through adjustments in the unemployment rate (or by the same token through changes in the level of employment) If the unemployment rate is at the minimum rate the labour market reaches equilibrium through adjustments in the real wage For other factors (capital and natural resources) equilibrium is given by flexible wages (or rents)
The baseline scenarios reflect the actual aggregate functioning of the Tunisian
economy during the period 2006-10 and project this through 2015mdashbased on existing data available for the preparation of this paper Take for example some results of the pro-cyclical baseline scenario (Table 8) The real exchange rate appreciates on average by 06 percent per annum in the baseline in consistency with more spending in non-tradables (clearly government consumption) though it is worth mentioning that the actual trend of the real exchange rate is not being reproduced as world prices are not updated due to lack of information As a result of this exports fall as a percentage of GDP whereas imports remain on the increasemdashand foreign savings become larger relative to GDP In consistency with past trends government debts decline over time Tax revenue is assumed
The model is first run assuming that the quantity of value added (that is real GDP at factor cost) is exogenous while the exogenous component of the efficiency parameter temporarily becomes endogenous In this run the observed trajectory of real GDP is imposed on the quantity of value added and this is achieved by proportionally scaling the efficiency parameter for all production activities This run becomes the starting point to solve the model again and generate the baseline scenario assuming that the quantity of value added is endogenous and the exogenous component of the efficiency parameter remains exogenous though this is exogenously set to vary yearly to enable reproduction of the observed trajectory of aggregate real GDP growth
33
to remain at around 22 percent after 2010 Foreign transfers to the government increase with respect to the base year to clear the government budget
Table 8 Tunisia Selected macroeconomic and government indicators for the pro-
cyclical baseline scenario 2005-15 (Percent of GDP)
2005 2010 2015
National accounts
Consumption ndash private 634 693 726
Consumption - government 157 166 173
Investment ndash private 129 129 129
Investment - government 96 100 102
Exports 500 398 346
Imports -506 -485 -476
Government
Foreign debt 539 390 319
Domestic debt 28 17 14
Tax revenue 187 219 219
Foreign transfers 08 51 49
Source Authorsrsquo estimates based on application of MAMS for Tunisia
Will the MDGs be achieved under a continuation of public spending policies
If public consumption in 2010-15 continues to grow at the relatively high pace seen in 2009 (that is 7 percent per annum) and public investment follows suit as assumed under the countercyclical baseline scenario progress in achieving the MDGs would be notable but Tunisia would fall short of meeting the targets for primary education mortality rates and water and sanitation coverage by 2015 (Figure 2) The main gaps would be seen for maternal mortality and the coverage of basic sanitation and these would be slightly higher under the public spending assumptions of the pro-cyclical baseline scenario The comparison of the MDG indicator trends of the countercyclical baseline scenario and those of the pre-crisis baseline scenario show that the impact of the political crisis on the MDGs has been modest as it is being assumed that public spending would in any case have continued to grow at a relatively high pace without the political crisis Also the differences between these two scenarios is small in terms of the MDGs because GDP growth which is 42 percent in the countercyclical baseline scenario is only 03 percentage points higher when we assumed a situation without political crisis (Table 9) As a consequence employment is slightly higher and this boots household income and spending moderately As said the later is one of the determinants of the MDGs Private consumption grows by 59 and 63 percent per annum under the countercyclical and pre-crisis baseline scenarios respectively But even though the MDG indicators show very small variations under both scenarios as further shown below such small differences have implications in terms of the additional public spending that would be required to meet the MDG targets
34
Figure 2 Tunisia MDG achievement under the alternative baseline scenarios 2005-
15 (MDG indicators and 2015 targets)
MDG 2 primary completion rate ()
984984
981
9600
9700
9800
9900
10000
2005 2010 2015
target = 999
MDG 5 maternal mortality rate (per 100000 live births)
293
329
289
1500
2000
2500
3000
3500
4000
4500
5000
5500
2005 2010 2015
MDG 4 child mortality rate (per 1000 live births)
173175
173
1500
1600
1700
1800
1900
2005 2010 2015
target = 166
MDG 7a drinking water coverage ( of population)
986987 988
9600
9700
9800
9900
10000
2005 2010 2015
target = 100
MDG 7b basic sanitation coverage ( of population)
866
849
869
7500
8000
8500
9000
9500
10000
2005 2010 2015
Contercyclical baseline scenario
Pro-cyclical baseline scenario
Pre-crisis baseline scenario
target = 100
target = 187
Source Authorsrsquo estimates based on application of MAMS for Tunisia
Table 9 Tunisia GDP consumption and investment in the baseline scenarios 2006-
15 (Percentage annual growth)
countercyclical pro-cyclical pre-crisis
Consumption ndash private 59 59 63
Consumption ndash government 61 43 61
Fixed investment ndash private 51 48 54
Fixed investment - government 78 53 77
GDP at market prices 42 43 45
Source Authorsrsquo estimates based on application of MAMS for Tunisia
35
44 MDG-financing scenarios
Main assumptions The MDG-financing scenarios were generated to make comparisons with themdashrespectivemdashbaseline scenario In these new scenarios public spending increases as much as required to meet the targets for primary education mortality rates and water and sanitation To achieve this some of the closure rules and conditions of the baseline scenarios change Government spending by MDG sector becomes endogenous and no longer increases at a given growth rate as in the baseline scenarios The model remains fully determined (that is the number of endogenous variables is exactly equal to the number of equations) by assuming that the corresponding MDG indicator is exogenous and follows a non-linear trend that given diminishing marginal returns to variations in the MDG determinants leads to fully meeting the targets by 2015 In both baseline and MDG scenarios one financing variable clears the government budget while three other remain fixed and are updated depending on a rule (for example a percentage of GDP can be imposed exogenously on a year-on-year basis) Foreign transfers from abroad (the equivalente to grand aid) clear the government budget in the baseline scenarios as indicated This rule remains unchanged under the MDG scenarios whereby transfers from abroad also finance the additional MDG public spending It does however change when the financing mechanism alternatively is domestic borrowing domestic taxation or foreign borrowing in which case one of these three becomes the clearing variable of the budget Another change in these scenariosmdashwith respect to the baselinesmdashis that the model becomes savings-driven that is private investment adjusts endogenously even as a share of GDP to maintain balance between total savings and total investment How much would it cost to achieve the MDGs
In the MDG-financing scenarios public spending (current and capital) increases endogenously right after the base year of the simulation period in order to achieve the MDGs for primary education child and maternal mortality and water and sanitation In the case of Tunisiarsquos MAMS the base year is 2005 such that public spending scales up starting in 2006 For this reason in this paper the additional public spending required to achieve the MDGs includes what Tunisiarsquos government should have spent but did not spent in 2006-10 to have been fully on track in meeting the MDG targets To this we add the additional spending the government will have to incur in 2011-15 to meet the targets8 Foreign transfers to the government (ftr) domestic direct taxation (tax) foreign borrowing (fb) and domestic borrowing (db) are the financing mechanisms under study and additional public spending required to achieve the MDGs can be much or less depending on the choice of these financing mechanisms
8 The additional public spending requirement to achieve the MDGs is defined as the public spending on MDG-related sectors in the MDG-financing scenarios minus the public spending on MDG-related sectors in the corresponding baseline scenario Annual averages for the additional public spending requirement for 2006-10 and 2011-15 are calculated and subsequently added
36
As can be seen in Table 10 the mortality goals would be the most costly to finance (more than 3 percent of GDP per annum) followed by the primary education goal This is consistent with the earlier analysis in which MDG gaps were presented to be widest for maternal mortality Taking the assumptions of the countercyclical baseline scenario as our first benchmark public spending would need to increase between 57 to 62 percent of GDP per annum in order to achieve the MDGs under study New spending requirements would be little more than 2 percent of GDP for investment thus reflecting the deficient state of infrastructure in the social sectors The cost of financing the MDGs is about 15 percent of GDP higher under the assumptions of the pro-cyclical baseline scenario This may be taken as an indication that a continued effort to maintaining countercyclical spending may pay off in comparison to what the government would have to spend later at an incremental marginal cost if it disrupted spending when GDP was on the decline How feasible it would be for the government to maintain countercyclical spending is the other question that one needs to ask The other finding is that in terms of additional public spending required to achieve the MDGs the effect of the revolution would be very modest (that is around 04 percent of GDP per annum) if public spending continued to be countercyclical If Tunisiarsquos government cannot maintain pre-crisis MDG spending levels and public spending rather falls in 2011 and recovers in 2012 in tandem with GDP as assumed in this scenario analysis the political crisis would make the government incur almost 2 percent of GDP per annum more in spending to meet the MDGs Again it seems that a good strategy to minimize the future cost of achieving the MDGs would be to maintain high public spending growth now in spite of the economic problems that the political crisis may have caused However the mobilization of resources to finance such high countercyclical spending may face constraints that one needs to keep in mind as further explained below Table 10 Tunisia Additional annual public spending requirements to meet the
MDG targets in financing scenarios1
(deviation from baseline scenario
percent of GDP)
Countercyclical Pro-cyclical Pre-crisis
ftr tax fb db ftr tax fb db ftr tax fb db
Primary education 17 18 17 18 23 24 23 25 16 17 16 18
- current 14 14 14 15 17 18 17 18 13 13 13 14
- capital 03 04 03 04 06 07 06 07 03 04 03 04
Health 32 34 32 35 36 39 36 39 30 32 30 33
- current 20 21 20 22 22 24 22 25 19 20 19 21
- capital 12 12 12 12 13 14 13 14 11 12 11 12
Water and sanitation 08 09 08 09 12 13 12 13 07 08 07 08
- current 02 02 02 02 03 03 03 03 02 02 02 02
- capital 06 07 06 07 07 08 07 08 06 06 06 06
Total 57 61 57 62 71 76 71 78 53 57 53 59
- current 36 37 36 39 42 45 42 46 34 35 34 37
- capital 21 23 21 23 26 29 26 29 20 22 20 22
1 Additional public spending and acronyms are defined in the text Source Authorsrsquo estimates based on application of MAMS for Tunisia
37
Macroeconomic trade-offs of MDG financing
In all MDG-financing scenarios the injection of public spending triggers a real exchange rate appreciation (Table 11) This is consistent with the fact that for low- and even middle-income countries like Tunisia large-scale investments for the achievement of the MDGs could meet severe skilled-labour constraints in the short-to-medium run in spite of the high levels of education of the population Public expenditures centred on meeting the MDGs in the form of expanding basic social services in health and education would put intense pressure on a pool of teachers doctors and other trained workers that is likely to be limited Constraints on skilled labour could then lead to upward pressure on the skill premium for such workers which in turn would increase the overall labour costs for the public sector and the cost of achieving the MDGs9 As a result ldquonon-tradablesrdquo such as MDG-related services become relatively more expensive than ldquotradablesrdquo as public spending is scaled up and this translates into a real exchange rate appreciation This penalizes export sectors regardless of the financing mechanism of public spending which in the case of Tunisia affects GDP growth though this trade off is more marked when foreign resources are used owing to the associated inflow of foreing exchange (Table 11) In the MDG-financing scenarios exports grow less than in the baseline and only when foreign resources are used to finance the new public spending would imports increase slightly more than in the baseline (that is merely 01 percentage points per annum) As a result trade volumes in the MDG-financing scenarios increase at a lower pace compared to the baseline scenario In MAMS trade openness is represented by the ratio of trade volumes to GDP and is one of the determinants of factor productivity Thus the deceleration of GDP growth in the MDG-financing scenarios is also explained by a reduction in factor productivity relative to the baseline Higher factor employment in the MDG sectors is insufficient to revert the reduction in GDP
GDP growth is slightly less though when the new public spending is financed through domestic borrowing or increased tax revenues as these financing mechanisms also penalize private spending On one hand borrowing domestically implies the government takes a (larger) share of private savings to finance the budget thus crowding out private investment and as a result private consumption and imports On the other hand increased taxation reduces the amount of disposable income households can spend to consume which subsequently reflects also in reduced private spending and imports Due to the macroeconomic trade-offs it triggers the MDG strategy cannot be expected to bring about a stimulus to the economy in the short term Moreover as said earlier the productivity gains from greater MDG achievement will take some time to materialize and are thus unlikely to impact growth visibly in the short and medium terms Not only would GDP growth be less than in the baseline and foreign-financing scenarios but the reduction in private spending in education and health services in the domestic-financing scenarios would have to be fully compensated by even more public spending to meet the MDG targets Domestic borrowing mainly but also increased taxation to a lesser extent would
9 In fact it was noted that for the highly skilled workers wage growth is about 1 percentage point higher in the MDG financing scenarios compared to the baseline scenarios Wage growth is only slightly higher for the other less skillful workers and it is actually less for the unskilled workers in the scenarios with domestic borrowing and increased taxation where GDP growth decelerates as further explained below
38
push up public spending requirements to meet the MDGs in a range of 04 to 07 percent of GDP per annum (see Table 10)
Table 11 Tunisia Real macroeconomic indicators in MDG-financing scenarios
2006-15 (deviation from baseline scenario percentage annual growth)
Countercyclical Pro-cyclical Pre-crisis
ftr tax fb db ftr tax fb db ftr tax fb db
Absorption 02 -02 02 -02 03 -03 03 -03 02 -02 02 -02
Consumption - private 01 -05 01 -06 00 -08 00 -09 01 -05 01 -06
Consumption - government 13 14 13 14 20 22 20 22 13 14 13 14
Fixed investment - private -01 -04 -01 -03 -01 -05 -01 -04 -01 -04 -01 -03
Fixed investment ndash government 1 25 30 27 29 19 19 19 20 28 30 28 30
Exports -12 -10 -12 -08 -17 -14 -17 -10 -11 -10 -11 -08
Imports 01 -04 01 -05 00 -08 00 -07 01 -04 01 -05
GDP at market prices -02 -03 -02 -03 -02 -04 -02 -03 -02 -03 -02 -03
Total factor employment (index) 01 00 01 00 02 01 02 01 01 00 01 00
Total factor productivity (index) -02 -03 -02 -03 -03 -04 -03 -04 -02 -03 -02 -03
Real exchange rate (index) -05 -03 -05 -02 -06 -02 -06 -02 -05 -02 -05 -02
1 Government fixed investment was calculated for two sub-periods 2006-8 when capital spending is frontloaded to raise capital stocks in MDG sectors and 2009-15 when capital stocks in MDG sectors do not have to increase as much as they are already sufficient for the government to deliver required MDG services The difference between the annual growth rates of government fixed investment for these sub-periods is presented in the table for government fixed investment Source Authorsrsquo estimates based on application of MAMS for Tunisia
Feasibility of MDG financing Not only would domestic borrowing or increased taxation be less desirable financing mechanisms in view of the relatively higher public spending requirements but they would unlikely be feasible options for Tunisia Domestic resources would not easily be mobilized to finance MDG public spending given already low savings that will perhaps be even lower under the expectation that growth would decelerate substantially in 2011 and the economy would start to recover only at a moderate pace in 2012 During this biennium unemployment will likely reach dramatically high levels particularly for the youth and remittancesrsquo inflows will unlikely be increasing Furthermore the domestic debt is fairly small as a percentage of GDP which is not only as a result of fiscal objectives but also an indication that Tunisiarsquos domestic bond market may not be developed enough to allocate domestic savings in amounts that are commensurate to the financing of development goals
Tax revenue was almost 20 percent of GDP in 2009 (Table 3) Not only would this tax burden be considered relatively high for developing country standards but it has also difficult to raise it From 1995 to 2009 tax collection has essentially remained unchanged as percent of GDP Against this backdrop further increases of the tax burden in the midst of forming and consolidating a new political regime and trying to recover economic
39
growth would most likely be politically infeasible and economically undesirable Improving tax collection should be a priority but achieving this will require some time
According to the simulation results tax revenue would need to increase by more
than 6 percentage points of GDP by 2015 in order for the government to be able to finance the new MDG spending under the tax financing scenario that takes the countercyclical baseline as the benchmark (Table 12) As also measured for the new MDG spending (Table 11) this accounts for both the extent to which tax revenue should have increasedmdashbut did not increasemdashin 2006-10 in order to have fully financed the newly required MDG spending and the tax revenue that the government would additional have to raise to continue financing MDG spending until the targets are met by 2015 Tax revenue would even have to be about 4 percentage points of GDP higher if public spending declines in tanden with GDP in 2011mdashas assumed under the pro-cyclical baseline scenario since the MDG gaps to finance under this scenario would be more pronounced
These are macroeconomic constraints that Tunisia would likely face if the
government decides to finance newly required MDG spending through domestic borrowing or increased taxation As explained above these are financing options that would also curtail private spending in MDG-related sectors making the government incur more MDG spending compared to a situation where financing is through resources from abroad Table 12 Tunisia Additional annual foreign aid and tax revenue required to achieve
the MDGs in the corresponding MDG financing scenario1
2011-15
(deviation from baseline scenario percent of GDP)
Tax revenue
(tax financing scenario) Foreign aid
(ftr financing scenario)
Countercyclical baseline 64 64
Pro-cyclical baseline 106 87
Pre-crisis baseline 61 62
1 Additional foreign aid and tax revenue requirements are defined in the text Source Authorsrsquo estimates based on application of MAMS for Tunisia
Tunisia will unavoidably have to rely on foreign resources to reconstruct its political system spur economic growth and finance development goals Given the political changes this country is going through which after constitutional amendments could pave the way for a full-blown election and the good signs that economic growth may pick up steam in 2012 the international donor community has already pledged help
According to the simulation results following the same kind of estimation of additional financing requirements used for tax revenue Tunisia would also need little more than 6 percent of GDP per annum in foreign aid to be able to finance public spending in primary education health and water and sanitation in order to meet the targets by 2015 (Table 12) This public spending is assumed to be countercyclical meaning that as
40
simulated failure to sustain public spending for MDG sectors from 2011 would likely widen MDG gaps and increase the cost of financing the MDGs which tends to be incremental in marginal terms the closer to 2015 In fact taking the conditions of the pro-cyclical baseline scenario as the benchmark we find that almost 9 percent of GDP per annum would be the amount of foreign aid required to be able to finance public spending and meet the MDGs by 2015 This would put required foreign aid to achieve the MDGs under study in the range of US$27 to US$39 billion per annum10 In late May 2011 the G8 group promised US$20 billion to Tunisia and Egypt in loans and grants over the next three years The first tranche of which several billions would presumably go to Tunisia would be disbursed during the second semester of 2011 It would then be quite feasible for Tunisia to achieve the MDGs under study should this help materialize and if part of this is directed to MDG sectors in the next four years Non-concessional loans and other borrowing from abroad would on the contrary be at the cost of accumulating debt but it is perhaps the only other feasible option for Tunisia to mobilize resources for MDG financingmdashalong with using receipts from selling confiscated assets belonging to members of the ousted government as further indicated below Following the trend of 2005-09 the government debt is on the decline in the baseline scenarios and it levels off above 30 percent by 2015 (Figure 3) The government debt would increase to almost 62 percent of GDP under the foreign borrowing scenario that takes the countercyclical spending assumption as the reference path This would not be such unfeasible financing mechanism if the government could live with a debt 6 percentage points of GDP higher than in 2005 It can be seen that under the assumption of pro-cyclical spending for which we already gauged the additional public spending required to achieve the MDGs government debt would be slightly higher compared to the countercyclical baseline scenario reaching almost 74 percent of GDP in 2015 In other words waiting for GDP growth to catch up again in order to resume MDG public spending would not only widen MDG gaps but also as it becomes more costly to achieve the MDGs towards the end of the simulation period it would put the debt burden under unsustainable territory The upshot here is that countercyclical spending reduces the cost of the MDG financing strategy not only in terms of new public spending required but also in terms of debt accumulation compared to a situation where public spending follows GDP downturns that increase the government efforts towards the end of the simulation period Finally the simulation results also show that government indebtedness would have needed to increase by only 3 percentage points of GDP by 2015 compared to 2005 if the political crisismdashas simulated heremdashhad not unfolded
10 Estimates are based on additional foreign aid requirements presented in Table 12 and GDP at current prices (US$443 billion) as recorded in the July 2011 update of IMFrsquos World Economic Outlook
41
Figure 3 Tunisia Government debt in the baseline and foreign-borrowing (fb)
scenarios 2005 2009 2015 (Percent of GDP)
Source Authorsrsquo estimates based on application of MAMS for Tunisia
5 Conclusions and policy recommendations
Before the recent global financing crisis and political revolution Tunisia was one of the fastest growing economies in the MENA region Since the 1990s the country was reaping benefits from various structural reforms a labour-intensive and export-oriented growth strategy the liberalisation of the economy and a prudent management of monetary and fiscal policies This economic model helped to propel growth but the economy remained vulnerable to external shocks and seriously challenged by high unemployment Given that the government has essentially continued the strategy it addopted since the 1960s of providing social transfers and food subsidies to fight poverty and supporting education and health sectors considerable progress in achieving the MDGs had been witnessed before the economic and political crises and some targetsmdashsuch as that of halving extreme poverty from its 1990 levelmdashhad already basically been met In spite of progress lack of access to parental care and insufficient health service delivery in rural areas combined with inadequate transport infrastructure and services have seriously imperiled further reducing maternal mortality An important share of the population also lacks basic sanitation especially in the rural areas
Foreign demand for Tunisianrsquos exports diminished as a result of the global financing crisis and this translated into sluggish growth Even so MDG progress was not interrupted owing to the governmentrsquos countercyclical spending policy Just when the economy started to show symptoms of recovery in 2010 discontent of the population about unemployment and corruption mainly led to a political revolution that has raised challenges at all levels
42
In this study we used a CGE model to perform a scenario analysis with a view to shed light on the prospects and challenges Tunisia faces to achieve the MDGs We showed that progress in achieving the MDGs would continue to be notable if public spending continues to grow as seen before the revolution but the targets for primary education child and maternal mortality and water and sanitation would not be met by 2015 The main gaps would be seen for maternal mortality mainly and basic sanitation to a lower extent MDG progress is found to be slightly less if public spending becomes pro-cyclical and follows the GDP deceleration expected for 2011 The impact of the political crisis on the MDGsmdashprimarily transmitted through less household income and consumption per capitamdashwould be only modest if the government manages to keep MDG spending countercyclical to sluggish GDP growth The global financing crisis did not affect MDG achievement precisely because the government maintained spending growing at high rates in spite of the observed GDP deceleration
Our analysis further showed that in order to meet the MDGs under study by 2015 public spending would need to rise by 57-78 percent of GDP per annummdashdepending on how public spending evolves after the political crisis and the mechanism used to finance it The mortality goals would be the most expensive to finance (32-39 percent of GDP per annum) followed by the primary education goal Little more than half of the newly required spending would be for new investment to compensate for deficiencies in infrastructure Additional resources required would tend to be relatively less if high growth of public spending seen before the revolution is not disrupted which in turn would help to minimize the impact of the political crisis on the MDGs
The injection of additional public spending could result in a small real exchange rate appreciationmdashif skilled-labour supply constraints lead to upward pressure on the skill premium for teachers doctors and other trained workers which in turn increases labour costs for the public sectormdashthat would somewhat penalize exports and economic growth This effect was found to be larger for scenarios in which additional MDG public spending is financed with resources from abroad owing to the inflow of foreign exchangemdashwhich likely are amongst the few financing options at Tunisiarsquos disposal But GDP growth was found to be even slightly less when the new public spending was financed through domestic borrowing or increased tax revenues Domestic borrowing by the government crowds out private investment as a (larger) share of private savings is diverted to finance the budget thus hurting private consumption and imports Increased taxation in turn reduces disposable income which subsequently also translates into reduced private spending and imports In these cases we found the government incurs an extra cost of 04-07 percent of GDP per annum in order to compensate for less private spending in MDG-related sectors And due to these macroeconomic trade-offs the MDG strategy should not be expected to act as a catalyst to stimulate the economy in the short term The productivity gains from greater MDG achievement would take some time to materialize as typically expected from any development strategy
Both domestic borrowing and increased taxation would be less desirable and perhaps infeasible options to finance the newly required MDG spending in Tunisia The revolution has hurt the economy and it would be unthinkable that under such
43
circumstances sufficient national savings could be mobilized to finance MDG public spending Workerrsquos remittances from abroad have been an important source of household savings but also these have been on the decline These two mechanisms of domestic resource mobilization could actually slow down the economic recovery that Tunisians badly need Furthermore Tunisiarsquos domestic bond market is not sufficiently developed to allocate domestic savings in amounts that are commensurate to the required financing of development goals The existing tax burden hovering 20 percent of GDP would also be considered relatively high for developing country standards Using these financing mechanisms in the midst of the formation and consolidation of a new political regime would also likely be politically infeasible
Whether it wants it or not Tunisia will have to rely on foreign resources to reconstruct its political system spur economic growth and finance development goals The use of non-concessional loans and other borrowing from abroad to achieve the MDGs would come at the cost of accumulating debt at levels that may perhaps be considered inconsistent with debt targets According to the scenario analysis performed relying on foreign borrowing alone to finance MDG achievement would push the government debt up to at least 62 percent of GDP by 2015mdashor even more if high growth of public spending seen before the political crisis is disrupted in the short term
Acquiring new debt at such high levels may however be avoided if the international donor community honours recent pledges of grant aid that it has made The donorsrsquo willingness to help Tunisia builds on the expectation that current political changes will translate into constitutional amendments that ultimately pave the way for a full-blown election and economic growth will pick up steam in 2012 According to our scenario analysis Tunisia would need at least little more than 6 percent of GDP per annum in foreign aid compared to what is currently receiving in order to be able to finance public spending required to timely meet the goals in primary education health and water and sanitation without resorting to other sources of financing The required foreign aid to achieve the MDGs would be in the range of US$27 to US$39 billion per annum depending on the pace at which MDG spending grows after the political crisis This would pretty much fall under amounts of aid that the G8 group of rich countries has promised to grant to Tunisia and Egypt
If foreign aid cannot be mobilized in the amounts that would be required to finance
the MDG strategy a combination of this and foreign borrowingmdashof levels that would not compromise debt sustainablitymdashwould be recommended Nevertheless domestic resource mobilization should gradually replace foreign resource mobilization mainly through fiscal reforms that permit to enhance the efficiency of tax collection and by this means broaden the tax base Furthermore the fiscal constraints could be eased if the sale of assets confiscated from members of the ousted government generates resources to finance the achievement of development goals In any case the government will also need to engage in more active production sector and labour market policies in order to raise productivity growth improve production capacity and create more jobs in the economy Only so would the economy really pick up steam and recover and the alarming unemployment levels be
44
reduced The impact of economic growth on poverty reduction could also be enhanced if the said fiscal reforms are progressive and help to reduce inequality
References
Ageacutenor Pierre-Richard Nihal Bayraktar and Karim El Aynaoui 2005 ldquoRoads out of
poverty Assessing the links between aid public investment growth and poverty reductionrdquo World Bank Policy Research Paper 3490
Ayadi M G Boulila M Lahouel and P Montigny (2005) ldquoPro-Poor Growth in Tunisiardquo International Development and Strategies Paris France
Bibi S and R Chatti 2007 ldquoPublic Spending Pro-Poor Growth and Poverty Reduction in Tunisia A Multi-level Analysisrdquo In Ali Abdel Gadir Ali and Shenggen Fan (eds) Public Policy and Poverty Reduction in the Arab Region State of Kuwait The Arab Planning Institute pp 259-319
Chaffai M E Patrick Plane and Dorra Triki Guermazi 2006 ldquoTotal Factor Productivity in Tunisian Manufacturing Sectors Convergence or Catch-up with OECD membersrdquo Working Paper Series The World Bank
Chemingui MA and H Bchir Mohammed 2008 ldquoDoes Multilateral Trade Liberalization Matters for Poverty Reduction in Africardquo Background paper for for the International Policy Analysis Network project (in collaboration with IFPRI) Washington DC
Cornelia Kaldewei y Ingo Pitterle 2011 ldquoBehavioural Factors as Emerging Main Determinants of Child Mortality in Middle-Income Countries A Case Study of Jordanrdquo DESA Working Paper No 103 New York United Nations Department of Economic and Socials Affairs Available from httpwwwunorgesadesapapers2011wp103_2011pdf
ETF (European Training Foundation) 2007 ldquoThe contribution of Human Resources Development to Migration Development in Tunisiardquo Research Report Available from httpwwwetfeuropaeupubmgmtnsf(getAttachment)5CD26BB43A026CD8C12573DB004D8AD2$FileNOTE7B7KG6pdf
IMF 2009a ldquoIMF Executive Board Concludes 2009 Article IV Consultation with Tunisiardquo Washington DC International Monetary Fund
IMF 2009b ldquoStatement of the IMF Mission on the 2009 Article IV Consultation with Tunisiardquo Washington DC International Monetary Fund
IMF 2010 ldquoTunisia 2010 Article IV ConsultationmdashStaff Report Public Information Notice on the Executive Board Discussion and Statement by the Executive Director for Tunisiardquo IMF Country Report No 10282 Washington DC
Isaksson Anders and Thiam Hee Ng 2006 ldquoDeterminants of Productivity Cross-Country Analysis and Country Case Studiesrdquo UNIDO Working Paper Vienna
45
Lahouel MH 2007 ldquoThe Success of Pro-Poor Growth in Rural and Urban Tunisirdquo In T Besley and LJCord (eds) Delivering on the Promise of Pro-Poor Growth
Insights and Lessons from Countries Experiences Palgrave Macmillan and the World Bank pp 199-218
Lofgren Hans and Carolina Diaz-Bonilla 2010a ldquoMAMS An economy-wide model for analysis of MDG country strategies ndash an application to Latin America and the Caribbeanrdquo In Marco V Saacutenchez Rob Vos Enrique Ganuza Hans Lofgren and Carolina Diaz-Bonilla (eds) Public Policies for Human Development Feasible
Financing Strategies for Achieving MDGs in Latin America and the Caribbean London PalgraveMacmillan
Lofgren Hans 2010 ldquoWhat determines the evolution of MDG indicators A Selective Review of the Literaturerdquo Development Prospects Group (DECPG) Washington DC the World Bank (Third Draft September 21)
Nehru Vikram and Ashok Dhareshwar 1993 ldquoA New Database on Physical Capital Stock Sources Methodology and Resultsrdquo Revista de Anaacutelisis Econoacutemica Vol 8 No 1 pp 37-59 June
Saacutenchez Marco V (2004) Rising inequality and falling poverty in Costa Ricarsquos
agriculture during trade reform A macro-micro general equilibrium analysis Maastricht Shaker
Saacutenchez Marco V and Giacomo Sbrana 2009a ldquoDeterminants of attendance in Jordans educationrdquo Technical note prepared for the Project Assessing Development Strategies to Achieve the Millennium Development Goals (MDGs) in the Arab region New York United Nations Department of Economic and Socials Affairs Available from httpwwwunorgendevelopmentdesapolicycapacitycountry_documentsjordan_sanchez_sbrana_2009pdf
Saacutenchez Marco V Rob Vos Enrique Ganuza Hans Lofgren and Carolina Diaz-Bonilla (eds) 2010 Public Policies for Human Development Feasible Financing
Strategies for Achieving MDGs in Latin America and the Caribbean London PalgraveMacmillan
Saacutenchez Marco V and Giacomo Sbrana 2009b ldquoDeterminants of education attainment and development goals in Yemenrdquo Background paper prepared for the Project Assessing Development Strategies to Achieve the Millennium Development Goals (MDGs) in the Arab region New York United Nations Department of Economic and Socials Affairs Available from httpwwwunorgendevelopmentdesapolicycapacityyemenshtml
Sbrana Giacomo 2009 ldquoTechnical note on the determinants of water and sanitation in Yemenrdquo Technical note prepared for the Project Assessing Development Strategies to Achieve the Millennium Development Goals (MDGs) in the Arab region New York United Nations Department of Economic and Socials Affairs Available from httpwwwunorgendevelopmentdesapolicycapacityyemenshtml
UNDP 2004 Rapport national sur les objectifs du milleacutenaires Tunis United Nations Development Programme
46
Vos Rob and Marco V Saacutenchez 2010 ldquoA Non-Parametric Microsimulation Approach to Assess Changes in Inequality and Povertyrdquo International Journal of
Microsimulation 3(1) 8-23 Available from httpwwwmicrosimulationorgIJMV3_1IJM_25pdf
World Bank 2003 ldquoImplementation completion report (CPL-37820 SCL-3782A SCPM-3782S CPL-37830)rdquo Report No 27171 Water Supply and Sewerage Project Finance Private Sector and Infrastructure Group Middle East and North Africa Region Washington DC The World Bank
World Bank 2003 ldquoTunisia Poverty Update Volume I Main Reportrdquo Washington DC
World Bank 2007 ldquoTunisia Country Assistance Strategy Documentrdquo Washington DC
47
Appendix A1 Elasticities of substitution and household expenditure used in the
calibration of MAMS
Substitution between
Factors
1 imports vs domestic
output 2 exports vs domestic
output 2
Expenditure elasticity of
market demand 2
Agriculture and fishing 074 206 111 081
Food processing 147 183 071 081
Construction materials ceramics glass 138 222 303 065
Mechanical and electrical industries 187 217 144 080
Chemicals 145 270 036 081
Textiles clothing and leather 013 172 123 171
Other manufacturing 114 232 214 121
Mining and oil refining 148 135 025 100
Electricity 127 169 (062) 065
Construction 184 059
Trade 159 (062) 100
Transport and communication 164 140 (062) 119
Hotels cafes and restaurants 137 (140) (062) 137
Finance and insurance 070 (140) (062) 313
Private primary education 070 (150) 340 162
Private secondary education 070 (150) (340) 162
Private tertiary education 070 (150) (340) 162
Private health 070 (140) (062) 122
Other private services 130 (150) (340) 098
Water and sanitation 157 (150) (340) 065
Public primary education 070 162
Public secondary education 070 162
Public tertiary education 070 162
Public health 070 122
Public infrastructure 070 100
Other government activities 070 100
1 Elasticities at the activity level 2 Elasticities at the commodity level Note elasticities in parenthesis were adjusted by the authors to ensure a feasible model solution Original estimates are available upon request Source Estimates by Nidhal Ben Cheikh Moncef Youzbachi and Jameleddine Boumedie as part of the project for which this study was elabourated with minor adjustments by the authors to ensure a feasible model solution
48
Appendix A2 Elasticities of the MDGs with respect to their determinants
Spending per-capita
or per-student
Other public infras-tructure
Household consumption
per-capita MDG 4 MDG 7a MDG 7b
Wage incentives
Non-education MDGs
MDG 4 child mortality -0485 -0010 -0100 -0020 -0020
MDG 5 maternal mortality -0864 -0010 -0100 -0005 -0005
MDG 7a drinking water 0100 0000 0010
MDG 7b basic sanitation 0644 0000 0100
Primary education
Entry rate 1100 0000 0250 -0110 0110
Promotion rate 0867 0150 0250 -0087 0087
Secondary education
Promotion rate 0200 0150 0300 -0017 0017
Graduation amp continuation 0100 0150 0300 -0020 0030
Tertiary education
Promotion rate 0137 0150 0250 -0014 0014
Graduation amp continuation 1230 0100 0750 -0015 0030
Source Authorsrsquo estimates as explained in the text
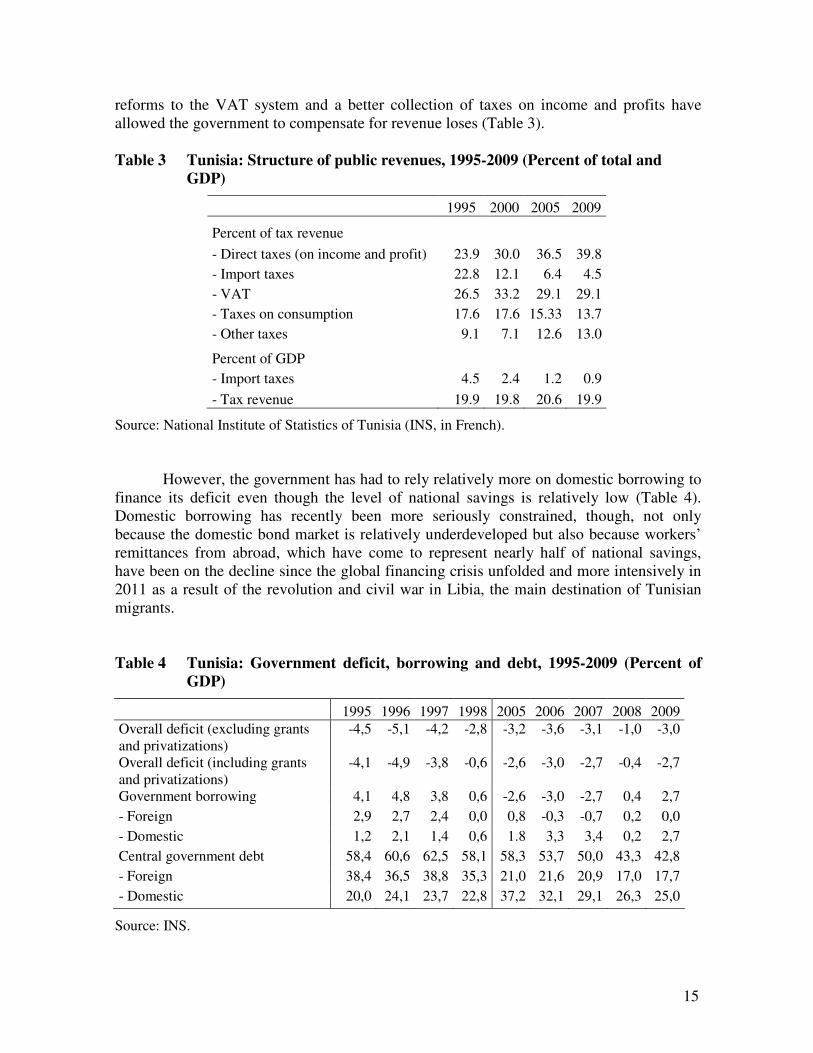
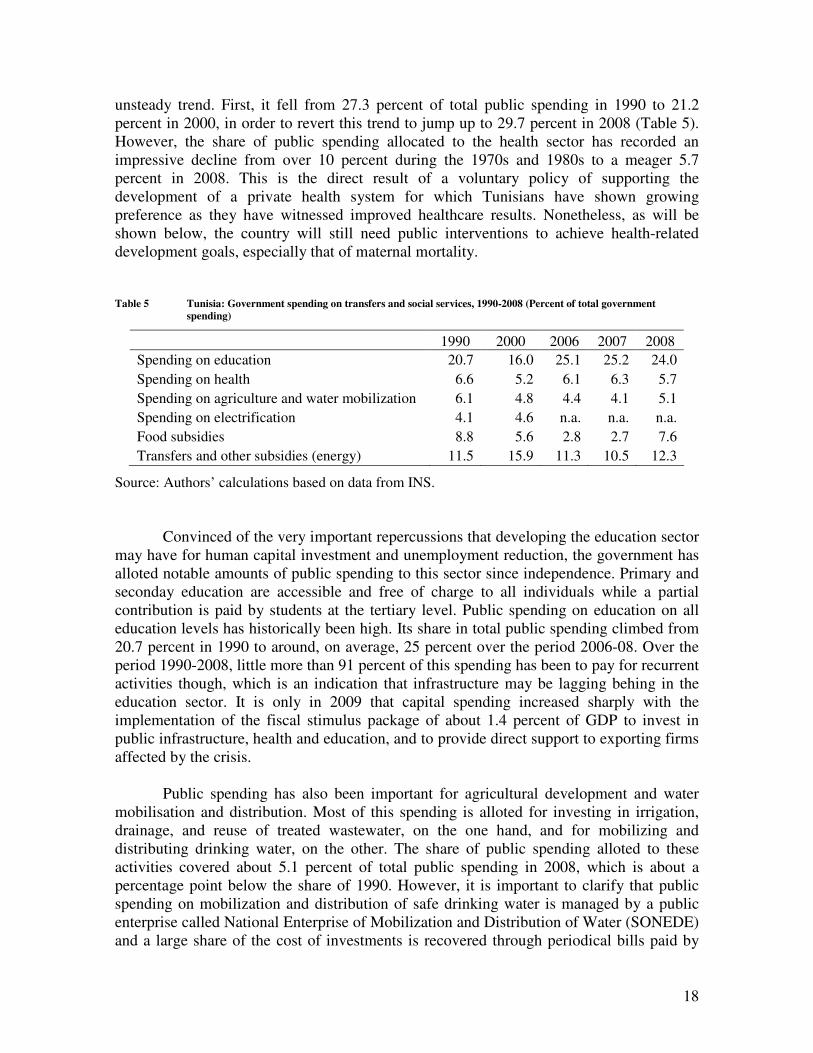

20
and Chatti 2007) Also the government continued to subsidize food consumption in spite of the relatively low level of international prices for most agricultural products before the recent food crisis of 2007-08 and even though subsidies have largely decreased since the implementation of the structural adjustment program Since the mid-1990s these subsidies have been more targeted to products consumed by the poor thus contributing significantly to poverty reduction particularly in urban areas The government also implemented many programs of public works to benefit the unemployed poor with a cost estimated at 012 percent of GDP Finally the government is providing almost universal health care to the population with various levels of personal contributions to the real costs of the service delivered The health care system is estimated to cost to the government around 52 percent of the countryrsquos GDP (Bibi and Chatti 2007)
The results recorded in terms of wages incomes and welfare transfers have
improved living conditions Not only has the poverty rate declined as further shown in the below but the share of rudimentary houses has shrunk from 27 percent in 1994 to 08 percent in 2004 and there has been a noticeable 80 percent increase in the rate of household ownership As will also be indicated below the coverage of utility-service indicators (ie drinking water basic sanitation and electrification) has increased notably too particularly in the rural areas
Even though the education system has serious weaknesses it has provided the poor
with significant opportunities to improve their living conditions Several indicators that will be presented below show that there has been remarkable progress in education for example a sharp increase in the average number of years of education among the active population Progress has been higher in coastal regions but this has by and large been shared among the population including regions such as the centre-west where poverty is concentrated
The health system has remained basically public although the private system has
undergone a fast development in recent years as mentioned earlier With the implementation of the National Funds of Health Insurance in 2007 both rich and poor people have the same access to health services and health policy seems to have translated into better health and social security indicators (see next subsection)
Family planning and birth control programs which Tunisia embarked on as early as
the beginning of the 1960s in spite of the fact that this was very unusual for a Muslim country have no doubt played a very important role in moderating population growth over the last three decades from around 3 percent at the beginning of the 1960s to around 11 percent in 2007 This sharp drop in population growth may have had influence on poverty alleviation
Rural development programs have also been a major component of government
policy for the last two decades providing infrastructure water supply electrification roads etc Moreover direct social transfers have been provided for more than 100000 households In 2010 public social expenditures including direct transfers accounted for 18 percent of the GDP
21
33 Evolution of the MDGs over 1990-2005
Tunisia has made considerable progress in achieving MDGs though it may not be fully ready to meet all targets by 2015 under current public spending policies Until 2005 progress in achieving the target of reducing maternal mortality by two thirds was being insufficient and here is where the country faces one of its bigest MDG challenges Areas where progress has on the contrary been remarkable include poverty reduction universal primary education as measured by the primary completion rate for boys and girls and child mortality Progress before the global financing crisis and the political revolution had prompted the government to raise its ambitions to achieve these goals adding new progress indicators such as the quality of education
The Tunisian government has aknowledged that progress at the national level is not
always matched at the sub-regional level where disparities do exist While some regions in the country have experienced remarkable strides in development others are still lagging behind according to the most recent UNDP report available (UNDP 2004) In order to truly address development issues and alleviate poverty for all Tunisians by 2015 more attention would need to be given to the specific challenges facing each of the individual sub-regions A review of progress made in achieiving various of the MDGs and the prospects to achieve them by 2015 is provided in what follows Table 6 shows the progress made in achieving various MDGs until 2005mdashthe base year of a CGE analysis presented in section 4mdashor circa This progress is compared to the targets set for 2015 in order to indicate if based on a linear continuation of past trends Tunisia would seem on track to timely meeting the targets without further policy efforts
Table 6 Tunisia MDG achievement and targets for 2015
1990
(or circa) 2005
(or circa) 2015 target
MDG 1 Poverty headcount ratio (percent of population) - National poverty line - US$125-a-day poverty line (PPP)
67 59
38
25(2000)
34 30
MDG 2 Enrolment rate (percent) - Children aged 6 years - Children aged between 6 and 11 years
963 881
992 (2008-09) 977 (2008-09)
1000 1000
MDG 4 under-five mortality rate (per 1000 live births) 373 221 (2002)
184 (2007)
166
MDG 5 maternal mortality rate (per 100000 live births)
748 548 (2000) 187
MDG 7a Access to clean water (percent of population) 750 978 (2004) 10001 MDG 7b Access to basic sanitation (percent of urban population)
599 (1994)
704 (2002) 783 (2004)
10001
1 A national full coverage target is used in the table and in the policy scenario analysis as further shown below The international target of reducing by half the proportion of the population without coverage (from base year) would be 989 per cent for clean water and 892 percent for basic sanitation in both urban and rural areas Source INS (various publications) World Bank (2007) and UNDP (2004)
22
MDG 1 Eradicate extreme poverty and hunger Social achievements and equity are among Tunisiarsquos greatest assets Not only have these helped ensure internal cohesion but they have also distinguished Tunisia from other countries in the region Pro-poor economic growth and social policies along with lower population growth as indicated earlier have all translated into an impressive record of poverty reduction over the years The incidence of extreme poverty (using the national poverty line) went down from 40 percent in 1960 to 129 percent by 1980 and further down to 67 percent by 1990 (Table 7) This reduction has been possible during a period in which income equality declinedmdashaccording to the Gini coefficient However the rhythm at which extreme poverty incidence had been declining decelerated during the first half of the 1990s when income equality increased The extreme poverty incidence regained its declining trend between 1995 and 2005 where it reached at its lowest level (38 percent) In this period incomes also became more fairly distributed Average per capita expenditures for the lowest decile of the population moved closer to mean expenditures for the country as a whole In absolute terms the number of poor increased from 600000 in 1990 to 690000 in 1995 and fell to 400000 in 2000 (World Bank 2003) Nonetheless many households can be vulnerable to sliding back into poverty as their consumption is closely distributed around the poverty line
As for extreme poverty using the international US$125 a day poverty line it went down from 59 percent in 1990 to 25 percent in 2000 overachieving the 2015 international target of about 30 percent as set for MDG 1 in Table 6 Having also been able to reduce extreme poverty to 38 percent in 2005 as mesured by the national poverty line (Table 7) a decent economic recovery after the global economy crisis and the revolution without any marked deterioration in income inequality would likely take Tunisian to achieve the 34 percent national target by 2015 (Tables 6 and 7) Table 7 Tunisia Poverty incidence and inequality
1 1980-2005
1980 1985 1990 1995 2000 2005
Extreme poverty incidence (percent of the population)
Urban 118 84 73 71 49 19
Rural 141 70 57 49 29 71
Total 129 77 67 62 42 38
Gini coefficient
Urban 0418 0432 0374 0389 0391 na
Rural 0412 0379 0354 0353 0358 na
Total 0455 0453 0401 0417 0409 0400
1 Both poverty incidence and inequality are computed based on consumption per capita data The national extreme poverty line is used to calculate the poverty incidence Source INS
23
MDG 2 Achieve universal primary education The objective of education for all has been consolidated progressively through enourmous efforts since Tunisiarsquos independence Even during the period in which the SAP was introduced did public spending on education remained of paramount importance In 2005 the government spent on education the equivalent to 73 percent of GDP which corresponds to 208 percent of total government expenditures government expenditures on education over the period 1990-2007 vary between 6 and 75 percent of GDP and this share stablized at around 7 percent for 2008-09mdashaccording to the World Bankrsquos World Development Indicators However these efforts have not led to achieving the goal of education for all as the share of students that do not complete the primary cycle though small has not declined as much as expected The adoption of the education reform in July 1991 yielded good results though through guarantying 9 years of basic education for all children aged 6 to 16 allowing a reduction in the dropout rate and increasing schooling of children aged 6 to 122 The enrolment rate for both boys and girls aged 6 passed from around 963 percent in 1990-91 to 99 percent in 1999-2000 and 992 percent in 2008-09 (Table 6) For children aged 6 to 11 the rate of scholling went up from 881 percent in 1990-91 to 971 percent in 1999-2000 and 977 percent in 2008-09 This basically means repetition and dropout are not seriously afflicting primary completion rates in Tunisia
In spite of this achievement the most important setback of this reform seems to be
the decline in the quality of education as increasing the quantity of students has been a priority The illiteracy rate is also still high in Tunisia According to the last results of the general census on population and housing published in 2005 229 percent of the population aged 10 and over is illiterate against 462 percent in 1984 and 317 percent in 1994 However illiteracy in Tunisia is still relatively high among old people The literacy rate for young aged 15 to 24 is estimated at 944 percent in 2004 against 882 percent one decade before
Given observed progress in primary education Tunisia is on track to achieve the
goal of education for all and the country is now improving its education strategy with measures aiming at improving the quality of education through the reinforcement of technical and vocational education training (TVET) However when a more strict measurement is used for MDG 2 for example the on-time completion rate for the cohort of children 6 to 11 the picture changes slightly As further indicated below additional fiscal efforts would be needed to achieve MDG 2 along this more strict measure of progress in schooling MDG 3 Promote gender equality and empower women Since independence Tunisian legislation has also helped to ensure the durability and irreversibility of womenrsquos acquired rights Furthermore these rights have been evolving and adapting constantly to the social changes taking place in the country Hence different
2 The reform introduced in July 1991 stipulated that ldquothe state guarantees free of charge to all school-age children the right to schooling and the maximum equal opportunity to enjoy this right for as long as they are able to regularly attend their schools according to the regulations in forcerdquo
24
amendments to the personal status code promulgated in 1956 and modified in 1993 have been aimed at expurgating all forms of discrimination against women Thus Tunisia is one of the most advanced countries in the region as far as womenrsquos rights are concerned Gender parity is respected in access to health care and education Currently the rates of schooling both at primary and secondary as well as tertiary levels do not discriminate girls who in fact account for more than 50 percent of enrolled students
Moreover the labour market participation is accesible to both males and females
who do receive the same treatment regarding wages and regulations However women only make up for 26 percent of the working population and they tend to be mostly employed by the public sector where their participation is higher than that of males contrary to what is seen in the private sector
MDG 4 Reduce child mortality There has been a significant drop in child mortality over the last decade due to the modernization and coverage of the health system and the various changes occurred in the Tunisian society The continued improvement in living standards as result of declining poverty has been a major determinant of the reduction in the under-five mortality rate which has been systematically diminished from 373 per 1000 live births in 1990 to 184 in 2007 falling short of achieving the MDG target for merely less than 2 deaths per 1000 live births (Table 6) By this measure the country is pretty much on track to achieve MDG 4 by 2015 but this will depend on the ability of the country to reduce the remaining disparities between rural and urban areas in terms of child mortality which are still a major concern for policymakers and for which some extra spending will likely be needed In fact child mortality in rural areas is estimated to double that of urban areas
MDG 5 Reduce maternal mortality In this field policy has been based on the concept of family planning which later on evolved into the concept of mother-and-child health care and which finally included the aspect of reproductive health based on the promotion prevention and management of womenrsquos health in general and the motherrsquos health more in particular The maternal mortality rate was estimated at 548 per 100000 live births in 2000 having systematically fallen by 20 deaths per 100000 live births since 1990 (Table 6) But this progress seems to be insufficient to put the country on track in achieving the 187 maternal mortality rate by 2015 (that is reducing this rate by three quarters between 1990 and 2015) According to UNDP (2004) maternal mortality would only reach 336 per 100000 live births in 2015 if past trends would continue and are linearly extrapolated into the future The main reason behind the lack of progress in reducing maternal mortality is the poor quality of emergency health care and deficient road and transport infrastructure in the rural areas In fact many women who hemorrhaged after giving delivery died while waiting to be transfered to a better-equipped hospital while others reach health centers already too late to be saved Due to these problems a national strategy to reduce maternal mortality had been set up since 1998 This strategy has made it possible to implement a monitoring system for maternal deaths which has enabled improvement of the regional coverage of health centers for
25
preventing and reducing maternal mortality and even so the reduction of maternal mortality continues to be less than required
MDG 7 Ensure environmental sustainability With almost 98 percent of the population having access to safe drinking water Tunisia has made a remarkable improvement towards achieving full coverage moving up from only 75 percent in 1990 (Table 6) The country is pretty much on track to achieve this MDG (7a) but to ensure that such will be the case will depend on the rapidity and efficiency of ongoing investmens to improve the water distribution network in defavored regions3 and getting illegal urbanization under control in both urban and rural areas Tunisiarsquos government has seriously adopted development strategies at its regionsrsquo level to improve the living conditions of its population including through better access to basic public services such as drinking water electrification health services sanitation and education According to the population census for 2004 978 percent of the total population had access to safe drinking water against only 846 percent for the rural population In fact official statistics confirm that disparities still preval among areas and regions of the country with 10 percent of the population leaving in the North West and Centre West having no access to drinking water
Regarding the share of the population with access to the a basic sanitation network official statistics confirm a considerable improvement in this area at the national level from 599 percent in 1994 to 783 percent in 2004 (Table 6) But achieving this MDG (7b) will be more challenging for Tunisia considering that by 2004 there was still a gap of nearly 11 percent of the population without basic sanitation And the problem is that there are still considerable regional variations Coverage of the service varies from 10 percent in some cities of the South to 963 percent in the governorate of Tunis The future progress to meet the target will depend also on ongoing investments that are expected to extend the sanitation network It is worth noting that the connection to a sanitation network is costly and depends on the proximity of the existing network to a given private residence For this reason many households prefer to wait until the number of private residences is large enough to reduce the cost of getting connected to a sanitation network and it is only then that they do request it Thus the achievement of this goal depends also on urbanization policies and the awarness that may be created among households about the health-related importance of taking part of a sanitation network
In all Tunisia will most likely have to scale up public policies to close some
existing MDG gaps that though small their financing may be costly The challenges to achieve MDG 5 seem to be particularly staggering Up to 2009 countercyclical public policies had enabled the country to remain afloat in achieving the MDGs during the global financing crisis But both GDP growth and public spending are expected to decrease in
3 These investments come as part of the ongoing economic and social development plan (2010-14) which the government is implementing through its two concerned public enterprises (ONAS and SONEDE) as well as the Solidarity Fund
26
2010-11 as a result of the political revolution So there also remains to be seen how past progress achieved have been affected by the political crisis
4 Policy scenario analysis
A series of scenarios are evaluated in this section to answer the key questions of this paper clearly what has been the impact of the political crisis on the MDGs The second question is whether under a foreseen economic recovery the country would be expected to achieve the MDGs should it be able to continue with the countercyclical public policies seen before the political crises The mobilization of resources to finance new public spending could face constraints though The economy may not be healthy enough to generate the required level of incomes and savings Externally lenders and investors may sense political uncertainties as risky which leaves the country at the mercy of international donors How much additional public spending would be needed to achieve the MDGs and how this could be financed without triggering unfavourable macro-economic trade-offs to the economy at large would be a third key question Finally what would happen should the countercyclical public policies seen before the political crises not be continued under a foreseen economic recovery path 41 Modelling framework
The MAMS framework is used to address these questions This is a dynamic-recursive CGE model which is described in length in Lofgren and Diaz-Bonilla (2010) The use of a CGE model is justified to the extent that the pursuit of a strategy towards the achievement of the MDGs will likely have strong effects throughout the economy Such strategy would undoubtedly affect demand and supply in the different markets (goods and services factors and foreign exchange) and the related adjustments may imply important trade-offs throughout the period for achieving the MDGs MAMS in particular also takes into consideration the possible synergies between the different goals Such synergies may influence the required expansion of services (for example greater coverage of drinking water supply may reduce the need for health service expansion) or the speed at which the various MDGs are achieved
The strategy adopted to finance the required public spending would also affect the
outcomes For example foreign financing may induce real exchange rate effects while financing through domestic taxes could reduce private consumption demand among other things and domestic borrowing could crowd out credit resources for private investment Tunisian policymakers could thus face important trade-offs depending on the financing of MDG achievement and the space they would have to scale up public spending No doubt increased public spending is essential for achieving the MDGs but adjustments in the real exchange rate real wages and other relative prices may increase the unit costs for achieving the MDGs along with the costs for other sectors or discourage exports thereby widening the external deficit that needs to be financed and so on The productivity gains from greater MDG achievement will take some time to materialize and are thus unlikely to impact growth visibly in the short and medium terms Therefore it is critical that short-run trade-offs not offset potential economic and social gains in the longer run
27
The MAMS framework has been built from a fairly standard CGE framework with
dynamic-recursive features but incorporates a special module which specifies the main determinants of MDG achievement and the direct impact of enhanced public expenditures on MDG-related infrastructure and services (see Lofgren and Diaz-Bonilla 2010) MAMS considers specific targets for achieving universal primary education (MDG 2) reducing under-five and maternal mortality (MDGs 4 and 5) and increasing access to safe water and basic sanitation (MDGs 7a and 7b) In the case of MDG 2 the primary completion rate is the indicator used for universal primary education and this is constructed by the model using data on student behaviour (enrolment repetition graduation) A target is set for completion on time without repetition for the relevant country-specific age cohort for primary school Student behaviour in turn depends on the quality of education (service delivery per student) income incentives (the expected wage premium from education) the under-five mortality rate (a proxy for the health status of the potential student population) household consumption per capita (a proxy for the capacity to pay for education and for opportunity costs) and the level of public infrastructure (a proxy for the effective distance to school) Under-five and maternal mortality are considered to be determined by the availability of public and private health services per capita household consumption per capita the level of public infrastructure (a proxy for the effective distance to health centres and hospitals) and the coverage of water and sanitation services Access to water and sanitation on the other hand depends on household consumption per capita the provision of such services by public or private providers and the level of public infrastructure
The effectiveness of the determinants of MDG achievement follows a non-linear
pattern Logistic functions for the ldquoproductionrdquo of social services are generated in such way that each determinant becomes relatively less effective as progress towards the 2015 target is made These social services may be provided publicly or privately nonetheless it is only new government investment and current expenditures that will lead to a policy-driven increase in the supply of MDG-related services and public infrastructure For this to take place the government has to mobilize sufficient domestic or foreign resources to finance those new investments and expenditures
In the below we tried to answer the above-posed questions by running and
analysing a number of alternative policy scenarios with the application of MAMS with a Tunisian dataset These policy scenarios are compared to a baseline scenario which aims to replicate observed performance and policy stance in recent years The common denominator in each of these policy scenarios is thatmdashunlike in the baselinemdashMDG spending is scaled up in such a way that MDGs 2 4 5 and 7 are achieved by 20154 All these MDG scenarios are performed under alternative financing rules that is to say the required increase in public spending is financed through alternatively increased foreign grant aid foreign borrowing domestic borrowing or taxation These scenarios allow us to assess the MDG-related spending requirements and macroeconomic trade-offs by
4 There are two kinds of policy scenarios one simulates the achievement of each MDG target separately (or two simultaneously as in the case of the health or the sanitation goals) whereas in the other public spending is scaled up as much as required to ensure the simultaneous achievement of all MDG targetsmdashexcluding that of poverty reduction We focus on the second kind of scenarios in this paper
28
comparing results of different MDG achievement and financing settings and those of the baseline scenario
42 Model calibration
The accounting consistency and framework of MAMS and its main structural parameters are provided by a Social Accounting Matrix (SAM) with some of the following especial features (i) separate accounts for public and private activitiescommodities for education (by cycle) health water and sanitation and other public infrastructure are used (ii) capital stocks are included for each government activitymdashto which the national accounts attribute operating surplus (iii) domestic and foreign interest payments are separated from institutional transfers (iv) savings and capital accounts are specified for each institution including the rest of the world (v) in addition to investment demand investment by sector of destination is also specified and (vi) labour is classified by educational level In the particular case of Tunisia the SAM was built for 2005 using official national accounts data from the Central Bank and Tunisian Employment Survey from the National Institute of Statistics
Two-Stage Least Squares (TSLS) and Ordinary Least Squares (OLS) were used to estimate an import-demand function by commodity an export-supply function by commodity and demand functions for factors and intermediate goods by activity in order to estimate the elasticities of substitution (and transformation) used in the model using time series for 1972-2006 for quantity data and price deflators from the Central Bank of Tunisia following specifications used in Saacutenchez (2004) Also a commodity-based expenditure demand function was also estimated to calibrate the Linear Expenditure System (LES) of the model using 6000 observations from National Institute of Statisticsrsquo Household Income and Expenditure Survey (HIES) for 20055 After applying some needed fine-tuning to the initial estimates the elasticity values used for the calibration of the modelrsquos constant-elasticity of substitution and transformation functions and the expenditure system are presented in Appendix A1 Using OLS and a time series for 1971-2007 the elasticity of savings with respect to per-capita income was estimated to be about 095mdashafter controlling for a dummy variable in 1974 (oil shock) an autoregressive and a constant variable A value of as low as 00006 was used for the elasticity of TFP with respect to trade openness based on the study of Chaffai et al (2006) In the absence of data for government capital stocks historical government investment data from the Central Bank of Tunisia a depreciation rate of about 25 percentmdashas used in Ageacutenor et al (2005) for government capital in education health infrastructuremdashand a net profit rate of about
5 Both the construction of the SAM and the estimation of substitution and expenditure elasticities were carried out at the initial stages of the project for which this paper has been prepared by Moncef Youzbachi and Nidhal Ben Cheikh at that moment from respectively the Ministry of Development and International Cooperation and Jameleddine Boumedie from the Tunisian Superior Institute of Statistics and Information Analysis (ESSAI) The SAM suffered minor adjustments by the authors of this paper to update some macroeconomic balances and make it more suitable for the calibration of MAMS The SAM and the estimation results for the elasticities are available upon request to the authors of this paper Using data for 1970-2007 from World Development Indicators (WDI) from the World Bank and the specification that frisch = -36 ypc
-036 (where ypc stands for income per capita) the Frisch parameter for household LES demand was estimated to be equal to -31
29
16 percentmdashas found by Nehru and Dhareshwar (1993) for developing countriesmdashwere used to construct base-year government stock data6
Base-year employment by labour type and activity unemployment by type of
labour and labour force participation rates were obtained from the Tunisian Employment Survey for various years Population data for different cohorts were compiled from the United Nations Population Division Database All other information on national accountsmdashincluding GDP and government consumption growth fiscal accounts and domestic and foreign debt flows and stocksmdashwas obtained from Tunisiarsquos Central Bank
The calibration of the MDG module of MAMS turned out to be more cumbersome
due to lack of data MDG indicators and 2015 targets used in MAMS are consistent with those presented in Table 6 All education related data (enrolment repetition graduation) used to construct the indicator associated with MDG 2 were compiled using NISrsquos data (for primary and secondary) and the Ministry of Education (for tertiary) In this application of MAMS with Tunisian data primary education comprises only 6 grades whereas secondary and tertiary include respectively 7 and 3 grades In other words the new definition whereby the first cycle is basic education and comprises 9 grades is not being used Targeting getting almost all boys and girls in the age cohort to entry and pass all grades of basic education without repetition would be overambitious given the relatively short time span from 2005 (the base year of the model) to 2015 (the target year of the MDGs)
Two additional key pieces of information were used to calibrate the MDG module
in MAMS and more specifically the logistic functions from which MDG indicators are generated including for education On the one hand are the so-called MDG scenario parameters which serve as starting points that help identify a projected outcome for each MDG indicator for an expected year (2010 for MDG 2 given the primary cycle last 6 years and 2015 for all other goals) given a set of values for determinants under whichmdashit is believedmdashthe projected outcome could be achieved The elasticities of the MDGs with respect to its determinants are the other piece of information All this information is also useful in the model to provide the logistic functions with an inflection point from which returns to sector-specific spendingmdashand other determinantsmdashbegin to decrease The model recalculates the initial elasticities in consistency with the shape of the logistic functions
To estimate the MDG scenario parameters we relied heavily on unit cost estimates
and financing gap studies obtained from World Bank (2003) for water and sanitation the World Bankrsquos Road Costs Knowledge System (ROCKS) database for public infrastructure and the World Health Organization (WHO) for mortality rates The student behaviour related determinants are estimated using the data from the UNESCO database We found that public spending per student would barely have to change to achieve the MDGs and this is consistent with the progress shown by completion rates that are publicly
6 It is assumed that over a period of 5 years investment spending has permitted the capital stock to grow at the same real rate as the production of government services using the capital stock in question On the basis of this assumption it is possible to derive capital stocks for the initial year (5 years ago) and the base year
30
available (and the trend for MDG 2 that the model generates as will be seen below) Health spending per-capita would have to be about 43 percent larger between 2005 and 2015 to achieve MDGs 4 and 5 whereas spending in water and sanitation in 2015 would have to be about 23 percent above the value observed in 2005mdashlikely due to existing gaps especially in the rural areas Lastly we found that other public infrastructuremdashnot directly linked to education health and water and sanitationmdashwould have to increase by about 19 percent from 2005 and 2015 in order to achieve the MDGs under study All thesemdashpartial equilibrium or sectoralmdashrequirements are taken and reestimated by MAMS in a general equilibrium setting
Neither data were available to estimate the elasticities of the MDG indicators with
respect to the set of determinants nor no study for Tunisia reports useful parameter values to the knowledge of the authors of this paper To try and overcome this limitation elasticities estimated for Yemen and Jordan and other developing countries (as reported in Saacutenchez and Sbrana 2009ab Sbrana 2009 Lofgren 2010 Kaldewei and Pitterle 2011) were used as starting points Through sensitivity analysis these initial elasticity values were adjusted until given all other information that was being used for the calibration a continuation of the trend shown by MDG indicators since around the year 2000 was being reproduced In the case of MDG 2 as will be seen in the below the model constructs a primary completion rate close to 98 percent for boys and girls aged between 6 and 11 equating this to reported enrolment rates thus assuming that repetition and drop-out rates are nil in Tunisia This may be a strong assumption in the way the model is being calibrated but difficult to be otherwise in view of a lack of official data on primary completion rates
43 Baseline scenarios
Main assumptions Taking real values of 2005 three alternative baseline scenarios were generated for Tunisia once the model was fully calibrated and solved The so-called ldquocountercyclicalrdquo and ldquopro-cyclicalrdquo baseline scenarios assume observed growth rates for both GDP and government consumption in 2006-10 They also project a marked GDP growth deceleration in 2011 owing mostly to the political crisis and subsequently a recovery of GDP at a rate of 55 percent per annum by the end of the simulation period (Figure 1) These two scenarios also show that economic growth was already on the decline since 2008 when the global financing crisis erupted but this crisis barely affected the MDGs during 2008-9 because public spending grew by 46 and 7 percent Both scenarios then include the effects of the global economic and political crises The difference between these two scenarios is in 2010-15 government consumption grows at the GDP growth rate in the pro-cyclical scenario whereas the countercyclical scenario assumes government consumption continues to grow by 7 percent as seen in 2009 Analysis of the countercyclical baseline scenario enables us to respond to how far the government would get in terms of MDG achievement by 2015 should its spending continue to increase at the pace of 2009 What
31
gaps the country would face if government spending rather follows the GDP cycle become apparent when the pro-cyclical and the countercyclical scenarios are compared
A third so-called ldquopre-crisisrdquo baseline scenario is generated to determine what
impact recent political turmoil may have had on the MDGs under certain modelling assumptions For this scenario the GDP growth rate of 2010 (that is 38 percent) before Tunisians witnessed the adverse effects on the political crisis is maintained for 2011-12 GDP grows as in the ldquocrisisrdquo scenarios between 2013 and 2015 Government spending is assumed to trend as in the countercyclical baseline scenario To gauge the effects of the political crisis on the MDGs a comparison between the pre-crisis and the countercyclical scenarios is made This implicitly assumes that the impact of the political crisis on the MDGs is fundamentally transmitted through GDP growthmdashwhich is expected to affect for example household consumption per capita a key determinant of the MDGs Again government spending would not be a transmission mechanism of the political crisis because it is being assumed that continues to grow at the pace observed for 2009
Figure 1 Tunisia Growth rate of real GDP and government consumption in
alternative baseline scenarios 2006-15 (Percent)
63
38
10
55
00
10
20
30
40
50
60
70
80
2006 2007 2008 2009 2010 2011 2012 2013 2014 2015
GDP growth rate - pro-cyclical amp countercyclical baseline scenarios
GDP growth rate - pre-crisis baseline scenario
Gov consumption - pro-cyclical amp pre-crisis baseline scenarios
Gov consumption - countercyclical baseline scenario
Source Central Bank of Tunisia and authorsrsquo assumptions based on a plausible scenario for 2011-15
Notice that both real GDP growth and real government consumption growth are
being imposed on the three baseline scenarios Real GDP growth is merely imposed through a calibration procedure adjusting productivity but GDP is fully endogenous in the model7 This means that for the pre-crisis baseline scenario in particular we are simply
7 GDP growth is driven by factor stocks and efficiency (endogenous and exogenous) parameters investment and depreciation for the different capital types by a combination of demographic factors and the functioning of the educational system for the different labour categories and by an exogenous growth rate for natural resources used in some sectors The aggregate growth trajectory is imposed through the production function
32
assuming that the effects of the political crisis take place through productivity losses without exogenously updating any other parameter Productivity losses affect the level of production and as a result factor employment and household income and consumption per capitamdashthe later being one of the key determinants of the MDGs In the case of government spending it is assumed that consumption and other components of recurrent spending grow at a given rate per annum which is part of the closure rules of the model Government investment spending depends on the demand for capital in the public services sector and this in turn depends on government consumption
Other macroeconomic closure rules used to generate the baseline scenarios are as
follows Government investment spending is covered through current savings and fixed levels of borrowing (domestic and external) and tax rates Any remaining imbalances are covered by foreign transfers from abroad (ie foreign aid) which basically assume their true value as the calibration of the model entailed imposing observed trends for the levels of borrowing and tax revenues The real exchange rate adjusts to clear the current account of the balance of payments Private savings rates adjusts such that private investment equals total savings given a fixed ratio of private investment to GDP
The model distinguishes three types of workers those who have not completed
secondary education (unskilled) those with at least completed secondary education (semi-skilled) and those who have completed some degree in tertiary education (skilled) In all of the scenarios if the unemployment rate by type of worker exceeds a minimum unemployment rate the real wage (with respect to the consumer price index) is equivalent to a ldquoreservation wagerdquo such that the market reaches equilibrium through adjustments in the unemployment rate (or by the same token through changes in the level of employment) If the unemployment rate is at the minimum rate the labour market reaches equilibrium through adjustments in the real wage For other factors (capital and natural resources) equilibrium is given by flexible wages (or rents)
The baseline scenarios reflect the actual aggregate functioning of the Tunisian
economy during the period 2006-10 and project this through 2015mdashbased on existing data available for the preparation of this paper Take for example some results of the pro-cyclical baseline scenario (Table 8) The real exchange rate appreciates on average by 06 percent per annum in the baseline in consistency with more spending in non-tradables (clearly government consumption) though it is worth mentioning that the actual trend of the real exchange rate is not being reproduced as world prices are not updated due to lack of information As a result of this exports fall as a percentage of GDP whereas imports remain on the increasemdashand foreign savings become larger relative to GDP In consistency with past trends government debts decline over time Tax revenue is assumed
The model is first run assuming that the quantity of value added (that is real GDP at factor cost) is exogenous while the exogenous component of the efficiency parameter temporarily becomes endogenous In this run the observed trajectory of real GDP is imposed on the quantity of value added and this is achieved by proportionally scaling the efficiency parameter for all production activities This run becomes the starting point to solve the model again and generate the baseline scenario assuming that the quantity of value added is endogenous and the exogenous component of the efficiency parameter remains exogenous though this is exogenously set to vary yearly to enable reproduction of the observed trajectory of aggregate real GDP growth
33
to remain at around 22 percent after 2010 Foreign transfers to the government increase with respect to the base year to clear the government budget
Table 8 Tunisia Selected macroeconomic and government indicators for the pro-
cyclical baseline scenario 2005-15 (Percent of GDP)
2005 2010 2015
National accounts
Consumption ndash private 634 693 726
Consumption - government 157 166 173
Investment ndash private 129 129 129
Investment - government 96 100 102
Exports 500 398 346
Imports -506 -485 -476
Government
Foreign debt 539 390 319
Domestic debt 28 17 14
Tax revenue 187 219 219
Foreign transfers 08 51 49
Source Authorsrsquo estimates based on application of MAMS for Tunisia
Will the MDGs be achieved under a continuation of public spending policies
If public consumption in 2010-15 continues to grow at the relatively high pace seen in 2009 (that is 7 percent per annum) and public investment follows suit as assumed under the countercyclical baseline scenario progress in achieving the MDGs would be notable but Tunisia would fall short of meeting the targets for primary education mortality rates and water and sanitation coverage by 2015 (Figure 2) The main gaps would be seen for maternal mortality and the coverage of basic sanitation and these would be slightly higher under the public spending assumptions of the pro-cyclical baseline scenario The comparison of the MDG indicator trends of the countercyclical baseline scenario and those of the pre-crisis baseline scenario show that the impact of the political crisis on the MDGs has been modest as it is being assumed that public spending would in any case have continued to grow at a relatively high pace without the political crisis Also the differences between these two scenarios is small in terms of the MDGs because GDP growth which is 42 percent in the countercyclical baseline scenario is only 03 percentage points higher when we assumed a situation without political crisis (Table 9) As a consequence employment is slightly higher and this boots household income and spending moderately As said the later is one of the determinants of the MDGs Private consumption grows by 59 and 63 percent per annum under the countercyclical and pre-crisis baseline scenarios respectively But even though the MDG indicators show very small variations under both scenarios as further shown below such small differences have implications in terms of the additional public spending that would be required to meet the MDG targets
34
Figure 2 Tunisia MDG achievement under the alternative baseline scenarios 2005-
15 (MDG indicators and 2015 targets)
MDG 2 primary completion rate ()
984984
981
9600
9700
9800
9900
10000
2005 2010 2015
target = 999
MDG 5 maternal mortality rate (per 100000 live births)
293
329
289
1500
2000
2500
3000
3500
4000
4500
5000
5500
2005 2010 2015
MDG 4 child mortality rate (per 1000 live births)
173175
173
1500
1600
1700
1800
1900
2005 2010 2015
target = 166
MDG 7a drinking water coverage ( of population)
986987 988
9600
9700
9800
9900
10000
2005 2010 2015
target = 100
MDG 7b basic sanitation coverage ( of population)
866
849
869
7500
8000
8500
9000
9500
10000
2005 2010 2015
Contercyclical baseline scenario
Pro-cyclical baseline scenario
Pre-crisis baseline scenario
target = 100
target = 187
Source Authorsrsquo estimates based on application of MAMS for Tunisia
Table 9 Tunisia GDP consumption and investment in the baseline scenarios 2006-
15 (Percentage annual growth)
countercyclical pro-cyclical pre-crisis
Consumption ndash private 59 59 63
Consumption ndash government 61 43 61
Fixed investment ndash private 51 48 54
Fixed investment - government 78 53 77
GDP at market prices 42 43 45
Source Authorsrsquo estimates based on application of MAMS for Tunisia
35
44 MDG-financing scenarios
Main assumptions The MDG-financing scenarios were generated to make comparisons with themdashrespectivemdashbaseline scenario In these new scenarios public spending increases as much as required to meet the targets for primary education mortality rates and water and sanitation To achieve this some of the closure rules and conditions of the baseline scenarios change Government spending by MDG sector becomes endogenous and no longer increases at a given growth rate as in the baseline scenarios The model remains fully determined (that is the number of endogenous variables is exactly equal to the number of equations) by assuming that the corresponding MDG indicator is exogenous and follows a non-linear trend that given diminishing marginal returns to variations in the MDG determinants leads to fully meeting the targets by 2015 In both baseline and MDG scenarios one financing variable clears the government budget while three other remain fixed and are updated depending on a rule (for example a percentage of GDP can be imposed exogenously on a year-on-year basis) Foreign transfers from abroad (the equivalente to grand aid) clear the government budget in the baseline scenarios as indicated This rule remains unchanged under the MDG scenarios whereby transfers from abroad also finance the additional MDG public spending It does however change when the financing mechanism alternatively is domestic borrowing domestic taxation or foreign borrowing in which case one of these three becomes the clearing variable of the budget Another change in these scenariosmdashwith respect to the baselinesmdashis that the model becomes savings-driven that is private investment adjusts endogenously even as a share of GDP to maintain balance between total savings and total investment How much would it cost to achieve the MDGs
In the MDG-financing scenarios public spending (current and capital) increases endogenously right after the base year of the simulation period in order to achieve the MDGs for primary education child and maternal mortality and water and sanitation In the case of Tunisiarsquos MAMS the base year is 2005 such that public spending scales up starting in 2006 For this reason in this paper the additional public spending required to achieve the MDGs includes what Tunisiarsquos government should have spent but did not spent in 2006-10 to have been fully on track in meeting the MDG targets To this we add the additional spending the government will have to incur in 2011-15 to meet the targets8 Foreign transfers to the government (ftr) domestic direct taxation (tax) foreign borrowing (fb) and domestic borrowing (db) are the financing mechanisms under study and additional public spending required to achieve the MDGs can be much or less depending on the choice of these financing mechanisms
8 The additional public spending requirement to achieve the MDGs is defined as the public spending on MDG-related sectors in the MDG-financing scenarios minus the public spending on MDG-related sectors in the corresponding baseline scenario Annual averages for the additional public spending requirement for 2006-10 and 2011-15 are calculated and subsequently added
36
As can be seen in Table 10 the mortality goals would be the most costly to finance (more than 3 percent of GDP per annum) followed by the primary education goal This is consistent with the earlier analysis in which MDG gaps were presented to be widest for maternal mortality Taking the assumptions of the countercyclical baseline scenario as our first benchmark public spending would need to increase between 57 to 62 percent of GDP per annum in order to achieve the MDGs under study New spending requirements would be little more than 2 percent of GDP for investment thus reflecting the deficient state of infrastructure in the social sectors The cost of financing the MDGs is about 15 percent of GDP higher under the assumptions of the pro-cyclical baseline scenario This may be taken as an indication that a continued effort to maintaining countercyclical spending may pay off in comparison to what the government would have to spend later at an incremental marginal cost if it disrupted spending when GDP was on the decline How feasible it would be for the government to maintain countercyclical spending is the other question that one needs to ask The other finding is that in terms of additional public spending required to achieve the MDGs the effect of the revolution would be very modest (that is around 04 percent of GDP per annum) if public spending continued to be countercyclical If Tunisiarsquos government cannot maintain pre-crisis MDG spending levels and public spending rather falls in 2011 and recovers in 2012 in tandem with GDP as assumed in this scenario analysis the political crisis would make the government incur almost 2 percent of GDP per annum more in spending to meet the MDGs Again it seems that a good strategy to minimize the future cost of achieving the MDGs would be to maintain high public spending growth now in spite of the economic problems that the political crisis may have caused However the mobilization of resources to finance such high countercyclical spending may face constraints that one needs to keep in mind as further explained below Table 10 Tunisia Additional annual public spending requirements to meet the
MDG targets in financing scenarios1
(deviation from baseline scenario
percent of GDP)
Countercyclical Pro-cyclical Pre-crisis
ftr tax fb db ftr tax fb db ftr tax fb db
Primary education 17 18 17 18 23 24 23 25 16 17 16 18
- current 14 14 14 15 17 18 17 18 13 13 13 14
- capital 03 04 03 04 06 07 06 07 03 04 03 04
Health 32 34 32 35 36 39 36 39 30 32 30 33
- current 20 21 20 22 22 24 22 25 19 20 19 21
- capital 12 12 12 12 13 14 13 14 11 12 11 12
Water and sanitation 08 09 08 09 12 13 12 13 07 08 07 08
- current 02 02 02 02 03 03 03 03 02 02 02 02
- capital 06 07 06 07 07 08 07 08 06 06 06 06
Total 57 61 57 62 71 76 71 78 53 57 53 59
- current 36 37 36 39 42 45 42 46 34 35 34 37
- capital 21 23 21 23 26 29 26 29 20 22 20 22
1 Additional public spending and acronyms are defined in the text Source Authorsrsquo estimates based on application of MAMS for Tunisia
37
Macroeconomic trade-offs of MDG financing
In all MDG-financing scenarios the injection of public spending triggers a real exchange rate appreciation (Table 11) This is consistent with the fact that for low- and even middle-income countries like Tunisia large-scale investments for the achievement of the MDGs could meet severe skilled-labour constraints in the short-to-medium run in spite of the high levels of education of the population Public expenditures centred on meeting the MDGs in the form of expanding basic social services in health and education would put intense pressure on a pool of teachers doctors and other trained workers that is likely to be limited Constraints on skilled labour could then lead to upward pressure on the skill premium for such workers which in turn would increase the overall labour costs for the public sector and the cost of achieving the MDGs9 As a result ldquonon-tradablesrdquo such as MDG-related services become relatively more expensive than ldquotradablesrdquo as public spending is scaled up and this translates into a real exchange rate appreciation This penalizes export sectors regardless of the financing mechanism of public spending which in the case of Tunisia affects GDP growth though this trade off is more marked when foreign resources are used owing to the associated inflow of foreing exchange (Table 11) In the MDG-financing scenarios exports grow less than in the baseline and only when foreign resources are used to finance the new public spending would imports increase slightly more than in the baseline (that is merely 01 percentage points per annum) As a result trade volumes in the MDG-financing scenarios increase at a lower pace compared to the baseline scenario In MAMS trade openness is represented by the ratio of trade volumes to GDP and is one of the determinants of factor productivity Thus the deceleration of GDP growth in the MDG-financing scenarios is also explained by a reduction in factor productivity relative to the baseline Higher factor employment in the MDG sectors is insufficient to revert the reduction in GDP
GDP growth is slightly less though when the new public spending is financed through domestic borrowing or increased tax revenues as these financing mechanisms also penalize private spending On one hand borrowing domestically implies the government takes a (larger) share of private savings to finance the budget thus crowding out private investment and as a result private consumption and imports On the other hand increased taxation reduces the amount of disposable income households can spend to consume which subsequently reflects also in reduced private spending and imports Due to the macroeconomic trade-offs it triggers the MDG strategy cannot be expected to bring about a stimulus to the economy in the short term Moreover as said earlier the productivity gains from greater MDG achievement will take some time to materialize and are thus unlikely to impact growth visibly in the short and medium terms Not only would GDP growth be less than in the baseline and foreign-financing scenarios but the reduction in private spending in education and health services in the domestic-financing scenarios would have to be fully compensated by even more public spending to meet the MDG targets Domestic borrowing mainly but also increased taxation to a lesser extent would
9 In fact it was noted that for the highly skilled workers wage growth is about 1 percentage point higher in the MDG financing scenarios compared to the baseline scenarios Wage growth is only slightly higher for the other less skillful workers and it is actually less for the unskilled workers in the scenarios with domestic borrowing and increased taxation where GDP growth decelerates as further explained below
38
push up public spending requirements to meet the MDGs in a range of 04 to 07 percent of GDP per annum (see Table 10)
Table 11 Tunisia Real macroeconomic indicators in MDG-financing scenarios
2006-15 (deviation from baseline scenario percentage annual growth)
Countercyclical Pro-cyclical Pre-crisis
ftr tax fb db ftr tax fb db ftr tax fb db
Absorption 02 -02 02 -02 03 -03 03 -03 02 -02 02 -02
Consumption - private 01 -05 01 -06 00 -08 00 -09 01 -05 01 -06
Consumption - government 13 14 13 14 20 22 20 22 13 14 13 14
Fixed investment - private -01 -04 -01 -03 -01 -05 -01 -04 -01 -04 -01 -03
Fixed investment ndash government 1 25 30 27 29 19 19 19 20 28 30 28 30
Exports -12 -10 -12 -08 -17 -14 -17 -10 -11 -10 -11 -08
Imports 01 -04 01 -05 00 -08 00 -07 01 -04 01 -05
GDP at market prices -02 -03 -02 -03 -02 -04 -02 -03 -02 -03 -02 -03
Total factor employment (index) 01 00 01 00 02 01 02 01 01 00 01 00
Total factor productivity (index) -02 -03 -02 -03 -03 -04 -03 -04 -02 -03 -02 -03
Real exchange rate (index) -05 -03 -05 -02 -06 -02 -06 -02 -05 -02 -05 -02
1 Government fixed investment was calculated for two sub-periods 2006-8 when capital spending is frontloaded to raise capital stocks in MDG sectors and 2009-15 when capital stocks in MDG sectors do not have to increase as much as they are already sufficient for the government to deliver required MDG services The difference between the annual growth rates of government fixed investment for these sub-periods is presented in the table for government fixed investment Source Authorsrsquo estimates based on application of MAMS for Tunisia
Feasibility of MDG financing Not only would domestic borrowing or increased taxation be less desirable financing mechanisms in view of the relatively higher public spending requirements but they would unlikely be feasible options for Tunisia Domestic resources would not easily be mobilized to finance MDG public spending given already low savings that will perhaps be even lower under the expectation that growth would decelerate substantially in 2011 and the economy would start to recover only at a moderate pace in 2012 During this biennium unemployment will likely reach dramatically high levels particularly for the youth and remittancesrsquo inflows will unlikely be increasing Furthermore the domestic debt is fairly small as a percentage of GDP which is not only as a result of fiscal objectives but also an indication that Tunisiarsquos domestic bond market may not be developed enough to allocate domestic savings in amounts that are commensurate to the financing of development goals
Tax revenue was almost 20 percent of GDP in 2009 (Table 3) Not only would this tax burden be considered relatively high for developing country standards but it has also difficult to raise it From 1995 to 2009 tax collection has essentially remained unchanged as percent of GDP Against this backdrop further increases of the tax burden in the midst of forming and consolidating a new political regime and trying to recover economic
39
growth would most likely be politically infeasible and economically undesirable Improving tax collection should be a priority but achieving this will require some time
According to the simulation results tax revenue would need to increase by more
than 6 percentage points of GDP by 2015 in order for the government to be able to finance the new MDG spending under the tax financing scenario that takes the countercyclical baseline as the benchmark (Table 12) As also measured for the new MDG spending (Table 11) this accounts for both the extent to which tax revenue should have increasedmdashbut did not increasemdashin 2006-10 in order to have fully financed the newly required MDG spending and the tax revenue that the government would additional have to raise to continue financing MDG spending until the targets are met by 2015 Tax revenue would even have to be about 4 percentage points of GDP higher if public spending declines in tanden with GDP in 2011mdashas assumed under the pro-cyclical baseline scenario since the MDG gaps to finance under this scenario would be more pronounced
These are macroeconomic constraints that Tunisia would likely face if the
government decides to finance newly required MDG spending through domestic borrowing or increased taxation As explained above these are financing options that would also curtail private spending in MDG-related sectors making the government incur more MDG spending compared to a situation where financing is through resources from abroad Table 12 Tunisia Additional annual foreign aid and tax revenue required to achieve
the MDGs in the corresponding MDG financing scenario1
2011-15
(deviation from baseline scenario percent of GDP)
Tax revenue
(tax financing scenario) Foreign aid
(ftr financing scenario)
Countercyclical baseline 64 64
Pro-cyclical baseline 106 87
Pre-crisis baseline 61 62
1 Additional foreign aid and tax revenue requirements are defined in the text Source Authorsrsquo estimates based on application of MAMS for Tunisia
Tunisia will unavoidably have to rely on foreign resources to reconstruct its political system spur economic growth and finance development goals Given the political changes this country is going through which after constitutional amendments could pave the way for a full-blown election and the good signs that economic growth may pick up steam in 2012 the international donor community has already pledged help
According to the simulation results following the same kind of estimation of additional financing requirements used for tax revenue Tunisia would also need little more than 6 percent of GDP per annum in foreign aid to be able to finance public spending in primary education health and water and sanitation in order to meet the targets by 2015 (Table 12) This public spending is assumed to be countercyclical meaning that as
40
simulated failure to sustain public spending for MDG sectors from 2011 would likely widen MDG gaps and increase the cost of financing the MDGs which tends to be incremental in marginal terms the closer to 2015 In fact taking the conditions of the pro-cyclical baseline scenario as the benchmark we find that almost 9 percent of GDP per annum would be the amount of foreign aid required to be able to finance public spending and meet the MDGs by 2015 This would put required foreign aid to achieve the MDGs under study in the range of US$27 to US$39 billion per annum10 In late May 2011 the G8 group promised US$20 billion to Tunisia and Egypt in loans and grants over the next three years The first tranche of which several billions would presumably go to Tunisia would be disbursed during the second semester of 2011 It would then be quite feasible for Tunisia to achieve the MDGs under study should this help materialize and if part of this is directed to MDG sectors in the next four years Non-concessional loans and other borrowing from abroad would on the contrary be at the cost of accumulating debt but it is perhaps the only other feasible option for Tunisia to mobilize resources for MDG financingmdashalong with using receipts from selling confiscated assets belonging to members of the ousted government as further indicated below Following the trend of 2005-09 the government debt is on the decline in the baseline scenarios and it levels off above 30 percent by 2015 (Figure 3) The government debt would increase to almost 62 percent of GDP under the foreign borrowing scenario that takes the countercyclical spending assumption as the reference path This would not be such unfeasible financing mechanism if the government could live with a debt 6 percentage points of GDP higher than in 2005 It can be seen that under the assumption of pro-cyclical spending for which we already gauged the additional public spending required to achieve the MDGs government debt would be slightly higher compared to the countercyclical baseline scenario reaching almost 74 percent of GDP in 2015 In other words waiting for GDP growth to catch up again in order to resume MDG public spending would not only widen MDG gaps but also as it becomes more costly to achieve the MDGs towards the end of the simulation period it would put the debt burden under unsustainable territory The upshot here is that countercyclical spending reduces the cost of the MDG financing strategy not only in terms of new public spending required but also in terms of debt accumulation compared to a situation where public spending follows GDP downturns that increase the government efforts towards the end of the simulation period Finally the simulation results also show that government indebtedness would have needed to increase by only 3 percentage points of GDP by 2015 compared to 2005 if the political crisismdashas simulated heremdashhad not unfolded
10 Estimates are based on additional foreign aid requirements presented in Table 12 and GDP at current prices (US$443 billion) as recorded in the July 2011 update of IMFrsquos World Economic Outlook
41
Figure 3 Tunisia Government debt in the baseline and foreign-borrowing (fb)
scenarios 2005 2009 2015 (Percent of GDP)
Source Authorsrsquo estimates based on application of MAMS for Tunisia
5 Conclusions and policy recommendations
Before the recent global financing crisis and political revolution Tunisia was one of the fastest growing economies in the MENA region Since the 1990s the country was reaping benefits from various structural reforms a labour-intensive and export-oriented growth strategy the liberalisation of the economy and a prudent management of monetary and fiscal policies This economic model helped to propel growth but the economy remained vulnerable to external shocks and seriously challenged by high unemployment Given that the government has essentially continued the strategy it addopted since the 1960s of providing social transfers and food subsidies to fight poverty and supporting education and health sectors considerable progress in achieving the MDGs had been witnessed before the economic and political crises and some targetsmdashsuch as that of halving extreme poverty from its 1990 levelmdashhad already basically been met In spite of progress lack of access to parental care and insufficient health service delivery in rural areas combined with inadequate transport infrastructure and services have seriously imperiled further reducing maternal mortality An important share of the population also lacks basic sanitation especially in the rural areas
Foreign demand for Tunisianrsquos exports diminished as a result of the global financing crisis and this translated into sluggish growth Even so MDG progress was not interrupted owing to the governmentrsquos countercyclical spending policy Just when the economy started to show symptoms of recovery in 2010 discontent of the population about unemployment and corruption mainly led to a political revolution that has raised challenges at all levels
42
In this study we used a CGE model to perform a scenario analysis with a view to shed light on the prospects and challenges Tunisia faces to achieve the MDGs We showed that progress in achieving the MDGs would continue to be notable if public spending continues to grow as seen before the revolution but the targets for primary education child and maternal mortality and water and sanitation would not be met by 2015 The main gaps would be seen for maternal mortality mainly and basic sanitation to a lower extent MDG progress is found to be slightly less if public spending becomes pro-cyclical and follows the GDP deceleration expected for 2011 The impact of the political crisis on the MDGsmdashprimarily transmitted through less household income and consumption per capitamdashwould be only modest if the government manages to keep MDG spending countercyclical to sluggish GDP growth The global financing crisis did not affect MDG achievement precisely because the government maintained spending growing at high rates in spite of the observed GDP deceleration
Our analysis further showed that in order to meet the MDGs under study by 2015 public spending would need to rise by 57-78 percent of GDP per annummdashdepending on how public spending evolves after the political crisis and the mechanism used to finance it The mortality goals would be the most expensive to finance (32-39 percent of GDP per annum) followed by the primary education goal Little more than half of the newly required spending would be for new investment to compensate for deficiencies in infrastructure Additional resources required would tend to be relatively less if high growth of public spending seen before the revolution is not disrupted which in turn would help to minimize the impact of the political crisis on the MDGs
The injection of additional public spending could result in a small real exchange rate appreciationmdashif skilled-labour supply constraints lead to upward pressure on the skill premium for teachers doctors and other trained workers which in turn increases labour costs for the public sectormdashthat would somewhat penalize exports and economic growth This effect was found to be larger for scenarios in which additional MDG public spending is financed with resources from abroad owing to the inflow of foreign exchangemdashwhich likely are amongst the few financing options at Tunisiarsquos disposal But GDP growth was found to be even slightly less when the new public spending was financed through domestic borrowing or increased tax revenues Domestic borrowing by the government crowds out private investment as a (larger) share of private savings is diverted to finance the budget thus hurting private consumption and imports Increased taxation in turn reduces disposable income which subsequently also translates into reduced private spending and imports In these cases we found the government incurs an extra cost of 04-07 percent of GDP per annum in order to compensate for less private spending in MDG-related sectors And due to these macroeconomic trade-offs the MDG strategy should not be expected to act as a catalyst to stimulate the economy in the short term The productivity gains from greater MDG achievement would take some time to materialize as typically expected from any development strategy
Both domestic borrowing and increased taxation would be less desirable and perhaps infeasible options to finance the newly required MDG spending in Tunisia The revolution has hurt the economy and it would be unthinkable that under such
43
circumstances sufficient national savings could be mobilized to finance MDG public spending Workerrsquos remittances from abroad have been an important source of household savings but also these have been on the decline These two mechanisms of domestic resource mobilization could actually slow down the economic recovery that Tunisians badly need Furthermore Tunisiarsquos domestic bond market is not sufficiently developed to allocate domestic savings in amounts that are commensurate to the required financing of development goals The existing tax burden hovering 20 percent of GDP would also be considered relatively high for developing country standards Using these financing mechanisms in the midst of the formation and consolidation of a new political regime would also likely be politically infeasible
Whether it wants it or not Tunisia will have to rely on foreign resources to reconstruct its political system spur economic growth and finance development goals The use of non-concessional loans and other borrowing from abroad to achieve the MDGs would come at the cost of accumulating debt at levels that may perhaps be considered inconsistent with debt targets According to the scenario analysis performed relying on foreign borrowing alone to finance MDG achievement would push the government debt up to at least 62 percent of GDP by 2015mdashor even more if high growth of public spending seen before the political crisis is disrupted in the short term
Acquiring new debt at such high levels may however be avoided if the international donor community honours recent pledges of grant aid that it has made The donorsrsquo willingness to help Tunisia builds on the expectation that current political changes will translate into constitutional amendments that ultimately pave the way for a full-blown election and economic growth will pick up steam in 2012 According to our scenario analysis Tunisia would need at least little more than 6 percent of GDP per annum in foreign aid compared to what is currently receiving in order to be able to finance public spending required to timely meet the goals in primary education health and water and sanitation without resorting to other sources of financing The required foreign aid to achieve the MDGs would be in the range of US$27 to US$39 billion per annum depending on the pace at which MDG spending grows after the political crisis This would pretty much fall under amounts of aid that the G8 group of rich countries has promised to grant to Tunisia and Egypt
If foreign aid cannot be mobilized in the amounts that would be required to finance
the MDG strategy a combination of this and foreign borrowingmdashof levels that would not compromise debt sustainablitymdashwould be recommended Nevertheless domestic resource mobilization should gradually replace foreign resource mobilization mainly through fiscal reforms that permit to enhance the efficiency of tax collection and by this means broaden the tax base Furthermore the fiscal constraints could be eased if the sale of assets confiscated from members of the ousted government generates resources to finance the achievement of development goals In any case the government will also need to engage in more active production sector and labour market policies in order to raise productivity growth improve production capacity and create more jobs in the economy Only so would the economy really pick up steam and recover and the alarming unemployment levels be
44
reduced The impact of economic growth on poverty reduction could also be enhanced if the said fiscal reforms are progressive and help to reduce inequality
References
Ageacutenor Pierre-Richard Nihal Bayraktar and Karim El Aynaoui 2005 ldquoRoads out of
poverty Assessing the links between aid public investment growth and poverty reductionrdquo World Bank Policy Research Paper 3490
Ayadi M G Boulila M Lahouel and P Montigny (2005) ldquoPro-Poor Growth in Tunisiardquo International Development and Strategies Paris France
Bibi S and R Chatti 2007 ldquoPublic Spending Pro-Poor Growth and Poverty Reduction in Tunisia A Multi-level Analysisrdquo In Ali Abdel Gadir Ali and Shenggen Fan (eds) Public Policy and Poverty Reduction in the Arab Region State of Kuwait The Arab Planning Institute pp 259-319
Chaffai M E Patrick Plane and Dorra Triki Guermazi 2006 ldquoTotal Factor Productivity in Tunisian Manufacturing Sectors Convergence or Catch-up with OECD membersrdquo Working Paper Series The World Bank
Chemingui MA and H Bchir Mohammed 2008 ldquoDoes Multilateral Trade Liberalization Matters for Poverty Reduction in Africardquo Background paper for for the International Policy Analysis Network project (in collaboration with IFPRI) Washington DC
Cornelia Kaldewei y Ingo Pitterle 2011 ldquoBehavioural Factors as Emerging Main Determinants of Child Mortality in Middle-Income Countries A Case Study of Jordanrdquo DESA Working Paper No 103 New York United Nations Department of Economic and Socials Affairs Available from httpwwwunorgesadesapapers2011wp103_2011pdf
ETF (European Training Foundation) 2007 ldquoThe contribution of Human Resources Development to Migration Development in Tunisiardquo Research Report Available from httpwwwetfeuropaeupubmgmtnsf(getAttachment)5CD26BB43A026CD8C12573DB004D8AD2$FileNOTE7B7KG6pdf
IMF 2009a ldquoIMF Executive Board Concludes 2009 Article IV Consultation with Tunisiardquo Washington DC International Monetary Fund
IMF 2009b ldquoStatement of the IMF Mission on the 2009 Article IV Consultation with Tunisiardquo Washington DC International Monetary Fund
IMF 2010 ldquoTunisia 2010 Article IV ConsultationmdashStaff Report Public Information Notice on the Executive Board Discussion and Statement by the Executive Director for Tunisiardquo IMF Country Report No 10282 Washington DC
Isaksson Anders and Thiam Hee Ng 2006 ldquoDeterminants of Productivity Cross-Country Analysis and Country Case Studiesrdquo UNIDO Working Paper Vienna
45
Lahouel MH 2007 ldquoThe Success of Pro-Poor Growth in Rural and Urban Tunisirdquo In T Besley and LJCord (eds) Delivering on the Promise of Pro-Poor Growth
Insights and Lessons from Countries Experiences Palgrave Macmillan and the World Bank pp 199-218
Lofgren Hans and Carolina Diaz-Bonilla 2010a ldquoMAMS An economy-wide model for analysis of MDG country strategies ndash an application to Latin America and the Caribbeanrdquo In Marco V Saacutenchez Rob Vos Enrique Ganuza Hans Lofgren and Carolina Diaz-Bonilla (eds) Public Policies for Human Development Feasible
Financing Strategies for Achieving MDGs in Latin America and the Caribbean London PalgraveMacmillan
Lofgren Hans 2010 ldquoWhat determines the evolution of MDG indicators A Selective Review of the Literaturerdquo Development Prospects Group (DECPG) Washington DC the World Bank (Third Draft September 21)
Nehru Vikram and Ashok Dhareshwar 1993 ldquoA New Database on Physical Capital Stock Sources Methodology and Resultsrdquo Revista de Anaacutelisis Econoacutemica Vol 8 No 1 pp 37-59 June
Saacutenchez Marco V (2004) Rising inequality and falling poverty in Costa Ricarsquos
agriculture during trade reform A macro-micro general equilibrium analysis Maastricht Shaker
Saacutenchez Marco V and Giacomo Sbrana 2009a ldquoDeterminants of attendance in Jordans educationrdquo Technical note prepared for the Project Assessing Development Strategies to Achieve the Millennium Development Goals (MDGs) in the Arab region New York United Nations Department of Economic and Socials Affairs Available from httpwwwunorgendevelopmentdesapolicycapacitycountry_documentsjordan_sanchez_sbrana_2009pdf
Saacutenchez Marco V Rob Vos Enrique Ganuza Hans Lofgren and Carolina Diaz-Bonilla (eds) 2010 Public Policies for Human Development Feasible Financing
Strategies for Achieving MDGs in Latin America and the Caribbean London PalgraveMacmillan
Saacutenchez Marco V and Giacomo Sbrana 2009b ldquoDeterminants of education attainment and development goals in Yemenrdquo Background paper prepared for the Project Assessing Development Strategies to Achieve the Millennium Development Goals (MDGs) in the Arab region New York United Nations Department of Economic and Socials Affairs Available from httpwwwunorgendevelopmentdesapolicycapacityyemenshtml
Sbrana Giacomo 2009 ldquoTechnical note on the determinants of water and sanitation in Yemenrdquo Technical note prepared for the Project Assessing Development Strategies to Achieve the Millennium Development Goals (MDGs) in the Arab region New York United Nations Department of Economic and Socials Affairs Available from httpwwwunorgendevelopmentdesapolicycapacityyemenshtml
UNDP 2004 Rapport national sur les objectifs du milleacutenaires Tunis United Nations Development Programme
46
Vos Rob and Marco V Saacutenchez 2010 ldquoA Non-Parametric Microsimulation Approach to Assess Changes in Inequality and Povertyrdquo International Journal of
Microsimulation 3(1) 8-23 Available from httpwwwmicrosimulationorgIJMV3_1IJM_25pdf
World Bank 2003 ldquoImplementation completion report (CPL-37820 SCL-3782A SCPM-3782S CPL-37830)rdquo Report No 27171 Water Supply and Sewerage Project Finance Private Sector and Infrastructure Group Middle East and North Africa Region Washington DC The World Bank
World Bank 2003 ldquoTunisia Poverty Update Volume I Main Reportrdquo Washington DC
World Bank 2007 ldquoTunisia Country Assistance Strategy Documentrdquo Washington DC
47
Appendix A1 Elasticities of substitution and household expenditure used in the
calibration of MAMS
Substitution between
Factors
1 imports vs domestic
output 2 exports vs domestic
output 2
Expenditure elasticity of
market demand 2
Agriculture and fishing 074 206 111 081
Food processing 147 183 071 081
Construction materials ceramics glass 138 222 303 065
Mechanical and electrical industries 187 217 144 080
Chemicals 145 270 036 081
Textiles clothing and leather 013 172 123 171
Other manufacturing 114 232 214 121
Mining and oil refining 148 135 025 100
Electricity 127 169 (062) 065
Construction 184 059
Trade 159 (062) 100
Transport and communication 164 140 (062) 119
Hotels cafes and restaurants 137 (140) (062) 137
Finance and insurance 070 (140) (062) 313
Private primary education 070 (150) 340 162
Private secondary education 070 (150) (340) 162
Private tertiary education 070 (150) (340) 162
Private health 070 (140) (062) 122
Other private services 130 (150) (340) 098
Water and sanitation 157 (150) (340) 065
Public primary education 070 162
Public secondary education 070 162
Public tertiary education 070 162
Public health 070 122
Public infrastructure 070 100
Other government activities 070 100
1 Elasticities at the activity level 2 Elasticities at the commodity level Note elasticities in parenthesis were adjusted by the authors to ensure a feasible model solution Original estimates are available upon request Source Estimates by Nidhal Ben Cheikh Moncef Youzbachi and Jameleddine Boumedie as part of the project for which this study was elabourated with minor adjustments by the authors to ensure a feasible model solution
48
Appendix A2 Elasticities of the MDGs with respect to their determinants
Spending per-capita
or per-student
Other public infras-tructure
Household consumption
per-capita MDG 4 MDG 7a MDG 7b
Wage incentives
Non-education MDGs
MDG 4 child mortality -0485 -0010 -0100 -0020 -0020
MDG 5 maternal mortality -0864 -0010 -0100 -0005 -0005
MDG 7a drinking water 0100 0000 0010
MDG 7b basic sanitation 0644 0000 0100
Primary education
Entry rate 1100 0000 0250 -0110 0110
Promotion rate 0867 0150 0250 -0087 0087
Secondary education
Promotion rate 0200 0150 0300 -0017 0017
Graduation amp continuation 0100 0150 0300 -0020 0030
Tertiary education
Promotion rate 0137 0150 0250 -0014 0014
Graduation amp continuation 1230 0100 0750 -0015 0030
Source Authorsrsquo estimates as explained in the text
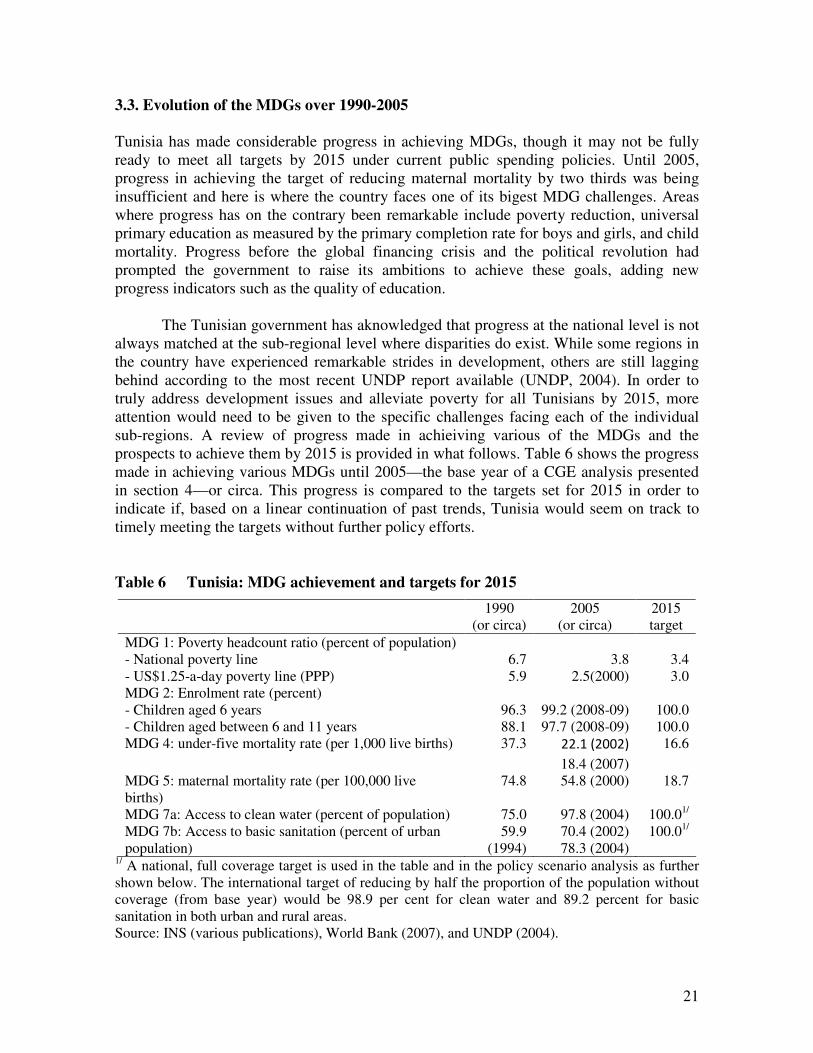

30
available (and the trend for MDG 2 that the model generates as will be seen below) Health spending per-capita would have to be about 43 percent larger between 2005 and 2015 to achieve MDGs 4 and 5 whereas spending in water and sanitation in 2015 would have to be about 23 percent above the value observed in 2005mdashlikely due to existing gaps especially in the rural areas Lastly we found that other public infrastructuremdashnot directly linked to education health and water and sanitationmdashwould have to increase by about 19 percent from 2005 and 2015 in order to achieve the MDGs under study All thesemdashpartial equilibrium or sectoralmdashrequirements are taken and reestimated by MAMS in a general equilibrium setting
Neither data were available to estimate the elasticities of the MDG indicators with
respect to the set of determinants nor no study for Tunisia reports useful parameter values to the knowledge of the authors of this paper To try and overcome this limitation elasticities estimated for Yemen and Jordan and other developing countries (as reported in Saacutenchez and Sbrana 2009ab Sbrana 2009 Lofgren 2010 Kaldewei and Pitterle 2011) were used as starting points Through sensitivity analysis these initial elasticity values were adjusted until given all other information that was being used for the calibration a continuation of the trend shown by MDG indicators since around the year 2000 was being reproduced In the case of MDG 2 as will be seen in the below the model constructs a primary completion rate close to 98 percent for boys and girls aged between 6 and 11 equating this to reported enrolment rates thus assuming that repetition and drop-out rates are nil in Tunisia This may be a strong assumption in the way the model is being calibrated but difficult to be otherwise in view of a lack of official data on primary completion rates
43 Baseline scenarios
Main assumptions Taking real values of 2005 three alternative baseline scenarios were generated for Tunisia once the model was fully calibrated and solved The so-called ldquocountercyclicalrdquo and ldquopro-cyclicalrdquo baseline scenarios assume observed growth rates for both GDP and government consumption in 2006-10 They also project a marked GDP growth deceleration in 2011 owing mostly to the political crisis and subsequently a recovery of GDP at a rate of 55 percent per annum by the end of the simulation period (Figure 1) These two scenarios also show that economic growth was already on the decline since 2008 when the global financing crisis erupted but this crisis barely affected the MDGs during 2008-9 because public spending grew by 46 and 7 percent Both scenarios then include the effects of the global economic and political crises The difference between these two scenarios is in 2010-15 government consumption grows at the GDP growth rate in the pro-cyclical scenario whereas the countercyclical scenario assumes government consumption continues to grow by 7 percent as seen in 2009 Analysis of the countercyclical baseline scenario enables us to respond to how far the government would get in terms of MDG achievement by 2015 should its spending continue to increase at the pace of 2009 What
31
gaps the country would face if government spending rather follows the GDP cycle become apparent when the pro-cyclical and the countercyclical scenarios are compared
A third so-called ldquopre-crisisrdquo baseline scenario is generated to determine what
impact recent political turmoil may have had on the MDGs under certain modelling assumptions For this scenario the GDP growth rate of 2010 (that is 38 percent) before Tunisians witnessed the adverse effects on the political crisis is maintained for 2011-12 GDP grows as in the ldquocrisisrdquo scenarios between 2013 and 2015 Government spending is assumed to trend as in the countercyclical baseline scenario To gauge the effects of the political crisis on the MDGs a comparison between the pre-crisis and the countercyclical scenarios is made This implicitly assumes that the impact of the political crisis on the MDGs is fundamentally transmitted through GDP growthmdashwhich is expected to affect for example household consumption per capita a key determinant of the MDGs Again government spending would not be a transmission mechanism of the political crisis because it is being assumed that continues to grow at the pace observed for 2009
Figure 1 Tunisia Growth rate of real GDP and government consumption in
alternative baseline scenarios 2006-15 (Percent)
63
38
10
55
00
10
20
30
40
50
60
70
80
2006 2007 2008 2009 2010 2011 2012 2013 2014 2015
GDP growth rate - pro-cyclical amp countercyclical baseline scenarios
GDP growth rate - pre-crisis baseline scenario
Gov consumption - pro-cyclical amp pre-crisis baseline scenarios
Gov consumption - countercyclical baseline scenario
Source Central Bank of Tunisia and authorsrsquo assumptions based on a plausible scenario for 2011-15
Notice that both real GDP growth and real government consumption growth are
being imposed on the three baseline scenarios Real GDP growth is merely imposed through a calibration procedure adjusting productivity but GDP is fully endogenous in the model7 This means that for the pre-crisis baseline scenario in particular we are simply
7 GDP growth is driven by factor stocks and efficiency (endogenous and exogenous) parameters investment and depreciation for the different capital types by a combination of demographic factors and the functioning of the educational system for the different labour categories and by an exogenous growth rate for natural resources used in some sectors The aggregate growth trajectory is imposed through the production function
32
assuming that the effects of the political crisis take place through productivity losses without exogenously updating any other parameter Productivity losses affect the level of production and as a result factor employment and household income and consumption per capitamdashthe later being one of the key determinants of the MDGs In the case of government spending it is assumed that consumption and other components of recurrent spending grow at a given rate per annum which is part of the closure rules of the model Government investment spending depends on the demand for capital in the public services sector and this in turn depends on government consumption
Other macroeconomic closure rules used to generate the baseline scenarios are as
follows Government investment spending is covered through current savings and fixed levels of borrowing (domestic and external) and tax rates Any remaining imbalances are covered by foreign transfers from abroad (ie foreign aid) which basically assume their true value as the calibration of the model entailed imposing observed trends for the levels of borrowing and tax revenues The real exchange rate adjusts to clear the current account of the balance of payments Private savings rates adjusts such that private investment equals total savings given a fixed ratio of private investment to GDP
The model distinguishes three types of workers those who have not completed
secondary education (unskilled) those with at least completed secondary education (semi-skilled) and those who have completed some degree in tertiary education (skilled) In all of the scenarios if the unemployment rate by type of worker exceeds a minimum unemployment rate the real wage (with respect to the consumer price index) is equivalent to a ldquoreservation wagerdquo such that the market reaches equilibrium through adjustments in the unemployment rate (or by the same token through changes in the level of employment) If the unemployment rate is at the minimum rate the labour market reaches equilibrium through adjustments in the real wage For other factors (capital and natural resources) equilibrium is given by flexible wages (or rents)
The baseline scenarios reflect the actual aggregate functioning of the Tunisian
economy during the period 2006-10 and project this through 2015mdashbased on existing data available for the preparation of this paper Take for example some results of the pro-cyclical baseline scenario (Table 8) The real exchange rate appreciates on average by 06 percent per annum in the baseline in consistency with more spending in non-tradables (clearly government consumption) though it is worth mentioning that the actual trend of the real exchange rate is not being reproduced as world prices are not updated due to lack of information As a result of this exports fall as a percentage of GDP whereas imports remain on the increasemdashand foreign savings become larger relative to GDP In consistency with past trends government debts decline over time Tax revenue is assumed
The model is first run assuming that the quantity of value added (that is real GDP at factor cost) is exogenous while the exogenous component of the efficiency parameter temporarily becomes endogenous In this run the observed trajectory of real GDP is imposed on the quantity of value added and this is achieved by proportionally scaling the efficiency parameter for all production activities This run becomes the starting point to solve the model again and generate the baseline scenario assuming that the quantity of value added is endogenous and the exogenous component of the efficiency parameter remains exogenous though this is exogenously set to vary yearly to enable reproduction of the observed trajectory of aggregate real GDP growth
33
to remain at around 22 percent after 2010 Foreign transfers to the government increase with respect to the base year to clear the government budget
Table 8 Tunisia Selected macroeconomic and government indicators for the pro-
cyclical baseline scenario 2005-15 (Percent of GDP)
2005 2010 2015
National accounts
Consumption ndash private 634 693 726
Consumption - government 157 166 173
Investment ndash private 129 129 129
Investment - government 96 100 102
Exports 500 398 346
Imports -506 -485 -476
Government
Foreign debt 539 390 319
Domestic debt 28 17 14
Tax revenue 187 219 219
Foreign transfers 08 51 49
Source Authorsrsquo estimates based on application of MAMS for Tunisia
Will the MDGs be achieved under a continuation of public spending policies
If public consumption in 2010-15 continues to grow at the relatively high pace seen in 2009 (that is 7 percent per annum) and public investment follows suit as assumed under the countercyclical baseline scenario progress in achieving the MDGs would be notable but Tunisia would fall short of meeting the targets for primary education mortality rates and water and sanitation coverage by 2015 (Figure 2) The main gaps would be seen for maternal mortality and the coverage of basic sanitation and these would be slightly higher under the public spending assumptions of the pro-cyclical baseline scenario The comparison of the MDG indicator trends of the countercyclical baseline scenario and those of the pre-crisis baseline scenario show that the impact of the political crisis on the MDGs has been modest as it is being assumed that public spending would in any case have continued to grow at a relatively high pace without the political crisis Also the differences between these two scenarios is small in terms of the MDGs because GDP growth which is 42 percent in the countercyclical baseline scenario is only 03 percentage points higher when we assumed a situation without political crisis (Table 9) As a consequence employment is slightly higher and this boots household income and spending moderately As said the later is one of the determinants of the MDGs Private consumption grows by 59 and 63 percent per annum under the countercyclical and pre-crisis baseline scenarios respectively But even though the MDG indicators show very small variations under both scenarios as further shown below such small differences have implications in terms of the additional public spending that would be required to meet the MDG targets
34
Figure 2 Tunisia MDG achievement under the alternative baseline scenarios 2005-
15 (MDG indicators and 2015 targets)
MDG 2 primary completion rate ()
984984
981
9600
9700
9800
9900
10000
2005 2010 2015
target = 999
MDG 5 maternal mortality rate (per 100000 live births)
293
329
289
1500
2000
2500
3000
3500
4000
4500
5000
5500
2005 2010 2015
MDG 4 child mortality rate (per 1000 live births)
173175
173
1500
1600
1700
1800
1900
2005 2010 2015
target = 166
MDG 7a drinking water coverage ( of population)
986987 988
9600
9700
9800
9900
10000
2005 2010 2015
target = 100
MDG 7b basic sanitation coverage ( of population)
866
849
869
7500
8000
8500
9000
9500
10000
2005 2010 2015
Contercyclical baseline scenario
Pro-cyclical baseline scenario
Pre-crisis baseline scenario
target = 100
target = 187
Source Authorsrsquo estimates based on application of MAMS for Tunisia
Table 9 Tunisia GDP consumption and investment in the baseline scenarios 2006-
15 (Percentage annual growth)
countercyclical pro-cyclical pre-crisis
Consumption ndash private 59 59 63
Consumption ndash government 61 43 61
Fixed investment ndash private 51 48 54
Fixed investment - government 78 53 77
GDP at market prices 42 43 45
Source Authorsrsquo estimates based on application of MAMS for Tunisia
35
44 MDG-financing scenarios
Main assumptions The MDG-financing scenarios were generated to make comparisons with themdashrespectivemdashbaseline scenario In these new scenarios public spending increases as much as required to meet the targets for primary education mortality rates and water and sanitation To achieve this some of the closure rules and conditions of the baseline scenarios change Government spending by MDG sector becomes endogenous and no longer increases at a given growth rate as in the baseline scenarios The model remains fully determined (that is the number of endogenous variables is exactly equal to the number of equations) by assuming that the corresponding MDG indicator is exogenous and follows a non-linear trend that given diminishing marginal returns to variations in the MDG determinants leads to fully meeting the targets by 2015 In both baseline and MDG scenarios one financing variable clears the government budget while three other remain fixed and are updated depending on a rule (for example a percentage of GDP can be imposed exogenously on a year-on-year basis) Foreign transfers from abroad (the equivalente to grand aid) clear the government budget in the baseline scenarios as indicated This rule remains unchanged under the MDG scenarios whereby transfers from abroad also finance the additional MDG public spending It does however change when the financing mechanism alternatively is domestic borrowing domestic taxation or foreign borrowing in which case one of these three becomes the clearing variable of the budget Another change in these scenariosmdashwith respect to the baselinesmdashis that the model becomes savings-driven that is private investment adjusts endogenously even as a share of GDP to maintain balance between total savings and total investment How much would it cost to achieve the MDGs
In the MDG-financing scenarios public spending (current and capital) increases endogenously right after the base year of the simulation period in order to achieve the MDGs for primary education child and maternal mortality and water and sanitation In the case of Tunisiarsquos MAMS the base year is 2005 such that public spending scales up starting in 2006 For this reason in this paper the additional public spending required to achieve the MDGs includes what Tunisiarsquos government should have spent but did not spent in 2006-10 to have been fully on track in meeting the MDG targets To this we add the additional spending the government will have to incur in 2011-15 to meet the targets8 Foreign transfers to the government (ftr) domestic direct taxation (tax) foreign borrowing (fb) and domestic borrowing (db) are the financing mechanisms under study and additional public spending required to achieve the MDGs can be much or less depending on the choice of these financing mechanisms
8 The additional public spending requirement to achieve the MDGs is defined as the public spending on MDG-related sectors in the MDG-financing scenarios minus the public spending on MDG-related sectors in the corresponding baseline scenario Annual averages for the additional public spending requirement for 2006-10 and 2011-15 are calculated and subsequently added
36
As can be seen in Table 10 the mortality goals would be the most costly to finance (more than 3 percent of GDP per annum) followed by the primary education goal This is consistent with the earlier analysis in which MDG gaps were presented to be widest for maternal mortality Taking the assumptions of the countercyclical baseline scenario as our first benchmark public spending would need to increase between 57 to 62 percent of GDP per annum in order to achieve the MDGs under study New spending requirements would be little more than 2 percent of GDP for investment thus reflecting the deficient state of infrastructure in the social sectors The cost of financing the MDGs is about 15 percent of GDP higher under the assumptions of the pro-cyclical baseline scenario This may be taken as an indication that a continued effort to maintaining countercyclical spending may pay off in comparison to what the government would have to spend later at an incremental marginal cost if it disrupted spending when GDP was on the decline How feasible it would be for the government to maintain countercyclical spending is the other question that one needs to ask The other finding is that in terms of additional public spending required to achieve the MDGs the effect of the revolution would be very modest (that is around 04 percent of GDP per annum) if public spending continued to be countercyclical If Tunisiarsquos government cannot maintain pre-crisis MDG spending levels and public spending rather falls in 2011 and recovers in 2012 in tandem with GDP as assumed in this scenario analysis the political crisis would make the government incur almost 2 percent of GDP per annum more in spending to meet the MDGs Again it seems that a good strategy to minimize the future cost of achieving the MDGs would be to maintain high public spending growth now in spite of the economic problems that the political crisis may have caused However the mobilization of resources to finance such high countercyclical spending may face constraints that one needs to keep in mind as further explained below Table 10 Tunisia Additional annual public spending requirements to meet the
MDG targets in financing scenarios1
(deviation from baseline scenario
percent of GDP)
Countercyclical Pro-cyclical Pre-crisis
ftr tax fb db ftr tax fb db ftr tax fb db
Primary education 17 18 17 18 23 24 23 25 16 17 16 18
- current 14 14 14 15 17 18 17 18 13 13 13 14
- capital 03 04 03 04 06 07 06 07 03 04 03 04
Health 32 34 32 35 36 39 36 39 30 32 30 33
- current 20 21 20 22 22 24 22 25 19 20 19 21
- capital 12 12 12 12 13 14 13 14 11 12 11 12
Water and sanitation 08 09 08 09 12 13 12 13 07 08 07 08
- current 02 02 02 02 03 03 03 03 02 02 02 02
- capital 06 07 06 07 07 08 07 08 06 06 06 06
Total 57 61 57 62 71 76 71 78 53 57 53 59
- current 36 37 36 39 42 45 42 46 34 35 34 37
- capital 21 23 21 23 26 29 26 29 20 22 20 22
1 Additional public spending and acronyms are defined in the text Source Authorsrsquo estimates based on application of MAMS for Tunisia
37
Macroeconomic trade-offs of MDG financing
In all MDG-financing scenarios the injection of public spending triggers a real exchange rate appreciation (Table 11) This is consistent with the fact that for low- and even middle-income countries like Tunisia large-scale investments for the achievement of the MDGs could meet severe skilled-labour constraints in the short-to-medium run in spite of the high levels of education of the population Public expenditures centred on meeting the MDGs in the form of expanding basic social services in health and education would put intense pressure on a pool of teachers doctors and other trained workers that is likely to be limited Constraints on skilled labour could then lead to upward pressure on the skill premium for such workers which in turn would increase the overall labour costs for the public sector and the cost of achieving the MDGs9 As a result ldquonon-tradablesrdquo such as MDG-related services become relatively more expensive than ldquotradablesrdquo as public spending is scaled up and this translates into a real exchange rate appreciation This penalizes export sectors regardless of the financing mechanism of public spending which in the case of Tunisia affects GDP growth though this trade off is more marked when foreign resources are used owing to the associated inflow of foreing exchange (Table 11) In the MDG-financing scenarios exports grow less than in the baseline and only when foreign resources are used to finance the new public spending would imports increase slightly more than in the baseline (that is merely 01 percentage points per annum) As a result trade volumes in the MDG-financing scenarios increase at a lower pace compared to the baseline scenario In MAMS trade openness is represented by the ratio of trade volumes to GDP and is one of the determinants of factor productivity Thus the deceleration of GDP growth in the MDG-financing scenarios is also explained by a reduction in factor productivity relative to the baseline Higher factor employment in the MDG sectors is insufficient to revert the reduction in GDP
GDP growth is slightly less though when the new public spending is financed through domestic borrowing or increased tax revenues as these financing mechanisms also penalize private spending On one hand borrowing domestically implies the government takes a (larger) share of private savings to finance the budget thus crowding out private investment and as a result private consumption and imports On the other hand increased taxation reduces the amount of disposable income households can spend to consume which subsequently reflects also in reduced private spending and imports Due to the macroeconomic trade-offs it triggers the MDG strategy cannot be expected to bring about a stimulus to the economy in the short term Moreover as said earlier the productivity gains from greater MDG achievement will take some time to materialize and are thus unlikely to impact growth visibly in the short and medium terms Not only would GDP growth be less than in the baseline and foreign-financing scenarios but the reduction in private spending in education and health services in the domestic-financing scenarios would have to be fully compensated by even more public spending to meet the MDG targets Domestic borrowing mainly but also increased taxation to a lesser extent would
9 In fact it was noted that for the highly skilled workers wage growth is about 1 percentage point higher in the MDG financing scenarios compared to the baseline scenarios Wage growth is only slightly higher for the other less skillful workers and it is actually less for the unskilled workers in the scenarios with domestic borrowing and increased taxation where GDP growth decelerates as further explained below
38
push up public spending requirements to meet the MDGs in a range of 04 to 07 percent of GDP per annum (see Table 10)
Table 11 Tunisia Real macroeconomic indicators in MDG-financing scenarios
2006-15 (deviation from baseline scenario percentage annual growth)
Countercyclical Pro-cyclical Pre-crisis
ftr tax fb db ftr tax fb db ftr tax fb db
Absorption 02 -02 02 -02 03 -03 03 -03 02 -02 02 -02
Consumption - private 01 -05 01 -06 00 -08 00 -09 01 -05 01 -06
Consumption - government 13 14 13 14 20 22 20 22 13 14 13 14
Fixed investment - private -01 -04 -01 -03 -01 -05 -01 -04 -01 -04 -01 -03
Fixed investment ndash government 1 25 30 27 29 19 19 19 20 28 30 28 30
Exports -12 -10 -12 -08 -17 -14 -17 -10 -11 -10 -11 -08
Imports 01 -04 01 -05 00 -08 00 -07 01 -04 01 -05
GDP at market prices -02 -03 -02 -03 -02 -04 -02 -03 -02 -03 -02 -03
Total factor employment (index) 01 00 01 00 02 01 02 01 01 00 01 00
Total factor productivity (index) -02 -03 -02 -03 -03 -04 -03 -04 -02 -03 -02 -03
Real exchange rate (index) -05 -03 -05 -02 -06 -02 -06 -02 -05 -02 -05 -02
1 Government fixed investment was calculated for two sub-periods 2006-8 when capital spending is frontloaded to raise capital stocks in MDG sectors and 2009-15 when capital stocks in MDG sectors do not have to increase as much as they are already sufficient for the government to deliver required MDG services The difference between the annual growth rates of government fixed investment for these sub-periods is presented in the table for government fixed investment Source Authorsrsquo estimates based on application of MAMS for Tunisia
Feasibility of MDG financing Not only would domestic borrowing or increased taxation be less desirable financing mechanisms in view of the relatively higher public spending requirements but they would unlikely be feasible options for Tunisia Domestic resources would not easily be mobilized to finance MDG public spending given already low savings that will perhaps be even lower under the expectation that growth would decelerate substantially in 2011 and the economy would start to recover only at a moderate pace in 2012 During this biennium unemployment will likely reach dramatically high levels particularly for the youth and remittancesrsquo inflows will unlikely be increasing Furthermore the domestic debt is fairly small as a percentage of GDP which is not only as a result of fiscal objectives but also an indication that Tunisiarsquos domestic bond market may not be developed enough to allocate domestic savings in amounts that are commensurate to the financing of development goals
Tax revenue was almost 20 percent of GDP in 2009 (Table 3) Not only would this tax burden be considered relatively high for developing country standards but it has also difficult to raise it From 1995 to 2009 tax collection has essentially remained unchanged as percent of GDP Against this backdrop further increases of the tax burden in the midst of forming and consolidating a new political regime and trying to recover economic
39
growth would most likely be politically infeasible and economically undesirable Improving tax collection should be a priority but achieving this will require some time
According to the simulation results tax revenue would need to increase by more
than 6 percentage points of GDP by 2015 in order for the government to be able to finance the new MDG spending under the tax financing scenario that takes the countercyclical baseline as the benchmark (Table 12) As also measured for the new MDG spending (Table 11) this accounts for both the extent to which tax revenue should have increasedmdashbut did not increasemdashin 2006-10 in order to have fully financed the newly required MDG spending and the tax revenue that the government would additional have to raise to continue financing MDG spending until the targets are met by 2015 Tax revenue would even have to be about 4 percentage points of GDP higher if public spending declines in tanden with GDP in 2011mdashas assumed under the pro-cyclical baseline scenario since the MDG gaps to finance under this scenario would be more pronounced
These are macroeconomic constraints that Tunisia would likely face if the
government decides to finance newly required MDG spending through domestic borrowing or increased taxation As explained above these are financing options that would also curtail private spending in MDG-related sectors making the government incur more MDG spending compared to a situation where financing is through resources from abroad Table 12 Tunisia Additional annual foreign aid and tax revenue required to achieve
the MDGs in the corresponding MDG financing scenario1
2011-15
(deviation from baseline scenario percent of GDP)
Tax revenue
(tax financing scenario) Foreign aid
(ftr financing scenario)
Countercyclical baseline 64 64
Pro-cyclical baseline 106 87
Pre-crisis baseline 61 62
1 Additional foreign aid and tax revenue requirements are defined in the text Source Authorsrsquo estimates based on application of MAMS for Tunisia
Tunisia will unavoidably have to rely on foreign resources to reconstruct its political system spur economic growth and finance development goals Given the political changes this country is going through which after constitutional amendments could pave the way for a full-blown election and the good signs that economic growth may pick up steam in 2012 the international donor community has already pledged help
According to the simulation results following the same kind of estimation of additional financing requirements used for tax revenue Tunisia would also need little more than 6 percent of GDP per annum in foreign aid to be able to finance public spending in primary education health and water and sanitation in order to meet the targets by 2015 (Table 12) This public spending is assumed to be countercyclical meaning that as
40
simulated failure to sustain public spending for MDG sectors from 2011 would likely widen MDG gaps and increase the cost of financing the MDGs which tends to be incremental in marginal terms the closer to 2015 In fact taking the conditions of the pro-cyclical baseline scenario as the benchmark we find that almost 9 percent of GDP per annum would be the amount of foreign aid required to be able to finance public spending and meet the MDGs by 2015 This would put required foreign aid to achieve the MDGs under study in the range of US$27 to US$39 billion per annum10 In late May 2011 the G8 group promised US$20 billion to Tunisia and Egypt in loans and grants over the next three years The first tranche of which several billions would presumably go to Tunisia would be disbursed during the second semester of 2011 It would then be quite feasible for Tunisia to achieve the MDGs under study should this help materialize and if part of this is directed to MDG sectors in the next four years Non-concessional loans and other borrowing from abroad would on the contrary be at the cost of accumulating debt but it is perhaps the only other feasible option for Tunisia to mobilize resources for MDG financingmdashalong with using receipts from selling confiscated assets belonging to members of the ousted government as further indicated below Following the trend of 2005-09 the government debt is on the decline in the baseline scenarios and it levels off above 30 percent by 2015 (Figure 3) The government debt would increase to almost 62 percent of GDP under the foreign borrowing scenario that takes the countercyclical spending assumption as the reference path This would not be such unfeasible financing mechanism if the government could live with a debt 6 percentage points of GDP higher than in 2005 It can be seen that under the assumption of pro-cyclical spending for which we already gauged the additional public spending required to achieve the MDGs government debt would be slightly higher compared to the countercyclical baseline scenario reaching almost 74 percent of GDP in 2015 In other words waiting for GDP growth to catch up again in order to resume MDG public spending would not only widen MDG gaps but also as it becomes more costly to achieve the MDGs towards the end of the simulation period it would put the debt burden under unsustainable territory The upshot here is that countercyclical spending reduces the cost of the MDG financing strategy not only in terms of new public spending required but also in terms of debt accumulation compared to a situation where public spending follows GDP downturns that increase the government efforts towards the end of the simulation period Finally the simulation results also show that government indebtedness would have needed to increase by only 3 percentage points of GDP by 2015 compared to 2005 if the political crisismdashas simulated heremdashhad not unfolded
10 Estimates are based on additional foreign aid requirements presented in Table 12 and GDP at current prices (US$443 billion) as recorded in the July 2011 update of IMFrsquos World Economic Outlook
41
Figure 3 Tunisia Government debt in the baseline and foreign-borrowing (fb)
scenarios 2005 2009 2015 (Percent of GDP)
Source Authorsrsquo estimates based on application of MAMS for Tunisia
5 Conclusions and policy recommendations
Before the recent global financing crisis and political revolution Tunisia was one of the fastest growing economies in the MENA region Since the 1990s the country was reaping benefits from various structural reforms a labour-intensive and export-oriented growth strategy the liberalisation of the economy and a prudent management of monetary and fiscal policies This economic model helped to propel growth but the economy remained vulnerable to external shocks and seriously challenged by high unemployment Given that the government has essentially continued the strategy it addopted since the 1960s of providing social transfers and food subsidies to fight poverty and supporting education and health sectors considerable progress in achieving the MDGs had been witnessed before the economic and political crises and some targetsmdashsuch as that of halving extreme poverty from its 1990 levelmdashhad already basically been met In spite of progress lack of access to parental care and insufficient health service delivery in rural areas combined with inadequate transport infrastructure and services have seriously imperiled further reducing maternal mortality An important share of the population also lacks basic sanitation especially in the rural areas
Foreign demand for Tunisianrsquos exports diminished as a result of the global financing crisis and this translated into sluggish growth Even so MDG progress was not interrupted owing to the governmentrsquos countercyclical spending policy Just when the economy started to show symptoms of recovery in 2010 discontent of the population about unemployment and corruption mainly led to a political revolution that has raised challenges at all levels
42
In this study we used a CGE model to perform a scenario analysis with a view to shed light on the prospects and challenges Tunisia faces to achieve the MDGs We showed that progress in achieving the MDGs would continue to be notable if public spending continues to grow as seen before the revolution but the targets for primary education child and maternal mortality and water and sanitation would not be met by 2015 The main gaps would be seen for maternal mortality mainly and basic sanitation to a lower extent MDG progress is found to be slightly less if public spending becomes pro-cyclical and follows the GDP deceleration expected for 2011 The impact of the political crisis on the MDGsmdashprimarily transmitted through less household income and consumption per capitamdashwould be only modest if the government manages to keep MDG spending countercyclical to sluggish GDP growth The global financing crisis did not affect MDG achievement precisely because the government maintained spending growing at high rates in spite of the observed GDP deceleration
Our analysis further showed that in order to meet the MDGs under study by 2015 public spending would need to rise by 57-78 percent of GDP per annummdashdepending on how public spending evolves after the political crisis and the mechanism used to finance it The mortality goals would be the most expensive to finance (32-39 percent of GDP per annum) followed by the primary education goal Little more than half of the newly required spending would be for new investment to compensate for deficiencies in infrastructure Additional resources required would tend to be relatively less if high growth of public spending seen before the revolution is not disrupted which in turn would help to minimize the impact of the political crisis on the MDGs
The injection of additional public spending could result in a small real exchange rate appreciationmdashif skilled-labour supply constraints lead to upward pressure on the skill premium for teachers doctors and other trained workers which in turn increases labour costs for the public sectormdashthat would somewhat penalize exports and economic growth This effect was found to be larger for scenarios in which additional MDG public spending is financed with resources from abroad owing to the inflow of foreign exchangemdashwhich likely are amongst the few financing options at Tunisiarsquos disposal But GDP growth was found to be even slightly less when the new public spending was financed through domestic borrowing or increased tax revenues Domestic borrowing by the government crowds out private investment as a (larger) share of private savings is diverted to finance the budget thus hurting private consumption and imports Increased taxation in turn reduces disposable income which subsequently also translates into reduced private spending and imports In these cases we found the government incurs an extra cost of 04-07 percent of GDP per annum in order to compensate for less private spending in MDG-related sectors And due to these macroeconomic trade-offs the MDG strategy should not be expected to act as a catalyst to stimulate the economy in the short term The productivity gains from greater MDG achievement would take some time to materialize as typically expected from any development strategy
Both domestic borrowing and increased taxation would be less desirable and perhaps infeasible options to finance the newly required MDG spending in Tunisia The revolution has hurt the economy and it would be unthinkable that under such
43
circumstances sufficient national savings could be mobilized to finance MDG public spending Workerrsquos remittances from abroad have been an important source of household savings but also these have been on the decline These two mechanisms of domestic resource mobilization could actually slow down the economic recovery that Tunisians badly need Furthermore Tunisiarsquos domestic bond market is not sufficiently developed to allocate domestic savings in amounts that are commensurate to the required financing of development goals The existing tax burden hovering 20 percent of GDP would also be considered relatively high for developing country standards Using these financing mechanisms in the midst of the formation and consolidation of a new political regime would also likely be politically infeasible
Whether it wants it or not Tunisia will have to rely on foreign resources to reconstruct its political system spur economic growth and finance development goals The use of non-concessional loans and other borrowing from abroad to achieve the MDGs would come at the cost of accumulating debt at levels that may perhaps be considered inconsistent with debt targets According to the scenario analysis performed relying on foreign borrowing alone to finance MDG achievement would push the government debt up to at least 62 percent of GDP by 2015mdashor even more if high growth of public spending seen before the political crisis is disrupted in the short term
Acquiring new debt at such high levels may however be avoided if the international donor community honours recent pledges of grant aid that it has made The donorsrsquo willingness to help Tunisia builds on the expectation that current political changes will translate into constitutional amendments that ultimately pave the way for a full-blown election and economic growth will pick up steam in 2012 According to our scenario analysis Tunisia would need at least little more than 6 percent of GDP per annum in foreign aid compared to what is currently receiving in order to be able to finance public spending required to timely meet the goals in primary education health and water and sanitation without resorting to other sources of financing The required foreign aid to achieve the MDGs would be in the range of US$27 to US$39 billion per annum depending on the pace at which MDG spending grows after the political crisis This would pretty much fall under amounts of aid that the G8 group of rich countries has promised to grant to Tunisia and Egypt
If foreign aid cannot be mobilized in the amounts that would be required to finance
the MDG strategy a combination of this and foreign borrowingmdashof levels that would not compromise debt sustainablitymdashwould be recommended Nevertheless domestic resource mobilization should gradually replace foreign resource mobilization mainly through fiscal reforms that permit to enhance the efficiency of tax collection and by this means broaden the tax base Furthermore the fiscal constraints could be eased if the sale of assets confiscated from members of the ousted government generates resources to finance the achievement of development goals In any case the government will also need to engage in more active production sector and labour market policies in order to raise productivity growth improve production capacity and create more jobs in the economy Only so would the economy really pick up steam and recover and the alarming unemployment levels be
44
reduced The impact of economic growth on poverty reduction could also be enhanced if the said fiscal reforms are progressive and help to reduce inequality
References
Ageacutenor Pierre-Richard Nihal Bayraktar and Karim El Aynaoui 2005 ldquoRoads out of
poverty Assessing the links between aid public investment growth and poverty reductionrdquo World Bank Policy Research Paper 3490
Ayadi M G Boulila M Lahouel and P Montigny (2005) ldquoPro-Poor Growth in Tunisiardquo International Development and Strategies Paris France
Bibi S and R Chatti 2007 ldquoPublic Spending Pro-Poor Growth and Poverty Reduction in Tunisia A Multi-level Analysisrdquo In Ali Abdel Gadir Ali and Shenggen Fan (eds) Public Policy and Poverty Reduction in the Arab Region State of Kuwait The Arab Planning Institute pp 259-319
Chaffai M E Patrick Plane and Dorra Triki Guermazi 2006 ldquoTotal Factor Productivity in Tunisian Manufacturing Sectors Convergence or Catch-up with OECD membersrdquo Working Paper Series The World Bank
Chemingui MA and H Bchir Mohammed 2008 ldquoDoes Multilateral Trade Liberalization Matters for Poverty Reduction in Africardquo Background paper for for the International Policy Analysis Network project (in collaboration with IFPRI) Washington DC
Cornelia Kaldewei y Ingo Pitterle 2011 ldquoBehavioural Factors as Emerging Main Determinants of Child Mortality in Middle-Income Countries A Case Study of Jordanrdquo DESA Working Paper No 103 New York United Nations Department of Economic and Socials Affairs Available from httpwwwunorgesadesapapers2011wp103_2011pdf
ETF (European Training Foundation) 2007 ldquoThe contribution of Human Resources Development to Migration Development in Tunisiardquo Research Report Available from httpwwwetfeuropaeupubmgmtnsf(getAttachment)5CD26BB43A026CD8C12573DB004D8AD2$FileNOTE7B7KG6pdf
IMF 2009a ldquoIMF Executive Board Concludes 2009 Article IV Consultation with Tunisiardquo Washington DC International Monetary Fund
IMF 2009b ldquoStatement of the IMF Mission on the 2009 Article IV Consultation with Tunisiardquo Washington DC International Monetary Fund
IMF 2010 ldquoTunisia 2010 Article IV ConsultationmdashStaff Report Public Information Notice on the Executive Board Discussion and Statement by the Executive Director for Tunisiardquo IMF Country Report No 10282 Washington DC
Isaksson Anders and Thiam Hee Ng 2006 ldquoDeterminants of Productivity Cross-Country Analysis and Country Case Studiesrdquo UNIDO Working Paper Vienna
45
Lahouel MH 2007 ldquoThe Success of Pro-Poor Growth in Rural and Urban Tunisirdquo In T Besley and LJCord (eds) Delivering on the Promise of Pro-Poor Growth
Insights and Lessons from Countries Experiences Palgrave Macmillan and the World Bank pp 199-218
Lofgren Hans and Carolina Diaz-Bonilla 2010a ldquoMAMS An economy-wide model for analysis of MDG country strategies ndash an application to Latin America and the Caribbeanrdquo In Marco V Saacutenchez Rob Vos Enrique Ganuza Hans Lofgren and Carolina Diaz-Bonilla (eds) Public Policies for Human Development Feasible
Financing Strategies for Achieving MDGs in Latin America and the Caribbean London PalgraveMacmillan
Lofgren Hans 2010 ldquoWhat determines the evolution of MDG indicators A Selective Review of the Literaturerdquo Development Prospects Group (DECPG) Washington DC the World Bank (Third Draft September 21)
Nehru Vikram and Ashok Dhareshwar 1993 ldquoA New Database on Physical Capital Stock Sources Methodology and Resultsrdquo Revista de Anaacutelisis Econoacutemica Vol 8 No 1 pp 37-59 June
Saacutenchez Marco V (2004) Rising inequality and falling poverty in Costa Ricarsquos
agriculture during trade reform A macro-micro general equilibrium analysis Maastricht Shaker
Saacutenchez Marco V and Giacomo Sbrana 2009a ldquoDeterminants of attendance in Jordans educationrdquo Technical note prepared for the Project Assessing Development Strategies to Achieve the Millennium Development Goals (MDGs) in the Arab region New York United Nations Department of Economic and Socials Affairs Available from httpwwwunorgendevelopmentdesapolicycapacitycountry_documentsjordan_sanchez_sbrana_2009pdf
Saacutenchez Marco V Rob Vos Enrique Ganuza Hans Lofgren and Carolina Diaz-Bonilla (eds) 2010 Public Policies for Human Development Feasible Financing
Strategies for Achieving MDGs in Latin America and the Caribbean London PalgraveMacmillan
Saacutenchez Marco V and Giacomo Sbrana 2009b ldquoDeterminants of education attainment and development goals in Yemenrdquo Background paper prepared for the Project Assessing Development Strategies to Achieve the Millennium Development Goals (MDGs) in the Arab region New York United Nations Department of Economic and Socials Affairs Available from httpwwwunorgendevelopmentdesapolicycapacityyemenshtml
Sbrana Giacomo 2009 ldquoTechnical note on the determinants of water and sanitation in Yemenrdquo Technical note prepared for the Project Assessing Development Strategies to Achieve the Millennium Development Goals (MDGs) in the Arab region New York United Nations Department of Economic and Socials Affairs Available from httpwwwunorgendevelopmentdesapolicycapacityyemenshtml
UNDP 2004 Rapport national sur les objectifs du milleacutenaires Tunis United Nations Development Programme
46
Vos Rob and Marco V Saacutenchez 2010 ldquoA Non-Parametric Microsimulation Approach to Assess Changes in Inequality and Povertyrdquo International Journal of
Microsimulation 3(1) 8-23 Available from httpwwwmicrosimulationorgIJMV3_1IJM_25pdf
World Bank 2003 ldquoImplementation completion report (CPL-37820 SCL-3782A SCPM-3782S CPL-37830)rdquo Report No 27171 Water Supply and Sewerage Project Finance Private Sector and Infrastructure Group Middle East and North Africa Region Washington DC The World Bank
World Bank 2003 ldquoTunisia Poverty Update Volume I Main Reportrdquo Washington DC
World Bank 2007 ldquoTunisia Country Assistance Strategy Documentrdquo Washington DC
47
Appendix A1 Elasticities of substitution and household expenditure used in the
calibration of MAMS
Substitution between
Factors
1 imports vs domestic
output 2 exports vs domestic
output 2
Expenditure elasticity of
market demand 2
Agriculture and fishing 074 206 111 081
Food processing 147 183 071 081
Construction materials ceramics glass 138 222 303 065
Mechanical and electrical industries 187 217 144 080
Chemicals 145 270 036 081
Textiles clothing and leather 013 172 123 171
Other manufacturing 114 232 214 121
Mining and oil refining 148 135 025 100
Electricity 127 169 (062) 065
Construction 184 059
Trade 159 (062) 100
Transport and communication 164 140 (062) 119
Hotels cafes and restaurants 137 (140) (062) 137
Finance and insurance 070 (140) (062) 313
Private primary education 070 (150) 340 162
Private secondary education 070 (150) (340) 162
Private tertiary education 070 (150) (340) 162
Private health 070 (140) (062) 122
Other private services 130 (150) (340) 098
Water and sanitation 157 (150) (340) 065
Public primary education 070 162
Public secondary education 070 162
Public tertiary education 070 162
Public health 070 122
Public infrastructure 070 100
Other government activities 070 100
1 Elasticities at the activity level 2 Elasticities at the commodity level Note elasticities in parenthesis were adjusted by the authors to ensure a feasible model solution Original estimates are available upon request Source Estimates by Nidhal Ben Cheikh Moncef Youzbachi and Jameleddine Boumedie as part of the project for which this study was elabourated with minor adjustments by the authors to ensure a feasible model solution
48
Appendix A2 Elasticities of the MDGs with respect to their determinants
Spending per-capita
or per-student
Other public infras-tructure
Household consumption
per-capita MDG 4 MDG 7a MDG 7b
Wage incentives
Non-education MDGs
MDG 4 child mortality -0485 -0010 -0100 -0020 -0020
MDG 5 maternal mortality -0864 -0010 -0100 -0005 -0005
MDG 7a drinking water 0100 0000 0010
MDG 7b basic sanitation 0644 0000 0100
Primary education
Entry rate 1100 0000 0250 -0110 0110
Promotion rate 0867 0150 0250 -0087 0087
Secondary education
Promotion rate 0200 0150 0300 -0017 0017
Graduation amp continuation 0100 0150 0300 -0020 0030
Tertiary education
Promotion rate 0137 0150 0250 -0014 0014
Graduation amp continuation 1230 0100 0750 -0015 0030
Source Authorsrsquo estimates as explained in the text
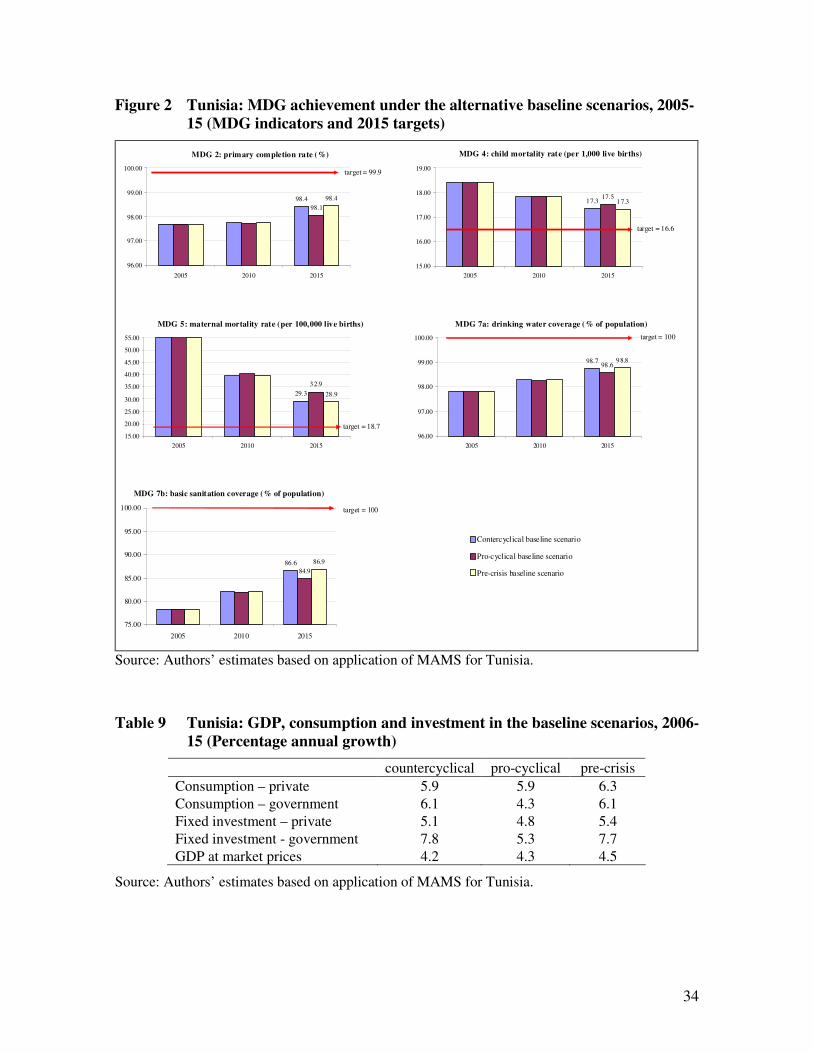