Embed Size (px)
Citation preview

1
Boundary Bay Conservation Committee (BBCC)
September 24, 2018
Cindy Parker
Panel Manager, Roberts Bank Terminal 2 Project
160 Elgin Street, 22nd Floor, Ottawa ON K1A 0H3
Telephone: 613-219-4108 or 1-866-582-1884
Roberts Bank Proposed Container Terminal 2 Project (RBT2) – Insufficient evidence in EIS
Executive Summary and Volume 1
Insufficient evidence in Introduction, Rationale, Purpose, Forecasts, Container Traffic Capacity, and
Alternate Means of Carrying out the Project
These sections of the EIS fail to provide sufficient evidence as vital information is incorrect, omitted,
contradictory, and/or misleading.
1. Missing is information from numerous reports and studies, historic and current, that provide the
necessary data on the container traffic business of the Vancouver Fraser Port Authority (VFPA)
and the Port of Prince Rupert.
2. The sole reliance on the Proponents’ studies is insufficient as more accurate evidence is
available in studies from other vested interests: B.C. ports; Metro Vancouver; Asia- Pacific
Gateway and Corridor Initiative; Journal of Commerce; Shipping News; Press Releases; Federal
Reports; and independent documents.
3. The reliance solely on Canada’s west coast container traffic business and omitting to separately
address the container traffic business of the Vancouver Fraser Port Authority (VFPA) fails to
provide evidence that supports the RBT2 Project.
4. Historic forecasts are misleading as they address initial 2001 forecasts but fail to include all
subsequent studies that are important to assessing validity of past and current forecasts.
5. Data for container traffic forecasts of the VFPA ports is omitted.
6. There is no evidence to support the rationale of the Project as data is missing for projected
demand and capacity of Vancouver ports.
7. The information for Canada’s west coast container traffic forecasts compared to actual
throughput is out of date and omits data, credible references, and more relevant studies.
8. Data for Canada’s west coast and Vancouver Fraser Port Authority (VFPA) container traffic
capacity is insufficient, anecdotal and fragmented.
9. Statistics for Deltaport, Roberts Bank, have been contradictory since the process began for an
environmental assessment (EA) of the Deltaport Third Berth (DP3) in 2005. Statistics changed
from prior to the DP3 Environmental Assessment (EA), and subsequent to the EA. This has led
to incorrect data in the RBT2 EIS, especially when compared to outside reports.
2
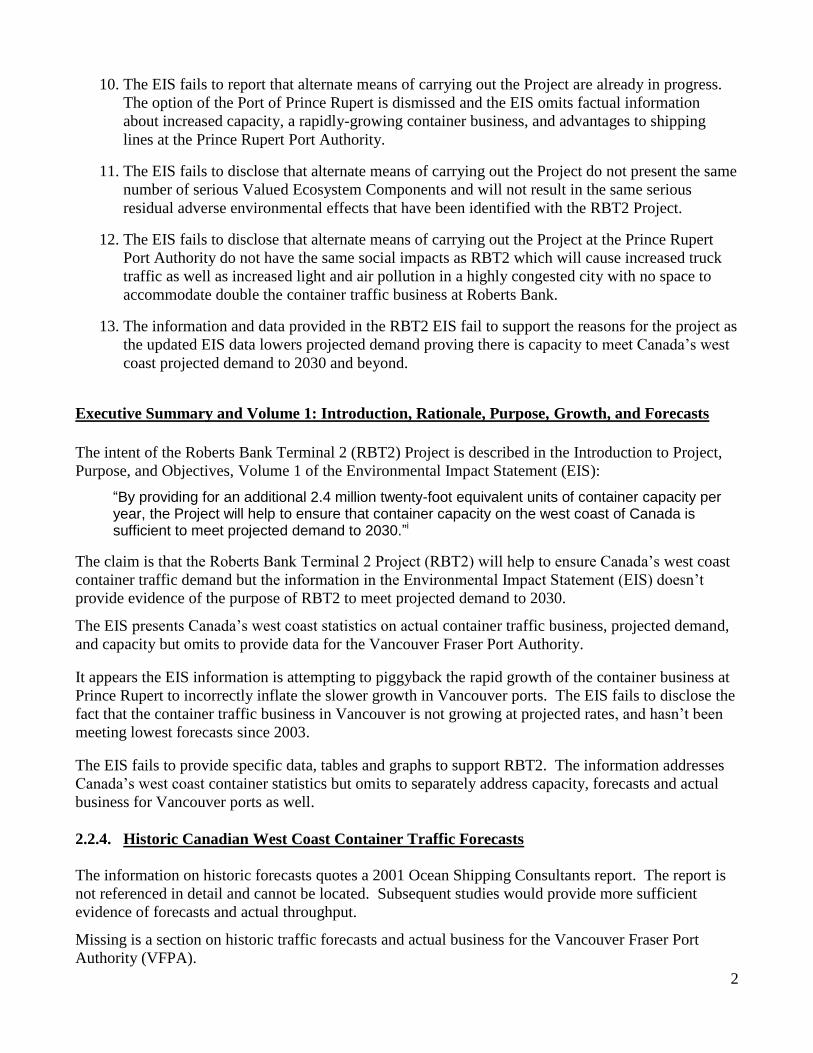
10. The EIS fails to report that alternate means of carrying out the Project are already in progress.
The option of the Port of Prince Rupert is dismissed and the EIS omits factual information
about increased capacity, a rapidly-growing container business, and advantages to shipping
lines at the Prince Rupert Port Authority.
11. The EIS fails to disclose that alternate means of carrying out the Project do not present the same
number of serious Valued Ecosystem Components and will not result in the same serious
residual adverse environmental effects that have been identified with the RBT2 Project.
12. The EIS fails to disclose that alternate means of carrying out the Project at the Prince Rupert
Port Authority do not have the same social impacts as RBT2 which will cause increased truck
traffic as well as increased light and air pollution in a highly congested city with no space to
accommodate double the container traffic business at Roberts Bank.
13. The information and data provided in the RBT2 EIS fail to support the reasons for the project as
the updated EIS data lowers projected demand proving there is capacity to meet Canada’s west
coast projected demand to 2030 and beyond.
Executive Summary and Volume 1: Introduction, Rationale, Purpose, Growth, and Forecasts
The intent of the Roberts Bank Terminal 2 (RBT2) Project is described in the Introduction to Project,
Purpose, and Objectives, Volume 1 of the Environmental Impact Statement (EIS): “By providing for an additional 2.4 million twenty-foot equivalent units of container capacity per year, the Project will help to ensure that container capacity on the west coast of Canada is sufficient to meet projected demand to 2030.”i
The claim is that the Roberts Bank Terminal 2 Project (RBT2) will help to ensure Canada’s west coast
container traffic demand but the information in the Environmental Impact Statement (EIS) doesn’t
provide evidence of the purpose of RBT2 to meet projected demand to 2030. The EIS presents Canada’s west coast statistics on actual container traffic business, projected demand,
and capacity but omits to provide data for the Vancouver Fraser Port Authority. It appears the EIS information is attempting to piggyback the rapid growth of the container business at
Prince Rupert to incorrectly inflate the slower growth in Vancouver ports. The EIS fails to disclose the
fact that the container traffic business in Vancouver is not growing at projected rates, and hasn’t been
meeting lowest forecasts since 2003. The EIS fails to provide specific data, tables and graphs to support RBT2. The information addresses
Canada’s west coast container statistics but omits to separately address capacity, forecasts and actual
business for Vancouver ports as well.
2.2.4. Historic Canadian West Coast Container Traffic Forecasts
The information on historic forecasts quotes a 2001 Ocean Shipping Consultants report. The report is
not referenced in detail and cannot be located. Subsequent studies would provide more sufficient
evidence of forecasts and actual throughput. Missing is a section on historic traffic forecasts and actual business for the Vancouver Fraser Port
Authority (VFPA).
3
Figure 2.2
Figure 2.2 is a graph that purports to support VFPA’s claim of the “robustness and accuracy of the
forecasts” as stated on page 2-7. No data is provided. A note claims the data is sourced from the
Ocean Shipping Consultants Report of 2013. However, this information cannot be directly located in
that study.
Figure 2.2 in the EIS is incorrect as the numbers in the vertical axis providing TEUS are misplaced.
The Review Panel requested an updated version of this Figure. The re-submitted Figure 2.2 has
corrected the error in the vertical axis.
There is no table and no credible reference for Figure 2.2 so a reader has no idea of actual numbers.
It is insufficient to present only 2001 forecasts. The 2003 study in the Environmental Assessment for
the Roberts Bank Deltaport Third Berth provided forecasts that have still not been realized. The lowest
forecast for 2015 was 3.6 million TEUs. The actual was 3.0 million TEUs.
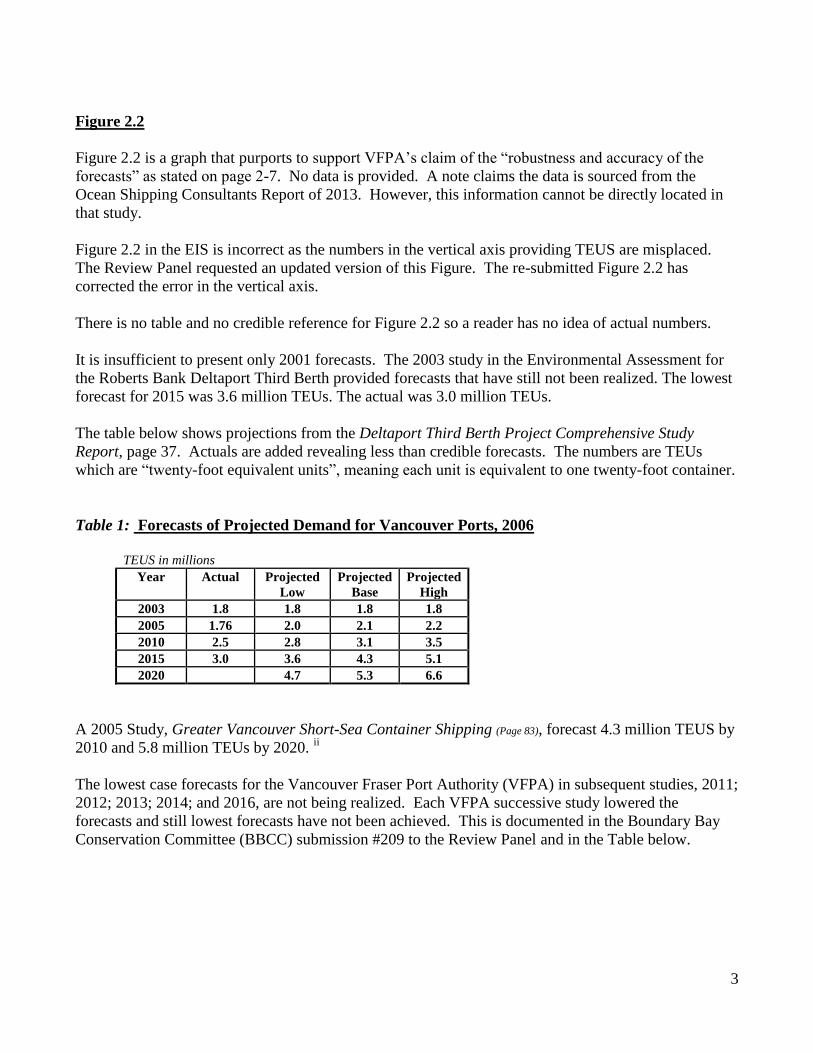
The table below shows projections from the Deltaport Third Berth Project Comprehensive Study
Report, page 37. Actuals are added revealing less than credible forecasts. The numbers are TEUs
which are “twenty-foot equivalent units”, meaning each unit is equivalent to one twenty-foot container.
Table 1: Forecasts of Projected Demand for Vancouver Ports, 2006
TEUS in millions
Year Actual Projected
Low
Projected
Base
Projected
High
2003 1.8 1.8 1.8 1.8
2005 1.76 2.0 2.1 2.2
2010 2.5 2.8 3.1 3.5
2015 3.0 3.6 4.3 5.1
2020 4.7 5.3 6.6
A 2005 Study, Greater Vancouver Short-Sea Container Shipping (Page 83), forecast 4.3 million TEUS by
2010 and 5.8 million TEUs by 2020. ii
The lowest case forecasts for the Vancouver Fraser Port Authority (VFPA) in subsequent studies, 2011;
2012; 2013; 2014; and 2016, are not being realized. Each VFPA successive study lowered the
forecasts and still lowest forecasts have not been achieved. This is documented in the Boundary Bay
Conservation Committee (BBCC) submission #209 to the Review Panel and in the Table below.
4
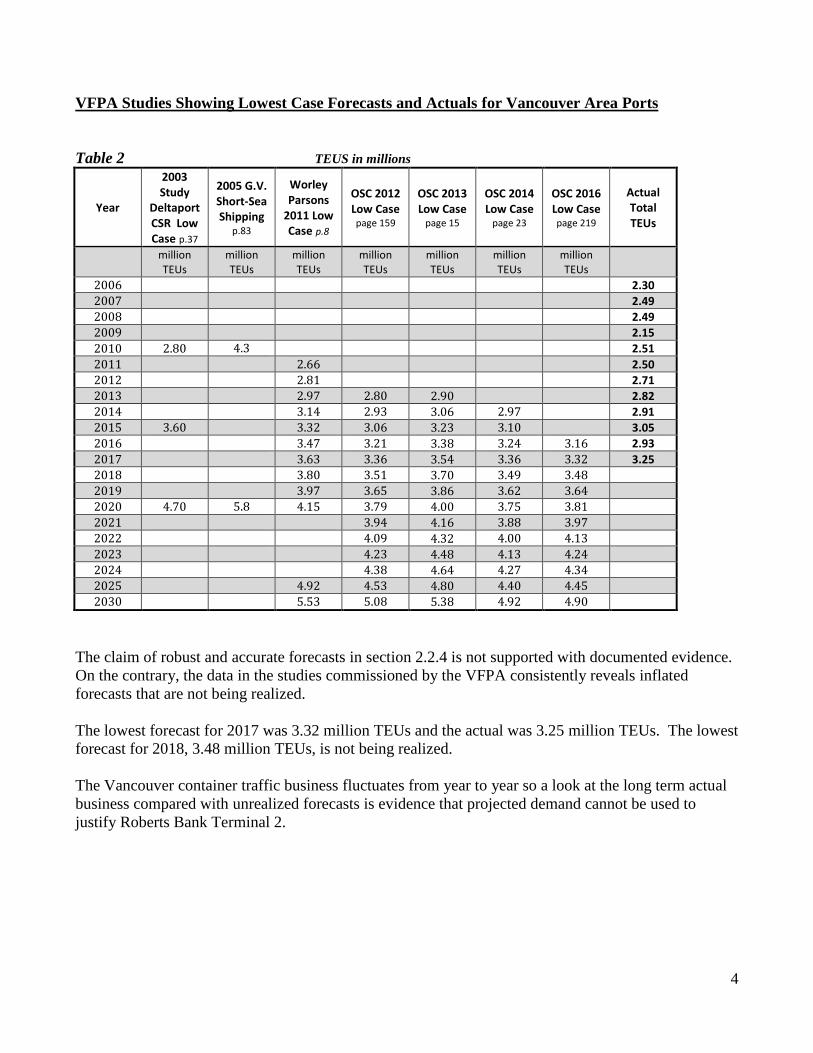
VFPA Studies Showing Lowest Case Forecasts and Actuals for Vancouver Area Ports
Table 2 TEUS in millions
Year
2003 Study
Deltaport CSR Low Case p.37
2005 G.V. Short-Sea Shipping
p.83
Worley Parsons
2011 Low Case p.8
OSC 2012 Low Case page 159
OSC 2013 Low Case
page 15
OSC 2014 Low Case
page 23
OSC 2016 Low Case page 219
Actual Total TEUs
million TEUs
million TEUs
million TEUs
million TEUs
million TEUs
million TEUs
million TEUs
2006
2.30
2007
2.49
2008
2.49
2009
2.15
2010 2.80 4.3
2.51
2011
2.66
2.50
2012
2.81
2.71
2013
2.97 2.80 2.90
2.82
2014
3.14 2.93 3.06 2.97
2.91
2015 3.60 3.32 3.06 3.23 3.10
3.05
2016
3.47 3.21 3.38 3.24 3.16 2.93
2017
3.63 3.36 3.54 3.36 3.32 3.25
2018
3.80 3.51 3.70 3.49 3.48
2019
3.97 3.65 3.86 3.62 3.64 2020 4.70 5.8 4.15 3.79 4.00 3.75 3.81 2021
3.94 4.16 3.88 3.97
2022
4.09 4.32 4.00 4.13 2023
4.23 4.48 4.13 4.24
2024
4.38 4.64 4.27 4.34 2025
4.92 4.53 4.80 4.40 4.45
2030
5.53 5.08 5.38 4.92 4.90
The claim of robust and accurate forecasts in section 2.2.4 is not supported with documented evidence.
On the contrary, the data in the studies commissioned by the VFPA consistently reveals inflated
forecasts that are not being realized.
The lowest forecast for 2017 was 3.32 million TEUs and the actual was 3.25 million TEUs. The lowest
forecast for 2018, 3.48 million TEUs, is not being realized.
The Vancouver container traffic business fluctuates from year to year so a look at the long term actual
business compared with unrealized forecasts is evidence that projected demand cannot be used to
justify Roberts Bank Terminal 2.

5
Container Business at the Vancouver Fraser Port Authority 2000 to 2017
The graph and table below provide data of the VFPA container business from 2000 to 2017. As the
container business was growing and expanding in the early years, the Compound Annual Growth Rate
(CAGR) from 2000 to 2007 was 10.66%. After the initial introduction of the container business to
Vancouver, business slowed and for the past ten years (2007 – 2017) the CAGR has been 2.70%. The
EIS fails to disclose the slower growth rate since 2007 and the drops in 2008, 2009 and 2016. The container business is reported in TEUS, “twenty-foot equivalent units”, which means each unit is
equivalent to one twenty-foot container. Graph1
Source of Information: VFPA Statistics, Vancouver Port Authority Statistics, and Statistics Canada
Table 3: Container Business in Vancouver Ports 2000 – 2017
0
500,000
1,000,000
1,500,000
2,000,000
2,500,000
3,000,000
3,500,000
2000 2001 2002 2003 2004 2005 2006 2007 2008 2009 2010 2011 2012 2013 2014 2015 2016 2017
Container Business of Vancouver Area Ports 2000-2017
TotalTEUs
TEUS
YEAR TEUs
2000 1,229,842
2001 1,197,142
2002 1,558,762
2003 1,791,568
2004 1,982,488
2005 2,140,223
2006 2,302,381
2007 2,498,691
2008 2,492,107
2009 2,152,462
2010 2,514,309
2011 2,507,032
2012 2,713,160
2013 2,825,475
2014 2,912,928
2015 3,054,467
2016 2,929,585
2017 3,252,223

6
The EIS fails to document evidence to support the purpose and rationale for RBT2. The EIS addresses
Canada’s west coast container business and forecasts but omits to provide evidentiary reasons for the
Terminal 2 Project at Roberts Bank.
Canada’s West Coast Container Business 2008 to 2017
The graph below provides evidence of the rapid growth at the Prince Rupert Port Authority.
The Compound Annual Growth Rate (CAGR) of the Vancouver Fraser Port Authority (VFPA)
container business from 2008 to 2017 was 3% while the CAGR of the Prince Rupert Port Authority
was 20% during the same 9 years. The CAGR of the two combined was 5%.
Graph 2
The EIS does not differentiate between the rapid growth at the Port of Prince Rupert and the slower
growth in Vancouver ports. As a result, the forecasts for the VFPA in the EIS are not realistic.
2.2.5 Current Canadian West Coast Container Traffic Forecasts Updated information from the Ocean Shipping Consultants Report (OSC) of 2016 was provided to the
Review Panel for this section. The three upgraded graphs, Figures 2-2, 2-3, and 2-4 are all for
Canada’s West Coast forecasts.
Missing in the EIA is a section on container traffic forecasts for Vancouver area ports. These can be
found in the OSC 2016 Report, page 219, but they are not included in the EIS. These are shown on
pages 4 and 18 of this document.
The omission of this important information is a critical deficiency of this EIS
2.49 2.15
2.51 2.50 2.71 2.82 2.91 3.05 2.93 3.25
.18
.26
.34 .41 .56 .54
.62 .77 0.8
0.9
0.00
1.00
2.00
3.00
4.00
5.00
2008 2009 2010 2011 2012 2013 2014 2015 2016 2017
Canada's West Coast Container Traffic Actual TEUs
Port of Vancouver Actual TEUs Prince Rupert Actual TEUs
million TEUS

7
Capacity to Meet Demand
The EIS does not provide evidence to support the claim that RBT2 will meet Canada’s projected
demand to 2030. To the contrary, the data above provides evidence that the increased demand is at
Prince Rupert Port Authority where the capacity is required.
Data providing existing and planned capacity for the VFPA is not included in the EIS. Figure 2-4
displays west coast forecasts and planned capacity increases but the graph is not easy to decipher and
fails to provide evidence to support reasons for the massive increase in capacity at Roberts Bank.
RBT2 EIS: Figure 2-4 Canadian West Coast Container Traffic Forecast and Planned Capacity
Increases to 2030, from Ocean Shipping Consultants Study, 2016.
Graph 3
There is no data to explain the lines on the graph. Specific information is essential to consideration of
objectives and rationale of the Project.
The vague depiction is followed by a statement that the graph is evidence of need for RBT2.
Professionals in business would be embarrassed to use such vague information as evidence that a
project is feasible. Business requires feasibility studies and cost/benefit analyses. These are missing
from the EIS.

8
There isn’t any section in the EIS that presents the necessary data of container capacity for each port
with ongoing and planned expansions. There are subjective descriptions in section 5.3.1, but no
definitive data.
85% Effective Capacity
The VFPA presents port operations as being limited to 85% of maximum capacity. This raises serious
questions because engineering requires incorporation of limiting factors in the initial assessment of
capacity, not after the port capacity has been calculated.
If the VFPA cannot operate to capacity, then it is another reason to question the efficiency of
Vancouver area ports. Were the engineering reports remiss in reporting properly calculated capacity?
Increased capacity can be achieved through more intensive use of existing terminals and more
operating hours, not more terminals. As the VFPA is finding it difficult to operate at calculated
capacity, it is likely that the Vancouver area, rail, roads and shipping lanes are too congested to
consider more container traffic. Larger container vessels present new logistics that Vancouver’s
congestion probably cannot, and should not, incorporate.
As Canadians have invested hundreds of millions of tax dollars on container infrastructure for existing
terminals, the VFPA should not bring in new competition that threatens current operations. The VFPA
may be building at Roberts Bank in order to move the container business out of Burrard Inlet. That
way, the VFPA could maximize real estate profits instead of maximizing container business at existing
terminals.
It is also important that the container business does not squeeze out Vancouver’s bulk shipping
terminals which are more essential to Canada’s economy. The container business imports products
with 24% bound to the U.S. whereas bulk shippers export grain, potash, minerals and forest products
which are more vital to Canada’s economic wealth.
Figure 2.4 includes the Prince Rupert Port Authority in the 85% effective capacity category. This is
inappropriate as the Prince Rupert Port Authority operated well above stated capacity prior to its first
expansion.
As the container business is growing faster in Prince Rupert, it makes sense that capacity expansions be
built at that location. This was advised by three independent transportation experts in the Strategic
Advisors Report, Asia Pacific Gateway and Corridor Initiative Report and Recommendations, 2008.
Burghadt, De Fehr and Turner recommended that:
“…policy makers develop container capacity in Prince Rupert before making investments in Vancouver”…and further that: “…a systematic approach be taken to achieve an understanding of port capacity before a conclusion is reached that a particular port must necessarily be larger.”
The Report, commissioned by Canada’s Minister of Transportation, was, and continues to be, ignored.

9
Canada’s West Container Traffic Capacity: A Comparison of the RBT2 EIS and Other
Referenced Information The following Tables and Graph depict Canada’s west coast container capacity according to
information in the EIS and Ocean Shipping Consultants Study, 2016 compared to referenced sources. Capacity numbers for the VFPA, 2011 to 2025, are documented in a Table 7-6 on page 225 of the 2016
OSC Report. Statistics from the Prince Rupert Port Authority are added in to calculate Canada’s West
Coast Capacity. With the exception of RBT2, the OSC 2016 Table does not include expansions beyond
2018. While the Vancouver totals in the following table are identical to OSC 2016, Table 7.6, the numbers for
individual Vancouver ports are not specifically accurate as they were extrapolated from different
sources: the OSC 2016 Table 7.8; Section 5.3 of this EIS; the Deltaport Third Berth EA, Chapter 3;
Figure 2-4 of this EIS; and published information documented under Referenced Sources.
Table 4 VFPA-Canada’s West Coast Container Traffic Capacity as shown in Fig. 2-4 of RBT2 EIS
2004 2005 2010 2015 2016 2017 2020 2022 2025
RBT2
Deltaport 0.90 0.90 1.80 2.00 2.20 2.40 2.40 2.40 4.80
Vanterm 0.44 0.60 0.70 0.70 0.90 0.90 0.90 0.90 0.90
Centerm 0.36 0.70 0.90 0.90 0.90 0.90 1.40 1.40 1.40
Fraser Surrey 0.30 0.30 0.25 0.25 0.05 0.05
Vancouver Totals 2.00 2.50 3.65 3.85 4.05 4.25 4.70 4.70 7.10
Prince Rupert 0.50 0.50 0.75 0.75 0.75 1.35 1.35 1.90 1.90
West Coast Total 2.60 3.00 4.15 4.60 4.80 5.70 6.05 6.60 9.00
Table 5 Canada’s West Coast Container Traffic Capacity Without RBT2 from Referenced Sources
Reference xiv documents a potential capacity of 4 million TEUs at the Port of Prince Rupert.
2004 2005 2010 2015 2016 2017 2020 2022 2025
Deltaport 1.40 1.40 2.10 2.30 2.50 2.70 3.00 3.00 3.00
Vanterm 0.44 0.60 1.00 1.00 1.00 1.00 1.08 1.08 1.08
Centerm 0.36 0.36 0.88 0.88 0.88 1.00 1.50 1.80 1.80
Fraser Surrey 0.30 0.60 0.20 0.20 0.20 0.20 0.20 0.20 0.20
Vancouver Total 2.50 2.96 4.18 4.38 4.58 4.90 5.78 6.08 6.08
Prince Rupert 0.50 0.50 0.75 1.35 1.35 1.80 2.50
(4.00)
West Coast Total 2.50 2.96 4.68 4.88 5.33 6.25 7.13 7.88 8.58
(10.08)

10
The tables and graphs provide evidence of more than sufficient container traffic capacity to meet
Canada’s west coast demand to 2030.
Table 6
Summary Table Showing Incremental Capacity for Canada’s West Coast Container Traffic
Graph 4: Comparison of Statistics Showing Canada’s West Coast Container Traffic Capacity
Without the Roberts Bank Container Terminal 2 Project (RBT2), referenced sources identify the
potential for a capacity of over 8.50 million TEUs for Canada’s west coast by 2022 and, with further
expansions and efficiencies, port operators claim capacity for over 10 million TEUs by 2030.
Reference xiv documents the potential for 4 million TEUs at the Port of Prince Rupert.
Referenced sources identify the potential for a capacity of 6 million TEUs for the VFPA by 2025. This
is without the Roberts Bank Container Terminal 2 Project.
2.49 2.15 2.51 2.50 2.71 2.82 2.91 3.05 2.93 3.25
.18
.26 .34 .41
.56 .54 .62 .77 0.8 0.9 4.15
4.80
5.70
6.05 6.60
9.00
4.68
6.25
7.13
7.88 8.58
0.00
1.00
2.00
3.00
4.00
5.00
6.00
7.00
8.00
9.00
10.00
2008 2009 2010 2011 2012 2013 2014 2015 2016 2017 2018 2019 2020 2021 2022 2023 2024 2025 2030
Differing Statistics for B.C. West Coast Container Traffic Capacity
Port of Vancouver Actual TEUs Prince Rupert Actual TEUs
Capacity according to VFPA with RBT2 Documented Capacity without Terminal 2
Terminal 2 - RBT2
Expansions at Vanterm, Centerm and Prince Rupert
million TEUS
DTRRIP Capacity According to VFPA
DTRRIP - Deltaport Road and Rail Improvement
Documented Capacity without RBT2
TEUs in millions
2011 2015 2016 2017 2018 2019 2020 2022 2025 2030
According to VFPA in
RBT2 EIS Figure 2-4 4.15 4.60 4.80 5.70 6.05 6.05 6.05 6.60
9.00
T2 9.00
Other Documented Capacity
without RBT2 4.68 4.88 5.33 6.25 6.25 6.25 7.13 7.88 8.48 8.58

11
Referenced Sources
Container Capacity at Vanterm Terminal, Burrard Inlet 1,080,000 TEUs by 2020
“Vanterm increased its capacity to 0.60 million TEUs in 2005”iii
“…Terminal Systems Inc….has ordered equipment to increase Vanterm’s capacity to over 1.0 million TEUs by 2009….”iv
A June, 2018, article states Vanterm’s investment will increase capacity to 1,080,000 TEUs. “GCT is also investing $160 million in infrastructure improvements at its 900,000-TEU Vanterm container terminal that will boost its capacity by approximately 20 per cent.”v
A Study commissioned by the Corporation of Delta documents a capacity of 1 million TEUs at
Vanterm:
“By 2031, it is assumed that Terminal 2 will be operating at full capacity. This is based on the following forecasted annual throughputs at full capacity: … II Vanterm (1 million TEUs)”vi
Container Capacity at Centerm Terminal, Burrard Inlet 1,800,000 TEUs by 2020
A 2007 Transport Canada Study:
“In 2006 Centerm completed a major terminal redevelopment doubling its capacity from 0.36 million TEUs to 0.78 million TEUs per year. The company expects to double its volume within two years and reach a million TEUs by 2010.”vii
A 2014 Announcement:
“… Port Metro Vancouver announced that it is considering design options to increase container capacity at the Centerm terminal in the Burrard Inlet, from its current 900,000 TEUs to as much as 1.8 million TEUs”viii
Container Capacity at Fraser Surrey Docks - 34 kilometres up the Fraser River from the Estuary
600,000 TEUs in 2005
Handling 100,000 to 200,000 TEUs
In 2005, Fraser Surrey Docks spent $190 million on expanding container capacity to 600,000 TEUS.
Then its main customer transferred to another Vancouver Terminal. The VFPA states in the EIS that
the Fraser Surrey Docks handles about only 100,000 TEUs annually due to larger container ships and
navigational constraints of the Fraser River. However, due to its extensive land and rail yards, there is
opportunity for Fraser Surrey Docks to be used for export of laden containers with agricultural
specialty crops. This would help Canada’s balance of trade in the container traffic business.
12
Container Capacity at the Port of Prince Rupert 2,500,000 TEUs by 2025
Potential for 4 million TEUs
The Port of Prince Rupert began operations in 2007.
“The original design capacity of the terminal was 500,000 TEU. However effective management and an efficient workforce have seen throughput grow to 776,412 TEUs in 2015… … with phase 2A complete the project expanded the wharf to 800m in length and increased throughput capacity to 1.35 million TEUs per annum.”ix
In August, 2017, the Port of Prince Rupert announced completion of expansion to 1.35 TEUs.x
In June, 2018, the Port of Prince Rupert announced another expansion:
“The Phase 2B expansion will increase annual throughput capacity at Canada’s second largest container terminal to 1.8 million TEUs (twenty-foot equivalent units) when complete in 2022.”xi
https://www.rupertport.com/news/releases/fairview-phase-2B-expansion
DP World has plans to increase capacity to 2.4 million TEUs:
“Additionally, Prince Rupert this year received the necessary permits for a southern expansion of the port. Don Krusel, president and CEO, said plans for this expansion project have not been finalized but it could include construction of a third container berth, extension of the on-dock rail yard and additional storage space. The southern expansion would increase annual throughput capacity to 2.4 million TEUsxii.
“DP World has ambitions to increase its cargo handling capacity on Canada’s West Coast to four million TEUs by 2022. Sixty per cent of that total would flow through Prince Rupert as part of a third Fairview expansion that would raise its capacity to between two million and 2.5 million TEUs.”xiii
A research paper by engineers reveals a potential capacity of 4 million TEUs at the Prince Rupert Port
Authority: “Currently, Prince Rupert is in the design and permitting stage for a second container terminal to begin development in 2015 which would have capacity to move 2 million TEUs annually and potentially bring the total capacity to 4 million TEUs by 2020.”xiv
Container Capacity at Deltaport at Roberts Bank 3 million TEUs without RBT2
The VFPA statistics for container traffic capacity at Deltaport have been misleading for years resulting
in claims of need for more capacity.
In 2008, Terminal Systems Inc, the operators of Deltaport, stated on their website, in documents, and in
studies, that container traffic capacity at Deltaport was 1.4 million TEUs which would expand to 2.1
million TEUs with the Deltaport Third Berth.
“Deltaport capacity after the completion of Deltaport Berth 3 in 2009 will be 2,100,000 TEUs”xv
This information was also documented in Chapter 4.2 of the Transport Canada Pacific Coast Container
Terminal Competitiveness Study – TP 14837E, 2011.
“…Terminal Systems Inc. is adding a third berth at Deltaport to increase capacity from 1.4 to 2.1 million TEUs per year by 2009…xvi

13
The statistics used in the Environmental Assessment for the Deltaport Third Berth were lower by
500,000 TEUs for claimed existing capacity and lower for added capacity stating the Third Berth
would add 400,000 TEUs of capacity:
“The proposed Project at Roberts Bank would increase Deltaport capacity from 900,000 TEUs
a year in 2003 to 1,300,000 TEUs by 2008”xvii
However, when the Project was completed, the VFPA announced an initial capacity that was higher by
300,000 TEUs and a higher added capacity of 600,000 TEUs.
“The project, which took two years to construct, increases Deltaport’s capacity by up to 50 per cent from 1.2 million twenty-foot equivalent units (TEUs) to 1.8 million TEUs.”xviii
Then in 2011, the VFPA announced the Deltaport Terminal Road and Rail Terminal Improvement
Project (DTRIPP) that would add 600,000 TEUs to Deltaport by 2017 for a total capacity of 2.4 million
TEUs: “The VFPA proposes to provide funding for the design and implementation of a project that could increase the container capacity at Deltaport Terminal by 600,000 TEUs (twenty-foot equivalent unit containers) to a total capacity of 2.4 million TEUs.” xix
This is the current set of statistics used by the Vancouver Fraser Port Authority. Section 5.3.1.1 of this
EIS, states the Deltaport Terminal Road and Rail Improvement Project (DTRRIP):
“…will improve efficiency and further increase capacity at Deltaport Terminal by 600,000 TEUs to 2.4 million TEUs by 2017”
Section 2.1.1 addresses rationale for the RBT2 Project:
“The Project will provide an additional 2.4 million twenty-foot equivalent unit (TEU) of container
capacity per year.”
However, the study for the Deltaport Road and Rail Improvement Project (DRRIP) confirms that
Deltaport, without RBT2, can handle 3 million TEUs by 2020 with the transportation upgrades,
intermodal yard reconfiguration and improved efficiencies. The road and rail upgrades have added
capacity of 600,000 TEUs and the associated upgrades will further increase capacity.
“Case 1: Deltaport has a sustainable capacity of 2.4 million TEU. Deltaport has maximum capacity of 3.0 million TEU in the interim years of high demand up to about 2020. Cases 2 and 3: Deltaport has a sustainable capacity of 3.0 million TEU.”xx
There is further evidence the Environmental Assessment Report for the Deltaport Road and Rail
Improvement Project (DRRIP):xxi
“Emissions are calculated based on the Deltaport container terminal reaching a capacity of 3 million TEUs per year by 2020 due to Deltaport improvements”
As a result of inconsistency in numbers, in the EIS, the VFPA erroneously reports a maximum of 4.7
million TEUs of container traffic capacity at Vancouver ports without the Roberts Bank Terminal 2
Project.

14
Statistics presented by the VFPA in the EIS also fail to include correct numbers for the increase in
capacity occurring at other Vancouver ports. Documents provide evidence of container traffic capacity
of 6.08 million TEUs without RBT2.
The consequence of this constant alteration of so-called statistics has far-reaching implications as it
conceals the fact that the Vancouver Fraser Port Authority has sufficient container traffic capacity
without the Roberts Bank Terminal 2 Project.
This is an unfortunate situation as the decision whether to proceed, or not, with Terminal 2 is made by
Canada’s Minister of Transportation. The Transportation Ministry is using questionable FVPA
statistics in a recent Transport Canada Report, ‘Evaluation of the Asia-Pacific Gateway and Corridor
Initiative and the Gateways and Borders Crossing Fund’, Transport Canada, Evaluation and Advisory
Services, October 2017. Container traffic capacity in Chart 7 of the document shows similar statistics
to the statistics used by the VFPA in the Roberts Bank Terminal 2 Project EIS.xxii
Chart 7: Evaluation of the Asia-Pacific Gateway and Corridor Initiative and the Gateways and
Borders Crossing Fund’, Transport Canada, Evaluation and Advisory Services, October 2017
Graph 5
As noted above, the Environmental Assessment for the Deltaport Third Berth, (DP3) stated the project
would add 400,000 TEUs at Deltaport. Note in the graph above that 900,000 TEUs are added at
around the time the Third Berth was completed in 2009.

15
The numbers in this 2017 Transport Canada graph do not correlate with Referenced Sources in this
document. Chart 7 shows VFPA capacity of 4.8 million TEUs without Roberts Bank Terminal 2
(RBT2) which is incorrect and out of date. The referenced information in this document demonstrates
VFPA will have capacity of 6.08 TEUS without RBT2.
As a result of skewed data, Canada’s Minister of Transportation is not, and will not, be equipped with
full, accurate evidence in his decision on the Roberts Bank Terminal 2 Project.
This information is reinforced in the Inland Intermodal Cargo Facility Study, 2014, commissioned by
the City of Delta which claims with RBT2, VFPA will have a capacity of 7.60 million TEUs. Without
RBT2 that is a capacity of 5.20 million TEUs.
“By 2031, it is assumed that Terminal 2 will be operating at full capacity. This is based on the following forecasted annual throughputs at full capacity: II Deltaport (2.4 million TEUs) II RBT2 (2.4 million TEUs) II Centerm (1.8 million TEUs) II Vanterm (1 million TEUs)”xxiii
The numbers in the Delta Study differ slightly from the References Sources in this document at they
report 2.4 million TEUs (not 3 million) for Deltaport and were documented before the announcement
of further expansions at Vanterm.
The contradictory information about Deltaport capacity has a domino effect on VFPA’s statistics for
Vancouver ports’ total capacity and Canada’s west coast container capacity.
As container traffic capacity information is fundamental to determining purpose and rationale of the
RBT2 Project, the convoluted information about capacity at Deltaport is inaccurate and misleading.
Container Traffic Capacity at Vancouver Area Ports
The Roberts Bank Terminal 2 Project (RBT2) EIS fails to provide evidence of the need for increased
container traffic capacity in the Vancouver area. The Table and Graph below demonstrate ample
container traffic capacity in the Vancouver area without the Roberts Bank Terminal 2 Project (RBT2)
The Ocean Shipping Consultants Report, 2016, page 225, shows that the Vancouver Fraser Port
Authority will have a container traffic capacity of 4.70 million TEUs by 2018 and then no increase in
capacity beyond that date, with the exception of the Roberts Bank Terminal 2 Project that will increase
capacity to 7.1 million TEUs in 2023.
It is now 2018 and planned expansions have been announced for both Vanterm and Centerm so these
are not included in the EIS.
Graph 6 below depicts the differing statistics on capacity compared with the actual container traffic
business at the Vancouver Fraser Port Authority (VFPA). Even considering just the VFPA statistics, it
is clear from the graph that the capacity exists to meet the growth in actual business without RBT2.

16
Table7
Canada’s West Coast Container Incremental Capacity to 2025 from Referenced Sources
Vancouver Fraser Port Authority Container Traffic Capacity: A Comparison of information in
the RBT2 EIS and Other Referenced Information
Graph 6
2.49 2.15
2.51 2.50 2.71 2.82 2.91 3.05 2.93 3.25
2.80 3.08
3.65
4.68
7.10
3.20 3.58 4.18
4.90
5.78
6.08
6.08
0.00
0.50
1.00
1.50
2.00
2.50
3.00
3.50
4.00
4.50
5.00
5.50
6.00
6.50
7.00
7.50
8.00
2008 2009 2010 2011 2012 2013 2014 2015 2016 2017 2018 2019 2020 2021 2022 2023 2024 2025 2030
Differing Statistics for Container Traffic Capacity of Vancouver Area Ports
Port of Vancouver Actual TEUs Capacity according to VFPA with RBT2
Documented Capacity without Terminal 2
Terminal 2
Expansions at Vanterm and Centerm
million TEUS
DTRRIP Capacity According to VFPA
DTRRIP - Deltaport Road and Rail Improvement Project
Documented Capacity Without RBT2
Terminal TEU
Capacity
Expansions and Improvements
dates of expansions are estimated
TEU
Capacity
2005 2010 2015 2017 2017-
2020 2022 2025
Deltaport
1,400,000
700,000
200,000
400,000
300,000
3,000,000
Vanterm 600,000 400,000 80,000 1,080,000
Centerm 360,000 520,000 120,000 500,000 300,000 1,800,000
Fraser Surrey 600,000 -400,000 200,000
Vancouver
Total
2,960,000
4,180,000
4,380,000 4,900,000 5,780,000 6,080,000 6,080,000
Prince
Rupert
500,000 850,000 800,000 2,400,000
West Coast
Total
500,000 1,350,000 2,150,000 8,480,000
17
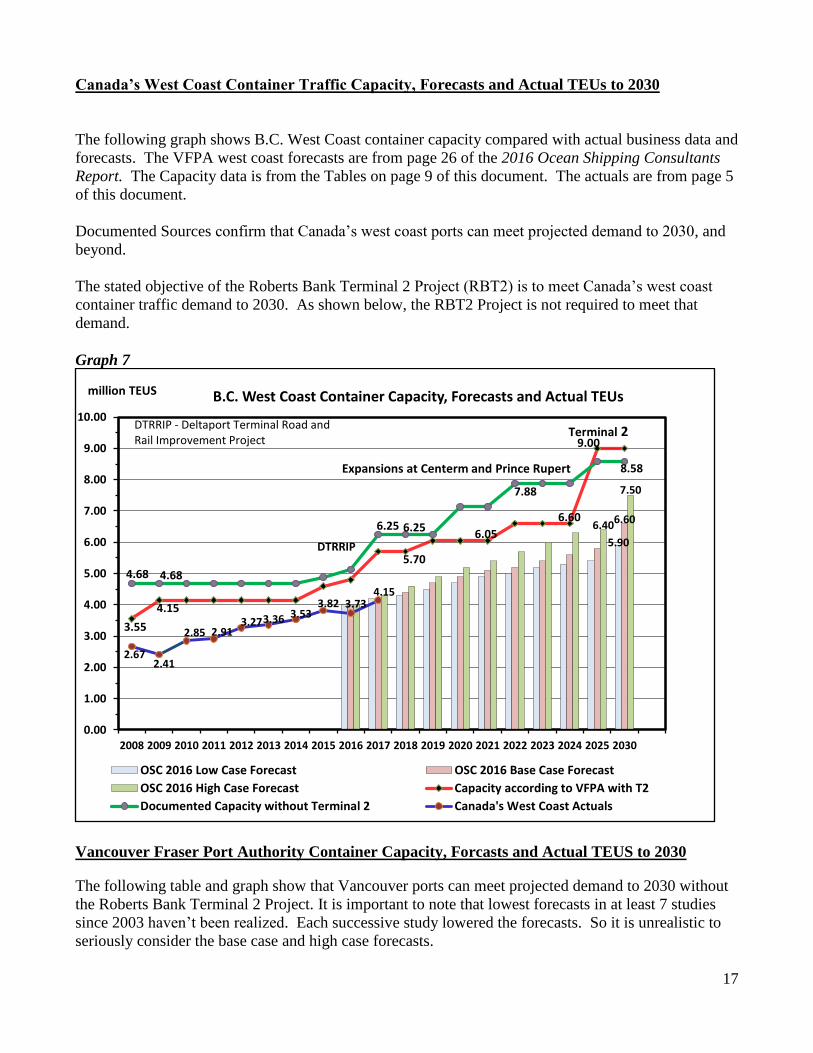
Canada’s West Coast Container Traffic Capacity, Forecasts and Actual TEUs to 2030
The following graph shows B.C. West Coast container capacity compared with actual business data and
forecasts. The VFPA west coast forecasts are from page 26 of the 2016 Ocean Shipping Consultants
Report. The Capacity data is from the Tables on page 9 of this document. The actuals are from page 5
of this document.
Documented Sources confirm that Canada’s west coast ports can meet projected demand to 2030, and
beyond.
The stated objective of the Roberts Bank Terminal 2 Project (RBT2) is to meet Canada’s west coast
container traffic demand to 2030. As shown below, the RBT2 Project is not required to meet that
demand.
Graph 7
Vancouver Fraser Port Authority Container Capacity, Forcasts and Actual TEUS to 2030
The following table and graph show that Vancouver ports can meet projected demand to 2030 without
the Roberts Bank Terminal 2 Project. It is important to note that lowest forecasts in at least 7 studies
since 2003 haven’t been realized. Each successive study lowered the forecasts. So it is unrealistic to
seriously consider the base case and high case forecasts.
5.90
6.60 6.40
7.50
3.55
4.15
5.70
6.05
6.60
9.00
4.68 4.68
6.25 6.25
7.88
8.58
2.67 2.41
2.85 2.91 3.27 3.36 3.53
3.82 3.73 4.15
0.00
1.00
2.00
3.00
4.00
5.00
6.00
7.00
8.00
9.00
10.00
2008 2009 2010 2011 2012 2013 2014 2015 2016 2017 2018 2019 2020 2021 2022 2023 2024 2025 2030
B.C. West Coast Container Capacity, Forecasts and Actual TEUs
OSC 2016 Low Case Forecast OSC 2016 Base Case Forecast
OSC 2016 High Case Forecast Capacity according to VFPA with T2
Documented Capacity without Terminal 2 Canada's West Coast Actuals
Terminal 2
Expansions at Centerm and Prince Rupert
million TEUS
DTRRIP
DTRRIP - Deltaport Terminal Road and Rail Improvement Project

18
Table 8: VFPA Container Business Capacity, Actuals and Forecasts
OSC – Ocean Shipping Consultant Study 2016
Year OSC 2016 Forecast Low Case
OSC 2016 Forecast
Base Case
OSC 2016 Forecast
High Case
Actual Total TEUs
Capacity according to
published information
Capacity according
to Port Vancouver
2011 2.51 2.51 2.51 2.50 4.18 3.65 2012 2.71 2.71 2.71 2.71 4.18 3.65 2013 2.83 2.83 2.83 2.82 4.18 3.65 2014 2.91 2.91 2.91 2.91 4.18 3.65 2015 3.05 3.05 3.05 3.05 4.38 3.85 2016 3.16 3.18 3.19 2.93 4.38 4.05 2017 3.32 3.37 3.44 3.25 4.90 4.25 2018 3.48 3.58 3.69 4.90 4.70 2019 3.64 3.78 3.95 5.20 4.70 2020 3.81 3.99 4.21 5.78 4.70 2021 3.97 4.18 4.45 5.78 4.70 2022 4.13 4.38 4.70 6.08 4.70 2023 4.24 4.52 4.89 6.08 7.10 2024 4.34 4.66 5.09 6.08 7.10 2025 4.45 4.81 5.29 6.08 7.10 2030 4.90 5.48 6.23 6.08 7.10
Graph 8
4.90
5.48
5.09
6.23
2.71 2.82 2.91 3.05 2.93 3.25
4.18
4.90
5.78
6.08 6.08
3.65
4.70
7.10
2.00
2.50
3.00
3.50
4.00
4.50
5.00
5.50
6.00
6.50
7.00
7.50
8.00
2011 2012 2013 2014 2015 2016 2017 2018 2019 2020 2021 2022 2023 2024 2025 2030
Vancouver Fraser Port Authority Container Container Capacity, Actuals and Forecasts
OSC 2016 Low Case Forecasts OSC 2016 Base Case Forecasts OSC 2016 High Case Forecasts
Actual TEUs Documented Capacity without T2 Capacity according to Port
million TEUs
Actual TEUs
Terminal 2
Capacity claimed by VFPA
Documented Capacity Without Terminal 2

19
Container Traffic Imports and Exports at Vancouver Ports
The following information is missing from the Roberts Bank Terminal 2 Environmental Impact
Statement.
Table 9: VFPA Actual and Projected Import and Export TEUs
YEAR Total TEUs
Total Export TEUs
Total Laden
Exports
Total Empty
Exports
Total Import TEUs
Import US
Bound TEUs
Import Canada Bound TEUs
Projected Total
Import TEUs
Projected Import
US Bound TEUs
Projected Import Canada Bound TEUs
2000 1,234,000
622,000
546,165 38,231 507,934 2001 1,202,00
0 596,000
553,981 38,779 515,202
2002 1,565,836
721,000
741,951 96,454 645,497
2003 1,799,881
791,000
752,566 90,308 662,258
2004 1,982,488
840,000
824,783 65,983 758,800
2005 2,140,223
884,000
884,324 44,216 840,108
2006 2,302,000
1,076,000
1,137,307
79,611 1,057,696
2007 2,495,52
2 1,104,00
0 1,301,30
7 91,091 1,210,21
6
2008 2,492,107
1,197,799
915,465 282,334 1,294,308
103,545
1,190,763
2009 2,153,00
0 1,029,61
3 925,411 104,201 1,122,84
9 89,828 1,033,02
1
2010 2,514,309
1,217,364
940,921 276,443 1,296,946
129,694
1,167,252
2011 2,507,03
2 1,186,42
2 999,725 186,697 1,320,61
0 171,67
9 1,148,93
1
2012 2,713,160
1,261,852
1,048,824
213,028 1,451,309
261,236
1,190,073
2013 2,825,47
5 1,317,48
3 1,125,61
9 191,865 1,507,99
2 316,67
8 1,191,31
4
2014 2,912,928
1,356,223
1,045,676
310,547 1,556,678
358,036
1,198,642
2015 3,054,46
7 1,473,62
1 1,066,03
4 407,588 1,580,84
6 379,40
3 1,201,44
3
2016 2,929,585
1,375,447
1,100,686
274,760 1,554,139
357,452
1,196,687
2017 3,252,22
3 1,538,97
3 1,101,64
5 437,328 1,713,25
0 394,04
8 1,319,20
2
2018
1,824,50
0 417,800 1,406,70
0 2019
1,918,60
0 439,400 1,479,20
0 2020
2,013,30
0 461,000 1,552,30
0 2021
2,099,80
0 480,900 1,618,90
0 2022
2,190,10
0 501,500 1,688,60
0 2023
2,260,10
0 517,600 1,726,00
0 2024
2,332,10
0 534,100 1,798,00
0 2025
2,406,30
0 551,000 1,855,30
0 2026
2,482,10
0 568,400 1,913,70
0 2027
2,559,50
0 586,100 1,973,40
0 2028
2,619,10
0 599,800 2,019,30
0 2029
2,679,20
0 613,500 2,065,70
0 2030
2,739,70
0 627,400 2,112,30
0
References: VFPA Statistics; Ocean Shipping Consultants Study 2016, page 220

20
Graph 9
The business of Canadian-bound containers has been relatively flat since 2007. From 2010 to 2017,
Canadian-bound container imports at Vancouver ports grew at a Compound Annual Growth Rate
(CAGR) of 1.76% while U.S. bound imports grew at a CAGR of 17.21%. So the forecasts for
Canada-Bound container traffic are unrealistic when compared to actual TEUs since 2006. A quick glance at the graph above reveals that Vancouver’s recent growth in container traffic imports is
mainly for U.S.-bound containers. The EIS should include a cost/benefit analysis of the Vancouver
Fraser Port Authority handling US-bound container traffic as it is of questionable value to the Canadian
economy. It causes local congestion and pollution in a highly populated area with geographic limits. It
also adds problems to an overloaded railway system. Page 69 of the Ocean Shipping Consultants Study of 2016 states less than 30% of import containers are
for B.C. It appears only 10% to 15 % of container traffic imports are destined for the Vancouver area
so more capacity is not required to meet local demand.
Container Traffic Exports at Vancouver Ports From 2010 to 2017 Vancouver container traffic exports grew at a Compound Annual Growth Rate of
3.1%. Laden exports grew at a CAGR of 2.28% during those 7 years. The Vancouver laden container
export business has been flat for the past 5 years with a CAGR of 1% from 2012 to 2017.
The export of empty containers grew at a CAGR of 6.77% from 2010 to 2017 and at CAGR of 15.47%
from 2012 to 2017.
There has been a decline in the balance of trade in container traffic in Vancouver area ports. Where
there used to be about a 200,000 to 300,000 difference in TEUs between imports and laden exports, the
difference now is 400,000 to 600,000 TEU difference.
0.00
0.25
0.50
0.75
1.00
1.25
1.50
1.75
2.00
2.25
2.50
2.75
3.00
2000 2002 2004 2006 2008 2010 2012 2014 2016 2018 2020 2022 2024 2026 2028 2030
Millions TEUs VFPA - Actual and Projected Import TEUs and Destinations
Import Canada Bound TEUs Import US Bound TEUs
Projected Import Canada Bound TEUs Projected Import US Bound TEUs
Canada Bound
U.S. Bound
Forecast U.S. Bound
Forecast Canada Bound

21
Alternate Means of Carrying Out the Roberts Bank Terminal 2 Project (RBT2)
Section 5.3 The information above (Graphs 4, 6, 7, & 8) demonstrates that alternate means of meeting west coast
container traffic demands are already being carried out, some with financing and permits in place. On page 5-10 of the RBT2 EIS it is stated:
“Additional capacity will be required at both Prince Rupert and PMV container handling facilities to meet long-term forecasted demand for containerized trade-handling capacity on the west coast of B.C. As a result, the Prince Rupert expansions are not an alternative for providing long-term capacity. Accordingly, this alternative will not be subject to further consideration.”xxiv
The Proponent then dismisses the option of west coast container traffic demand being met by
expanding capacity at the Prince Rupert Port Authority. This statement is not supported with evidence.
To the contrary, the information in this document indicates more than sufficient container traffic
capacity to 2030, which is the stated rationale of this EIS. Also, this document provides evidence that
forecasted container traffic demand for Vancouver ports has not been realized in the past 10 years. (Pgs.
3, 4, & 18)
In Table IR1-06-1, Feasibility Analysis for Marine Terminal within British Columbia Alternatives,
under Alternatives Considered, the EIS incorrectly states the Prince Rupert Port Authority cannot
provide long term capacity growth by the mid-20s and it is not a feasible alternate means. As
documented on page 12 of this document:
“The Phase 2B expansion will increase annual throughput capacity at Canada’s second largest container terminal to 1.8 million TEUs (twenty-foot equivalent units) when complete in 2022.”xxv
https://www.rupertport.com/news/releases/fairview-phase-2B-expansion
The Prince Rupert Port Authority offers the deepest harbour in North America which is serviced by the
Canadian National Railway (CN) providing a dedicated intermodal rail connection to the Chicago hub
in less than 100 hours. The port is more than two sailing days closer to Asia and it has cheaper
industrial land available.
In contrast, the Vancouver Fraser Port Authority is located in a congested area with limited land
resources. The port has to compete for railway use and the containers have to be transported through
the challenging, rugged Rocky Mountains.
Due to its success, the Prince Rupert Port Authority was ranked in the top 10 in the Americas category
of the Journal of Commerce 2015 survey of global port productivity.
The Port of Prince Rupert has Valued Ecosystem Components but not on the same scale as Roberts
Bank. The Roberts Bank Terminal 2 Project plans to dredge and fill in 445 acres of waterlot in the
Fraser River estuary, an area of international significance for salmon, migratory birds and resident
orcas. Building at Roberts Bank will cause significant residual adverse environmental effects which
cannot be mitigated or compensated.
The Prince Rupert Port Authority was granted a Port Award by Colliers International in 2013 in
recognition of being the only port in the Pacific Northwest with a direct railway connection (Canadian
National) to the Port of Mobile, the deepest port along the Gulf Coast. The port is also being
recognized by shippers and it has become the fastest growing North American port:

22
“There is nothing that would take us out of Prince Rupert,” said Howard Finkel, executive vice president of Cosco Container Lines Americas and vice president of Cosco Americas. “It’s been a success story for us. Our shippers like it, so I don’t see any changes at all. There may be expanded services into there. We intend to keep our dominant position and we would like to offer this to more shippers.”
(Cosco expects to remain the driving force at Prince Rupert, Journal of Commerce, Peter Tirschwell; March 28,
2016)
This information is missing from the RBT2 EIS.
Also missing is the Report, mentioned on page 8, which advises policy makers to develop container
capacity in Prince Rupert before making investments in Vancouver. The Canadian Ministry of
Transportation is ignoring its own report by three transportation experts.
The EIS presents the Deltaport Terminal as limited to 2.4 TEUs. As explained above, (pages 12-15), the
Deltaport statistics provided by the Port of Vancouver over the past 15 years appear to be skewed when
compared to other published information and data.
The EIS dismisses the Centerm expansion to 1.5 million TEUs stating it cannot meet the long-term
capacity needs. Graphs 6, 7, &8 above clearly show the expansions at Centerm, Vanterm and the Port
of Prince Rupert developing enough container traffic capacity to meet demand to 2030.
On page 5-6 of the EIS, it is stated that it is not feasible to expand Vanterm until sometime after 2030.
This is now inaccurate as Vanterm has announced increased capacity to meet 2030 demand.
The existing Vancouver container terminals are in an untenable position due to the mandate of the
Vancouver Fraser Port Authority (VFPA), commonly known as the Port of Vancouver. The Vancouver
area container port operators are tenants of the VFPA so their leases can be discontinued when they are
due for renewal. In this case, their landlord, the VFPA, wants a new terminal which will create more
competition and more real estate opportunities. The area container port operators are not in a good
position to disagree with the Port of Vancouver.
At Roberts Bank, if Terminal 2 is built, the employees for Global Containers Inc at Deltaport will have
to compete with an adjacent, automated terminal. As forecasted demand is not being realized, jobs will
be lost.
In response to Sufficiency Information Request #06 (IRI-06), the Proponent responded on Page 3:
“Based on the analyses of the location alternatives (see Table IR1-06-1), RBT2 was deemed to be the only viable option to meet the anticipated long-term growth and demand of containerised trade on the west coast of Canada…”,
This conclusion is not supported with credible evidence. Information above proves it is definitely not
the only viable option. Indeed, it is not even a viable option as the costs to build the Project will be
prohibitive.
The demand for containerized trade on Canada’s west coast by 2030 can be met, without the Roberts
Bank Terminal 2 Project, as documented above and summarized in Graphs 4, 6, 7 & 8 of this
document.

23
References
i Roberts Bank Terminal 2 Project – Environmental Impact Statement, Volume 1, Section 1,
Introduction https://www.ceaa-acee.gc.ca/050/documents/p80054/101388E.pdf ii
iii
Container Capacity Expansion Plans at Pacific Coast Ports, Hanam Canada Corporation, January
2007, Page 31/72 https://www.tc.gc.ca/media/documents/policy/tp14710e.pdf
iv Transport Canada, Pacific Coast Container Terminal Competitiveness Study - TP 14837E,
December, 2011, Chapter 4.2 https://tc.gc.ca/eng/policy/report-research-ack-tp14837e-chapter4-1646.htm
v Big money deal for Delta port operator, June 10, 2018
https://www.vitadaily.ca/faq/big-money-deal-for-delta-port-operator-1.23328931 vi
Inland Intermodal Cargo Facility Study for the Corporation of Delta Draft 1.6 August 15, 2014, page
20 of document; scrolled page 29/76
https://delta.civicweb.net/document/111945/F02%20Inland%20Port%20Study.pdf
vii Container Capacity Expansion Plans at Pacific Coast Ports, Hanam Canada Corporation, January
2007, Scrolled page 31/72
https://www.tc.gc.ca/media/documents/policy/tp14710e.pdf
viii
Port Metro Vancouver, Container Capacity Improvement Program
http://www.robertsbankterminal2.com/wp-content/uploads/PMV-Container-Capacity-Improvement-Program-Update-
November-2014.pdf
ix
Fairview Container Terminal website: Phase II North Expansion https://www.rupertport.com/future/fairview-terminal-phase-2
x Port of Prince Rupert Press Release: PORT OF PRINCE RUPERT COMPLETES FAIRVIEW TERMINAL
EXPANSION, August 28, 2017 https://www.rupertport.com/news/releases/fairview-2-expansion
xi Phase of Prince Rupert Fairview Terminal Expansion Unveiled, June 19, 2018 https://www.rupertport.com/news/releases/fairview-phase-2B-expansion
xii
CMA CGM gains slots to Prince Rupert, capping busy year for port, Bill Mongelluzzo, Senior Editor | Nov 19, 2015,
Journal of Commerce
https://www.joc.com/port-news/international-ports/port-prince-rupert/cma-cgm-gains-slots-prince-rupert-
capping-busy-year-port_20151119.html

24
xiii
Cargo up, optimism up for B.C. container terminals
Positive numbers for Centerm, Fairview operator, but outlook for global carriers is mixed
By Timothy Renshaw | February 20, 2018, 8:00am https://biv.com/article/2018/02/cargo-optimism-bc-container-terminals xiv
Pacific Northwest Logistics Patterns: The Port of Prince Rupert as a Successful National Gateway
Strategy; A report prepared for Transportation Northwest (TransNow) University of Washington, Anne V.
Goodchild, PhD Kelly Pitera, MS Susan Albrecht; 2009
pacific northwest logistics patterns: the port of prince rupert ... - ROSA xv
TSI Website: 2005-2006
xvi
Chapter 4.2 of the Transport Canada Pacific Coast Container Terminal Competitiveness Study – TP
14837E, 2011 https://www.tc.gc.ca/eng/policy/report-research-ack-tp14837e-chapter4-1646.htm xvii
Deltaport Third Berth Project, Environmental Assessment Application, Page iv Scrolled p.5/86
https://www.portvancouver.com/wp-content/uploads/2015/03/EA_App_Preface_et_al.pdf
xviii
Deltaport’s new third berth officially opens, January 18, 2010
https://www.portvancouver.com/news-and-media/news/deltaports-new-third-berth-officially-opens-bringing-a-50-
per-cent-increase-in-terminal-capacity/
xix
Deltaport Terminal , Road and Rail Improvement Project, Delta, BC, CEAA Screening, October, 2011
https://www.acee-ceaa.gc.ca/052/details-eng.cfm?pid=64535

25
xx
Projections of Vessel Calls and Movements at Deltaport and Westshore Terminals, Deltaport Terminal Road and Rail
Improvement Project (DTRRIP), November 28, 2011, pages 21&22
http://www.robertsbankterminal2.com/wp-content/uploads/Projections-of-Vessel-Calls-and-Movements-at-Deltaport-and-
Westshore-Terminals.pdf
xxi
Environmental Assessment Report, Deltaport Terminal Road and Rail Improvement Project; Hemmera; November,
2012, bottom of page 276 (Scrolled 299/450)
https://www.portvancouver.com/wp-content/uploads/2015/03/the-environmental-assessment-report.pdf xxii
Evaluation of the Asia-Pacific Gateway and Corridor Initiative and the Gateways and Borders Crossing Fund
Transport Canada, Evaluation and Advisory Services, October 2017, Chart 7.
https://www.tc.gc.ca/eng/corporate-services/evaluation-asia-pacific-gateway-corridor-initiative-borders-crossing-fund.html
xxiii
Inland Intermodal Cargo Facility Study for the Corporation of Delta Draft 1.6 August 15, 2014,
Page 20, Scrolled page 29/76 https://delta.civicweb.net/document/111945/F02%20Inland%20Port%20Study.pdf
xxiv
Roberts Bank Terminal 2 Project, Environmental Impact Assessment, Volume 1, page 5-10
https://www.ceaa-acee.gc.ca/050/documents/p80054/101388E.pdf
xxv Phase of Prince Rupert Fairview Terminal Expansion Unveiled, June 19, 2018 https://www.rupertport.com/news/releases/fairview-phase-2B-expansion