Embed Size (px)
Citation preview

University of Wollongong University of Wollongong
Research Online Research Online
University of Wollongong Thesis Collection 1954-2016 University of Wollongong Thesis Collections
2016
The Relationship between responsible leadership and presenteeism and The Relationship between responsible leadership and presenteeism and
the mediating role of organisational commitment and employee turnover the mediating role of organisational commitment and employee turnover
intentions: an employee perspective intentions: an employee perspective
Md. Amlan Jahid Haque University of Wollongong Follow this and additional works at: https://ro.uow.edu.au/theses
University of Wollongong University of Wollongong
Copyright Warning Copyright Warning
You may print or download ONE copy of this document for the purpose of your own research or study. The University
does not authorise you to copy, communicate or otherwise make available electronically to any other person any
copyright material contained on this site.
You are reminded of the following: This work is copyright. Apart from any use permitted under the Copyright Act
1968, no part of this work may be reproduced by any process, nor may any other exclusive right be exercised,
without the permission of the author. Copyright owners are entitled to take legal action against persons who infringe
their copyright. A reproduction of material that is protected by copyright may be a copyright infringement. A court
may impose penalties and award damages in relation to offences and infringements relating to copyright material.
Higher penalties may apply, and higher damages may be awarded, for offences and infringements involving the
conversion of material into digital or electronic form.
Unless otherwise indicated, the views expressed in this thesis are those of the author and do not necessarily Unless otherwise indicated, the views expressed in this thesis are those of the author and do not necessarily
represent the views of the University of Wollongong. represent the views of the University of Wollongong.
Recommended Citation Recommended Citation Haque, Md. Amlan Jahid, The Relationship between responsible leadership and presenteeism and the mediating role of organisational commitment and employee turnover intentions: an employee perspective, Doctor of Philosophy thesis, School of Management, Operations and Marketing, University of Wollongong, 2016. https://ro.uow.edu.au/theses/4763
Research Online is the open access institutional repository for the University of Wollongong. For further information contact the UOW Library: [email protected]

The School of Management, Operations and Marketing
The Relationship between Responsible Leadership and Presenteeism
and the Mediating Role of Organisational Commitment and
Employee Turnover Intentions: An Employee Perspective
Md. Amlan Jahid Haque
This thesis is presented as part of the requirements for the Award of the Degree of
DOCTOR OF PHILOSOPHY
from
The University of Wollongong
April 2016

i
THESIS CERTIFICATION I, Md. Amlan Jahid Haque, declare that this thesis, submitted in fulfilment of the requirement for the Doctor of Philosophy, in the School of Management, Operations and Marketing (SMOM), University of Wollongong, is wholly my own work unless otherwise referenced or acknowledged. The document has not been submitted for qualifications at any other academic institution. Md. Amlan Jahid Haque 11 April, 2016

ii
ABSTRACT
Despite the promotion of various leadership styles based on leader-follower relationship,
individual competencies, competition and goals, calls have been made for a leadership
approach that is embedded in the often implicit notion of responsibility. Responsible
Leadership (RL) highlights two fields of study: social responsibility and stakeholder
leadership to achieve mutually beneficial business goals. RL presents an attractive and
important integration of research on leadership and corporate social responsibility and offers
the opportunity to provide significant advances in organisational studies. While much has
been studied about social responsibility, less is known about the influence of RL on
employee outcomes, such as presenteeism, organisational commitment and turnover
intentions.
Presenteeism is defined as attending work while being ill and unable to work, at least not at
full capacity. Presenteeism costed the Australian economy $A34.1 billion (2.7% of the
Gross Domestic Product) for 2009-2010 (Medibank, 2011). It is well recognised in both
psychological and occupational-hazard studies but needs further exploration in the context
of organisational leadership. Presenteeism indicates a substantial impact on employees’
productivity and imposes a significant economic burden both on businesses and national
economies. This thesis proposes a structural model and examines the direct influence of RL
on employee outcomes, including presenteeism, organisational commitment and turnover
intentions. It also examines the mediating roles of both organisational commitment and
employee turnover intentions on the relationship between RL and presenteeism.
The proposed model was tested using a heterogeneous sample of employees from various
Australian industry sectors. A web-based survey was mailed to 3500 employees and 323
responses were collected to confirm 200 complete responses. A total of 123 responses were
incomplete and were therefore excluded from the findings, resulting in an overall response
rate of 9.2%. Participants responded to scales measuring responsible leadership,
presenteeism, organisational commitment and turnover intentions.

iii
Eight hypotheses were developed to examine the thesis aims. Structural equation modelling
(SEM) was used to test the proposed hypotheses. The results of SEM provided support for
eight hypotheses. The significant findings of the study were threefold. First, RL behaviours
were negatively and significantly related to both presenteeism and employee turnover
intentions in workplaces among Australian employees. The results suggest that when
employees perceive their leaders to be responsible, there is greater likelihood that employees
will exhibit lower presenteeism and turnover intentions at work. Second, RL was also
positively and significantly related to organisational commitment. This result suggest that
RL has a significant and positive influence on employees’ emotional attachments to their
organisations (affective commitment) and the individual personal values (normative
commitment) than their costs of resigning, such as losing attractive benefits or seniority
(continuance commitment). Third, the results support the hypotheses that organisational
commitment and employee turnover intentions partially mediate the relationship between
RL and presenteeism. The results suggest that both organisational commitment and
employees’ turnover intentions reduce the total influence of RL on presenteeism.
The findings of this thesis provide valuable insights by corroborating and extending theory
and research in several ways. First, the study is one of the first reported studies to test the
direct and indirect relationship between RL and presenteeism with an Australian sample.
Second, it empirically tests an underexplored assumption of RL theory by examining the
influence of RL on employee outcomes including organisational commitment, employee
turnover intentions and presenteeism. Third, the proposed model in this thesis is one of the
first to examine how and why RL influences presenteeism by integrating two mediators,
organisational commitment and employee turnover intentions. Fourth, several implications
for practice can be highlighted including designing employee training programs to promote
RL skills among managers, recognising presenteeism, incorporating organisational strategies
to recover losses from presenteeism, and encouraging managers to enhance organisational
commitment and reduce employee turnover intentions in organisations. In conclusion,
limitations of the study are presented along with recommendations for future research.

iv
PUBLICATIONS FROM THIS RESEARCH
Haque, A., Fernando, M. & Caputi, P. (2015), ‘The mediating role of employee turnover intentions on the relationship between HR practices and presenteeism: Evidence from Australian employees’, 29thAustralian and New Zealand Academy of Management Conference. Queenstown, New Zealand: ANZAM. Haque, A., Fernando, M. & Caputi, P. (2015), ‘The relationship between responsible leadership and organisational commitment and the mediating effect of turnover intentions: An empirical study with Australian employees’, APROS (Asia Pacific Researchers in Organisation Studies) and EGOS (European Group for Organisational Studies) Conference. University of Technology, Sydney, Australia: APROS/EGOS. Haque, A., Fernando, M. & Caputi, P. (2014), ‘A conceptual framework for understanding responsible leadership and presenteeism: The mediating influence of organisational commitment and employee turnover intentions’, 28th Australian and New Zealand Academy of Management Conference. University of Technology, Sydney, Australia: ANZAM. Haque, A., Fernando, M. & Caputi, P. ‘The relationship between responsible leadership and organisational commitment and the mediating effect of employee turnover intentions: An empirical study with Australian employees’, (Work in progress). Target: Journal of Business Ethics Haque, A., Fernando, M. & Caputi, P. ‘The mediating role of employee turnover intentions on the relationship between HR practices and presenteeism: Evidence from Australian employees’, (Work in progress). Target: International Journal of Human Resource Management Haque, A., Fernando, M. & Caputi, P. ‘A conceptual framework for understanding responsible leadership and presenteeism: The mediating influence of organisational commitment and employee turnover intentions’, (Work in progress). Target: Leadership and Organisation Development Journal

v
ACKNOWLEDGEMENTS
Special thanks to many people without whom this thesis would not have been completed:
First and foremost, I was fortunate to have Associate Professor Mario Fernando as my
primary supervisor. His constant support, determination, academic excellence, high
standards and values, and care made it possible for me to complete this journey.
I am also extremely grateful to my co-supervisor Associate Professor Peter Caputi for his
direction, encouragement and valuable support during the completion of this thesis. I am
indebted to Peter for sharing his knowledge with me and deeply appreciate all his efforts to
help me to succeed.
My gratitude goes to Dr. Celeste Rossetto for her excellent mentorship. I have learned a
great deal from her insights and wisdom.
My special thanks go to my wife, Abbey, for her patience, devotion, support, and
encouragement that she gave me during this journey; to my adorable daughter, Riddhi, who
is the ultimate source of happiness in my life and gave me the energy to strive even harder.
I would like to thank all my teachers, relatives, and friends for their unconditional support
and encouragement.
Last but not least, this thesis is dedicated to my mother, Shahara Haque and especially to be
in memory of my deceased father, Associate Professor A. M. M. Jahidul Haque, Department
of Political Science, Rajshahi University, Bangladesh. I would not be standing in this place
today without their love and sacrifices. Thanks to all of you that I named and to all that I did
not take the time to name from the bottom of my heart.

vi
TABLE OF CONTENTS
ABSTRACT ............................................................................................................................. ii
PUBLICATIONS FROM THIS RESEARCH ....................................................................... iv
ACKNOWLEDGEMENTS ..................................................................................................... v
TABLE OF CONTENTS ........................................................................................................ vi
LIST OF FIGURES ................................................................................................................ xi
LIST OF TABLES ................................................................................................................ xiii
1. INTRODUCTION AND OVERVIEW ............................................................................. 14
1.1 Introduction ................................................................................................................ 14
1.2 Theoretical significance of responsible leadership (RL) ........................................... 14
1.3 Practical significance of RL ....................................................................................... 17
1.4 The significance of presenteeism ............................................................................... 19
1.5 Statement of the problem ........................................................................................... 20
1.6 Purpose of the study ................................................................................................... 23
1.7 Research questions and hypotheses ........................................................................... 24
1.8 Significance of the study ............................................................................................ 26
1.9 Structure of the Thesis ............................................................................................... 31
2. LITERATURE REVIEW .................................................................................................. 33
2.1 Introduction .................................................................................................................. 33
2.2 Evolution of leadership theories .................................................................................. 33
2.3 Responsible leadership (RL) ........................................................................................ 44
2.3.1 RL from organisational and individual perspectives ............................................ 46
2.3.2 RL in social and stakeholder perspectives ............................................................ 47
2.3.3 RL in a global perspective .................................................................................... 49
2.4 Framing RL with other value-centered leadership theories ......................................... 52
2.4.1 Transformational leadership and RL .................................................................... 53
2.4.2 Ethical leadership and RL ..................................................................................... 54
2.4.3 Servant leadership and RL .................................................................................... 55
2.4.4 Authentic leadership and RL ................................................................................ 56
2.5 RL and organisational performance ............................................................................. 58
2.6 Presenteeism ................................................................................................................ 64
2.6.1 Absenteeism vs. presenteeism .............................................................................. 66

vii
2.6.2 Types of presenteeism........................................................................................... 67
2.6.3 Causes of presenteeism ......................................................................................... 68
2.6.4 Cost of presenteeism ............................................................................................. 72
2.7 Presenteeism and workforce productivity .................................................................... 73
2.8 Organisational commitment ......................................................................................... 75
2.8.1 Definitions of organisational commitment ........................................................... 76
2.8.2 Attitudinal approach to organisational commitment............................................. 77
2.8.3 Behavioural approach to organisational commitment .......................................... 78
2.8.4 Components of organisational commitment ......................................................... 78
2.8.5 Three-component model of organisational commitment ...................................... 79
2.9 Overcommitment ......................................................................................................... 82
2.9.1 Effort-reward imbalance and overcommitment interaction .................................. 83
2.9.2 Overcommitment and presenteeism ...................................................................... 84
2.10 Employee turnover intentions .................................................................................... 85
2.10.1 From employee turnover intentions to turnover ................................................. 86
2.10.2 Factors affecting turnover intentions .................................................................. 87
2.11 Chapter summary ....................................................................................................... 89
3. HYPOTHESES DEVELOPMENT ................................................................................... 91
3.1 Introduction .................................................................................................................. 91
3.2 RL and presenteeism .................................................................................................... 91
3.3 RL and organisational commitment ............................................................................. 94
3.4 RL and employee turnover intentions .......................................................................... 97
3.5 Organisational commitment and employee turnover intentions .................................. 99
3.6 Organisational commitment and presenteeism .......................................................... 101
3.7 Employee turnover intentions and presenteeism ....................................................... 102
3.8 The mediating role of organisational commitment and employee turnover intentions
on the relationship between RL and presenteeism ..................................................... 104
3.8.1 The mediating role of organisational commitment on the relationship between RL
and presenteeism ................................................................................................. 104
3.8.2 The mediating role of employee turnover intentions on the relationship between
RL and presenteeism ........................................................................................... 107
3.9 Chapter summary ....................................................................................................... 109

viii
4. METHODOLOGY .......................................................................................................... 111
4.1 Introduction ................................................................................................................ 111
4.2 Study model and proposed hypotheses ...................................................................... 111
4.3 Overview of the research design ................................................................................ 112
4.3.1 Explanatory research design: hypothesis-testing ................................................ 113
4.3.2 Designs for hypothesis testing: correlational design .......................................... 114
4.3.3 Quantitative research .......................................................................................... 114
4.3.4 Deductive reasoning............................................................................................ 116
4.3.5 Survey design ...................................................................................................... 117
4.4 Participants: The sample population .......................................................................... 118
4.4.1 The sampling design: Identifying the target population and sampling frame .... 118
4.4.2 The sampling method and the procedures for locating participants ................... 119
4.4.3 Determining the sample size ............................................................................... 120
4.5 Profile of the selected sample .................................................................................... 121
4.6 Measures (survey instruments) .................................................................................. 125
4.6.1 Perceived responsible leadership ........................................................................ 125
4.6.2 Presenteeism ....................................................................................................... 126
4.6.3 Organisational commitment ................................................................................ 127
4.7 Procedure for data collection ..................................................................................... 129
4.8 Procedure for data analysis ........................................................................................ 131
4.8.1 Preliminary analysis ............................................................................................ 131
4.8.2 SEM: the two-step modelling approach .............................................................. 131
4.8.3 Hypothesis testing ............................................................................................... 133
4.9 Chapter summary ....................................................................................................... 136
5. ANALYSIS AND FINDINGS ........................................................................................ 137
5.1 Introduction ................................................................................................................ 137
5.2 Fundamentals of structural equation modeling .......................................................... 137
5.2.1 What is SEM? ..................................................................................................... 138
5.2.2 Key characteristics of SEM ................................................................................ 139
5.2.3 Strategies for model testing in SEM ................................................................... 139
5.3 Four stages for testing a model in SEM ..................................................................... 141
5.3.1 Model specification ............................................................................................. 141
5.3.2 Model estimation stage ....................................................................................... 142
ix
5.3.3 Model evaluation (model fit) stage ..................................................................... 143
5.3.4 Model modification stage ................................................................................... 148
5.4 Correlations among unobserved variables for testing the structural model ............... 150
5.5 Assumptions for violation before hypotheses testing in SEM ................................... 152
5.6 Sample size for SEM: adequate sample size in SEM ................................................ 153
5.6.1 Sample-size issues in SEM ................................................................................. 153
5.6.2 The level of model complexity ........................................................................... 155
5.6.3 Missing data ........................................................................................................ 155
5.7 Multivariate normality ............................................................................................... 155
5.8 First-stage analysis of two-stage modelling approach ............................................... 157
5.8.1 The measurement scale of responsible leadership (RL) ..................................... 158
5.8.2 The measurement scale of organisational commitment ...................................... 162
5.8.3 The measurement scale of employee turnover intentions ................................... 169
5.8.4 The measurement scale of presenteeism ............................................................. 171
5.9 Second stage: estimate the structural model .............................................................. 175
5.10 Hypothesis testing .................................................................................................... 177
5.10.1 Hypothesis testing of direct relationships: hypotheses H1-H6 .......................... 177
5.10.2 Testing of simple mediation hypothesis: hypothesis H7 and H8 ....................... 178
5.11 Chapter summary ..................................................................................................... 181
6. DISCUSSION AND CONCLUSION.............................................................................. 183
6.1 Introduction ................................................................................................................ 183
6.2 General overview of the thesis ................................................................................... 183
6.3 Discussion of findings................................................................................................ 184
6.3.1 Perceived RL and presenteeism .......................................................................... 184
6.3.2 Perceived RL and organisational commitment ................................................... 185
6.3.3 Perceived RL and employee turnover intentions ................................................ 186
6.3.4 Organisational commitment and employee turnover intentions ......................... 187
6.3.5 Organisational commitment and presenteeism ................................................... 187
6.3.6 Employee turnover intentions and presenteeism ................................................ 188
6.3.7 The mediating influence of organisational commitment on the association
between RL and presenteeism ............................................................................ 189
6.4 Theoretical contributions ........................................................................................... 191
6.5 Methodological contributions .................................................................................... 195

x
6.6 Practical implications ................................................................................................. 196
6.6.1 Conducting training programs to promote and develop RL for organisational
leadership. ........................................................................................................... 196
6.6.2 Recognising presenteeism and implementing organisational strategies to recover
losses from it ....................................................................................................... 198
6.7 Limitations of the study ............................................................................................. 202
6.8 Recommendations for future research ....................................................................... 205
6.9 Concluding remarks ................................................................................................... 208
REFERENCES .................................................................................................................... 210
APPENDIX A: University of Wollongong Human Resource Ethics Report, Study Invitation
Letter and Online Survey ........................................................................... 267
APPENDIX A-1: University of Wollongong Human Resource Ethics Report ................... 268
APPENDIX A-2: Invitation Letter ...................................................................................... 269
APPENDIX A-3: Online Survey ......................................................................................... 271
APPENDIX B: The Assumptions of Violation for Testing Direct and Indirect Influences of
the Hypotheses ............................................................................................ 279
APPENDIX C: Further Secondary Analysis of the Variables Examined in this Study ...... 283

xi
LIST OF FIGURES
Figure 1.1: The relational model between perceived RL and presenteeism with the
mediating role of organisational commitment and employee turnover
intentions ............................................................................................................ 24
Figure 3.1: Hypothesised model proposing the direct and mediational relationship between
RL, organisational commitment and presenteeism .......................................... 106
Figure 3.2: Hypothesised model proposing the direct and mediational relationship between
RL, employee turnover intentions and presenteeism ....................................... 108
Figure 4.1: The proposed structural model and hypotheses ............................................... 111
Figure 4.2: Deductive approach of this study ..................................................................... 117
Figure 5.1: Confirmatory factor analysis (CFA) for the measurement model of RL ......... 160
Figure 5.2: Illustration of CFA for the measurement model of organisational commitment
with the modification indices ........................................................................... 165
Figure 5.3: The final (modified) models of CFA for the measurement model of OC with the
modification indices ......................................................................................... 167
Figure 5.4: Illustration for CFA for the measurement model of presenteeism (SPS-6) with
modification of the following indices .............................................................. 173
Figure 5.5: The final (modified) model of CFA for the measurement model of SPS-6 with
the modification indices ................................................................................... 174
Figure 5.6: The results of the β estimates of the relationship between unobserved variables,
R2 values and loadings for the structural model .............................................. 176
Figure 5.7: Simple mediation relationship .......................................................................... 179
Figure 5.8: The β estimates of specific indirect and total indirect effects to assess H7 ...... 179
Figure 5.9: The β estimates of specific indirect and total indirect effects to assess H8 ...... 180
Figure B-1: Histogram of independent variables with presenteeism .................................. 281
Figure B-2: Scatter plots of independent variables with presenteeism ............................... 282
Figure B-3: Results of P-P plots of independent variables with presenteeism ................... 282
Figure C-1: β estimates of the relationship between RL and the subscales of presenteeism
(work process and work outcomes). ............................................................... 284
Figure C-2: β estimates of the relationship between RL and the subscales of OC: affective,
continuance & normative commitment ........................................................... 285

xii
Figure C-3: The results of β estimates of the relationship between three components of
OC and employee turnover intentions. ........................................................... 286
Figure C-4: β estimates of the relationship among affective, continuance, and normative
commitment and presenteeism ........................................................................ 287

xiii
LIST OF TABLES
Table 2.1: Evolution of leadership theories .......................................................................... 42
Table 2.2: Scholarly contributions to RL literature .............................................................. 50
Table 2.3: Summary of key empirical findings relevant to this study .................................. 61
Table 2.4: Summary of the causes of presenteeism .............................................................. 71
Table 4.1: Demographic profile of participants .................................................................. 121
Table 5.1: Summary of the selected indices and recommended thresholds........................ 147
Table 5.2: Correlation matrix among unobserved and demographic variables .................. 151
Table 5.3: Test of multivariate normality- skewness and kurtosis statistics ....................... 156
Table 5.4: Descriptive statistics of the perceived RL scale ................................................ 158
Table 5.5: The results of first-order CFA Analysis of the perceived RL measurement
scale.................................................................................................................... 161
Table 5.6: Descriptive statistics of the perceived organisational commitment scale .......... 163
Table 5.7: Results of CFA for organisational commitment after modification .................. 168
Table 5.8: Descriptive statistics of the employee turnover intentions scale ....................... 169
Table 5.9: The results of first-order CFA analysis of employee turnover intentions scale 171
Table 5.10: Descriptive statistics of the presenteeism scale ............................................... 171
Table 5.11: The results of the CFA analysis of presenteeism scale after modification ...... 175
Table A-1: Questions for the scale of RL ........................................................................... 274
Table A-2: Questions for the scale of presenteeism ........................................................... 276
Table A-3: Questions for the scale of employee turnover intentions ................................. 277
Table A-3: Questions for the scale of employee turnover intentions ................................. 278
Table B1: Results of Shapiro-Wilk test to assess normality ............................................... 280
Table B2: TOL and VIF values of the relationship between RL, organisational commitment,
and employee turnover intentions with the dependent variable ......................... 281
Table C-1: Correlation matrix among the three components of organisational commitment
and employee turnover intentions ...................................................................... 288
Table C-2: Correlation matrix among the three components of organisational commitment
and presenteeism ................................................................................................ 288

14
1 INTRODUCTION AND OVERVIEW
1.1 Introduction
This chapter explains the overall purpose and the significance of the Ph.D. thesis and
introduces responsible leadership (RL), organisational commitment, employee turnover
intentions and presenteeism. This study has two specific aims: to examine the influence of
perceived RL on presenteeism, organisational commitment and employee turnover intentions
with a structural model; and to explore the mediation of organisational commitment and
employee turnover intentions on the relationship between perceived RL and presenteeism.
The notion of organisational leadership has been used in numerous contexts within
organisational studies and expressed at individual, group and managerial levels. Section 1.2 of
this chapter outlines the importance of RL in the current organisational leadership context.
This chapter then explains the significance of presenteeism followed by the statement of the
problem. Thereafter, this chapter presents the research questions and hypotheses, and outlines
the significance and contributions of the thesis. Finally, the last section provides a general
overview of the remaining chapters.
1.2 Theoretical significance of responsible leadership (RL)
As an interdisciplinary concept, RL attracts attention from scholars and researchers from
diverse fields such as organisational behaviour, human resource management (HRM),
psychology, philosophy, corporate governance, strategy, law, sociology, political science,
marketing, business ethics and sustainability (Siegel, 2014). Although the notion of RL is
relatively new in the literature, it shows an important theoretical significance for
organisational leadership.
First, several researchers acknowledge that RL inherently intersects the individual, group and
organisational levels for its leadership outcomes. The concept of RL integrates two specific
fields of study: social responsibility and leadership. Much has been written about social
responsibility in the literature and its relationship with organisational financial outcomes
(Orlitzky et al., 2003), but more investigation is required into both employee and
organisational outcomes. Moreover, RL helps an organisation attain group, organisational,

15
and societal goals to continually function ethically and socially responsibly within its business
community (Phillips & Freeman, 2003; Doh et al., 2011; Voegtlin et al., 2012). Hence, RL
integrates both the micro and macro-based literature on social responsibility and considers
leadership as a process or method of inclusion to achieve individual, group, organisational
and societal goals.
Second, Waldman and Galvin (2008) identified that the notion of responsibility is missing
from current leadership practices, which include transformational, charismatic, authentic,
participative, servant, ethical, shared, and spiritual leadership. RL encourages leaders to lead
in a way that is responsible towards the environment, society, business organisations and
stakeholders (Maritz et al., 2011). Hence, RL delimits contemporary leadership practices and
establishes explicitly what ‘responsibility’ implies in leadership. It also suggests that leaders
lead in business environments where they may have decreasing legitimacy and trust because
of unethical acts in various forms (Maak & Pless, 2006a). RL is defined as a social and
relational phenomenon (Pless & Maak, 2011), and the literature of RL signifies the leadership
role in several ways. First, RL extends the relationship between leader and followers toward a
broader scope for its social and global business outcomes (Maak & Pless, 2006b). Second, RL
recognises the normative dimensions as in ethical or moral obligations underlying the
relationship between leaders and their stakeholders (Donaldson & Preston, 1995; Freeman et
al., 2007). It suggests that leaders be responsible so that they can be effective leaders
(Waldman & Galvin, 2008). Third, RL offers a more balanced approach towards the
stakeholder relationship by shaping leaders as facilitators for relational processes that result in
stronger leader-stakeholder relationships (Maak & Pless, 2006). Hence, the theoretical
development of RL creates a culture of inclusion between organisations and societies by
building a solid moral ground for responsible businesses (Pless & Maak, 2004; Avery &
Baker, 1990).
Third, the stakeholder theory influences RL (Pless & Maak, 2011). It is a theory of
organisational management and business ethics that addresses morals and values in both
managing and leading organisations (Freeman, 1984). Stakeholder theory is significant, as it
suggests the needs to balance multiple stakeholder entities and guide leaders to achieve an
ideal level of harmonisation to meet stakeholder expectations (Waldman & Balven, 2015;
Stahl & Luque, 2014). Doh and Quigley (2014) considered the individual, group and

16
organisational levels of RL as supporting stakeholder theory at four discrete levels. First, at
the micro or individual level, responsible leaders consider followers as significant
stakeholders and attempt to influence the stakeholders’ motivation and creativity (Zhang &
Bartol, 2010). Second, at the group or team level, responsible leaders influence and encourage
teams to value diverse perspectives toward other stakeholders. Here, leaders provide both
team-level psychological support and learning for team performance; these also influence
improved decision-making within organisations (Stasser & Titus, 1985; Edmondson, 1999).
Third, at the organisational level, responsible leaders help to build an open, inclusive and
diverse internal culture by sharing and disseminating knowledge. They also foster strong ties
with external stakeholders that lead organisations toward growth, innovation and superior
employee performance (Thomas, 2004). Lastly, at the societal level where responsible leaders
lead across cultural boundaries to harmonise both the internal and external stakeholders. Here,
they anticipate and recognise both the socio-economic challenges and opportunities to act
more responsibly (Miska et al., 2013; Stahl et al., 2013). Hence, RL shows its theoretical
significance in the furthering of stakeholder theory to meet stakeholder expectations for
organisations’ internal as well as external customers.
Fourth, Mirvis et al. (2010) focused on the holistic view of leadership and considered RL to
be a function of the individual leader (the ‘Me’), of responsible organisations (the ‘We’), and
of responsible business in the larger ecosystem of investors, consumers, competitors,
regulators and other interests (the ‘Us’) that provide a context to act responsibly for legitimate
and sustainable business leadership. While the notion of RL does not claim that most leaders
are irresponsible, it does assert that because of various corporate scandals (such as Enron,
HIH and WorldCom), managers are increasingly held accountable for their leadership roles to
their organisations’ multiple stakeholders and society as a whole. Hence, the literature of RL
comprises supporting trustful relationships with all stakeholders and incorporates responsible
actions to achieve a meaningful and common business vision (Maak & Pless, 2006a, 2006b;
Pless, 2007). Hence, the literature of RL is significant for these relationships to establish a
sense of justice, recognition, care and responsibility for a broader range of organisational and
social outcomes.
Finally, the current literature of organisational leadership integrates the perspectives of both
ethical and stakeholder theories to compare the RL literature with other leadership practices

17
(Doh & Stumpf, 2005; Pless et al., 2012; Voegtlin et al., 2012; Miska et al., 2013; Doh &
Quigley, 2014). The stakeholder reflection for RL emerged because of current world issues,
such as the global financial crisis, environmental catastrophes, corporate scandals, and
globalisation. The stakeholder theory is described as:
...the assumption that values are necessarily and explicitly a part of doing business. It
asks managers to articulate the shared sense of the value they create, and what brings
its core stakeholders together. It also pushes managers to be clear about how they
want to do business, specifically what kinds of relationships they want and need to
create with their stakeholders to deliver on their purpose (Freeman et al., 2004,
p. 364).
Hence, RL is theoretically grounded on stakeholder theory and promotes organisational
leadership with moral awareness and accountability for societal and global concerns. In
contrast, Lynham and Chermack (2006) suggested an integrative framework of leadership,
which they termed Responsible Leadership for Performance (RLP), and acknowledged the
influence of RL on organisational performance. The consequences of RL for employee
productivity and organisational performance have been well acknowledged, but studies
exploring its predictors and outcomes are not enough. Researchers have recommended that
despite the potential to shed light on some aspects of leadership at work, research on RL is
still in a developing stage (Waldman & Balven, 2015). Therefore, the notion of RL has the
potential to expand the current leadership literature by developing and extending the influence
of RL on employee outcomes. This study will examine the interactions between selected
employee outcomes and RL that either have not been addressed or require further attention.
Therefore, this thesis will contribute to the literature by offering evidence that leaders should
be more attentive to and sincere in their practice of RL for desirable organisational leadership
outcomes.
1.3 Practical significance of RL
RL is rare in leadership practices where the idea of responsibility is more generally
considered to mean ‘being able to respond’ by using capability and exercising accountability
(Brown, 1986; Salancik & Meindl, 1984). This view of responsibility specifies individuals’

18
inclination to respond in an acceptable manner to a particular situation. The role of
appropriateness is significant to leaders, as it associates responsible actions with what is
correct, ethical or favourable, and suggest that acting responsibly means aiming for the greater
good (Walsh et al., 2003). RL not only includes the notion of responsibility, it also shows the
potential to generate practical leadership outcomes (Burns, 1978; Yukl et al., 2002). Several
researchers have suggested applying RL for maximising employee performance and achieving
both organisational and societal goals (Doh et al., 2011; Waldman & Siegel, 2008; Pless et al.,
2012; Miska et al., 2013; Stahl et al., 2013; Voegtlin et al., 2012 ). In addition to its
theoretical contribution, the notion of RL has significant practical outcomes. Pless and Maak
(2011) noted, “Responsible leadership responds to both existing gaps in leadership theory and
the practical challenges facing leadership” (p. 4). In the current study, the practical
significance of RL is as follows.
First, severe ethical lapses and failures of several well-known corporations have raised
questions about current organisational leadership practices (Manz et al., 2008; Stahl & de
Luque, 2014). For example, corporate collapses (such as Enron, HIH and WorldCom),
product recalls (such as those from Volkswagen and Toyota), and corporate excesses (such as
Exxon-Valdez) have emphasised demands for organisational leadership to display
accountability and morality. As a result, organisations are increasingly challenged to execute
leadership skills with a better sense of responsibility towards all stakeholders and to
demonstrate RL in practice.
Second, in addition to various corporate scandals and collapses, there is a growing public
demand to solve some of the social and global issues to which leaders are expected to respond
(Pless et al., 2011; Maak & Pless, 2006a). Various stakeholders, particularly those who are
socially neglected and excluded, have become more critical and want to be involved in
dialogue for corporate responsibility (Mària & Lozano, 2010). In this situation, leaders need
to cope with the new pressure to compel stakeholders to support their organisations
(Schneider, 2002). Hence, scholars proposed to explore the characteristics, competencies, and
other properties that promote RL, and that thus may prevent leadership scandals and ethical
misconducts. For example, responsible leaders may act as “agents of world benefit” (Maak &
Pless, 2009, p. 540) and may help to not repeat scandals; rather, they may aim to solve future
global and ecological issues. Researchers have suggested that RL contributes to improve life

19
in the community by proactively including different stakeholders in beneficial engagements
and by adhering to a socially responsible code of conduct (Mària & Lozano, 2010; Voegtlin,
2011; Yunus et al., 2010).
Third, the concept of RL links corporate social responsibility (CSR) with stakeholder theory
(Stahl & De Luque, 2014). Hence, RL encourages organisations to go beyond economic
interests and promote CSR by extending the stakeholder perspective to include their
organisational missions, expectations about corporate responsibility to society and leaders’
own moral values (Morgeson et al., 2013; Waldman & Siegel, 2008; Phillips et al., 2003).
Finally, RL is generating a considerable amount of interest among practitioners because of its
influence on organisational phenomena such as, employee commitment, employee
performance, turnover intentions and organisational effectiveness (Doh et al., 2011; Pless et
al., 2012; Doh & Quigley, 2014). Although the concept of RL has been shown to have
potential for increasing organisational performance (Waldman & Siegel, 2008; Pless et al.,
2012; Miska et al., 2013; Stahl et al., 2013; Voegtlin et al., 2012), there is limited practical
evidence showing the influence of RL on both employee and organisational performance
outcomes (Morgeson et al., 2013; Christensen et al., 2014; Doh & Quigley, 2014). Hence,
further studies to establish the links between RL and organisational outcomes can be
significant. These findings will present arguments for organisations to invest in RL-
development platforms and to ensure that their businesses become responsible within their
communities.
1.4 The significance of presenteeism
Presenteeism – defined as attending work while being ill and unable to work, at least not at
full capacity (Aronsson et al., 2000; Johns, 2010; Brooks et al., 2010; Lack, 2011) – is well
recognised in both psychological and occupational-hazard studies. However, it needs further
exploration in the context of organisational leadership. Researchers have shown that
presenteeism is more costly to organisations than sickness absence, and reducing employee
productivity (Hemp, 2004; Schultz & Edington, 2007; Johns, 2010; Scuffham et al., 2014).
Researchers have suggested several effects of presenteeism to demonstrate its importance in
organisational studies. First, employees with health conditions may include those who would

20
like to take time off, but are unable to because of a variety of reasons, such as job security,
poor sick pay, peer pressure, increased workloads or fear of disciplinary action (Aronsson et
al., 2000; Lowe, 2002; Biron et al., 2006). Second, presenteeism affects employees’
productivity when they are enforced to continue work because of demands from their
employers (Dew et al., 2005; Johns, 2007; Aronsson et al., 2000; Hemp, 2004; Quazi, 2013).
Third, presenteeism not only affects employees’ productivity but also causes lack of
engagement and commitment, boredom, poor workplace relationships and work-life conflict
(Johns, 2010; Pilette, 2005; Grinyer & Singleton, 2000; Duxbury & Higgins, 2001; Caverley
et al., 2007). As a consequence, presenteeism worsen employees’ health, make accidents more
likely, reduce their productivity and reduce their motivation to work effectively (Aronsson et
al., 2000; Hemp, 2004; Johns, 2010; Pilette, 2005). Hence, from an HRM perspective,
presenteeism can adversely affect both employees’ productivity and organisational
performance (Aronsson & Gustafsson, 2005; Hemp, 2004; Scuffham et al., 2014).
1.5 Statement of the problem
Employee productivity has become a critical success factor for organisations’ sustainable
competitive performance. Managers are aware of the impact of absenteeism, but recently,
presenteeism has also drawn attention for its significant impact on employee productivity and
the significant economic burden it imposes on businesses and overall economies. The cost of
presenteeism remains invisible as organisations focus only on the direct health-care costs of
absenteeism (Wright et al., 2002).
Several published studies have examined the role of organisational leadership on employee
well-being. How leaders are perceived by employees to inhabit their role influences the
employees’ psychological and physical well-being. Research suggests that the role of
leadership is significant for understanding employees’ psychological and physical health, and,
consequently, its effects on their sickness absence (absence because of health conditions). To
date, however, presenteeism has not been extensively examined (Nyberg et al., 2008; Nyberg
et al., 2009; Kelloway & Barling, 2010; Scuffham et al., 2014). Moreover, there is abundant
evidence for an association between employees’ perceptions of how their leaders are and
behave and the soundness of the employees’ psychological and physical health (Gilbreath &
Benson, 2004; Offerman & Hellman, 1996; Seltzer & Numerof, 1988). Similarly, researchers

21
indicate that different styles of leadership practices have different levels of relationships
between presenteeism and employees’ perception about leadership influences (Nyberg et al.,
2008; Stordeur et al., 2001; Sosik & Godshalk, 2001; Tepper, 2000). The majority of research
has been conducted within the literature of organisational leadership which suggests that
leadership is important to the extent that it is not only associated with employees’ attitudes,
performance and motivation, but also essential for their personal and social well-being
(Nyberg et al., 2008; Stordeur et al., 2001; Sosik & Godshalk, 2001; Tepper, 2000). Aronsson
et al. (2000) argued that employees have significantly enhanced the risk of being at work
when ill if explicitly or implicitly pressured by managers; this suggests a relationship between
leadership and presenteeism. Similarly, Aronsson and Gustafsson (2005) studied the
antecedents of presenteeism and found several work-related and personal factors, such as staff
replacement, time pressure, insufficient resources or financial stresses, influence
presenteeism. Nyberg et al. (2008) argued that leadership influences the pattern of
presenteeism outcomes. Although several studies have examined various leadership
influences on presenteeism (Arnold et al., 2007; van Dierendonck et al., 2004; Nyberg et al.,
2008; Ensley et al., 2006; Skogstad et al., 2007; Nielsen et al., 2008), none have yet
investigated presenteeism’s links to perceived RL.
Organisations often strive to understand how employees can be managed for sustainable
competitive advantage. Researchers have emphasised the role of HRM as a means of
managing human and social capital for greater competitive advantages. According to Youndt
et al. (2004), both HR investment and development have a significant role in creating human
capital for competitive performance. Human capital is defined as the knowledge, skills and
abilities (KSA) residing with and used by individuals (Wright et al., 1994). Improved human
capital can potentially provide a competitive advantage, as employees are integral to a firm’s
success (Wright & Kehoe, 2008). Consequently, the management of human capital
increasingly focuses on leadership practices for the optimal use of organisational resources
and capabilities. The promotion and improvement of human capital can improve
organisational commitment in employees, and they are positively associated with each other
(Puhakainen & Siponen, 2010; Hollins, 2012). On the other hand, as a threat to employees’
turnover rate, turnover intentions have attracted much attention by researchers and
practitioners, as employee retention significantly develops and maintains human capital for
organisations (Boles et al., 2004). Research has shown that identifying and dealing with

22
antecedents of employee turnover intentions is an effective way to reduce actual turnover
(Dess & Shaw, 2001). Moreover, the indirect costs of employee turnover include reduced
productivity, loss of human capital and decrease in morale among remaining employees
(Griffeth et al., 2000; Allen et al., 2003; Jacobs & Roodt, 2007). Hence, this study includes
employees’ organisational commitment and turnover intentions, as the inclusion of these
variables in previous organisational studies has shown links to both employee and
organisational performance. Therefore, this study considers two mediators: organisational
commitment and employee turnover intentions. The study aims to examine the impact on the
relationship of perceived RL and presenteeism.
The use of mediating variables is common in organisational studies. According to MacKinnon
et al. (2007), a mediating variable transmits the effect of an independent variable to a
dependent variable, but the challenging task of research remains to infer the true state of
mediation from observations. In this study, organisational commitment is the first mediating
variable in the relationship between perceived RL and presenteeism. It is justified as a
mediator because of the relative characteristics of an individual’s identity, involvement and
attachment to the organisation (Mowday et al., 1982; Aldag & Reschke, 1997). Moreover, the
significance of organisational commitment is prioritised as it differentiates between stayers
and leavers more than job satisfaction (Porter et al., 1974). Hence, a significant number of
studies already consider organisational commitment as a mediating variable for various
organisational studies (Meyer & Smith, 2000; Hwang & Hopkins, 2012; Jing & Zhang, 2014).
On the other hand, according to Porter and Steers (1973), greater emphasis should be placed
on understanding the turnover decision process, as an employee’s ‘intention to leave’ is a
likely mediator to the attitude-behaviour relationship. However, the notion of employee
turnover intentions is more prevalent in organisational studies, as it represents the last stage
prior to quitting. In this study, both mediators are likely to influence the relationship of
perceived RL and presenteeism. This thesis includes a further discussion of both mediators in
the following chapters.
Previous studies have identified several inadequacies in the understanding of the relationship
between leadership practices and presenteeism, which is a compelling reason to conduct this
study. First, the direct link between leadership and employee performance (through
presenteeism) is implied rather than explicit. In other words, studies that examined leadership

23
did not link leadership performance to objective outcomes of the leadership system (Holton &
Lynham, 2000; Bass, 1990). However, workplaces are dynamic and perceived RL may
represent a substantial opportunity for business leaders to reduce presenteeism and improve
organisational performance, as leading responsibly is predominantly linked to organisational
effectiveness (Bennis, 1994). Second, the impact of leadership on performance has not been
examined from various levels (individual, group, process and organisational) for
organisational performance (Holton & Lynham, 2000; Bass, 1990; Lynham, 1998, 2000a,
2000b; Yukl & Van, 1992). Hence, it is imperative to study the relationship of perceived RL
on an individual level for employee outcomes focusing on presenteeism. Third, the notion of
‘responsibility’ within perceived RL compared to other forms of leadership practices is absent
in current leadership literature in relation to employee outcomes such as organisational
commitment or employee turnover intentions (Gardner, 1990; Collins & Porras, 1994; Takala,
1999; Mostovicz et al., 2011). There seems to be a paucity of literature on the link between
perceived RL and presenteeism. Therefore, this study will also contribute to organisational
studies for leadership development and employee outcomes by investigating the relationship
between perceived RL and presenteeism in the Australian context.
1.6 Purpose of the study
The main purpose of this study is to examine the relationship between perceived RL and
presenteeism. It also scrutinises the mediating role of organisational commitment and
employee turnover intentions on the relationship between perceived RL and presenteeism.
The independent variable RL “can be defined as the art and ability involved in building,
cultivating and sustaining trustful relationships to different stakeholders, both inside and
outside the organisation, and in co-ordinating responsible action to achieve a meaningful,
commonly shared business vision” (Maak 2007, p.334). The dependent variable, presenteeism
is defined as attending work while being ill and unable to work at full capacity (Lack, 2011).
As the mediators, organisational commitment (including normative, affective and
continuance) (Meyer et al., 1993) and employee turnover intentions (Donnelly & Ivancevich,
1975) will be measured to examine the relationship between perceived RL and presenteeism
among the Australian employees. Therefore, this thesis limits its focus to specific key
constructs: RL, organisational commitment, employee turnover intentions and presenteeism.

24
- -
+ m
+
-
Responsible Leadership
(Organisational Level)
Employee Turnover Intentions
Organisational Commitment
-Normative -Affective -Continuance
Presenteeism -Work process -Work outcome
m -
The selection of each construct is justified by a literature review (Chapter 2). Figure 1.1
shows the relationships of the studied variables. Overall, this study aims to:
1. empirically examine the nature of the relationship between perceived RL and
presenteeism in a sample of Australian employees;
2. evaluate and test the role of employees’ perceptions of perceived RL in the
relationships between perceived RL, organisational commitment, employee turnover
intentions and presenteeism; and
3. develop and test the mediational roles of organisational commitment and employee
turnover intentions on the relationship between perceived RL and presenteeism; and
1Figure 1.1: The relational model between perceived RL and presenteeism with the mediating role of organisational commitment and employee turnover intentions . The plus (+) and minus (-) signs indicate positive and negative relationships among the variables.
1.7 Research questions and hypotheses
This study will investigate the relationship between perceived RL and presenteeism in the
Australian context and examine the mediating role of organisational commitment (normative,

25
affective and continuance) and employee turnover intentions. Hence, the following research
questions will guide this study:
Research Question 1: Is there a significant relationship between perceived RL and
presenteeism?
Research Question 2: Is there a significant relationship between perceived RL and
organisational commitment?
Research Question 3: Is there a significant relationship between perceived RL and
employee turnover intentions?
Research Question 4: Is there a significant relationship between organisational
commitment and employee turnover intentions?
Research Question 5: Is there a significant relationship between organisational
commitment and presenteeism?
Research Question 6: Is there a significant relationship between employee turnover
intentions and presenteeism?
Research Question 7: Is there a significant mediating relationship between
organisational commitment and the association of perceived RL and presenteeism?
Research Question 8: Is there a significant mediating relationship between employee
turnover intentions and the association of perceived RL and presenteeism?
To answer the above research questions, this study proposes the following hypotheses (H1 to
H8):
Hypothesis 1 (H1): There is a negative relationship between perceived RL and
presenteeism.
Hypothesis 2 (H2): There is a positive relationship between perceived RL and
organisational commitment.
Hypothesis 3 (H3): There is a negative relationship between perceived RL and
employee turnover intentions.
Hypothesis 4 (H4): There is a negative relationship between organisational
commitment and employee turnover intentions.
Hypothesis 5 (H5): There is a negative relationship between organisational
commitment and presenteeism.

26
Hypothesis 6 (H6): There is a positive relationship between employee turnover
intentions and presenteeism.
Hypothesis 7 (H7): Organisational commitment mediates the association between
perceived RL and presenteeism.
Hypothesis 8 (H8): Employee turnover intentions mediate the association between
perceived RL and presenteeism.
1.8 Significance of the study
The influence of national culture on leadership practices has been well documented. Many
scholars have suggested that cultural values and elements (e.g., norms and beliefs) affect what
leaders do (House et al., 1997; Ag Budin & Wafa, 2015). The behaviour of leaders reflects
their culture (Bass, 1985; Kopelman et al., 1990; Yukl, 1994; Pater, 2015). Hence, scholars
have claimed that culture acts as a contingency factor in exercising leadership (Bass, 1990;
House et al., 1997, 2004).
Many researchers examining the influence of culture on value-based leadership approaches
have noted that norms, values and traditions can influence leaders’ behaviour, inclinations and
attitudes in several ways (Lord & Maher, 1991; House et al., 1997; Adler, 2008; Yukl, 2010).
For example, Mittal and Dorfman (2012) investigated servant leadership across 62 societies
and suggested a five-factor (egalitarianism, moral integrity, empowering, empathy, and
humility) resolution. These five factors were found to be significant for successful leadership
across cultures. Walumbwa et al. (2010) explored the relationship between authentic
leadership and power distance, employees’ identification with their direct supervisors and
empowerment. These associations were intermediated by the employees’ level of
identification with the superiors and their feelings of empowerment. Kirkman et al. (2009)
examined the associations among transformational leadership, power distance orientation,
organisational citizenship behaviour and perceptions of procedural justice from the US and
China. Their findings suggested that transformational leadership positively influenced all the
elements, including employee’s procedural justice; however, divergences among nations did
not significantly influence these associations. This study examines the influence of RL on
presenteeism, organisational commitment and employee turnover intentions from the
employee perspective with an Australian sample.

27
Several researchers have examined the extent to which different perspectives on leadership
might be seen as being affected by Australian culture. Egalitarianism and individualism are
two key traits identified by Ashkanasy and Falkus (1997) in Australian cultural history that
shapes leadership effectiveness. The belief that Australians are equal, egalitarianism, in
particular, can influence how leaders approach particular situations in Australia. The GLOBE
(Global Leadership and Organizational Behavior Effectiveness) study generated important
research findings about the nature of effective leadership in the Australian cultural context
(House et al., 2002). This study suggested that leader effectiveness is contextual and
embedded in the Australian societal and organisational norms, values and beliefs of the
people being led (Ashkanasy et al., 2000; House et al., 2002). Moreover, for the purposes of
examining leadership effectiveness, Australian culture was classified as lying within the
“Anglo” (English-speaking) cluster of countries. Karpin’s (1995) report discussed the
perceived weaknesses of Australian leadership practices, such as lack of vision, a short-term
view and lack of strategic perspective, poor teamwork, inflexibility, poor people skills and
inadequate cross-cultural skills (O’Neill, 1996; Barker, 2002). The report emphasised the
inadequacy of Australian leadership from various cultural perspectives and described how
Australia needed to develop leadership practices to compete in the global marketplace.
More recently, organisational leaders in Australia have been exposed for dishonesty, greed
and irresponsible performance. The history of Australian corporate collapses and failures
includes many prominent company names including Qintex, HIH Insurance, One Tel and
Bankwest. This thesis responds to the call for leadership driven by responsibility, and
examines the influence of RL on employee outcomes with an Australian sample.
Researchers have suggested that employees’ health conditions for presenteeism have
significant impact on organisational performance. According to Stewart et al. (2003), the cost
of presenteeism in the USA is three times higher than absenteeism. Similarly, presenteeism
cost the Australian economy $A 34.1 billion for the year 2009-2010, or 2.7% of the gross
domestic product (Medibank, 2011). This loss is even higher in the USA. For 2010,
presenteeism cost the USA economy $US 180 billion, or 1.7% of its gross domestic product
(Weaver, 2010). In the UK, presenteeism costs £13 million in lost working days annually
(Hardy et al., 2003). According to the Harvard Business Review, US companies may lose
$150 billion annually because of presenteeism (Hemp, 2004). The total cost of presenteeism

28
is enormous, and alarming for both organisational and national economic growth. While there
is adequate discussion in the literature about the relationship between various leadership
styles and employee performance, there is limited evidence for the influence of RL on
presenteeism, or for the mediational effect of organisational commitment and employee
turnover intentions. Hence, this study contributes to the organisational leadership literature
both theoretically and practically by investigating the relational (structural) model presented
in Figure 1.1. The following discussion outlines the theoretical contributions of this thesis by
addressing specific calls from various scholars:
i. Pless et al. (2011) suggested that several challenges to establishing the notion of RL
persist because of its lack of theoretical advancement. However, the need for RL is not
limited to corporate scandals and ensuing calls for responsible and ethical conduct
(Brown & Trevino, 2006). It also includes the need to address organisational changes
and new demands resulting from changing business contexts (Maak & Pless, 2006;
Waldman & Galvin, 2008). Hence, this research will contribute to advancing the RL
literature to help scholars to establish RL with additional theoretical and empirical
evidence.
ii. Researchers have shown a significant amount of interest in values-based leadership
approaches, and prefer RL for its multilevel (individual, organisational, social and
global) outcomes (Doh & Stumpf, 2005; Waldman & Galvin, 2008; Siegel, 2014;
Waldman & Balven, 2014). This study examines perceived RL as a value-based
leadership approach and extends Brown and Trevino’s (2006) findings of ‘value’ and
Spreitzer’s (2007) notion of ‘responsibility’ for organisational leadership practices.
Therefore, this thesis examines how perceived RL contributes to the literature on
values-based leadership practices for organisational studies.
iii. Lynham and Chermack (2006) proposed the concept of responsible leadership for
performance (RLP) as a model for organisational leadership. They suggested that a
leader’s responsible (effective, moral and persistent) leadership can be connected to
organisational performance. This research will contribute to develop the theory of
RLP and explore the eight strategic propositions indicated in the theoretical outline

29
(see Lynham & Chermack, 2006, pp. 81-82). Therefore, this study will be an
extension of RLP.
iv. The concept of RL promises a significant influence for organisation’s ‘macro’,
‘meso’, and ‘micro’ levels (see Voegtlin et al., 2012, p.5). This study examines the
influence of perceived RL at the micro (organisational) level about leaders’ roles from
employees’ perception. Hence, this thesis will theoretically contribute to extending
Voegtlin et al. (2012)’s perceived RL outcomes at the micro level of
manager-employee relationships.
v. The role of HR managers in promoting RL has been ignored in the
organisational-studies literature (Bhattacharya et al., 2008, 2009; Maak & Pless, 2006;
Wittenberg et al., 2007). HRM can facilitate RL, but research into the role of HRM
practices has overlooked this potential (Gond et al., 2011). This research will
contribute to the HRM literature by increasing the understanding of employees’
perceptions of RL and its relationship with organisation commitment, employee
turnover intentions and presenteeism.
vi. Lastly, this research study marks perhaps the first attempt to operationalise RL
with Cooper’s (1994) conceptualisation of presenteeism. The association between
employees’ perceptions of organisational leadership and the level of presenteeism is
well analysed (Brown & Trevino, 2006; Tepper, 2000; Nyberg et al., 2009;
Leineweber et al., 2011), but lacks sufficient academic rigor, particularly in relation to
RL. In addition, the mediational roles studied in this project link psychological and
organisational behaviour literature.
Furthermore, by addressing the objectives using the relational model (Figure 1.1), this
research will have the following practical implications:
i. Literature on RL crosses the levels of analysis for individuals, groups and
organisations as a whole, but lacks adequate use and practice in organisational
leadership (Morgeson et al., 2013; Christensen et al., 2014). While much has been
written about RL from the stakeholder and global perspectives, less is known about its

30
application from the employee’s perspective. However, researchers acknowledge that
leaders significantly influence employees’ morale and work outcomes (Kinnunen &
Perko, 2012; Steultjens et al., 2012; Gilbreath & Karimi, 2012). Hence, compared to
ethical and moral leadership, RL may prove uniquely applicable to organisational
leadership. Therefore, exploring the relationship between situational antecedents (RL,
organisational commitment or employee turnover intentions) and outcome
(presenteeism) from the employee’s perspective will help organisations apply RL to
improve organisational performance.
ii. Presenteeism causes productivity loss due to employees’ health conditions at work
and adversely affects organisational performance (Reilly et al., 1993; Koopman et al.,
2002). Researchers have found that organisational leadership influences employees’
behaviour for the outcomes of both their absenteeism and presenteeism (Hetland et al.,
2007; Nyberg et al., 2009; Gilbreath & Karimi, 2012). Hence, focus on leaders’
further training and development to enhance leadership skills and ability may reduce
productivity loss significantly. Previous studies have suggested assessments such as
multi-source or ‘360-Degree-Leadership’ to improve leadership skills and behaviour
for managerial roles (Barling et al., 1996; Avolio & Gibbons, 1988). This study will
help organisations practice RL in their strategic HRM to plan managers’ training and
development initiatives. Hence, this thesis will contribute to organisations’ efforts to
revise their current leadership evaluation and development practices to facilitate the
application and execution of RL within organisations.
iii. Presenteeism is a continuous challenge for organisations and has an adverse result
for both micro and macro economies. By 2050, the total cost of presenteeism in
Australia is estimated to rise to $35.8 billion (Medibank, 2011). This study considers
the associated costs of productivity loss from presenteeism, including the levels of
employees’ psychological and physical health. Therefore, from an economic
perspective, this thesis will contribute towards measuring and identifying immediate
solutions for presenteeism to minimise both micro and macro-economic losses in the
Australian context.

31
iv. Organisations projecting a higher level of RL are likely to achieve higher levels of
employee retention (Doh et al., 2011). This study finding will suggest ways to increase
cross-functional management among top management and HR departments for an
effective deployment of RL to attain a lower rate of turnover and higher employee
commitment. In addition, this study will also develop necessary interventions and
approaches to facilitate RL within organisations and generate a deeper understanding
and discussion of RL and presenteeism for Australian employees. Therefore, this
thesis will create an opportunity to advance leadership roles for better management of
presenteeism, organisational commitment and employee retentions.
In summary, this study will be principally concerned with perceived RL and related employee
outcomes in the Australian context. Four key industry findings supported the motivation for
developing and testing the proposed model (Figure 1.1, page 24) of RL and presenteeism in
the Australian context. First, several corporate scandals and collapses in Australia (such as
James Hardie, HIH Insurance, One Tel and Qintex) raised the demand for responsible
leadership. Leaders are increasingly held accountable for their leadership roles. Second, the
cost of presenteeism for the Australian economy is reported to be $A34.1 billion (2.7% of the
Gross Domestic Product) for 2009-2010 (Medibank, 2011). Third, Roche et al. (2015)
suggested that employee turnover costs varied across the countries in 2014 (US $20,561;
Canada $26,652, New Zealand $23,711, Australia $48,790) and Australian costs were
substantially higher due to high turnover and replacement costs. Finally, high organisational
commitment associated with low turnover intentions and the cost of employee replacement
has been estimated to be twice their annual salary in Australia (Brunetto et al., 2013).
Therefore, this thesis will contribute to the organisational-leadership literature both
theoretically and practically by investigating the relationships between the perceived RL,
presenteeism, organisational commitment and employee turnover intentions of Australian
employees.
1.9 Structure of the Thesis
This thesis consists of six chapters. The current chapter outlined the introduction of the thesis,
giving the background of RL, the importance of recognising presenteeism, the problem

32
statement and purpose of this study, its research questions with their associated hypotheses,
and significance of this thesis.
Chapter 2 contains a literature review for the relational model (Figure 1.1), focusing on the
relevance of perceived RL with other leadership theories, presenteeism, organisational
commitment and employee turnover intentions. It describes the evolution of leadership
theories, including the various perspectives of RL, linking RL’s individual, social and global
perspectives. The notion of RL is further clarified with related value-centered leadership
approaches for organisational performance.
Chapter 3 presents the discussion for the development of the hypothesised model. It also
incorporates the justifications for each of the eight hypotheses and how each addresses the
aims of the thesis.
Chapter 4 illustrates the hypothesised model (Figure 1.1) and formulates the testable
hypotheses (H1 to H8), including the direct and mediating relationships. It describes the
research methods used to meet the purposes of this thesis. It also explains the research design,
the population and sample size and the measurement instruments with their psychometric
properties. Lastly, the chapter outlines the ethical considerations for data collection and the
analysis procedures for this study.
Chapter 5 gives a comprehensive explanation of Structural Equation Modelling (SEM) and a
discussion of the steps and stages for its application. It also includes both the tests of the
proposed hypotheses and their results, and a summary of the overall data analysis.
Finally, Chapter 6 provides a discussion and interpretation of the results found in Chapter 5.
It also presents the theoretical and practical contributions of the thesis, including its
limitations, and provides suggestions for future researchers.

33
2 LITERATURE REVIEW
2.1 Introduction
This chapter provides the theoretical background to the proposed study model that is based on
RL and the employee outcomes of presenteeism, organisational commitment and employee
turnover intentions. The key aim of this literature review is to determine the relevance of
existing theoretical contributions to the relationship between RL and presenteeism including
the mediational influences of organisational commitment and employee turnover intentions on
their direct association. This chapter is presented in 10 sections. Section 2.2 explains the
evolution of leadership theory and its relevance to RL. Sections 2.3 to 2.5 examine RL and its
related major issues, such as different perspectives of RL, a comparison of RL with other
value-based leadership theories and RL for organisational performance. Sections 2.6 and 2.7
outline the relevant features of presenteeism for the current study. Sections 2.8 and 2.9
describe organisational commitment and the issue of employees’ overcommitment. Finally,
Section 2.10 provides insights into employee turnover intentions and its link to factors
affecting employee turnover intentions.
2.2 Evolution of leadership theories
There is a large amount of literature on leadership, and the term ‘leadership’ is commonly
used in many contexts. Leadership has been firmly linked to organisational performance and
effectiveness since the beginning of civilization (Kouzes & Posner, 1995). There are
numerous definitions and theories of leadership with adequate similarities to conclude that
leadership is an effort to influence others and the power to induce compliance (Wren, 1995).
Moreover, the concept of leadership simultaneously implies both ambiguity and complexity
(Carroll et al., 2008; Denis et al., 2010). There is a vast amount of literature on both the
evolution of leadership and history of leadership research (Cacioppe, 1997). Therefore, a brief
evolution of leadership approaches is offered here. Although the practice of leadership has
changed considerably over time, the need for leaders and leadership has not (Bass, 1990;
Kouzes & Posner, 1995). The review in this chapter briefly traces the historical evolution of
leadership theories from their initial focus on Great Man and trait theories to the
contemporary study of RL. Although the theoretical foundations of leadership theory have
changed over time, in many ways the fundamental functions of leadership– direction,

34
decision-making, goal setting, communicating and resolving conflict– have not changed in
their essence (Clark & Clark, 1990).
In the 19th century, the notion of the ‘great man’ dominated leadership theory. This theory
claimed that only some individuals (leaders) have the needed attributes (such as
persuasiveness, personality, intuition, judgment, courage, intelligence, aggressiveness or
action orientation) that set them apart from others and allow them to occupy leadership
options, exercising power and authority within the group or society (Northouse, 2006;
Kippenberger & NetLibrary, 2002; Borgatta et al., 1954). However, though this idea may
serve sufficiently for case studies, it is effectively unusable and, therefore, not applicable as a
scientific theory (van Wart, 2003). Hence, the great man theory subsequently gave rise in the
1920s and 1930s to the trait theory which attempted to identify traits that made leaders
different from other individuals.
The trait theory of leadership has the underlying assumption that leaders clearly need to
possess some universal characteristics that would make them leaders. The trait approach
asserted that distinct physical, social and individual characteristics are inherent in leaders
(Allen, 1998). Traits were viewed as something fixed that was present at birth and applicable
in any circumstance. Thus, this theory is also based on the assumption that leaders are born,
not made, and the key to success is simply in distinguishing those personalities who were
born to be great leaders (Horner, 1997). However, it is uncertain as to what traits consistently
link to trait leadership. One of the flaws with this line of thought is that it overlooks the
situational and environmental elements that play a role in leaders’ effectiveness (Horner,
1997). Moreover, trait theory proposes significant attributes for successful leadership (drive,
passion to lead, truthfulness, confidence, intellect and job-related knowledge), but does not
provide a conclusion as to whether these traits are inherent to individuals, or whether they can
be developed through training and education. Allen (1998) suggested that no two leaders are
similar, and no single leader owns all of the traits. Therefore, researchers refocused their
efforts away from ‘who is a leader’ to ‘what leaders do’. This interest in identifying
observable leader behaviours moved the leadership discourse towards behavioural theories
(Sashkin & Burke, 1990).

35
Many behavioural theorists have suggested that leadership behaviours can be learned, and that
training and development programs can be useful in this learning process (Allen, 1998). The
behavioural approach made an effort to identify what effective leaders do in their jobs and to
describe the relationships between those specific behaviours and leadership effectiveness
(Yukl, 2013). This approach has contended that in terms of effectiveness, the output of the
leaders’ behaviour focuses on their job accomplishment and goal achievement. Hence,
behavioural theorists have assumed that the best styles of leadership could be taught, and
developed several training programs to develop managers’ leadership behaviours (Allen,
1998). For example, the renowned and well-documented University of Michigan and Ohio
State leadership studies followed this approach (Horner, 1997). Similarly, Blake et al. (1964)
developed a two-factor model of leadership behaviour, using what they termed ‘concern for
people’ and ‘concern for output’ to observe and examine leadership outcomes; in time, they
added a third variable, flexibility. The result of this research was essentially descriptive, and
helped categorise leaders’ performance based on their own emphasis either people or
production (Horner, 1997). Thereafter, the investigation into leadership behaviours evolved to
the next major thrust, the situational contexts of leadership, to find meaningful patterns for
further theory-building and useful advice.
Primarily, the idea of situational leadership was similar to Westburg’s (1931) suggestion that
a leaders’ achievement is tied with the ability to understand both the followers and the
situation at a given time and respond accordingly to both as circumstances change. The
contributions of Stogdill (1948; 1974) and Mann (1959) appeared to further support and
advance the notion of situational leadership. Thereafter, Yukl (2013) noted that the
effectiveness of leaders’ behaviour could be linked to a number of situational factors, such as
the extent of leaders’ authority and discretion, the quality of the organisation’s work
subordinates’ attributes and the nature of the external environment. Therefore, situational
leadership is characterised as a trait or behavioural reflection consisting of either innate skills
(traits) or responses to the demands of a distinct situation. This change of direction for
leadership paved the way to consider other propositions for understanding the leader-follower
relationship (Hollander & Offermann, 1990). Hence, leadership theories have evolved to
explore the leader-follower relationship more than leaders’ personal characteristics.

36
Fiedler (1961) focused on the outcome of leadership effectiveness rather than individuals’
specific traits. He argued that situational elements as well as the characteristics of both the
leader and followers affected the leadership process far more than predetermined leadership
traits. Thus, Fiedler’s theories continued the evolution of leadership theories away from traits
to determining the how aspects of a situation interacted with attributes of leaders that tended
to make their followers optimistic. As a result, in the mid-1960s, two new approaches to
leadership theory emerged from the situational approach: the contingency and transactional
leadership models. Both models contributed to the knowledge of leadership complexity by
shifting away from trait-based or situational approaches to a new dimension of leadership
(Hollander & Offermann, 1990).
The contingency models (Fiedler, 1964; House, 1971; Vroom & Yetton, 1973) contended that
leadership effectiveness was a combined result of both the qualities of the leader and the
demands of a particular situation, and that these requirements interacted to ensure that
leaders’ potential was consistent with the tasks they faced. Similarly, Fiedler’s (1961)
Contingency Leadership Model (CLM) supported the suggestion that effective leadership is
situation-dependent. He suggested that leaders needed to be prepared to address effectively a
host of situational variables to make intelligent decisions regarding their actions. In addition,
House’s (1971) path-goal model predicated that employees’ performance and satisfaction
were influenced by the behaviour of their leaders. Here, the leader’s task was to ensure
employees’ understanding of their goals, reduce or eliminate any impediments for their goal
accomplishment and to increase their satisfaction, while employees’ task was to achieve their
goals. Moreover, the Decision Making Model (DMM) developed by Vroom and Yetton
(1973) suggested that it was important for leaders to determine how much participation
employees would have in the organisation’s decision-making process. This model was
established on the idea that there was a direct link between employees’ acceptance of
decisions and their productivity. However, all the contingency models emphasised leaders’
behaviours toward their followers, rather than their traits, focusing on the idea of leaders’
concern for followers’ situational outcomes, such as job satisfaction and employee
productivity. Thereafter, corresponding leadership practices to ensure employees’ ability and
performance outcomes convincingly introduced further dimensions in leadership development
for organisational studies (Anderson, 1992). As a result, a new dimension of organisational
leadership was emerged to explain both leaders’ and followers’ behavioural perspectives. For
example, the Reinforcement Theory (Skinner, 1972) stemmed from a behaviourist viewpoint,

37
arguing that behaviour was controlled by its consequences for leadership outcomes in
organisations. According to Horner (1997), leaders were in a position to provide either
positive or negative consequences to followers; this reinforcement theory significantly
affected the development of an effective leadership style in organisations for superior leader-
employee outcomes.
A review of the leadership literature reveals an evolving series of theories from ‘great man’
and ‘value-based’ theories to ‘responsible’ leadership (see Table 2.1, page 40). While early
theories tend to focus on the characteristics and behaviours of successful leaders, more recent
theories appear to focus on the role of followers, the contextual nature of leadership and
leaders’ value components, such as ethics, integrity, trust, respect or sense of responsibility
(Bass & Bass, 2008; Yukl, 2011).
The notion of situational leadership was developed by Kenneth Blanchard and Paul Hersey.
Some prominent situational leadership approaches include Tannenbaum and Schmidt’s
leadership model (Tannenbaum & Schmidt, 1958); Reddin’s tri-dimensional theory of
leadership (Reddin, 1964); path-goal theory (House, 1971) and Hersey and Blanchard’s
situational leadership theory (Hersey & Blanchard, 1977, 1982). Situational theory suggests
that effective leaders need to be flexible, and must adapt themselves to their situation (Hersey
& Blanchard, 1977, 1982). According to McCleskey (2014, p. 118), “Situational leadership
theory proposes that effective leadership requires a rational understanding of the situation and
an appropriate response, rather than a charismatic leader with a large group of dedicated
followers”. It recommends that leaders must adjust their style to fit the development level of
the followers they try to influence (Wofford & Liska, 1993; McKee et al., 2013). It focuses on
followers’ readiness to do their jobs and leaders’ responsibility to observe and adapt their
leadership style accordingly. Here, readiness refers to followers’ capability and willingness to
follow their leaders (Hersey et al., 2001).
Contingency approaches to leadership include the basic assumption that when it comes to
leadership style, one size does not fit all. Some examples of contingency approaches include
Fiedler’s contingency theory (Fiedler, 1964), cognitive resource theory (Fiedler & Garcia,
1987) and strategic contingencies theory (Hickson et al., 1971). According to Fiedler (1971,
p.128), “The contingency model postulates that the performance of interacting groups is

38
contingent upon the interaction of leadership style and situational favorableness”. Several
scholars have suggested that leaders’ behaviour within organisations should be contingent on
the situation at a specific time, and that there is no one leadership style that is appropriate for
every situation (Yukl, 1971; Denison et al., 1995; Malos, 2012; Kriger & Seng, 2005). Hence,
contingency approaches to leadership stress using different styles of leadership appropriate to
the needs presented by different organisational situations.
On the other hand, behavioural approaches to leadership assume that leaders’ success is based
solely on how they behave. Examples of behavioural approaches to leadership include
autocratic, democratic and laissez-faire styles (Lewin et al. 1939), Michigan leadership
studies (Yukl, 2011), managerial or leadership grid (Blake & Mouton, 1964), Ohio State
leadership studies (Bass & Bass, 2008) and role theory (Graen, 1976). These approaches
consider leadership effectiveness beyond leaders’ personal characteristics or traits (McKee et
al., 2013). In response to the criticisms of the trait theory of leadership (Allen, 1998), scholars
examined leadership as a set of behaviours and identified what successful leaders did,
developed classifications of actions, indicated broader perspectives and prescribed different
leadership styles. According to Kriger and Seng (2005, p. 772), “leadership behaviour is
theorised to depend upon: 1) on-going observation by the leader of subtle changes in his or
her surrounding environment; 2) on-going real-time self-observation of the often subtle
changes in the inner world of the leader (i.e., complex interactions among thoughts, feelings,
intuitions, inspirations, and creative imagination); 3) an on-going aspiration to transcend the
duality of ‘self’ and ‘other’ (to ‘self-actualize’ in the terminology of Maslow); and 4) a deep
wish to serve others to eliminate or decrease human suffering”. Researchers at Ohio State
University in the United States surveyed leaders and found two major dimensions of
behaviours associated with leadership styles (Bass, 1990). First, leadership ‘consideration’
refers people oriented behaviour such as respect and concern for employees’ wellbeing;
second, initiating leadership ‘structure’ refers to leaders’ behaviours related to task and goal
orientation. Similarly, Robert Blake and Jane Mouton presented the managerial grid model
(Blake et al., 1964) and identified five different leadership styles based on leaders’ concern
for people and for production.
The situational, contingency and behavioural theories of leadership have some noticeable
overlaps (Bass, 1985; Yukl, 2002; Dansereau et al., 2013). First, both the contingency and

39
situational approaches focus on the importance of situations. The contingency approach bases
the effectiveness of a leader on the individual’s leadership style and group task situation
(Fiedler, 1978). Situational leadership refers to the use of a leader’s individual skills and
ability to lead in a particular situation (Hersey & Blanchard, 1969). In contrast, the
behavioural approaches of leadership suggest that leadership behaviour can be learned by
focusing on what leaders do, or how they behave, and ignoring their personal traits (Yukl,
1971). Second, both the situational and contingency leadership approaches are extensions of
behavioural leadership theories (McKee et al., 2013). Third, all three approaches claim that
there is no single style of effective leadership, because of followers’ behavioural and
situational demands (Northouse, 2013; Dinh et al., 2014). Hence, a leadership style that is
effective in one situation may be ineffective or a failure in another. Fourth, scholars assume
that the effectiveness of leadership styles should be determined by both the internal and
external factors of the organisations, including the considerations of the skills and abilities of
both the leaders and followers (Morrison, 2010; Northouse, 2013; Dinh et al., 2014). Any of
these three approaches may fail to correctly predict outcomes for the same leadership position
and the same organisation, because factors such as leaders’ and/or followers’ behaviour or
situations may not be correctly identified and applied (Yukl, 2011; Hoyt, 2013).
Despite these overlaps, there are some differences between situational and contingency
theories. First, the notion of situational leadership shows flexibility in accommodating
appropriate leadership skills to resolve situations (Bass, 1985), while leaders in the
contingency approach lack flexibility, as their effectiveness depends on the appropriate match
between a leader’s inherent style, including personal traits and group task situation (Kabanoff,
1981; Northouse, 2013). Second, leaders with contingency practices predict that followers
will function according to the leader’s style, while the situational approach suggests that the
followers will alter their behaviour based on a leader’s personality and ability (Ayman, 2004;
Barbour, 2013). Finally, the level of rigidity in the leader’s behaviour differs between
situational and contingency theories of leadership, with several scholars suggesting that
situational leaders can move flexibly along a continuum to enable their effectiveness in
different situations (Avolio et al., 2009; Northouse, 2013; Dinh et al., 2014). Hence,
situational leadership theories appear to be more democratic and employee-oriented because
they can reflect the changing nature of organisational situations. On the other hand,
40
contingency leadership theories focus on the premise that leadership styles are fairly rigid and
relatively inflexible.
Leadership effectiveness remains critical to many leadership theories, including contingency,
situational and behavioural (Nebeker, 1975; Morrison, 2010; Northouse, 2013; Dinh et al.,
2014). However, after recent major corporate scandals, there have been calls to balance the
demand for leadership effectiveness with leadership responsibility. As a response to this call,
a new leadership theory, responsible leadership (RL), has been proposed by scholars such as
Lynham and Chermack (2006) and Maak and Pless (2006a; 2006b).
Until 1978, the focus of the conventional literature had been leadership at lower (operational)
levels, which was effective for small groups, but less so at the upper or executive levels (van
Wart, 2003). Burns (1978) radically changed that focus and advanced the concept of
transactional leadership, which focused on the distribution of rewards and punishments and
asserted that leaders were primarily concerned with maintaining order in day-to-day activities
(Lord et al., 1999; Avolio et al., 1991). Leaders using transactional behaviour relied on
authority instead of personal charisma and tended to disregard the emotions of their
employees (Bass, 1985). Transactional leadership was derived initially from a social-
exchange perspective that focused on the implicit social contract between leaders and
followers and its relationship to effectiveness (Bass et al., 2003). However, transactional
models focused on exchange theory and the perceptions and expectations that followers had
regarding the actions and motives of their leaders. The exchange theory recommended that
both leaders and subordinates develop a separate exchange relationship as they mutually
defined the role of leadership in the context of the leader-follower relationship. Avolio et al.
(1991) suggested that transactional leaders managed the status quo and maintained the day-to-
day operations of a business, but did not focus on recognising the organisation’s directional
application for employees’ work toward organisational goals or employee productivity as
aligned with organisational goals and profitability. However, the followers’ perception
regarding fairness and equity of the exchange with the leader is paramount and should not be
overlooked (Yukl, 2013; Yammarino & Dansereau, 2002). Hence, the transactional approach
to leadership gave way to the transformational leadership approach.

41
The concept of transformational leadership evolved as a discernible leadership trend in the
late 1970s and early 1980s (Hickman, 1990). Transformational leadership involved change, as
contrasted with leadership that retained the status quo (Avolio & Bass, 2002; Kouzes &
Posner, 1995; Yukl et al., 2002). Burns (2003) established much of the framework for the
constructs of the transactional and transformational leadership paradigm. He also noted a
certain difference between leaders whose exchanges with followers were transactional and
those for whom these exchanges were transformational (Burns, 1978; Kellerman, 1999).
Burns (1978) viewed transformational-type leadership as potentially the more powerful of the
two approaches, since it “occurs when one or more persons engage with others in such a way
that leaders and followers raise one another to higher levels of motivation and morality” (p.
4). The notion of transformational leadership did not replace transactional leadership; the
theories are neither inconsistent nor incompatible. Leaders typically were seen to use both
approaches, although transformational leadership was often more effective in its results
(Avolio & Bass, 1988; Bass, 1985). Hence, it is evident that after the early work of Burns,
Bass contributed significantly to bridge the gap between transactional and transformational
leadership (Sashkin & Rosenbach, 1998).
Burns’s (1978) primary work was significant for establishing transformational leadership
(Sashkin & Rosenbach, 1998). Both Bass and Burns contributed the concept of
transformational leadership and developed it into a convincing measurable concept for the
development of leadership theories (Sashkin & Rosenbach, 1998). However, the job of
transformational leaders was not to make every decision and ensure collaborative decision-
making within organisations (Book, 1998; Wheatley, 1994). Instead, this approach to
leadership inspired employees to work together for change in their organisations to manage
competitive productivity (Dixon, 1998). However, different views of leadership from about
this time can also be found in the literature. One example is charismatic leadership, where
leaders exerted obtrusive influence and power on their followers as a consequence of their
emotional appeal, especially in crisis-type situations where traditional wisdom demanded a
strong leadership (House, 1977).
More recently, leadership theories have developed more toward value-based leadership
approaches such as ethical, authentic, servant and spiritual leadership. Several authors have
suggested value-based leadership for organisational outcomes that focus on the value
components, such as integrity, honesty, courage, patience, trust and respect (Covey, 1989;

42
Depree, 1989; Greenleaf, 1977). These values have been considered to shape the manner of
acting, decision-making, relations with people and behavioural expectations within
organisations (Simmerly, 1987). For example, Peters and Waterman (1982) asserted that the
true role of leadership was to manage the values of organisations, and that leadership
approaches should be value-laden for sustainable organisational competition.
Within the field of organisational studies, ethics is considered as an important emerging issue
affecting leadership outcomes (Brown & Trevino, 2006). Ethical leadership and leaders’ level
of moral development have become essential elements for organisational leadership (Turner et
al., 2002). Day et al. (2009) suggested that leadership models should consider the ethical
concern that leaders develop their morals in workplaces. Hence, a key distinction of ethical
leadership is its focus on the internalised moral perspective, moral person, moral manager and
idealised influence (Brown & Trevino, 2006; Walumbwa et al., 2008). In contrast to other
value-based leadership styles, authentic leadership is more concerned with self-awareness,
transparency, internalised moral perspective and sensible processing (Gardner et al., 2005;
Walumbwa et al., 2008). However, servant leadership is a logical extension of
transformational leadership (Stone et al., 2004). Servant leadership draws on leaders’ self-
awareness, authentic behaviour, positive modelling, conceptual skills, empowerment of
followers, ethical behaviour, drive to create value for the community, subordinates’ growth
and success, ability to put subordinates’ needs first and emotional healing (Avolio & Gardner,
2005; Liden et al., 2007). Lastly, spiritual leadership is built on concern for others, as shown
by integrity, role modelling, altruism and hope or faith (see Fry, 2003). However, these value-
driven theories share several common features and concentrate more on RL. Therefore,
because the interest in value-centered leadership is great, it merits further exploration, and the
following section of this chapter describes RL, with its multi-perspective approach, in more
detail. Table 2.1 summarises the above discussion on the evolution of leadership theories.
1Table 2.1: Evolution of leadership theories
Classification Authors Idea/concept/comments

43
Classification Authors Idea/concept/comments
Great man theory Borgatta et al. (1954) Leaders have the needed attributes
(such as persuasiveness, personality,
intuition, judgment, courage,
intelligence, aggressiveness or
action orientation) that set them
apart from others and allow them to
occupy leadership options,
exercising power and authority
within the group or society.
Trait theory Allen (1998); Horner
(1997)
Distinct physical, social and
individual characteristics are
inherent in leaders.
Two-factor model of
leadership behaviour
Blake et al. (1964); Horner
(1997)
The output of the leaders’ behaviour
focuses on their job accomplishment
and goal achievement. It assumed
that the best styles of leadership
could be taught.
Situational leadership Stogdill (1948, 1974);
Mann (1959)
Leadership is characterised as a trait
or behavioural reflection consisting
of either innate skills (traits) or
responses to the demands of a
distinct situation.
Contingency models of
leadership (CLM, Path-
goal leadership, DMM)
Fiedler (1964); House
(1971); Vroom and Yetton
(1973)
Emphasises leaders’ behaviours
toward their followers, rather than
their traits. Focuses on the idea of
leaders’ concern for followers’
situational outcomes, such as job
satisfaction and employee
productivity.

44
Classification Authors Idea/concept/comments
Transactional leadership Burns (1978); Avolio et al.
(1991); Bass et al. (2003)
Focus is on the distribution of
rewards and punishments. It relies
on authority instead of personal
charisma and tends to disregard the
emotions of their employees.
Transformational
leadership
Burns (1978) ; Kellerman
(1999)
Leaders not only ensure
collaborative decision-making
within organisations, they also
inspire employees to work together
for change in their organisations to
manage competitive productivity.
Value-based leadership
(ethical, authentic,
servant and spiritual
leadership )
Day et al. (2009); Stone et
al. (2004);Avolio and
Gardner, (2005); Liden et
al. (2007); Fry (2003)
Leadership focuses on integrity,
honesty, courage, patience, trust and
respect for organisational outcomes.
Responsible leadership Maak and Pless (2006a,
2006b, 2009); Pless and
Maak (2011)
Leadership is a values-based and
principle-driven relationship
between leaders and stakeholders.
2.3 Responsible leadership (RL)
The notion of leadership has been considered as an important and dominant part of the
organisational behaviour literature for several decades. Schwandt & Marquardt (2000)
suggested that no other role in organisations has gathered more interest than the leadership
role. Generating 2,460,000 results (7 April, 2016) on Google Scholar, the term ‘Responsible
Leadership’ is fast gaining recognition as an effective leadership approach to study and
practice in the education, healthcare, psychology and management disciplines. The growing
interest in RL among management scholars is also demonstrated by the rising number of
journal articles (e.g., Waldman & Balven, 2015; Siegel, 2014; Pless et al., 2012; Voegtlin et
al., 2012) and books (e.g., Maak & Pless, 2006a; Lawrence & Beamish, 2013; Moody-Stuart,
45
2014; Fernando, 2016), as well as dedicated research centres spread across the globe (e.g.,
Centre for Responsible Leadership, Canada; Globally Responsible Leadership Initiative,
Belgium; Albert Luthuli Centre for Responsible Leadership, South Africa). RL has moved
into the mainstream of business thinking as a multilevel phenomenon. It is also studied at the
individual, group and organisation levels and is used to emphasise leadership effectiveness
within the economic, social and global contexts. For example, leaders’ ethical conduct and
respect for stakeholders’ interests are prime concerns of responsible leaders. Maak and Pless
(2006a) claim that the RL literature has developed to understand leadership as an influencing
process embedded in stakeholder values and ethical principles. Therefore, RL centres on the
relationships between leaders and followers, and focuses on sustainable results that benefit
organisations, related group of people, and the broader social and natural environment.
The concept of RL is constantly developing but needs to be addressed more fully and clarified
in theory and research (Maak & Pless, 2009; Waldman & Balven, 2015). Several scholars,
thought leaders, and consortia of academics and practitioners have sought to define RL from
their perspectives in contemporary organisations (D’Amato et al., 2009). As a value-based
leadership concept, RL acknowledges the existing gaps in leadership literature and also seeks
to define what ‘responsible’ means in the context of organisational leadership (Pless & Maak,
2011). For the notion of value-based leadership, Maak and Pless noted:
...we define responsible leadership as a values-based and principle-driven
relationship between leaders and stakeholders who are connected through a shared
sense of meaning and purpose through which they raise to higher levels of motivation
and commitment for achieving sustainable value creation and responsible change
(Maak & Pless, 2009, p. 539).
Douglas (1996) claimed that there can be no leadership without corresponding responsibility
for an outcome like RL. Similarly, Waldman and Galvin (2008) argued that the notion of
responsibility is missing from other value-based leadership theories, in particular from
transformational, charismatic, authentic, participative, servant, shared, spiritual and ethical
leadership.
The notion of RL considers social and relational phenomena that focus on the leader–follower
relationship (Pless & Maak, 2011). According to Waldman and Balven (2014), RL signifies a
46
concept that exists at the intersection of two fields of study, social responsibility and
leadership. While much has been written about social responsibility, such as its relationship to
organisations’ financial performance (Maak & Pless, 2006b; Orlitzky et al., 2003), less is
known about how actions and decisions on the part of individuals affect social responsibility.
Hence, the concept of RL inherently crosses levels of analysis by considering individuals,
groups, and organisations as a whole (Pless & Maak, 2011; Christensen et al., 2014;
Morgeson et al., 2013; Voegtlin et al., 2012) from organisational, social and global
perspectives. These multilevel also consider various theoretical frameworks to RL, such as
agency (Aguilera et al., 2008), stakeholder (Margolis & Walsh, 2003; Clarkson, 1995),
institutional (Campbell, 2007); stewardship (Davis, 2005) and ethics-based (Brown &
Treviño, 2006) theories. The variety of theoretical bases suggests different potential
definitions of what constitutes responsibility and may explain how leaders might fit within the
RL approach.
2.3.1 RL from organisational and individual perspectives
Examining RL from an organisational perspective necessarily also includes the consideration
of individuals’ behaviour and decisions and their associations with leadership influences
(Waldman & Balven, 2015). Similarly, Voegtlin et al. (2012) noted that responsible leaders
play an important part within organisations as role models and in involving employees in
decision-making. As a result, when employees follow responsible leaders, they may have
higher levels of job satisfaction, motivation, commitment or organisational citizenship.
Several scholars have suggested that responsible leaders consider their followers as important
stakeholders to make use of their unique perspectives in maintaining their motivation and
creativity (Pless, 2007; Doh & Quigley, 2014; Zhang & Bartol, 2010). They have also noted
that at the team level, responsible leaders consider and encourage their stakeholders’ diverse
perspectives, which may lead to team-level psychological safety and learning for team
performance and improve decision-making (Edmondson, 1999; Stasser & Titus, 1985).
There is overwhelming evidence that the perceptions, decisions, and actions of individual
managers, particularly those at senior levels, have an impact on their organisations’ social
performance and long-term viability (Maak & Pless, 2009; Kakabadse et al., 2005; Waldman
& Galvin, 2008). For organisations, a leader is “someone who occupies a position in a group,
influences others in accordance with the role expectation of the position, and co-ordinates and

47
directs the group in maintaining itself and reaching its goal” (Raven & Rubin, 1976, p. 37).
Moreover, a responsible leader is recognised as one who creates a culture of inclusion that is
built on a steady moral ground (Pless & Maak, 2004). Hence, RL at an organisational level is
a process of inclusion to attain group, organisational, and societal goals (Avery & Baker,
1990; Pless & Maak, 2004). According to Phillips and Freeman (2003), the thought of RL
comprises the social-relational process of individual leaders and collectivises organisational
actions determined by the upper levels that actively include various stakeholdersin producing
ethical and socially responsible organisations. Hence, RL focuses on the individual effort
toward a societal goal to move the organisation closer to becoming an ethical and responsible
system as a whole.
Several academics and researchers have explored some of the characteristics of leaders and
organisations under the umbrella concept of RL (Doh & Stumpf, 2005; Maak & Pless, 2006a;
Waldman & Galvin, 2008). They have argued that leaders need to integrate ethics, CSR and
conscientious stakeholder relationships in their leadership approaches. However, considering
employees as critical stakeholders has captured the attention of both academics and
practitioners (Doh et al., 2011). For example, among the ‘primary’ stakeholder groups
(shareholders, employees, customers, societies and suppliers), employees are considered to be
the most significant element, as they are vital for business operations and their collective
actions assist the leaders in achieving organisational goals. Hence, an important domain of RL
literature focuses on the antecedents and organisational outcomes for ethical decision- making
from employees’ perspectives (Brown & Treviño, 2006; Pless et al., 2012; Tenbrunsel &
Smith-Crowe, 2008; Voegtlin et al., 2012; Waldman & Galvin, 2008; Waldman & Siegel,
2008).
2.3.2 RL in social and stakeholder perspectives
From the societal perspective of RL, Doh and Quigley (2014) suggest that the leaders who
can consistently apply a stakeholder approach may be better able to manage across cultural
boundaries (Miska et al., 2013). Leaders’ stakeholder perspectives may also identify and
anticipate critical socioeconomic challenges within business trends so that they can respond
more appropriately (Stahl et al., 2013; Maak & Pless, 2006b). Moreover, studies of corporate
governance emphasise that organisational leaders make decisions, which include CSR

48
strategies, within the framework of organisational-level governance mechanisms (Filatotchev,
2012). This may shape the foundations of leadership responsibility and accountability not
only to shareholders but also to a wider body of stakeholders (Scherer et al., 2013). Hence,
from organisational to social level integration, Doh and Quigley (2014) claim that the
responsible leaders with a stakeholder approach may help build an open, inclusive and diverse
internal culture by sharing and disseminating knowledge while fostering strong ties with
external stakeholders, all of which could lead to organisation growth, innovation and
performance (Thomas, 2004). Hence, a significant amount of literature attempts to integrate
studies in ethics, leadership and CSR to triangulate the evolving concept of RL (Maak &
Pless, 2006a; Waldman & Siegel, 2008; Pless & Maak, 2011; Waldman & Galvin, 2008;
Pless et al., 2012; Voegtlin et al., 2012; Fernando, 2016).
Maak and Pless (2006a) present RL as a relational and ethical phenomenon. They suggest that
the practice of RL results in social interactions with those who are affected by leadership and
have an interest in the leadership relationship. This expands the view of a traditional
leader-subordinate relationship to a leader-stakeholder relationship. They also advise shifting
attention to the responsibilities that leaders have in relation to different stakeholders, and
contend that relationships “are the centre of leadership” (Maak & Pless 2006b, p. 39), such
that “building and cultivating…ethically sound relations toward different stakeholders is an
important responsibility of leaders in an interconnected stakeholder society” (Maak & Pless
2006a, p. 101). Here, ‘others’ are all those with a stake in the leadership project. Thus, Maak
and Pless (2011) refer to a responsible leader as an individual who adapts “the idea of
effectiveness with the idea of corporate responsibility by being an active citizen and
promoting active citizenship inside and outside the organisation” (Pless 2007, p. 450). Hence,
from the societal perspective, RL helps to develop and promote sustainable relations among
the stakeholders within the society for a greater good and does not limit it to shareholders and
managers (Maak 2007). Therefore, Doh and Quigley (2014) observe a progressively visible
trend in the literature to incorporate ‘stakeholder’ consideration in the conceptualisation of
RL, perhaps in response to recent major world events (e.g., the global financial crisis,
environmental catastrophes, ethical scandals and globalisation).

49
2.3.3 RL in a global perspective
In the global context of RL, Voegtlin et al. (2012) questioned, “Who is responsible for what
and toward whom in an interconnected business world?” (p. 2). The quest for RL is not
confined to corporate scandals and collapses for responsible and ethical conduct (Brown &
Treviño, 2006); RL also originates from the differences in and new requirements of global
business contexts (Miska et al., 2013; Voegtlin et al., 2012). Stakeholders expect that
organisations and their leaders demand active roles in stimulating responsible behaviour,
within and outside organisations, such as by creating a reliable organisational culture,
pursuing a triple bottom line (social, environmental and economic value) approach and
performing as respectable citizens (Maak, 2007; Pless, 2007). According to Miska et al.
(2013), responsible leaders’ interaction with stakeholders provides a more clearer
understanding of what constitutes leadership responsibility, given the rising complexity of
conducting business in globalised conditions (Scherer et al., 2009; Scherer & Palazzo, 2008).
Maak and Pless (2006b) argued for applying RL to the integration of global stakeholder
society and leadership, for three reasons. First, it transcends the dyadic leader-follower model
to an understanding of leadership as leader-stakeholder collaboration. Second, it provides
normative orientation to deal with multi-cultural backgrounds or complex moral dilemmas.
Third, it enables leaders to produce moral or ethical decisions, thereby bringing different
interests to satisfying and, if possible, mutually beneficial solutions. Moreover, both Maak
and Pless (Maak, 2007; Maak & Pless, 2006b; Pless, 2007) characterised the concept of RL as
a “value-based and through ethical principles driven relationship between leaders and
stakeholders” (Pless 2007, p. 438). They also developed a role model of RL in which “the
responsible leader acts as a weaver of stakeholder relationships” (Maak 2007, p. 340), thereby
leveraging social capital for organisations. Thus, Voegtlin (2011) defined RL as recognition
and reflection of the outcomes of one’s behaviour for all stakeholders, as well as the attempt
to wield influence by facilitating the engagement of the concerned stakeholders to engage in
an effective stakeholder exchange. Therefore, responsible leaders attempt to weigh and
consider the interests of all stakeholders’ claims. This understanding of RL as an ideal based
on high moral standards encounters constraints in the day-to-day activities of organisations
(Stansbury, 2009).

50
From the above discussion it is understandable that RL is introduced as a multilevel concept
over the existing leadership practises and theories in the literature. The notion of RL is absent
in high-profile scandals on the individual, organisational, and systemic levels, despite its
potential usefulness in dealing with the social, ethical, and environmental challenges in the
global context for better leadership performance (Pless & Maak, 2011). Table 2.2 presents a
summary of the prominent scholars and their contribution to RL.
2Table 2.2: Scholarly contributions to RL literature
Authors RL and related concept Idea/conception/comments
Maak and Pless (2006a,
2006b); Maak (2007); Pless
(2007); Pless and Maak
(2009); Voegtlin et al.
(2012); Doh and Quigley
(2014); Waldman and Balven
(2015); Voegtlin (2011);
Waldman (2011)
Definition and concept
development of RL
Compared the emergent
understanding of RL with
related leadership theories
and directed pathways for
future research.
Lynham and Chermack
(2006)
Responsible leadership for
performance (RLP)
Leader’s responsible
(effective, moral and
persistent) leadership can be
connected to organisational
performance.
Voegtlin et al. (2012) Role of RL on organisational
outcomes across three levels
(macro, meso and micro) of
analysis.
RL does not conceptualise
leader success in the sense of
financial performance as the
primary driver of leadership
behaviour. Instead, RL
operates by establishing
consensual solutions that all
affected parties accept as
legitimate.

51
Authors RL and related concept Idea/conception/comments
Doh and Stumpf (2005);
Waldman and Galvin (2008);
Siegel (2014); Waldma and
Balven (2014)
RL as values-based
leadership
Researchers have shown a
significant amount of interest
in values-based leadership
approaches, and prefer RL
for its multilevel (individual,
organisational, social and
global) outcomes.
Voegtlin et al. (2012) RL in global business RL as a multi-level outcome
showed that how such an
understanding of leadership
can address the challenges of
globalization and offered
research opportunities for
responsible leadership in
global business.
Waldman and Siegel (2008);
Siegel (2014)
Socially responsible
leadership
Leaders play a significant
role in framing and executing
CSR initiatives, but debate
the appropriate drivers of
socially RL undertaken by
these leaders. They suggest
that an approach which takes
into account both
instrumental behaviour and
leader motives or values
holds potential in integrating
some of their differences.
Gond et al. (2011) RL and HRM with an
exploration of the CSR-HR
Interface
Organisation of the HR-CSR
interface can enable or
undermine the HR

52
Authors RL and related concept Idea/conception/comments
contributions to RL and point
to underlying cognitive
factors that shape the HR-
CSR interface.
2.4 Framing RL with other value-centered leadership theories
At present, organisations emphasising more responsible leadership as a part of their existing
leadership practices because of expectations from various quarters. Mirvis et al. (2010)
outlined the differences of modern approaches to leadership and point out that conventional
views emphasis profit, shareholder return and legal compliance to reduce impairments,
whereas current attitudes tend to emphasise value creation, stakeholder requirements and
broader social and environmental responsibilities. Hence, values are considered as central to
RL, and the thoughts related to business ethics connect in a variety of ways to the notion of
values (Maak & Pless, 2006a; Freeman & Auster, 2011). Simmerly (1987) suggests that
values within organisations shape how employees and leaders choose to act, the decision-
making process, relationships with people and behavioural expectations from each other.
From the value-driven perspective, RL shows a broader concern for multilevel (individual,
group and society) motivations and commitment for sustainable internal and external
stakeholder achievements. Pless (2007) established RL as “…a values-based and through
ethical principles driven relationship between leaders and stakeholders who are connected
through a shared sense of meaning and purpose through which they raised one another to
higher levels of motivation and commitment to achieving sustainable values creation and
social change” (p.438). Hence, value-based leadership guides leaders to undertake a conscious
obligation to manage their values and create a corporate culture that optimises economic
performance, ethical actions and social participation and reduces environmental impact. In
addition, Pless and Maak (2011) highlighted the importance of turning practitioners’ attention
to those leadership approaches and styles that are value-centred (ethical, authentic, servant
and transformational leadership). Therefore, RL is viewed as a broader, more comprehensive
leadership approach, far superior to any single value-based leadership theory. These value-

53
driven leadership theories and their similarities and differences with RL are reviewed in the
next section.
2.4.1 Transformational leadership and RL
Transformational leaders inspire their followers by promoting and demonstrating a mutual
vision and inspiring them to look beyond egotisms for the benefit of their teams and
organisations (Groves & LaRocca 2011). Transformational leaders are the executives who
promote and motivate their followers by projecting and communicating attractive visions,
common goals and shared values, as well as set examples for the requested behaviour (Bass &
Avolio, 1990; Bass & Riggio, 2006). A simplified model of transformational leadership
includes five leadership dimensions: idealised attributes, idealised behaviour (such as the
‘charisma’ dimension), inspirational motivation, intellectual stimulation and individualised
consideration (Bass & Avolio, 2000). The notion of RL has similarities to transformational
leadership, particularly in leaders’ common notion of vision, inspiration, intellectual
stimulation and individualised consideration (Pless & Maak, 2011). However, in many ways,
RL differs from the transformational approach. First, RL considers a broader range of
followers in leadership than transformational leadership. Pless and Maak (2011) suggested
that responsible leaders view their followers more broadly and consider the need of
stakeholders from both within and outside the organisation. Second, transformational leaders
focus more on employee performance and organisational achievements in consideration of
stockholder satisfaction. In contrast, RL focuses on broader achievements in terms of
stakeholder satisfaction and related higher social purposes from both the organisational and
societal perspectives. Hence, a significant advancement of the leadership concept is visible
from transformational leadership to RL: the change from a shareholder mindset to a broader
stakeholder orientation (Waldman & Galvin, 2008; Maak & Pless, 2006a). Third, RL
considers a wider view of organisational success than merely a focus on leaders’ individual
achievements. Thus, the concept of RL is less individualistic (e.g., unlike the great man and
charismatic leader models), and is inclined more towards relational aspects of leadership in
terms of inclusion, collaboration and assistance with various stakeholder groups (Pless &
Maak, 2011; Uhl-Bien, 2006).

54
Maak and Pless (2006a) recommend the application of RL in the broader leadership context
of stakeholder collaboration, new responsibilities and roles; these new roles can include, for
example, coordinators and cultivators who act as ‘weavers’ in and among a network of
relationships. Fourth, transformational leadership supports leaders’ ethical or unethical
behaviour depending on the leaders’ motivation to qualify as a moral leader with ethical
values and social motives that decline to use intimidation and manipulative influence (Bass,
1985; Brown & Treviño, 2006). On the other hand, Pless and Maak (2011) considered a
responsible leader as a virtuous individual with ethical knowledge (e.g., moral reasoning and
moral imagination) who makes ethical and moral decisions by maintaining influence with
stakeholders, while also using influence and power to attempt moral and legitimate
conclusions through justifiable means. In other words, to succeed as responsible, leaders must
be considered more accountable, trustworthy and ethical than in other leadership approaches
including transformational leadership. Fifth, rapid change in organisational contexts adds
further challenges for leaders. As a result, both transformational leadership and RL consider
the importance of change and transformation. However, responsible leaders exercise change
as a means to attain a higher social purpose, while transformational leaders do not necessarily
follow that path (Pless & Maak, 2011). Therefore, transformational leadership may have
success in terms of organisational profit and employee satisfaction but does not extend to
ensuring social achievements as RL would demand.
2.4.2 Ethical leadership and RL
Ethical leaders may achieve a higher level of results within organisations by exhibiting
qualities that will influence employees to work harder and more ethically. Brown et al. (2005)
define ethical leadership as “the demonstration of normatively appropriate conduct through
personal actions and interpersonal relationships, and the promotion of such conduct to
followers through two-way communication, reinforcement and decision-making” (p.120).
This broader notion of ethical leadership empowers managers as leaders to incorporate and be
explicit about their values and ethics. Compared to RL, ethical leadership is concerned with
individualistic effectiveness rather than communal or social responsiveness. For example,
during organisational decision-making, an action may be considered ethical at the
organisational level, but it may not be ethical for societal interests. Pless and Maak (2011)
explain that the central conceptual discrepancies between ethical and RL stem from their

55
diverse paradigmatic viewpoints. Ethical leadership is involved with the direction leaders take
in organisations and how leaders may use such direction to improve their leadership outcome.
In contrast, RL identifies effectiveness; as a result but primarily seeks to achieve the relational
view of the leader-stakeholder design and its links to elements of responsibility.
Moreover, RL confirms it’s pre-eminence over ethical leadership. First, it goes beyond ethical
standpoints from the relational perspectives. For example, the former emphasises the
significance of a full-range view of the leader-stakeholder relationship, while ethical
leadership limits its view to a classical leadership dyad of leader-subordinate (Pless & Maak,
2011). Moreover, Pless and Maak (2011) also point out that ethical leadership endeavours to
predict consequences, such as leader effectiveness, employee job satisfaction or dedication;
whereas RL embraces this micro-level perspective to concentrate on multilevel results (such
as those for the individual, group and society). Second, RL adopts a broader view in the
definition of ethical culture than ethical leadership. Ethical leadership theory reflects intra-
organisational contextual elements, such as an ethical culture (Trevino, 1990), but RL allows
more and addresses determinants from the cultural background, such as power distance and
human coordination (Pless & Maak, 2008). Third, RL can provide better justifications for
leaders’ ethical decisions and outcomes than ethical leadership. Voegtlin et al. (2012) argued
that ethical leadership remains commonly descriptive in its approach to assess leadership
ethics. In addition, by only describing the prevailing moral norms, ethical leadership does not
allow for a critical justification for what is ethically correct. Hence, Voegtlin et al. (2012)
suggested that ethical leadership neither provides ethical orientation for leaders nor offers
normative advice; therefore, there is still a prerequisite for a philosophical foundation, such as
RL that provides an orientation on how to manage the inconsistent norms of a heterogeneous
stakeholder society. Therefore, Voegtlin et al. (2012) suggested that RL is a process model of
leadership that is not only obviously linked to ethical features of the leaders but also
conceptualise ethical leadership as the antecedent of RL.
2.4.3 Servant leadership and RL
The notion of servant leadership was introduced by Robert Greenleaf in 1970 (van
Dierendonck, 2011). Later, Greenleaf (1977) distinguished servant leaders who place others’
demands, desires and concerns above their own interests. Thus servant leaders’ deliberately

56
choose to help others, and their primary motive is first to assist, as opposed to lead. Hence,
servant-leadership is to ask: “...do those served grow as persons; do they while being served,
become healthier, wiser, freer, more autonomous, more likely themselves to become
servants?” (Greenleaf, 1977, p. 13). However, Bass (2000) suggested that the theory of
servant leadership required substantial empirical research, with great promise for future
leadership prospects. Compared to RL, servant leadership shared leaders’ constituencies,
which include followers and stakeholders, and asserted that leaders’ task is to assist the
essentials and legitimate interests of others (Greenleaf, 2002). Despite this commonality,
responsible leaders do not attempt ‘self-sacrificial servanthood’ (Sendjaya et al., 2008, p.
405), just for the interest of serving followers and promoting their good. Thus, Pless and
Maak (2011, p. 7) noted that:
…the concern of the responsible leader is to mobilize others to serve, engage in, and
support objectives tied to a mutually desirable social purpose. That purpose is not
limited to helping others grow or become leaders in their own right; it also entails
organisational and societal levels (including positive outcomes such as sustainable
value creation and social change). The central motivation, therefore, is not serving
others but rather responding to others’ interests and needs, including those of
outside stakeholders and society at large.
The concept of RL also interprets followers as stakeholders in terms of being internal and
external followers of the organisation, not just as followers within workplaces. Hence, the key
priority for servant leadership is exercised with the issue of motivation and contextual factors,
an idea that has been neglected in servant leadership literature. Moreover, servant leadership
is contradictory in that it assumes a traditional top-down, individualised, self-centred
leadership approach (Pless & Maak, 2011). Therefore, RL shows more advancement in terms
of organisational demand for both internal and societal level of responsiveness and multilevel
leadership outcomes.
2.4.4 Authentic leadership and RL
Authentic leadership is a relative concept that satisfies followers’ need for accountability,
integrity, courage and transparency because of its focus on leaders’ own transparency, internal

57
principles and moral compass in the face of nefarious, shifting and possibly ethically
ambiguous business practices (Diddams & Chang, 2012). Authentic leaders are those who
know and serve based on their real values, beliefs, integrity and strengths (Avolio & Gardner,
2005; Walumbwa et al., 2008; Avolio et al., 2010). Hence, authentic leaders emphasise
building the leader's legitimacy through honest relationships with followers through which
leaders value their input and promote openness.
Both RL and authentic leadership have common positive organisational initiatives, such as
providing meaning at work and contributing to continued performance and progress with
long-term value creation for stockholders (Luthans & Avolio, 2003; Avolio et al., 2004;).
However, RL not only aims for positive organisational outcomes but extends beyond
traditional financial output variables (Maak, 2007; Pless, 2007). For example, RL
encompasses stakeholders’ participation in adding value and social capital to the business and
community, and thus eventually contributing to positive social change. RL advances and
appears to overlap authentic leadership with respect to its self-awareness and self-regulation
factors (Pless & Maak, 2005). RL challenges leaders to take additional steps to increase a
sense of others’ emotions, values and norms, reflect on the sufficiency of their own emotions
and values and evaluate them with respect to general principles and local needs (Pless &
Maak, 2005). Hartman (1988) suggested that the challenge of ‘authenticity’ for authentic
leadership becomes either how values are known or whether values are realisable through
action. However, ethical components are well established as a primary component in RL
which allows this approach to be considered more worthy than authentic leadership. Hence,
Werhane (1999) suggested the RL approach for moral deliberation and decision-making skills
for organisations.
In summary, RL integrates both ethical and democratic views of leader-follower-stockholder
integrations and the broader view of social responses to a higher extent than other value-based
leadership theories. Against the general backdrop of contemporary value-based leadership
theories, RL engages not only the internal concerns of organisations but also the concern of
external stakeholders. Above all, RL considers a broader, society-oriented view to redefine
the concept of organisational leadership. Thus, the primacy of RL over other value-based
leadership theories warrants empirical research. This study focuses on the individuals in
leadership positions within Australian organisations: both senior leaders and employees

58
serving in managerial or supervising positions. The suggested model applies equally to top,
middle and lower-level managers. Therefore, this study defines a ‘leader’ broadly to reflect
the notion of RL occurring throughout the organisation as well as in interactions with
shareholders. Here, the response of RL should be considered from employees’ perspective,
incorporating their assessment of their organisations’ inclusiveness of different stakeholders,
the fairness of its HR practices, and the managerial support they receive to perform their jobs.
Therefore, in this study the context of employees’ perceptions about RL comprises three
considerations: whether the organisations’ stakeholder culture encourages its managers to act
responsibly for its societies; whether organisation’s HR practices are fair and inclusive for all
employees; and whether there is managerial support that develops employees’ capability to
perform within the organisation.
2.5 RL and organisational performance
In recent times, organisational leadership has become more challenging, as it needs to
establish and show its concern for societal welfare, the natural environment and employee
wellbeing. With that call, the concept of responsible business moved into business philosophy
to determine precisely to what extent any business or leader’s behaviour could be considered
responsible. Moreover, the increasing numbers of corporate collapses, including those of
Enron, HIH and WorldCom, have made the question critical for business researchers. Hence,
the notion of RL is developing in connection with examinations of the responsibility of
different multinational companies towards their environment and community in the wake of
multiple scandals (Pless, 2007). RL focuses on a sustainable relationship among organisation
leaders and stakeholders that is intended to lead to beneficial outcomes for both the
community and the environment (Cameron, 2011).
According to Mirvis et al. (2010), only 20% of people surveyed in 25 countries agreed that
most corporations are socially responsible. Corporations are promoting RL values, but have
yet to adopt and establish them in practice to make the business world more responsible.
Hence, Grojean et al. (2004) has recommended various approaches that organisations can use
develop an ethical climate, including setting clear expectations for ethical conduct, setting an
example from the top and giving feedback and supporting responsible behaviour to recognise
and reward behaviour that promotes organisational values. Maritz et al. (2011) explained the

59
interface among strategy and RL. For example, for ‘top down’ strategic approaches, the
responsible leader must take the role of an architect, outlining a detailed plan and determining
what is needed to secure the alignment of all its components. Conversely, ‘bottom up’ or
emergent tactics require the responsible leader to serve as a change agent, supporting and
empowering lower-level employees to come up with novel ideas and consider independent
decisions.
In the literature, several researchers have demonstrated a significant relationship between
leadership styles, employees’ performance and organisational outcomes. Campbell (1977)
suggested that when managers use their various leadership styles to show concern, care and
respect for employees, employees achieve higher performance outcome for their
organisations. Many scholars have also found support for a significant association between
leadership style and organisational performance (Howell & Frost, 1989; Bryman, 1992). For
example, Sun (2002) found that leadership style has a substantial positive correlation with
organisational performance in both schools and enterprises. Similarly, Huang (2006)
established a positive association between transformational leadership and organisational
performance. Moreover, studies with leadership approaches in some organisational settings
have demonstrated the superiority of transformational and charismatic leadership, over other
leadership styles when predicting organisational performance. However, there is not much
attention given in the literature to the link between RL and organisational performance in the
Australian context.
Can RL contribute to a superior organisational performance? Lynham and Chermack (2006)
recommended a theoretical framework Responsible Leadership for Performance (RLP) to
demonstrate the influence of RL on organisational performance. RLP has an integrative
framework of leadership that specifies the nature and challenges of organisational leadership,
focusing on organisational performance. Lynham and Chermack (2006) indicated eight
strategic propositions to put their RLP theory into practice. (1) RLP has a theoretical frame
for leadership as a system-in-focus, in which leadership is conceptualised as a deliberate,
focused practice, not personal or a process controlled by an individual. (2) All systems have
an aim. The aim of RLP is to assist the needs and desired results of the constituency of a
performance system by positively influencing various domains of performance in a
responsible manner by an efficient, ethical and sustainable practice. (3) The content of RLP is

60
received from all three units of the theoretical framework-considerations of constituency, a
structure of ‘responsibleness’ and domains of performance. If all three groups are not existing
and associating, there is no system of RLP in action. (4) Leaders to be responsible, they must
manifest, and be judged to demonstrate effectiveness, ethics and persistence. If one of these
three characteristic properties is failing from leadership, that leadership cannot be viewed as
responsible. (5) A structure of responsibleness and domains of performance are
interdependent in the notion of RL. A shift in one unit can be expected to produce a difference
in the other two groups. (6) As responsibleness with effectiveness, ethics, and persistence
increases, the outcome of the overall performance system can be supposed to rise. (7)
Constituency is a prerequisite for RL for performance. Without a constituency, RLP will be
meaningless; and, (8) without managing inputs from constituency and outputs in the form of
multi-level results, the theory of RLP fails.
In addition to RLP, Voegtlin et al. (2012) proposed a new model of RL to address challenges
at different organisational levels. They advised that RL does not conceptualise leader success
in the sense of financial performance as the primary driver of leadership behaviour. Instead,
RL operates by establishing consensual solutions that all affected parties accept as legitimate.
This model highlights the role of RL on organisational outcomes across three levels of
analysis. First, the macro-level as a point of evidence involves the interaction of organisations
with the wider society. Second, the meso-level is observed as the level of analysis of internal
organisational structures and practices. Third, the micro-level is considered as the degree of
personal interaction of individual agents. In considering meso-level outcomes, Voegtlin et al.
(2012) suggested that the effects of RL may change the mutual practices and natures of
organisations. Moreover, for the micro level, responsible leaders may also have a direct and
considerable influence on their followers. Apart from the direct link between RL and
effectiveness, Voegtlin et al. (2012) assumed the additional indirect or mediational impact of
RL on organisational performance. For example, mediating variables such as external
stakeholders and personal level interactions may influence the direct relationship between RL
and organisations’ social and financial performance. The concept of RL offers new and
exciting possibilities compared to other existing leadership theories, but also shows
challenges for both academics and researchers because of its novelty (Fernando, 2016).
Hence, this study attempts to examine the influence of RL on employee outcomes and explore

61
the impact of RL on presenteeism, organisational commitment and employee turnover
intentions, based on Voegtlin et al.’s (2012) micro-levels.
Form the above discussion of RL, Table 2.3 summarises the major empirical findings relevant
to this study.
3Table 2.3: Summary of key empirical findings relevant to this study
Researcher(s) Aim of the Study Study Design Study Result(s)
Nyberg et al. (2008)
The aim of this study was to examine the association among managerial leadership and self-reported sickness absence and sickness presenteeism among Swedish individuals.
Multiple logistic regression analyses
Managerial leadership was found to be relevant for the understanding of sickness absence and sickness presenteeism in the Swedish working population.
Arnold et al. (2007)
To explore the relation between transformational leadership and psychological wellbeing with the mediational influence of meaningful work.
Anderson and Gerbing’s (1988) two-stage modeling approach
A positive relationship was found among transformational leadership and psychological wellbeing mediated or partially mediated by the meaning found in work.
Blegen and Severinsson (2011)
To provide a synthesis of the studies conducted and to discuss the relationship between nursing leadership and nursing management in the context of mental health nursing.
A literature search using EBSCO-host, Academic Search Premier, Science Direct, CINAHL and PubMed for the period January 1995–July 2010
Leadership and management in the context of mental health nursing are human activities that imply entering into mutual relationships.
Doh et al. (2011)
To investigate the relationships between perceived responsible leadership, HR practices, employees’ satisfaction, intention to leave and turnover among Indian
Correlation analysis
Strong associations were found amongst variables suggesting that employee’ views of the support they receive from managers, the HR practices, and corporate socially responsible

62
Researcher(s) Aim of the Study Study Design Study Result(s)
employees. activities may be an overarching construct that attaches them to the organisation.
Nyberg et al. (2008a)
To investigate the association between managerial leadership and ischaemic heart disease (IHD) between employees.
Cox proportional hazard analyses
An association between perceived leadership behaviours and IHD was also evident in subsidiary analyses with only acute myocardial infarction and cardiac death as the outcome.
Westerlund et al. (2009)
To investigate the associations between Attentive Managerial Leadership, and perceived stress, age relative self-rated health and sickness absence due to overstrain/fatigue, adjusting for the dimensions of the Demand Control Support model.
Correlational study
The study indicates that managerial leadership is associated with employee stress, health, and sickness absence independently of the Demand Control Support model and should be considered in future studies of health concerns for employees, and in work environment interventions.
McKee et al. (2011)
To explore linkages among transformational leadership, workplace spirituality and wellbeing in health care workers.
Multilevel modelling
Leaders’ influence on individual wellbeing through their ability to enhance employees’ sense of community in the workplace.
Nyberg et al. (2009)
To investigate destructive managerial leadership in the hotel industry in Sweden, Poland, and Italy in relation to psychological wellbeing among employees.
Cross-sectional exploratory study
Autocratic and malevolent leadership were more strongly related to iso-strain than was self-centred leadership. Variations in leadership practice between countries were seen for autocratic and malevolent leadership.

63
Researcher(s) Aim of the Study Study Design Study Result(s)
Nielsen et al. (2008)
To investigate the effects of transformational leadership on followers’ perceived work characteristics and psychological wellbeing.
A theory-driven model of the relationships using Structural Equation Modelling
The results indicated that followers’ perceptions of their work characteristics did mediate the relationship between transformational leadership style and psychological wellbeing.
Nielsen et al. (2009)
To examine two possible psychological mechanisms that link transformational leadership behaviours to employee job satisfaction and wellbeing.
Structural equation modelling
Self-efficacy was established to fully mediate the relationship among transformational leadership and wellbeing, and team efficacy was found to partially mediate the relationship among transformational leadership and job satisfaction and fully mediate the association among transformational leadership and wellbeing.
Sosik and Godshalk (2000)
To inspect relationships among mentor leadership behaviours (laissez-faire, transactional contingent reward and transformational), perception of mentoring functions received (career development and psychosocial support) and job- related stress.
Partial least squares (a structural equation modelling technique)
The association among mentor transformational behaviour and job- related stress was moderated by the level of mentoring functions received. Results are discussed as they relate to scholars who are becoming concerned in searching solutions to develop organisational members and allay job-related stress.

64
Researcher(s) Aim of the Study Study Design Study Result(s)
Gilbreath and Karimi (2012)
To investigate the extent to which supervisor behaviour is associated with employee presenteeism. It also investigated the efficacy of a measure of job-stress-related presenteeism among Australian employees.
Correlation analysis
Results suggest that presenteeism is subject to supervisor influence. This study also suggests that there are positive supervisor behaviorus that may affect the degree to which employees experience presenteeism. Supervisor behaviours that help employees keep their work in perspective may be especially helpful.
Munir et al. (2012)
To explore the mediating effects of work-life conflict among transformational leadership and job satisfaction and psychological wellbeing.
A longitudinal design with regression analyses
Transformational leadership style was directly associated with perceptions of work-life conflict, job satisfaction and psychological wellbeing.
2.6 Presenteeism
The term ‘presenteeism’ was coined by Sir Cary Cooper, American-born British psychologist
and professor at Lancaster University Management School in the UK. He defined
presenteeism as attending work whilst having medical conditions (Cooper, 2011).
Presenteeism in the literature is noted as an opposite of absenteeism (Wright et al., 2002;
Goetzel et al., 2004). It has been described as attending work while being ill, and at work but
unable to work with full capacity (Aronsson et al., 2000; Halbesleben et al., 2014; Lack,
2011; Brooks et al., 2010). This concept has been employed by several organisational
practitioners and researchers, both implicitly and explicitly, as one leading to productivity loss
(Goetzel et al. 2004; Johns, 2010; Scuffham et al., 2014). Thus, presenteeism results when
employees come to work despite physical or psychological illness that should keep them
away from work, and as a result reduces productivity (Aronsson et al., 2000; Gosselin et al.,
2013). This cost and productivity loss connected with presenteeism is found to be greater than
that of absenteeism (Goetzel et al., 2003; Hemp, 2004; Schultz & Edington, 2007).

65
There is no distinct, unified definition of presenteeism in the literature. Chapman (2005)
noted that, “[a]s with all new endeavors, no single authoritative definition of presenteeism is
in common use” (p. 1). Moreover, the definition of presenteeism has been defined from
employees’ behavioural as well as economic perspectives. For example, some researchers
focus on the issue of sick employees being at work and not being productive, and others
consider their behavioural responses. Hence, the definition of presenteeism can be stated from
both economic or financial and behavioural perspectives. This study examines presenteeism
from the productivity perspective, where employees are becoming less productive in their
performance outcomes.
From an economic point of view, presenteeism is defined as reduced productivity at work due
to employees’ health conditions or other events, such as office politics or work conditions that
distract them from desired productivity (Hummer et al., 2002; Whitehouse, 2005; Turpin et
al., 2004). Several studies identify presenteeism in terms of productivity loss due to illness
and attempt to quantify the impact of health conditions and symptoms on employees’ overall
productivity (Reilly et al., 1993; Koopman et al., 2002). Hence, the economic or financial
focus consider presenteeism for employees with health conditions who come to work but
struggle to reach their normal level of productivity.
From the behavioural perspective, presenteeism encompasses a number of possibilities, such
as physical or psychological ill-health, disillusionment with the workplace, a protest element
at perceived unfairness and poor work-life balance arrangements. Therefore, behavioural
perspectives define presenteeism in several ways. For example, Evans (2004) defined
presenteeism as going to work in spite of feeling unhealthy and suffering other events that
might generally compel an absence (e.g., child care facilities). Similarly, presenteeism is also
defined as working longer hours, thus putting in ‘face time’ while being unwell (Worrall et
al., 2000; Simpson, 1998).
In the literature, presenteeism has been criticised for being diffused and lacking nuance
because of the above-mentioned perspectives. Johns (2010) gathered a list of 10 different
definitions, including his own; the definitions have in common the concern of being present at
the workplace while in ill health either physically or psychologically, this concern but
expressed in various ways. For example, researchers have used other terms with similar

66
meaning, such as sickness attendance (Dellve et al., 2011; Hansson et al., 2006; Johansson &
Lundberg, 2004) working through illness (Dew et al., 2005), and inappropriate non-use of
sick leave (Grinyer & Singleton, 2000). This study consequently uses the term ‘presenteeism’
as ‘sickness presenteeism’, referring to the definition of Aronsson et al. (2000) as going to
work while being ill (physically, psychologically or both), and at work, but unable to work at
full capacity. This definition is preferred for this thesis because of its simple wording and easy
comprehension, increasing the usefulness of this thesis to people from a broad range of
backgrounds.
2.6.1 Absenteeism vs. presenteeism
A discussion of presenteeism should begin with some focus on absenteeism, as it is
considered the opposite of presenteeism in the literature (Goetzel et al, 2004; Aronsson et al.,
2000; Lowe, 2002; Gosselin et al., 2013). The notion of absenteeism is described as the
failure to report for scheduled work (Johns, 2002). In the 1950s, Canfield and Soash (1955)
shifted their focus from absenteeism to presenteeism. They projected presenteeism as a
positive attribute, as employees indicate an attitude that values ‘showing up’ as opposed to the
negative behaviour of being absent (absenteeism). According to Covner (1950), absenteeism
is a viable and reasonable area for research as it is apt to happen with ‘consistency of pattern’,
indicating trends toward healthy attendance behaviours. Moreover, Smith (1970)
distinguished between illness-absenteeism and non-occupational illness-absence and found
that most of instances for being unable to come to work (absenteeism) were due to sickness or
injury. He also suggested that interviewing and counselling for employees may provide
effective focus on presenteeism and should be included in organisations’ formal policies.
Thereafter, in the 1980s and 1990s, corporate mergers and downsizings influenced
management to continue to work beyond regular hours, and attracted practitioners’ increased
focus on presenteeism. This is because, as Aronsson et al. (2000) suggested, long working
hours for many white-collar employees caused sickness presenteeism, reduced benefit levels
and increased sickness compensation for organisations.
Both absenteeism and presenteeism are the outcomes of a particular decision point: the choice
between going to work and not going to work. This decision point is the common thread in
the constructs, but developed from different literature and explained using different theories

67
(Halbesleben et al., 2014). In contrast to absenteeism, presenteeism considers “mutual
alternatives” (Aronsson & Gustafsson, 2005, p. 964), because a simultaneous consideration of
both absenteeism and presenteeism explains the process by which an employee chooses
between absence and presence when they are sick. However, Aronsson & Gustafsson (2005)
proposed a conceptual model where presenteeism may result in either destructive or
salutogenic (i.e. factors that support human health and wellbeing) outcomes. They explained
that presenting to work when ill may either make the illness worse and lead to sickness
absenteeism, or serve as therapy if the workplace denotes a healthy social environment. On
the other hand, being absent from work due to sickness may have unexpected negative
consequences on employees’ health due to being excluded from the labour market or a host of
issues related to returning to work.
Comparisons of the cost between absenteeism and presenteeism are well discussed in the
literature. Goetzel et al. (2003) separated productivity loss from absenteeism and the amount
of unproductive time spent at work when affected by a condition, or presenteeism. They
emphasised presenteeism by indicating employees’ physical presence at work. On the other
hand, Kumar et al. (2003) suggested that absenteeism and presenteeism exhibit exactly
opposing rates of increase and decrease relative to each other. In their study, they found that
while longer hours spent performing work indicated reduced absenteeism, presenteeism rose
significantly. Moreover, Stewart et al. (2003) found that the cost of presenteeism is three
times higher than that of absenteeism in the US. Similarly, it was claimed that presenteeism is
far more costly than its sickness-related absenteeism and disability (Hemp, 2004). Therefore,
from a managerial point of view, organisations have an interest in taking balanced decisions
so that on one hand, employees do not shirk (reducing absenteeism), and that, on the other,
they take some days off when needed, to avoid presenteeism (Brown & Sessions, 2004). The
current study also considers the significance of presenteeism over absenteeism in the
Australian context because of the observations found in the literature and examines the
influence of RL in Australian organisations.
2.6.2 Types of presenteeism
Cooper identified four types of presenteeism (Cooper, 2011). In fully functioning
presenteeism, employees are healthy and rarely take sick days. They are involved and

68
motivated, and participate in their jobs. In sickness presenteeism, employees turn up to work
but their health is suffering to greater or lesser degree. Although they are not well, their job
insecurity is such that they come to work even when they are feeling unwell, but they are
mostly unproductive. In job dissatisfied presenteeism, employees are usually physically and
psychologically healthy, but have more absences from work than the average employee. Their
work may not have damaged them instantly, but they are less involved or committed to their
job. This is because there may have a mismatch between their character or capabilities and
their position or role requirements, or because they are poorly managed. Lastly, presenteeism
in the stressed or chronic unhealthy is a combination of those who have severe chronic health
conditions and those whom the job itself has damaged.
In contrast, Quazi (2013) classified presenteeism in terms of two different types of employee
behaviours. In sickness presenteeism, employees come to work with health or other physical
or psychological conditions that reduce their on-the-job productivity. In non-sickness
presenteeism, employees come to work while experiencing life conditions that are not related
to sickness (e.g., personal financial difficulties, stress, perceived workplace pressure, legal or
family problems) and perform below capacity (Milano, 2005). However, non-sickness
presenteeism can also be perceived when employees spend time at work on personal matters.
For example, Casale (2008) reported that employees spend about 2.5 to 5 hours per week at
work undertaking personal concerns. However, the current study is concerned with ‘sickness
presenteeism’ and refers here as ‘presenteeism’.
2.6.3 Causes of presenteeism
When employees report (or are forced to report) to work while they are ill or have medical
conditions, this can result in productivity losses. Several factors may influence the occurrence
of presenteeism in organisations, and various studies have identified several causes. For
example, Johns (2010) indicated that the primary factors that influence presenteeism are
employees’ personal financial challenges, work related stress and perceived pressure from
managers or colleagues to attend work. Quazi (2013) found that employees were more likely
to go to work ill during economic downturns for job security, financial reasons, work
environment, time pressure, and other reasons.

69
One of the frequently mentioned reasons for presenteeism is employees’ job security. Johns
(2007) suggested that one of the reasons for presenteeism is feeling of job insecurity caused
from organisational downsizing or restructuring. Hence, job (in)security is deemed to be the
most probable explanation for sudden drops in sickness absenteeism rates during periods of
layoffs (Luz & Green, 1997). Patton (2012) reported that half of those who were willing to go
to work sick indicated that the most important reason for their decision was job security.
Similarly, Worrall and Cooper (2007) suggested that employees work extended hours to
appear diligent when they feel insecure in their positions, which makes presenteeism more
likely.
Some employees may attend work while unwell because of financial difficulty and lack of
personal or sick leave. According to Johns (2007), presenteeism might occur when employees
think that the option of absenteeism is not available or is perceived to be more costly. A
survey in the U. S. by CIGNA Corporation found that 25% of respondents came to work sick
because they needed money, and 38% cited a sense of duty towards their company (Casale,
2008). Other studies have suggested that presenteeism may have more to do with a sense of
duty than financial difficulty or lack of personal or sick leave (Quazi, 2013). For example,
some employees attend work because they may not want to disappoint their team members.
Gurchiek (2009) suggests that two-fifths of employees base their work ethic and dedication
on the belief that their organisations or co-workers need them to be at work despite their being
ill or having other issues, while about one-fourth of them come to work when ill or having
other issues of financial need. Thus, rewards for good attendance regardless of productivity,
or sick leave resulting in a negative point on a performance appraisal may be considerations
for those worried about job security (Grinyer & Singleton, 2000; Lowe, 2002).
Work environment plays a significant role in presenteeism outcomes. Dew et al. (2005)
described the work environment as either a ‘battleground’ or a ‘sanctuary’ depending on
factors such as pressures faced by employees and the way employees cope, control and make
choices. Barnes et al. (2008) found that the perceptions of work in terms of clarity of roles,
job demand, and control and the quality of one’s relationship with management and
colleagues were related to sub-optimal job performance. Caverley et al. (2007) suggested that
work-related factors, such as job security and relationships with supervisors and colleagues
were significantly associated with presenteeism. Moreover, the influence of teamwork and

70
pressure from colleagues also act as a driver to be present at work despite being ill (Grinyer &
Singleton, 2000).
Work overload and time pressure are also recognised in the literature as factors promoting
presenteeism. Both situations involve employees experiencing a high volume of work on a
daily basis (Aronsson et al., 2000; Biron et al., 2006; Lewis & Cooper, 1999; Lowe, 2002).
Preziotti and Pickett (2006) identified that 60% of respondents felt pressured to go to work
out of concern that their work might not be completed, making it one of the prevalent causes
of presenteeism. Caverley et al. (2007) argued that a lack of replacements and the need to
meet deadlines causes presenteeism to flourish. Hence, presenteeism is high when there is
difficulty in finding replacements, and work left undone must be done by the employee on
return to work (Dew et al., 2005).
Employees’ psychological reasons may also be symptoms of a larger issue of presenteeism
prevalent in almost every workplace (Quazi, 2013). For example, some employees may feel
guilty for missing work, which may be attributed to their strong commitment to their jobs,
which in turn raises the likelihood of sickness presenteeism (Hansen & Andersen, 2008). A
survey by the National Foundation for Infectious Diseases indicated that 48% of the
respondents felt guilty for missing work (Preziotti & Pickett, 2006). The inspiration of
teamwork or pressure from colleagues also acts as a driver to be present at work despite
having health conditions (Grinyer & Singleton, 2000). According to Hansen and Andersen
(2008), when higher levels of co-operation in performing work tasks are required, higher
levels of presenteeism are also displayed, as employees depend more on each other for the
completion of duties in workplaces. Similarly, Luz and Green (1997) found that group
cohesiveness might restrain employees from being absent from work. For example, Quazi
(2013) suggests that employees tend to be more concerned about having fellow colleagues
carry additional workload for them during their absence, so they turn up for work despite
feeling ill. Therefore, they are tempted to report to work when they are sick out of loyalty to
their colleagues (Dew et al., 2005).
Ramsey (2006) considered six reasons employees come to work despite being sick. First is
fear of falling behind; for example, employees feel that missing work due to sickness might
put them behind schedule. Second is the iron man mentality; for example, some employees

71
believe that missing work for sickness is a sign of weakness, and they consider it. To them, it
is more important to show that they are invincible. Third is reluctance to use sick leave; for
example, employees would like to accumulate their sick leave especially when they have the
opportunity to cash it in. Fourth is the ‘indispensable man theory’; for example, some
employees think that their organisation cannot run without their presence. Fifth is wishful
thinking; for example, some people keep hoping that they will get better without missing
work. Sixth is a misunderstood sense of duty; for example, some employees may be highly
conscientious and worried about letting down their fellow workers, bosses and the whole
organisation if they miss work due to illness.
Apart from these factors associated with presenteeism, a number of articles have also
suggested significant relationships with other personal and work determinants such as high
work-life conflict (Duxbury & Higgins, 2001), professionalism and guilt, perceived
seriousness of the ailment (Biron et al., 2006), rewards for low absence rates (Kristensen,
1991) and control over the labor market (Kivimaki et al., 2005), as reasons to engage in
presenteeism. This study focuses on the leadership and manager-employee relationship to
examine RL and presenteeism, and includes the mediational influences of organisational
commitment and employee turnover intentions among Australian employees. Table 2.4
summarises the above discussion with the various causes of presenteeism as described in the
literature.
4Table 2.4: Summary of the causes of presenteeism
Author(s) & Year Causes of Presenteeism
Johns (2010) Personal financial difficulties, work stress and perceived
work load from managers or co-workers to join work.
Quazi (2013) Economic downturns and job security, financial reasons,
work environment and time pressure.
Johns (2007); Patton (2012) Job insecurity caused from organisational downsizing or
restructuring.
Gurchiek (2009) Organisation’s or co-workers’ need them to be at work
despite being ill or having other issues.
Dew et al. (2005) Work environment; loyalty to their colleagues.

72
Author(s) & Year Causes of Presenteeism
Caverley et al. (2007) Job security, relationships with supervisors and colleagues;
lack of replacement and the need to meet deadlines.
Grinyer and Singleton (2000) The influence of teamwork and pressure from colleagues.
Biron et al. (2006); Preziotti
and Pickett (2006); Aronsson
et al. (2000); Lewis and
Cooper (1999); Lowe (2002)
Work overload and time pressure.
Hansen and Andersen (2008) Employees may feel guilty for missing work, which may
be attributed to their strong commitment to their jobs.
Ramsey (2006) Fear of falling behind; iron man mentality; reluctance to
use sick leave; indispensable man theory; wishful thinking;
misunderstood sense of duty.
Duxbury and Higgins (2001);
Biron et al., 2006; Kristensen
(1991); Kivimaki et al. (2005)
Work-life conflict; professionalism and guilt, perceived
seriousness of the ailment; rewards for low absence rates;
control over labor market.
2.6.4 Cost of presenteeism
In the 1950s, scholars and practitioners attempted to quantify losses in productivity caused
presenteeism, the situation of being ‘here but not all there’ (Canfield & Soash, 1955). The
concept of presenteeism became more familiar to describe employees who performed at less
than fully functional levels. In the last decade, a great deal of work was done to estimate real
costs of productivity loss linked to presenteeism (Lynch & Reidel, 2001; Burton et al., 1999;
Goetzel et al., 2003; Collins et al., 2005; Koopman et al., 2002).
In the literature of presenteeism, researchers have argued that coming to work when unwell
may be expensive and more damaging to productivity and performance than deciding just to
stay home for the day (Hemp, 2004; Berger et al., 2003; Wang et al., 2003). For example,
Bank One in the US found that presenteeism costs $311.8 million annually, while the annual
total cost for medical treatments and prescriptions, absenteeism, and disability is $176.2
million (Hemp, 2004). Hence, this cost recommends that a less than fully performing

73
employee on the job can have a dramatic impact on workforce productivity and organisations’
profitability.
Presenteeism generates an economic burden on both the micro (organisational) and macro
(national) economies. For organisations, Goetzel et al. (2004) suggested that the costs of
presenteeism exceed direct medical expenses and that depression, and other psychological
illnesses were among the highest contributors to presenteeism. Goetzel et al. (2003) also
identified that productivity-related losses are higher for psychological conditions than for
physical. Ozminkowski et al. (2004) indicated that the cost of presenteeism reaches between
$2,000 and $2,800 per employee every year; and Burton et al. (2006) obtained comparable
outcomes as well as a new estimate for 2004 of between $1,392 and $2,592. A study reported
in the Harvard Business Review advises that US companies may lose $150 billion annually
because of presenteeism (Hemp, 2004). Research by PriceWaterhouseCoopers (PwC, 2009)
exposed that presenteeism may cost employers up to seven times more than absenteeism per
employee per year. Using the Chartered Institute of Personnel and Development (CIPD)
figures as a base, they calculated the cost of presenteeism at just below £5,000 (approximately
AUD$7,960) per concerned employee per annum. At the national level, presenteeism cost the
Australian economy $A 34.1 billion for the year 2009-2010, or 2.7% of the GDP (Medibank,
2011). This is even higher in the USA. For 2010, presenteeism costs the US economy $US
180 billion or 1.7% of its GDP (Weaver, 2010). Similarly, in the UK, presenteeism costs 13
million lost working days annually (Hardy et al., 2003). Therefore, presenteeism indicates a
substantial impact on employees’ productivity and imposes a significant economic burden
both on businesses and national economies.
2.7 Presenteeism and workforce productivity
Presenteeism refers to workforce productivity and considers the employees who are present at
work but may not be working to full capacity due to their psychological or physical ailments
(Burton et al., 1999). According to CCH Incorporated (2003), “presenteeism is a new term
used by human resource professionals to describe circumstances in which employees come to
work even though they are ill, posing potential problems of contagion and lower
productivity”(p. 163). Similarly, Levin-Epstein (2005) defines presenteeism as lost

74
productivity that happens when employees come to work but work below par due to any
illness.
In recent years, the discussion on workforce productivity has shifted its focus away from
employee absence to presenteeism (Halbesleben et al., 2014), measured as the extent of
various diseases, conditions and symptoms that negatively affect the work productivity of
employees who choose to work through the illness (Chapman, 2005). For example, poor or no
health care benefits (Athey, 2009), perceptions about work environment (Pilette, 2005),
perceived pressures from supervisors or co-workers (Grinyer & Singleton, 2000), fear of
disciplinary action and the risk to promotion opportunities (McKevitt et al., 1997), meeting
job demands (Halbesleben et al., 2014), job insecurity (MacGregor et al, 2008) and
employees’ belief that their illness or medical condition is not severe enough to warrant
staying home (Johns, 2010) may result in employees presenting to work when they are in ill
health, but their presence is merely physical and their productivity suffers.
From the individual perspective, presenteeism may result from employees’ perceptions of
their given workload (Athey, 2009). For example, some employees work with ill health and
feel they have too much work to do, need to meet deadlines, feel morally obligated and feel
there is inadequate coverage to handle their job responsibilities (Aronsson & Gustafsson,
2005; Athey, 2009; Johns, 2010). As a result, they damage the quantity and quality of
employees’ productivity, as well as that of their work team and their co-workers as
individuals. Hence, presenteeism can result in the exacerbation of existing medical conditions,
accidents and errors due to impaired functions, additional time needed to complete tasks,
irritability, fatigue, poor concentration, and decreased motivation (Aronsson et al., 2000;
Hemp, 2004; Johns, 2010; Pilette, 2005). Therefore, presenteeism can decrease performance
output and negatively affect workgroup productivity (Aronsson & Gustafsson, 2005; Hemp,
2004; Scuffham et al., 2014). The current study considers the productivity perspective for
presenteeism and examines RL for its influence on employee productivity with the
mediational influence of organisational commitment and employee turnover intentions.

75
2.8 Organisational commitment
The notion of organisational commitment is considered to be a multidimensional construct
that can have a meaningful impact on organisational performance and effectiveness (Meyer &
Herscovich, 2001). It has been extensively researched for years and found to be a reliable
predictor of voluntary employee turnover and employee intention to leave the organisation
(Meyer & Allen, 1997). In general, organisational commitment refers to the strength of an
employee’s identification with organisational goals and the importance of remaining with the
organisation (Mowday et al., 1982). The term ‘commitment’ considers the psychological link
or bonding between employees and their organisations. The essential characteristics of
commitment have been considered as: (1) a faith in and approval of the organisation's goals
and values; (2) compliance to exert a work effort toward achieving goals; and (3) a desire to
continue job with the organisation (Allen & Meyer, 1990; Porter et al., 1974). Organisations
historically claim that they value the concept of employee commitment, which, according to
modern literature, is often considered an essential element in employee performance (Kouzes
& Posner, 1993; Peters & Waterman, 1982). Hence, the study of organisational commitment
steadily gains interest, as the effects stemming from the level of employees’ commitment can
have a significant impact on organisations and society as a whole (Mowday et al., 1982). An
understanding of organisational commitment is essential for organisations to consider
employee retention, reduce turnover and achieve greater organisation outcomes (Tett &
Meyer, 1993; Allen & Meyer, 1996). Several studies show that organisational commitment
has a negative relationship with employees’ propensity to leave organisations during times of
change and upheaval (Meyer & Allen, 1997; Tett & Meyer, 1993).
In previous studies, organisational commitment has been considered both as a consequence
and an antecedent of employees’ work-related variables (Meyer et al., 1989; Cohen, 1993;
Hunt & Morgan, 1994). Many studies have suggested that an increase in organisational
commitment has the potential to increase organisations’ productivity and profit margins, as
well as their employees’ health and wellbeing (Blau & Boal, 1989; Cohen, 1993; Eisenberger
et al., 1997; Meyer et al., 1993; Mitchell et al., 2001; Tett & Meyer, 1993). However, Mathieu
and Zajac (1990) argued that “although higher levels of commitment may relate to improved
job performance in some situations, the present findings suggest that commitment has very
little direct influence in most instances” (p.184). This inconsistency may be because of the

76
ways in which commitment has been conceptualised and measured. Academics and
practitioners define commitment and put it into practice in different ways, and it is
challenging to incorporate the results of the accumulating research (Akhtar & Tan, 1994;
Hrebiniak & Allutto, 1972). The concept of organisational commitment can take several
forms, and it is, therefore, imperative that researchers state explicitly what form or forms of
commitment are being studied to ensure that the measures, they use, are appropriate for that
purpose (Meyer et al., 1993). The current study focuses on employees’ commitment toward
their organisations as defined by Meyer and Allen (1997).
2.8.1 Definitions of organisational commitment
Organisational commitment refers to a psychological bond between employees and their
organisations, and describes the likelihood that employees will not leave their organisations
voluntarily (Allen & Meyer, 1996; Meyer & Allen, 1991). However, various scholars and
researchers have offered several definitions from different points of view. For example,
Mowday et al., (1982) suggested that organisational commitment indicates the relative
strength of an individual’s identity and involvement in their organisation. From a cost-based
perspective, Kanter (1968) views commitment as “a profit associated with continued
participation and a ‘cost’ associated with leaving” (p. 504). However, Marsh and Mannari
(1977) considered commitment as moral responsibility, where employees feel obligated to
maintain employment with the organisation, regardless of how little status enhancement or
satisfaction their organisations provide. It is evident that there is no single definition for
organisational commitment in the literature (Akhtar & Tan, 1994).
Most researchers agree that organisational commitment comprises a psychological bond
between employee and organisation, but their definitions differ in the nature of the
psychological state being described (Meyer & Allen, 1997). This is because researchers have
scrutinised the nature of organisational commitment using two primary approaches: the
behavioural (or calculative) approach and the attitudinal approach (Akhtar & Tan, 1994).
Both methods are well established in the organisational commitment literature (Mowday et
al., 1982; Reichers, 1985; Salancik, 1977). The primary difference between them is that
attitudinal commitment research supports the idea that employees are committed to the group
first and then perform well, whereas the behavioural commitment approach supports the idea

77
that the employees perform well and are then committed to the group (Mowday et al., 1982).
The following two sections describe the approaches in detail.
2.8.2 Attitudinal approach to organisational commitment
There is significant agreement in the literature that organisational commitment is an attitude
(O’Reilly & Chatman, 1986; Allen & Meyer, 1990; Angle & Perry, 1981; Jaros et al., 1993;
Mowday et al., 1982). Hence, some researchers refer to commitment as a ‘psychological state’
(Allen & Meyer, 1990), others simply as a ‘bond’ or ‘linking’ (Mowday et al., 1982; Mathieu
& Zajac, 1990) of the individual to the organisation; an ‘orientation’ (Sheldon, 1971), a
‘readiness to act’ (Leik et al., 1999) or an ‘un-conflicted state of internal readiness’ (Brickman
et al., 1987). Thus, attitude is considered as an individual’s internal state preceding and
guiding action, feelings, beliefs and behavioural preferences (Ajzen, 2001; Ajzen & Fishbein,
1980).
Attitudinal commitment focuses on the processes by which employees think about their
relationships with their organisation (Mowday et al., 1982). It is also described as employees’
mind-set in which they recognise the extent to which their personal values and goals
correspond with those of organisation, exert considerable effort on behalf of the organisation,
and form a strong desire to stay with the organisation (Mowday et al., 1982, p. 27). The
majority of organisational commitment studies focus on the attitudinal approach (Mathieu &
Zajac, 1990; Mowday et al., 1979; Porter et al., 1974). Meyer and Allen (1997) suggested two
primary aspects of the attitudinal commitment approach. First, from an organisational
perspective, demonstration of strong commitment is associated with desirable outcomes, such
as lower absenteeism and turnover and higher productivity. Second, determination of
employees’ personal characteristics and situational conditions contributes to their high
commitment. Therefore, the attitudinal commitment approach focuses on the process by
which employees come to think about their relationship with the organisation mainly as a
mind-set in which they consider the degree to which their goals and values are corresponding
with those of their organisation (Singh et al., 2008). Here, organisational commitment is
deemed to be developed according to a prospective view, which asserts that an individual’s
psychological bond is a function of his or her involvement, loyalty and belief in the
organisation’s values.

78
2.8.3 Behavioural approach to organisational commitment
Meyer and Herscovitch (2001) stated that employees’ commitment includes ‘behavioural
terms’ that explain what actions a commitment implies. The behavioural approach to
commitment relates to the processes by which employees become locked into a certain
organisation and how they deal with that (Mowday et al., 1982). It focuses primarily on
recognising the conditions under which behaviour, once shown, tends to be recurring, as well
as on the effects of such behaviour on attitude change (O’Reilly & Caldwell, 1981). Hence,
the behavioural commitment views employees as being committed to a particular course of
action (e.g., maintaining employment with an organisation), as opposed to being committed to
the organisation itself (Meyer & Allen, 1997).
The behavioural approach evolved as a result of Becker’s (1960) side-bet theory of
commitment, described by Hrebiniak and Alutto (1972) as “a structural phenomenon, which
occurs as a result of individual organisational transactions and alternations in side-sets or
investments over time” (p. 556). Becker (1960) believed that employees can make certain
investments or ‘side-bets’ in their organisations and these investments then become sunk costs
that reduce the attractiveness of leaving the organisation for employment elsewhere. The
‘side-bet’ is some action or interest or environmental condition that is important to the
individual and influences consistency of behaviour (Becker, 1960; Salancik, 1977).
Inconsistent behaviour would mean losing the side bet. As noted by Meyer and Allen (1997),
employees “[become] too committed to a particular course of action” (p. 9), as a result of the
accumulation of side-bets that would be lost if membership in their present organisation
terminated. Hence, organisational commitment can be seen as an outcome of perceived profit
from maintaining employment or disengaging from an on-going line of activity that is costly
to the individual; these choices result in commitment.
2.8.4 Components of organisational commitment
Some theorists have broken organisational commitment into components to better understand
its effects; researchers have defined these elements somewhat differently. For example,
Caldwell et al. (1990) wrote of compliance, identification, and internalisation commitment.
They suggested that compliance commitment occurs when employees adopt certain
behaviours to gain concrete rewards; identification commitment occurs when an employee
79
feels proud to be identified with the group; and, internalisation commitment occurs when an
individual’s values are congruent with the organisations values (Caldwell et al., 1990). There
are several other constructs of commitment theory as well (Becker, 1960; Sheldon, 1971). For
example, Meyer et al. (2006) suggested that employees’ commitment possesses both
cognitive and affective elements. The former are the behavioural expressions that form the
basis of the commitment (as described above); the latter encompasses whatever feelings a
specific mindset evokes (e.g., pride or guilt). Meyer and Allen’s work has been widely cited
and validated by a variety of studies, including a cross-cultural study (Kacmar et al., 1999).
The depth of this theory lies in its reliability, which makes it an appropriate framework for the
current study also.
Even though other conceptualisations of commitment have appeared in the literature (Mayer
& Schoorman, 1992; Pentley & Gould, 1988), the contribution of Meyer and Allen (1991,
1997) delivers the richest interpretation of commitment in their three-component model of
commitment. This model as explained by Meyer and Allen (1997) still dominates
organisational commitment research (Meyer et al., 2002). In their review of the three-
component model, Meyer and Allen (1991) identified three distinct components in the
definition of commitment: (1) commitment to an affective orientation, or desire to remain
with the organisation; (2) commitment to a perceived cost (continuance) associated with
leaving the organisation; and (3) commitment as an obligation (normative) to remain in the
organisation, each of which members may experience to varying degrees (Allen & Meyer,
1990a; Meyer & Allen, 1991). This current study includes the three-component model as one
of the mediators; the following section describes the model in more detail.
2.8.5 Three-component model of organisational commitment
The three-component conceptualisation of organisational commitment is considered the
leading model in organisational commitment research (Bentein et al., 2005; Cohen, 2003;
Greenberg & Baron, 2003; Meyer et al., 2002). The model was proposed by Meyer and Allen
(1991, 1997), who specified its components as affective, continuance and normative
commitment. While these components are different in nature from one another, together they
permit an analysis of the relationship between employee behaviour and organisational
outcomes; for example, policies based on such analysis can reduce the probability of

80
employee turnover for organisations. Allen and Meyer (1990) suggest that “employees with
strong affective commitment remain because they want to, those with strong continuance
commitment because they need to, and those with strong normative commitment because they
feel they ought to do so” (p. 3). According to Solinger et al. (2008), three perspectives are
noteworthy for analysing the presumed common conceptual ground of the three components.
First, all three elements are thought to reflect employees’ psychological state (i.e., want, need,
ought) and to address the attitudinal forms of organisational commitment (as described in the
previous section). Second, the three elements are assumed to be associated with organisations,
reflecting the idea that organisational commitment as an attitude. Third, the three states can be
considered simultaneously. Thus, for the conceptualisation of the components, organisational
commitment should be recognised as the ‘net sum’ of these three psychological states (Allen
& Meyer, 1990). The following three sections highlight the three components in detail.
2.8.5.1 Affective commitment
Affective commitment identifies an employee’s particular affinity or affection toward the
group, which is related to the retention in organisations (Meyer & Allen, 1997). This affinity
indicates a sense of shared identity between the employee and the organisation. Often this
shared identity comprises a shared value, which provides great motivation for employees to
contribute meaningfully to the work process. Additionally, managers note that employees
with high affective commitment report higher levels of adherence to policy and lower levels
of job turnover (Mowday et al., 1982). Thus, employees with affective commitment want to
stay in the organisation and have an emotional attachment to the organisation (Meyer &
Allen, 1997). As a result, high affective commitment leads to employees’ better job
performance (Rhoades et al., 2001; Rhoades & Eisenberger, 2002).
Affective commitment also reflects a person's identification with, involvement in, and
sentimental attachment to the organisation (Stinglhamber et al., 2002). According to Jaros et
al. (1993), “it is a degree to which an individual is psychologically attached to an employing
organisation through feelings such as loyalty, affection, warmth, belongingness, fondness,
happiness, and pleasure” (Jaros et al., 1993, p. 954). Mowday et al. (1982) described
affective commitment as the relative strength of an employee’s identification with and
involvement in a particular organisation (p. 27). Affective commitment is important in the
current study, because it appears to have the highest correlations with withdrawal cognitions

81
and turnover among the three commitment components (Meyer et al., 2002; Stinglhamber et
al., 2002). The construct might also tap some of the personal and emotional reasons why
employees come to work when they are unwell.
2.8.5.2 Continuance commitment
Continuance commitment refers to the state employees are in when they stay in a job because
they need to, not necessarily because they want to (Meyer & Allen, 1997). With this notion of
commitment, employees associate a cost with leaving, and stay in a position even after they
no longer feel an affinity for the group. Continuance commitment can create feelings of
resentment and negatively correlate with performance indicators, such as employee
attendance (Meyer & Allen, 1991). Similarly, it may show negative results for employers,
particularly when employees remain committed but not productive in workplaces (Reichers,
1985).
Continuance commitment may be developed as a consequence of actions or events that
increase the cost of leaving the organisation and does not involve the emotional aspects
associated with such decisions. Meyer and Allen (1991) summarised these actions and events
in terms of two sets of antecedent variables: various investments that employees make and the
employment alternatives that they believe exist; and employees’ recognition that investments
and/or lack of alternatives make their leaving more costly. If employees perceive that the
costs are too high to leave the organisation, they are likely to perform tasks that would ensure
continuous employment. However, a negative association is reported between continuance
commitment and promotion potential (Meyer et al., 1989; Shore et al., 1995), and no
significant relationship is with reported with either to job performance or absenteeism
(Gellatly, 1995; Hackett et al., 1994). Meyer and Allen (1991) suggested that before an
employee decides to leave, there is a period of disenchantment. During this phase, employees
may respond to dissatisfaction in three ways: they may express ideas about improvement
(voice); they may show a willingness to accept things the way they are (loyalty); or they may
withdraw (neglect). Researchers recommend that the stronger an individual’s continuance
commitment, the more likely they are to withdraw or express turnover intentions (Kacmar et
al., 1999).

82
2.8.5.3 Normative commitment
The third component of the three-component model described by Meyer and Allen is
normative commitment. In this instance, employees stay in the organisation out of a sense of
obligation and feel they ought to remain because of perceived obligations, such as rooted
norms of reciprocity (Meyer & Allen, 1991; 1997). Thus, employees with higher normative
commitment continue their jobs by consideration of their belief that it is the right or moral
thing to do (Meyer & Allen, 1991; Wiener, 1982). Wiener and Gechman (1977) suggested
that normative commitment is not a desire or passion that is fuelled by an individual’s
commitment, belonging instead to their sense of right and wrong. The influence of the
psychological contract, with its distinct emphasis that reciprocal obligations in an exchange
relationship will be fulfilled, might be the missing link in understanding the relationship
between trust and normative commitment (Meyer & Allen, 1997).
Employees under normative commitment also may feel that it is morally right to stay with
their organisations (Meyers & Allen, 1991). The association between normative commitment
and employee performance outcomes is positive, but weaker than that for affective
commitment (Randall et al., 1990). Meyer and Allen (1991) suggest that the beneficial effects
of normative commitment might be short-term for organisations than the other two
components of organisational commitment.
2.9 Overcommitment Within organisations, employees are expected to be highly committed to increasing
productivity but it remains a question that where to draw the line from higher commitment to
overcommitted employees. It will be significant to examine the adverse effects of
overcommitment on presenteeism. Researchers suggest that employees with overcommitment
drive high demand for restriction and approval, and repeatedly strain their resources, thus
precipitating exhaustion and breakdown in the long-term (Joksimovic et al., 1999). In the
literature, overcommitment is described as a continuing cognitive-motivational pattern of
maladaptive coping with demands identified by excessive striving and a failure to withdraw
from duties (Etzion et al., 1998; Siegrist et al., 2004). It is also considered as a risk factor for
strain even when there is no effort-reward imbalance; this may be because it appears to be a
personal, exhaustive work-related coping style (Preckel et al., 2007; Siegrist, 1996; Tsutsumi

83
& Kawakami, 2004). The concept of overcommitment in the literature is described more
extensively as effort-reward imbalance (ERI) theory in the organisational commitment
literature.
2.9.1 Effort-reward imbalance and overcommitment interaction
The ERI model was proposed in the 1990s. It claimed that where an imbalance exists between
the higher amount of perceived effort and lower level of perceived rewards, an increased risk
of ill health and distress is apparent (Siegrist, 1996). The theory held that work-related
benefits depend upon a mutual relationship between effort and rewards at work. Hence, the
ERI model claims that work characterised by both high effort and little rewards represents a
reciprocity deficit between ‘costs’ and ‘gains’ (Vegchel et al., 2002). In this model, effort on
the job is an element of a social contract that is reciprocated by adequate reward. Moreover,
rewards are disseminated by three transmitter systems: esteem, career opportunities, and job
security (Siegrist et al., 2004). This model connects higher work-related stress and sequential
morbidity to an imbalance between the amounts of effort employees devote to their work and
the rewards they receive (Siegrist, 1996). This model may be explained further and modified
by personal dispositions, such as overcommitment to work.
Overcommitment is introduced as an intrinsic component of the ERI model, and is believed to
clarify stressful practice caused from high-cost and low-gain conditions at work, as it induces
exaggerated exertions that are not met by extrinsic rewards (Siegrist, 1996). It is an individual
difference in the way employees experience effort-reward imbalance and appears to be
relatively stable over time (Preckel et al., 2007; Siegrist, 1996). The situation of effort-reward
imbalance is observed to be more frequent in employees who are extremely committed or
over-committed to their work (Kinman & Jones, 2008). Hence, overcommitment can be
described as a set of attitudes, behaviours and emotions that reflect extreme striving for
results with a higher intention to be recognised and valued (Siegrist, 2001). Therefore,
employees who are overcommitted are more likely to strive than a person in the same
situation who is less committed.
The ERI model is often applied to organisational and occupational health psychology
research, and is central to research on employee populations (Rennesund & Saksvik, 2010).
Some employees are assumed to be more at risk for experiencing an imbalance between effort

84
and reward at work, and effort-reward imbalance is postulated to be experienced more
intensively by persons characterised by overcommitment (Hetland et al., 2012). A potential
imbalance between effort and reward could lead to stress experiences and strain, and over
time could cause increased risk of adverse health effects, including illness and disease
(Tsutsumi et al., 2001; Joksimovic et al., 2002; Preckel et al., 2005; Vrijkotte et al., 1999; van
Vegchel et al., 2005; Siegrist, 2008). However, both external demands and internal needs can
contribute to ERI (Siegrist et al., 2004). Internal requirements are a result of an individual's
ambition and personal motivation; accordingly, a person's personality is of importance.
Overcommitment could be of particular interest and overcommitted individuals are proposed
to underestimate work demands and overestimate their capacities. This study considers
employee commitment as the mediational variable for the direct relationship between RL and
presenteeism, and it is essential to be aware of employees’ overcommitment effects on the
selected relational model.
2.9.2 Overcommitment and presenteeism
The ERI model is one of the most influential theoretical frameworks in occupational health
research studies (Siegrist, 2002). Various studies on ERI and overcommitment used critical
cut-off values to diagnose hazardous conditions to health at the workplace including
presenteeism (van Vegchel et al., 2005; Tsutsumi & Kawakami, 2004). For example,
employees’ overcommitment increases the risk of coronary heart disease (Kuper et al., 2002;
Preckel et al., 2005); significant physiological cardiovascular risk influences including
elevated lipid levels and haemostatic risk elements (Peter et al., 1998; Vrijkotte et al., 1999);
vital exhaustion (Preckel, von Känel et al., 2005); depression (Dragano et al., 2008); and
anxiety (Godin & Kittel, 2004). Studies have also found that a high level of overcommitment
is linked to decreased job satisfaction (Li et al., 2005), greater work-family conflict (Kinman
& Jones, 2008) and increased absenteeism (Godin & Kittel, 2004). However, some studies
have suggested that there is no evidence of an association between work attitudes and
behaviours, such as turnover intentions (Kinnunen et al., 2008; Derycke et al., 2010) and
sickness absences (Hanebuth et al., 2006; Griep et al., 2010).
Several factors are related to work and personal circumstances identified with presenteeism
including the concept of overcommitment (Bergstrom et al., 2009). Arronson and Gustafson

85
(2005) indicated that the risk of sickness presence can be affected by personal and work-
related demands for presence. In many cases, presenteeism has been shown to connote
perseverance in the face of difficulty, particularly when employees’ personality is also
considered (Johns, 2010). As a result, employees with an internal health locus of control, high
consciousness and hardiness and a strong work ethic who exhibit ‘workaholism’ or low self-
esteem may be prone to showing up at work despite their illness (Johns, 2010). Hence,
overcommitment may compel employees to achieve and surpass their ambitions in
workplaces. Bergstrom et al. (2009) suggested that among personal factors that can contribute
to presenteeism is employees’ overcommitment. Similarly, Hansen and Andersen (2008)
claimed that the most important personal circumstance of presenteeism is overcommitment.
Cicei et al., (2013) advised further research and studies on managerial and organisational
measures aimed at reducing overcommitment and promoting programs that discourage
presenteeism. However, this study does not focus on employees’ overcommitment issues as a
factor of presenteeism; rather, it examines the three-component model of affective,
continuance and normative commitment.
2.10 Employee turnover intentions The concept of employees’ turnover intentions is used interchangeably with other terms in the
literature, such as propensity to leave, staying or leaving intentions, intent to leave, or
intention to quit. This study uses the term ‘employee turnover intentions’ to refer to
individuals’ behavioural intention to leave their organisations (Good et al., 1996; Mobley et
al., 1979). It also indicates individuals’ assessed possibility that they will leave their work at
some point in the near future (Brough & Frame, 2004). Here, employees’ behavioural
intentions reflect the most honest and immediate cognitive antecedents of overt behaviour
(Fishbein & Ajzen, 1975; Triandis, 1977). The theory of attitudes proposes that the best single
predictor of employees’ behaviour will be a measure of their intention to perform that
behaviour (Fishbein & Ajzen, 1975).
Employees’ intentions to stay or leave their organisation are consistently related to turnover,
and this relationship is significantly stronger and more significant than the satisfaction-
turnover relationship (Lum et al., 1998). Hence, employee turnover intentions are the
culmination of employees’ personal decision-making process that links their thought

86
processes and behavioural action (Steel & Ovalle, 1984). However, employees’ turnover
intentions and actual turnover are not the same. Turnover indicates employees’ permanent
movement beyond the boundary of their organisations (Rahman & Nas, 2013); turnover
intentions refer to three specific elements in the withdrawal cognition process: thoughts of
resigning the job, the intention to search for new jobs and the intention to terminate
employment (Carmeli & Weisberg, 2006).
Several researchers have suggested that intentions have an immediate causal effect on
employees’ final turnover decision (Bedeian et al., 1991; Addae et al., 2006). Employee
turnover is considered detrimental to any organisation for cost and work disruption and has
become a much-studied phenomenon (Addae et al., 2006; Yousaf, 2008). Employees’ final
decision to quit their jobs is an undesirable outcome for both the organisation and employees
as it affects both parties. Hence, it is important to recognise employee turnover intentions to
minimise the negative impact on both employee and organisational performance (Low et al.,
2001). This study examines employee turnover intentions instead of turnover because of the
concern of before the fact reaction than highlighting the after the fact response of employee
outcomes.
2.10.1 From employee turnover intentions to turnover
The literature on turnover suggests that it occurs because employees, who dislike their jobs,
will look for alternative employment opportunities (Spector, 1997). Turnover and turnover
intentions are primary concerns for many organisations, particularly with relation to employee
performance and productivity. In addition to the cost of turnover, employee turnover
intentions also cost organisations money and lost opportunities. According to Joinson (2000),
organisations may incur costs that result from employees’ slower work pace or increased
absenteeism. For example, when employees are unable to come to work, the organisation
incurs costs in lost sales opportunities with lost service and also raises its costs by paying
overtime pay for employees who take on the work of absent employees. Though turnover
intentions are not the same construct as actual turnover, but often used as a surrogate measure
in workplaces. This is because the intention to leave is considered to be the immediate
precursor of quitting. Fishbein’s (1967) model of attitudes-intentions-behaviour and Locke’s
task motivation model have shown that employees’ intentions can be considered as the most
87
immediate motivational determinant of choice to stay with or leave their organisations (Locke
et al., 1970; Locke, 1968). Previous studies have supported this contention by offering
empirical evidence of the associations between turnover intentions and actual turnover
(Newman, 1974; Kraut, 1975; Porter et al., 1976; Steers, 1977).
Bluedom (1982a) reviewed 23 articles and reported significant positive relationships between
turnover intentions and turnover. In that comparison, 15 out of the 23 studies compared the
predictive power of turnover intentions with the predictive power of outcome variables. In 19
of 20 comparisons made in these 15 studies, turnover intention was the most accurate
predictor of turnover behaviour. Therefore, some researchers have recommended using
employee turnover intentions rather than actual staying or leaving behaviour as a criterion
variable (Coverdale & Terborg, 1980; Bluedom, 1982b). However, employee turnover
intentions can be criticised for not being a perfect measure. According to Mobley et al.
(1979), the association between employee turnover intentions and turnover appears to be
consistent, but it also accounts for less than 24% of the variance in turnover. They also
identified the probable reasons for this; for example, it may not account for impulsive
behaviour; it may not capture perception and evaluation of substitutes; and along with
individual, organisational and external conditions, a change may occur in the original
dimension between the first observation and that of the actual behaviour. Therefore, the more
precise the measure of employee turnover intentions and the less time between the
measurement and the true response of turnover, the stronger the relationship should be
(Mobley et al., 1979). In other words, the more organisations can predict employee turnover
intention, the less turnover may result in their future. This is the justification for considering
turnover intentions than turnover as a mediating variable in the current study.
2.10.2 Factors affecting turnover intentions
In the literature, several factors have been identified as influences on employees’ turnover
intentions. For example, Berry (2010) found that employee’s attitude, appraiser, peers,
management, organisational configuration, external compatibility and job demands are
significant for employee turnover intentions. Similarly, Cotton and Tuttle (1986) found that
employees’ self-assessment of compensation, job satisfaction, work experience, demographic
variables, family size, trust and organisational commitment affect employee turnover

88
intentions. Other researchers have found that job stability and enrichment (Luna-Arocas &
Camps, 2008), positive feelings and trust (Maertz et al., 2007), job prospects (Munasinghe,
2006), employee engagement (Macey & Schneider, 2008), pay and benefits (Heckert &
Farabee, 2006), employee performance (McNeilly & Russ, 1992), growth and development
(Grawitch et al., 2007), supervisors’ social support (Noe et al., 2005), job involvement and
organisational commitment (Blau & Boal, 1989) and organisational politics (Byrne, 2005)
may cause behavioural predisposition to stay or withdraw from the organisation and to judge
if a particular job can satisfy expectations. Joo (2010) suggests three specific reasons for
employee turnover intentions: employee dissatisfaction with organisation-wide policies; lower
levels of organisational commitment in workplaces; and influence of organisations’ learning
culture and leader member exchange (LMX) quality, or the different exchange relationships
leaders develop over time with various subordinates (Maertz et al., 2007). The causes and
factors affecting employee turnover intentions in the literature examined here are multiple and
complex and demand further study. To shed light on the antecedents of employee turnover,
researchers have focused attention on these factors, expecting that changes in them will effect
corresponding changes in turnover intentions and actual turnover rates (Biron & Boon, 2013).
The current study includes employee turnover intentions as a mediating variable on the
relationship between RL and presenteeism.
2.10.3 Two perspectives of turnover intentions
Both the human capital (Becker, 1975) and social exchange (Blau, 1964) theories
acknowledge and emphasise the usefulness of employee turnover intentions literature in
organisational studies. For example, Malik et al. (2011) suggested that these two theories are
powerful tools for understanding employees’ workplace behaviour. Identifying employees as
human capital (the human capital theory) suggests that development of employees enhances
their productivity and employability in the market, which may induces increased turnover for
better jobs (Green et al., 2000). This theory suggests that the employee relationships
developed in a context of trust, loyalty or mutual commitments and investment in employees'
development (through training or benefits) can create an active employee-mindset to stay with
their organisations (Cropanzano & Mitchell, 2005; Benson et al., 2004; Lee & Bruvold, 2003;
Maurer & Lippstreu, 2008). On the other hand, social exchange theorists (Blau, 1964;
Eisenberger et al., 1986; Sieben, 2007) suggest that social behaviour is the result of an
exchange process may affect employees’ turnover intentions. This theory suggests that such

89
exchange processes creates an atmosphere within organisations for honouring organisation-
employee relationships, which influences employees’ turnover intentions (Foong-ming,
2008), as employees are likely to reciprocate the supervisor’s support and trust by exhibiting a
strong commitment, loyalty and trust in return (Yukl, 2013). Similarly, Huselid (1995) and
Malik et al. (2011) found strong evidence for the social exchange theory as an association
with lower labor turnover. They also found that elements of human capital theory associated
with employees’ decision whether to stay with their organisations depends on reasons such as
managerial responses to employees’ cultural differences, organisational configuration,
external market demands and employee benefits. Hence, both theories may provide a better
explanation for turnover behaviour of the Australian employees for this study than either
theory on its own.
2.11 Chapter summary This chapter presented a review of the literature relevant to this study’s theoretical
framework. The review explained the relevant leadership theories focusing on RL,
presenteeism and its effect on work productivity, organisational commitment and employee
turnover intentions.
The first part of the literature reviewed organisational leadership theories including RL. It
addressed the evolution of leadership theories and offered a detailed analysis of RL with other
value-centered theories, such as transformational, ethical, servant and authentic leadership
theories. However, the notion of RL was presented with a multiple frame of definitions from
individual, organisational, social, stakeholder and global perspectives. Finally, RL was shown
to influence organisational performance. The chapter then reviewed the definitions of
presenteeism and contrasted it with absenteeism. Subsequent sections explained the type,
causes and cost of presenteeism from an organisational perspective. The association of
presenteeism with workforce productivity was described to support the conceptual framework
of this study.
The focus of organisational commitment in this literature review included its definition; the
two perspectives, such as attitudinal and behavioural approaches and its various components.
In addition, the organisational components were specified with Meyer and Allen’s (1991,

90
1997) three-component model including the affective, continuance and normative
commitment. Lastly, organisational commitment was reviewed with employees’ overcommit
where it described as the ERI interaction and adverse impact of presenteeism outcome.
The last part of this chapter considered employees’ turnover intentions. The discussion
included how turnover intentions tend to lead to actual turnover; factors affecting their
intentions; and the two perspectives of turnover intentions.
The next chapter describes the research methodology used in the current study to correlate the
relationship between RL and presenteeism with the mediation of organisational commitment
and employee turnover intentions. It also addresses the appropriateness of the research design;
indicates the research questions and hypothesis; describes the study population and sampling
frame, measurement instruments, data collection and analysis processes; and discusses issues
associated with validity and reliability for this study.

91
3 HYPOTHESES DEVELOPMENT
3.1 Introduction
This chapter provides further justifications for the development of this study’s hypotheses and
their justifications. The development of the research questions with supportive hypotheses and
objectives are essential steps in producing relevant results to be used in evidence-based
research studies (Farrugia et al., 2010). Sections 3.2 to 3.8 describe the main hypothesised
relationships among RL, organisational commitment, employee turnover intentions and
presenteeism. Sections 3.8 and 3.9 present the possible mediating role of organisational
commitment and employee turnover intentions on the relationship between RL and
presenteeism. Finally, Section 3.10 provides an overview of this chapter and builds on to
Chapter 4.
3.2 RL and presenteeism
The relationship between leadership and employee outcomes, such as productivity,
organisational commitment and employee turnover is well presented in organisational
literature. Yukl (2013) considered the concept of leadership from two perspectives: as a role,
where a person has certain responsibilities and functions, and as an influence process that
occurs within a social system. In this study, leadership refers to managerial leadership, where
leaders influence employees by holding a formal managerial or supervisory position within
organisations. These leadership roles may also influence employees’ physical and
psychological wellbeing, which in turn may lead to employee productivity and presenteeism.
However, employees judge their managers’ leadership roles and response by different levels
of productivity. There is ample evidence in the literature for the association between
employees’ perceptions of how their managers are and behave, and the level of stress and
health conditions at their workplaces (Tepper, 2000; Offerman & Hellman, 1996; Stordeur et
al., 2001; Sosik & Godshalk, 2001; Gilbreath & Benson, 2004; van Dierendonck et al., 2004;
Nyberg et al., 2008). Hence, managerial leadership can play a significant role in employees’
presenteeism to manage a productive workforce.

92
The consequences of presenteeism are more complicated than absenteeism for organisations,
and are often not well understood by managerial leadership, especially when it comes to
employee performance and productivity. This is because managers may see their employees
arrive on time and seemingly ready for a full day’s work but not recognise that they are
actually not physically or psychologically fit enough to deliver their best efforts. As a result,
employees may become inattentive, demoralised and less productive while being present in
their jobs. According to a study by Medibank, Australia (2011), the total cost of presenteeism
to the Australian economy was $25.7 billion in 2005-06 and $34.1 billion in 2009-10. On
average, 6.5 working days of productivity are lost to presenteeism per employee annually. As
a result, in 2010, presenteeism equalised to a 2.7% decrease in the overall GDP for the
Australian economy. Hence, presenteeism is a persistent problem and costs the Australian
economy billions of dollars. Organisational leadership needs to realise and address this hidden
perennial problem. Support from the organisation’s leaders combined with regular attention to
employee health and their productivity is essential. Nyberg et al. (2008) suggested that
leadership significantly affects presenteeism at workplaces, but it has not been extensively
examined. The different ways through which leadership could affect or be associated with
presenteeism can thus be explored further, particularly in relation to RL.
Several studies have investigated the relationship among leadership, employee productivity,
presenteeism and health-related outcomes at workplaces. There is enough evidence in the
literature to link the current study and the relationship it proposes between RL and
presenteeism. For example, research has examined the reciprocity in the relationship between
managerial leadership and employee wellbeing (van Dierendonck et al., 2004), the mediating
role of diverse work characteristics (Arnold et al., 2007; Nielsen et al. 2008), the moderating
role of psychological factors and coping among employees (Harvey et al., 2007), the
destructive components of leadership (Ensley et al., 2006; Skogstad et al., 2007), and
transformational leadership (Nielsen et al., 2008). Moreover, leadership and its impact on
employees’ health have been researched from various perspectives within the organisational
studies. For example, employees’ assessment of managerial leadership and incidence of
ischemic heart disease has been shown to have a significant association (Nyberg et al., 2009).
Similarly, Hetland et al. (2007) suggested that aspects of leadership practices have a greater
impact on employee health conditions at work. Some studies have predominantly focused on
leaders’ personal characteristics and behavioural influences on employee outcomes. For
93
example, leaders’ personal attributes have been linked to improved wellbeing and decreased
levels of stress among employees (Arnold et al., 2007; Sosik & Godshalk, 2000; Harris, 1999;
Melchior et al., 1997; Wilcoxon, 1989; Nielsen et al., 2008; Seltzer & Numerof, 1998).
However, based on a meta-analysis, Kuoppala et al. (2008) suggested that further research is
needed to strengthen and clarify the evidence for the relationship between organisational
leadership, employees’ wellbeing and health-related outcomes. Hence, this exploration is
warranted to study RL and presenteeism regarding employee outcomes in the Australian
context.
Evidence suggests that employees’ psychosocial health is related to presenteeism (Aronsson
et al., 2000; Elstad & Vabø, 2008; McKevitt et al., 1997). According to Gilbreath and Benson
(2004), managerial leadership showed a significant influenced employee psychological
wellbeing over many other factors, including stress, life and work events. Hence, leadership is
connected with employees’ both psychological and physical health to influence presenteeism
and productivity loss (Kelloway & Barling, 2010; Nyeberg et al., 2008; Sosik & Godshalk,
2000).
Along with other recent leadership theories, transformational leadership has been studied in
considering employees’ psychological health. For example, transformational leadership in
particular has been found to be positively associated with employee psychological wellbeing
for both individual and organisational performance (Arnold et al., 2007). According to
Cummings et al. (2010), transformational leadership is the most commonly used leadership
approach to influence workers’ sense of meaningfulness, commitment and identification with
their work within the organisational context. However, managerial leadership may influence
working conditions, which in turn affects employees’ presenteeism. In addition, employees’
ability and motivation also play a significant role in the leader-follower relationship
(Hofstede, 2006). This study specifically incorporates RL in organisations to examine its
influence on presenteeism in Australian workplaces.
The notion of RL is relatively new in organisational leadership theories (Waldman & Balven,
2015; Siegel, 2014) and there appears to be, no reported conceptual or empirical study to date,
outlining the pathways by which RL links to presenteeism in the Australian context. One
reason for this scarcity of literature that because RL and presenteeism discourses have

94
developed mostly independently of each other. Studies of this relationship are based on
managerial leadership theories, which are often examined either for various employee health
conditions or estimating organisational effectiveness (Setterlind & Larsson, 1995; Gilbreath
& Benson, 2004; Yukl, 2006; Kouppala et al., 2008). Employees’ health conditions related to
presenteeism have been shown to lead to reductions in productivity levels, including both
quality and quantity of work outcomes (Shamansky, 2002; Hemp, 2004). Moreover, several
researchers suggested that leadership in organisations positively affects employees’ health in
terms of both physical and psychological wellbeing in workplaces (Gavin & Kelley, 1978;
Sheridan & Vredenburgh, 1978; Mullen & Kelloway, 2010). Hence, it is evident in the
literature that leadership in organisations positively influences employees’ health, and that
employees’ health at work negatively influences presenteeism. This research specifically
focuses on the relationship between RL and presenteeism in light of the vast amount of
organisational leadership studies. Thus, it is useful to research how RL in organisations
associates with employees’ presenteeism; this leads to the following hypothesis:
H1: There is a negative relationship between perceived RL and presenteeism.
3.3 RL and organisational commitment
It is essential for leaders to ensure organisational commitment for their employees to meet the
challenges of a competitive global market. The concept of organisational commitment refers
to the relative strength of individuals’ identification with, and involvement in a particular
organisation. It also conceptualises employees’ affective attachment to their organisations
(Meyer & Allen, 1993; Salami & Omole, 2005). The influence of affective attachment leads
employees to share organisations’ values and increases their desire to remain in their
organisation and their willingness to exert more effort for it (Mowday et al., 1979). Previous
studies have found that organisational commitment influences other organisational elements,
such as job satisfaction, motivation, decision-making, organisational support, reward,
communication and leadership (Alarape & Akinlabi, 2000; Salami & Omole, 2005).
Organisational commitment, as described in Section 2.8.5, has been classified in the literature
as affective (emotional attachments), continuance (costs of leaving) and normative (personal
values) (Meyer & Allen, 1993; Brief, 1998). Affective commitment refers to feelings of
belonging and a sense of attachment to the organisation, and is related to personal

95
characteristics, organisational structures and work experiences, such as pay, supervision, role
clarity and skill variety (Hartman, 2000). Continuance commitment refers to employees’
comparison of the costs associated with leaving the organisation or staying (Murray et al.,
1991). Normative commitment refers to employees’ feelings of moral compulsion to remain
with the organisation (Meyer & Allen, 1991).
Research shows that committed employees perform better. Organisational commitment is
considered as an important antecedent to other positive organisational outcomes (Meyer &
Allen, 1997; Meyer et al., 2002). For example, Mathieu and Zajac (1990) found that
organisational commitment influences employee performance, absenteeism, attendance, and
employee turnover. From a leadership perspective, many studies have implied that leadership
in organisations can uphold a higher level of organisational commitment and demonstrated
positive relationships between various leadership approaches and employee attitudes,
motivation and performance (Bass et al. 2004; Bass & Avolio, 1990; Stogdill, 1963; Yozgat
et al., 2014; Gokce et al., 2014; Şahin et al., 2014; Keskes, 2014; Wagner et al., 2013; Suk et
al., 2015). According to Zahra (1984), employees’ perceptions of their managers’ leadership
styles influence their organisational commitment. However, organisational commitment
influences both employee turnover intentions and leadership styles (Alarape &Akinlabi, 2000;
Doh et al., 2011; Salami & Omole, 2005). Hence, employees may perceive that some
managers’ leadership approach influences them more than others in enhancing their
organisational commitment. For example, significant attention has been given to
transformational leaders and their ability to enhance their employees’ organisational
commitment (Bass, 1985). This study focuses on other value-based leadership approaches to
justify the reason for examining RL with organisational commitment in the Australian
context.
Among the value-based leadership approaches, transformational leaders influence their
employees with personal rather than positional authority, and encourage employees to think
critically. They also involve employees in internal decision-making processes and inspire
their loyalty while recognising and ensuring that each employee has the opportunity to
develop personal potential (Yammarino et al., 1993). There is strong evidence for a
significant positive relationship between transformational leadership and organisational
commitment (Mathieu & Zajac, 1990; Gillet & Vandenberghe, 2014; Xueli et al., 2014; Choi,

96
2014; Kim, 2014; Top et al., 2015). Similarly, some researchers have focused on the relation
between leaders’ ethical behaviour and employees’ level of commitment toward
organisations. Brown et al. (2005) defined ethical leadership as “the demonstration of
normatively appropriate conduct through personal actions and interpersonal relationships, and
the promotion of such conduct to followers through two-way communication, reinforcement
and decision-making” (p.120). Several researchers have suggested that leaders’ ethical
behaviour influences employees’ behavioural outcomes, including commitment, job
satisfaction and turnover (Pettijohn et al., 2008; Beeri et al., 2013; Hassan et al., 2013; Hassan
et al., 2014; Demirtas & Akdogan, 2015). Among the value-based leadership approaches both
transformational and ethical leadership have been shown to have a significant positive
relationship with organisational commitment. This is provoking for the newly evolved notion
of RL; however, other leadership approaches should not be overlooked here.
Managers who adopt a servant leadership approach keep employees’ needs, aspirations and
interests above their own (Greenleaf, 2002). Previous research suggests that the considerate
behaviour of servant leaders is a strong component and positively correlates with
organisational commitment (Agarwal et al., 1999; Miao et al., 2014). Similarly, Cerit (2010)
identified servant leadership as a significant predictor of employees’ commitment to their
organisations. Researchers have also found that authentic leadership is also a key determinant
of organisational commitment (Avolio et al., 2004). According to Leroy et al. (2012),
managers’ authentic leadership is related to employees’ work role performance and fully
mediated through affective organisational commitment. Moreover, authentic leaders can
enhance their employees’ behavioural outcomes, such as affective commitment,
organisational citizenship behaviour and productivity (Walumbwa et al., 2008). Studies of
managerial roles coupled with authentic leadership have confirmed that employees share
leaders’ values, beliefs and convictions, and that authentic leadership is associated with
positive organisational commitment (Meyer & Allen, 1991; Gardner et al., 2005). Therefore,
various value-based leadership approaches have been shown to predict employees’
organisational commitment meaningfully; however, RL has not been extensively examined
and needs to be scrutinised further to apply in organisational leadership. This limitation in the
literature can be overcome by examining the relationship between RL and organisational
commitment. RL is considered to be linked to employees’ organisational commitment in this
study, which leads to the following hypothesis:

97
H2: There is a positive relationship between perceived RL and organisational commitment.
3.4 RL and employee turnover intentions
Employee turnover intentions refer to employees’ behavioural intent to leave their
organisations (Mobley et al., 1979). In the literature, it is also referred to as propensity to
leave, staying or leaving intentions, intention to quit or intent to leave. In other words, it is a
distinct decision as individuals’ psychological withdrawal from their occupation or
organisation and behaviour to look for other jobs or career alternatives (Martin, 1979;
Mobley, 1982; Moore, 2000; Blau, 1988, 2007; Blau et al., 2003). Psychological withdrawals
mount in workplaces when employees mentally distance themselves from their work
environment and eventually increase intentions to leave their organisations (Keaveney &
Nelson, 1993). Moreover, employees who form turnover intentions, in general, do not work to
their full potential. They lose their focus on work, deliver reduced performance and become
less productive than the employees who do not bear turnover intentions (Beehr & Gupta,
1978). The notion of employee turnover intentions has been studied in various disciplines
from attitudinal, behavioural and organisational perspectives (Samad, 2006). Demographic
variables such as age and tenure have been also found to be related to turnover intentions
within organisational studies (Cohen, 1993). Similarly, work-related issues (managerial
leadership or organisational commitment), personal (health condition or illness), external
(social impression about the organisation) and job-related factors (job environment) are also
found to play an important role in employees’ decision to remain with or leave their
organisations.
The role of managerial leadership is well researched in the employee turnover literature;
however, most research has focused on general supervisory support (Griffeth et al., 2000;
Holtom et al., 2008; Bass & Bass, 2008). Manager-employee relationships at workplaces may
also influence employee turnover intentions because of employees’ emotional and intellectual
involvement. Employees spend a significant portion of their working life in daily interactions
with managers; understandably, that builds and reflects their attitudes toward managerial
leadership outcomes and turnover intentions (Griffeth et al., 2000; DeConinck & Stilwell,
1997; Oldham & Cummings, 1996; Wells & Peachey, 2011; Palanski et al., 2014; Mathieu et
al., 2015). According to Myatt (2008), employees leave their jobs for several reasons, and
98
most of them are directly or indirectly related to leadership. As a result, several studies have
focused on the influence of leadership on employee turnover intentions and actual turnover
(Hsu et al., 2003; Silverthorne, 2001; Long & Thean, 2011; Liu et al., 2013; Zhiqiang et al.,
2013; Wang & Yen, 2015). Employee turnover intentions can be instigated because of low
salaries, work overload, relocation, layoff and job dissatisfaction (Schwerin & Kline, 2008).
Moreover, research suggests that many employees leave their jobs because of not having a
good relationship with their managers (Joyce, 2006; Myatt, 2008). Hence, leadership role is
viewed as an important influence to manage employee turnover intentions; this study
examines RL and its relationship on employee turnover intentions among Australian
employees.
Transformational leadership has been characterised by four leadership influences: idealised
influence, inspirational motivation, intellectual stimulation, and individual consideration
(Bass, 1990). Gill et al. (2011) described a negative relationship between transformational
leadership and employee turnover intentions. Managers who adapt transformational
leadership have shown significant positive associations with several organisational processes
and outcomes: job performance, job satisfaction, organisational commitment, organisational
citizenship behaviour and employee attitudes toward adopting evidence-based practices
(Walumbwa et al., 2005). Several studies also found that transformational leadership has a
negative relationship with employee turnover intentions and moderates the effect of
organisational climate and work environment (Hamstra et al., 2011; Tse et al., 2013; Green et
al., 2013; Badawy & Bassiouny, 2014; Peachey et al., 2014). Transformational leaders in an
organisation may help to reduce employee turnover intentions by strengthening group
cohesion, increasing organisational commitment and recognising and rewarding the work
done by employees. They also can buffer the negative effects of a stressful job environment
by providing support and inspiration to their employees (Stordeur et al., 2001). As a result,
organisations have more committed employees, which reduce their overall turnover losses.
Employees respond more positively to leaders who practise value-based leadership because of
theses leaders’ employee orientation and informal communications. Leaders’ pro-employee
behaviours significantly influence employees’ turnover intentions (Jaramillo et al., 2009). For
example, ethical leadership has been shown to assure more satisfied and committed
employees, which in turn, results in lower employee turnover intentions and superior
competitive performance (Kim & Brymer, 2011; Palanski et al., 2014). Similarly, Jaramillo et

99
al. (2009) found that servant leaders create a positive work climate in which salespeople feel a
stronger sense of shared organisational values, become more committed to organisations and
express a deeper desire to remain in their organisations. Moreover, servant leaders create a
positive work environment in which employees develop feelings of attachment and loyalty to
organisations (Liden et al., 2007). Managers who adopt a servant leadership approach make
their primary priority to support employees’ requirements such as better work condition and
employee benefits. These managers also have a moral obligation to take care of the necessities
for their employees to minimise turnover intentions (Greenleaf, 1977; Greenleaf, 2002;
Jaramillo et al., 2009). Authentic leaders also foster trust and promote employee
identifications and build confidence to accomplish work goals; this culminates in increased
employee and organisational performance (Walumbwa et al., 2008; Avolio et al., 2009).
According to Laschinger and Fida (2014), authentic leadership in a managerial role influences
employee retention significantly, and reduces turnover intentions. Kiersch (2012) also
suggested that authentic leadership is a significant predictor of turnover intentions, finding a
significant relationship with employee turnover. Hence, the role of the value-based leadership
approaches are well recognised in the literature for employee turnover, but not enough
research has been done into the relationship between RL and employee turnover intentions to
draw the same conclusion (Kleinman, 2004; Loke, 2001; Luthans, 2005; Vroom & Jago,
2007). Moreover, the relationship between RL and employee turnover intentions should not
be overlooked. Therefore, this study aims to further advance the organisational leadership
literature to explore the direct influence of RL on employee turnover intentions in the current
Australian context with the following hypothesis:
H3: There is a negative relationship between perceived RL and employee turnover intentions.
3.5 Organisational commitment and employee turnover intentions
In addition to the key aim of examining the relationship between RL and presenteeism and the
mediational role of organisational commitment and employee turnover intentions, this study
also inspects the direct relationship between the mediators. Both organisational commitment
and employee turnover intentions have been well researched and shown to be significant for
employees’ intentions to leave or stay with organisations. Committed employees express a
willingness to go beyond the expected requirements of their duties, and are more likely to

100
remain with the organisation than less committed employees (Meyer & Allen, 1991).
Organisational commitment is related to employee turnover intentions; one way to overcome
turnover rate is to increase employee commitment (Meyer & Allen, 1997; Bedean, 2009).
Previous studies have noted that organisational commitment and turnover are significantly
related, and negatively associated to each other (Paillé et al., 2011; Simo et al., 2010;
Mowday et al., 1982; Hunt & Morgan, 1994; Robbins & Coulter, 2003): committed
employees demonstrate positive intentions to serve their organisations and also think less
about quitting their jobs.
According to Meyer and Allen (1997), employee turnover negatively correlates with
organisational commitment. They conceptualised a multiple-component commitment model
following the antecedents to and consequences of commitment with affective, continuance
and normative units. In the literature, it is known as a three-component model of
organisational commitment. Meyer and Allen (1997) found that all three components of
organisational commitment show significant negative relationships with employees’ turnover
intentions in various levels. For example, a meta-review of the correlations between
organisational commitment and employee turnover intentions confirmed their significant
negative relationship significantly the coefficients ranging from -.29 to -.61 (Meyer et al.,
2002). Many researchers have highlighted the inverse relationship between this three-
component model of organisational commitment and employee turnover intentions (Trimble,
2006; Harris, et al., 2009; Paillé et al., 2011; Lee & Bruvold, 2003; Stumf & Hartman, 1984;
Manzoor & Naeem, 2011; Lee et al. 2012). In addition to the above studies, the current study
also considers the recent literature of human resources management for the associations
between organisational commitment and employee turnover intentions (Faloye, 2014; Watty
& Udechukwu, 2014; Yousaf et al., 2015; Brien et al., 2015; Saranya & Muthumani, 2015).
Organisational commitment has been considered a better predictor and measure for
employees’ turnover rate and intentions to stay in organisations than other influences at work,
such as job satisfaction or work environment (Wagner, 2007; Watty & Udechukwu, 2014;
Yueran & Liu, 2015). The current study also expects to find a negative relationship between
organisational commitment and employee turnover intentions for the study sample. Therefore,
it is hypothesised that:

101
H4: There is a negative relationship between organisational commitment and employee
turnover intentions.
3.6 Organisational commitment and presenteeism
Research suggests that organisational commitment plays an essential role in employee
productivity, because employees who are highly committed show higher participation and
efficiency at work than others (Angle & Perry, 1981; Ekmekci, 2011; Phipps et al., 2013).
Similarly, Balfour and Wechsler (1996) recommended that employees’ organisational
commitment is an appropriate and significant aspect to give insights into employee
productivity. Hence, it is important that managers develop employees’ organisational
commitment through psychological elements to produce more-devoted employees to support
their organisational goals, interests and values (Singh et al., 2008). Moreover, organisations
fostering an environment that encourages employee commitment will also profit from higher
productivity. According to Kinjerski and Skrypnek (2006), when employees are committed to
work, despite their health conditions, they try their best to get their work done productively.
However, highly committed employees may be inspired to work longer hours, which
inevitably takes its toll on them for both of their psychological and physical health (Schwartz
& McCarthy, 2007). Research has shown that organisational commitment is associated with
lower absenteeism, but that it is also related to higher levels of presenteeism and may lead to
‘over-commitment’ consequences (Caverley et al. 2007; Bergstrom et al., 2009; Johns, 2010;
Bierla et al., 2013; Graf et al., 2015). It is understandable that committed employees may
come to work despite being ill and sometimes if may force themselves to work harder; in turn,
this may increase presenteeism instead of further productivity. However, the current study
focuses on employee commitment instead of over-commitment effects.
According to Hansen and Andersen (2008), organisational commitment is a significant
predictor of presenteeism; that is, employees with higher commitment are more likely to force
themselves to be at work while sick. For example, employees may prefer to come to work
rather than taking the risk of being absent because of its related consequences such as job
security and additional workload. Bockerman and Laukkanen (2009) noted that
organisational commitment implies a willingness by employees to exert considerable effort on
behalf of the organisation, which ensures a good attendance record and productive work.

102
Similarly, Taifor et al. (2011) examined the direct influence of organisational commitment on
presenteeism and found that higher organisational commitment associates with lower
presenteeism at work. However, there is not enough available literature on the relationship
between organisational commitment and presenteeism in leadership studies. Hence, this study
postulates a link between organisational commitment and presenteeism in the Australian
context with the following hypothesis:
H5: There is a negative relationship between organisational commitment and presenteeism.
3.7 Employee turnover intentions and presenteeism
Employee turnover intentions may influence employee productivity, expenses and overall
performance of organisations. It is assumed that if leaders in organisations can reduce
employees' turnover intentions, turnover will decrease and employee productivity will be
influenced positively. A number of studies have inspected the relationship between employee
productivity and both employee turnover intentions and employee wellbeing (Stewart et al.,
2003; Kim & Garman, 2004; Boles et al., 2004; Kemery et al., 2012). Employees’ health
conditions result in low productivity due to several reasons, such as low energy, increased
distractions while at work, negative emotions about work resulting in turnover and inability to
attend work or perform well (Hanisch & Hulin, 1990; Schaufeli et al., 2009; Kim & Garman,
2004). Employees’ wellbeing is considered to be a multidimensional construct that
incorporates several concerns. They include work environment, financial benefits, emotional
or physical health and behavioural risks (such as turnover intentions) and quality of
employees’ social connections within a community (Diener, 2000; Lee et al., 2004; Diener,
2006; Kemery et al., 2012; Sears et al., 2013). For example, unhealthy workplaces that poses
a threat to employee health and insufficient medical allowances for health care facilities might
demoralise employees to leave their jobs. There is strong evidence that these elements are
associated not only with employee wellbeing, but also with further organisational
expenditure, and influence performance outcomes, including productivity (Lynch et al., 1993;
Boles et al., 2004; Sears et al., 2013; Kemery et al., 2004). Employee turnover intentions,
whether observed or concealed may increase the actual turnover rate, and influence employee
health and presenteeism in a way that decreases productivity in organisations.

103
In the literature, employee turnover intentions have been described as the pre-stage of
employees’ actual decisions on whether to leave or quit their jobs, and have been argued to be
a causal effect on the turnover decision (Bedeian et al., 1991; Addae et al., 2006). Employee
turnover intentions that end at turnover may cause several indirect costs, such as diminished
productivity and additional time required by managers for recruiting, selecting and supporting
new employees. Reductions in employee turnover lead to increases in organisational
performance. They also help to reduce the costs associated with loss of human capital such as
hiring and replacing employees (Egan et al., 2004; Silverthorne, 2004). Employee turnover
intentions may cause under-performance with less productivity as employees become
emotionally detached from their organisations and increase presenteeism (Reese, 1992; Taifor
et al., 2011). Thus anything that can be done to reduce employee turnover intentions may lead
to significant benefits for both employees and employers.
Ruez (2004) identified some key drivers of presenteeism, such as workplace stress, employee
health and work-life balance that may also be relevant to employee turnover intentions.
Understandably, adverse levels of these drivers demoralise employees, which affects their job
effort and organisational commitment and increases absenteeism and employee turnover. A
higher amount of absenteeism provides an initial indication for employees’ withdrawal
process, and organisations should consider such information as more than just data on absence
rates (Cohen & Golan, 2007). However, when employees have turnover intentions and are
forced to come to work while being ill for any reason, they may demoralise themselves to
work below their best effort. In that situation, they may not have enough mental and
psychological fitness to work with their expected productivity. To the best of my knowledge,
no studies have been published that measure the associations between employee turnover
intentions and presenteeism. Therefore, this study hypothesises that employee turnover
intentions have a positive relationship with presenteeism and asserts the following hypothesis:
H6: There is a positive relationship between employee turnover intentions and presenteeism.

104
3.8 The mediating role of organisational commitment and employee turnover intentions on the relationship between RL and presenteeism
Various organisational factors have been examined to link employees’ wellbeing and
presenteeism in organisational studies, such as job efforts and rewards (Siegrist, 1996),
organisational change and job security (Kivimaki et al., 2000); work environment factors
including management and leadership (McGregor et al., 2014); and work-life balance (Voss et
al., 2000; Burton et al., 2004). There is also evidence for a direct association between
employees’ perceptions of how their leaders perform and level of presenteeism (Gilbreath &
Benson, 2004; van Dierendonck et al., 2004; Sosik & Godshalk, 2000), but evidence os
lacking for any indirect relationship with mediational effects. The direct influence between
leadership and presenteeism is not straightforward, and may yield varying results because of
the influence of other work-related outcomes. Less attention has been given to leadership
practices and employees’ work-related outcomes, such as organisational commitment and
turnover intentions, to link them to presenteeism. There is also a scarcity of evidence in the
literature to signify any mediational influence of employees’ work-related outcomes on the
relationship between RL and presenteeism. According to Nyberg et al. (2008), the
relationship between leadership and presenteeism has not been examined extensively and
needs further exploration. Many other researchers have also stressed the need to further
examine influence of leadership approaches on employees’ wellbeing and presenteeism
(Sosik & Godshalk, 2000; Gilbreath & Benson, 2004; van Dierendonck et al., 2004; Nyberg
et al., 2009; Westerlund et al., 2010). Therefore, the current study includes two specific work-
related outcomes as mediators to examine the indirect relationship between RL and
presenteeism among Australian employees: organisational commitment and employee
turnover intentions.
3.8.1 The mediating role of organisational commitment on the relationship between RL and
presenteeism
Organisational commitment is identified as an essential component for understanding
organisational performance and employee behaviour, as most researchers make an effort to
clarify its predictors and consequences (Gomes, 2009). It is also specified as an emotional
attachment for the identification and involvement established between employees and their
organisations (Meyer & Allen, 1997). Organisational commitment is important not only for
the evaluation of employees’ performance outcomes but also for examining overall
105
organisational performance. Employees’ commitment has been shown to be associated with
several relevant organisational elements, such as leadership styles (Keskes, 2014); employee
performance outcomes including absenteeism, attendance and turnover (Mathieu & Zajac,
1990); organisational citizenship behaviour (Schappe, 1998); job characteristics (Lin & Hsieh,
2002); and organisational trust (Korsgaard et al., 1995). Hence, organisational commitment
has become a significant element for organisational leadership studies.
The recent literature of organisational studies has considered organisational commitment as a
significant mediator because of its influences over employees’ various work-related
outcomes, such as organisational citizenship behaviour (Ahmed et al., 2013; Fu et al., 2014),
customer relationship management (Garrido-Moreno et al., 2014), employee turnover
intentions (Han et al., 2015) and job satisfaction (Hsu et al., 2015). Previous studies have also
indicated the relative strength of organisational commitment for employees’ identification,
involvement and attachment to their organisations (Mowday et al., 1979; Porter et al., 1974;
Aldag & Reschke, 1997), and signify the importance of organisational commitment as a
mediator for organisational studies. Moreover, organisational commitment in organisational
leadership studies has also been shown to have significant role as a mediator (Yeh & Hong,
2012; Hougyun, 2012), but evidence is lacking for the relationship between RL and
presenteeism. Therefore, the current study also considers organisational commitment as a
mediator between RL and presenteeism (Figure 3.1). Employees who are highly committed to
their organisations tend to come to work despite being ill, which contributes to the prevalence
of presenteeism. The possible influence of organisational commitment is demanding further
examination for its mediational intervention on the direct relationship between RL and
presenteeism. Moreover, to justify the mediating role of organisational commitment:
1) RL must be related with both organisational commitment and presenteeism; and
2) The introduction of organisational commitment into the analysis must reduce the initially
observed link between RL and presenteeism.

106
2Figure 3.1: Hypothesised model proposing the direct and mediational relationship between RL, organisational commitment and presenteeism
The following considerations are also essential to examine the mediational influence of
organisational commitment on the relationship of RL and presenteeism. First, RL must have a
direct relationship with presenteeism. The direct relationship between RL and presenteeism
was hypothesised (H1) in Chapter 1 and justified in Section 3.2. Second, RL should also have
a direct relationship with organisational commitment. The direct relationship between RL and
organisational commitment was hypothesised (H2) in Chapter 1, and Section 3.3 suggested
various leadership approaches to organisational commitment to link RL and organisational
commitment for this study. Third, for the mediational model shown in Figure 3.1,
organisational commitment should have a direct relationship with presenteeism; this was
hypothesised (H5) in Chapter 1, and Section 3.6 outlined the direct relationship between
organisational commitment and presenteeism for this study. Finally, the inclusion of
organisational commitment into the mediational model (Figure 3.1) must reduce the initially
observed relationship result between RL and presenteeism. In other words, if the result of the
direct relationship between RL and presenteeism shows any detrimental outcome compared to
their primarily tested direct influence, the mediational influence will be justified. The latter
condition, which indicates that introducing organisational commitment will reduce the
strength of the direct relationship between RL and presenteeism, is tested in the results
chapter of this thesis in Section 5.9.2 of Chapter 5. This leads to the following hypothesis:
H7: Organisational commitment mediates the association between RL and presenteeism.
H7
H2 H5
H1
Responsible Leadership
Presenteeism
Organisational Commitment

107
3.8.2 The mediating role of employee turnover intentions on the relationship between RL and
presenteeism
The notion of employee turnover intentions is not the same construct as actual turnover, but is
often used as a surrogate measure, as it is the immediate precursor of quitting. According to
Spector (1997), turnover results because employees who dislike their job or work
environment will look for alternative employment prospects. As a work related-outcome,
turnover can be considered as an end result of employees’ turnover intentions, and it has
become a major concern for many organisations. The concept of employee turnover intentions
is also recognised as the cause of psychological, sociological and economic difficulties in
workplaces (Meral et al., 2014). Both turnover and turnover intentions may cost organisations
money and lost opportunities and lead to under-performance, and thus loss of productivity.
Employees with turnover intentions gradually become emotionally detached and incur costs
that result from their slower work pace, which influences increased absenteeism and
presenteeism (Reese, 1992; Joinson, 2000; Taifor et al., 2011). Moreover, when employees
conceal turnover intentions, organisations suffer costs in lost productivity and higher
overheads by paying overtime for employees who take on the work of absent employees. In
these circumstances, leadership may not have any role to play in higher employee outcomes.
In previous studies, researchers have tried to predict and explain employees’ turnover
intentions so that leaders in organisations can lead with effective strategic initiatives to avoid
potential future turnover (Kraut, 1975; Hwang & Kou, 2006). Researchers have also
suggested that employees’ turnover intentions are the most immediate motivational
determinant of choice to stay or leave their organisations (Fishbein, 1967; Locke, 1968;
Locke et al., 1970). Previous studies have supported these arguments and offered empirical
evidence for the relationship between employee turnover intentions and actual turnover
(Newman, 1974; Porter et al., 1976; Steers, 1977). Moreover, employee turnover intentions
have received significant attention in recent organisational studies as a mediator for
employees’ several behavioural outcomes, such as leadership outcomes, employee wellbeing,
perceived organisation support and organisation commitment (Christian & Ellis, 2014; Kuo et
al., 2014; Yousaf et al., 2015; Takase et al., 2015; Saranya & Muthumani, 2015; Brien et al.,
2015), but evidence is lacking for RL and presenteeism. Hence, one of the purposes of this
study is to examine the influence of employees’ turnover intentions as a mediator on the
relationship between RL and presenteeism. However, to justify this mediating role:

108
H8
H3 H6
H1 Responsible Leadership Presenteeism
Employee Turnover Intentions
1) RL must be related with both employee turnover intentions and presenteeism; and
2) The introduction of employee turnover intentions into the analysis must reduce the initially
observed relationship between RL and presenteeism.
3Figure 3.2: Hypothesised model proposing the direct and mediational relationship between RL, employee turnover intentions and presenteeism
In this study, the mediational influence of employee turnover intentions on the relationship
between RL and presenteeism comprises the following considerations. First, RL must have a
direct relationship with presenteeism for the proposed mediational model, as shown in Figure
3.2. The direct relationship between RL and presenteeism was hypothesised (H1) in Chapter 1
and justified in Section 3.2 with the evidence to link RL and presenteeism. Second, RL should
have a direct relationship with employee turnover intentions. The direct relationship between
RL and employee turnover intentions was hypothesised (H3) in Chapter 1, and Section 3.4
outlined the direct relationship among leadership and employee turnover intentions for the
justification to examine the influence of RL on employee turnover intentions for this study.
Third, for the mediational model shown in Figure 3.2, employee turnover intentions also need
to have a direct relationship with presenteeism; this was hypothesised (H6) in Chapter 1, and
Section 3.7 outlined the direct relationship between organisational commitment and
presenteeism. Finally, the presence of employee turnover intentions in the mediational model
(Figure 3.2) must decrease the initially detected relationship outcome between RL and
presenteeism. In other words, if the effect of the direct relationship between RL and
presenteeism shows any reduced outcome compared to their primarily tested direct influence,

109
the mediational influence of employee turnover intentions will be justified. The latter
condition, which indicates that introducing organisational commitment will reduce the
strength of the direct relationship between RL and presenteeism, is tested in Section 5.9.2.
The above considerations warrant investigation into whether employee turnover intentions
mediate the relationship between RL and presenteeism and drive the following hypothesis.
H8: Employee turnover intentions mediate the association between perceived RL and
presenteeism.
3.9 Chapter summary
This chapter presented a comprehensive review of the literature and the current state of
knowledge for the development of the hypotheses as shown in the relational model (Figure
1.1) in Chapter 1. The overall review explained the relevant literature for the conceptualised
relationships among RL, organisational commitment, employee turnover intentions and
presenteeism. It also included the justification for the mediators on the relationship between
RL and presenteeism.
The first part of this chapter (Sections 3.2 to 3.4) outlined the literature of the various
leadership approaches that examined presenteeism, organisational commitment and employee
turnover intentions. Section 3.2 outlined the various value-based leadership practices along
with employee wellbeing to justify the direct influence of perceived RL on presenteeism. In
Section 3.3 the notions of RL and organisational commitment were described and assumed to
have a positive relationship. Section 3.4 outlined a negative relationship between perceived
RL and employee turnover intentions.
The second part (Sections 3.5 to 3.7) described the development of hypotheses for the
relationship of presenteeism with organisational commitment and employee turnover
intentions relationships. Section 3.5 predicted a negative relationship between organisational
commitment and employee turnover intentions; Section 3.6 similarly predicted a negative
relationship between organisational commitment and presenteeism; and Section 3.7 predicted
a positive relationship between employee turnover intentions and presenteeism.

110
Finally, Sections 3.8 and 3.9 described the development and justifications of the hypotheses
for two mediating variables of organisational commitment and employee turnover intentions
on the association between RL and presenteeism.
Chapter 4 will present a detailed outline of the research methodology and approaches
followed in this thesis.

111
4 METHODOLOGY
4.1 Introduction This chapter presents an overview of the methodology on which the study is founded. Its eight
sections describe the sequential steps for empirical research methods according to Punch
(2003) and Balnaves and Caputi (2001). Section 4.2 reviews the hypotheses set out in Chapter
1. Section 4.3 outlines the justification of the current research design and clarifies the
methodology applied in this thesis. Section 4.4 explains the target population, sampling
design, sampling method and sample size. The descriptive characteristics of the sampling
profile are presented in Section 4.5. Thereafter, Section 4.6 describes the measures (survey
instruments) used for assessing the selected variables in the thesis. Section 4.7 then outlines
the data-collection procedure, and Section 4.8 gives the statistical techniques for hypothesis
testing. The last section summarises the chapter.
4.2 Study model and proposed hypotheses
Chapters 1 and 2 have described the development of the proposed model and the formulation
of the hypotheses for the current study. The model illustrates the hypothesised relationships
between RL and the mediators of employee presenteeism: organisational commitment and
employee turnover intentions. The proposed structural model is presented in Figure 4.1.
4Figure 4.1: The proposed structural model and hypotheses
H5
H3 H6
H2
H1 Responsible Leadership
Employee Turnover Intentions
Organisational Commitment
Presenteeism
H4
H8
H7

112
Eight hypotheses were developed to meet the purposes of the thesis (Section 1.6). These
hypotheses will be tested to empirically validate the suggested structural model (Figure 4.1).
The key aim of this study is to determine the relationship between perceived RL and
presenteeism with the mediating effects of organisational commitment and employee turnover
intentions. The research questions (Section 1.7) are addressed by the following hypotheses
(H1-H8)
Hypothesis H1: There is a negative relationship between perceived RL and presenteeism.
Hypothesis H2: There is a positive relationship between perceived RL and organisational
commitment.
Hypothesis H3: There is a negative relationship between perceived RL and employee turnover
intentions.
Hypothesis H4: There is a negative relationship between organisational commitment and
employee turnover intentions.
Hypothesis H5: There is a negative relationship between organisational commitment and
presenteeism.
Hypothesis H6: There is a positive relationship between employee turnover intentions and
presenteeism.
Hypothesis H7: Organisational commitment mediates the association between perceived RL
and presenteeism.
Hypothesis H8: Employee turnover intentions mediate the association between perceived RL
and presenteeism.
4.3 Overview of the research design
Research methods are the ‘blueprints’ or ‘recipes’ for research studies to collect and analyse
data (Cooper & Schindler, 2006; Creswell, 2005). Any research approach relies heavily on the
level of existing knowledge about the research topic, and should incorporate a specific
background for the studied variables. It also should specify the context and type of
observation and data collection, and describe the processes required to accomplish the aimed
study. A justified research design is important “to understand how the nature of the problem
influences the choice of research method” (Zikmund, 2003, p. 54). Hence, research designs
justify the aims of research studies to be examined in an accurate and unbiased manner.

113
This study, which used a quantitative methodological approach, can be defined as explanatory
(deductive-reasoning) and correlational research. It also applied a cross-sectional survey
within Australia. A survey-based design with a number of measures (survey instruments) was
use to assess full-time Australian employees’ perceptions of RL, presenteeism, organisational
commitment and turnover intentions. Quantitative studies involve deductive reasoning and
develop specific predictions from the literature to test hypotheses (Hart, 2007). The purpose
of this quantitative study was to determine if there is any relationship between the variables
RL, presenteeism, organisational commitment, and employee turnover intentions. Previous
studies have similarly addressed managerial leadership and employees’ health conditions or
performance outcomes with quantitative research techniques (Doh et al., 2011; Gilbreath &
Karimi, 2012; Westerlund et al., 2009; Nyberg et al., 2009; Nielsen et al., 2009). This
quantitative design was appropriate for the study as “it is useful for identifying the type of
association, explaining complex relationships of multiple factors that explain an outcome, and
predicting an outcome from one or more predictors” (Creswell, 2005, p. 338). Moreover,
quantitative design identifies the characteristics of the observed variables and explores
correlations among two or more variables (Leedy & Ormrod, 2005; Sekaran, 2003). Sections
4.3.1 to 4.3.5 elaborate the research design to explore the objectives, clarify the relationships,
and draw the implications of the current study.
4.3.1 Explanatory research design: hypothesis-testing
Research designs are described from two perspectives in the literature (Balnaves & Caputi,
2001; Sekaran, 2003). First, a research design should include a specific framework or
structure, such as exploratory, descriptive or explanatory. These approaches help the
researcher to make decisions about whether to use a cross-sectional, longitudinal or
experimental design, a case study or a combination of these. This perspective clarifies the
structure (or nature or framework) of the research so that it can deliver the evidence needed to
answer research problems (Balnaves & Caputi, 2001). Second, a research design should
include the type of data (primary or secondary, qualitative or quantitative or a combination),
method of data collection and sampling strategy. This perspective justifies the decision about
how to collect evidence to answer the research questions. For example, social science studies
can be categorised into three classes of research: exploratory, descriptive and explanatory.
Exploratory research aims to explore and identify problems when limited information is
known, clarify the nature and scope of the problems under study look for insights, develop

114
propositions and hypotheses for further research and reach a better understanding of the
solutions. Descriptive research is based on a previous understanding of the nature of the
research problems and finds the answers to the research the questions (e.g., who? what?
where? when? wow? how many?). Finally, explanatory research describes a process where
the aim is to develop explanations through possible mechanisms (Balnaves & Caputi, 2001;
Sekaran, 2003). This research approach not only states what is happening (as in descriptive
research), it also offers answers about why something occurs in a certain manner. Researchers
develop their hypotheses on the basis of the possible causes of a certain relationship and the
existing literature, and then provide evidence to support or reject those hypotheses and draw a
conclusion.
4.3.2 Designs for hypothesis testing: correlational design
This study surveyed and collected data without any experimental interventions from full-time
Australian employees. Respondents were under managerial supervision so that their responses
could be used to examine the relationships among the selected variables, such as RL,
presenteeism, organisational commitment and employee turnover intentions. A correlational,
also known as non-experimental, research design focuses on the empirical relationship
between studied variables. It is a non-experimental approach because it does not involve any
manipulation of the variables; instead, it aims to determine the relationship among variables
and the strength (significance) of the variables’ association with each other. Punch (2003)
noted that correlational designs measure the degree to which variables vary or co-vary, rather
than manipulating independent variables. Manipulation of an independent variable is possible
in a causal or experimental design as it is associated with cause-and-effect hypotheses
(Balnaves & Caputi, 2001; Zikmund et al., 2010). However, the current study does not require
manipulation of independent variables, so a correlational design rather than a causal
relationship design was selected.
4.3.3 Quantitative research
There are two major approaches to research studies: qualitative and quantitative. Whether a
study adopts a qualitative or quantitative approach is important for the overall research
justification (Creswell, 2003; Punch, 2003). Quantitative research is a way to test theories by
examining the relationship among variables (Polit & Hungler 2013; Moxham, 2012).

115
Moreover, quantitative research designs involve “either identifying the characteristics of an
observed phenomenon or exploring possible correlations among two or more phenomena,”
(Leedy & Ormrod, 2005, p. 179). The variables may or may not be manipulated but the data
are collected in a quantified or numeric form and referred to as statistical evidence (White &
Millar, 2014; Wong, 2014). This method is suitable for addressing the questions of the current
study and its hypotheses, as they support explanatory (theory-testing) research and examine
the relationships among variables (Hair et al., 2004; Newman & Harrison, 2008).
Qualitative methods are applied to explore new challenges or opportunities and develop an
understanding of the human experience by making sense of, or interpreting, phenomena in
terms of the meanings people bring to them (Greenhalgh & Taylor, 1997; Bowling, 2002).
Creswell (2003) recommended qualitative research to investigate new beliefs and emotions to
deliver higher-quality information. Qualitative research may include exploratory, theory-
generating research, narrative research, case studies or ethnographic studies. The quantitative
and qualitative approaches differ in their perspectives. In a quantitative research, it is assumed
that cognition or behaviour is highly anticipated and explicable. Here, the assumption of
determinism applies, which means that all events are completely determined by one or more
reasons (Salmon, 2007). For example, the process by which children learn to speak or
communicate is determined by one or more causes and quantitative research cannot identify a
universal or exact law for particular human learning. On the other hand, a qualitative
approach views human behaviour as dynamic, and as changing over time or place; it usually
is not aimed at generalising beyond the particular people who are studied. Thus, in qualitative
research, different individuals or groups may provide their different realities or perspectives,
and various social constructs may influence how they perceive or understand their world and
how they should act. In other words, quantitative studies search for explanations while
qualitative studies seek the understanding of complex interrelationships (Groat & Wang,
2002).
Quantitative approaches function under the assumption of objectivity and assume that there is
a reality to be observed and that rational observers who look at the same phenomenon will
agree on its realism and characteristics. Standardised questionnaires and other quantitative
measures or tools are often used to measure what is observed. In contrast, qualitative
approaches mostly contend that reality is socially constructed (Guba & Lincoln, 1989). For

116
example, individuals’ social behaviour follows the socially constructed norms they have
internalised. For this reason, a significant difference among qualitative and quantitative
approaches is in their data-collection procedures. Qualitative studies involve data-collection
procedures that allow an in-depth understanding of human behaviours and support a
comprehensive, detailed explanation of the concern under investigation (Creswell, 2003). The
results of qualitative research are not tested to determine whether they are statistically
significant or simply due to chance (Patton, 2002); as a result, it is problematic to generalise
qualitative findings. The findings of qualitative studies cannot be generalised to the wider
population, or to other related populations, with certainty equal to that of quantitative findings
(Creswell, 2003). In contrast, quantitative studies allow the findings to be generalised to the
defined population and allow the researcher to make claims about the population to a high
degree of certainty (Zikmund, 2003; Hair et al., 2004).
This study is concerned with explaining the relationship among the selected variables in the
Australian context; quantitative research was used to test these associations. It will be
important that findings from this research can be generalised across Australian workplaces,
because the research was intended to provide managers or supervisors with new
understanding of manager-employee relationships, with the ultimate goal to clarify how they
can increase levels of RL, enhance organisational commitment and reduce employees’
presenteeism and turnover intentions. Hence, this study as a ‘correlational design and
hypotheses testing’ is appropriate and justifiable for the overall objectives of the study, and
the quantitative approach is appropriate to establish its results for this thesis.
4.3.4 Deductive reasoning
Reasoning is considered to be a systematic process of thought that yields a conclusion from
perceptions, thoughts or assertions (Johnson-Laird, 1999). Research clusters around two
major research paradigms that are formed by a combination of inductive or theory-building
approaches with qualitative research methods, and deductive or theory-testing approaches
with quantitative research methods (Bitektine, 2008). Inductive approaches are embedded in
rich empirical data and consider circumstances to produce a theory that is accurate, interesting
and testable as a natural complement to deductive research (Eisenhardt & Graebner, 2007;
Gulati, 2009). Inductive reasoning also refers to a process in which researchers develop
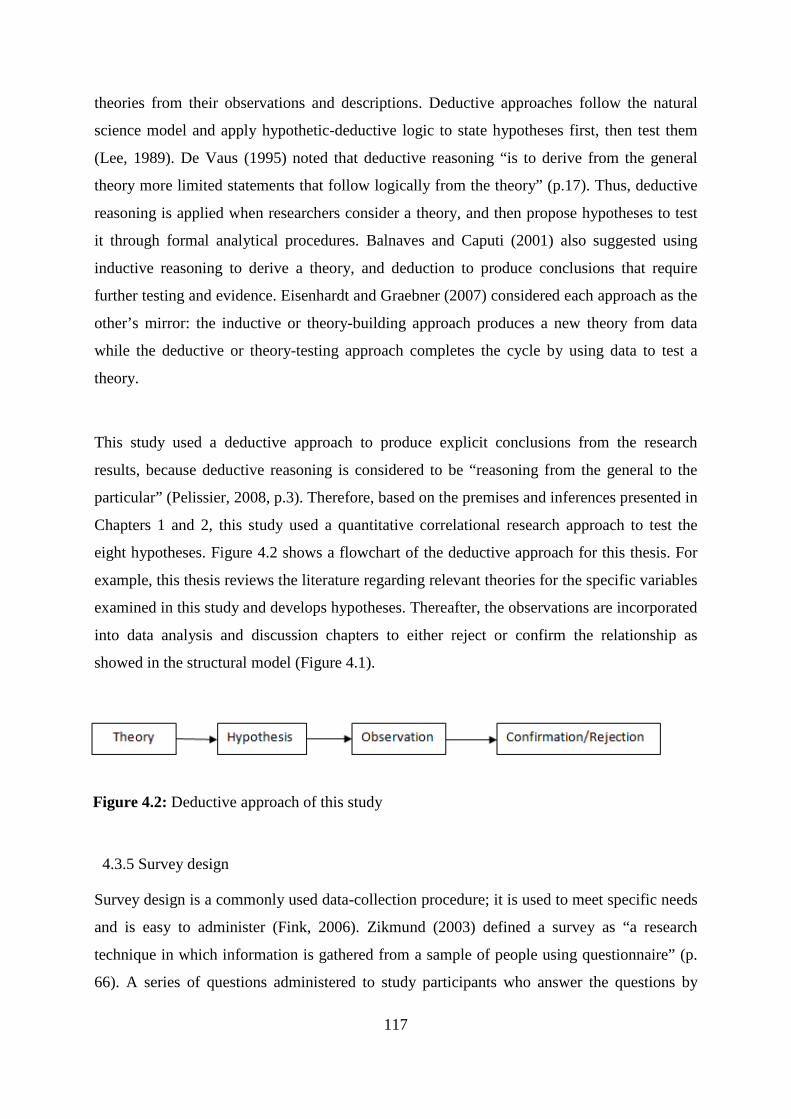
117
theories from their observations and descriptions. Deductive approaches follow the natural
science model and apply hypothetic-deductive logic to state hypotheses first, then test them
(Lee, 1989). De Vaus (1995) noted that deductive reasoning “is to derive from the general
theory more limited statements that follow logically from the theory” (p.17). Thus, deductive
reasoning is applied when researchers consider a theory, and then propose hypotheses to test
it through formal analytical procedures. Balnaves and Caputi (2001) also suggested using
inductive reasoning to derive a theory, and deduction to produce conclusions that require
further testing and evidence. Eisenhardt and Graebner (2007) considered each approach as the
other’s mirror: the inductive or theory-building approach produces a new theory from data
while the deductive or theory-testing approach completes the cycle by using data to test a
theory.
This study used a deductive approach to produce explicit conclusions from the research
results, because deductive reasoning is considered to be “reasoning from the general to the
particular” (Pelissier, 2008, p.3). Therefore, based on the premises and inferences presented in
Chapters 1 and 2, this study used a quantitative correlational research approach to test the
eight hypotheses. Figure 4.2 shows a flowchart of the deductive approach for this thesis. For
example, this thesis reviews the literature regarding relevant theories for the specific variables
examined in this study and develops hypotheses. Thereafter, the observations are incorporated
into data analysis and discussion chapters to either reject or confirm the relationship as
showed in the structural model (Figure 4.1).
5Figure 4.2: Deductive approach of this study
4.3.5 Survey design
Survey design is a commonly used data-collection procedure; it is used to meet specific needs
and is easy to administer (Fink, 2006). Zikmund (2003) defined a survey as “a research
technique in which information is gathered from a sample of people using questionnaire” (p.
66). A series of questions administered to study participants who answer the questions by

118
themselves (that is, not in an interview or through interaction with a survey administrator) is
referred to as self-report data. Zikmund et al. (2010) suggested that this survey design enables
the collection of data from the research-sample participants to provide information about the
present: learn what the population is thinking, acting and expecting in real time; identify
typical responses; and explore new understanding.
This study used a cross-sectional and self-administered online survey posted on a website to
collect and assess data for each of the variables at a specific point in time. Web-based surveys
are self-administered, and are thus the simplest form of administration for researchers (Burns
& Bush, 2006). All questions in the questionnaire used a Likert scale to collect participant
responses, except for the demographic section. All questions were collected from previous
studies that used either five- or seven-point Likert scales (Section 4.6). The advantages of this
method made it preferable to other, more traditional approaches: it has been found to be
faster, more efficient and economical and better suited for collecting data or information that
may be sensitive. Therefore, a self-administered online survey was suitable for this study.
4.4 Participants: The sample population
According to McGaghie & Crandall (2001), sampling from populations addresses research
efficiency and accuracy. The term ‘population’ refers to all members of a defined group that
researchers can study or from which they can collect information for their studies; a sample is
a systematically drawn group from the population that represents the same characteristics as
the population. However, the technique of determining and justifying a sample is a complex
matter in quantitative research (Balnaves & Caputi, 2001). In the current study, the following
three steps were used to clarify the sample population (Creswell, 2003; Punch, 2003;
Zikmund et al., 2010): identifying the target population and sampling frame; determining the
sampling method and the procedures for locating participants; determining the sample size or
number of participants. Sections from 4.4.1 to 4.4.3 describe these three steps.
4.4.1 The sampling design: Identifying the target population and sampling frame
Sampling is a technique of studying from a few selected items, instead of the whole unit. In
other words, it is a process of surveying only some members of the population to make

119
inferences about the population as a whole (Burns & Bush, 2006). The target population is
defined as a complete group that possess a common set of characteristics that are relatively
similar to the entire group under study as described by the research objectives (Burns & Bush,
2006; Zikmund et al., 2010). This study identified the target population as employees over 18
years of age and working full-time within Australia. The sampling frame was limited to
employees who are exclusively working under direct managerial or supervisorial positions
from any Australian sector, such as finance, health, education or health.
4.4.2 The sampling method and the procedures for locating participants
In quantitative studies, representativeness is an important quality for any sample. However, it
would be unrealistic and highly expensive to examine all participants in the target population.
Thus, the common characteristics of the population and its sample size need to be well
clarified. It is essential to use a representative sample that has no qualitative differences to the
target population. A web-based online survey provides no chance to claim any selection
procedure for the sampling technique. Here, the probability of any participant being selected
was unknown, and a non-probability judgemental sampling was used to select potential
participants from the target population. The judgemental sampling is an ‘educated guess’ as to
who should represent the population (Burns & Bush, 2006). It ensures the selection of
participants who have certain characteristics that fulfil the aim of particular studies (Zikmund,
2003; Fink, 2006). Judgement sampling also helps in collecting a large number of
participants in an effective manner (Zikmund, 2003). In addition, this sampling method is one
of the most appropriate methods when the target population is too big and difficult to contact
(Burns & Bush, 2006).
A web-based online survey was used in this study to reach potential research participants and
to ensure the quality of the judgment sampling method. An US-based professional survey
company, ‘Qualtrics’ was hired to administer the web-based online survey questionnaire
across the various sectors within Australia. A total of 3500 potential participants were
contacted for participating in the study through e-mail invitations.

120
4.4.3 Determining the sample size
Sample-size determination is an essential phase for any research study (Lenth, 2001).
Researchers can alter the sample size to increase its ‘power’ and ability to detect ‘effect size’
according to the context of the research (Cohen, 1990; 1992). Power refers to the ability to
generalise to other samples from the same population based on their regression coefficients.
Effect size indicates the magnitude of difference between two groups. The effect size of
sample is a crucial component of the research process without which it may take months to
investigate something with a tool that is either completely useless or costly. Hence, the
justification of an appropriate sample size should rely mostly on the nature and purpose of
study, the degree of accuracy required from the results and the variation of the population
(Lenth, 2001; Balnaves & Caputi, 2001; De Vaus, 2002).
There are several approaches to determining sample size. For example, researchers may
specify the desired width of a confidence interval and fix the sample size to achieve their goal
(Lenth, 2001). Similarly, the Bayesian approach can be used where a study optimises some
utility function, such as precision of estimation or cost. This technique, named for the English
mathematician Thomas Bayes, allows researchers to combine prior information about a
population parameter with evidence from information contained in a sample to guide the
statistical inference process (Ross & Mackey, 2015). Israel (1992) also advised several
approaches, such as, considering the whole population as a sample when the sample is small
and manageable; using a sample size that is comparable to other similar studies; using
published tables; using formulas, which is known as a power analysis. One of the most
popular approaches to sample size determination involves conducting a power analysis. Lenth
(2001) indicated several essentials for the power analysis approach. First, the researcher
specifies a hypothesis test on a parameter θ (along with the underlying probability model for
the data). Second, the significance level α of the test is identified. Third, an effect size (d) that
reflects an alternative of scientific interest is specified. Fourth, historical values or estimates
of other parameters needed to compute the power function of the test are obtained. Finally, a
target value of the power of the test when θ = d is specified.
This study used power analysis to calculate the sample size, and followed the SEM technique
suggested by Anderson and Gerbing (1988) and Marsh et al. (1988) for the data analysis
(Section 4.8). A satisfactory sample size is essential for using SEM analysis to produce

121
reliable results and effective suggestions. Hair et al. (2010) considered four conditions
adequate for establishing an appropriate sample size within SEM: (1) the normality of the
data; (2) the estimation technique used by the researcher for analysis; (3) the size of the model
and its complexity; and, (4) the missing data. All these conditions are described in Section
5.4. Similar to previous relevant studies, the sample size for this study was 200 (see Gilbreath
& Karimi, 2012; Williden et al., 2012; Nielsen et al., 2008; Nyberg et al., 2008). A total of
323 survey responses were received, from which were drawn 200 complete responses. The
power analysis in this study was deemed sufficient with an effect size of .15 and error
probability of .05 for the targeted sample. Moreover, the choice of this sample size was
supported by other researchers, who claimed that a sample size of 200 participants can be
considered sufficient to achieve a desired level of statistical power with a specified model
(Kline, 2011; Garver & Mentzer, 1999; Hoe, 2008).
4.5 Profile of the selected sample
The web-based online survey for this study consisted of two sections. The first included
questions about participants’ demographic characteristics; the second asked about the study
variables. Participants were primarily screened out by their minimum age and job status (less
than 18 and/or part-time job). If qualified, they were requested to provide information about
their age, gender, marital status, income, level of education, working position, duration of
service in work, working hours per week, industry type, total number of employees at their
organisation site, the duration of service under the supervisor, their own appraisal rating over
the last year and any illness that prevented them from attending work at the time of data
collection. Table 4.1 provides the demographic data for the participants in this study.
5Table 4.1: Demographic profile of participants (N = 200)
Item Category Frequency Percentage
Gender
Male 95 47.5 Female 105 52.5
Age
18-25 years 13 6.5 26-35 years 68 34.0 36-45 years 50 25.0 46-55 years 45 22.5 56-65 years 17 8.5
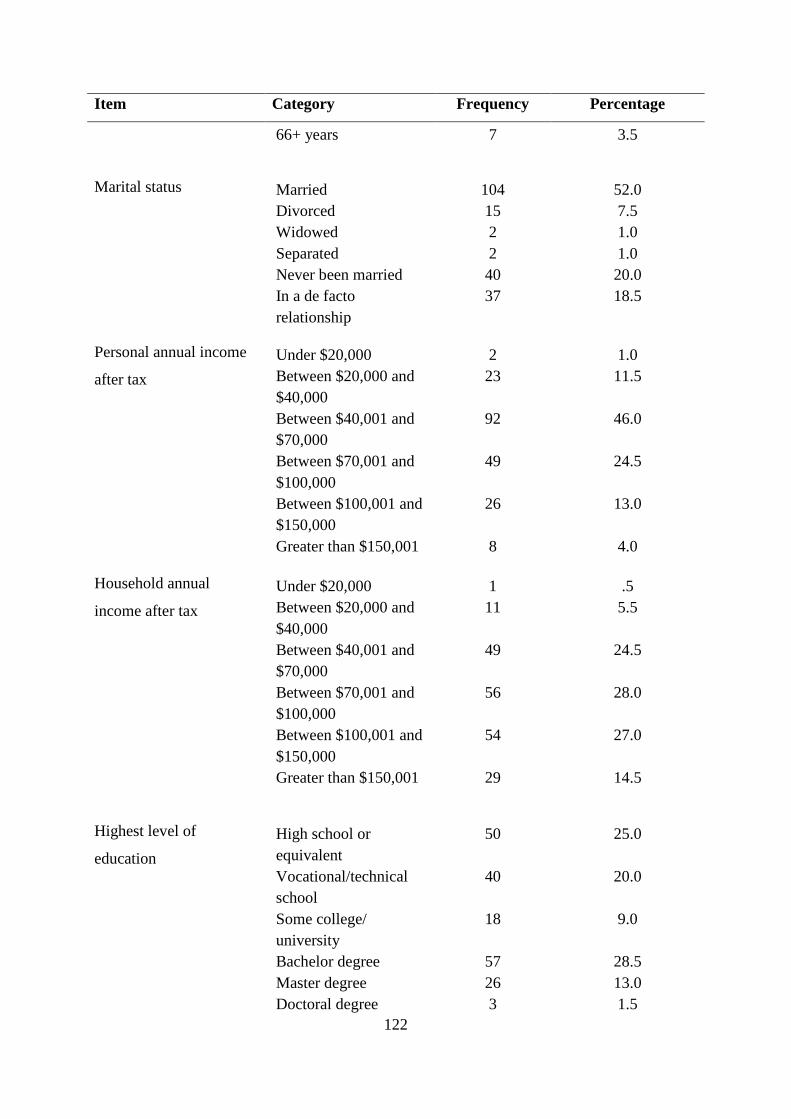
122
Item Category Frequency Percentage
66+ years 7 3.5
Marital status
Married 104 52.0 Divorced 15 7.5 Widowed 2 1.0 Separated 2 1.0 Never been married 40 20.0 In a de facto relationship
37 18.5
Personal annual income
after tax
Under $20,000 2 1.0 Between $20,000 and $40,000
23 11.5
Between $40,001 and $70,000
92 46.0
Between $70,001 and $100,000
49 24.5
Between $100,001 and $150,000
26 13.0
Greater than $150,001 8 4.0
Household annual
income after tax
Under $20,000 1 .5 Between $20,000 and $40,000
11 5.5
Between $40,001 and $70,000
49 24.5
Between $70,001 and $100,000
56 28.0
Between $100,001 and $150,000
54 27.0
Greater than $150,001 29 14.5
Highest level of
education
High school or equivalent
50 25.0
Vocational/technical school
40 20.0
Some college/ university
18 9.0
Bachelor degree 57 28.5 Master degree 26 13.0 Doctoral degree 3 1.5

123
Item Category Frequency Percentage
Professional degree 4 2.0 Others 2 1.0
Work position in the
organisation
Unskilled Worker 16 8.0 Skilled Worker 70 35.0 Team Leader 25 12.5 Executive 8 4.0 Manager 43 21.5 Director 8 4.0 General Manager 7 3.5 Chief Executive Officer
3 1.5
Others 20 10.0 Duration of service in
work
Less than 1 year 16 8.0 1-3 years 40 20.0 4-7 years 64 32.0 8-11 years 21 10.5 12-15 years 23 11.5 Over 15 years 32 16.0 Total 196 98.0 Missing 4 2.0
Working hours/Week
Less than 10 hours 1 0.5 20–29 hours 2 1.0 30–39 hours 105 52.5 40–49 hours 69 34.5 50–59 hours 19 9.5 60–69 hours 2 1.0 More than 70 hours 2 1.0 Less than 10 hours 1 0.5
Industry type
Financial sector 30 15.0 Telecom sector 8 4.0 Health sector 22 11.0 Don't know 10 5.0 Others 130 65.0
No. of employees work
at participants’ 1 10 5.0 2-4 14 7.0 5-9 13 6.5
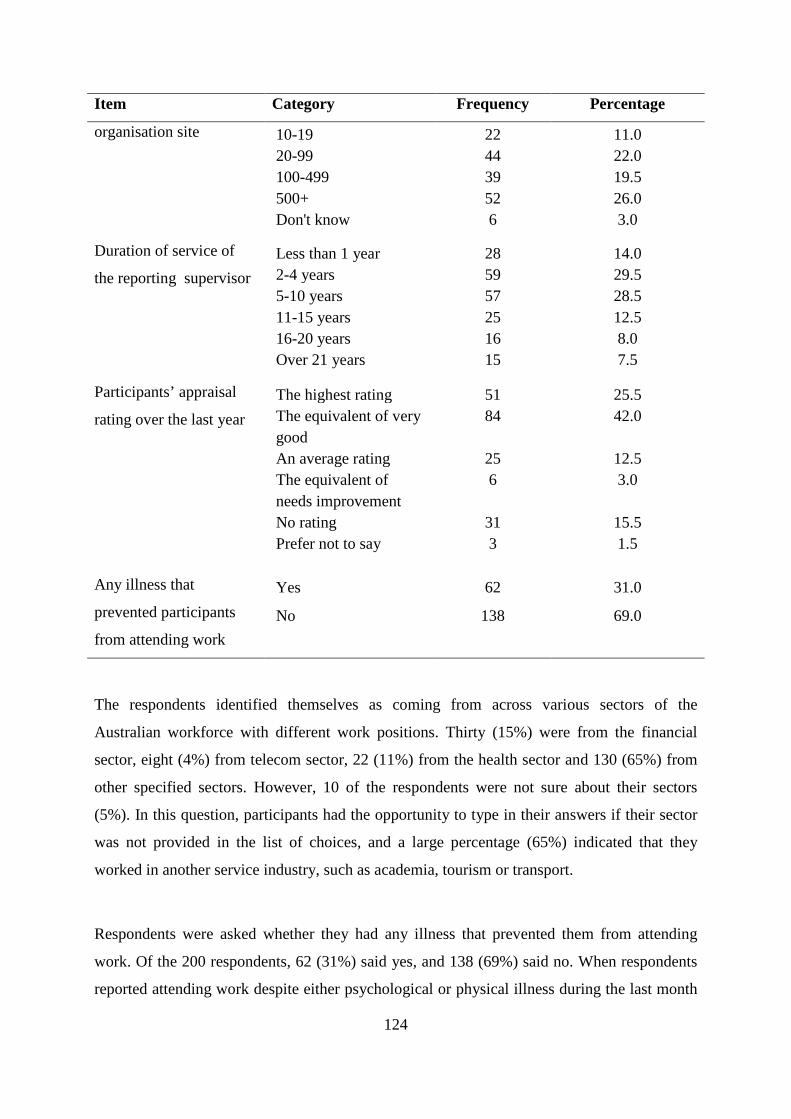
124
Item Category Frequency Percentage
organisation site
10-19 22 11.0 20-99 44 22.0 100-499 39 19.5 500+ 52 26.0 Don't know 6 3.0
Duration of service of
the reporting supervisor
Less than 1 year 28 14.0 2-4 years 59 29.5 5-10 years 57 28.5 11-15 years 25 12.5 16-20 years 16 8.0 Over 21 years 15 7.5
Participants’ appraisal
rating over the last year
The highest rating 51 25.5 The equivalent of very good
84 42.0
An average rating 25 12.5 The equivalent of needs improvement
6 3.0
No rating 31 15.5 Prefer not to say 3 1.5
Any illness that
prevented participants
from attending work
Yes 62 31.0
No 138 69.0
The respondents identified themselves as coming from across various sectors of the
Australian workforce with different work positions. Thirty (15%) were from the financial
sector, eight (4%) from telecom sector, 22 (11%) from the health sector and 130 (65%) from
other specified sectors. However, 10 of the respondents were not sure about their sectors
(5%). In this question, participants had the opportunity to type in their answers if their sector
was not provided in the list of choices, and a large percentage (65%) indicated that they
worked in another service industry, such as academia, tourism or transport.
Respondents were asked whether they had any illness that prevented them from attending
work. Of the 200 respondents, 62 (31%) said yes, and 138 (69%) said no. When respondents
reported attending work despite either psychological or physical illness during the last month

125
38 reported that they did not want to increase workload of others (19%), 44 reported lack of
replacement (22%), 34 felt that there would have been an increased burden of work once
returned (17%), 87 reported not being sick enough (43.5%), 24 reported pressure from work
(12%), 19 reported money or financial stresses (9.5%), three reported that their sick leave had
been used up ( 1.5% rounded), 16 reported concern for job security (8%) and 44 specified
other reasons (22%).
4.6 Measures (survey instruments)
The second part of the web-based survey questionnaire combined four measures with 40
items in total for the hypothesised model. The measures were:
• Perceived Responsible Leadership from Doh et al. (2011);
• Presenteeism with the Stanford Scale 6 (SPS-6) from Koopman et al. (2002);
• Organisational Commitment from Meyer et al. (1993); and
• Employee Turnover Intentions from Donnelly and Ivancevich (1975).
4.6.1 Perceived responsible leadership
In this study, RL was measured using a scale developed by Doh et al. (2011) that measures
RL from employees’ perceptions about their managers’ or supervisors’ leadership responses;
it consists of 13 items divided into three components of the scale: stakeholder culture (This
organisation takes an active role in its community. This organisation responds well to a
diverse group of stakeholders), HR practices (Our performance appraisal programs are
effectively used to retain the best talent. Our organisation believes that all employees deserve
to be actively managed as talent), and managerial support (My immediate manager gives me
the support I need to do my job well. My immediate manager is good at developing people)
(Appendix C). Responses were on a seven-point scale (1 = strongly disagree, 2 = somewhat
disagree, 3 = slightly disagree, 4 = neither agree nor disagree, 5 = slightly agree, 6 =
somewhat agree, 7 = strongly agree). Cronbach’s alpha of perceived RL was .94 as a
composite scale. Stakeholder culture, HR practices, and managerial support yielded alpha
values of .87, .93 and .95 respectively in this study.

126
Scholars have commented on the lack of available instruments to measure RL, and have said
that the development of any new instruments risks incorporating a subjective notion of RL
(Waldman, 2011; Miska & Mendenhall, 2016). The cross-level perspectives (macro, meso
and micro) of RL are known to challenge the importance of RL orientations across all levels
(see Voegtlin et al., 2012, p. 5). Here, macro-level indicates interaction of organisations with
the wider society; meso-level, the level of analysis of internal organisational structures and
practices; and micro-level, the degree of personal interaction of individual agents. To achieve
the research aims of this study, a scale to assess both subjective and organisational
perspectives (stakeholder culture, HR practices and managerial support) was required. There
are two scales to measure RL. The discursive responsible leadership measure developed by
Voegtlin (2011) includes items that measure superiors’ roles with respect to various
stakeholders rather than focusing on employees’ expectations that their leaders will exhibit
RL. As the aim of this thesis was to measure the influence of RL on employee outcomes from
the employee perspective, Voegtlin’s (2011) scale was deemed inappropriate. The other scale
to measure RL was developed by Doh et al. (2011) through collaboration between academics
and HR experts, and intended to be applicable and generalisable to multi-country studies. This
scale has the required components (as noted in Section 4.6.1, page 120) to gather data about
perceptions of RL from both organisational and employees’ perspectives, and exhibits the
appropriate psychometric properties (Appendix A-3). Hence, Doh et al.’s (2011) scale, rather
than Voegtlin’s, was deemed appropriate for this study.
4.6.2 Presenteeism
Presenteeism was measured with the Stanford Scale 6 (SPS-6: Koopman et al. 2002). The
SPS-6 measures an individual’s ability to perform at normal levels while in a state of
distraction. The six-item scale was structured with 10 health conditions: allergy, arthritis,
asthma, any cancer, depression/sadness/mental illness, diabetes, heart disease, hypertension,
migraine/headache and respiratory disorders. This scale used a five-point Likert scale ranging
from 1 (strongly disagree) to 5 (strongly agree). A sample item from the SPS-6 is: Because of
the above mentioned health condition(s) the stresses of my job were much harder to handle.
Internal consistency or reliability for SPS-6 was found to be high (Cronbach’s α = 0.80), and
concurrent validity was found to be high also in the specific measures of presenteeism
(Koopman et al., 2002). However, in this study, the reliability score (Cronbach’s alpha) of

127
SPS-6 was .78 as a composite scale. The components ‘work process’ and ‘work outcome’ had
the alpha values of .82 and .75 respectively. The Stanford SPS-6 measures an employee’s
ability to perform at normal levels through selected health conditions (Koopman et al., 2002).
This thesis examined the influence of RL on the attribute of presenteeism with 10 health
conditions (see Section 4.6.2, page 121).
Various scales are used across organisations and professions to measure the costs associated
with presenteeism. The researcher had the option of using the Iverson et al. (2010) measure or
the Stanford SPS-6 measure in the current study. The Iverson et al. (2010) measure estimates
the cumulative impact and related costs of presenteeism for employee productivity. This
instrument focuses on productivity loss or cost of time lost from working hours. However,
this thesis did not aim to measure productivity loss due to presenteeism.
The Stanford SPS-6 measures employees’ ability to perform at their usual levels at various
health levels (Koopman et al., 2002). McClain (2013) recommends SPS-6 as an emerging
scale to apply in employee health and wellness interventions for improving employee
productivity. Several researchers (e.g. Collins et al., 2005; Turpin et al., 2004) have suggested
that SPS-6 is the most concise and appropriate for these purposes. This thesis examines the
influence of RL on the attribute of presenteeism relating to 10 health conditions (Section
4.6.2, page 121). Therefore this study applied the Stanford SPS-6 measure to assess the
degree of difficulty employees experience in performing their daily work tasks.
4.6.3 Organisational commitment
Organisational commitment was measured using the three commitment scales adapted from
Meyer et al. (1993). This scale has three components: affective, continuance and normative
each of which has six items, for a total of 18 items (Appendix C). Sample items for affective
commitment included I would be very happy to spend the rest of my career with this
organisation and I do not feel emotionally attached to this organisation. Sample items for
continuance commitment included It would be very hard for me to leave my organisation
right now, even if I wanted to and I feel that I have too few options to consider leaving this
organisation. Sample items for normative component included I would feel guilty if I left this
organisation now and This organisation deserves my loyalty. Responses used a five-point

128
scale (1 = strongly disagree, 2 = somewhat disagree, 3 = Uncertain, 4 = somewhat agree, 5 =
strongly agree). Ko et al. (1997) conducted a study using the Meyer et al.’s (1993) scales and
reported coefficient alphas of 0.86 for affective commitment, 0.58 for continuance
commitment and 0.78 for normative commitment in sample 1 and 0.87, 0.64, and 0.76,
respectively, in sample 2. In this study, the reliability score, or Cronbach’s alpha of
organisational commitment was .88 as a composite scale. The components of affective,
continuance, and normative commitment had alpha values of .86, .73, and .90 respectively.
Several scales are available to measure OC. For example, Grusky (1966) proposed a scale
with four items: organisational seniority, identification with the organisation, attitudes toward
administrators and general attitudes toward the organisation. Hrebiniak and Alutto (1972)
applied a four-item scale of OC that asked, in effect, “what it would take for the employee to
leave the organisation”. Similarly, Kanter (1968, 1977) used a 36-item scale, but has not
reported on either its validity or its reliability. Thereafter, Wiener and Gechman (1977)
proposed an approach where OC was measured by noting employees’ conduct of voluntary
work-related activities during personal time. However, all these instruments and scales had
systematic and comprehensive limitations on establishing stability and consistency.
Meyer et al.’s (1993) scale was the most suitable for the research aims of this thesis for two
reasons. First, as Jaros (2007) notes, this scale reflects: (a) a specific type of commitment,
such as affective, normative, or continuance, associated with remaining in the organisation;
(b) the target of this commitment (organisation); (c) the behaviour to be predicted, such as
remaining a member of the organisation; and (d) affect, with cognitions being captured by the
mindset and behavioural terms. These characteristics of the scale align well with the research
aims and context of this thesis (Section 1.5, page 20). Second, similar to the aims of this
study, Meyer et al.’s (1993) scale has been used by several researchers to predict essential
employee outcomes, such as turnover and citizenship behaviours, job performance,
absenteeism and tardiness, with satisfactory validity and reliability scores (Meyer et al.,
2002).

129
4.6.4 Employee turnover intentions
Employee turnover intentions were measured with a scale developed by Donnelly and
Ivancevich (1975). The three-items scale used a five-point scale (1 = strongly disagree, 2 =
somewhat disagree, 3 = uncertain, 4 = somewhat agree, 5 = strongly agree) (Appendix C).
The measure included items such as It is likely that I will actively look for a new job soon; I
often think about quitting; and, I will probably look for a new job in the near future. Donnelly
and Ivancevich (1975) provided evidence of the scale’s criterion validity; reliability was
indicated with a Cronbach’s alpha of 0.88 (Fournier et al., 2010). The reliability score,
Cronbach’s alpha for employee turnover intentions was .88 in the current study.
The notion of turnover intention is well examined in the organisational studies literature
(Sager et al., 1998). In most cases, researchers have used a single-item scale (Guimaraes,
1997; Lambert et al., 2001), but this was deemed inadequate for this thesis. Martin and Roodt
(2008) suggest that only a limited number of studies have used more than three items in their
instruments (e.g., Becker, 1992; Fox & Fallon, 2003; Lum et al., 1998). However, these
instruments have been shown to be insufficiently validated. This study applied Donnelly and
Ivancevich’s (1975) scale for two reasons. First, this scale has been well established to
examine turnover intentions as a means of measuring the impact of turnover predictors (Price
& Mueller, 1981; Bluedorn, 1982; Hom & Griffeth, 1987). Second, several researchers
recommend this scale as a credible and effective tool because it includes items such as: It is
likely that I will actively look for a new job soon; I often think about quitting; and I will
probably look for a new job in the near future (Lysonski & Johnson, 1983; Johnston et al.,
1990).
4.7 Procedure for data collection
In this study, a pilot test was conducted prior to final data collection. In the pilot test, 20
respondents (10% of the sample size N=200) were requested to provide their feedback about
the measures, and to identify any probable difficulties responding the questions, so that these
could be rectified in the final data collection. According to Reynolds et al. (1993), use of a
pilot test enhances the questionnaire design and identifies areas for improvement in the
survey. In the pilot, respondents were requested to provide further comments and suggestions

130
to improve the survey questionnaire. The feedback from the pilot test was used to validate the
survey for the final data collection. However, no major changes were needed except a few
explanatory notes about item wording. For example, formal high potential program’ was
reworded as ‘employee training and development for team building or enhancing leadership
skills’ for better comprehension in the final data collection. Finally, this study was approved
by the University’s Human Research Ethics Committee (HREC) (Appendix A-1 contains the
HREC Report).
After the pilot test, invitations to complete a web-based survey were sent out by the company
Qualtrics. The invitation letter included the nature and purpose of the study, data-collection
process, potential contribution and information about participants’ confidentiality and
privacy. Participants were also told the approximate time the survey would take and the
number of questions it involved. The invitation letter and the survey questionnaire are
attached at Appendix A-2 and A-3 respectively. The link to the survey questionnaire was
provided in the invitation letter and distributed by Qualtrics. It was an anonymous survey, and
the invited participants had the choice to discontinue their participation at any point before
submitting the complete survey. In addition, participants were required to answer all the
questions in each section before they moved to the next part of the questionnaire. The survey
was technically programmed so that each participant could not submit more than one survey,
and that only one survey could be submitted from a given IP address.
Qualtrics recruited the participants. Data collection was carried out for two weeks. To recruit
the target sample (N=200), Qualtrics sent 3500 online invitations via email to potential
participants; 323 responses were collected to confirm 200 complete responses. A total of 123
responses were incomplete and were, therefore, exempted from the findings, resulting in an
overall response rate of 9.2%. This response rate is reasonably common for this type of
survey; Punch (2003) found that a response rate of 30-40% or even less is expected for online
surveys. At the end of data collection, the sample of 200 responses was analysed using the
statistical analysis program IBM SPSS (Version 21) as described in the following section.

131
4.8 Procedure for data analysis Data analyses in the current study were conducted in two stages: preliminary data analysis
and hypothesis testing.
4.8.1 Preliminary analysis
This study used descriptive and inferential statistics for the data analysis. Descriptive statistics
were used to describe the basic features of the research variables and to summarise the studied
data. Preliminary analyses conveyed the important aspects of the distribution for the survey
data and described the basic features of the participants’ responses to ensure that there were
no out-of-bound items beyond the projected range. The means, standard deviations, inferential
statistics with correlation matrix and reliability analyses of the selected scales were used to
test the hypotheses. Correlation analysis established the linear relationship among the studied
dependant and independent variables.
4.8.2 SEM: the two-step modelling approach
The current study used structural equation modelling (SEM) to conduct data analysis to
examine the hypothesised model (Figure 4.1). SEM is a comprehensive statistical modelling
tool for analysing multivariate data involving complex relationships between and among
variables (Hoyle, 1995). It combines the structural model and the measurement model, which
comprises everything that has been measured and observed among the variables examined.
Here, SEM was applied to test the proposed direct and mediated hypotheses between RL,
organisational commitment, employee turnover intentions and presenteeism. SEM was
applied to assess whether the model (both scales and hypothesised model) produced a
satisfactory fit with the collected data. This analysis was implemented using Analysis of
Moment Structures (AMOS), distributed by IBM SPSS (Version 21). Hence, SEM was the
prime analytical tool used in the current study, as explained in detail in Chapter 5.
This study followed the two-stage modelling approach developed by Anderson and Gerbing
(1988), which is a widely recommended approach for SEM. This approach considers a
feasible statistical tool for exploring multivariate relationships among some or all of the
variables and provides a comprehensive approach to a research question for measuring or

132
analysing theoretical models (Burnett & Williams, 2005; Anderson & Gerbing, 1988). It also
examines measurement error and provides path coefficients for both the direct and indirect
effects of structural hypotheses (Joreskog & Sorbom, 1996). Hence, the two-stage modelling
is a suitable approach, as it “provides a basis for meaningful interference about theoretical
constructs and their interrelations, as well as avoiding some special interference” (Anderson
& Gerbing, 1988, p. 411). In the current study, SEM was applied with two fundamental
components: measurement model and structural model.
In the first stage of the measurement model, SEM assesses the acceptability of the scales
based on how well each of the underlying indicators and errors fits in the model.
Confirmatory factor analysis (CFA) by SEM was used to test the validity, reliability and
goodness of fit for the measurement instruments. Researchers recommend conducting CFA
for each set of observed variables hypothesised to indicate their respective latent variable
(Byrne, 2010; Schumacker & Lomax, 2004). The goal of the study was to investigate how the
indicator variables (items of scales) converge on their respective theoretical latent construct.
In addition, the SEM measurement model was used to estimate the composite scale
reliabilities and discriminant validities of the latent variables. This was achieved by
comparing the correlations among the variables. In addition, Cronbach’s alphas were
calculated to determine whether the instruments maintained reasonable (>0.78) internal
consistency (reliability).
The second step in the measurement model stage determined the reliability for each construct
in the hypothesised model to ensure that the items posited to measure a construct were
adequately related to be reliable in justifying their degree of consistency (Hair et al., 2010).
Hence, reliability was tested with the Cronbach’s alpha test in SPSS. For the Cronbach alpha
value, researchers have suggested > 0.75 to confirm acceptability of reliability (Hair et al.,
1995).
Finally, the measurement model examined the goodness of fit for each measure by showing
how satisfactorily each variable of the proposed model fitted the collected data. Thus, a
combination of indices was compared with absolute, badness and incremental fit indices as
prescribed by several researchers (Hu & Bentler, 1999; Byrne, 2001; Hair et al., 2010). The

133
detail of the goodness of fit indices and their respective cut-off values are presented in
Chapter 5.
The structural model stage focused on the overall relationship between variables by
identifying how each construct appears in the model. The overall goodness-of-fit of the
proposed structural model was assessed according to Anderson and Gerbing (1988). The
structural model estimates the path coefficients of the direct and indirect relationships
between variables, whether latent or measured (Grimm & Yarnold, 2000). According to
Byrne (2001), a model fits the data well when the fit indices are established to be higher than
the specified cut-off values. These indices and particular threshold values are presented in
Chapter 5.
4.8.3 Hypothesis testing
Hypothesis testing is a statistical procedure used to accept or reject the hypothesis based on
the sample information (Burns & Bush, 2006). This study proposed six direct hypotheses and
two simple mediation hypotheses (H1-H8) to address the aims of the current study, as
described in Section 4.2. The following two sections describe each underlying test that was
used in the data-analysis process.
4.8.3.1 Direct hypotheses
This study used SEM to examine the magnitude of the effect of the direct relationships among
the independent and dependent variables. The estimates of path coefficient weights between
the variables in SEM were used to determine the sign and strength of the relationship among
the variables proposed in the six direct hypotheses. Hair et al. (2010) advised that it is
essential to evaluate several assumptions before testing hypotheses for their conclusions.
Hence, four of the most popular assumptions were addressed in the statistical analysis:
normality, linearity, multicollinearity and homoscedasticity. Garson (2011) noted that
violating any one of these assumptions may undermine the credibility or research outcomes.
The assumptions are described accordingly.

134
First, this study used the Shapiro-Wilk (W) test to examine whether the sample of the study
was normally distributed or not. This test is based on the correlation between the data and the
corresponding normal scores (Peat & Barton, 2005). Garson (2011) recommended this test for
a sample of up to 2000 participants. The value of the W test is not significant if the variable’s
distribution is not significantly different from normal. Hence, as a guidline: if a W test is
statistically non-significant, the null hypothesis of the normal distribution is rejected (Hair et
al., 2010).
Second, this study verified linearity for the statistical relationship using scatterplots that
potted the dependent variable against each of the independent variables to justify the
assumption of linearity. Hair et al. (2010) suggested that the assumption of linearity reflects
better performance for hypothesis testing, because any statistical analysis inconsistent with
linear and nonlinear relationships may become inaccurate for further calculations.
Third, the assumption of multicollinearity appears when two or more variables in a
hypothesised model are highly correlated and provide redundant information about the sample
data. It is effective when there are high levels of intercorrelations among explanatory
variables, and they are equal to or higher than r = .80 (Rubin, 2009; Garson, 2011). The
consequences of high multicollinearity may increase the standard error of estimates
(decreased reliability) and cause confusing or misleading results (Burns & Bush, 2006).
Hence, Garson (2011) suggested that it would be better to use other tests that can take
interaction effects, as well as simple correlations into consideration rather than only
considering the values of inter-correlation. Thus, multicollinearity should be assessed and can
be eliminated with the tolerance value or variance inflation factor (VIF). However,
multicollinearity is not an issue when the tolerance value is below 0.10 or when the value of
VIF is above 10.0 (Burns & Bush, 2006; Hair et al., 2010). In this study, there was no
reported multicollinearity, as it was measured by Pearson’s correlation for describing the
strength and direction of the relationships between the hypothesised variables in the proposed
model.
Finally, homoscedasticity (also known as homogeneity of covariances) means that the
variance of errors is same across all levels of the independent variables (Osborne & Waters,
2003). It refers to the assumption that the dependent variable shows similar extents of

135
variance across the range of values for the independent variables (Kim & Bentler, 2002; Hair
et al., 2010). It is indicated when the width of the band of residuals is nearly the same at
different levels of the dependent variable and scatter plots show a pattern of residuals
normality distributed around the mean (Berry & Feldman, 1985). The assumption of
homoscedasticity in this study was examined using SPSS and checked graphically by
observing whether bivariate scatterplots had an oval shape versus a cone shape.
After testing the four assumptions with the direct hypotheses, this study considered the simple
mediation of the hypothesised model.
4.8.3.2 Simple mediation hypothesis
This study considered the simple mediation effects of organisational commitment and
employee turnover intentions on the relationship between perceived RL and presenteeism.
Preacher and Hayes (2004) acknowledged that the simple mediation model exists when an
independent variable (X) affects a dependent variable (Y) through a mediator (M). The total
effect of X on Y signifies the total effect (c). The direct effect of X on Y after the addition of
M is expressed as (c'). Path (a) represents the effect of X on M, and path (b) characterises the
effect of M on Y controlling for the effect of X. The indirect effect of Y and X is defined as
ab. In most cases, the indirect effect (ab) represents the difference between the c and c' (ab=c-
c'); thus the total effect (c) can be estimated as the sum of c and ab (c= c'+ ab). As a rule of
thumb, a partially mediated model is supported when the value of the indirect effect path (ab)
is smaller than the value of the total effect path (c) and has the same sign.
The causal-steps approach established by Baron and Kenny (1986) is the most cited approach
to test simple mediation (Hayes, 2009; MacKinnon & Fairchild, 2009). This approach also
indicates a series of requirements that must be considered for the mediation model to work.
According to Baron and Kenny (1986), Judd and Kenny (1981), and MacKinnon et al. (2002),
the requirements are: (1) the total effect of the independent variable on the dependent variable
must be significant; (2) the path of the independent variable to the mediator must be
significant; (3) the path from the mediator to the dependent variable must be significant; and
(4) the fourth step is required only for complete mediation. However, if the independent
variable no longer has any effect on the dependent variable when the mediator has been
controlled, the complete mediation has occurred and the model is considered fully mediated.

136
However, it has weaknesses also, such as limitation to identify the mediation effect and the
inability to quantify the magnitude of the mediation effect. The limitations of this method
make it questionable for testing hypotheses (MacKinnon & Fairchild, 2009; Hayes, 2009). In
addition, the current study used the bootstrapping approach which is more valid and effective
method for explicitly testing the mediation results; hence, it should be the method of choice
for mediation analysis (Hayes, 2009).
Bootstrapping uses the sample data to estimate relevant characteristics of the population. It
can be used to originate exact standard errors, confidence intervals and hypothesis tests for
most statistics (Blunch, 2013). The SEM in the current study involved the bootstrapping
purpose in AMOS software for two particular causes. First, it uses several items for goodness
of fit indices and helps in estimating whether the hypothesised model fits the observed data to
meet the two-step approach developed by Anderson and Gerbing (1988). Second, SEM
enables the testing of a mediating hypothesis, rather than requiring separate regression
analyses for testing them. The maximum likelihood estimation method, used as a default in
SEM with AMOS, concurrently measures all model paths together (Byrne, 2010).In this
study, the bootstrapping procedure in AMOS was used and performed with 5,000 resamples.
Statistical significance for the indirect effect was determined by 99% bias and accelerated
confidence intervals (Hayes, 2009; Hayes et al., 2010).
4.9 Chapter summary
This chapter stated the overall research methodology used in this study. It has provided a
justification for the methodology used to test the hypotheses and achieve the aim(s) of the
study. The chapter described the proposed hypothesised model and hypotheses. A detailed
analysis of the research design, including the target population, and the sample, concerns of
sampling, and the survey instruments used to consider the five variables of the study were
explained. A comprehensive explanation of the data-collection and data-analysis procedures
was also presented. Chapter 5 presents the results of the data analysis with the details of SEM,
the main analytical technique of the study.
137
5 ANALYSIS AND FINDINGS
5.1 Introduction
This chapter reports the results of the current study in two parts. The first part (Sections 5.2 to
5.4) provides the discussion and application of structural equation modelling (SEM); Section
5.2 then presents an overview of the SEM including its definition and characteristics and
some major strategies used in the current study. Section 5.3 explains four steps for testing
models in SEM. The sample size and relative issues of SEM are outlined in Section 5.4.
The second part (Sections 5.5 to 5.9) reports the results of hypothesis testing. Section 5.5
examines the first stage of the two-stage modelling approach to analyse and assess the
validity, reliability and goodness of fit for each measurement scale. Then, Section 5.6 inspects
the second stage of this modelling approach by evaluating the goodness of fit for the
structural model based on the first phase of the two-stage modelling approach. All the
correlations among study variables are reported in Section 5.7. Then, Section 5.8 describes
the four assumptions for violating issues before testing the hypotheses. Section 5.9 examines
all the hypotheses for the current study and the last section provides a summary of this
chapter.
5.2 Fundamentals of structural equation modeling
As a methodological procedure, SEM tests and analyses the relationship between variables to
incorporate unobserved variables (or latent variables) measured indirectly by indicator
variables (Hair et al., 2014). It is used when the unobserved variable is not directly
measurable; for example, when the unobserved variable is more theoretical in nature or would
be difficult and expensive to measure it in practice. Byrne (2010) indicated two significant
aspects of SEM. First, the causal processes within SEM present a series of structural
equations (i.e., regression), and second, these structural relations can be modelled pictorially
to enable a clearer conceptualisation of the theory under study. Thus, the following sections
describe the definitions, characteristics and approaches or strategies of SEM to analyse the
collected data.

138
5.2.1 What is SEM?
SEM, developed by Joreskog (1973), is a multivariate statistical analysis technique that is
applied to analyse structural relationships between a set of observed (measured) and
unobserved (latent) variables (MacCallum & Austin, 2000; Hair et al., 2014). In other words,
it is a technique or methodology for representing, measuring and testing a theoretical network
of (mostly) linear relationships among variables (Rigdon, 1998). It offers relative variable
strength or importance and simultaneously scrutinises theoretical models. SEM combines the
techniques of factor analysis, path analysis, and econometric modeling. Moreover, it can be
applied to conduct confirmatory factor analysis (CFA) to test the validity, reliability and
goodness of fit of the measurement instruments. SEM is concerned with the relationships
among several constructs (variables), taking into account their pre-specified measurement
structure (Yang, 2003). Hence, SEM provides a more holistic approach to model-building and
allows assessing both measurement issues and causal relationships in one model through the
use of path analysis, which statistically and visually illustrates complex relationships among
variables (Kline, 2011). Moreover, SEM can accommodate the bias in the estimates due to the
measurement error associated with imperfect measures in social science data by using
multiple indicators for all latent variables (Hair et al., 2014). Therefore, SEM can provide
more-precise parameter estimates and increased statistical power.
SEM examines relational models to justify its good fit to collected data and provides a
research conclusion. The unobserved variables are statistically measured through several
underlying observed variables in the proposed model. In this study, the unobserved (latent
variables) were RL, organisational commitment, employee turnover intentions and
presenteeism. The observed variables comprised 13 items of the RL scale; eighteen items of
the organisational commitment scale; three items of the employee turnover intentions scale;
and six items of the presenteeism (SPS-6) scale. Therefore, the proposed model of this study,
which was based on previous research, consisted of four unobserved latent variables and 40
indicators that represented the four scales. It should be noted that this proposed model was
modified when conducting the first stage of the two-stage modelling approach according to fit
indices.

139
5.2.2 Key characteristics of SEM
SEM helps researchers with a comprehensive method for the quantification and testing of
substantive theories (Grace, 2006). Major characteristics of SEM are that they explicitly take
into account measurement (scale) error that is ubiquitous in most disciplines, and typically
contain latent variables (Blunch, 2008). Raykov and Marcoulides (2006) identify three
significant characteristics of SEM. First, it can measure and consider constructs that are
theoretical, abstract in nature or hypothetical and not easy to measure directly. For example,
satisfaction, anxiety, attitudes, goals, intelligence, motivation, personality, reading and writing
abilities, aggression, or socioeconomic status can be viewed as representative of such
constructs. Second, it can consider the potential errors of measurement in all observed
variables, in particular in the independent (predictor, explanatory) variables. This is possible
by adding an error term for each fallible measure, whether it is an explanatory or predicted
variable. The variances of the error terms are, in general, parameters that are estimated when a
model is fit to data. Third, SEM usually fits matrices of interrelationship indices; that is,
covariance or correlation matrices, between all pairs of observed variables, and occasionally
also to variable means. SEM goes beyond regression analysis by modeling several
multiple-regression equations between sets of variables together, including mediators when
necessary (Blunch, 2008; Byrne, 2001). These characteristics mentioned suggest SEM as a
superior method to test the hypothesised model for this study.
5.2.3 Strategies for model testing in SEM
For a quantitative methodology, SEM can be applied using several strategies. Joreskog and
Sorbom (1996) described three strategies for SEM: (1) a strictly confirmatory strategy that
examines a theoretical model with no modifications to the original model; (2) model
generating or development that estimates the initial specifications for a model, then makes
subsequent re-specifications with the aim of reaching a final model with better fit; and (3) an
alternative-models strategy that analyses alternative or 'rival' models with the intention of
deciding the most valid. A brief description of these strategies is presented below.
Strictly confirmatory: This strategy is highly restrictive, requiring the investigator to
evaluate a single model in isolation and leaving little recourse if that model does not work
well (MacCallum & Austin, 2000). Ultimately, the researcher has a single model that is

140
accepted or rejected based on its correspondence to the data (Joreskog, 1973). In this strategy
SEM assesses the goodness of fit of the hypothesised model, and the researcher aims to focus
only on whether to accept or reject the model without any further modification. For a
hypothesised model, researchers integrate their concepts from related theories and research
described previously to examine the influence among variables.
Model generation: This strategy is probably the most common and occurs when an initial
model does not fit the data and is subsequently modified by the researcher. Byrne (2010)
found that it was the most common of the three strategies. It depends on the goodness of fit of
the model (Section 5.3.3) and is considered useful if the original model provides a poor fit to
the data, as it allows the researcher to re-specify and improve the model fit. MacCallum and
Austin (2000) advised that any modifications in models for this strategy should be guided by
relevant previous research or theories to avoid distorted and unclear results. The strategy is
possibly misleading and easily mistreated; studies have shown that such data-driven model
modifications may lack validity (MacCallum, 1986) and are highly susceptible to
capitalisation on chance (MacCallum et al., 1992). Hence, Joreskog and Sorbom (1996)
recommended that this strategy be applied with some preconditions. First, it should be
acknowledged that the resulting model is in part data-driven; second, modifications must be
substantively meaningful; and third, the modified model must be evaluated by fitting it to an
independent sample. In this strategy, the researcher is interested in an exploratory rather than
confirmatory manner to modify and re-estimate the model as necessary.
Alternative models: This strategy refers to situations in which more than one a priori model is
available, and has been found more useful for testing models using SEM (Joreskog, 1973;
Maccallum & Austin, 2000). Here, researchers compare the original model with several
alternative credible models to identify a particular model that best fits the research data.
MacCallum and Austin (2000) suggested that the strategy contributes some protection from
the confirmation bias of other strategies. However, it also requires appropriate theoretical or
empirical foundations to identify more than one model; the particular model with adequate
correspondence (model fit) to the data may be retained, but the rest will be rejected (Kline,
2011).

141
This study considered a confirmatory approach and the purpose of this thesis was to test a
hypothesised model driven by previous research and find the best model to fit the data
(Section 5.3.1). Therefore, it was suitable to follow both the model-generating and
alternative-models strategy for testing the hypotheses of this study. The application of both
strategies together provided a rigorous evaluation to ensure the best model to fit the data, as
well as to offer meaningful inferences for the hypotheses of the study.
5.3 Four stages for testing a model in SEM
Four stages are involved in testing SEM models: model specification, model estimation,
model evaluation, and model modification (e.g., Kline, 2011; Schumacker & Lomax, 2004;
Hair et al., 2014). They are reiterative because problems at a later step may require a return to
an earlier one. These steps are briefly explained below.
5.3.1 Model specification
The hypothesised model (Figure 4.1) was presented in Chapter 4; the current study analysed
the model with AMOS using SPSS (IBM Version 21). This was directed by two initial steps:
the model conceptualisation and path diagram construction. First, the hypotheses were
translated into a testable model. This is an essential step, as it is unlikely that a model lacking
unobserved or observed variables can result in a useful, testable model. Second, the
hypothesised relationships among unobserved variables and observed variables were drawn
graphically as a path diagram. A path diagram connects variables based on relevant theory
and logic to visually display the hypotheses that will be examined in the study (Hair et al.,
2014). It is important because it helps in explicitly depicting the direct and indirect
relationships in the model (Diamantopoulos & Siguaw, 2000). These paths (Figure 3.1in
Chapter 3) were established on the evidence from previous research as described in the
literature review chapter.
Model specification requires researchers to support hypotheses with relevant theories and
research studies to develop their theoretical models. Hence, before any data collection or
analysis, researchers specify a particular model that should be confirmed using
variance-covariance data. In other words, available information from literature or related

142
studies is used to select the variables for the proposed theoretical model and the relationship
among then (Schumacker & Lomax, 2010). Thus, this stage involves determining every
relationship and variable in the model according to the study’s aims. It is the manner by
which the researcher finalizes which relationships are null, which are fixed to a constant, and
which may vary (Khine, 2013).
Savalei and Bentler (2006) suggested that in this stage, the researcher should follow three
essential conditions. First, the number of estimated parameters in the proposed hypothesised
model should be less than or equal to the data obtained from the sample covariance matrix.
Second, the study needs to ensure that each unobserved variable has one of its loadings to its
indicators or observed variables. However, this is adjusted automatically by AMOS software
as a default option. Third, the unobserved latent variables should relate to several underlying
indicators to allow their identification. In this study, these conditions were met by assigning
the four unobserved variables with the items that developed the four scales. The proposed
model was run in AMOS without any error message, and thus satisfied these three conditions
and completed this stage successfully.
5.3.2 Model estimation stage
The estimation stage determines the value of the unknown parameters and the error associated
with the estimated value from a set of observed data. According to Iriondo et al. (2003), the
aim of this stage is to estimate the value of the unknown parameters, such as the standardised
path coefficients, in such a way that the observed variance-covariance matrix is optimally
adjusted to the predicted moment matrix. Schreiber (2008) also stated that this stage concerns
the procedure to derive the parameter estimates, such as the coefficients and standard errors.
This study used AMOS, which provides a number of estimation approaches, such as
maximum likelihood estimation (ML), weighted least squares (WLS), generalised least square
(GLS), unweighted least square (ULS), two stages least square (2SLS) and asymptotically
distributed free (ADF) methods. Selection of any estimation method depends on whether the
data are normally distributed. For example, ULS estimates have no distributional assumptions
and are scale dependent, which means that the scale of all the observed variables should be
the same for the estimates to be consistent. Similarly, the ML and GLS approaches consider
multivariate normality although they are not scale-dependent. Hence, when the normality

143
assumption is violated, it is recommended to use ADF as the WLS estimator, as it does not
assume normality. However, the ADF estimator involves very large samples (i.e., n = 500 or
more) to produce accurate estimates (Yuan & Bentler, 1998). In contrast, simple models
estimated with ML can achieve accurate estimates with a sample size as small as 200. The
ML method is more popular and more highly recommended than others, as it identifies
estimates that have the highest chance of reproducing the observed data (Blunch, 2008).
The ML principle is based on calculation of the likelihood function in AMOS, which
expresses the probability of obtaining the present data (covariance or correlation matrix) as a
function of the parameters of the method (Blunch, 2008). Thus, ML gives estimates based on
maximising the likelihood that the observed covariances are drawn from a population
assumed to be the same as that indicated in the coefficient estimates. Garson, (2011)
suggested the following important assumptions inherent in ML: (1) it does not assume
uncorrelated error terms; (2) it includes a large sample as required for asymptotic
unbiasedness; (3) it includes indicator variables with multivariate normal distribution; (4)
there is a valid specification of the model; and (5) it includes continuous interval-level
indicator variables. Practitioners and researchers have also given other reasons to use ML. For
example, Savalei and Bentler (2006) preferred ML because it maximises the likelihood of
observed variables under any proposed model and works better than many other estimation
methods that require fewer assumptions such as normality.
5.3.3 Model evaluation (model fit) stage
After estimation, the evaluation stage (also known as ‘model fit’) is attained for the specified
model to determine how well the data fit the hypothesised model (Schumacker, & Lomax,
2010). This stage focuses on evaluating the fit, or the goodness of fit, of the model to support
the proposed model. If the hypothesised model suitably estimates all of the substantiate
relationships between the unobserved and observed variables, it should be possible to estimate
a covariance matrix between measured variables (Blunch, 2008; Hair et al., 2010). A number
of goodness-of-fit indices must be assessed in SEM to establish whether the measurement
models (i.e., measurement scales) and structural model provide a good fit for the proposed
model. Shah and Goldstein (2006) argued that the complexity of this step guided researchers
to consider various goodness-of-fit indices with different cut-off values as a mixture of
indices that show the degree of fit or misfit in the models. However, to overcome the

144
complexity and achieve goodness of fit researchers have advised the use of three sets of
indices, such as absolute fit indices, badness-of-fit measures and incremental or comparative
fit indices (Blunch, 2008; Hair et al., 2010; Hair 2014). Badness-of-fit measures both weak fit
and lack of fit; the bigger the index, the more ‘bad’ the fit. Sections 5.3.3.1 to 5.3.3.4 will
describe and summarise these indices and justify their use in this study.
5.3.3.1 Absolute fit indices
Absolute fit indices estimate how well the specified model reflects the data. They provide an
assessment of how accurate a researcher’s theory or model fits the sample data (Hair et al.,
2006; Hair et al., 2014), and determine the extent to which both the measurement and
structural models predict the observed covariance (or correlations matrix) in comparison to no
model without using the alternative models as a basis for comparison (Joreskog & Sorbom,
1996; Blunch, 2008; Shah & Goldstein, 2006). They also indicate the extent to which the
proposed model reproduces the sample data (Shah & Goldstein, 2006; Khine, 2013). The
indices most frequently applied by researchers are the chi-square (χ2) statistic, ratio of the chi-
square to degrees of freedom (CMIN/DF), goodness-of-fit index (GFI) and adjusted
goodness-of-fit index (AGFI).
The chi-square statistics tests for the extent of misspecification (Khine, 2013). A significant
chi-square suggests that the model does not fit the sample data. In contrast, a non-significant
chi-square indicates a model that fits the data well. The chi-square statistic is a traditional
standard for estimating overall model fit, and is often pointed to as either a ‘badness-of-fit’
(Kline, 2011) or a ‘lack of fit’ (Mulaik et al., 1989) measure. A good model fit should provide
an insignificant result at a 0.05 threshold (Barrett, 2007). However, for small sample sized
study, chi-square lacks power and may not discriminate between good fitting and poorly
fitting models (Kenny & McCoach, 2003). For this reason, researchers have sought
alternative indices to assess model fit. For example, relative/normed chi-square (χ2/df)
minimises the impact of sample size, and though there is no consensus regarding an
acceptable ratio of this statistic, references range from as high as 5.0 (Wheaton et al., 1977) to
as low as 2.0 (Tabachnick & Fidell, 2007). However, in AMOS, the inadequacy in chi-square
within CMIN/DF has been reduced by dropping one or more paths. As the cut-off value,
researchers recognise a model as 'fit' with a value for CMIN/DF that is less than 5, with lower
values being better (Blunch, 2008; Hair et al., 2014).

145
To overcome the insufficiency of chi-square within CMIN/DF, further assessment of model
fit with the GFI and AGFI (Blanch, 2008; Khine, 2013). GFI is an alternative to χ2 and
estimates the proportion of variance that is accounted for by the estimated population
covariance (Tabachnick & Fidell, 2007). GFI is defined as a measure of the relative amount
of variances and covariances jointly accounted for by the model (Joreskog & Sorbom, 1996).
GFI assesses the relative value of the observed variances or covariances explained by the
model; it is analogous to the R2 in regression analysis. For a good fit, the recommended GFI
value should be > 0.95, with 1 being a perfect fit (Miles & Shevlin, 1998; Hu & Bentler,
1999; Khine, 2013). In contrast, AGFI attempts differing degrees of model complexity and
adjusts the GFI by a ratio of the degrees of freedom used in a model to the total degrees of
freedom (Blunch, 2008; Khine, 2013), with more saturated models reducing fit (Tabachnick
& Fidell, 2007); and AGFI tends to increase with a sample size. As with GFI, values for the
AGFI also range between 0 and 1, and it is accepted that values of 0.90 or greater indicate
well-fitting models (Bagozzi & Yi, 1988; Hu & Bentler, 1999). However, both GFI and AGFI
have similar limitations to chi-square in that they are less sensitive to sample size (Hu &
Bentler, 1999). Therefore, researchers have suggested applying the badness-of-fit measures or
incremental-fit indices (Hair et al., 1998; Diamantopoulos & Siguaw, 2000; Hair et al., 2010).
The two most common measures of badness-of-fit (sometimes called ‘parsimonious fit
measures’) are the mean square error of approximation (RMSEA) and standardised root mean
residual (SRMR); these are described below.
5.3.3.2 Badness-of-fit indices
RMSEA is defined as the average difference per degree of freedom expected to arise in the
population, not the sample (Hair et al., 1995). It has become ‘one of the most informative fit
indices’ (Diamantopoulos & Siguaw, 2000, p. 85) due to its sensitivity to the number of
estimated parameters in the model. In other words, RMSEA indicates how well the model,
with unknown but optimally chosen parameter estimates would fit the population covariance
matrix (Byrne, 1998). The cut-off points and references for RMSEA have been reduced
considerably in the last 20 years. In the 1990s, an RMSEA in the range of 0.05 to 0.10 was
considered an indication of fair fit and values above 0.10 indicated a poor fit (MacCallum et
al., 1999). It was then thought that an RMSEA of between ‘0.08 to 0.10’ gives a mediocre fit
and below 0.08 shows a good fit (MacCallum et al., 1999). However, a cut-off value close to

146
.06 (Hu & Bentler, 1999) or a stringent upper limit of 0.07 (Steiger, 2007) now appears to be
the consensus amongst authorities in this area.
SRMR is specified as the standardised difference between the observed covariance and
predicted covariance, which is well understood in the metric of the correlation matrix (Bollen
& Long, 1993; Byrne, 2001). SRMR is the square root of the difference between the residuals
of the sample covariance matrix and the hypothesised covariance model. SRMR also solves
this difficulty and is, therefore, much more significant to understand. Values for the SRMR
range from zero to 1.0 with well-fitting models reaching values less than .05 (Diamantopoulos
& Siguaw, 2000; Byrne, 1998), however values as high as 0.08 are deemed acceptable (Hu &
Bentler, 1999). For SRMR, 0.00 indicates a perfect fit but it must be noted that SRMR will be
lower when there is a large number of parameters in the model and models are based on large
sample sizes (Byrne, 2001; Khine, 2013).
5.3.3.3 Incremental (comparative) fit indices
Incremental-fit indices, also recognised as comparative (Miles & Shevlin, 2007) or relative fit
indices (McDonald & Ho, 2002), compare the perfection of the model to the null model,
where the null model considers no covariances among the observed variables (Khine, 2013).
They do not use the chi-square in its raw form, but compare the chi-square value to a baseline
model (McDonald & Ho, 2002). Moreover, these indices differ from the indices described
above as they compare the fit of the proposed hypothesised model with the null model where
all variables are uncorrelated and this model has the lowest fit (Schumacker & Lomax, 2010;
Khine, 2013). According to Norman and Streiner (2003), incremental indices are based on
two observations: (1) how much the model deviates from the null hypothesis of no
relationships; and (2) the index shrinking as the number of variables increases. The current
study applied three of the most popular incremental indices, such as the comparative fit index
(CFI), the tucker fit index (TFI) and the normed fit index (NFI). Byrne (2010) suggested that
the measures of these indices are normed, so their standards range between 0-1, and asserted
that the higher the value, the better the model fit the data. Values that equal or exceed 0.90 are
deemed to have an acceptable model fit (Hu & Bentler, 1999; Markland, 2007; Khine, 2013).

147
5.3.3.4 Summary of goodness-of-fit indices and their interpretation of optimal values
Given the above discussion about model fit and its measures, it is important to summarise a
list of the indices that guided the data analysis in the current study. Researchers have used and
justified various; there has been no particular or uniform index that delivers all the criteria
needed for model fit (Crowley & Xitao, 1997). It may be a temptation for many researchers to
select those fit indices that point out the best fit. Hooper et al. (2008) advised avoiding this
situation, as it may become very confusing for others. As a solution, some researchers have
suggested reporting a grouping of indices with RMSEA and SRMR (Hu & Bentler, 1999;
Sugawara & MacCallum, 1993). Similarly, Byrne (2010) advised using the CFI as an
important index for estimating the model’s goodness of fit. Others have advised using SRMR
when evaluating model fit (Savalei & Bentler, 2006). This study applied all the major indices
in deciding whether to accept the hypothesised model, and avoided incorrect propositions of
assessment by applying the suggested combination of indices. A total of nine indices within
the three general fit indices were used for this study. Table 5.1 summarises the selected
indices and recommended thresholds.
6Table 5.1: Summary of the selected indices and recommended thresholds
Name Type cceptable Level Comments
Chi-square (χ2) Model fit p > 0.05
(at the α = 0.05 level)
Smaller the better
Greatly affected by sample size. The
larger the sample the more likely the
p-value will indicate a significant
difference between the model and the
data. Hence, a non- significant result
indicates a model fit (Kline, 2011;
Barrett, 2007).
Normed Chi-square
(χ2/df)
Absolute fit
1.0<χ2/df <3.0 Values close to 1 indicate good fit but
values less than 1 may indicate over
fit. Hence, fit values of more than 5.0
suggest that the model needs
modification (Marsh et al., 1988; Hair
et al., 2010).

148
Name Type cceptable Level Comments
Goodness of fit (GFI),
&
Adjusted goodness of
fit (AGFI)
Absolute fit GFI & AGFI > 0.95 Values between 0.90 and 0.95 may
also indicate a satisfactory fit. Less
than 0.90 suggests that the model is a
poor fit. GFI index value that equals or
exceeds 0.90 indicates an acceptable
fit (Bagozzi & Yi, 1988; Schumacker
& Lomax, 2004), and a value close to
0.95 indicates a good model fit
(Hoelter, 1983; Hu & Bentler, 1999).
Root mean square
error of approximation
(RMSEA) &
standardised root mean
residual (SRMR)
Absolute fit
RMSEA & SRMR <
0.05; good
.05 < value ≤ .08; acceptable
RMSEA values between 0.05 and 0.08
may also indicate a satisfactory fit.
SRMR is suitable (the model is a good
fit) when it is in the range of 0-1 and a
value less than 0.05 (Diamantopoulos
& Siguaw, 2006; Steiger, 2007; Hu &
Bentler, 1999; Thomspson, 2004).
Tucker-Lewis index (TLI), non-normed fit index (NNFI)
Incremental Fit TLI & NNFI .90 ≤ value < .95; acceptable ≥ .95 ; good
Values between 0.90 and 0.95 indicate
a satisfactory fit. Values greater than 1
may indicate over fit (Hu & Bentler,
1999; Schumacker & Lomax, 2004).
Comparative, Tucker
and normed fit indices
(CFI, TFI and NFI)
Incremental fit CFI, TFI & NFI >
0.95; good
.90 ≤ value < .95;
acceptable
Values between 0.90 - 0.95 may also
indicate a satisfactory fit. Values close
to 0 indicate a poor fit, CFI = 1
indicates a perfect fit (Hu & Bentler,
1999; Tabachnick & Fidell, 2007;
Hoe, 2003).
5.3.4 Model modification stage
Model modification is important and should be based on theoretical and content deliberations
(Anderson & Gerbing, 1988). Otherwise, modifications would respond to data-driven
149
considerations that may lack validity (MacCallum, 1986). If the proposed model is not as
strong as researcher would like, the modification stage allows the researcher to change the
model and evaluate the new version. If the fit of the model is still not satisfactory, hypotheses
can be adjusted, and the model retested; this stage is often called re-specification
(Schumacker & Lomax, 2004). Martens (2005) reports that researchers accomplish the
modification by using statistical search strategies to determine which adjustments result in a
better-fitting model. For the modification stage, Khine (2013, p.17) suggested the following
four steps in AMOS. First, the estimates are checked for the regression coefficients and the
specified covariances. The ratio of the coefficient to the standard error is equivalent to a z test
for the significance of the relationship, with a p < .05 cut-off of about 1.96. Second, the
covariances or path coefficients are adjusted to improve the model fit. Third, the model is
rerun to observe the modification indices and determine whether the fit is now adequate. The
new model is now a subset of the previous one and considered a ‘nested model’. Here, the
difference in the chi-square is a test for whether some important information may lose, with
the degrees of freedom of this chi-square equal to the number of the adjusted paths. For
example, if the original model had a chi-square of 187.3, and two non-significant paths were
removed, resulting in a new chi-square of 185.2 with 2 degrees of freedom (not statistically
significant difference), significant information were not lost with this adjustment. Finally, the
researcher can refer to the modification indices (MI) provided by most SEM programs if the
model fit is still not adequate after steps 1 to 3. The value of a given modification index is the
amount that the chi-square value is expected to decrease if the corresponding parameter is
freed. In every step, a parameter is freed that produces the largest improvement in fit and this
process continues until a sufficient fit is achieved. Although AMOS will recommend all
changes that will improve model fit, some of these changes may be nonsensical, and
researchers need to be directed by theory.
Byrne (2001) also suggested two popular strategies to modify any misfit model with AMOS:
testing the correlation of error terms (also known as ‘residuals parameters’); and examining
the modification indices to improve the overall model. Here, residual parameters help to
detect the discrepancies between a proposed model and an alternative estimated model
(Byrne, 2001). Hence, researchers can determine the source of misspecification in the model
and correct it. The extent and sign of every parameter should be rational and compatible with
the underlying unobserved latent variable. On a proposed measurement model (or scale), each

150
indicator must significantly load onto its analogous latent variables. Here, standardised
residual covariance (SRC) values of 2.58 or less are considered statistically significant at the
level of 0.05 (Byrne, 2001). SRC values are considered as modification indices and point out
the discrepancies between the proposed and estimated models. These values also indicate
whether those discrepancies are significant. Each residual parameter value above the
acceptable value indicates that the proposed model lacks sufficient information. The indicator
variable must, therefore, be removed from the proposed model to improve the fit of the model
(Byrne, 2001).
The second strategy for model fit is the observation of modification indices within the non-
estimated parameters. Modifications to any model can be suggested by the residuals obtained
in the original run in AMOS, and by special statistics called modification indices. These
indices are values observed for the improvement in model fit, specifically changes to paths
whose addition to the model would result in the greatest improvement in the overall chi-
square value (Savalei & Bentler, 2006). Moreover, these modifications need to make sense
theoretically to interpret the overall model. Values for modification indices will reduce the
value of chi-square if the estimated parameter is freed up. For example, when using correlated
errors, a researcher does not want to free up the covariance between the residual and indicator
variables for different factors because this could damage the internal consistency and
interpretability of the model. Correlated error terms describe the unanalysed associations,
which mean that the specific nature of the shared ‘something’ is unknown. To improve the fit,
the focus should be on drawing an arc (as double-headed arrows) between the residuals with
the largest value of correlated errors within the same factor (Byrne, 2010). Tracing an arc
between the residuals of interest also seems to add internal consistency to the relevant factor
and lead to a corresponding reduction in chi-square. However, while the modification indices
are helpful for assessing the influence of model modifications, researchers should only make
changes to the model based on particular justifications or past research (Hair et al., 2010).
5.4 Correlations among unobserved variables for testing the structural model
Correlation estimates the magnitude of the relationship between a pair of variables; in other
words, the degree to which, as the value of one variable changes, the value of the other
variable also changes (Hair et al., 1998). This section specifies the correlations between the

151
four unobserved latent variables of the study. In this study, references to the cut-off values
for the effect size of the relationships are followed according to Cohen’s (1992) guidelines.
Here, a low correlation is shown by an r value less than .28, a moderate correlation by an r
value between .28 to .49 and a substantial correlation by an r value greater than .50. A 99%
confidence interval is used to determine the degree of significance of a relationship. However,
any perfect or extremely high correlation between two variables is not necessarily desirable,
and may suggest the presence of multicollinearity. A number of cut-off values have been
established in the literature to monitor this evaluation. For example, Rubin (2009) suggested
that multicollinearity is detected when the value of the correlation coefficient that exceeds the
cut-off value accounts for a substantial proportion of variance (r= .80 or above) for two or
more coefficients. Table 5.2 presents the correlations among the study variables.
7Table 5.2: Correlation matrix among unobserved and demographic variables
Variables 1 2 3 4
1. Responsible leadership
2. Organisational
commitment
.552**
3. Employee turnover
intentions
-.555** -.635**
4. Presenteeism -.295** -.170* .407**
5. Age -.134 -.022 -141* -.228**
6. Gender .092 -.009 -.018 .082
7. Academic background .115 .053 -.046 .035
8. Industry -.069 -.003 -.049 -.027
9. Working time/week -.070 .025 .012 -.072
10. Working length .043 .116 -.226** -.120
11. Working length with
supervisor
.077 .151* -.061 -.067
** Correlation is significant at the 0.01 level (two-tailed). * Correlation is significant at the 0.05 level (two-tailed).
Table 5.2 represents the relationship between study variables both at the 0.001and 0.005
significance levels. These results are in the anticipated direction and show primary support for
152
all the proposed hypotheses for this study. The following observations explore the nature of
the correlations among the variables examined in the study.
RL showed positive and significant correlations with organisational commitment (r= .55, p<
0.001), negative relationship with intentions (r= -.55, p< 0.001) and presenteeism (r= -.30, p<
0.001). Organisational commitment showed large and significant negative correlations with
employee turnover intentions (r= -.64, p< 0.001) and nominal correlations with presenteeism
(r= -.17, p< 0.005). Moderate and significant correlation coefficients were found between
employee turnover intentions and presenteeism (r= .41, p< 0.001). Of the demographic
variables, age of participants was significantly correlated with employee turnover intentions
(r= -.14, p< 0.005) and presenteeism (r= -.23, p< 0.001). Participants’ working length was
significantly and negatively correlated with employee turnover intentions (r= -.23, p< 0.001)
and working length with supervisor was positively and significantly correlated with
organisational commitment (r= .15, p< 0.005). Finally, the r values (Table 5. 2) indicate that
there is no problem of multicollinearity, as the values of r between each pair of variables were
less than .80, which is in line with Rubin’s (2009) recommendations.
5.5 Assumptions for violation before hypotheses testing in SEM It was essential to scrutinise four underlying assumptions – normality, linearity,
homoscedasticity and multicollinearity – before testing the direct and mediating effects in the
proposed model, as any violations of these assumptions could make the overall results
unreliable (the data-analysis procedure is described in Section 6.8). The results of this
analysis are presented in Appendix B. However, any violations of these assumptions could
make the overall results unreliable.
Normality: Table 5.3 presents the results of the skewness and kurtosis of the variables
examined in this study; all the values are well within the range of +1 to -1. Table B1 in
Appendix B shows the results of the Shapiro-Wilk (W) test of normality; all the values are
non-significant (alpha > 0.05). Hence, there was no violation of the assumption of normality.

153
Linearity and homoscedasticity: Both assumptions were evaluated with the graphical
examination of scatterplots. A visual observation of the bivariate scatterplots indicated that
the relationships among the study variables formed relatively straight and linear lines, which
indicated that there were no violations of linearity. For homoscedasticity, the same visual
inspection of the bivariate scatterplots showed a general oval shape that indicated no violation
of the assumption of homoscedasticity. The histogram, scatterplots and P-P plots are
presented in Figures B-1 to B-3 in Appendix B.
Multicollinearity: Primarily, the results (Table 5.2) indicated no evidence of a violation of the
multicollinearity assumption, as none of the values were highly correlated with each other.
However, in accordance with Hair et al. (2010), two additional tests, the tolerance value
(TOL) and variance inflation factor (VIF), were used to evaluate multicollinearity. Results
from the TOL and VIF tests (Table B2 in Appendix B) were within satisfactory range,
indicating no violation of multicollinearity.
5.6 Sample size for SEM: adequate sample size in SEM
Sample size plays a significant role in almost every statistical technique applied in empirical
research (Raykov & Marcoulides, 2006). A common formula used to determine sample size
when estimating means of variables was given by McCall (1982): n = (Z σ /ε)2, where n is the
sample size needed for the desired level of precision, ε is the effect size, Z is the confidence
level, and σ is the population standard deviation of scores (σ can be estimated from prior
research studies, test norms, or the range of scores divided by 6). Sample size is an important
issue in SEM, and while no consensus has been reached among researchers at present, some
suggestions are found in the literature (Raykov & Widaman, 1995; Kline, 2011). The
following section describes some issues relating to sample size for SEM.
5.6.1 Sample-size issues in SEM
Sample-size issues in SEM affect the ability to correctly estimate the hypothesised model and
identify the specification error (Khine, 2013). Researchers often require larger sample sizes to
maintain power and obtain stable parameter estimates and standard errors (Schumacker &
Lomax, 2004). AMOS also requires larger sample sizes (Byrne, 2010). Hoelter (1983)

154
suggested using the critical N statistic, which indicates the sample size needed to obtain a chi-
square value that would reject the null hypothesis in SEM. Critical N was often useful for
AMOS in the current study to determine the standard sample size that would make the
obtained fit (measured by chi-square) significant at the stated level.
Raykov and Widaman (1995) indicated four requirements to consider a sample size: model
misspecification, model size, non-normality, and estimation procedure. Model
misspecification refers to the extent to which the hypothesised model suffers from
specification error (e.g. omission of relevant variables in the model). If there are issues about
specification error, the sample size can be increased over what would otherwise be required.
When considering model size, the minimum sample size should be greater than the variables
in the correlation matrix, with preferably 10 participants per parameter or element estimated.
If the data exhibit non-normal characteristics, the ratio of participants to parameters should be
raised to 15 to confirm that the sample size is large enough to minimise the impact of
sampling error on the estimation procedure. For the estimation procedure itself, maximum
likelihood estimation (MLE) should be used in SEM, as Ding et al., (1995) recommends that
the minimum sample size to use MLE appropriately be between 100 to 150 participants; if the
sample size increases, the MLE method increases its sensitivity to detect variances among the
data.
Several researchers have shown a more liberal approach in their specification, arguing that
there is no correct and fixed sample size when applying SEM, as that depends on the subject
to observed-variable procedure (Maccallum et al., 1999). Thus, a suitable sample size depends
mostly on the number of the observed variables presented in the model. For example, Hair et
al. (2014) advised that an acceptable range is to have 20 participants for every variable to be
analysed in the model. Moreover, they argued that a minimum agreed on threshold for sample
size in SEM is five participants for each observed variable item that needs to be analysed and
a satisfactory ratio is 10 participants or subjects for each. Kline (2005) recommended that 10
to 20 participants per estimated parameter would result in a sufficient sample. One hundred
cases can be considered as small, 100-200 as intermediate, and more than 200 as large
(Blunch, 2008; Byrne, 2010; Hair et al., 2014). In this study, the sample size (N= 200) was
considered sufficient to achieve a desired level of statistical power for the proposed model.
Most scholars and practitioners agree that a sample size of 200 cases can be considered

155
sufficient to achieve a desired level of statistical power with a given model (Anderson &
Gerbing, 1988; Ding et al., 1995; Hoe, 2008; Blanch, 2008; Byrne, 2010; Hair et al., 2014).
However, Hair et al. (2010) advised that several factors such as multivariate normality, the
level of model complexity and missing data should be considered to determine and justify the
sample size. The following sections briefly describe these issues to justify the chosen sample
size, and confirm the validity of the results for examining the hypotheses.
5.6.2 The level of model complexity
Model complexity is an important issue in sample-size determination and influences models
to fit data in SEM (Kline, 2011; Blunch, 2008). According to Hair et al. (2010), more
complex paths models necessitate higher sample sizes and model complexity results from an
increase in the hypothesised unobserved latent variables and observed variables. As clarified
in Chapter 4 (Section 4.4.3), the proposed model consists of 40 observed indicators. The ratio
of 40:200 is considered adequate and exceeds the lower level for adequacy of sample size
(Hair et al., 2010).
5.6.3 Missing data
It is expected that a researcher collect a complete dataset that contains all responses to all
items (Khine, 2013). In the current study, there was no issue of missing data, and, therefore,
the related undesirable outcomes were rejected by the data-collection procedure by default.
Missing data may become a difficulty in any analysis that is created by the absence of some
portions of a familiar data structure from the overall collected data (Hair et al., 2010).
Samples with missing data affect the results of SEM because the sample size is reduced from
the original number of cases to account for the missing data (Blunch, 2008; Hair et al., 2010).
In the data-collection procedure for this study, invited participants completed all the questions
in the specified section before proceeding to the next part of the survey questionnaire (Section
4.7 in Chapter 4).
5.7 Multivariate normality
In SEM, it is assumed that the multivariate distribution is normally distributed and identified
when the shape of the data distribution for the studied variables differs considerably from the

156
normal distribution. Kline (2005) suggested that all univariate distributions should be normal,
and that the joint distribution of any pair of the variables is bivariate normal. For example,
testing a model with non-normally distributed data may erroneously suggest that the model is
a good (or a poor) fit to the data. However, this assumption is seldom found in practice, and
one of the methods for calculating multivariate normality is Mardia’s normalised multivariate
kurtosis value (Mardia, 1974). Mardia (1974) offered tests of multivariate normality based on
sample measures of multivariate skewness and kurtosis. According to Kline (2013), “this is
done by comparing the Mardia’s coefficient for the data under study to a value computed
based on the formula p (p+2) where p equals the number of observed variables in the model”
(p.11). If Mardia’s coefficient is lower than the value obtained from the above formula, the
data is deemed as multivariate normal. AMOS tests the individual variables for normality and
provides a test for Mardia's multivariate kurtosis. In this study, Mardia’s coefficient was
reported to be .024 in AMOS, which was lower than the formula value 24 [4(2+2)], and thus
satisfied multivariate normality. Similarly, the measures of skewness and kurtosis are often
used to assess univariate normality assumption (Hair et al., 2010). Skewness measures the
symmetry of the distribution, where a negative value indicates that the distribution is left-
skewed, and a positive value that it is skewed to the right. Kurtosis measures whether the data
is peaked or flat relative to a normal curve, where a positive value indicates a relatively
peaked distribution and a negative value indicates a relatively flat distribution (Hair et al.,
2010). These ratios for skewness and kurtosis range from -1 to +1, with a value of 0 indicate
that the sample is normally distributed (Schumacker & Lomax, 2004). The acceptable range
for skewness or kurtosis is considered to be below +1.5 and above -1.5 (Tabachnick & Fidell,
2013). Table 5.3 presents the results of the skewness and kurtosis tests in this study for the
selected variables; they were found to be within the acceptable range to claim that the sample
data as normally distributed.
8Table 5.3: Test of multivariate normality- skewness and kurtosis statistics
Variables Skewness Kurtosis
Multivariate normality (Mardia’s
coefficient)
-
.024
Responsible leadership -.442 -0.38

157
Variables Skewness Kurtosis
Organisational commitment -.477 -.003
Employee turnover intentions .268 -1.14
Presenteeism .057 -0.33
5.8 First-stage analysis of two-stage modelling approach
The first stage in the two-stage modelling evaluates the psychometric properties for each
study variable. Anderson and Gerbing (1988) advocated a two-stage approach for SEM,
where the first stage (measurement model) is independently formed and developed before the
second stage (structural model). The first stage is also essential to justify the second-stage
results for the hypothesised model. Byrne (2010) argued that the second stage depends mainly
on the estimates of the relationships amongst unobserved latent variables to assess the extent
to which these relationships are valid and significant, assuming that the measurement scale
(first stage) of each unobserved latent variable is psychometrically suitable. Here, the
psychometric properties were estimated and justified by testing whether construct validity
(factor loading), goodness-of-fit estimates and reliability of the measurement scales were
found within their respective acceptable ranges. However, the estimates of observed
variables’ loading on their unobserved latent variable need to be higher than 0.50 (Hair et al.,
2014), the reliability values for each measurement scale need to be higher than 0.70 (George
& Mallery, 2003) and goodness-of-fit indices need to be within the acceptable range of index
values. These particulars are presented in Table 5.1.
In the first stage, factor loading and goodness-of-fit for each measurement scale was assessed
through a series of confirmatory factor analysis (CFA) calculations in AMOS, and the
reliability analyses were conducted using IBM SPSS-21. CFA is a distinct procedure of SEM
applied to examine the loadings of observed indicators on their unobserved latent variables
and the loadings between unobserved latent variables (MacCallum & Austin, 2000).
Descriptive statistics and psychometric properties for the individual measurement scales are
presented in the following Sections 5.8.1 and 5.8.4.

158
5.8.1 The measurement scale of responsible leadership (RL)
Sections 5.5.1.1 to 5.5.1.3 present the details of the first-stage analysis of the RL
measurement scale.
5.8.1.1 Descriptive statistics of the RL scale
The descriptive statistics for the 13 items of the RL scale are summarised in Table 5.4.
9Table 5.4: Descriptive statistics of the perceived RL scale
Mean SD Skewnes
s
Kurtosis
Stak
ehol
der
cultu
re
1. This organisation takes an active role in its
community.
4.89 1.63 -.52 -.52
2. This organisation takes ethics seriously. 5.41 1.54 -.81 .01
3. This organisation responds well to a
diverse group of stakeholders.
5.32 1.35 -.72 .17
4. This organisation takes corporate social
responsibility seriously.
5.04 1.58 -.64 -.11
HR
pra
ctic
es
5. Our performance appraisal programs are
effectively used to retain the best talent.
4.45 1.80 -.48 -.75
6. Our compensation programs are effectively
used to retain the best talent.
4.23 1.75 -.46 -.78
7. Our organisation believes that all
employees deserve to be actively managed as
talent.
4.69 1.67 -.65 -.486
8. Our organisation’s program (e.g., training
or workshops) for high potentials helps in
talent retention.
4.35 1.75 -.36 -.854
9. The company has a formal ‘high potential’
program (e.g., training and development for
team building or enhancing leadership skills
etc.), and people know what they need to do
to get into it and to advance within it.
3.85 1.92 -.04 -1.12

159
Mean SD Skewnes
s
Kurtosis M
anag
eria
l sup
port
. 10. My immediate manager leads by example. 4.70 1.85 -.46 -.82
11. My immediate manager gives me the
support I need to do my job well.
4.98 1.76 -.84 -.19
12. My immediate manager is effective. 5.01 1.73 -.76 -.27
13. My immediate manager is good at
developing people.
4.60 1.82 -.50 -.63
Total mean score 4.72 1.58 -.56 -.49
Stakeholder culture 5.17 1.53 -0.67 -0.11
HR practices 4.31 1.78 -0.40 -0.80
Managerial support 4.82 1.79 -0.64 -0.48
In Table 5.4, items 2 and 3 had the highest means scores of 5.41 and 5.32 respectively. These
values indicate that participants were placing comparatively more emphasis on their
organisations’ seriousness about ‘ethics’ and responsiveness to the diverse group of
stakeholders. However, the overall average of the RL scale was 4.72, which means that the
average answers of the respondents were mostly neutral (between the ‘Neither agree nor
disagree’ to ‘Slightly agree’ response options). The total average value of SD was 1.58, which
means that the respondents’ answers on the RL scale spread out slightly around the total
average mean score. Finally, the skewness and kurtosis values were within the recommended
cut-off estimates (-1.5 to 1.5), supporting the assertion that all items of this scale formed a
normally distributed sample.
5.8.1.2 Assessing goodness of fit for perceived RL scale
SEM was applied from IBM AMOS 21 to estimate the absolute, badness and incremental-fit
indices. The fit indices indicated that the perceived RL fit the collected data (χ2 = 110.596,
χ2/df= 1.813, p< .000, GFI= .92, AGFI= .89, CFI= .98, TLI = .97, NFI= .96, RMSEA= .064
and SRMR= .037). Hence, the scale for perceived RL showed appropriate fit with the
proposed measurement model. The value for χ2 / df fell well within the range of 1 to 3; GFI,
TLI, NFI, and CFI were higher than .90; AGFI was suitably .89; and RMSEA and SRMR
were at the satisfactory levels of .064 and .037 respectively. In addition to the good fit indices,

160
all factor loadings were over .72 (p < .01), as shown in Figure 5.1, strongly establishing the
adequacy of the measurement items included in the RL scale for the study.
6Figure 5.1: Confirmatory factor analysis (CFA) for the measurement model of RL
5.8.1.3 Assessing construct validity and reliability for the perceived RL scale
CFA tests the construct validity, as it is more powerful in identifying adequate items within a
measurement domain that best represent the empirical and theoretical domains (Benson &
Hagtvet, 1996). The standardised regression weights (known as β coefficients) within AMOS
explore the loading of all the items of the scale (observed indicators) with their corresponding
latent variable (Byrne, 2001). After CFA for the measurement model of RL (Figure 5.1), β
coefficients for the 13 indicators of the perceived RL variable were determined (Table 5.5).
The β weights for the RL items ranged between 0.72 and 0.96 at p< 0.001. For example, items
13, 12 and 8 had the highest loadings on RL, with β weights of 0.96, 0.93 and 0.92
respectively. These values suggest that when overall RL goes up by 1 standard deviation, the

161
value of the item ‘My immediate manager is effective’ goes up by 96% of a standard
deviation; the item ‘My immediate manager gives me the support I need to do my job well’
goes up by 93% of a standard deviation; and the item ‘Our organisation’s program (e.g.,
training or workshops) for high potentials helps in talent retention’ goes up by 92% of a
standard deviation. Item number 1, ‘This organisation takes an active role in its community’
had the lowest variance, with a β weight of 72%. Therefore, the β weights in Table 5.5 show
that the loading estimates for items of perceived RL scale were statistically significant and
valid according to the suggested 0.50 cut-off values (Garver & Mentzer, 1999).
The squared multiple correlations coefficients (R2) describe how much of the variance in the
unobserved variable is accounted for the indicator variables (Hair et al., 2010). Table 5.5
shows that estimate of R2 were high and statistically significant at p< 0.001. For example,
item 1 ‘This organisation takes an active role in its community’ explained .72 of the variance
in perceived RL. In other words, the error variance of item 1 was approximately .28 of the
variance of item 1 itself. Moreover, the Cronbach’s alpha coefficient was above the research
guidelines of 0.75, as 0.94 indicates that the scale is sufficiently reliable and measures what it
is supposed to measure. Therefore, the goodness-of-fit values, the output of the first-order
CFA analysis and Cronbach’s alpha value support the claims that the items of perceived RL
in this study are valid and reliable, and have a strong fit with the collected data. Thus, the first
measurement scale, perceived RL, requires no further modification.
10Table 5.5: The results of first-order CFA Analysis of the perceived RL measurement scale
Items of RL β weights (factor
loadings of
indicators on RL)
R2 sig.
Stakeholder culture .84 .70 0.001
1. This organisation takes an active role in its
community.
.72 .52 0.001
2. This organisation takes ethics seriously. .80 .64 0.001
3. This organisation responds well to a
diverse group of stakeholders.
.78 .60 0.001

162
Items of RL β weights (factor
loadings of
indicators on RL)
R2 sig.
4. This organisation takes corporate social
responsibility seriously.
.89 .80 0.001
HR practices .83 .69 0.001
5. Our performance appraisal programs are
effectively used to retain the best talent.
.88 .77 0.001
6. Our compensation programs are effectively
used to retain the best talent.
.87 .76 0.001
7. Our organisation believes that all
employees deserve to be actively managed as
talent.
.84 .71 0.001
8. Our organisation’s program (e.g., training
or workshops) for high potentials helps in
talent retention.
.92 .84 0.001
9. The company has a formal ‘high potential’
program (e.g., training and development for
team building or enhancing leadership skills
etc.) people know what they need to do to get
into it and to advance within it
.83 .69 0.001
Managerial support .76 .58 0.001
10. My immediate manager leads by
example.
.89 .79 0.001
11. My immediate manager gives me the
support I need to do my job well.
.93 .86 0.001
12. My immediate manager is effective. .96 .91 0.001
13. My immediate manager is good at
developing people.
.88 .78 0.001
5.8.2 The measurement scale of organisational commitment
Sections 5.5.2.1 to 5.5.2.3 present the details of the first-stage analysis for the measurement
scale of organisational commitment.

163
5.5.2.1 Descriptive statistics of organisational commitment scale
The descriptive statistics for eighteen items of OC scale are summarised in Table 5.6.
11Table 5.6: Descriptive statistics of the perceived organisational commitment scale
Mean SD Skewness Kurtosis
Affe
ctiv
e co
mm
itmen
t
1. I would be very happy to spend the rest of
my career with this organisation. 3.40 1.34 -.39 -1.01
2. I really feel as if this organisation's
problems are my own. 2.74 1.32 .24 -1.17
3. I do not feel a strong sense of belonging to
my organisation. 3.32 1.39 -.30 -1.24
4. I do not feel emotionally attached to this
organisation. 3.35 1.32 -.40 -1.06
5. I do not feel like part of the family at my
organisation. 3.52 1.30 -.62 -.77
6. This organisation has a great deal of
personal meaning for me. 3.28 1.29 -.26 -1.08
Con
tinua
nce
com
mitm
ent
7. Right now, staying with my organisation is
a matter of necessity as much as desire. 3.88 1.14 -.91 -.06
8. It would be very hard for me to leave my
organisation right now, even if I wanted to. 3.57 1.24 -.61 -.70
9. Too much of my life would be disrupted if
I decided I wanted to leave my organisation
now.
3.59 1.25 -.59 -.73
10. I feel that I have too few options to
consider leaving this organisation. 3.14 1.28 -.25 -1.10
11. If I had not already put so much of myself
into this organisation, I might consider
working elsewhere.
2.71 1.17 .24 -.85
12. One of the few negative consequences of
leaving this organisation would be the 3.54 1.24 -.56 -.77

164
Mean SD Skewness Kurtosis
scarcity of available alternatives.
N
orm
ativ
e C
omm
itmen
t
13. I do not feel any obligation to remain with
my current employer. 3.16 1.29 -.17 -1.14
14. Even if it were to my advantage, I do not
feel it would be right to leave my organisation
now.
2.94 1.33 .10 -1.18
15. I would feel guilty if I left this
organisation now. 2.81 1.39 .11 -1.37
16. This organisation deserves my loyalty. 3.22 1.36 -.35 -1.13 17. I would not leave my organisation right
now because I have a sense of obligation to
the people in it.
3.20 1.31 -.31 -1.11
18. I owe a great deal to my organisation. 2.94 1.31 -.07 -1.15 Total average score 3.24 1.29 -0.28 -0.98 Affective commitment 3.27 1.33 -0.29 -1.06
Continuance commitment 3.41 1.22 -0.45 -0.70
Normative commitment 3.05 1.33 -0.12 -1.18
Table 5.6 presents the mean, SD, skewness and kurtosis for the 18 items of organisation
commitment, including the three sub-dimensions: affective, continuance and normative
commitment. The overall mean for the measurement scale of organisational commitment
sample was 3.24, which indicates that the responses of employees on the scale were mostly
positive. The deviation of the data from the overall mean score was small (SD= 1.29). On the
other hand, for the sub-dimensions, the mean and SD were 3.27 and 1.33 respectively for
affective commitment; 3.41 and 1.22 respectively for continuance commitment; and 3.05 and
1.3 respectively for normative commitment. Among the three sub-dimensions, continuance
commitment had the highest mean (3.41) which suggests that employees who completed this
scale showed more continuance commitment to their work than affective or normative
commitment. The last two columns (skewness and kurtosis values) fell within the satisfactory
cut-off value range (-1.5 to +1.5), which indicates that all items on this scale were normally
distributed.

165
5.5.2.2 Assessing goodness of fit for the organisational commitment scale
The fit indices for the CFA (Figure 5.2 shows the OC and its fit indices) indicated that the
data did not fit well (χ2=530.31, χ2/df= 4.46, p< .000; GFI= .74, AGFI= .67, CFI= .77, TLI=
.74, NFI= .72, RMSEA= .132 and SRMR= .103). Some goodness-of-fit indices were lower
than the required cut-off values. Particularly, GFI and AGFI were found to be lower than the
recommended cut-off values (0.74 and 0.67 respectively). This is suggestive of poor fit also,
the values of the incremental-fit indices were less than the required 0.95 cut-off value - 0.77,
0.74 and 0.72 for CFI, TLI and NFI respectively. Therefore, a review of the standardised
residual correlations and modification indices was used to respecify the model (Byrne, 2001).
7Figure 5.2: Illustration of CFA for the measurement model of organisational commitment with the modification indices: χ2=596.29, χ2/df= 4.42, p< .000; GFI= .72, AGFI= .64, CFI= .75, TLI= .71, NFI= .70, RMSEA= .131 and SRMR= .112

166
Based on the modification indices (Section 5.3.4), it is possible to improve the fit of a scale by
correlating one pair of standardised errors if it has fewer than three items, or by removing
item(s) with a loading value lower than 0.50 from the scale because the error related to the
items is greater than the variance they explain (Hair et al., 2010). All such items were
removed from the scale in this study.
Three items from the continuance commitment sub-scale were removed to obtain an adequate
model fit. The procedure for deleting any item from this scale was based on the re-
specification strategies presented in Section 5.3.4, and was followed until the estimates of the
goodness-of-fit indices indicated an adequate fit with the data. Three more items (OC8, OC9
and OC11) could have been removed as they had less than .50 of their loading value, but were
kept to maintain the continuance commitment sub-scale with at least three items. Hence,
modification was made to the OC from a scale based on 18 items to one based on 15 items.
Rerunning the model without these three items (Figure 5.3 shows the OC scale after
modification and its fit indices) indicated that all indices met the minimum cut-off values and
provided a better fit to the data (χ2= 162.95, χ2/df= 1.90, p< .000; GFI= .90, AGFI= .86,
CFI= .95, TLI= .94, NFI= .910, RMSEA= .067 and SRMR= .0560).

167
8Figure 5.3: The final (modified) models of CFA for the measurement model of OC with the modification indices: χ2= 162.95, χ2/df= 1.90, p< .000; GFI= .90, AGFI= .86, CFI= .95, TLI= .94, NFI= .910, RMSEA= .067 and SRMR= .0560
5.5.2.3 Assessing construct validity and reliability of organisational commitment after
modification
After modifying the fit of the organisational commitment scale (Figure 5.3), the parameter
estimates of the scale items were considered, as shown in Table 5.7. Outcomes from CFA
revealed that all three organisational commitment items loaded significantly except the
continuance sub-scale, and more specifically the OC8, OC9 and OC11; these items were
deleted because of their negative values of -.06, -.09 and -.22 respectively. The β weights and
R2 estimates were calculated for each item of the modified scale and sub-dimensions
(affective, continuance and normative) in Table 5.7. The estimates of R2 for the modified
items were high and significant at p< 0.001.

168
The Cronbach’s alpha coefficient for the overall scale was 0.875. This means that the 15
items measured on the overall construct of organisational commitment were highly related
and consistently measured employees’ organisational commitment.
12Table 5.7: Results of CFA for organisational commitment after modification Items of organisational commitment β weights (factor
loadings of
indicators on RL)
R2 sig.
1. I would be very happy to spend the rest of
my career with this organisation. .699 .736 0.001
2. I really feel as if this organisation's
problems are my own. .642 .554 0.001
3. I do not feel a strong sense of belonging to
my organisation. .600 .764 0.001
4. I do not feel emotionally attached to this
organisation. .617 .435 0.001
5. I do not feel like part of the family at my
organisation. .656 .379 0.001
6. This organisation has a great deal of
personal meaning for me. .812 .547 0.001
8. It would be very hard for me to leave my
organisation right now, even if I wanted to. .415 .050 0.001
9. Too much of my life would be disrupted if
I decided I wanted to leave my organisation
now. .384 .147 0.001
11. If I had not already put so much of myself
into this organisation, I might consider
working elsewhere. .224 .172 0.001
13. I do not feel any obligation to remain with
my current employer. .739 .660 0.001
14. Even if it were to my advantage, I do not
feel it would be right to leave my .615 .430 0.001

169
Items of organisational commitment β weights (factor
loadings of
indicators on RL)
R2 sig.
organisation now.
15. I would feel guilty if I left this
organisation now. .659 .380 0.001
16. This organisation deserves my loyalty. .874 .360 0.001 17. I would not leave my organisation right
now because I have a sense of obligation to
the people in it. .744 .412 0.001
18. I owe a great deal to my organisation. .858 .489 0.001
5.8.3 The measurement scale of employee turnover intentions
Sections 5.5.3.1 to 5.5.3.3 present the details of the first-stage analysis for the scale of
employee turnover intentions.
5.8.3.1 Descriptive statistics of the employee turnover intentions scale
Table 5.8 summarises the descriptive statistics for three items of employee turnover intentions
below:
13Table 5.8: Descriptive statistics of the employee turnover intentions scale
Mean SD Skewnes
s
Kurtosis
1. It is likely that I will actively look for a new
job soon. 2.52 1.41 .43 -1.15
2. I often think of quitting my current job. 2.68 1.47 .27 -1.41
3. I will probably look for a job in the near
future. 2.74 1.46 .16 -1.38
Total mean score 2.65 1.45 .29 -1.31

170
Amongst the three items of the scale, item 3 had the highest mean score, 2.74, whereas item 1
had the lowest mean score, 2.52. Both values indicate that the majority of respondents
intended to look actively for a new job in the near future. The estimates also suggest that the
total mean score for the three items of the employee turnover intentions scale was 2.65, which
indicates that on average, respondents’ answers were mostly closer to the ‘uncertain’ option.
In contrast, the SD for the total scale was 1.45, which indicates that respondents’ answers
varied little from the total mean score. This lower value of SD indicates respondents’ higher
level of agreement. Finally, the columns for skewness and kurtosis show values within the
recommended cut-off estimates (-1.5 to 1.5), which indicates that all items related to
employee turnover intentions were in a usual distribution through the sample.
5.8.3.2 Assessing goodness-of fit for the employee turnover intentions scale
The estimates of the goodness-of-fit indices for employee turnover intentions showed that the
scale has zero degrees of freedom and the chi-square statistic is zero. Hence, the model should
fit the data perfectly, as there was no probability level assigned to the chi-square statistic.
However, this is because this scale had only three items and the indices were already over-
fitted (e.g. CFI and GFI 1.00) and RMSEA was .82 by the default value. However, a
composite reliability (Raykov, 1997a, 1997b) was measured from the structural model (Figure
5.6) with each item’s standardised loadings; this resulted in an estimated .90 for the scale of
employee turnover intentions. The results in the structural model show that all the three items
were significantly loaded onto the TI construct, with values ranging from .79 to .92.
5.8.3.3 Assessing the construct validity and reliability for employee turnover intentions
scale
Table 5.9 shows the β weights for the items in the employee turnover intentions scale. The
results of the first-order CFA revealed that parameter estimates for the three measurement
items ranged between .76 and .95. In the scale, item 3 had the highest loading on unobserved
variable, with .95. This means that when employee turnover intentions increase by one
standard deviation, the item, ‘I will probably look for a job in the near future’ will increase by
95% of a standard deviation. Item 2, ‘I often think of quitting my current job’, had the lowest
variance, with a β weight of .76. The outcomes show that parameter estimates for items of the
employee turnover intentions scale were statistically significant.

171
All values of R2 were satisfactory and statistically significant. For example, the item ‘It is
likely that I will actively look for a new job soon’ explained 90% of its variance in the scale
means, and the error variance of this item was approximately .10 of the variance of the item
itself. The Cronbach’s alpha coefficient was .90, indicating that the scale is strongly reliable
to measure the overall construct of employee turnover intentions with high internal
consistency. Therefore, the scale of employee turnover intentions used in this study is reliable
and fits the collected data, and does not need further modification.
14Table 5.9: The results of first-order CFA analysis of employee turnover intentions scale
Items of employee turnover intentions β weights (factor
loadings of
indicators on
RL)
R2 sig.
1. It is likely that I will actively look for a
new job soon.
.89 .90 .001
2. I often think of quitting my current job. .76 .58 .001
3. I will probably look for a job in the near
future.
.95 .80 .005
5.8.4 The measurement scale of presenteeism
Sections 5.5.4.1 to 5.5.4.3 give the details of the first-stage analysis for the measurement scale
of presenteeism.
5.8.4.1 Descriptive statistics for the presenteeism scale
The descriptive statistics for the six items of the presenteeism scale are summarised in Table
5.10.
15Table 5.10: Descriptive statistics of the presenteeism scale
Mean SD Skewness Kurtosis
1. Because of the above mentioned health
condition(s) the stresses of my job were much 2.81 1.24 -.05 -1.22

172
Mean SD Skewness Kurtosis
harder to handle.
2. Despite having the above mentioned health
condition(s), I was able to finish hard tasks in my
work.
1.95 1.08 1.39 1.51
3. The above mentioned health condition(s)
distracted me from taking pleasure in my work. 3.28 1.27 -.55 -.86
4. I felt hopeless about finishing certain work
tasks, due to the above mentioned health
condition(s)
2.27 1.13 .51 -.83
5. At work, I was able to focus on achieving my
goals despite the above mentioned health
condition(s).
2.21 1.15 .84 -.18
6. Despite having the above mentioned health
condition(s), I felt energetic enough to complete
all my work.
2.42 1.21 .60 -.72
Total mean score 2.49 1.18 .46 -.38
Table 5.10 presents the mean, SD, skewness and kurtosis for the six items of SPS-6 for the
measurement scale of presenteeism. The overall mean for theSPS-6 sample was 2.49, which
indicates that the responses were, on average, negative. The spread of the data from the
overall mean score was minor (SD= 1.18) and indicates that employees who completed this
scale felt more dedicated to work process than to outcomes. The last two columns (skewness
and kurtosis values) fell within the satisfactory value range (-1.5 to +1.5), which indicates that
all items on this scale were normally distributed throughout the sample.
5.8.4.2 Assessing goodness-of-fit for the presenteeism (SPS-6) scale
The fit indices for the CFA (Figure 5.4 shows SPS-6 and its fit indices) showed that the data
did not fit well (χ2=172.42, χ2/df= 19.16, p< .000; GFI= .74, AGFI= .38, CFI= .65, TLI= .42,
NFI= .97, RMSEA= .302 and SRMR= .154). Some goodness-of-fit indices were lower than
the minimum cut-off values. For example, GFI, AGFI, CFI and TLI were found to be lower

173
than the recommended cut-off values (0.74, .38, .65 and 0.42 respectively). This indicates
poor fit and suggests that the model was misspecified (Byrne, 2001).Therefore, the
standardised residual correlations and modification indices were conducted to re-specify the
model.
9Figure 5.4: Illustration for CFA for the measurement model of presenteeism (SPS-6) with modification of the following indices: χ2=172.42, χ2/df= 19.16, p< .000; GFI= .74, AGFI= .38, CFI= .65, TLI= .42, NFI= .97, RMSEA= .302 and SRMR= .154
According to the modification indices (Section 5.3.3.4), it is possible to improve the fit of a
scale by correlating one pair of standardised errors if it has fewer than three items, or by
deleting from the scale any item with a loading value lower than 0.50. Any factor with a
loading value less than 0.50 can be removed; because the error related to the items is greater
than the variance they explain (Hair et al., 2010). However, as noted earlier that modification
of a model requires a strong theoretical justification or support from previous research (Byrne,
2001; Hooper et al., 2008).
One of the items (SPS2) from the subscale of work process was removed to obtain an
adequate model fit. The technique for removing any item from this scale was based on the
modification strategies detailed in Section 5.3.4, and was followed until the estimates of the
goodness-of-fit indices indicated a satisfactory fit with the data. The SPS-6 scale was
modified from six items to five. Rerunning the model with the five items (Figure 5.5)
indicated that all indices met the required cut-off values and provided a better fit to the data

174
(χ2=13.84, χ2/df= 4.61, p< .003; GFI= .97, AGFI= .87, CFI= .97, TLI= .91, NFI= .97,
RMSEA= .135 and SRMR= .044).
10Figure 5.5: The final (modified) model of CFA for the measurement model of SPS-6 with the modification indices:(χ2=13.84, χ2/df= 4.61, p< .003; GFI= .97, AGFI= .87, CFI= .97, TLI= .91, NFI= .97, RMSEA= .135 and SRMR= .044
5.8.4.3 Assessing the construct validity and reliability of SPS-6 after modification
After modifying the fit of presenteeism (Figure 5.5), the parameter estimates of the items of
the scale were considered in Table 5.11. The results of the β weights from the CFA revealed
that three items (SPS-1, 3 and 4) loaded significantly, with estimates of .88, .78 and .66
respectively. However, two items (SPS 5 and 6) loaded moderately, with estimates of .34 and
.42 respectively, which are below the cut-off value of .50. These two loadings were adapted
because of the above modification indices and to avoid over-fitted model indices. If the items
SPS 5 and 6 were removed, the overall presenteeism model with three items (SPS-1, 3 and 4)
becomes over-fitted with the modification indices. Moreover, the estimates of R2 for modified
items were high and significant at p< 0.001. The variances in the presenteeism construct were
largely explained by the five items, at 77%, 79% 66% 34% and 42% respectively. This gives
further support to the modified model. The Cronbach’s alpha coefficient for the overall scale
was 0.81. This means that the five items measured on the overall construct of presenteeism
are highly related and consistently measure employees’ presenteeism.

175
16Table 5.11: The results of the CFA analysis of presenteeism scale after modification
Items of presenteeism (SPS-6) after
modification (α= 82%)
β weights (factor
loadings of
indicators on RL)
R2 sig.
1. Because of the above mentioned health
condition(s) the stresses of my job were much
harder to handle.
.88 .77 0.001
3. The above mentioned health condition(s)
distracted me from taking pleasure in my
work.
.79 .62 0.001
4. I felt hopeless about finishing certain work
tasks, due to the above mentioned health
condition(s)
.66 .46 0.001
5. At work, I was able to focus on achieving
my goals despite the above mentioned health
condition(s).
.34 .11 0.001
6. Despite having the above mentioned health
condition(s), I felt energetic enough to
complete all my work.
.42 .18 0.001
5.9 Second stage: estimate the structural model All necessary elements for addressing the first stage of the two-stage modelling approach
were met, and after determining the psychometric properties for each measurement scale,
some modifications were proposed regarding the original model of the study. A structural
model consisting of perceived responsible leadership (13 indicators), organisational
commitment (15 indicators), employee turnover intentions (three indicators) and presenteeism
(three indicators) was established. This structural model is presented in Figure 5.6 and
considered as the hypothesised model of the study.

176
11Figure 5.6: The results of the β estimates of the relationship between unobserved variables, R2 values and loadings for the structural model (RL: responsible leadership, OC: organisational commitment, TI: employee turnover intentions, P: presenteeism)

177
Here, the estimates of the goodness-of-fit indices indicated that this modified structural model
presented in Figure 5.6 fit the data adequately. In the modification, items from: RL (RL1),
organisational commitment (OC7 to OC12) and presenteeism (SPS2, SPS5 and SPS6) were
removed because of their poor loading (estimated between .06 and .55). The modified
structural model closely fit the data, with a relative χ2 = 592.713, χ2/df =1.55, GFI = .84,
AGFI = .81, CFI = .96, TLI = .95, NFI = .89, RMSEA = .053, and SRMR = .060. All fit
indices except GFI and AGFI were within the acceptable range.
5.10 Hypothesis testing
This section tests the study model with the proposed hypotheses as described in Section 3.2.
Here, the process of hypotheses testing is divided into two sub-sections. Section 5.9.1 focuses
on testing the direct relationship hypotheses formulated in hypotheses H1 to H6. Section 5.9.2
tests the simple mediation hypothesis formulated in hypotheses H7 and H8.
5.10.1 Hypothesis testing of direct relationships: hypotheses H1-H6
This study considered six direct hypotheses (H1 to H6), and used the standardised β estimates
of the modified structural model applied with AMOS to test their relationships. Here, both the
value of Pearson’s correlation coefficient r and the β estimates for the six hypotheses were
presented in the paths between unobserved variables (Figure 5.6).
The first hypothesis (H1) was developed to assess the nature of the relationship between RL
and presenteeism within the sample of Australian employees. The Pearson’s correlation
coefficient showed a significant and negative associated with RL and presenteeism (r= -.30,
p< 0.001), and the results of the β estimates in the SEM revealed the similar relationship (β= -
.22, p< 0.034). The second hypothesis (H2) was developed to evaluate the nature of the
relationship between RL and organisational commitment. Here, the values of both r and β
showed a significant and high positive association, with r= .55 (p< 0.001) and β= .65 (p<
0.001). The third hypothesis (H3) was formulated to assess the nature of the relationship
between RL and employee turnover intentions. The Pearson’s correlation coefficient also
supported a significant and negative association with RL and employee turnover intentions
(r= -.55, p< 0.001), and the results of β estimates in the SEM revealed the supportive

178
relationship (β= -.17, p< 0.037). The fifth hypothesis (H5) was established to consider the
nature of the relationship between organisational commitment and employee turnover
intentions. Here, the values of both r and β showed a significant and high negative
association, with r= -.64 (p< 0.001) and β= -.61 (p< 0.001). Finally, the last direct relationship
(H6) was developed to assess the nature of the relationship between employee turnover
intentions and presenteeism. Here, the values of both r and β showed a significant and
positive association, with r= -.41(p< 0.001) and β= .44 (p< 0.001). Therefore, all the direct
relationships among the studied variables in hypotheses H1 to H6 were supported with both
Pearson’s correlation coefficient and β values, with the exception of the significance values of
p< 0.034 and p< 0.037 for H1 and H3 respectively. The outcomes of the squared multiple
correlations (R2) in Figure 5.6 also showed that organisational commitment, employee
turnover intentions and presenteeism were explained by RL, with values of .41, .53 and .25
respectively.
5.10.2 Testing of simple mediation hypothesis: hypothesis H7 and H8
This study considered two mediation relationships with the hypotheses H7 and H8 in the
proposed model (Figure 4.1). Hypothesis H7 asserted that organisational commitment
mediates the direct relationship between RL and employees’ presenteeism at work. Similarly,
hypothesis H8 asserted that employee turnover intentions mediate the direct relationship
between RL and employees’ presenteeism.
To test H7, the total effect of RL on presenteeism (c) and the direct effect of RL on
presenteeism (c') needed to be assessed. Moreover, path (a), which represents the direct effect
of RL on organisational commitment, and path (b), which represents the direct effect of
organisational commitment on presenteeism, also needed to be inspected. The total indirect
effect (ab) of RL on employees when controlling organisational commitment also needed to
be tested. The estimate of the indirect effect (ab) represents the difference between c and c'.
Consequently, the value of c can also be calculated as the sum of c' and ab (Preacher &
Hayes, 2004). As a general rule, Shrout and Bolger (2002) suggested that a partially mediated
hypothesis is supported when the value of the indirect effect path (ab) is smaller than the
value of the total effect path (c) with the same sign. Therefore, if the direct effect of
organisational commitment accounts for a significant amount of variance in presenteeism, but

179
c' remains significant, a partial mediation relationship is indicated. On the other hand, a full
mediation relationship is supported when the significant effect between RL and presenteeism
is no longer significant when controlling organisational commitment. Figure 5.7 presents the
simple mediation relationship and mediator effects for both H7 and H8.
12 Figure 5.7: Simple mediation relationship
Several tests are available in the literature to examine mediation among variables. Here, SEM
with bootstrapping was used to assess and report estimates of the indirect effects. The
justifications for using this approach were defined in Chapter 3 (Section 3.8.3.2).
Bootstrapping with 5000 resamples was applied to give more-precise estimates of the
significance of the indirect effect of organisational commitment. The statistical significance
of the indirect effect was determined using 99% bias and percentile confidence intervals.
Figure 5.8 represents all the essential estimates of bootstrap analysis to examine hypothesis
H7 and assess the indirect effect.
13Figure 5.8 : The β estimates of specific indirect and total indirect effects to assess H7
b= 0.15
RL Presenteeism
Organisational Commitment
c = - 0.36 c' = -0.09
ab = -0.27
a= 0.64
Independent Variable
Dependent Variable
Mediating Variable
c = c' + ab c = c' - ab
ab = c - c'
a b
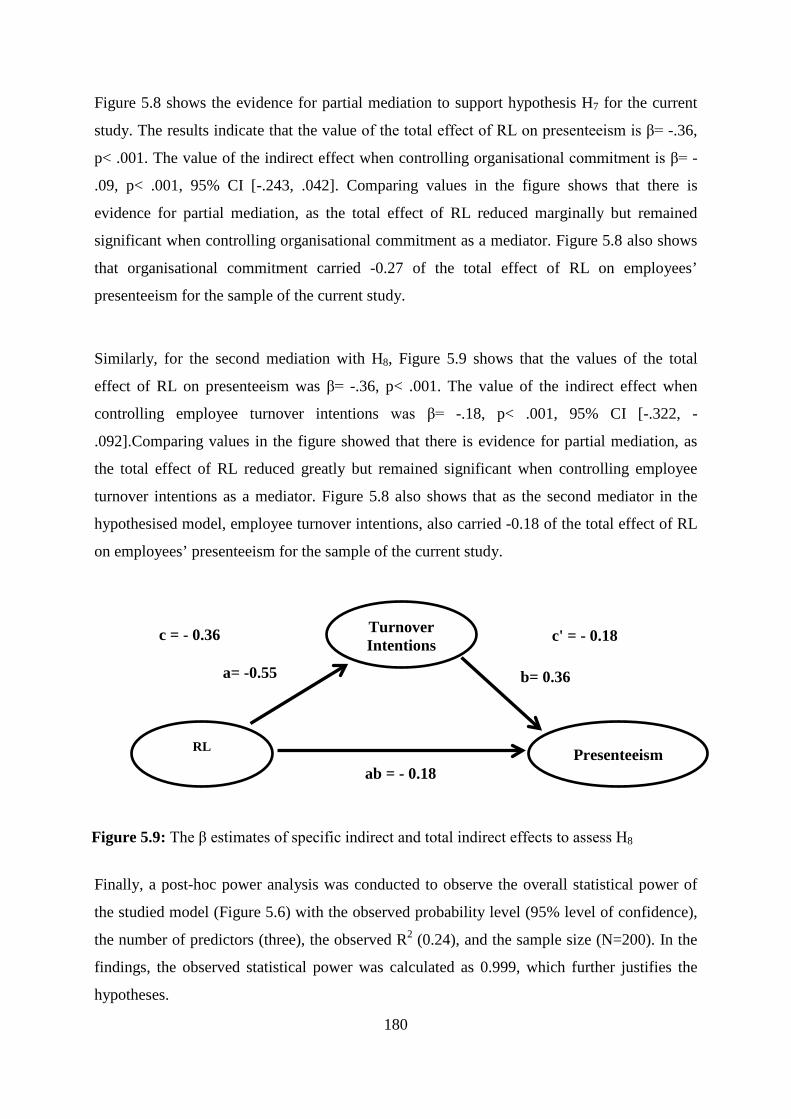
180
Figure 5.8 shows the evidence for partial mediation to support hypothesis H7 for the current
study. The results indicate that the value of the total effect of RL on presenteeism is β= -.36,
p< .001. The value of the indirect effect when controlling organisational commitment is β= -
.09, p< .001, 95% CI [-.243, .042]. Comparing values in the figure shows that there is
evidence for partial mediation, as the total effect of RL reduced marginally but remained
significant when controlling organisational commitment as a mediator. Figure 5.8 also shows
that organisational commitment carried -0.27 of the total effect of RL on employees’
presenteeism for the sample of the current study.
Similarly, for the second mediation with H8, Figure 5.9 shows that the values of the total
effect of RL on presenteeism was β= -.36, p< .001. The value of the indirect effect when
controlling employee turnover intentions was β= -.18, p< .001, 95% CI [-.322, -
.092].Comparing values in the figure showed that there is evidence for partial mediation, as
the total effect of RL reduced greatly but remained significant when controlling employee
turnover intentions as a mediator. Figure 5.8 also shows that as the second mediator in the
hypothesised model, employee turnover intentions, also carried -0.18 of the total effect of RL
on employees’ presenteeism for the sample of the current study.
14Figure 5.9: The β estimates of specific indirect and total indirect effects to assess H8
Finally, a post-hoc power analysis was conducted to observe the overall statistical power of
the studied model (Figure 5.6) with the observed probability level (95% level of confidence),
the number of predictors (three), the observed R2 (0.24), and the sample size (N=200). In the
findings, the observed statistical power was calculated as 0.999, which further justifies the
hypotheses.
RL Presenteeism
Turnover Intentions
c = - 0.36 c' = - 0.18
ab = - 0.18
a= -0.55 b= 0.36

181
5.11 Chapter summary
This chapter analysed and reported the collected survey data. The overall analysis presented a
number of issues.
First, among the four measurement scales, RL and employee turnover intentions provided a
good fit for the data. However, the organisational commitment and presenteeism (SPS) scales
required further modification to improve their goodness of fit. As described, some items from
both scales were removed as an approach to present the degree to which indicators
represented the unobserved latent variables of the study.
Second, descriptive statistics for the applied measurement scale were presented. The figures
and related values indicated that there were no out-of-bounds estimates and that the results
were well within the expected ranges. All the measurement scales confirmed good
psychometric properties. The results of CFA satisfied the loading of indicator items on
constructs and above the preferred 0.50 threshold of tolerability. Each scale also had a
Cronbach’s alpha above the preferred 0.75 requirement of acceptability. Hence, no
assumptions of violation were noted, and the study variables were strongly and significantly
correlated with each other.
Third, the analysis of direct hypotheses revealed that RL to organisational commitment,
organisational commitment to employee turnover intentions, and employee turnover
intentions to presenteeism have significant effects to each other. RL to presenteeism and
turnover showed moderate effects on each other but significant with their correlational
measures. However, organisational commitment to presenteeism has the minimum effect, and
that may indicate employees’ overcommitment issues as described in the literature Chapter 2
(Section 2.10).
Finally, the mediation results from the proposed model showed that both mediators,
organisational commitment and employee turnover intentions partially mediated the direct
relationship between RL and presenteeism. Therefore, the proposed model of this study

182
confirmed the best fit for the collected data and supported all the developed hypotheses with
evidence of sufficient statistical power of 0.999.
The next chapter discusses the overall findings and conclusions based on the quantitative data
and analysis in this chapter. It will describe both the theoretical and methodological
contributions of this study, including the practical implications of the findings. It will also
identify the potential limitations of this thesis and future research opportunities. Lastly,
concluding remarks will be presented.

183
6 DISCUSSION AND CONCLUSION
6.1 Introduction
This chapter summarises the overall findings of this thesis. It also recognises its contribution
to the literature and implications for future research opportunities. This chapter consists of
seven sections. The next section, Section 6.2, presents a general review of the purposes, aims
and hypotheses of the thesis. The findings for each hypothesis and their links to the research
purposes are described in Section 6.3. The theoretical contributions of this thesis are outlined
in Section 6.4. Section 6.5 contains the implications for managerial practice, and Section 6.6
identifies the potential limitations of this thesis. Thereafter, Section 6.7 offers some guidelines
and suggestions for future researchers. Finally, the concluding remarks are presented in
Section 6.8.
6.2 General overview of the thesis
The main purpose of this thesis was to develop and examine a relational model that explains
the relationships between RL, presenteeism, organisational commitment and employee
turnover intentions. To the best of my knowledge, this thesis is the first study to investigate
these variables simultaneously within an Australian context. The present thesis was
undertaken based on several important theoretical and practical aims, as outlined in Section
1.5:
1. Empirically examine the nature of the relationship between RL and presenteeism in a
sample of Australian employees;
2. Evaluate and test the role of employees’ perceptions of RL for explaining the nature of the
relationship between RL, organisational commitment, employee turnover intentions, and
presenteeism; and
3. Develop and test the mediational role of organisational commitment and employee turnover
intentions on the relationship between RL and presenteeism.

184
Eight hypotheses setting our six direct and two simple mediational relationships were
formulated (Section 4.2). To meet the aims of this thesis, and to test the hypotheses, a
comprehensive literature review was undertaken to establish theoretical justifications for each
hypothesis (Chapters 2 and 3). A web-based survey combining four scales was used in the
data-collection process. A sample of 200 employees was recruited for the survey. The eight
hypotheses, including the mediation analyses, were tested through SEM. The results fully
support seven of the eight hypotheses. As presented in Chapter 5, one hypothesis (H1)
required further analysis. The following section describes the main findings of this thesis and
explains the results of each hypothesis in detail.
6.3 Discussion of findings
The intent of this study was to determine whether a relationship existed between RL and
presenteeism and whether organisational commitment and employee turnover intentions
among Australian employees mediated this relationship. This section presents the results of
the tested hypotheses (H1 to H8) as presented with the research questions in Chapter 1
(Section 1.7) and described in Chapter 5 (Section 5.9). The overall findings of this study
regarding the relationships among the examined variables in the context of previous literature
and the framework of the conceptual model are discussed below.
6.3.1 Perceived RL and presenteeism
Hypothesis 1 (H1) posited that there is a direct and negative relationship between RL and
presenteeism in workplaces among Australian employees. Previous leadership and
presenteeism studies have examined the effect of various leadership practices on employee
performance (Gilbreath & Karimi, 2012; Nyberg et al., 2008) and wellbeing (Nyberg et al.,
2009; Sosik & Godshalk, 2000), including the prevalence of presenteeism. The findings of
this thesis demonstrate specifically that RL can influence presenteeism in workplaces. The
results showed a significant and negative association between RL and presenteeism (r= -.30,
p< 0.001). The β estimates in the SEM revealed a similar relationship (β= -.22, p< 0.034),
which also suggests a moderate direct impact of RL on presenteeism for the studied sample.
In addition, a further secondary analysis was conducted (Figure C-1 in Appendix C) among
RL and the subscales of presenteeism: work process and work outcome. The results found

185
that RL has more influence on work process (β= -.36, p< 0.001) than on work outcome (β=
.07, p< 0.065). This finding means RL has a significant negative influence on presenteeism
that is particular to work process rather than work outcome. In other words, while the
relationship between RL and a composite score for presenteeism is negative, at the subscale
level, only presenteeism related to work process is significantly related to RL.
The findings for Hypothesis 1 (H1) indicate that when employees perceive their managers or
supervisors as leaders who lead with more perceived responsibility, there is a greater
likelihood that employees will generate less presenteeism at work. The higher levels of
perceived responsibility include leading by exemplary behaviour and care of employees
through managerial support, taking initiatives for higher employee retention with superior
HRM practices and CSR initiatives using morals and ethics in stakeholder relationships. This
finding is consistent with previous research (Hetland et al., 2007; Nyberg et al., 2008;
Kelloway & Barling, 2010; Sosik & Godshalk, 2000; Nyberg et al., 2011), and suggests that
RL in workplaces directly affects employees’ work processes and prevalence of presenteeism.
6.3.2 Perceived RL and organisational commitment
The findings for Hypothesis 2 (H2) suggest that there is a direct and positive relationship
between RL and organisational commitment in the study sample of Australian employees
(Section 1.6). As described in Chapter 3 (Section 3.3), the organisational studies literature has
described the positive impact of various leadership approaches on organisational commitment
(Gillet & Vandenberghe, 2014; Top et al., 2015). In line with these studies, the current study
demonstrated a significant positive influence between RL and employees’ organisational
commitment. Primarily, findings revealed a significant and positive association between RL
and organisational commitment (r= .55, p< 0.001). In addition, the analysis from SEM
confirmed that employees’ perceived RL had a strong and significant direct influence on
organisational commitment (β= .65, p< 0.001). Thereafter, a further secondary analysis was
executed (Figure C-2 in Appendix C) with RL and the three subscales of organisational
commitment (affective, continuance and normative commitment). The results showed that RL
has more influence on employees’ affective (β= .538, p< 0.001) and normative (β= .507, p<
0.001) commitment than on their continuance commitment (β= .104, p< 0.002), and thus RL
has a significant and positive influence on employees’ emotional attachments for their

186
organisations (e.g., affective commitment) and individual personal values (e.g., normative
commitment) more than on their costs of leaving, such as losing attractive benefits or
seniority (e.g., continuance commitment).
The results of Hypothesis 2 (H2) suggest that when employees perceive more qualities of RL
in their leaders, they respond with a higher level of organisational commitment. Hence, RL,
with its attributes of a relational stakeholder culture, HRM practices and managerial support,
more positively influence employees’ organisational commitment than do other leadership
styles. These results are consistent with previous studies (Bass et al. 2004; Wagner et al.,
2013; Yozgat et al., 2014; Gokce et al., 2014; Şahin et al., 2014; Keskes, 2014; Suk Bong et
al., 2015).
6.3.3 Perceived RL and employee turnover intentions
Hypothesis 3 (H3) posited a direct and negative relationship between RL and employee
turnover intentions among the Australian workforce. Previous literature (Section 3.4)
suggested that different leadership practices, such as transformational, ethical, servant and
authentic leadership, have negative relationships with employees’ turnover intentions. In the
current study, the findings showed a significant and negative association between RL and
employee turnover intentions (r= -.55, p< 0.001). Moreover, β estimates in the SEM also
revealed a supportive negative relationship among the variables (β= -.17, p< 0.037).
The outcome of Hypothesis 3 (H3) indicated that when employees recognise the greater
potential of their managers’ RL, they hold a lower level of turnover intentions. Employees
responded particularly to the specific leadership attributes of leaders’ care for them (i.e.,
managerial support), employee retention and HRM functions (i.e., HR practices) and
managers’ ethical decision-making and concern for their stakeholders (i.e., stakeholders
culture). These findings are consistent with previous studies (Silverthorne, 2001; Hsu et al.,
2003; Myatt, 2008; Zhiqiang et al., 2013; Tse et al., 2013; Liu et al., 2013; Harris et al.,
2014). The results of the current thesis also suggest that RL directly affects employees’
turnover intentions. In other words, RL enhances employees’ perception of organisational
leadership with greater responsibility, HRM functions and communities, and that this
perception eventually leads to a higher employee retention rate for organisations.

187
6.3.4 Organisational commitment and employee turnover intentions
Hypothesis 4 (H4) claimed that there is a direct and negative relationship between
organisational commitment and employee turnover intentions in the Australian workforce.
Chapter 3 (Section 3.5) demonstrated that the relationship between organisational
commitment and turnover intentions has been studied extensively and has been acknowledged
as an important concern for employees’ initiatives to leave or stay with their organisations. In
this study, findings showed a significant and negative association among organisational
commitment and employee turnover intentions (r= -.64, p< 0.001)). Similarly, β estimates in
the SEM analysis revealed a supportive relationship (β= -.61, p< 0.001) for the sample of
Australian employees. A further secondary analysis was executed with the three components
of organisational commitment and employee turnover intentions. For each posited
relationship, the Pearson’s correlation coefficient showed a significant negative relationship
with affective (r= -.64, p< 0.001) and normative (r= -.60, p< 0.001), but an insignificant
relationship with continuance commitment (r= -.12) (Table C-1 in Appendix C). However, the
results of the β estimates in the SEM showed a supportive relationship for affective (β= -.65,
p< 0.001), normative (β= -.24, p< 0.001) and continuance (β= -.20, p< 0.008) commitment
(Figure 6.3 in Appendix C).
The results from testing Hypothesis 4 (H4) show that organisational commitment reduces
employees’ turnover intentions in workplaces. Among the three components, employees’
affective commitment showed the highest negative influence on employee turnover
intentions. These findings are rational and similar to those of previous studies (Lee &
Bruvold, 2003; Stumpf & Hartman, 1984; Manzoor & Naeem, 2011; Lee et al., 2012; Faloye,
2014); these studies also found that organisational commitment in organisations directly
affects employees’ turnover intentions and may affect employee retention rates.
6.3.5 Organisational commitment and presenteeism
The results supported Hypothesis 5 (H5), showing a direct and negative relationship between
organisational commitment and presenteeism for the sample of Australian employees in the
study. Chapter 3 (Section 3.6) described organisational commitment as employees’
willingness to exert considerable effort on behalf of their organisations as expressed by better
attendance records and more effective and productive work, and showed that it is associated
188
with lower presenteeism. In the current study, results showed a minimal negative association
between organisational commitment and presenteeism (r= -.17, p< 0.005). The β estimates in
the SEM also revealed an insignificant positive relationship (β=.09, p< 0.457) for the studied
sample. A further secondary analysis was executed with the three components of
organisational commitment on presenteeism. The Pearson’s correlation coefficient showed a
significant negative relationship with affective (r= -.27, p< 0.001) and normative (r= -.19, p<
0.001) commitment, but an insignificant and positive relationship to continuance commitment
(r= .128) (Table C-2 in Appendix C). The β estimates in the SEM showed a similar
relationship for affective commitment (β= -.38, p< 0.001), but insignificant for normative (β=
-.08, p< 0.326) and continuance (β= .10, p< 0.324) commitment (Appendix C).
The results of Hypothesis 5 (H5) showed that employees’ higher levels of organisational
commitment did not influence presenteeism, but only their affective commitment. This
indicates a further opportunity to explore employees’ overcommitment in workplaces, as
employees’ continuance and normative commitment may further encourage them to come to
work when they are not in a fit state to perform their jobs, and may need support from their
managers to take sick leave. This finding is similar to previous studies (e.g. Arronson &
Gustafson, 2005; Bergstrom et al., 2009; Johns, 2010; Cicei et al., 2013). To manage
presenteeism for higher employee productivity, further research is required to examine
employees’ optimum level of organisational commitment rather than overcommitment.
6.3.6 Employee turnover intentions and presenteeism
The results of Hypothesis 6 (H6) showed a direct and positive relationship between employee
turnover intentions and presenteeism in the sample of Australian employees. As described in
Chapter 3 (Section 3.7), employee turnover intentions are the pre-stage of employees’ actual
decisions on whether to leave or quit their job. These intentions make them emotionally
detached from their organisations, which may lead to presenteeism. In this study, the
Pearson’s correlation coefficient exposed a significant and positive association between
employee turnover intentions and presenteeism (r= .41, p< 0.001). The results of β estimates
in the SEM also revealed a supportive relationship (β= .44, p< 0.001) in the sample of
Australian employees.

189
The results of Hypothesis 3 (H3) proposed that employees’ higher levels of turnover
intentions influence higher levels of presenteeism in organisations. In other words, when
employees are considering turnover intentions and are forced to work in spite of poor health,
eventually they show higher levels of presenteeism. This finding is congruent with previous
studies (Reese, 1992; Ruez, 2004; Hemp, 2004; Taifor et al., 2011), which additionally
suggests that employees’ turnover intentions in organisations positively influence
presenteeism to reduce employee productivity at work. To the best of my knowledge, there is
no published study measuring the associations between employee turnover intentions and
presenteeism; therefore, this finding is a novel empirical contribution.
6.3.7 The mediating influence of organisational commitment on the association between RL
and presenteeism
The results of Hypothesis 7 (H7) stated that employees’ organisational commitment mediates
the relationship between RL and presenteeism among the sample of Australian employees.
Section 3.8 described the role of organisational commitment as a mediator for the direct
relationship between RL and presenteeism. However, this thesis appears to be the first study
to report the influence of RL on presenteeism with the mediational influence of organisational
commitment. Results showed that RL influenced presenteeism both directly (Hypothesis 1),
and indirectly or partially mediated (Hypothesis 7) by organisational commitment for
employees’ productivity outcomes. This is because the direct relationship between RL and
presenteeism remained significant at the time of considering organisational commitment as
the mediator (Section 5.9.2). In other words, results suggested that managers who scored high
on perceived RL are more capable of decreasing presenteeism and increasing organisational
commitment. However, for the indirect (mediated) relationship between RL and presenteeism,
the inclusion of organisational commitment decreases the total effect of RL on presenteeism
(β estimates from -0.36 to -0.27 at p< 0.001). Hence, organisational commitment only
partially mediates the relationship between RL and presenteeism.
This partial mediational effect of employees’ organisational commitment in the relationship
between RL and presenteeism can be further described. For example, with the influence of
RL, employees may work with higher organisational commitment to exert more effort at work
instead of being ill at work which will tend to reduce presenteeism. This association also

190
indicates that responsible leaders need to consider their employees as important stakeholders
to generate higher levels of work motivation, creativity and productivity (Lynham &
Chermack, 2006; Lowhorn, 2009; Zhang & Bartol, 2010). These results suggest that when
organisational commitment is introduced as a mediator on the direct relationship between RL
and presenteeism, the total effect of RL on presenteeism is somewhat less (Figure 5.8).
Several recent studies have also considered organisational commitment as a mediator in their
studies because of its significant influence over other organisational factors such as among
performance appraisal and organisational citizenship behaviour (Ahmed et al., 2013); between
perceived reputation and citizenship behaviour (Fu et al., 2014); between job characteristics
and job satisfaction (Hsu et al., 2015); and between role stress and turnover intentions (Han et
al., 2015). Therefore, the mediational analysis on organisational commitment supports a
partial mediation in the direct relationship between RL and presenteeism, and further
confirms the findings of previous studies.
6.3.8 The mediating role of employee turnover intentions on the association between RL and
presenteeism
The results of Hypothesis 8 (H8) stated that employee turnover intentions mediate the direct
relationship between RL and presenteeism in organisations. However, this thesis seems to be
the first study to report the influence of RL on presenteeism with the mediation of employee
turnover intentions. This suggests that RL affects presenteeism directly, as shown in
Hypothesis 1(H1), and indirectly or partially mediated (H8) by stimulating employee turnover
intentions for employees’ productivity outcome. The results in the analysis showed that
managers who scored high on perceived RL were more capable of influencing both
presenteeism and employee turnover intentions to which RL is directly related. However, for
the indirect (partially mediated) relationship between RL and presenteeism, the inclusion of
employee turnover intentions decreased the total effect of RL on presenteeism (β estimates
from -0.36 to -.18 at p< 0.001); this means that employee turnover intentions offer a partial
mediation in the current study.
The partial mediation relationship (H8) can be explained further. If employees do not perceive
higher levels of RL from their superiors, their pride in their work and their job satisfaction are
likely to decline (Doh et al., 2011). As a consequence, employees’ thoughts of leaving their
organisations (turnover intentions) become more prevalent and some of them may leave when

191
available opportunities elsewhere are offered. Moreover, presenteeism is positively influenced
by dissatisfaction at work and employees forcing themselves to attend work with ill-health.
Pless et al. (2011) suggested that responsible leaders should build and sustain businesses that
benefit their multiple stakeholders, and should prioritise their own employees. However, the
influence of RL on HR practices has been overlooked so far. Researchers have suggested that
RL can hardly be accomplished without a deep transformation of managerial motivations and
values (Bhattacharya et al., 2009; Maak & Pless, 2006; Wittenberg et al., 2007; Brown &
Trevino 2006; Ciulla, 2006; Waldman & Galvin, 2008;). Hence, employees’ levels of
turnover intentions influence the direct relationship between RL and presenteeism as
mediator.
The partial mediating role of employee turnover intentions can be explained from the HRM
perspective as well. For example, leaders hoping to practice RL to discourage presenteeism
may experience an adverse result if the employees conceal their turnover intentions. Previous
studies have also considered employee turnover intentions as the mediating variable because
of its significant influence over organisational performance (Gond et al., 2011; Waldman &
Galvin 2008; Maak & Pless, 2006; Doh et al., 2011; Voegtlin et al., 2012; Yukl, 2013).
Therefore, the findings of this study suggest that employees’ turnover intentions reduce the
total effect of RL on presenteeism (Figure 5.9) and support a partial mediation.
6.4 Theoretical contributions
This study examined the relationship between RL and presenteeism with the mediational
effects of organisational commitment and employee turnover intentions in the Australian
context. The theoretical contributions of this thesis are threefold. First, it provides an
understanding of the antecedents and consequences of RL with presenteeism, organisational
commitment and employee turnover intentions as study variables. Hence, it contributes to the
literature on organisational leadership to link RL with employees’ behavioural outcomes.
Second, this thesis contributes to the literature of both organisational behaviour and HRM by
exploring the mediational influences of organisational commitment and employee turnover
intentions on the direct relationship between RL and presenteeism. Third, this thesis examines
an underexplored concept of presenteeism and contributes to the literature of organisational

192
studies to explore the influence of RL in organisations. These three key theoretical
contributions are described more fully below.
The notion of RL is largely underexplored and lacks evidence in the literature of
organisational studies. Researchers suggest that there are many challenges in applying RL
because of organisations’ continual changes and new demands of business contexts (Maak &
Pless, 2006; Waldman & Galvin, 2008; Pless et al., 2011). While several studies have
confirmed the relationship between various leadership practices and presenteeism (Gilbreath
& Benson, 2004; Van et al., 2004; Nyberg et al., 2008), this thesis extends the literature of RL
in several ways. First, this study addressed both Maak (2007) and Maak and Pless’s (2006)
understanding of RL from the employee’s perspectives to examine the hypothesised model
(Figure 1.1). For example, Maak and Pless suggest that leadership that goes beyond the
dyadic leader-follower model and extends it to a higher engagement between leaders and
stakeholders (Maak 2007; Maak & Pless 2006b). This thesis has examined employees’
perception of these RL attributes – for example, managers’ stakeholder culture (see the RL
scale in Appendix A-3) – to link RL and employee outcome. The findings of the thesis
suggest that managers’ RL attributes influence organisational commitment, employee
turnover intentions and presenteeism in workplaces. Hence, this thesis has explicitly
examined the attributes of RL to apply Maak and Pless’s views in practice and contribute to
the literature of RL.
Second, the study findings extend the work of Brown and Trevino (2006, 2009) and
Spreitzer’s (2007) value-centered leadership practices. This thesis has conceptualised RL as a
value-based leadership approach (Section 2.4) to examine its relationships with presenteeism,
organisational commitment, and employee turnover intentions. Researchers have suggested
that value-based leadership incurs obligations for leaders to manage their values and create a
corporate culture that optimises economic performance, ethical actions and social
participation and reduces environmental impact (Pless, 2007; Brown & Trevino 2006, 2009;
Spreitzer, 2007). This thesis contributes to the literature to include the evidence on how these
attributes of RL can influence employees’ organisational commitment, turnover intentions
and presenteeism.

193
Third, this thesis extends the work of Lynham and Chermack’s (2006) theory of Responsible
Leadership for Performance (RLP). They suggested RLP as an integrative framework
addressing the nature and challenges of organisational leadership which are both responsible
for and focused on organisational performance. This thesis extends this claim and contributes
to the literature about the relationship between RL and organisational performance, focusing
on the employee outcomes of organisational commitment, employee turnover intention and
presenteeism. Hence, conferring to RLP, this thesis also suggests that managers’ perceived
RL can be linked with organisational commitment, employee turnover intentions and
presenteeism for superior organisational performance.
Fourth, this thesis highlighted the notion of Voegtlin et al. (2012) to measure the positive
outcomes associated with RL at the micro level (organisational level) in the employee-
manager relationship (p.5). They suggested that among the three levels (macro, meso and
micro), responsible leaders may have a direct and considerable effect on their immediate
followers, particularly at the micro level. This thesis has examined RL at the micro level and
supported their claims. Hence, this thesis contributes to the literature of organisational
leadership and suggests that RL has an effect on followers at the micro-level.
The second key theoretical contribution of this study is to the literature on organisational
behaviour and HRM through its exploration of the mediators, organisational commitment and
employee turnover intentions on the direct relationship between RL and presenteeism. As
stated in Chapter 5 (Section 5.9.2), managers who hold RL attributes can influence
employees’ level of presenteeism indirectly through both mediators. In other words, both
organisational commitment and employee turnover intentions showed partial mediational
influences that can affect employees’ presenteeism. These results support those of several
recent studies that have shown a significant role for organisational commitment as an
effective mediating variable (Garrido-Moreno et al., 2014; Jing & Zhang, 2014; Han et al.,
2015; Hsu et al., 2015). Similarly, the mediating influence of employee turnover intentions
matches with several recent organisational studies on the relationship between leadership and
presenteeism (Christian & Ellis, 2014; Yousaf et al., 2015; Takase et al., 2015; Saranya &
Muthumani., 2015; Brien et al., 2015). This thesis suggests that employees who are highly
committed to organisations and who come to work with health conditions show less
presenteeism than who lack the organisational commitment. However, it is also anticipated

194
that employees’ overcommitment in the workplace may affect the relationship between RL
and presenteeism. In other words, overcommitted employees may result in higher levels of
presenteeism in workplaces. If employees are experiencing health issues, they should take
leave from work to avoid presenteeism. However, because of their overcommitment they may
come to work and increase presenteeism. These results lend support to existing research
findings and extend the existing literature on RL and presenteeism. The thesis results further
confirms new research areas to examine novel propositions that have been suggested in the
literature but are yet to be explored.
There is a scarcity of literature on the notion of presenteeism and its consequences in the field
of HRM. Researchers have suggested that studies related to presenteeism and employees’
wellbeing are well established in the literature for occupational health studies, but limited in
the field of HRM and organisational studies (D’Abate & Eddy, 2007; Polach, 2003; Bing et
al., 2003; Goetzel et al., 2004; Johns, 2010; Scuffham et al., 2014). Moreover, employees’
work-life integration issues have received limited attention from HR perspectives and have
been overlooked as a critical force for leadership, organisational effectiveness and HR
development (Polach, 2003; Gond et al., 2011). Hence, D’Abate (2005) attempted to identify
a full range of activities related to employee engagement in workplaces and the reasons
behind the behaviour, pointed out the need for further empirical studies to examine
presenteeism. The current study inspected the influence of RL on presenteeism with
employees’ behavioural attributes, such as organisational commitment and employee turnover
intentions, and thus contributes to the literature on HRM to comprehend how the notion of
presenteeism can disrupt positive organisational outcomes, and to argue that it should be
taken seriously for future organisational studies to promote sustainable competitive
advantage. Moreover, the current study contributes to the literature of HRM because of the
results of both the mediating influences of organisational commitment and employee turnover
intentions on the direct influence between RL on presenteeism. Therefore, this thesis
contributes to the literature of both HRM and organisational behaviour, and answers calls to
examine the relationship between RL and presenteeism with the mediational influences of
organisational commitment and employee turnover intentions.

195
6.5 Methodological contributions
This study presents a unique structural model and methodology for testing the relationships
among the antecedents and consequences of RL. The uniqueness of this model balances the
fact that it offers a methodology for examining a new combination of variables arranged in a
specific pattern, including both direct and indirect (mediation) relationships. In addition to the
theoretical and practical contributions, this thesis offers several methodological contributions
to understand the underlying mechanism by which RL shows its relationship with
organisational commitment, employee turnover intentions and presenteeism. First, examining
RL with a relational model within organisational studies is rare. This thesis provides a new
insight through its hypothesised model (Figure 1.1) and examines the influence of RL on
employees’ outcomes, such as organisational commitment and employee turnover intentions
and presenteeism. Second, this study is one of the first RL studies to test the mediators,
employee turnover intentions and organisational commitment for their relationships with
presenteeism. Several researchers have proposed that leadership practices in organisations
lead to performance through workforce characteristics, and have examined the direct
relationship between various leadership approaches and employee performance outcomes
(Section 2.5). However, while employee commitment has been well examined (Section 3.8.1),
employee turnover intentions as a mediator has not previously been tested (Becker & Gerhart,
1996; Haque et al., 2014). Hence, the current study methodologically contributes to the RL
literature through mediational analyses. Third, this study applied SEM as a data-analysis
technique to examine the hypothesised model (Figure 1.1), which is also a novel application
to the examination of linkages between RL and presenteeism within organisational studies.
Shah and Goldstein (2006) advised that the use of SEM as a methodological procedure to test
and analyse the relationship between variables has been steadily increasing in organisational
studies. Therefore, this thesis contributes to the existing organisational studies by proposing a
systematic methodological approach with SEM to examine a relational model between RL
and presenteeism with the mediation of organisational commitment and employee turnover
intentions.

196
6.6 Practical implications The empirical findings of this study also provide useful insights on the relationship between
RL and specific employee outcomes (organisational commitment, employee turnover
intentions and presenteeism). The empirical results contribute to the development of effective
organisational strategies and leadership practices. The findings described in this thesis have
potential practical implications in three areas:
(1) Conducting training programs to promote and develop RL for organisational leadership;
(2) Recognising presenteeism and incorporating organisational strategies to recover losses
from presenteeism; and
(3) Encouraging managers to enhance organisational commitment and reduce employee
turnover intentions in organisations.
6.6.1 Conducting training programs to promote and develop RL for organisational leadership.
The empirical results of this study showed that RL influences employee outcomes such as
organisational commitment, employee turnover intentions and presenteeism. These findings
raise significant concerns for organisations to hasten progressive changes within workplaces
to promote RL practices. Stahl and De Luque (2014) specified the importance of preventing
unethical behaviour for managers in workplaces and advised on the promotion of responsible
behaviour through further training and education to achieve higher leadership outcomes.
However, there has been much debate in the literature about whether leaders in organisations
can be trained to become responsible leaders (House & Aditya, 1997). Regardless of the
argument, leadership research and consulting practice have effectively focused on developing
programs that can shape the effectiveness of individuals in leadership positions. For example,
PwC’s ‘Project Ulysses’ is an integrated service-learning program where individuals travel
overseas to spend time working with NGOs, entrepreneurs and other small organisations in
less developed countries to learn about RL (Waldman & Balven, 2015). The post-program
survey provided evidence that this experience enhanced RL qualities among the participants,
who can now promote RL in their organisations. Some large companies, such as IBM, Novo
Nordisk, GlaxoSmithKline and Unilever, have applied similar programs to support their
global corporate social responsibility (CSR) and sustainability strategy to promote RL for

197
their organisations (Googins et al., 2007; Caligiuri et al., 2013). Programs like Project Ulysses
are inspiring examples of how to initiate and design training and development programs for
managers to understand how RL can be learned and transferred to their organisations (Pless et
al., 2011; Doh & Quigley, 2014).
It is also important for organisations to recognise how individual-level variables, such as
personality traits, motives and values, may predict managers’ propensity to engage in RL,
particularly when recruiting, selecting, and promoting their employees. Several researchers
have suggested that individual differences, including their traits and personal characteristics,
are associated with leadership outcomes (Stogdill, 1963; Bass, 1990; Bennis, 1994). Hence,
organisations may use personality tests and integrity tests (Scroggins et al., 2009) to
determine which manager is more likely to act responsibly. Moreover, organisations may also
consider managers’ attitudes and values to determine whether they match the alignment of
their corporate culture with RL, as candidates’ formal credentials and job-related skills may
not be the best predictors of their responsible behaviour (Stahl & De Luque, 2014). Hence,
organisations need to implement RL by actively promoting responsible behaviour from their
managers who play leadership roles and discouraging irresponsible acts. In addition,
supporting training and development initiatives that use reward systems to increase moral
awareness will hold managers (leaders) accountable for irresponsible behaviour (Crane &
Matten, 2007). This thesis provides empirical evidence and contributes to leadership
practitioners to introduce particular training and development programs for their managers to
promote RL in workplaces.
The results of this thesis highlighted the significance of organisational commitment and
employee turnover intentions as mediators in the relationship between RL and presenteeism.
It will be valuable for organisations to provide formal training to managers to apply their RL
to enhance organisational commitment and reduce employee turnover intentions to achieve
higher employee productivity. Researchers and practitioners acknowledge both organisational
commitment and employee turnover intentions as significant factors in effective leadership
results (Alarape & Akinlabi, 2000; Salami & Omole, 2005), but there is a scarcity of
empirical studies on RL and employees’ behavioural outcomes. On the other hand, Doh et al.
(2011) suggested that organisations that are enacting RL receive further advantages through
higher levels of employee retention. Hence, this thesis provides help to managers in

198
incorporating strategic HRM with RL for higher employee outcomes, such as higher
organisational commitment and reduced employee turnover intentions and presenteeism. For
that to be successful, organisations need to align their existing leadership with RL attributes
focusing on HR practices and stakeholder perceptions to support employees for in developing
organisational commitment and lower employee turnover intentions.
6.6.2 Recognising presenteeism and implementing organisational strategies to recover losses
from it
The results showed significant influences among RL, organisational commitment, employee
turnover intentions and presenteeism. Organisations aiming to develop HR functions and
leadership for higher employee outcomes can use the results of this thesis to implement
employee wellbeing programs and managerial interventions to minimise presenteeism in
workplaces. For example, organisations may employ health professionals to check
employees’ health conditions at work in a routine or non-routine manner to detect and
forestall presenteeism. This will not only help managers to prevent presenteeism in
workplaces, it may also provide employee satisfaction and support for employee wellbeing.
Similarly, organisations focusing on higher employee outcomes should be aware of
presenteeism and focus on RL to redesign job descriptions for managers so that employees
feel and act more involved and are motivated and productive.
This thesis recommends that organisations recognise presenteeism and managers act
supportively to show further concern for their employees’ wellbeing. Organisations can
redesign HR functions and departments to enhance their concern for presenteeism and support
for employees’ wellbeing. Employees who feel they can approach their bosses, colleagues and
managers for both physical and emotional support are likely to experience a lower level of
burnout and higher commitment (Sullivan, 1993). Hence, managers need to identify and
examine presenteeism by fostering an environment of open communication among all
employees within organisations to share and identify their wellbeing issues. There are several
possible approaches to achieve this objective. It is essential to increase employees’ formal and
informal associations with managers to understand their expectations and let employees know
they have the highest level of managerial support. For example, formal meetings can be
organised to share ideas and involve employees in the decision-making process to prevent
presenteeism. In addition, informal associations, such as get-togethers or family-friendly days

199
in workplaces, may also encourage employees to enhance their attachment with their
managers for a more collegial work environment. Presenteeism in workplaces is not only the
concern of employee wellbeing; it also has significant consequences for employee
productivity and organisational profitability (Section 2.7). Hence, initiatives for redesigning
existing leadership practices toward RL would help organisations achieve increased employee
productivity and sustainable competitive advantage.
6.6.3 Encouraging managers to enhance organisational commitment and reduce employee
turnover intentions in organisations
The results of this thesis provide practical implications that address HRM issues related to
employee outcomes such as organisational commitment and turnover intentions. From an
HRM perspective, it is important for organisations to manage employees’ organisational
commitment, as it influences their performance outcomes and turnover. Organisations should
encourage and develop managers’ abilities to practice RL to enhance organisational
commitment and reduce employee turnover intentions. This could be achieved by conducting
training or development programs to improve existing leadership roles concerning RL. In
addition, organisations could create informal initiatives to develop employees’ self-initiatives
for higher organisational commitment. For example, organising informal get-togethers,
helping employees to identify and share their work expectations, recognising organisational
values and assessing work environments in which both organisational values and employees’
expectation from managers’ leadership can be aligned can empower employees to participate
in decision-making and encourage informal convention and continuous feedback. Moreover,
both these formal and informal engagements need to take into account the need to develop,
create and redesign job responsibilities for greater RL outcomes, as these were found to be
significant for employees’ organisational commitment, turnover intentions and presenteeism
in the current study. Therefore, encouraging employees’ participation and allowing them to
contribute to their work environment will reveal RL to enhance their self-esteem, and result in
more organisational commitment and lower turnover intentions.
This thesis provides potential practical implications for organisations to enhance their
employees’ organisational commitment. By increasing organisational commitment,
organisations could have a more positive and higher level of employee productivity and
retention. For example, organisations may encourage a job-crafting approach to enhance
200
employees’ organisational commitment in workplaces. Lyons (2008) described the notion of
job crafting as the spontaneous changes made by employees to satisfy their personal needs
and not necessarily the needs of the organisation. In other words, job crafting includes the
ability to adjust employees’ abilities and preferences with the current job to make it more
satisfying, purposeful and meaningful through their own initiatives. Redesigning employees’
jobs with job crafting provide an opportunity for them to shape their jobs in ways that would
possibly change how employees do and think about their work, which in turn can improve
related outcomes for organisational performance (Wrzesniewski & Dutton, 2001). This
approach increases control over employers and gives employers an indication of areas of
weakness in the construction of job tasks. A possible procedure for this change would be as
follows. First, organisations need to focus on the areas in the job that are weak and need
crafting, such as the employee-manager and employee-employee relationships. After
recognising the areas, the next step is to assess how crafting influences the work environment
and stakeholders such as employees and clients, including managers providing leadership in
the organisations. Second, organisations can then start to implement job-crafting responses in
the workplace; for example, recognising clear expectations of employees’ careers, tasks and
roles, and encouraging their responsibility and development in work environment. Third,
organisations need to continually observe whether the job-crafting approach is achieving its
aims by obtaining feedback from employees and their managers. These crafting processes
ensure the desired positive changes among employees, and organisations can include this
approach as a potential practice in their job-redesigning programs to increase organisational
commitment and reduce turnover intentions.
From the HRM perspective, the result of this thesis will benefit organisations to facilitate and
enrich their initiatives for presenteeism and employee retentions. According to Mercer (2011),
40% of Australian employees were seriously considering leaving their organisation and
searching for new jobs in the upcoming year. Hence, managers need to observe employees
who are coming to work while ill and should build awareness among their staff about
presenteeism. Organisations can design and organise particular training and workshops for
employees’ wellbeing to reduce presenteeism and enhance employee productivity. As a
consequence, this will confirm a positive state of employee retention and reduce employees’
turnover intentions. Researchers have shown that managerial support is a major element in
reducing employee exhaustion and thus improving the retention rate for organisations

201
(Brunetto et al., 2010). The relationship between organisational commitment and
presenteeism also has important managerial implications regarding overcommitment issues.
Because, of the mediational effect organisational commitment has between RL even if
employees are highly committed, the level of presenteeism will not necessarily decline,
possibly because of overcommitment. Therefore, based on the results of this thesis,
organisations should implement strategies that can facilitate their management of
presenteeism for higher employee productivity, commitment and retention. For example,
organisations may introduce designated leave for presenteeism with pay and encourage
employees not to report to work when they have detected health conditions (Section 2.6.3).
This strategy will not only signify leaders’ attention on presenteeism, but also encourage
employees to be under healthcare supervision to avoid productivity losses, thus leading to
higher organisational commitment and reduced turnover intentions.
In this study, organisational commitment was examined with employee turnover intentions
and observed as an important component for positive workplace outcomes. The findings of
this study also provide further support to the results indicated by Erdheim et al. (2006). They
suggest that organisational commitment should be included on the list of constructs that are
thought to be related to employees’ personality, because, as previous studies suggest,
organisational commitment provides an attitudinal link in the relationship of employee
personality and job search behaviours (Klein et al., 2009; Salgado, 2002; Zimmerman, 2008).
The notion of job search behaviours is defined as the actions of an employee to generate job
opportunities in other organisations (Swider et al., 2011). These job search behaviours include
updating one’s resume and attending job interviews for new employment (Blau, 1994).
Employees with lower levels of commitment are more likely to leave their organisations
(Meyer et al., 2002). Hence, organisational commitment is an important antecedent of job
search behaviours, which are in turn highly related to actual employee turnover. Therefore, on
the basis of the analysed results, this thesis recommends that organisations could incorporate
selection procedures based on personality measures thought to induce high levels of
organisational commitment and increase employee retention.
Finally, the findings of this thesis indicate the importance of RL and suggest that it can be
effective for HRM policies that benefit organisations by achieving higher employee
outcomes. The concern of presenteeism remains a continuing problem for Australian

202
economy. The total annual cost of presenteeism is estimated to be $35.8 billion by 2050,
which equates to a decrease in GDP of 2.8% (Medibank Ltd, 2011). Both the direct and
indirect relationship between RL and presenteeism identified in the Medibank study provide
organisations an opportunity to be aware, evaluate and reduce their future contribution to
presenteeism levels. The results of the mediational influences of organisational commitment
and employee turnover intentions can help organisations understand the extent to which RL
can influence higher employee productivity. From the thesis findings, organisational
commitment is strongly related to employee turnover intentions. Organisations that aim to
enhance employee retention should value highly committed employees. By recognising these
relationships, organisations will be able to understand the importance of employees’
psychological mechanisms to manage higher organisational commitment and lower intentions
to quit the job.
6.7 Limitations of the study
Several limitations of this study are worth noting. This study analysed self-reported responses
from Australian employees across various sectors. In the data-collection process, there is a
chance of common method biasness (CMB) and socially desirable responses (SDR). The
notion of CMB refers to the degree to which studied correlations among the variables are
altered or inflated due to a methods effect (Meade et al., 2007). According to Podsakoff and
Organ (1986), collecting information from a single source may be a limitation, because it may
affect the explanations drawn about the relationship between variables. The concept of SDR is
the tendency for participants to present a favourable image of themselves (Johnson &
Fendrich, 2002). This study minimises the probability of CMB with SEM applications
(Section 5.2). Researchers have attempted to create approaches for addressing CBM in SEM
(Podsakoff et al., 2003). This study used the CFA test for discriminant validity and satisfied
the ‘goodness of fit’ indices for the proposed relational model. As the SDR issues, this study
included all participants’ responses of the participants as anonymous, and every step was
taken to ensure participants’ privacy, and they had the freedom to discontinue their
participation at any point of the survey. From the CMB perspective, it would be valuable for
future researchers to further validate the results of this study by using various methodological
techniques from multiple sources. For example, with a longitudinal approach, the studied
model can be examined with employees and their direct managers or supervisors

203
simultaneously at a certain interval. Collecting the data anonymously will enhance the
internal validity of the results to reduce SDR bias. This would provide superior depth and
rigorous analysis of the results of the hypotheses examined in this study.
Another probable limitation in this study was related to the cross-sectional approach in data
collection. The cross-sectional study, in contrast with a longitudinal approach, does not allow
a higher degree of confidence (Hair et al., 2010). A longitudinal study refers to an
investigation where participant outcomes or results are collected over multiple follow-up
times (Van et al., 2004); such a design offers further confidence in the study results because
of the replication of observations of the same variables over an expected period of time
(Diggle et al., 2002; Sekaran, 2003). Therefore, it can be advised for future researchers to
replicate findings of the study using a longitudinal analysis for at least two reasons. First, it
permits more consistent and accurate explanations for the correlational influence of the
constructs. Second, researchers can observe any change in the relational outcomes of the
hypothesised model over different point of times to justify causal relationships in addition to
correlational influence.
It would be worthwhile to note that the demographic characteristics of respondents were not
included as control variables in this study. Several studies have shown that control variables
in the demographic profile, such as age, gender, income and year of work experience
influence the dependent variables and relational outcomes; for example, gender has been
shown to influence to organisational commitment (Lee & Peccei, 2007; Dalgıç, 2014),
employee turnover intentions (Blomme et al., 2010; Pao-Ling, 2013), leadership (Ming, 2010;
Mujtaba et al., 2010) and presenteeism (Petri, 2009; Larson et al., 2009). Consideration of
control variables in this study may give more robustness to external validation of the overall
results. However, incorporating these demographic variables into the hypothesised model was
beyond the purpose of this study, as it would have increased the complexity of the model to a
point that it would have been likely to include numerous unidirectional paths, which in turn
might affect the ‘goodness of fit’ indices for SEM. Therefore, it would be motivating for
future researchers to consider some comparison between respondents and non-respondents
with respect to participants’ demographic characteristics.

204
This research was conducted among a sample of Australian employees, and the results are
valid for Australia, but may not be generalizable for employees in other countries.
Generalisability for any research describes the extent to which research findings can be
applied outside its own contextual setting (Altman & Bland, 1998). Moreover, concerns like
the low response rate of the sample, the different definitions of RL and presenteeism, and
different sample characteristics of the demographic profile might reduce the validity of
attempts to generalise the findings of this study. To minimise these limitations and increase
the generalisability of the thesis, a number of pre-emptive stages were taken in this study; for
example, the selection of a heterogeneous sample; the sampling strategy applied in this study
(Section 3.4); and the use of a professional company (Qualtrics, USA) to ensure variability in
the collected data. It would be inspiring for future research to test the model of this study
using a superior sample that represents additional demographic features.
This study applied a cross-sectional research design for its data collection and examined the
correlational model with the selected variables. This relational study examined the influences
among the variables of RL, organisational commitment, employee turnover intentions and
presenteeism. A causal investigation may be viewed for cause and effect outcomes among the
same variables. The cross-sectional research approach collects data at a given point in time,
but limits inferences about causality (Leedy & Ormrod, 2001). Hence, the proposed model
can also be tested as a causal model. Many researchers have suggested that a causal model is
easier to examine in SEM, but interpretations for causality must be approached with further
caution, as causality can be determined only through experimental design approaches (Grimm
& Yarnold, 2000; Hair et al., 2010). Therefore, for a better understanding of the relationships
examined in this study, future research could be carried out using a causal study design
approach.
Future researchers may choose to examine how Australian cultural attributes might affect the
exercise of RL. For example, Hofstede (1984) suggested the categorisation of Australian
culture as masculine, high in individualism, low in power distance, average in uncertainty
avoidance and high in short-term orientation. Future researchers could use this
characterisation and GLOBE study findings to examine the impact of each of the cultural
attributes on how RL is enacted in the Australian context.

205
Finally, this thesis examined a relational model with eight hypotheses (Figure 4.1). It applied
a quantitative method as its explanatory paradigm (deductive reasoning) and used
correlational research techniques. This thesis did not attempt to answer the research question:
‘What is RL?’; rather, all the research questions were relationship-based (Section 4.2, page
107). Section 4.3 (page 107) provided the justifications for the methodological approach. To
further extend the findings of the study, a number of qualitative techniques may be used in
future research to examine the ‘how’ and ‘why’ aspects of the study findings. First, engaging
the micro, meso and macro levels of organisations, a qualitative study may explore how the
individual, organisational and social elements influence RL. Second, using qualitative
methods, researchers may examine how organisational culture may influence the relationship
between RL and employee outcomes. Third, the issue of overcommitment can also be
examined using qualitative methods, particularly how overcommitment of employees can be
managed. Finally, qualitative studies could be conducted across industries, cultures and
regions to examine how contextual factors influence RL.
6.8 Recommendations for future research
This thesis benefits both practitioners and researchers of RL to understand its relational
influence on employee outcomes, including presenteeism, organisational commitment and
employee turnover intentions. The following future research opportunities and
recommendations are provided to further advance the research into the topic.
This study applied SEM to test the direct and mediational relationships among the selected
variables. As a tool, SEM generates parameter estimates that support the proposed
hypothesised model (Figure 1.1); however, this evidence is not sufficient to establish any
causal relationship among the studied variables, as SEM only predicts causality while
emphasising mediation in any relational model, but cannot prove it (Bollen, 1989; James et
al., 1982). Hence, this thesis cannot confirm the direction of causality regarding the different
levels of influences of RL on presenteeism and the other two variables. In other words, this
thesis cannot claim that RL can cause reduced presenteeism or employee turnover intentions
and increased organisational commitment. Therefore, future research should test the
applicability of the proposed model to infer causal relationships, and thus enrich the accuracy
of the current study’s results. Moreover, the study applied a cross-sectional survey strategy to
collect the data at a single point in time. This was an effective and time-saving approach to

206
examine the proposed models (Figure 1.1), and makes the study’s results suitable as the basis
for a longitudinal study. Hence, further research can advance the outcomes of this study by
engaging a longitudinal methodology to understand whether the relationships found between
variables in the studied model could change over periods of time. For example, the proposed
model can be tested over specific periods of time to monitor managers’ leadership
performance for both employee and organisational outcomes. Therefore, future longitudinal
research is encouraged to disclose the causal process of how RL may evolve over a specific
period of time to influence employee outcomes.
The study results found partial mediation relationships for both organisational commitment
and employee turnover intentions on the relationship between RL and presenteeism. The
inclusion of other employee job-related variables may help to build a more comprehensive
model for the relationship between RL and presenteeism. Future researchers, therefore, could
focus on identifying other possible mediating or moderating variables to help further
understand the underlying mechanisms that influence the nature of the direct relationships for
RL and presenteeism. For example, mediators (e.g., trust in the manager) and moderators
(e.g., work environment) may provide more rigorous future models, as these factors play a
significant role in leadership effectiveness (Bass, 1985; Yozgat et al., 2014; Asencio &
Mujkic, 2016). According to BlessingWhite (2008), only 28% of employees trust their
managers at work, which suggests that this factor may play an important role in employee
productivity. Similarly, the role of work environment as a moderator may improve the
theoretical underpinnings of the literature and develop an additional process that may also
help in applying RL to reduce presenteeism in organisations.
From the theoretical background of RL, the thesis focused on Responsible Leadership for
Performance (RLP) as proposed by Lynham and Chermack (2006). The notion of RLP has
offered an applicable model that addresses organisational leadership and focuses on both
‘performance’ and the conception of leaders’ responsibility. This study is a further
exploration of RLP to promote the influences of RL on three employee outcomes:
presenteeism, organisational commitment and employee turnover intentions. There are
research opportunities further to extend RLP with additional organisational
performance-related outcomes, such as return on investment, and employee performance
outcomes, such as job satisfaction or turnover.

207
This thesis extends Voegtlin et al.’s (2012) micro-view of leadership from among multi-level
views, such as micro, meso and macro-level of organisational outcome. Future researchers
have the opportunity to explore the influence of RL on both the macro and meso-level also.
For example, examining the influence of RL on the meso level to link organisational culture
and performance, and on the macro level to link relations to external stakeholders (see
Voegtlin et al., 2012, p.5). Therefore, researchers will be able to signify the outcome of RL
from a broader perspective not only for internal employees but also for external stakeholders
to help organisations to be more responsible in their business communities.
The notion of presenteeism is well examined in occupational health studies (Goetzel et al.,
2004; Johns, 2010; Scuffham et al., 2014), but is relatively new in the field of HRM (Bing et
al., 2003). Hence, it is important to increase the understanding of the factors that relate to
presenteeism from HRM perspectives as it is significantly associated with employees’
wellbeing and performance outcomes. In addition, it is also necessary to fill the gaps in the
literature for presenteeism in HRM. Therefore, further research opportunities can explore
more about the influence of presenteeism with other organisational and employee outcomes
from HRM, such as return on investment, organisational effectiveness, employee engagement
and organisational citizenship behaviour.
This study employed a cross-sectional and self-administered online survey research design to
investigate the relational model in the Australian context. Hence, the results of the current
study should be validated in other countries or cultural contexts to provide greater support for
the outcomes of this study. For example, it could be worthwhile to validate the findings of this
study by conducting a cross-comparative study with other nations that have some similar or
different characteristics, such as in the European and Asian contexts. Moreover, as the current
findings are from a Western context, future researchers may explore further research
opportunities by addressing the question in non-Western cultures; for example, revalidating
the dimensionality of RL and presenteeism in non-Western cultures or examining the
mediational role of employee turnover intentions on the relationship between RL and
presenteeism in a non-Western culture.
This thesis focused on the employee outcomes presenteeism, organisational commitment and
employee turnover intentions from the employee’s perspective on RL only. It is therefore

208
imperative for future studies to understand the different influences of other leadership styles
on employee outcomes. Hence, other possible value-based leadership styles, such as
transformational, ethical, situational, transactional or empowering leadership might be
considered for the studied variables. Researchers have suggested further studies for RL and
prioritised it over other value-based leadership approaches because of two reasons. First, the
comparative studies would help in understanding the place of RL in the nomological network
(see Cronbach & Meehl, 1955). Second, this suggested comparison study would help to
provide top management with a better understanding of how to develop training programs for
managers to increase levels of productivity currently lost to presenteeism. This current study
focused on the three variables for the proposed relational mode examining the relationship of
RL, organisational commitment and employee turnover intentions to presenteeism. Future
research is desired to further explore how presenteeism might be affected from other HRM
perspectives. This may include strategic HRM (Schuler & Jackson, 1987); flexible
workplaces practices (Moen et al., 2011) and improve work engagement and life satisfaction
(Grawitch & Barber, 2010).
6.9 Concluding remarks
This study has achieved its intended goal of examining the impact of RL on presenteeism
among a sample of Australian employees including the mediational influences of
organisational commitment and employee turnover intentions. Specifically, the study
provided evidence that employees’ perception of their managers’ RL responses is
significantly related to the other three studied variables (presenteeism, organisational
commitment and employee turnover intentions), and also is important for employee
productivity. Based on these findings, practitioners and scholars could continue to pursue an
appropriate approach to understand the significance of RL for both employee and
organisational performance. The development of this model was initially motivated by calls in
the literature for research concerning RL (Maak, 2007), presenteeism (Aronsson et al., 2000;
Johns, 2010; Brooks et al., 2010; Lack, 2011), organisational commitment (Allen & Meyer,
1990) and employee turnover intentions (Martin, 1979; Mobley, 1982; Moore, 2000; Blau et
al., 2003). The results of the data analysis revealed substantial evidence that an RL approach
minimises presenteeism and employee turnover intentions, and enhances organisational
commitment. This study further enhanced the importance and utility of the relationship

209
between RL and presenteeism by highlighting two mediators to examine their indirect
relationship, such as organisational commitment and employee turnover intentions. The direct
relationship between RL on presenteeism was found to be partially mediated by employees’
organisational commitment and turnover intentions. These results contributed to filling the
significant gap in previous studies (Nyberg et al., 2008; Kuoppala et al., 2008; Gilbreath &
Benson, 2004; Yukl, 2013; Kouppala et al., 2008).
The results of this study have confirmed the relationships in the proposed model for the
sample of Australian employees. This thesis can now be used as a foundation for future
research initiatives to extend the existing understanding of the variables examined in the
study. Theoretically, one of the major contributions of this study was to understand how and
why RL influences employees in workplaces for presenteeism, organisational commitment
and turnover intentions. This study showed how employees’ perception of RL is mediated
with organisational commitment and employee turnover intentions for work-related outcomes
(i.e., presenteeism). The results related to this study have filled an important gap in the
literature and responded to previous calls (Maak, 2007; Nyberg et al., 2008) to further
understand the nature of the influence of RL in organisational studies. Most significantly, the
results and model presented in this thesis have provided several practical outcomes for both
academics and managerial practitioners. This study has also provided a prescriptive model
indicating how organisations configurations for managerial interventions can be optimised
strategically to have a significant impact on employee performance. In conclusion, it is
believed that organisations can build their capability by deploying effective training and
development programs to promote RL, and by rearranging work environments to promote
leader-employee relationships that prevent presenteeism, leading to higher organisational
commitment and employee retention.

210
REFERENCES
Addae, H. M., Parboteeah, K. P. & Davis, E. E. (2006), ‘Organizational Commitment and Intentions to Quit: An Examination of the Moderating Effects of Psychological Contract Breach in Trinidad and Tobago, International Journal of Organizational Analysis, vol. 14, no. 3, pp. 225-238. Adler, N. J. (2008), International Dimensions of Organizational Behaviour, Thomson Southwestern, Mason, OH. Agarwal, S., DeCarlo, T. E. & Vyas, S. B. (1999), ‘Leadership Behavior and Organizational Commitment: A Comparative Study of American and Indian Salespersons’, Journal of International Business Studies, vol.30, no. 4, pp.727-743. Ag Budin, D. K. & Wafa S. A. (2015), ‘The Relationship between Culture and Leadership Style Preference among Malay-Brunei, Bajau and Kadazan-Dusun Community in Sabah, Malaysia’, Journal of Management Development, vol. 34, no. 10, pp. 1202-1210. Aguilera, R., Filatotchev, I., Jackson, G. & Gospel, H. (2008), ‘An organizational Approach to Comparative Corporate Governance: Costs, Contingencies, and Complementarities’, Organization Science, vol. 19, no. 3, pp. 475-492. Ahmed, I., Mohammad, S. K. & Islam, T. (2013), ‘The Relationship between Perceived Fairness in Performance Appraisal and Organizational Citizenship Behavior in the Banking Sector of Pakistan: Mediating Role of Organizational Commitment’, International Journal of Management & Innovation, vol. 5, no. 2, pp. 75-88. Ajzen, I. (2001), ‘Nature and Operation of Attitudes’, Annual Review of Psychology, vol. 52, pp. 27-58. Ajzen, I. & Fishbein, M. (1980), Understanding Attitudes and Predicting Social Behavior, Prentice Hall, Upper Saddle River, NJ. Akhtar, S. & Tan, D. (1994), ‘Reassessing and Re-Conceptualizing the Multidimensional Nature of Organizational Commitment’, Psychological Reports, vol. 75, no., 3, pp. 1379-1390. Ashkanasy, N. M. & Falkus, S. (1997), The Australian Enigma, Chapter submitted for inclusion in the first 'Globe Anthology', Brisbane. Ashkanasy, N. M., Trevor-Roberts, E. & Kennedy, J. (2000), ‘Leadership Attributes and Cultural Values in Australia and New Zealand Compared: An Initial Report Based on GLOBE Data’, International Journal of Organisational Behaviour, vol. 2, no. 3, pp.37-44. Alarape, A. I. & Akinlabi, F. M. (2000), ‘Influence of Perceived Organizational Support and Discretionary Treatment on Work Attitude of Industrial Workers’, African Journal of the Psychological Study of Social Issues, vol. 5, no. 1, pp. 23-36.

211
Aldag, R. & Reschke, W. (1997), ‘Employee Value Added: Measuring Discretionary Effort and Its Value to the Organization’, Centre for Organization Effectiveness, Inc. 608/833-3332, pp. 1-8. Allen, D. G., Shore, L. M. & Griffeth, R. W. (2003), ‘The Role of Perceived Organizational Support and Supportive Human Resource Practices in the Turnover Process’, Journal of Management, vol. 29, no. 1, pp. 99-103. Allen, G. (1998), Supervision, Dallas County Community College, Department of Business Administration and Management, accessed November 11, 2004, from http://www.ollie.dcccd.edu/mgmtl374/book contents/4directing/leadinu/lead.htm Allen, N. J. & Meyer, J. P. (1990), ‘The Measurement and Antecedents of Affective, Continuance and Normative Commitment to the Organization’, Journal of Occupational Psychology, vol.63, no,1, pp. 1-18. Allen, N. J. & Meyer, J. P. (1996), ‘Affective, Continuance, and Normative Commitment to the Organization: An Examination of Construct Validity’, Journal of Vocational Behavior, vol.49, no. 3, pp. 252-276. Altman, D. G. & Bland, J. M. (1998), ‘Statistics Notes: Generalisation and Extrapolation’, British Medical Association: British Medical Journal, vol. 317, no.7155, pp. 409-410. Anderson, J. C. & Gerbing, D. W. (1988), ‘Structure Equation Modeling in Practice: A Review and Recommended Two-Step Approach’, Psychological Bulletin, vol. 103, no. 3, pp. 411-423. Anderson, S. J. (1992), Psychological Type and Leadership, University of Calgary, Department of Educational Policy and Administrative Studies, Calgary, AB. Angle, H. L. & Perry, J. L. (1981), ‘An Empirical Assessment of Organizational Commitment and Organizational Effectiveness’, Administrative Science Quarterly, vol. 26, no. 1, pp.1-14. Arnold, K. A., Turner, N., Barling, J., Kelloway, E. K. & McKee, M. C. (2007), ‘Transformational Leadership and Psychological Well-Being: The Mediating Role of Meaningful Work’, Journal of Occupational Health and Psychology, vol. 12, no. 3, pp. 193-203. Aronsson, G, Gustafsson, K. & Dallner M. (2000), ‘Sick But Yet at Work. An Empirical Study of Sickness Presenteeism’, Journal of Epidemiology and Community Health, vol. 54, pp. 502-509. Aronsson, G. & Gustafsson, K. (2005), ‘Sickness Presenteeism: Prevalence Attendance-Pressure Factors, and an Outline or a Model for Research’, Journal of Occupational and Environmental Medicine, vol. 47, pp. 958-66. Asencio, H. & E. Mujkic (2016), ‘Leadership Behaviors and Trust in Leaders: Evidence from the U.S. Federal Government’, Public Administration Quarterly, vol. 40, no. 1, pp. 156-179.

212
Athey, J. (2009), Absenteeism, Presenteeism, and Keeping the Workplace and Workers Healthy, accessed 15 February 2013, from http://www.hrhero.com/hl/articles/2009/09/01/absenteeism-presenteeism-and-keeping-the-workplace-and-workers-healthy/ Avery, G. & Baker, E. (1990), Psychology at Work, Sydney: Prentice Hall, Australia Pvt Ltd. Avolio, B. J. & Bass, B. M. (1988). ‘Transformational Leadership, Charisma and Beyond’, in Hunt, J. G., Baliga, B. R., Dachler, H. P. & Schriesheim C. A (Eds.), Emerging Leadership Vistas, Lexington, MA, pp. 29-50. Avolio, B. J. & Gardner, W. L. (2005), ‘Authentic Leadership Development: Getting to the Root of Positive forms of Leadership’, Leadership Quarterly, vol.16, vo. 3, pp. 315-338. Avolio, B. J. & Gibbons, T. C. (1988), Developing transformational leaders: A life span approach, in Conger, J. A. & Kanungo, R. N. (Eds.), Charismatic Leadership: The Elusive Factor in Organizational Effectiveness, Jossey-Bass, San Francisco, CA. Avolio, B. J., Gardner, W. L., Walumbwa, F. O., Luthans, F. & May, D. R. (2004), ‘Unlocking the Mask: A Look at the Process by Which Authentic Leaders’ Impact Follower Attitudes and Behavior’, Leadership Quarterly, vol.15, no.6, pp. 801–823. Avolio, B. J., Reichard, R. J., et al. (2009), ‘A Meta-Analytic Review of Leadership Impact Research: Experimental and Quasi-Experimental Studies’, The Leadership Quarterly, vol. 20, no. 5, pp.764-784. Avolio, B. J., Griffith, J., Wernsing, T. S. & Walumbwa, F. O. (2010), ‘What is Authentic Leadership Development?’ in Linley, S., Harrington, & Garcea, N. (Eds.), Oxford Handbook of Positive Psychology and Work, New York, Oxford University Press, NY, pp. 39-51. Avolio, B., Waldman, D. & Yammarino, F. (1991), ‘Leading in the 1990’s: The four I’s of transformational leadership’, Journal of European Industrial Training, vol. 15, no. 4, pp. 9-16. Ayman, R. (2004), ‘Situational and Contingency Approaches to Leadership’, in Antonakis, J. Cianciolo A. T. & Sternberg, R. J. (Eds.), The Nature of Leadership, Thousand Oaks, CA, US, Sage Publications, pp.148-170. Badawy, E. T. & Bassiouny, M. (2014), ‘Employee Engagement as a Mediator between Transformational Leadership and Intention to Quit’, Competition Forum, vol. 12, no. 1, pp. 152-160. Bagozzi, R. P. & Yi, Y. (1988), 'On the Evaluation of Structural Equation Models’ , Journal of the Academy of Marketing Science, vol. 16, no. 1 pp. 74-94. Balfour, D. & Wechsler, B. (1996), ‘Organizational Commitment’, Public Productivity & Management Review, vol. 19, no. 3, pp. 256-277. Balnaves, M. & Caputi, P. (2001), Introduction to Quantitative Research Methods: An Investigative Approach, Sage Publication, London.

213
Barbour, J. D. (2013), ‘Contingency Management and Situational Leadership Theories’, in Irby, B. J., Brown, G. Lara-Alecio, R. & Jackson, S. (Eds.), Handbook of Educational Theories, Charlotte, NC, US, IAP Information Age Publishing, pp. 917-921.
Barling, J., Weber, T. & Kelloway, E. K. (1996), ‘Effects of Transformational Leadership Training on Attitudinal and Financial Outcomes: A Field Experiment’, Journal of Applied Psychology, vol.81, no. 6, pp. 827–832.
Barnes, M., Rhiannon, B., Williams, G., Webb, K. & Aylward, M. (2008), ‘Beliefs about Common Health Problems and Work: A Qualitative Study’, Social Science and Medicine, vol. 67, no. 4, pp. 657-665.
Baron, R. M. & Kenny, D. A. (1986), ‘The Moderator-Mediator Variable Distinction in Social Psychological Research: Conceptual, Strategic, and Statistical Considerations’, Journal of Personality and Social Psychology, vol. 51, no.6, pp.1173-1182.
Barker, C. (2002), The Heart and Sole of Leadership, AIM Books, McGraw Hill, Sydney.
Barrett, P. (2007), ‘Structural Equation Modelling: Adjudging Model Fit’, Personality and Individual Differences, vol. 42, no. 5, pp. 815-824.
Bass, B. (1985), Leadership and Performance beyond Expectation, Free Press, New York.
Bass, B. & Avolio, B. (2000), Multifactor Leadership Questionnaire, Mind Garden, Redwood City, CA.
Bass, B. M. & Avolio, B. J. (1994), Improving Organizational Effectiveness through Transformational Leadership, Sage Publications, Thousand Oaks, CA.
Bass, B. M. & Bass, R. (2008), The Bass Handbook of Leadership, New York: The Free Press.
Bass, B. M. (1990), Bass and Stogdill’s Handbook of Leadership; Theory, Research, and Managerial Applications, Free Press, New York.
Bass, B. M. (2000), ‘The Future of Leadership in Learning Organizations’, Journal of Leadership Studies, vol. 7, no. 3, pp.18-40.
Bass, B. M. & Avolio, B. J. (1990), ‘The Implications of Transactional and Transformational Leadership for Individual, Team, and Organizational Development’, in Woodman, R.W. & Pasmore, W. A. (Eds), Research in Organizational Change and Development, JAI, Greenwich, CT, pp. 231-72.
Bass, B. M., Avolio, B. J., Jung, D. I. & Berson, Y. (2003), ‘Predicting Unit Performance by Assessing Transformational and Transactional Leadership’, Journal of Applied Psychology, vol. 88, no. 2, pp. 207-218.
Bass, B. M. & Riggio, R. E. (2006), Transformational Leadership, Lawrence Erlbaum Associates, Mahwah, N. J.

214
Bass, A. J., Zhu, W., Koh, W. & Bhatia, P. (2004), ‘Transformational Leadership and Organizational Commitment: Mediating Role of Psychological Empowerment and Moderating Role of Structural Distance’, Journal of Organizational Behavior, vol. 25, no.8, pp. 951-968.
Becker, B. & Gerhart, B. (1996), ‘The Impact of Human Resource Management on Organizational Performance: Progress and Prospects, Academy of Management Journal, vol. 39, no. 4, pp. 779-901.
Becker, G. (1975), Human Capital: A Theoretical and Empirical Analysis, with Special Reference to Education, Chicago, University of Chicago Press.
Becker, T. E. (1992), ‘Foci and Bases of Commitment: Are They Distinctions Worth Making?’, Academy of Management Journal, vol. 35, no. 1, pp. 232-244.
Becker, H. S. (1960), ‘Notes on the concept of Commitment’, American Journal of Sociology, vol. 66, no.1, pp. 32-40.
Bedean, P. (2009), ‘Employee Retention Building Organizational Commitment: Recommendations for Non-profit Organizations’, Transylvanian Review of Administrative Sciences, vol. 25, pp. 40-50.
Bedeian, A. G., Kemery, E. R. & Pizzolatto, A. B. (1991), ‘Career Commitment and Expected Utility of Present Job as Predictors of Turnover Intentions and Turnover Behavior’, Journal of Vocational Behavior, vol. 39 no. 3, pp. 331-343.
Beehr, T. A. & Gupta, N. (1978), ‘A Note on the Structure of Employee Withdrawal’, Organizational Behavior and Human Performance, vol. 21, pp.73-79.
Beeri, I., Dayan, R., Gadot, E. V. & Werner, S. B. (2013), ‘Advancing Ethics in Public Organizations: The Impact of an Ethics Program on Employees’ Perceptions and Behaviors in a Regional Council’, Journal of Business Ethics, vol. 112, no. 1, pp. 59-78.
Bennis, W. (1994), On Becoming a Leader, Addison-Wesley, New York.
Benson, G., Finegold, D. & Mohrman, S. (2004), ‘You Paid for the Skills, Now Keep Them: Tuition Reimbursement and Voluntary Turnover’, Academy of Management Journal, vol. 47, no. 3, pp. 315-331.
Bentein, K., Vandenberg, R. J., Vandenberghe, C. & Stinglhamber, F. (2005), ‘The Role of Change in the Relationship Between Commitment and Turnover: A Latent Growth Modeling Approach’, Journal of Applied Psychology, vol. 90,no. 3, 468-482.
Berger, M. L., Howell, R., Nicholson, S. & Sharda, C. (2003), ‘Investing in Healthy Human Capital’, Journal of Occupational and Environmental Medicine, vol. 45, no. 12, pp. 1213-1225.
Bergstrom, G., Bodin, L., Hagberg, J., Aronsson, G., Josephson, M., et al. (2009), ‘Sickness Presenteeism Today, Sickness Absenteeism Tomorrow: A Prospective Study on Sickness
215
Presenteeism and Future Sickness Absenteeism’, Journal of Occupational and Environmental Medicine, vol. 51, no. 6, pp. 629-638.
Berry, M. L. (2010), ‘Predicting Turnover Intent: Examining the Effects of Employee Engagement, Compensation Fairness, Job Satisfaction, and Age’, Unpublished PhD thesis, University of Tennessee, Knoxville, TN.
Berry, W. D. & Feldman, S. (1985), Multiple Regression in Practice. Sage University Paper Series on Quantitative Applications in the Social Sciences, series no. 07-050). Sage Publications, Newbury Park, CA.
Bhattacharya, C. B., Korshun, D. & Sen, S. (2009), ‘Strengthening Stakeholder-Company Relationships Through Mutually Beneficial Corporate Social Responsibility Initiatives’, Journal of Business Ethics, vol. 85, no. 2, pp. 257-272.
Bhattacharya, C. B., Sen, S. & Korshun, D. (2008), ‘Using Corporate Social Responsibility to Win the War For Talent’, MIT Sloan Management Review, vol. 49, no. 2, pp. 37-44.
Bierla, I, Huver, B. & Richard, S. (2013), ‘New Evidence on Absenteeism and Presenteeism’, International Journal of Human Resource Management, vol. 24, no. 7, pp. 1536-1550.
Bing, J. W., Kehrhahn, M. & Short, D. C. (2003), ‘Challenges to the Field of Human Resources Development’, Advances in Developing Human Resources, vol. 5, no. 3, pp. 342-351.
Biron, C., Brun, J. P., Ivers, H. & Cooper, C. (2006), ‘Psychosocial Work Environment and Well-Being Determinants of Presenteeism’, Journal of Public Mental Health, pp. 26-38.
Biron, M. & Boon, C. (2013), ‘Performance and Turnover Intentions: A Social Exchange Perspective’, Journal of Managerial Psychology, vol. 28, no. 5, pp. 511-531.
Bitektine, A. (2008), ‘Prospective Case Study Design: Qualitative Method for Deductive Theory Testing’, Organizational Research Methods, vol. 11, no. 1, pp. 160-180.
Blake, R. R. & Mouton, J. S. (1964), The Managerial Grid: The Key to Leadership Excellence, Gulf Publishing Co., Houston.
Blake, R. R., Shepard, H. A. & Mouton, J. S. (1964), Managing Intergroup Conflict in Industry, Gulf Publishing Co., Houston, Texas.
Blau, G. (2007), ‘Does A Corresponding Set of Variables for Explaining Voluntary Organizational Turnover Transfer to Explaining Voluntary Occupational Turnover?’, Journal of Vocational Behavior, vol. 70, no.1, pp.135-148.
Blau, G. (1988), ‘Testing Generalizability of a Career Commitment and Its Impact on Employee Turnover’, Journal of Vocational Behavior, vol. 35, no. 1, pp. 88-193.
Blau, G. (1994), ‘Testing a Two-Dimensional Measure of Job Search Behavior’, Organizational Behavior and Human Decision Making Processes, no. 59, pp. 288-312.

216
Blau, G. J. & Boal, K. B. (1989), ‘Using Job Involvement and Organizational Commitment Interactively to Predict Turnover’, Journal of Management, vol. 15, no. 1, pp. 115-127.
Blau, G., Tatum, S. D. & Ward-Cook, K. (2003), ‘Correlates of Professional versus Organizational Withdrawal Cognitions’, Journal of Vocational Behaviour, vol. 63, pp.72- 85.
Blau, P. M. (1964), Exchange and Power in Social Life, Wiley, New York: NY.
Bluedorn, A. C. (1982), ‘A Unified Model of Turnover from Organizations’, Human Relations, vol. 35, pp. 135-153.
Blegen, N. E. & Severinsson, E. (2011), ‘Leadership and Management in Mental Health Nursing’, Journal of Nursing Management, vol. 19, no. 4, pp. 487-497.
BlessingWhite (2008), The State of Employee Engagement 2008 Asia Pacific Overview. Princeton, NJ BlessingWhite, Inc., accessed 11 November 2013, from http://www.blessingwhite.com/%5CContent%5CReports%5C2008EmployeeEngagementAPO V.pdf
Blomme, R. J., van Rheede, A. & Tromp, D. M. (2010), ‘The Use of The Psychological Contract to Explain Turnover Intentions in the Hospitality Industry: A Research Study on the Impact of Gender on the Turnover Intentions of Highly Educated Employees’, International Journal of Human Resource Management, vol. 21, no. 1, pp. 144-162.
Bluedom, A. C. (1982a), ‘The Theories of Turnover: Causes, Effects and Meaning’, Research in the Sociology of Organizations, vol. 1, pp. 75-128.
Bluedom, A. C. (1982b), ‘A Unified Model of Turnover from Organizations’, Human Relations, vol. 35, no. 2, pp. 135-153.
Blunch, N. J. (2013), Introduction to Structural Equation Modeling Using IBM SPSS Statistics and AMOS, Sage Publications. London.
Blunch, N. J. (2008), Introduction to Structural Equation Modelling Using SPSS and AMOS, Sage Publications. London.
Bockerman, P. & Laukkanen, E. (2009), ‘Presenteeism in Finland: Determinants by Gender and the Sector of Economy’, Ege Academic Review, vol. 9, no. 3, pp. 1007-1016.
Boles, M, Pelletier, B. & Lynch, W. (2004), ‘The Relationship between Health Risks and Work Productivity’, Journal of Occupational and Environmental Medicine, vol. 46, no. 7, pp. 737–745.
Bollen, K. A. (1989), Structural Equations with Latent Variables, New York: Wiley.
Bollen, K. A. & Long, J. S. (1993), Testing Structural Equation Models, Sage Publications, Newbury Park, CA.
Book, E. W. (1998), ‘Leadership for the Millennium’, Working Woman, vol. 3, pp. 29-33.

217
Borgatta, E. F., Bales, R. F. & Couch, A. S. (1954), ‘Some Findings Relevant to the Great Man Theory of Leadership’, American Sociological Review, vol. 19, no. 6, pp. 755-759.
Bowling, A. (2002), Research Methods in Health, Buckingham: Open University Press.
Brickman, P., Janoff-Bullman, R. & Rabinowitz, V. C. (1987), ‘Meaning and Value’, in Wortman, C. B. & Sorrentino, R. (Eds.), Commitment, Conflict, and Caring, Prentice Hall, Englewood Cliffs, NJ, pp. 59-105.
Brien, A., Thomas, N. & Hussein, A. (2015), ‘Turnover Intention and Commitment as Part of Organizational Social Capital in the Hotel Industry’, Journal of Human Resources in Hospitality & Tourism, vol. 14, no. 4, pp. 357-381.
Brooks, A., Hagen, S. E., Sudhakar, M. S., Sathyanarayanan, S., Schultz, A. B. & Edington, D. W. (2010), ‘Presenteeism: Critical issues’, Journal of Occupational Medicine, vol.52, no. 11, pp. 1055-1067.
Brough, P. & Frame, R. (2004), ‘Predicting Police Job Satisfaction and Turnover Intentions: The Role of Social Support and Police Organizational Variables’, New Zealand Journal of Psychology, vol. 33,no. 1, pp. 8-16.
Brown, M. E. & Trevino, L. K. (2006), ‘Ethical Leadership: A Review and Future Directions’, Leadership Quarterly, vol. 17, no.6, pp. 595-616.
Brown, M. E., Trevino, L. K. & Harrison, D. A. (2005), ‘Ethical leadership: A Social Learning Perspective for Construct Development and Testing’, Organizational Behaviour and Human Decision Processes, vol. 97, no. 2, pp.117-134.
Brown, R. (1986), Attribution Theory, Social Psychology, New York, NY: Free Press, pp. 131-194.
Brown, S. & Sessions, J. (2004), ‘Absenteeism, Presenteeism and Shirking’, Economic Issues, vol. 9, no. 1, pp. 15-21.
Bryman, A. (1992), Charisma and Leadership in Organizations, Sage Publications, London.
Burnett, J. L. & Williams, L. J. (2005), ‘Structural Equation Modeling (SEM): An Introduction to Basic Techniques and Advanced Issues’, in Swanson, R. A. & Holton, E. (Eds.), Research in Organizations: Principles and Methods of Inquiry, Berrett-Koehler, San Francisco, pp. 143-160.
Brunetto, Y., Farr-Wharton, R. & Shacklock, K. (2010), ‘The Impact of Supervisor-Subordinate Relationships on Public and Private Sector Nurses’ Commitment’, Human Resource Management Journal, vol. 20, no.2, pp. 206-225.
Brunetto, Y., Xerri, M., Shriberg, A., Farr-Wharton, R., Shacklock, K., Newman, S. & Dienger, J. (2013), ‘The Impact of Workplace Relationships on Engagement, Well-Being, Commitment and Turnover for Nurses in Australia and the USA’, Journal of Advanced Nursing, vol. 69, no. 12, pp. 2786-2799.

218
Burns, J. M. (2003), Transforming Leadership: A New Pursuit of Happiness, Atlantic Monthly Press, New York.
Burns, A. C. & Bush, R. F. (2006), Marketing Research, Prentice Hall, Englewood Cliffs, N.J.
Burns, J. M. (1978), Leadership, Harper & Row, New York.
Burton, W. N., Conti, D. J., Chen, C. Y., Schultz, A. B. & Edington, D. W. (1999), ‘The Role of Health Risk Factors and Disease on Worker Productivity’, Journal of Occupational and Environmental Medicine, vol. 41, no. 10, pp. 863-877.
Burton, W., Chen, C. Y., Conti, D. J. et al. (2004), ‘Caregiving for ill Dependents and its association with Employee Health Risks and Productivity’, Journal of Occupational and Environmental Medicine, vol. 46, no.10, pp. 1048-1056.
Burton, W., Chen, C. Y., Conti, D. J., Schultz, A. B. & Edington, D. W. (2006), ‘The Association between Health Risk Change and Presenteeism Change’, Journal of Occupational and Environmental Medicine, vol. 48, no. 3, pp. 252-263.
Byrne, B. M. (2001), Structural Equation Modeling with Amos: Basic Concepts, Applications, and Programming, Lawrence Erlbaum Associates, Mahwah, New Jersey.
Byrne, B. M. (2010), Structural Equation Modeling with AMOS: Basic Concepts, Applications, and Programming, Taylor & Francis Group, LLC, New York.
Byrne, S. Z. (2005), ‘Fairness Reduces the Negative Effects of Organizational Politics on Turnover Intentions, Citizenship Behavior and Job Performance’, Journal of Business and Psychology, vol. 20, no. 2, pp. 175-200.
Caldwell, D. F., Chatman, J. A. & O’Reilly, C. A. (1990), ‘Building Organizational Commitment: A Multi-firm Study’, Journal of Occupational Psychology, vol. 63, no. 3, pp. 245-261.
Caligiuri, P., Mencin, A. & Jiang, K. (2013), ‘Win–win–win: The Influence of Company-Sponsored Volunteerism Programs on Employees, NGOs, and Business Units’, Personnel Psychology, vol. 66, pp. 825-860.
Cameron, K. (2011), ‘Responsible Leadership as Virtuous Leadership’, Journal of Business Ethics, vol. 98, no. 1, pp. 25-35.
Campbell, J. L. (2007), ‘Why Would Corporations Behave in Socially Responsible Ways? An Institutional Theory of Corporate Social Responsibility’, Academy of Management Review, vol. 82, pp. 946-967.
Campbell, J. P. (1977), ‘On The Natural of Organizational Effectiveness’, in Goodman, P.S.& Pennings, J. M. (Eds.), New Perspectives on Organizational Effectiveness, Jossey-Bass, San Francisco, CA, vol. 2, pp.13-55.

219
Canfield, G. W. & Soash, D. G. (1955), ‘Presenteeism- A Constructive View’, Industrial Medicine and Surgery, vol. 24, no.9, pp. 417-418.
Carmeli, A. & Weisberg, J. (2006), ‘Exploring Turnover Intentions among Three Professional Groups of Employees’, Human Resource Development International, vol. 9, no. 2, pp. 191-206.
Carroll, B., Levy, L. & Richmond, D. (2008), ‘Leadership as Practice: Challenging the Competency Paradigm’, Leadership, vol. 4, no. 4, pp. 363-379.
Caverley, N., Cunningham, J. B. & MacGregor, J. N. (2007), ‘Sickness Presenteeism, Sickness Absenteeism, and Health following Restructuring in a Public Service Organization,’ Journal of Management Studies, vol. 44, no. 2, pp. 304-319.
Casale, J. (2008), ‘Employers Face Worker “presenteeism”’, Business Insurance, vol. 42, no. 36, p. 35.
Cacioppe, R. (1997), ‘Leadership Moment by Moment!’, Leadership & Organizational Development Journal, vol.17, no. 7, pp. 335-345.
CCH Incorporated (2003), ‘Unscheduled Employee Absenteeism Hits Lowest Point in CCH Survey History’, Human Resources Management and Trends, no. 569, pp. 155-164.
Cerit, Y. (2010), ‘The Effects of Servant Leadership on Teachers’ Organizational Commitment in Primary Schools in Turkey’, International Journal of Leadership in Education, vol. 13, no. 3, pp 301-317.
Chapman, L. S. (2005), ‘Presenteeism and Its Role in Worksite Health Promotion’, American Journal of Health Promotion, vol. 19, no. 4, pp. 1-8.
Choi, S. Y. (2014), ‘The Effects of Leadership on Social Workers' Organizational Commitment: Focusing on Ethical Leadership, Organizational Trust, and Supervisor Trust’, Information (Japan), vol. 17, no. 10, pp. 4771-4778.
Christensen, L. J., Mackey, A. & Whetten, D. (2014), ‘Taking Responsibility for Corporate Responsibility: The Role of Leaders in Creating, Implementing, Sustaining, or Avoiding Socially Responsible Firm Behaviors’, Academy of Management Perspectives, vol. 28, no. 2, pp. 164-178.
Christian, J. & Ellis, A. (2014), ‘The Crucial role of Turnover Intentions in Transforming Moral Disengagement into Deviant Behavior at Work’, Journal of Business Ethics, vol. 119, no. 2, pp. 193-208.
Cicei, C. C., Mohorea, L. & Teodoru, A. A. (2013), ‘Investigating Two Predictors of Sickness Presenteeism on a Romanian Sample: The Case of Performance-Based Self-Esteem and Overcommitment’, Procedia - Social and Behavioral Sciences, vol. 78, pp. 325-329.
Ciulla, J. B. (2006), ‘Ethics: The Heart of Leadership’, in Maak, T. & Pless, N. M. (Eds.), Responsible Leadership, Routledge London, New York, pp. 17-32.

220
Clark, K. E. & Clark, M. B. (1990), Measures of Leadership, Center for Creative Leadership, Greensboro, NC.
Clarkson, M. B. (1995), ‘A Stakeholder Framework for Analyzing and Evaluating Corporate Social Performance’, Academy of Management Review, vol. 20, no. 1, pp. 92-117.
Cohen, A. (1993), ‘Organizational Commitment and Turnover: A Meta-Analysis’, Academy of Management Journal, vol. 36, no. 5, pp. 1140-1150.
Cohen, J. (1990), ‘Things I have Learned (so far)’, American Psychologist, vol. 45, no. 12, pp.1304‐1312.
Cohen, J. (1992), ‘A Power Primer’, Psychological Bulletin, vol. 12, no. 1, pp. 155‐159.
Cohen, A. & Golan, R. (2007), ‘Predicting Absenteeism and Turnover Intentions by Past Absenteeism and Work Attitudes’, Career Development International, vol. 12, no. 5, pp. 416-432.
Collins, J. J., Baase, C. M., Sharda, C. E., Ozminkowski, R. J., Nicholson, S., Billotti, G. M., et al. (2005), ‘The Assessment of Chronic Health Conditions on Work Performance, Absence, and Total Economic Impact for Employers’, Journal of Occupational and Environmental Medicine, vol. 47, no. 6, pp. 547-557.
Collins, J. C. & Porras, J. (1994), Built to Last: Successful Habits of Visionary Companies, Harper Business, New York.
Cooper, C. L. (1994), ‘The costs of healthy work organizations’, in Cooper, C. L. & Williams S. (Eds.), Creating Healthy Work Organizations, Wiley, Chichester, England, pp. 1-5.
Cooper, C. L (2011), Presenteeism is More Costly than Absenteeism, accessed 24 April 2013, from http://www.hrmagazine.co.uk/hro/features/1019355/presenteeism-costly-absenteeism
Cooper, D. R. & Schindler, P. S. (2006), Business Research Methods, New York: McGraw-Hill Irwin.
Cotton, J. L. & Tuttle, J. M. (1986), ‘Employee Turnover: A Meta-Analysis and Review with Implications for Research’, Academy of Management Review, vol. 11, no. 1, pp.55–70.
Coverdale, S. & Terborg, J. R. (1980), ‘A Re-Examination of the Mobley, Horner, and Hollingsworth Model of Turnover: A Useful Replication’, Paper presented at the 40th annual meeting of the Academy of Management, Detroit.
Covey, S. R. (1989), The Seven Habits of Highly Effective People: Restoring the Character Ethic, New York: Simon and Schuster.
Covner, B. J. (1950), ‘Management Factors Affecting Absenteeism’, Harvard Business Review, vol. 28 (5), 42-48.

221
Crane, A. & Matten, D. (2007), Business Ethics: Managing Corporate Citizenship and Sustainability in the Age of Globalization, Oxford University Press, Oxford, UK.
Creswell, J. W. (2005), Educational Research: Planning, Conducting, and Evaluating Quantitative and Qualitative Research, Upper Saddle River, Pearson, NJ.
Creswell, J. W. (2003), Research Design, Qualitative, Quantitative and mixed Methods Approaches, Sage Publications, Thousand Oaks, CA.
Cronbach, L. & Meehl, P. (1955), ‘Construct Validity in Psychological Tests’, Psychological Bulletin, vol. 52, no. 4, pp. 281-302.
Cropanzano, R. & Mitchell, M. S. (2005), ‘Social Exchange Theory: An Interdisciplinary Review’, Journal of Management, vol. 31 no. 6, pp. 874-900.
Crowley, S. L. & Xitao, F. (1997), 'Structural Equation Modeling: Basic Concepts and Applications in Personality Assessment Research’, Journal of Personality Assessment, vol. 68, no. 3, pp. 508-531.
Crumpton, A. D. (2011), An Exploration of Spirituality within Leadership Studies Literature, accessed 22 June 2013, from http://www.inter-disciplinary.net/wpcontent/uploads/2011/02/Crumpton-paper.pdf.
Cummings, G. G., MacGregor, T., Davey, M., Lee, H. P., Wong, C., Lo, E., Muise, M. & Stafford, E. (2010), ‘Leadership Styles and Outcome Patterns for the Nursing Workforce and Work Environments: A Systematic Review’, International Journal of Nursing Studies, vol. 47, no. 3, pp.363-385.
D'Abate, C. & Eddy, E. (2007), ‘Engaging In Personal Business on the Job: Extending the Presenteeism Construct’, Human Resource Development Quarterly, vol. 18, no. 3, pp. 361-383.
Dalgıç, G. (2014), ‘A meta-analysis: Exploring the effects of gender on organisational commitment of teachers’, Issues in Educational Research, vol. 24, no. 2, pp. 133-151.
D'Amato, A., Henderson, S. & Florence, S. (2009), Corporate Social Responsibility and Sustainable Business: A Guide to Leadership Tasks and Functions, Center for Creative Leadership, Greensboro, NC, USA.
Dansereau, F., Seitz, S. R., et al. (2013), ‘What Makes Leadership, Leadership? Using Self-Expansion Theory to Integrate Traditional and Contemporary Approaches’, The Leadership Quarterly, vol. 24, no. 6, pp. 798-821.
Davis, G. F. (2005), ‘New Directions in Corporate Governance’, Annual Review of Sociology, vol. 31, no. 1, pp. 143-162.
Day, D. V., Harrison, M. M. & Halpin, S. M. (2009), An Integrative Approach to Leader Development: Connecting Adult Development, Identity, And Expertise, Routledge, New York.
De Vaus, A. D. (1995), Surveys in Social Research, Allen & Unwin, Melbourne, Victoria.

222
De Vaus, A. D. (2002), Surveys in Social Research, Allen and Unwin, St. Leonards, NSW.
DeConinck, J. B. & Stilwell, C. D. (1997), ‘Incorporating Organizational Justice, Role States, Pay Satisfaction and Supervisor Satisfaction in a Model of Turnover Intentions’, Journal of Business Research, vol. 57, pp. 225-231.
Dellve, L., Hadzibajramovic, E. & Ahlborg, G., Jr. (2011), ‘Work Attendance among Healthcare Workers: Prevalence, Incentives, and Long-Term Consequences for Health and Performance’, Journal of Advanced Nursing, vol. 67, no. 9, pp. 1918-1929.
Demirtas, O. & Akdogan, A. (2015), ‘The Effect of Ethical Leadership Behavior on Ethical Climate, Turnover Intention, and Affective Commitment’, Journal of Business Ethics, vol. 130, no. 1, pp. 59-67.
Denis, J. L., Langley, A. & Rouleau, L. (2010), ‘The Practice of Leadership in The Messy World of Organizations’, Leadership Journal, vol. 6, no. 1, pp. 67-88.
Denison, D. R., Hooijberg, R. & Quinn, R. E. (1995), ‘Paradox and Performance: Toward a Theory of Behavioral Complexity in Managerial Leadership’, Institute for Operations Research and the Management Sciences, vol. 5, pp. 524-540.
DePree, M. (1989), Leadership is an Art, Doubleday, New York.
Derycke, H., Vlerick, P., Burnay, N., Declaire, C., D'Hoore, W., Hasselhorn, H., et al. (2010), ‘Impact of The Effort-Reward Imbalance Model on Intent to Leave Among Belgian Health Care Workers; A Prospective Study’, Journal of Occupational and Organizational Psychology, vol. 83, no. 4, pp. 879-893.
Dess, G. G. & Shaw, J. D. (2001), ‘Voluntary Turnover, Social Capital and Organizational Performance’, Academy of Management Review, no.26, no.3, pp. 466-456.
Dew, K., Keefe, V. & Small, K. (2005), ‘Choosing' to Work When Sick: Workplace Presenteeism’, Social Science & Medicine, vol. 60, no. 10, pp. 2273-2282.
Diamantopoulos, A. & Siguaw, J. A. (2000), ‘Introducing LISREL: A Guide for the Uninitiated, Sage Publications’, London. Directions in Psychological Science, vol. 18, no. 1, pp. 16-20.
Diddams, M. & Chang, G. C. (2012), ‘Only Human: Exploring the Nature of Weakness in Authentic Leadership’, Leadership Quarterly, vol. 23, no. 3, pp. 593-603.
Diener, E. (2000), ‘Subjective Well-Being: The Science of Happiness and a Proposal for a National Index’, American Psychologist, no. 55, pp. 34-43.
Diener, E. (2006), ‘Guidelines for National Indicators of Subjective Well-Being and Ill-Being’, Applied Research in Quality of Life, vol. 1, pp. 151-157.
Diggle, P. J., Heagerty, P. J., Liang, K. Y. & Zeger, S. L. (2002), Analysis of Longitudinal Data, Oxford University Press, Oxford, UK.

223
Ding, L., Velicer, W. F. & Harlow, L. L. (1995), ‘Effects of Estimation Methods, Number of Indicators per Factor and Improper Solutions on Structural Equation Modeling Fit Indices’, Structural Equation Modeling, vol. 2, no. 2, pp. 119-143.
Dinh, J. E., Lord, R. G., et al. (2014), ‘Leadership Theory and Research in the New Millennium: Current Theoretical Trends and Changing Perspectives’, The Leadership Quarterly, vol. 25, no. 1, pp. 36-62.
Dixon, D. L. (1998), ‘The Balanced CEO: A Transformational Leader and a Capable Manager’, Health Forum Journal, vol. 41, no. 2, pp. 26-29.
Doh, J., Stumpf, S. & Tymon, W (2011), ‘Responsible Leadership Helps Retain Talent in India’, Journal of Business Ethics, vol. 98, no.1, pp. 85-100.
Doh, J. P. & Quigley, N. R. (2014), ‘Responsible Leadership and Stakeholder Management: Influence Pathways and Organizational Outcomes’, Academy of Management Perspectives, vol. 28, no. 3, pp. 255-274.
Doh, J. P. & Stumpf, S. A. (2005), Handbook on Responsible Leadership and Governance in Global Business, Edward Elgar, Northampton, MA.
Donaldson, T. & Preston, L. (1995), ‘The Stakeholder Theory of the Corporation: Concepts, Evidence, and Implications’, Academy of Management Review, vol. 20, no. 1, pp. 65-91.
Donnelly, J. H. & Ivancevich, J. M. (1975), ‘Role Clarity and the Salesman’, Journal of Marketing, vol. 39, no.1, pp.71-74.
Douglas, R. W. (1996), ‘Responsibility in Leadership’, Credit World, vol. 85, no. 1, p. 33.
Dragano, N., Ying, H., Moebus, S., Jokel, K., Erbel, R. & Siegrist, J. (2008), ‘Two Models of Job Stress and Depressive Symptoms: Results from a Population-Based Study’, Social Psychiatry and Psychiatric Epidemiology, vol. 43, no. 3, pp. 72-78.
Edmondson, A. C. (1999), ‘Psychological Safety and Learning Behavior in Work Teams’, Administrative Science Quarterly, vol. 44, no. 2, pp. 350-383.
Egan, T. M., Yang, B. & Bartlett, K. R. (2004), ‘The Effects of Organizational Learning Culture and Job Satisfaction on Motivation to Transfer Learning and Turnover Intention’, Human Resource Development Quarterly, vol. 15, no. 3, pp. 279-301.
Eisenberger, R., Cummings, J., Armeli, S. & Lynch, P. (1997), ‘Perceived Organizational Support, Discretionary Treatment, and Job Satisfaction’, Journal of Applied Psychology, vol. 52, no. 5, pp. 812-820.
Eisenberger, R., Huntington, R., Hutchison, S. & Sowa, D. (1986), ‘Perceived organizational Support’, Journal of Applied Psychology, vol. 71, no. 3, pp. 500-507.
Eisenhardt, K. M. & Graebner, M. E. (2007), ‘Theory Building from Cases: Opportunities and Challenges’, The Academy of Management Journal, vol. 50, no. 1, pp. 25-32.

224
Ekmekci, A. K. (2011), ‘A Study on Involvement and Commitment of Employees in Turkey’, Journal of Public Administration and Policy Research, vol. 3, no. 3, pp. 68-73.
Elçi, M., Şener, İ., Aksoy, S., et al. (2012), ‘The Impact of Ethical Leadership and Leadership Effectiveness on Employees’ Turnover Intention: The Mediating Role of Work Related Stress’, Procedia - Social and Behavioral Sciences, vol.58, pp. 289-297.
Elstad, J. I. & Vabø, M. (2008), ‘Job Stress, Sickness Absence and Sickness Presenteeism in Nordic Elderly Care’, Scandinavian Journal of Public Health, vol. 36, no. 5, pp.467–474
Ensley, M., Hmieleski, K. & Pearce, C. (2006), ‘The Importance of Vertical and Shared Leadership Within New Venture Top Management Teams: Implications For The Performance Of Startups’, Leadership Quarterly, vol. 17, no. 3, pp. 217-231.
Erdheim, J, Wang, M. & Zickar, M. J. (2006), ‘Linking the Big Five personality constructs to organizational commitment’, Personality and Individual Differences, vol. 41, no. 5, pp. 959-970.
Etzion, D., Eden, D. & Lapidot, Y. (1998), ‘Relief from Job Stressors and Burnout: Reserve Service as a Respite’, Journal of Applied Psychology, vol. 83, no. 4, 577-585.
Evans, C. (2004), ‘Health and Work Productivity Assessment: State of the Art or State of Flux?’, Journal of Occupational and Environmental Medicine, vol. 46, no. 1, pp. 3-11.
Faloye, D. O. (2014), ‘Organisational Commitment and Turnover Intentions: Evidence from Nigerian Paramilitary Organisation’, International Journal of Business & Economic Development, vol. 2, no. 3, pp. 23-34.
Fernando, M. (2016), Leading Responsibly in the Asian Century, Cham, [Ger.]: Springer, [2016]. UOW Catalogue, EBSCOhost (accessed February 2, 2016).
Farrugia, P., Petrisor, B. A., Farrokhyar, F. & Bhandari, M. (2010), ‘Research Questions, Hypotheses and Objectives’, Canadian Journal of Surgery, vol. 53, no. 4, pp. 278-281.
Fiedler, F. (1961), ‘Leadership and Leadership Effectiveness Traits: A Reconceptualisation of the Leadership Trait Problem’, in Porter, D. A. P. (Eds), Studies in Organisational Behaviour and Management, Pennsylvania: International Textbook.
Fiedler, F. E. (1964), ‘A Contingency Model of Leadership Effectiveness’, in Berkowitz, L. (Eds.), Advances in Experimental Social Psychology, New York: Academic Press, pp. 149-190.
Fiedler, F. E. (1971), ‘Validation and Extension of the Contingency Model of Leadership Effectiveness: A Review of Empirical Findings’, Psychological Bulletin, vol. 76, no. 2, pp. 128-148.
Fiedler, F. E. (1978), ‘The Contingency Model and the Dynamics of the Leadership Process’, in Berkowitz, L. (Eds.), Advances in Experimental Social Psychology, vol. 11, Academic Press, New York.

225
Fiedler, F. E. & Garcia, J. E. (1987), New Approaches to Leadership: Cognitive Resources and Organizational Performance, Wiley, NY.
Filatotchev, I. (2012), ‘Corporate Governance Issues in Competitive Strategy Research’, in Dagnino, G. (Ed.), Handbook of Research on Competitive Strategy, Edward Elgar, Cheltenham, UK, pp. 300-324.
Fink, A. (2006), How to Conduct Surveys, Sage Publications, Thousand Oaks, CA.
Fishbein, M. (1967), ‘Attitude and the Predictions of Behaviors’, in Fishbein, M. (Eds.), Readings in AttitudeTheory and Measurement, Wiley, New York.
Fishbein, M. & Ajzen, I. (1975), Belief, Attitude, Intention and Behavior: An Introduction to Theory and Research, Reading, MA, Addison-Wesley.
Foong-ming, T. (2008), ‘Linking Career Development Practices to Turnover Intention: The Mediator of Perceived Organizational Support’, Journal of Business and Public Affairs, vol. 2 no. 1, pp. 1-20.
Fournier, C., Tanner, J. F., Chonko, L. B. & Manolis, C. (2010), ‘The Moderating Role of Ethical Climate on Salesperson Propensity to Leave’, Journal of Personal Selling & Sales Management, vol. 30, no.1, pp. 7-22.
Fox, S. R. & Fallon, B. J. (2003), ‘Modeling the Effect of Work/Life Balance on Job Satisfaction and Turnover Intentions’, Symposium paper presented at the 5th Australian Industrial and Organisational Psychology Conference, Melbourne, Australia.
Freeman, R. E. (1984), Strategic Management: A Stakeholder Approach, Boston, MA: Pitman.
Freeman, R. E. & Auster, E. R. (2011), ‘Values, Authenticity, and Responsible Leadership’, Journal of Business Ethics, vol. 98, no. 1, pp. 15-23.
Freeman, R. E., Wicks, A. C. & Parmar, B. (2004), ‘Stakeholder Theory and ‘The Corporate Objective Revisited’’, Organization Science, vol. 15, no.3, pp. 364-369.
Freeman, R. E., Harrison, J. S. & Wicks, A. C. (2007), Managing for Stakeholders: Survival, Reputation, and Success, Yale University Press, New Haven.
Fry, L. W. (2003), ‘Toward a Theory of Spiritual Leadership’, Leadership Quarterly, vol. 14, no.6, pp. 693-727.
Fu, H., Li, Y. & Duan, Y. (2014), ‘Does Employee-Perceived Reputation Contribute to Citizenship Behavior? The Mediating Role of Organizational Commitment’, International Journal of Contemporary Hospitality Management, vol. 26, no. 4, pp. 593-609.
Gardner, J. W. (1990), On Leadership, Free Press, New York.

226
Gardner, W. L., Avolio, B. J., Luthans, F., May, D. R. & Walumba, F. O. (2005), ‘Can You See the Real Me? A Self-Based Model of Authentic Leader and Follower Development’, Leadership Quarterly, vol. 16, no. 3, pp. 343-372.
Garrido-Moreno A., Lockett, N. & García-Morales, V. (2014), ‘Paving the Way for CRM Success: The Mediating Role of Knowledge Management and Organizational Commitment’, Information & Management, vol. 51, no. 8, pp. 1031-1042.
Garson, D. (2011), Testing of Assumptions, accessed 7 January 2013, http://faculty.chass.ncsu.edu/garson/PA765/assumpt.htm#normal
Garver, M. S. & Mentzer, J. T. (1999), 'Logistics Research Methods: Employing Structural Equation Modeling to Test for Construct Validity', Journal of Business Logistics Volume, vol. 20, no. 1, pp. 33-57.
Gavin, J. F. & Kelley R. F. (1978), ‘The Psychological Climate and Reported Well-Bring of Underground Miners: An Exploratory Study’, Human Relations, vol. 31, no. 7, pp.567-581.
Gellatly, I. R. (1995), ‘Individual and Group Determinants of Employee Absenteeism: Test of A Casual Model’, Journal of Organizational Behavior, vol. 16, pp. 469-485.
George, D. & Mallery, P. (2003), SPSS for Windows Step by Step: A Simple Guide and Reference, Allyn & Bacon, Boston.
Gilbreath, B. & Benson, P. (2004), ‘The Contribution of Supervisor Behaviour to Employee Psychological Well-Being’, Work & Stress, vol. 18, no. 3, pp. 255-266.
Gilbreath, B. & Karimi, L. (2012), ‘Supervisor Behavior and Employee Presenteeism’, International Journal of Leadership Studies, vol. 7, no. 1, pp.114-131.
Gill, A., Mathur, N., Sharma, S. P. & Bhutani, S. (2011), ‘The Effects of Empowerment and Transformational Leadership on Employee Intentions to Quit: A Study of Restaurant Workers in India’, International Journal of Management, vol. 28, no.1, no. 2, pp.217-229.
Gillet, N. & Vandenberghe, C. (2014), ‘Transformational Leadership and Organizational Commitment: The Mediating Role of Job Characteristics’, Human Resource Development Quarterly, vol. 25, no. 3, pp. 321-347.
Godin, I. & Kittel, F. (2004), ‘Differential Economic Stability and Psychosocial Stress at Work: Associations with Psychosomatic Complaints and Absenteeism’, Social Science & Medicine, vol. 58, no. 8, pp. 1543-1553.
Goetzel, R. Z., Long, S. R., Ozminkowski, R. J., Hawkins, K, Wang, S. & Lynch, W. (2004), ‘Health, Absence, Disability, and Presenteeism Cost Estimates of Certain Physical and Mental Health Conditions Affecting U.S. Employers’, Journal Of Occupational Environmental Medicine, vol. 46, no. 4, pp. 398-412.
Goetzel, R. Z., Hawkins, K., Ozminkowski, R. J. & Wang, S. (2003), ‘The Health and Productivity Cost Burden of the “Top 10” Physical and Mental Health Conditions Affecting

227
Six Large U.S. Employers in 1999’, Journal of Occupational and Environmental Medicine, vol. 45, no. 1, pp. 5-14.
Gokce, B., Guney, S. & Katrinli, A (2014), ‘Does Doctors' Perception of Hospital Leadership Style and Organizational Culture Influence their Organizational Commitment?’, Social Behavior & Personality: An International Journal, vol. 42, no. 9, pp. 1549-1561.
Gomes, D. R. (2009), ‘Organizational Change and Job Satisfaction: The Mediating Role of Organizational Commitment’, Exedra, vol. 1, pp. 177-196.
Gond, J., Igalens, J., Swaen, V. & Akremi, A. E. (2011), ‘The Human Resources Contribution to Responsible Leadership: An Exploration of the CSR-HR Interface’, Journal of Business Ethics, vol. 98, no. 1, pp. 115-132.
Good, L. K., Page, T. J. & Young, C. E. (1996), ‘Assessing Hierarchical Differences in Job-Related Attitudes and Turnover Among Retail Managers’, Journal of the Academy of Marketing Science, vol. 24, no. 2, pp. 148-156.
Googins, B. K., Mirvis, P. H. & Rochlin, S. A. (2007), Beyond Good Company: Next Generation Corporate Citizenship, Palgrave Macmillan, New York.
Gosselin, L. Lemyre, & Corneil, W. (2013), ‘Presenteeism and Absenteeism: Differentiated Understanding of Related Phenomena’, Journal of Occupational Health Psychology, vol. 18, no. 1, pp. 75-86.
Grace, J. B. (2006), Structural Equation Modeling and Natural Systems, Cambridge University Press, Cambridge.
Graen, G. B. (1976), Role-making Processes within Complex Organizations, in Dunnette, M. D. (Eds.), Handbook of Industrial and Organizational Psychology, pp. 1201–1245, Rand McNally. Chicago, IL.
Graf, E., Cignacco, E., Zimmermann, K. & Zúñiga, F. (2015), ‘Affective Organizational Commitment in Swiss Nursing Homes: A Cross-Sectional Study’, The Gerontologist, pp. 1-15.
Grawitch, M. J. & Barber, L. K. (2010), ‘Work Flexibility or Nonwork Support? Theoretical and Empirical Distinctions for Work-Life Initiatives’, Consulting Psychology Journal: Practice and Research, vol. 62, no. 3, pp. 169-188.
Grawitch, M. J., Trares, S. & Kohler, J. M. (2007), ‘Healthy Workplace Practices and Employee Outcomes’, International Journal of Stress Management, vol. 14, no. 3, pp. 275-293.
Green, A. E., Miller, E. A. & Aarons, G. (2013), ‘Transformational Leadership Moderates the Relationship Between Emotional Exhaustion and Turnover Intention Among Community Mental Health Providers’, Community Mental Health Journal, vol. 49, no. 4, pp. 373-379.

228
Green, F., Felstead, A., Mayhew, K. & Pack, A. (2000), ‘The Impact of Training on Labour Mobility: Individual and Firm Level Evidence from Britain’, British Journal of Industrial Relations, vol. 38 no. 2, pp. 261-275.
Greenberg, J. & Baron, A. B. (2003), Behavior in Organizations, Upper Saddle River, Prentice Hall, NJ.
Greenhalgh, T. & Taylor, R. (1997), ‘Papers that go Beyond Numbers (qualitative research)’, British Medical Journal, vol. 315, no. 7110, pp. 740-743.
Greenleaf, R. K. (2002), Servant-leadership: A Journey into the Nature of Legitimate Power and Greatness, Mahwah, Paulist Press, NJ.
Greenleaf, R. K. (1977), Servant Leadership: A Journey into the Nature of Legitimate Power and Greatness, Mahwah, Paulist Press, NJ.
Griep, R., Lucia, R., Chor, D., Toivanen, S. & Landsbergis, P. (2010), ‘Beyond Simple Approaches to Studying the Association between Work Characteristics and Absenteeism: Combining the DCS and ERI Models’, Work & Stress, vol. 24, no. 2, pp. 179-195.
Griffeth, R. W., Hom, P. W. & Gaertner, S. (2000), ‘A Meta-Analysis of Antecedents and Correlates of Employee Turnover: Update, Moderator Tests, and Research Implications for the Next Millennium’, Journal of Management, vol. 26, no.3, pp. 463-488.
Grimm, L. G. & Yarnold, P. R. (2000), Reading and Understanding More Multivariate Statistics, Washington DC: American Psychological Association.
Grinyer, A. & Singleton, V. (2000), ‘Sickness Absence as Risk-Taking Behaviour: A Study of Organizational and Cultural Factors in the Public Sector’, Health, Risk and Society, vol. 2, no. 1, pp. 7-21.
Groat, L. &. Wang, D. (2002), Architectural Research Methods, John Wiley & Sons Inc., New York.
Grojean, M. W., Resick, C. J., Dickson M. W. & Smith, D. B. (2004), ‘Leaders, Values, and Organizational Climate: Examining Leadership Strategies for Establishing an Organizational Climate Regarding Ethics’, Journal of Business Ethics, vol. 55, no. 3, pp. 223-241.
Groves, K. S. & LaRocca, M. A. (2011), ‘Responsible Leadership Outcomes via Stakeholder CSR Values: Testing a Values-Centered Model of Transformational Leadership’, Journal of Business Ethics, vol. 98, no.1, pp. 37-55.
Grusky, O. (1966), ‘Career Mobility and Organizational Commitment’, Administrative Science Quarterly, vol. 10, no. 4, pp. 488-503.
Guba, E. G. & Lincoln, Y. S. (1989), Fourth Generation Evaluation, Newbury Park, Sage Publications, London, New Delhi.
Gulati, P. M. (2009), Research Management: Fundamental and Applied Research, Global India Publications.

229
Guimaraes, T. (1997), ‘Assessing Employee Turnover Intentions before/after TQM’, International Journal of Quality & Reliability Management, vol. 14, no. 1, pp. 46-63.
Gurchiek, K. (2009), Cutting Costs is Top Reason for U.S. Wellness Programs, accessed 3 January 2010, SHRM, from http://www.shrm.org/Publications/HRNews/Pages/WellnessCosts.aspx
Hackett, R. D., Bycio, P. & Hausdorf, P. A. (1994), Further Assessments of Meyer and Allen’s (1991) Three-component Model of Organizational Commitment. Journal of Applied Psychology, vol. 79, no. 1, pp. 15-23.
Hair, J. F., Black, W. C., Babin, B. J., Anderson R. E. & Tatham, R. L. (2006), Multivariate Data Analysis, Upper Saddle River, Prentice Education, Inc., NJ.
Hair, J. F., Anderson, R. E., Tatham, R. L. & Black, W. C. (1998), Multivariate Data Analysis with Readings, Prentice Hall Englewood Cliffs, New Jersey.
Hair, J. F., Black, W. C., Babin, B. J. & Anderson, R. E. (2010), Multivariate Data Analysis: A Global Perspective, Upper Saddle River, NJ.
Hair, J. F., Bush, R. P. & Ortinau, D. J. (2004), Marketing Research: Within a Changing Information Environment, McGraw-Hill.
Hair, J. F., Hult, G. T., Ringle, C. M. & Sarstedt, M. (2014), A Primer on Partial Least Squares Structural Equation Modeling (PLS-SEM), Sage Publications, Thousand Oaks, CA.
Halbesleben, J. R., Whitman, M. V. & Crawford, W. S. (2014), ‘A Dialectical Theory of the Decision to Go to Work: Bringing together Absenteeism and Presenteeism’, Human resource management review, vol. 24, no. 2, pp. 177-192.
Hamstra, M. R., van Yperen, N. W., et al. (2011), ‘Transformational-Transactional Leadership Styles and Followers’ Regulatory Focus: Fit Reduces Followers’ Turnover Intentions’, Journal of Personnel Psychology, vol. 10, no. 4, pp. 182-186.
Han, S., Han, J., An, Y. & Lim, S. (2015), ‘Effects of Role Stress on Nurses' Turnover Intentions: The Mediating Effects of Organizational Commitment and Burnout’, Japan Journal of Nursing Science, vol. 12, no. 4, pp. 287-296.
Hanebuth, D., Meinel, M. & Fischer, J. (2006), ‘Health-Related Quality of Life, Psychosocial Work Conditions, and Absenteeism in an Industrial Sample of Blue- and White-Collar Employees: A Comparison of Potential Predictors’, Journal of Occupational & Environmental Medicine, vol. 48, no. 1, pp. 28-37.
Hanisch, K. A, Hulin, C. L. (1990), ‘Job Attitudes and Organizational Withdrawal: An Examination of Retirement and other Voluntary Withdrawal Behaviors’, Journal of Vocational Behavior, vol. 37, no. 1, pp. 60-78
Hansen, C. D. & Andersen, J. H. (2008), ‘Going Ill To Work – What Personal Circumstances, Attitudes and Work-Related Factors are Associated With Sickness Presenteeism?’, Social Science & Medicine, vol. 67, no. 6, pp. 956-964.

230
Hansson, M., Bostrom, C. & Harms-Ringdahl, K. (2006), ‘Sickness Absence and Sickness Attendance - What People with Neck or Back Pain Think’, Social Science & Medicine, vol. 62, no. 9, pp. 2183-2195.
Haque, A., Fernando, M. & Caputi, P. (2014), A Conceptual Framework for Understanding Responsible Leadership and Presenteeism: the Mediating Influence of Organizational Commitment and Employee Turnover Intentions, accessed 10 January 2016, Research Online http://ro.uow.edu.au/buspapers/659
Hardy, G. E., Woods, D. & Wall, T. D. (2003), ‘The Impact of Psychological Distress on Absence from Work’, Journal of Applied Psychology, vol. 88, no. 2, pp. 306-314.
Harris, K. J., Wheeler, A. R. & Kacmar, K. M. (2009), ‘Leader–Member Exchange and Empowerment: Direct and Interactive Effects on Job Satisfaction, Turnover Intentions, and Performance’, Leadership Quarterly, vol. 20, no.3, pp. 371-382.
Harris, T. B., Li, N. & Kirkman, B. (2014), ‘Leader–Member Exchange (LMX) in Context: How LMX Differentiation and LMX Relational Separation Attenuate LMX's Influence on OCB and Turnover Intention’, Leadership Quarterly, vol. 25, no. 2, pp. 314-328.
Hart, M. (2007), ‘Design’, International Journal of Childbirth Education, vol. 22, no. 1, pp. 22-26.
Hartman, C. C. (2000), ‘Organizational Commitment: Method Scale Analysis and Test of Effects’, International Journal of Organizational Analysis, vol. 8, no. 1, pp.89-109.
Hartman, E. M. (1988), Conceptual Foundations of Organization Theory, Cambridge, Ballinger, MA.
Harvey, P., Stoner, J., Hochwarter, W. & Kacmar, C. ( 2007), ‘Coping with Abusive Supervision: The Neutralizing Effects of Ingratiation and Positive Affect on Negative Employee Outcomes’, Leadership Quarterly, vol. 18, pp. 264-280.
Hassan, S., Wright, B. E. & Yukl, G. (2014), ‘Does Ethical Leadership Matter in Government? Effects on Organizational Commitment, Absenteeism, and Willingness to Report Ethical Problems’, Public Administration Review, vol. 74, no. 3, pp. 333-343.
Hassan, S., Rubina, M., Yukl, G. & Gregory, E. (2013), ‘Ethical and Empowering Leadership and Leader Effectiveness’, Journal of Managerial Psychology, vol. 28, no. 2, pp. 133-46.
Hayes, A. F. (2009), ‘Beyond Baron and Kenny: Statistical Mediation Analysis in the New Millennium’, Communication Monographs, vol. 76, no. 4, pp. 408-420.
Hayes, A. F., Preacher, K. J. & Myers, T. (2010), ‘Mediation and the Estimation of Indirect Effects in Political Communication Research’, in Bucy, E. P. & Holbert, R. L (Eds.), Sourcebook for Political Communication Research: Methods, Measures, and Analytical Techniques, Routledge, New York, pp. 434-465.
Heckert, T. M. & Farabee, A. M. (2006), ‘Turnover Intentions of the Faculty at a Teaching-focused University’, Psychological Reports, vol. 99, no. 1, pp. 39-45.

231
Hemp, P. (2004), ‘Presenteeism: At Work – But Out of It’, Harvard Business Review, vol. 82, no. 10, pp. 49-58.
Hersey, P. & Blanchard, K. (1969), ‘Life-cycle Theory of Leadership’, Training and Development Journal, vol. 23, no. 2, pp. 26-34.
Hersey, P. & Blanchard, K. H. (1977), Management of Organizational Behaviour, Utilizing Human Resources, Prentice Hall, Englewood Cliffs, NJ.
Hersey, P. & Blanchard, K. H. (1982), Management of Organisational Behaviour, Prentice Hall, Englewood Cliffs, NJ.
Hersey, P., Blanchard, K. H. & Johnson D. E. (2001), Management of Organizational Behavior: Leading Human Resources, Prentice Hall, Inc., NJ.
Hetland, H., Saksvik, I. B., Albertsen, H., Berntsen, L. S. & Henriksen, A. (2012), ‘All Work and No Play...” Overcommitment and Personality among University and College Students’, College Student Journal, vol. 46, no. 3, pp. 470.
Hetland, H., Sandal, G. M. & Johnsen, T. B. (2007), ‘Burnout in the information technology sector: Does leadership matter?’, European Journal of Work and Organizational Psychology, vol. 16, no.1, pp. 58-75.
Hickman, C. R., (1990), Mind of a Manager, Soul of a Leader, John Wiley & Sons, Inc., New York.
Hickson, D. J., Hinigs, C. R., Lee, C. A., Schneck, R. S., & Pennings, J. M. (1971), ‘A Strategic Contingencies Theory of Intra-Organizational Power’, Administrative Science Quarterly, vol. 16, pp. 216-229
Hoe, S. L. (2008), ‘Issues and Procedures in Adopting Structural Equation Modeling Technique’, Journal of Applied Quantitative Method, vol. 3, no. 1, pp. 76-83.
Hoelter, J. W. (1983), 'Factorial Invariance and Self-Esteem: Reassessing Race and Sex Differences', Social Forces, vol. 61, no. 3, pp. 834-846.
Hofstede, G. (1984), Culture’s Consequences: International Differences in Work-related Values, Sage Publications, Newbury Park, CA.
Hofstede, G. (2006), ‘What did GLOBE Really Measure? Researchers’ Minds versus Respondents’ minds’, Journal of International Business Studies, vol. 37, no. 6, pp. 882-896.
Hoffman, A. J. & Bazerman, M. S. (2007), ‘Changing practice on sustainability: understandingand overcoming the organizational and psychological barriers to action’, in Sharma, S., Hollander, E. P. & Offermann, L. R. (1990), ‘Power and Leadership in Organization: Relationships in Transition’, American Psychologist, vol. 45, no. 2, pp. 179-189.
Hollander, E. P. & Offermann, L. R. (1990), ‘Power and leadership in organization: Relationships in transition’, American Psychologist, vol. 45, no. 2, pp. 179-189.

232
Hollins, M. A. (2012), ‘Effect of Organizational Mentoring on Job Satisfaction, Organizational Commitment, Career Development and Job-Related Stress in the Black Employee’, Ph.D. Thesis, accessed 18 June 2013, from https://esirc.emporia.edu/handle/ 123456789/1028
Holtom, B. C., Mitchell, T. R., Lee, T. W. & Eberly, M. B. (2008), ‘Turnover and Retention Research: A Glance at the Past, A Closer Review of the Present, and a Venture into the Future’, Academy of Management Annals, vol. 2, pp. 231-274.
Holton, E. F. & Lynham, S. A. (2000), ‘Performance-Driven Leadership Development’, Advances in Developing Human Resources, vol. 2, no. 2, pp.1- 17.
Hom, P.W. & Griffeth R. W. (1987), ‘A Longitudinal Investigation of Mobley's (1977) Theory of Employee Turnover’, Proceedings of American Management Association, New Orleans.
Hooper, D., Coughlan, J. & Mullen, M. (2008), ‘Structural Equation Modelling: Guidelines for Determining Model Fit’, Electronic Journal of Business Research Methods, vol. 6, no. 1, pp. 53-60.
Horner, M. (1997), ‘Leadership Theory: Past, Present and Future’, Team Performance Management, vol. 3, no. 4, p. 270.
Hougyun, K. M. (2012), ‘Transformational Leadership and Organisational Citizenship Behavior in the Public Sector in South Korea: The Mediating Role of Affective Commitment’, Local Government Studies, vol. 38, no. 6, pp. 867-892.
House, R. J. & Aditya, R. N. (1997), ‘The Social Scientific Study of Leadership: Quo Vadis?’, Journal of Management, vol. 23, no. 3, pp. 409-473.
House, R. J. (1971), ‘A Path-Goal Theory of Leader Effectiveness’, Administrative Science Quarterly, vol. 16, pp. 321-338.
House, R. J. (1977), ‘A 1976 Theory of Charismatic Leadership’, in Hunt, J. G. & Larson, L. L. (Eds.), Leadership: The cutting edge Carbondale, Southern Illinois University Press, IL, pp. 189-207.
House, R. J., Wright, N. S. & Aditya, R. N. (1997), ‘Cross-Cultural Research on Organizational Leadership: A Critical Analysis and a Proposed Theory’, in Earley, P. C. & Erez, M. (Eds.), New Perspectives in International Industrial Organizational Psychology, San Francisco, New Lexington, pp. 535-625.
House, R. J., Hanges, P. J., Javidan, M., Dorfman, P. W. & Gupta, V. (2004), Culture, Leadership and Organizations: The GLOBE Study of 62 Societies, Sage Publications, Thousand Oaks, California.
Howell, J. M. & Frost, P. J. (1989), ‘A Laboratory Study of Charismatic Leadership’, Organizational Behavior and Human Decision Processes, vol. 43, no. 2, pp. 243-269.

233
Hoyle, R. (1995). ‘The Structural Equation Modeling Approach: Basic Concepts and Fundamental Issues’, in Hoyle, R. H. (Eds.), Structural Equation modeling: Concepts, issues, and applications, Sage Publications, Thousand Oaks, CA, pp. 1-15.
Hoyt, C. L. (2013), Leadership within Virtual Contexts, Oxford University Press.
Hrebiniak, L. G. & Alutto, J. A. (1972), ‘Personal and Role-Related Factors In the Development of Organizational Commitment’, Administrative Science Quarterly, vol. 17, pp. 555-573.
Hsu, J., Jui-Che, S., Huang, S.,Y., Leong, L. & Li, A. M. (2003), ‘Are Leadership Styles Linked to Turnover Intention: An Examination in Mainland China?’, Journal of American Academy of Business, Cambridge, vol. 3, no.1/2, pp. 37-43.
Hsu, L. C. & Liao, P. W. (2015), ‘From Job Characteristics to Job Satisfaction of Foreign Workers in Taiwan's Construction Industry: The Mediating Role of Organizational Commitment’, Human Factors and Ergonomics in Manufacturing, pp. 1-13.
Hu, L. T. & Bentler, P. M. (1999), ‘Structural Equation Modeling: A Multidisciplinary Journal’, Structural Equation Modeling, vol. 6, no. 1, pp. 1-55.
Hu, L. & Bentler, P. M. (1999a), ‘Cutoff Criteria for Fit Indexes in Covariance Structure Analysis: Conventional Criteria versus New Alternatives’, Structural Equation Modeling, vol. 6, pp. 1-55.
Huang, L. S. (2006), ‘Transformational Leadership has Effect on Organizational Performance: The Organizational Culture as an Intermediary Variable’, Unpublished master's thesis, National Taipei University, Taipei, Taiwan.
Hummer, J., Sherman, B. & Quinn, N. (2002), Present and Unaccounted for, Occupational Health Safety, vol. 71, no. 40 (2), pp. 44-100.
Hunt, S. D. & Morgan, R. M. (1994), ‘Organizational Commitment: One of Many Commitments or Key Mediating Construct?’, Academy of Management Journal, vol. 37, no. 6, pp.1568-1587.
Huselid, M. A. (1995), ‘The Impact of Human Resource Management Practices On Turnover, Productivity, and Corporate Financial Performance’, Academy of Management Journal, vol. 38 no. 3, pp. 635-672.
Hwang, I. S. & Kou, J. H. (2006), ‘Effects of Job Satisfaction and Perceived Alternative Employment Opportunities on Turnover Intention: An Examination of Public Sector Organizations’, Journal of American Academy of Business, Cambridge, vol. 8, no.2, pp. 254-255.
Hwang, J. & Hopkins, K. (2012), ‘Organizational Inclusion, Commitment, and Turnover Among Child Welfare Workers: A Multilevel Mediation Analysis’, Administration in Social Work, vol. 36, no. 1, pp. 23-39.

234
Iriondo, J. M., Albert, M. J. & Escudero, A. (2003), ‘Structural Equation Modeling: An Alternative for Assessing Causal Relationships in Threatened Plant Populations’, Biological Conservation, vol. 113, pp. 367-377.
Israel, G. D. (1992), Determining Sample Size, accessed 8 October 2012, University of Florida, from http://edis.ifas.ufl.edu/pdffiles/PD/PD00600.pdf.
Iverson, D., Lewis, K. L., Caputi, P. & Knospe, S. (2010), ‘The Cumulative Impact and Associated Costs of Multiple Health Conditions on Employee Productivity’, Journal of Occupational And Environmental Medicine, vol. 52, no. 12, pp. 1206-1211.
Jacobs, E. & Roodt, G. (2007), ‘The Development of a Knowledge Sharing Construct to Predict Turnover Intentions’, Aslib Proceedings: New Information Perspectives, vol. 59, no. 3, pp. 229-248.
James, L. R., Muliak, S. A. & Brett, J. M. (1982), Causal Analysis: Assumptions, Models, and Data, Sage Publications, Beverly Hills.
Jaramillo, F., Grisaffe, D. B., Chonko, L. B. & Roberts, J. A. (2009), ‘Examining the impact of servant leadership on salesperson’s turnover intention’, Journal of Personal Selling and Sales Management, vol. 29, no. 4, pp.351-365.
Jaros, S., Jermier, J., Koehler, J. & Sincich, T. (1993), ‘Effects of Continuance, Affective, and Moral Commitment on the Withdrawal Process: An Evaluation of Eight Structural Equation Models’, Academy of Management Journal, vol. 36, no. 5, pp. 951-995.
Jaros, S. (2007), ‘Meyer and Allen Model of Organizational Commitment: Measurement Issues’, ICFAI Journal of Organizational Behavior, vol. 6, no. 4, pp. 7-25.
Jing, L. & Zhang, D. (2014), ‘The Mediation of Performance in the Relationship of Organizational Commitment to University Faculty’s Effectiveness’, Asia Pacific Education Review, vol.15, no. 1, pp. 141-153.
Johansson, G. & Lundberg, I. (2004), ‘Adjustment Latitude and Attendance Requirements as Determinants of Sickness Absence or Attendance: Empirical Tests of the Illness Flexibility Model’, Social Science & Medicine, vol. 58, no. 10, pp.1857-1868.
Johns, G. (2002), ‘Absenteeism and Mental Health’, in Thomas, J.C. & Hersen, M. (Eds), Handbook of Mental Health in the Workplace, Sage Publication, Thousand Oaks, CA, pp. 437-455.
Johns, G. (2007), ‘Absenteeism or Presenteeism: Not at Work or Not Working Well’, in Cooper, C.L. & Barling, J. (Eds), The Oxford Handbook of Organizational Well-Being. Oxford University Press, Oxford.
Johns, G. (2010), ‘Presenteeism in the Workplace: A Review and Research Agenda’, Journal of Organizational Behavior, vol.31, no. 4, pp. 519-542.
Johnson-Laird, P.N. (1999), ‘Deductive Reasoning’, Annual Review of Psychology, vol. 50, no. 1, pp. 109-135.

235
Johnson, T. & Fendrich, M. (2002), ‘A Validation of the Crowne-Marlowe Social Desirability Scale’, Paper Presented at the American Association for Public Opinion Research, St Petersburg, FL.
Johnston, M. W., Parasuraman, A., Charles, M. F. & Black, W. C. (1990), ‘A Longitudinal Assessment of the Impact of Selected Organizational Influences on Salespeople's Organizational Commitment during Early Employment’, Journal of Marketing Research, vol. 27, pp. 333-44. Joinson, C. (2000), Public sector HR: Leaving Bureaucracy Behind, HR Magazine, vol. 45, no. 6, accessed August 24, 2012, from http://www.shrm.org/hrmagazine/ 2000index/0600/0600joinson.asp.
Joinson, C. (2000), ‘Capturing Turnover Costs’, HR Magazine, vol. 45, no. 7, pp. 107-119.
Joksimovic, L., Starke, D., Knesebeck, O. & Siegrist, J. (2002), ‘Perceived Work Stress, Overcommitment, and Self-Reported Musculoskeletal Pain: A Cross sectional Investigation’, International Journal of Behavioral Medicine, vol. 9, no. 2, pp. 2, pp.122-138.
Joksimovic, L., Siegrist, J., Meyer-Hammer, M., Peter, R., Franke, B., Klimek, W. J., Heintzen, M. P., Strauer, B. E. (1999), ‘Overcommitment predicts restenosis after coronary angioplasty in cardiac patients’, International Journal of Behavioral Medicine, 6, pp. 356-369.
Joo, B. K. (2010), ‘Organizational Commitment for Knowledge Workers: The Roles of Perceived Organizational Learning Culture, Leader–Member Exchange Quality, and Turnover Intention’, Human Resource Development Quarterly, vol. 21, no. 1, pp. 69-85.
Joreskog, K. G. (1973), ‘A General Method for Estimating a Linear Structural Equation System’, in Goldberger, A. S. & Duncan, O. D. (Eds.), Structural Equation Models in the Social Sciences, Academic Press, New York, pp. 85-112.
Joreskog, K. G. & Sorbom, D. (1996), LISREL 8: User’s Reference Guide, Chicago: Scientific Software.
Joyce, A. (2006), Likeability Value as Much as Job Skills, The Honolulu Advertiser, accessed 12 December 2010, from http://the.honoluluadvertiser.com/article/2006/Mar/13/bz/FP603130308.html
Judd, C. M. & Kenny, D. A. (1981), ‘Process Analysis: Estimating Mediation in Treatment Evaluations’, Evaluation Review, vol. 5, no. 5, pp. 602-619.
Jung, D., Yammarino, F. J. & Lee, J. K. (2009), ‘Moderating Role of Subordinates' Attitudes on Transformational Leadership and Effectiveness: A Multi-Cultural and Multi-Level Perspective’, Leadership Quarterly, vol. 20, no. 4, pp. 586-603.
Kabanoff, B. (1981), ‘The Potential Influence Index as a Measure of Situational Favourability in the Contingency Model of Leadership’, Australian Journal of Psychology, vol. 33, no. 1, pp. 47-59.

236
Kacmar, K. M., Carlson, D. S. & Brymer, R. A. (1999), ‘Antecedents and Consequences of Organizational Commitment: A Comparison of Two Scales’, Educational and Psychological Measurement, vol. 59, pp. 976-996.
Kakabadse, N., Rozuel, C. & Lee-Davis, L. (2005), ‘Corporate Social Responsibility and Stakeholder Approach: A Conceptual Review’, International Journal of Business Governance and Ethics, vol. 1, no. 4, pp. 277-302.
Kang, H. J., Gatling, A. & Kim, J. (2015), ‘The Impact of Supervisory Support on Organizational Commitment, Career Satisfaction, and Turnover Intention for Hospitality Frontline Employees’, Journal of Human Resources in Hospitality and Tourism, vol. 14, no. 1, pp. 68-89.
Kanter, R. M. (1968), ‘Commitment and Social Organization: A Study of Commitment Mechanisms in Utopian Communities’, American Sociological Review, vol. 33, pp. 499-517.
Kanter, R. M. (1977), Men and Women of the Corporation, Basic Books, New York.
Karpin, D. (1995), ‘Enterprising Nation: Renewing Australia’s Managers to meet the Challenges of the Asia-Pacific Century’, Report of the Industry Task Force on Leadership and Management Skills, April, Canberra, Australian Government Publishing Service.
Keaveney, S. M. & Nelson, J. E. (1993), ‘Coping With Organizational Role Stress: Intrinsic Motivational Orientation, Perceived Role Benefits, and Psychological Withdrawal’, Journal of the Academy of Marketing Science, vol. 21, no. 2, pp. 113-124.
Kelloway, E. K. & Barling, J. (2010), ‘Leadership Development as an Intervention in Occupational Health Psychology’, Work and Stress, vol. 24, pp. 260-279.
Kemery, E. R., Mossholder, K. W. & Bedeian, A. G. (2012), Role Stress, Physical Symptomatology, And Turnover Intentions: A Causal Analysis of Three Alternative Specifications, accessed August 26, 2013, from http://bus.lsu.edu/management/faculty/abedeian/articles/ RSPhySym-JOB1987.pdf.
Kenny, D. A. & McCoach, D. B. (2003), ‘Effect of the Number of Variables on Measures of Fit in Structural Equation Modeling’, Structural Equation Modeling, vol. 10, pp. 333-351.
Keskes, I. (2014), ‘Relationship between Leadership Styles and Dimensions of Employee Organizational Commitment: A Critical Review and Discussion of Future Directions’, Intangible Capital, vol. 10, no. 1, pp. 26-51.
Khine, M. S. (2013), Application of Structural Equation Modeling in Educational Research and Practice, Springer Verlag, DE.
Kiersch, C. E. (2012), ‘A Multi-Level Examination of Authentic Leadership and Organizational Justice in Uncertain Times’, Doctoral dissertation, Colorado State University.
Kim, J. & Garman, E. T. (2004), ‘Financial Stress, Pay Satisfaction and Workplace Performance’, Compensation Benefits Review, vol. 36, pp. 69-76.

237
Kim, H. (2014), ‘Transformational Leadership, Organizational Clan Culture, Organizational Affective Commitment, and Organizational Citizenship Behavior: A Case of South Korea's Public Sector’, Public Organization Review, vol. 14, no. 3, pp. 397-417.
Kim, K. H. & Bentler, P. M. (2002), ‘Tests of Homogeneity of Means and Covariance Matrices for Multivariate Incomplete Data’, Psychometrika, vol. 67, no. 4, pp. 609-624.
Kim, W. G. & Brymer, R. A. (2011), ‘The Effects of Ethical Leadership on Manager Job Satisfaction, Commitment, Behavioral Outcomes, and Firm Performance’, International Journal of Hospitality Management, vol. 30, no.4, pp. 1020-1026.
Kinjerski, V. & Skrypnek, B. J. (2006), ‘Creating Organisational Conditions that Foster Employee Spirit at Work’, Leadership & Organisation Development Journal, vol. 27, no. 4, pp. 280-295.
Kinman, G. & Jones, F. (2008), ‘Effort-Reward Imbalance, Over-Commitment and Work-Life Conflict: Testing an Expanded Model’, Journal of Managerial Psychology, vol. 23, no. 3, pp. 236-251.
Kinnunen, U. & Perko, K. (2012), ‘What Kind of Leadership Behavior is Related to Sickness Presenteeism?’, Psychology & Health, vol. 27, pp. 68-69.
Kinnunen, U., Feldt, T. & Makikangas, A. (2008), ‘Testing the Effort-Reward Imbalance Model among Finnish Managers: The Role of Perceived Organizational Support’, Journal of Occupational Health Psychology, vol. 13, no. 2, pp. 114-127.
Kippenberger, T. & NetLibrary, I. (2002), Leadership Styles, Capstone Pub, Oxford, U.K.
Kirkman, B. L., Chen, G., Farh, J. L., Chen, Z. X. & Lowe, K. B. (2009), ‘Individual power distance orientation and follower reactions to transformational leaders: A cross-level, cross-cultural examination’, Academy of Management Journal, vol. 52, no. 4, pp. 744-764.
Kivimaki, M., Vahtera, J., Pentti, J. & Ferrie, J. E. (2000), ‘Factors Underlying the Effect of Organisational Downsizing on Health of Employees: Longitudinal Cohort Study’, British Medical Journal, vol. 320, no. 7240, pp. 971-975.
Kivimaki, M., Head, J., Ferrie, J. E., Hemingway, H., Shipley, M. J., Vahtera, J. & Marmot, M. G. (2005), ‘Working While Ill as a Risk Factor for Serious Coronary Events: the Whitehall II Study’, American Journal of Public Health, vol. 95, no.1, pp. 98-102.
Klein, H. J., Becker, T. E. & Meyer, J. P. (2009), Commitment in Organizations: Accumulated Wisdom and New Directions, Routledge/ Psychology Press, New York.
Kline, R. B. (2005), Principles and Practice of Structural Equation Modeling, Guilford Press, New York.
Kline, R. B. (2011), Principles and Practice of Structural Equation Modeling, Guilford Press, New York.

238
Kleinman, C. S. (2004), ‘Leadership: A Key Strategy in Staff Nurse Retention’, Journal of Continuing Education in Nursing, vol.35, no. 3, pp.128-132.
Ko, J. W., Price, J. L. & Mueller, C. W. (1997), ‘Assessment of Meyer and Allen’s Three-component Model of Organizational Commitment in South Korea’, Journal of Applied Psychology, vol. 82, no. 6, pp. 961–973.
Kopelman, R. E., Brief, A. P. & Guzzo, R. A. (1990), ‘The role of climate and culture in productivity’, in Schneider, B. (Eds.), Organizational Climate and Culture, San Francisco, Jossey-Bass, pp. 282-318.
Koopman, C., Pelletier, K. R, Murray, J. F, Sharda, C. E, Berger, M. L., Turpin, R. S, et al., (2002), ‘Stanford Presenteeism Scale: Health Status and Employee Productivity’, Journal of Occupational and Environmental Medicine, vol. 44, no. 1 pp.14-20.
Korsgaard, M., Schweiger, D. & Sapienza, H. (1995), ‘Building Commitment, Attachment and Trust in Strategic Decisions’, Academy of Management Journal, vol. 38, no. 1, pp. 60-85.
Kouppala, J., Lamminpää, A., Liira, J. & Vainio, H. (2008), ‘Leadership, Job Well-being, and Health Effects – A systematic Review and a Meta-Analysis’, Journal of Occupational and Environmental Medicine, vol. 50, no. 8, pp, 904-915.
Kouzes, J. M. & Posner, B. Z. (1993), Credibility: How Leaders Gain and Lose it, Why People Demand it, Jossey-Bass Publishers, San Francisco.
Kouzes, J. M. & Posner, B. Z. (1995), The Leadership Challenge, Jossey-Bass Publishers, San Francisco.
Kraut, A. I. (1975), ‘Predicting Turnover of Employees from Measured Job Attitudes’, Organisational Behavior and Human Performance, vol. 13, no. 2, pp. 233-243.
Kriger, M. & Seng, Y. (2005), ‘Leadership with Inner Meaning: A Contingency Theory of Leadership Based on the Worldviews of Five Religions’, The Leadership Quarterly, vol. 16, no. 5, pp. 771-806.
Kumar, R. N., Hass, S. L., Li, J. Z., Nickens, D. J., Daenzer, C. L. & Wathen, L. K. (2003), ‘Validation of the Health-Related Productivity Questionnaire Diary (HRPQ-D) on a Sample of Patients with Infectious Mononucleosis: Results from a phase 1 Multicenter Clinical Trial’, Journal of Occupational and Environmental Medicine, vol. 45, no. 8, pp. 899-907.
Kuo, H. T., Lin, K. C. & Li, I. (2014), ‘The Mediating Effects of Job Satisfaction on Turnover Intention for Long-Term Care Nurses in Taiwan’, Journal of Nursing Management, vol. 22, no. 2, pp. 225-233.
Kuoppala, J., Lamminpaa, A., Liira, J. & Vainio, H. (2008), ‘Leadership, Job Well-Being, and Health Effects-A Systematic Review and A Meta-Analysis’, Journal of Occupational & Environmental Medicine, vol. 50, no. 8, pp. 904-915.
Kuper, H., Singh-Manoux, A., Siegrist, J. & Marmot, M. (2002), ‘When Reciprocity Fails: Effort-Reward Imbalance in Relation to Coronary Heart Disease and Health Functioning

239
within the Whitehall II Study’, Occupational & Environmental Medicine, vol. 59, no. 11, pp.777-785.
Lack, D. M. (2011), ‘Presenteeism Revisited: A Complete Review’, Journal of the American Association of Occupational Health Nurses, vol. 59, vol. 2, pp. 77-89.
Lambert, E. G., Hogan, N. L. & Barton, S. M. (2001), ‘The Impact of Job Satisfaction on Turnover Intent: A Test of A Structural Measurement Model Using A National Sample Of Workers’, Social Science Journal, vol. 38, no. 2, pp. 233-250.
Larson, B. A., Fox, M. P., Rosen, S., Bii, M., Sigei, C., et al. (2009), ‘Do the Socioeconomic Impacts of Antiretroviral Therapy Vary By Gender? A Longitudinal Study of Kenyan Agricultural Worker Employment Outcomes’, BMC Public Health, vol. 9, p.240.
Laschinger, H. K. & Fida, R. (2014), ‘A Time-Lagged Analysis of the Effect of Authentic Leadership on Workplace Bullying, Burnout, and Occupational Turnover Intentions’, European Journal of Work and Organizational Psychology, vol. 23, no. 5, pp. 739-753.
Lawrence, J. T. & Beamish, P. W. (2013), Globally Responsible Leadership: Managing According to the UN Global Compact, Sage Publications, Thousand Oaks, CA.
Lee, T. W., Mitchell, T. R., Sablynski, C. J., Burton, J. P. & Holtom, B. C. (2004), ‘The Effects of Job Embeddedness on Organizational Citizenship, Job Performance, Volitional Absences, and Voluntary Turnover’, Academy of Management Journal, vol. 47, pp. 711-722.
Lee, A. S. (1989), ‘A Scientific Methodology for MIS Case Studies’, MIS Quarterly, vol. 13, no. 1, pp. 33-50.
Lee, C. H. & Bruvold, N. T. (2003), ‘Creating Value for Employees: Investment in Employee Development’, The International Journal of Human Resource Management, vol. 14, no. 6, pp. 981-1000.
Lee, D. C., Hung, L. M. & Chen, M. L. (2012), ‘Empirical Study on the Influence among Corporate Sponsorship, Organizational Commitment, Organizational Cohesiveness and Turnover Intention’, Journal of Management and Sustainability, vol. 2, no. 2, pp.43-53.
Lee, H. J. & Peccei, R. (2007), ‘Organizational-Level Gender Dissimilarity and Employee Commitment’, British Journal of Industrial Relations, vol. 45, no. 4, pp. 687-712.
Leedy, P. D. & Ormrod, J. E. (2005), Practical Research: Planning and Design, Upper Saddle River, Pearson, NJ.
Leik, R. K., Owens, T. J. & Tallman, I. (1999), ‘Interpersonal Commitments: The Interplay of Social Networks and Individual Identities’, in Adams, J. M. & Jones, W. M. (Eds.), Handbook of Interpersonal Commitment and Relationship Stability, Dordrecht, Kluwer Academic/Plenum, The Netherlands, pp. 239-256.
Leineweber, C., Westerlund, H., Hagberg, J., Svedberg, P., et al. (2011), ‘Sickness Presenteeism Among Swedish Police Officers’, Journal of Occupational Rehabilitation, vol. 21, no. 1, pp. 17-22.

240
Lenth, R. V. (2001), ‘Some Practical Guidelines for Effective Sample Size Determination’, The American Statistician, vol. 55, no. 3, pp. 187-193.
Leroy, H., Palanski, M. E. & Simons, T. (2012), ‘Authentic Leadership and Behavioral Integrity as Drivers of Follower Commitment and Performance’, Journal of Business Ethics, vol. 107, no.3, pp. 255-264
Levin-Epstein, J. (2005), Presenteeism and Paid Sick Days, Centre for Law and Social Policy (CLASP), Washington, D.C., accessed November 15, 2012, from http://www.clasp.org/publications/presenteeism.pdf.
Lewis, S. & Cooper, C. L. (1999), ‘The Work-Family Research Agenda in Changing Contexts’, Journal of Occupational Health Psychology, vol. 4, pp. 382-93.
Lewin, K., Lippitt, R. & White, R. K. (1939), ‘Patterns of Aggressive Behavior in Experimentally Created ‘Social Climates’’, Journal of Social Psychology, vol. 10, pp. 271–299.
Liden, R. C., Wayne, S. J., Zhao, H. & Henderson, D. (2007), ‘Servant Leadership: Development of a Multidimensional Measure and Multi-Level Assessment’, Leadership Quarterly, vol. 19, no. 2, pp. 161-177.
Li, J., Yang, W., Cheng, Y., Siegrist, J. & Cho, S. (2005), ‘Effort-Reward Imbalance at Work and Job Dissatisfaction in Chinese Healthcare Workers: A Validation Study’, International Archives of Occupational and Environmental Health, vol. 78, no. 3, pp. 198-204.
Limerick, D., Cunnington, B. & Trevor-Roberts, B. (1985), ‘Frontiers of Excellence: A Study of Strategy, Structure and Culture in Fifty Australian Organisations’, Brisbane: Australian Institute of Management, Queensland Division.
Lin, S. & Hsieh, A. (2002), ‘Constraints of Task Identity on Organizational Commitment’, International Journal of Manpower, vol. 23, no. 2, pp. 151-165.
Liu, Z., Cai, Z., Li, J, Shi, S. & Fang, Y. (2013), ‘Leadership Style and Employee Turnover Intentions: A Social Identity Perspective’, Career Development International, vol. 18, no. 3, pp. 305-324.
Locke, E. A. (1968), ‘Toward a Theory of Task Motivation and Incentives’, Organizational Behavior and Human Performance, vol. 3, pp. 157-189.
Locke, E. A., Cartledge, N. & Knerr, C. S. (1970), ‘Studies of the Relationship between Satisfaction, Goal Setting, and Performance’, Organizational Behavior and Human Performance, vol. 5, pp. 135-158.
Loke, J. (2001), ‘Leadership Behaviors: Effects on Job Satisfaction, Productivity and Organizational Commitment’, Journal of Nursing Management, vol. 9, no. 4, pp. 191-204.
Long, C. S. & Thean, L. Y. (2011), ‘Relationship between Leadership Style, Job Satisfaction and Employees' Turnover Intention: A Literature Review’, Research Journal of Business Management, vol. 5, no. 3, pp. 91-100.
241
Lord, R. G., Brown, D. J. & Freiberg, S. J. (1999), ‘Understanding the Dynamics of Leadership: The Role of Follower Self-Concepts in the Leader/Follower Relationship’, Organizational Behavior and Human Decision Processes, vol. 78, no. 3, pp. 167-203.
Lord, R. & Maher, K. J. (1991), Leadership and Information Processing: Linking Perceptions and Performance, Unwin-Everyman, Boston.
Low, G. S., Cravens, D. W., Grant, K. & Moncrief, W. C. (2001), ‘Antecedents and Consequences of Salesperson Burnout’, European Journal of Marketing, vol. 35, no. 5/6, pp. 587-611.
Lowe, G. (2002), ‘Here in Body, Absent in Productivity’, Canadian HR Reporter, vol. 15, no. 21, pp. 5-8.
Lowhorn, G. L. (2009), ‘The Effect of Supportive Organizational Leadership, Organizational Socialization, and Satisfaction with Supervision on Turnover as Mediated by Organizational Commitment and Job Satisfaction in Faculty', Ph.D. thesis, School of Global Leadership & Entrepreneurship, Regent University, Virginia.
Lum, L., Kervin, J., Clark, K., Reid, F. & Sirola, W. (1998), ‘Explaining Nursing Turnover Intent: Job Satisfaction, Pay Satisfaction, or Organizational Commitment?’, Journal of Organizational Behavior, vol. 19, no. 3, pp. 305-320.
Luna-Arocas, R. & Camps, J. (2008), ‘A Model of High Performance Practices and Turnover Intentions’, Personnel Review, vol. 37, no. 1, pp. 26-46.
Luthans, F. (2005), Organizational Behavior, McGraw-Hill Irwin, Boston, MA.
Luthans, F. & Avolio, B. J. (2003), ‘Authentic Leadership: A Positive Developmental Approach’, in Cameron, K. S., Dutton, J. E. & Quinn, R. E. (Eds.), Positive Organizational Scholarship, Barrett-Koehler, San Francisco, pp. 241- 261.
Luz, J. & Green, M. S. (1997), ‘Sickness Absenteeism from Work – A Critical Review of Literature’, Public Health Review, vol. 25, no. 2, pp. 89-122.
Lynch, W. D., Gilfillan, L. A., Jennett, C. & Bender, J. (1993), ‘Health Risks and Health Insurance Claims Costs: Results for Health Hazard Appraisal Responders and Non-responders’, Journal of Occupational and Environmental Medicine, vol. 35, no. 1, pp. 28-33.
Lynch, W. & Riedel, J. (2001), ‘Measuring Employee Productivity: A Guide to Self-Assessment Tools’, William M. Mercer, Inc. & the Institute for Health and Productivity Management, AZ, Phoenix and Scottsdale.
Lynham, S. A. & Chermack, T. J. (2006), ‘Responsible Leadership for Performance: A Theoretical Model and Hypotheses’, Journal of Leadership and Organizational Studies, vol. 12, no. 4, pp. 73-88.
Lynham, S. A. (1998), ‘The Development and Evaluation of a Model Of Responsible Leadership for Performance: Beginning the Journey’, Human Resource Development International, vol.1, no. 2, pp.207-220.

242
Lynham, S. A. (2000a), ‘The Development of a Theory Of Responsible Leadership for Performance’, Unpublished Doctoral Dissertation, University of Minnesota, UMN, MN, St Paul.
Lynham, S. A. (2000b), ‘Leadership Development: A Review of the Theory and Literature’, in Kuchinke, K. P. (Ed.), Academy of Human Resource Development Conference Proceedings, Baton Rough, AHRD, LA, pp. 285-292.
Lyons, P. (2008), ‘The Crafting of Jobs and Individual Differences’, Journal of Business Psychology, vol. 23, no. 1-2, pp. 25-36.
Lysonski, S. & Johnson, E. (1983), ‘The Sales Manager as a Boundary Spanner: A Role Theory Analysis’, Journal of Personal Selling and Sales Management, vol. 3, pp. 8-21.
Maak, T. (2007), ‘Responsible Leadership, Stakeholder Engagement, and the Emergence of Social Capital’, Journal of Business Ethics, vol. 74, no.4, pp. 329-334.
Maak, T. & Pless, N. M. (2006a), ‘Responsible Leadership: A Relational Approach’, in Maak, T. & Pless, N. M. (Eds.), Responsible Leadership, Routledge, London, New York, pp. 33-53.
Maak, T. & Pless, N. M. (2006b), ‘Responsible Leadership in a Stakeholder Society’, Journal of Business Ethics, vol. 66, pp.99-115.
Maak, T. & Pless, N. M. (2009), ‘Business Leaders as Citizens of the World: Advancing Humanism on A Global Scale’, Journal of Business Ethics, vol. 88, no. 3, pp. 537-550.
MacCallum, R. C., Roznowski, M. & Necowitz, L. B. (1992), ‘Model Modifications in Covariance Structure Analysis: The Problem of Capitalization on Chance’, Psychological Bulletin, vol. 111, pp. 490-504.
MacCallum, R. C. (1986), ‘Specification Searches in Covariance Structure Modeling’, Psychological Bulletin, vol. 100, pp. 107-120.
Maccallum, R. C., Widaman, K. F., Zhang, S. & Hong, S. (1999), ‘Sample Size in Factor Analysis’, Psychological Methods, vol. 4, no. 1, pp. 84-99.
MacCallum, R. C. & Austin, J. T. (2000), ‘Applications of Structural Equation Modeling in Psychological Research’, Annual Review of Psychology, vol. 51, no. 1, pp. 201-226.
Macey, W. H. & Schneider, B. (2008), ‘The Meaning of Employee Engagement’, Industrial and Organizational Psychology, vol. 1, no.1, pp. 3-30.
MacGregor, J. N., Cunningham, J. B. & Caverley, N. (2008), ‘Factors in Absenteeism and Presenteeism: Life Events and Health Events’, Management Research News, vol. 31, no.8, pp. 607-615.
MacKinnon, D. P. & Fairchild, A. J. (2009), ‘Current Directions in Mediation Analysis’, Current Directions in Psychological Science, vol. 18, no.1, pp. 16-20.

243
MacKinnon, D. P., Fairchild, A. J. & Fritz, M. S. (2007), ‘Mediation Analysis’, Annual Review of Psychology, vol. 58, p. 593.
MacKinnon, D. P., Lockwood, C.M., Hoffman, J. M., West, S. G. & Sheets, V. (2002), ‘A Comparison of Methods to Test Mediation and Other Intervening Variable Effects’, Psychological Methods, vol. 7, no. 1, pp. 83-104.
McClain, E. (2013), ‘Critical Synthesis Package: Stanford Presenteeism Scale (SPS-6)’, MedEdPORTAL Publications, vol. 9, no. 9602.
Maertz, C. P.,Griffeth, R. W., Campbell, N. S. & Allen, D. G. (2007), ‘The Effects of Perceived Organizational Support and Perceived Supervisor Support on Employee Turnover’, Journal of Organizational Behaviour, vol. 28, no. 8, pp. 1059-1075.
Malik, O. F., Abbas, Q., Kiyani, T. M., Malik, K.U. & Waheed, A. (2011), ‘Perceived Investment in Employee Development and Turnover Intention: A Social Exchange Perspective’, African Journal of Business Management, vol. 5, no. 5, pp. 1904-1914.
Malos, R. (2012), ‘The Most Important Leadership Theories’, Annals of Eftimie Murgu University Resita, Fascicle II, Economic Studies, pp. 413-420.
Mann, R. D. (1959), ‘A Review of the Relationship between Personality and Performance in Small Groups’, Psychological Bulletin, vol. 56, no. 4, pp. 241-270.
Manz, C. C., Anand, V., Joshi, M. & Manz, K. P. (2008), ‘Emerging Paradoxes in Executive Leadership: A Theoretical Interpretation of the Tensions between Corruption and Virtuous Values’, Leadership Quarterly, vol. 19, pp. 385-392.
Manzoor, M. & Naeem, H. (2011), ‘Relationship of Organization Socialization with Organizational Commitment and Turnover Intention: Moderating role of Perceived Organizational Support’, Interdisciplinary Journal of Contemporary Research in Business, vol.3, no.8, pp.515-529.
Mardia, K. V. (1974), ‘Applications of Some Measures of Multivariate Skewness and Kurtosis in Testing Normality and Robustness Studies’, Sankhya, vol. 36, no. 2, pp. 115-128.
Margolis, J. D. & Walsh, J. P. (2003), ‘Misery Loves Companies: Rethinking Social Initiatives by Business’, Administrative Science Quarterly, vol. 48, no. 2, pp. 268-305.
Mària, J. & Lozano, J. (2010), ‘Responsible Leaders for Inclusive Globalization: Cases in Nicaragua and the Democratic Republic of the Congo’, Journal of Business Ethics, vol.93, no. 1, pp. 93-111.
Maritz, R., Pretorius, M. & Plant, K. (2011), ‘Exploring the Interface between Strategy-Making and Responsible Leadership’, Journal of Business Ethics, vol. 98, no. 1, pp. 101-113.
Markland, D. (2007). ‘The golden rule is that there are no golden rules: A commentary on Paul Barrett's recommendations for reporting model fit in structural equation modeling’, Personality and Individual Differences, vol. 42, no. 5, pp. 851-858.
244
Marsh, H. W., Balla, J. R. & Mcdonald, R. P. (1988), 'Goodness-of-Fit Indexes in Confirmatory Factor Analysis: The Effect of Sample Size', Psychological Bulletin, vol. 103, no. 3, pp. 391-410.
Marsh, R. M. & Mannari, H. (1977), ‘Organizational Commitment and Turnover: A Prediction Study’, Administrative Science Quarterly, vol. 22, no. 1, pp. 57-75.
Martens, M. P. (2005), ‘The Use of Structural Equation Modeling in Counselling Psychology Research’, The Counselling Psychologist, vol. 33, no. 3, pp. 269-298.
Martin, T. N. (1979), ‘A Contextual Model of Employee Turnover Intention’, Academy of Management Journal, vol. 22, no. 2, pp. 313-324.
Martin, A. & Roodt, G. (2008), ‘Perceptions of Organisational Commitment, Job Satisfaction and Turnover Intentions in a Post-Merger Tertiary Institution’, SA Journal of Industrial Psychology, vol. 34, no. 1, pp. 23-31.
Mathieu, C., Fabi, B., Lacoursière, R. & Raymond, L. (2015), ‘The Role of Supervisory Behavior, Job Satisfaction and Organizational Commitment on Employee Turnover’, Journal of Management & Organization, Published Online: 01 June 2015 (http://dx.doi.org/10.1017/jmo.2015.25), pp. 1-5.
Mathieu, J. E. & Zajac, D. M. (1990), ‘A Review and Meta-Analysis of the Antecedents, Correlates, and Consequences of Organizational Commitment’, Psychological Bulletin, vol. 108, no. 2, pp. 171-194.
Maurer, T. J. & Lippstreu, M. (2008), ‘Who will be Committed to an Organization that Provides Support for Employee Development?’, Journal of Management Development, vol. 27, no. 3, pp. 328-347.
Mayer, R. C. & Schoorman, F. D. (1992), ‘Predicting Participation and Production Outcomes through A Two-Dimensional Model of Organizational Commitment’, Academy of Management Journal, vol. 35, no. 3, pp. 671-684.
McCall, C. H., Jr. (1982), Sampling Statistics Handbook for Research, Iowa State University Press, Ames, Iowa.
McDonald, R. & Ho, M. (2002), ‘Principles and Practice in Reporting Structural Equation Analyses’, Psychological Methods, vol. 7, no.1, pp. 64-82.
McGaghie, W. & Crandall, S. (2001), ‘Population and Sample’, Academic Medicine, vol. 76, no. 9, pp. 934-935.
McGregor, A., Hons, B., Iverson, D., Caputi, P., Magee, C. & Ashbury, F. (2014), ‘Relationships between Work Environment Factors and Presenteeism Mediated by Employees' Health’, Journal of Occupational & Environmental Medicine, vol. 56, no. 12, pp. 1319-1324.

245
McKevitt, C., Morgan, M., Dundas, R., Holland, W. W. (1997), ‘Sickness Absence and ‘Working Through’ Illness: A Comparison of Two Professional Groups’, Journal of Public Health Medicine, vol. 19, no. 3, pp. 295-300.
McKee, A., Kemp, T. & Spence, G. (2013), Management: A Focus on Leaders, Pearson, Australia.
McKee, M., Driscoll, C., Kelloway, E. & Kelley, E. (2011), ‘Exploring Linkages among Transformational Leadership, Workplace Spirituality and Well-Being in Health Care Workers’, Journal of Management, Spirituality & Religion, vol. 8, no. 3, pp. 233-255.
McCleskey, J. A. (2014), ‘Situational, Transformational, and Transactional Leadership and Leadership Development’, Journal of Business Studies Quarterly, vol. 5, no. 4, p.117.
McNeilly, K. M. & Russ, F. A. (1992), ‘The Moderating Effect of Sales Force Performance on Relationships Involving Antecedents of Turnover’, Journal of Personal Selling and Sales Management, vol. 12, pp. 9-20.
Medibank Research Series (2011), ‘Medibank’s Sick at Work: The Cost of Presenteeism to Your Business and the Economy’, Medibank Research Series, Medibank & KPMG Econtech, Australia.
Meral, E., Melisa, E. K., Lütfihak, A. & İrge, Ş. (2014), ‘The Mediating Role of Mobbing on the Relationship between Organizational Silence and Turnover Intention Procedia’, Social and Behavioral Sciences, vol. 150, no. 15, pp. 1298-1309.
Mercer (2011), Australian Workers Satisfied but Still Looking to Leave: Employee Engagement Risky Business for Employers, accessed 22 October 2012, Mercer Human Resource Consulting, from http://www.mercer.com.au/press-releases/australia-employee-engagement-risky-business
Meyer, J. P. & Smith, C. A. (2000), ‘HRM Practices and Organizational Commitment: Test of a Mediation Model’, Canadian Journal of Administrative Sciences-revue Canadienne des sciences de l’administration, vol. 17, no. 4, pp. 319-331.
Meyer, J. P. & Allen, N. J. (1991), ‘A Three-Component Conceptualization of Organizational Commitment’, Human Resource Management Review, vol.1, pp. 61-89.
Meyer, J. P. & Allen, N. J. (1997), Commitment in the Workplace: Theory, Research, and Application, Sage Publications, Thousand Oaks, CA.
Meyer, J. P., Stanley, D. J., Hersovitch, L. & Topolnytsky, L. (2002), ‘Affective, Continuance, and Normative Commitment to the Organization: A Meta-analysis of Antecedents, Correlates, and Consequences’, Journal of Vocational Behavior, vol. 61, p. 34-35.
Meyer, J. P. & Herscovitch, L. (2001), ‘Commitment in the Workplace: Toward a General Model’, Human Resource Management Review, vol. 11, pp. 299-326.

246
Meyer, J. P., Allen, N. J. & Smith, C. A. (1993), ‘Commitment of Organizations and Occupations: Extension and Test of A Three-Component Conceptualization’, Journal of Applied Psychology, vol. 78, pp. 538-551.
Meyer, J. P., Paunonen, S. V., Gellatly, I. R., Goffin, R. D. & Jackson, D. N. (1989), ‘Organizational Commitment and Job Performance: It’s the Nature of the Commitment that Counts’, Journal of Applied Psychology, vol. 74, no. 1, pp. 152-156.
Meyer, J. P., Stanley, D. J., Herscovitch, L. & Topolnytsky, L. (2002), ‘Affective, Continuance, and Normative Commitment to the Organization: A Meta-analysis of Antecedents, Correlates, and Consequences’, Journal of Vocational Behavior, vol. 61, no. 1, pp. 20-52.
Meyers, L. S, Gamst, G. & Guarino, A. J. (2006), Applied Multivariate Research: Design and Interpretation, Sage Publications, Thousand Oak, CA.
Miao, Q., Newman, A., et al. (2014), ‘Servant Leadership, Trust, and the Organizational Commitment of Public Sector Employees in China’, Public Administration, vol. 92, no. 3, pp. 727-743.
Milano, C. (2005), ‘Being there: can Coming to Work be a Risk’, Risk Management, vol. 52, no. 11, pp. 30-34.
Miles, J. & Shevlin, M. (1998), ‘Effects of Sample Size, Model Specification and Factor Loadings on the GFI in Confirmatory Factor Analysis’, Personality and Individual Differences, vol. 25, pp. 85-90.
Ming, Y. W. (2010), ‘Gender and Cultural Influences on Expected Leadership Styles in the Taiwanese Public Relations Field: Transformational and Transactional Leadership Styles’, China Media Research, vol. 6, no. 1, pp. 37-46.
Mirvis, P., DeJong, D., Googins, B., Quinn, L. & Van Velsor, E. (2010), Responsible Leadership Emerging: Individual, Organizational, and Collective Frontiers, accessed 3 December 2013, from http://www.up.ac.za/media/shared/Legacy/ems.zp11798./Documents/2013-alcrl-position-paper.zp36923.pdf.
Miska, C., Stahl, G. K. & Mendenhall, M. E. (2013), ‘Intercultural Competencies as Antecedents of Responsible Global Leadership’, European Journal of International Management, vol. 7, no. 5, pp. 550–569.
Miska, C. & Mendenhall, M. E. (2016), ‘Responsible Leadership: A Mapping of Extant Research and Future Directions’, Journal of Business Ethics, pp.1-18.
Mitchell, T. R., Holtom, B. C., Lee, T. W., Sablynski, C. J. & Erez, M. (2001), ‘Why People Stay: Using Job Embeddedness to Predict Voluntary Turnover’, Academy of Management Journal, vol. 44, pp. 1102-1121.
Mittal, R. & Dorfman, P. W. (2012), ‘Servant Leadership across Cultures’, Journal of World Business, vol. 47, no. 4, pp. 555-570.

247
Mobley, W. H., Griffeth, R. W., Hand, H. H. & Meglino, B. M. (1979), ‘Review and Conceptual Analysis of the Employee Turnover Process’, Psychological Bulletin, vol. 86, pp. 493-522.
Mobley, W. H. (1982), ‘Some Unanswered Questions in Turnover with Withdrawn Research’, Academy of Management Review, vol. 7, no.1, pp. 111-116.
Moen, P., Kelly, E. L., Tranby, E. & Huang, Q. (2011), ‘Changing Work, Changing Health: Can Real Work-Time Flexibility Promote Health Behaviors and Well-Being?’, Journal of Health and Social Behavior, vol. 52, no. 4, pp. 404-429.
Moody-Stuart, M. (2014), Responsible Leadership: Lessons from the Front Line of Sustainability and Ethics, Greenleaf Publishing, Sheffield, UK.
Moore, J. E. (2000). ‘One Road to Turnover: An Examination of Work Exhaustion in Technology Professionals’, MIS Quarterly, vol. 24, no.1, pp. 141-168.
Morgeson, F. P., Aguinis, H., Waldman, D. A. & Siegel, D. S. (2013), ‘Extending Corporate Social Responsibility Research to the Human Resource Management and Organizational Behavior Domains: A Look to the Future’, Personnel Psychology, vol. 66, pp. 805–824.
Morrison, K. (2010), Complexity Theory, School Leadership and Management: Questions for Theory and Practice’, Educational Management Administration & Leadership, vol. 38, no. 3, pp. 374-393.
Mostovicz, E. I., Kakabadse, A. & Kakabadse, N. K. (2011), ‘The Four Pillars of Corporate Responsibility: Ethics, Leadership, Personal Responsibility and Trust’, Corporate Governance, vol. 11, no. 4, pp. 489-500.
Mowday, R. Porter, I. W. & Steers, R. M. (1982), Employee-Organizational Linkages: The Psychology of Commitment, Absenteeism and Turnover, Academic Press, New York.
Moxham, L. (2012), ‘Nurse Education, Research and Evidence-Based Practice’, in Berman, A., Snyder, S. J., Levett-Jones, T., Hales, M., Harvey, N., Luxford, Y., Moxham, L., Park, T., Parker, B., Reid-Searl, K. & Stanley, D. (Eds.), Kozier & Erb’s Fundamentals of Nursing, vol. 1, Frenchs Forest, Pearson, Sydney.
Mujtaba, B. G., Khanfar, N. M. & Khanfar, S. M. (2010), ‘Leadership Tendencies of Government Employees in Oman: A Study of Task and Relationship based on Age and Gender’, Public Organization Review, vol. 10, no. 2, pp. 173-190.
Mulaik, S. A., James, L. R., van Alstine, J., Bennet, N., Lind, S. & Stilwell, C. D. (1989), ‘Evaluation of Goodness-of-Fit Indices for Structural Equation Models’, Psychological Bulletin, vol. 105, no. 3, pp. 430-445.
Mullen, J. & Kelloway, E. K. (2010), ‘Leading to Occupational Health and Safety’, in Campbell J. & Tetrick, L. (Eds.) Handbook of Occupational Health Psychology, DC: APA Books, Washington,

248
Munasinghe, L. (2006), ‘Expectations Matter: Job Prospects and Turnover Dynamics’, Labour Economics, vol. 13, no. 5, pp. 589-609.
Munir, F., Nielsen, K., Garde, A. H., Albertsen, K. & Carneiro, I. G. (2012), ‘Mediating the Effects of Work-Life Conflict between Transformational Leadership and Health-Care Workers' Job Satisfaction and Psychological Wellbeing’, Journal of Nursing Management, vol. 20, no. 4, pp. 512-521
Murray, L. P., Gregoire, M. B. & Downey, R. G. (1991), ‘Organizational Commitment of Management Employees in Restaurant Operations’, Hospitality Research Journal, vol.14, pp. 339-348.
Myatt, M. (2008), How to Reduce Employee Turnover, accessed 11 August 2012, from http://cpnmhn.typepad.com/management_matters/2008/06/how-to-reduce-e.html150
Nebeker, D. M. (1975), ‘Situational Favorability and Perceived Environmental Uncertainty: An Integrative Approach’, Administrative Science Quarterly, vol. 20, no. 2, pp. 281-294.
Newman, D. A. & Harrison, D. A. (2008), ‘Been There, Bottled That: Are State and Behavioral Work Engagement New and Useful Construct “Wines”?’, Industrial & Organizational Psychology, vol. 1, no. 1, pp. 31-35.
Newman, J. E. (1974), ‘Predicting Absenteeism And Turnover: A Field Comparison of Fishbein’s Model and Traditional Job Attitude Measures’, Journal of Applied Psychology, vol. 59, no. 5, pp. 610-615.
Nielsen, K., Yarker, J., Brenner, S. O., Randall, R. & Borg, V. (2008), ‘The Importance of Transformational Leadership Style for the Well-Being of Employees Working With Older People’, Journal of Advanced Nursing, vol. 63, no. 5, pp. 465-475.
Nielsen, K., Yarker, J., Randall, R. & Munir, F. (2009), ‘The Mediating Effects of Team and Self-Efficacy on the Relationship between Transformational Leadership, and Job Satisfaction and Psychological Well-Being in Healthcare Professionals: A Cross-Sectional Questionnaire Survey’, International Journal of Nursing Studies, vol. 46, no. 9, pp.1236-1244.
Noe, R. A., Hollenbeck, J. R., Gerhart, B. & Wright, P. M. (2005), Human Resource Management: Gaining a Competitive Advantage, McGraw-Hill, New York.
Norman, G. R. & Streiner, D. L. (2003), Prettydarnedquick Statistics, BC Decker, Hamilton, London.
Northouse, P. G. (2006). Leadership: Theory and Practice, Sage Publications, Thousand Oaks, CA.
Northouse, P. G. (2013), Leadership: Theory and Practice, Sage Publications, Thousand Oaks, CA.
Nyberg, A., Alfredsson, L., Theorell, T., Westerlund, H., Vahtera, J. & Kivimaki, M. (2009), ‘Managerial Leadership and Ischaemic Heart Disease among Employees: The Swedish WOLF Study’, Occupational and Environmental Medicine, vol.66, no.1, pp.51-55.

249
Nyberg, A., Westerlund, H., Linda L. Hanson, M. & Theorell, T. (2008), ‘Managerial Leadership is Associated with Self-Reported Sickness Absence and Sickness Presenteeism among Swedish Men and Women’, Scandinavian Journal of Public Health, vol.36, no. 8, pp. 803-811.
O’Reilly, C. A. & Caldwell, D. F. (1981), ‘The Commitment and Job Tenure of New Employees: Some Evidence of Post Decisional Justification’, Administrative Science Quarterly, vol. 26, pp. 597-616.
O’Reilly, C. A. & Chatman, J. (1986), ‘Organizational Commitment and Psychological Attachment: The Effects of Compliance, Identification, and Internalization of Prosocial Behavior’, Journal of Applied Psychology, vol. 71, no.3, pp. 492-499.
Offerman, L. R. & Hellman, P. S. (1996), ‘Leadership Behaviour and Subordinate Stress: A 360 Degrees View’, Journal of Occupational Health Psychology, vol. 1, no.4, pp. 382-390.
Oldham, G. R. & Cummings, A. (1996), ‘Employee Creativity: Personal and Contextual Factors at Work’, Academy of Management Journal, vol. 39, no.3, pp. 607-634.
O’Neill, M. (1996), ‘The Karpin Report’, Business Date, vol. 4, no. 2, pp. 1-5.
Orlitzky, M., Schmidt, F. L. & Rynes, S. (2003), ‘Corporate Social And Financial Performance: A Meta-Analysis’, Organization Studies, vol. 24, no. 3, pp. 403-411.
Osborne, J. W. & Waters, E. (2003), ‘Four Assumptions of Multiple Regressions that Researchers should Always Test’, Practical Assessment, Research and Evaluation, vol. 8, no. 2.
Ozminkowski, R. J., Goetzel, R. Z., Chang, S. & Long, S. (2004), ‘The Application of Two Health and Productivity Instruments at A Large Employer’, Journal of Occupational and Environmental Medicine, vol. 46, no. 7, pp. 635-648.
Paillé, P., Fournier, P. S. & Lamontagne, S. (2011), ‘Relationships Between Commitments to the Organization, the Superior and the Colleagues, and the Intention to Leave Among Truckers’, International Journal of Organizational Analysis, vol. 19, no. 2, pp. 92-108.
Palanski, M., Avey, J. B. & Jiraporn, N. (2014), ‘The Effects of Ethical Leadership and Abusive Supervision on Job Search Behaviors in the Turnover Process’, Journal of Business Ethics, vol. 121, no. 1, pp. 135-146.
Pao-Ling, C. H. (2013), ‘Psychological Contract Breach and Turnover Intention: The Moderating Roles of Adversity Quotient and Gender’, Social Behavior & Personality: an international journal, vol. 41, no, 5, pp. 843-859.
Patton, M. Q. (2002), Qualitative Research and Evaluation Methods, Sage Publications, Thousand Oaks, CA.
Peachey, J. W., Burton, L. J. & Wells, J. (2014), ‘Examining The Influence of Transformational Leadership, Organizational Commitment, Job Embeddedness, and Job

250
Search Behaviors on Turnover Intentions in Intercollegiate Athletics’, Leadership & Organization Development Journal, vol. 35, no. 8, pp. 740-755.
Peat, J, & Barton, B. (2005), Medical Statistics: A Guide to Data Analysis and Critical Appraisal, Blackwell Publishing.
Pelissier, R. (2008), Business Research Made Easy, Juta & Company Ltd., Kenwyn, ZA.
Pentley, L. E. & Gould, S. (1988), ‘Etzioni’s Model of Organizational Involvement: A Perspective for Understanding Commitment to Organizations’, Journal of Organizational behavior, vol. 9, no.1, pp. 43-59.
Pater, R. (2015), ‘Advanced Culture Change Leadership’, Professional Safety, vol. 60, no. 9, pp. 24 26.
Peter, T. J. & Waterman R. H. (1982), ‘In Search of Excellence – Lessons from America’s Best-run Companies’, in Schneider, B., Goldstein, H. W., & Smith, D. B. (1995), The ASA Framework: An update. Personnel Psychology, New York, Harper & Row, vol. 48, pp. 747-783.
Peter, R. & Siegrist, J. (1997), ‘Chronic Work Stress, Sickness Absence and Hypertension in Middle Managers: General or Specific Sociological Explanations?’, Social Science & Medicine, vol. 45, no. 7, pp. 1111-1120.
Petri, B. (2009), ‘Presenteeism in Finland: Determinants by Gender and the Sector of Economy’, Ege Academic Review, vol. 9, no. 3, p.1007.
Pettijohn, C., Pettijohn, L. & Taylor, A. J. (2008), ‘Salesperson Perceptions of Ethical Behaviors: Their Influence on Job Satisfaction and Turnover Intentions’, Journal of Business Ethics, vol.78, no.4, pp. 547-557.
Phillips, R. & Freeman, E. (2003), Stakeholder Theory and Organizational Ethics, Berrett-Koehler, San Francisco, CA.
Phillips, R., Freeman, R. E. & Wicks, A. (2003), ‘What stakeholder theory is not’, Business Ethics Quarterly, vol. 13, no. 4, pp. 479–502.
Phipps, S. T., Prieto, L. C. & Ndinguri, E. N. (2013), ‘Understanding the Impact of Employee Involvement On Organizational Productivity: The Moderating Role Of Organizational Commitment’, Journal of Organizational Culture, Communications & Conflict, vol. 17, no. 2, pp. 107-120.
Pilette, P. C. (2005), ‘Presenteeism and Productivity: Two Reasons Employee Assistance Programs Make Good Business Cents’, Annals of the American Psychotherapy Association, vol. 8, no.1, pp. 12-14.
Pless, N. M. (2007), ‘Understanding Responsible Leadership: Roles Identity and Motivational Drivers’, Journal of Business Ethics, vol. 74, no. 4, pp. 437–456.

251
Pless, N. M. & Maak, T. (2004), ‘Building an Inclusive Diversity Culture: Principles, Processes and Practices’, Journal of Business Ethics, vol. 54, no.2, pp. 129-147.
Pless, N. M. & Maak, T. (2005), ‘Relational Intelligence for Leading Responsibly in a Connected Responsible Leadership’ , in Weaver, K. M. (Ed.), Best Paper Proceedings of the Sixty-Fifth Annual Meeting of the Academy of Management, Honolulu, HI.
Pless, N. M. & Maak, T. (2011), ‘Responsible Leadership: Pathways to the Future’, Journal of Business Ethics, vol. 98, no.1, pp. 3-13.
Pless, N. M., Maak, T. & Stahl, G. K. (2011), ‘Developing Responsible Global Leaders through International Service-Learning Programs: The Ulysses Experience’, Academy of Management Learning & Education, vol. 10, no.2, pp. 237-260.
Pless, N. M., Maak, T. & Waldman, D. A. (2012), ‘Different Approaches Toward Doing the Right Thing: Mapping the Responsibility Orientations of Leaders’, Academy of Management Perspectives, vol. 26, no. 4, pp. 51-65.
Podsakoff, P. M., MacKenzie, S.B., Lee, J. Y. & Podsakoff, N. P. (2003), ‘Common Method Biases in Behavioral Research: A Critical Review of the Literature and Recommended Remedies’, Journal of Applied Psychology, vol. 88, no. 5, pp. 879-903.
Podsakoff, P. M. & Organ, D. W. (1986), ‘Self-Reports in Organizational Research: Problems and Prospects’, Journal of Management, vol. 13, no. 2, pp. 419-441.
Polach, J. (2003), ‘HRD’s Role in Work-Life Integration Issues: Moving the Workforce to a Change in Mindset’, Human Resource Development International, vol. 6, no. 1, pp. 57-68.
Polit, D. F. & Hungler, B. P. (2013), Essentials of Nursing Research: Methods, Appraisal, and Utilization, Wolters Kluwer/Lippincott Williams and Wilkins, Philadelphia.
Porter, L. W., Crampon, W. J. & Smith, F. J. (1976), ‘Organizational Commitment and Managerial Turnover: A Longitudinal Study’, Organizational Behavior and Human Performance, vol.15, no, 1, pp. 87-88.
Porter, L.W. & Steers, R. M. (1973), ‘Organizational, Work, and Personal Factors in Employee Turnover and Absenteeism’, Psychological Bulletin, vol. 80, no. 2, pp. 151-176.
Porter, L., Steers, R., Mowday, R. & Boulian, P. (1974), ‘Organizational Commitment, Job Satisfaction, and Turnover among Psychiatric Technicians’, Journal of Applied Psychology, vol. 59, no. 5, pp. 603-609.
Preacher, K. J. & Hayes, A. F. (2004), ‘SPSS And SAS Procedures for Estimating Indirect Effects in Simple Mediation Models’, Behavior Research Methods, Instruments, and Computers, vol. 36, no, 4, pp. 717-731.
Preckel, D., von Känel, R., Kudielka, B. M. & Fischer, J. E. (2005), ‘Overcommitment to Work is Associated with Vital Exhaustion’, International Archives of Occupational and Environmental Health, vol. 78, no. 2, pp. 117-122.

252
Preziotti, S. & Pickett, K. (2006), ‘New National Survey Shows Employees Feel Pressured to Go to Work Despite Being Sick with Flu’, National Foundation for Infectious Diseases, Fleishman-Hillard Inc., Bethesda.
Price, J. L. & Mueller, C. W. (1981), ‘A Causal Model of Turnover for Nurses’, Academy of Management Journal, vol. 24, pp. 543-565.
Puhakainen, P. & Siponen, M. (2010), ‘Improving Employees’ Compliance through Information Systems Security Training: An Action Research Study’, MIS Quarterly, vol. 34, no. 4, pp. 757-778.
Punch, K. (2003), Survey Research: The Basics, Sage Publications, Thousand Oaks, CA.
PwC (PriceWaterhouseCoopers) (2009), Absence Management, Annual Survey Report, Chartered Institute of Personnel and Development, UK.
Quazi, H. (2013), Presenteeism: The Invisible Cost to Organizations, Palgrave MacMillan, New York.
Rahman, W. & Nas, Z. (2013), ‘Employee Development and Turnover Intention: Theory Validation’, European Journal of Training and Development, vol. 37, no. 6, pp. 564-579.
Raven, B. H. & Rubin, J. Z. (1976), Social Psychology: People in Groups, John Wiley & Sons, Inc., New York.
Ramsey, R. D. (2006), ‘Presenteeism: A New Problem in the Workplace’, Supervision, vol. 67, no. 8, pp. 14-17.
Randall, D. M., Fedor, D. B. & Longenecker, C. O. (1990), ‘The Behavioral Expression of Organizational Commitment’, Journal of Vocational Behavior, vol. 36, pp. 210-224.
Raykov, T. (1997a), ‘Estimation of Composite Reliability for Congeneric Measures’, Applied Psychological Measurement, vol. 21, no. 2, pp. 173-184.
Raykov, T. (1997b), ‘Scale Reliability, Cronbach’s Coefficient Alpha, and Violations of Essential Tau-Equivalence with Fixed Congeneric Components’, Multivariate Behavioral Research, vol. 32, no. 4, pp. 329-353.
Raykov, T. & Marcoulides, G. A. (2006), A First Course in Structural Equation Modeling, Lawrence Erlbaum Associates Inc., Mahwah, New Jersey.
Raykov, T. & Widaman, K. F. (1995), ‘Issues in Applied Structural Equation Modeling Research’, Structural Equation Modeling: A Multidisciplinary Journal, vol. 2, no.4, pp. 289-318.
Reddin, W. J. (1964), ‘The Tri-dimensional Grid’, Training Directors Journal, vol. 18, no. 7, pp. 9-18.
Reichers, A. E. (1985), ‘Review and Reconceptualization of Organizational Commitment’, Academy of Management Journal, vol. 10, no. 3, pp. 465-476.

253
Reilly, M. C., Zbrozek, A. S. & Dukes, E. M. (1993), ‘The Validity and Reproducibility of a Work Productivity and Activity Impairment Instrument’, Pharmacoeconomics, vol. 4, no. 5, pp. 353-365.
Reese, K. (1992), The Professional Concern for the Personnel Manager, Lexicon Publishers. NY,
Rennesund, A. B. & Saksvik, P. O. (2010), ‘Work Performance Norms and Organizational Efficacy as Cross-Level Effects on the Relationship between Individual Perceptions of Self-Efficacy, Overcommitment, and Work-Related Stress’, European Journal of Work and Organizational Psychology, vol. 19, no. 6, pp. 629-653.
Reynolds, N., Diamantopoulos, A. & Schlegelmilch, B. B. (1993), ‘Pretesting in Questionnaire Design: A Review of the Literature and Suggestions for Further Research’, Journal of the Market Research Society, vol. 35, no. 2, pp.171-182.
Rhoades, L. & Eisenberger, R. (2002), ‘Perceived Organizational Support: A Review of the Literature’, Journal of Applied Psychology, vol. 87, no. 4, pp. 698-714.
Rhoades, L., Eisenberger, R. & Armeli, S. (2001), ‘Affective Commitment to the Organization: The Contribution to Perceived Organizational Support’, Journal of Applied Psychology, vol. 86, no. 5, pp. 825-836.
Rigdon, E. E. (1998), ‘Structural Equation Modeling in Modern methods for business research’ in Marcoulides, G. A. (Eds.). Mahwah, NJ: Lawrence Erlbaum Associates, Publishers, Lawrence Erlbaum Associates, Publishers, Mahwah, NJ, pp. 251-294.
Robbins, S. P. & Coulter, M. (2003), Management, Prentice-Hall, Englewood Cliffs, NJ.
Roche, M. A., Duffield, C. M., Homer, C., Buchan, J. & Dimitrelis, S. (2015), ‘The Rate and Cost of Nurse Turnover in Australia’, Collegian, vol. 22, pp. 353-358.
Ross, S. J. & B. Mackey (2015), ‘Bayesian Approaches to Imputation, Hypothesis Testing, and Parameter Estimation’, Language Learning, vol. 65, no. 1, pp. 208-227.
Rubin, A. (2009), Statistics for Evidence-Based Practice and Evaluation, Brooks Cole, Belmont, CA.
Ruez, P. (2004), ‘Quality and Bottom-Line can Suffer at The Hands of the Working Sick’, Managed Healthcare Executive, vol. 14, no. 11, pp. 46-48.
Sager, J. K., Griffeth, R. W. & Horn, P. W. (1998), ‘A Comparison of Structural Models Representing Turnover Cognitions’, Journal of Vocational Behaviour, vol. 53, no. 2, pp. 254-273.
Şahin, İ., Akyürek, C. E. & Yavuz, S. (2014), ‘Assessment of Effect of Leadership Behaviour Perceptions and Organizational Commitment of Hospital Employees on Job Satisfaction with Structural Equation Modelling’, Journal of Health Management, vol. 16, no. 2, p. 161-177.

254
Salancik, G. R. & Meindl, J. R. (1984), ‘Corporate Attributions as Strategic Illusions of Management Control’, Administrative Science Quarterly, vol. 29, no. 2, pp. 238-254.
Salancik, G. R. (1977), Commitment and the Control of Organizational Behavior: New Directions in Organizational Behavior, St. Clair Press, Chicago.
Salami, S. O. & Omole, O. A. (2005), ‘Participation in Decision Making Process: Incentives and Training as Predictors of Organisational Commitment among Industrial Workers’, African Journal for the Psychological Study of Social Issues, vol. 8, no. 2, pp. 210-227.
Salgado, J. F. & Moscoso, S. (2002), ‘Comprehensive Meta-Analysis of the Construct Validity of the Employment Interview’, European Journal of Work and Organizational Psychology, vol. 11, no. 3, pp. 299-324.
Salmon, A. (2007), ‘Walking the Talk: How Participatory Interview Methods Can Democratize Research’, Qualitative Health Research, vol. 17, no. 7, pp. 982-993.
Samad, S. (2006), ‘The Contribution of Demographic Variables: Job Characteristics & Job Satisfaction on Turnover Intentions’, Journal of International Management Studies, vol.1, no.1, pp. 1-12.
Saranya, R. & S. Muthumani (2015), ‘Impact of Perceived Organisation Support and Organisation Commitment on Turnover Intention of Women Employees in IT Industry’, Journal of Theoretical & Applied Information Technology, vol. 75, no. 2, pp. 256-261.
Sashkin, M. & Burke, W. W. (1990), ‘Understanding and Assessing Organizational Leadership’, in Clark, K. E. & Clark, M. B. (Eds), Measures of Leadership, Leadership Library of America Inc., West Orange, NJ, pp. 297-326.
Sashkin, M. & Rosenbach, W. E. (1998), The Leadership Profile, Seabrook, Ducochon Press, MD.
Savalei, V. & Bentler, P. M. (2006), ‘Structural Equation Modeling', in Grover, R & Vriens, M. (Eds.), Handbook of Marketing Research: Uses, Misuses, and Future Advances, Sage Publications, Thousand Oaks, pp. 330-364.
Schappe, S. (1998), ‘The Influence of Job Satisfaction, Organizational Commitment, and Fairness Perceptions on Organizational Citizenship Behaviour’, the Journal of Psychology, vol. 132, no. 3, pp. 277-290.
Schaufeli, W. B., Bakker, A. B. & van Rhenen, W. (2009), ‘How Changes in Job Demands and Resources Predict Burnout, Work Engagement, and Sickness Absenteeism’, Journal of Organisational Behaviour, vol. 30, no. 7, pp. 893-917.
Schuler, R. S. & Jackson, S. E. (1987), ‘Organisational Strategy and Organisational Level as Determinants of Human Resource Management Practices’, Human Resource Planning, vol. 10, no. 3, pp. 125-141.

255
Scherer, A. G. & Palazzo, G. (2008), ‘Globalization and Corporate Social Responsibility’, in Crane, A. McWilliams, A. Matten, D. Moon, J. & Siegel, D. S. (Eds.), Oxford Handbook of Corporate Social Responsibility, Oxford University Press, Oxford, pp. 413-431.
Scherer, A. G., Baumann-Pauly, D. & Schneider, A. (2013), ‘Democratizing Corporate Governance: Compensating for the Democratic Deficit of Corporate Political Activity and Corporate Citizenship’, Business and Society, vol. 52, vol. 3, pp. 473-514.
Scherer, A. G., Palazzo, G. & Matten, D. (2009), ‘Globalization as a Challenge for Business Responsibilities’, Business Ethics Quarterly, vol. 19, no. 3, pp. 327-347.
Schreiber, J. D. (2008), ‘Core Reporting Practices in Structural Equation Modeling’, Research in Social and Administrative Pharmacy, vol. 4, no. 2, pp. 83-97.
Schultz, A. B. & Edington, D. (2007), ‘Employee Health and Presenteeism: A Systematic Review’, Journal of Occupational Rehabilitation, vol. 17, no. 3, pp. 547-579.
Schumacker, R. E. & Lomax, R. G. (2004), A Beginner’s Guide to Structural Equation Modeling, Lawrence Erlbaum Associates, New Jersey.
Schumacker, R. E. & Lomax, R. G. (2010), A Beginner's Guide to Structural Equation Modeling, Routledge, Taylor & Francis Group, New York, NY.
Schwandt, D. & Marquardt, M. (2000), Organizational Learning: From World-Class Theories to Global Best Practices, Boca Raton, FL: CRC Press, LLC.
Schwartz, T. & McCarthy, C. (2007), Manage Your Energy, Not Your Time, Harvard Business Review, October.
Scuffham, P. A., Vecchio, N. & Whiteford, H. A. (2014), ‘Exploring the Validity of HPQ-Based Presenteeism Measures to Estimate Productivity Losses in the Health and Education Sectors’, Medical decision making : An International Journal of the Society for Medical Decision Making, vol. 34, no. 1, pp. 127-137.
Sears, L. E., Shi, Y. Y., Coberley, C. R. & Pope, J. E. (2013), ‘Overall Well-Being as a Predictor of Health Care, Productivity, and Retention Outcomes in a Large Employer’, Journal of Population Health Management, vol. 16, no. 6, pp. 397-405.
Sekaran, U. (2003), Research Methods for Business: A Skill Building Approach, Wiley, New York.
Seltzer, J. & Numerof, R. E. (1988), ‘Supervisory Leadership and Subordinate Burnout’, Academy of Management Journal, vol. 31, no. 2, pp. 439-446.
Sendjaya, S., Sarros, J. C. & Santora, J. C. (2008), ‘Defining and Measuring Servant Leadership Behaviour in Organizations’, Journal of Management Studies, vol. 45, no. 2, pp. 403-424.
Setterlind, S. & Larsson, G. (1995), ‘The Stress Profile: A Psychosocial Approach to Measuring Stress’, Stress Medicine, vol. 11, no.2, pp. 85-92.

256
Shah, R. & Goldstein, S. M. (2006), ‘Use of Structural Equation Modeling in Operations Management Research: Looking Back and Forward’, Journal of Operations Management, vol. 24, pp. 148-169.
Sheldon, M. E. (1971), ‘Investments and Involvements as Mechanisms Producing Commitment to the Organization’, Administrative Science Quarterly, vol. 16, pp. 142-150.
Sheridan, J. E. & Vredenburgh, D. J. (1978), ‘Usefulness of Leader Behavior and Social Power Variables in Predicting Job Tension, Performance, and Turnover of Nursing Employees’, Journal of Applied Psychology, vol. 63, no. 1, pp 89-95.
Shamansky, S. L. (2002), ‘Presenteeism…When being there is not being there’, Public Health Nursing, vol.19, no. 2, pp, 79-80.
Shore, L. M., Barksdale, K. & Shore, T. H. (1995), ‘Managerial Perceptions of Employee Commitment to the Organization’, Academy of Management Journal, vol. 38, pp. 1593-1615.
Shrout, P. E. & Bolger, N. (2002), ‘Mediation in Experimental and Nonexperimental Studies: New Procedures and Recommendations’, Psychological Methods, vol. 7, no. 4, pp. 422-445.
Sieben, I. (2007), ‘Does Training Trigger Turnover – or Not? The Impact of Formal Training on Graduates’ Job Search Behaviour’, Work, Employment and Society, vol. 21, no. 3, pp. 397-416.
Siegel, D. S. (2014), ‘Responsible Leadership’, Academy of Management Perspectives, vol. 28, no. 3, pp. 221-223.
Siegrist, J., Starke, D., Chandola, T., Godin, I., Marmot, M., Niedhammer, I. & Peter, R. (2004), ‘The Measurement of Effort-Reward Imbalance at Work: European Comparisons’, Social Science and Medicine, vol. 58, no. 8, pp. 1483-1499.
Siegrist, J. (1996), ‘Adverse Health Effects of High-Effort/Low-Reward Conditions’, Journal of Occupational Health Psychology, vol. 1, no.1, pp. 27-41.
Siegrist, J. (2001), ‘A Theory of Occupational Stress’, in Dunham, J. (Eds.), Stress in the workplace: past, present and future, Whurr Publishers, London, pp. 52-66.
Siegrist, J. (2002). ‘Effort-Reward Imbalance at Work and Health’, in Perrewe, P. L. &. Ganster, D. C. (Eds.), Historical and Current Perspectives on Stress and Health, Elsevier Science Ltd., Oxford, UK, vol. 2, pp. 261-291.
Siegrist, J. (2008), ‘Effort-Reward Imbalance and Health in a Globalized Economy’, Scandinavian Journal of Work Environment & Health, vol. 6, pp. 163-168.
Silverthorne, C. (2001), ‘Situational Leadership as a Predictor of Success and Productivity among Taiwanese Business Organizations’, Journal of Psychology, vol.135, no.4, pp. 399-413.

257
Silverthorne, C. (2004). ‘The Impact of Organizational Culture and Person-Organization Fit on Organizational Commitment and Job Satisfaction in Taiwan’, Leadership & Organization Development Journal, vol. 25, no. 7, pp. 592-599.
Simmerly, R. G. (1987), Strategic Planning and Leadership in Continuing Education, Jossey- Bass Publishers, San Francisco.
Simo, P., Enache, M., Leyes, J. & Fernandez, A. (2010), ‘Analysis of the Relation between Subjective Career Success, Organizational Commitment and the Intention to Leave the Organization’, Transylvanian Review of Administrative Sciences, vol. 29, no. 1, pp. 144-158.
Simpson, R. (1998), ‘Presenteeism, Power and Organizational Change: Long Hours as a Career Barrier and the Impact on the Working Lives of Women Managers’, British Journal of Management, vol. 9, no. 1, pp. 37-50.
Singh, B., Gupta, P. K. & Venugopal, S. (2008), ‘Organisational Commitment: Revisited’, Journal of the Indian Academy of Applied Psychology, vol. 34, no.1, pp. 57-68.
Skinner, B. F. (1972), Cumulative Record, Appleton Century-Crofts, New York.
Skogstad, A., Einarsen, S., Torsheim, T., Aasland, M. S. & Hetland, H. (2007), ‘The Destructiveness of Laissez-Faire Leadership Behavior’, Journal of Occupational Health Psychology, vol. 12, no. 1, pp. 80-92.
Smith, D. J. (1970), ‘Absenteeism and Presenteeism in Industry’, Archives of Environmental Health, vol. 21, pp. 670-677.
Solinger, O. N., Olffen, W. V. & Roe, R. A. (2008), ‘Beyond the Three-Component Model of Organizational Commitment’, Journal of Applied Psychology, vol. 93, no. 1, pp. 70-83.
Sosik, J. J. & Godshalk, V. M. (2000), ‘Leadership Styles, Mentoring Functions Received and Job-Related Stress: A Conceptual Model and Preliminary Results’, Journal of Organizational Behavior, vol. 21, no.4, pp. 365-390.
Sosik, J. J. & Godshalk, V. M. (2001), ‘Self-Other Rating Agreement in Mentoring: Meeting Protégé Expectations for Development’, Proceedings of the Institute of Behavioral and Applied Management, Charleston, SC, pp. 130-147.
Spector, P. E. (1997), Job Satisfaction: Application, Assessment, Causes and Consequences, Sage Publications, Thousand Oaks, CA.
Spreitzer, G. (2007), ‘Participative Organizational Leadership, Empowerment, and Sustainable Peace’, Journal of Organizational Behavior, vol. 28, no. 8, pp. 1077-1096.
Stahl, G. K. & De Luque, M. S. (2014), ‘Antecedents of Responsible Leader Behavior: A Research Synthesis, Conceptual Framework, and Agenda for Future Research’, Academy of Management Perspectives, vol. 28, no. 3, pp. 235-254.

258
Stahl, G. K., Pless, N. & Maak, T. (2013), ‘Responsible Global Leadership’, in Mendenhall, M., Osland, J., Bird, A., Oddou, G., Maznevski, M. & Stahl, G. K. (Eds.), Global leadership: Research, practice and development, Routledge, London, pp. 240-259.
Stansbury, J. (2009), ‘Reasoned Moral Agreement: Applying Discourse Ethics within Organizations’, Business Ethics Quarterly, vol. 19, no. 1, pp. 33-56.
Stasser, G. & Titus, W. (1985), ‘Pooling of Unshared Information in Group Decision Making: Biased Information Sampling During Discussion’, Journal of Personality and Social Psychology, vol. 48, no. 6, pp. 1467-1478.
Steel, R. P. & Ovalle, N. K. (1984), ‘A Review and Meta-Analysis of Research on the Relationship between Behavioral Intentions and Employee Turnover’, Journal of Applied Psychology, vol. 69, no. 4, pp. 673-686.
Steers, R. (1977), ‘Antecedents and Outcomes of Organizational Commitment’, Administrative Science Quarterly, vol. 22, no. 1, pp. 46-56.
Steiger, J. H. (2007), ‘Understanding the Limitations of Global Fit Assessment in Structural Equation Modeling’, Personality and Individual Differences, vol. 42, no. 5, pp. 893-98.
Steultjens, E., Baker, N. & Aas, R. W. (2012), ‘Organizational Leadership, Health Risk Screening, Individually Tailored Programs, and Supportive Workplace Culture Might Reduce Presenteeism’, Australian Occupational Therapy Journal, vol. 59, no. 3, pp. 247-248.
Stewart, W. F., Ricci, J. A., Chee, E. & Morganstein, D. (2003), ‘Lost Productive Work Time Costs from Health Conditions in the United States: Results from the American Productivity Audit’, Journal of Occupational and Environmental Medicine, vol. 45, pp. 1234-1246.
Stinglhamber, F., Bentein, K. & Vandenberghe, C. (2002), ‘Extension of the Three Component Model of Commitment to Five Foci: Development of Measures and Substantive Test’, European Journal of Psychological Assessment, vol. 18, pp. 123-138.
Stogdill, R. M. (1948), ‘Personal Factors Associated with Leadership: A Survey of the Literature, Journal of Psychology, vol. 25, no.1, pp. 35-71.
Stogdill, R. (1963), Manual for the Leader Behavior Description Questionnaire-Form XII, Columbus, Bureau of Business Research, Ohio State University, OH.
Stogdill, R.M. (1974), Hanbook of Leadership, Free Press, New York.
Stone, A. G., Russell, R. F. & Patterson, K. (2004), ‘Transformational versus Servant Leadership: a Difference in Leader Focus’, Leadership & Organization Development Journal, vol. 25, no. 4, pp. 349-361.
Stordeur, S., Vandenberghe, C. & D’hoore, W. (2001), ‘Leadership, Organizational Stress, and Emotional Exhaustion among Hospital Nursing Staff’, Journal of Advanced Nursing, vol. 35, no. 4, pp. 533-542.
259
Stumpf, S. A. & Hartman, K. (1984), ‘Individual Exploration to Organizational Commitment or Withdrawal’, Academy of Management Journal, vol. 27, no. 2, pp. 308-329.
Stumpf, S. A., Doh, J. P. & Tymon, W. (2009), ‘Capitalizing on Human Resource Management in India: The Link between HR Practices and Employee Performance’, Human Resource Management, vol. 49, no. 3, pp. 351-373.
Sugawara, H. M. & Maccallum, R. C. (1993), 'Effect of Estimation Method on Incremental Fit Indexes for Covariance Structure Models', Applied Psychological Measurement, vol. 17, no. 4, pp. 365-377.
Suk, B. C., Thi-Bich T. & Byung, P. (2015), ‘Inclusive Leadership and Work Engagement: Mediating Roles of Affective Organizational Commitment and Creativity’, Social Behavior & Personality: An International Journal, vol. 43, no. 6, pp. 931-943.
Sullivan, P. J. (1993), ‘Occupational Stress in Psychiatric Nursing’, Journal of Advanced Nursing, vol. 18, no. 4, pp. 591-601.
Sun, R. Y. (2002), ‘The Relationship among the Leadership Style, Organizational Culture and Organizational Effectiveness Based on Competing Value Framework: An Empirical Study for the Institute of Technology In Taiwan’, Unpublished doctoral dissertation, National Taipei University, Taipei, Taiwan.
Swider, B. W., Boswell, W. R. & Zimmerman, R. D. (2011), ‘Examining the Job Search– Turnover Relationship: The Role of Embeddedness, Job Satisfaction, and Available Alternatives’, Journal of Applied Psychology, vol. 96, no. 2, pp. 432-441.
Tabachnick, B. G. & Fidell, L. S. (2007), Using Multivariate Statistics, Allyn and Bacon, Boston.
Tabachnick, B. G. & Fidell, L. S. (2013), Using Multivariate Statistics, Pearson/Allyn and Bacon, Boston.
Taifor, N. A., Abdullah, H. S. & Hashim, R. (2011), ‘Incidence and Antecedents of Presenteeism: The Case of A Federal Government Ministry in Malaysia’, Humanities, Science and Engineering (CHUSER), IEEE Colloquium on, pp. 654-659.
Takala, T. (1999), ‘Ownership, Responsibility and Leadership: A Historical Perspective’, International Journal of Social Economics, vol. 26, no. 6, pp. 742-751.
Takase, M., Teraoka, S. & Kousuke, Y. (2015), ‘Investigating the adequacy of the Competence-Turnover Intention Model: how does nursing competence affect nurses' turnover intention?’, Journal of Clinical Nursing, vol. 24, no. 5/6, pp. 805-816.
Tannenbaum, R. & Schmidt, W. (1958), ‘How to Choose a Leadership Pattern’, Harvard Business Review, vol. 36, no. 2, pp.95-101.
Tenbrunsel, A. E. & Smith-Crowe, K. (2008), ‘Ethical Decision-Making: Where We’ve Been and Where We’re Going’, Academy of Management Annals, vol. 2, no.1, pp. 545-607.

260
Tepper, B. (2000), ‘Consequences of Abusive Supervision’, Academy of Management Journal, vol. 43, no. 2, pp. 178-190.
Tett, R. P. & Meyer, J. P. (1993), ‘Job Satisfaction, Organizational Commitment, Turnover Intention, and Turnover: Path Analyses Based on Meta-Analytic Findings’, Personnel Psychology, vol. 46, no. 2, pp. 259-293.
Thomas, D. A. (2004), ‘Diversity as a Strategy’, Harvard Business Review, vol. 82, no. 9, pp. 1-11.
Thomspson, B. (2004), Exploratory and Confirmatory Factor Analysis, American Psychological Association, Washington, DC.
Top, M., Akdere, M. & Tarcan, M. (2015), ‘Examining Transformational Leadership, Job Satisfaction, Organizational Commitment and Organizational Trust in Turkish Hospitals: Public Servants Versus Private Sector Employees’, International Journal of Human Resource Management, vol. 26, no. 9, pp. 1259-1282.
Trevino, L. K. (1990), A Cultural Perspective on Changing Organizational Ethics, In R. Woodman & W. Passmore (Eds.), JAI Press, Greenwich, CT, pp. 195-230.
Triandis, H. (1977), Interpersonal Behavior, Brooks/Cole, Monterey, CA.
Trimble, D. E. (2006), ‘Organizational Commitment, Job Satisfaction, and Turnover Intentions of Missionaries’, Journal of Psychology and Theology, vol. 34, no. 4, pp. 349-360,
Tse, H. M., Huang, X. & Lam, W. (2013), ‘Why does Transformational Leadership Matter for Employee Turnover? A Multi-Foci Social Exchange Perspective’, Leadership Quarterly, vol. 24, no. 5, pp. 763-776.
Tsutsumi, A. & Kawakami, N. (2004), ‘A Review of Empirical Studies on the Model of Effort-Reward Imbalance at Work: Reducing Occupational Stress by Implementing A New Theory’, Social Science & Medicine, vol. 59, no.11, pp. 2335-2359.
Tsutsumi, A., Kayaba, K., Theorell, T. & Siegrist, J. (2001), ‘Association Between Job Stress And Depression Among Japanese Employees Threatened by Job Loss in a Comparison Between Two Complementary Job-Stress Models’, Scandinavian Journal of Work Environment & Health, vol. 27, no. 2, pp. 146-153.
Turner, N., Barling, J., Epitropaki, O., Butcher, V. & Milner, C. (2002), ‘Transformational Leadership and Moral Reasoning’, Journal of Applied Psychology, vol. 87, no. 2, pp. 304-311.
Turpin, R. S., Ozminkowski, R. J., Sharda, C. E., et al. (2004), ‘Reliability and Validity of the Stanford Presenteeism Scale’, Journal of Occupational and Environmental Medicine, vol. 46, no. 11, pp. 1123-1133.
Tymon, W., Stumpf, S. A. & Doh, J. P. (2010), ‘Exploring Talent Management in India: The Neglected Role of Intrinsic Rewards’, Journal of World Business, vol. 45, no, 2, pp. 109-121.

261
Uhl-Bien, M. (2006), ‘Relational Leadership Theory: Exploring the Social Processes of Leadership and Organizing’, Leadership Quarterly, vol. 17, no. 6, pp. 654-676.
Urbonas, G., Kubiliene, L., Kubilius, R. & Urboniene, A. (2015), ‘Assessing the Effects of Pharmacists' Perceived Organizational Support, Organizational Commitment and Turnover Intention on Provision of Medication Information at Community Pharmacies in Lithuania: A Structural Equation Modeling Approach’, BMC Health Services Research, vol. 15, no. 1, pp.1-10.
van Dierendonck, D. (2011), ‘Servant Leadership: A Review and Synthesis’, Journal of Management, vol. 37, no.4 , pp. 1228-1261.
van Dierendonck, D., Haynes, C., Borrill, C. & Stride, C. (2004), ‘Leadership Behavior and Subordinate Well-Being’, Journal of Occupational Health Psychology, vol. 9, no. 2, pp. 165-175.
van Vegchel, N., de Jonge, J., Bosma, H. & Schaufeli, W. (2005), ‘Reviewing The Effort-Reward Imbalance Model: Drawing Up the Balance of 45 Empirical Studies’, Social Science & Medicine, vol. 60, no.5, pp. 1117-1131.
van Wart, M. (2003), ‘Public-Sector Leadership Theory: An Assessment’, Public Administration Review, vol. 63, no. 2, pp. 214-229.
Vegchel, N. V., Jonge,J. D.,Bakker, A. B. & Schaufeli, W. B. (2002), ‘Testing Global And Specific Indicators of Rewards in the Effort-Reward Imbalance Model: Does it Make any Difference?’, European Journal of Work and Organizational Psychology, vol. 11, no. 4, pp. 403-421.
Voegtlin, C. (2011), ‘Development of a Scale Measuring Discursive Responsible Leadership’, Journal of Business Ethics, vol. 98, no. 1, pp. 57-73.
Voegtlin, C., Patzer, M. & Scherer, A. G. (2012), ‘Responsible Leadership in Global Business: A New Approach to Leadership and its Multi-Level Outcomes’, Journal of Business Ethics, vol. 105, no. 1, pp. 1-16.
Voss, M., Floderus, B. & Diderichsen, F. (2004), ‘How do Job Characteristics, Family Situation, Domestic Work and Lifestyle Factors Relate to Sickness Absence? A study based on Sweden Post’, Journal of Occupational and Environmental Medicine, vol. 46, no. 11, pp. 1134-1143.
Vrijkotte, T., van Doornen, L. & de Geus, E. (1999), ‘Work Stress and Metabolic and Hemostatic Risk Factors’, Psychosomatic Medicine, vol. 61, no.6, pp. 796-805.
Vroom, V. H. & Jago, A. G. (2007), ‘The Role of Situation in Leadership’, American Psychologists, vol. 62, no. 1, pp.17-24.
Vroom, V. H. & Yetton, P. W. (1973), Leadership and Decision Making, University of Pittsburgh Press, Pittsburgh, PA.

262
Wagner, J. I., Warren, S., Cummings, G., et al. (2013), ‘Resonant Leadership, Workplace Empowerment, and “Spirit at Work”: Impact on RN Job Satisfaction and Organizational Commitment’, Canadian Journal of Nursing Research, vol. 45, no. 4, pp. 108-128.
Waldman, D. A. (2011), ‘Moving Forward With the Concept of Responsible Leadership: Three Caveats To Guide Theory and Research’, Journal of Business Ethics, vol. 98, no. 1, pp. 75-83.
Waldman, D. A. & Balven, R. M. (2015), ‘Responsible Leadership: Theoretical Issues and Research Directions’, Academy of Management Perspectives, vol. 1, no. 1. pp. 19-29.
Waldman, D. A. & Galvin, B. M. (2008), ‘Alternative Perspectives of Responsible Leadership’, Organizational Dynamics, vol. 37, no. 4, pp. 327-341.
Waldman, D. A. & Siegel, D. (2008), ‘Defining the Socially Responsible Leader’, Leadership Quarterly, vol. 19, no. 1, pp. 117-131.
Waldman, D. A. & Yammarino, F. J. (1999), ‘CEO Charismatic Leadership: Levels-of-Management and Levels-of-Analysis Effects’, Academy of Management Review, vol. 24, no. 2, pp. 266-285.
Walsh, J. P., Weber, K. & Margolis, J. D. (2003), ‘Social Issues and Management: Our Lost Cause Found’, Journal of Management, vol. 29, no.6, pp. 859-881.
Walumbwa, F. O., Avolio, B. J., Gardner, W. L., Wernsing, T. S. & Peterson, S. J. (2008), ‘Authentic Leadership: Development and Analysis of A Multidimensional Theory-Based Measure’, Journal of Management, vol. 34, no.1, pp. 89-126.
Walumbwa, F. O., Wang, P., Wang, H., Schaubroeck, J. & Avolio, B. J. (2010), ‘Psychological Processes Linking Authentic Leadership to Follower Behaviours’, Leadership Quarterly, vol. 21, no. 5, pp. 901-914.
Wang, C. H. & Yen, C. D. (2015), ‘Leadership and Turnover Intentions of Taiwan TV Reporters: The Moderating Role of Safety Climate’, Asian Journal of Communication, vol. 25, no. 3, pp. 255-270.
Wang, P. S., Beck, A., Berglund, P., Leutzinger, J. A., Pronk, N., Richling, D., et al. (2003), ‘Chronic. Medical Conditions and Work Performance in the Health and Work Performance Questionnaire Alibration Surveys’, Journal of Occupational and Environmental Medicine, vol. 45, no. 12, pp. 1303-1311.
Watty, B. W. & Udechukwu, I. (2014), ‘The Relationship Between HRM Practices And Turnover Intentions: A Study of Government and Employee Organizational Citizenship Behavior in the Virgin Islands’, Public Personnel Management, vol. 43, no. 1, pp. 58-82.
Weaver, R. (2010), Cost of Presenteeism Surpasses Absenteeism, accessed May 19, 2012, from http://www.examiner.com/human-capital-in-detroit/cost-of-presenteeism-surpasses-absenteeism

263
Wells, J. E. & Peachey, J. W. (2011), ‘Turnover Intentions: Do Leadership Behaviors and Satisfaction with the Leader Matter?’, Team Performance Management, vol. 17, no. 1, pp. 23-40.
Werhane, P. H. (1999), Moral Imagination and Management Decision Making, Oxford University Press, New York, Oxford.
Westburgh, E.M. (1931), ‘A Point of View: Studies in Leadership’, Journal of Abnormal and Social Psychology, vol. 25, no. 4, pp. 418-423.
Westerlund, H., Nyberg, A., Bernina, P., Hyde, M., et al., (2009), ‘Managerial Leadership is Associated with Employee Stress, Health, and Sickness Absence Independently of the Demand Control Support Model’, Journal of Prevention, Assessment and Rehabilitation, vol. 37, no. 1, pp. 71-79.
Westerlund, H., Nyberg, A., Bernin, P., Hyde, M., et al. (2010), ‘Managerial Leadership is Associated with Employee Stress, Health, and Sickness Absence Independently of the Demand-Control-Support Model’, Work, vol. 37, no. 1, pp.71-79.
Wheatley, M. J. (1994), Leadership and the New Science, Berrett-Koehler Publishers, San Francisco, CA.
Wheaton, B., Muthen, B., Alwin, D., F. & Summers, G. (1977), ‘Assessing Reliability and Stability in Panel Models’, Sociological Methodology, vol. 8, no. 1, pp. 84-136.
White, L. & Millar, R. B. (2014), ‘Quantitative Approaches’, in Wright-St Clair, V., Reid, D., Shaw S. & Ramsbotham, J. (Eds.), Evidence based Health Practice, Oxford University Press, South Melbourne.
Whitehouse, D. (2005), ‘Workplace Presenteeism: How Behavioral Professionals can Make a Difference’, Behavioral Healthcare Tomorrow, vol. 14, pp. 32-35.
Wiener, Y. (1982), ‘Commitment in Organizations: A Normative View’, Academy of Management Review, vol. 7, no. 3, pp. 418-428.
Wiener, Y. & Gechman, A. S. (1977), ‘Commitment: A Behavioral Approach to Job Involvement’, Journal of Vocational Behavior, vol. 10, no. 1, pp. 47-52.
Wilcoxon, S. (1989), ‘Leadership Behavior and Therapist Burnout: A Study of Rural Agency Settings’, Journal of Rural Community Psychology, vol. 10, no. 2, pp. 3-14.
Williden, M., Schofield, G. & Duncan, S. (2012), ‘Establishing Links between Health and Productivity in the New Zealand Workforce’, Journal of Environmental Medicine, vol. 54, no. 5, pp. 545-550.
Wittenberg, J., Harmon, J., Russel, W. G. & Fairfield, K. D. (2007), ‘HR’s Role in Building a Sustainable Enterprise: Insights from some World’s best Companies’, Human Resource Planning, vol. 30, no. 1, pp. 10-20.

264
Wong, G. (2014), ‘Research Questions’, in Wright-St C. V., Reid, D., Shaw S. & Ramsbotham, J. (Eds.), Evidence-based Health Practice, Oxford University Press, South Melbourne.
Wofford, J. C. & Liska, L. Z. (1993), Path-Goal Theories of Leadership: A Meta-Analysis, Journal of Management, vol. 19, no. 4, p. 587.
Worrall, L. & Cooper, C. L. (2007), ‘Managers' Work-Life Balance and Health: The Case of UK Manager’, European Journal of International Management, vol. 1, no. (1/2), pp. 129-145
Worrall, L., Cooper, C. & Campbell, F. (2000), ‘The New Reality for UK Managers: Perpetual Change and Employment Instability’, Work, Employment and Society, vol. 14, no.4, pp. 647-668.
Wren, J. T. (1995), The Leaders Companion: Insights on Leadership Through The Ages, The Free Press. New York.
Wright, D. W., Beard, M. J. & Edington, D. W. (2002), ‘Association of Health Risks with the Cost of Time Away from Work’, Journal of Occupational and Environmental Medicine, vol. 44, no.12, pp.1126-1134.
Wright, P. M. & Kehoe, R. R. (2008), ‘Human Resource Practices and Organizational Commitment: A Deeper Examination’, Asia Pacific Journal of Human Resources, vol. 46, no. 1, pp. 6-20.
Wright, P. M., McMahan, G. C. & McWilliams, A. (1994), ‘Human Resources and Sustained Competitive Advantage: A Resource-Based Perspective’, International Journal of Human Resource Management, vol. 5, no. 2, pp. 301-326.
Wrzesniewski, A. & Dutton, J. E. (2001), ‘Crafting a Job: Revisioning Employees as Active Crafters of their Work’, Academy of Management Review, vol. 26, no.2, pp. 179-201.
Xueli, W., Lin, M. A. & Mian, Z. (2014), ‘Transformational Leadership and Agency Workers' Organizational Commitment: The Mediating Effect of Organizational Justice and Job Characteristics’, Social Behavior & Personality: An International Journal, vol. 42, no, 1, pp. 25-36.
Yammarino, F. J., Spangler, W. D. & Bass, B. M. (1993), ‘Transformational Leadership and Performance: A Longitudinal Investigation’, Leadership Quarterly, vol. 4, pp. 81-102.
Yang, B. (2003), ‘Identifying Valid and Reliable Measures for Dimensions of a Learning Culture’, Advances in Developing Human Resources, vol. 5, no. 2, pp. 152-162.
Yeh, H. & Hong, D. (2012), ‘The Mediating Effect of Organizational Commitment on Leadership Type and Job Performance’, Journal of Human Resource and Adult Learning, vol. 8, no. 2, pp. 50-59.
Youndt, M. A., Subramaniam, M. & Snell, S. A. (2004), ‘Intellectual capital profiles: An examination of investments and returns’, Journal of Management Studies, vol. 41, no. 2, pp. 335-362.

265
Yousaf, A. (2008), ‘The Role of Organizational Justice in the Relationship between LMX, Organizational Commitment and Intent to Turnover’, M. Sc. Thesis, University of Twente, Enschede.
Yousaf, A., Sanders, K. & Abbas, Q. (2015), ‘Organizational/Occupational Commitment and Organizational/Occupational Turnover Intentions’, Personnel Review, vol. 44, no. 4, pp. 470-491.
Yozgat, U., Serim, R. H. & Cem, D. D. (2014), ‘Out of Sight Out of Mind: Effect of Ostrich Leadership on Affective Commitment and the Moderating Role of Trust in Supervisor’, Business Studies Journal, vol. 6, no. 1, pp. 79-89.
Yuan, K. H. & Bentler, P. M. (1998), ‘Normal Theory Based Test Statistics in Structural Equation Modeling’, British Journal of Mathematical and Statistical Psychology, vol. 51, no. 2, pp. 289-309.
Yueran, W. E. & Liu, I. U. (2015), ‘Career Plateau and Turnover Intention in Chinese Employees: Career Anchor as Moderator’, Social Behavior & Personality: an international journal, vol. 43, no. 5, pp. 757-766.
Yukl, G. (1971), ‘Toward a Behavioral Theory of Leadership’, Organizational Behavior & Human Performance, vol. 6, no. 4, pp. 414-440.
Yukl, G. (1994), Leadership in Organizations, Prentice-Hall, Englewood Cliffs, NJ.
Yukl, G. (2002), Leadership in Organizations, Upper Saddle River, Prentice Hall, NJ.
Yukl, G. (2010), Leadership in Organizations, Prentice-Hall, Upper Saddle River, NJ.
Yukl, G. (2011), Contingency Theories of EffectiveLeadership, in Bryman, A., Collinson, D., Grint, K., Jackson, B. & Uhl-Bien, M. (Eds.), The Sage Handbook of Leadership, Thousand Oaks, CA, pp. 286-298.
Yukl, G. (2013), Leadership in organizations, Upper Saddle River, Prentice Hall, NJ.
Yukl, G. & Van, F., D. (1992), ‘Theory and Research on Leadership in Organizations’, in Dunnette, M. D. & Hough, L. M. (Eds.), Handbook of Industrial and Organizational Psychology, Consulting Psychologists, CA, Palo Alto, vol. 3, pp. 147-197.
Yukl, G., Gordon, A. & Taber, T. (2002), ‘A Hierarchical Taxonomy of Leadership Behavior: Integrating A Half Century of Behavior Research’, Journal of Leadership and Organizational Studies, vol. 9, no. 1, pp. 15-31.
Yunus, M., Moingeon, B. & Lehmann-Ortega, L. (2010), ‘Building Social Business Models: Lessons from the Grameen experience’, Long Range Planning, vol. 43, no. (2/3), pp. 308-235.
Zhang, X. & Bartol, K. M. (2010), ‘Linking Empowering Leadership and Employee Creativity: The Influence of Psychological Employment, Intrinsic Motivation, and Creative Process Engagement’, Academy of Management Journal, vol. 53, no, 1, pp. 107-128.

266
Zhiqiang, L., Zhenyao, C., Ji, L., et al. (2013), ‘Leadership Style and Employee Turnover Intentions: A Social Identity Perspective’, Career Development International, vol. 18, no. 3, pp. 305-234.
Zikmund, W. G. (2003), Business Research Methods, Thompson, Southwestern Mason, OH.
Zikmund, W. G., Babin, B. J., Carr, J. C. & Griffin, M. (2010), Business Research Methods, South- Western Cengage Learning, Mason, OH.
Zimmerman, R. D. (2008), ‘Understanding the Impact of Personality Traits on Individual's Turnover Decisions: A Meta-Analytic Path Model’, Personnel Psychology, vol. 61, no. 2, pp. 309-348.

267
APPENDICES
APPENDIX A: University of Wollongong Human Resource Ethics Report, Study Invitation Letter and Online Survey

268
APPENDIX A-1: University of Wollongong Human Resource Ethics Report

269
APPENDIX A-2: Invitation Letter

270
APPENDIX A-2: Invitation Letter (contd.)

271
APPENDIX A-3: Online Survey
SECTION ONE: Screening and Demographic Questions
Screening questions:
Q1. Employment status in Australia:
Full time employee Part time employee
Q2. Your age is 18 or above:
Yes No
Demographic Questions:
Please specify what most suits your situation by using the following options:
Q1. Gender:
Male Female
Q2. Age:
18-25 years 26-35 years 36-45 years 46-55 years 56-65 years 66+ years
Q3. Marital status:
Married Divorced Widowed Separated Never been married In a de facto relationship

272
Q4. What is your personal annual income after tax?
Under $20,000 Between $20,000 and $40,000 Between $40,001 and $70,000 Between $70,001 and $100,000 Between $100,001 and $150,000 Greater than $150,001
Q5. Please report an estimate of your household annual income after tax:
Under $20,000 Between $20,000 and $40,000 Between $40,001 and $70,000 Between $70,001 and $100,000 Between $100,001 and $150,000 Greater than $150,001
Q6. What is the highest level of education you have completed?
Primary school High school or equivalent Vocational/technical school Some college/ university Bachelor degree Master degree Doctoral degree Professional degree (Doctor of Medicine, Juris Doctor, etc.) Other (please specify) ____________________
Q7. Your job title:………………………….
Q8. What is your work position in the organisation?
Unskilled Worker Skilled Worker Team Leader Executive Manager Director General Manager Chief Executive Officer Other (please specify) ____________________
273
Q9. How many years have you been working for your organisation? If less than a year please
indicate number of months: ____________________
Q10. On average, how many hours do you work per week?
<10 hours 10–19 hours 20–29 hours 30–39 hours 40–49 hours 50–59 hours 60–69 hours ≥70 hours
Q11. In which sector is your organisation?
Financial sector Telecom sector Health sector Don't know Other (please specify)____________________
Q12. Including you, how many employees work at your organisation site?
1 2-4 5-9 10-19 20-99 100-499 500+ Don't know Q13. How long has your superior (your reporting manager) been in his/her work position?
Less than 1 year 2-4 years 5-10 years 11-15 years 16-20 years Over 21 years

274
Q14. Please choose one of the following options that best describes your appraisal rating over
the last year. I have received:
The highest rating The equivalent of very good An average rating The equivalent of needs improvement A poor rating No rating Prefer not to say
Q15. Have you had an illness that prevented you from attending work?
Yes No
Q16. Why did you attend your work despite the illness (physical or mental) during last
month? (Please check all that apply)
Did not want to increase workload of others There would not have been a replacement available Felt that there would have been an increased burden of work once returned Not sick enough Pressure from work Money/financial stresses Sick leave had been used up ( no more sick days) Concerns about job security Other (please specify)____________________ SECTION TWO: Questions for the variables studied in the thesis:
RESPONSIBLE LEADERSHIP:
The following questions ask you for your views of responsible leadership. It focuses on
particular responses of the managers’ responsible leadership approach towards the stakeholder
or different interest groups (e.g., customers and community), human resource practices and
managerial support of the organisation.
17Table A-1: Questions for the scale of RL

275
Stro
ngly
D
isag
ree
Som
ewha
t D
isag
ree
Slig
htly
D
isag
ree
Nei
ther
Agr
ee
nor D
isag
ree
Slig
htly
A
gree
Som
ewha
t A
gree
Stro
ngly
A
gree
1. This organisation takes an active role in its community.
2. This organisation takes ethics seriously (e.g., is committed to ethics training).
3. This organisation responds well to a diverse group of stakeholders (e.g., employees, investors, government or its agencies, owners or shareholders, suppliers, unions, and the community).
4. This organisation takes corporate social responsibility seriously (e.g., has a clear policy that reflects its commitment to one or more social causes).
5. Our performance appraisal programs are effectively used to retain the best talent.
6. Our compensation programs are effectively used to retain the best talent.
7. Our organisation believes that all employees deserve to be actively managed as talent.
8. Our organisation’s program (e.g., training or workshops) for high potentials helps in talent retention.
9. The company has a formal ‘‘high potential’’ program (e.g., training and development for team building or enhancing leadership skills etc.)- people know what they need to do to get into it and to advance within it.
10. My immediate manager leads by example.
11. My immediate manager gives me the support I need to do my job well.
12. My immediate manager is effective.
13. My immediate manager is good at developing people.

276
PRESENTEEISM:
Presenteeism is attending to work while being ill. It refers to the situation when you are at
work, but unable to work, at least not up to full capacity. The following questions ask your
work experiences in the last month. A total of 13 health conditions have been considered for
presenteeism and they are: Stress, Insomnia/poor sleep, Neck and/or back pain, Cold,
Headache, Depressed mood, Allergies/hay fever, Digestive problems, Arthritis, High blood
pressure, Influenza, Asthma and Diabetes.
PRESENTEEISM (SPS-6):
18Table A-2: Questions for the scale of presenteeism
Stro
ngly
D
isag
ree
Som
ewha
t D
isag
ree
Nei
ther
Agr
ee
nor D
isag
ree
Som
ewha
t A
gree
Stro
ngly
A
gree
1. Because of the above mentioned health condition(s) the stresses of my job were much harder to handle.
2. Despite having the above mentioned health condition(s), I was able to finish hard tasks in my work.
3. The above mentioned health condition(s) distracted me from taking pleasure in my work.
4. I felt hopeless about finishing certain work tasks, due to the above mentioned health condition(s)
5. At work, I was able to focus on achieving my goals despite the above mentioned health condition(s).
6. Despite having the above mentioned health condition(s), I felt energetic enough to complete all my work.

277
EMPLOYEE TURNOVER INTENTIONS:
Table Turnover Intentions: The following questions ask about your intentions and motivations
to leave the organisation.
19Table A-3: Questions for the scale of employee turnover intentions
ORGANISATIONAL COMMITMENT: Organisational commitment is a psychological state that binds an employee to an
organisation; the following questions ask about organisational commitment.
Stro
ngly
D
isag
ree
Som
ewha
t D
isag
ree
Nei
ther
A
gree
D
i
Som
ewha
t A
gree
Stro
ngly
A
gree
1. It is likely that I will actively look for a new job
soon.
2. I often think of quitting my current job.
3. I will probably look for a job in the near future.

278
20Table A-3: Questions for the scale of employee turnover intentions
Stro
ngly
D
isag
ree
Som
ewha
t D
isag
ree
Nei
ther
Agr
ee
nor D
isag
ree
Som
ewha
t A
gree
Stro
ngly
A
gree
1. I would be very happy to spend the rest of my career with this organisation.
2. I really feel as if this organisation's problems are my own.
3. I do not feel a strong sense of belonging to my organisation.
4. I do not feel emotionally attached to this organisation.
5. I do not feel like part of the family at my organisation.
6. This organisation has a great deal of personal meaning for me.
7. Right now, staying with my organisation is a matter of necessity as much as desire.
8. It would be very hard for me to leave my organisation right now, even if I wanted to.
9. Too much of my life would be disrupted if I decided I wanted to leave my organisation now.
10. I feel that I have too few options to consider leaving this organisation.
11. If I had not already put so much of myself into this organisation, I might consider working elsewhere.
12. One of the few negative consequences of leaving this organisation would be the scarcity of available alternatives.
13. I do not feel any obligation to remain with my current employer.
14. Even if it were to my advantage, I do not feel it would be right to leave my organisation now.
15. I would feel guilty if I left this organisation now.
16. This organisation deserves my loyalty.
17. I would not leave my organisation right now because I have a sense of obligation to the people in it.
18. I owe a great deal to my organisation.

279
APPENDIX B: The Assumptions of Violation for Testing Direct and Indirect Influences of the Hypotheses
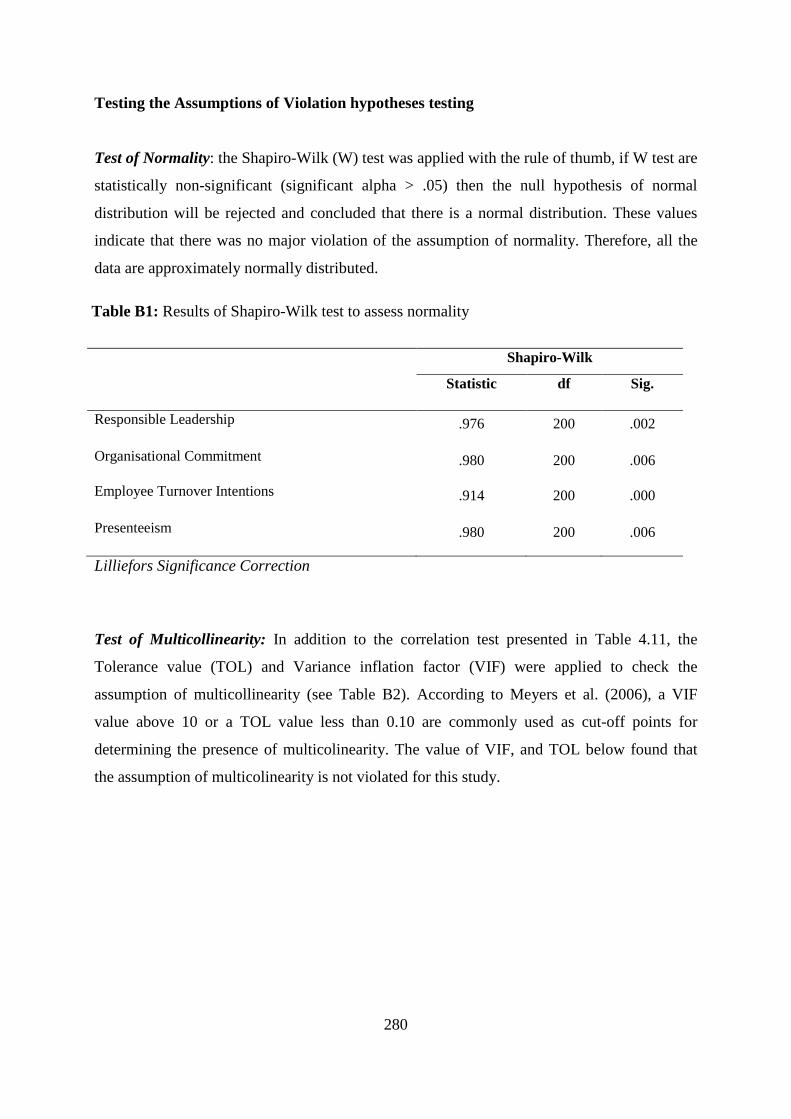
280
Testing the Assumptions of Violation hypotheses testing Test of Normality: the Shapiro-Wilk (W) test was applied with the rule of thumb, if W test are
statistically non-significant (significant alpha > .05) then the null hypothesis of normal
distribution will be rejected and concluded that there is a normal distribution. These values
indicate that there was no major violation of the assumption of normality. Therefore, all the
data are approximately normally distributed.
21Table B1: Results of Shapiro-Wilk test to assess normality
Shapiro-Wilk
Statistic df Sig.
Responsible Leadership .976 200 .002
Organisational Commitment .980 200 .006
Employee Turnover Intentions .914 200 .000
Presenteeism .980 200 .006
Lilliefors Significance Correction
Test of Multicollinearity: In addition to the correlation test presented in Table 4.11, the
Tolerance value (TOL) and Variance inflation factor (VIF) were applied to check the
assumption of multicollinearity (see Table B2). According to Meyers et al. (2006), a VIF
value above 10 or a TOL value less than 0.10 are commonly used as cut-off points for
determining the presence of multicolinearity. The value of VIF, and TOL below found that
the assumption of multicolinearity is not violated for this study.

281
22Table B2: TOL and VIF values of the relationship between RL, organisational commitment, and employee turnover intentions with the dependent variable
Collinearity Statistics
Tolerance VIF
Responsible Leadership .625 1.600
Organisational Commitment .540 1.853
Employee Turnover Intentions .536 1.864
Dependent Variable: presenteeism Test of linearity and homoscedasticity: Both assumptions were evaluated through visual
observation of scatterplots. A visual examination of the bivariate scatterplots displayed that
the relationships between the study variables formed relatively straight and linear lines, which
was indicative of no violations of linearity. In addition, for homoscedasticity, the same
observation of the bivariate scatterplots showed a general oval shape. This specified no
violation of the assumption of homoscedasticity. Histogram, scatterplots and normal P-P plot
are directed for presenteeism. Specifically, Figure B-1, Figure B-2 and Figure B-3 represent
the Histogram, scatterplots and normal P-P plots test for independent variables with
Presenteeism.
15Figure B-1: Histogram of independent variables with presenteeism

282
16Figure B-2: Scatter plots of independent variables with presenteeism
17Figure B-3: Results of P-P plots of independent variables with presenteeism

283
APPENDIX C: Further Secondary Analysis of the Variables Examined in this Study

284
18Figure C-1: β estimates of the relationship between RL and the subscales of presenteeism (work process and work outcomes) with : χ2 = 349.391, χ2/df = 2.532, GFI = .85, AGFI = .79, CFI = .93, TLI = .91, NFI = .87, RMSEA = .088, and SRMR = .0890.

285
19Figure C-2: β estimates of the relationship between RL and the subscales of OC: affective, continuance & normative commitment with: χ2 = 750.868, χ2/df = 1.822, GFI = .81, AGFI = .77, CFI = .92, TLI = .91, NFI = .84, RMSEA = .064, and SRMR =. 1060.

286
20Figure C-3: The results of β estimates of the relationship between three components of OC and employee turnover intentions with: χ2 = 599.407, χ2/df = 3.330, GFI = .88, AGFI = .74, CFI = .83, TLI = .80, NFI = .77, RMSEA = .108 and SRMR = .2496.

287
21Figure C-4: β estimates of the relationship among affective, continuance, and normative commitment and presenteeism with: χ2 = 675.978, χ2/df = 2.805, GFI = .80, AGFI = .75, CFI = .82, TLI = .79, NFI = .75, RMSEA = .095 and SRMR = .2087.

288
23Table C-1: Correlation matrix among the three components of organisational commitment and employee turnover intentions
Variable 1 2 3 4
1. Affective Commitment 1
2. Continuance Commitment .067 1
3. Normative Commitment .770** .181* 1
4. Employee Turnover Intentions -.654** -.119 -.603** 1
**. Correlation is significant at the 0.01 level (2-tailed). *. Correlation is significant at the 0.05 level (2-tailed).
24Table C-2: Correlation matrix among the three components of organisational commitment and presenteeism
Variable 1 2 3 4
1. Affective Commitment 1
2. Continuance Commitment .067 1
3. Normative Commitment .770** .181* 1
4. Presenteeism -.273** -.128 -.186** 1
**. Correlation is significant at the 0.01 level (2-tailed). *. Correlation is significant at the 0.05 level (2-tailed).