Embed Size (px)
Citation preview

Western Kentucky UniversityTopSCHOLAR®
Dissertations Graduate School
5-2012
The Relationship Between OrganizationalCommmitment and Position in PostSecondaryEducationLinda Brewer KellerWestern Kentucky University, [email protected]
Follow this and additional works at: https://digitalcommons.wku.edu/diss
Part of the Higher Education Administration Commons, and the Organizational Behavior andTheory Commons
This Dissertation is brought to you for free and open access by TopSCHOLAR®. It has been accepted for inclusion in Dissertations by an authorizedadministrator of TopSCHOLAR®. For more information, please contact [email protected].
Recommended CitationKeller, Linda Brewer, "The Relationship Between Organizational Commmitment and Position in PostSecondary Education" (2012).Dissertations. Paper 29.https://digitalcommons.wku.edu/diss/29


THE RELATIONSHIP BETWEEN ORGANIZATIONAL COMMITMENT AND POSITION IN POSTSECONDARY EDUCATION
A Dissertation Presented to
The Faculty of the Educational Leadership Doctoral Program Western Kentucky University
Bowling Green, Kentucky
In Partial Fulfillment
Of the Requirements for the Degree Doctor of Education
By Linda Brewer Keller
May 2012


I dedicate this work to my family: to my husband, Ken, who listened to me worry about a
host of unfamiliar concerns; to my older son, Ben, who often asked, perhaps with
sympathy, if I was done yet and how much longer it would be; to my daughter, Danielle,
who would sit and chat with me for a few minutes while I was at the computer; and to my
younger son, Michael, who would run in, give me a hug, and dash away again. While I
tried to minimize the impact of pursuing this degree on you, that became more difficult as
I proceeded. I hope that someday you understand my desire to complete this program. I
also dedicate this to my parents, Ben and Mickey Brewer, who instilled in my sisters and
me the importance of education at an early age.

iv
Acknowledgements
I would like to thank and acknowledge the members of my dissertation
committee, Dr. Kyong Chon, Dr. Robert Reber, and Dr. Bud Schlinker for their time and
efforts on my behalf. I would like to extend special thanks to my dissertation chair, Dr.
Ric Keaster, for his time, quick responses, and attention to detail in his efforts to guide
me through this dissertation process. I would also like to thank the members of my
cohort, Cohort II, for their support and camaraderie during our journey through this
program.

v
Table of Contents
Chapter 1 Introduction ........................................................................................................ 1
Problem Statement .................................................................................................. 3
Purpose of the Study ............................................................................................... 5
Research Questions ................................................................................................. 6
General Methodology ............................................................................................. 6
Definitions............................................................................................................... 8
Assumptions ............................................................................................................ 9
Limitations and Delimitations ............................................................................... 10
Significance of Study ............................................................................................ 11
Chapter 2 Review of the Literature ................................................................................... 12
Motivation Theory ................................................................................................ 12
Organizational Commitment ................................................................................. 15
Construct development. ............................................................................ 15
Measurement development. ...................................................................... 24
Outcomes of organizational commitment. ................................................ 31
Tardiness and absenteeism. ........................................................... 32
Turnover. ....................................................................................... 36
Relationship with job satisfaction. ............................................................ 39
Antecedents of organizational commitment. ............................................ 41
Personal and position characteristics. ........................................... 42
Organizational characteristics. ...................................................... 51
Organizational commitment and higher education. .................................. 56

vi
Chapter 3 Methodology .................................................................................................... 67
Research Questions and Hypotheses .................................................................... 67
Type of Research .................................................................................................. 69
Research Context .................................................................................................. 69
Research Participants ............................................................................................ 70
Instrumentation ..................................................................................................... 70
Reliability. ................................................................................................. 71
Validity. .................................................................................................... 72
Procedures Used to Collect Data .......................................................................... 73
Data Analysis ........................................................................................................ 74
Description of variables. ........................................................................... 75
ANOVA. ................................................................................................... 78
Multiple regression. .................................................................................. 79
Dummy coding.............................................................................. 80
Sample size. .................................................................................. 80
Assumptions of regression. ........................................................... 81
Multicollinearity. .......................................................................... 81
Selection of regression model. ...................................................... 82
Chapter 4 Results .............................................................................................................. 84
Descriptive Statistics ............................................................................................. 85
Analysis for Research Question 1 ......................................................................... 89
Analysis for Research Question 2 ......................................................................... 91
Analysis for Research Question 3 ......................................................................... 93

vii
Analysis for Research Question 4 ......................................................................... 94
Analysis for Research Question 5 ......................................................................... 98
Analysis for Research Question 6 ....................................................................... 102
Chapter 5 Discussion ...................................................................................................... 107
Discussion of Research Question 1..................................................................... 108
Discussion of Research Question 2..................................................................... 108
Discussion of Research Question 3..................................................................... 109
Discussion of Research Question 4..................................................................... 110
Discussion of Research Question 5..................................................................... 111
Discussion of Research Question 6..................................................................... 111
Discussion of Qualitative Responses .................................................................. 112
Relationship with Previous Research .................................................................. 115
Implications......................................................................................................... 118
Limitations .......................................................................................................... 118
Suggestions for Future Research ........................................................................ 119
Summary and Conclusion ................................................................................... 121
References ....................................................................................................................... 124
Appendix A ..................................................................................................................... 132
Appendix B ..................................................................................................................... 134
Appendix C ..................................................................................................................... 135
Appendix D ..................................................................................................................... 142
Appendix E ..................................................................................................................... 143
Appendix F...................................................................................................................... 144

viii
Appendix G ..................................................................................................................... 145
Appendix H ..................................................................................................................... 146
Appendix I ...................................................................................................................... 147
Appendix J ...................................................................................................................... 148
Appendix K ..................................................................................................................... 149

ix
List of Figures
Figure E1. Frequency distribution of affective commitment scores. .............................. 143
Figure F1. Frequency distribution of continuance commitment scores. ......................... 144
Figure G1. Frequency distribution of normative commitment scores. ........................... 145
Figure H1. Scatterplot of predicted and residual scores for affective commitment. ...... 146
Figure I1. Scatterplot of predicted and residual scores for continuance commitment. ... 147
Figure J1. Scatterplot of predicted and residual scores for normative commitment. ..... 148
Figure K1. Mean scores for affective, continuance, and normative commitment by
position. ............................................................................................................... 149

x
List of Tables
Table 1. Plan for Data Analysis ........................................................................................ 74
Table 2. Descriptive Statistics for Personal Variables ...................................................... 86
Table 3. Descriptive Statistics for Position Variables ...................................................... 87
Table 4. Means and Standard Deviations for Commitment Items .................................... 88
Table 5. ANOVA Results for Affective Commitment ..................................................... 90
Table 6. Dunnett Post Hoc Comparisons for Affective Commitment .............................. 91
Table 7. ANOVA Results for Continuance Commitment ................................................ 92
Table 8. Tukey Post Hoc Comparisons for Continuance Commitment............................ 92
Table 9. ANOVA Results for Normative Commitment ................................................... 94
Table 10. Tukey Post Hoc Comparisons for Normative Commitment ............................. 94
Table 11. ANOVA Results for the Regression Model of Affective Commitment ........... 96
Table 12. Hierarchical Multiple Regression Coefficients for Affective Commitment ..... 97
Table 13. ANOVA Results for the Regression Model of Continuance Commitment .... 100
Table 14. Hierarchical Multiple Regression Coefficients for Continuous Commitment 101
Table 15. ANOVA Results for the Regression Model of Normative Commitment ....... 104
Table 16. Hierarchical Multiple Regression Coefficients for Normative Commitment . 105
Table 17. Summary of Regression Analysis Results for Affective, Continuance, and
Normative Commitment ..................................................................................... 112

xi
THE RELATIONSHIP BETWEEN ORGANIZATIONAL COMMITMENT AND POSITION IN POSTSECONDARY EDUCATION
Linda Brewer Keller May 2012 149 pages
Directed by: Dr. Ric Keaster, Dr. Kyong Chon, Dr. Robert Reber, and Dr. Bud Schlinker
Educational Leadership Doctoral Program Western Kentucky University
Organizational commitment has been linked to important employee behaviors and
perceptions, including turnover, intent to turnover, absenteeism, and job satisfaction. In
spite of its important outcomes, the formation of commitment is not well documented and
research concerning antecedents has provided inconsistent results. Little of this research
has involved the postsecondary education field and characteristics unique to it. This
study investigated the relationship between employee position and organizational
commitment in the postsecondary education setting. The model of organizational
commitment utilized was the three-component concept developed by Meyer and Allen
(1997) composed of affective, continuance, and normative commitment.
Research participants were 2,914 university employees. Using an online survey,
participants responded to personal and position-related items and the organizational
commitment assessment. The personal variables included were gender, age, and
education level. The position-related variables were position as faculty, staff, or
administration; full or part-time employment; tenure status; salaried or hourly pay status;
years of employment at the university; retirement plan participation; and campus
location. The survey also included a free-response item that asked participants why they
responded as they did to the commitment items.
As demonstrated by analysis of variance, position had a significant influence on
affective, continuance, and normative commitment. For each commitment component,

xii
staff had significantly higher commitment than faculty. A difference was also found
between staff and administration for continuance commitment. Hierarchical regression
analysis for the personal and position variables yielded significant results for each of the
commitment components as well. The block of position variables demonstrated a
significant relationship with affective and normative commitment. The blocks of position
and personal variables were significantly related to continuance commitment. The study
findings concerning the lower organizational commitment of faculty, combined with the
body of research demonstrating the outcomes associated with organizational
commitment, should indicate to institutional leaders the need to be aware of and focus on
organizational commitment as an important employee attitude.

1
Chapter 1 Introduction
Why does one employee work for an organization for 20 years while another
employee of the same organization leaves after only 3 months? Why does one employee
work harder and longer than another who does only the minimum required to maintain
employment? Productivity and turnover are two important aspects of organizational
success. Employee turnover is an expensive event on several levels, and higher turnover
is associated with lower financial performance (Huselid, 1995). Direct costs associated
with turnover may include the expense of recruitment advertizing, travel-related
expenses, pre-employment screening, and training. Indirect costs may include the time
spent to review applications, interview candidates, and negotiate a hire as well as losses
in productivity from position vacancies and the orientation and training of new
employees. When an employee leaves an organization, the knowledge and experience of
that employee is lost to the organization as well. Cascio (1991) developed an arithmetic
model to estimate the costs of turnover, and others (Tziner & Birati, 1996) have
suggested improvements to the model. Estimates of turnover costs range from 50% to
200% of a position’s annual compensation (Emmerich, 2001), although the cost of
turnover has received little attention from researchers (Bruce, 2005). As the annual
turnover rate for the United States was 37% in 2009 (U.S. Department of Labor, 2010),
turnover is an expensive as well as a pervasive issue for organizations.
With the extent and expense of turnover, researchers have investigated the sources
and causes of turnover. Among other factors and concepts, turnover has been linked to
organizational commitment (e.g., Mathieu & Zajac, 1990). In one of the seminal works
on organizational commitment, commitment was defined as the measure of an employee’s

2
identification and involvement with an organization (Porter, Steers, Mowday, & Boulian,
1974). Rooted in motivation theory, Porter’s conceptualization of organizational
commitment included a belief in and acceptance of an organization’s goals, a willingness
to exert considerable effort for an organization, and a desire to remain a member of an
organization. Organizational commitment was later re-conceptualized as a three-
component construct composed of affective commitment, continuance commitment, and
normative commitment (Meyer & Allen, 1991). Under the Meyer and Allen (1991)
framework, commitment was composed of an employee’s emotional connection and
identification with an organization (i.e., affective commitment), an employee’s
recognition of the costs of leaving an organization (i.e., continuance commitment), and an
employee’s feelings of obligation to remain with an organization (normative
commitment).
In addition to turnover, organizational commitment has been linked to important
employee attitudes and behaviors. These include withdrawal cognitions (e.g., Fuller,
Hester, Barnett, Frey, & Relyea, 2006), intent to turnover (e.g., Aryee, Wyatt, & Min,
1991; Bedeian, 2007), intention to search (e.g., Mathieu & Zajac, 1990), tardiness (e.g.,
Dishon-Berkovits & Koslowsky, 2002), and absenteeism (e.g., Hausknecht, Hiller, &
Vance, 2008). A strong relationship between organizational commitment and job
satisfaction has also been indicated (e.g., Aryee et al., 1991; Bedeian, 2007; Boehman,
2007; Mathieu & Zajac, 1990), but the nature and causality of the relationship between
the two remain unclear (Meyer, 1997). These and other studies have established the
importance of organizational commitment as a concept of interest to organizational
leaders.

3
Problem Statement
Research concerning the outcome effects or consequences of organizational
commitment has provided significant results. As such, researchers have investigated the
conditions or qualities associated with organizational commitment. These studies have
explored the relationship between organizational commitment and a wide variety of
antecedent variables, including but not limited to personal, position, and organizational
characteristics (Mowday, Porter, & Steers, 1982).
Research concerning the formation of organizational commitment has resulted in
inconsistent findings. Possible explanations for this include the wide variety of
antecedent variables that have been proposed and researched and the inability to interpret
research results unequivocally (Meyer & Allen, 1991). Some studies have found a
relationship between organizational commitment and personal characteristics of the
employee, such as gender (Mathieu & Zajac, 1990), age (Goulet & Frank, 2002; Morris
& Sherman, 1981), and education (Morris & Sherman, 1981). However, other research
has not supported these conclusions (Bedeian, 2007; Billingsley & Cross, 1992;
Boehman, 2007; Giffords, 2003). Some research has found a relationship between
organizational commitment and position characteristics, such as salary (Schroder, 2008)
and employment length (Fuller et al., 2006; Marchiori & Henkin, 2004; Porter et al.,
1974), while other research has not (Bedeian, 2007; Billingsley & Cross, 1992; Wallace,
1995). Some studies have found a relationship between commitment and organizational
characteristics, such organizational size (Su, Baird, & Blair, 2009) and organizational
type (Giffords, 2003; Goulet & Frank, 2002), while other research has not (Al-Qarioti &

4
Al-Enezi, 2004). With these conflicting results, additional research is needed concerning
the antecedent variables of organizational commitment.
While some characteristics can be found in many organizations, some
organizations have unique qualities that set them apart from other organizations.
Institutions of postsecondary education have distinctive cultures (Bergquist & Pawlak,
2008) and features (Kezar, 2001) that differentiate them from other organizations. These
differences present additional opportunities for inquiry into organizational commitment
exclusive to the field of postsecondary education. Features of postsecondary schools may
include the employment of faculty, a tenure system, and policies related to academic
freedom and shared governance. Unlike most businesses, most postsecondary education
institutions do not hold a for-profit disposition, but rather are public or not-for-profit
(Carnegie Foundation for the Advancement of Teaching, 2010). Such unique qualities
may influence the organizational commitment of employees of postsecondary educational
institutions and therefore provide additional variables for study.
While much research has been conducted on organizational commitment, less
research has been conducted exploring organizational commitment in the unique setting
of postsecondary institutions. Due to their unique nature, employees of these institutions
may experience commitment differently than employees of other organizations. Two
studies (Fuller et al., 2006; Schroder, 2008) have indicated that a relationship between
organizational commitment and position (i.e., faculty, staff, or administration) may exist.
Using only the affective commitment component of organizational commitment, Fuller et
al. (2006) reported a significant relationship between affective commitment and position
for employees of a university. Faculty had significantly lower affective commitment

5
scores than the staff and the administrator groups. The difference between the staff and
administrator groups was not significant. In a study designed to investigate predictor
variables of organizational commitment for university faculty and administrators,
Schroder (2008) found a different set of predictors for faculty and for administrators. As
this study used the Organizational Commitment Questionnaire (OCQ; Porter et al., 1974)
as the organizational commitment measure, investigation into the components of
commitment was not undertaken. While these two studies have begun the investigation
into the relationship between organizational commitment and position, additional
research is needed.
Purpose of the Study
This study investigated the relationship between organizational commitment and
position within the field of postsecondary education. The effect of position on
organizational commitment has received little attention in the literature; however, two
studies (Fuller et al., 2006; Schroder, 2008) have provided support for the existence of a
relationship between the two variables. Neither of these studies explored the relationship
between position and the three components of organizational commitment (i.e., affective,
continuance, and normative commitment).
An employee’s position as faculty, administration, or staff may differentially
influence the formation of affective, continuance, and normative commitment. As the
three components were designed to assess different aspects of commitment, employees in
these groups may experience the components of commitment differently. The current
study continued and expanded the investigation into the relationship between
organizational commitment and position in the field of postsecondary education.

6
Research Questions
1. Does the affective commitment of employees of postsecondary institutions differ
according to position?
2. Does the continuous commitment of employees of postsecondary institutions
differ according to position?
3. Does the normative commitment of employees of postsecondary institutions differ
according to position?
4. Is the affective commitment of employees of postsecondary institutions related to
personal or position characteristics?
5. Is the continuance commitment of employees of postsecondary institutions related
to personal or position characteristics?
6. Is the normative commitment of employees of postsecondary institutions related
to personal or position characteristics?
General Methodology
This section provides a brief overview of the methodology utilized for this study.
It includes information concerning the research participants, survey instrument, and data
collection methods. A more detailed description of the methodology can be found in the
third chapter of this work.
Employees from a large, public university in the southern United States
participated in the study. After obtaining Institutional Review Board approval, an email
was sent to university employees briefly describing the study and its voluntary nature and
inviting them to participate. The email noted that participants would be offered a chance
to win a prize in a drawing. The email contained a hyperlink to the online survey

7
instrument. Reminder emails containing the same information as the initial email were
sent 7 and 14 days after the initial email. The online instrument was deactivated 21 days
after the initial email.
The survey instrument for this study was placed on a Web-based online survey
platform. Organizational commitment was assessed using the Affective, Continuance,
and Normative Commitment Scale (Meyer & Allen, 1997). This scale is well established
in the organizational commitment literature (see Allen & Meyer, 1996 for a discussion on
construct validity). As demonstrated through meta-analysis, the reliability of each of the
three components is high: .82 for the affective commitment scale (ACS), .76 for
continuance commitment scale (CCS), and .73 for normative commitment scale (NCS;
Meyer, Stanley, Herscovitch, & Topolnysky, 2002). Permission was obtained from the
authors of the instrument for use in this study. Based on previous organizational
commitment research, the survey instrument also contained items related to personal and
position characteristics, including position, and a free-response item which asked
participants to describe why they answered to the commitment items as they did.
After the deactivation of the online instrument, the data were downloaded into a
statistical analysis program and reviewed for missing data and outliers. To create a score
for affective commitment, continuance commitment, and normative commitment, the
scores from the six scale items were averaged. For analysis, the components of
organizational commitment were the dependent variables while the position and other
personal and position characteristics were the independent variables. To compare
affective, continuance, and normative commitment across position (Research Questions
1, 2, and 3), data were analyzed with a one-way analysis of variance (ANOVA) for each

8
of the component scales. Multiple regression analysis for personal and position
characteristic variables were used to ascertain their impact on the commitment
components and the amount of variance accounted for by the variables (Research
Questions 4, 5, and 6).
Definitions
Administration: employees who “plan, direct, or coordinate research, instructional,
student administration and services, and other educational activities at postsecondary
institutions, including universities, colleges, and junior and community colleges” (United
States Department of Labor, 2011).
Affective commitment: a component of organizational commitment reflecting “the
employee’s emotional attachment to, identification with, and involvement in the
organization” (Meyer & Allen, 1991, p. 67).
Continuance commitment: a component of organizational commitment reflecting the
employee’s “awareness of the costs associated with leaving the organization” (Meyer &
Allen, 1991, p. 67).
Faculty: “Persons identified by the institution as such and whose assignments include
conducting instruction, research, or public service as a principal activity (or activities).
…. Faculty may also include [administrative positions] if their principal activity is
instruction combined with research and/or public service” (United States Department of
Education, http://nces.ed.gov/programs/coe/glossary.asp).
Normative commitment: a component of organizational commitment reflecting the
employee’s “feeling of obligation to continue employment” with an organization (Meyer
& Allen, 1991, p. 67).

9
Organizational commitment: a psychological state concerning an employee’s relationship
with the employing organization based on the employee’s affective attachment to the
organization, perceived costs of leaving the organization, and sense of obligation to
remain with the organization (Meyer & Allen, 1991).
Position: categorization of non-student employees of postsecondary education institutions
as faculty, administration, or staff.
Postsecondary education: “a formal instructional program whose curriculum is designed
primarily for students who are beyond the compulsory age for high school [including]
programs whose purpose is academic, vocational, and continuing professional education,
and excludes avocational and adult basic education programs” (United States Department
of Education, http://nces.ed.gov/programs/coe/glossary.asp).
Staff: employees of postsecondary education institutions who are not primarily faculty,
administration, or students.
Assumptions
In conducting this study, the researcher assumed that the participants responded to
the survey in an honest and accurate manner. As the research investigated an employee’s
relationship with the employing organization, participant responses may have been
influenced by response bias and therefore indicated more positive responses than were
accurate. Assurances of confidentiality and anonymity and the brevity of the survey
instrument may have helped to dissipate these concerns. It was assumed that the data
were accurately transferred from the research participants’ keystrokes or mouse-clicks to
the online survey platform to the retrieval site for data accumulation. Researchers have

10
found support for the use of Web-based surveys for data collection (Cobanoglu, Warde,
& Moreo, 2001; Sills & Song, 2002).
Limitations and Delimitations
The non-experimental design of this study made it susceptible to internal validity
threats. As random assignment of research participants to a particular type of position
was not feasible, differences due to extraneous variables may exist among these
employee groups. Additionally, due to the voluntary nature of the study, employees that
chose to participate in this study may not be representative of all employees at the
postsecondary institution.
This study included a limited selection of personal and position-related
characteristics. Inclusion of all such variables was not feasible as including all such
variables would have required an extensive survey, the length of which would have been
arduous for participants. The study was also limited to the employees of one institution.
Organizational characteristics have been shown to influence organizational commitment
(Buka & Bilgic, 2010; Giffords, 2003; Goulet & Frank, 2002). By limiting the study to
one postsecondary education institution, effects due to organizational differences were
minimized.
As the study was conducted with the employees of one public university, the
results may not be generalizable to other types of postsecondary institutions. As
organizational type has been shown to impact organizational commitment (Giffords,
2003; Goulet & Frank, 2002), this may be particularly true for for-profit postsecondary
institutions. The degree to which this institution is dissimilar to other institutions will
affect the generalizability of the results.

11
Significance of Study
Previous research has linked organizational commitment to important employee
attitudes and behaviors, including turnover, job satisfaction, and absenteeism. Less is
known about the formation and antecedents of organizational commitment. While some
studies have demonstrated a relationship between organizational commitment and
personal, position, and organizational characteristics, more research is needed.
Additionally, little research has focused on the unique environment of postsecondary
education.
This study investigated the relationship between the components of organizational
commitment and position in the field of postsecondary education. The knowledge gained
contributed to the understanding of the formation of organizational commitment in
postsecondary education. Additionally, differences found in affective, continuance, and
normative commitment by position may indicate to educational leaders the most
appropriate places to direct organizational resources in order to increase the commitment
in its employees. Increases in commitment could lead to higher employee satisfaction as
well as lower absenteeism and turnover.
In this chapter, the concept of organization commitment was introduced. Its
relationship with several important employee outcome variables, including turnover, was
briefly discussed, as was the general methodology of this study. The next chapter delves
more deeply into the development of the organizational commitment construct, its
relationship with other variables, and provides a review of the literature related to these
topics.

12
Chapter 2 Review of the Literature
In this chapter, the previous research and literature related to organizational
commitment is reviewed and the relationship to the theoretical framework of motivation
theory is outlined. The development of the construct of organizational commitment is
examined, as is the development of its measurement. Following this, research that links
organizational commitment to employee outcomes as well as personal, position, and
organizational characteristics is reviewed. The chapter is concluded with a section
focusing on the study of organizational commitment within postsecondary education.
Motivation Theory
Organizational commitment has a foundation in organizational behavior and
motivation theory. Organizational behavior, or the study of human behavior in an
organizational setting, has long been interested in what motivates people at work. Many
theories have been developed to explain motivation, including theories by Maslow,
Alderfer, Herzberg, Vroom, and many others.
Maslow (1970) developed a hierarchy of needs to explain human motivation.
According to the theory, humans were motivated from within to reach their full potential,
which Maslow called self-actualization. To reach this goal, people progressed through
five levels of needs: basic physiological, safety and security, social affiliation or
belonging, esteem, and self-actualization or self-realization. Under this hierarchy, lower
level needs had to be satisfied before higher-level needs could be addressed. This was
referred to as prepotency. Although the needs were arranged hierarchically, often
depicted as a pyramid, people could progress forward or move backward through the
levels. In the lower four levels, motivation was created because the needs specific to

13
each level were not met. These were therefore referred to as deficiency needs. Needs in
the self-actualization fifth level were called growth needs because they result from the
need of a person to develop rather than from a deficiency.
From Maslow’s hierarchy, a related theory of motivation was developed by
Alderfer called ERG Theory, standing for existence, relatedness, and growth (Jex, 2002).
Instead of five levels, Alderfer’s model had three, in which physiological and safety
needs were combined to form existence needs, social affiliation was represented by
relatedness needs, and esteem and self-actualization were combined to form growth
needs. Unlike Maslow, Alderfer’s theory did not require needs to be met in a hierarchical
manner, but rather allowed that persons could focus on needs from multiple levels at the
same time.
Herzberg (Herzberg, 1966; Herzberg, Mausner, & Snyderman, 1959) proposed a
two-factor theory of motivation called the motivation-hygiene theory. Based on
interviews with accountants and engineers in Pennsylvania, Herxberg theorized that the
presence of certain characteristics led to satisfaction (i.e., motivators), while the absence
of a different set of characteristics led to dissatisfaction (i.e., hygiene factors). This was a
marked departure from the traditional viewpoint that satisfaction was the opposite or lack
of dissatisfaction and vice versa. Under Herzberg’s theory, satisfaction and
dissatisfaction were separate concepts created by different factors.
According to Herzberg’s theory, motivators or motivating factors stemmed from
characteristics of the job, including the work itself, competency, achievement,
recognition, and advancement. These have also been called intrinsic factors. Their
presence contributed to satisfaction; however, their absence did not create dissatisfaction.

14
Rather, dissatisfaction was related to the hygiene or maintenance factors, which stemmed
from the work environment. These included characteristics such as working conditions,
salary, benefits, supervision, relationships with supervisors and coworkers, and
organizational policies and have been called extrinsic factors. The absence of these
factors created dissatisfaction; however, their presence does not create satisfaction.
Herzberg also theorized that a minimum level of maintenance factors had to be present in
order for motivating factors to be effective.
In contrast to need-based theories, Vroom’s Expectancy Theory was based on the
linkages between employee effort, performance, and outcomes (Jex, 2002). Under this
model, employee effort was a function of the degree to which employees perceived that
effort would lead to successful performance (i.e., expectancy), that performance would
lead to an expected outcome (i.e., instrumentality), and the employee’s value of the
expected outcome (i.e., valence). Therefore, employees directed their efforts to tasks
they believed they could perform and for which they would obtain outcomes that they
valued.
Motivation theories have attempted to explain employee motivation and
satisfaction at work and have contributed to the understanding of these phenomena. In
addition to the work by Maslow, Alderfer, Herzberg, and Vroom, other theories include
Adam’s Equity Theory, Homan’s Social Exchange Theory, Likert’s Management
Systems Theory, Locke’s Goal-Setting Theory, and McGregor’s Theory X and Theory Y
(Jex, 2002). Researchers continue to explore employee motivation and satisfaction.
Over time, one concept that has demonstrated a strong relationship with employee

15
satisfaction is organizational commitment (e.g., Boehman, 2007; Mathieu & Zajac, 1990;
Porter et al., 1974).
Organizational Commitment
While organizational commitment has a foundation in motivation theory, it is a
separate construct, with a complement of research on which it is based. The following
review into the development of the construct begins with the work of Porter et al. (1974)
and highlights the development of the construct. The three-component theory of
commitment (Meyer & Allen, 1991) is discussed.
Construct development.
In one of the seminal works on organizational commitment, Porter et al. (1974)
defined organizational commitment as the measure of a person’s identification and
involvement with an organization. Porter et al. further characterized the construct as
comprising three components: “(a) a strong belief in and acceptance of the organization’s
goals and values; (b) a willingness to exert considerable effort on behalf of the
organization; and (c) a definite desire to maintain organizational membership” (p. 604).
For the study, Porter et al. compared the ability of organizational commitment and job
satisfaction to predict turnover. It was theorized that commitment would be related to job
satisfaction, but that commitment would represent a more comprehensive connection
between the employee and the organization (Porter et al., 1974). In the study,
organizational commitment and job satisfaction were assessed at multiple points over
time rather than a single measurement. This allowed the researchers to explore the
relationship of organizational commitment and job satisfaction to turnover as
employment progress and turnover occurred.

16
To assure that turnover occurred during the study, Porter et al. (1974) chose a
subject pool with a historically high turnover rate, psychiatric technician trainees from a
state hospital. Sixty trainees from two training classes were included in the study. The
classes did not differ significantly on gender or education and their selection method,
training, assignments, and instructors were the same. Therefore, the two classes were
combined into one group for analysis.
To measure organizational commitment, Porter et al. (1974) created the OCQ.
The 15-item questionnaire included items designed to measure the employees’
perceptions of their loyalty to the organization, willingness to exert effort on behalf of the
organization’s goals, and acceptance of the organization’s values. Subjects responded on
a 7-point Likert scale from strongly disagree to strongly agree. The Cronbach alpha for
the measure over the four testing periods ranged from .82 to .93 (Porter et al., 1974). Job
satisfaction was measured with the Job Descriptive Index, which was composed of five
subscales based on satisfaction with supervision, co-workers, work, pay, and promotion.
Subjects completed the measures voluntarily and in person on four different occasions:
10 weeks before the end of the training, 2 weeks before the end of the training, 2 weeks
after the end of the training, and 6 weeks after the end of the training. Information on the
subsequent turnover was gathered from the employing organization for 8 months after the
training was complete.
Data were divided into two groups according to the subjects’ continuance or
termination of employment. The comparison of the demographic characteristics of the
groups revealed a significant difference due to age. This variable was controlled for in
subsequent analyses. Discriminant analysis showed significant differences between the

17
continuing and terminating subjects at the third and fourth measurements, 2 weeks after
the end of the training and 6 weeks after the end of the training, respectively. For both of
these periods, organizational commitment and job satisfaction factors accounted for 21%
of the variance in turnover. Of this, organizational commitment was a primary
contributor. The difference between the groups was not significant at the first and second
measurements, 10 weeks before the end of the training and 2 weeks before the end of the
training, respectively.
Porter et al. (1974) conducted additional analysis to examine the relationship of
organization commitment to turnover without the effects of job satisfaction. Partial
correlations between organizational commitment and turnover, when holding overall job
satisfaction constant, were significant for the latter three of the four testing periods.
These findings support the unique contribution of organizational commitment to
turnover.
The research of Porter et al. (1974) demonstrated that organizational commitment
is not static but changes over time. It also demonstrated that the inverse relationship
between organization commitment and turnover grows stronger as the employee
approaches turnover. The study’s results also supported the distinction between
organizational commitment and job satisfaction as related but separate constructs.
As organizational commitment continued to be researched, the construct was
further tested, defined, and compared to other related concepts. Morrow (1983)
examined the theoretical development and measurement of work commitment, in which
organizational commitment was included. In a review of the literature, Morrow found 30
forms of work commitment. Based on their higher frequency of use in a social science

18
citation index, Morrow concentrated on five focus areas for work commitment and their
related constructs: Protestant work ethic endorsement for value focus, career salience for
career focus, job involvement and work as a central life interest for job focus,
organizational commitment for organizational focus, and union commitment for union
focus.
Based on a literature review and utilizing facet design, Morrow (1983) examined
similarities and differences among the foci for work commitment based on how the
concept of commitment had previously been used in the literature. Using previous
studies, each form of work commitment was compared with the others based on
definition, measurement, reliability, impact from and on other variables, and permanence
over time. To assess the concept redundancies among the measures, Morrow also
examined the intercorrelations between them from earlier research. Due to a lack of data
and the range of intercorrelations found, the analysis was inconclusive.
In the examination of organizational commitment as one conceptualization of
work commitment, Morrow (1983) selected the definition and measure developed by
Mowday, Steers, and Porter (1979). Of the forms of work commitment included,
Morrow determined that organizational commitment had the least amount of overlap with
the other work commitment measures and strong reliability. The antecedents of
organizational commitment appeared to be personal characteristics and job setting
factors. Morrow noted a lack of research involving the impact of socialization and
culture on organizational commitment. Of the work commitment measures included,
Morrow found the organizational commitment measure the most likely to change over the
span of a lifetime, changing as the employer changes, as the employer implements

19
changes, and as the employee makes a personal investment in the organization. As such,
it was deemed manipulatable.
Based on the examination of previous research, Morrow (1983) concluded that the
measures of work commitment considered had some degree of construct contamination.
In making recommendations to improve future research, Morrow suggested that work
commitment be re-configured with different concepts for different work focus areas. A
similar suggestion for organizational commitment was recommended by Reichers (1985).
Like Morrow (1983), Reichers (1985) examined the previous organizational
commitment research in an attempt to arrive at consensus concerning the development of
the concept. Using previous research as a foundation, Reichers developed a new
theoretical framework for organizational commitment that incorporated multiple
commitment foci. The foci were based on multiple constituencies both inside and outside
the organization.
In reviewing the organizational commitment literature, Reichers (1985) found a
consistently demonstrated relationship between organizational commitment and turnover
as well as other withdrawal behaviors. She questioned whether these results were due in
part to the inclusion of items related to intentions to quit in the commonly used OCQ
(Porter et al., 1974). If the measure and the outcome to which it is being related are
redundant, the findings could be artifactual. Reichers suggested that future assessments
of organizational commitment should remove redundancies regarding turnover.
Reichers (1985) noted that the previous research on organizational commitment
had not taken into account the nature of the organization. Rather, the studies had focused
on intra-personal or personal variables in examining organizational commitment.

20
Reichers observed, “Because it is the organization that is presumed to be the focus of the
individual’s commitment, attention to the nature of the organization seems warranted” (p.
469).
Based on the review, Reichers (1985) proposed that organizational commitment
would be more accurately defined and measured as a compilation of several different
commitments to various groups that make up an organization and with whom the
organization is involved. These groups included those within the organization as well as
groups external to the organization. This suggestion reflected the viewpoint that an
organization was not a single entity, but instead was composed of constituencies or
coalitions that can have multiple and sometimes competing goals and values. Reichers’
model of organization commitment included such constituencies as top management, co-
workers, community, clients and customers, professional associations, and unions.
Morrow (1983) and Reichers (1985) suggested that organization commitment was
inadequately conceptualized and defined. Reviews indicated a lack of consistency and
systematic study in the organizational commitment literature. Thus, the basis for the re-
development and refinement of the organizational commitment concept was presented.
Meyer and Allen (1991) responded to this with their influential, three-component theory
of organizational commitment.
In light of the criticisms of organizational commitment in the late 1970’s and the
1980’s, Meyer and Allen (1991) developed a three-component theory of organizational
commitment. Based on previous research and theoretical inference, this proposed model
of organizational commitment was composed of the following: affective commitment,

21
continuance commitment, and normative commitment. These three components were not
different types of commitment, but interrelated components of one construct.
Affective commitment was “the employee’s emotional attachment to,
identification with, and involvement in the organization” (Meyer & Allen, 1991, p. 67).
Meyer and Allen identified three antecedent categories of affective commitment: personal
characteristics, organizational structure, and work experience. This component was very
similar to the Porter et al. (1974) definition of organizational commitment and the OCQ
(Porter et al., 1974).
Continuance commitment was “an awareness of the costs associated with leaving
the organization” (Meyer & Allen, 1991, p. 67). This component involved the benefits
derived from continuing with an organization and the recognition of the costs associated
with leaving an organization. Antecedents of this commitment component included any
benefit or feature the employee valued that would be lost if his or her employment was
terminated and was influenced by the employee’s perception of alternative employment
opportunities.
Normative commitment was “a feeling of obligation to continue employment”
(Meyer & Allen, 1991, p. 67). This feeling of obligation stemmed from socialization
factors and in recognition of the organization’s investment in the employee. The least
amount of research was found for this component, so it was the most theoretical of the
three.
According to Meyer and Allen (1991), much research had focused on the
relationship between organizational commitment and turnover or turnover intentions.
They suggested that commitment should also be studied in terms of other work-related

22
variables, such as attendance, effort, and performance. They also noted a lack of research
investigating the development of organizational commitment within employees.
Several years later, Allen and Meyer (1996) examined the construct validity of the
three-component theory of organizational commitment and of the Affective,
Continuance, and Normative Commitment Scales. In their review of the performance of
the ACS, CCS, and NCS in research studies, Allen and Meyer gathered information on
the scales concerning their reliability, their factor structures, and their relationship with
other variables. Their review focused on these three areas in order to provide different
types of support for construct validity. As there were not a sufficient number of studies
utilizing this specific measure of organizational commitment in most instances to conduct
a meta-analytic review, they instead explored patterns of evidence across studies.
Allen and Meyer (1996) conducted a literature review for research studies
involving at least one of the three component measures of organizational commitment.
The median reliability across studies included was .85 for the ACS, .79 for the CCS, and
.73 for the NCS, including both the six and eight item scale measures. While only a
limited number of studies involved repeated testing over time, those studies that involved
multiple administrations of the component scales showed test-retest reliabilities ranging
from .38 to .94. According to Allen and Meyer, the four lowest test-retest reliabilities
involved assessments that were taken on employees’ first day at work. “Employees may
find it difficult to respond meaningfully to commitment items when they have almost no
experience with the organization” (Allen & Meyer, 1996, p. 255).
In considering studies that examined the factor structure of the component scales,
Allen and Meyer (1996) found that most studies supported the distinction of the ACS,

23
CCS, and NCS. Through factor analysis, several studies suggested the existence of two
constructs within the CCS, one based on employment alternatives and the other based on
employee sacrifices if the he or she left the organization. While acknowledging the two-
factor CCS provided a better fit to the data, they argued that the increase in fit was
modest. As the two factors were highly related, they suggested that considering them as
two separate factors may have little practical meaning.
In reviewing the relationship between the components of organizational
commitment and other related variables, Allen and Meyer (1996) sought to construct a
nomological net to support construct validity. Overall, the results provided evidence
supporting the construct validity of the measures of ACS, CCS, and NCS. For example,
ACS and the OCQ were strongly related, as expected. The ACS also correlated
significantly with work attitude measures of job satisfaction and job involvement. The
relationships between the three scales and other work-related characteristics exhibited the
pattern of results expected for the commitment components. Correlations for the
commitment components were generally significant for turnover and turnover intentions,
as theorized. From their analysis, Allen and Meyer concluded that the findings “suggest
that the three commitment measures are distinguishable from other commonly used work
attitude measures and related to measures of ‘antecedent’ and ‘consequence’ variables
largely in accordance with theoretical predictions” (p. 271).
In this section, the conception and definition of organizational commitment has
been reviewed. Porter et al. (1974) demonstrated the inverse relationship between
organizational commitment and turnover and that this relationship changes over time and
as the employee approaches turnover. Morrow (1983) and Reichers (1985) considered

24
the foci of work commitment and suggested that organizational commitment was not
based on a single factor but rather a culmination of multiple commitments. Meyer and
Allen (1991) proposed a model of organizational commitment that provided an expanded
conceptualization of organizational commitment. While embracing the Porter et al.
(1974) concept of organizational commitment, they also included additional elements in
their three-component model. As the definition of organizational commitment has
changed over time, so too, has its measurement.
Measurement development.
Just as the concept of organizational commitment has evolved through research,
so has its measurement. Alutto, Hrebiniak, and Alonso (1973) created early measures of
organizational and professional commitment. The two assessments were very similar,
except one was directed toward the organization while the other was directed toward the
occupation.
For the study, subjects were nurses employed by three state hospitals in New
York and elementary and secondary teachers employed in two school districts in New
York (n = 713). The questionnaire included the measures of commitment being tested, a
measure of dissatisfaction with organizational recognition and rewards, and demographic
information (i.e., age, years of experience, intention of seeking an advanced degree,
marital status, and gender). For the organizational commitment measure, respondents
were asked if they would leave their current organization for no increase, a slight
increase, or a large increase in pay, status, freedom, or friendlier coworkers. Subjects
selected a response of yes, no, or uncertain. For the occupational commitment measure,

25
subjects were asked the same questions, but directed toward the profession rather than the
organization.
In the first step of data analysis, inter-item correlations were reviewed, as well as
item correlations with the remainder of the scale items collectively. The inter-item
correlations showed that overall the items were generally more highly correlated by the
increase level (i.e., no, small, large) than by the benefit under consideration (i.e., pay,
status, freedom, or friendlier coworkers). The highest reliability scores were for the items
in the slight increase category. For subsequent data analysis, only the responses to the
slight increase category were included. In the second step of data analysis, ANOVA
demonstrated significant differences in organizational commitment for age, years of
experience, intention of seeking an advanced degree, marital status, gender, and
dissatisfaction. Data on post hoc testing were not included, so it is not known where the
significant differences were, except that females reported higher organizational
commitment than males. Significant differences in occupational commitment were found
for all variables except marital status.
Alutto et al. (1973) developed a measure of organizational commitment that
included the factors of compensation, status, freedom, and congeniality. However, it
focused mainly on tangible benefits that employees received from their employment and
on the employee leaving the employers. The scale developed by Porter et al. (1974)
presented a measure that considered organizational commitment from a different
perspective.
The OCQ by Porter et al. (1974) has been widely used in the literature. As
referenced in the previous section, the questionnaire was designed to measure employee

26
perceptions of organizational loyalty, their willingness to exert effort on behalf of the
organization’s goals, and acceptance of the organization’s values. Of the 15 items, six
were reverse worded. Subjects indicated their level of agreement or disagreement on a 7-
point scale. Reliability scores in the study ranged from .82 to .93 (Porter et al., 1974).
In a test of commitment measures, Brierley (1996) conducted quantitative
research to determine if commitment measures would retain their validity if used in a
shortened format. The measures included were the OCQ (Porter et al., 1974) and the
Professional Commitment Questionnaire (PCQ) by Aranya, Pollock, and Armernic
(1981). The PCQ was modeled after the OCQ with the items directed toward the
profession rather than the organization. The results of other research (Angle & Perry,
1981; Mathieu, 1991; Tetrick & Farkas, 1988, as cited in Brierley, 1996) suggested the
15-item measures were composed of two factors rather than one and proposed shortening
the measures to nine items each.
For this research (Brierley, 1996) assessment, 637 questionnaires were sent to
chartered accountants in the United Kingdom. Of these, 191 were returned (response rate
= 30%). Questionnaires included nine items from the OCQ and nine items from the
PCQ. Subjects were also asked about their intentions to leave their organizations,
intentions to leave their profession, and their job satisfaction.
Combining the nine items from each scale, the initial factor analysis of the 18
commitment items resulted in a four-factor solution. Four items, one from the OCQ and
three from the PCQ, loaded on more than one factor and therefore were deleted from
analysis. Subsequent factor analysis again yielded a four-factor solution. The first factor
was composed of six items from the OCQ and had a Cronbach alpha of .864. The second

27
factor included four items from the PCQ and had a Cronbach alpha of .78. The third and
fourth factors contained one item each from the OCQ and PCQ and had alpha scores of
.64 and .74, respectively (Brierley, 1996).
Based on the results of the factor analysis, correlations were computed between
the four factors and intent to leave the organization, intent to leave the profession, and job
satisfaction. The OC and PC factors were significantly and negatively correlated with
intent to leave the organization and intent to leave the profession. For intent to leave the
organization, the correlation with the OC factor was significantly stronger than the
correlation with the PC factor. For intent to leave the profession, the correlation with the
PC factor was stronger but not significantly stronger than the correlation with the OC
factor. All four factors were significantly and positively related to job satisfaction.
While recognizing the limitations of the study, Brierley (1996) suggested more
research was needed on the OCQ and PCQ, as they did not result in a two-factor solution
by questionnaire as expected. This study was conducted in the United Kingdom while
most of the previous organizational commitment research took place in the United States.
Differences in culture, organizations, and employee perceptions may affect commitment.
However, this research on the validity of shorted forms of the OCQ and PCQ indicated
that the nine item scales might not be as valid as the original form.
In a two-part study, Allen and Meyer (1990) conducted research to develop and
then test a measure of organizational commitment that reflected their three-component
model of affective, continuance, and normative commitment. For the first part, subjects
were full-time, non-unionized employees from two manufacturing organizations and one
university. A letter of explanation, the questionnaire, and a pre-addressed return

28
envelope were distributed by the organizations’ personnel departments to approximately
500 employees. Subjects (n = 256) voluntarily completed and returned the
questionnaires.
The questionnaire consisted of a pool of 66 items related to commitment,
including the OCQ (Mowday et al., 1979). Other items were adapted from existing
scales or created by the authors for the purpose of scale construction and to reflect the
three-component model of organizational commitment. Subjects responded to the items
on a 7-point scale from strongly disagree to strongly agree.
After data analysis, items were selected from the initial pool based the individual
item’s endorsement proportion, item-total correlations, positive and negative keying, and
non-redundancy (Allen & Meyer, 1990). While not a primary concern, equal measure
length for each component scale was desired. After elimination of items, eight items for
each component were selected. These eight items yielded reliability scores of .87 for the
ACS, .75 for the CCS, and .79 for the NCS (Allen & Meyer, 1990). Subsequent factor
analysis for the 24 items revealed that each item loaded highest on the component for
which it was written. The affective scale accounted for 58.8% of the variance, while the
continuance and normative scales accounted for 25.8% and 15.4% of the variance,
respectively. Both the ACS and the NCS were significantly correlated with the OCQ.
Inter-correlations between the three component scales revealed a significant correlation
between the affective and normative scales.
In the second part of the study, Allen and Meyer (1990) tested their Affective,
Continuance, and Normative Commitment Scales and their relationship with proposed
antecedents. Subjects were full-time, non-unionized employees from a department store,

29
a hospital, and a university library. A letter of explanation, the questionnaire, and a pre-
addressed return envelope were distributed by the organizations’ personnel departments
to 634 employees. Three hundred thirty-three were voluntarily completed and returned.
Questionnaires included the ACS, CCS, and NCS. Several one or two item scales were
also included to measure theorized antecedents of each of the scales: job challenge, role
clarity, goal clarity, goal difficulty, management receptiveness, peer cohesion,
organizational dependability, equitable treatment, personal importance, feedback on
performance, participation in decision-making for ACS; transferability of skills,
transferability of education, likelihood of relocation upon leaving the organization, self-
investment, reduction of pension, proportion of resident in the community, and
employment alternatives for the CCS; and loyalty expectations for the NCS.
For the second part of the study, the reliabilities of the developed component
scales were .86 for the ACS, .82 for the CCS, and .73 for the NCS (Allen & Meyer,
1990). The correlation (r = .48) between the ACS and NCS was again significant. The
NCS also correlated significantly with the CCS, but the correlation was weak (r = .16).
Canonical correlation analysis was used to examine the antecedent variables. Three
canonical roots were produced, reflecting the three components. In general, results
followed the hypothesized predictions of antecedents for ACS, as well as the CCS,
although to a lesser degree.
Allen and Meyer (1990) developed a measure of organizational commitment
reflecting their three-component theory of organizational commitment. While grounded
in the earlier work of Porter et al. (1974), the scale expanded the measure to encompass

30
additional components. The three-component measure has been used in many research
studies and subjected to testing by many researchers (e.g., Xu & Bassham, 2010).
Xu and Bassham (2010) conducted quantitative research to test the Allen and
Meyer’s (1990) three-component model of organizational commitment. Specifically,
they examined the factor structure of the scale as well as the inter-item correlations.
From their results, they recommended the three-factor structure be retained and suggested
revisions to some of the items.
Research participants for the study were president assistants from 4-year
postsecondary educational institutions in the United States. From an initial pool of 1,334,
279 presidential assistants participated (response rate of 21%). Participants were
contacted via email and sent a hyperlink to the online survey instrument. The survey
instrument included the Affective, Continuance, and Normative Commitment Scales
(Allen & Meyer; 1990) as well as demographic items (i.e., gender, race, ethnicity,
degrees earned, salary, employment status, title, and employment region). As this study
was part of a larger study, the instrument also contained items not of interest to this
aspect of the research.
Data analysis revealed scale reliability scores of .85, .75, and .66 for the ACS,
CCS, and NCS, respectively (Xu & Bassham, 2010). Based on lower correlations with
the rest of the subscale, the authors recommended the removal of one continuance
commitment item and one normative commitment item and noted weak correlations of
two other NCS items. While a three factor, confirmatory factor analysis for the original
scale produced significant results, the data-model fit was unacceptable. Xu and Bassham
(2010) modified the scale data by removing the two items recommended for deletion and

31
moving the other two items from the NCS to the ACS based on the item correlations.
Confirmatory factor analysis on the modified scales yielded significant results and a
stronger fit. They also tested a four-factor model wherein the CCS was separated into
two subscales. While this model yielded significant results with good fit, the high
correlations between the two CCS subscales led the researchers to discard the four-factor
model.
In this section, the measures of organizational commitment were reviewed. Early
measures, such as Alutto et al. (1973) and Porter et al. (1974) approached the measure of
organizational commitment from different perspectives. The OCQ (Porter et al., 1974) is
prevalent in the literature and is still used by researchers (e.g., Lambert & Hogan, 2009;
Schroder, 2008). The three-component model measure by Allen and Meyer (1990),
while grounded in the work of Porter et al. (1974), expanded the measure of
organizational commitment to encompass the components of affective, continuance, and
normative commitment. The three-component organizational commitment measure has
continued to be researched and developed. While modifications have been suggested for
the measure, support has been found for the three-factor model (e.g., Xu & Bassham,
2010). In the next section, these assessments of commitment are applied to research
studies investigating the outcomes of commitment. This research underscores the
importance of the commitment construct and its status as a variable of interest in
organizational behavior.
Outcomes of organizational commitment.
In the previous sections, the development of the concept of organizational
commitment was reviewed as well as its measurement. In this section, the outcomes of

32
organizational commitment, including tardiness, absenteeism, and turnover are discussed.
Research investigating the relationship between organizational commitment and these
employee outcomes has spanned decades and continues to be of interest.
Tardiness and absenteeism.
Research by Dishon-Berkovits and Koslowsky (2002) investigated the
relationship of organizational commitment, time urgency, and the age of the youngest
child to employee tardiness. They hypothesized punctual employees would have higher
levels of organizational commitment and time urgency and older children than employee
who were tardy. Further, they hypothesized that these three variables would differentiate
between punctual and tardy employees.
For the study, Dishon-Berkovits and Koslowsky (2002) mailed questionnaires to
158 employees of an industrial organization in Israel. The questionnaire included the
OCQ (Porter et al., 1974); a measure of time urgency; demographic questions, including
the age of the youngest child; and the request for permission to obtain data from the
employee’s personnel file. Completed questionnaires and personnel data were available
for 128 employees. Tardiness was measured by the incidences of the employee arriving
to work one or more minutes after the scheduled start time. Data were gathered from the
organization’s time clock system for a 10-month period before questionnaire completion.
Based on the organization’s strict policy on tardiness, employees who were late one or
more times over the 10-month period were categorized as tardy. Employees with no late
clock-ins were categorized as punctual.
Data analysis revealed significant differences between the groups for all three
variables. Three, independent sample t tests demonstrated that tardy employees had

33
significantly lower levels of organizational commitment and time urgency as well as
younger children than employees in the punctual group did. Discriminant function
analysis demonstrated that all three variables were predictors of punctuality; however,
organization commitment was the strongest predictor.
The study by Dishon-Berkovits and Koslowsky (2002) demonstrated the
relationship between organizational commitment and tardiness. Other researchers have
also investigated this relationship. Blau (1986) investigated the effects of organizational
commitment and job involvement on employee absenteeism and tardiness. For the
quantitative study, 82 staff nurses working at a Midwestern city hospital completed
measures of organizational commitment and job involvement. The organizational
commitment was measured using a shortened version of the measure by Porter, Crampon,
and Smith (1976). Data were subsequently gathered for the subjects’ absenteeism and
tardiness for the 6-month period following the completion of the survey. For the study,
unexcused absences and unexcused tardiness were defined as the frequency of reporting
to work late or being absent without permission, respectively.
Through data analysis, Blau (1986) found that organizational commitment and job
involvement were significantly and positively correlated. Factor analysis conducted on
the two measures’ items demonstrated that the measures of organizational commitment
and job involvement were empirically independent. Organizational commitment was
significantly and negatively correlated with unexcused tardiness; however, the correlation
for unexcused absences was not significant. Job involvement did not significantly
correlate with unexcused absences or unexcused tardiness. Hierarchical regression
analysis showed that organizational commitment explained a significant portion of the

34
variance (3.7%) in unexcused tardiness but not for unexcused absences. Main effects for
job involvement were not significant for either dependent variable. The interaction term
of organizational commitment by job involvement was significant for tardiness and
absences.
In a study involving turnover as well as absenteeism, Somers (1995) explored the
relationship between organizational commitment and employee absenteeism, intent to
remain, and turnover. Subject participants were staff nurses at a hospital in the
northeastern United States. Affective, continuance, and normative commitment were
measured with the Allen and Meyer (1990) scale. Intent to remain was measured on a
scale devised by Bluedorn (1982, as cited in Somers, 1995). Absenteeism was assessed
by two methods: the number of absences in a 12-month period (i.e., total absences) and
the number of absences occurring before or after a weekend or holiday in a 12-month
period (i.e., annexed absences). No distinction was made between voluntary and
involuntary absences. Information on turnover was gathered from personnel records 12
months after survey completion. All turnover was voluntary. Due to the instances of
missing data, analysis for intent to remain and turnover was based on 388 subjects while
absenteeism was based on 303 subjects.
Overall regression analysis showed the three components of organizational
commitment accounted for a significant proportion of the variance in intent to remain
(22%) and annexed absences (27%; Somers, 1995). Affective commitment was a
significant predictor for intent to remain (positive relationship), turnover (negative
relationship), and annexed absences (negative relationship). Normative commitment was
a significant predictor for intent to remain (positive relationship). In examining the

35
interaction effects among the three components of commitment, the term of affective
commitment by continuance commitment was significant for intent to remain and
annexed absences. According to Somers, the relationship between affective commitment
and intent to remain and affective commitment and annexed absenteeism was tempered at
high levels of continuance commitment.
While the previous studies by Blau (1986), Dishon-Berkovits and Koslowsky
(2002), and Somers (1995) have considered absenteeism on the individual level,
Hausknecht et al. (2008) investigated absenteeism at the unit level, such as a department
or division. They hypothesized that organizational commitment and job satisfaction
would be negatively related to absenteeism at the unit level. They also examined the
effect of local unemployment rates on organizational commitment and job satisfaction in
predicting absenteeism.
Employees of a large state transportation department served as subjects for the
Hausknecht et al. (2008) study. Using a repeated measures design, data were collected
from subjects at five intervals over a 6-year period. Initial surveys were performed on
paper but were gradually transferred to an online survey site. Response rates were not
significantly different between the two methods. The surveys consisted of measures of
organizational commitment (adapted from Meyer & Allen, 1984) and job satisfaction. To
aggregate individual level data to the unit level, the average value for the subjects in a
unit was used. Data concerning absenteeism were gathered from the organization.
Absenteeism was expressed as a percentage of work hours missed due to absences of less
than three consecutive workdays. Unemployment rates at the county level were collected
from the Bureau of Labor Statistics.

36
After building a longitudinal model of absenteeism and after controlling for unit
size, unit type (i.e., maintenance or office), and unemployment, data analysis revealed
organizational commitment and job satisfaction were each negatively related to
absenteeism. The interaction between organizational commitment and job satisfaction
for absenteeism was also significant. Lower levels of absenteeism were found for units
with high organizational commitment and high job satisfaction. Further analysis
demonstrated that the unemployment rate moderated the relationship between
organizational commitment and absenteeism as well as between job satisfaction and
absenteeism. The study by Hausknecht et al. (2008) showed the relationship between
organizational commitment and absenteeism found at the individual level also extended
to the unit level.
The studies by Blau (1986), Dishon-Berkovits and Koslowsky (2002), and
Somers (1995) demonstrated a relationship between organizational commitment and
tardiness and absenteeism. In addition, this relationship may exist on the unit level as
well as on the individual level (Hausknecht et al., 2008). Research has also explored the
relationship between organizational commitment and another important outcome
variable, turnover.
Turnover.
Two of the studies previously discussed in this chapter included turnover and
turnover-related variables. The research of Porter et al. (1974) demonstrated a
significant, inverse relationship between organization commitment and turnover and that
this relationship grows stronger as the employee approaches turnover. Somers (1995)

37
also found support for the relationship between organizational commitment and intent to
remain.
To amalgamate the prior research results concerning organizational commitment,
Mathieu and Zajac (1990) conducted a meta-analysis on the antecedents, correlates, and
consequences of organizational commitment. For the analysis, studies that measured
organizational commitment on an individual level and presented empirical findings
between organizational commitment and another variable were included. To be included
in the analysis, Mathieu and Zajac set a three-correlation minimum threshold for
variables. These parameters yielded correlations between organizational commitment
and 48 variables from 124 published studies and 174 independent samples.
For the 48 variables included in the meta-analysis, Mathieu and Zajac (1990)
categorized them as antecedents, correlates, or outcomes. Categorization as an
antecedent was based on the framework of others (Mowday et al., 1982; Steers, 1977)
and included personal, job, and organizational characteristics as well as group-leader
relations and role states. Correlates were so designated because, like organizational
commitment, they reflect a psychological reaction or response to the organization and its
environment. Consequences included behavior or behavioral intentions. The authors
acknowledged that a certain amount of reciprocity likely existed among the variables;
however, the classification provided a framework to discuss the analysis results.
The meta-analysis by Mathieu and Zajac (1990) included an analysis of eight
outcome variables of organizational commitment. Of these, large, negative correlations
(i.e., above .40), corrected for sampling error and attenuation, were found for intention to
search and intention to leave. A medium, negative corrected correlation (i.e., between

38
.21 and .40), was found for turnover. Small, corrected correlations (less than .21) were
found for attendance and lateness (negative) in addition to others’ ratings of job
performance, output measures of job performance, and perceived job alternatives
(negative). Results for antecedent and correlates are discussed in the sections of this
chapter.
Lambert and Hogan (2009) examined the impact of personal characteristics, work
environment, employment opportunities, job satisfaction, and organizational commitment
on intent to turnover. Research subjects were the staff, excluding upper administration,
of a private, maximum-security prison in the Midwestern United States. Two hundred
surveys with postage-paid return envelopes were distributed to employees. Incentives
were offered to participants in the form of cash awards via a raffle drawing. One hundred
sixty employees completed and returned the survey. In addition to items related to a
larger study, the survey instrument contained measures of turnover intention,
organizational commitment (adapted from Mowday et al., 1982), job satisfaction,
perceived job dangerousness, role ambiguity, role conflict, role overload, input into
decision-making, and organizational fairness, as well as items for gender, age, tenure,
position (i.e., correctional officer or not a correctional officer), education level, race, and
perception of external employment opportunities.
Using multivariate ordinary least squares regression analysis, 61% of the variance
in turnover intent was accounted for by the variables collectively (Lambert & Hogan,
2009). Organizational commitment had the greatest significant impact on the intention to
turnover, followed by job satisfaction and age, respectively. None of the remaining
variables achieved significance. In a secondary analysis to consider the indirect impact

39
of personal characteristics and work environment variables on turnover intent through
organizational commitment and job satisfaction, another multivariate ordinary least
squares regression analysis was conducted. For organizational commitment, 71% of the
variance was accounted for by the personal and work environment variables. Significant
relationships were found for job satisfaction, input into decision-making, organizational
fairness, and role conflict. For job satisfaction, 57% of the variance in job satisfaction
was accounted for by the variables collectively, with significant findings for
organizational fairness, role ambiguity, role overload, and gender.
The studies by Lambert and Hogan (2009), Mathieu and Zajac (1990), Porter et
al. (1974), and Somers (1995) are a few examples of research demonstrating an inverse
relationship between organizational commitment and turnover. In addition, the study by
Porter et al. demonstrated that the relationship between commitment and intent to
turnover grew stronger as the employee approached turnover. As previously discussed,
other studies have also demonstrated a relationship between organizational commitment
and other outcome variables, including tardiness and absenteeism. Job satisfaction, as
discussed in the next section, has also been considered an outcome variable of
organizational commitment. It has also been considered an antecedent and a correlate.
While that nature of the relationship between organizational commitment and job
satisfaction has been a source of divergence among researchers, the existence of the
relationship is well researched.
Relationship with job satisfaction.
Many studies have investigated the relationship between organizational
commitment and job satisfaction (e.g., Aryee et al., 1991; Bedeian, 2007; Billingsley &

40
Cross, 1992; Boehman, 2007; Brierley, 1996; Buka & Bilgic, 2010; Hausknecht et al.,
2008; Lambert & Hogan, 2009; Porter et al., 1974; Schroder, 2008). As noted by
Mathieu and Zajac (1990), “The influence of job satisfaction and its components is one of
the more thoroughly investigated topics in the [organizational commitment] literature” (p.
183). The exact nature of the relationship is a subject of debate among researchers
(Mathieu & Zajac, 1990). Some research has supported organizational commitment as an
antecedent of job satisfaction while other research has supported job satisfaction as an
antecedent of organizational commitment.
While causality remains unresolved, research has demonstrated that
organizational commitment and job satisfaction are related concepts. As discussed in
previous sections within this chapter, significant results between organizational
commitment and job satisfaction have been found by Brierley (1996), Hausknecht et al.
(2008), and Lambert and Hogan (2009). Additional studies with results supporting this
relationship are included in following sections of this chapter as well.
In addition to the outcome variables already discussed, the meta-analysis by
Mathieu and Zajac (1990) included an analysis of 14 correlates of organizational
commitment. Of these, eight were related to satisfaction. Large correlations, corrected
for sampling error and attenuation, were found for overall job satisfaction, satisfaction
with supervision, and satisfaction with the work itself as well as motivation, internal
motivation, job involvement, and occupational commitment. Medium corrected
correlations were found for intrinsic job satisfaction, satisfaction with coworkers,
promotion satisfaction, pay satisfaction, stress (negative), and union commitment. A
small, corrected correlation was found for extrinsic job satisfaction.

41
Due to its strong relationship with job satisfaction, researchers have also
investigated whether organizational commitment and job satisfaction were measurements
of the same construct. Research has demonstrated their distinctiveness. Hausknecht et
al. (2008) found that a two-factor model results in a better fit than a one-factor model for
measures of organizational commitment and job satisfaction. While other studies found
significant correlations between measures of organizational commitment and job
satisfaction, they did not indicate multicollinearity (e.g., Boehman, 2007) or construct
redundancy (Meyer et al., 2002). Porter et al. (1974) also found that organizational
commitment exhibited a significant relationship with turnover even when job satisfaction
was held constant.
While the nature of the relationship between organizational commitment and job
satisfaction may be undetermined, the existence of a relationship is supported by the
literature. Furthermore, organizational commitment has been shown to be related to
important outcome variables as well, such as turnover, tardiness, and absenteeism. The
discovery of how organizational commitment is formed and what factors influence its
formation would be pivotal in an attempt to direct resources to increase employees’
commitment and thereby benefit from the positive consequences of such in an
organizational setting. The next section will review research on antecedents of
organizational commitment, including personal, position, and organization
characteristics.
Antecedents of organizational commitment.
Given the important outcomes that have been associated with organizational
commitment as discussed in the previous section, researchers have investigated the

42
development and antecedents of organizational commitment. Research on antecedent
variables has been “characterized by a ‘laundry list’ of significant antecedent or correlate
variables” (Reichers, 1985, p. 467), a comment echoed by Meyer and Allen (1991).
While the variables can often be grouped into three broad categories of personal,
position, and organization characteristics, most studies investigated variables from more
than one category. Organizational characteristics have received less attention in the
commitment literature than the other two categories, a lack that has been noted by
researchers (e.g., Glisson & Durick, 1988; Meyer & Allen, 1991). For this reason, the
organizational characteristics are discussed separately.
Personal and position characteristics.
In a two-part study, Morris and Sherman (1981) studied the antecedents of
organizational commitment and then tested the generalizability of the results. Based on
earlier research, seven variables previously found to be related to organizational
commitment were selected: age, education, sense of accomplishment, role conflict, role
ambiguity, initiating structure, and supervisor consideration. After arriving at a
prediction model based on the entire sample, the data were re-analyzed to check for
model differences based on job level, job focus, and organizational membership.
For the study, questionnaires were administered to employees at three care and
training facilities for developmentally disabled people. The facilities were located in the
same state and operated by the state government. Across the three facilities, 506
employees voluntarily completed the questionnaire for a 35% response rate. The
questionnaire included the OCQ (Porter et al., 1974) as well as items related to age,

43
education, role conflict, sense of accomplishment, role ambiguity, initiating structure, and
supervisor consideration.
Data analysis revealed significant zero-order correlations between organizational
commitment and all of the other study variables (Morris & Sherman, 1981). Most of the
variables were inter-correlated as well. Stepwise multiple regression resulted in a seven-
predictor model that explained 47% of the variance in organizational commitment. The
six variables of age, education, role conflict, sense of accomplishment, initiating
structure, and supervisor consideration made significant contributions in the model. The
only variable that did not achieve significance was role ambiguity. To test the
generalizability of the model, subsequent regression analysis was conducted including
nuisance variables. Separate analysis for job level, job focus, and employing
organization had no significant effects on the original seven variables and failed to
increase the proportion of variance explained by the original model.
As discussed in a previous section, the meta-analysis by Mathieu and Zajac
(1990) also included an analysis of 26 antecedent variables of organizational
commitment. Of these, large correlations, corrected for sampling error and attenuation,
were found for perceived personal competence, job scope, and leader communication.
Medium corrected correlations were found for age, Protestant work ethic, skill variety,
challenge, task interdependence, leader initiating structure, leader consideration,
participative leadership, role ambiguity (negative), role conflict (negative), and role
overload (negative). Small corrected correlations were found for gender, education
(negative), marital status, position tenure, organizational tenure, ability, salary, job level,

44
task autonomy, group cohesiveness, organizational size (negative), and organizational
centralization (negative).
Like Morris and Sherman (1981), Aryee et al. (1991) explored predictor variables
for organizational commitment as well as turnover. In addition, they sought to discover if
the antecedents were the same across professional versus non-professional employment
settings. The study was conducted in Singapore to investigate if the observed
relationship from a newly industrialized country differed from results found in earlier
studies conducted in established industrialized countries.
Seven hundred surveys were mailed to a random sample of certified public
accountants in Singapore. Two hundred forty-five usable surveys were received. The
survey instrument included the 15-item OCQ (Porter et al., 1974) which had a .89 alpha
coefficient for this subject sample. To measure professional commitment, Aryee et al.
(1991) modified the OCQ by substituting the word profession for organization.
Measures of skill utilization, realization of professional expectations, professional-
organizational conflict, job satisfaction, and turnover intentions were also included.
Aryee et al. (1991) found significant and positive zero-order correlation between
organizational commitment and professional commitment, skill utilization, and job
satisfaction. Significant and negative correlations for commitment were found with
realization of expectations and turnover intentions. The correlation with the professional-
organizational conflict variable was not significant. Stepwise multiple regression for
organizational commitment yielded three significant predictor variables: job satisfaction,
realization of professional expectations, and professional commitment. Together, these
accounted for 55% of the variability in organizational commitment. Regression analysis

45
for turnover intentions yielded two significant predictor variables, organizational
commitment and job satisfaction, which accounted for 36% of the variability.
To examine the predictors of organizational commitment by employment setting,
Aryee et al. (1991) analyzed data after grouping data by professional and non-
professional employment setting. The employment setting distinction was based on
whether the accountant worked in an accounting firm (professional) or not
(nonprofessional). For both groups, job satisfaction, realization of professional
expectations, and professional commitment were again significant predictors for
organizational commitment. For the nonprofessional group, skill utilization was also
significant. The amount of variance account for was the same, 55%. For turnover
intentions, the predictor variables of organizational commitment and job satisfaction were
significant for the professional and non-professional settings, accounting for 38% and
37% of the variance, respectively.
In a study focused on general and special education teachers, Billingsley and
Cross (1992) studied the relationship of personal and work-related variables to
commitment and job satisfaction. The measures of commitment included both
organizational commitment and professional commitment. The relationship among
commitment, job satisfaction, and the teachers’ intent to stay in teaching was examined.
From the Virginia State of Education personnel database, a random selection of
general and special educators (n = 1147) were drawn and were mailed questionnaires at
their work addresses at three intervals. The response rate was 83% (n = 956). The
questionnaire included the demographic and work-related characteristics of interest, three
measures of commitment (one organizational and two professional), and one measure of

46
job satisfaction. The first measure of professional commitment was an adaptation of the
15-item OCQ (Porter et al., 1974), altered to focus on the profession rather than the
organization. The second measure of professional commitment was the scale developed
by Alutto et al. (1973). The correlations between the two professional commitment
measures were .53 and .54 for general and special educators, respectively. The
organizational commitment measure was based on a modification of the Alutto et al.
scale with alterations to focus the scale on the school rather than the profession. To
access job satisfaction, teachers were asked to indicate their agreement or disagreement
with various satisfaction statements. Other existing measures were used to assess job
involvement, stress, role conflict, role ambiguity, and leadership support. Questions
relating to demographic variables included gender, age, race, number of years in
teaching, number of years teaching in the current school division, education level, and
primary breadwinner status.
Analysis on the descriptive statistics of general and special educators showed
significant differences between the groups’ means on their commitment to the school,
role conflict, role ambiguity, stress, and job involvement (Billingsley & Cross, 1992).
Separate regression analyses were used to predict the three commitment variables and job
satisfaction from the 12 demographic and work-related variables. In general, the work-
related variables were better at predicting organizational commitment, professional
commitment, and job satisfaction than were the demographic variables for both general
and special educators. Regression analysis was used to examine the relationship between
the commitment and satisfaction to the intention to remain in teaching. For general and
special educators, the two measures of professional commitment contributed significantly

47
to the prediction of intention to stay in teaching, but organizational commitment and job
satisfaction did not.
Similar to Billingsley and Cross (1992), Wallace (1995) studied variables that
influenced organizational commitment and professional commitment; however, their
research focused on lawyers rather than teachers. Variables related to authority and
autonomy, career opportunities, specialization, and collegiality were included. The
research also encompassed two different employment settings, professional and non-
professional organizations. A professional work setting was described as one in which
the majority of the employees are professionals, the professional work is central to the
mission of the organization, and the goals of the organization and the professional are
consistent with one another (e.g., law firms). In nonprofessional organizations,
professionals work in sub-units of a larger, bureaucratic organization (e.g., lawyers
serving as counsel for corporations or in government agencies).
Questionnaires were mailed to the work addresses of all lawyers in a city in
Western Canada from a professional organization’s mailing list (n = 1,155). Of those
returned complete, only lawyers who indicated that they practiced in a private practice
law firm and government or corporate lawyers were included (n = 730). The sample was
similar to the population on the characteristics of gender and work setting. The
questionnaire consisted of a 3-item measure of organizational commitment adapted from
the OCQ (Porter et al., 1974) and a matching, 3-item measure of professional
commitment also adapted from Porter et al. (1974). The items dealt with the degree to
which the respondents felt loyal, cared about, and were proud of their employing
organization. Other measures included authority and autonomy, career opportunities,

48
specialization, collegiality, and various control variables (i.e., perceived labor market
conditions, employer size, earnings, tenure, years of previous legal experience, education,
gender, kinship responsibilities, and work motivation).
Data were categorized according to the professional or nonprofessional work
setting. Significant differences were found between the groups for both organizational
and professional commitment, with employees of professional organizations having
higher commitment means than employees of nonprofessional organizations (Wallace,
1995). After the data were adjusted for structural characteristics (i.e., authority and
autonomy, career opportunities, specialization, and collegiality), the differences were no
longer significant for organizational commitment, but they were for professional
commitment. After the means were adjusted for the structural characteristics and the
control variables (i.e., perceived labor market conditions, employer size, earnings, tenure,
years of previous legal experience, education, gender, kinship responsibilities, and work
motivation), the differences were no longer significant for either commitment measure.
For organizational commitment, regression analysis produced significant results
for the nonprofessional group for legitimacy of criteria used in distributing rewards,
autonomy, promotions, and specialization. Regression for the professional organizations
yielded results for legitimacy of criteria used in distributing rewards, fairness or rewards,
autonomy, promotions, task variety, and co-worker support. For professional
commitment, regression analysis produced significant results for the nonprofessional
group for participation, co-worker support, and motivation. Regression for the
professional organizations yielded results for legitimacy of criteria used in distributing

49
rewards, autonomy, formalization, specialization, task variety, co-worker support, and
motivation were significant.
The results found by Wallace (1995) initially indicated that the work setting, in
this case professional versus nonprofessional, influenced organizational commitment.
After controlling for authority and autonomy, career opportunities, specialization, and
collegiality, the differences were no longer significant. However, the study measured
commitment by a 3-item scale adapted from the Porter et al. (1974) 15-item scale. No
reliability or validity data of this shortened form were supplied. Brierley (1996), as
discussed previously in this chapter, found a shortened, 9-item scale to have questionable
validity.
In their research, Chang and Choi (2007) investigated the relationship between
organizational commitment and professional commitment, and how this relationship
changed over an employee’s tenure. They theorized that organizational commitment
would be high during the introductory period, decline, and then increase, creating a “u”
shape. For professional commitment, they theorized that the inverse would happen. As
one type of commitment decreased, the other would increase, and thus they would
complement each other.
Questionnaires were mailed to 310 research and development employees at two
electronics firms in Korea. The response rate was 66% (n = 204). The questionnaires
included a 5-item organizational commitment measure adapted from Mowday et al.
(1979). The measure of professional commitment was comprised on these same items
with the word profession substituted for company. Demographic items included were
tenure, gender, educational attainment, and previous number of employers.

50
To avoid the challenges of longitudinal research, Chang and Choi (2007)
partitioned the data into seven groups based on employee tenure to show changes in
commitment over employee tenure. Groupings covered shorter spans of time for more
recent hires and longer spans of time for longer-term employees, with time ranges from 1
month to 12 years. Significant differences were found between organizational and
professional commitment in the second group (3 to 6 months of tenure) and in the third
group (7 to 12 months of tenure). Overall, the levels of organizational commitment
followed a u-shaped pattern. The pattern for professional commitment was more erratic.
Focusing on just employees with less than 12 months of tenure, the theorized u-shape for
organizational commitment and inverse u-shape for professional commitment were
found. Exploratory post hoc regression analysis limited to the first 14 months of tenure
revealed curvilinear patterns for organizational and professional commitment with
comparable effect sizes in opposite directions.
As Chang and Choi’s (2007) research was limited to research and development
professionals at electronics firms in Korea, it may not be generalizable to other
environments. However, it does suggest that an employee’s length of employment may
be a mitigating factor that should be considered when investigating organizational or
professional commitment. Some studies have found significant effects for
tenure/employment length (Fuller et al., 2006; Marchiori & Henkin, 2004; Porter et al.,
1974) while other studies have not (Bedeian, 2007; Billingsley & Cross, 1992; Giffords,
2003; Wallace, 1995).
Research has demonstrated a relationship between organizational commitment
and a variety of personal and position characteristics (Aryee et al., 1991; Mathieu &

51
Zajac, 1990; Morris & Sherman, 1981). Billingsley and Cross (1992) found that
organizational commitment was more influenced by work-related variables than by
personal demographics. In a study focusing length of employment, Chang and Choi
(2007) found that organizational commitment may change over time, as also
demonstrated by Porter et al. (1974).
Organizational characteristics.
Unlike personal and position characteristics, organizational characteristics have
received little attention in the organizational commitment literature, a lack that has been
noted by researchers (Glisson & Durick, 1988; Meyer & Allen, 1991). Support for a
relationship between organizational commitment and organizational size (Su et al., 2009)
as well as organizational type (Giffords, 2003; Goulet & Frank, 2002) has been found.
Goulet and Frank (2002) studied the impact of organizational type on
organizational commitment. The study included public, for-profit, and not-for-profit
organizations. Demographic variables included age, gender, marital status, caring for a
child or elderly parent, educational level, employment sector, years of service in current
position, years of service with current employer, and current or previous supervisory
experience.
Full-time employees of 16 organizations took part in the study. Paper surveys
were distributed and collected by managers or key work-group members. No information
was given regarding the organizations’ field or their location; they were listed as
businesses, agencies, and offices. Surveys were completed at the work site and sealed in
envelopes by the respondent. Of 375 employees, 228 completed the survey (response
rate of 61%). The surveys included the OCQ (Mowday et al., 1979), three items related

52
to hours worked, and demographic variables. In this study, the OCQ had a reliability
alpha of .91 (Goulet & Frank, 2002).
Data were analyzed to discover possible demographic differences that might exist
by organizational type. Employees of public organizations were significantly older than
not-for-profit and for-profit employees. Not-for-profit organizations had a significantly
higher proportion of female employees than for-profit organizations. Organizational
commitment was significantly and negatively correlated with age. For organizational
sector, organizational commitment was significantly lower for employees of public
organizations. The difference between not-for-profit and for-profit organizations was not
significant.
Giffords (2003) investigated the relationship of organizational type (i.e., public,
not-for-profit, and proprietary) and demographic variables to commitment. This
quantitative research included organizational commitment and professional commitment
of social service employees. Based on previous research, the demographic variables
included were age, length of service, gender, marital status, position, and education.
Participants were social service employees working for three different social
service organizations in a New York county (N = 207). Participants were asked to
participate in the research during business-related meetings. The survey instrument
comprised the 15-item OCQ (Porter et al., 1974), the15-item PCQ (Aranya et al., 1981),
and items concerning type of employment setting, age, gender, employment status,
marital status, education level, length of service, and position. Both the OCQ and the
PCQ were measured on a 7-point Likert scale ranging from 1 = highly dissatisfied to 5 =

53
highly satisfied. The OCQ had a reliability coefficient of .90 and the PCQ, .87 (Giffords,
2003).
The data were analyzed using a one-way (ANOVA) for organizational
commitment and organizational type. Results indicated statistically lower means for
public employees than not-for-profit and proprietary employees (Giffords, 2003). The
mean difference between not-for-profit employee and proprietary employees was not
significant. The one-way ANOVA for professional commitment and organizational type
did not yield significant findings. Multiple regression analysis showed no significant
relationships between organizational commitment and any of the demographic variables.
For professional commitment, significant results were found for age and position.
Position was categorized as administrators or all others (i.e., groups collapsed across line
workers, supervisors, and people who performed both of these tasks).
In a study outside the United States, Al-Qarioti and Al-Enezi (2004) examined the
organizational commitment of middle level managers by organizational type. The four
organizational types were government ministries, public institutions, private businesses,
and nongovernment organizations. According to Al-Qarioti and Al-Enezi, ministries and
nongovernment organizations are not profit or market oriented, but ministries are owned
by the state while nongovernment organizations are owned by national associations.
Public institutions are owned by the state and partially market oriented. Private
businesses are primarily owned by the private sector and are profit and market oriented.
Using a stratified random sampling, 400 mid-level managers were selected from
six ministries, six public institutions, six private institutions, and three nongovernment
organizations in Jordan. Paper questionnaires were distributed to managers, who

54
completed and returned the questionnaires. The response rate was 83% with 332
questionnaires returned. Questionnaires consisted of the OCQ (Mowday et al., 1979),
which was modified and translated into Arabic. Items related to organizational type, age,
gender, education level, marital status, and years of service were included.
Correlations with organizational commitment yielded significant results for age,
educational level, and marital status. One-way analysis of variance for organizational
commitment by organizational type yielded no significant results. The same was true for
age, gender, and length of service. Significant results were found for education and
marital status.
The findings by Al-Qarioti and Al-Enezi (2004) concerning organizational
commitment and organizational type are contrary to the results of Giffords (2003) and
Goulet and Frank (2002). The study was conducted in another country with different
types of organizations (i.e., government ministries, public institutions, private businesses,
and nongovernment organizations), which may have affected the results. “In the opinion
of the present researchers the findings of the study can be understood in the Jordanian
context, as no great differences [exist] in work conditions between types of organizations
in Jordan” (Al-Qarioti & Al-Enezi, 2004, p. 343).
In a study conducted in Albania, Buka and Bilgic (2010) examined the differences
in organizational commitment, job satisfaction, and job involvement for public and
private teachers in Albania. Subjects were public and private high and secondary school
teachers from various schools and cities in Albania. For data collection, the researcher
explained in-person the purpose of the study and its voluntary nature, then distributed the
questionnaires to the teachers. The researcher usually returned the next day to gather the

55
completed questionnaires. The questionnaire contained translated and revised
measurements of job satisfaction, job involvement, and the organizational commitment
(Meyer & Allen, 1997).
Due to the translation into Albanian and to investigate the use of the scale in that
country, an explanatory factor analysis was performed on the organizational commitment
measure. The scree plot favored a one-factor solution that accounted for 31% of the
variance, while the parallel test favored a two-factor solution. The reliability of the
measure was .85 (Buka & Bilgic, 2010).
Due to correlation analysis and qualifying requirements, age was included in
hypothesis testing as a covariate. A 2 x 2 multiple analysis of covariance (MANCOVA)
was performed for organizational type and gender on organizational commitment, job
satisfaction, and job involvement. No significant results were found for gender.
Significant results for organizational type were found for organizational commitment, job
satisfaction, and job involvement. Teachers working in the private schools had higher
levels of organizational commitment and job satisfaction than did teachers working at
public schools. Teachers in public schools had higher levels of job involvement than
their private school counterparts did.
The studies by Goulet and Frank (2002) and Giffords (2003) indicated that
organization type has an impact on organizational commitment. In both studies, public
sector employees had significantly lower organizational commitment than employees in
for-profit and not-for-profit organizations. Goulet and Frank theorized that the lower
organizational commitment found for public sector employees was due to their less
attractive compensation package. Giffords suggested that the lack of promotional

56
opportunities could account for the lower organizational commitment of employees of
public institutions. Research by Buka and Bilgic (2010) outside the United States
provided support for difference in organizational commitment according to organization
type for public and private school teachers. Al-Qarioti and Al-Enezi (2004) did not find
differences in commitment for organizational type in Jordan. Differences in countries
and organizational types may account for these conflicting findings.
Much research has been undertaken to explore the construct of organizational
commitment. Research has demonstrated its relationship with important outcome
variables, including turnover and absenteeism, and has attempted to identify antecedent
variables. Previous research has taken place in different organizations, with many
different employees. The current research is focused on employees of higher education
institutions. Previous research concerned with organizational commitment and conducted
in similar institutions is of particular interest to this study.
Organizational commitment and higher education.
Boehman (2007) researched the predictor variables for organizational
commitment for student affairs professionals. The organizational variables included were
job satisfaction, organizational support, organizational politics, and work/nonwork
interaction variables (measured in this study as gender, marital status, and provider role).
Only the affective commitment component of organizational commitment was used.
Subjects were randomly sampled from members of a national association of
student affairs professionals. Selected professional were sent an email that explained the
purpose of the research as well as the hyperlink to the Web-based survey. The survey
hyperlink was closed 15 business days after the email was sent. Of the 1,450 emails sent,
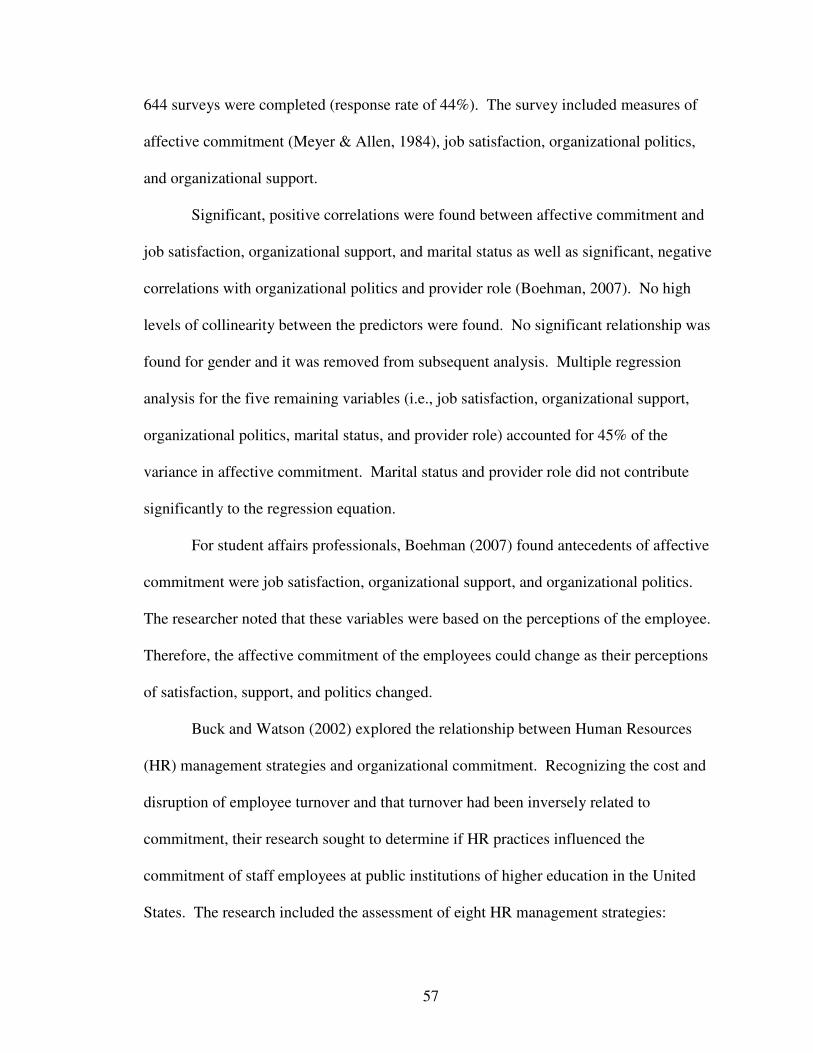
57
644 surveys were completed (response rate of 44%). The survey included measures of
affective commitment (Meyer & Allen, 1984), job satisfaction, organizational politics,
and organizational support.
Significant, positive correlations were found between affective commitment and
job satisfaction, organizational support, and marital status as well as significant, negative
correlations with organizational politics and provider role (Boehman, 2007). No high
levels of collinearity between the predictors were found. No significant relationship was
found for gender and it was removed from subsequent analysis. Multiple regression
analysis for the five remaining variables (i.e., job satisfaction, organizational support,
organizational politics, marital status, and provider role) accounted for 45% of the
variance in affective commitment. Marital status and provider role did not contribute
significantly to the regression equation.
For student affairs professionals, Boehman (2007) found antecedents of affective
commitment were job satisfaction, organizational support, and organizational politics.
The researcher noted that these variables were based on the perceptions of the employee.
Therefore, the affective commitment of the employees could change as their perceptions
of satisfaction, support, and politics changed.
Buck and Watson (2002) explored the relationship between Human Resources
(HR) management strategies and organizational commitment. Recognizing the cost and
disruption of employee turnover and that turnover had been inversely related to
commitment, their research sought to determine if HR practices influenced the
commitment of staff employees at public institutions of higher education in the United
States. The research included the assessment of eight HR management strategies:

58
benefits, due process, employee participation, employee skill level, general training, job
enrichment, social interactions, and wages.
Data collection was conducted in two separate phases. In the first phase, a survey
instrument was mailed to the chief HR employee at all 84 public higher education
institutions in the continental U.S. that were Carnegie classified Research I or Research II
institutions. The survey contained items related to the eight HR management strategies
of interest. Of these 34 returned surveys, six institutions were included in the second
phase of data collection. Institutions were dropped from subsequent inclusion due to
unusable responses, inability to attain Institutional Review Board approval to participate
in the study, unwillingness to provide a list of staff employees meeting study criteria, or
unwillingness to allow direct access to employees via email.
In the second phase of data collection, staff employees with 16 to 22 months of
continuous employment from the six remaining institutions were asked to complete the
Affective, Continuance, and Normative Commitment Scales (Meyer, Allen, & Smith,
1993). The employment period was specified in an attempt to reduce confounds due to
employment length. Employees completed the questionnaire through an online site after
gaining access through a provided password. Within the 8-day timeframe given, 130
employees completed the questionnaire (response rate = 29%).
Regression analysis for each of the commitment scales scores was computed
separately. Results showed no statistically significant relationships between HR
management variables and the individual organizational commitment components.
Correlation coefficients between certain HR management variables and two of the
commitment components were significant. Wages were significantly correlated with

59
affective commitment. General training and job enrichment were significantly related to
normative commitment. There were no significant findings for continuance commitment.
While it appears from the research of Buck and Watson (2002) that HR
management strategies overall have little impact on employees’ organizational
commitment, there does seem to be some evidence that particular strategies may impact
specific organizational commitment components. The HR strategies that were found to
be related to affective and normative commitment were unique for each component.
Buck and Watson’s (2002) inclusion of staff employees with between 16 and 22
months of continuous employment may have influenced the results. Chang and Choi
(2007) found a significant decrease in organizational commitment at 7-12 months of
tenure, which began to increase after 3 years. It is possible that by selecting employees in
the early, disillusionment phase, organizational commitment was too low to find results
for HR strategies.
In a quantitative study involving faculty, Bland, Center, Finstad, Risbey, and
Staples (2006) investigated how productivity and commitment were impacted by
appointment type and years of experience in teaching. Appointment type was
categorized as tenured or tenure-track versus other appointments (i.e., not on tenure-track
in institutions with or without a tenure system). Only full-time faculty were included.
Data for the Bland et al. (2006) study were a subset of the data collected during
the 1999 National Study of Postsecondary Faculty conducted by the National Center for
Education Statistics. From the sampled U.S. postsecondary institutions, data for full-time
faculty from Research and Doctoral institutions were included (n = 5,226). Research
productivity was captured in the dataset through items related to publications (articles,

60
books, and software), presentations, patents or products, funded research, grant amounts,
and hours spent on research. Educational productivity was captured through items
related to number of classes taught, hours spent teaching, hours spent advising, number of
committees served on, and number of committees chaired. Three items were used as a
proxy for organizational commitment likelihood of leaving current academic position,
likelihood of choosing an academic career again, and hours worked per week.
A three-way multivariate analysis of variance (MANOVA) was conducted for
appointment type on research productivity, educational productivity, and commitment
while controlling for educational degree and role focus (i.e., differentiated or
comprehensive). One MANOVA was run for all faculty within the study’s parameters
and a second, separate MANOVA was run with only new hires, operationalized as
faculty with less than seven years of experience. Overall, results indicated that tenured
and tenure-track faculty were more productive in terms of research and teaching
productivity. Commitment, as measured, was significantly higher for tenured and tenure-
track faculty than for non-tenure-track faculty. Similar results were found for faculty
with less than 7 years of experience (subset of faculty group) although fewer of the
differences were significant.
Based on the research of Bland et al. (2006), it may be important to include the
type of faculty appointment in research concerning organizational commitment.
However, due to the use of an existing dataset, Bland et al. devised a 3-item proxy for
organizational commitment (i.e., likelihood of leaving current academic position,
likelihood of choosing an academic career again, and hours worked per week). While
organizational commitment and intent to leave have been found to be related (Aryee et

61
al., 1991; Lambert & Hogan, 2009; Mathieu & Zajac, 1990; Porter et al., 1974), it is
unknown if these items were an accurate assessment of organizational commitment.
Bedeian’s (2007) research focused on the creation of a measure of faculty
cynicism and explored its relationship with other employee-organization variables,
including organizational commitment, organizational identification, job satisfaction, and
turnover. The study population was the 2004 Academy of Management Meeting
participants as listed in the meeting’s published program. This population was restricted
to those holding terminal degrees, affiliated with an educational institution in the U.S.,
and having an email address ending in a U.S. extension or non-commercial domain name.
From those, every third name from an alphabetical listed was selected. Participants were
emailed a cover letter and the link to an online survey. A reminder email was sent one
week later. The online survey was available for 10 days. The survey consisted of the
measures of cynicism developed by the researcher for this study, affective commitment
(Allen & Meyer, 1990), organizational identification, job satisfaction, turnover intentions,
and demographic information. After the elimination of unusable responses, 379 surveys
were used in the data analysis.
Intercorrelations between affective commitment and the study variables yielded
statistically significant, positive results for organizational identification and job
satisfaction. Significant, negative correlations were found with cynicism and intended
turnover. Affective commitment did not relate to years at the current university, years
with the highest degree, academic rank, age, or gender. The composite reliability of the
affective commitment scale was .88 (Bedeian, 2007).

62
Marchiori and Henkin (2004) assessed the organizational commitment of
chiropractic faculty in the United States and Canada. The researchers requested that the
16 chiropractic colleges in the U.S. and the one chiropractic college in Canada distribute
and collect surveys on their behalf. Surveys consisted of an organizational commitment
measure (Meyer & Allen, 1984), personal characteristics (i.e., age, gender, years with
current institution, and years in higher education), and workplace variables (i.e.,
employment status, academic rank, assignment, and chiropractic college). Two
institutions did not participate. Of the remaining institutions, 609 surveys were
completed and returned (response rate of 54%).
Correlations for the three commitment components and age, academic rank, years
at the current institution, and years in higher education yielded different significant
results for each component. Continuance commitment correlated with all four variables.
Affective commitment correlated with rank and year in higher education. Normative
commitment correlated significantly with years at current institution. Regression analysis
for each commitment component yielded different predictor variables for each.
Continuance commitment had the highest number of significant predictors as well as the
most variance explained (12.2%). Its predictors included rank, years at current
institution, employment status, and employing institution. The only significant predictor
variable for affective commitment was years in higher education, and for normative
commitment, gender. Both results were modest (1.1% and .8% of variance explained,
respectively).
The research by Marchiori and Henkin (2004) demonstrated that the different
components of organizational commitment are related to and predicted by different

63
characteristics of employees and their work environment. Years at the current institution
was not related to affective commitment, but was to continuance commitment. The high
degree of normative commitment indicated by the faculty of the chiropractic colleges
may indicate that different professions experience commitment differently. This may be
of particular importance when considering service professions. In addition, the
organization may also influence how employees of that organization experience
commitment.
Schroder’s (2008) quantitative research focused on predicting organizational
commitment for faculty and administrators at the university level through job satisfaction
factors and religious commitment. It also sought to discover if faculty and administrators
had different predictors for organizational commitment. The job satisfaction factors
included were achievement; recognition; advancement; growth; responsibility; work
itself; organizational policies and administration; interpersonal relationships with
supervisors, peers, and students; working conditions; salary; supervision; status; and job
security.
A survey questionnaire was mailed to full-time and half-time employees of a
private Christian university (N = 835). The questionnaire contained the Professional
Satisfaction Scale (Blank, 1993, as cited in Schroder, 2008), the OCQ (Porter et al.,
1974), and the Intrinsic Religious Motivation Scale (Hoge, 1972, as cited in Schroder,
2008). Subject responses were measured on a 5-point Likert scale ranging from 1 =
highly dissatisfied to 5 = highly satisfied. The response rate was 67%.
Data were analyzed using descriptive statistics and stepwise regression analysis.
A model of six predictors explained 55.6% of the variance in organizational commitment

64
for the faculty. Organizational commitment was predicted by organizational policy and
administration, work itself, religious commitment, salary, working conditions, and
achievement. A model of five predictors explained 70.8% of the organizational
commitment for university administrators. The predictors were growth, religious
commitment, responsibility, job security, and relations with students.
Fuller et al. (2006) examined the interaction among organizational attachment,
perceived organizational support, and perceived external prestige of postsecondary
employees. Although the study used the term organizational attachment, the measure
employed was of the affective commitment component of organizational commitment.
They hypothesized that perceived organizational support and perceived external prestige
would be positively related to organizational attachment (i.e., affective commitment). To
investigate the effect of a cosmopolitan or local social-role orientation, they also included
it as a moderating variable.
Study participants in Fuller et al. (2006) were employees of a university in the
southern United States. Surveys were mailed to all employees. The response rate was
26% (n = 325). The survey included measures of affective commitment (Meyer & Allen,
1997), perceived organizational support, perceived external prestige, cosmopolitan/local
role orientation, as well as several demographic variables (i.e., gender, educational level,
and years with the current employer).
In Fuller et al. (2006), correlations showed significant, positive relationship
between affective commitment and perceived organizational support and perceived
external prestige. A significant, negative relationship was found between affective
commitment and withdrawal cognitions, perceived external prestige, employee status

65
(faculty, administrators, or staff), and years of service. Analyses of variance with post
hoc Scheffe tests to compare the means of the employee status groups on affective
commitment revealed that faculty had significantly lower commitment than staff and
administrators. The difference between the staff and administrators was not significant.
The results for perceived organizational support followed the same pattern. Withdrawal
cognition scores for faculty were significantly higher than the scores for staff. For
perceived external prestige, administrator means were significantly higher than the
faculty means. Other differences between employee groups were not significant.
The importance of organizational commitment has been demonstrated across
organizations, including postsecondary education institutions. Previous studies have
investigated the antecedents for affective commitment for staff (Boehman, 2007) as well
as correlates of affective, continuance, and normative commitment for staff (Buck &
Watson, 2002). Using a proxy measurement of organizational commitment, Bland et al.
(2006) offered some indication that commitment for faculty may be related to tenure
status. For faculty, Bedeian (2007) found a relationship between affective commitment
and job satisfaction and intended turnover. Marchiori and Henkin (2004) found different
predictor variables for each of the three components of organizational commitment for
faculty.
In research involving both faculty and staff, Schroder (2008) found different
predictors for organizational commitment by employee group. The only shared predictor
for both groups was religious commitment, which may due to the use of a religious-based
university for subjects. These results highlight the importance of recognizing differences
in faculty and administrators in terms of what predicts their organizational commitment

66
and suggest that different strategies for increasing organizational commitment based by
employee group may be more helpful than one overall strategy.
In another study including both faculty and staff, Fuller et al. (2006) demonstrated
that affective commitment was significantly higher for staff and administrators than for
faculty. Continuance and normative commitment, the other two components of
organizational commitment, were not included in the study. Based on the results for
affective commitment, these other components could yield differences for position as
well.

67
Chapter 3 Methodology
The current study investigated the relationship between organizational
commitment and position (i.e., faculty, staff, administration) in postsecondary
institutions. The literature has established the relationship between organizational
commitment and important employee behaviors and attitudes, such as turnover, intent to
turnover, job satisfaction, and absenteeism. Research has investigated the antecedents of
organizational commitment, but the investigation has been unsystematic and has
produced conflicting results. Additionally, little research concerning organizational
commitment has been conducted in postsecondary education institutions, particularly
with the three-component model of organizational commitment (Meyer & Allen, 1997).
The unique cultures and characteristics of these institutions set them apart from many
organizations and offer variables for study that do not typically exist in other
organizations.
In this chapter, the methodology for the current study is detailed. First, the
research questions and related hypotheses are stated. Next, the research design is
presented as well as information concerning the study participants and instrumentation.
Lastly, the data collection procedures and approach to data analysis are discussed.
Research Questions and Hypotheses
The current study sought to answer six questions regarding the organizational
commitment of employee of postsecondary education institutions. The research
questions are presented below, followed by the related hypothesis.
Research Question 1: Does the affective commitment of employees of postsecondary
institutions differ according to position?

68
Hypothesis 1: The affective commitment of employees of postsecondary institutions will
differ according to position.
Research Question 2: Does the continuous commitment of employees of postsecondary
institutions differ according to position?
Hypothesis 2: The continuous commitment of employees of postsecondary institutions
will differ according to position.
Research Question 3: Does the normative commitment of employees of postsecondary
institutions differ according to position?
Hypothesis 3: The normative commitment of employees of postsecondary institutions
will differ according to position.
Research Question 4: Is the affective commitment of employees of postsecondary
institutions related to personal or position characteristics?
Hypothesis 4: The affective commitment of employees of postsecondary institutions will
be related to personal and position characteristics.
Research Question 5: Is the continuance commitment of employees of postsecondary
institutions related to personal or position characteristics?
Hypothesis 5: The continuance commitment of employees of postsecondary institutions
will be related to personal and position characteristics.
Research Question 6: Is the normative commitment of employees of postsecondary
institutions related to personal or position characteristics?
Hypothesis 6: The normative commitment of employees of postsecondary institutions
will not be related to personal or position characteristics.

69
Type of Research
The research design for this study was a descriptive, non-experimental design
using survey data. The study is subject to the weaknesses found in non-experimental
research. Random assignment of research participants to a particular position was not
feasible; therefore, differences may exist among the employee groups that are not related
to their position. In addition, as participation was voluntary, employees who chose to
respond to the survey may not be representative of all employees at the postsecondary
institution. Furthermore, research subjects may feel compelled to respond in a positive
manner. Significant differences indicate that a relationship or association exists, but
causality cannot be inferred from the results.
The research participants for this study were the employees of a public university,
selected for its size and convenience. As organizational type has been shown to impact
organizational commitment (Giffords, 2003; Goulet & Frank, 2002), the results may not
be applicable to other types of postsecondary institutions, particularly for-profit ones.
Since the results are based on a single institution, the results may only be generalizable to
similar postsecondary institutions.
Research Context
Data for this study were collected over a 3-week period during the fall semester of
2011. Data were gathered from the employees of one postsecondary institution located in
the southern United States. The Carnegie Foundation Institution Profile for the university
described it as a large, public institution with graduate and undergraduate programs that
was primary residential (Carnegie Foundation for the Advancement of Teaching, 2010).

70
Research Participants
Research participants were employees of a large, public university in the southern
United States. The university selection was based on its large size and convenience.
Approval from the university’s Institutional Review Board (see Appendix A) was
obtained before any data collection was initiated.
All university employees with an institutional email address were invited to
participate in the study. The email invitation (see Appendix B) included a brief
description of the study, offered an incentive for participation (i.e., a chance to win one of
three gift cards valued at $50 each), and contained a hyperlink to the online survey
instrument. Offering a financial incentive to potential participants has been suggested as
a means to increase participation (Dillman, 2007). After the initial email, reminders were
by email after 7 days and after 14 days.
Instrumentation
The survey instrument (see Appendix C) was composed of three parts. The first
section requested information related to personal and position characteristics, including
position. Items in the first section were developed by the researcher to gather
information on the variables of interest. These included gender, age, the highest level of
education completed (i.e., less than high school, high school diploma or G.E.D.,
associate’s degree, bachelor’s degree, master’s degree, or doctoral degree), employment
status (i.e., full-time or part-time), position (i.e., faculty, staff, or administration), tenure
status (i.e., not applicable/staff position, non-tenure tack, tenured track, or tenure), pay
status (i.e., hourly or salaried), length of employment at the university in whole years
competed, retirement plan participation (i.e., Kentucky Employees Retirement System

71
[KERS] or Kentucky Employees Retirement System - Hazardous Duty[KERS-H],
Kentucky Teachers’ Retirement System [KTRS], Optional Retirement System [ORS], or
none), and campus location (i.e., main campus or regional campus).
The second section contained the Affective, Continuance, and Normative
Commitment Scales (Meyer & Allen, 1997) to assess the three components of
organizational commitment. Permission to use the instrument for the current study was
obtained from the authors prior to its use (see Appendix D). Participants responded to
each item on a 7-point scale, with 1 = strongly disagree, 2 = disagree, 3 = somewhat
disagree, 4 = neither agree nor disagree, 5 = somewhat agree, 6 = agree, and 7 =
strongly agree.
The third section of the survey instrument was composed of one, free-response
item. The item informed research participants that the purpose of the measure was to
assess organizational commitment and then asked participants to provide their thoughts
as to why they responded to the commitment items as they did. So that this free-response
item would not dissuade employees from responding, it was clearly marked as optional.
Participants were able to skip any item they wished to skip. The response area was a text
field with no maximum or minimum length.
Reliability.
To test the reliability of the Affective, Continuance, and Normative Commitment
Scales (Meyer & Allen, 1997) within the field of postsecondary education, reliability
analysis was performed. Reliability was demonstrated by the statistic Cronbach’s alpha.
The alpha for the 18 item Meyer and Allen scale for this study was .87. Cronbach’s

72
alpha was also computed for each of the three component scales, which were composed
of six items each. These were .87 for the ACS, .75 for the CCS, and .86 for the NCS.
Validity.
To investigate the validity of the Affective, Continuance, and Normative
Commitment Scales (Meyer & Allen, 1997) within the field of postsecondary education,
factor analysis was conducted. The dimensionality of the 18 items of the Affective,
Continuance, and Normative Commitment Scales (Meyer & Allen, 1997) was
investigated using a principal components confirmatory factor analysis. For this analysis,
a three-factor solution was rotated using Varimax rotation. The resultant three factors
accounted for 58% of the common variance.
The first factor accounted for 30% of the common variance and had an eigenvalue
of 5.34. According to the item factor loadings, the first factor was highly associated with
the six ASC items as well as three NCS items. In addition to the six ACS items, the three
specific NCS items associated with this factor were 1. “This organization deserves my
loyalty.” 2. “I owe a great deal to my organization.” and 3. “I do feel an obligation to
remain with my current employer.” This last NCS item was also highly associated with
the third factor.
The second factor had an eigenvalue of 2.72 and accounted for 15% of the
common variance. The second factor was highly associated with five of the six CCS
items. The only CCS item not included in this factor was “If I had not already put so
much of myself into this organization, I might consider working elsewhere.” This item
loaded on the third factor.

73
The third factor accounted for 13% of the common variance and had an
eigenvalue of 2.40. The third factor was composed of three remaining NCS items and the
one remaining CCS item. These four items were 1. “Even if it were to my advantage, I
do not feel it would be right to leave my organization now.” 2. “I would not leave my
organization right now because I have a sense of obligation to the people in it.” 3. “I
would feel guilty if I left my organization now.” 4. “If I had not already put so much of
myself into this organization, I might consider working elsewhere.” Two NCS items
from this third factor were also associated with the first factor.
Procedures Used to Collect Data
With approval from the institution, an email and two reminder emails were sent to
all university employees with university email addresses to invite them to participate in
the research. The email contained a brief description of the research, the offer of an
incentive to participate, and a hyperlink to the online survey instrument. Reminder
emails were sent to all employees 7 days after the initial email and 14 days after the
initial email. Due to restrictions established by the institution on sending email to
institution-established employee groups, the dissertation committee chair sent the
invitation and reminder emails on behalf of the researcher. Twenty-one days after the
initial email, the online survey instrument was deactivated.
The survey instrument was designed and distributed through an online survey
platform called SurveyMonkey. The instrument was created in SurveyMonkey by the
researcher and tested for accuracy and ease of use prior to the start of the study. The
instrument was activated the same day that the invitation email was sent to the subject

74
pool. After 21 days, the instrument was deactivated by the researcher and the data were
downloaded for analysis.
Data Analysis
After deactivation of the online survey instrument, the data were downloaded
from the online survey platform and imported into the statistical data analysis program
Statistical Package for the Social Sciences (SPSS). The data were reviewed for outliers.
One research participant indicated her years of age as 1949; this number was changed to
63. The plan for data analysis is summarized in Table 1. For all analysis, 95%
confidence intervals were utilized.
Table 1
Plan for Data Analysis
Research Question Analysis IV DV
1. Does the affective commitment of employees of postsecondary institutions differ according to position?
ANOVA Position Affective commitment
2. Does the continuous commitment of employees of postsecondary institutions differ according to position?
ANOVA Position Continuance commitment
3. Does the normative commitment of employees of postsecondary institutions differ according to position?
ANOVA Position Normative commitment

75
Research Question Analysis IV DV
4. Is the affective commitment of employees of postsecondary institutions related to personal or position characteristics?
Hierarchical regression
First block: employment status, faculty status, staff status, tenured, tenure track, non-tenure track, pay status, length of employment, KERS or KERS-H retirement, KTRS retirement, ORP retirement, and campus location Second block: gender, age, and education
Affective commitment
5. Is the continuance commitment of employees of postsecondary institutions related to personal or position characteristics?
Hierarchical regression
First block: employment status, faculty status, staff status, tenured, tenure track, non-tenure track, pay status, length of employment, KTRS retirement, KERS or KERS-H retirement, ORP retirement, and campus location Second block: gender, age, and education
Continuance commitment
6. Is the normative commitment of employees of postsecondary institutions related to personal or position characteristics?
Hierarchical regression
First block: employment status, faculty status, staff status, tenured, tenure track, non-tenure track, pay status, length of employment, KTRS retirement, KERS or KERS-H retirement, ORP retirement, and campus location Second block: gender, age, and education
Normative commitment
Note: For regression analysis, the position, tenure status, and retirement plan variables were dummy coded.
Description of variables.
The survey instrument for this research was designed to gather information from
research participants on the personal and position variables of interest, as well as on

76
affective, continuance, and normative commitment. Regarding the personal variables,
gender was categorical and provided nominal level data, with 1 = male and 2 = female.
Age was expressed in whole numbers, was numeric, and provided ratio level data.
Education, expressed as the highest level completed, was ordinal and provided nominal
level data. For education, 1 = less than high school, 2 = high school diploma or G.E.D.,
3 = associate’s degree, 4 = bachelor’s degree, 5 = master’s degree, and 6 = doctoral
degree.
For the position attributes, employment status was categorical and provided
nominal level data, with 1 = full-time and 2 = part-time. Position was categorical and
provided nominal level data. For position, 1= faculty, 2 = staff, and 3 = administration.
Tenure status was categorical and provided nominal level data, with 1 = not
applicable/staff position, 2 = non-tenure track, 3 = tenure track, and 4 = tenured. Pay
status was categorical, providing nominal level data, where 1 = hourly and 2 = salaried.
Length of employment was expressed as a whole number of years completed, was
numeric, and provided ratio level data for analysis. The retirement plan variable was
categorical and provided nominal level data. Retirement plan was coded as 1 = KERS or
KERS-H, 2 = KTRS, 3 = ORP, and 4 = none. Campus location was categorical and
provided nominal level data, with 1 = main campus and 2 = regional campus.
While most of the personal and position variables are self-explanatory, the
retirement plan variable may require additional information. All full-time employee and
certain part-time employees, as noted below, are required to participate in the KTRS,
KERS, KERS-H, or ORP plan. The KTRS plan is a defined benefit plan for full-time
positions requiring certification or a 4-year degree and for similarly situated part-time

77
employees whose positions equal 70% time or greater. The KERS and KERS-H plans
are also defined benefit plans, but for positions which do not require certification or a 4-
year degree. These plans are available to full-time employees and to those working an
average of 100 hours or more per month over a calendar or fiscal year. The ORP plan is
a defined contribution plan that is offered as an alternative to the KTRS.
For the Affective, Continuance, and Normative Commitment Scales (Meyer &
Allen, 1997), research participants responded to 18 statements, indicating their level of
agreement with the statement. Responses were made on a 7-point scale, with 1 =
strongly disagree, 2 = disagree, 3 = somewhat disagree, 4 = neither agree nor disagree, 5
= somewhat agree, 6 = agree, and 7 = strongly agree. These responses were numeric and
provided interval level data.
Four items on the Affective, Continuance, and Normative Commitment Scales
(Meyer & Allen, 1997) required reverse coding. Three of these were on the ACS and one
was on the NCS. For these items, a response of 1 = strongly disagree became 7 =
strongly agree and vice versa, a response of 2 = disagree became 6 = agree and vice
versa; and a response of 3 = somewhat disagree became 5 = somewhat agree and vice
versa. A response of 4 = neither agree nor disagree remained the same. All analyses
were conducted with the recoded item scores.
For analysis, it was necessary to create a component score for affective,
continuance, and normative commitment. The Affective, Continuance, and Normative
Commitment Scales (Meyer & Allen, 1997) contained 18 statements to which subjects
respond to on a 7-point scale. Of these items, six assessed affective commitment, six
assessed continuance commitment, and six assessed normative commitment. To create a

78
score for each of these three components, the applicable item scores were averaged.
These scale scores were numeric and provided interval level data for analysis.
ANOVA.
The first three research questions investigated the relationship between position
and each of the three organizational commitment components. These questions were
1. Does the affective commitment of employees of postsecondary institutions differ
according to position?
2. Does the continuous commitment of employees of postsecondary institutions
differ according to position?
3. Does the normative commitment of employees of postsecondary institutions differ
according to position?
For each of these questions, data were analyzed using one-way ANOVA. This analysis is
appropriate for research designs with one independent variable with two or more groups
and one dependent variable (Shavelson, 1996). This design is reflected in the first three
research questions. In each, the independent variable was position, which had three
levels (i.e., faculty, staff, or administration). For each question, the dependent variable
was a commitment component (i.e., affective commitment, continuance commitment, or
normative commitment, respectively).
The assumptions of ANOVA include independence, normality, and homogeneity
of variance (Shavelson, 1996). When the assumption of independence is met, the score
for any research subject is independent from the scores of all other participants.
Independence was logically assumed. Each participant selected his or her response to the
position item and multiple responses for this item were not possible. When the

79
assumption of normality is met, scores on the dependent variable are normally
distributed. To determine if this assumption was met, the frequency distributions of the
commitment component scores were inspected. When the assumption of homogeneity of
variance is met, the Levene test for homogeneity of variance is not significant. To
determine if the assumption was met, the Levene test of homogeneity of variance was
evaluated.
Multiple regression.
The last three research questions examined the relationship between the personal
and position variables and each of the three organizational commitment components.
These research questions were
4. Is the affective commitment of employees of postsecondary institutions related to
personal or position characteristics?
5. Is the continuance commitment of employees of postsecondary institutions related
to personal or position characteristics?
6. Is the normative commitment of employees of postsecondary institutions related
to personal or position characteristics?
For these investigations, data were analyzed using multiple regression. Multiple
regression is an appropriate analysis to explore the relationships between one dependent
variable and each of two or more independent variables (Shavelson, 1996). For the
fourth, fifth, and sixth research questions, the independent or predictor variables were the
personal and position attributes (see Table 1). For each question, the dependent or
outcome variable was a commitment component (i.e., affective commitment, continuance
commitment, or normative commitment, respectively).

80
Dummy coding.
For regression analysis, the independent or predictor variables were the personal
and position attributes. However, for this analysis, the three multiple category variables
of position, tenure status, and retirement plan had to be converted into dichotomous
variables, which are also known as dummy variables. The recoding of the position
variable resulted in two new dummy variables: one for faculty status and one for staff
status. The tenure status variable was re-coded into three new dummy variables: one for
tenured, one for tenure track, and one for non-tenure track. The retirement plan variable
was re-coded into three new dummy variables, one for KTRS retirement, one for KERS
or KERS-H retirement, and one for ORP retirement. For all of these new dummy
variables, a response of 0 = no and 1 = yes.
In addition to the dummy coding for position, tenure status, and retirement plan,
the previously existing dichotomous variables also had to be recoded. These variables
were gender, employment status, pay status, and campus location. The responses for
these variables were coded as a 1 or a 2. For example, for the gender variable, 1 = male
and 2 = female. For the regression analysis, the responses for these variables were re-
coded as a 0 or a 1. For example, gender was re-coded as 0 = male and 1 = female. This
pattern of recoding (i.e., 1 recoded as 0 and 2 recoded as 1) was used consistently with
this group of dichotomous variables.
Sample size.
With regression analysis, the number of research participants or the sample size is
an important consideration. An adequate number of participants must be obtained in
order to achieve a reliable equation and generalizable results. According to Tabachnick

81
and Fidell (2007), the sample size for regression analysis should be greater than the
number of independent variables times eight plus an additional 50, or N > 50 + 8 m,
where m is the number of independent or predictor variables. The evaluation of this
equation for the current study demonstrated that an adequate number of research
participants was obtained for the regression analysis.
Assumptions of regression.
The assumptions of regression include independence, normality,
homoscedasticity, and linearity (Shavelson, 1996). As with ANOVA, the assumption of
independence was logically concluded. Assumptions of normality, homoscedasticity, and
linearlity were checked by examining the scatterplot of the predicted and residual scores
(Shavelson, 1996) for affective commitment, continuance commitment, and normative
commitment. On the scatterplots, the predicted scores were on the abscissa and the
residual scores were on the ordinate. When the assumption of normality is met, data
points should be clustered at the center of the plot for each increment of the predictor
score with fewer points farther from the center (Shavelson, 1996). According to
Shavelson (1996), when the assumption of linearity is met, the data points should form a
horizontal scatter of residual scores. When the assumption of homoscedasticity is met,
the scatter of the data points about the center of the plot should be same for all predicted
scores (Shavelson, 1996). The scatterplots for each commitment component was
examined to determine if these conditions were met.
Multicollinearity.
Multicollinearity is the existence of a moderate to strong relationship between two
or more predictor variables in multiple regression analysis. When multicollinearity

82
exists, it can limit the size of the multiple correlation coefficient, mask the true
importance of a predictor, and increase the instability of the predictor equation (Stevens,
2007). To investigate the multicollinearity between the predictor variables in this study,
the intercorrelations among the predictor variables and the variance inflation factor (VIF)
for each predictor were examined. While correlations can be used to investigate
multicollinearity, they may not be an accurate indicator (Stevens, 2007). For this reason,
VIF scores were also used. A VIF of more than 10 indicates that multicollinearity may
exist among predictors (Stevens, 2007). VIF scores were evaluated against this
threshold.
Selection of regression model.
This study utilized hierarchical regression analysis. Predictors were entered into
the regression analysis in two blocks. The first data entry block contained the position
attributes and included employment status, faculty status, staff status, tenured, tenure
track, non-tenure track, pay status, length of employment, KERS or KERS-H retirement,
KTRS retirement, ORP retirement, and campus location. The second data entry block
contained the personal attributes and included gender, age, and education. Under this
model, the significance of each block could be examined as well as the incremental
prediction power of the subsequent block. The personal variables were entered in the
second block as previous research has shown that these type of variables overall tended to
have a weak relationship with organizational commitment (Mathieu & Zajac, 1990;
Meyer & Allen, 1997).
In this chapter, the methodology for this study was presented in detail. The six
research questions and the related six hypotheses were stated. The research design was

83
detailed, as was information regarding the research participants and the survey
instrument. The data collection procedures and data analysis plan were explained. In the
next chapter, the results of the data analysis for the research questions are presented. The
results of these analyses are discussed in the final chapter.

84
Chapter 4 Results
The purpose of this study was to investigate the relationship between
organizational commitment and position within the field of postsecondary education.
Two previous studies (Fuller et al., 2006; Schroder, 2008) explored organizational
commitment in a postsecondary setting. However, neither study examined the
relationship between position as faculty, staff, or administration and the three
components of organizational commitment (i.e., affective, continuance, and normative
commitment) in a postsecondary setting. The current study added to the body of
knowledge on organizational commitment and position in the field of postsecondary
education.
The previous three chapters introduced the concept of organizational
commitment, reviewed the literature concerning organizational commitment, and outlined
the methodology utilized in the current study. In this chapter, the analysis of the research
data is presented from a statistical perspective. Descriptive statistics are presented first,
followed by the results as they relate to the research questions. This study investigated
six questions.
1. Does the affective commitment of employees of postsecondary institutions differ
according to position?
2. Does the continuous commitment of employees of postsecondary institutions
differ according to position?
3. Does the normative commitment of employees of postsecondary institutions differ
according to position?

85
4. Is the affective commitment of employees of postsecondary institutions related to
personal or position characteristics?
5. Is the continuance commitment of employees of postsecondary institutions related
to personal or position characteristics?
6. Is the normative commitment of employees of postsecondary institutions related
to personal or position characteristics?
The results of the statistical analyses related to each question are presented in the order of
the research questions. The results are discussed in the next chapter.
Descriptive Statistics
At the time of data collection, the participating institution employed 2,914 people
(P. Booth, personal communication, December 13, 2011). Of these, 681 research
subjects responded to the survey, for a response rate of 23%. Missing data accounted for
less than 4% of participant responses.
The descriptive statistics for the personal variables are presented in Table 2 for
the research participants responding. The majority of the research participants were
female (n = 438 or 64%). Participants ranged in age from 20 to 79 years old, with an
average age of about 46 years (M = 45.54, SD = 12.80). For the survey item regarding
the highest level of education completed, no participants chose the response for less than
high school or G.E.D.; therefore, it does not appear in the results section. Most
participants reported holding some type of college degree, with 4% indicating an
associate’s degree, 22% a bachelor’s degree, 38% a master’s degree, and 31% a doctoral
degree.

86
Table 2
Descriptive Statistics for Personal Variables
Variable Response N (%)
Gender Male 241 (35) Female 438 (65)
Age (years)a 20 - 29 97 (15) 30 - 39 124 (19) 40 - 49 165 (25) 50 - 59 175 (26) 60 - 69 87 (13) 70 - 79 13 (2)
Education High school diploma or GED 31 (5) Associate’s degree 29 (4) Bachelor’s degree 150 (22) Master’s degree 259 (38) Doctoral degree 210 (31)
a For presentation purposes, age was categorized.
For the position variables, Table 3 contains the descriptive statistics for the
research participants responding. Most research participants were full-time employees (n
= 563 or 83%) and reported working at the main campus (n = 602 or 89%). The majority
held salaried positions (n = 571 or 85%). Half of the participants identified themselves as
holding staff positions (n = 341 or 50%), while slightly less than half identified
themselves as faculty (n = 300 or 44%). A slight majority of research participants
indicated that tenure status did not apply to their position (n = 351 or 53%), while 21% (n
= 139) indicated they were tenured and 9% indicated they were on a tenure track (n =
63). The average length of employment at the institution was 10 years (M = 9.60, SD =
9.42), with a range of less than 1 year to 46 years. The distribution for length of
employment was positively skewed, with many participants reporting lower years of
employment and a few participants reporting higher years of employment. Responses for
retirement plan participation indicated that almost half of the subjects (n = 314 or 47%)

87
participated in the KTRS, followed by the ORP retirement plan at 24% (n = 165), and the
KERS or KERS-H plan at 18% (n = 120) of responses. Eleven percent of participants
indicated that they did not participate in any of these retirement plans.
Table 3
Descriptive Statistics for Position Variables
Variable Response N (%)
Employment status Full-time 563 (83) Part-time 114 (17)
Position Faculty 300 (44) Staff 341 (50) Administration 37 (6)
Tenure status Not applicable/Staff 351 (53) Non-tenure track 116 (17) Tenure-track 63 (9) Tenured 139 (21)
Pay status Hourly 102 (15) Salaried 571 (85)
Length of employment 0 - 4 256 (38) (years)a 5 - 9 172 (25) 10 - 14 101 (15) 15 - 19 34 (5) 20 - 24 50 (7) 25 - 46 64 (10)
Retirement plan KERS or KERS-H 120 (18) KTRS 314 (47) ORP 165 (24) None 77 (11)
Location Main campus 602 (89) Regional campus 73 (11)
a For presentation purposes, length of employment was categorized.
The item responses for the Affective, Continuance, and Normative Commitment
Scales (Meyer & Allen, 1997) were examined. The full range of responses, from 1 =
strongly disagree to 7 = strongly agree, were used for all items. Table 4 provides the
means and standard deviations for each of the scale items. The item with the lowest
mean score for research participants (M = 3.26, SD = 1.51, n = 646) was the continuance

88
Table 4
Means and Standard Deviations for Commitment Items
Scale Item M SD N
Affective commitment scale I would be very happy to spend the rest of my career
in this organization 5.22 1.63 655
I really feel as if this organization's problems are my own.
3.56 1.73 643
I do not feel like "part of the family" at my organization.
4.69 1.83 655
I do not feel "emotionally attached" to this organization.
4.83 1.76 654
This organization has a great deal of personal meaning for me.
4.78 1.71 644
I do not feel a strong sense of belonging to my organization.
4.69 1.74 645
Continuous commitment scale It would be very hard for me to leave my organization
right now, even if I wanted to. 4.29 1.85 654
Too much of my life would be disrupted if I decided I wanted to leave my organization right now.
4.63 1.90 655
Right now, staying with my organization is a matter of necessity as much as desire.
4.55 1.78 654
I believe that I have too few options to consider leaving this organization.
3.58 1.79 644
One of the few negative consequences of leaving this organization would be the scarcity of available alternatives.
4.53 1.91 655
If I had not already put so much of myself into this organization, I might consider working elsewhere.
3.26 1.51 646
Normative commitment scale I do not feel any obligation to remain with my current
employer. 4.21 1.73 641
Even if it were to my advantage, I do not feel it would be right to leave my organization now.
3.45 1.81 655
I would feel guilty if I left my organization now. 3.75 1.85 649 This organization deserves my loyalty. 4.88 1.66 656 I would not leave my organization right now because
I have a sense of obligation to the people in it. 4.19 1.75 644
I owe a great deal to my organization. 4.32 1.68 640

89
commitment item “If I had not already put so much of myself into this organization, I
might consider working elsewhere.” The item with the highest mean score for all
participants (M = 5.22, SD = 1.63, n = 655) was the affective commitment item, “I would
be very happy to spend the rest of my career in this organization.”
Affective, continuance, and normative commitment were each assessed by six
items. To create a commitment component score, the means of the responses for the six
items of each scale were computed. The component scores for affective, continuance,
and normative commitment ranged from 1.00 to 7.00, with lower scores indicating a
lower degree of the specific commitment and higher scores indicating a higher degree of
the specific commitment. For research participants, the mean score for affective
commitment was 4.63 (n = 656, SD = 1.34), for continuance commitment was 4.15 (n =
656, SD = 1.21), and for normative commitment was 4.13 (n = 656, SD = 1.33).
The correlations between the component scores were computed. Affective and
normative commitment were significantly correlated, r(654) = .72, p < .001. There was
also a significant correlation between continuous and normative commitment, although it
was not as strong, r(654) = .22, p < .001. The correlation between affective and
continuance commitment was not significant, r(654) = .06, p = .133.
Analysis for Research Question 1
For the first research question, the effect of position on the affective commitment
of employees of postsecondary institutions was investigated. ANOVA was used to
evaluation this relationship. In this analysis, the independent variable was position,
categorized as faculty, staff, or administration. The dependent variable was affective
commitment.

90
Analysis was conducted to determine if the assumption of normality and
homogeneity of variance were met. To determine if the assumption of normality was
met, the frequency distribution of affective commitment scores was examined (see Figure
1 in Appendix E). The distribution revealed that the affective commitment scores were
not normally distributed. However, ANOVA is robust to violations of normality when
the independent variable has a fixed number of levels (Shavelson, 1996). As the
independent variable, position, in this analysis had three levels, ANOVA was robust to
this violation. The Levene test of homogeneity of variance was utilized to determine if
the assumption of homogeneity of variance was met. For this analysis with affective
commitment, the Levene test was significant, indicating that this assumption was
violated. Therefore, post hoc testing was conducting using a method appropriate for
when this assumption is violated.
A one-way ANOVA was performed to determine the effect of position on
affective commitment. The results of ANOVA, displayed in Table 5, indicated a
statistically significant difference in affective commitment scores based on position, F(2,
651) = 10.86, p < .001). Position explained 3% (η2 = .03) of the variance in affective
commitment.
Table 5
ANOVA Results for Affective Commitment
Source SS df MS F p
Between Groups 37.81 2 18.91 10.86 .000 Within Groups 1133.54 651 1.74 Total 1171.35 653
Based on the significant results of ANOVA, post hoc comparisons were
conducted to determine where the differences in affective commitment were. As the

91
Levene test for homogeneity of variance was significant (p = .035), post hoc testing was
conducted with Dunnett’s test. The results showed a significant difference between staff
(M = 4.84, SD = 1.25) and faculty (M = 4.37, SD = 1.39) on affective commitment (see
Table 6). Differences in affective commitment between the administration group (M =
4.91, SD = 1.36) and the other two groups were not significant.
Table 6
Dunnett Post Hoc Comparisons for Affective Commitment
Position Position Mean
Difference SE p
Staff Faculty .48 .11 .000
Administration Faculty .54 .24 .084
Administration Staff .07 .24 .988
Analysis for Research Question 2
The second research question investigated if the continuous commitment of
employees of postsecondary institutions differed according to position. ANOVA was
used for this analysis. The independent variable in the ANOVA was position as faculty,
staff, or administration. The dependent variable was continuance commitment.
Before considering the results of the ANOVA, testing was performed to
determine if the assumptions of normality and homogeneity of variance were met. The
frequency distribution of continuance commitment scores was examined (see Figure 1 in
Appendix F) to determine if the assumption of normality was met. While the distribution
revealed that the scores were not normally distributed, ANOVA is robust to violations of
normality when the independent variable has a fixed number of levels (Shavelson, 1996).
As the independent variable for this analysis met this condition, ANOVA was robust to
this violation. To determine if the assumption of homogeneity of variance was met, the

92
Levene test for homogeneity of variance was utilized. For continuance commitment, the
Levene statistic was not significant, demonstrating the assumption was met.
A one-way ANOVA was performed to determine the effect of position on
continuance commitment. As shown in Table 7, the results yielded a statistically
significant difference in continuance commitment scores based on position, F(2, 651) =
21.54, p < .001). Position explained 6% (η2 = .06) of the variance in continuance
commitment.
Table 7
ANOVA Results for Continuance Commitment
Source SS df MS F p
Between Groups 58.88 2 29.44 21.54 .000 Within Groups 889.96 651 1.37 Total 948.84 653
To determine where the differences in continuance commitment were, post hoc
comparisons were conducted. Tukey’s Honestly Significant Difference (HSD) post hoc
analysis revealed significant differences between staff (M = 4.45, SD = 1.13) and faculty
(M = 3.85, SD = 1.19) and between staff and administration (M = 3.88, SD = 1.38) for
continuance commitment (see Table 8). No difference was found between the faculty
and administration groups.
Table 8
Tukey Post Hoc Comparisons for Continuance Commitment
Position Position Mean
Difference SE p
Staff Faculty .60 .09 .000
Staff Administration .57 .21 .015
Administration Faculty .03 .21 .986

93
Analysis for Research Question 3
For the third research question, the effect of position on the normative
commitment of employees of postsecondary institutions was examined. ANOVA was
used in this analysis. As in the previous two research questions, the independent variable
was position, which for the purposes of this study was employment as faculty, staff, or
administration. The dependent variable was normative commitment as measured by the
Affective, Continuance, and Normative Commitment Scales (Meyer & Allen, 1997).
The assumptions of normality and homogeneity of variance were assessed for
possible violations. To determine if the assumption of normality was met, the frequency
distribution of normative scores was examined (see Figure 1 in Appendix G). This
revealed that the normative commitment scores were not normally distributed. However,
ANOVA is robust to violations of normality when the independent variable has a fixed
number of levels (Shavelson, 1996), as it does in this study. Therefore, ANOVA was
robust to this violation in this analysis. To determine if the assumption of homogeneity
of variance was met, the Levene test for homogeneity of variance was utilized. The
Levene statistic was not significant, so the assumption of homogeneity of variance was
not violated.
A one-way ANOVA was conducted to explore the effect of position on normative
commitment. The results of the ANOVA, displayed in Table 9, demonstrated a
statistically significant difference in normative commitment scores based on position,
F(2, 651) = 11.21, p < .001. Position explained 3% (η2 = .03) of the variance in
normative commitment.

94
Table 9
ANOVA Results for Normative Commitment
Source SS df MS F p
Between Groups 38.01 2 19.01 11.21 .000 Within Groups 1104.32 651 1.70 Total 1142.33 653
Post hoc comparisons were performed utilizing Tukey’s HSD Test. The results,
presented in Table 10, showed a significant difference in normative commitment between
staff (M = 4.37, SD = 1.25) and faculty (M = 3.88, SD = 1.33). No differences in
normative commitment were found between the administration (M = 4.11, SD = 1.51)
and the other two groups.
Table 10
Tukey Post Hoc Comparisons for Normative Commitment
Position Position Mean
Difference SE p
Staff Faculty .50 .10 .000
Staff Administration .27 .23 .470
Administration Faculty .23 .23 .582
Analysis for Research Question 4
In the fourth research question, the relationship between the affective
commitment of employees of postsecondary institutions and personal or position
attributes was explored. A hierarchical regression analysis using the enter method was
conducted to evaluate this relationship. For this analysis, the dependent or outcome
variable was affective commitment. The independent or predictor variables were gender,
age, education, employment status, faculty status, staff status, tenured, tenure track, non-
tenure track, pay status, length of employment, KERS or KERS-H retirement, KTRS

95
retirement, ORP retirement, and campus location. These independent variables were
entered into the equation in two blocks. The first data entry contained the position
attributes and included employment status, faculty status, staff status, tenured, tenure
track, non-tenure track, pay status, length of employment, KERS or KERS-H retirement,
KTRS retirement, ORP retirement, and campus location. The second date entry
contained the personal attributes and included gender, age, and education.
To determine if the assumptions of normality, homoscedasticity, and linearity
were met in this analysis, the scatterplot of the predicted scores and residual scores for
affective commitment was examined. To demonstrate normality, the data points should
be clustered at the center of the plot for each increment of the predictor score with fewer
points farther from the center (Shavelson, 1996). To demonstrate linearity, the data
points should form a horizontal scatter of residual scores (Shavelson, 1996). To
demonstrate homoscedasticity, the scatter of the data points about the center of the plot
should be same for all predicted scores (Shavelson, 1996). The scatterplot for affective
commitment (see Figure 1 in Appendix H) demonstrated graphically that these criteria
were met; therefore, the assumptions of regression analysis were not violated in this
analysis.
To investigate the relationship among the personal and position variables, inter-
correlations among predictor variables were examined. The predictors included in the
correlation matrix were age, education, and length of employment. The correlation
between education and age was significant, r(606) = .20, as was the correlation between
education and length of employment, r(606) = .11. While significant, these correlations

96
were not strong. The correlation between age and length of employment was significant
and strong, r(606) = .60.
Multicollinearity between the predictors was diagnosed by examining the VIF
statistics for the predictor variables. For the model with the position predictors, VIF
statistics ranged from 1.15 for campus location to 6.43 for faculty status. For the model
including the position and personal predictors, VIF statistics ranged from 1.11 for gender
to 6.46 for faculty status. All VIF statistics were less than 10; therefore, multicollinearity
was not indicated in the analysis.
The block of position variables was significantly related to affective commitment,
F (12, 593) = 3.56, p < .001, as shown for the first model in Table 11. The position
variables were significantly related to affective commitment. In the second model, the
personal variables were added to the analysis. The results for the second model were also
significant, F (15, 590) = 2.94, p < .001, although the addition of the personal variables
did not contribute significantly to the model.
Table 11
ANOVA Results for the Regression Model of Affective Commitment
Model SS df MS F p ∆F Sig. ∆F
1a Regression 73.17 12 6.10 3.56 .000a 3.56 .000 Residual 1016.41 593 1.71 Total 1089.58 605
2b Regression 75.85 15 5.06 2.94 .000b .52 .668 Residual 1013.72 590 1.72 Total 1089.58 605 a Predictors: campus location, KERS or KERS-H retirement, length of employment,
tenure track, employment status, non-tenure track, ORP retirement, pay status, tenured, staff status, KTRS retirement, and faculty status
b Predictors: campus location, KERS or KERS-H retirement, length of employment, tenure track, employment status, non-tenure track, ORP retirement, pay status, tenured, staff status, KTRS retirement, faculty status, gender, age, and education

97
The multiple correlation coefficient for the first block of predictors was .26,
indicating that approximately 7% (R2 = .07) of the variance in affective commitment was
accounted for by the linear combination of the position variables. The addition of the
second block of predictors, the personal variables, did not significantly increase the
amount of variance accounted for in affective commitment.
The results of the predictors’ effect on affective commitment are summarized in
Table 12. The significant predictors of affective commitment in Model 1 were length of
employment (t = 2.37), KTRS retirement (t = 2.03), and campus location (t = 2.00).
These results indicate that these three predictors were positively related to affective
commitment. Under this model, KTRS retirement (β = .19) made the strongest
contribution to explaining the affective commitment score, followed by length of
employment (β = .12) and campus location (β = .09), respectively.
Table 12
Hierarchical Multiple Regression Coefficients for Affective Commitment
Unstandardized
Coefficients
Standardized Coefficients
Regression Model Predictor B SE β t p
1 Employment status
.09 .21 .02 .42 .676
Faculty status -.25 .27 -.09 -.93 .354 Staff status -.10 .26 -.04 -.38 .707 Tenured -.50 .26 -.15 -1.90 .057 Tenure track -.23 .30 -.05 -.78 .438 Non-tenure track -.43 .24 -.12 -1.80 .073 Pay status .04 .19 .01 .23 .816 Length of
employment .02 .01 .12 2.37* .018
KERS or KERS-H retirement
.41 .28 .12 1.49 .136
KTRS retirement .52 .26 .19 2.03* .043 ORP retirement .30 .27 .10 1.12 .264

98
Unstandardized
Coefficients
Standardized Coefficients
Regression Model Predictor B SE β t p
Campus location .37 .18 .09 2.00* .046
2 Employment status
.09 .22 .02 .40 .692
Faculty status -.23 .27 -.09 -.86 .390 Staff status -.11 .27 -.04 -.40 .688 Tenured -.47 .28 -.14 -1.72 .087 Tenure track -.22 .31 -.05 -.72 .475 Non-tenure track -.43 .24 -.12 -1.78 .076 Pay status .07 .19 .02 .38 .706 Length of
employment .01 .01 .09 1.67 .096
KERS or KERS-H retirement
.33 .28 .09 1.16 .246
KTRS retirement .50 .26 .19 1.91 .056 ORP retirement .29 .27 .09 1.08 .279 Campus location .33 .19 .08 1.78 .076 Gender .05 .12 .02 .44 .661 Age .01 .01 .05 .87 .383 Education -.06 .08 -.05 -.77 .444 * p < .05 Analysis for Research Question 5
The fifth research question investigated if the continuance commitment of
employees of postsecondary institutions was related to personal or position attributes.
Hierarchical regression analysis was utilized to evaluate this relationship. For this
analysis, the outcome variable was continuance commitment. The predictor variables
were entered into the regression in two blocks. The first data entry was composed of the
position attributes and included employment status, faculty status, staff status, tenured,
tenure track, non-tenure track, pay status, length of employment, KTRS retirement,
KERS or KERS-H retirement, ORP retirement, and campus location. The second data
entry was composed of the personal attributes and included gender, age, and education.

99
To determine if the assumptions of normality, homoscedasticity, and linearlity
were met in this analysis, the scatterplot of the predicted scores and residual scores for
continuance commitment was examined (see Figure 1 in Appendix I). The scatterplot
revealed the data points were clustered at the center of the plot for each increment of the
predictor score with fewer points farther from the center, demonstrating normality
(Shavelson, 1996). It also showed the data points formed a horizontal scatter of residual
scores, demonstrating linearity (Shavelson, 1996). Finally, the scatter of data points
about the center of the plot was about the same for all predicted scores, demonstrating
homoscedasticity (Shavelson, 1996). Therefore, the assumptions of regression analysis
were not violated in this analysis.
Inter-correlations among predictor variables were examined to investigate the
relationship among the personal and position variables. Age, education, and length of
employment were included in the correlation matrix. The correlations between education
and age, r(606) = .20, and between education and length of employment, r(606) = .11,
were significant, but not strong. The correlation between age and length of employment
was significant and strong, r(606) = .60.
VIF statistics for the predictor variables were examined to examine if
multicollinearity existed among the predictor variables. The regression analysis included
two models based on the two blocks of predictors, and both models were examined. For
the first model based on the block of position predictors, VIF statistics ranged from 1.15
for campus location to 6.43 for faculty status. For the second model based on the block
of position and personal predictors, VIF statistics ranged from 1.11 for gender to 6.46 for

100
faculty status. As all VIF statistics were less than 10, multicollinearity was not indicated
in the analysis.
For continuance commitment, the results of the multiple regression analysis
yielded significant results for the block of position variables, F (12, 593) = 8.52, p < .001,
as shown for the first model in Table 13. The position variables were significantly
related to continuance commitment. The personal variables were added to the analysis in
the second model. The results for the second model were also significant, F (15, 590) =
7.64, p < .001, demonstrating that the position and personal variables were significantly
related to continuance commitment.
Table 13
ANOVA Results for the Regression Model for Continuance Commitment
Model SS df MS F p ∆F Sig. ∆F
1a Regression 125.59 12 10.47 8.52 .000 8.52 .000 Residual 728.47 593 1.23 Total 854.06 605
2b Regression 138.87 15 9.26 7.64 .000 3.65 .012 Residual 715.19 590 1.21 Total 854.06 605 a Predictors: campus location, KERS or KERS-H retirement, length of employment,
tenure track, employment status, non-tenure track, ORP retirement, pay status, tenured, staff status, KTRS retirement, and faculty status
b Predictors: campus location, KERS or KERS-H retirement, length of employment, tenure track, employment status, non-tenure track, ORP retirement, pay status, tenured, staff status, KTRS retirement, faculty status, gender, age, and education
The multiple correlation coefficient for the first model with the position variables
was .38, meaning that approximately 15% (R2 = .15) of the variance in continuance
commitment was accounted for by the linear combination of the position variables. The
addition of the personal predictors in the second model significantly increased the
multiple correlation coefficient, to .40. The combination of the position and personal

101
variables increased the amount of variance in continuance commitment accounted for to
16% (R2 = .16).
The effect of the predictors on continuance commitment is summarized in Table
14. Employment status (t = -5.45) and education (t = -3.16) were significant predictors of
continuance commitment in the second model. Both of the predictors were negatively
related to continuance commitment. Under this model, employment status (β = -.30)
made the strongest contribution to explaining continuance commitment, followed by
education (β = -.18).
Table 14
Hierarchical Multiple Regression Coefficients for Continuance Commitment
Unstandardized
Coefficients
Standardized Coefficients
Regression Model Predictor B SE β t p
1 Employment status -1.04 .18 -.32 -5.80*** .000 Faculty status .22 .23 .09 .95 .345 Staff status .35 .22 .15 1.59 .113 Tenured -.48 .22 -.16 -2.18* .030 Tenure track -.50 .26 -.12 -1.95 .052 Non-tenure track -.13 .20 -.04 -.66 .508 Pay status -.00 .16 -.00 -.02 .981 Length of
employment .01 .01 .09 1.85 .065
KERS or KERS-H retirement
-.08 .23 -.03 -.35 .728
KTRS retirement -.25 .22 -.11 -1.16 .246 ORP retirement -.48 .23 -.18 -2.15* .032 Campus location -.03 .16 -.01 -.22 .829
2 Employment status -1.00 .18 -.30 -5.45*** .000 Faculty status .22 .23 .09 .94 .348 Staff status .24 .22 .10 1.08 .279 Tenured -.27 .23 -.09 -1.18 .239 Tenure track -.33 .26 -.08 -1.28 .203 Non-tenure track -.07 .20 -.02 -.32 .751 Pay status .05 .16 .02 .34 .732

102
Unstandardized
Coefficients
Standardized Coefficients
Regression Model Predictor B SE β t p
Length of employment
.01 .01 .09 1.76 .080
KERS or KERS-H retirement
-.19 .24 -.06 -.79 .428
KTRS retirement -.21 .22 -.09 -.96 .337 ORP retirement -.42 .23 -.15 -1.85 .065 Campus location -.07 .16 -.02 -.44 .661 Gender .06 .10 .03 .65 .513 Age -.00 .01 -.02 -.32 .748 Education -.22 .07 -.18 -3.16** .002 * p < .05. ** p < .01. *** p < .001 Analysis for Research Question 6
For the sixth research question, the relationship between the normative
commitment of employees of postsecondary institutions and personal or position
attributes was explored. Hierarchical regression analysis was conducted to evaluate this
relationship. For this analysis, normative commitment was the outcome variable. The
predictor variables were entered into the regression in two blocks. The predictor
variables for the first data entry were employment status, faculty status, staff status,
tenured, tenure track, non-tenure track, pay status, length of employment, KERS or
KERS-H retirement, KTRS retirement, ORP retirement, and campus location. These
were the position variables. The predictors for the second data entry were gender, age,
and education. These were the personal variables.
To determine if the assumptions of normality, homoscedasticity, and linearity
were met in this analysis, the scatterplot of the predicted scores and residual scores for
normative commitment was examined (see Figure 1 in Appendix J). The assumption of
normality was met as the data points were clustered at the center of the plot for each

103
increment of the predictor score with fewer points farther from the center (Shavelson,
1996). The assumption of linearity was met as the data points formed a horizontal scatter
of residual scores (Shavelson, 1996). The assumption of homoscedasticity was met, as
the scatter of data points about the center of the plot was the same for all predicted scores
(Shavelson, 1996). Therefore, the assumptions of normality, homoscedasticity, and
linearity were not violated in this analysis.
Inter-correlations among predictor variables were examined to investigate the
relationship among the personal and position variables. The predictors included in the
correlation matrix were age, education, and length of employment. Significant
correlations were found between education and age, r(606) = .20; education and length of
employment, r(606) = .11; and age and length of employment, r(606) = .60. While these
were significant, the only strong correlation was between age and length of employment.
Multicollinearity between the predictors was diagnosed by examining the VIF
statistics for the predictor variables. For the model including the block of position
predictors, VIF statistics ranged from 1.15 for campus location to 6.43 for faculty status.
For the model including position and personal predictors, VIF statistics ranged from 1.11
for gender to 6.46 for faculty status. Multicollinearity was not indicated in the analysis as
all VIF statistics were less than 10.
The results of the hierarchical regression analysis for normative commitment
yielded significant results for the block of position variables, F (12, 593) = 2.85, p < .01,
demonstrating a significant relationship between the position variables and normative
commitment (see Model 1 in Table 15). In second model, the personal variables were

104
added to the analysis. The results for the combination of position and personal variables
were also significant, F (15, 590) = 2.77, p < .001.
Table 15
ANOVA Results for the Regression Model for Normative Commitment
Model SS df MS F p ∆F Sig. ∆F
1a Regression 58.88 12 4.91 2.85 .001 2.85 .001 Residual 1022.82 593 1.73 Total 1081.70 605
2b Regression 71.05 15 4.74 2.77 .000 2.37 .070 Residual 1010.65 590 1.71 Total 1081.70 605 a Predictors: campus location, KERS or KERS-H retirement, length of employment,
tenure track, employment status, non-tenure track, ORP retirement, pay status, tenured, staff status, KTRS retirement, and faculty status
b Predictors: campus location, KERS or KERS-H retirement, length of employment, tenure track, employment status, non-tenure track, ORP retirement, pay status, tenured, staff status, KTRS retirement, faculty status, gender, age, and education
For the first model with the position variables, the multiple correlation coefficient
was .23, indicating that approximately 5% (R2 = .05) of the variance in normative
commitment was accounted for by the linear combination of the position variables.
While the addition of the second block of predictors increased the multiple correlation
coefficient, the increase was not significant. Therefore, the additional of the personal
variables to the model did not add significantly to the variance accounted for in
normative commitment.
A summary of the effect of the predictors on normative commitment is presented
in Table 16. Significant predictors of normative commitment were tenured (t = -2.65)
and non-tenure track (t = -2.21). Both were negatively related to the outcome variable.
Under this model, tenured (β = -.21) made the strongest contribution to explaining
normative commitment, followed by non-tenure track (β = -.18).

105
Table 16
Hierarchical Multiple Regression Coefficients for Normative Commitment
Unstandardized
Coefficients
Standardized Coefficients
Regression Model Predictor B SE Β t p
1 Employment status .13 .21 .04 .61 .543 Faculty status .11 .27 .04 .41 .682 Staff status .09 .26 .03 .33 .745 Tenured -.40 .26 -.21 -2.65** .008 Tenure track -.58 .30 -.18 -1.93 .055 Non-tenure track -.53 .24 -.15 -2.21* .027 Pay status .08 .19 .02 .43 .665 Length of
employment .00 .01 -.01 -.14 .893
KERS or KERS-H retirement
.33 .28 .09 1.20 .233
KTRS retirement .38 .26 .14 1.49 .136 ORP retirement .19 .27 .06 .72 .474 Campus location .28 .18 .07 1.54 .125
2 Employment status .17 .22 .05 .79 .429 Faculty status .13 .27 .05 .47 .639 Staff status .01 .27 .00 .02 .984 Tenured -.55 .27 -.17 -2.01* .045 Tenure track -.49 .31 -.11 -1.57 .116 Non-tenure track -.50 .24 -.14 -2.06* .040 Pay status .14 .19 .04 .75 .456 Length of
employment -.00 .01 -.02 -.41 .685
KERS or KERS-H retirement
.20 .28 .06 .40 .485
KTRS retirement .39 .26 .15 1.51 .131 ORP retirement .23 .27 .08 .87 .386 Campus location .23 .19 .05 1.21 .226 Gender .15 .12 .05 1.25 .212 Age .00 .01 .03 .62 .539 Education -.18 .08 -.13 -2.19* .029 * p < .05. ** p < .01.
In summary, this study investigated the impact of position as well as other
personal and position variables on affective, continuance, and normative commitment in
the field of higher education. The data analysis for position produced significant results

106
for each of the three components of commitment. Subsequent analysis showed
significant difference between the staff and faculty groups for affective, continuance, and
normative commitment. A significant difference was also found between the staff and
administration groups for continuance commitment. Hierarchical regression analysis for
the personal and position variables yielded significant results for each of the commitment
components. Length of employment, KTRS retirement plan, and campus location were
significant predictors of affective commitment. Employment status and education were
significant predictors of continuance commitment. Tenured and non-tenure track were
significant predictors of normative commitment. In the next chapter, the implications of
these results are discussed.

107
Chapter 5 Discussion
This research sought to explore the relationship of organizational commitment to
employee position and to personal and position characteristics in the field of
postsecondary education. Instead of a one-dimension measure of organizational
commitment, this study utilized the three-component measure of commitment composed
of affective, continuance, and normative commitment (Meyer & Allen, 1991, 1997). The
first chapter introduced the concept of organizational commitment and briefly discussed
its relationship to several important workplace outcomes, including turnover. It also
included a description of the purpose of the study and stated the research questions.
Chapter 2 reviewed the literature on organizational commitment, from its origin in
motivation theory through the development of the concept as an important employee
attribute in its own standing. This review also included research on the relationship of
organizational commitment with job satisfaction and employee outcomes, including
employee turnover, intent to turnover, absenteeism, and tardiness. Previous research
concerning the formation and antecedents of commitment was reviewed, with a separate
section covering the study of organizational commitment in higher education. The third
chapter provided the research plan for the current study, including a description of the
survey instrument, the data collection procedures, and the plan for data analysis. The
most recent chapter described the results in terms of statistical testing and significant
findings. This final chapter presents an interpretation of the findings and offers
suggestions for future research.

108
Discussion of Research Question 1
The first research question investigated the relationship between position as
faculty, staff, or administration and affective commitment within the field of
postsecondary education. It was hypothesized that the affective commitment of
employees of postsecondary institutions would differ according to the type of position
they held. The results of data analysis provided support for this hypothesis, as affective
commitment differed according to position. Specifically, the affective commitment of
staff was significantly higher than the affective commitment of faculty. The difference
between faculty and administration also approached significance (p = .08), with the
administration reporting higher affective commitment than the faculty.
The meaning of this difference in affective commitment can be interpreted based
on the work of Meyer and Allen (1991). Staff members of the institution reported a
greater “emotional attachment to, identification with, and involvement in the
organization” (Meyer & Allen, 1991, p. 67) than the faculty did. Further, “employees
with a strong affective commitment continue employment with the organization because
they want to do so” (Meyer & Allen, 1991, p. 67). The higher score of affective
commitment for the staff could be interpreted as a stronger desire to stay with the
organization.
Discussion of Research Question 2
The second research question sought to explore the relationship between position
and continuance commitment. It was hypothesized that the continuous commitment of
employees of postsecondary institutions would differ according to position as faculty,
staff, or administration. Data analysis supported for this hypothesis. Statistical analysis

109
demonstrated that continuance commitment differed significantly by position. As
demonstrated through post hoc testing, staff expressed higher levels of continuance
commitment than both faculty and administration.
Following the framework of Meyer and Allen (1991), these results for
continuance commitment suggest that the staff were more highly aware “of the costs
associated with leaving the organization” (Meyer & Allen, 1991, p. 67). Therefore, staff
members are more likely to “remain because they need to do so” (Meyer & Allen, 1991,
p. 67). The higher continuance commitment score could be interpreted as a stronger need
to stay with the organization.
Discussion of Research Question 3
The third research question examined the relationship between position and
normative commitment. The related third hypothesis was that the normative commitment
of employees of postsecondary institutions would differ according to position as faculty,
staff, or administration. The results supported for this hypothesis. Normative
commitment was related to employee position. As with affective commitment, post hoc
analysis revealed that the difference in normative commitment by position was between
the staff and faculty groups, with staff reporting higher normative commitment.
The normative commitment of staff was significantly higher than the normative
commitment of faculty. Staff had a greater “feeling of obligation to continue
employment” (Meyer & Allen, 1991, p. 67) than the faculty. They “feel that they ought
to remain with the organization” (Meyer & Allen, 1991, p. 67). The higher normative
score could be interpreted as a stronger feeling of obligation to stay with the organization.

110
To summarize the results related to the first three research questions,
postsecondary employees expressed different levels of organizational commitment
according to the position held. Staff reported significantly higher levels of affective,
continuance, and normative commitment than faculty. The significance and consistency
of these findings across all three components of commitment provided strong evidence
that the staff had higher organizational commitment than the faculty. In addition, staff
expressed higher levels of continuance commitment than administration. The small size
of the administration position category in this study may have limited the ability to find
significant results for this group.
Discussion of Research Question 4
The fourth research question focused on the relationship between personal and
position variables and affective commitment within the field of postsecondary education.
The fourth hypothesis predicted that the affective commitment of employees of
postsecondary institutions would be related to personal and position characteristics. Data
analysis provided partial support for this hypothesis. Hierarchical regression analysis for
affective commitment demonstrated that the block of position variables were significantly
related to affective commitment. The addition of the personal variables, however, did not
add significantly to the model. Therefore, affective commitment of the postsecondary
employees was related to the position attributes, but not the personal ones. Within the
block of position variables, three demonstrated a significant relationship with affective
commitment: length of employment, KTRS retirement, and campus location.

111
Discussion of Research Question 5
The fifth research question sought to explore the relationship between personal
and position variables and continuance commitment. It was hypothesized that the
continuance commitment of employees of postsecondary institutions would be related to
personal and position attributes. Data analysis provided support for this hypothesis. The
results of hierarchical regression analysis for continuance commitment demonstrated that
the block of position variables were significant predictors of continuance commitment.
The addition of the personal variables significantly increased the variance accounted for
in continuance commitment. Therefore, continuance commitment of the postsecondary
employees was related to the position and personal attributes. The significant predictors
from the blocks of position and personal variables were employment status and
education, one predictor from each set.
Discussion of Research Question 6
The sixth research question examined the relationship of personal and position
variables with continuance commitment. It was hypothesized that the normative
commitment of employees of postsecondary institutions would not be related to personal
and position characteristics. Data analysis provided partial support for this hypothesis.
The block of position variables was a significant predictor of normative commitment, as
demonstrated by the hierarchical regression analysis for normative commitment. While
the combination of position and personal variables was also significant, the addition of
the personal variables did not add to the model. Therefore, while the normative
commitment of the postsecondary employees was not related to the personal attributes, it
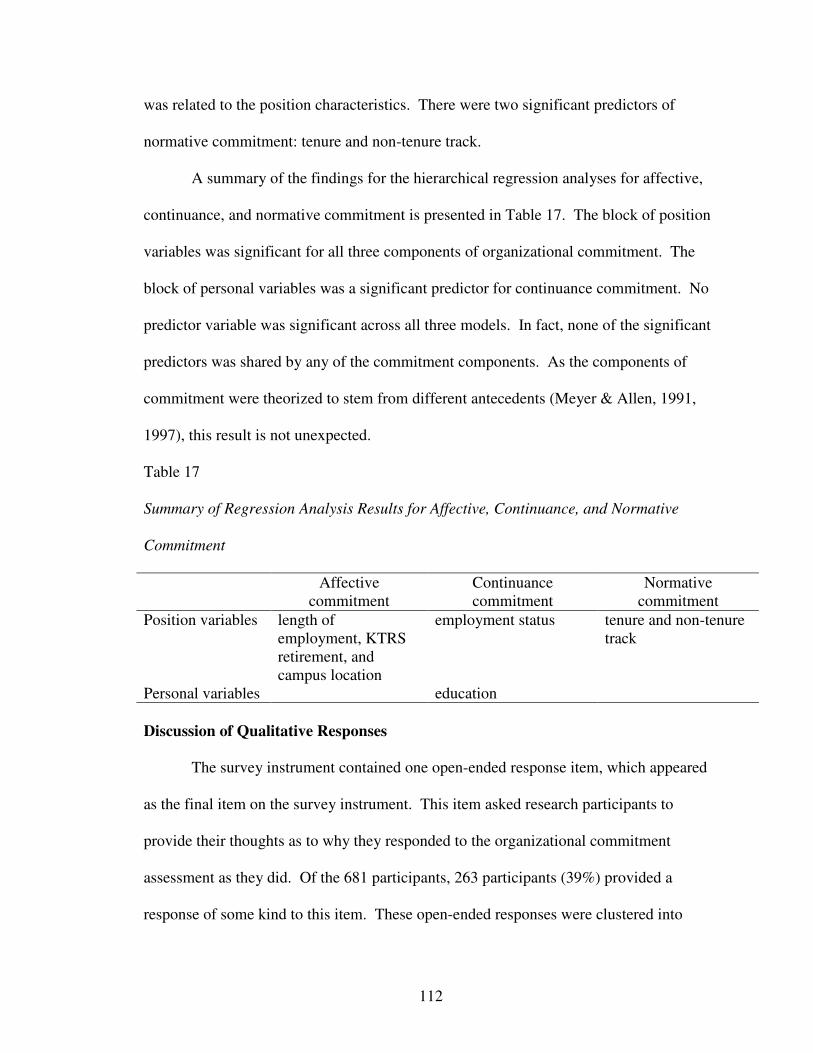
112
was related to the position characteristics. There were two significant predictors of
normative commitment: tenure and non-tenure track.
A summary of the findings for the hierarchical regression analyses for affective,
continuance, and normative commitment is presented in Table 17. The block of position
variables was significant for all three components of organizational commitment. The
block of personal variables was a significant predictor for continuance commitment. No
predictor variable was significant across all three models. In fact, none of the significant
predictors was shared by any of the commitment components. As the components of
commitment were theorized to stem from different antecedents (Meyer & Allen, 1991,
1997), this result is not unexpected.
Table 17
Summary of Regression Analysis Results for Affective, Continuance, and Normative
Commitment
Affective commitment
Continuance commitment
Normative commitment
Position variables length of employment, KTRS retirement, and campus location
employment status tenure and non-tenure track
Personal variables education
Discussion of Qualitative Responses
The survey instrument contained one open-ended response item, which appeared
as the final item on the survey instrument. This item asked research participants to
provide their thoughts as to why they responded to the organizational commitment
assessment as they did. Of the 681 participants, 263 participants (39%) provided a
response of some kind to this item. These open-ended responses were clustered into

113
groups through iterative readings of the responses by the researcher and letting categories
emerge.
One of the repeated themes for the open-ended response item was the
participants’ status as alumni or former students of the institution where the research was
conducted. Overall, based on the included comments, this prior relationship with the
institution as a student seems to be related to a positive disposition toward the university.
For example, one participant shared “I have a strong personal attachment to this
university because it's my alma mater.” For the most part, these participants expressed
feeling a personal relationship with the institution that was generally positive. The status
as a former student of an institution may influence the commitment an employee later
feels as an employee and perhaps connects the employee to the institution in a more
personal way. Inclusion of this variable in future organizational commitment research
conducted in the education field may be an important consideration.
Several participants offered a distinction between the commitment they felt to the
organization and the commitment they felt toward a certain segment of that organization.
While the Affective, Continuance, and Normative Commitment Scales (Meyer & Allen,
1997) were intended and worded to measure organizational commitment, some
participants noted that their feelings toward the organization were different from their
feelings toward their department, office, students, or other more localized grouping. The
response from one participant encapsulated this conflict well: “The issue is a complex
one and the questions do not fully address this complexity. For example, I feel a great
deal of loyalty to my unit within the organization, but little to the organization as a
whole.” This body of responses was reminiscent of the research of Reichers (1985) who

114
suggested that organizational commitment was a compilation of commitments to several
different groups connected to an organization. This premise appears to be supported by
the thoughts shared in this study by these responding participants. While the feeling
expressed toward the smaller groupings were generally positive, this was not exclusively
the case.
Another category of research participant responses to the open-ended item
involved an evaluation of the reciprocal evaluation of the relationship between the
employee and the institution as perceived by the respondent. As stated by one
respondent, “[The institution] has not fully committed to me, so I have not fully
committed emotionally to [the institution].” On a closely related theme, a few
respondents stated within their responses that they were part-time employees and the lack
of a full-time position and the benefits associated with a full-time position influenced the
commitment they felt toward the organization. For example, one respondent offered the
following: “Some of these responses are informed by my adjunct faculty status.
Reflecting on the questions and my responses, I may have answered differently if I were
a full-time faculty member.” This assessment of the employee’s commitment to the
organization as a reflection of the organization’s commitment to the employee was
demonstrated in the data analysis. Employee status as a full-time or part-time employee
exhibited a significant relationship with continuance commitment in the regression
analysis.
A few other themes emerged from the free-response item, although the number of
responses or the information provided was more limited. Status as a newer employee
was noted by some, with the related difficulty of responding to the survey due to a lack of

115
experience with the institution. This logical difficulty has been noted by researchers
(Allen & Meyer, 1996). Recent or impending retirement was also mentioned as an
influential factor in selected item responses, although the direction of effect as a positive
or negative factor was not noted. Several respondents acknowledged that they felt a
sense of commitment to the organization, but at the same time continued that those
feeling were secondary to their commitment to their families or that those feelings would
not prevent their decision to leave the institution for a better opportunity. As stated by
one participant, “I enjoy working for [the institution] and am very committed to the
institution, but that doesn't mean that I would not leave for the right position.” The
juxtaposition of commitment to organization versus commitment to family would seem to
have a negative impact on the evaluation of organizational commitment when they are
evaluated in terms of parts of the overall commitment experienced by an individual.
Relationship with Previous Research
The Affective, Continuance, and Normative Commitment Scales (Meyer & Allen,
1997) has been used with many different subject pools. This study utilized the measure
with employees of a postsecondary institution. For this group of employees as well, the
scales demonstrated adequate reliability across all three components. The scale
reliabilities in this study were similar to the reliability results observed in the meta-
analysis by Meyer et al. (2002).
Like the research of Xu and Bassham (2010), this study also found some item
contamination for the factor analysis on the items of the Affective, Continuance, and
Normative Commitment Scales (Meyer & Allen, 1997). As the current study utilized the
1997 version of the scale and Xu and Bassham utilized the 1990 version, a direct

116
comparison of the results is not possible, particularly with the extensive revisions to the
NCS. In this study, the NCS was related to the ACS and to the CCS, both in terms of
correlations and factor loadings from factor analysis. These results suggest that
continued modification of the scale may be in order.
Two studies (Fuller et al., 2006; Schroder, 2008) previously explored the
influence of organizational commitment in the postsecondary setting. Using the OCQ
(Porter et al., 1974), Schroder (2008) found different predictor variables for
organizational commitment for faculty than for staff. The results of the current study also
demonstrated that organizational commitment differed according to position. Research
by Fuller et al. (2006) demonstrated differences in affective commitment by position. In
the Fuller et al. study, faculty scores of affective commitment were significantly lower
than those of staff and those of administrators. The current study found similar results for
affective commitment, with faculty reporting lower levels of affective commitment than
staff. While the difference between the faculty and administration groups approached but
did not reach significance, in the current study, the pattern of results was in the same
direction as Fuller et al, with the faculty reporting lower affective commitment than the
administration. The current study corroborated the results of Fuller et al. and extended
the results by including and finding significant results for differences by position for
continuance commitment and normative commitment.
Similar to the results of previous research, this study found few significant results
for personal characteristics included in the study. Of the three personal attributes
included in the regression analyses in this study, only education achieved significance
and only for continuance commitment. This lack of results between personal attributes

117
and organizational commitment complements the finding of other research (Giffords,
2003; Mathieu & Zajac, 1990; Meyer & Allen, 1997) and extended them into the
postsecondary education field.
The results of the regression analyses in this study yielded different significant
predictors for each of the three components of organizational commitment, as did the
research by Marchiori and Henkin (2004). The lack of similar results across affective,
continuance, and normative commitment provided additional support for the three-
component commitment concept as developed by Meyer and Allen (1991, 1997). The
three components were designed to assess different aspects of commitment and as such,
were theorized to have different antecedents and sources. The lack of shared predictors
across any of the three commitment components offered additional support for this
conceptualization.
The open-ended item concerning why the participants responded in the way that
they did was included for two purposes. First, this item added description and substance
to the numerical responses. Second, as suggested by Reichers (1985), research on
organizational commitment should attempt to include the perceptions and perspective of
those experiencing the commitment. Information contained in this item seemed to
indicate that responding participants made a distinction between their commitment to the
organization and their commitment to a subpart of that organization. Some participants
sensed and acknowledged this distinction in their written responses. Reichers (1985)
suggested an approach to organizational commitment that included multiple
commitments to different organizational groups. The responses received in this study

118
provided some indication that multiple focuses for commitment may be experienced by
employees.
Implications
In the current study, faculty had significantly lower organizational commitment
than staff. This lower commitment was not limited to one component of commitment,
but was consistent across all three components. The lower commitment scores observed
for the faculty may be a reflection of the perception of some faculty that they operate
similar to independent contractors or that they are committed to their profession or
discipline rather than to a particular institution. As research has consistently
demonstrated a relationship between organizational commitment and turnover as well as
intent to turnover, educational administrators and leaders concerned about the potential,
negative impact of turnover on their organizations may want to consider means through
which the commitment of faculty to their particular educational institution may be
strengthened. The literature on organizational commitment includes a wide array of
characteristics related to commitment, in addition to those in the current study.
Administrators may want to discuss the plausibility and potential influence of certain
interventions with their colleagues and their faculty in order to determine which
interventions would be most beneficial to their institution.
Limitations
This study utilized a non-experimental design. Random assignment of research
participants to a specific type of position was not feasible. Due to the nature of this
study, causality cannot be inferred from these results.

119
While the sample size was adequate, it represented a small percentage of the
employee population of the institution. The response rate to the survey was only 23%.
While this provided an adequate sample for the statistical procedures utilized, it may limit
the generalizability of the results and call into question the representativeness of the
research participants.
The current research was limited to the employees of one public, postsecondary
institution. As organizational type has been shown to impact organizational commitment
(Giffords, 2003; Goulet & Frank, 2002), the results found may not be generalizable to
other types of postsecondary institutions. In addition, the unique nature of this particular
organization in terms of its history and culture may also make it difficult to transfer the
findings to other, dissimilar institutions.
For all hypotheses testing, a low proportion of the variance in the commitment
components was explained by the independent variables. The position variable
accounted for 3%, 6%, and 3% of the variance in affective, continuance, and normative
commitment, respectively. The block of position variable accounted for 7% and 5% of
the variance in affective and normative commitment, respectively, while the blocks of
position and personal variables accounted for 16% of the variance in continuance
commitment. While these results do not negate or dispute the statistically significance of
the findings, they may raise an issue of meaningful significance. Additional research at
other institutions may be necessary to determine if this is a valid concern.
Suggestions for Future Research
The current study selected a specific group of position and personal variables in
order to explore their relationship with organizational commitment in the field of

120
postsecondary education. Future research should include different variables of interest.
These could include items concerning faculty rank, years of employment in higher
education across institutions, information on prior student status, employee satisfaction
with the benefits offered by the institution, and the degree to which the employee takes
advantage of the benefits offered. The distinction between satisfaction with benefits
versus utilization of benefits may be an important distinction as they may not correspond
and could differentially influence commitment, particularly continuance commitment.
The participant responses to the open-ended item suggested that an employee’s
status as a graduate or as a former student of the institution may have implications for
research on organization commitment in the education field. This study did not include
any items related to the prior student or alumni status of the employees. The
connectedness and relationships experienced as a student may influence the employee’s
feelings toward the organization. If the experience as a student overall was positive, this
may be carried over into that person’s experience at the institution as an employee. Of
course, a negative experience as a student may be transferred as well. In addition, an
employee’s status as the graduate of an institution may have an effect on the perception
of that graduate employee by other employees. An employee who is also an alumnus
may be treated differently from an employee who is not an alumnus.
From the open-ended responses, as well, it would seem that research participants
had some difficulty responding to the Affective, Continuance, and Normative
Commitment Scales (Meyer & Allen, 1997) on an organizational level. It may be
enlightening to investigate commitment on a more personal level or to multiple groups
within the organization, as suggested by Reichers (1985). Particularly for larger

121
institutions, which often contain multiple colleges within the institution, a less macro-
level measure of commitment could be more effective and meaningful.
Across the affective, continuance, and normative commitment scores, it is
interesting to note the movement of the administrative group with respect to the other two
groups. For affective commitment, the mean score for the administration was closer to
the mean score for the staff than that for the faculty. For continuance commitment, the
opposite was true, with mean for the administration almost matching the mean for the
faculty. For normative commitment, the mean score for the administration score fell
almost at the midpoint between the staff and faculty groups. This varied pattern is in
contrast with the pattern of scores between the faculty and staff groups, which was
consistent across the three commitment components (see Figure 1 in Appendix K). It
may be interesting and informative to continue to investigate this group of employees as
separate category from faculty and staff.
As the current study was conducted in only one institution, future studies may
want to include multiple studies to assist with generalizability. In addition, it would be
interesting to explore whether the organizational commitment of employees from
different institutions varied according to the type of institution (i.e., public, private not for
profit, and for profit). Other research (Giffords, 2003; Goulet & Frank; 2002) has found
differences in organizational commitment by organizational type; however, that research
was not conducted in the postsecondary education setting.
Summary and Conclusion
This study sought to investigate the relationship between organizational
commitment and position in the field of postsecondary education. Data analysis with

122
ANOVA yielded significant results for each of the commitment components by position.
Specifically, the affective, continuance, and normative commitment of staff employees
was higher than those of faculty employees. These significant and consistent findings
between faculty and staff across all three, commitment components demonstrated that
position had an impact on the organizational commitment of postsecondary employees.
This difference in the organizational commitment of faculty and staff should continue to
be investigated as it has important implications for field of the postsecondary education.
This study also examined the relationship between affective, continuance, and
normative commitment and personal and position attributes using hierarchical regression
analysis. These attributes were entered into the analysis in two blocks. The first block
contained the position attributes, while the second block contained the personal attributes.
Regression analysis for affective commitment yielded significant results for the block of
position variables, with length of employment, participation in the KTRS retirement
system, and campus location exhibiting a significant relationship with affective
commitment. For continuance commitment, regression analysis yielded significant
results for both blocks of predictor variables. Employment status and education were
significant predictors of continuance commitment. Regression analysis for normative
commitment yielded significant results for the block of position predictors, with status as
tenured and in non-tenure track exhibiting a significant relationship with normative
commitment.
In addition to the research questions specifically investigated, this study added to
the body of knowledge concerning organizational commitment, both in general and in the
context of the education field. This study provided additional support for the premise

123
that the three commitment components stem from difference sources, as noted by their
lack of similar predictor variables. It also mirrored the general lack of findings between
organizational commitment and personal characteristics, and found such to be true of the
postsecondary education field as well. The position attribute included in this study
provided a starting point from which others can continue research for additional attributes
that would be meaningful to the specific field of higher education. Institutions of higher
education have many unique characteristics, which differentiate them from other
organizations. The responses to the open-ended item suggested qualities of
postsecondary institutions that might yield interesting results with further examination.
In light of the important outcomes associated with organizational commitment, a better
understanding of its antecedents and correlates would assist organizational leaders,
including educational administrators, in directing resources, policies, and practices to
support its development and growth.

124
References
Al-Qarioti, M. Q. A., & Al-Enezi, A. (2004). Organizational commitment of managers in
Jordan: A field study. International Journal of Public Administration, 27(5), 331-
352. doi:10.1081/PAD-120028813
Allen, N. J., & Meyer, J. P. (1990). The measurement and antecedents of affective,
continuance and normative commitment to the organization. Journal of
Occupational Psychology, 63(1), 1-18.
Allen, N. J., & Meyer, J. P. (1996). Affective, continuance, and normative commitment
to the organization: An examination of construct validity. Journal of Vocational
Behavior. 49(3), 252-276.
Alutto, J., Hrebiniak, L., & Alonso, R. (1973). On operationalizing the concept of
commitment. Social Forces, 51(4), 448-454. doi:10.2307/2576690.
Aranya, N., Pollock J., & Armernic, J. (1981). An examination of professional
commitment in public accounting. Accounting, Organizations and Society, 6(4),
271-280.
Aryee, S., Wyatt, T., & Min, M. (1991). Antecedents of organizational commitment and
turnover intentions among professional accountants in different employment
settings in Singapore. Journal of Social Psychology, 131(4), 545-556.
Bedeian, A. (2007). Even if the tower is “ivory,” it isn’t “white:” Understanding the
consequences of faculty cynicism. Academy of Management Learning &
Education, 6(1), 9-32. doi:10.5465/AMLE.2007.24401700
Bergquist, W. H., & Pawlak, K. (2008). Engaging the six cultures of the academy. New
York: J. Wiley & Sons.
125
Billingsley, B., & Cross, L. (1992). Predictors of commitment, job satisfaction, and intent
to stay in teaching: A comparison of general and special educators. The Journal of
Special Education, 25(4), 453-471.
Bland, C., Center, B., Finstad, D., Risbey, K., & Staples, J. (2006). The impact of
appointment type on the productivity and commitment of full-time faculty in
research and doctoral institutions. Journal of Higher Education, 77(1), 89-123.
Blau, G. (1986). Job involvement and organizational commitment as interactive
predictors of tardiness and absenteeism. Journal of Management, 12(4), 577-584.
doi:10.1177/014920638601200412
Boehman, J. (2007). Affective commitment among student affairs professional. NASPA
Journal, 44(2), 307-326.
Brierley, J. (1996). The measurement of organizational commitment and professional
commitment. Journal of Social Psychology, 136(2), 265-267.
Bruce, K. (2005). Magnus Alexander, the economists and the issue of labour turnover.
Business History, 47(4), 493-510. doi:10.1080/00076790500132936
Buck, J., & Watson, J. (2002). Retaining staff employees: The relationship between
Human Resources management strategies and organizational commitment.
Innovative Higher Education, 26(3), 175-193.
Buka, M., & Bilgic, R. (2010) Public and private schoolteachers’ differences in terms of
job attitudes in Albania. International Journal of Psychology, 45(3), 323-239.
doi:10.1080/00207590903452291

126
Carnegie Foundation for the Advancement of Teaching. (2010). The Carnegie
classification of institutions of higher education: Institution lookup. Retrieved
from http://classifications.carnegiefoundation.org/.
Cascio, F. W. (1991). Managing human resource: Productivity, quality of work life and
profits (3rd ed.). New York: McGraw Hill.
Chang, J., & Choi, J. (2007). The dynamic relation between organizational and
professional commitment of highly educated research and development (R&D)
professionals. Journal of Social Psychology, 147(3), 299-315.
Cobanoglu, C., Warde, B., & Moreo, J. P. (2001). A comparison of mail, fax and Web-
based survey methods. International Journal of Market Research, 43, 441-452.
Dillman, D. A. (2007). Mail and internet surveys: The tailored design method. New
Jersey: John Wiley & Sons.
Dishon-Berkovits, M., & Koslowsky, M. (2002). Determinants of employee punctuality.
Journal of Social Psychology, 142(6), 723-739.
Emmerich, R. (2001). Controlling the costs of mismanagement and turnover. The CPA
Journal, 71(10), 62-63.
Fuller, J., Hester, K., Barnett, T., Frey, L., & Relyea, C. (2006). Perceived organizational
support and perceived external prestige: Predicting organizational attachment for
university faculty, staff, and administrators. Journal of Social Psychology, 146(3),
327-347.
Giffords, E. (2003). An examination of organizational and professional commitment
among public, not-for-profit, and proprietary social service employees.
Administration in Social Work, 27(3), 5-23. doi:10.1300/J147v27n03_02.

127
Glisson, C., & Durick, M. (1988). Predictors of job satisfaction and organizational
commitment in human service organizations. Administrative Quarterly, 33, 61-81.
Goulet, L., & Frank, M. (2002). Organizational commitment across three sectors: Public,
non-profit, and for-profit. Public Personnel Management, 31(2), 201-210.
Retrieved from CINAHL with Full Text database.
Hausknecht, J. P., Hiller, N. J., & Vance, R. J. (2008). Work-Unit absenteeism: Effects of
satisfaction, commitment, labor market conditions, and time. Academy of
Management Journal, 51(6), 1223-1245. doi:10.5465/AMJ.2008.35733022
Herzberg, F. (1966). Work and the nature of man. Cleveland: World Publishing
Company.
Herzberg, F., Mausner, B., & Snyderman, B. S. (1959). The motivation to work. New
York: Wiley & Sons.
Huselid, M. A. (1995). The impact of human resource management practices on turnover,
productivity, and corporate financial performance. Academy of Management
Journal, 38(3), 635-672. doi:10.2307/256741
Jex, S. M. (2002). Organizational psychology: A scientist-practitioner approach. John
Wiley & Sons, Inc. (US). Retrieved from EBSCOhost.
Kezar, A. J. (2001). Understanding and facilitating organizational change in the 21st
century: Recent research and conceptualizations. New York: J. Wiley & Sons.
Lambert, E., & Hogan, N. (2009). The importance of job satisfaction and organizational
commitment in shaping turnover intent. Criminal Justice Review, 34(1), 96-118.
doi:10.1177/0734016808324230

128
Marchiori, D., & Henkin, A. (2004). Organizational commitment of health profession
faculty: dimensions, correlates and conditions. Medical Teacher, 26(4), 353-358.
Maslow, A. (1970). Motivation and personality. (2nd ed.). New York: Harper & Row.
Mathieu, J. E., & Zajac, D. M. (1990). A review and meta-analysis of the antecedents,
correlates, and consequences of organizational commitment. Psychological
Bulletin, 180(2), 171-194.
Meyer, J. P. (1997). Organizational commitment. In C.L. Cooper & I.T.Robertson (Eds.),
International review of industrial and organizational psychology (Vol. 12, pp.
175-228). Chichester, UK: Wiley.
Meyer, J. P., & Allen, N. (1984). Testing the 'side-bet theory' of organizational
commitment: Some methodological considerations. Journal of Applied
Psychology, 69(3), 372-378. doi:10.1037/0021-9010.69.3.372
Meyer, J. P., & Allen, N. (1991). A three-component conceptualization of organizational
commitment. Human Resource Management Review, 1(1), 61-89.
Meyer, J. P., & Allen, N. (1997). Commitment in the workplace: Theory, research, and
application. Sage Publishing, Inc. Retrieved from EBSCOhost.
Meyer, J. P., Allen, N. J., & Smith, C. A. (1993). Commitment to organizations and
occupations: Extension and test of a three-component conceptualization. Journal
of Applied Psychology, 78(4), 538-551. doi:10.1037/0021-9010.78.4.538
Meyer, J. P., Stanley, D. J., Herscovitch, L., & Topolnysky, L. (2002). Affective,
continuance, and normative commitment to the organization: A meta-analysis of
antecedents, correlates, and consequences. Journal of Vocational Behavior, 61,
20-52.

129
Morris, J., & Sherman, J. (1981). Generalizability of an organizational commitment
model. Academy of Management Journal, 24(3), 512-526. doi:10.2307/255572
Morrow, P. (1983). Concept redundancy in organizational research: The case for work
commitment. Academy of Management Review, 8(3), 486-500.
doi:10.2307/257837
Mowday, R. T., Porter, L. W., & Steers, R. M. (1982). Employee-Organizational
linkages. New York: Academic Press.
Mowday, R., Steers, R., & Porter, L. (1979). The measurement of organizational
commitment. Journal of Vocational Behavior, 14(2), 224-247.
Porter, L., Crampon, W., & Smith, F. (1976). Organizational commitment and managerial
turnover: A longitudinal study. Organizational Behavior and Human
Performance, 15(1), 87-98.
Porter, L., Steers, R., Mowday, R., & Boulian, P. (1974). Organizational commitment,
job satisfaction, and turnover among psychiatric technicians. Journal of Applied
Psychology, 59(5), 603-609. doi:10.1037/h0037335
Reichers, A. (1985). A review and reconceptualization of organizational commitment.
Academy of Management Review, 10(3), 465-476.
doi:10.5465/AMR.1985.4278960
Schroder, R. (2008). Predictors of organizational commitment for faculty and
administrators of a private Christian university. Journal of Research on Christian
Education, 17(1), 81-97. doi:10.1080/10656210801968299
Shavelson, R. J. (1996). Statistical reasoning for the behavioral sciences (3rd Ed.).
Needham Heights, MA: Allyn & Bacon.

130
Sills, S.J., & Song, C. (2002). Innovations in survey research: An application of Web-
based surveys. Social Science Computer Review, 20, 22-30.
Somers, M. J. (1995). Organizational commitment, turnover, and absenteeism: An
examination of direct and interaction effects. Journal of Organizational Behavior,
16(1), 49-58. doi:10.1002/job.4030160107
Steers, R. (1977). Antecedents and outcomes of organizational commitment.
Administrative Science Quarterly, 22(1), 46-56. Retrieved from MEDLINE
database.
Stevens, J. (2007). Intermediate statistics: A modern approach. Lawrence Erlbaum
Associates, Inc. eBook Collection (EBSCOhost).
Su, S., Baird, K., & Blair, B. (2009). Employee organizational commitment: The
influence of cultural and organizational factors in the Australian manufacturing
industry. The International Journal of Human Resource Management, 20(12),
2494-2516. doi:10.1080/09585190903363813
Tabachnick, B.G., & Fidell, L. S. (2007). Using multivariate statistics (5th ed.). Boston:
Allyn and Bacon.
Tziner, A., & Birati, A. (1996). Assessing employee turnover costs: A revised approach.
Human Resource Management Review, 6(2) 113-122.
United States Department of Education: Institute of Education Sciences, National Center
for Education Statistics. (ND). The condition of education: Glossary. Retrieved
from http://nces.ed.gov/programs/coe/glossary.asp.

131
United States Department of Labor: Bureau of Labor Statistics. (2010). Job openings and
labor turnover – January 2010 (USDL-10-0282). Retrieved from
http://www.bls.gov/news.release/archives/jolts_03092010.pdf.
United States Department of Labor: Bureau of Labor Statistics. (2011). Occupational
employment statistics: Occupational employment and wages, May 2010.
Retrieved from http://www.bls.gov/oes/current/oes119033.htm.
Wallace, J. (1995). Organizational and professional commitment in professional and
nonprofessional organizations. Administrative Science Quarterly, 40(2), 228-255.
Xu, L., & Bassham, L. S. (2010). Reexamination of factor structure and psychometric
properties of the three-component model of organizational commitment. North
America Journal of Psychology, 10(2), 297-312.

132
Appendix A
Institutional Review Board Approval

133

134
Appendix B
Email Invitation to Participate in Research Study
Dear WKU Faculty and Staff, I would like to ask for your help in completing my WKU degree through the Educational Leadership Doctoral Program. My dissertation research involves organizational commitment, and the information collected through this survey will assist in the understanding of organizational commitment in the postsecondary setting. Please complete the brief survey linked below. The survey should take approximately 10 minutes, and your response would be greatly appreciated. The survey will be available for three weeks, until 12/27/11. Once you complete the survey, you will have the option of entering into a drawing for one of three $50 Wal-mart gift cards. The information for the drawing will be submitted through a second hyperlink, found on the last screen of the survey. The information for the drawing will be separate from the survey and will not be linked to survey responses. Your responses to the survey will be anonymous and confidential. The survey does not request personally identifying information. No attempt will be made to link any information to specific individuals. Taking part in this research study is voluntary, and you may choose not to participate. If you decide to participate by clicking the link below, you do not have to answer any questions that make you uncomfortable, and you may stop taking part at any time. At any time prior to completing and submitting the survey, you may exit the survey (close or “x” out of the browser) and your answers will not be recorded. Opting not to participate in this study will not affect any future services you may be entitled to from WKU. There are no known risks from participating in this research study. The study is being conducted under the guidance of Dr. Ric Keaster. If you have any concerns or complaints about it, you may contact him at 270-745-7088.
Your continued cooperation with the following research implies your consent. The following link will take you to the survey: http://www.surveymonkey.com/s/orgcommit. Thank you for your participation! Linda Keller
THIS PROJECT HAS BEEN REVIEWED AND APPROVED BY THE WESTERN KENTUCKY UNIVERSITY INSTITUTIONAL REVIEW BOARD
Paul Mooney, Human Protections Administrator
TELEPHONE: (270) 745-6733

135
Appendix C

136

137

138

139

140

141

142
Appendix D
Permission to Use Affective, Continuance, and Normative Commitment Scales

143
Appendix E
Frequency Distribution for Affective Commitment Scores
Figure E1. Frequency distribution of affective commitment scores.

144
Appendix F
Frequency Distribution for Continuance Commitment Scores
Figure F1. Frequency distribution of continuance commitment scores.

145
Appendix G
Frequency Distribution for Normative Commitment Scores
Figure G1. Frequency distribution of normative commitment scores.

146
Appendix H
Scatterplot for Affective Commitment
Figure H1. Scatterplot of predicted and residual scores for affective commitment.

147
Appendix I
Scatterplot for Continuance Commitment
Figure I1. Scatterplot of predicted and residual scores for continuance commitment.
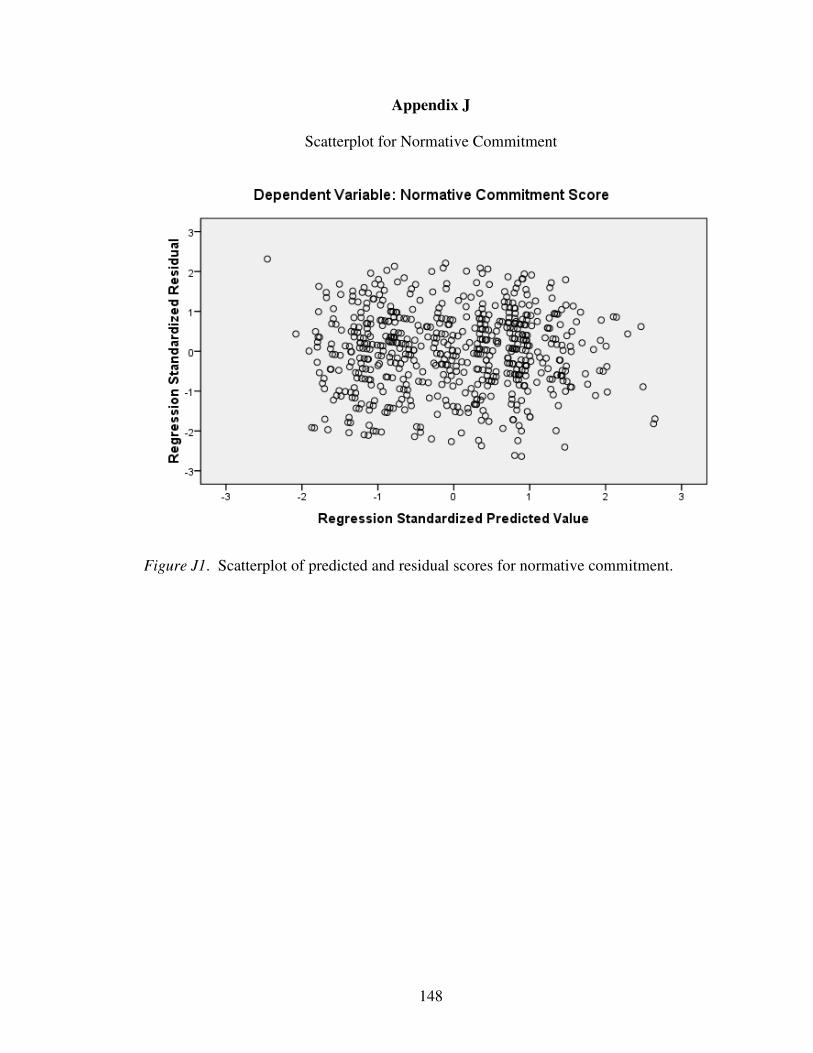
148
Appendix J
Scatterplot for Normative Commitment
Figure J1. Scatterplot of predicted and residual scores for normative commitment.

149
Appendix K
Mean Scores for affective, continuance, and normative commitment by position
Mean component scores by position
1
2
3
4
5
6
7
Affective
commitment
Continuance
commitment
Normative
commitment
Organizational commitment component
Mean
sco
re
Faculty
Staff
Administration
Figure K1. Mean scores for affective, continuance, and normative commitment by
position.