Embed Size (px)
Citation preview

THE RELATIONSHIP BETWEEN ORGANIZATIONAL CLIMATE AND JOB SATISFACTION FOR DIRECTORS OF PHYSICAL PLANTS
By
FREDERIC J. GRATTO
A DISSERTATION PRESENTED TO THE GRADUATE SCHOOL OF THE UNIVERSITY OF FLORIDA IN PARTIAL FULFILLMENT
OF THE REQUIREMENTS FOR THE DEGREE OF DOCTOR OF PHILOSOPHY
UNIVERSITY OF FLORIDA 2001

ACKNOWLEDGMENTS Throughout the process of earning this degree, I benefited from the wisdom and helpful
nature of several people. In particular, Dr. David Honeyman, chairman of my committee,
provided a real example of servant leadership, a concept I had read so much about. Also, Dr. Art
Sandeen, Dr. Dale Campbell, and Dr. Stephen Anderson lived up to their reputations as
distinguished scholars and fine men as they interacted with me throughout this project. Dr. James
Doud was a big help to me as well because of his sage advice, friendly disposition, and timely
encouragement.
My beautiful wife, Dr. Katherine Gratto, served as my special confidant and counselor.
She bolstered my efforts and fortified my resolve by helping me select courses and meet
deadlines so that I could make steady progress toward my new degree. I am especially thankful
for her friendship and support. Angela Rowe also provided me with help many times and clearly
showed why she is so highly regarded in Norman Hall. She is an incredible person, terrific
educator, and wonderful public servant.
My four children, Anthony, Melissa, Audrey, and Dominic returned the favors and advice
I have been giving them for years about the value of education. They kept me encouraged and
helped me see the light at the end of the tunnel. I appreciate their sincere support and
cheerleading. They were a big help, as always.

3
TABLE OF CONTENTS page ACKNOWLEDGMENTS ...................................................................................................ii LIST OF TABLES ...............................................................................................................v ABSTRACT.......................................................................................................................vii CHAPTERS 1 INTRODUCTION ...........................................................................................................1 Statement of the Problem.....................................................................................................6 Purpose.................................................................................................................................7 Definition of Terms .............................................................................................................7 Limitations ...........................................................................................................................8 Significance of the Study.....................................................................................................8 Summary..............................................................................................................................9 2 REVIEW OF RELATED LITERATURE .....................................................................10 Job Satisfaction..................................................................................................................13 Job Satisfaction Theories ...................................................................................................16 Organizational Climate .....................................................................................................23 Organizational Climate Theories ......................................................................................25 Organizational Climate and Job Satisfaction.....................................................................29 The Role and Impact of the Director of Physical Plant .....................................................32 Other Factors That May Affect Job Satisfaction ...............................................................34 Summary............................................................................................................................36 3 DESIGN OF THE STUDY............................................................................................38 Methodology ......................................................................................................................38 Summary............................................................................................................................44

4
4 PRESENTATION AND ANALYSIS OF THE DATA ................................................46 Survey Responses ..............................................................................................................47 Population Profile ..............................................................................................................47 Research Question 1...........................................................................................................50 Research Question 2...........................................................................................................56 Research Question 3...........................................................................................................63 Research Question 4...........................................................................................................69 Research Question 5...........................................................................................................78 Summary............................................................................................................................84 5 CONCLUSIONS and RECOMMENDATIONS...........................................................86 Conclusions ........................................................................................................................87 Implications ........................................................................................................................90 Suggestions for Further Research......................................................................................91 APPENDICES A ORGANIZATIONAL CLIMATE QUESTIONNAIRE FOR DIRECTORS OF PHYSICAL PLANTS ..........................................93 B COVER LETTER FOR QUESTIONNAIRE............................................97 REFERENCES ..................................................................................................................99 BIOGRAPHICAL SKETCH ...........................................................................................110

5
LIST OF TABLES Table page 1 Directors of Physical Plant: Distribution by Gender.................................................................................. 48 2 Director of Physical Plant: Distribution by Ethnic Origin ........................................................................ 48 3 Director of Physical Plant: Distribution by Gender and Ethnic Origin ...................................................... 49 4 Director of Physical Plant: Distribution by Type of Institution and Number of Students ............................ 49 5 Director of Physical Plant: Distribution by Number of Years at Current Institution ................................... 50 6 Directors’ of Physical Plants Perception of Organizational Climate: Frequency Distribution, Means, and Standard Deviations ................................ 54 7 Directors’ of Physical Plants Perception of Organizational Climate: Correlation Table .......................................................................................... 55 8 Directors’ of Physical Plants Satisfaction with Organizational Climate: Frequency Distribution, Means, and Standard Deviations ................................ 60 9 Directors’ of Physical Plants Satisfaction with Organizational Climate: Correlation Table .......................................................................................... 61 10 Directors’ of Physical Plants Overall Satisfaction with Institution: Frequency Distribution and Mean Distribution ............................................... 62 11 Importance of Job Satisfaction Variables to Directors of Physical Plants: Frequency Distribution, Means, and Standard Deviations ................................ 67 12 Importance of Job Satisfaction Variables to Directors of Physical Plants: Correlation Table .......................................................................................... 68 13 Directors’ of Physical Plants Overall Satisfaction with Position: Frequency Distribution and Mean Distribution ............................................... 69 14 The Relationship Between Measures of Job Satisfaction and Measures of Organizational Climate: Correlation Table ..................................................... 70 15 Step Wise Multiple Regression for Decision Making and Seven Organizational Climate Factors ............................................................................................ 71

6
16 Step Wise Multiple Regression for Autonomy, Power, and Control and Seven Organizational Climate Factors...................................................................... 72 17 Step Wise Multiple Regression for Relationship with Peers and Seven Organizational Climate Factors ..................................................................... 73 18 Step Wise Multiple Regression for Relationship with Subordinates and Seven Organizational Climate Factors ..................................................................... 74 19 Step Wise Multiple Regression for Relationship with Supervisor and Seven Organizational Climate Factors ..................................................................... 75 20 Step Wise Multiple Regression for Salary and Seven Organizational Climate Factors......................................................................................................... 76 21 Step Wise Multiple Regression for Benefits and Seven Organizational Climate Factors......................................................................................................... 77 22 Step Wise Multiple Regression for Professional Effectiveness and Seven Organizational Climate Factors...................................................................... 78 23 Analysis of Variance for Autonomy, Power, and Control and Size of Institution ................................................................................... 80 24 Analysis of Variance for Relationship with Peers and Size of Institution ......................................................................................... 81 25 Analysis of Variance for Relationship with Supervisor and Size of Institution ......................................................................................... 82 26 Analysis of Variance for Salary and Size of Institution ................................................ 83

7
Abstract of Dissertation Presented to the Graduate School of the University of Florida in Partial Fulfillment of the Requirements for the Degree Doctor of Philosophy
THE RELATIONSHIP BETWEEN ORGANIZATIONAL CLIMATE
AND JOB SATISFACTION FOR DIRECTORS OF PHYSICAL PLANTS
By
Frederic J. Gratto
December 2001
Chairman: Dr. David S. Honeyman Major Department: Educational Leadership, Policy, and Foundations
The purpose of this study was to investigate the relationship between measures of
organizational climate and measures of job satisfaction as applied to directors of physical plants.
Another purpose of this study was to determine if there were significant differences in the means
for job satisfaction when controlling for gender, ethnicity, classification of the institution by size
and type, number of years as director of physical plant at current institution, and type of
institution.
A survey instrument was electronically sent to directors of physical plants who were
members of the Association of Higher Education Facilities Officers as of July 2001. A total of
602 survey instruments were sent and 214 were returned, rendering a 37% response rate. The
data were analyzed to determine the relationship between measures of organizational climate and
job satisfaction and the differences in mean satisfaction ratings when controlling for gender,
ethnicity, classification of institution by size and type, number of years served at present
institution as director of physical plant, and type of institution.

ix
These analyses revealed that personal concerns, internal communication, organizational
structure, and evaluation were the organizational climate factors related to job satisfaction for
directors of physical plants. The eight job satisfaction variables investigated were: decision-
making; autonomy, power and control; relationship with peers; relationship with subordinates;
relationship with supervisor; salary; benefits; and professional effectiveness.

1
CHAPTER 1 INTRODUCTION
In the early part of the twentieth century, researchers began to be interested in the topic of
job satisfaction. Measuring performance on the job and increasing productivity were the primary
focus (Wanous, 1976). When Elton Mayo and his associates agreed to observe experiments
underway at the Western Electric Hawthorne plant near Chicago, job satisfaction became a
popular topic for research because of the unanticipated findings of the study. The experiments
were intended to determine the impact of illumination levels on worker productivity (Hanson,
1985). The results were a surprise because they indicated there was no significant relationship
between levels of illumination and productivity of workers (Hersey & Blanchard, 1996). This
unexpected outcome inclined the researchers to conclude that factors other than lighting levels
must have impacted worker productivity. They identified other variables that impacted
productivity more than aspects of the physical environment. Some of these were the effect of
informal work groups, the attitude of workers about the company, and the need for rest periods.
The researchers made two important conclusions. One was that human variability was a
significant factor in determining worker productivity. The second one was that norms and
expectations among workers had a greater impact on productivity than the work environment
(Luenburg & Ornstein, 1991).
The surprising findings of the Hawthorne Studies spurred interest in the topic of
employee motivation and job satisfaction. Subsequent studies about motivation and behavior

2 revealed that worker perception and job satisfaction were factors related to job performance
(McGregor, 1957; 1958; Spates, 1959; Tannebaum & Schmidt). As a consequence of these
studies and others, the study of human relations became well established. Argyris (1957)
observed that the early stages of studying human relations in the work place focused on why
peopled behaved in certain ways and whether or not they were satisfied with their jobs. Another
observation indicated that basically all human behavior in an organization was caused by any one
or a combination of individual factors, small informal group factors, or formal organizational
factors. One of the most important needs of workers was to enlarge those areas of their lives in
which their own decisions determined the outcome of their efforts. Individual factors and group
factors allowed for small adjustments by workers in various directions which allowed their
decisions to determine job performance. The extent to which workers strived for self-
actualization while behaving as agents of the organization affected job satisfaction. Argyris
considered the relationship between job satisfaction and organizational climate and concluded
that it was illogical, cruel, wasteful, and inefficient not to have a logical and rational design for
an organizational structure.
Prior to the Mayo studies, those who studied human relations considered motivation at
work to be a rather straightforward matter. People were either satisfied with their jobs or they
were not. But the research of Argyris (1962) led to a more comprehensive way to consider job
satisfaction. The study set out to measure how well organizations worked with people rather than
with things such as machinery and considered the human climate, which was comprised of
variables such as mutual understanding, mutual trust, self-esteem, openness, and internal
commitment. Argyris found many factors that influenced job satisfaction. Some of these were

3 administrative leadership, effectiveness of groups and intergroup relationships, formal
organizational structure, policies and practices, and people at all levels of the organization.
Argyris concluded that for an organization to be effective it must have a system with inputs,
outputs, and feedback. Interpersonal relationships and management understanding of the social
needs of workers were found to impact factors such as conformity, organizational structure, and
job satisfaction. Sayles and Strauss (1960) also investigated the need for informal work groups in
a job setting and found that belonging to a clique provided employees with a sense of
identification and belonging which contributed to job satisfaction. The importance of belonging
to a group, which increased job satisfaction, was confirmed in studies by Vroom (1964) and
March and Simon (1965).
McMurray (1953) also considered the focus of organizations on things rather than on
people during a time when business and industry emphasized production, research, accounting,
engineering, sales, and financial matters. As a consequence, management had less interest in
humanitarian considerations such as the needs of workers on the job. McMurray observed that
while this focus resulted in a vast contribution to the national economy and the tremendous
improvement in the American standard of living, it came at a cost to human well-being on the
job. McMurray concluded that many of the frictions and conflicts which plagued organizations
could be attributed to the extent to which management was insensitive to the needs, problems,
and anxieties of the people with whom they worked and whom they supervised. Similarly,
Golembiewski (1962) observed that in the early part of the twentieth century, the worker was a
cog in the mechanical system of the organization and of interest only so far as he performed the
expected functions. Whatever the individual brought to the workplace other than ability to do the

4 job was largely irrelevant. Man was regarded as merely a performer of a particular simple
function rather than as a complex entity. Golembiewski concluded that a lack of intimate friendly
cooperation and understanding about the worth of people in the workplace was a detriment to job
satisfaction. The extent to which organizations took the individual into account was studied by
Argyris (1964). These findings indicated that organizations which considered the personal and
social needs of people were more likely to have competent, committed, and fully functioning
individuals. Fleishman, Harris, and Burtt (1955) also studied the social setting in which people
worked. They concluded that the value system of organizations which favored productivity and
results rather than people adversely impacted job satisfaction. In contrast, Haire (1962) found
that successful organizations created a structure and climate that focused on the strengths and
interests of people which enhanced productivity and satisfaction on the job. Similarly, the
research findings of Stogdill (1965) indicated that successful organizations considered worker
morale and job satisfaction an output just as important as productivity.
Gordon and Howell (1959) studied the changing character of American business and
observed that although originally confined to production management problems, the scientific
approach to management had spread to include all aspects of management activities. Instead of
being taken as a given, the individual and his contribution became variables which organizations
had become interested in. Gordon and Howell concluded that skill in human relations was an
essential ingredient of effective management which enhanced both productivity and job
satisfaction. Human relations skills as related to supervision were studied by Guest (1962). This
research also documented the changing character of American organizations. The findings
indicated that when managers had meetings with subordinates and asked for input, people felt

5 more directly involved and experienced an increased level of satisfaction on the job. Argyris
(1976) also considered the relationship between job satisfaction and opportunities for workers to
provide input to supervisors and found that job satisfaction increased as opportunities to provide
feedback increased.
Part of the changing character of American businesses was manifested in the climate of
organizations. Owens (1995) as well as Steers and Porter (1975) studied climate and concluded
that it could be considered the personality of the organization. Climate was revealed in the
feelings of people and the comments they made about the place where they worked. The study of
job satisfaction and organizational climate revealed that organizations gradually changed their
perception and appreciation of workers. No longer were they considered mere cogs in the
machinery of an organization. They were considered just as important as the mission of the
organization (Stogdill, 1965). This perspective resulted in increased attention about how
organizational climate and job satisfaction impacted institutional effectiveness. Concern about
this and criticism about quality and accountability in education became an important matter on
college campuses (Report of the Wingspread Group on Higher Education, 1993). Smith (1993)
considered these matters in the field of higher education and concluded that effective
environments resulted from settings in which people were the primary focus. Barr (1988)
assessed the organizational climate at Palomar Community College and concluded that a better
understanding of organizational climate provided a basis for improving productivity, motivation,
and worker satisfaction. Consequently, specific research within the context of higher education
was timely, necessary, and appropriate.
Statement of the Problem

6 The relationship between organizational climate and job satisfaction was well
documented in industrial settings but less was understood about this relationship in educational
settings. Directors of physical plants were responsible for the institution’s facilities. This was
important because facilities were a significant factor in recruiting students, faculty, and staff and
because they contributed to the opportunity to learn on campus. The magnitude of the role that
directors of physical plants had in the higher education enterprise was made clear by Ernest
Boyer in a 1998 Carnegie Commission report: “You cannot be a core of excellence in higher
education if you do not demonstrate a commitment to facilities. It is time to recognize that
facilities provide the centerpiece around which all other functions in higher education take place”
(Medlin, 2000, p. 24). Directors of physical plants had an important role in determining the
quality of campus facilities and, consequently, the learning environment. Knowing more about
the relationship between organizational climate and job satisfaction among these campus leaders
could enhance the level of job satisfaction for directors of physical plants and positively impact
their job performance.
Purpose
The purpose of this study was to investigate the relationship between organizational
climate and job satisfaction as applied to directors of physical plants. A second purpose was to
determine if there were significant differences in means for job satisfaction within the context of
organizational climate when controlling for gender, ethnicity, classification of the institution by
size and type, and number of years experience as a director of physical plant at current
institution. In particular, the research addressed the following questions:
1. How do directors of physical plants perceive organizational climate at their respective institutions, using a set of seven identified factors for climate?

7 2. Using the same seven climate factors as an index, how satisfied are directors of physical plants with the organizational climate at their respective institutions?
3. How important is each of eight identified job satisfaction variables to directors of physical plants in the performance of their specific job responsibilities?
4. For each of eight job satisfaction variables, is there a significant relationship between measures of job satisfaction and a set of seven measures of satisfaction with the organizational climate, as reported by directors of physical plants?
5. Is there a significant difference in the means of eight job satisfaction variables
for directors of physical plants when compared by gender of the respondent,
ethnic origin of the respondent, classification of the institution by size and type,
and length of time served as a director of physical plant?
Definition of Terms
For the purposes of this study, the following definitions were used:
Director of Physical Plant was the chief administrator responsib le for maintaining the facilities and infrastructure of the institution, managing a charted course to improve and expand the facilities and infrastructure, and overseeing the financial affairs of the Physical Plant Department.
Job satisfaction referred to the extent to which people liked their jobs (Levin, 1995).
Organizational climate referred to the collective personality of the organization. It was an accumulation of feelings and perceptions that people have about the work environment at their place of employment (Evans, 1996).
Limitations
The following limitations are related to this study:
1. The study was limited to directors of physical plant who were members of the Association of Higher Education Facilities Officers.
2. This study focused only on job satisfaction and organization culture as they pertain to Directors of Physical Plants.

8 Significance of the Study
This study was significant for several reasons. First, significant changes were occurring
regarding what people expected from their jobs and careers (Colson & Eckerd, 1991). Second,
because of increasing diversity of workers it was important to understand more about how they
felt about the organizational climate in their places of work and their level of job satisfaction
(Moyers,1991). Third, a positive organizational climate was critical to the success of an
organization (Mirvis & Kanter, 1989). Four, the director of physical plant played a major role in
providing quality facilities and services on college campuses (Cain, 2000; Adams, 2000).
Because organizational climate had such an important role in determining job satisfaction
for employees, this research was conducted to increase the understanding of how climate
impacted job satisfaction for directors of physical plants. Findings of this study advanced the
body of knowledge by testing theoretical constructs about job satisfaction and organizational
climate as applied to directors of physical plants, and by determining whether or not the model
used by Chappell (1995), Palmer (1995), Evans (1996), Paulson (1997), DeMichele (1998) and
Zebetakis (1999) applied to this sector of higher education administration.
Dessoff (2001) and Medlin (1999) asserted that job satisfaction was enhanced for
facilities administrators when caring relationships were established in work environments and
when the organizational structure supported the mission and climate of the institution. This study
confirmed that factors such as internal communication, organizational structure, political climate,
professional development opportunities, promotional opportunities, and regard for personal
concerns had a significant impact on the level of job satisfaction for directors of physical plants
because they affected variables such as decision-making, relationship with peers, relationship
with subordinates, relationship with supervisor, and professional effectiveness.
Summary

9 Job satisfaction and organizational climate have been subjects of investigation since the
Hawthorne Studies conducted by Elton Mayo and his associates about sixty years ago. The
relationship between these two variables has been well documented in industrial settings but very
little was understood about it in educational settings. This study tested the theories and constructs
of job satisfaction and organizational climate for directors of physical plants at public and private
colleges and universities of various sizes in the United States and Canada.

10
CHAPTER 2 REVIEW OF RELATED LITERATURE
There was little interest in job satisfaction and organizational climate in the United States
until the 1930s. Prior to this time, the focus in work environments was on job performance and
maximizing worker output (Wanous, 1976). Considerable interest in these topics began when
Elton Mayo and his associates experimented at the Western Electric Hawthorne plant near
Chicago, Illinois. The Hawthorne study, as it came to be known, provided the impetus for others
to become interested in the topics of employee motivation and job satisfaction. Furthermore, the
Hawthorne studies revealed that employee perceptions, job satisfaction, and the social climate at
work had a significant influence on productivity and morale (Hersey, Blanchard, & Johnson,
1996). Because of these revelations, job satisfaction and organizational climate became topics of
considerable interest to researchers.
The purpose of this study was to investigate the relationship between organizational
climate and job satisfaction of directors of physical plants. This was an important concern
because job satisfaction impacted performance in the workplace since it was associated with
attendance, productivity, longevity, and the general attitudes of employees (Benfari, 1995;
Bennis, 1966; Gruneberg, 1979; Hopkins, 1983; Litwin & Stringer, 1968; Vroom, 1982). The re
were good reasons to be interested in job satisfaction, which was considered from the perspective
of the employee or the organization. From the employee perspective, a humanitarian view
indicated that people deserved to be treated fairly and with respect (Brady, 1989; Maxwell, 1998;
Ryan & Oestreich). From the vantage point of management, job satisfaction was considered a
factor which led to behavior by employees who influenced organizational performance. This was

11 a circular relationship. A favorable work environment tended to improve people which tended to
improve the organization.
“This is the simplest way of saying that proper management of the work lives of human beings, of the way in which they earn their living, can improve
them and improve the world and in this sense be a utopian or revolutionary technique” (Maslow, 1998, p. 5).
Consequently, job satisfaction was considered a reflection of how well an organization
was functioning and to an extent, a reflection of good judgment on the part of management.
Variances in productivity from one organizational unit to another were considered diagnostic of
trouble spots. These factors were sufficient to justify concern about job satisfaction and, in
combination, they explained the attention that has been paid to this important variable.
Directors of physical plants, like all employees, were affected by their level of job
satisfaction. It affected the ability to manage others and was important because department heads
were expected to serve as leaders and managers (Scott, 1980). Historically, effective leadership
consisted of the downward exercise of power and authority in both the organizational mission
and in the human dimension. Leaders offered jobs in exchange for a follower’s support,
cooperation, and compliance (Owens, 1995). In contrast, contemporary understanding and
practice of leadership included concern for followers and the extent to which they found
satisfaction in their jobs (Stemmle, 2000). This approach to managing people reflected the
notion presented by Jenkins (1999) as well as the opinions of Colson and Eckerd (1991). They
stated that people are any organization’s greatest asset so how they felt about their jobs was a
significant factor in work environments. They considered employees the heart and soul of any
enterprise, believed that each individual had value, and maintained that it was in an
organization’s best interest when people felt satisfied in their jobs. In a similar vein, Maslow

12 (1998) stated: “Most of us would argue that we believe in the potential of people and that people
are our most important organizational assets. If that is the case, why then do we frequently
design organizations to satisfy our need for control and not to maximize the contributions of
people?” (p. 11).
The concern for people in an organization was emphasized by Gilley and Maycunich
(2000, p. 3). They stated:
“A virtual certainty in any organization’s annual report is a statement of how important employees are to the ultimate success of the bus iness. These organizations claim that their employees are their number one priority. They further assert that their efforts and resources are focused on employee satisfaction and development.” This emphasis on the worth and contribution of people was a fairly new phenomenon for
leaders to consider because prior to the 1930s the focus in work environments was almost
exclusively on productivity. Job satisfaction was not a factor (Wanous, 1976). Not much interest
was shown in this area until Elton Mayo and his associates experimented at the Western Electric
Hawthorne plant in Illinois. What became known as the Hawthorne study provided some
knowledge of employee motivation and satisfaction on the job. It revealed that job performance
is related to job satisfaction and that the social environment in the workplace had an impact on
morale and productivity. Other researchers such as Bess and Lodahl (1969) as well as Solmon
and Tierney (1977) confirmed these observations and as a consequence, the human relations
movement was started.
Job Satisfaction
Some people like to go to work and consider it an integral part of their lives. Others do
not want to work but do only because they must, for financial or other reasons. Because there

13 were such divergent perspectives about work and because these perspectives had the potential to
impact job performance, job satisfaction was a topic of great interest for people who worked in
organizations and for those who studied them. In fact, it was the most frequently studied variable
in organizational behavior research (Spector, 1997). Job satisfaction has been a topic of interest
to researchers because of the perception that it was associated with absenteeism, worker
productivity, employee turnover, and general mental health of employees (Chappell, 1995). The
assessment of job satisfaction, its causes, consequences, and nature were important variables that
drew the attention of researchers for almost seventy years. The earliest studies about it focused
on productivity and turnover while later studies focused on need fulfillment.
Researchers were concerned about whether or not the job met the employee’s physical and
psychological needs for things provided by work, such as salary (Porter, 1962; Wolf, 1970).
Job satisfaction was a subjective term, defined in a variety of ways, and all of them dealt
with how one perceived his or her job experience (Evans, 1996). Job satisfaction was often used
interchangeably with morale in the workplace according to Pincus (1986). Vroom (1982)
described job satisfaction as “the affective orientation of individuals toward work roles they are
presently occupying” (p. 99). Several other researchers also emphasized the affective nature of
job satisfaction in the workplace (Beck, 1990; Kendall & Hulin, 1969; McCormick & Ilgen,
1980; Satterlee, 1988). Job satisfaction was described more simply by Locke (1976) as a positive
relationship characterized by pleasurable or positive state of mind resulting from the job
experience. Job satisfaction was a good feeling that one got by providing a service or effort
which helped others become relieved of a burden, experience pleasure, or get what they wanted

14 (Capodagli & Jackson, 1999). Similarly, Manz (1998) described job satisfaction as being derived
from the opportunity to serve others and make a worthwhile contribution. Likewise, Harris
(1996) maintained that the special element most critical to job satisfaction was contributing to
worthwhile work and pointed out the connection between the importance of having a job that
makes a difference and how well an organization functioned. Harris stated: “The highest level of
service comes from the heart, so the company that reaches its people’s heart will provide the
very best service” (p. 17). Another simple definition was offered by Spector (1997). Spector
stated: “Job satisfaction is the degree to which people like their jobs” (p. vii). Levin (1995)
stated that job satisfaction could be looked at from the perspective of the employee as well as
from the perspective of the employer. Levin asserted that for employees, job satisfaction came
from having work that mattered and from a sense of job security. From the employer’s view, he
stated that job satisfaction came from involving employees in decisions that affected them and
from providing people with the skills, motivation, and freedom to do their jobs better. Levin also
stated that how people did their jobs and how they felt about them greatly affected their
productivity and job satisfaction. Although definitions of job satisfaction varied, it was generally
agreed that it could be regarded as an attitudinal variable, considered a global feeling about the
job or as a related constellation of attitudes about various aspects or facets of the job. For the
purpose of this study, job satisfaction was defined as a person’s attitude toward his or her job.
Job satisfaction involved any aspect or part of a job. Aspects of a job frequently assessed
included rewards such as salary compensation, fringe benefits, opportunities to get involved, the
nature of the work, the organization itself, or people such as coworkers, supervisors, or
subordinates (Kern, Riley, & Jones, 1987). Practices in human resources emphasized concern for

15 employee welfare because every person was considered part of the organization team. Initiatives
to resolve problems between management and labor and enhance teamwork were recognized as
mutually beneficial. “What distinguishes these joint efforts from earlier programs is their
commitment to employee involvement and quality of work life” (Ray, 1988, p. 3).
It was important to know how to enhance employee job satisfaction because of the
potential impact on productivity. It was also important to understand the pitfalls which awaited
an organization that did not react to resolve problems which caused employees to be dissatisfied
on the job. Deal and Jenkins (1994) and Goffee and Jones (1998) reported that dissatisfied
employees impacted the organization by not following the rules, mindlessly conforming to
policy, being frequently absent, committing sabotage, spreading ill will through gossiping, not
contributing as much as they could, and subverting the organization by way of negative attitudes
and comments. Satisfaction on the job combated these problems and contributed to productivity
in the workplace (Clarke, 1992; Mobley, 1977). There were variables about a job which affected
employee job satisfaction. If jobs were too narrow, fragmented, and restrictive, there was a
conflict between the individual and the system (Bolman & Deal, 1991). Other dimensions that
affected job satisfaction were autonomy and feedback. Therefore, it was important to increase
job satisfaction and this took place in an organization which provided worthwhile work,
opportunities for advancement, a positive environment, and a sense of mutual trust (Wolgemuth,
1999).
Job Satisfaction Theories
Factors impacting job satisfaction could be divided into two categories (Spector, 1997).
He called them antecedents of job satisfaction. The first antecedent was the job environment

16 comprised of factors external to the individual such as treatment by others in the workplace,
rewards, on the job relationships, and the nature of the work. The second antecedent was
comprised of individual factors that the person brought to the job. This included expectations,
personality, the need for fulfillment, motivation, and experiences (Chappell, 1995). Both
categories of factors worked together to determine how well the individual fit the job which
influenced job satisfaction.
Person-Environment Fit Theory
This theory stated that the fit between the person and the job was an important influence
on job satisfaction (Kristof, 1996). An emphasis on improving the fit between the abilities of
people and the demands of their jobs made an important contribution to both organizational
functioning and individual adjustment. A good fit was described as a healthy match between the
worker’s needs and the demands of the job (Chappell, 1995). There was job satisfaction when
characteristics of the job were matched to characteristics of the individual (Edwards, 1991). The
importance of the relationship between the organization and the individual was first recognized
by Argyris (1957). He pointed out that a conflict sometimes developed when there was a
discrepancy between the needs of the organization and the needs of the individual. He also
maintained that this incongruence resulted in frustration, failure, short term perspective on the
part of the employee, and conflict within the organization. Argyris stated that employees who
felt incongruence in their job found ways to resist or deal with frustrations within the
organization.
1. They withdrew from the organization through absenteeism or by quitting.

17 2. They stayed on the job but developed a mental distance by becoming apathetic
or passive.
3. They resisted the organization by restricting output or through deception and sabotage.
4. They tried to escape the present circumstance by climbing the hierarchy to a better job.
5. They tried to create groups such as unions that tried to deal with problems between the organization and the people in it. 6. They socialized their children to believe that work was unrewarding and
offered little chance for advancement. (Bolman & Deal, 1991)
Maslow’s Hierarchy of Needs
Employees usually wanted to have some say over matters that affected them in the
workplace and if they did not have this they were not likely to feel satisfied no matter what other
issues they were permitted to address. Personal meaningfulness, therefore, was an important
factor to consider regarding job satisfaction (Brady, 1989). Including this dimension was not as
straightforward as it appeared on the surface because personal meaningfulness varied as people
grew and changed in their lives and careers. At a particular time in one’s life and career a person
might have been preoccupied with salary and security needs. At a later point, the focus might
have been on accomplishment and recognition. Maslow (1970) was the first to recognize that
there was a hierarchy of needs in people. His premise was that as lower needs were met they
became less of a concern and were replaced by higher level needs. He asserted that higher level
needs could not be addressed until lower level needs had been met. He classified human
motivation into five categories.
1. Physiological needs: need for food, clothing, and shelter;
2. Safety needs: the need to be free of fear of physical danger or deprivation;

18 3. Social needs: the need to belong to and be accepted within various groups;
4. Esteem needs: the need for self esteem and for esteem from others;
5. Self-Actualization needs: the need or desire to become all that one is capable of becoming. (Galpin, 1996)

19 Alderfer’s ERG Theory
Clayton Alderfer (1975) considered Maslow’s hierarchy of needs and offered a revised
and realigned version of it. He concluded that all people had three basic needs which were
existence needs, relatedness needs, and growth needs. Alderfer’s existence grouping
corresponded to Maslow’s basic psychological and safety needs. Relatedness corresponded to
Maslow’s social needs. Growth needs corresponded to Maslow’s esteem and self-actualization
(Hersey, Blanchard, & Johnson, 1996). Examples of Alderfer’s existence needs were food,
water, shelter, and pay. Examples of relatedness needs were relationships with friends, family,
co-workers, and employers. Examples of growth needs were the need to feel good about oneself
and the desire to accomplish more personally and in one’s work.
Herzberg’s Motivation-Hygiene Theory
Frederick Herzberg extended Maslow’s theory of motivation by applying it specifically
to the workplace. He developed the concept of man as having two sets of needs, which were
independently met. His studies of job attitudes revealed that esteem and self-actualization
seemed to become more important as people developed. In interviews, he asked people from
eleven industries in the Pittsburgh area what kinds of things about their jobs made them unhappy
or dissatisfied and what kinds of things made them happy or satisfied. From this data he
concluded that people had two different kinds of needs. He observed that when people felt
dissatisfied with their jobs they were concerned about the work environment. In contrast, when
they felt good about their jobs, the feeling was about the job itself. The first category of needs he
called hygiene or maintenance factors. They were hygiene factors because they impacted the
worker’s environment and served in preventing job dissatisfaction. They were maintenance

20 factors because they were never fully met and must continue to be maintained. He called the
second category of needs motivators because they were effective in motivating people to better
performance.
Herzberg felt that matters such as company policies, quality of supervision, working
conditions, interpersonal relationships, money, status and security should be considered hygiene
or maintenance factors because they were related to the conditions under which a job was
performed (Hersey, Blanchard, & Johnson, 1996). Herzberg referred to factors that involved
feelings of achievement, professional growth, and recognition on the job as motivators. He used
this term because these factors were capable of having a positive impact on job satisfaction
which often resulted in an increase in individual performance on the job (Kerns, Riley, & Jones,
1987).
Theory X and Theory Y
According to Douglas McGregor, the traditional organization had centralized decision
making, a hierarchal pyramid, and was based on certain assumptions about human behavior and
human motivation. He assembled these assumptions into two theories: Theory X and Theory Y.
“Theory X assumed that most people preferred to be directed, were not interested in assuming
responsibility, and wanted safety above all. Accompanying this philosophy was the belief that
people were motivated by money, fringe benefits, and the threat of punishment” (Hersey,
Blanchard, & Johnson, 1996
p. 37). Leaders who accepted these assumptions closely supervised their employees because
they believed that external control was the best way to deal with unreliable or irresponsible
people.

21 McGregor believed that Theory X assumptions about human nature were often inaccurate
and felt that management styles based on them would fail to motivate people to work toward
attainment of organizational goals. As a consequence, he concluded that management needed
leadership styles based on a more accurate understanding of human nature and motivation. His
Theory Y asserted that people are not, by nature, lazy and unreliable. This theory conceived of
man as desiring to work and use his skills, to make decisions for himself, and operating heavily
on internal controls (Kern, Riley, & Jones, 1987).
Theory Z
William Ouchi expanded and modified McGregor’s work. He believed that the ideal
organization was egalitarian, fully engaged the participation of employees in day to day
operations, and emphasized interpersonal relationships. Such an entity was characterized by
employee cooperation with the objectives of the organization. Ouchi, mindful of McGregor’s
Theory Y, used the term Theory Z to describe a leadership philosophy that focused on the
interdependence between people and organizations. The most important part of this relationship
was the commitment in an organization’s culture to its people. Theory Z suggested that
humanized working conditions increased productivity and profits to the company and enhanced
the self-esteem of the employees (Bolman & Deal, 1991).

22 Expectancy Theory
Based on the earlier works of Lewin (1935), Victor Vroom created the Expectancy
Theory (1964). The premise of this theory was that felt needs caused behavior and this motivated
behavior in a work environment was increased if a person perceived a positive relationship
between effort and performance. Vroom concluded that motivated behavior was increased if
there was a positive relationship between good performance and rewards. As a consequence, he
identified three relationships that enhanced motivated behavior. These were a positive
relationship between effort and performance, a positive relationship between desired
performance and rewards, and the achievement of valued outcomes or rewards (Hersey,
Blanchard, & Johnson, 1996). This theory identified the link between effort and performance and
the link between performance and valued outcomes. It pointed out that people exerted effort to
accomplish a particular objective if there was a reasonable expectation that the effort expended
would result in a desired performance or reward.
Equity Theory
This theory, created by Adams (1965) contended that people wanted to receive equitable
reward and compensation for their work. He asserted that if people felt they were treated
equitably in the work environment they would be satisfied in their jobs. If they did not feel they
were treated equitably in the work environment they were dissatisfied about their jobs. Evans
(1996) concluded that individuals wanted to be treated equitably in the work place. If they were,
they were satisfied with their jobs. If they were not, then dissatisfaction resulted.
When workers considered the effort they put forth on the job and the personal sacrifices
they made to an organization, they expected certain outcomes such as an equitable salary, status

23 within the organization, and recognition for their efforts. Beck (1990) stated that if the perception
of workers was that a discrepancy existed between the effort put forth and the compensation
received, they would be dissatisfied on the job. In contrast, he stated that if the perception of
workers was that the compensation was equitable, there would be job satisfaction.
Another factor that impacted job satisfaction was the amount of involvement in decision
making by employees (Witt & Nye, 1992). Their experiments involved employees from various
organizations and they concluded that when workers were involved in decision making they
were more likely to be satisfied on the job, exerted more effort, and made more sacrifices to be
successful within the organization. The perception of being involved in decisions which affected
them was an important part of job satisfaction according to Witt and Myers (1992).
Organizational Climate
Organizational climate was a useful tool for understanding the complexities of
organizations. It was defined as an accumulation of tangible perceptions that individuals had
about various aspects of the work environment (Evans, 1996). Extensive research about it
attested to the importance of this variable regarding how organizations functioned. Researchers
and authors repeatedly cited organizational culture as a fundamental factor which impacted
organizational performance (Fullan, 1991; Fullan & Miles, 1992; Sagor, 1995; Sarason, 1996;
Sergiovanni & Starratt, 1987). Kouzes and Posner (1987) defined culture as a pattern of shared
assumptions that a group learned as it solved problems. They considered it the correct way to
think, perceive, and feel in relation to those problems. Bolman and Deal (1984, p. 4) offered a
simple definition of organizational culture: “The way we do things around here.” Peterson and
Spencer (1990) defined organizational culture as a broad concept of organizationally related
24 phenomena. They stated that it might be considered the organization value system. Likewise,
Lenz (1999) stated that organizational culture was determined by the prominent values of
leadership in an organization. It was revealed in the way people were treated, the ways things got
done, and in a focus on customer service. Berry (1999) also included customer service in his
definition of organizational culture. He defined it as a work environment which clearly
demonstrated that each person had worth, each person made a worthwhile contribution, each
person used their talents to the fullest, and each person served others. Band (1991) also referred
to customer satisfaction in his description of organizational culture. He considered it a winning
formula that everyone knew and embraced. It was comprised of the feeling of teamwork that
pervaded an organization and the belief that service to customers was paramount for success.
Forehand (1968) described it simply as an interaction between environmental and personal
variables.
Organizational culture was the value system and personality of the organization. It was
comprised of clearly defined characteristics such as the ethos of the place, the mission of the
organization, its goals, the shape of the hierarchy, governance and policy matters, participant
behaviors, and workplace dynamics (Peterson & Spencer, 1990). Similarly, Peterson and White
(1992) defined culture as “the deeply embedded patterns of organizational behavior and the
shared values, assumptions, beliefs, or ideologies that members have about their organization
and its work” (p. 181). Peters and O’Connor (1980) described organizational culture as the
environment in which people worked. This environment was either positive or negative,
supportive or not, depending on whether or not it provided people with what they needed to do
their jobs. They identified eight factors which shaped the culture of the workplace: amount and

25 quality of job-related information, availability of tools and equipment, availability of materials
and supplies, amount of budgetary support, amount of help available from other people, time
available for doing the job, and physical features of the work environment. A similar perspective
was provided by Blanchard and Bowles (1993) in their succinct definition of organizational
culture. They stated that it was a prevailing sentiment within an organization that was comprised
of two focuses, the worth of employees and the worth of customers.
Organizational Climate Theories
Total Quality Management
Total Quality Management (TQM) was a philosophy that emphasized quality
measurement through statistical process control and group problem solving. It was based on the
idea of continuous improvement and centered on top management support, employee
involvement, process improvement, and recognition rewards. TQM was a useful tool for control
and for maintaining quality standards. Many educational institutions became involved with Total
Quality Management efforts and learned the importance of customers, whoever they may be
(Wattenbarger, 1994). In these settings, quality was defined as meeting or exceeding customer
needs and expectations (McNealy, 1994). By understanding customers, institutions were better
able to offer new and better services specifically designed to meet or exceed expectations. This
was the first important aspect of TQM. The second important aspect of TQM was the focus on
processes. By focusing efforts on providing services which customers really want, organizations
reduced costs by eliminating those processes that did not contribute to the desired services. This
increased efficiency was the third important output of the TQM process. A main use of Total
Quality Management was an attempt to overcome insensitivity to customers. The challenge was

26 to continually define and improve quality as perceived by the customer. Organizations that used
TQM identified what service meant to customers. The identification of quality supported total
quality management techniques such as statistical process control and statistical quality control
(Barsky, 1995).
The origin of the TQM movement was in the corporate sector. The major premises of it,
quality control, teamwork, empowerment, continuous improvement which worked well in Japan
and the United States also proved useful in educational settings (Cain & Christensen, 2000).
They stated that TQM involved an on going series of assessment activities undertaken over time.
This assessment was a tool for continuous improvement whose power was cumulative because it
resulted in more refined changes to improve customer satisfaction. Another benefit of continuous
assessment for educational institutions was verified by van der Have (1997). He noted that self-
assessment activities were critical to those who were responsible for maintaining institutions of
higher learning because of the increased scrutiny of processes and outcomes. In light of
shrinking or stagnant allocations for education, the concepts of TQM gained favor at many
institutions (Christenson, 1999). Total Quality Management was a concept that required
continual administrative support, a strong commitment from employees, and frequent
measurement of results. Institutions of higher learning which used TQM found that it increased
efficiency, resulted in better customer satisfaction, and contributed to a positive image (Cain &
Christensen; Christenson, 1999; Spence and Stuckman, 1994).
The Organizational Climate Description Questionnaire
The Organizational Climate Description Questionnaire was developed by Andrew W.
Halpin and Don B. Croft (1963). They conducted research in an elementary school setting and

27 their findings began the discussion of organizational climate. In their research they wanted to
investigate organizational climate. They did this by eliciting from teachers the factors that they
thought were important when describing the climate of a school. Their findings allowed them to
identify six types of organizational climate.
1. Open Climate. In this kind of climate, teachers worked well together, were proud to be part of the school, and exhibited high camaraderie. The teachers had a friendly relationship with each other and with the principal. The administrator was able to lead and control the teachers yet generally displayed behavior that encouraged leadership roles to develop within the faculty.
2. Autonomous Climate. In this environment the teachers had control, were self- governed, and were extended great latitude by the principal to make decisions. As a consequence, the faculty worked well together to solve problems and meet the goals of the school. Morale was generally high in an autonomous climate.
3. Controlled Climate. In this setting the principal allowed less flexibility and the achievement of tasks was the main focus. Nonetheless, morale was usually high as teachers concentrated on getting the job accomplished. They expected to be told what and when to do it since the principal allowed little flexibility in the way things were done. Focus by the principal and teachers was on getting the job done. Therefore, concern for the feelings of others was not part of a controlled climate. 4. Familiar Climate. This environment was friendly and the social needs of people were important considerations. Very little direction was provided by the principal and there was considerable concern about making everyone feel comfortable. Productivity was not emphasized and as a result people did not work at their full capacity.
5. Paternal Climate. Principals in this setting tried unsuccessfully to control the faculty and meet their social needs. This behavior was seen as insincere and did not motivate teachers.
6. Closed Climate. In this climate there was considerable apathy and teachers enjoyed neither high achievement nor social belonging. They did not work well together. The principal was ineffective and not concerned about the social needs or welfare of faculty and staff.
The Organizational Climate Index

28 George C. Stern (1970) developed a way to measure organizational climate. His research
was based on the work of Lewin (1935) who believed that by studying individuals and groups in
their work settings, the effect of organizational climate could be determined. Stern maintained
that efforts to measure organizational climate must consider the individual and the work
environment. To develop the Organizational Climate Index (OCI) Stern also considered the work
of Murray, Barrett, and Homburger (1938). Murray had developed the concept of need-press and
its impact on human personality. He reasoned that personality was the product of interplay
between individual needs and press, which was the accumulation of environmental pressures that
led to changes in behavior. Stern felt that certain factors influenced the climate in institutions of
higher education and developed a questionnaire, with Carl Steinhoff, to measure them. The
College Characteristics Index (CCI) was first used in public schools and it probed the
organizational press as experienced by persons in an organization (Lunenburg and Ornstein,
1991). It has been used in a wide variety of educational settings because its strength was based
on a strong theoretic concept of climate which has been beneficial to researchers (Evans, 1996).
The original tool, the Organizational Climate Index (OCI) measured six factors about climate.
1. Intellectual Climate, an indicator of the extent to which the environment, staff, and faculty supported the scholarly interests of the institution.
2. Achievement standards, an indicator of the extent to which the environment in an organization emphasized high standards of personal achievement.
3. Personal dignity, an indicator of whether or not the work environment stressed a sense of fair play and openness, the integrity of individuals, and provided a supportive environment.
4. Organizational effectiveness, an indicator of the degree to which the work environment enhanced the ability of people to effectively perform their duties.

29 5. Orderliness, an indicator of the need to conform to a defined core of personal appearance and institutional image.
6. Impulse control, an indicator of the constraints and organizational control over
people in the work environment.
Organizational climate could be measured by using the Organizational Climate Index
(OCI). It measured need press and control press. Analyzed together they provided an indication
of an organization’s climate.
Organizational Climate and Job Satisfaction

30 According to McGregor (1960) leadership was a relationship of the characteristics of the
organization and the characteristics of people. Characteristics of an organization such as its
purpose, structure, the nature of tasks to be performed, opportunities for advancement, and the
political nature of the job environment impacted how people felt about their jobs. This occurred
because people brought attitudes, needs, and aspirations to work environments and were
impacted, either positively or negatively, by the organizational climate. McGregor (1960) stated
that organizational climate needed to mesh, in subtle ways, with the goals, talents, and
aspirations of people in order for there to be effective performance of leaders.
The quality of working life was investigated by Morf (1986). Work was found to be a
social activity that affected the quality of life because of those things which people experienced
while on the job. The extent to which work and the work environment affected people was
pointed out by Gini (2000):
“In the long run work can prove a boon or a burden, creative or crippling, a means to personal happiness or a prescription for despair. But no matter where might wind up on this spectrum, where we work, how we work, what we do at work, and the general climate and culture of the workplace indelibly mark us for life.” (p. 2).
A high quality of work satisfaction was found in organizations which had a supportive
job climate and recognized the value of human resources. Ford (1979) found this to be true in
settings that involved industrial engineers because his research pointed out that characteristics of
an organizational climate such as concern for the feelings of others impacted satisfaction on the
job. Regarding employment in the public sector, Hopkins (1983) also found that a high regard
for the feelings of others tended to increase satisfaction on the job. Glaser (1976) came to the
same conclusion based on research at American Telephone and Telegraph Company and also

31 asserted that internal communication within an organization impacted job satisfaction for
workers. The quality of internal communication as well salary, benefits, and advancement
opportunities were components of organizational climate that Brief (1998) identified as having a
direct impact on job satisfaction. Another organizational climate characteristic that impacted job
satisfaction was individual development opportunities according to Barbash (1976). The quality
of life at work was also investigated by Schlesinger (1982). This research found that it was
important to provide a work environment that encouraged continuous learning, provided new
opportunities, and demonstrated an active interest in the job satisfaction of employees.
Rice (1982) also investigated the relationship between job satisfaction and organizational
climate and asserted that people were the heart of any enterprise because their ideas, attitudes,
and efforts were key causes of success. Findings pointed out that for maximize performance,
people needed to be satisfied at work. This was best accomplished by understanding their
makeups, ideas, capabilities, feelings, attitudes, hopes, dreams, and goals and nurturing an
organizational climate which supported them. Freeman and Rodgers (1999) studied workers in a
variety of settings such as industry, chambers of commerce, and education and determined that
people wanted an organization that was not political, encouraged open communication, and
provided plenty of opportunities for advancement. Bisconti and Solmon (1977) interviewed
hundreds of people in a wide range of work environments and investigated the relationship
between organizational climate and job satisfaction. This research indicated that people tended to
be more satisfied on the job in organizations which allowed a high degree of autonomy and
nurtured relationships among peers, supervisors, and subordinates. Although it was not always
clear what the most important needs for employees were, Hackman and Suttle (1977) found that

32 an organizational climate which edified people, honored their accomplishments, and kept their
best interests in mind was likely to produce satisfied employees. Despite often diverse and
competing needs of people in the workplace, these researchers found that successful
organizations sought and developed ways to nurture a climate that enabled individuals to
succeed. This resulted in mutual gain for individuals and the enterprise.
The Role and Impact of the Director of Physical Plant
The growth and expansion of higher education in the United States was one of the most
durable and impressive success stories in the history of American domestic institutions. Colleges
and universities had continued to support more students and employ more people than ever
before. Many institutions enjoyed lofty reputations for educational excellence, support of
technological advances, and community service. “The remarkable expansion and growth of
higher education is evidence of the wide range of benefits that have popularly been considered to
flow from higher education” (Kaiser, 1997, p. 17). At institutions of higher education, the
director of physical plant was responsible for managing the facilities which made learning
process possible. Without buildings and grounds and the infrastructure to support them, there
could be no colleges or universities. In addition to managing and maintaining facilities, directors
of physical plant were responsible for short and long range planning, fiscal management of the
many funding sources which supported facilities, and organization of capital improvements.
Other concerns which faced a director of physical plant included deferred maintenance since
there were not adequate resources to do everything which needed to be done, preparation to meet
the demands for electronic delivery systems and information technology, the proliferation of
distance education, space requirements on campus, adaptability of existing space for new

33 teaching methods, changes in the traditional patterns of daytime classroom and laboratory use,
impact on campus attendance as faculty and students increased the use of electronic technology
in the learning process, and the affect of non-traditional students on the demand for on-campus
residence and dining services.
There were administrative and supervisory components to the job as well. The director of
physical plant was responsible for reporting the status of the enterprise to a higher authority,
usually the vice president for administrative affairs. He or she was also responsible for providing
vision for the organization, leadership for various department heads, and guidance to those who
maintain the buildings and grounds (Kinnaman, 2000). Further, the director of physical plant had
to be able to communicate well with various constituencies such as deans, students, faculty, and
others who were interested in the appearance and condition of the campus. The director also had
to be able to successfully vie for limited institutional resources. The director also played a major
role in developing
the organizational culture within physical plant and was responsible for employee development
(Jenkins, 1998).
Campus facilities, managed by the director of physical plant, helped institutions of higher
education sustain and advance their mission to provide learning experiences for the masses.
Colleges and universities enriched the lives of students and employees, helped secure America’s
place in the competitive global economy, and created flourishing national, regional, and local
economies (Kaiser & Kirkwood, 2000). Directors of physical plant supported and helped with
these accomplishments. As a consequence, these people played a major role on campus and were
integral to the success of the higher education enterprise (Kaiser, 1997).
Other Factors That May Affect Job Satisfaction

34 Because so many other factors also might have impacted the relationship between job
satisfaction and organizational climate for directors of physical plants, the literature was also
reviewed to find pertinent information about gender and ethnicity, classification of the institution
by size and type, years of experience as director of physical plant at a particular institution, and
type of institution.
Gender and Ethnic Differences
Keller (1985) and Rebore (2001) studied the differences in leadership styles of men and
women. Their research indicated that women tend toward holistic expressions of personality
whereas men tend toward the perfection of individual abilities. Hersi (1993) found that
perceptions about the communication climate and relationships with colleagues impacted job
satisfaction for women in higher education positions. Relationships with peers and subordinates
were found to impact job satisfaction for men. Cassidy and Warren (1991) found that job
satisfaction for men and women was negatively impacted when they worked in environments
that were dominated by the opposite sex. Hersey and Blanchard (1988) also documented the
differences between the leadership styles of men and women and asserted that these differences
help organizations be more diversified regarding management of people and were, therefore,
more likely to help organizations be more effective.
Kekes (1993) and Moon (1993) found differences in the ways African, Asian, and
European Americans interacted with one another and with others from different ethnic
backgrounds. Moreover, they recorded significant differences in expectations on the job and the
impact of the organizational climate when comparing these groups.
Classification by Size and Type of Institution

35 Fink (1999) found that the number of students enrolled at an institution impacted the job
of the director of physical plant. Larger and more diverse institutions presented greater and
different challenges than colleges with smaller enrollments. Likewise, Kaiser and Kirkwood
(2000) found that the size of a college or university affected how matters such as the budgeting
process, planning use of space, master planning, capital renewal, and facility audits were
handled. Moreover, the research by Kaiser and Kirkwood (2000) found that public universities
tended to use management reviews of efficiency to monitor performance while private
universities often used a work order process to identify needs and realign reporting lines to
increase worker efficiency. These very different approaches to process improvement impacted
the job of the director of physical plant.
Number of Years as Director of Physical Plant at Present Institution
The number of years served at a college or university as director of physical plant was
examined because longevity was found to have an impact on the ability to provide a vision for
the institution (Stemmle, 2000). Kinnaman (2000) cons idered the length of time directors of
physical plants served at an institution and identified four phases that these administrators went
through. The entrepreneurial phase included adaptability, flexibility, risk taking, high motivation,
and energy. The growth phase involved putting into place systems, rules and procedures to help
ensure continued efficiency and effectiveness. The late growth phase was marked by
complacency, breakdown in communication, habit orientation, rejection of innovation,
bureaucratic style, low risk taking, and low energy. The renewal phase was marked by
revitalization, closeness to customers, risk taking, quality orientation, openness, flexibility, and
an inclination to seek further training. Kinnaman (2000) found that these phases had an impact

36 on the level of job satisfaction for directors of physical plants and affected their approach to
leadership in their organizations.
Summary
The purpose of this study was to investigate the relationship between organizational
climate and measures of job satisfaction as applied to directors of physical plant. In this study,
job satisfaction was considered to be a person’s negative or positive feelings about his or her
place of employment (Beck, 1990). The subject of job satisfaction became an interesting topic
for research after the Hawthorne Studies conducted by Elton Mayo and his associates. An
abundance of research has since been conducted to consider this phenomenon which verified its
importance in the workplace. Interest in the relationship between job satisfaction and
organizational climate remained high because pressures for institutional effectiveness kept
increasing (Chappell, 1995). In this study, organizational climate referred to perceptions of
people in the workplace regarding the work environment. Many researchers considered it to be
the personality of the organization (Emery, 1999; Hatch, 1997; Hartman, 1988; Kotter &
Heskett, 1992; Kunda, 1992). The important role of the director of physical plant in higher
education has been well documented (Davis, 1997; Kaiser, 1997; Medlin, 1999). Findings of this
study have advanced the body of knowledge about the relationship between organizational
climate and job satisfaction of directors of physical plant. This was important because of the
impact leaders had on the organizations in which they worked. Chappell (1995, p. 65) stated:
“How well the executive leadership is able to mold a positive organizational climate in the
expanding global arena will have profound effects on the success and well-being of not only the
employees but ultimately of entire organizations.” The research of Sell and Shipley (1979, p. 57)

37 pointed out the significance of a positive organizational climate and its importance for the
success of individuals and the organization:
“An important reason for employing the concept of job satisfaction must ultimately be to make assessments about people and jobs so that some action or improvement can be made in the jobs themselves, so that they are more satisfying for the people doing them, or that other appropriate remedies are taken to ensure in some way a better fit between the individual and his job and organization.”

38
CHAPTER 3 DESIGN OF STUDY
The purpose of this study was to investigate the nature of the relationship between
measures of organizational climate and measures of job satisfaction as applied to directors of
physical plants. This study was also conducted to determine if there was a significant difference
in means for eight job satisfaction variables when controlling for gender, ethnicity, classification
of the institution by size and type, and number of years of experience as a director of physical
plant. The research posed five questions:
1. How do directors of physical plants perceive organizational climate at the ir respective institutions using a set of seven identified factors for climate?
2. Using the same seven climate factors as an index, how satisfied are directors of physical plants with the organizational climate of their respective institutions?
3. How important is each of eight identified job satisfaction variables to physical plant directors in the performance of their specific job responsibilities?
4. For each of eight job satisfaction variables, is there a significant relationship between measures of job satisfaction and a set of seven measures of satisfaction with organizational climate, as reported by directors of physical plants?
5. Is there a significant difference in the means of eight job satisfaction variables for directors of physical plant s when controlled by gender of the director, ethnic origin of the director, classification of the institution by size and type, and length of time served as a director of physical plant?
Methodology
To test the questions listed above, a survey instrument designed to address job
satisfaction and organizational climate was used. It collected information about the perceptions
of directors of physical plants for seven factors related to organizational climate, levels of

39 satisfaction with those factors, and the importance of eight specific aspects of job satisfaction
related to fulfilling the responsibilities of their administrative jobs.
To test the first three questions, data were collected about perception of organizational
climate, satisfaction with organizational climate, and importance of job satisfaction. This
information was utilized to assemble a descriptive profile based on frequency distributions,
correlation tables, mean distributions of means, standard deviations, and standard errors of
means. Composites were developed to reveal how directors of physical plants perceived
organizational climate in higher education institutions, how satisfied they were with climate, and
how important each of the eight job satisfaction variables were in the performance of their jobs.
Step wise multiple regression was utilized to address question four. This analysis
examined the relationship between job satisfaction and organizational climate and the
importance of specific aspects of job satisfaction. It also was used to determine if relationships in
measures of job satisfaction existed when controlling for gender of respondents, ethnicity of
respondents, classification of institution by size and type, and length of time served as director of
physical plant at the current institution.
According to Lehman (1988), multiple regression analysis may be used to establish the
functional relationship between one dependent variable and a set of two or more independent
variables. It may also be used to determine the proportion of variance in the dependent variable
that is predictable from a set of independent variables. This research used step wise multiple
regression to analyze each of eight job satisfaction variables against seven organizational climate
factors, to determine which organizational factors had the most significant relationship with
specific job satisfaction variables for directors of physical plants.

40 To answer question five, one-way analysis of variance was used to determine is there
were significant differences in means of the eight job satisfaction variables when compared by
gender of respondent, ethnic origin of respondent, classification of the institution by number of
students, classification of institution whether public or private, and length of time served as
director of physical plant.
The Population
All of the directors physical plants who were members of the Association of Higher
Education Facilities Officers were asked to participate in this study. This population consisted of
602 individuals according to the 2001 membership records.
Procedure for Data Collection
An electronic message asking directors of physical plant to take part in the study was sent
to six hundred and two members of the Association of Higher Education Facilities Officers. The
survey instrument was attached. Directors of physical plants were asked to respond by the date
indicated on the survey instrument.
Instrumentation
This study used a near replica of the survey instrument originally utilized in a University
of Florida dissertation that measured the same theoretical constructs on community college chief
instructional officers (Chappell, 1995). Palmer (1995) also used a revised version of Chappell’s
survey instrument to investigate the relationship between organizational climate and job
satisfaction for directors of health occupations program directors. Evans (1996) used a revised
version of Chappell’s survey instrument to study the same relationship for community college
presidents. Paulson (1997) did likewise to study teachers in a large suburban school district.

41 Demichele (1998) revised the original survey instrument and studied the same relationship for
collegiate campus recreation program directors. Zabetakis (1999) also used the original survey
instrument to investigate the relationship between job satisfaction and organizational climate for
community college chief business officers. In each of these studies, some statistically significant
relationships were found between organizational climate and job satisfaction.
Chappell’s survey instrument was developed from literature related to job satisfaction
and organizational climate. Survey instruments found in the original works of Barr (1988) and
Levy (1989) served as a basis for the design of the instrument Chappell used. Regarding validity
for survey instruments, Benson (1998) stated that numerous studies utilizing different
approaches, different samples, and different populations may be required to build a strong body
of evidence that supports or fails to support the validity of the scores derived from a test. Based
on these guidelines, Chappell’s survey instrument was appropriate for use in this study.
Chappell (1995) stated that the survey instrument was examined for validity, reliability,
and consistency by the Board of Directors of the National Council of Instructional
Administration. The supervising committee revised Chappell’s survey instrument and it was
subsequently field tested to ensure validity, reliability, and consistency. The validation process
involved asking nine community college professionals to complete Part I of the survey on two
different occasions. A range of responses was recorded from the answers for each of the
questions in Part I. Analysis of responses to each of 21 questions indicated the survey instrument
was valid and reliable. Eight subjects completed the entire field test. To confirm consistency,
answers from the pretest and posttest were compared (Chappell, 1995). A Pearson Product
Moment Correlation analysis confirmed the survey could elicit a variety of responses and that the

42 questions were clearly stated. Correlation coefficients for the field test ranged from 0.2336 to
0.9492 (Chappell, 1995).
To test the reliability of the survey instrument for this study, it was completed by five
department heads at the University of Florida Physical Plant. Based on this input, the question
about the collective bargaining status of the institution from part three of Chappell’s study was
eliminated from the survey instrument used in this study.
Seven factors about organizational climate, were addressed by the survey instrument. The
intent was to see how they related to eight job satisfaction variables. Definitions for the seven
organizational climate are shown below.
1. Internal Communication. The institution’s formal and informal communication processes and styles.
2. Organizational Structure. The institution’s administrative operation or its hierarchal lines of authority and requirements for operating within that hierarchy.
3. Political Climate. The nature and complexity of the institution’s internal politics or the degree to which an employee must operate within a political framework in order to accomplish a task.

43 4. Professional Development Opportunities. The opportunities for employees to pursue and participate in activities to enhance job performance.
5. Evaluation. The institution’s procedure for evaluation through positive feedback intended to provide professional growth for the employee.
6. Promotion. The institution’s commitment to interna l promotion and advancement within the organization.
7. Regard for Personal Concern. The institution’s sensitivity to and regard for the
personal concerns and well-being of the employee.
Eight job satisfaction factors were used in this study. The intent was to determine the
relationship between them and the seven factors of organizational climate. The job satisfaction
factors are listed and defined below.
1. Participation in Decision-Making. The institution’s process for decision making and opportunities for involvement by the employee to participate in that process.
2. Power. The amount or degree of jurisdiction or discretion that the employee is able to exercise while performing the tasks of his or her position.
3 - 5. Relationship with Colleagues. The quality of the affiliation that an employee maintains with peers, subordinates, and supervisor.
6 - 7. Salary and Benefits. The perceived equity and adequacy of the salary and benefit package received by the employee.
8. Professional Effectiveness. The perceived overall effectiveness of the employee in his or her position.
The survey instrument also included questions regarding the director of physical plant’s
overall satisfaction with his/her position and his/her overall satisfaction with the institution. Part
two of the survey instrument asked for demographic information. A final version of the survey
instrument can be found in Appendix A and the cover letter that preceded it is shown in
Appendix B.

44 Statistical Analysis
Step wise multiple regression analysis was used to determine the nature of the
relationship between measures of organizational climate and measures of job satisfaction as
reported by directors of physical plants. One-way analysis of variance was used to determine if
the means for job satisfaction within the context of organizational climate factors varied when
controlling for the demographic variables of ethnicity, gender, number of years at current
institution as director of physical plant, classification of the institution based on number of
students, and whether the institution was public or private. Reporting Procedure
Thirty-seven percent of the 602 surveys were returned. A profile of directors of physical
plants was developed by analyzing the data collected. The data were also used to determine the
director of physical plant’s perception of the organizational climate as well as their levels of
satisfaction with the institution’s climate. Furthermore, the data revealed how significant each of
the job satisfaction factors were and if there were any significant differences while controlling
for factors that could influence job satisfaction and organizational climate.
Summary
Job satisfaction and organizational climate have been topics of research for about seventy
years. The relationship between these variables had also been extensively investigated in a
variety of work environments though seldom considered in educational settings. No studies were
found which measured the constructs of job satisfaction and organizational climate relative to the
perspectives of directors of physical plants. Therefore, this study tested these constructs as
reported by directors of physical plants. Responses to questions regarding the relationship

45 between these two constructs, from the perspective of physical plant directors are reported and
analyzed in Chapter 4.

46
CHAPTER 4 PRESENTATION AND ANALYSIS OF THE DATA
The purpose of this study was to investigate the relationship between measures of
organizational climate and measures of job satisfaction as applied to directors of physical plants.
Furthermore, this study was conducted to determine if there were significant differences in the
means for job satisfaction within the context of organizational climate when controlling for
gender, ethnicity, classification of the institution by size and type, and number of years served as
a director of physical plant. Specifically, the research addressed five questions:
1. How do directors of physical plants perceive organizational climate at their respective institutions, using a set of seven identified factors for climate?
2. Using the same seven climate factors as an index, how satisfied are directors of physical plants with the organizational climate at their respective institutions?
3. How important is each of eight identified job satisfaction variables to directors of physical plants in the performance of their specific job responsibilities?
4. For each of eight job satisfaction variables, is there a significant relationship between measures of job satisfaction and a set of seven measures of satisfaction with organizational climate, as reported by directors of physical plants?
5. Is there a significant difference in the means of eight job satisfaction variables for directors of physical plants when compared by gender of the respondent, ethnic origin of the respondent, classification of the institution by size and type, and length of time served as a director of physical plant?

47
Survey Responses
A total of 602 survey instruments were electronically sent to directors of physical plants
that were 2001 members of the Association of Higher Education Facilities Officers. A total of
214 were returned, which provided a return rate of 37%.
Population Profile
Gender and Ethnicity
Tables 1 through 3 provide gender and ethnic distributions for directors of physical
plants. 210 of the 214 respondents completed the question about gender. Of these, 200 (93.5%)
were male and 10 (4.7) were female. One-hundred-ninety-seven directors of physical plants were
white which was 92.1% of the population. Blacks and Hispanics both represented less than 3%
of the total with 3 and 5 respondents (1.4% and 2.3%) respectively. The remaining 2.8% of the
respondents included all other ethnic groups. As shown in Table 3, only four gender/ethnic
combinations were significantly represented in the population.

48 Table 1 Directors of Physical Plants: Distribution by Gender ________________________________________________________________________ Gender n % ________________________________________________________________________ Male 200 93.5 Female 10 4.7 No response 4 1.9 Total 214 100.0 ________________________________________________________________________ Table 2 Directors of Physical Plants: Distribution by Ethnic Origin ________________________________________________________________________ Ethnic Origin n % ________________________________________________________________________ Black/African American 3 1.4 Hispanic 5 2.3 White/Caucasian 197 92.1 Asian American 4 1.9 All other 5 2.3 Total 214 100.0 ________________________________________________________________________

49 Table 3 Directors of Physical Plant: Distribution by Gender and Ethnic Origin ________________________________________________________________________ Gender & Ethnic Origin n % ________________________________________________________________________ White Male 183 85.6 White Female 10 4.7 Hispanic Male 5 2.3 Asian/American Male 4 1.8 Black/African American Male 3 1.4 All other 9 4.2 Total 214 100.0 ________________________________________________________________________ Type of Institution and Number of Students Table 4 provides information about the type of institutions and number of students at the institutions. Table 4 Directors of Physical Plants: Distribution by Type of Institution and Number of Students ________________________________________________________________________ Classification n % ________________________________________________________________________ public 139 65.0 private 75 35.0 ________________________________________________________________________ Number of Students ________________________________________________________________________ 0 - 999 13 6.1 1000 - 1999 25 11.7 2000 - 2999 22 10.3 3000 - 3999 18 8.4 4000 - 4999 13 6.1 5000 - 11999 44 20.6 12,000 - 19,999 47 22.0 20,000 and over 32 15.0 ________________________________________________________________________

50 Number of Years Served at Current Institution Table 5 shows the distribution of directors of physical plant according to the number of years served at their respective institutions. Table 5 Directors of Physical Plants: Distribution by Number of Years at Current Institution ________________________________________________________________________ Years experience n % ________________________________________________________________________ Less than 1 year 15 7.0 1-5 years 83 38.8 6-10 years 50 23.4 11-14 years 39 18.2 15 years or more 27 12.6 Total 214 100.0
________________________________________________________________________
Research Question 1
This research question asked how directors of physical plants perceived the
organizational climate at their institutions, using a set of seven organizational climate factors. In
this study, climate was defined as the conditions that affect job satisfaction and productivity.
The factors under consideration included (a) internal communication, (b) organizational
structure, (c) political climate, (d) professional development opportunities, (e) evaluation, (f)
promotion, and (g) regard for personal concerns. The organizational climate factors were coded
as follows:

51 IC = Perception of Internal Communication;
OS = Perception of Organizational Structure;
PLC = Perception of Political Climate;
PDO = Perception of Professional Development Opportunities;
EVAL = Perception of Evaluation;
PROMO = Perception of Promotion; and
RPC = Perception of Regard for Personal Concerns.
Directors of Physical Plants were asked to rate the degree to which the seven
organizational factors were present at their institution with five (5) indicating the highest level of
presence and one (1) indicating the lowest level of presence. Therefore, the rating of five was
interpreted as the very highest level of presence of the organizational climate factor in question.
A rating of four was understood to mean a high level of existence of the factor. A rating of three
indicated a moderately high level of existence. A rating of two indicated a low level of existence
of the organizational climate factor. A rating of one was understood to mean that a very low level
of the organizational climate factor was evident.
Tables 6 provides a composite of the perceptions that directors of physical plants had
regarding organizational climate at their institutions. The three organizational climate factors that
received the highest mean ratings, as shown in table 6, were regard for personal concerns (RPC),
professional development opportunities (PDO), and internal communication (IC). The mean
score for RPC was 4.26, with a large majority (n = 181 or 85%) of the directors of physical
plants rating RPC as either four or five. Nearly half of them (n = 106 or 49%) rated this aspect of
organizational climate as five, the highest possible rating. These data suggest that directors of
physical plants generally

52 believe that they worked in an environment that supported them and where a concern for their
personal matters was displayed.
The other organizational factors that received the highest ratings were professional
development opportunities (PDO) and internal communication (IC). These received mean scores
of 4.07 and 3.81 respectively. A total of 162 directors of physical plants (75.7%) assigned a
rating of four or five to PDO and a total of 149 respondent s (69.6%) rated internal
communication with a four or a five. These data indicated that, in general, directors of physical
plants worked in environments where they had sufficient opportunities for professional
development and open communication was the norm.
The perception of evaluation (EVAL) also received a relatively high mean rating (3.74).
Evaluation was defined as the degree to which the institution’s procedures for evaluating
employees was perceived as fair and supportive. Over half of the respondents (n = 133 or 62%)
felt that the procedures by which they were evaluated were fair and supportive. This important
because the evaluation process and how one is perceived has an impact on job satisfaction.
Perception of promotion (PROMO) received the lowest mean rating of all the perceptions
of organizational climate (3.30). This was noteworthy because it pointed out the perception that
directors of physical plants felt that they had few opportunities for upward mobility within their
organizations or ins titutions. Less than half (n = 100 or 47%) rated PROMO four or five,
indicating that they did not feel that they had much opportunity for advancement from their
present jobs.
Table 7 shows that internal communication had a positive correlation with organizational
structure, professional development opportunities, evaluation, promotional opportunities, and
regard for personal concerns. Internal communication had a negative correlation with political

53 climate. Political climate also had a negative correlation with professional development
opportunities, evaluation, promotional opportunities and regard for personal concern.
Professional development opportunities also had a positive correlation with evaluation,
promotional opportunities, and regard for persona l concern. Evaluation also had a positive
correlation with promotional opportunities and regard for personal concern.

54 Table 6 Directors’ of Physical Plants Perceptions of Organizational Climate: Frequency Distributions, Means, and Standard Deviations ________________________________________________________________________ Factor Ratings Mean SD Totals 5 4 3 2 1 ________________________________________________________________________ IC n 38 111 53 10 2 3.81 .81 214 % 17.8 51.9 24.8 4.7 .9 100 ________________________________________________________________________ OS n 41 97 56 16 4 3.72 .92 214 % 19.2 45.3 26.2 7.5 1.9 100 ________________________________________________________________________ PLC n 48 64 51 41 10 3.46 1.17 214 % 22.4 29.9 23.8 19.2 4.7 100 ________________________________________________________________________ PDO n 96 66 29 17 6 4.07 1.07 214 % 44.9 30.8 13.6 7.9 2.8 100 ________________________________________________________________________ EVAL n 63 70 51 21 9 3.74 1.11 214 % 29.4 32.7 23.8 9.8 4.2 100 ________________________________________________________________________ PROMO n 24 76 64 40 10 3.30 1.05 214 % 11.2 35.5 29.9 18.7 4.7 100 ________________________________________________________________________ RPC n 106 75 20 9 4 4.26 .93 214 % 49.5 35.0 9.3 4.2 1.9 100 ________________________________________________________________________ IC = Perception of Internal Communication OS = Perception of Organizational Structure PLC= Perception of Political Climate PDO = Perception of Professional Development Opportunities EVAL = Perception of Evaluation PROMO = Perceptions of Promotion RPC = Perception of Regard for Personal Concerns

55 Table 7 Directors’ of Physical Plants Perception of Organizational Climate: Correlation Table: ________________________________________________________________________ IC OS PLC PDO EVAL PROMO RPC ________________________________________________________________________ IC 1.00 0.22* -0.36* 0.26* 0.47* 0.38* 0.40* OS 0.22* 1.00 0.00 0.07 0.12 0.09 0.13 PLC -0.36* 0.00 1.00 -0.29* -0.31* -0.30* -0.43* PDO 0.26* 0.07 -0.29* 1.00 0.41* 0.41* 0.42* EVAL 0.47* 0.12 -0.31* 0.41* 1.00 0.54* 0.46* PROMO 0.38* 0.09 -0.30* 0.41* 0.54* 1.00 0.41* RPC 0.40* 0.13 -0.43* 0.42* 0.46* 0.41* 1.00 ________________________________________________________________________ * Correlation is significant at the .05 level. IC = Perception of Internal Communication OS = Perception of Organizational structure PLC = Perception of Political Climate PDO = Perception of Professional Development Opportunities EVAL = Perception of Evaluation PROMO = Perception of Promotion RPC = Regard for Personal Concerns

56 Research Question 2
The second research question examined directors’ of physical plants satisfaction with the
organizational climate at their institution. Analysis of this data provided a descriptive composite
of how satisfied directors of physical plants were with this part of the work environment. Coding
of the satisfaction ratings for the seven organizational climate factors used the same pattern as
for the ratings of perception, but with a numeral 2 added as follows:
IC2 = Satisfaction with Internal Communication;
OS2 = Satisfaction with Organizational Structure;
PLC2 = Satisfaction with Political Climate;
PDO2 = Satisfaction with Professional Development Opportunities;
EVAL2 = Satisfaction with Evaluation;
PROMO2 = Satisfaction with Promotion; and
RPC2 = Satisfaction with Regard for Personal Concerns
Directors of Physical Plants were asked to rate their level of satisfaction with the
organizational climate at their institution with five (5) indicating the highest level of satisfaction
with a particular factor and one (1) indicating the lowest level of satisfaction. A rating of four (4)
was understood to mean a high level of satisfaction. A rating of three (3) represented a moderate
level of satisfaction. A rating of two (2) was interpreted as a low level of satisfaction.
Satisfaction ratings for organizational climate are shown in Tables 8. As was the case
regarding perception of organizational climate by directors of physical plants, the highest ratings
for satisfaction of this same variable were (a) regard for personal concern (RPC2 / mean score
4.32), (b) professional development opportunities (PDO2 / mean score 3.99), and (c) internal
57 communication (IC2 / mean score 3.74). Satisfaction ratings for evaluation (EVAL2) and
organizational structure (OS2) were also fairly high, 3.64 and 3.60 respectively.
A total of 175 (81.7%) of the directors of physical plants indicated they were either
satisfied or highly satisfied with regard for personal concern (RPC2). Only 12 (5.6%) reported
that they were unsatisfied or very unsatisfied with RPC. These data are consistent with the 84.6%
of the respondents who reported perceptions of strong or very strong regard for personal concern
at their institutions. This indicates that directors of physical plants generally were satisfied with
the extent to which their institutions showed concern for their personal well-being.
A total of 152 respondents (71%) were either satisfied or highly satisfied with
professional development opportunities at their institution. These data were also consistent with
reported perceptions about the presence of profe ssional development opportunities, as discussed
in the analysis of research question 1. This meant that in general, directors of physical plants
were satisfied with the opportunities afforded them for professional development.
A total of 141 respondents (66%) indicated that they were very satisfied or satisfied with
internal communication (IC2). These data were also consistent with perceptions about internal
communication. In research question 1, 149 people (69.6%) indicated that they were very
satisfied or satisfied with their perception of internal communication at their institution. Only a
few people (23, 10.7%) indicated that they were not satisfied with internal communication at
their institution.
Directors of physical plants reported lower satisfaction with promotional opportunities
(PROMO, mean = 3.30). Although 100 people (46.7%) reported being satisfied or very satisfied
with promotional opportunities, almost a quarter of the respondents (n = 50, 23.3%) were

58 unsatisfied or very unsatisfied with promotional opportunities. This indicates that there is
considerable concern among directors of physical plants about the likelihood of promotional
opportunities.
Directors of physical plants were generally as satisfied with evaluation (EVAL2) as they
were with internal communication (IC2), as evidenced by a mean satisfaction rating of 3.74
compared to a mean rating of 3.81 for internal communication. Generally, it appeared that if
directors of physical plants perceived that the system for evaluation was fair and supportive, they
were satisfied with their evaluations. Since the mean rating for internal communication is nearly
the same as that of evaluation (3.74 and 3.81 respectively) internal communication may have
been a factor in the level of satisfaction with evaluation.
Pearson product moment correlation coefficients for satisfaction with organizational
climate scores are shown in Table 9. One correlation (.479) was between internal communication
(IC2) and organizational structure (OS2). This can be interpreted to mean that the organizational
structure contributed to internal communication or that internal communication enhanced the
organizational structure. A second correlation (.567) was between internal communication (IC2)
and evaluation (EVAL2). This can be interpreted to mean that clear communication inclined
respondents to feel more comfortable with the evaluation process. A third correlation (.535) was
between internal communication (IC2) and regard for personal concern (RPC2). This can be
interpreted to indicate that internal communication enhanced the feeling that people showed
concern for each other in the organizations surveyed. A fourth correlation (.453) was between
professional development opportunities (PDO2) and evaluation (EVAL2). This can be
interpreted to mean that ample opportunities for professional development were present and that
people utilized these opportunities which enhanced their evaluations. A fifth correlation (.539)

59 was between professional development opportunities (PDO2) and promotional opportunities
(PROMO2). This relationship indicates that when people took advantage of opportunities for
professional development their opportunities for advancement increased. A sixth correlation
(.512) was between regard for personal concern (RPC2) and professional development
opportunities (PDO2). This can be interpreted to indicate that regard for the welfare of others
inclined the institution to provide opportunities for professional development which would be
mutually beneficial to the employee and the institution.
Directors of physical plants were asked to rate their overall satisfaction with their college.
The mean score for overall satisfaction (OSWC) was 3.93 as shown in Table 10. Two hundred
and thirteen of the 214 directors of physical plants responded to this question. A total of 63
respondents (29.4%) rated themselves as highly satisfied and an additional 129 (60.3%) rated
themselves as satisfied with their college. These data reinforced the generally high ratings for
satisfaction with seven organizational climate factors that were reported via the survey
instrument. These data also suggested that the majority of directors of physical plants were
satisfied overall with their college.

60 Table 8 Directors’ of Physical Plants Satisfaction with Organizational Climate: Frequency Distributions, Means, and Standard Deviations ________________________________________________________________________ Factor Ratings Mean SD Totals ________________________________________________________________________ 5 4 3 2 1 ________________________________________________________________________ IC2 n 38 103 50 21 2 3.74 0.91 214 % 17.8 48.1 23.3 9.8 .9 100 ________________________________________________________________________ OS2 n 32 93 63 20 6 3.60 0.96 214 % 14.9 43.5 29.4 9.3 2.8 100 ________________________________________________________________________ PLC2 n 42 60 66 30 16 3.39 1.18 214 % 19.6 28 30.8 14 7.5 100 ________________________________________________________________________ PDO2 n 94 58 31 22 9 3.99 1.18 214 % 43.9 27.1 14.5 10.3 4.2 100 ________________________________________________________________________ EVAL2 n 60 62 49 31 10 3.64 1.19 214 % 28.0 29.0 22.8 14.5 4.7 100 ________________________________________________________________________ PROMO2 n 40 66 66 30 12 3.44 1.13 214 % 18.7 30.8 30.8 14.0 5.6 100 ________________________________________________________________________ RPC2 n 116 59 27 8 4 4.32 0.94 208 % 54.2 27.6 12.6 3.7 1.9 100 ________________________________________________________________________ IC2 = Satisfaction with Internal Communication OS2 = Satisfaction with Organizational Structure PLC2 = Satisfaction with Political Climate PDO2 = Satisfaction with Professional Development Opportunities EVAL2 = Satisfaction with Evaluation PROMO2 = Satisfaction with Promotion RPC2 = Satisfaction with Regard for Personal Concerns

61 Table 9
Directors’ of Physical Plants Satisfaction with Organizational Climate: Correlation Table
________________________________________________________________________
IC2 OS2 PLC2 PDO2 EVAL2 PROMO2 RPC2
________________________________________________________________________
IC2 1.00 0.47* 0.00 0.44* 0.56* 0.43* 0.53*
OS2 0.47* 1.00 0.10 0.27* 0. 39* 0.39* 0.42*
PLC2 -0.00 0.10 1.00 -0.10 -0.15* -0.08 0.00
PDO2 0.44* 0.27* -0.10 1.00 0.45* 0.53* 0.51*
EVAL 0.56* 0.39* -0.15* 0.45* 1.00 0.42* 0.41*
PROMO 0.43* 0.39* -0.08 0.53* 0.42* 1.00 0.53*
RPC2 0.53* 0.42* 0.00 0.51* 0.41* 0.53* 1.00
________________________________________________________________________
* Correlation is significant at the .05 level.
IC2 = Satisfaction with Internal Communication
OS2 = Satisfaction with Organizational Structure
PLC2 = Satisfaction with Political Climate
PDO2 = Satisfaction with Professional Development Opportunities
EVAL2 = Satisfaction with Evaluation
PROMO2 = Satisfaction with Promotion
RPC2 = Satisfaction with Regard for Personal Concerns

62 Table 10
Directors’ of Physical Plants Overall Satisfaction with Institution: Frequency Distribution and Mean Distribution
Frequency Distribution
________________________________________________________________________
Factor Ratings Total
________________________________________________________________________
5 4 3 2 1
________________________________________________________________________
OSWC
n 63 97 32 18 3 213
% 29.4 45.3 15.0 8.4 1.4 99.5
________________________________________________________________________
Mean Distribution
________________________________________________________________________
Factor N Mean SD
________________________________________________________________________
OSWC 213 3.930.82
________________________________________________________________________
OSWC = Overall Satisfaction with College

63 Research Question 3
The third research question examined how important eight job satisfaction variables were
to directors of physical plants in the performance of their jobs. The composite for the
significance of the eight job satisfaction variables is provided in Tables 11 through 13.
The eight job satisfaction variables used in this study were (a) participation in decision
making, (b) autonomy, power, control, (c) relationship with peers, (d) relationship with
subordinates, (e) relationship with superior, (f) salary, (g) benefits, and (h) professional
effectiveness. They were coded as follows:
DM = Importance of Participation in Decision Making;
APC = Importance of Autonomy, Power, Control;
RWP = Importance of Relationship with Peers;
RWSub = Importance of Relationship with Subordinates;
RWSup = Importance of Relationship with Supervisor;
SAL = Importance of Salary;
BENE = Importance of Benefits; and
PE = Importance of Professional Effectiveness
Each director of physical plant was asked to rate each factor for job satisfaction on a scale
of one to five, with five as the maximum response and one as the minimum response. A rating of
five was interpreted to signify very important. A rating of four was interpreted to signify
important. A rating of three was interpreted to signify moderately
important. A rating of two was interpreted to signify unimportant. A rating of one was
interpreted to signify very unimportant. These ratings are recorded in Table 11.
A close examination of Tables 11 and 12 reveals that all eight job satisfaction variables
were important to directors of physical plants. Five variables were especially important to the

64 respondents as evidenced by mean scores above four. In descending order these were
relationship with subordinates (RWSub, mean = 4.49), relationship with supervisor (RWSup,
mean = 4.42), relationship with peers (RWP, mean = 4.40), professional effectiveness (PE, mean
= 4.36), and benefits (BENE, mean = 4.14). These data are consistent with the literature in that
they pointed out the importance of building strong relationships in the work environment in order
to accomplish organizational objectives in a professional manner.
Relationship with subordinates (RWSub) was the most important factor to directors of
physical plants as evidenced by the fact that 96.7% of the respondents rated this factor as either
important or very important. None of them rated it as unimportant. This pointed out the
importance of establishing and nurturing caring work environments that support employees of
institutional organizations. Relationship with supervisor (RWSup) was the second most
important factor for the respondents. This was verified by the fact that 88.8% of them rated it as
important or very important. This underscored the significance of establishing relationships with
higher level administration within a college environment. The third most important variable,
based on mean, was relationship with peers (RWP). However, it was rated as important or very
important by a higher percentage (93.0) than the second most important variable, relationship
with supervisor (RWSup, 88.8%). High concern for this factor confirms the critical importance
of establishing good relationships with peers that strengthen teams and extend networking
opportunities. None of the respondents rated this factor as unimportant. The fourth most
important variable, based on mean, was professional effectiveness (PE). This factor was rated as
important or very important by 93.5% of the directors of physical plants. The critical importance
of leadership that could achieve high quality products and service was verified by these data.

65 Benefits (BENE) was the fifth most important factor since 83.2% of the respondents rated it
important or very important. This pointed out the fact that a comprehensive benefits package was
highly valued by directors of physical plant directors and viewed as an important component of
compensation. An interesting fact was that salary (SAL) was not as highly ranked as benefits
(BENE). The mean for salary was lower ( 3.97) and a lower percentage of respondents (78.5)
considered it important or very important.
The two factors rated lowest by mean were autonomy, power and control (APC, mean =
3.78) and decision making (DM, mean = 3.73). Respectively, only 64.5% and 69.6 % of the
directors of physical plants considered these factors important or very important. These data
confirmed that there was less concern about being autonomous and less interest in making
decisions unilaterally. Both of these characteristics about the growing trend of collaboration were
consistent with the review of literature.
Pearson product moment correlation coefficients for the job satisfaction variables are
shown in Table 12. The strongest relationship was found between benefits (BENE) and salary
(SAL) with a correlation coefficient of 0. 74. This was not surprising because salary and benefits
were often regarded as the primary components of compensation for work (Hoppock, 1977). The
second strongest relationship was between autonomy, power, and control (APC) and decision
making (DM). This high correlation coefficient (0.54) pointed out the importance of having the
administrative latitude to manage human resources and facilities with a minimum of interference.
The third strongest relationship was between relationship with supervisor (RWSup) and
autonomy, power, and control (APC). This correlation coefficient (0.45) revealed the importance
of having the autonomy and power to make decisions that will be supported and pass the test of
scrutiny by others, the supervisor in particular. Another significant relationship was between

66 relationship with subordinates (RWSub) and relationship with peers (RWP). This correlation
coefficient was 0.43 and pointed out the fact that it was important to have healthy relationships at
all organizational levels. The last strong relationship was between relationship with supervisor
(RWSup) and relationship with peers (RWP). This correlation coefficient was 0.42 and further
verified the importance of having healthy relationships with others throughout an organization.
These associations were not surprising considering the amount of interaction that was implied by
the generally high ranking of internal communication.
The mean score for overall satisfaction with position (OSWP) was 4.13 as shown in
Table 13. This table also shows the frequency and mean distributions for OSWP. A total of 172
respondents (80.4%) rated themselves as satisfied or very satisfied with their position. Directors
of physical plants placed a high value on all job satisfaction variables, generally provided high
ratings for satisfaction with the seven organizational climate factors, and indicated overall
satisfaction with college (OSWC). These data therefore suggest that a relationship between
measures of organizational climate and measures of job satisfaction did exist for directors of
physical plants.

67 Table 11 Importance of Job Satisfaction Variables to Directors of Physical Plants: Frequency Distributions, Means, and Standard Deviations ________________________________________________________________________ Variable Ratings Mean SD Totals 5 4 3 2 1 ________________________________________________________________________ DM n 47 91 55 22 3 3.73 .96 214 % 22.0 42.5 23.8 10.3 1.4 100 ________________________________________________________________________ APC n 45 104 38 21 4 3.78 .96 212 % 21.0 48.6 17.8 9.8 1.9 100 ________________________________________________________________________ RWP n 104 95 11 4 0 4.40 .68 214 % 48.6 44.4 5.1 1.9 0 100 ________________________________________________________________________ RWSub n 112 95 6 1 0 4.49 .58 214 % 52.3 44.4 2.8 .5 0 100 ________________________________________________________________________ RWSup n 120 70 19 1 3 4.42 .79 213 % 56.1 32.7 8.9 .5 1.4 100 ________________________________________________________________________ SAL n 54 114 32 11 2 3.79 .84 213 % 25.2 53.3 15.0 5.1 .9 100 ________________________________________________________________________ BENE n 73 105 27 7 1 4.14 .79 213 % 34.1 49.1 12.6 3.3 .5 100 ________________________________________________________________________ PE n 98 102 9 4 1 4.36 .70 214 % 45.8 47.7 4.2 1.9 .5 100 ________________________________________________________________________ DM = Importance of Participation in Decision-Making APC = Importance of Autonomy, Power, Control RWP = Importance of Relationship with Peers RWSub = Importance of Relationship with Subordinates RWSup = Importance of Relationship with Supervisor SAL = Importance of Salary BENE = Importance of Benefits PE = Importance of Professional Effectiveness

68 Table 12
Importance of Job Satisfaction Variables to Directors of Physical Plants: Correlation Table ________________________________________________________________________
DM APC RWP RWSub RWSup SAL BENE PE
________________________________________________________________________
DM 1.00 0.54* 0.19* 0.08 0.27* 0.13* 0.07 0.32*
APC 0.54* 1.00 0.27* 0.02 0.45* 0.26* 0.17* 0.29*
RWP 0.19* 0. 27* 1.00 0.43* 0.42* 0.30* 0.31* 0.34*
RWSub 0.08 0.02 0.43* 1.00 0.28* 0.13 0.17* 0.33*
RWSup 0.27* 0.45* 0.42* 0.28* 1.00 .00 0.05 0.29*
SAL 0.13* 0.26* 0.30* 0.13 0.00 1.00 0.74* 0.28*
BENE 0.07 0.17* 0.31* 0.17* 0.05 0.74* 1.00 0.30*
PE 0.32* 0.29* 0.34* 0.34* 0.33* 0.28* 0.30* 1.00
________________________________________________________________________
* Correlation is significant at the 0.05 level.
DM = Importance of Participation in Decision-Making
APC = Importance of Autonomy, Power, Control
RWP = Importance of Relationship with Peers
RWSub = Importance of Relationship with Subordinates
RWSup = Importance of Relationship with Supervisor
SAL = Importance of Salary
BENE = Importance of Benefits
PE = Importance of Professional Effectiveness

69 Table 13 Directors’ of Physical Plants Overall Satisfaction with Position: Frequency Distribution and Mean Distribution
Frequency Distribution ________________________________________________________________________ Variable Ratings Totals ________________________________________________________________________ 5 4 3 2 1 ________________________________________________________________________ OSWP n 76 96 25 9 2 208 % 35.5 44.9 11.7 4.2 .9 100 ________________________________________________________________________
Mean Distribution ________________________________________________________________________ Variable N Mean SD ________________________________________________________________________ OSWP 208 4.13 .86 ________________________________________________________________________ OSWP = Overall Satisfaction with Position
Research Question 4
The fourth research question examined the relationship between measures of job
satisfaction and measures of satisfaction with seven organizational climate factors as reported by
directors of physical plants. Table 14 shows the correlation coefficients for the job satisfaction
variables (DM, APC, RWP, RWSub, RWSup, SAL, BENE, and PE) as well as the satisfaction
ratings for organizational climate (IC2, OS2, PLC2, PDO2, EVAL2, PROMO2, and RPC2). It is
noteworthy to mention that all significant relationships were positive except those with political
climate, which were all negative.

70 Table 14 The Relationship Between Measures of Job Satisfaction and Measures of Organizational Climate: Correlation Table ________________________________________________________________________
DM APC RWP RWSub RWSup SAL BENE PE ______________________________________________________________________________ IC2 0.34* 0.36* 0.30* 0.15* 0.29* 0.15* 0.19* 0.36* OS2 0.13* 0.19* 0.22* 0.12 0. 18* 0.08 0.03 0.29* PLC2 -0.20* -0.20* 0.03 0.00 -0.15* -0.09 -0.10 0.01 PDO2 0.23* 0.18* 0.35* 0.13 0.20* 0.15 0.17* 0.25* EVAL2 0.43* 0.52* 0.23* 0.02 0.49* 0.11 0.12 0.37* PROMO2 0.10 0.18* 0.43* 0.18* 0.25* 0.32* 0.31* 0.32* RPC2 0.23* 0.27* 0.45* 0.11 0.27* 0.17* 0.16* 0.40* _____________________________________________________________________________ * Correlation is Significant at the 0.05 level. DM = Importance of Participation in Decision-Making APC = Importance of Autonomy, Power, Control RWP = Importance of Relationship with Peers RWSub = Importance of Relationship with Subordinates RWSup = Importance of Relationship with Supervisor SAL = Importance of Salary BENE = Importance of Benefits PE = Importance of Professional Effectiveness IC2 = Satisfaction with Internal Communication OS2 = Satisfaction with Organizational Structure PLC2 = Satisfaction with Political Climate PDO2 = Satisfaction with Professional Development Opportunities EVAL2 = Satisfaction with Evaluation PROMO2 = Satisfaction with Promotion RPC2 = Satisfaction with Regard for Personal Concerns

71 Decision Making
Table 14 indicates that a significant relationship existed between participation in decision
making (DM) and six of the seven organizational climate factors: internal communication (IC2),
organizational structure (OS2), political climate (PLC2), professional development opportunities
(PDO2), evaluation (EVAL2), and regard for personal concern (RPC2). Step wise multiple
regression was utilized to determine which of the seven organizational climate factors had the
greatest impact on decision-making. The results shown in Table 15 indicate that evaluation
(EVAL2) had the greatest impact on decision making. Step wise multiple regression found that
none of the other organizational climate factors were significant. These data suggested that when
a director of physical plant felt that the evaluation process was fair and accurate, the ability to
make decisions was enhanced.
Table 15 Step Wise Multiple Regression for Decision-Making and Seven Organizational Climate Factors ________________________________________________________________________ Step Factor Significance R² ________________________________________________________________________ 1 Evaluation .00 .19 2 Political Climate .06 .12 3 Internal Communication .07 .13 4 Promotional Opportunities .16 .09 5 Regard for Personal Concerns .34 .06 6 Professional Development Opportunities .47 .05 7 Organizational Structure .61 .03 ________________________________________________________________________

72 Autonomy, Power, and Control
Table 14 indicates that a significant relationship existed between autonomy, power, and
control (APC) and all seven organizational climate factors. All of these relationships were
positive except the one with political climate (PLC2). Step wise multiple regression was used to
determine which organizational climate factor had the greatest impact on autonomy, power, and
control. The results shown in Table 16 indicate that evaluation (EVAL2) had the greatest impact
on autonomy, power, and control. Step wise multiple regression found that none of the other
organizational climate factors were significant. These data suggest that when directors of
physical plants felt the evaluation process was fair and accurate, their feelings of autonomy,
power, and control in their job environments were enhanced.
Table 16
Step Wise Multiple Regression for Autonomy, Power, and Control and Seven Organizational Climate Factors ________________________________________________________________________ Step Factor Significance R² ________________________________________________________________________ 1 Evaluation .00 .27 2 Political Climate .05 .11 3 Internal Communication .11 .11 4 Professional Development Opportunities .31 .06 5 Regard for Personal Concerns .33 .06 6 Promotional Opportunities .66 .02 7 Organizational Structure .78 .27 ________________________________________________________________________

73 Relationship with Peers
Table 14 indicates that a significant relationship existed between relationship with peers
(RWP) and all seven of the organizational climate factors except political climate (PCL). Step
wise multiple regression was used to determine which organizational climate factor had the
greatest impact on relationship with peers. The results shown in Table 17 indicate that
promotional opportunities (PROMO2) and regard for personal concerns (RPC) were significant.
These data suggest that relationship with peers was enhanced when there was a high regard for
the personal concern of others and when adequate promotional opportunities were available.
Table 17
Step Wise Multiple Regression for Relationship with Peers and Seven Organizational Climate Factors ________________________________________________________________________ Step Factor Significance R² ________________________________________________________________________ 1 Promotional Opportunities .00 .18 2 Regard for Personal Concerns .00 .23 3 Political Climate .38 .05 4 Professional Development Opportunities .55 .04 5 Internal Communication .58 .04 6 Organizational Structure .82 .01 7 Evaluation .91 .00 ________________________________________________________________________ Relationship with Subordinates
Table 14 indicates that there was a relationship between relationship with subordinates
(RWSub) and two organizational climate factors: internal communication (IC2) and promotional
opportunities (PROMO2). Step wise multiple regression was used to determine which
organizational climate factor had the greatest impact on relationship with subordinates. The
results shown in Table 18 indicate that promotional opportunities (PROMO2) was significant.
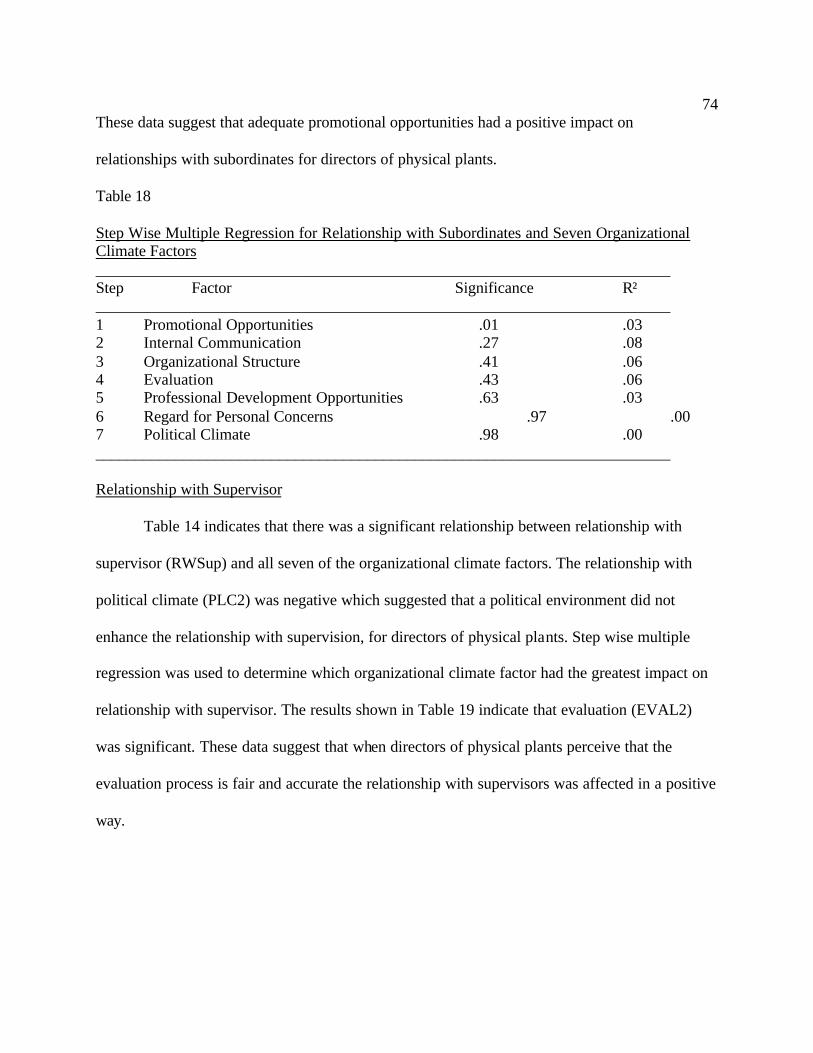
74 These data suggest that adequate promotional opportunities had a positive impact on
relationships with subordinates for directors of physical plants.
Table 18
Step Wise Multiple Regression for Relationship with Subordinates and Seven Organizational Climate Factors ________________________________________________________________________ Step Factor Significance R² ________________________________________________________________________ 1 Promotional Opportunities .01 .03 2 Internal Communication .27 .08 3 Organizational Structure .41 .06 4 Evaluation .43 .06 5 Professional Development Opportunities .63 .03 6 Regard for Personal Concerns .97 .00 7 Political Climate .98 .00 ________________________________________________________________________ Relationship with Supervisor
Table 14 indicates that there was a significant relationship between relationship with
supervisor (RWSup) and all seven of the organizational climate factors. The relationship with
political climate (PLC2) was negative which suggested that a political environment did not
enhance the relationship with supervision, for directors of physical plants. Step wise multiple
regression was used to determine which organizational climate factor had the greatest impact on
relationship with supervisor. The results shown in Table 19 indicate that evaluation (EVAL2)
was significant. These data suggest that when directors of physical plants perceive that the
evaluation process is fair and accurate the relationship with supervisors was affected in a positive
way.

75 Table 19
Step Wise Multiple Regression for Relationship with Supervisor and Seven Organizational Climate Factors ________________________________________________________________________ Step Factor Significance R² ________________________________________________________________________ 1 Evaluation .00 .23 2 Political Climate .21 .07 3 Regard for Personal Concerns .37 .06 4 Promotional Opportunities .46 .05 5 Professional Development Opportunities .73 .02 6 Organizational Structure .74 .02 7 Internal Communication .88 .01 ________________________________________________________________________ Salary
There was a significant relationship between the importance of salary (SAL) and internal
communication (IC2), professional development opportunities (PDO2), promotional
opportunities (PROMO2), and regard for personal concern (RPC2). These data are shown in
Table 14. Step wise multiple regression was used to determine which organizational climate
factor had the greatest impact on salary. The results shown in Table 20 indicate that promotional
opportunities (PROMO2) was significant. These data indicate that the presence of promotional
opportunities tended to have a positive effect on salaries for directors of physical plants.
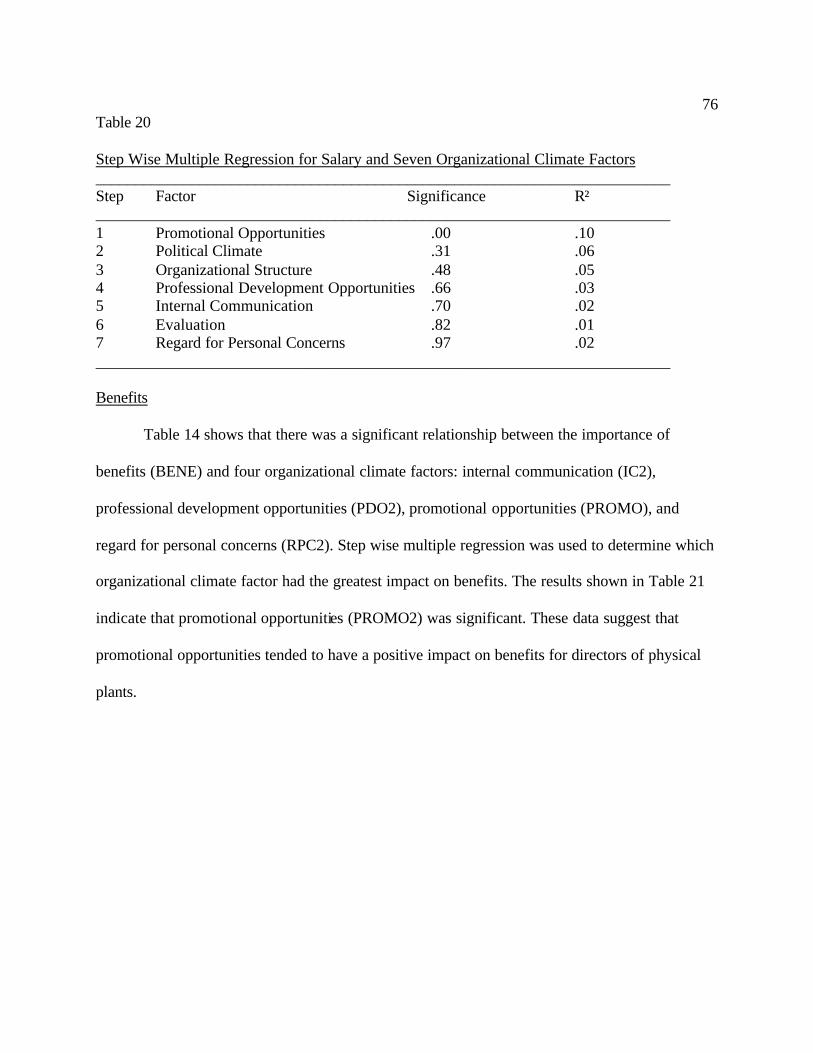
76 Table 20
Step Wise Multiple Regression for Salary and Seven Organizational Climate Factors ________________________________________________________________________ Step Factor Significance R² ________________________________________________________________________ 1 Promotional Opportunities .00 .10 2 Political Climate .31 .06 3 Organizational Structure .48 .05 4 Professional Development Opportunities .66 .03 5 Internal Communication .70 .02 6 Evaluation .82 .01 7 Regard for Personal Concerns .97 .02 ________________________________________________________________________
Benefits
Table 14 shows that there was a significant relationship between the importance of
benefits (BENE) and four organizational climate factors: internal communication (IC2),
professional development opportunities (PDO2), promotional opportunities (PROMO), and
regard for personal concerns (RPC2). Step wise multiple regression was used to determine which
organizational climate factor had the greatest impact on benefits. The results shown in Table 21
indicate that promotional opportunities (PROMO2) was significant. These data suggest that
promotional opportunities tended to have a positive impact on benefits for directors of physical
plants.

77 Table 21
Step Wise Multiple Regression for Benefits and Seven Organizational Climate Factors ________________________________________________________________________ Step Factor Significance R² ________________________________________________________________________ 1 Promotional Opportunities .00 .10 2 Organizational Structure .12 .11 3 Political Climate .25 .07 4 Internal Communication .29 .07 5 Regard for Personal Concerns .85 .01 6 Evaluation .92 .00 7 Professional Development Opportunities .97 .00 ________________________________________________________________________
Professional Effectiveness
There was a significant relationship between professional effectiveness (PE) and six
organizational factors as shown in Table 14: internal communication (IC2), organizational
structure (OS2), professional development opportunities (PDO2), evaluation (EVAL),
promotional opportunities (PROMO2), and regard for personal concerns (RPC2). Step wise
multiple regression was used to determine which organizational climate factor had the greatest
impact on professional effectiveness. The results shown in Table 22 indicate that regard for
personal concern (RPC2) and evaluation (EVAL2) were significant. These data suggested that
for directors of physical plants professional effectiveness was enhanced when the evaluation
process was considered fair and accurate as well as when regard for personal concerns was
displayed in the work environment.

78 Table 22
Step Wise Multiple Regression for Professional Effectiveness and Seven Organizational Climate Factors ________________________________________________________________________ Step Factor Significance R² ________________________________________________________________________ 1 Regard for Personal Concerns .00 .13 2 Evaluation .00 .19 3 Organizational Structure .11 .11 4 Promotional Opportunities .12 .12 5 Internal Communication .57 .04 6 Political Climate .60 .03 7 Professional Development Opportunities .77 .02 ________________________________________________________________________
Research Question 5
This question asked if there was a significant difference in the means of eight job
satisfaction variables for directors of physical plants when compared by gender of the
respondent, ethnic origin of the respondent, classification of the institution by size of student
body, whether the institution was public or private, and length of time served at present
institution as director of physical plant. A total of 200 respondents out of 214 (93.45%) were
males and 197 out of 214 (92%) were white. It was concluded that analysis of this distribution
could not provide statistically significant results. Therefore, ethnic origin of the respondent and
gender of the respondent were not used in the one-way analysis of variance to test for significant
differences in the means of the eight job satisfaction variables.
Decision-Making
A one-way analysis of variance was used to determine if there were statistically
significant differences in the means for size of institutions with regard to decision making. A
significance level of .05 indicated that no significant differences were found. A one-way analysis
of variance was also used to determine if there were statistically significant differences in the

79 means for number of years served at present institution as director of physical plant with regard
to decision making. A significance level of .37 indicated that no significant differences were
found. A one-way analysis of variance was also used to determine if there were statistically
significant differences in the means for public or private institutions with regard to decision
making. A significance level of .17 indicated that no significant differences were found.
Autonomy, Power, and Control
A one-way analysis of variance was used to determine if there were statis tically
significant differences in the means for size of institution with regard to autonomy, power, and
control. Table 23 shows that significance level of .03 indicated there were statistically
significant differences. The Tukey HSD was used as a follow up procedure to determine which
sizes of institutions had a statistically significant difference with regard to autonomy, power, and
control. The follow up procedure found that institutions that had a student enrollment of 20,000
and over were significantly different than those which had an enrollment of 12,000-19,000. Since
the mean was higher for this group, this indicated that directors of physical plants felt a higher
degree of autonomy, power, and control than those at the smaller institutions.

80 Table 23
Analysis of Variance for Autonomy, Power, and Control and Size of Institution ________________________________________________________________________ Sum of Mean Source Squares df Square F Sig. Class 13.44 7 1.92 2.18 .03* Error 179.139 204 .87 * significant at % = .05 A one-way analysis of variance was also used to determine if there were statistically
significant differences in the means for years of experience as director of physical plant with
regard to autonomy, power, and control. A significance level of .31 indicated that there were no
significant differences. This same procedure was used to determine if there were statistically
significant differences in the means for type of institution, whether public or private, with regard
to autonomy, power, and control. A significance level of .71 indicated that there were no
significant differences.
Relationship with Peers
A one-way analysis of variance was used to determine if there were statistically
significant differences in the means for size of institution with regard to relationship with peers.
Table 24 shows that a significance level of .04 indicated there were statistically significant
differences. The Tukey HSD was utilized as a follow up procedure to determine which sizes of
institutions had a statistically significant difference in means with regard to relationship with
peers. The follow up procedure found that institutions that had an enrollment of 20,000 and over
had a significant difference in means than those with an enrollment of 0-999. Since the larger
institutions had a higher mean, this indicated that directors of physical plants at the larger
institutions had a higher opinion of their relationship with peers than those at smaller institutions.

81 Table 24
Analysis of Variance for Relationship with Peers and Size of Institution ________________________________________________________________________ Sum of Mean Source Squares df Square F Sig. Class 6.37 7 .91 2.06 .04* Error 90.86 206 .44 * significant at % = .05 A one-way analysis of variance was also used to determine if there were statistically
significant differences in means for years of experience as a director of physical plant with
regard to relationship with peers. A significance level of .55 ind icated that there were no
significant differences. This same procedure was used to determine if there were statistically
significant differences in means for type of institution, public or private, with regard to
relationship with supervisors. A significance level of .49 indicated that no significant differences
were found.
Relationship with Subordinates
A one-way one way analysis of variance was used to determine if there were statistically
significant differences in means for size of institution with regard to relationship with
subordinates. A significance level of .42 indicated that no significant differences were found.
This same procedure was used to determine if there were statistically significant differences in
means for years of experience as director of physical plant with regard to relationship with
subordinates. A significance level of .58 indicated that no significant differences were found. A
one-way ANOVA was also used to determine if there were statistically significant differences in
means for type of institution, public or private, with regard to relationship with subordinates. A
significance level of .15 indicated that no significant differences were found.

82 Relationship with Supervisor
A one-way analysis of variance was used to determine if there were statistically
significant differences in means for size of institution with regard to relationship with supervisor.
Table 25 shows a significance level of .00 which indicated that there were statistically significant
differences. A Tukey HD was used as a follow up procedure to determine which institutions had
statistically significant differences in means. This procedure found that institutions with
enrollments 1000-1999 were significantly different than those with enrollments 0-999. Since the
larger institutions had a higher mean, this indicated that directors of physical plants at these
institutions had significantly better relationship with supervisors.
Table 25 Analysis of Variance for Relationship with Supervisors and Size of Institution _______________________________________________________________________ Source Squares df Square F Sig. Class 12.55 7 1.79 3.07 .00* Error 119.41 205 .58 * significant at % = .05 A one-way analysis of variance was also used to determine if there were statistically
significant differences in means for years of experience as a director of physical plant with
regard to relationship with peers. A significance level of .75 indicated that no significant
differences were found. This same procedure was used to determine if there were statistically
significant differences in means for type of institution, public or private, with regard to
relationship with supervisor. A significance level of .49 indicated that no significant differences
were found.
Salary
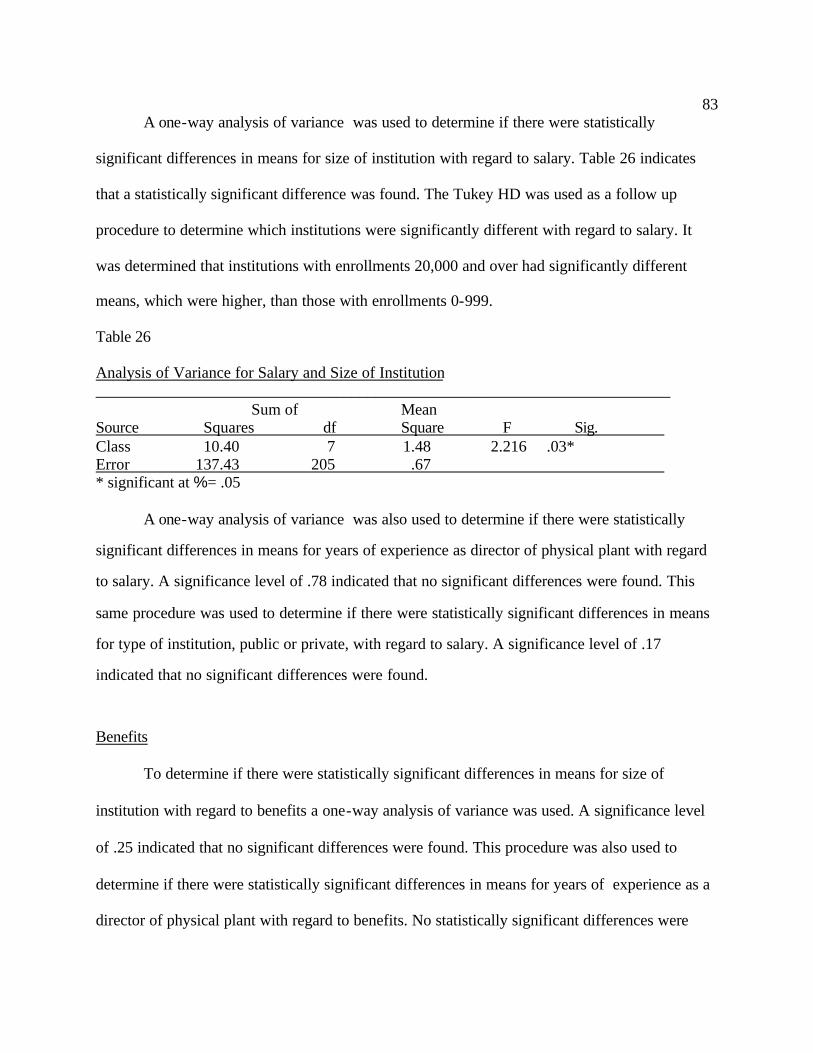
83 A one-way analysis of variance was used to determine if there were statistically
significant differences in means for size of institution with regard to salary. Table 26 indicates
that a statistically significant difference was found. The Tukey HD was used as a follow up
procedure to determine which institutions were significantly different with regard to salary. It
was determined that institutions with enrollments 20,000 and over had significantly different
means, which were higher, than those with enrollments 0-999.
Table 26
Analysis of Variance for Salary and Size of Institution ________________________________________________________________________
Sum of Mean Source Squares df Square F Sig. Class 10.40 7 1.48 2.216 .03* Error 137.43 205 .67 * significant at % = .05
A one-way analysis of variance was also used to determine if there were statistically
significant differences in means for years of experience as director of physical plant with regard
to salary. A significance level of .78 indicated that no significant differences were found. This
same procedure was used to determine if there were statistically significant differences in means
for type of institution, public or private, with regard to salary. A significance level of .17
indicated that no significant differences were found.
Benefits
To determine if there were statistically significant differences in means for size of
institution with regard to benefits a one-way analysis of variance was used. A significance level
of .25 indicated that no significant differences were found. This procedure was also used to
determine if there were statistically significant differences in means for years of experience as a
director of physical plant with regard to benefits. No statistically significant differences were

84 found. This procedure was also utilized to determine if there were statistically significant
differences in mean for type of institution, public or private, with regard to benefits. No
statistically significant differences were found.
Professional Effectiveness
A one-way analysis of variance was used to determine if there were statistically
significant differences in means for size of institution with regard to professional effectiveness.
A significance level of .79 indicated that none were found. This procedure was also used to
determine if there were statistically significant differences in means for experience as director of
physical plant with regard to professional effectiveness. None were found. Likewise no
statistically significant differences in means were found for type of institution, public or private,
with regard to professional effectiveness when this same procedure was used.
Summary
Six hundred and two survey instruments were electronically sent to directors of physical
plants who were members of the Association of Higher Education Facilities Officers in the year
2001. A total of 214 were returned, rendering a 37% rate of return. The data provided a profile of
directors of physical plants and composites of their perceptions about organizational climate,
their satisfaction with organizational climate, and how important they found eight job
satisfaction variables to be in the performance of their jobs.
Significant relationships were found between the seven organizational climate factors and
the eight job satisfaction variables, as they relate to directors of physical plants, research question
4, and are shown in Table 12. To determine which organizational climate factors had the most
significant impact on each of the job satisfaction variables, step wise multiple regression was
used. Evaluation had the greatest impact on decision making, autonomy, power, and control,

85 relationship with supervisor, and professional effectiveness. Promotional opportunities had the
greatest impact on relationship with peers, relationship with subordinates, salary, and benefits.
Relationship with peers and professional effectiveness were also impacted by regard for personal
concerns.
One-way analysis of variance was used to determine if there were statistically significant
differences in means for each job satisfaction variable in regard to size of the institution, years of
experience as director of physical plant, and type of institution which was either public or
private. Statistically significant differences were found in the means for autonomy, power, and
control and the size of the institution. Statistically significant differences were also found in the
means for relationship with peers and the size of the institution. Statistically significant
differences in means were also found in relationship with supervisor and size of the institution.
Chapter 5 includes an analysis of this data, conclusions that can be drawn from it, and a
recommendation for future research.

86
CHAPTER 5 CONCLUSIONS AND RECOMMENDATIONS
The purpose of this study was to investigate the relationship between measures of
organizational climate and measures of job satisfaction as applied to directors of physical plants.
Another intent was to determine if there were significant differences in means for job satisfaction
within the context of organizational climate when controlling for gender, ethnicity, classification
of the institution by size and type, and number of years in present position. Specifically, the
research addressed five questions.
1. How do directors of physical plants perceive organizational climate at their respective institution using a set of seven factors for climate?
2. Using the same seven climate factors as an index, how satisfied are directors of physical plants with the organizational climate at their respective institution?
3. How important is each of eight job satisfaction variables to directors of physical plants in the performance of their jobs?
4. For each of eight job satisfaction variables, is there a significant relationship between measures of job satisfaction and a set of seven measures of satisfaction with organizational climate, as reported by directors of physical plants?
5. Is there a significant difference in the means of eight job satisfaction variables
for directors of physical plants when compared by gender of the respondent,
ethnic origin of the respondent, classification of the institution by size and type,
and length of time served in present position.

87 Conclusions
Profile of the Director of Physical Plant
For the purpose of this study, the director of physical plant was defined as the chief
facilities officer at an institution. The average director of physical plant was a white male.
However, every ethnic/gender combination was represented. The average respondent had been in
his/her present job 5.21 years. Most directors of physical plants (139 out of 214, 65%) served at
public institutions. Almost half of the respondents (42.6) worked at institutions which had 5000-
19,999 students.
Directors’ of Physical Plants Perception of Organizational Climate
Those who responded to the survey instrument revealed the presence of all
organizational climate factors at their respective institution. These were internal communication,
organizational structure, political climate, professional development opportunities, evaluation,
promotion, and regard for personal concerns. Three of these factors: regard for personal concerns
(RPC), professional development opportunities (PDO), and internal communication (IC)
received the highest mean score ratings. These data indicated that directors of physical plants
believed they worked in environments where concern was shown for people, opportunities for
further training existed, and internal communication was effective.
Directors’ of Physical Plants Satisfaction with Organizational Climate
The three highest satisfaction ratings regarding the organizational climate factors, as
shown in Table 8, were regard for personal concerns (RPC), professional development
opportunities (PDO), and internal communication (IC). Over 80% of all directors of physical

88 plants were satisfied with their positions on campus and almost 75% were satisfied with the
overall operation of their college.
Directors’ of physical plants satisfaction with regard for personal concerns was consistent
with their perceptions about it. The overall perception of and satisfaction with regard for
personal concerns were both above 80%. Similarly, the perception about professional
development opportunities and satisfaction with them were consistent with each other. Most of
the respondents (84.5%) perceived that there were ample opportunities for further training at
their institution and 81.8% were satisfied with these opportunities.
The mean scores revealed that the lowest level of satisfaction was with political climate.
The data revealed that about half of the respondents (47.6%) were satisfied with the political
climate while 52.4% were moderately satisfied or unsatisfied with the political climate on
campus.
The findings about satisfaction with organizational climate and how it was related to job
satisfaction supported the review of literature, in particular: Argyris (1964), Beck (1990), Bennis
(1966), and Golembiewski (1962).
Importance of Job Satisfaction
As evidenced by the frequency distribution ratings, all eight job satisfaction variables
used in this study were important to directors of physical plants. Most important to them were
relationship with subordinates (RWSub), relationship with superior (RWSup), relationship with
peers (RWP), professional effectiveness (PE), and benefits (BENE). Salary (SAL), autonomy,
power, and control (APC), and decision making (DM) were less important to the respondents.
These findings indicate that good relationships with others in the work setting were most
important to directors of physical plants. These findings supported the research of Jenkins (1999)

89 and Medlin (1999) who stated that good relationships were the most important ingredient for
success for managers of facilities. The fact that autonomy, power, and control as well as decision
making were less important to directors of physical plants pointed out the significance of
collaboration in the process of successful leadership. These findings supported the research of
Beck (1990), Benfari (1995), and Bolman (1984).
The Relationship between Measures of Organizational Climate and Measures of Job Satisfaction Table 14 in Chapter 4 shows the many significant relationships found between
organizational climate factors and job satisfaction variables. Step wise multiple regression was
utilized to determine which organizational climate factor had the greatest impact on each of the
eight job satisfaction variables. Evaluation had the greatest affect on decision making, autonomy,
power, and control, relationship with supervisor, and professional effectiveness. These findings
reinforced the research of Argyris (1976), Gruneberg (1979), and Berry (1999) which pointed
out importance of people knowing how well they are performing in their job environment.
Promotional opportunities was the organizational climate factor that had the greatest
impact on relationship with subordinates, salary, and benefits. Regarding salary and benefits,
these findings reinforced the studies of Cain (2000), Galpin (1996), Guest (1962), and Hackman
and Suttle (1977) who asserted that when employees have increased potential for advancement
they are more likely to be compensated well in the present jobs.
Regard for personal concern was found to be significantly related to relationship with
peers and professional effectiveness. These findings pointed out the importance of investing in
the lives of others and supported the research of Capodagli and Jackson (1999), Clarke (1992),
who provided their versions of the golden rule.
Implications

90 The findings of this study have implications for leaders in most organizations so that
work environments can be enhanced and job satisfaction enriched. In particular, these findings
would be especially useful to administrators at institutions of higher learning, including directors
of physical plants. These and other leaders who are interested in providing a positive
organizational climate and helping people be satisfied on the job should recognize that it is
imperative to consider the perspectives of those who do the work of the enterprise. For example,
a demonstration of regard for the personal concerns of employees is imperative in order to have a
successful caring organization that treats people as an important resource. Providing professional
development opportunities is also an important and edifying component of organizational
climate since it contributes to job satisfaction and ultimately to organizational success. Clear
lines of internal communication are critical and an essential component of a positive
organizational climate. They help and allow people to successfully interact to build relationships
so that the business of an organization can be effectively and efficiently accomplished. The
perception that professional development opportunities exist was important to directors of
physical plants. This feeling contributed to job satisfaction for them and it is reasonable to
conclude that this is also a common concern for other people in different types of organizations.
A clear and fair process of evaluation was also important to directors of physical plants.
Employees need to know organizational expectations and how well their performance is meeting
these expectations. Lastly, organizational structure is a major factor which impacts the people in
it and ultimately the organization itself. Just as the research of Kristof (1996) indicated,
employees who have a comfortable fit within the organizational structure are more likely to be

91 satisfied with it and more likely to be satisfied with their jobs. This information can help
administrators understand their organizations better and help them bring about change.
Suggestions for Further Research
Three specific opportunities exist to further advance the body of knowledge about
organizational climate and job satisfaction. First, it would be helpful and interesting to know if
similar relationships between measures of organizational climate and job satisfaction exist for
others who work in universities and colleges. It would also be helpful to know if other
administrators as satisfied with their organizations and jobs as directors of physical plants.
Second, considering the importance of collaborative decision making, it would be helpful to
know how organizational structures can be designed to promote this successful leadership style.
Third, it would be beneficial to understand why there is so little diversity among directors of
physical plants. Why is this profession dominated by white men? More qualitative methods
might be helpful to obtain more precise information about the profession to determine why so
few women and minorities were involved in it.
In this study, the survey instrument was sent electronically to directors of physical plants
so that it would be convenient and easy to respond. Despite this effort, a limitation of this study
is the relatively low rate of return for the survey instrument, 37 percent. In future studies of this
type it might be advisable to precede the instrument with written correspondence to inform
people about the study and ask for their help. Contacting potential respondents about a week
after the survey is sent to inquire about their intent to participate might prove useful.
This research supported current theories and practices in higher education. In particular, it
pointed out significant relationships between organizational climate and job satisfaction for

92 directors of physical plants. These findings have applications for leaders in the management of
facilities. Future studies might investigate the relationship between organizational climate and
job satisfaction for other leaders in higher education such as directors of campus unions,
directors of planning, and directors of housing.

93
APPENDIX A ORGANIZATIONAL CLIMATE QUESTIONNAIRE
FOR DIRECTORS OF PHYSICAL PLANTS Purpose and Rationale: The purpose of this questionnaire is to gather perceptions about institutional climate from Directors of Physical Plants. Director of Physical Plant is defined as the chief administrative officer responsible for facilities on campus. Climate is defined as the conditions that affect job satisfaction and productivity. “Climate” to an organization is what “personality” is to an individual. This survey instrument consists of two parts. Part I includes questions related to your college and your position. Part II includes questions pertaining to demographic information.
Please read all questions carefully . All responses will be treated confidentially. Please complete and return this survey instrument by July 10, 2001. Please return your completed survey instrument by clicking on SUBMIT at the end of the questionnaire.
Thank you for your time and thoughtful participation in this project.
Part I: Organizational and Position Ratings Instructions: Considering your own experience at your college, please select the number of the rating that best represents your opinion or perception. Descriptions of the extremes on the continuum have been provided to assist you in choosing your answers. Section A. Please rate the level or degree to which the following qualities are present at your college, with five (5) indicating the highest level of presence and one (1) indicating the lowest level of presence. 1. Internal communication - the college’s formal and informal communication processes and style (Ex.: articulation of mission, purposes, values, policies, and procedures).
Open communication 5 4 3 2 1 Closed communication 2. Organizational structure – the college’s organizational structure and administrative operation (Ex.: the hierarchical lines of authority and
requirements for operating within that hierarchy).
Highly structured 5 4 3 2 1 Loosely structured
3. Political Climate – the nature and complexity of the college’s politics (Ex.: the degree to which the Director of Physical Plant must operate within a political framework in order to accomplish his/her job).
Highly political 5 4 3 2 1 Not highly political 4. Professional development opportunities – the opportunity for the Director of Physical Plant to pursue and participate in professional
development activities (Ex.: encouragement to learn, develop, and/or share innovative practices).
Participation highly encouraged 5 4 3 2 1 Participation not encouraged 5. Evaluation – the college’s procedures for evaluating the Director of Physical Plant (Ex.: fair and supportive procedures that focus on
improvement rather than fault-finding).
Supportive evaluation procedures 5 4 3 2 1 Non-supportive procedures 6. Promotion – the college’s commitment to internal promotion and advancement from within the organization (Ex.: career ladders, internship
opportunities, etc.).
Internal promotions encouraged & supported 5 4 3 2 1 Internal promotions not encouraged & supported 7. Regard for personal concerns – sensitivity to and regard for the personal concerns of all employees (Ex.: college is supportive and flexible
during times of personal emergencies).

94
High sensitivity or concern 5 4 3 2 1 Low sensitivity or concern Section B. Please rate your level of satisfaction with each of the college’s qualities listed below, with five (5) indicating the highest level of satisfaction and one (1) indicating the lowest level of satisfaction. 8. Internal communication – the college’s formal and informal communication processes and style (Ex.: articulation of mission, purpose,
values, policies and procedures).
Open communication 5 4 3 2 1 Closed communication 9. Organizational Structure – the college’s organizational structure and administrative operation (Ex.: the hierarchical lines of authority and
requirements for operating within the hierarchy).
Highly structured 5 4 3 2 1 Loosely structured 10. Political climate – the nature and complexity of the college’s politics (Ex.: the degree to which the Director of Physical Plant must operate
within a political framework in order to accomplish his/her job).
Highly political 5 4 3 2 1 Not highly political 11. Professional development opportunities – the opportunity for the Director of Physical Plant to pursue and participate in professional
development activities (Ex.: encouragement to learn, develop and/or share innovative practices).
Participation highly encouraged 5 4 3 2 1 Participation not encouraged 12. Evaluation – the college’s procedures for evaluating the Director of Physical Plant (Ex.: fair and supportive procedures that focus on improvement rather than fault-finding).
Supportive evaluation procedures 5 4 3 2 1 Non-supportive procedures 13. Promotion – the college’s commitment to internal promotion and advancement from within the organization (Ex.: career ladders,
internship opportunities, etc.).
Internal promotions encouraged & supported 5 4 3 2 1 Internal promotions not encouraged & supported 14. Regard for personal concerns – the Director of Physical Plant’s sensitivity to and regard for the personal concerns of all employees (Ex.:
college is supportive and flexible during times of personal emergencies).
High sensitivity or concern 5 4 3 2 1 Low sensitivity r concern Section C. Please indicate how important each of the following factors is to you in your position as Director of Physical Plant, with five (5) indicating highest level of importance and one (1) indicating the lowest level of importance. 15. Participation in decision making – the college’s process for decision making and opportunities for involvement by instructors and others
(Ex.: level of input requested for administrative decisions that involve instructional affairs).
Most important 5 4 3 2 1 Least important 16. Power – the degree of power held by the Director of Physical Plant within the organization (Ex.: decisions made by the Director of Physical
Plant are subject to reversal by others).
Most important 5 4 3 2 1 Least important

95 17. Relationship with colleagues – the quality of the Director of Physical Plant’s relationship with peers, subordinates and supervisor (Ex.: the
atmosphere of mutual collegial respect exists).
a. With peers :
Most important 5 4 3 2 1 Least important
b. With subordinates
Most important 5 4 3 2 1 Least important
c. With supervisor
Most important 5 4 3 2 1 Least important 13. Salary and benefits – the salary and benefits of the Director of Physical Plant (Ex.: salary and benefits package are equitable and
comparable with colleagues in similar situations).
a. Salary:
Most important 5 4 3 2 1 Least important b. Benefits
Most important 5 4 3 2 1 Least important 13. Professional Effectiveness – the perceived overall effectiveness of the Director of Physical Plant in his/her position (Ex.: “Am I successful
in accomplishing the objectives of my position?”).
Most important 5 4 3 2 1 Least important Section D. 14. Please indicate the level of your overall satisfaction with your position, with five (5) indicating the highest level of satisfaction and one (1) indicating the lowest level of satisfaction.
Most satisfied 5 4 3 2 1 Least satisfied Section E. 21. Please indicate the level of your overall satisfaction with your college with five (5) indicating the highest level of satisfaction and one (1) indicating the lowest level of satisfaction.
Most satisfied 5 4 3 2 1 Least satisfied 22. Please indicate the level of your overall satisfaction in your relationship with your supervisor, with five (5) indicating the highest
level of satisfaction and one (1) indicating the lowest level of satisfaction.
Most satisfied 5 4 3 2 1 Least satisfied 23. Given the significance of higher administration as they relate to climate, please indicate the level of your overall satisfaction with
their willingness to cooperate and be open-minded to your ideas and suggestions, with five (5) indicating the highest level of satisfaction and one indicating the lowest level of satisfaction.
Most satisfied 5 4 3 2 1 Least satisfied

96
Part II: Demographic Information Instructions: Please provide the following demographic information by using a check mark or filling in the blank. A. Your current position title: ______________________________________ B. Number of years you have served as Director of Physical Plant at your current institution.
________ Less than 1 year ________ 11 – 14 years ________ 1 – 5 years ________ 15 years or more
________ 6 – 10 years C. Ethnic group:
________ Asian American ________ White/Caucasian ________ Black/African American ________ Native American ________ Hispanic ________ Other: (please
specify) ________ D. Gender
________ Female ________ Male E. Number of students at your institution ________ 0 – 999 ________ 3,000 – 3,999 ________ 12,000 – 19,999 ________ 1,000 – 1,999 ________ 4,000 – 4,999 ________ 20,000 and over
________ 2,000 – 2,999 ________ 5,000 – 11,999 F. Type of Institution ________ public ________ private G. Name of Institution (optional) ______________________________________ H. Please use this space to make any comments or observations relating to the issues raised in this survey:
Thank you.
SUBMIT

97
APPENDIX B COVER LETTER FOR QUESTIONNAIRE
Dear APPA member, In my role as APPA’s Executive Vice President, I cont inue to be impressed with the level of participation in our association. This involvement makes us stronger because it provides valuable feedback and insight about needs and issues that impact our profession. Certainly, one of the matters that ought to concern us is our own level of satisfaction on the job and how it affects our organizations. We need to know as much as possible about this relationship because it is part of the body of knowledge necessary to effectively manage facilities. It is essential in today’s fast-paced, rapidly changing world that we understand as much as we can about leadership, our impact on organizations, and their impact on us. For this reason, the theme of this questionnaire is certainly in alignment with our association’s overarching purpose to gather and disseminate information that can help us improve our performance as managers of facilities. The information gathered from Fred Gratto’s questionnaire (see his letter following mine) is likely to be very beneficial to our understanding of leadership. Therefore, I hope that you will take a few moments to complete it and respond to Fred by Tuesday, July 10, 2001. Thank you for your time and support of this worthy research project. Sincerely, E. Lander Medlin Executive Vice President

98
Dear Colleague, I have served as Assistant Director of Physical Plant at the University of Florida since 1985. Because of my work on campus and involvement with APPA, I became very interested in the impact of leadership on facilities organizations. I decided to pursue a doctoral degree and investigate the relationship between organizational climate and job satisfaction for Directors of Physical Plants. To do this effectively, your help is needed. Please respond to the questionnaire by simply clicking on the following link: http://admn.santafe.cc.fl.us/~bgordon/survey/questions.htm It inquires about the organizational climate on your campus and your level of job satisfaction. It can be completed in approximately ten minutes. There are no right or wrong answers and you do not have to answer any question you do not want to answer. Respondents are guaranteed anonymity because no reference to any school or individual will be made in the data analysis. Please provide your response to each question and click on <Submit> at the end of the form when you have completed the questionnaire. Please complete by July 10, 2001. For the purposes of this research, a response to this questionnaire will be considered your consent to participate in the study. In addition to the information provided above, the University of Florida Institutional Review Board policy requires the researcher to provide participants with the following information: This project does not involve any immediate or foreseen (a) benefits, (b) risks, or (c) compensation. Questions or concerns about research participants' rights can be directed to the UFIRB office, PO Box 112250/ 98A Psychology Building, University of Florida, Gainesville, FL 32611-2250. Research participants are free to withdraw consent and discontinue participation in the project at any time without consequence. If you would like to receive a copy of the findings of this study, please indicate this in your return email and I'll be happy to provide it. Thank you in advance for your help and participation. http://admn.santafe.cc.fl.us/~bgordon/survey/questions.htm Sincerely, Frederic Gratto [email protected] 352-392-1148

99
REFERENCES Adams, M. (2000). The art of facility stewardship in Maine. Facilities Manager. Alexandria, VA: APPA Publications, May/June. Adams, J. S. (1965). Inequity in social exchanges. In L. Berkowitz, (Ed.), Advances in Experimental Psychology (pp. 267-299). New York: Academic Press. Alderfer, C. P. (1975). Learning from changing: Organizational diagnosis and development. Beverly Hills: Sage Publications. Brady, G. F. (1989). Management by involvement. New York: Insight Books Argyris, C. (1962). Interpersonal competence and organizational effectiveness. Homewood, IL: The Dorsey Press, Inc. Argyris, C. (1964). Integrating the individual and the organization. New York: John Wiley & Sons. Argyris, C. (1976). Increasing leadership effectiveness. New York: John Wiley & Sons. Argyris, C. (1957). Personality and the organization: The conflict between the system and the individual. New York: Harper & Row. Band, W. (1991). Creating value for customers. New York: John Wiley & Sons. Barbash, J. (1976). Job satisfaction attitude surveys. Paris: OECD. Barr, R. (1988). The spring 1988 Palomar College climate survey: An analysis with comparisons to the fall 1986 survey. (ERIC Document Reproduction Service No. ED 320 615). Barsky, J. (1995). World-class customer satisfaction. New York: Irwin Professional Publishing. Beck, R. C. (1990). Motivation: theories and principles. Englewood Cliffs, NJ: Prentice Hall. Benfari, R. C. (1995). Changing your management style . New York: Simon and Schuster Inc. Bennis, W. (1966). Changing organizations. New York: McGraw-Hill.

100 Benson, J. (1998). Developing a strong program of construct validation: A test anxiety example. Educational Measurement: Issues and Practices, 17, 10-17. Berry, L. (1999). Discovering the soul of service. New York: The Free Press. Bess, J. L., & Lodahl, T. M. (1969). Career patterns and satisfaction in university middle -management. Educational Record, 50, (Spring), 220-229. Bisconti, A. S. & Solmon, L. C. (1977). Job satisfaction after college. Bethlehem, PA: The CPC Foundation. Blanchard, K., & Bowles, S. (1993). Raving fans. New York: William Morrow and Company. Bolman, L. G., & Deal, T. E. (1984). Modern approaches to understanding and managing organizations. San Francisco: Jossey-Bass. Bolman, L. G., & Deal, T. E. (1991). Reframing organizations. San Francisco: Jossey-Bass. Brady, G. F. (1989). Management by involvement. New York: Insight Books Brief, A. P. (1998). Attitudes in and around organizations. London: Sage Publications. Bulls, H. E., & Greenberger, J. S. (1998). The front door. Business Officer. December. Cain, D. (2000). Creating a learning organization environment for the facilities professional. Facilities Manager, 16,(2), 20-25. Cain, D., & Christensen, D. (2000), Assessment and continuous improvement. Facilities Manager, 16(1), 19-20. Capodagli, B., & Jackson, L. (1999). The Disney way. New York: McGraw-Hill. Cassidy, M. L. & Warren, B. O. (1991). Status consistency and work satisfaction among professional and managerial men and women. Gender and Society, 5 (2), 193-206. Chappell, S. K. (1995). The relationship between organizational climate and job satisfaction as reported by community college chief instructional officers (Doctoral Dissertation, University of Florida, 1995). Christenson, J. (1999). The M-Quality Journey. Facilities Manager, 15, (2), 43-45 Clarke, K. E. (1992). Impact of leadership. Greensboro, NC: Center for Creative Leadership. Colson, C. W., & Eckerd, J. W. (1991). Why America doesn’t work. Dallas: Word Publishing. Croft, D. B., & Halp in, A. W. (1963). The organizational climate of schools. Chicago: University of Chicago, Midwest Administration Center.

101 Davis, J. (1997). Deferred maintenance and the Americans with disabilities act. Facilities Manager, 13, (2), 37-42. Deal, T. E. & Jenkins, W. A. (1994). Spotlighting backstage employees: Organizing the hidden side of colleges and universities. Business Officer, 27(9), 36-41. DeMichele, D. (1998). The relationship between organizational climate and job satisfaction as reported by mid-level collegiate campus recreation program coordinators (Doctoral Dissertation, University of Florida, 1998). Dessoff, A. (2001). Leadership is personal. Facilities Manager, 17, (5), 31-34. Edwards, J. R. (1991). Person-job fit: A conceptual integration, literature review, and methodological critique. In C. L. Cooper & I. T. Robertson (Eds.), International review of industrial and organizational psychology, 1991 (pp. 283-357). Chichester, UK: Wiley. Emery, M. (1999). Searching: The theory and practice of making cultural change. Philadelphia: John Benjamins Publishing Company. Evans, G. L. (1996). The relationship between organizational climate and job satisfaction as reported by community college presidents (Doctoral Dissertation, University of Florida, 1996). Fink, I. (1999). Managing space at small colleges. Facilities Manager, 15, (5), 31-35. Fleishman, E., Harris, E., & Burtt, H. (1955). Leadership and supervision in industry. Columbus, OH: Ohio State University Press. Ford, R. N. (1979). Why jobs die and what to do about it. New York: American Management Association. Freeman, R. B.& Rodgers. (1999). What workers want. Ithaca, NY: Cornell University Press. Fullan, M. (1991). The new meaning of educational change. New York: Teachers College, Columbia University. Fullan, M. G. & Miles, M. B. (1992). Getting reform right: What works and what doesn’t. Kappan. 73(10): 744-752. Galpin, T. J. (1996). The human side of change. San Francisco: Jossey-Bass. Gilley, J. W., & Maycunich, A. (2000). Beyond the learning organization. Cambridge: Perseus Books. Gini, A. (2000). My job my self. New York: Routledge Publishing.

102 Glaser, E. M. (1976). Productivity gains through worklife improvement. New York: Harcourt Brace Jovanovich. Goffee, R. & Jones, G. (1998). The character of a corporation. New York: Harper-Collins Publishers. Golembiewski, R. (1962). Behavior and organization: O & M and the small group. Chicago: Rand McNally & Company. Gordon, R. & Howell, J. (1959). Changing character of American business. Higher Education for Business, 23, 13-17. Gruneberg, M. M. (1979). Understanding job satisfaction. New York: John Wiley & Sons. Guest, R. (1962). Organizational change: the effect of successful leadership. Homewood, IL: The Dorsey Press, Inc. Hackman, J. & Suttle, J. (1977). Improving life at work. Santa Monica, CA: Goodyear Publishing Co. Haire, M. (1962). Organization theory in industrial practice. New York: John Wiley & Sons. Hanson, E. M. (1985). Educational administration and organizational behavior. Boston: Allyn and Bacon, Inc. Hartman, E. (1988). Conceptual foundations of organization theory. Cambridge: Ballinger Publishing Company. Hatch, M. (1997). Organization Theory. New York: Oxford University Press. Hersey, P. & Blanchard, K. (1988). Management of organizational behavior: Utilizing human resources. Englewood Cliffs, NJ: Prentice Hall. Hersey, P., Blanchard, K., & Johnson, D. (1996), Management of organizational behavior: Utilizing human resources. Upper Saddle river, NJ: Prentice Hall. Hersi, D. T. (1993). Factors contributing to job satisfaction for women in higher education administration. CUPA Journal, 44 (2), 29-35. Hoppock, R. (1977). Job satisfaction. New York: ARNO Press. Jenkins, C. (1998). Leaders and ethics: What the contemporary experts say. Facilities Manager, 14, (1), 51-54. Jenkins, C. (1999). The value of relationships. Facilities Manager, 14, (3), 33-36. Kaiser, H. (1997). A foundation to uphold: Overview and policy implications. Facilities Manager, 13, (2), 17-20.

103 Kaiser, H. & Kirkwood, D. (2000). Evaluating the facilities planning, design, and construction department: The capital programs management audit. Facilities Manager, 16, (3), 15-22. Kekes J. (1993). The morality of pluralism. Princeton, NJ: Princeton University Press. Keller, E. F. (1985). Reflections on gender and science. New York: Yale University Press. Kern, J. P., Riley, J. R. & Jones, L. N. (1987). Human Resources Management. New York: Marcel Dekker, Inc. Kinnaman, M. (2000). How to make a difference: On becoming an enlightened leader. Facilities Manager, 16, (2), 15-19. Kotter, J. P. & Heskett, J. L. (1992). Corporate culture and performance. New York: The Free Press. Kouzes, J. M. & Posner, B. Z. (1987). The leadership challenge: How to get extraordinary things done in an organization. San Francisco: Jossey-Bass. Kristof, A. L. (1996). Person-organization fit: An integrative view of its conceptualizations, measurement, and implications. Personnel Psychology, 49, 1-49. Kunda, G. (1992). Engineering Culture. Philadelphia: Temple University Press. Lehman, P. W. (1988). Study guide for Shavelson statistical reasoning for the behavioral sciences (2nd ed). Boston: Allyn and Bacon, Inc. Lenz, V. (1999). The Saturn difference: Creating customer loyalty in your company. New York: John Wiley & Sons.
Levin, D. I. (1995). Reinventing the workplace. Washington D. C.: The
Brookings Institution. Levy, S. G. (1989). Organizational climate and job satisfaction as reported by Pennsylvania community college middle -level administrators (Doctoral dissertation, Lehigh University, 1989). Dissertation Abstracts International, 50, A1509. Lewin, K. (1935). A dynamic theory of personality: Selected papers (D. K. Adams & K. E. Zener, Trans.). New York: McGraw-Hill. Litwin, G. H., & Stringer, R. A. (1968). Motivation and organizational climate. Boston: Harvard University Press.
Locke, E. A. (1976). Nature and causes of job satisfaction. In M. D. Dunnette, (ed.). Handbook of Industrial and Organizational Psychology (pp. 1297-1349). Chicago: Rand McNally and Company.

104 Luenburg, F. C., & Ornstein, A. C. (1991). Educational administration: Concepts and practices. Belmont, CA: Wadsworth Publishing Co.
Kern, J. P., Riley, J. J., & Jones, L. N. (1987). Human Resources Management. New York: Marcel Dekker, Inc.
Manz, C. C. (1998). The leadership wisdom of Jesus. San Francisco: Berrett-Koehler Publishers. March, J. & Simon, H. (1965). Organizations. New York: John Wiley and Sons. Maslow, A. H. (1970). Motivation and personality. NY: Harper & Row. Maslow, A. H. (1998). Maslow on management. New York: John Wiley and Sons.
Maxwell, J. C. (1998). The 21 Irrefutable laws of leadership. Nashville: Thomas Nelson Publishers.
McCormick, E. J., & Ilgen, D. R. (1980). Industrial Psychology. Englewood Cliffs, NJ: Prentice Hall. McGregor, D. (1957). The human side of enterprise. Management Review, 46, 22-28. McMurray, R. (1953). Empathy: management’s greatest need. Advanced Management. 18, 6-11. McNealy, R. (1994). Making customer satisfaction happen. London: Chapman & Hall. Medlin, L. (1999). Leadership through relationships. Facilities Manager, 15, (6), 18-21. Medlin, L. (2000). A call for leadership in research. Facilities Manager, 16, (3), 35-37. Mirvis, P. H. & Kanter, D. L. (1989). Combating Cynicism in the workplace. National Productivity Review. 8, 379. Mobley, W. H. (1977). Intermediate linkages in the relationship between job satisfaction and employee turnover. Journal of Applied Psychology. 62, 237-240. Moon, D. J. (1993). Constructing community: Moral pluralism and tragic conflicts. Princeton, NJ: Princeton University Press. Morf, M. (1986). Optimizing work performance. New York: Quorum Books. Moyers, B. (1991). A world of ideas. New York: Doubleday.

105 Murray, H. A., Barrett, W. G. , & Homburger, E. (1938). Explorations in personality: A clinical and experimental study of fifty men of college age, by the workers at the Harvard psychological clinic . New York: Oxford University Press.
Owens, R. G. (1995). Organizational behavior in education. Boston: Allyn and Bacon. Palmer, C. K. (1995). Organizational climate and job satisfaction as reported by Florida community college health occupations program directors (Doctoral Dissertation, University of Florida, 1995). Paulson, G. (1997). A study of selected organizational climate factors and job satisfaction variables among teachers in a large suburban school district (Doctoral Dissertation, University of Florida, 1997). Peters, L. H., & O’Connor, E. J. (1980). Situational constraints and work outcomes: The influences of a frequently overlooked construct. Academy of Management Review, 5, 391-397. Peterson, M. W., & Spencer, M. G. (1990). Understanding academic culture and climate. In W. G. Tierney (Ed.), New directions for institutional research No. 68 (pp. 3-18. San Francisco: Jossey-Bass. Peterson, M. W., & White, T. H. (1992). Faculty and administrator perceptions of the ir environments: Different views or different models of organization? Research in Higher Education, 33(2), 177-204. Peterson, V. (1999). Creating a learning environment. Facilities Manager, 15, (3), 51-54. Pincus, J. D. (1986). Communication satisfaction, job satisfaction, and job performance. Human Communication Research, 13(3), 395-413. Porter, L. W. (1962). Job attitudes in management: Perceived deficiencies in need fulfillment as a function of job level. Journal of Applied Psychology, 46, 375-384. Ray, P. E. (1988). New departures in industrial relations. Washington, D. C.: British-North American Committee. Rebore, R. W. (2001). The ethics of educational leadership. Columbus, OH: Merrill Prentice Hall. Report of the Carnegie Foundation for the Advancement of Teaching (1986). Change. 1986. Report of the Wingspread Group on Higher Education (1993). An American imperative: higher expectations for higher education. Racine, WI: The Johnson Foundation. Rice, C. (1982). Your team of tigers, getting good people and keeping them. New York: American Management Association. Ryan, K. D., & Oestreich, D. K. (1991). Driving fear out of the workplace. San Francisco: Jossey-Bass.

106 Sagor, R. (1995). Overcoming the one-solution syndrome. Educational Leadership. April. Sarason, S. (1996). The culture of the school and the problem of change. New York: Teachers College Press. Satterlee, B. (1988). A study to determine the job satisfaction of the engineering/industrial faculty at Delgado Community College. (ERIC Document Reproduction Service No. ED 336 593). Washington, D. C. : Educational Research and Information Center. Sayles, R. & Strauss, G. (1960). Human behavior in organizations. Englewood Cliffs, NJ: Prentice-Hall, Inc. Schlesinger, L. (1982). Quality of work life and the supervisor. New York: Praeger Publishers.
Scott, R. A. (1980). Lords, squires and yeomen: Collegiate middle managers in the U.S. Higher Education, 9, 385-398.
Sell, K. G. & Shipley, P. (1979). Satisfactions in work design: Ergonomics and other approaches.
London: Taylor and Francis LTD. Sergiovanni, T, & Starratt, R. (1987). Supervision: Human perspectives. New York: McGraw-Hill. Smith, B. L. (1993). Creating learning communities. Liberal Education. Fall, 32-39. Smith, P. C., Kendall, L. M., & Hulin, C. L. (1969). The measurement of satisfaction in work and retirement. Chicago: Rand McNally and Company. Solomon, L. C. & Tierney. M. L. (1977). Determinants of job satisfaction among college administrators. Journal of Higher Education, 48(4), 412-431. Spates, T. G. (1959). Human Relations: How far have we come? Management Record, 21, 78-84.
Spector, P. E. (1997). Job Satisfaction. London: Sage Publica

107 tions Inc.
Spence, C. S., & Stuckman, J. A. (1994). Community college faculty and staff collaborating in service: Total quality management. In A. M. Hoffman & D. J. Julius (Eds.), Managing community and junior colleges: Perspectives for a new century (pp. 207-220). Washington, DC: CUPA. Steers, R. M. & Porter, L. W. (Eds.). 1975. Motivation and work behavior (3rd ed). New York: McGraw-Hill. Stemmle, J. (2000). Covey workshops in the Mizzou campus facilities’ workplace. Facilities Manager, 16, (1), 21-24. Stern, G. C. (1970). People in context: Measuring personal environment congruence in education and industry. New York: Wiley. Stogdill, R. (1965). Managers, employees, organizations. Columbus, OH: The Ohio State University Press. Tannebaum, R. & Schmidt, W.(1958). How to choose a leadership pattern. Harvard Business Review, 46, 95-101. van der Have, P. (1997). Continuous assessment improves educational facilities. Facilities Manager, 13, (2), 32-36. Vroom, F. H. (1964). Work and motivation. New York: John Wiley & Sons, Inc. Vroom, F. H. (1982). Work and motivation. Malabar, FL: R. E. Krieger Publishing Company. Originally published in NY: Wiley in 1964 and reprinted in 1978.
Wanous, J. P. (1976). A causal-correlational analysis of the job satisfaction and performance relationship. Journal of Applied Psychology, 59, 139-144. Wattenbarger, J. L. (1994). New theories of leadership and human resources management for community colleges. In A. M. Hoffman & D. J. Julius (Eds.), Managing community and junior colleges: Perspectives for a new century (pp. 69-78). Washington, DC: CUPA. Witt, L. A. & Myers, J. G. (1992). Perceived environmental uncertainty and participation in decision-making in the prediction of perceptions of the fairness of personnel decisions. Review of Public Personnel Administration, 12 (3), 49-56. Witt, L. A. & Nye, L. G. (1992). Gender and the relationship between perceived fairness of pay or promotion and job satisfaction. Journal of Applied Psychology, 77, 910-917. Wolf, M. G. (1970). Need gratification theory: A theoretical reformulation of job satisfaction/dissatisfaction and job motivation. Journal of Applied Psychology, 54, 87-94. Wolgemuth, R. (1999). Daddy @ Work. Grand Rapids, MI: Zondervan Publishing House.

108 Zebetakis, S. (1999). The relationship between organizational culture and job satisfaction for community college chief business officers (Doctoral Dissertation, University of Florida, 1999).

109
BIOGRAPHICAL SKETCH Frederic Gratto grew up near Lake Placid, New York, in the Adirondack Mountains. He received
a B. A. degree in psychology from the State University of New York at Plattsburgh. He also earned a
M.Ed. Degree in parks and recreation from the University of Georgia and an M.A. in urban and regional
planning from the University of Florida.
He started his career in facilities management at the State University of New York at Delhi and
moved on to a position as Superintendent of Parks in Muscatine, Iowa. His next job was at the University
of Florida. After working sixteen years in Physical Plant, his interest in leadership led to the pursuit of a
doctoral degree. His future plans include either college teaching or other administrative positions in
facilities management.

110
I certify that I have read this study and that in my opinion it conforms to acceptable standards of scholarly presentation and is fully adequate, in scope and quality, as a dissertation for the degree of Doctor of Philosophy.
___________________________
David S. Honeyman, Chair
Professor of Educational Leadership, Policy, and Foundations
I certify that I have read this study and that in my opinion it conforms to acceptable standards of scholarly presentation and is fully adequate, in scope and quality, as a dissertation for the degree of Doctor of Philosophy.
___________________________ C. Arthur Sandeen
Professor of Educational Leadership,
Policy and Foundations
I certify that I have read this study and that in my opinion it conforms to acceptable standards of scholarly presentation and is fully adequate, in scope and quality, as a dissertation for the degree of Doctor of Philosophy.
______________________________ Dale F. Campbell Professor of Educational Leadership,
Policy, and Foundations
I certify that I have read this study and that in my opinion it conforms to acceptable standards of scholarly presentation and is fully adequate, in scope and quality, as a dissertation for the degree of Doctor of Philosophy.
___________________________ Stephen C. Anderson
Professor of Recreation, Parks, and Tourism

111
This dissertation was submitted to the Graduate Faculty of the College of Education and to the Graduate School and was accepted as partial fulfillment of the requirements for the degree of Doctor of Philosophy.
___________________________ Dean, College of Education ___________________________
Dean, Graduate School