Embed Size (px)
Citation preview
Paper ID #17478
The Relationship Between Course Assignments and Academic Performance:An Analysis of Predictive Characteristics of Student Performance
Mrs. Deborah Ann Pedraza, Texas Tech University
I am a Systems and Engineering doctoral student at Texas Tech University. I have Bachelor’s degree inthe Mathematics from The University of Houston - Victoria, an MBA - The University of Houston - Vic-toria, and a Master’s Degree in Electrical and Computer Engineering - The University of Massachusetts-Amherst. I teach Mathematics, Engineering, and Computer Science at Cuero High School in Cuero, TXand adjunct for The Victoria College in Victoria, TX. I also spent 20 years at Alcoa - Point Comfort Op-erations where I spent time as a Systems Analyst, Process Control Engineer, and Electrical Engineeringand Computer Systems Superintendent. I am a former graduate of the Golden Crescent Alliance for Mi-norities in Engineering (GCAME) and then later returned to chair this organization for 15 years to helpothers consider engineering as a career.
Dr. Mario G. Beruvides P.E., Texas Tech University
Dr. Mario G. Beruvides is the AT&T Professor of Industrial Engineering and Director of the Laboratoryfor Systems Solutions in the Industrial Engineering Department at Texas Tech University. He is a regis-tered professional engineer in the state of Texas. He holds a BS in mechanical engineering and an MSIEfrom the University of Miami in Coral Gables, Florida and a PhD in Industrial and Systems Engineeringfrom Virginia Polytechnic Institute and State University (Virginia Tech) in Blacksburg, Virginia.
c©American Society for Engineering Education, 2016

The Relationship Between Course Assignments and Academic Performance:
An Analysis of Predictive Characteristics of Student Performance Texas Tech University
Abstract Research in the open literature suggests that several possible variables (i.e. SAT scores and others) can predict the academic readiness of students in an engineering program, but many are not always reliable sources. This research analyzes different models for predicting success in an undergraduate education course as well as identifies factors that affect success or failure. The study evaluates the current state of the art to determine what critical performance measures might lead to accurate student success. The study reviews the determinants that most influence the success or failure of students. The premise of this research is to accurately predict the performance of Engineering students and provide a means to identify struggling students and suggest intervention strategies for intervention to help students succeed. By identifying students that are more likely to fail and assisting them before they do, it is possible to increase the number of students that remain in Engineering. Introduction Predicting student performance in college courses in all subject areas has been studied and researched much in the open literature for many years. One such study presented by Paul Egan and Victor Ferre[14] stresses the need to predict performance of potential teachers and how they will fare on the (1984-1986) NTE Core Battery of Tests. They concluded that undergraduate grade point average and a subset of ACT scores correlated with the NTE Core Battery as well as with the old NTE Common Examinations given to teachers. By recognizing the importance for predicting how students will fare, interventions can be performed to assist students with intermediary efforts that will assist them in passing the examinations. In addition, others have stated that because of the strong correlations, that perhaps doing well on the ACT may exempt some from some such teacher standards testing measures such as the NTE Core Battery or NTE Common Examinations or other such mandated state testing.[14]
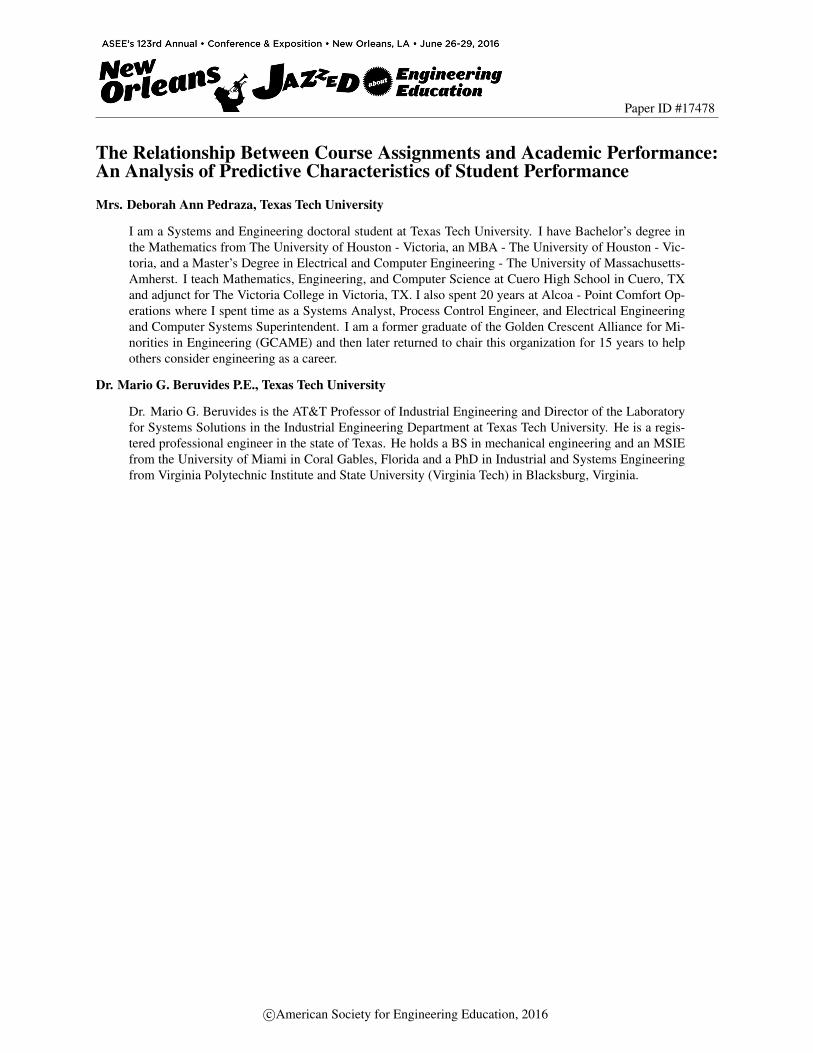
In one early study involving prediction of College English Performance, the authors found that “By and large, of those measures studied, the weighted average of all academic New York State Regents Examination grades is the best predictive device. The Regents Latin III examination grade best foretells the college English average.”[46] Further, they found that specifically the Latin III grades predicted the college English grades. This same study, further, stated that performance in a college English course may be predicted by using a high school English course, any high school secondary language score, general high school grade point average, or the Cooperative English Examination. They also noted that, regarding gender and prediction, vocabulary scores are extremely important in predicting the success of boys in College English. However, general information scores are more important for girls in the prediction of success in College English.[46]

In Table 1, entitled “Zero-Order Correlation Coefficients Between College English and Various Measures,” shows that the coefficients of prediction used in the study performed by Wagner and Strabel[46] in 1937. This table presents the results from the measures they used including weighted average of all academic New York State Regents Examinations grades, all subject grades, and the average grades for all English courses taken in high school as well as other data. The research criteria used for success included the grades from Freshman and Sophomore English classes taken in college as well as any other English course taken during the first two years in college. Even as early as 1937, interest has been generated for improving student performance and predicting how well they will perform in class.
Some important factors in predicting student achievement include grade point average, standardized tests, and class rank; previous related experience; motivational variables and personality traits; socioeconomics, gender, and race; expectancy and needs theory; incentives; study habits of students; homework requirements; tutorials; instructor differences; online involvement; classroom environment; learning styles; and class attendance. For the purposes of this study, we will consider grade point average, standardized tests, and class rank to be scholarly factors; previous related experience, motivational variables and personality traits, socioeconomics, gender, race, expectancy and needs theory, incentives, study habits of students as psychological factors; and homework requirements, tutorials, instructor differences, online involvement, classroom environment, earning styles, and class attendance as external factors.
Scholarly Factors
Many universities base college admissions solely on class rank or on high school grade
point average. According to Crystale Marsh, Michael Vandehey, and George Diekhoff[38]: “standardized [sic] test of academic aptitude do not assess the motivational skills necessary for success (Kerr, Fagley, & Miller, 1998) and fail to provide an ecologically valid assessment of the complex array of skills that are needed in college (Oldfield, 1994); Thompson & Kobrak, 1983),. High school performance fails to predict, with a high degree of accuracy, college success. First, the high school curriculum may not have prepared the student for college work, and second, high school GPAs are poor predictors of college success due to grade inflation and a lack standardization in high school grading systems (Jones & Watson, 1990; Owen, Jenkins, & Harburg, 2003) [38]
Marsh, et al,[38] presented their findings in Table 2, Predicting Cumulative GPA. Even
adding in additional General Psychology exams did not provide improvements in determining the variance in their study. This study actually suggests that scores on the Psychology exams in the General Psychology course are better predictors of later academic success than are scores on either the ACT or SAT exams. Further, they found that the midterm General Psychology exam was more predictive of student grade point average. As this study implies, if at-risk learners are identified early, “there may be a higher probability that they can be referred to academic or counseling services and be retained.” [38]
Rubin and Stroud,[43] in their study, found that for students whose grade point average is just passing, that high school grade point average is less predictive or informative as to how the
students will fare in college. They also found that when considering these “average” students, it is more important to consider where these students attended high school rather than simply their
Table 1 -- Zero-Order Correlation Coefficients Between College English and Various
Measures[46]
May, 1937] PERFORMANCE IN COLLEGE ENGLISH 695
TABLE I Zero-Order Correlation Coefficients Between College
English and Various Measures
Total Regents Mean*
Total Regents Mean
Regents English IV
Rank in H. S. Class*
Iowa Content English
H. S. English Av.
American Council Education Opposites
Regents Latin III
Regents English III
H. S. English I
Regents English II
Total Iowa Content
Regents Eng. Literature
American Council Education Completion
American Council Education Total
Regents Eng. Grammar
American Council Education Artificial Language Age at H, S. Grad.
No. of H. S. Units
American Council Education Analogies
Boys Girls Total
Boys Girls Total
Boys Girls Total
Boys Girls Total
Boys Girls Total
Boys Girls Total
Boys Girls Total
Boys Girls Total
Boys Girls Total
Boys Girls Total
Boys Girls Total
Boys Girls Total
Boys Girls Total
Boys Girls Total
Boys Girls Total
Boys Girls Total
Boys Girls Total
Boys Girls Total
Boys Girls Total
Boys Girls Total
MEAN 2-YR. COLLEGE ENGLISH
No. r 250 .57 151 .65
401 .62 390 217 607 429 229 658 253 157 420 341 141 482 334 184 518 422 230 652 245 157
402 425 232 657 383 200 583 409 224 633 340 141 481
52 55
107 422 230 652 416 229 645 266 163
429 422 230 652 421 215 636 430 232 662 358 146
504
.53
.65
.60 .47 .58 .47 .47 .60 .57 .52 .58 .57 .39 .33 .52 .51 .45 .49 .64 .68 .68 .39 .42 .45
.39
.33
.45
.32 .44 .43 .46 .62 .50 .07 .60 .21 .40 .44 .37 .39 .27 .35 .27 .18 .30 .21 .44 .30
-.18 .18 .23 .09 .27 .22 .14 .15 .12
FRESHMAN ENGLISH
No. r 250 .54 151 .64
401 .61 388 217 605
430 229 659 264 157
421 346 140 486 336 184 520 424 230 654 245 157 402 426 232 658 385 199 584 411 224 635 342 141 483
52 54
106 424 230 654 417 229 646 267 163
430
.49
.63 .58 .43 .58 .53 .43 .62 .54 .47 .49 .50 .40 .48 .49 .44 .47 .49 .40 .52 .49 .41 .48 .48 .36 .39 .41 .34 .44 .44 .45 .58 .47 .34 .52 .44 .40 .49 .41 .38 .48 .40 .34 .29 .35
SOPHOMORE ENGLISH
No. r 214 .37 139 .59 353 .50 376 212 598 406 224 630 226 145 371 318 138
456 320 180 500 404 225 629 237 154
391
325 138
463 52 53
105 404 225 629 400 224 624
.42
.49
.48 .36 .42 .43 .34 .56 .49 .40 .42 .45 .26 .34 .39 .42 .30 .38 .38 .43 .43
.38
.47
.39
.17
.41
.31
.27
.35
.28
.28
.33
.28
*Cases from only four large Buffalo high schools over a six year period. The rank in class as presented here cannot be compared with all r's presented in this table since the small high schools with their
more variable student populations are not included.
**Inasmuch as time did not permit the calculation of all possible interrelations, tha less likely ones have been omitted.
This content downloaded from 132.174.254.127 on Fri, 10 Oct 2014 13:51:19 PMAll use subject to JSTOR Terms and Conditions

Table 2 – Predicting Cumulative GPA[38]
grade point average. They, further, surmise that the high school attended “is a more important predictor of university performance for students with poorer high school records than for students with better high school records.”[43]
According to Holen and Newhouse[22] in “Student Self-Prediction of Academic Achievement,” there are three basic variables that have consistently emerged “as among the most predictive of college grades: high school grade average, college grade average, and grades in previous, related courses.”[22] In their study, Holen and Newhouse[22] found that self prediction of how a student would do in a particular course was as good a predictor as of actual performance as any of these other methods of prediction. As a matter of fact, the “students’ prediction was as highly correlated with actual performance as college average, the best other single predictor, and more highly correlated than all other predictors.”[22]
Figure 1 entitled, “Structural Equation Model of Course Experience (CEQ), SAL (deep,
surface and strategic), HSGPA, effort (hours/week), and examination grade (PSYK100) without mediation,” demonstrates that the direction of causality between course experience and student approach to learning. This model did not appear to show independent effects of course experience as a predictor of examination grades when controlling for the effects of a students approach to learning.[13] The authors also found that course experience and demographic variables were also independent predictors of a student’s approach to learning. And thus, their

research indicates that course experience causes a student’s approach to learning. The authors also found that as far as subgroups of students, there were differences between students who did not intend to continue psychology studies as compared to the rest of the students. Those who intended to continue their studies in psychology had more favorable course experiences and approaches to learning and higher efforts and performed better on the exam as opposed to those who do not plan to continue their studies in psychology. Even though their mean high school grade point average was similar to those who did not intend to continue their studies, these students performed just as well. This may show a difference in motivation but not necessarily in academic ability.[13]
Figure 1 – Structural Equation Model of Course Experience (CEQ), SAL (deep, surface and strategic), HSGPA, effort (hours/week), and examination grade (PSYK100) without mediation[13]
In an electronics program, Barry Lunt[36] used twelve predictor variables to determine the
best predictors for students entering the electronics program. Lunt[36] found that the best predictor variables for academic success in the electronics technology program were ACT composite score, high school natural science grade point average, and ACT natural science score; however, for the electronics engineering technology program high school electronics grade point average, high school natural science grade point average, abstract conceptualization vs concreter experience and ACT natural science scores. He also found that the best predictor variables for electrical engineering were high school rank, ACT math scores, high school

electronics grade point average and high school natural science grade point average. Using their results, counselors could help guide students to a program that they may be more successful pursuing.[36] Psychological and Other Sociological Factors Still other researchers have tried to use other predictors to improve student success and gather data on student success rates. Researchers have incorporated psychological factors such as motivational variables, personality traits of student, socioeconomic factors, gender, race, expectancy and needs theories, and individual learning styles of a student.
Ramon Henson[21] states that “much of the variance in academic performance still remains unaccounted for, the search for predictors, intellective as well, as non-intellective goes on.”[21] He further asserts that the most accurate predictors are aptitude tests; however, even those are at best accurate to about 50 percent and thus much of the variance in prediction still remains unaccounted for. In his study, Henson[21] found that “the interaction between expectancy and ability accounted for more of the variance in performance than either of the two effects alone.”[21] In his study, Henson[21] suggests that we may be able to predict outcomes not based on a person’s past aptitude or grade point average, but rather, on their self esteem, dogmatism, and intrinsic or extrinsic motivation to be successful.[21]
Evidence of the use of performance comparisons in efficacy belief formation is supported by other research and supports the claim of self-efficacy theory that vicarious experiences are more influential on students who have little experience in a particular area such as in coming freshman engineering students.26 Yet, another study stated that individuals “who are less confident, experience negative interactions with peers and instructors, and hold negative perceptions of engineering are less likely to be committed to engineering and more likely to be interested in other majors. Student experiences mediate the effects of key individual characteristics.”[35]
Also, another study found that in addition to math skills, “high [sic] school academic
performance and conscientiousness were also significant predictors” of academic success in engineering.[19] Yet, in a study by Carlile8 titled, “Predicting Performance in the Teaching Profession,” the author considered the relationship between student teaching grades and the scores the student teachers made on intelligence tests, tests of teaching aptitude, grade point average in college, and Iowa State Basic Skills Exams. The author found that there was a very low relationship between the student teaching grades the students earned and intelligences tests, tests of teaching aptitude, grade point average in college, and the Iowa State Basic Skills Exams. Carlile found that these measures were not very foretelling of a student’s success or failure in the teaching profession or in student teaching courses; however, of the measures studied, college grade point average was the closest predictor of success in the student teaching courses and its efficiency was “only twelve per cent better than pure guessing.”[8] Carlile found that the highest coefficient was related to grade point average with a correlation coefficient of .46 which suggests that grade point average is effective in predicting student success.[8]

Other studies have shown that factors such as “home and class background, study habits, previous withdrawal, and expectations” might have more influence on the predictability of how well a student will do in college.[37] Other research has also shown that more analysis should be done to show similar patterns of characteristic criteria of students with like groups might be more indicative of their predictability as opposed to grade point average or scholastic aptitude tests.[37] Margrain[37] found in, “Student Characteristics and Performance,” that much of the unaccounted for variance in student performance may have more to do with their teacher’s ability, their personality, biases, as well as other variables that should be considered. Richard Klinedinst[31] studied the possibility of predicting the performance and retention of musical students in the fifth grade. In his study, Klinedinst[31] examined eleven different factors that have been linked to performance including musical aptitude, scholastic ability, math achievement, reading achievement, general music teacher rating, attitude toward music, self-concept in music, music background, motivation to achieve in music, socioeconomic status, and instrument adaptation assessment. Several important conclusion were noted:
1. During the first school year of instruction, performance achievement is best predicted by scholastic ability and academic achievement tests.
2. Although there is a significant relationship between academic achievement and student retention, other factors such as self-concept in music and family socioeconomic status play a prominent role.
3. At the present time, success on a musical instrument cannot be predicted on the basis of student physical characteristics, possibly due to difficulty in identifying the characteristics to be measured and the lack of a appropriate measuring instrument.
4. Retention of students can be predicted with much more accuracy than student dropout.
5. The validity of predicting performance achievement after less than one school year of instruction may be questionable.[31]
Todd Hoover,[23] in his paper entitled, “Performance Prediction of Students in Teacher
Education,” presented 16 characteristics for predicting performance in one course. In Table 3 titled, “Correlation Coefficients (Criterion Variable = Points Earned), Hoover[23] presents different student personality factors and their related coefficients. Hoover[23] found the most significant correlations include grade point average and humble/assertive, grade point average and tough/tender-minded and humble/assertive and tough/tender minded. The data presented by Hoover[23] suggest that grade point average and each of these sixteen different performance factors do not correlate well with the actual performance of the students in their coursework[23]. Furthermore, he shows that Factors E and I together have a coefficient of 0.1622
According to the study titled “Predictors and Correlates of Academic Performance Among Urban African American Adolescents,” African American students with unfavorable attitudes toward deviance and those who spend time involved with their families are much more likely to have better grade point averages.[40] For African American students living in public housing or similar urban settings, family characteristics, and supplementary interventions are positively correlated with higher grade point averages for these individuals. Parents and other family members support students through literacy and experiences and other types of encouragement which are important for young adolescents.[40]

Table 3 – Correlation Coefficients (Criterion Variable = Points Earned)[23]
Braddock and Dawkins[3] found in their study that “high school grades are statistically
significant determinants of college grade performance in three (two-year TWI; four-year TBI; four-year TWI) of the four comparisons made while aptitude test scores were found to be statistically significant contributors in only one (two-year TBI) of the four subgroups. Gosman[17], et al, found that “not only are black students more likely than white students to withdraw from college, but they also engage in proportionately more part-time and interrupted schooling, resulting in significantly lower four-year completion rates for blacks.”[17]
Natriello and McDill,[39] further, found that teachers’ and peers’ standards have a small
positive effect on course and outcome, and that parents’ standards have a larger negative effect. In Table 4, entitled “Interpretations of Effects in the Model of the Determinants of Student Effort and Achievement,” the authors present the two dependent variables homework and English GPA as well as the predetermined variables.[39] Using the authors’ interpretation of the effects in the model, they found that the biggest effect is the students’ gender. They found that female students devote more time to their homework than their male counterparts. Further, they found that students whose parents are highly educated and come from smaller families tend to devote more time to their homework regardless of their gender. Also, juniors tend to spend less time on their homework. Furthermore, students in a college preparatory track and who have high expectations for themselves also tend to spend more time on their homework. A teachers,

parents, and peers standards all have a positive effect on the time spend on homework; however, what is surprising is that the most significant effect was the standards of peers.[39]
Table 4 – Interpretations of Effects in the Model of the Determinants of Student Effort and
Achievement[39]
One study found that “female [sic] students spent more time on independent study,
reported more social integration, completed more credits, and were more likely to stay in engineering than were male students.”[29] Academic integration and persistence were vital for the success of both males and females in this study while social integration assured only men’s academic success. They also found that women seemed to be less likely to benefit from prior preparation during their high school years.[29]
John Young,[48] of Rutgers University, studied the effects of prediction on both men and women’s grade point average. He found that by using a single equation to estimate the grade point average for men and women led to a heavily underpredicted grade point average for women[48]. Young, further, states that “rather [sic] than condemn the use of standardized tests as summarily handicapping different segments of the population, as some individuals have done, we might do better to concern ourselves with issues such as group differences in academic
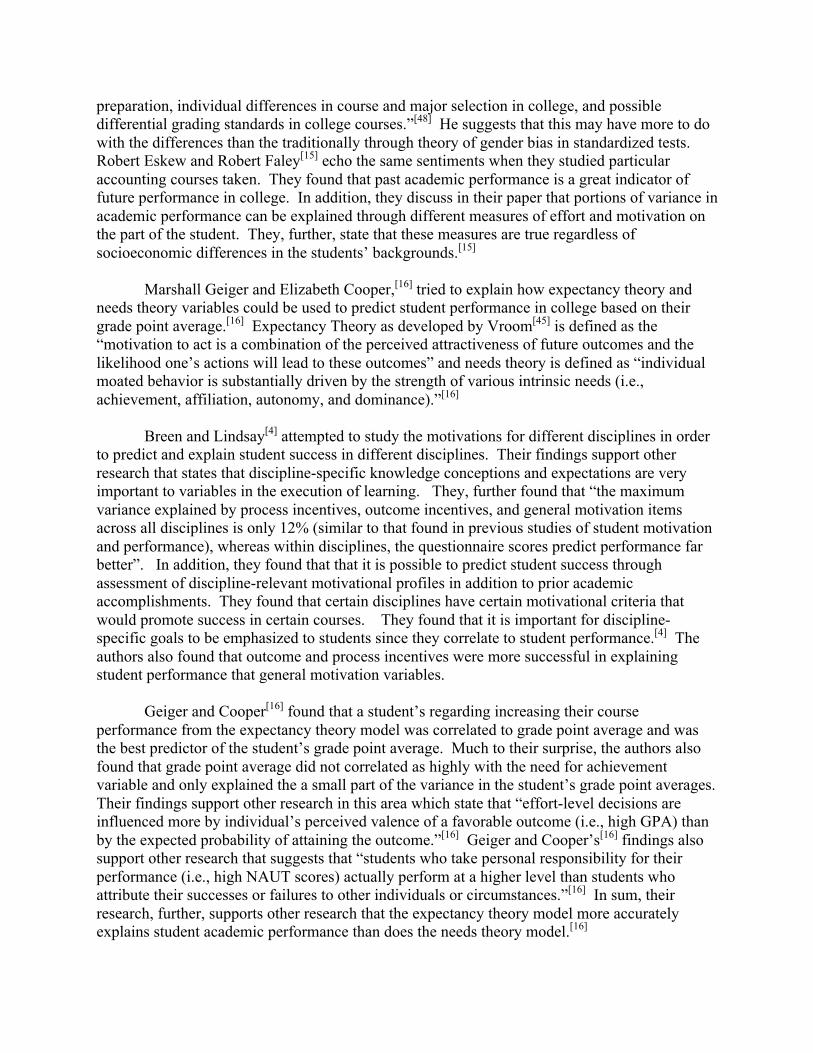
preparation, individual differences in course and major selection in college, and possible differential grading standards in college courses.”[48] He suggests that this may have more to do with the differences than the traditionally through theory of gender bias in standardized tests. Robert Eskew and Robert Faley[15] echo the same sentiments when they studied particular accounting courses taken. They found that past academic performance is a great indicator of future performance in college. In addition, they discuss in their paper that portions of variance in academic performance can be explained through different measures of effort and motivation on the part of the student. They, further, state that these measures are true regardless of socioeconomic differences in the students’ backgrounds.[15] Marshall Geiger and Elizabeth Cooper,[16] tried to explain how expectancy theory and needs theory variables could be used to predict student performance in college based on their grade point average.[16] Expectancy Theory as developed by Vroom[45] is defined as the “motivation to act is a combination of the perceived attractiveness of future outcomes and the likelihood one’s actions will lead to these outcomes” and needs theory is defined as “individual moated behavior is substantially driven by the strength of various intrinsic needs (i.e., achievement, affiliation, autonomy, and dominance).”[16] Breen and Lindsay[4] attempted to study the motivations for different disciplines in order to predict and explain student success in different disciplines. Their findings support other research that states that discipline-specific knowledge conceptions and expectations are very important to variables in the execution of learning. They, further found that “the maximum variance explained by process incentives, outcome incentives, and general motivation items across all disciplines is only 12% (similar to that found in previous studies of student motivation and performance), whereas within disciplines, the questionnaire scores predict performance far better”. In addition, they found that that it is possible to predict student success through assessment of discipline-relevant motivational profiles in addition to prior academic accomplishments. They found that certain disciplines have certain motivational criteria that would promote success in certain courses. They found that it is important for discipline-specific goals to be emphasized to students since they correlate to student performance.[4] The authors also found that outcome and process incentives were more successful in explaining student performance that general motivation variables. Geiger and Cooper[16] found that a student’s regarding increasing their course performance from the expectancy theory model was correlated to grade point average and was the best predictor of the student’s grade point average. Much to their surprise, the authors also found that grade point average did not correlated as highly with the need for achievement variable and only explained the a small part of the variance in the student’s grade point averages. Their findings support other research in this area which state that “effort-level decisions are influenced more by individual’s perceived valence of a favorable outcome (i.e., high GPA) than by the expected probability of attaining the outcome.”[16] Geiger and Cooper’s[16] findings also support other research that suggests that “students who take personal responsibility for their performance (i.e., high NAUT scores) actually perform at a higher level than students who attribute their successes or failures to other individuals or circumstances.”[16] In sum, their research, further, supports other research that the expectancy theory model more accurately explains student academic performance than does the needs theory model.[16]

Incentives are often thought to inspire and provide motivation for students. In one study by Dong Jeong,[27] the impact of AP exam incentives on the outcomes of the exams. Some incentives include exemption from the exam fees or other subsidies for AP programs were investigated. Jeong[27] found that AP test fee exemptions are related to an increase in the participation of the course enrollees for socioeconomically disadvantaged populations and thereby can serve as an important role in reducing socioeconomic disparities between students. Further, Jeong[27] found “little evidence that state-sponsored AP incentives (performance-based) are associated with an increase in the odds of the enrollment and success of students on the exam.”[27] Of interest and note is that Jeong[27] found that minorities and socioeconomically disadvantaged students are much less likely than their peers to do well on the AP exam. This study is evident that fee exemption alone is not sufficient enough to close the achievement gap in AP performance.[27] Still other studies have considered the applicability of race, gender, socio-economic status, grade point average, high school curriculum, and study habits of students to predict college success.
Braddock and Dawkins3 studied these particular criteria, and found that “both intellective and nonintellective factors may influence academic success in college; the relative importance of specific predictors (intellective or nonintellective) varies across type of college setting; and predicting black academic achievement is more problematic in traditionally white than traditionally black colleges and universities”. Table 5 presents the correlation matrix of all variables used in their study. In addition, other studies have found that higher graduation rates were associated with lower racism and discrimination perceptions of students.[5]
Table 5 -- Correlation Matrix of All Variables[3]

External Factors Natriello and McDill[39] studied the effects of teachers’, parents’, and peers’ standards on
student effort and achievement. Figure 2 entitled, “A Model of the Determinants of Student Effort and Achievement,” presents the factors considered by Natriello and McDill.[39] They presented research that suggests that homework has a positive effect on a students’ success in a course. Their research also suggested that females tend to complete their homework more often than their male counterparts.
Lee, Courtney, and Balassi[33] found in their study that by using an online homework tool called Aplia rather than using instructor assigned and graded homework that student success as measured by a standardized test in microeconomics did not appear to improve student success. They echo other research that suggests what improvement students perceived might be attributed to the text used student effort including their attendance, class size, and teach/student interaction both in and out of the classroom environment. While there was some improvement was seen in the standardized test scores, this could be due to more effort on the part of the student rather than the fact that homework was available online through the use of Aplia.[33]
Figure 2 – A Model of the Determinants of Student Effort and Achievement[39]
As most of the literature on student performance indicators has presented variables such as standardized test scores, prior academic performance, and previous experience in a particular area, or learning styles in predicting student success, Boatman, Courtney and Lee[2] presented a study suggesting a strong visual learning preference positively influences student performance. They, further, reported that ethnicity nor gender influence student performance but rather that ethnicity and gender-based differences in student performance might be caused by differences in

learning styles. They used a questionnaire that determined a student’s learning style whether it be visual, aural/auditory, read/write, or kinesthetic. They found in their study, that high school GPA and math SAT score are both highly significant and positive with the score in the economics course they were trying to predict. Their emphasis was on learning styles. In this introductory economics course, those students with a strong preference for visual learning did much better than their counterparts. Even those economics instructors used in the study with non-visual preferences had students that were primarily visual learners performed better. Their study also indicated that for those students that actually pass the introductory economics course had a preference for processing information that is presented textually seemed to have an advantage over other students which suggests that the textbook selection process may be extremely important.[33] In addition, this study presented finding that while SAT verbal scores do not seem to influence student performance in an introductory economics course, SAT math scores are highly significant determinants of student success in this course.[33] As a matter of fact, in research performed by Grodner and Rupp,[18] they found that students that were required to do homework had higher retention rates and higher test scores as well as better grades and lower failure rates as compared with students that were not required to complete homework. In addition, these students also had significantly higher retention rates in the course as opposed to the students that were not required to complete homework. Further, students that were required to complete homework earned on average 10 to 14 percent better on exam scores than their non-homework counterparts.[18] Also, Natriello and McDill[39] found that regarding English GPA several variables had a positive effect. Some of these variables include mother’s educational level, student’s gender, and number of siblings. These are enhanced by a student’s aspirations, expectations, curriculum, and performance standards.[39] Natriello and McDill[39] surmise the following: School-based evaluators (teachers and peers) are more likely to set high standards for
students able to deal with a challenge, and these standards are more effective in generating effort on homework and higher achievement than the standards set by home-based evaluators (parents) which are more likely to be established for students less able to deal with a challenge. Nonetheless, some very small portion for the increased standards does result in increased effort and achievement.[39]
Eskew and Faley’s[15] study sought to present findings that would correlate previous hours earned in high school to subsequent related courses in college particularly those related to accounting. They studied, specifically, how well students would do on examinations in a first year accounting course in college. In their research, they concluded; however, that SAT scores, previous and more recent academic performance in a related field, effort and motivation, pre-college study of accounting and/or bookkeeping are significantly related to performance on examinations in an introductory college accounting course.[15] In another study, student performance was determined by tracking the number of assignments attempted, the average assignment grade, and the number of tutorials attended for a course in finite mathematics. The researchers tracked twenty-two variables related to time, previous mathematical experience, academic performance, attitude, self concept, and test anxiety. They found correlations between average grade in the mathematics course and

quantitative ability as determined by a mathematics pretest. The research also showed that students of mathematics did have an “underlying sense of enjoyment that is associated with their past and present performances, their self-concepts, and final performances, and that is working toward interacting in the appropriate directions with test anxiety.”[47] Watson,[47] also, found a positive correlation between tutorial attendance and test examination performance. Watson corroborated the results of other researchers by finding that success at high school, general quantitative ability as determined by the pretest given, and preceding numerical courses taken could help predict the final grade in this finite course. Further, the author found that “80% overall success rate of the model in predicting passes and failures may encourage students to take heed of warnings it makes even at the lower end of predicted success.”[47] In another study, researchers found that spending one extra hour of class contact time on a statics class had only a minor and statistically insignificant effect on the final course grade.[6] One interesting note on the practice of tutorial attendance was brought to light by Huang[24] who states “that most American students use test preparation after school for remedial purposes, but those with favorable socioeconomic backgrounds are more likely to use it as an enrichment strategy.”[24] Further, attending after school tutorials does not necessarily mean higher level performance by those that attend, but rather more variables are in effect such as the content and mode of delivery for the tutorials, motivation of the students as well as the intensity, duration and timing of the tutoring provided. Huang[24] also found that “participation in mathematics tutoring after school does not widen the achievement gap in mathematics. The same applies to science tutoring.”[24] Huang,[24] further, asserts that when used as an enrichment strategy, mathematics for remedial purposes may not be as effective, but for science, it is more effective.[24] In one related research endeavor, Hughes[25] studied the importance of peer-assisted learning for student performance in a human anatomy and physiology course. Hughes[25] met with the peer leaders and trained them prior to the study taking place. Data was collected which included the final course average, peer-leader session attendance, and overall GPA. The author found that the best time for tutoring was immediately after class. Further, the study showed that students that attended at least six sessions had a higher final course average than their peers.[25]
Another study regarding students in a masters in social work program tried to show correlations regarding students in the same course and different instructors and how well the students performed in a graduate research course. The authors, Rosenthal and Wilson,[42] found that “although [sic] there was considerable variation in professional backgrounds and teaching styles among the four instructors teaching the course, student performance in the course did not differentiate across instructors and the different instructors were not differentially effective with students of different characteristics.”[42] Rosenthal and Wilson[42] found that differences in how well the students in their study did based on they type of first degree earned. Specifically, they found that BSW students as opposed to BA students had a lower level of cognitive development and supported their research with other similar studies that found that BSW students had lower GRE scores than their BA

equivalents. They also found that BSW students tended to have inflated grade point averages. In addition, they found that “undergraduate [sic] social service majors as a group performed less well; however, among all students (social service majors as well as other majors), those who had a lower undergraduate GPA performed less well than those with higher GPAs.”[42]
Often, student performance is linked to how well an instructor teaches but evaluating professors can be extremely difficult as some students evaluate professors “better” if they are “easy” and evaluate professors as “bad” if they encourage deep, analytical thinking. One study found that in an introductory calculus course professors significantly affect student achievement in the course and in follow-on related courses.[9] This same study also found that less experienced and less qualified professors produce students who fare well in introductory courses but more experienced and more qualified professors produced students who fared better in follow-on courses. They assert that perhaps this discrepancy may be attributed to less experienced professors adhering to curriculum more strictly and more experienced instructors bringing in more experience to enhance learning they know will be needed in follow-on courses.[9] But, perhaps it is not how well the instructor teaches, but more what approach to learning is promoted in a class. One study describes the Growing Teaching approach as the most successful approach to teaching construction engineers while the students should adopt the Achieving Motive learning approach for learning in order to improve course grades.[34]
In “Active Learning in Large Classes: Can Small Interventions Produce Greater Results
Than Are Statistically Predictable?”[1] the author presents a study of first year students who participated in a course that was mainly taught through lecture. The study sought to add active learning by using blogs and discussion groups online to augment learning from the course. Each of the postings was correlated to each of the exams in the course. The data suggest that “small changes in class structure produce larger gains in the student learning than would be predicted by the percentage of the final grade that the active learning activities constitute.”[1]
“Blogs provide a dynamic interactive medium for online discussion, combining text,
images, and links to other content to allow ‘bloggers’ an outlet in which to provide commentary on whatever topic interests them.”[7] Michael Cameron[7] found in his research that a blog assignment as used as part of on an introductory economics courses was associated with student ability, gender and student perception of the blog. In fact, he found that students with experience in economics did not appear to out perform students without previous economics experiences. In addition, he found that student performance was positively correlated with the quality of their blog participation which suggests that if students were more focused on the blog assignment, then student performance in the course would improve.[7] The study by Kennelly, Considine, and Flannery,[30] found that using online versus paper based assignments in one economics class that there was little effect on the student’s performance on the exam. Regardless of how the assignment is completed had little effect on performance on that portion of the exam. They did find; however, that the online assignments were more likely to be completed by the students as opposed to the paper assignments, but again regardless of whether it was paper or online had little effect on the performance.[30]
Another key component to learning is the physical, social, and teacher management style.
Cheng,[11] in his study, describes the relationship between the classroom environment and
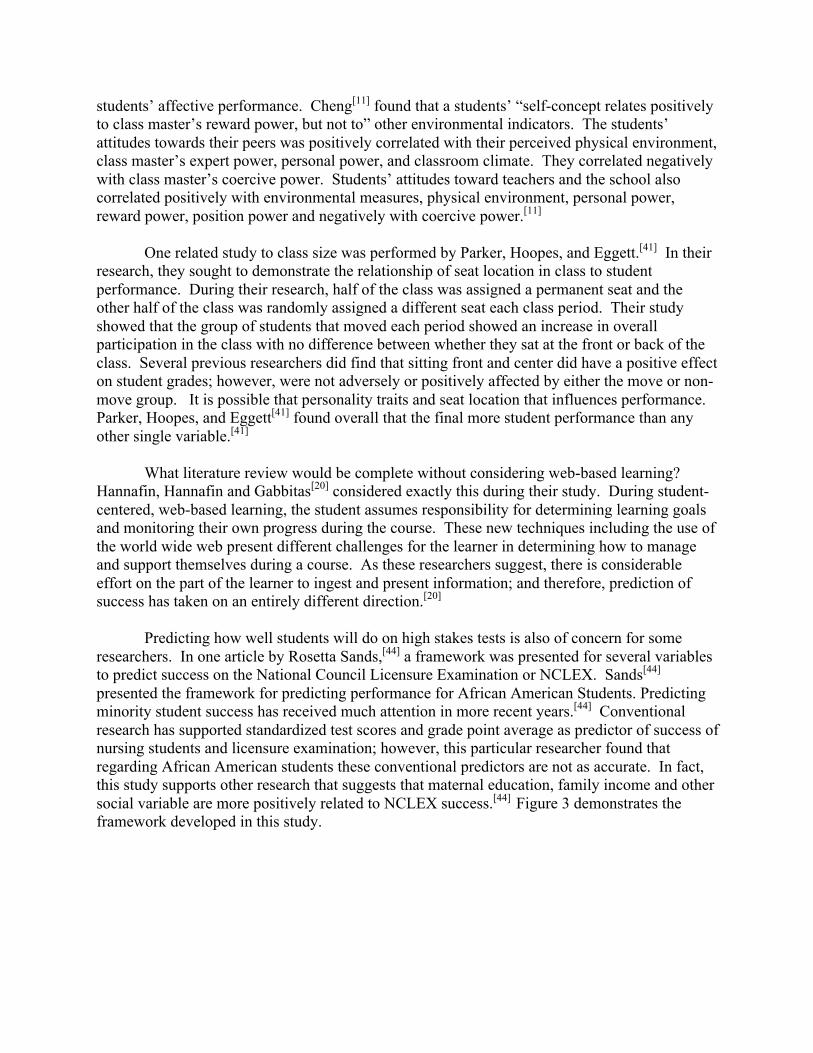
students’ affective performance. Cheng[11] found that a students’ “self-concept relates positively to class master’s reward power, but not to” other environmental indicators. The students’ attitudes towards their peers was positively correlated with their perceived physical environment, class master’s expert power, personal power, and classroom climate. They correlated negatively with class master’s coercive power. Students’ attitudes toward teachers and the school also correlated positively with environmental measures, physical environment, personal power, reward power, position power and negatively with coercive power.[11]
One related study to class size was performed by Parker, Hoopes, and Eggett.[41] In their
research, they sought to demonstrate the relationship of seat location in class to student performance. During their research, half of the class was assigned a permanent seat and the other half of the class was randomly assigned a different seat each class period. Their study showed that the group of students that moved each period showed an increase in overall participation in the class with no difference between whether they sat at the front or back of the class. Several previous researchers did find that sitting front and center did have a positive effect on student grades; however, were not adversely or positively affected by either the move or non-move group. It is possible that personality traits and seat location that influences performance. Parker, Hoopes, and Eggett[41] found overall that the final more student performance than any other single variable.[41]
What literature review would be complete without considering web-based learning?
Hannafin, Hannafin and Gabbitas[20] considered exactly this during their study. During student-centered, web-based learning, the student assumes responsibility for determining learning goals and monitoring their own progress during the course. These new techniques including the use of the world wide web present different challenges for the learner in determining how to manage and support themselves during a course. As these researchers suggest, there is considerable effort on the part of the learner to ingest and present information; and therefore, prediction of success has taken on an entirely different direction.[20] Predicting how well students will do on high stakes tests is also of concern for some researchers. In one article by Rosetta Sands,[44] a framework was presented for several variables to predict success on the National Council Licensure Examination or NCLEX. Sands[44] presented the framework for predicting performance for African American Students. Predicting minority student success has received much attention in more recent years.[44] Conventional research has supported standardized test scores and grade point average as predictor of success of nursing students and licensure examination; however, this particular researcher found that regarding African American students these conventional predictors are not as accurate. In fact, this study supports other research that suggests that maternal education, family income and other social variable are more positively related to NCLEX success.[44] Figure 3 demonstrates the framework developed in this study.
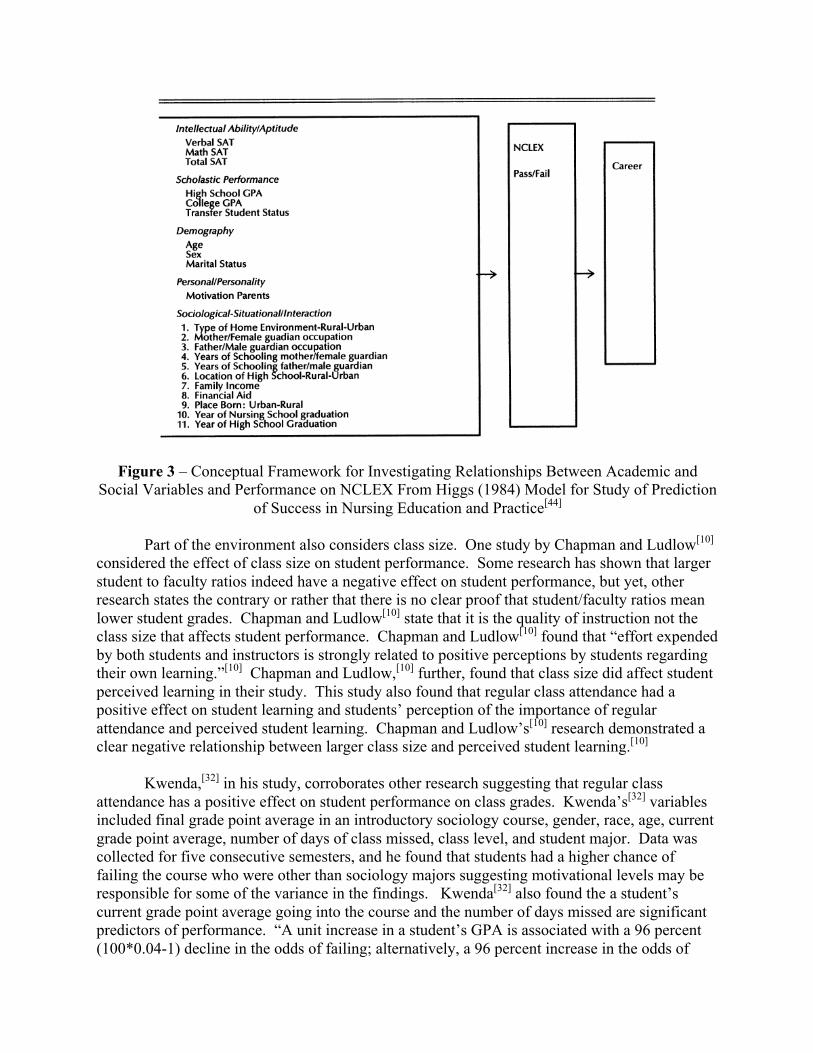
Figure 3 – Conceptual Framework for Investigating Relationships Between Academic and Social Variables and Performance on NCLEX From Higgs (1984) Model for Study of Prediction
of Success in Nursing Education and Practice[44]
Part of the environment also considers class size. One study by Chapman and Ludlow[10] considered the effect of class size on student performance. Some research has shown that larger student to faculty ratios indeed have a negative effect on student performance, but yet, other research states the contrary or rather that there is no clear proof that student/faculty ratios mean lower student grades. Chapman and Ludlow[10] state that it is the quality of instruction not the class size that affects student performance. Chapman and Ludlow[10] found that “effort expended by both students and instructors is strongly related to positive perceptions by students regarding their own learning.”[10] Chapman and Ludlow,[10] further, found that class size did affect student perceived learning in their study. This study also found that regular class attendance had a positive effect on student learning and students’ perception of the importance of regular attendance and perceived student learning. Chapman and Ludlow’s[10] research demonstrated a clear negative relationship between larger class size and perceived student learning.[10]
Kwenda,[32] in his study, corroborates other research suggesting that regular class attendance has a positive effect on student performance on class grades. Kwenda’s[32] variables included final grade point average in an introductory sociology course, gender, race, age, current grade point average, number of days of class missed, class level, and student major. Data was collected for five consecutive semesters, and he found that students had a higher chance of failing the course who were other than sociology majors suggesting motivational levels may be responsible for some of the variance in the findings. Kwenda[32] also found the a student’s current grade point average going into the course and the number of days missed are significant predictors of performance. “A unit increase in a student’s GPA is associated with a 96 percent (100*0.04-1) decline in the odds of failing; alternatively, a 96 percent increase in the odds of

passing the class.”[32] He found that students who do well in other classes are more likely to do well in an introductory sociology course and that for each additional day of class missed, increases the odds of failing the course by almost half. An interesting note in this study was that for minority students the underlying disadvantage was not in passing the course but rather when it came to getting an A in the course. Kwenda[32] found that , as in other studies, grade point average is indicative of success in this introductory sociology course as well.[32]
Johnson[28] echoes similar sentiments regarding class size in her study published in an article called, “Class Size and Student Performance at a Public Research University: A Cross-Classified Model.” In this study, the author accounted for students and classes within a wide range of class sizes across different disciplines at a single institution. The study provided data of a negative effect of class size on grade performance. It further shows that as the class size increases, the students’ performance decreases.[28] The model presented by Johnson[28] suggests that “ the effect of increasing class size is more pronounced in Engineering, Biology, and Social Science.”[28] Crede, Roch, and Kieszczynka[12] studied the relationship between class attendance with grades and various student characteristics. They also found that attendance has a strong positive relationship with student performance. They found that class attendance is a better predictor of academic performance than traditional measures including standardized tests such as the SAT, high school grade point average, a student’s study habits and study skills. A summary figure of the possible relationships among class attendance, grades and student characteristics is shown in Figure 4.[12] Crede, et al.,[12] found that student attendance is a better predictor of college performance than any previous predictors including SAT scores, high school grade point average, student study skills, or time spent studying. They did state that student behavior while in class is equally important as a student that is simply physically present and is not taking notes, or engaged in active listening will not fare as well as others with similar attendance levels. They also recognize that individual difference variables such as self-control, delayed gratification, etc. may exhibit stronger relationships with attendance than those variables studied in this current study.[12] Lessons Learned
Table 6 provides a brief summary of the review of the literature in this area. The table presents the three types of factors, examples considered in each area, along with the most significant contribution or effect in that area. What can be surmised from this table is that much research is still needed in this area in order to understand and predict the success rate for students in college level courses. What the literature suggests is that perhaps there is not a “one size fits all” approach that should be taken for every course or for each discipline, but rather, perhaps we should begin to look at specific courses to see if we can predict how a student will fare in one particular course and when the most accurate prediction can be made in that particular course for in-course intervention.
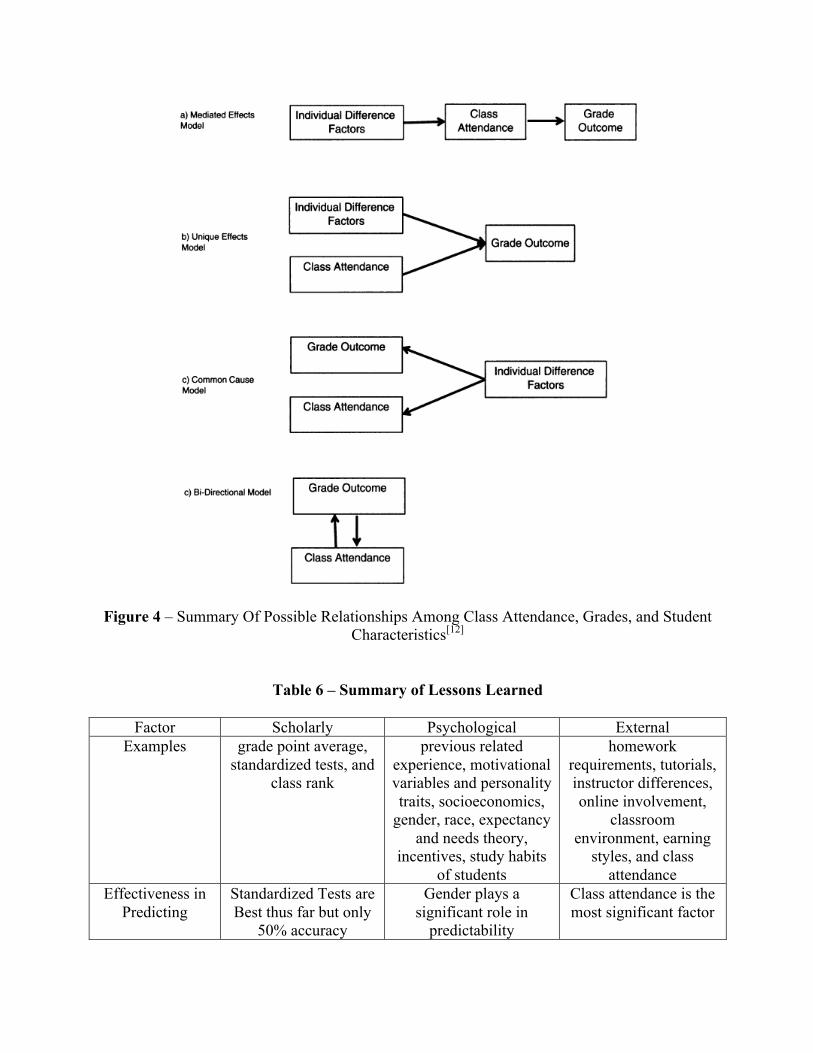
Figure 4 – Summary Of Possible Relationships Among Class Attendance, Grades, and Student Characteristics[12]
Table 6 – Summary of Lessons Learned
Factor Scholarly Psychological External Examples grade point average,
standardized tests, and class rank
previous related experience, motivational variables and personality traits, socioeconomics,
gender, race, expectancy and needs theory,
incentives, study habits of students
homework requirements, tutorials, instructor differences, online involvement,
classroom environment, earning
styles, and class attendance
Effectiveness in Predicting
Standardized Tests are Best thus far but only
50% accuracy
Gender plays a significant role in
predictability
Class attendance is the most significant factor

Summary and Opportunities for Research
The following can be concluded from the review of the state of the art of the research of this paper carried out in this paper.
• When researching the predictors for success in Engineering coursework an overwhelming list of publications produced by universities, licensing agencies, and various establishments will be found. The available research enumerates various tools and factors that are important in predicting success in Engineering as well as other courses of study. What can be surmised as is that researchers are interested in retaining and making sure that their students are successful no matter what their discipline may be. There is an increased need for a common list of factors that are important in defining what makes a student successful. The analysis of the work reviewed in this paper suggests that for successful student development there is a need for: o A better tool for predicting success in college. o By predicting early success or failure, colleges and universities can identify earlier
students that may not be successful and can begin to provide various interventions that will aide the student in staying in college and also in their chosen discipline.
o Due to the shortages in Engineering and other STEM related disciplines, researching and implementing critical retention strategies has become an important area of study.
• The points listed above are not only critical to the academic world, but are also important to the business world that look to the academic community to provide technically skilled workers so needed for the success of their future.
• The available research indicates that there are differences in the factors best for predicting success of students. There are a myriad of known and analyzed standard predictors such high SAT scores, high school GPAs, etc. to determine which students will have the highest rate of success upon entering college level work. There is a berth of active measures to be implemented once a student is in a college level course. Early predictors allow for early intervention to help improve student success in course completion. This area of research needs much more attention.
In summary, this paper began by reviewing the importance of predicting student success
in college. Many studies and predictor variables were presented to impress upon the reader the importance and significance of this study and insights into what variables may be significant in predicting student success in college. This paper, further, included an explanation of the various variables that have been included in various studies. The explorations of the variables and various interventions that have been presented provide a foundational knowledge for future theory development. This summary concludes with the suggestion that a model should be presented that can predict the success of an individual in any college course including an Engineering Economics course. Several models and variables have been identified that showed promise, but further research is necessary. Finally, the methodical integration of these variables demonstrates knowledge of systems. With the incorporation of this knowledge, a forging of a good model to prevent engineering student failures caused by inherent variables begins.
Bibliography [1] Adrian, L. M. (2010). Active learning in large classes: Can small interventions produce greater results than are
statistically predictable? The Journal of General Education, 59(4), 223-237.
[2] Boatman, K., Courtney, R., & Lee, W. (2008). "See How They Learn": The impact of faculty and student learning styles on student performance in introductory economics. The American Economist, 52(1), 39-48.
[3] Braddock, J. H., & Dawkins, M. P. (1981). Predicting black academic achievement in higher education. Journal of Negro Education, 50(3), 319-327.
[4] Breen, R., & Lindsay, R. (2002). Different disciplines require different motivations for student success. Research in Higher Education, 43(6), 693-725.
[5] Brown, A. R., Morning, C., & Watkins, C. (2005). Influence of African American engineering student perceptions of campus climate on graduation rates. Journal of Engineering Education, 263-271.
[6] Burkhardt, J. (2013). The effectiveness of additional class contact time on student performance in statics. International Journal of Mechanical Engineering Education, 169-177.
[7] Cameron, M. (2012, October). ‘Economics with Training Wheels’: Using blogs in teaching and assessing introductory economics . The Journal of Economic Education, 43(4), 397-407.
[8] Carlile, A. B. (1954, May). Predicting performance in the teaching profession. The Journal of Educational Research, 47(9), 641-668.
[9] Carrell, S. E., & West, J. E. (2010, June). Does professor quality matter? Evidence from random assignment of students to professors. Journal of Political Economy, 118(3), 409-432.
[10] Chapman, L., & Ludlow, L. (2010). Can downsizing college class sizes augment student outcomes? An investigation of the effects of class size on student learning. The Journal of General Education, 59(2), 105-123.
[11] Cheng, Y. C. (1994). Classroom environment and student affective performance: An effective profile. The Journal of Experimental Education, 62(3), 221-239.
[12] Crede, M., Roch, S. G., & Kieszczynka, U. M. (2010, June). Class attendance in college: A meta-analytic review of the relationship of class attendance with grades and student characteristics. Review of Educational Research, 80(2), 272-295.
[13] Diseth, A., Pallesen, S., Brunborg, G. S., & Larsen, S. (2010, Mar). Academic achievement among first semester undergraduate psychology students: The role of course experience, effort, motives, and learning stategies . Higher Education, 59(3), 335-352.
[14] Egan, P. J., & Ferre, V. A. (1989). Predicting performance on the National Teacher Examination Core Battery. The Journal of Educational Research, 82(4), 227-230.
[15] Eskew, R. K., & Faley, R. H. (1988, Jan). Determinants of student performance in the first college-level financial accounting course . The Accounting Review, 63(1), 137-147.

[16] Geiger, M. A., & Cooper, E. A. (1995). Predicting academic performance: The impact of expectancy and needs theory. The Journal of Experimental Education, 63(3), 251-262.
[17] Gosman, E. J., Dandridge, B. A., Nettles, M. T., & Thoeny, A. R. (1983). Predicting student progression: The influence of race and other student institutional characteristics on college student performance. Research in Higher Education, 18(2), 209-236.
[18] Grodner, A., & Rupp, N. G. (2013). The role of homework in student learning outcomes: Evidence from a field experiment. The Journal of Economic Education, 44(2), 93-109.
[19] Hall, C. W., Kauffmann, P. J., Wuensch, K. L., Swart, W. E., DeUrquidi, K. A., Griffen, O. H., & Duncan, C. S. (2015). Aptitude and personality traits in retention of engineering students. Journal of Engineering Education , 167-188.
[20] Hannafin, M., Hannafin, K., & Gabbitas, B. (2009). Re-examining cognition during student-centered, web-based learning. Educational Technology Research and Development, 57(6), 767-785.
[21] Henson, R. (1976). Expectancy beliefs, ability, and personality in predicting academic performance. The Journal of Educational Research, 70(1), 41-44.
[22] Holen, M. C., & Newhouse, R. C. (1976, Feb). Student self-prediction of academic achievement. The Journal of Educational Research, 69(6), 219-220.
[23] Hoover, T. (1979). Preformance prediction of students in teacher education. The Journal of Experimental Education, 47(3), 192-195.
[24] Huang, M. H. (2013, November). After-School tutoring and the distribution of student performance . Comparative Education Review , 57(4), 689-710.
[25] Hughes, K. S. (2011, March). Peer-Assisted learning strategies in human anatomy and physiology . The American Biology Teacher, 73(3), 144-147.
[26] Hutchinson-Green, M. A., Follman, D. K., & Bodner, G. M. (2008). Providing a voice: Qualitative investigation of the impact of a First-Year engineering experience on students' efficacy beliefs. Journal of Engineering Education, 177-190.
[27] Jeong, D. W. (2009). Student participation and performance on advanced placement exams: Do state-sponsored incentives make a difference? Educational Evaluation and Policy Analysis, 31(4), 346-366.
[28] Johnson, I. Y. (2010, Dec). Class size and student performance at a public research university: A cross-classified model. Research in Higher Education, 51(8), 701-723.
[29] Kamphorst, J. C., Hofman, W. H., Jansen, E. P., & Terlouw, C. (2015). Explaining academic success in engineering degree programs: Do female and male students differ? Journal of Engineering Education, 189-211.
[30] Kennelly, B., Considine, J., & Flannery, D. (2011, April). Online assignmentsin economics: A test of their effectiveness. The Journal of Economic Education, 42(2), 136-146.
[31] Klinedinst, R. E. (1991). Predicting performance achievement and retention of fifth-grade instrumental students. Journal of Research in Music Education, 39(3), 225-238.

[32] Kwenda, M. (2011, April). Factors affecting performance in an introductory sociology course. College Teaching, 59(2), 60-65.
[33] Lee, W., Courtney, R. H., & Balassi, S. J. (2010, May). Do online homework tools improve student results in principles of microeconomics courses? The American Economic Review, 100(2), 283-286.
[34] Ling, F. Y., Ng, P. K., & Leung, M. (2011). Predicting the academic performance of construction engineering students by teaching and learning approaches: Case study. Journal of Professional Issues in Engineering Education & Practice, 277-284.
[35] Litzler, E., & Young, J. (2012). Understanding the risk of attrition in undergraduate engineering: Results from the project to assess the climate in engineering. Journal of Engineering Education, 319-345.
[36] Lunt, B. M. (1996). Predicting academic success in electronics. Journal of Science Education and Technology, 5(3), 235-240.
[37] Margrain, S. A. (1978). Student characteristics and academic performance in higher education: A review. Research in Higher Education, 8(2), 111-123.
[38] Marsh, C. M., Vandehey, M. A., & Diekhoff, G. M. (2008). A comparison of an introductory course to SAT/ACT Scores in predicting student performance . The Journal of General Education, 57(4), 244-255.
[39] Natriello, G., & McDill, E. L. (1986, Jan). Performance standards, student effort on homework, and academic achievement. Sociology of Education, 59(1), 18-31.
[40] Nebbitt, V. E., Lombe, M., Lapoint, V., & Bryant, D. (2009). Predictors and correlates of academic performance among urban African Amerian adolescents. Journal of Negro Education, 78(1), 29-41.
[41] Parker, T., Hoopes, O., & Eggett, D. (2011, April). The effect of seat location and movement or permanence on student-initiated participation. College Teaching, 59(2), 79-84.
[42] Rosenthal, B. S., & Wilson, W. C. (1992). Student factors affecting performance in an MSW research and statistics course. Journal of Social Work Education, 28(1), 77-84.
[43] Rubin, D. B., & Stroud, T. W. (1977). Comparing high schools with respect to student performance in university. Journal of Educational Statistics, 2(2), 139-155.
[44] Sands, R. F. (1988). Predictive potential of social variables for Black nursing students' performance on the National Council Licensure Examination. The Journal of Negro Education, 57(4), 502-511.
[45] Vroom, V. (1964). Work and motivation. New York: Wiley.
[46] Wagner, M. E., & E., S. (1937, May). Predicting performance in college English. The Journal of Educational Research, 30(9), 694-699.
[47] Watson, J. M. (1988). Student characteristics and prediction of success in a conventional university mathematics course. The Journal of Experimental Education, 56(4), 203-212.
[48] Young, J. W. (1991). Gender bias in predicting college academic performance: A new approach using item response theory. Journal of Educational Measurement, 28(1), 37-47.