Embed Size (px)
Citation preview
1
The Regional Government of Oromia
The Financial Management Performance of the
Oromia Government (PEFA Report)
June 2015
World Bank Oromia PEFA Assessment
2
CURRENCY AND EXCHANGE RATES Currency unit = Ethiopian birr (ETB)
US$1 = ETB 19.56 (as of May 30, 2014)
Ethiopian Fiscal Year (EFY): July 8 – July 7
EFY 2005 = Gregorian FY 2013 (July 1, 2012 – June 30, 2013)
In this document the term FY refers to the Gregorian fiscal year and is not the same as the term EFY.
I
Table of Contents
Tables II
Acronyms and Abbreviations ..................................................................................................................... IV
Summary Assessment .................................................................................................................................... 1
Integrated Assessment of Public Financial Management (PFM) Performance .................................................. 1 Assessment of the Impact of PFM Weaknesses ................................................................................................................ 3 1. Introduction 7
1.1 Background and Objectives .............................................................................................................................................. 7 1.2 Scope .......................................................................................................................................................................................... 7 1.3 Process of the Regional Assessment ............................................................................................................................. 8 1.4 Donor Harmonization ......................................................................................................................................................... 9 1.5 Quality Assurance ................................................................................................................................................................. 9 1.6 Structure of the Report .................................................................................................................................................... 10 2. Country Background Information ......................................................................................................... 11
2.2 Budgetary Outcomes ........................................................................................................................................................ 12 2.3 Legal and Institutional Framework ............................................................................................................................ 13 3. Assessment of the Public Financial Management (PFM) Systems, Processes, and Institutions ....... 15
3.1 Budget Credibility .............................................................................................................................................................. 15 3.2 Comprehensiveness and Transparency .................................................................................................................... 22 3.3 Policy-Based Budgeting ................................................................................................................................................... 32 3.4 Predictability and Control in Budget Execution ................................................................................................... 35 3.5 Accounting, Recording, and Reporting ...................................................................................................................... 52 3.6 External Scrutiny and Audit ........................................................................................................................................... 58 3.7 Donor Practices ................................................................................................................................................................... 64 4. Government Reform Process .................................................................................................................. 67
4.1 Recent and Ongoing Reforms ....................................................................................................................................... 67 4.2 Institutional Factors Supporting Reform planning and Implementation .................................................. 68 Appendix A. Summary of Indicator Scores ............................................................................................... 70
Appendix B. Persons Seen ........................................................................................................................... 78
Appendix C. Documents Seen ..................................................................................................................... 80
Appendix D. Oromia BOFED Organization Chart .................................................................................. 81
Appendix E. PI-1 and PI-2 Calculations .................................................................................................... 82
Appendix F. PI-3 Calculation ..................................................................................................................... 84
Appendix G. Calculation of HLG-1 Variance ........................................................................................... 85
World Bank Oromia PEFA Assessment
II
Tables
Table SA.1 PEFA Performance Indicators for the Oromia Government, 2010–14
Table 1.1 Structure of Oromia State Government
Table 2.1 Budget Outcomes, FYs 2010/11–2012/13
Table 2.2 Actual Budgetary Allocations by Economic Classification (as % of total expenditure)
Table 3.1 Transfers from Federal Government to Oromia State Government
Table 3.2 HLG-1 Results
Table 3.3 Expenditure Out-turns Compared with Revenue Out-turns
Table 3.4 PI-1 Results
Table 3.5 PI-2 Results
Table 3.6 Analysis of Revenue Variance, FYs 2010/11–2012/13 (EFYs 2003–5)
Table 3.7 PI-3 Results
Table 3.8 Arrears of Expenditures, End of FY 2010/11 to End of FY 2012/13
Table 3.9 PI-4 Results
Table 3.10 PI-5 Results
Table 3.11 Information in Budget Documentation for FY 2013/14
Table 3.12 PI-6 Results
Table 3.13 Extra-budgetary Expenditure, FY 2012/13 (ETB, millions)
Table 3.14 PI-7 Results
Table 3.15 PI-8 Results
Table 3.16 PI-9 Results
Table 3.17 Number of the Required Elements of Information to Which the Public Has Access
Table 3.18 PI-10 Results
Table 3.19 PI-11 Results
Table 3.20 PI-12 Results
Table 3.21 PI-13 Results
Table 3.22 PI-14 Results
Table 3.23 Collection of Tax Arrears (ETB, millions)
Table 3.24 PI-15 Results
Table 3.25 PI-16 Results
Table 3.26 PI-17 Results
Table 3.27 PI-18 Results
Table 3.28 Transparency in Procurement
Table 3.29 Procurement Review Requirements
Table 3.30 PI-19 Results
Table 3.31 PI-20 Results
Table 3.32 PI-21 Results
Table 3.33 PI-22 Results
Table 3.34 PI-23 Results
Table 3.35 PI-24 Results
Table 3.36 Timeliness of Financial Statements Submission to ORAG
Table 3.37 PI-25 Results
Table 3.38 Timeliness of Audit of Financial Statements by ORAG
Table 3.39 PI-26 Results
Table 3.40 PI-27 Results
Table 3.41 PI-28 Results
Table 3.42 Forecast and Actual Program and Project Support (ETB, millions)
Table 3.43 D-2 Results
Table 3.44 Share of Aid Using National Procedures

World Bank Oromia PEFA Assessment
III
Table 3.45 D-3 Results
Table E.1 Fiscal Years for Assessment
Table E.2 Data for Fiscal Year 2010/11 (ETB, millions)
Table E.3 Data for Fiscal Year 2011/12 (ETB, millions)
Table E.4 Data for Fiscal Year 2012/13 (ETB, millions)
Table E.5 Results Matrix
Table G.1 Fiscal Years for Assessment
Table G.2 Data for Fiscal Year 2011/12 (ETB, millions)
Table G.3 Data for Fiscal Year 2012/13 (ETB, millions)
Table G.45 Results Matrix
World Bank Oromia PEFA Assessment
IV
Acronyms and Abbreviations
ADB/ADF African Development Bank/African Development Fund
AGA Autonomous Government Agency (PEFA term)
BFC Budget and Finance Committee, House of People’s Representatives
BI Budget institutions (ministries, agencies, institutions, and other budgetary units)
BoE Bank of Ethiopia
BoFED Bureau of Finance and Economic Development
CBE Commercial Bank of Ethiopia
COFOG Classification of Functions of Government
CRB Complaints Review Board (procurement)
CSRP Civil Service Reform Program
DFID Department for International Development (UK)
EBO Extra Budgetary Operation
EFY Ethiopian fiscal year
EMCP Expenditure Management and Control Program
ERA Ethiopian Roads Authority
ERCA Ethiopian Revenue and Customs Authority
ETB Ethiopian birr
EU European Union
FM Financial Management
FPPMD Financial, Procurement and Property Management Department
FY Financial Year or Fiscal Year
GDP Gross Domestic Product
GEQIP General Education Quality Improvement Program
GFS Government finance statistics (IMF standards)
GoE Government of Ethiopia
GTP Growth and Transformation Plan FY 2010/11–2014/15
HRD Human Resource Department
IAD Internal Audit Department
IBEX Integrated Budget and Expenditures
ID Inspection Department
IDA International Development Agency (World Bank)
IMF International Monetary Fund
IFMIS Integrated Financial Management Information System
INTOSAI International Organization of Supreme Audit Institutions
IPSAS International Public Sector Accounting Standards
IT Information Technology
KfW Kreditanstalt für Wiederaufbau
MDG Millennium Development Goal
MEFF macroeconomic and fiscal framework
MoFED Ministry of Finance and Economic Development
MTEF Medium-Term Expenditure Framework
NBE National Bank of Ethiopia (Central Bank)
NGO Nongovernmental Organization
NS Not Scored (by PEFA)
OFAG Office of the Federal Auditor General
ONRS Oromia National Regional State
OPESA Oromia Privatization and Public Enterprises Supervising Agency
ORA Oromia Revenue Authority
World Bank Oromia PEFA Assessment
V
ORAG Office of the Regional Auditor General
PAC Public Accounts Committee
PBS Promotion of Basic Services (formerly Protection of Basic Services Program)
PE Public Enterprises
PEFA Public Expenditure and Financial Accountability
PFM Public Financial Management
PI Performance Indicator (PEFA)
PMIS Payroll Management Information System
PPA Public Procurement and Property Administration Authority
PPESA Privatization and Public Enterprises Supervising Agency
PREM Poverty Reduction and Economic Management, World Bank
PSCAP Public Sector Capacity Building Program
PSNP Productive Safety Net Program
RFQ Request for quotation
SIGTAS Standard Integrated Government Tax Administration System
TAC Tax Appeal Commission
TIN Taxpayer Identification number
TOR Terms of Reference
UNDP United Nations Development Program
UNICEF United Nations Children’s Fund
USAID U.S. Agency for International Development
VAT Value-Added Tax
WaSH Water and Sanitation Hygiene
1
Summary Assessment
This is the third PEFA assessment conducted of the Regional State of Oromia. The objective is to
provide an independent assessment of the quality and performance of the public financial
management (PFM) system in the regional state.1
A detailed summary of scores down to the dimension level and comparisons with the FY 2010
assessment are given at Appendix A. A brief summary is provided in Table SA.1 at the end of this
summary assessment.
Integrated Assessment of Public Financial Management (PFM) Performance
Budget Credibility
The budget is not a realistic projection of revenue or expenditure and is not a credible statement of
Oromia State Government policies. As in FY 2010, there are moderate expenditure variances,
particularly on capital expenditures, where successive budgets provide for an unrealistic level of
project execution. During the year there are many significant transfers between budgets, indicating
rapid changes in priorities and/or poor budgeting. The state’s own revenue is consistently
underestimated, by an average of 35 percent, particularly on income tax, turnover tax, and sale of
goods and services. However, the impact of this on government finance is minor, as own revenue is
only 21–24 percent of all revenue. The block grant from the Federal Government and Millennium
Development Goal grants are the major sources of revenue, and these (particularly the block grant)
are much more predictable, which lends stability to fiscal management.
Expenditure arrears are low (below 2 percent of expenditures for the year). There is still a problem
of verifying and clearing old balances. More information and age analysis of payables is needed.
Comprehensiveness and Transparency
The budget classification allows analysis by function and economic character that is fairly consistent
with International Monetary Fund government finance statistics standards; it also allows analysis by
administrative responsibility center and source of funds. However, budget documentation presented
to the Council and general fiscal information available to the public does not meet accepted standards
of transparency, despite the improvements brought in by the Financial Accountability and
Transparency Project. In addition, the budget and accounts are very incomplete, missing the Oromia
Road Authority, some noncommercial bodies supervised by the Oromia Privatization and Public
Enterprises Supervising Agency (OPESA), and significant external aid through Channels 2 and 3.
Fiscal relations between the regional government and its subordinate bodies are fairly transparent,
as the major transfer of funds to woredas (the block subsidy) is determined by formula. The
intimation of the budgeted allocations to woredas is late (after their budgets should be finalized as a
result of late approval of budgets at higher levels. Reporting up the line is timely, using the same
chart of accounts at all levels. Extra-budgetary autonomous agencies and public enterprises submit
fiscal reports to the OPESA at least annually, but a consolidated overview of fiscal risk is missing.
The change in the law allowing the Oromia State Government to borrow and give guarantees on
loans to these bodies suggests a need for a more formal regular overview by the regional Bureau of
Finance and Economic Development (BoFED) and the Council.
Fur 1 The PEFA Framework is presently under review. A new framework will probably apply to future assessments. All
present guidance is available on the PEFA website www.pefa.org.
Commented [A1]: The word Fur (below) comes above
each footnote throughout the report – I can’t remove it
World Bank Oromia PEFA Assessment
2
Policy-Based Budgeting
A clear annual budget calendar exists, but there are some slippages. A comprehensive and clear
budget circular is issued to budget institutions (BIs) that shows the ceilings previously approved by
the Oromia Cabinet, but expenditure ceilings are flexible and not finalized before BIs have to prepare
their budgets. The Council approves the budget soon after the start of the year.
Forecasts of fiscal aggregates are prepared for three years on a rolling annual basis, a major advance.
Sector strategies are prepared based on the Growth and Transformation Plan (GTP), but not within
overall resource projections. Many investment decisions have weak links to sector strategies.
Recurrent cost implications are included in forward budget estimates.
Predictability and Control in Budget Execution
The legislative framework and procedures for most taxes are comprehensive and clear, with limited
discretionary powers of the revenue authority, and taxpayers are being educated and supported. The
tax appeals system, however, does not appear to be independent of the revenue authority.
Taxpayers have been substantially registered and biometrics collected, enforced through control of
trade licensing and company registration. Penalties for not registering or making declarations are
adequate but not always effective. There has been an improvement in tax audits, resulting in
significant additional assessments. Tax arrears are not significant in relation to total collections (less
than 2 percent). However, there is no aggregate control in the computerized Standard Integrated
Government Tax Administration System (SIGTAS) to ensure reconciliation of arrears at the
beginning of the year with assessments, collections, and closing arrears.
Revenue collections are transferred to the BoFED Treasury Account at least monthly. Cash forecasts
are made each year and updated monthly. BoFED releases quarterly ceilings to the zero balance
accounts of budgetary institutions, which are cleared against the Treasury Account daily, so program
managers have a continuous three-month horizon of what they can spend. Most cash balances are
known daily. At the time of this assessment, the government had no formal debt on its books,
although there is some debt in its autonomous bodies and public enterprises. It still needs guidelines
on the contracting of loans and guarantees and a more formal and regular review of fiscal risk.
Payroll and personnel records are disconnected manual or MS Excel systems, except in the Bureau
of Education (BoE), which has an integrated package used by education branches in many woredas.
Controls are adequate against overpayments, late payments, and “ghost” employees.
Procurement has a new legislative framework and extensive training has been given, although there
is high staff turnover and procurement is still weak. The regulatory body audits a small proportion
of procuring entities each year. Competitive methods of procurement are used in 80–90 percent of
procurements, but there is still unjustified use of noncompetitive single source and request-for-
quotation methods. The complaints system meets most standards of transparency and fairness, but
government procurement plans and actual contract awards are not transparent (except to actual
bidders).
The Integrated Budget and Expenditures (IBEX) system has been rolled out to all regional sector
bureaus, zones and woredas, and 283 of these are now connected: the rest send in their data by email
or memory stick. The IBEX controls payments within the respective budgets but does not include
commitment data. The new Integrated Financial Management Information System (IFMIS) includes
commitment controls and is being piloted across the country, including in Oromia. It is expected that
World Bank Oromia PEFA Assessment
3
the rollout of IFMIS will enable more systematic control of commitments within the projected cash
available. Other internal controls are sound and, subject to staff training and turnover, are understood
and applied. Internal audit is being strengthened.
Accounting, Recording, and Reporting
Bank reconciliations are up-to-date and advances are controlled, although with some old balances
carried forward indefinitely. Service delivery units such as schools and health centers keep records
of cash resources received and post information on notice boards.
Woredas submit monthly financial reports and BoFED issues consolidated quarterly reports, usually
within six weeks (rated B). BoFED also issues annual consolidated financial reports, recently within
six months of the end of the year. However, the budget and all financial statements omit some extra-
budgetary units and donor-funded projects. The fiscal picture is full of holes. Accounting standards
are prescribed in regulations and manuals and do not equate to international standards, such as cash-
based International Public Sector Accounting Standards (IPSAS).
External Scrutiny and Audit
The Oromia Regional Auditor General (ORAG) has been reestablished by proclamation and has
adequate powers and an increasing budget. It has started on performance audits, linking expenditure
to benefits. However, it is auditing only two-thirds of all expenditures each year, using a risk-based
approach. Audit reports are taking 10–11 months from receipt of the annual financial statements to
submission of audit reports to the Council. Nevertheless, there is a strong and systematic follow-up
of findings and fair management response.
The Budget and Finance Committee (BFC) in the Council reviews draft budgets, including overall
resource projections, and has adequate time for its review and interaction with the executive.
However, the executive makes significant adjustments to the budget during the year, including
transfers from a large contingency budget. Ex post, the same committee receives ORAG reports,
financial and performance, and completes its review within four months. Follow up is robust.
Assessment of the Impact of PFM Weaknesses
Aggregate Fiscal Discipline
Fiscal discipline is generally strong, but large and unpredictable variations from plan and budget,
which are not explained in the accounts, indicate a lack of planning capacity or a lack of discipline
in sticking to the plan and budget. A lack of transparency, both in the budget documentation
presented to council and in key fiscal data to the public, limits the information on government
performance.
Two areas of risk are omitted from the budget and accounts: some extra-budgetary funds and public
enterprises. These bodies are now enabled to borrow, creating contingent liabilities for the regional
government. At present, there is insufficient monitoring of fiscal risk.
Strategic Allocation of Resources
Budgetary institutions prepare their budgets within ceilings that have been politically approved, but
ceilings are still negotiable within the executive. Final allocations are not known until higher-level
budgets are approved. This undermines the prioritization of resource allocations.

World Bank Oromia PEFA Assessment
4
The medium-term planning is based loosely on medium-term strategic sector plans, but these are
framed without reference to aggregate resource projections. It is also not clear how far sector
strategies are aligned with the GTP.
Efficient Service Delivery
Efficient service delivery requires that program managers know their resource allocations in good
time to undertake orderly procurement. The intimation of ceilings for expenditure on zero-balance
accounts, not just for a single month but also the following two months, allows managers to plan
more rationally.
The tight controls on transactions, and the constant scrutiny of internal and external audit, also
contribute to the reduction of fraud, errors, and waste and the promotion of economy, efficiency,
and cost-effectiveness.
Prospects for Reform Planning and Implementation
Most reform is managed at federal level by the Ministry of Finance and Economic Development
(MoFED) through the Expenditure Management and Control Program (EMCP). This was discussed
in the PEFA report on the Federal Government. Since FY 2011, EMCP has led reforms in accounting
(including the rollout of IBEX), planning and budgeting, cash flow management (zero-balance
accounts for sector bureaus), procurement and property management (the legal framework), internal
audit (manuals, training) and downward accountability awareness (training of citizens and their
representatives).
The Oromia State Government has participated fully in these reforms and made considerable
progress. This looks likely to continue.
World Bank Oromia PEFA Assessment
5
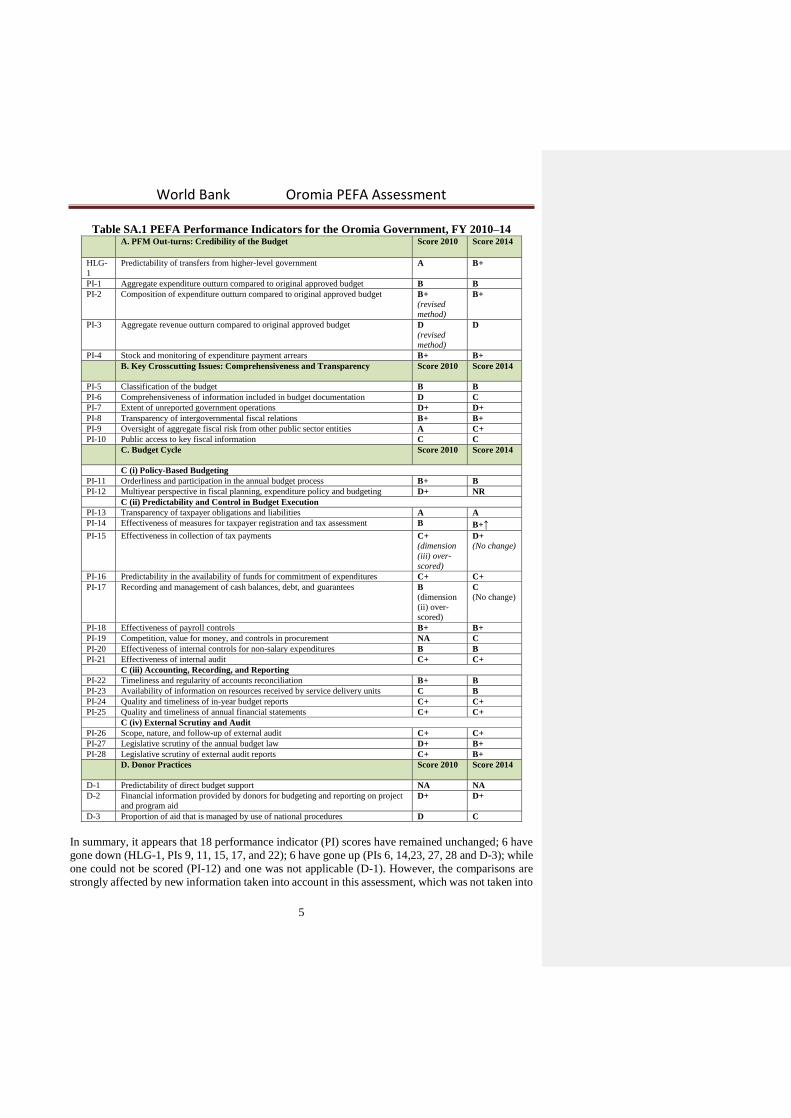
Table SA.1 PEFA Performance Indicators for the Oromia Government, FY 2010–14 A. PFM Out-turns: Credibility of the Budget
Score 2010 Score 2014
HLG-
1
Predictability of transfers from higher-level government A B+
PI-1 Aggregate expenditure outturn compared to original approved budget B B
PI-2 Composition of expenditure outturn compared to original approved budget B+
(revised
method)
B+
PI-3 Aggregate revenue outturn compared to original approved budget D
(revised
method)
D
PI-4 Stock and monitoring of expenditure payment arrears B+ B+
B. Key Crosscutting Issues: Comprehensiveness and Transparency
Score 2010 Score 2014
PI-5 Classification of the budget B B
PI-6 Comprehensiveness of information included in budget documentation D C
PI-7 Extent of unreported government operations D+ D+
PI-8 Transparency of intergovernmental fiscal relations B+ B+
PI-9 Oversight of aggregate fiscal risk from other public sector entities A C+
PI-10 Public access to key fiscal information C C
C. Budget Cycle
Score 2010 Score 2014
C (i) Policy-Based Budgeting
PI-11 Orderliness and participation in the annual budget process B+ B
PI-12 Multiyear perspective in fiscal planning, expenditure policy and budgeting D+ NR
C (ii) Predictability and Control in Budget Execution
PI-13 Transparency of taxpayer obligations and liabilities A A
PI-14 Effectiveness of measures for taxpayer registration and tax assessment B B+↑
PI-15 Effectiveness in collection of tax payments C+
(dimension
(iii) over-
scored)
D+
(No change)
PI-16 Predictability in the availability of funds for commitment of expenditures C+ C+
PI-17 Recording and management of cash balances, debt, and guarantees B
(dimension
(ii) over-
scored)
C
(No change)
PI-18 Effectiveness of payroll controls B+ B+
PI-19 Competition, value for money, and controls in procurement NA C
PI-20 Effectiveness of internal controls for non-salary expenditures B B
PI-21 Effectiveness of internal audit C+ C+
C (iii) Accounting, Recording, and Reporting
PI-22 Timeliness and regularity of accounts reconciliation B+ B
PI-23 Availability of information on resources received by service delivery units C B
PI-24 Quality and timeliness of in-year budget reports C+ C+
PI-25 Quality and timeliness of annual financial statements C+ C+
C (iv) External Scrutiny and Audit
PI-26 Scope, nature, and follow-up of external audit C+ C+
PI-27 Legislative scrutiny of the annual budget law D+ B+
PI-28 Legislative scrutiny of external audit reports C+ B+
D. Donor Practices
Score 2010 Score 2014
D-1 Predictability of direct budget support NA NA
D-2 Financial information provided by donors for budgeting and reporting on project
and program aid D+ D+
D-3 Proportion of aid that is managed by use of national procedures D C
In summary, it appears that 18 performance indicator (PI) scores have remained unchanged; 6 have
gone down (HLG-1, PIs 9, 11, 15, 17, and 22); 6 have gone up (PIs 6, 14,23, 27, 28 and D-3); while
one could not be scored (PI-12) and one was not applicable (D-1). However, the comparisons are
strongly affected by new information taken into account in this assessment, which was not taken into

World Bank Oromia PEFA Assessment
6
the FY 2010 assessment. These factors are explained in the individual indicator descriptions in
Chapter 3 and in Appendix A.

World Bank Oromia PEFA Assessment
7
1. Introduction
1.1 Background and Objectives
Two previous PEFA assessments have been made of the Regional State of Oromia, in FYs 2007 and
2010. Following discussions in FY 2013 between the Ministry of Finance and Economic
Development (MoFED) and development partners (DPs), MoFED took ownership of the next PEFA
by setting up a technical team to supervise the process. The Minister of State, MoFED, on July 31,
2013, nominated a team of 14 members, comprising the head of the Expenditure Management and
Control Program (EMCP) Coordinating Unit (as chair), 10 directors and senior officers of MoFED,
and 3 directors and senior officers of the Public Procurement and Property Administration Agency
(PPA).
After a period of consultation among donor partners and MoFED, a Concept Note2 was agreed upon.
This covers a set of seven PEFA assessments: the Federal Government, Addis Ababa city
administration, and five regions (states)—Oromia, Amhara, Southern Nations and Nationalities
Peoples’ Region, Tigray, and Somali. A synthesis report consolidates the findings. This report is the
third to be produced and covers only the regional state of Oromia.
The objective of the PEFA assessment is to provide an independent assessment on the quality and
performance of the public financial management system in the regional state. This will be used to
benchmark progress against a standard set of indicators and as the basis for dialogue on ongoing
public financial management (PFM) reforms supported through the Expenditure Management and
Control Program and for new PFM initiatives such as the request from MoFED to the World Bank
to move forward with the preparation of a stand-alone PFM project. It may also feed into the
proposed projects in tax administration, audit, and transparency to be funded by the United
Kingdom’s Department for International Development. In accordance with PEFA philosophy, the
report itself makes no recommendations, but provides a pool of reliable information on which dialog
can be based.
It is not the purpose of the assessment to evaluate and score different institutions or individuals in
charge within the Oromia State Government. It is rather to strengthen the government’s own PFM
reform program and identify priorities within the reform agenda.
1.2 Scope
The regional government of Oromia has three administrative levels: the regional government is the
first level and includes 53 budgetary institutions: 44 sector offices, the regional Auditor General, the
Regional Council (RC), and a number of autonomous government agencies. The second level
consists of 18 zones. These are de-concentrated branches of the regional government that have legal
personality but no political authority (no elected councils). Zonal offices administer the woredas
(anas) under their jurisdiction and are responsible for law and order in their respective areas. The
third level is woredas: 44 urban woredas (also called urban administrations) and 265 rural woredas.
Woredas are responsible for primary and secondary education (up to 10th grade), primary health
care (health posts and health centers), construction, and maintenance of woreda roads and access
roads to kebeles (village areas), drinking water supply, agricultural extension services, and
administration of the woreda councils. Woredas have elected councils, so woreda offices have a dual
accountability: to their councils as well as to the regional government.
Fur 2 World Bank, (2013), “Concept Note: Ethiopia: Public Expenditure & and Financial Accountability (PEFA)
Assessment”
World Bank Oromia PEFA Assessment
8
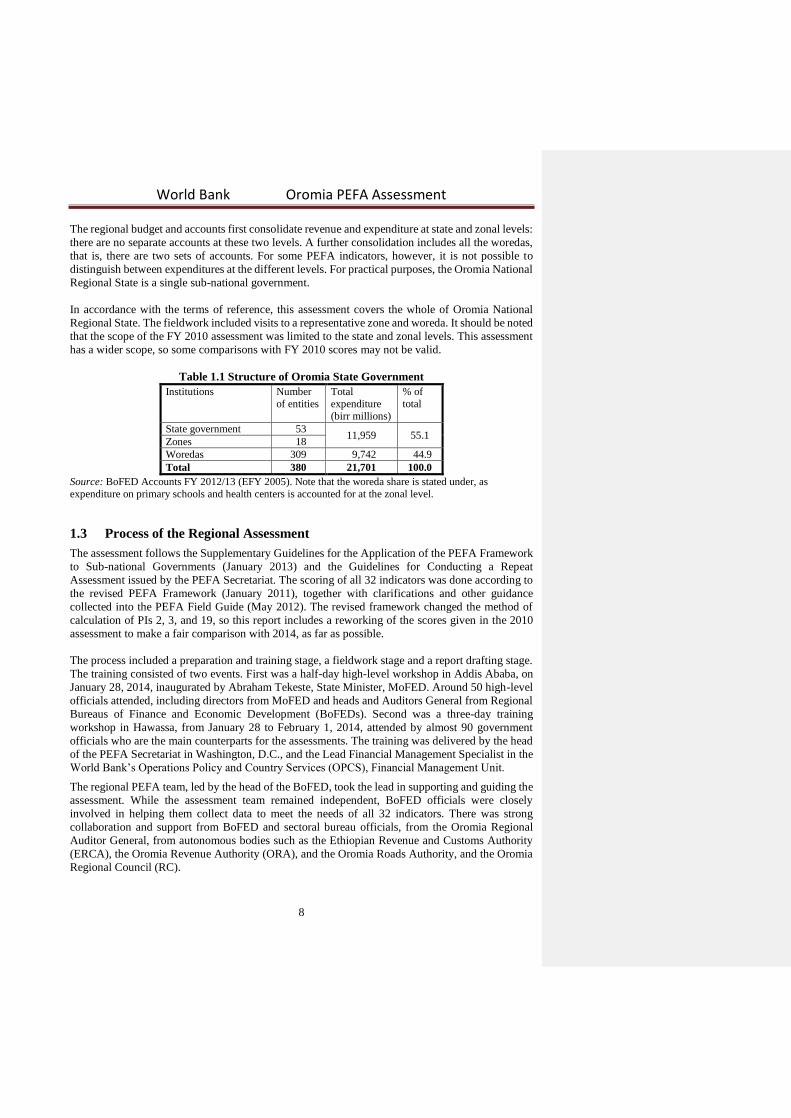
The regional budget and accounts first consolidate revenue and expenditure at state and zonal levels:
there are no separate accounts at these two levels. A further consolidation includes all the woredas,
that is, there are two sets of accounts. For some PEFA indicators, however, it is not possible to
distinguish between expenditures at the different levels. For practical purposes, the Oromia National
Regional State is a single sub-national government.
In accordance with the terms of reference, this assessment covers the whole of Oromia National
Regional State. The fieldwork included visits to a representative zone and woreda. It should be noted
that the scope of the FY 2010 assessment was limited to the state and zonal levels. This assessment
has a wider scope, so some comparisons with FY 2010 scores may not be valid.
Table 1.1 Structure of Oromia State Government
Institutions Number
of entities Total
expenditure
(birr millions)
% of
total
State government 53 11,959 55.1
Zones 18 Woredas 309 9,742 44.9 Total 380 21,701 100.0
Source: BoFED Accounts FY 2012/13 (EFY 2005). Note that the woreda share is stated under, as
expenditure on primary schools and health centers is accounted for at the zonal level.
1.3 Process of the Regional Assessment
The assessment follows the Supplementary Guidelines for the Application of the PEFA Framework
to Sub-national Governments (January 2013) and the Guidelines for Conducting a Repeat
Assessment issued by the PEFA Secretariat. The scoring of all 32 indicators was done according to
the revised PEFA Framework (January 2011), together with clarifications and other guidance
collected into the PEFA Field Guide (May 2012). The revised framework changed the method of
calculation of PIs 2, 3, and 19, so this report includes a reworking of the scores given in the 2010
assessment to make a fair comparison with 2014, as far as possible.
The process included a preparation and training stage, a fieldwork stage and a report drafting stage.
The training consisted of two events. First was a half-day high-level workshop in Addis Ababa, on
January 28, 2014, inaugurated by Abraham Tekeste, State Minister, MoFED. Around 50 high-level
officials attended, including directors from MoFED and heads and Auditors General from Regional
Bureaus of Finance and Economic Development (BoFEDs). Second was a three-day training
workshop in Hawassa, from January 28 to February 1, 2014, attended by almost 90 government
officials who are the main counterparts for the assessments. The training was delivered by the head
of the PEFA Secretariat in Washington, D.C., and the Lead Financial Management Specialist in the
World Bank’s Operations Policy and Country Services (OPCS), Financial Management Unit.
The regional PEFA team, led by the head of the BoFED, took the lead in supporting and guiding the
assessment. While the assessment team remained independent, BoFED officials were closely
involved in helping them collect data to meet the needs of all 32 indicators. There was strong
collaboration and support from BoFED and sectoral bureau officials, from the Oromia Regional
Auditor General, from autonomous bodies such as the Ethiopian Revenue and Customs Authority
(ERCA), the Oromia Revenue Authority (ORA), and the Oromia Roads Authority, and the Oromia
Regional Council (RC).
World Bank Oromia PEFA Assessment
9
The main fieldwork for the Oromia assessment was done March 17–29, 2014. It included an initial
meeting with the BoFED head and his PEFA team, followed by interviews with civil servants at the
level of department heads and technicians, the Regional Auditor General and RC members, and with
Oromia Chamber of Commerce (listed at appendix B). It also included a review of key documents
(see appendix C). Interviews with donor agencies were undertaken in the course of the federal level
assessment. The assessment team comprised three independent consultants: Tony Bennett (team
leader), Getnet Haile, and Zeru Gebre Selassie, under the supervision of Parminder Brar, World
Bank sector leader and Lead Financial Management Specialist. Individual terms of reference were
provided to the consultants, based on the Concept Note. As far as possible, the information collected
was triangulated with other sources.
A draft report was prepared during and after the fieldwork and was presented to the World Bank on
May 30, 2014. It was circulated to all stakeholders and peer reviewers (see “Quality Assurance”)
and their comments were collated by the World Bank. Comments were received in writing from
Oromia BoFED on July 7, 2014, and at a workshop on October 17. The assessment team addressed
all comments in a draft final report. This was standardized with other regional reports in an integrated
report issued on January 18, 2015. Further comments on the (un-standardized) Oromia report were
received from the PEFA Secretariat on January 31. Comments were received from development
partners (DPs) on the Federal Government report, but not the Oromia or other regional reports. The
final report will be posted on the MoFED website and linked to the PEFA website.
1.4 Donor Harmonization
The donor agencies concerned with PFM in Ethiopia are the World Bank and International
Development Agency, Department for International Development (UK) (DFID), African
Development Bank (ADB), European Union (EU), U.S. Agency for International Development
(USAID), Irish Aid, the UN Group, and others, who have set up a public financial management
(PFM) donor group, co-chaired at the time of the assessment by DFID and the World Bank. The
group was fully involved in the arrangements for the 2014 PEFA assessments, starting with the
Concept Note and agreement on funding. The assessments are being funded jointly by DFID,
USAID, Irish Aid, and the World Bank, with the World Bank managing the process. A first meeting
was held between the donor group and the assessment team on February 11, 2014, and a progress
review meeting on February 28, 2014.
Donor agency inputs were solicited during the fieldwork, both for the scoring of the donor indicators
(D-1 to D-3) and for their perceptions on financial management performance over the past four years
and possible future directions. Donors participated in the regional workshop on October 17, 2014.
1.5 Quality Assurance
A robust quality assurance has been put in place through the PEFA Secretariat’s PEFA CHECK
system and through the World Bank peer review process. The criteria for the PEFA Secretariat to
give the PEFA CHECK endorsement were followed.
The World Bank process includes a decision meeting on the Concept Note, which was chaired by
the Country Director. The World Bank peer reviewers are (1) Nicola Smithers, PFM cluster leader,
PREM public sector anchor, World Bank, Washington, D.C.; (2) Gert Van der Linde, lead PFM
specialist, South Africa CO; (3) Sanjay Vani, lead FM specialist, OPCS, World Bank, Washington,
D.C.; and (4) Manoj Jain, lead FM specialist and FM cluster leader, South Asia Region, World Bank,
New Delhi.
World Bank Oromia PEFA Assessment
10
The government PFM team in MoFED was consulted at every stage of the process to ensure that the
reports are of the required quality and to take ownership of the process and the outputs. In addition,
the draft final report was circulated to the PFM donor group and their inputs sought before the report
was finalized.
1.6 Structure of the Report
Chapter 2 briefly describes the context of the Oromia Regional Government, the structure of the
public sector and of public sector operations, and the legal and institutional framework for PFM.
Chapter 3 presents the evaluation of Oromia PFM systems, processes, and institutions based on the
32 high-level indicators of the PEFA performance framework at sub-national level. Chapter 4
describes recent and ongoing reforms and main areas of intervention.

11
2. Country Background Information
2.1 Economic Context, Development, and Reforms
Oromia3 is the largest and most populous of the nine regions of Ethiopia, with a land area of
363,375 square kilometers and a population of 32,997,000, or about one-third of the entire
country. The state stretches across central Ethiopia and shares boundaries with Kenya and
South Sudan and with all the other regional states except Tigray. The administrative capital is
Addis Ababa (Finfinne).
Source: Wikipedia, with permission of USAID, Ethiopia.
The regional gross domestic product (GDP) is estimated by Oromia Bureau of Finance and
Economic Development (BoFED). Regional GDP at constant (base 2000) market prices was
ETB 41,418 million in FY 2009/10, or ETB 1,408 per capita (US$109). Real GDP grew 10.4
percent that year, and has continued to grow steadily. The economy is based on agriculture,
mainly rain-fed, which contributes 65 percent of the regional GDP and employs 89 percent of
the labor force. Oromia accounts for a large proportion of Ethiopian agricultural exports:
coffee4, hides and skins, pulses, and oil seeds.
Oromia has a very varied topography and climate: rainfall varies considerably from 400
Fur 3 Information in this section is from BoFED, “Oromia in Brief,” December; www.oromiaBoFED.org; and
Office of the President, “Oromia Today” 2013/1 4 The Jimma area of Oromia is believed to be the place of origin of coffee.
World Bank Oromia PEFA Assessment
12
millimeters a year in the south to 2,400 millimeters a year in the western highlands. Only 7.1
percent of irrigable land is irrigated: irrigation development is a priority of the state to ensure
food security and attain the Millennium Development Goals (MDGs). Industry accounts for
about 10 percent of GDP and services provide the remaining 25 percent. There are abundant
minerals (gold, tantalum, iron, nickel, coal, marble, and so forth). The potential for exploitation
of these minerals has not yet been fully assessed. There is also great potential for hydropower.
The national Growth and Transformation Plan (GTP) is the source for the Oromia strategy for
economic and social development. Significant achievements have been made since FY 2001/02
in the MDG sectors: agriculture, education, health, water and sanitation, and roads.
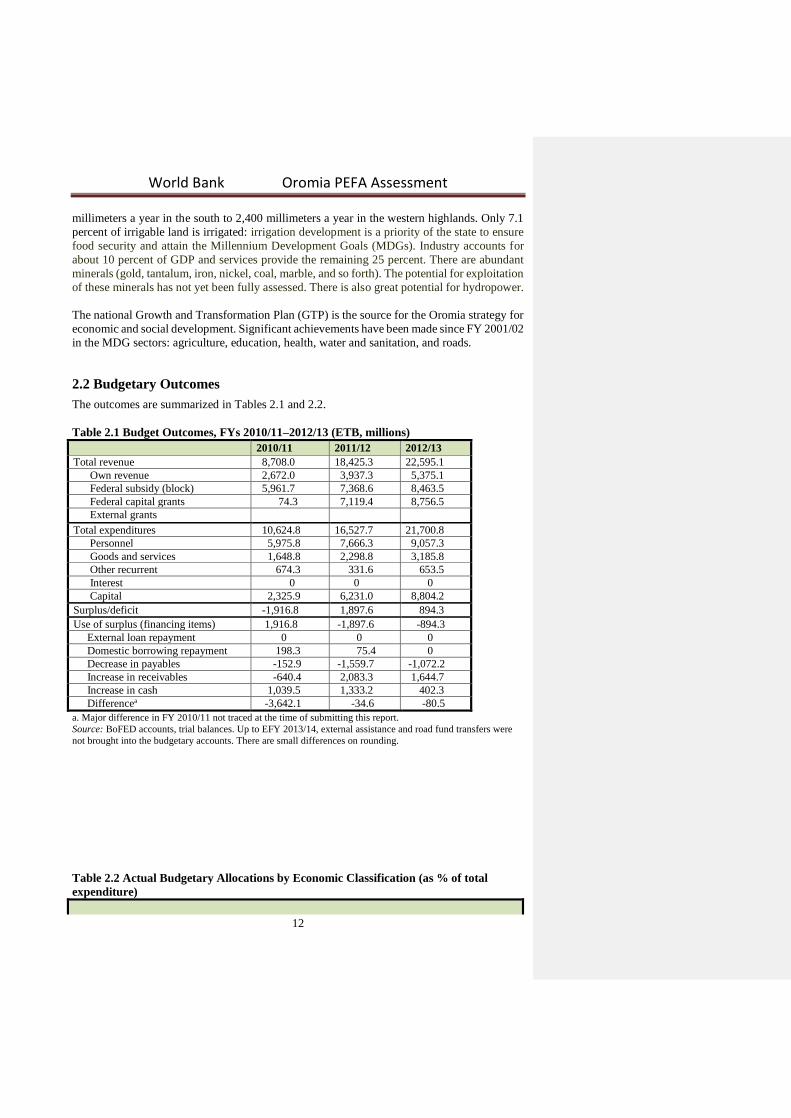
2.2 Budgetary Outcomes
The outcomes are summarized in Tables 2.1 and 2.2.
Table 2.1 Budget Outcomes, FYs 2010/11–2012/13 (ETB, millions)
2010/11 2011/12 2012/13
Total revenue 8,708.0 18,425.3 22,595.1 Own revenue 2,672.0 3,937.3 5,375.1 Federal subsidy (block) 5,961.7 7,368.6 8,463.5 Federal capital grants 74.3 7,119.4 8,756.5 External grants
Total expenditures 10,624.8 16,527.7 21,700.8 Personnel 5,975.8 7,666.3 9,057.3 Goods and services 1,648.8 2,298.8 3,185.8 Other recurrent 674.3 331.6 653.5 Interest 0 0 0 Capital 2,325.9 6,231.0 8,804.2
Surplus/deficit -1,916.8 1,897.6 894.3
Use of surplus (financing items) 1,916.8 -1,897.6 -894.3 External loan repayment 0 0 0 Domestic borrowing repayment 198.3 75.4 0 Decrease in payables -152.9 -1,559.7 -1,072.2 Increase in receivables -640.4 2,083.3 1,644.7 Increase in cash 1,039.5 1,333.2 402.3 Differencea -3,642.1 -34.6 -80.5
a. Major difference in FY 2010/11 not traced at the time of submitting this report.
Source: BoFED accounts, trial balances. Up to EFY 2013/14, external assistance and road fund transfers were
not brought into the budgetary accounts. There are small differences on rounding.
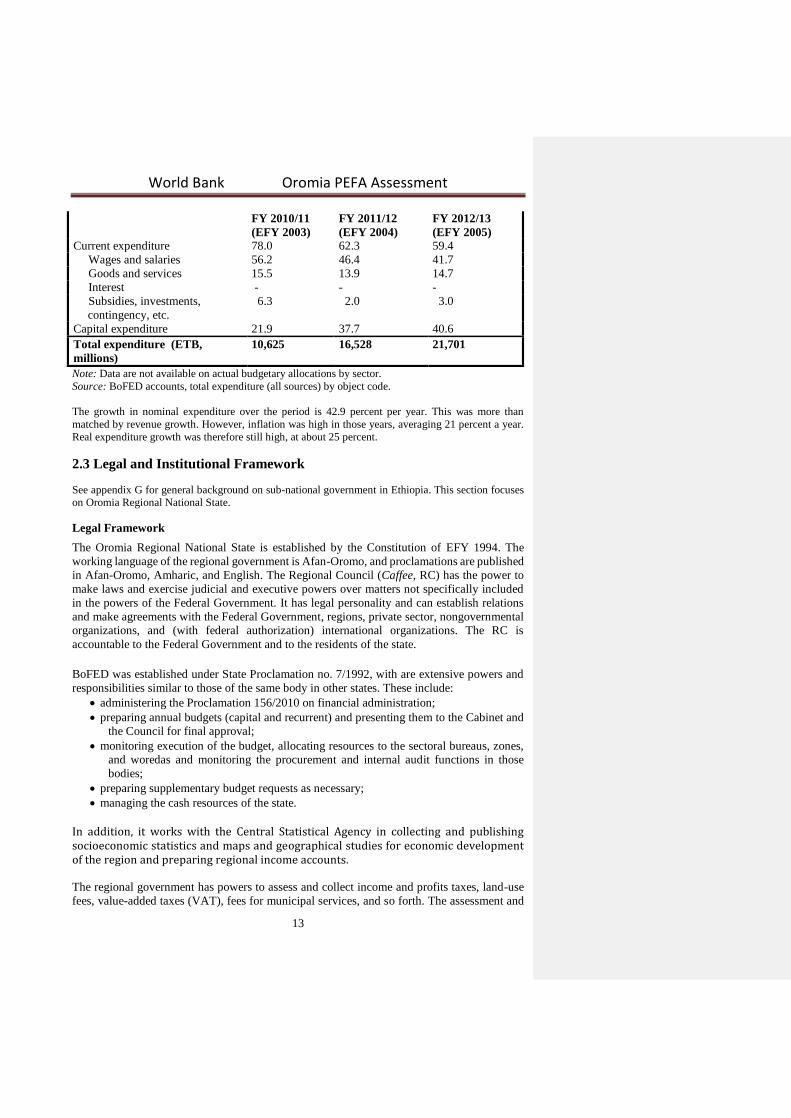
Table 2.2 Actual Budgetary Allocations by Economic Classification (as % of total
expenditure)
World Bank Oromia PEFA Assessment
13
FY 2010/11
(EFY 2003)
FY 2011/12
(EFY 2004)
FY 2012/13
(EFY 2005)
Current expenditure 78.0 62.3 59.4
Wages and salaries 56.2 46.4 41.7
Goods and services 15.5 13.9 14.7
Interest - - -
Subsidies, investments,
contingency, etc.
6.3 2.0 3.0
Capital expenditure 21.9 37.7 40.6
Total expenditure (ETB,
millions)
10,625 16,528 21,701
Note: Data are not available on actual budgetary allocations by sector.
Source: BoFED accounts, total expenditure (all sources) by object code.
The growth in nominal expenditure over the period is 42.9 percent per year. This was more than
matched by revenue growth. However, inflation was high in those years, averaging 21 percent a year.
Real expenditure growth was therefore still high, at about 25 percent.
2.3 Legal and Institutional Framework
See appendix G for general background on sub-national government in Ethiopia. This section focuses
on Oromia Regional National State.
Legal Framework
The Oromia Regional National State is established by the Constitution of EFY 1994. The
working language of the regional government is Afan-Oromo, and proclamations are published
in Afan-Oromo, Amharic, and English. The Regional Council (Caffee, RC) has the power to
make laws and exercise judicial and executive powers over matters not specifically included
in the powers of the Federal Government. It has legal personality and can establish relations
and make agreements with the Federal Government, regions, private sector, nongovernmental
organizations, and (with federal authorization) international organizations. The RC is
accountable to the Federal Government and to the residents of the state.
BoFED was established under State Proclamation no. 7/1992, with are extensive powers and
responsibilities similar to those of the same body in other states. These include:
administering the Proclamation 156/2010 on financial administration;
preparing annual budgets (capital and recurrent) and presenting them to the Cabinet and
the Council for final approval;
monitoring execution of the budget, allocating resources to the sectoral bureaus, zones,
and woredas and monitoring the procurement and internal audit functions in those
bodies;
preparing supplementary budget requests as necessary;
managing the cash resources of the state.
In addition, it works with the Central Statistical Agency in collecting and publishing socioeconomic statistics and maps and geographical studies for economic development of the region and preparing regional income accounts.
The regional government has powers to assess and collect income and profits taxes, land-use
fees, value-added taxes (VAT), fees for municipal services, and so forth. The assessment and
World Bank Oromia PEFA Assessment
14
collection of direct and indirect taxes is undertaken by the Oromia Revenue Authority (ORA).
It can borrow from domestic and external sources with federal authorization.
Institutional Framework
BoFED is the main institution for budget preparation and execution (including treasury,
internal audit, and control functions). It consists of departments, called core processes, sub-
processes, and support processes (see organization chart at appendix D). The RC approves the
draft budget and the annual financial accounts. The Office of the Regional Auditor General
(ORAG) is in charge of external audit of budgetary institutions, zonal offices, woredas, and
enterprises.
There are many autonomous government agencies, including the Oromia Roads Authority,
Construction Industry Development and Control Authority, Land Development and City
Renewal Agency, Addis Ababa City Courts, Qebele Social Courts, Tax Appeal Commission,
Labor Relations Board, Civil Service Tribunal, Urban Land Clearance Matters Appeal
Commission, and so forth. These are mostly within the state budget and accounting system (see
PI-7 dimension (i)).
Key Features of the Oromia Public Financial Management System
Although woredas are elected bodies, have legal personality, contract in their own name, and
maintain their own budgets and accounts, fiscally they are decentralized units of the regional
government. The Oromia budget, monthly accounts, and annual accounts consolidate all their
revenues and expenditures from the Integrated Budget and Expenditures (IBEX) computer
system, which produces monthly reports on each of the budgetary institutions (BIs) (53 at state
level, 18 zones, and 309 woredas, of which 44 are urban administrations and 265 are rural).
There is online connectivity between BoFED and the sectoral bureaus and other BIs within
Addis Ababa, but not yet with the zonal offices or between the zonal offices and the woredas.
Zonal offices and woredas use stand-alone IBEX systems and submit monthly summaries of
their transactions to BoFED. Payments are made by each connected BI on a zero-balance bank
account that is reimbursed at the end of each day from the Oromia Treasury. Revenue bank
accounts are used by the ORA and revenue-receiving BIs: these are also cleared daily to the
Oromia Treasury. Payroll and procurement operations are decentralized to the BIs, and they
have their own internal audit units. All are tightly supervised by BoFED.
Block grants (untied) are made by BoFED to the woredas monthly in accordance with the
approved budget, which is prepared according to a revenue-sharing and block-allocation
formula based on principles of equity and encouragement of competition. The regional
government has its own formula for horizontal distribution to the woredas, and this is not
controlled by the Federal Government. There are also specific grants for capital projects (see
under PI-8).
Based on their action plans, budgets are disbursed to the different sector bureaus, rural woredas,
and urban administrations on a monthly basis. Monthly reports on expenditure are sent to
BoFED.

15
3. Assessment of the Public Financial Management (PFM)
Systems, Processes, and Institutions
This chapter briefly explains each of the 32 indicators, the actual situation at the time of the
assessment, how this relates to the PEFA Framework and its requirements for scores of A, B,
C or D, and the assessed scores.
Where an indicator has more than one dimension, the dimensional scores are combined by one
of two methods. Method 1 (M1) is used where poor performance on one dimension is likely to
undermine the impact of good performance on other dimensions, so the overall score is
determined by the score of this weakest link. A plus sign is added where any of the other
dimensions is scored higher than the weakest link. On indicators where a low score on a
dimension does not necessarily undermine the impact of higher scores on other dimensions,
the dimensional scores are averaged (M2 method). The average of all possible combinations
of scores is provided by a table in the PEFA Blue Book.
The method of combining scores (M1 or M2) is shown in the summary box of each
multidimensional indicator.
3.1 Budget Credibility
HLG-1 Predictability of transfers from higher level of government
The Oromia government receives from the Federal Government: (1) an annual allocation from
the MoFED block grant to regions; (2) Millennium Development Goal (MDG) capital grants;
and (3) a 50 percent share of business income tax and 30 percent of indirect taxes collected by
the Federal Government on behalf of Oromia state.
The purpose of the block grant formula is to ensure that every citizen has equal access to basic
services, such as health, education, clean water, agricultural development and roads. It aims to
equalize the revenue of regions, based on a calculation of the revenue-raising capacity and
expenditure needs per capita. The formula is based on: (1) population; (2) resources needed to
provide all people of the region with the basic services; and (3) an estimate of the revenue
potential of the region. The challenge of the unit cost-based formula is that it requires extensive
data. Woredas have difficulty in providing good quality data.
The grant to the regional capital budget is based on an infrastructure deficit index. Regions that
are disadvantaged in terms of schools, health clinics, roads, and other infrastructure get higher
shares.
The regional distribution from the road fund goes directly to the Oromia Road Authority for
road and drainage maintenance. This is not in the Oromia budget or accounts and has been
excluded from this indicator. Similarly, external assistance and loans from donor agencies
through sector ministries should be included in the assessment of predictability of transfers.
However, these are not brought to account, neither in the Oromia budget nor the accounts (see
PI-7 (ii)), so have also been excluded.
The block grant to Oromia is at present 32.5 percent of the federal total block grant each year.
The BoFED provides data for the calculation of the percentage every three years. The House
of the Federation (which includes Oromia regional representatives) is mandated by the

World Bank Oromia PEFA Assessment
16
Constitution to fix the percentage allocations (see the federal assessment under PI-8). MoFED
informs the BoFEDs of the indicative amount in March and April, and the final amount at the
end of May or early June. It is disbursed in 12 equal monthly installments, in the first week of
each month, and is very predictable.
MDG grants are given for capital projects in the agriculture, health, education, water and
sanitation, and road sectors. These have to be individually negotiated with BoFED and are paid
to the respective woredas through the sector bureaus.
Shares of concurrent revenue are paid to Oromia monthly on time. Data on amounts were not
available and have been excluded from the assessment.
The amounts budgeted and received by Oromia BoFED from FYs 2010/11 to 2012/13 are
indicated in Table 3.1.
Table 3.1 Transfers from Federal Government to Oromia State Government
FY 2010/11 (EFY
2003) FY 2011/12 (EFY 2004) FY 2012/13 (2005)
Budget Actual Budget Actual Budget Actual
Block grant 7,642 8,450
9,932 9,958 11,575 11,575
MDG grants 0 0 4,880 4,557 6,500 5,665
Shared
revenues NA NA NA NA NA NA
Total 7,642 8,450 14,812 14,515 18,075 17,240 % variance +10.6% -2.0% -4.1%
(i) Annual deviation of actual total HLG transfers from the original total estimated amount
provided by HLG to the sub-national entity for inclusion in the latter’s budget
In no year did transfers fall short of the estimate by more than 5 percent. The data do not include
shared revenues, as in 2010 (and in other regions). This dimension is rated A.
(ii) Annual variance between actual and estimated transfers of earmarked grants
Only MDG grants are earmarked. These started in FY 2011/12. Appendix G shows that
variance in the provision of earmarked grants in FY 2011/12 was 3.1 percent and in FY 2012/13
it was 6.2 percent. This earns a rating of B.
(iii) In-year timeliness of transfers from HLG (compliance with timetables for in-year
distribution of disbursements agreed within one month of the start of the subnational fiscal
year)
The legal mandate for public bodies to spend money is the vote of the House of People’s
Representatives on the annual budget appropriations for the approved budget, which takes
place no later than July 7. MoFED notifies public bodies, including the regions, of their
approved budgets between July 8 and July 15. Regions adjust their work plans, where outcomes
and required resources to achieve these outcomes are presented, to the approved budget.
Thereafter, financial action plans, indicating monthly disbursement requirements are submitted
to MoFED.

World Bank Oromia PEFA Assessment
17
Zones should know their forthcoming transfers by the end of March, before they prepare the
budget for the zone and the 13 woredas under them. The disbursement timetable is pre-agreed
and respected. This qualifies for a score of A. See Table 3.2.
Table 3.2 HLG-1 Results
PI Score
2010a Score
2014 Justification Performance change
HLG-1 A B+ M1 (i) A A Data on share of shared revenues
not available. No change.
(ii) A B Variance in provision of
earmarked grants exceeded 5%
in no more than one of the past
three years.
No comparison
possible. No MDG
grants at the time of the
2010 assessment. (iii) A A Actual transfers have been
distributed evenly across the
year in all of the past three years.
Improvement in
timeliness of transfers.
a. In the 2010 assessment, the indicator was given an A but the dimensions were not scored. As this is an M1
indicator, an overall A implies that all dimensions are rated A.
PI-1 Aggregate expenditure outturn compared to original approved budget
The regional accounts (consolidated BIs, zones, and woredas) show that total expenditure
(recurrent and capital) was above budget in FY 2010/11 but below budget over the past two
years (see appendix F). Table 3.3 shows the percentage of under-expenditure, and the
corresponding under-collection (or overestimation) of revenue. In effect, expenditure was
constrained by capacity limitations and revenue was more than adequate to meet the reduced
expenditure (see also Table 2 on budgetary outcomes). Council approval of overestimated
expenditure increases BoFED discretionary power to make transfers between budgets.
Table 3.3 Expenditure Out-turns Compared with Revenue Out-turns
Variance of
expenditure/budget Variance of revenue/budget
FY 2010/11 (EFY 2003) +11.6% +69.9% FY 2011/12 (EFY 2004) -8.7% +30.9% FY 2012/13 (EFY 2005) -4.8% +26.4%
Table 3.4 PI-1 Results
PI Score
2010 Score
2014 Justification Performance
change PI-1 B B Actual expenditure deviated more than
10% from budget in only one of the past
three years.
No change.
PI-2 Composition of expenditure outturn compared to original approved budget
Where the composition of expenditure varies considerably from the original budget, the budget
will not be a useful statement of policy intent. Measurement against this indicator requires an
empirical assessment of expenditure out-turns against the original budget at a sub-aggregate
level. In the Oromia government budget and accounts, as in the federal accounts, there is an

World Bank Oromia PEFA Assessment
18
administrative classification, with organizations classified into four broad functional groups:
administrative and general, economic, social, and other, then into 22 sub-functional heads (see
PI-5). Appendix E shows the original budgets and actual out-turns for each of these heads.
The method of assessing this indicator changed in 2011. Allowance is now made for any
change in the total resource envelope, which is equal to the total actual expenditure. The
original approved budgets are adjusted by the ratio of the actual resource envelope to the
budgeted resource envelope.5 Variances are then measured against these “adjusted budgets.” It
should be made clear that the term adjusted budget is a PEFA term and has no reference to
Oromia council-adjusted budgets, which may be quite different.
(i) Extent of the variance in expenditure composition during the past three years
Appendix E shows that there was moderate variance in each of the past three years, amounting
to 10.2 percent, 9.7 percent, and 8.8 percent. This results in a B score.
The assessment in 2010 showed high variance (a D score), but this has been reworked
according to the new method and using the same basis of classification, so that a comparison
can be made with 2014. Appendix E shows that in 2010 the score would have been B rather
than D. There is therefore no change from 2010 to 2014.
An analysis of the variance shows that in FY 2010/11 (EFY 2003), variance was mainly due
to under-expenditure on water and health and over-expenditure on agriculture and construction.
In FY 2011/12 (EFY 2004), it was mainly due to under-expenditure on water and education
and over-expenditure on general services and health. In FY 2012/13 (EFY 2005), it was due to
under-expenditure again on water and education and over-expenditure on general services and
construction. Water is always under-spent (or overestimated), but the other sub-functions are
sometimes overspent, sometimes under-spent. Overall variance is reducing slowly.
(ii) The average amount of expenditure actually charged to the contingency vote over the
past three years
A second change made in 2011 was the separation of the contingency budget and actual
contingency expenditure, which is made the subject of a new dimension (ii). It is good practice
to charge contingency expenditure to the benefiting heads and to transfer the budget also to the
benefiting heads. This is done. The contingency budget averaged 1.7 percent of total budget in
the past three years, BoFED has authorized many transfers to other codes, and expenditures
have been charged to those codes, not against the contingency code. The contingency budget
averaged 1.3 percent in FYs 2006/07–2008/09, not significantly different from FYs 2010/11–
2012/13, indicating that changes in the ratio of the contingency to expenditure had no material
impact on the changes in the ratings for dimension (i). A significant proportion of the
contingency is for wage increases, the allocation of which has no bearing on credibility.
Table 3.5 PI-2 Results
PI Score
2010 Score
2014 Justification Performance change
Fur 5 On the principle that the original budget was an optimal budget in which expenditure on all heads had equal
marginal benefits.
World Bank Oromia PEFA Assessment
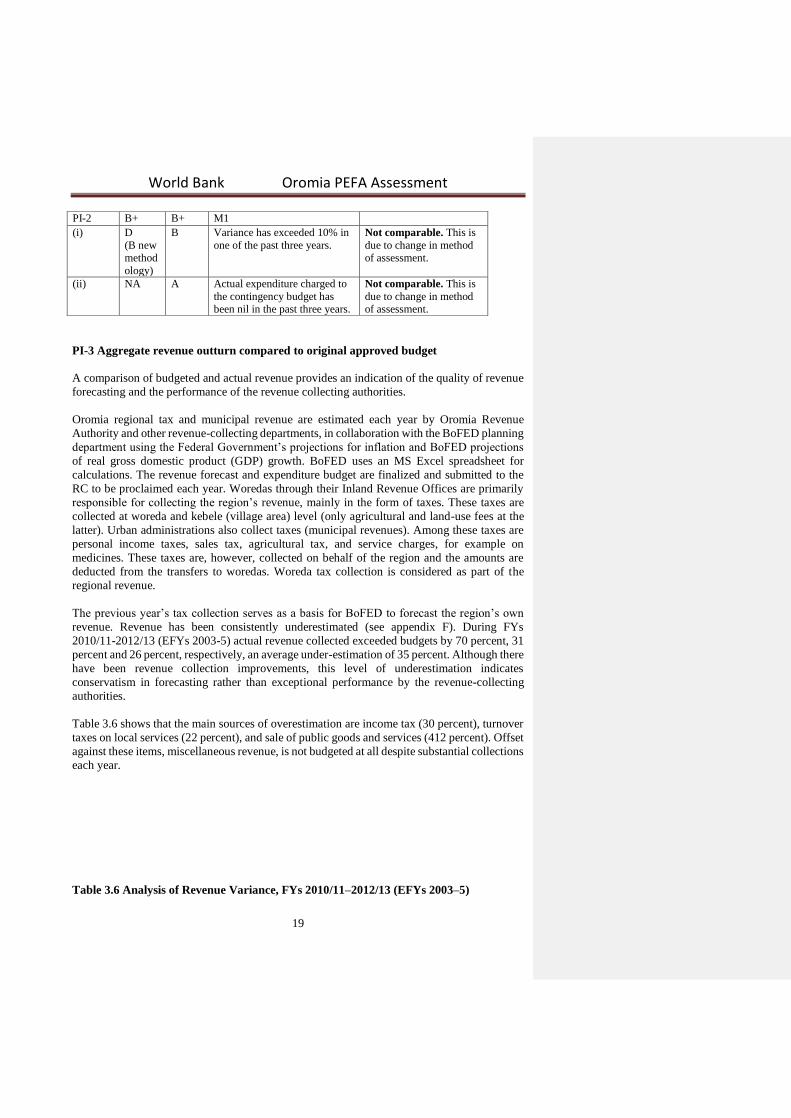
19
PI-2 B+ B+ M1 (i) D
(B new
method
ology)
B Variance has exceeded 10% in
one of the past three years. Not comparable. This is
due to change in method
of assessment.
(ii) NA A Actual expenditure charged to
the contingency budget has
been nil in the past three years.
Not comparable. This is
due to change in method
of assessment.
PI-3 Aggregate revenue outturn compared to original approved budget
A comparison of budgeted and actual revenue provides an indication of the quality of revenue
forecasting and the performance of the revenue collecting authorities.
Oromia regional tax and municipal revenue are estimated each year by Oromia Revenue
Authority and other revenue-collecting departments, in collaboration with the BoFED planning
department using the Federal Government’s projections for inflation and BoFED projections
of real gross domestic product (GDP) growth. BoFED uses an MS Excel spreadsheet for
calculations. The revenue forecast and expenditure budget are finalized and submitted to the
RC to be proclaimed each year. Woredas through their Inland Revenue Offices are primarily
responsible for collecting the region’s revenue, mainly in the form of taxes. These taxes are
collected at woreda and kebele (village area) level (only agricultural and land-use fees at the
latter). Urban administrations also collect taxes (municipal revenues). Among these taxes are
personal income taxes, sales tax, agricultural tax, and service charges, for example on
medicines. These taxes are, however, collected on behalf of the region and the amounts are
deducted from the transfers to woredas. Woreda tax collection is considered as part of the
regional revenue.
The previous year’s tax collection serves as a basis for BoFED to forecast the region’s own
revenue. Revenue has been consistently underestimated (see appendix F). During FYs
2010/11-2012/13 (EFYs 2003-5) actual revenue collected exceeded budgets by 70 percent, 31
percent and 26 percent, respectively, an average under-estimation of 35 percent. Although there
have been revenue collection improvements, this level of underestimation indicates
conservatism in forecasting rather than exceptional performance by the revenue-collecting
authorities.
Table 3.6 shows that the main sources of overestimation are income tax (30 percent), turnover
taxes on local services (22 percent), and sale of public goods and services (412 percent). Offset
against these items, miscellaneous revenue, is not budgeted at all despite substantial collections
each year.
Table 3.6 Analysis of Revenue Variance, FYs 2010/11–2012/13 (EFYs 2003–5)

World Bank Oromia PEFA Assessment
20
Description
Total budget
for 3 years (birr
millions)
Total actual
for 3 years (ETB,
millions)
Actual
as % of
budget
Total revenue 8646.4 11,667.7 135%
Tax revenue 7673.1 9440.7 123%
Tax on income, profit, and capital gain 5116.5 6637.1 130% Value added tax 1781.1 1977.7 111% Excise taxes on locally manufactured goods 3.7 0.9 25% Sales turnover tax on locally manufactured
goods 362.5 409.8 113% Turnover tax on local services 108.5 132.0 122% Stamps sales and duty 300.9 283.2 94% Excise tax on imported goods 0.0 0.0
Sales tax on imported goods 0.0 0.1
Non-tax revenue 965.2 2218.8 230%
Administrative fees and charges 213.8 280.2 131% Sales of public goods and services 182.4 933.1 512% Government investment income 560.9 461.2 82% Miscellaneous revenue 0.0 535.5 Contributions to pension fund 0.0 0.4 Capital revenue 8.1 8.2 101% Sales of movable and immovable properties 6.4 6.6 104% Sales of stock 0.1 0.0 10%
Royalty on public assets 1.6 1.7 104%
Source: BoFED accounts EFY 2003–5.
The method of scoring PI-3 was changed in 2011. Since then, underestimating revenue is also
penalized, although not as much as overestimation. This makes a big difference to the
comparison with the 2010 assessment. The score for 2010 would be D under the new method,
as revenue was grossly underestimated in the relevant years, at an average of 43 percent. In
effect, the pattern of underestimation has continued, particularly for non-tax revenues, although
slightly less in the past three years. There is no real change in performance, as shown in Table
3.7.
Table 3.7 PI-3 Results
Indicator Score
2010
2010 score
under new
method
Score
2014
Justification Performance change
PI-3 A D D Actual revenue was
above 116% of
budget in all three
years
No change.
PI-4 Stock and monitoring of expenditure payment arrears
World Bank Oromia PEFA Assessment
21
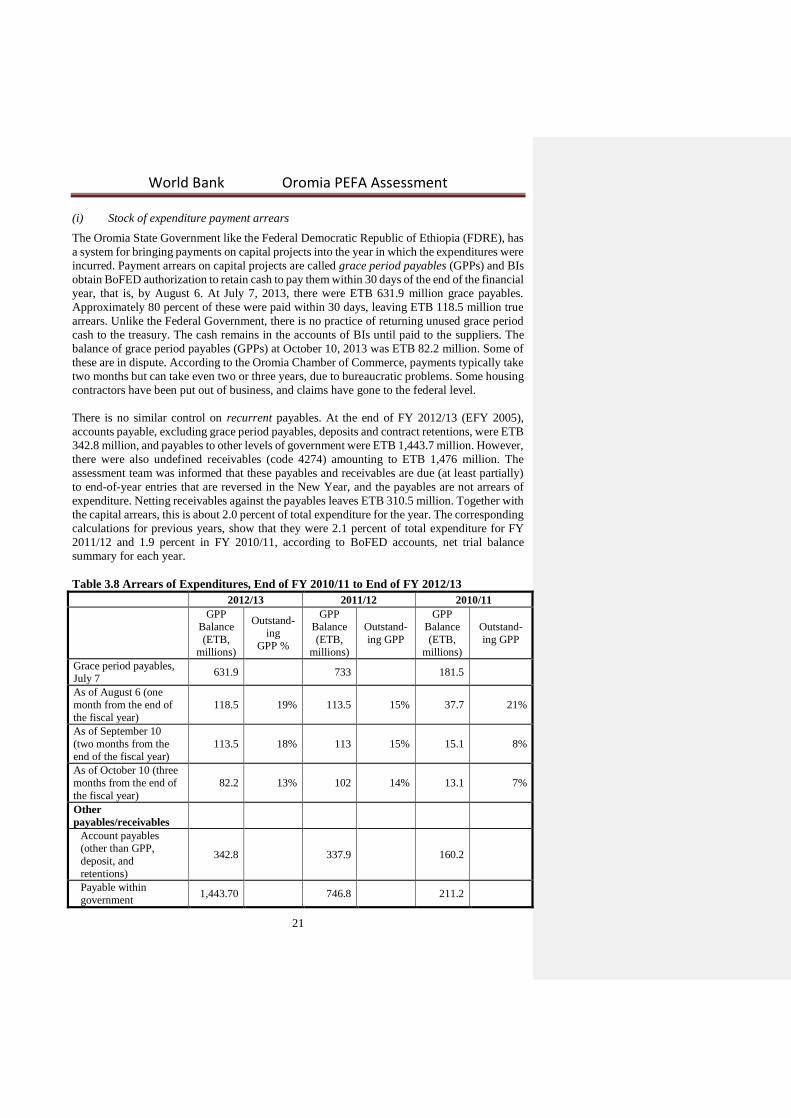
(i) Stock of expenditure payment arrears
The Oromia State Government like the Federal Democratic Republic of Ethiopia (FDRE), has
a system for bringing payments on capital projects into the year in which the expenditures were
incurred. Payment arrears on capital projects are called grace period payables (GPPs) and BIs
obtain BoFED authorization to retain cash to pay them within 30 days of the end of the financial
year, that is, by August 6. At July 7, 2013, there were ETB 631.9 million grace payables.
Approximately 80 percent of these were paid within 30 days, leaving ETB 118.5 million true
arrears. Unlike the Federal Government, there is no practice of returning unused grace period
cash to the treasury. The cash remains in the accounts of BIs until paid to the suppliers. The
balance of grace period payables (GPPs) at October 10, 2013 was ETB 82.2 million. Some of
these are in dispute. According to the Oromia Chamber of Commerce, payments typically take
two months but can take even two or three years, due to bureaucratic problems. Some housing
contractors have been put out of business, and claims have gone to the federal level.
There is no similar control on recurrent payables. At the end of FY 2012/13 (EFY 2005),
accounts payable, excluding grace period payables, deposits and contract retentions, were ETB
342.8 million, and payables to other levels of government were ETB 1,443.7 million. However,
there were also undefined receivables (code 4274) amounting to ETB 1,476 million. The
assessment team was informed that these payables and receivables are due (at least partially)
to end-of-year entries that are reversed in the New Year, and the payables are not arrears of
expenditure. Netting receivables against the payables leaves ETB 310.5 million. Together with
the capital arrears, this is about 2.0 percent of total expenditure for the year. The corresponding
calculations for previous years, show that they were 2.1 percent of total expenditure for FY
2011/12 and 1.9 percent in FY 2010/11, according to BoFED accounts, net trial balance
summary for each year.
Table 3.8 Arrears of Expenditures, End of FY 2010/11 to End of FY 2012/13
2012/13 2011/12 2010/11
GPP
Balance
(ETB,
millions)
Outstand- ing
GPP %
GPP
Balance
(ETB,
millions)
Outstand- ing GPP
GPP
Balance
(ETB,
millions)
Outstand- ing GPP
Grace period payables,
July 7 631.9
733
181.5
As of August 6 (one
month from the end of
the fiscal year) 118.5 19% 113.5 15% 37.7 21%
As of September 10
(two months from the
end of the fiscal year) 113.5 18% 113 15% 15.1 8%
As of October 10 (three
months from the end of
the fiscal year) 82.2 13% 102 14% 13.1 7%
Other
payables/receivables
Account payables
(other than GPP,
deposit, and
retentions)
342.8 337.9 160.2
Payable within
government 1,443.70 746.8 211.2

World Bank Oromia PEFA Assessment
22
Less receivables -1,476 -855.8 -204.7
Net recurrent payables 310.50 228.90 0.00 166.70 0.00
Total arrears 429.00 0.19 342.40 0.15 204.40 0.21
Total expenditure for
the year 21,700.90 16,602.40 10,540.50
% of arrears to total
expenditure 1.98% 2.06% 1.94%
This dimension is rated on the balance of arrears at the end of the last financial year before the
assessment, i.e., at July 7, 2013. At that time, arrears were just under 2 percent of expenditure
for the year, which is counted as low and earns an A rating.
(ii) Availability of data to monitor the stock of expenditure payment arrears
Data on the stock of arrears is generated annually, but does not include an age profile.
Table 3.9 PI-4 Results
PI Score
2010 Score
2014 Justification for score Performance change
PI-4
B+ B+ M1
(i) A A The stock of arrears is less
than 2% of total expenditure. The end-year stock of arrears has
grown since FY 2008/09 but has
fallen as a % of expenditure since FY
2010/11. Delays in paying bills are
due to bureaucratic problems rather
than commitment control problems. (ii) B B The annual accounts show
payables in detail, but they are
not analyzed by age.
No change.
3.2 Comprehensiveness and Transparency
PI-5 Classification of the Budget
(i) The classification system used for formulation, execution, and reporting of the central
government budget
The same chart of accounts is used for formulating the budget, reporting during the year, and
for informing the annual financial statements at all levels of government. The assessment of
this indicator is, therefore, the same as for the Federal Government. See Table 3.10 for results.
Revenue is classified according to the International Monetary Fund (IMF) government finance
statistics (GFS) standards (tax revenue, non-tax revenue, and capital revenue), although with
three exceptions: (1) privatization proceeds (sale of public enterprise equity) are treated as
capital revenue rather than a financing item; (2) repayments of principal on loans made by the
Government of Ethiopia (GoE) (code 1505) are also treated as capital revenue rather than a
financing item; and (3) external assistance (donor grants) is treated as a financing item rather
than revenue.
The expenditure budget is broken into four parts: (1) recurrent; (2) capital expenditure from

World Bank Oromia PEFA Assessment
23
treasury revenue; (3) capital from external assistance (grants); and (4) capital from donor loans.
There is also an administrative classification, with organizations classified into four broad
functional groups: administrative and general, economic, social, and other. These groups are
then classified into 22 sub-functions, which broadly align with the international classification
of functions of government (COFOG) at the main function level (10 main functions), but not
the sub-functions. At present, program budgeting has not been introduced into regional
planning and budgeting.
The budget and accounts also use two further classifications, although the printed budget does
not present this detail. The first is area of expenditure: personnel, classification 61; goods and
services, 62; fixed assets and construction, 63; and other payments, 64. The latter includes
grants and subsidies, investments, debt service, contingency, and pension payments. The
second is line items, which analyze areas of expenditure in more detail, e.g., salaries to
permanent staff are coded 6111. These two classifications constitute an economic classification
that is broadly compliant with the IMF GFS classification except that public debt principal
repayments are treated as expenditures rather than negative financing.6
All expenditure is classified by jurisdiction (i.e., region and city administration, zone and sub-
city, and woreda) and source of finance.
Table 3.10 PI-5 Results
PI Score
in 2010 Score
in 2014 Justification for score Performance
change PI-5 B B Budget formulation and execution is based
on administrative, economic, and functional
classification (using at least the 10 main
COFOG functions), using GFS and COFOG
standards or a standard that can produce
consistent documentation according to those
standards.
No change.
PI-6 Comprehensiveness of information included in budget documentation
In order for the legislature to carry out its function of scrutiny and approval, the budget
documentation should allow a complete overview of fiscal forecasts, budget proposals, and
results of past fiscal years.
This indicator is assessed on the latest budget documentation, which is for FY 2013/14 (EFY
2006). The budget documentation7 as submitted to the RC (budget estimates) includes the
requirements in Table 3.11.
Table 3.11 Information in Budget Documentation for FY 2013/14
Fur 6 It appears that highly concessionary loans in the past have been treated as grants and taken to revenue, so the
logic is to treat their repayment as expenditure. Neither treatment complies with IMF-GFS standards. 7 The budget documentation submitted to the Oromia Regional Council consists of the Macro-Economic and
Fiscal Framework (end December/early January) and the detailed estimates of revenue and expenditure (end
May).

World Bank Oromia PEFA Assessment
24
Requirement
Fulfilled Document
1. Macroeconomic assumptions,
including aggregate growth,
inflation, and exchange rate
estimates, at the very least
Yes The Budget and Financial Affairs Committee of
the Oromia Regional Council receives only the
draft Budget. GDP growth data are shown for
the past three years and forecast years in the
budget document.
2. Fiscal deficit
Not
applicable The law requires a balanced budget.
3. Deficit financing
Not
applicable The law requires a balanced budget.
4. Public debt stock Not
applicable The state may now legally borrow (Financial
Proclamation 156/2010, Article 39), but no
formal borrowing has been completed at the
time of this assessment. 5. Financial assets No These are in the trial balance but this is not part
of the budget documentation.
Supplementary budget considers financial assets.
Quarterly report is submitted and discussed in
depth with cabinet.
6. Prior year’s budget outturn (FY
2011/12), in the same format as the
budget for FY 2013/14
No Only data for the budget year are shown.
7. Current year’s budget outturn
(FY 2012/13), in the same format
as the budget for FY 2013/14
No This is not provided. Explained to the RC, but not in terms of
delivery. 8. Summarized budget data for both
revenue and expenditure according
to the main heads of the
classifications used (ref. PI-5),
including data for the current and
previous year
Partial The detailed budget shows only data for the
budget year. Revenue summary over the years is available,
but expenditure is not.
9. Explanation of the budget
implications of new policy
initiatives
Yes Social and economic situation of the regions in
the past is assessed.
Current year priorities and policy issues and
implication to the budget are explained:
Priorities detailed by sectors, including the
Growth and Transformation Plan (GTP).
Proportion of above information contained in the budgetary documentation published most
recently by the central government
The most recent budget documentation of EFY 2006 (FY 2013/14) fulfils two of the six
applicable information benchmarks.
Table 3.12 PI-6 Results
PI Score
2010 Score
2014 Justification Performance change
World Bank Oromia PEFA Assessment
25
PI-6
D C Two of the six applicable
information elements are
completely provided.
No change.
PI-7 Coverage of government operations
Fiscal information such as the budget, execution reports, and financial statements should
include all budgetary and extra-budgetary activities in order to allow a complete overview of
revenues, expenditures, and public financing.
(i) Level of extra-budgetary expenditure (not including project expenditures financed by
donors) that does not appear in fiscal reports
The revenue and expenditure accounts for the last completed financial year (FY 2012/13)
appear to be comprehensive except as follows.
In addition to its own budget (Code 273, the second largest BI in the Oromia Regional
Government (ORG) Budget after education), the Oromia Roads Authority acts as a de-
concentrated agency of GoE’s Ethiopia Roads Authority (ERA), which administers the DP-
supported Roads Fund (RF). The RF finances GoE road maintenance projects. By agreement
with DPs, the ERA transfers funds monthly from the RF to Oromia Roads Authority which
manages both financial and physical project performance. The Oromia Roads Authority
maintains separate project accounts on a stand-alone Integrated Budget and Expenditures
(IBEX) system and reports monthly to BoFED and quarterly to the RF. The budgeted
expenditure for FY 2013/14 out of the RF is ETB 1,480 million, mainly for road maintenance
(contracted out to Oromia Road Construction Enterprise up to FY 2012/13).
The funding is effectively a Channel 2a mechanism (DPs to sector ministries to sector bureaus),
as mentioned under PI-7 dimension (ii). As with other Channel 2a projects, the RF-funded
projects are (or should be) budgeted and reported on at federal level. If they are not, then they
are an unreported EBO at federal level, not regional level. In any case, as noted above, the
Oromia Roads Authority reports quarterly to RF, indicating that spending is not an unreported
EBO. Even if it is an extra-budgetary operation at the regional level, its operations are reported
to BoFED, which is in the position to report to the Regional Cabinet, which itself can report to
the RC (which is the case in Amhara, as noted under PI-7 (i) in the 2010 and 2014 PEFA
assessments).
The budget and accounts, both in-year and annual, include many autonomous bodies, which
are shown in each year’s accounts, such as the Credit Guarantee Fund (Code 461), Police
Commission, Oromia Public Enterprise Supervising Authority, Agricultural Research Institute,
and Public Service College, which is in accordance with the International Public Sector
Accounting Standards (IPSAS) and PEFA Framework. Public enterprises are excluded from
the budget and accounts, in accordance with the PEFA Framework.
There are seven bodies outside the Oromia National Regional State (ONRS) accounts (IBEX)
system, which are all owned 100 percent by ONRS. They are supervised by the Privatization
and Public Enterprises Supervising Authority (PPESA), which reports to the ONRS President
and the Council. On preliminary analysis, it appears that only two of the seven are in fact public
enterprises (non-financial public corporations), as defined by UN and IMF GFS (GFSM 2001),
as follows:
1. Oromia Forest and Wild Life Enterprise. This enterprise was set up to manage the
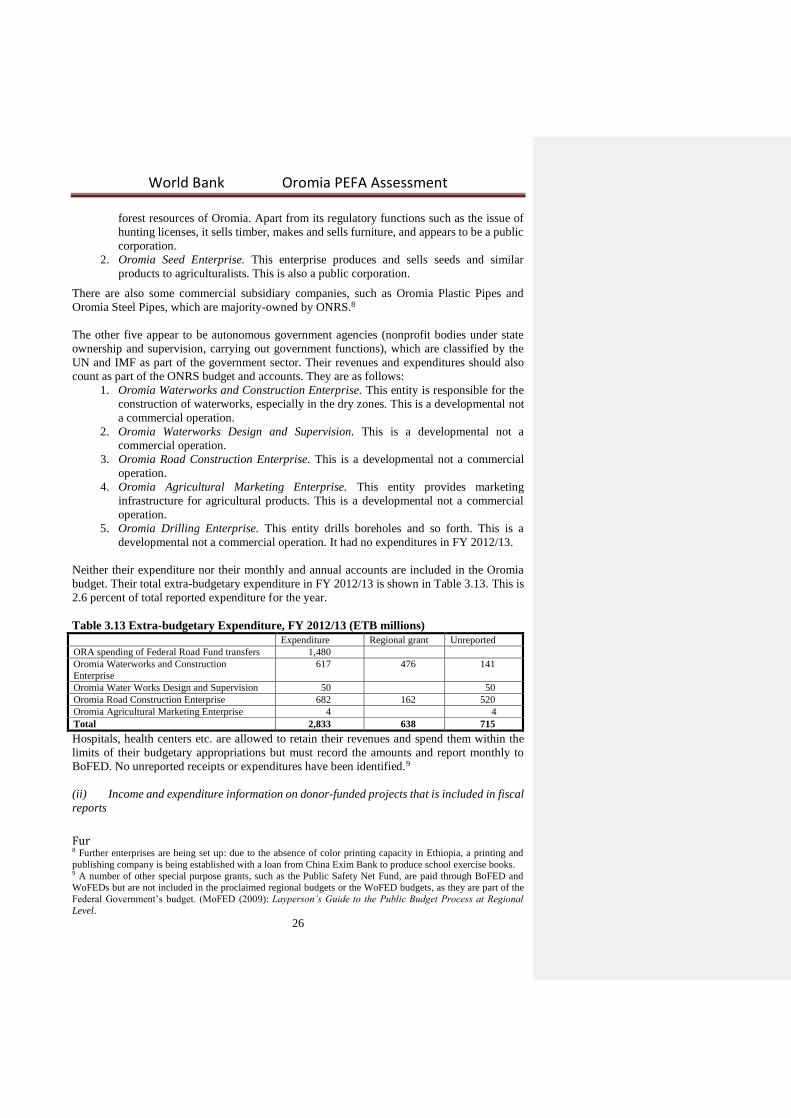
World Bank Oromia PEFA Assessment
26
forest resources of Oromia. Apart from its regulatory functions such as the issue of
hunting licenses, it sells timber, makes and sells furniture, and appears to be a public
corporation.
2. Oromia Seed Enterprise. This enterprise produces and sells seeds and similar
products to agriculturalists. This is also a public corporation.
There are also some commercial subsidiary companies, such as Oromia Plastic Pipes and
Oromia Steel Pipes, which are majority-owned by ONRS.8
The other five appear to be autonomous government agencies (nonprofit bodies under state
ownership and supervision, carrying out government functions), which are classified by the
UN and IMF as part of the government sector. Their revenues and expenditures should also
count as part of the ONRS budget and accounts. They are as follows:
1. Oromia Waterworks and Construction Enterprise. This entity is responsible for the
construction of waterworks, especially in the dry zones. This is a developmental not
a commercial operation.
2. Oromia Waterworks Design and Supervision. This is a developmental not a
commercial operation.
3. Oromia Road Construction Enterprise. This is a developmental not a commercial
operation.
4. Oromia Agricultural Marketing Enterprise. This entity provides marketing
infrastructure for agricultural products. This is a developmental not a commercial
operation.
5. Oromia Drilling Enterprise. This entity drills boreholes and so forth. This is a
developmental not a commercial operation. It had no expenditures in FY 2012/13.
Neither their expenditure nor their monthly and annual accounts are included in the Oromia
budget. Their total extra-budgetary expenditure in FY 2012/13 is shown in Table 3.13. This is
2.6 percent of total reported expenditure for the year.
Table 3.13 Extra-budgetary Expenditure, FY 2012/13 (ETB millions)
Expenditure Regional grant Unreported
ORA spending of Federal Road Fund transfers 1,480
Oromia Waterworks and Construction
Enterprise
617 476 141
Oromia Water Works Design and Supervision 50 50
Oromia Road Construction Enterprise 682 162 520
Oromia Agricultural Marketing Enterprise 4 4
Total 2,833 638 715
Hospitals, health centers etc. are allowed to retain their revenues and spend them within the
limits of their budgetary appropriations but must record the amounts and report monthly to
BoFED. No unreported receipts or expenditures have been identified.9
(ii) Income and expenditure information on donor-funded projects that is included in fiscal
reports
Fur 8 Further enterprises are being set up: due to the absence of color printing capacity in Ethiopia, a printing and
publishing company is being established with a loan from China Exim Bank to produce school exercise books. 9 A number of other special purpose grants, such as the Public Safety Net Fund, are paid through BoFED and
WoFEDs but are not included in the proclaimed regional budgets or the WoFED budgets, as they are part of the
Federal Government’s budget. (MoFED (2009): Layperson’s Guide to the Public Budget Process at Regional
Level.
World Bank Oromia PEFA Assessment
27
Donor funding to Oromia is provided through the following channels:
The Promotion of Basic Services (PBS) Program. The funds are akin to budget support
to the Federal Government, which is then incorporated into the Federal Government
block grant to regional governments.
Channel 1. Donor funding for projects and programs is channeled through MoFED to
BoFED (Channel 1a), the spending being budgeted for at federal level, or is provided
straight to BoFED (Channel 1b), which then allocates the funds to sector bureaus and
woredas, the spending being budgeted for at regional level. Most of this spending
represents UN Executive Committee (ExCom)-funded projects (UNICEF, UN
Development Program (UNDP) and UN Population Fund (UNFPA)). The annual
amounts being very small.
Channel 2. Donor funding for projects and programs is channeled through Federal
Government line ministries to the corresponding regional sector bureaus (Channel 2a)
or is provided straight to the sector bureaus (Channel 2b). The Channel 2a funding is
supposed to be budgeted for at federal ministry level. The Channel 2b funding is
supposed to be budgeted for at regional level, but, as with other regions, this tends not
to be the case in Oromia, the actual spending not being reported to BoFED either. The
spending therefore constitutes unreported EBOs, the magnitude of which is not known.
Judging by the experience in other regions assessed, the amounts could be significant.
Channel 3. Donors (including NGOs) fund projects directly, bypassing both BoFED
and sector bureaus.
PI-7 (ii) refers only to funds provided directly to any level of ONRS, that is, not through the
federal subsidy, and only to extra-budgetary operations, that is, operations that are not in the
Oromia budget and/or not included in the Oromia monthly and annual accounts. This definition
excludes all the channel 1a projects—the PBS program, Productive Safety Net Program
(PSNP), Household Asset Building Program (HABP), General Education Quality
Improvement Program (GEQIP), Urban Local Government Development Program (ULGDP),
Public Sector Capacity Building Program (PSCAP), and WaSH—and, in principle, Channel 2a
projects. In principle, it excludes the Channel 1b projects (four UN ExCom projects), as these
are contained in the approved budgets. At present, however, actual spending is not being
reported on through IBEX due to the ongoing connectivity problems.
There is little information on Channel 2 and Channel 3 aid flows. Under Channel 2, the Global
Fund for HIV, Malaria and Tuberculosis provides support directly to the Oromia Health Bureau
and is not included in the Oromia budget or accounts, and appears not to be included either in
the Ministry of Health (MoH), as also noted in the 2010 PEFA, at which time the Global Fund
was spending very large amounts of money in Ethiopia, including in Oromia. According to the
Health Bureau, US$ 67.9 million (approximately ETB 1,328 million) was disbursed to Oromia
in FY 2012/13. Aid through the Agricultural Sector Support Project is channeled through the
Ministry of Agriculture to Oromia Agriculture Bureau and is also omitted from Oromia fiscal
reports, as it is covered in the Ministry of Agriculture’s budget. Table 3.44, under indicator D-
3, shows ETB 283 million on the UN ExCom projects funded through Channel 1b. These are
budgeted for, but spending is currently not captured by IBEX (it was up to FY 2010/11).
Together, these amount to ETB 1,611 million.
Under Channel 3, “unreported expenditure” in terms of assessing PI-7 (ii) includes any external
aid to projects that does not flow through government accounts but has been agreed to through
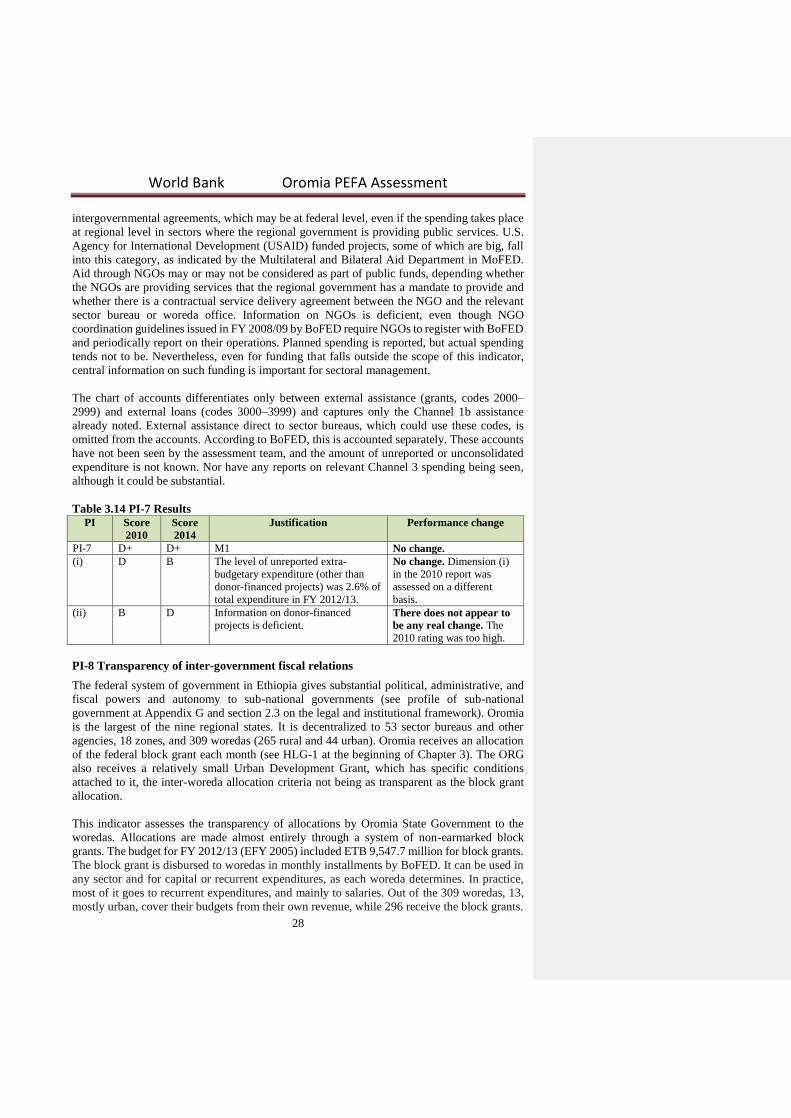
World Bank Oromia PEFA Assessment
28
intergovernmental agreements, which may be at federal level, even if the spending takes place
at regional level in sectors where the regional government is providing public services. U.S.
Agency for International Development (USAID) funded projects, some of which are big, fall
into this category, as indicated by the Multilateral and Bilateral Aid Department in MoFED.
Aid through NGOs may or may not be considered as part of public funds, depending whether
the NGOs are providing services that the regional government has a mandate to provide and
whether there is a contractual service delivery agreement between the NGO and the relevant
sector bureau or woreda office. Information on NGOs is deficient, even though NGO
coordination guidelines issued in FY 2008/09 by BoFED require NGOs to register with BoFED
and periodically report on their operations. Planned spending is reported, but actual spending
tends not to be. Nevertheless, even for funding that falls outside the scope of this indicator,
central information on such funding is important for sectoral management.
The chart of accounts differentiates only between external assistance (grants, codes 2000–
2999) and external loans (codes 3000–3999) and captures only the Channel 1b assistance
already noted. External assistance direct to sector bureaus, which could use these codes, is
omitted from the accounts. According to BoFED, this is accounted separately. These accounts
have not been seen by the assessment team, and the amount of unreported or unconsolidated
expenditure is not known. Nor have any reports on relevant Channel 3 spending being seen,
although it could be substantial.
Table 3.14 PI-7 Results
PI Score
2010 Score
2014 Justification Performance change
PI-7 D+ D+ M1 No change. (i) D B The level of unreported extra-
budgetary expenditure (other than
donor-financed projects) was 2.6% of
total expenditure in FY 2012/13.
No change. Dimension (i)
in the 2010 report was
assessed on a different
basis. (ii) B D Information on donor-financed
projects is deficient. There does not appear to
be any real change. The
2010 rating was too high.
PI-8 Transparency of inter-government fiscal relations
The federal system of government in Ethiopia gives substantial political, administrative, and
fiscal powers and autonomy to sub-national governments (see profile of sub-national
government at Appendix G and section 2.3 on the legal and institutional framework). Oromia
is the largest of the nine regional states. It is decentralized to 53 sector bureaus and other
agencies, 18 zones, and 309 woredas (265 rural and 44 urban). Oromia receives an allocation
of the federal block grant each month (see HLG-1 at the beginning of Chapter 3). The ORG
also receives a relatively small Urban Development Grant, which has specific conditions
attached to it, the inter-woreda allocation criteria not being as transparent as the block grant
allocation.
This indicator assesses the transparency of allocations by Oromia State Government to the
woredas. Allocations are made almost entirely through a system of non-earmarked block
grants. The budget for FY 2012/13 (EFY 2005) included ETB 9,547.7 million for block grants.
The block grant is disbursed to woredas in monthly installments by BoFED. It can be used in
any sector and for capital or recurrent expenditures, as each woreda determines. In practice,
most of it goes to recurrent expenditures, and mainly to salaries. Out of the 309 woredas, 13,
mostly urban, cover their budgets from their own revenue, while 296 receive the block grants.
World Bank Oromia PEFA Assessment
29
The allocation formula is continuously being refined. Several regions, including Oromia, now
use a formula that is based on the unit costs of basic services, multiplied by the respective
numbers of beneficiaries.
The assessment team visited East Shewa Zonal Office and Lomie Woreda to check on the
predictability, transparency, and timing of Oromia state transfers. The East Shewa Zone has 30
sector offices, 10 rural woredas, and 3 urban woredas. The Zonal Office of Finance and
Economic Development (ZoFED), which is, along with zonal sector offices, a de-concentrated
component of the regional government, provides support to the sector offices on planning and
budgeting. Lomie Woreda comprises 35 rural kebeles and five lower town administrations.
(i) Transparency and objectivity in the horizontal allocation among woreda government
of transfers from ORG
The Oromia State Council allocates the block grant to the woredas based on unit costs, a
formula that is intended to give every citizen fair and equal access to basic services: health,
education, clean water, agricultural development, and road access. The formula is based on the
following variables: (1) the number of beneficiaries of each basic service; (2) the unit (per
capita) cost of woreda services; and (3) the revenue-raising potential. Data are collected and
provided by each zone to BoFED in December and January. Expenditure needs are then
estimated by sector, including education, health, agriculture, water, roads, and administration.
Within these sectors, the main unit costs are identified, for example cost per student, per patient,
and so on. Costs per unit are standardized and multiplied by the numbers of students, extension
workers, and so forth. This gives the total cost of meeting the needs in each woreda, and funds
are allocated accordingly.
Some of the “data” are matters of opinion, such as the revenue-generating potential. Woredas
appear to be unable to use their data to calculate their subsidy themselves, and save themselves
the trouble by waiting for the notification from BoFED and adjusting their budgets accordingly.
The capital budget provided by the Federal Government is allocated to woredas according to
the infrastructure deficit in each of the basic sectors. Woredas with relatively poor
infrastructure (schools, classrooms, farmer training centers, veterinary clinics, health centers
and health posts, water supply, and roads) get higher shares. Each capital project must be
approved and managed at the regional level. Disbursements are made according to progress.
(ii) Timely provision of reliable information to subnational governments on the allocations
to be made to them by central government for the following year
The total amount of block grants to woredas from BoFED is mainly based on the amount of
block grant from MoFED to BoFED. The initial notification of this from MoFED is in
February. BoFED then provides woredas with initial notification of the block grants to them.
Woreda offices then start preparing their budgets. Each Woreda Office of Finance and
Economic Development (WoFED) consolidates its sector offices’ work plans into a proposed
budget and submits it to the Woreda Cabinet to be checked and agreed on. WoFED makes any
necessary adjustments based on comments from the Cabinet and submits the budget to BoFED
via the zonal office, which plays a facilitation and coordination role. The Cabinet may make
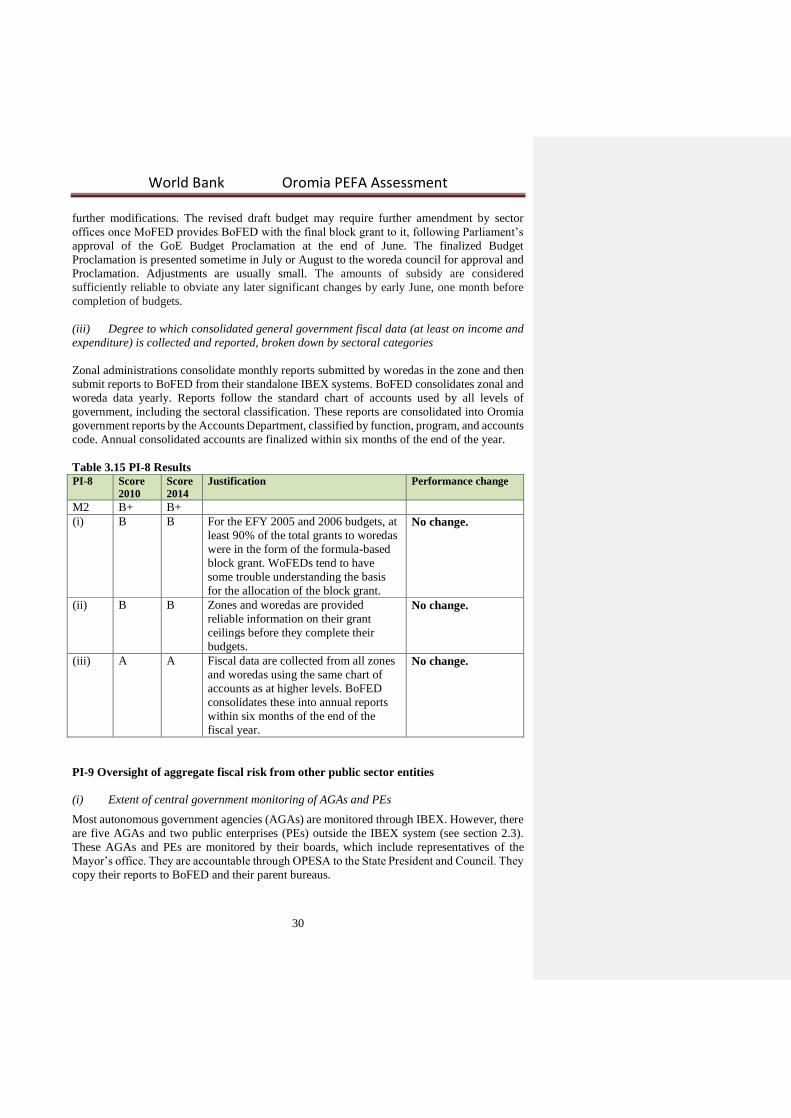
World Bank Oromia PEFA Assessment
30
further modifications. The revised draft budget may require further amendment by sector
offices once MoFED provides BoFED with the final block grant to it, following Parliament’s
approval of the GoE Budget Proclamation at the end of June. The finalized Budget
Proclamation is presented sometime in July or August to the woreda council for approval and
Proclamation. Adjustments are usually small. The amounts of subsidy are considered
sufficiently reliable to obviate any later significant changes by early June, one month before
completion of budgets.
(iii) Degree to which consolidated general government fiscal data (at least on income and
expenditure) is collected and reported, broken down by sectoral categories
Zonal administrations consolidate monthly reports submitted by woredas in the zone and then
submit reports to BoFED from their standalone IBEX systems. BoFED consolidates zonal and
woreda data yearly. Reports follow the standard chart of accounts used by all levels of
government, including the sectoral classification. These reports are consolidated into Oromia
government reports by the Accounts Department, classified by function, program, and accounts
code. Annual consolidated accounts are finalized within six months of the end of the year.
Table 3.15 PI-8 Results
PI-8 Score
2010 Score
2014 Justification Performance change
M2 B+ B+
(i) B B For the EFY 2005 and 2006 budgets, at
least 90% of the total grants to woredas
were in the form of the formula-based
block grant. WoFEDs tend to have
some trouble understanding the basis
for the allocation of the block grant.
No change.
(ii) B B Zones and woredas are provided
reliable information on their grant
ceilings before they complete their
budgets.
No change.
(iii) A A Fiscal data are collected from all zones
and woredas using the same chart of
accounts as at higher levels. BoFED
consolidates these into annual reports
within six months of the end of the
fiscal year.
No change.
PI-9 Oversight of aggregate fiscal risk from other public sector entities
(i) Extent of central government monitoring of AGAs and PEs
Most autonomous government agencies (AGAs) are monitored through IBEX. However, there
are five AGAs and two public enterprises (PEs) outside the IBEX system (see section 2.3).
These AGAs and PEs are monitored by their boards, which include representatives of the
Mayor’s office. They are accountable through OPESA to the State President and Council. They
copy their reports to BoFED and their parent bureaus.
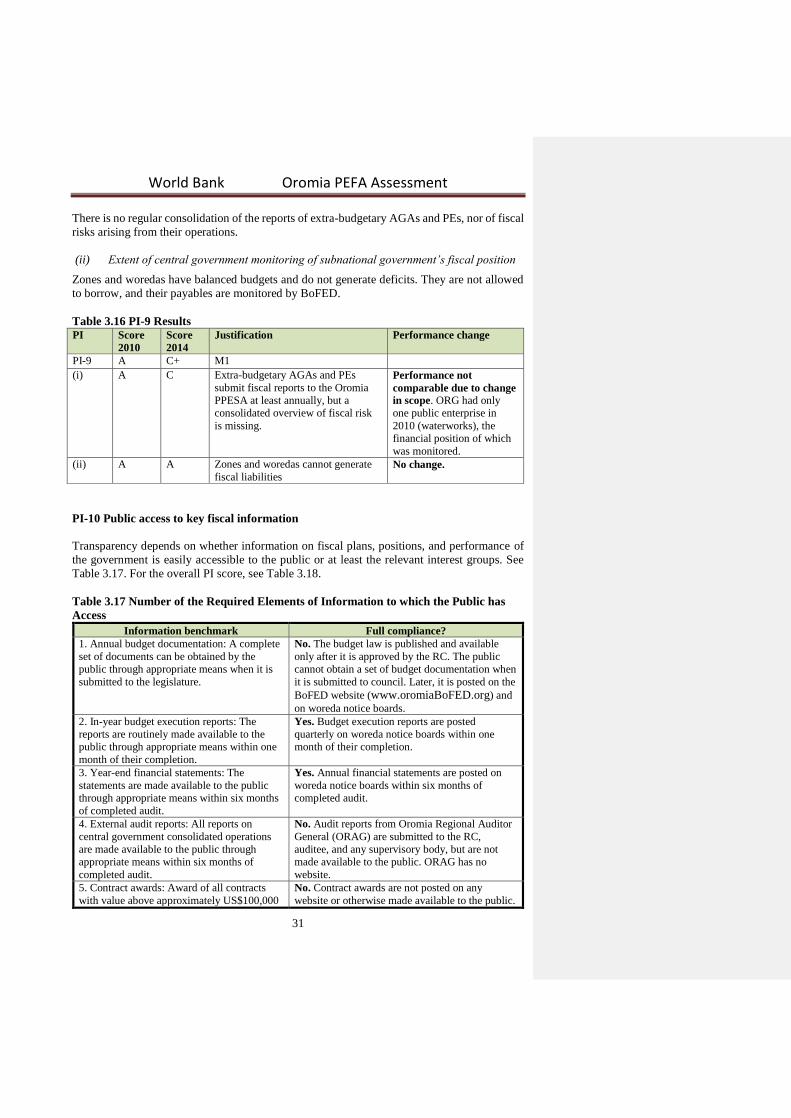
World Bank Oromia PEFA Assessment
31
There is no regular consolidation of the reports of extra-budgetary AGAs and PEs, nor of fiscal
risks arising from their operations.
(ii) Extent of central government monitoring of subnational government’s fiscal position
Zones and woredas have balanced budgets and do not generate deficits. They are not allowed
to borrow, and their payables are monitored by BoFED.
Table 3.16 PI-9 Results
PI Score
2010 Score
2014 Justification Performance change
PI-9 A C+ M1 (i) A C Extra-budgetary AGAs and PEs
submit fiscal reports to the Oromia
PPESA at least annually, but a
consolidated overview of fiscal risk
is missing.
Performance not
comparable due to change
in scope. ORG had only
one public enterprise in
2010 (waterworks), the
financial position of which
was monitored. (ii) A A Zones and woredas cannot generate
fiscal liabilities No change.
PI-10 Public access to key fiscal information
Transparency depends on whether information on fiscal plans, positions, and performance of
the government is easily accessible to the public or at least the relevant interest groups. See
Table 3.17. For the overall PI score, see Table 3.18.
Table 3.17 Number of the Required Elements of Information to which the Public has
Access
Information benchmark Full compliance? 1. Annual budget documentation: A complete
set of documents can be obtained by the
public through appropriate means when it is
submitted to the legislature.
No. The budget law is published and available
only after it is approved by the RC. The public
cannot obtain a set of budget documentation when
it is submitted to council. Later, it is posted on the
BoFED website (www.oromiaBoFED.org) and
on woreda notice boards. 2. In-year budget execution reports: The
reports are routinely made available to the
public through appropriate means within one
month of their completion.
Yes. Budget execution reports are posted
quarterly on woreda notice boards within one
month of their completion.
3. Year-end financial statements: The
statements are made available to the public
through appropriate means within six months
of completed audit.
Yes. Annual financial statements are posted on
woreda notice boards within six months of
completed audit.
4. External audit reports: All reports on
central government consolidated operations
are made available to the public through
appropriate means within six months of
completed audit.
No. Audit reports from Oromia Regional Auditor
General (ORAG) are submitted to the RC,
auditee, and any supervisory body, but are not
made available to the public. ORAG has no
website. 5. Contract awards: Award of all contracts
with value above approximately US$100,000
No. Contract awards are not posted on any
website or otherwise made available to the public.
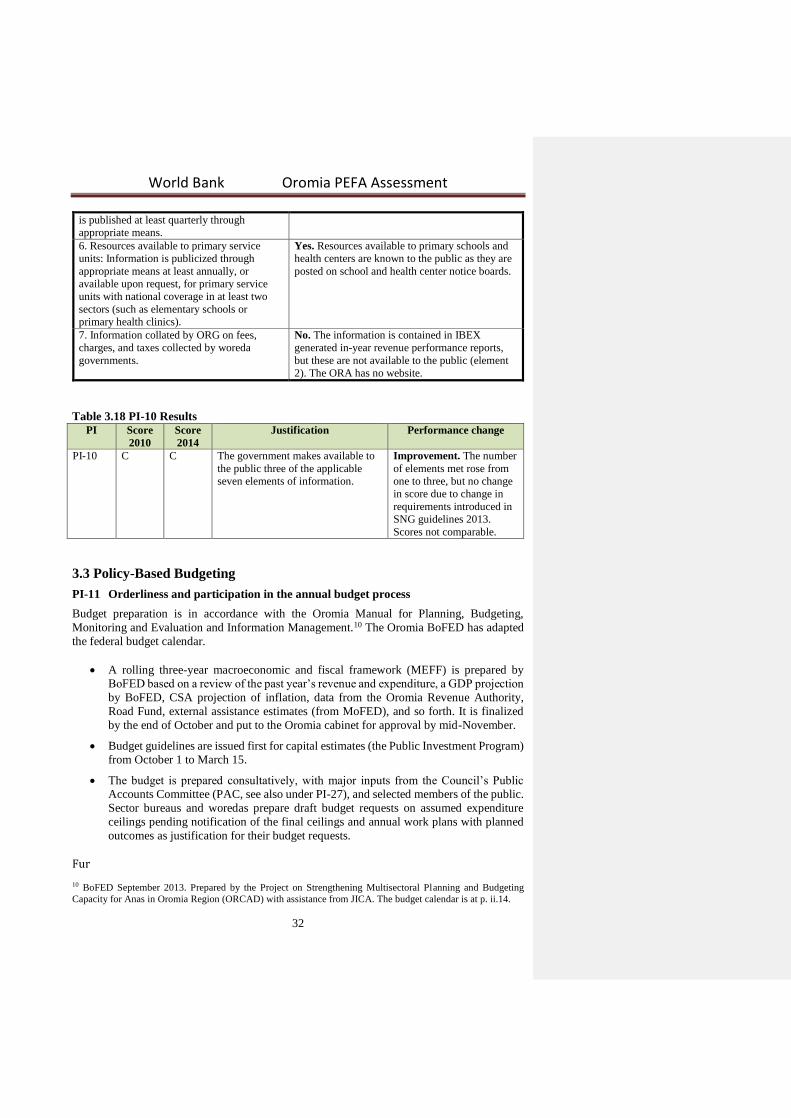
World Bank Oromia PEFA Assessment
32
is published at least quarterly through
appropriate means. 6. Resources available to primary service
units: Information is publicized through
appropriate means at least annually, or
available upon request, for primary service
units with national coverage in at least two
sectors (such as elementary schools or
primary health clinics).
Yes. Resources available to primary schools and
health centers are known to the public as they are
posted on school and health center notice boards.
7. Information collated by ORG on fees,
charges, and taxes collected by woreda
governments.
No. The information is contained in IBEX
generated in-year revenue performance reports,
but these are not available to the public (element
2). The ORA has no website.
Table 3.18 PI-10 Results
PI Score
2010 Score
2014 Justification Performance change
PI-10 C C The government makes available to
the public three of the applicable
seven elements of information.
Improvement. The number
of elements met rose from
one to three, but no change
in score due to change in
requirements introduced in
SNG guidelines 2013.
Scores not comparable.
3.3 Policy-Based Budgeting
PI-11 Orderliness and participation in the annual budget process
Budget preparation is in accordance with the Oromia Manual for Planning, Budgeting,
Monitoring and Evaluation and Information Management.10 The Oromia BoFED has adapted
the federal budget calendar.
A rolling three-year macroeconomic and fiscal framework (MEFF) is prepared by
BoFED based on a review of the past year’s revenue and expenditure, a GDP projection
by BoFED, CSA projection of inflation, data from the Oromia Revenue Authority,
Road Fund, external assistance estimates (from MoFED), and so forth. It is finalized
by the end of October and put to the Oromia cabinet for approval by mid-November.
Budget guidelines are issued first for capital estimates (the Public Investment Program)
from October 1 to March 15.
The budget is prepared consultatively, with major inputs from the Council’s Public
Accounts Committee (PAC, see also under PI-27), and selected members of the public.
Sector bureaus and woredas prepare draft budget requests on assumed expenditure
ceilings pending notification of the final ceilings and annual work plans with planned
outcomes as justification for their budget requests.
Fur 10 BoFED September 2013. Prepared by the Project on Strengthening Multisectoral Planning and Budgeting
Capacity for Anas in Oromia Region (ORCAD) with assistance from JICA. The budget calendar is at p. ii.14.
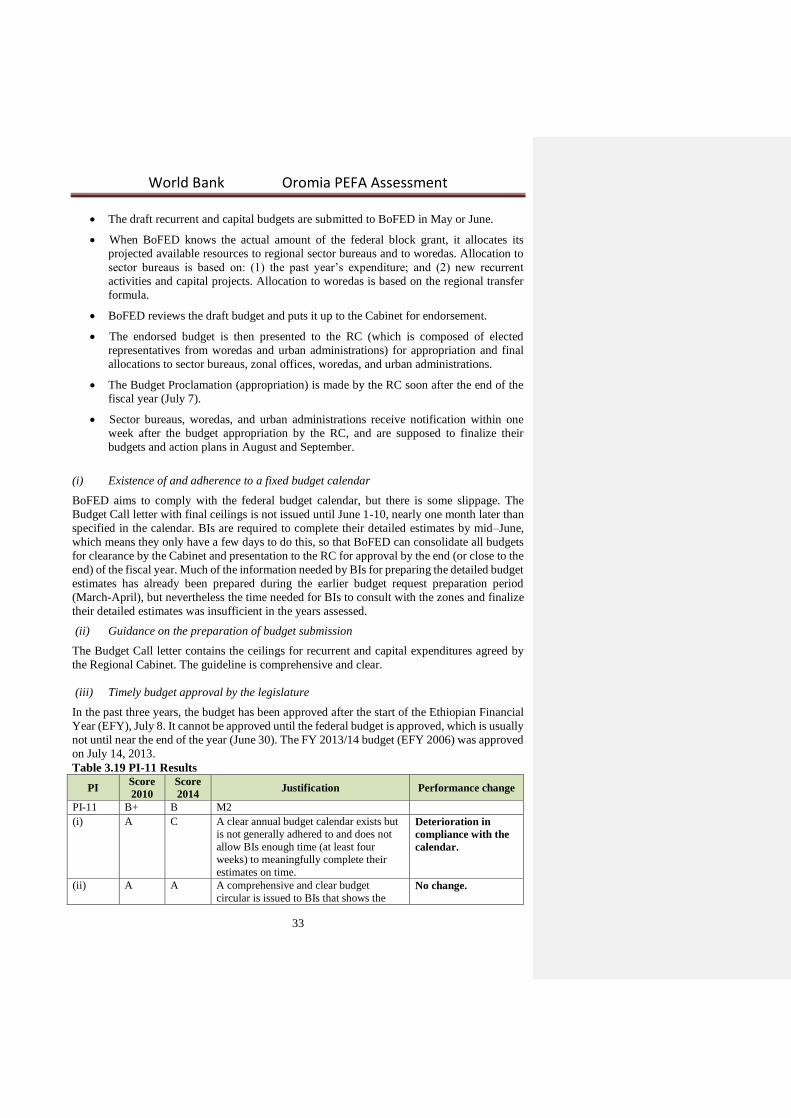
World Bank Oromia PEFA Assessment
33
The draft recurrent and capital budgets are submitted to BoFED in May or June.
When BoFED knows the actual amount of the federal block grant, it allocates its
projected available resources to regional sector bureaus and to woredas. Allocation to
sector bureaus is based on: (1) the past year’s expenditure; and (2) new recurrent
activities and capital projects. Allocation to woredas is based on the regional transfer
formula.
BoFED reviews the draft budget and puts it up to the Cabinet for endorsement.
The endorsed budget is then presented to the RC (which is composed of elected
representatives from woredas and urban administrations) for appropriation and final
allocations to sector bureaus, zonal offices, woredas, and urban administrations.
The Budget Proclamation (appropriation) is made by the RC soon after the end of the
fiscal year (July 7).
Sector bureaus, woredas, and urban administrations receive notification within one
week after the budget appropriation by the RC, and are supposed to finalize their
budgets and action plans in August and September.
(i) Existence of and adherence to a fixed budget calendar
BoFED aims to comply with the federal budget calendar, but there is some slippage. The
Budget Call letter with final ceilings is not issued until June 1-10, nearly one month later than
specified in the calendar. BIs are required to complete their detailed estimates by mid–June,
which means they only have a few days to do this, so that BoFED can consolidate all budgets
for clearance by the Cabinet and presentation to the RC for approval by the end (or close to the
end) of the fiscal year. Much of the information needed by BIs for preparing the detailed budget
estimates has already been prepared during the earlier budget request preparation period
(March-April), but nevertheless the time needed for BIs to consult with the zones and finalize
their detailed estimates was insufficient in the years assessed.
(ii) Guidance on the preparation of budget submission
The Budget Call letter contains the ceilings for recurrent and capital expenditures agreed by
the Regional Cabinet. The guideline is comprehensive and clear.
(iii) Timely budget approval by the legislature
In the past three years, the budget has been approved after the start of the Ethiopian Financial
Year (EFY), July 8. It cannot be approved until the federal budget is approved, which is usually
not until near the end of the year (June 30). The FY 2013/14 budget (EFY 2006) was approved
on July 14, 2013.
Table 3.19 PI-11 Results
PI Score
2010 Score
2014 Justification Performance change
PI-11 B+ B M2 (i) A C A clear annual budget calendar exists but
is not generally adhered to and does not
allow BIs enough time (at least four
weeks) to meaningfully complete their
estimates on time.
Deterioration in
compliance with the
calendar.
(ii) A A A comprehensive and clear budget
circular is issued to BIs that shows the No change.
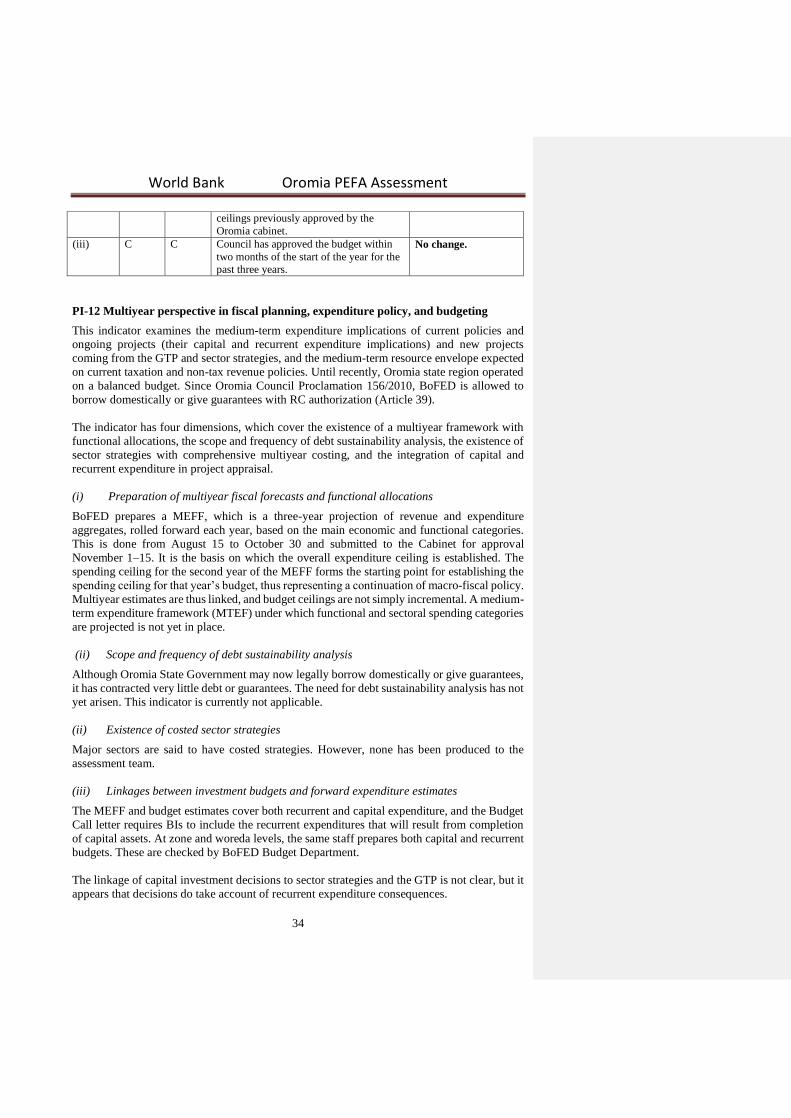
World Bank Oromia PEFA Assessment
34
ceilings previously approved by the
Oromia cabinet. (iii) C C Council has approved the budget within
two months of the start of the year for the
past three years.
No change.
PI-12 Multiyear perspective in fiscal planning, expenditure policy, and budgeting
This indicator examines the medium-term expenditure implications of current policies and
ongoing projects (their capital and recurrent expenditure implications) and new projects
coming from the GTP and sector strategies, and the medium-term resource envelope expected
on current taxation and non-tax revenue policies. Until recently, Oromia state region operated
on a balanced budget. Since Oromia Council Proclamation 156/2010, BoFED is allowed to
borrow domestically or give guarantees with RC authorization (Article 39).
The indicator has four dimensions, which cover the existence of a multiyear framework with
functional allocations, the scope and frequency of debt sustainability analysis, the existence of
sector strategies with comprehensive multiyear costing, and the integration of capital and
recurrent expenditure in project appraisal.
(i) Preparation of multiyear fiscal forecasts and functional allocations
BoFED prepares a MEFF, which is a three-year projection of revenue and expenditure
aggregates, rolled forward each year, based on the main economic and functional categories.
This is done from August 15 to October 30 and submitted to the Cabinet for approval
November 1–15. It is the basis on which the overall expenditure ceiling is established. The
spending ceiling for the second year of the MEFF forms the starting point for establishing the
spending ceiling for that year’s budget, thus representing a continuation of macro-fiscal policy.
Multiyear estimates are thus linked, and budget ceilings are not simply incremental. A medium-
term expenditure framework (MTEF) under which functional and sectoral spending categories
are projected is not yet in place.
(ii) Scope and frequency of debt sustainability analysis
Although Oromia State Government may now legally borrow domestically or give guarantees,
it has contracted very little debt or guarantees. The need for debt sustainability analysis has not
yet arisen. This indicator is currently not applicable.
(ii) Existence of costed sector strategies
Major sectors are said to have costed strategies. However, none has been produced to the
assessment team.
(iii) Linkages between investment budgets and forward expenditure estimates
The MEFF and budget estimates cover both recurrent and capital expenditure, and the Budget
Call letter requires BIs to include the recurrent expenditures that will result from completion
of capital assets. At zone and woreda levels, the same staff prepares both capital and recurrent
budgets. These are checked by BoFED Budget Department.
The linkage of capital investment decisions to sector strategies and the GTP is not clear, but it
appears that decisions do take account of recurrent expenditure consequences.
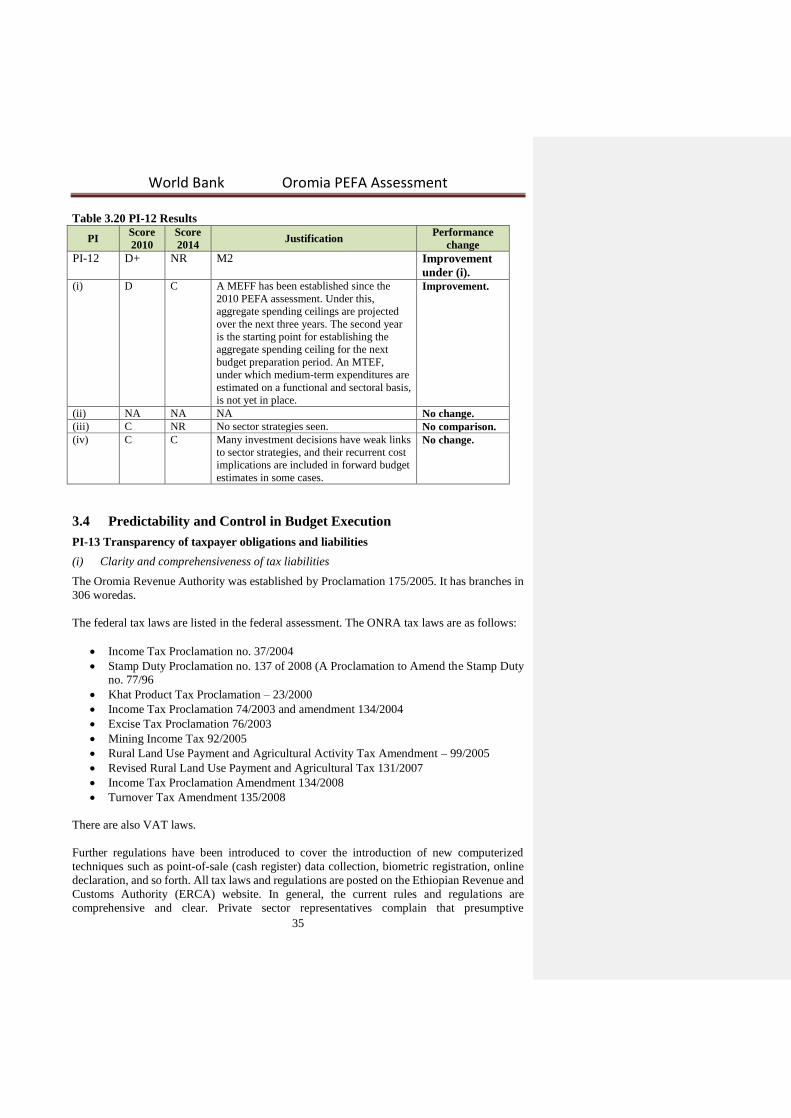
World Bank Oromia PEFA Assessment
35
Table 3.20 PI-12 Results
PI Score
2010 Score
2014 Justification
Performance
change
PI-12 D+ NR M2 Improvement
under (i). (i) D C A MEFF has been established since the
2010 PEFA assessment. Under this,
aggregate spending ceilings are projected
over the next three years. The second year
is the starting point for establishing the
aggregate spending ceiling for the next
budget preparation period. An MTEF,
under which medium-term expenditures are
estimated on a functional and sectoral basis,
is not yet in place.
Improvement.
(ii) NA NA NA No change. (iii) C NR No sector strategies seen. No comparison. (iv) C C Many investment decisions have weak links
to sector strategies, and their recurrent cost
implications are included in forward budget
estimates in some cases.
No change.
3.4 Predictability and Control in Budget Execution
PI-13 Transparency of taxpayer obligations and liabilities
(i) Clarity and comprehensiveness of tax liabilities
The Oromia Revenue Authority was established by Proclamation 175/2005. It has branches in
306 woredas.
The federal tax laws are listed in the federal assessment. The ONRA tax laws are as follows:
Income Tax Proclamation no. 37/2004
Stamp Duty Proclamation no. 137 of 2008 (A Proclamation to Amend the Stamp Duty
no. 77/96
Khat Product Tax Proclamation – 23/2000
Income Tax Proclamation 74/2003 and amendment 134/2004
Excise Tax Proclamation 76/2003
Mining Income Tax 92/2005
Rural Land Use Payment and Agricultural Activity Tax Amendment – 99/2005
Revised Rural Land Use Payment and Agricultural Tax 131/2007
Income Tax Proclamation Amendment 134/2008
Turnover Tax Amendment 135/2008
There are also VAT laws.
Further regulations have been introduced to cover the introduction of new computerized
techniques such as point-of-sale (cash register) data collection, biometric registration, online
declaration, and so forth. All tax laws and regulations are posted on the Ethiopian Revenue and
Customs Authority (ERCA) website. In general, the current rules and regulations are
comprehensive and clear. Private sector representatives complain that presumptive
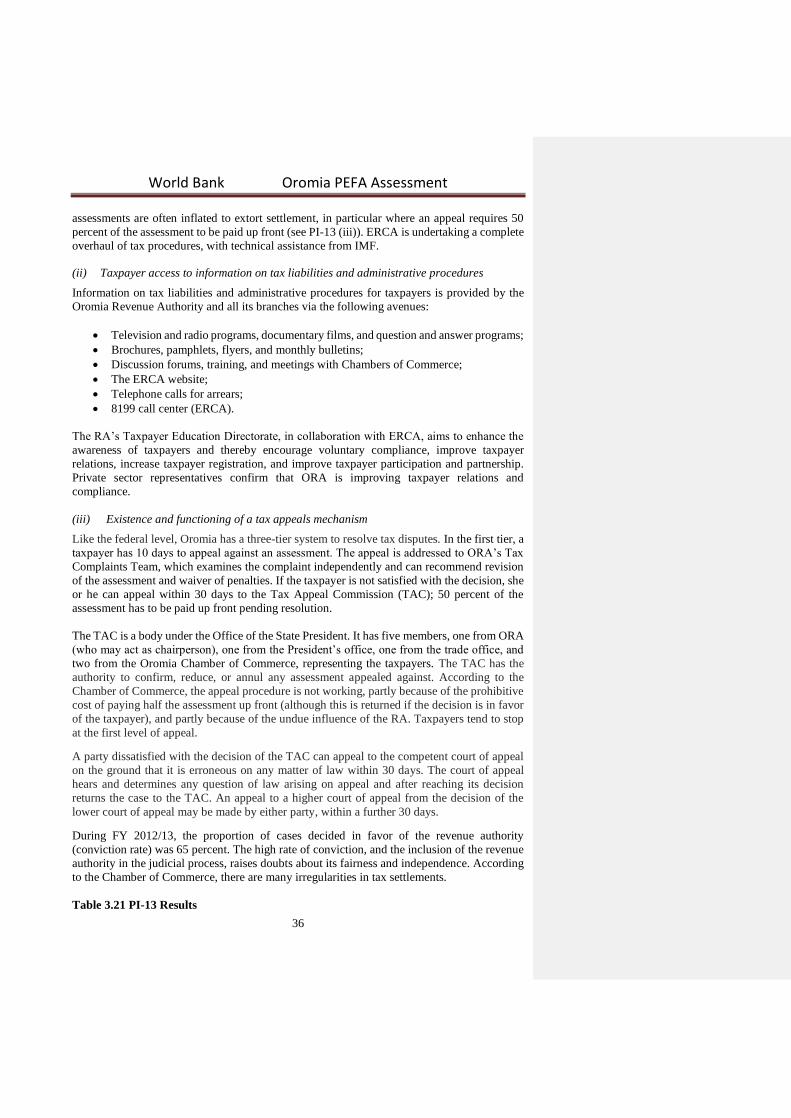
World Bank Oromia PEFA Assessment
36
assessments are often inflated to extort settlement, in particular where an appeal requires 50
percent of the assessment to be paid up front (see PI-13 (iii)). ERCA is undertaking a complete
overhaul of tax procedures, with technical assistance from IMF.
(ii) Taxpayer access to information on tax liabilities and administrative procedures
Information on tax liabilities and administrative procedures for taxpayers is provided by the
Oromia Revenue Authority and all its branches via the following avenues:
Television and radio programs, documentary films, and question and answer programs;
Brochures, pamphlets, flyers, and monthly bulletins;
Discussion forums, training, and meetings with Chambers of Commerce;
The ERCA website;
Telephone calls for arrears;
8199 call center (ERCA).
The RA’s Taxpayer Education Directorate, in collaboration with ERCA, aims to enhance the
awareness of taxpayers and thereby encourage voluntary compliance, improve taxpayer
relations, increase taxpayer registration, and improve taxpayer participation and partnership.
Private sector representatives confirm that ORA is improving taxpayer relations and
compliance.
(iii) Existence and functioning of a tax appeals mechanism
Like the federal level, Oromia has a three-tier system to resolve tax disputes. In the first tier, a
taxpayer has 10 days to appeal against an assessment. The appeal is addressed to ORA’s Tax
Complaints Team, which examines the complaint independently and can recommend revision
of the assessment and waiver of penalties. If the taxpayer is not satisfied with the decision, she
or he can appeal within 30 days to the Tax Appeal Commission (TAC); 50 percent of the
assessment has to be paid up front pending resolution.
The TAC is a body under the Office of the State President. It has five members, one from ORA
(who may act as chairperson), one from the President’s office, one from the trade office, and
two from the Oromia Chamber of Commerce, representing the taxpayers. The TAC has the
authority to confirm, reduce, or annul any assessment appealed against. According to the
Chamber of Commerce, the appeal procedure is not working, partly because of the prohibitive
cost of paying half the assessment up front (although this is returned if the decision is in favor
of the taxpayer), and partly because of the undue influence of the RA. Taxpayers tend to stop
at the first level of appeal.
A party dissatisfied with the decision of the TAC can appeal to the competent court of appeal
on the ground that it is erroneous on any matter of law within 30 days. The court of appeal
hears and determines any question of law arising on appeal and after reaching its decision
returns the case to the TAC. An appeal to a higher court of appeal from the decision of the
lower court of appeal may be made by either party, within a further 30 days.
During FY 2012/13, the proportion of cases decided in favor of the revenue authority
(conviction rate) was 65 percent. The high rate of conviction, and the inclusion of the revenue
authority in the judicial process, raises doubts about its fairness and independence. According
to the Chamber of Commerce, there are many irregularities in tax settlements.
Table 3.21 PI-13 Results
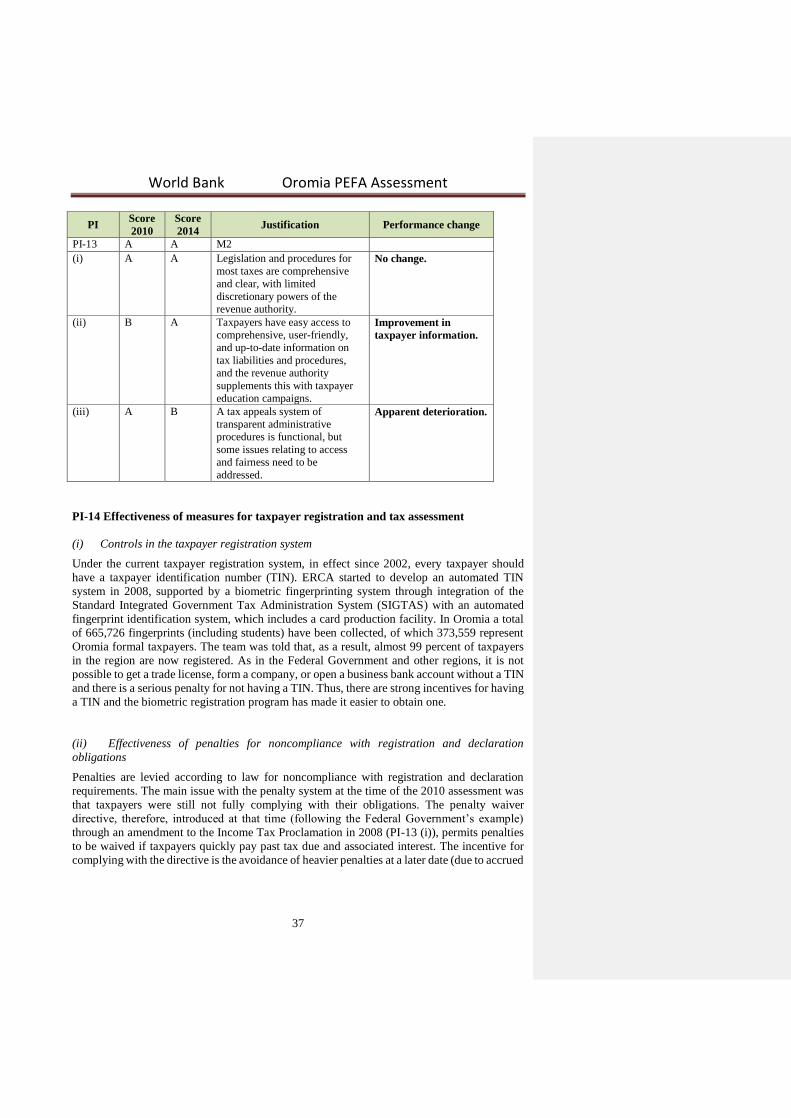
World Bank Oromia PEFA Assessment
37
PI Score
2010 Score
2014 Justification Performance change
PI-13 A A M2 (i) A A Legislation and procedures for
most taxes are comprehensive
and clear, with limited
discretionary powers of the
revenue authority.
No change.
(ii) B A Taxpayers have easy access to
comprehensive, user-friendly,
and up-to-date information on
tax liabilities and procedures,
and the revenue authority
supplements this with taxpayer
education campaigns.
Improvement in
taxpayer information.
(iii) A B A tax appeals system of
transparent administrative
procedures is functional, but
some issues relating to access
and fairness need to be
addressed.
Apparent deterioration.
PI-14 Effectiveness of measures for taxpayer registration and tax assessment
(i) Controls in the taxpayer registration system
Under the current taxpayer registration system, in effect since 2002, every taxpayer should
have a taxpayer identification number (TIN). ERCA started to develop an automated TIN
system in 2008, supported by a biometric fingerprinting system through integration of the
Standard Integrated Government Tax Administration System (SIGTAS) with an automated
fingerprint identification system, which includes a card production facility. In Oromia a total
of 665,726 fingerprints (including students) have been collected, of which 373,559 represent
Oromia formal taxpayers. The team was told that, as a result, almost 99 percent of taxpayers
in the region are now registered. As in the Federal Government and other regions, it is not
possible to get a trade license, form a company, or open a business bank account without a TIN
and there is a serious penalty for not having a TIN. Thus, there are strong incentives for having
a TIN and the biometric registration program has made it easier to obtain one.
(ii) Effectiveness of penalties for noncompliance with registration and declaration
obligations
Penalties are levied according to law for noncompliance with registration and declaration
requirements. The main issue with the penalty system at the time of the 2010 assessment was
that taxpayers were still not fully complying with their obligations. The penalty waiver
directive, therefore, introduced at that time (following the Federal Government’s example)
through an amendment to the Income Tax Proclamation in 2008 (PI-13 (i)), permits penalties
to be waived if taxpayers quickly pay past tax due and associated interest. The incentive for
complying with the directive is the avoidance of heavier penalties at a later date (due to accrued
World Bank Oromia PEFA Assessment
38
interest); the quicker people pay, the greater the proportion of waiver.11 The Government’s
revenue ends up being higher than in the absence of such a penalty waiver scheme. As a result
of the directive, 80–90 percent of penalties are waived on payment of tax liabilities. No data
have been seen by the team, however. As the arrears collection ratio is high (see PI-15 (i)), it
appears that the penalties provide a sufficient incentive for payment of arrears, although not
payment on time, and that revenue would be lower without them. SIGTAS has, since the 2010
assessment, made it easier to detect noncompliance and therefore to impose penalties for
noncompliance.
(iii) Planning and monitoring of tax audit and fraud investigation programs
To combat widespread tax evasion, efforts to counter it continue, principally by improved tax
audit and enhanced taxpayer compliance. An annual plan is prepared by regional, zonal, and
city administration levels and consolidated centrally by the audit and investigation department.
There are 12 auditors at the regional office and 4 to 8 auditors, depending on size at zone and
city administrations. Woredas are covered by zonal auditors. Tax audit procedures for Oromia
have been aligned with SIGTAS using 13 risk-based criteria. The tax audit program is
monitored to relate the number of days spent on tax audits to the additional revenue assessments
made. In FY 2012/13 eight tax auditors generated ETB 14.1 million additional revenue.
Table 3.22 PI-14 Results
PI Score
2010 Score
2014 Justification Performance change
PI-14 B B+ ↑ M2 (i) B A Taxpayers are registered in a
complete database with
comprehensive direct linkages to
other government registration
systems and financial sector
regulations.
Improvement. This is
due to introduction of a
biometric fingerprinting
system that has resulted
in nearly all potential
taxpayers being
registered through issue
of TINs. (ii) B B↑ Penalties for noncompliance
exist but are not always effective
in terms of getting people to pay
their taxes on time.
No change. However,
the penalty waiver
directive is providing an
incentive to pay off tax
debts quickly. (iii) C B Tax audits and fraud
investigations are managed and
reported on according to a
documented audit plan with clear
risk assessment criteria.
Improvement. This is
through introduction of
risk-based criteria and
monitoring of recoveries
per auditor.
PI-15 Effectiveness in the collection of tax payments
Fur 11 Under the directive a payments plan is agreed between ORA and the taxpayer, usually with a time limit (1–
6 months). Payments of arrears are made on a monthly basis, and the sooner the payment is made the higher the
rate of the penalties’ waiver (from 20 percent% up to 100 percent). If tax liabilities are paid within one month the
probability of a penalty waiver is 100 percent%, if within 2 months up to 80 % per cent waiver, depending on the
reasons forwarded by the taxpayer for not complying. SIGTAS is programmed to administer these waivers.

World Bank Oromia PEFA Assessment
39
(i) Collection ratio for gross tax arrears
Arrears can now be manually identified and aggregated from the SIGTAS database,. These are
not significant. According to the revenue authority, arrears at the beginning of FY 2011/12
(EFY 2004) were ETB 22.1 million, which was 1.1 percent of FY 2010/11 total tax collections,
and were ETB 36.3 million at the beginning of FY 2012/13, which was 1.15 percent of total
tax collections for FY 2011/12. The collection ratio is low, only 18.8 percent over the past two
years, but the low level of arrears justifies an A rating. The data for the last two years is shown
in Table 3.23.
Table 3.23 Collection of Tax Arrears (ETB millions)
Arrears at
beginning of
year
Collections
of arrears
during year
Debt
collection
ratio %
Total tax
collections
Arrears/total
collections %
FY 2010/11 2004.6 1.1
FY 2011/12 22.1 4.6 20.6 3,154.8 1.2 FY 2012/13 36.3 6.1 16.9 4,281.3 NAa Average of past two years 18.8 1.1
a. Arrears at beginning of FY 2013/14 not available to team as FY accounts not yet finished.
(ii) Effectiveness of transfer of tax collections to the Treasury by the revenue administration
Taxes and duties have to be paid by certified check at any of the woreda branches, or a branch
of the Commercial Bank of Ethiopia (CBE). Checks paid into CBE branches are transferred
daily and credited to a BoFED account within a few days. Cash collections at woreda branches
are not deposited in banks until they reach prescribed threshold amounts, which may be up to
a month later. A percentage of revenue collected by woredas is retained for possible refunds.
Most of the tax revenue collected is retained by the WoFEDs for their own expenditure and
offset against the monthly subsidy from BoFED.
(iii) Frequency of complete accounts reconciliation between tax assessments, collections,
arrears records, and receipts by the treasury
The bank gives the taxpayer a slip, which she or he takes to the woreda office for a receipt. At
the woreda level, receipts are reconciled daily with collections as shown on the bank
statements. There is a monthly reconciliation of revenue collected by the branches with the
amounts credited to the Treasury Account within 15 days of the end of the month. However,
no reconciliation of opening arrears, assessments, penalties, collections, waivers, and closing
arrears has been seen by the assessment team. Although individual taxpayer accounts are
reconciled, SIGTAS does not aggregate this information for all taxpayers. Aggregate arrears
are calculated manually, but no overall reconciliation appears to be made.
Table 3.24 PI-15 Results
PI Score
2010 Score
2014 Justification Performance change
PI-15 C+ D+ M1 No change. Dimension (iii)
appears to have been over-scored
in 2010 assessment. (i) A A The total amount of tax arrears is
insignificant (less than 2% of
total annual collections).
No change in rating. However,
arrears as a percentage of tax
collections fell to 1.1% from 1.4%
(average of two years).
World Bank Oromia PEFA Assessment
40
(ii) C C Revenue collections are
transferred to BoFED at least
monthly.
No change. However, there is
some improvement in collection
procedures. (iii) B D No complete reconciliation seen.
There is monthly reconciliation
of revenues collected by ORG
branches with amounts credited
to BoFED bank account, but
complete reconciliation of
assessments, arrears, and
collections not conducted.
No change. The 2010 assessment
did not show evidence of
reconciliation of arrears with
assessments and collections.
Appears to have been over-scored.
PI-16 Predictability in the availability of funds for commitment of expenditures
Effective execution of the budget in accordance with the work plans requires that the budgetary
institutions receive reliable information on availability of funds within which they can commit
expenditures for recurrent and capital inputs. This indicator assesses the extent to which
BoFED provides reliable information on the availability of funds to BIs that manage budget
heads in the Oromia government budget.
(i) Extent to which cash flows are forecast and monitored
On approval of the annual budget, each BI and woreda prepares a forecast of its monthly
recurrent and capital cash requirements. For the first month, BoFED releases one-twelfth of
the recurrent budget. For subsequent months, the BI or woreda should submit a request by the
10th of each month to meet its needs for the following three months, together with copies of
the payroll, procurement plan status, and commitments, to justify its request. Separate requests
are made for recurrent and capital expenditure and separate ceilings are issued. Releases may
be cut if a BI has unspent funds in its zero balance bank account, for example, because of
contractor delays. Releases may be increased if needed, for example, for seasonal expenditures,
but within the budget. BoFED processes requests and notifies each BI of its zero-balance
ceiling by the fifth of the month. Releases to woredas are made by transfer to their bank
accounts, subject to deductions for revenue they have collected and retained. Releases for non-
salary expenditures are made immediately, while releases for salaries are made at the end of
the third week.
About 50 percent of ORG’s budgeted domestically funded expenditure consists of subsidies to
woredas and urban administrations. These transfers are virtually guaranteed and the monthly
disbursement pattern is planned in advance (simply the total divided by 12). Out of the other
50 percent, about 25 percent is for personnel expenses, which are also highly predictable on a
monthly basis. Thus, cash flow forecasting is of importance to about 37 percent of total ORG
expenditure.
(iii) Reliability and horizon of periodic in-year information to BIs on ceilings for expenditure
commitment
As noted, BIs get monthly releases (overdraft ceilings for their zero bank balance accounts)
but can rely on the indicative amounts for the subsequent two months. In practice, BIs and
woredas can plan and commit expenditures with a time horizon up to the end of the year with
a high degree of confidence that resources will be available to meet payments eventually arising
from such commitments. Transfers from GoE comprise the bulk of ORG’s financial resources
and the receipt of these is very predictable. Since FY 2001/02, there has not been any cash flow
World Bank Oromia PEFA Assessment
41
problem. If cash is insufficient, a BI can apply for an increase in its monthly ceiling, within its
budget.
(iii) Frequency and transparency of adjustments to budget allocations, which are decided
above the level of BIs
In-year adjustments by the Council in FY 2012/13 (EFY 2005) were made only once through
a supplementary appropriation. However, BoFED has discretion on reallocations among sector
bureaus, zones, and woredas within the approved total expenditure. The only restriction is that
transfers cannot be made from a capital budget to a recurrent budget. Reallocations are frequent
but made after consultation with the affected BIs and with cabinet approval. The actual number
of adjustments is not available, but the low score on PI-2 indicates that the amounts are
substantial.
Table 3.25 PI-16 Results
PI Score
2010 Score
2014 Justification Performance change
PI-16 C+ C+ M1 Improvement under (i) (i) B A A cash forecast is prepared for
the year and updated monthly
based on actual cash inflows and
outflows.
Improvement to
monthly from quarterly
updates.
(ii) A A BIs are provided reliable
information on resource
availability at least quarterly in
advance and can with confidence
plan and commit expenditures
with a time horizon for payments
up to the end of the year.
No change.
(iii) C C Significant in-year budget
adjustments are frequent, but
undertaken with some
transparency.
No change.
PI-17 Recording and management of cash balances, debt and guarantees
The Oromia government may borrow from domestic sources with authorization by the RC
(Financial Proclamation 156/2010, Article 39), and identify external sources of loans and ask
the Federal Government so the latter secures the loan agreement for the benefit of the region.
At the time of this assessment, it had no formal borrowing (at any level), but the consolidated
trial balance showed sundry creditors and other operating payables (ETB 975million at July
2013, equivalent to 18 percent of total expenditure for the year).
(i) Quality of debt data recording and reporting
There is no formal debt, and debt recording and reporting is not an issue. This dimension is not
applicable.
(ii) Extent of consolidation of the government’s cash balances
The Oromia State Government has 292 bank accounts, as follows:
156 ‘A’ accounts funded by donors (ETB accounts);
World Bank Oromia PEFA Assessment
42
52 ‘B’ accounts for receipt of revenue, held by revenue receiving BIs and woredas;
44 ‘D’ accounts for deposits;
44 ‘Z’ accounts (zero-balance accounts for BI expenditure). All BIs have Z accounts,
including four outside Addis Ababa. The zonal offices and woredas are not connected.
The numbers do not include all woreda bank accounts.
The zero-balance accounts are cleared daily against the main Central Treasury Account. The
balances on the donor-funded accounts are known but not consolidated with other balances.
The revenue accounts are cleared in two weeks to a month (see PI-15 ii). Deposit account
balances are not government revenue and are not included in the single Treasury Account
arrangement. About 70 percent of all deposits in ORG-controlled bank accounts are part of
Treasury Single Accounts (TSAs).
(iii) Systems for contracting loans and issue of guarantees
As noted, the Oromia State Government can now borrow, but this has not yet been done, and
there is no debt strategy or limits in place. However, no borrowing can be done or issue of
guarantees made except through BoFED and with RC authorization.
Table 3.26 PI-17 Results
PI Score
2010 Score
2014 Justification Performance change
PI-17 B C M2 (i) NA NA There is no formal debt. No change. (ii) B C Most government cash balances are
calculated and consolidated at least
monthly.
No change. The 2010
rating appears to have
been too high. (iii) NA C The contracting of loans and
guarantees are subject to approval
by BoFED but are not subject to
clear guidelines.
Change in the legal
framework.
PI-18 Effectiveness of payroll controls
As the payroll is a major component of expenditure, its effective control is an important part
of financial management. This indicator is concerned with the payroll of public servants only:
wages for casual labor and discretionary allowances are included in the assessment of general
internal controls (PI-20).
As in the Federal Government, Oromia payroll is decentralized. Personnel records are
maintained by the human resource department of each BI. The Bank of Ethiopia (BoE) uses
software called Payroll Management Information System (PMIS).12 The software is currently
used in about 70 woredas in the region. Other BIs including BoFED are not computerized:
Excel spreadsheets are generally used for the preparation of payroll. Salaries are transferred to
the saving accounts of staff directly from the accounts of BIs by the 24th of each month.
(i) Degree of integration and reconciliation between personnel records and payroll data
Fur 12 Implementation of the software in the Bureau of Education was funded by USAID.
World Bank Oromia PEFA Assessment
43
Wages and salaries are paid by the Financial, Procurement and Property Management
Department (FPPMD) based on the list of personnel originally prepared by the Human
Resources Department (HRD) and contained in its payroll system. Each month, the head of the
HRD sends a list to the head of FPPMD of any changes to its personnel records that need to be
reflected in the payroll, including attendance related changes.
The personnel database and the payroll system are not integrated or linked electronically.
However, for every record change, FPPMD is notified by letter. Every month, payroll sheets
are reconciled against the previous month’s payroll and changes are supported by
documentation.
(ii) Timeliness of changes to the personnel records and payroll
Changes to personnel records (hiring, firing, retiring, promotions, demotions, and position
shift) are the responsibility of HRD, following notification by the head of the employee’s
department. The list of staff sent to FPPMD each month reflects any changes made up to the
20th; changes made after the cutoff date are reflected in the following month’s payroll.
(iii) Internal controls of changes to personnel records and the payroll
There are three main controls. Firstly, employees sign an attendance sheet twice a day (morning
and afternoon). It is the responsibility of the head of the department to report absenteeism to
HRD together with attendance sheets. HRD issues the list of employees to be paid for the
month and deductions for absenteeism. HRD issues a letter to FPPMD to suspend salary
payment of an employee absent from work over five days. If the employee does not report
within five days, HRD issues a letter of dismissal. Secondly, the payroll is reconciled against
the previous month’s payroll routinely before approval and transfer of cash to the accounts of
the respective employees. Thirdly, only the payroll accountants have access to the Excel
spreadsheet. Hard copy evidence of primary hiring, firing, retiring, promotions, demotions, and
position shifts are kept in HRD, FPPMD, and Central Archive. Monthly attendance and
payment authorization documents are signed by relevant employees for preparation,
verification, and approval and filed chronologically at FPPMD.
(iv) Existence of payroll audits to identify control weaknesses and/or ghost workers
Payroll audits are conducted as one component of the internal audit system (PI-21) and external
audit system (PI-26). Internal auditors review the payroll as part of the financial audit. No
comprehensive payroll audit is conducted. However, the internal auditors check the payroll
payments against attendance sheets, check against the previous month’s payments, check the
calculations, and check whether new additions are in line with the HR records. In addition,
internal auditors check HRD databases for completeness as a separate HRD audit. External
auditors audit the payroll similarly. Ghost workers are not generally a problem in the region:
just two cases were reported some years ago at woreda level and they were rectified
immediately. Payroll audits are conducted as one component of the internal audit system (PI-
21) and external audit system (PI-26). They cover all government entities.
Table 3.27 PI-18 Results
PI Score
2010 Score
2014 Justification Performance
change PI-18 B+ B+ M1 (i) B B Payroll and personnel database are not
linked directly electronically, but payroll No change.
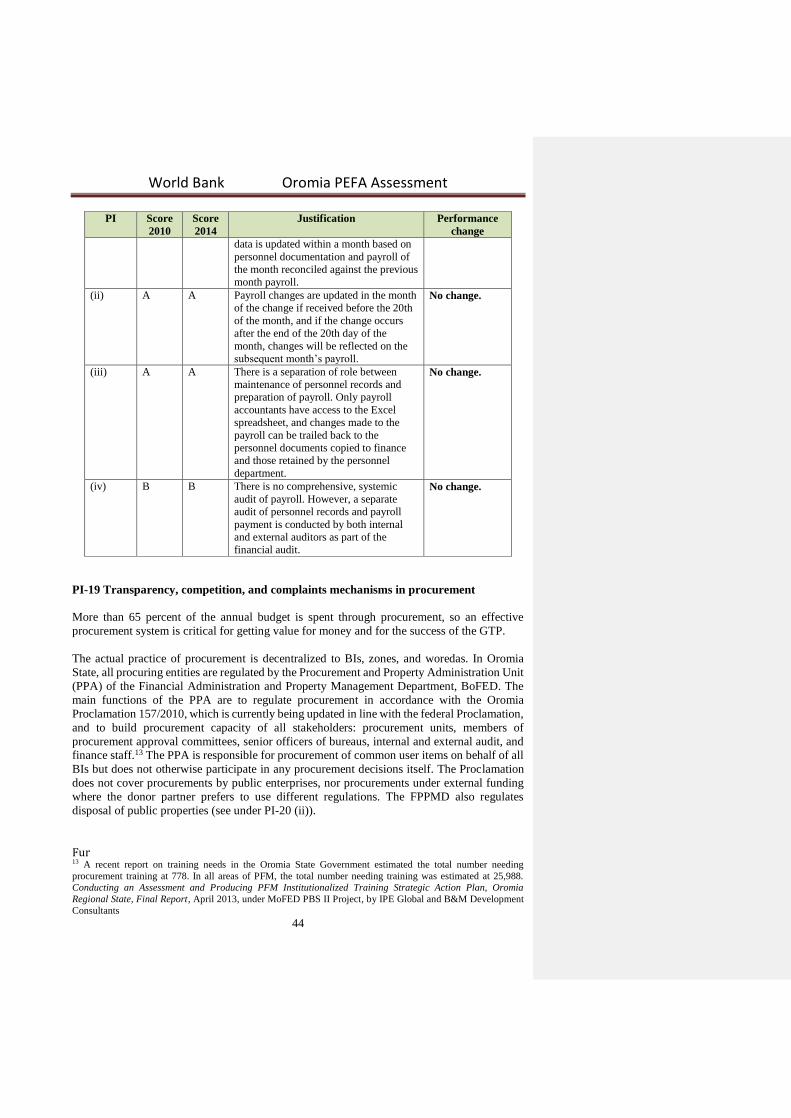
World Bank Oromia PEFA Assessment
44
PI Score
2010 Score
2014 Justification Performance
change data is updated within a month based on
personnel documentation and payroll of
the month reconciled against the previous
month payroll. (ii) A A Payroll changes are updated in the month
of the change if received before the 20th
of the month, and if the change occurs
after the end of the 20th day of the
month, changes will be reflected on the
subsequent month’s payroll.
No change.
(iii) A A There is a separation of role between
maintenance of personnel records and
preparation of payroll. Only payroll
accountants have access to the Excel
spreadsheet, and changes made to the
payroll can be trailed back to the
personnel documents copied to finance
and those retained by the personnel
department.
No change.
(iv) B B There is no comprehensive, systemic
audit of payroll. However, a separate
audit of personnel records and payroll
payment is conducted by both internal
and external auditors as part of the
financial audit.
No change.
PI-19 Transparency, competition, and complaints mechanisms in procurement
More than 65 percent of the annual budget is spent through procurement, so an effective
procurement system is critical for getting value for money and for the success of the GTP.
The actual practice of procurement is decentralized to BIs, zones, and woredas. In Oromia
State, all procuring entities are regulated by the Procurement and Property Administration Unit
(PPA) of the Financial Administration and Property Management Department, BoFED. The
main functions of the PPA are to regulate procurement in accordance with the Oromia
Proclamation 157/2010, which is currently being updated in line with the federal Proclamation,
and to build procurement capacity of all stakeholders: procurement units, members of
procurement approval committees, senior officers of bureaus, internal and external audit, and
finance staff.13 The PPA is responsible for procurement of common user items on behalf of all
BIs but does not otherwise participate in any procurement decisions itself. The Proclamation
does not cover procurements by public enterprises, nor procurements under external funding
where the donor partner prefers to use different regulations. The FPPMD also regulates
disposal of public properties (see under PI-20 (ii)).
Fur 13 A recent report on training needs in the Oromia State Government estimated the total number needing
procurement training at 778. In all areas of PFM, the total number needing training was estimated at 25,988.
Conducting an Assessment and Producing PFM Institutionalized Training Strategic Action Plan, Oromia
Regional State, Final Report, April 2013, under MoFED PBS II Project, by IPE Global and B&M Development
Consultants
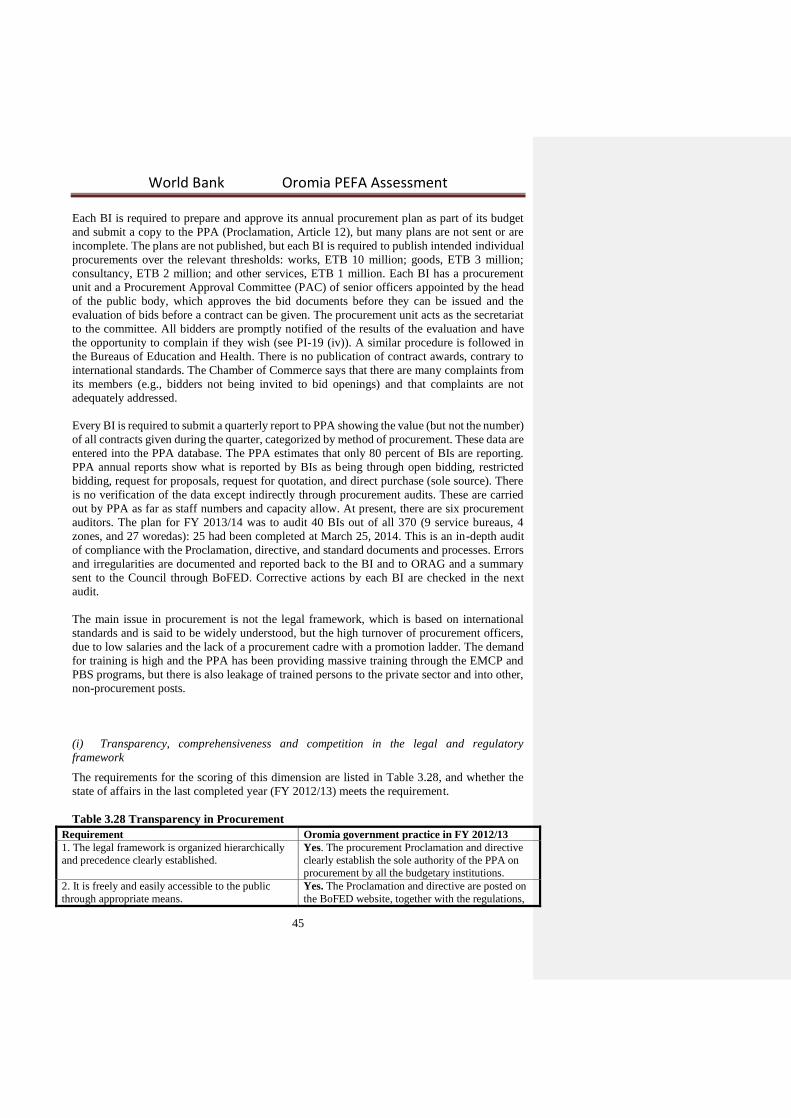
World Bank Oromia PEFA Assessment
45
Each BI is required to prepare and approve its annual procurement plan as part of its budget
and submit a copy to the PPA (Proclamation, Article 12), but many plans are not sent or are
incomplete. The plans are not published, but each BI is required to publish intended individual
procurements over the relevant thresholds: works, ETB 10 million; goods, ETB 3 million;
consultancy, ETB 2 million; and other services, ETB 1 million. Each BI has a procurement
unit and a Procurement Approval Committee (PAC) of senior officers appointed by the head
of the public body, which approves the bid documents before they can be issued and the
evaluation of bids before a contract can be given. The procurement unit acts as the secretariat
to the committee. All bidders are promptly notified of the results of the evaluation and have
the opportunity to complain if they wish (see PI-19 (iv)). A similar procedure is followed in
the Bureaus of Education and Health. There is no publication of contract awards, contrary to
international standards. The Chamber of Commerce says that there are many complaints from
its members (e.g., bidders not being invited to bid openings) and that complaints are not
adequately addressed.
Every BI is required to submit a quarterly report to PPA showing the value (but not the number)
of all contracts given during the quarter, categorized by method of procurement. These data are
entered into the PPA database. The PPA estimates that only 80 percent of BIs are reporting.
PPA annual reports show what is reported by BIs as being through open bidding, restricted
bidding, request for proposals, request for quotation, and direct purchase (sole source). There
is no verification of the data except indirectly through procurement audits. These are carried
out by PPA as far as staff numbers and capacity allow. At present, there are six procurement
auditors. The plan for FY 2013/14 was to audit 40 BIs out of all 370 (9 service bureaus, 4
zones, and 27 woredas): 25 had been completed at March 25, 2014. This is an in-depth audit
of compliance with the Proclamation, directive, and standard documents and processes. Errors
and irregularities are documented and reported back to the BI and to ORAG and a summary
sent to the Council through BoFED. Corrective actions by each BI are checked in the next
audit.
The main issue in procurement is not the legal framework, which is based on international
standards and is said to be widely understood, but the high turnover of procurement officers,
due to low salaries and the lack of a procurement cadre with a promotion ladder. The demand
for training is high and the PPA has been providing massive training through the EMCP and
PBS programs, but there is also leakage of trained persons to the private sector and into other,
non-procurement posts.
(i) Transparency, comprehensiveness and competition in the legal and regulatory
framework
The requirements for the scoring of this dimension are listed in Table 3.28, and whether the
state of affairs in the last completed year (FY 2012/13) meets the requirement.
Table 3.28 Transparency in Procurement
Requirement Oromia government practice in FY 2012/13 1. The legal framework is organized hierarchically
and precedence clearly established. Yes. The procurement Proclamation and directive
clearly establish the sole authority of the PPA on
procurement by all the budgetary institutions. 2. It is freely and easily accessible to the public
through appropriate means. Yes. The Proclamation and directive are posted on
the BoFED website, together with the regulations,
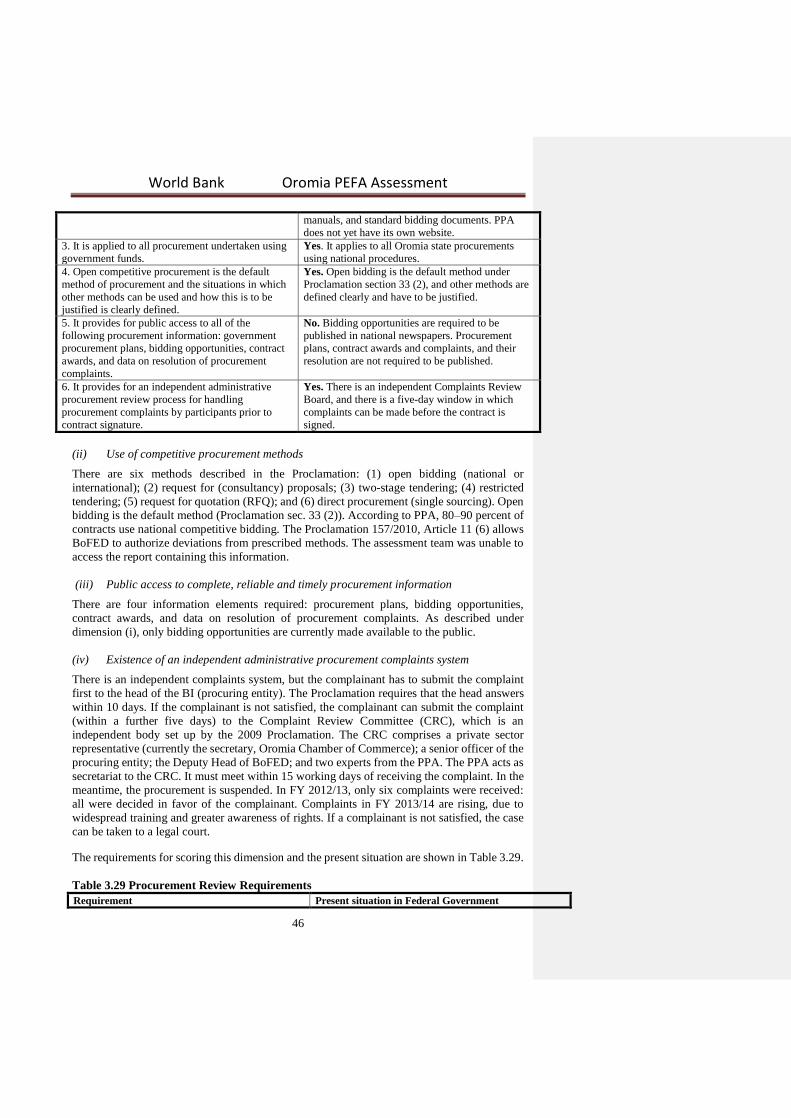
World Bank Oromia PEFA Assessment
46
manuals, and standard bidding documents. PPA
does not yet have its own website. 3. It is applied to all procurement undertaken using
government funds. Yes. It applies to all Oromia state procurements
using national procedures. 4. Open competitive procurement is the default
method of procurement and the situations in which
other methods can be used and how this is to be
justified is clearly defined.
Yes. Open bidding is the default method under
Proclamation section 33 (2), and other methods are
defined clearly and have to be justified.
5. It provides for public access to all of the
following procurement information: government
procurement plans, bidding opportunities, contract
awards, and data on resolution of procurement
complaints.
No. Bidding opportunities are required to be
published in national newspapers. Procurement
plans, contract awards and complaints, and their
resolution are not required to be published.
6. It provides for an independent administrative
procurement review process for handling
procurement complaints by participants prior to
contract signature.
Yes. There is an independent Complaints Review
Board, and there is a five-day window in which
complaints can be made before the contract is
signed.
(ii) Use of competitive procurement methods
There are six methods described in the Proclamation: (1) open bidding (national or
international); (2) request for (consultancy) proposals; (3) two-stage tendering; (4) restricted
tendering; (5) request for quotation (RFQ); and (6) direct procurement (single sourcing). Open
bidding is the default method (Proclamation sec. 33 (2)). According to PPA, 80–90 percent of
contracts use national competitive bidding. The Proclamation 157/2010, Article 11 (6) allows
BoFED to authorize deviations from prescribed methods. The assessment team was unable to
access the report containing this information.
(iii) Public access to complete, reliable and timely procurement information
There are four information elements required: procurement plans, bidding opportunities,
contract awards, and data on resolution of procurement complaints. As described under
dimension (i), only bidding opportunities are currently made available to the public.
(iv) Existence of an independent administrative procurement complaints system
There is an independent complaints system, but the complainant has to submit the complaint
first to the head of the BI (procuring entity). The Proclamation requires that the head answers
within 10 days. If the complainant is not satisfied, the complainant can submit the complaint
(within a further five days) to the Complaint Review Committee (CRC), which is an
independent body set up by the 2009 Proclamation. The CRC comprises a private sector
representative (currently the secretary, Oromia Chamber of Commerce); a senior officer of the
procuring entity; the Deputy Head of BoFED; and two experts from the PPA. The PPA acts as
secretariat to the CRC. It must meet within 15 working days of receiving the complaint. In the
meantime, the procurement is suspended. In FY 2012/13, only six complaints were received:
all were decided in favor of the complainant. Complaints in FY 2013/14 are rising, due to
widespread training and greater awareness of rights. If a complainant is not satisfied, the case
can be taken to a legal court.
The requirements for scoring this dimension and the present situation are shown in Table 3.29.
Table 3.29 Procurement Review Requirements
Requirement Present situation in Federal Government
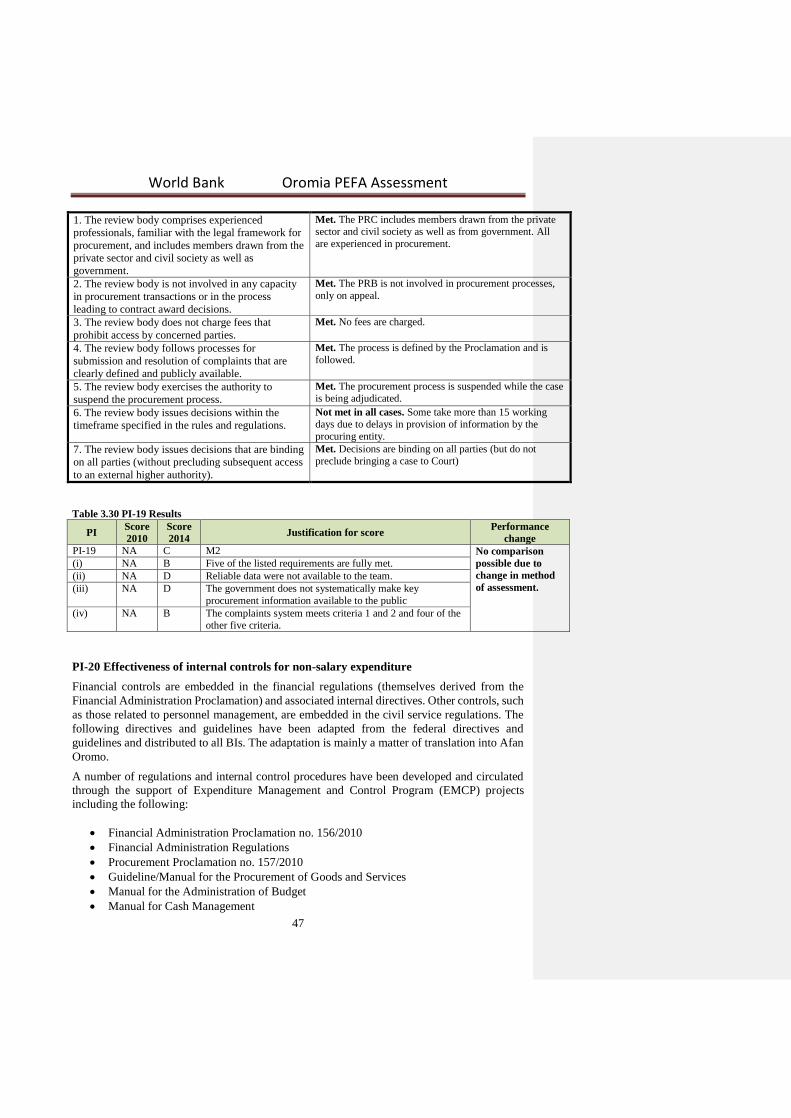
World Bank Oromia PEFA Assessment
47
1. The review body comprises experienced
professionals, familiar with the legal framework for
procurement, and includes members drawn from the
private sector and civil society as well as
government.
Met. The PRC includes members drawn from the private
sector and civil society as well as from government. All
are experienced in procurement.
2. The review body is not involved in any capacity
in procurement transactions or in the process
leading to contract award decisions.
Met. The PRB is not involved in procurement processes,
only on appeal.
3. The review body does not charge fees that
prohibit access by concerned parties. Met. No fees are charged.
4. The review body follows processes for
submission and resolution of complaints that are
clearly defined and publicly available.
Met. The process is defined by the Proclamation and is
followed.
5. The review body exercises the authority to
suspend the procurement process. Met. The procurement process is suspended while the case
is being adjudicated.
6. The review body issues decisions within the
timeframe specified in the rules and regulations. Not met in all cases. Some take more than 15 working
days due to delays in provision of information by the
procuring entity.
7. The review body issues decisions that are binding
on all parties (without precluding subsequent access
to an external higher authority).
Met. Decisions are binding on all parties (but do not
preclude bringing a case to Court)
Table 3.30 PI-19 Results
PI Score
2010
Score
2014 Justification for score
Performance
change
PI-19 NA C M2 No comparison
possible due to
change in method
of assessment.
(i) NA B Five of the listed requirements are fully met.
(ii) NA D Reliable data were not available to the team.
(iii) NA D The government does not systematically make key
procurement information available to the public
(iv) NA B The complaints system meets criteria 1 and 2 and four of the
other five criteria.
PI-20 Effectiveness of internal controls for non-salary expenditure
Financial controls are embedded in the financial regulations (themselves derived from the
Financial Administration Proclamation) and associated internal directives. Other controls, such
as those related to personnel management, are embedded in the civil service regulations. The
following directives and guidelines have been adapted from the federal directives and
guidelines and distributed to all BIs. The adaptation is mainly a matter of translation into Afan
Oromo.
A number of regulations and internal control procedures have been developed and circulated
through the support of Expenditure Management and Control Program (EMCP) projects
including the following:
Financial Administration Proclamation no. 156/2010
Financial Administration Regulations
Procurement Proclamation no. 157/2010
Guideline/Manual for the Procurement of Goods and Services
Manual for the Administration of Budget
Manual for Cash Management
World Bank Oromia PEFA Assessment
48
Cash Disbursement Manual
Accounting Procedure
Financial Accountability
Internal Audit Manual
Internal Control Standards
Property Administration
Handover Procedure
Procedure On Guarantor
In addition, the internal audit manual of the regional government contains the basic principles
of internal control systems. Line managers, with assistance from internal auditors and ORAG,
are responsible for ensuring that internal controls are respected.
(i) Effectiveness of expenditure commitment controls
The IBEX system has a budget control module that is not fully used in Oromia. Commitments
are controlled using separate records. According to the ORG Financial Administration
Regulations, a BI cannot enter into an expenditure commitment without an approved budget
and, within the budget, cannot enter into a commitment if the remaining uncommitted
(“unencumbered”) balance is insufficient, without the approval of the head of the BI. It seems
that the law is generally respected.14
The PEFA Framework requires not only that commitments are controlled within the budget
but also that they are controlled within projected cash availability. The IBEX system does not
control commitments against projections of cash availability as derived by BoFED from the
cash flow forecasts prepared by BIs (PI-16). It only monitors them, enabling the calculation of
remaining uncommitted budget balance after a new commitment has been entered into the
system. Financial administration departments in BIs can, however, through their manual
control processes, block proposed commitments that would result in monthly cash expenditure
limits (PI-17) established for the next quarter being exceeded (PI-16, PI-17). They can also
block proposed commitments that would generate payables in following quarters not consistent
with cash plans earlier agreed with BoFED (or they could suggest re-phasing and adjustment
of expenditure plans). Thus, cash availability is taken into consideration, as well as
unencumbered budget availability, in terms of controlling commitments.
According to the Oromia Chamber of Commerce, bills are typically paid two months after
submission and in some cases, e.g., on government housing, are not paid even after two or three
years (see PI-4). According to the discussion with the Oromia Road Authority, there are times
when contractors perform work in excess of the available cash for the period, partly because
they are implementing projects faster than budgeted for. In such cases, contractors may be
required to wait for some time, perhaps up to three months, for payment after submission of
certificates of work done. This is mainly a planning and budgeting issue rather than a
commitment control issue, as the contractor is doing work that has not been budgeted for; in
fact the commitment control system is working through guarding against payment for such
work. A situation may also arise if the government revises the road construction budget
downward during the year but does not inform the contractor to this effect. This is a
communication issue rather than a commitment control issue.
Fur 14 In FY 2012/13, four BIs of a total of 46 spent ETB 49.5 million over their revised budgets, out of total
expenditure of ETB 21,701 million.
World Bank Oromia PEFA Assessment
49
There are instances where grace period payables (GPPs) (PI-4) remain outstanding for about
12 months due to delays in the review and approval of payment certificates submitted by
contractors. Engineers based at zonal offices review payment certificates against physical work
accomplished and may lack capacity. Their approval is required before the woredas can pay.
The number of steps involved in processing such payments may be excessive (and thus an issue
under PI-19 (ii) and PI-4, the benefits of the business process reengineering exercise not having
been fully realized yet). This is a payments process issue rather than a commitment control
issue.
It is expected that the introduction of IFMIS will enable more systematic control of
commitments within the cash available through the automation of the largely manual
commitment control processes currently used.
(ii) Comprehensiveness, relevance, and understanding of other internal control rules and
procedures
As noted, manuals and guidelines have been issued with the objective of strengthening internal
control. These prescribe segregation of duties for preparing, checking, certifying, and
approving the movement of resources including cash, stock items, and properties. The number
of people involved depends on the nature of the transaction. For some procedures (payroll,
procurement, and employment), there is a separation of roles between units, functions, and
committees. There is a periodic reconciliation of bank accounts against statements, and
property and stock records against physical counts. The internal audit function (PI-21) prevents
and detects noncompliance. Both internal and external auditors critically check daily
subsistence payments (per diems) for rates, number of field days against attendance,
authorization, and relevant documents. The internal control manual also outlines management
responsibilities.
Documentation on regulations and procedures is readily accessible in offices, enabling good
understanding by staff. Training has been provided for the accountants and head of BIs on the
various internal control systems including on internal audit.
(iii) Degree of compliance with rules for processing and registration of transactions
Generally, compliance with rules for processing and recording transactions is good. ORAG has
reported noncompliance in certain BIs on cash and stock handling (shortages), effecting
payment without documentation, and unlawful per diem payments, which in total represent
about ETB 223 million. In addition, it is reported that a total of ETB 296 million was paid by
different auditees with incomplete documentation and about ETB 336 million was paid
contrary to financial and procurement laws, regulations, and directives. These amounts are
almost 4 percent of total expenditure of ETB 21.7 billion in FY 2012/13.
Future reforms. It is expected that compliance will improve in the future from the recent
initiatives of ORAG (PI-26) and the RCs (PI-28) using TV and radio programs on the findings
of audit reports and measures being taken on noncompliance.
Table 3.31 PI-20 Results
PI Score
2010 Score
2014 Justification Performance change
PI-20 B B M1
World Bank Oromia PEFA Assessment
50
(i) B B Expenditure commitment controls are
in place. Together with strong cash
management, they effectively limit
commitments to projected cash
availability and budget allocations with
minor exceptions.
No change.
(ii) B B Financial and non-financial controls are
comprehensive, well documented, and
widely understood.
No change.
(iii) B B Compliance with rules is fairly high,
but certain procedures may not be
respected occasionally by some BIs.
No change.
PI-21 Effectiveness of internal audit
Regular and adequate feedback to management is required on the effectiveness of controls
through an internal audit function (or equivalent systems monitoring function). This indicator
assesses: (i) coverage and quality of the internal audit function; (ii) frequency and distribution
of reports; and (iii) extent of management response to internal audit findings.
Internal audit activities in ORG are carried out by the internal audit unit of each BI. An internal
audit manual, which was adapted from GoE internal audit manual, has been used since 2006.
The manual was developed with a focus on meeting professional standards as per the
International Standards for the Professional Practices in Internal Audit, issued by the Institute
of Internal Auditors. In addition, the Inspection Department has adapted the prototype training
module and report-writing guide, originally prepared by MoFED, and distributed them to
internal audit units.
The Inspection Department, which is based in BoFED, is responsible for supervising internal
audit activities, building capacity of the internal audit units and enhancing internal audit quality
throughout the region. The department also conducts special audits originated by the head of
BoFED, informants, and the Ethics and Anticorruption Commission. In addition, it conducts
regular audits in collaboration with the internal audit team of BoFED, when BIs and woredas
lack capacity. Two staff members are attending the certification course for Certified Internal
Auditor from the Institute of Internal Auditors. In FY 2009/10, the Inspection Department
developed a standard on the number of internal auditors required per BI. BIs are categorized
by type, and the number of internal audit staff per BI is three, five, or eight, depending on the
size of the BI’s annual budget and the complexity of its transactions. The standard number of
internal auditors for zonal offices is eight and for woredas is five. At the time of this assessment,
about 70 percent of the positions were filled. Staff turnover is an issue in the region. Low
salary, high workload, lack of independence, and unsatisfactory follow-up of internal audit
findings are said to be major factors driving staff turnover. Newly recruited internal auditors
often lack capacity to conduct internal audit until they have been trained.
(i) Coverage and quality of the internal audit function
The manual and procedures on internal audit are in line with professional standards. Internal
audit is operational in all 44 BIs, 18 zonal offices, and 309 woredas. The Inspection Department
reviews the annual audit plan of all internal audit units every year and may recommend the
revision of the plan.
World Bank Oromia PEFA Assessment
51
Comprehensive risk analysis is not practiced in most internal audit units. The units are required
to audit accounts of the respective BIs on a monthly basis. When time allows, the units conduct
systemic audits on procurement, property, human resource, payroll, and cash. The financial
audit takes the largest share of audit time.
The internal audit function covers all government funds (regular Treasury and MDG Fund) and
donor-funded projects. The Inspection Department in collaboration with the internal audit unit
of BoFED supports woredas for regular and special internal audits. The Inspection Department
estimates the internal audit coverage to be 40 percent.
(ii) Frequency and distribution of reports
Internal audit units are required to conduct monthly audits and submit quarterly reports to the
Inspection Department and to the heads of the BIs audited. In practice, about 40 percent of
them are sending their reports to the Inspection Department. Failures to report quarterly are
mainly due to capacity limitations. The internal audit units visited by the team issue about 12
reports per annum to their respective BI heads. There is no legal requirement to submit reports
to ORAG (which is accountable to the RC and not the executive), but ORAG can (and does)
obtain internal audit reports on request.
(iii) Extent of management response to internal audit findings
Auditees are required to respond in three days, but in practice, many of them respond more
than 30 days after receipt of audit reports. Sample internal audit unit heads said that internal
audit reports are generally followed up by management. According to the Inspection
Department, 50 percent of managers respond to internal audit findings and recommendations.
The Inspection Department often writes letters to BoFED to withhold the budget to BIs who
fail to respond to three follow-up reminder letters. No budget transfer has been withheld so far
in response to Inspection Department requests.
Table 3.32 PI-21 Results
PI Score
2010 Score
2014 Justification Performance change
PI-21 C+ C+ M1 (i) C C Although the manuals and
guidelines are in line with the
international standards, due to
high staff turnover and vacancies
the coverage is about 40% and
there is insufficient time for
systemic audit.
No change in rating. No
BIs and woredas are
without internal auditors
(as reported in 2010
PEFA). However, staff
turnover is high, and at
the time of the
assessment only 70% of
the positions were filled. (ii) A A Reports are issued generally on a
fixed schedule at least on a
quarterly basis.
No change.
(iii) C C About 50% of the managers
respond on time. No change.
Planned reforms. There is a plan for internal audit units to conduct performance audits. Some
of the internal audit staff attended training on performance audit in February 2014.
World Bank Oromia PEFA Assessment
52
To improve the follow-up and actions on internal audit findings, audit committees are being
formed in 123 pilot woredas. The audit committees will follow up the implementation of
recommendations of internal and external audit reports and report to the woreda councils. In
addition, the Inspection Department plans to send a summary of major internal audit findings
and recommendations to the Regional Cabinet to enforce prompt action.
3.5 Accounting, Recording, and Reporting
PI-22 Timeliness and regularity of accounts reconciliation
(i) Regularity of bank account reconciliations
There are 292 bank accounts managed by the Treasury. Many of the BIs have three treasury-
controlled accounts, called B account (revenue collection), D account (deposits), and Z account
(zero balance account). In addition, some of the BIs have donor accounts.
Zero balance accounts are reconciled daily by the Treasury at BoFED if banks provide daily
statements, otherwise they are reconciled every three days. Daily bank statements and
disbursement reports from CBE are used to enter transactions into the IBEX system. BIs check
the statements against the running balance of their ceilings. They submit monthly financial
reports to BoFED, which checks them against the transfers made into zero balance accounts.
Deposits to the Treasury Accounts at CBE are reconciled daily against deposit slips. Deposit
slips are collected daily from CBE. The MDG account is not in the zero balance system. The
account is reconciled on a monthly basis at BoFED and zonal offices. At the BoFED level,
bank accounts of the Treasury and MDG are reconciled in less than three weeks from the end
of the month. Posting is not taking place on the main database as opening balances are awaiting
updates. A pseudo database is used to post transactions to get a temporary ledger and edit lists
for the purpose of account reconciliation.
In some of the BIs (such as the Bureau of Education) and East Shewa Zone, bank accounts are
reconciled in six weeks from the end of the month, and for certain project accounts within three
months from the end of the month.
Channel 1 and some other donor-funded project accounts are reconciled more than four weeks
from the end of the month. Zones reconcile their accounts. In addition, monthly bank
reconciliation reports are prepared by each BI and submitted to BoFED as part of their monthly
financial reports. Reconciliation takes place at detailed level.15
(ii) Regularity of reconciliation and clearance of suspense accounts and advances
The balance of suspense account (4201) increased from ETB 8.3 million in July 2011 to ETB
12 million in July 2013. The details and the purpose of this account are not clear to BoFED, as
details are available only at the level of BIs and woredas.
Most of the accounts are cleared by the end of the year. Generally, unknown bank entries shown
in the statements are cleared in the month after reconciliation. Some BI accounts show that
Fur 15 The PEFA Framework requires reconciliation at aggregate and detailed levels (for all government bank
accounts, not just Treasury-managed accounts) for an A rating. The detailed reconciliation is the only one that
matches individual receipts and payments in both records and provides assurance of accuracy. The aggregate
reconciliation adds nothing, and is insufficient in itself. Reconciliation statements should show only deposits in
transit that are related to transfers, deposits made close to the end of the month, and outstanding checks where
payees are yet to claim from the bank.

World Bank Oromia PEFA Assessment
53
certain items were not cleared within six months.16 Aging reports are not available to determine
how promptly advance and receivable accounts are cleared. According to BoFED, long
outstanding balances are mainly attributable to previous years and are under review and
investigation to clear up.
Suspense payments that are part of the petty cash system are reconciled periodically and subject
to monthly internal audit. Uncleared suspense accounts are transferred to staff advances after
seven days and are deducted from salaries.
Table 3.33 PI-22 Results PI Score
2010 Score
2014 Justification Performance change
PI-22 B+ B M2 (i) B B Bank accounts are reconciled on a
monthly basis for the majority of
treasury bank accounts within 4
weeks from the end of the month.
No change.
(ii) A B Suspense accounts and advances are
reconciled at least annually and only
a few balances are carried forward
to the following year. Balances are
mainly attributable to previous years
Some deterioration.
Future reforms. BoFED is negotiating with CBE to open a branch in the BoFED premises , in
order to establish a dedicated banking service, get daily bank statements and avoid delays.
PI-23 Availability of information on resources received by service delivery units
Oromia State aims to raise the number of primary schools to 12,559 and secondary schools to
571.17 Primary schools report to the respective woredas and secondary schools to the respective
zones. They receive resources from the Oromia Treasury and GEQIP, which is a multi-donor
Channel 1 program. Under GEQIP, primary schools have their own bank accounts and are
responsible for purchasing their inputs. Previously (as described in the 2010 PEFA
assessment), woreda education offices would procure inputs (e.g., text books) and allocate
these physically to schools according to an internal allocation system, recording the amounts
allocated in the process. The amounts allocated to each school would not be captured by IBEX
as they were in physical form, but the cash purchases by woreda offices (WoFED through the
single pool system) would be captured in IBEX, although in aggregate and not on an SDU by
SDU basis. The routine accounts record expenditure on each primary school: for example,
Wata Wanda Primary School capital construction is coded 310-02-02-00. In addition, each
school has a notice board that displays the school budget and revenue and expenditure. The
Oromia Bureau of Education collects data on each school, including the resources received,
and compiles them into annual reports.
Similarly, there are 948 health centers and 298 clinics (posts). Resources are received from the
Oromia Treasury, UNICEF, and UNFPA, but only cash resources received by SDUs are
captured within the IBEX system. Health posts tend not to have their own bank accounts,
Fur 16 As of July 7, 2013, receivables include staff advance balances of ETB 45 million, advances for recurrent
expenditure from next year’s budget of Br 22 million, purchase advances of Br 220 million, prepayments to
contractors and suppliers of Br 2.59 billion, and other advances of Br 1.47 billion. 17 Office of the President, Oromia Today, Addis Ababa,2013, p, 65
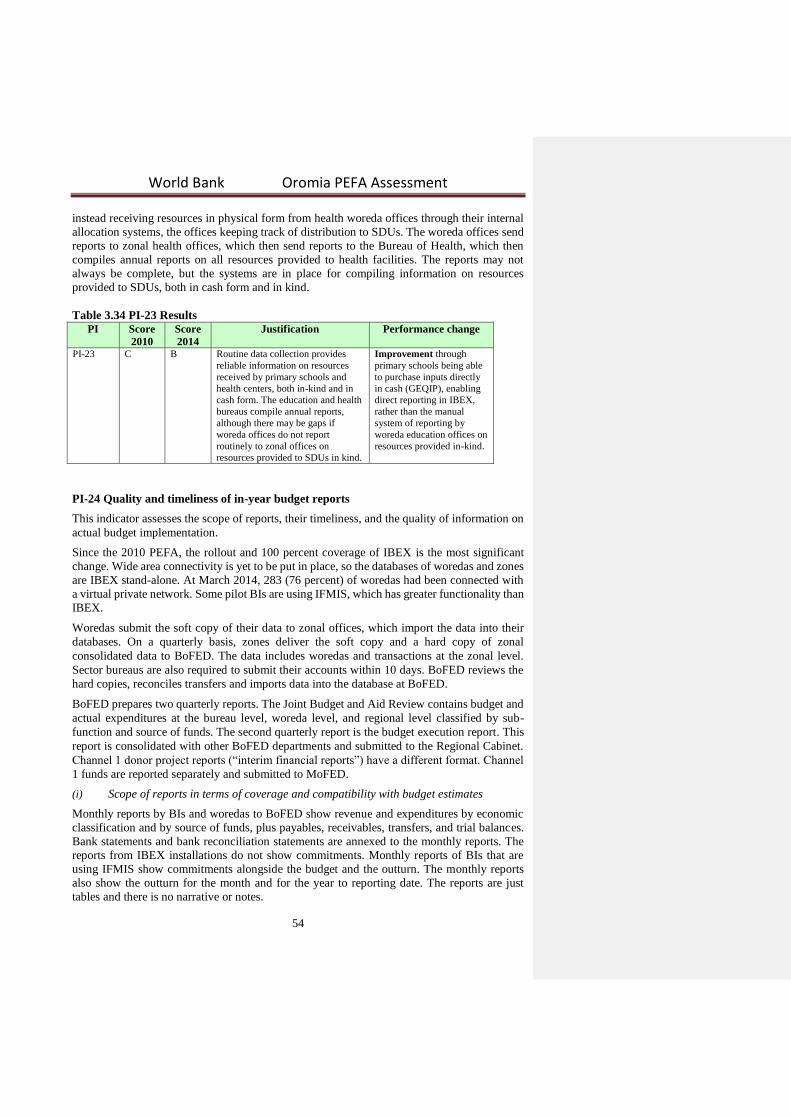
World Bank Oromia PEFA Assessment
54
instead receiving resources in physical form from health woreda offices through their internal
allocation systems, the offices keeping track of distribution to SDUs. The woreda offices send
reports to zonal health offices, which then send reports to the Bureau of Health, which then
compiles annual reports on all resources provided to health facilities. The reports may not
always be complete, but the systems are in place for compiling information on resources
provided to SDUs, both in cash form and in kind.
Table 3.34 PI-23 Results
PI Score
2010 Score
2014 Justification Performance change
PI-23 C B Routine data collection provides
reliable information on resources
received by primary schools and
health centers, both in-kind and in
cash form. The education and health
bureaus compile annual reports,
although there may be gaps if
woreda offices do not report
routinely to zonal offices on
resources provided to SDUs in kind.
Improvement through
primary schools being able
to purchase inputs directly
in cash (GEQIP), enabling
direct reporting in IBEX,
rather than the manual
system of reporting by
woreda education offices on
resources provided in-kind.
PI-24 Quality and timeliness of in-year budget reports
This indicator assesses the scope of reports, their timeliness, and the quality of information on
actual budget implementation.
Since the 2010 PEFA, the rollout and 100 percent coverage of IBEX is the most significant
change. Wide area connectivity is yet to be put in place, so the databases of woredas and zones
are IBEX stand-alone. At March 2014, 283 (76 percent) of woredas had been connected with
a virtual private network. Some pilot BIs are using IFMIS, which has greater functionality than
IBEX.
Woredas submit the soft copy of their data to zonal offices, which import the data into their
databases. On a quarterly basis, zones deliver the soft copy and a hard copy of zonal
consolidated data to BoFED. The data includes woredas and transactions at the zonal level.
Sector bureaus are also required to submit their accounts within 10 days. BoFED reviews the
hard copies, reconciles transfers and imports data into the database at BoFED.
BoFED prepares two quarterly reports. The Joint Budget and Aid Review contains budget and
actual expenditures at the bureau level, woreda level, and regional level classified by sub-
function and source of funds. The second quarterly report is the budget execution report. This
report is consolidated with other BoFED departments and submitted to the Regional Cabinet.
Channel 1 donor project reports (“interim financial reports”) have a different format. Channel
1 funds are reported separately and submitted to MoFED.
(i) Scope of reports in terms of coverage and compatibility with budget estimates
Monthly reports by BIs and woredas to BoFED show revenue and expenditures by economic
classification and by source of funds, plus payables, receivables, transfers, and trial balances.
Bank statements and bank reconciliation statements are annexed to the monthly reports. The
reports from IBEX installations do not show commitments. Monthly reports of BIs that are
using IFMIS show commitments alongside the budget and the outturn. The monthly reports
also show the outturn for the month and for the year to reporting date. The reports are just
tables and there is no narrative or notes.
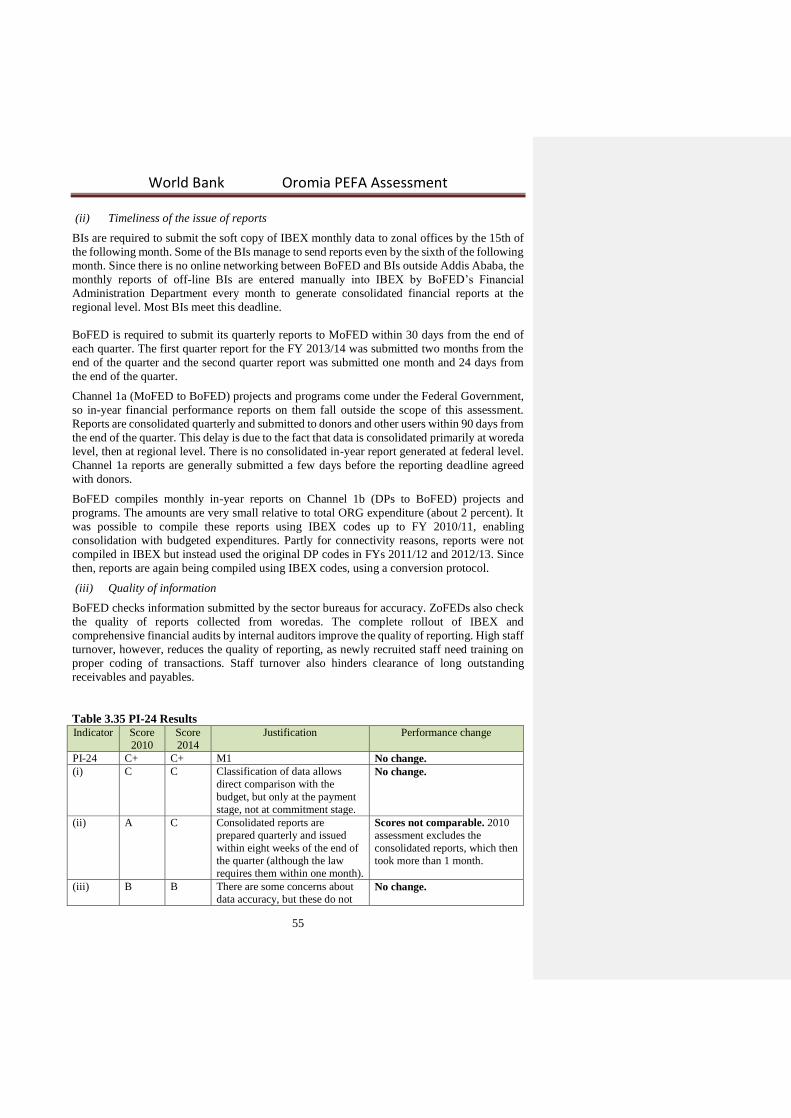
World Bank Oromia PEFA Assessment
55
(ii) Timeliness of the issue of reports
BIs are required to submit the soft copy of IBEX monthly data to zonal offices by the 15th of
the following month. Some of the BIs manage to send reports even by the sixth of the following
month. Since there is no online networking between BoFED and BIs outside Addis Ababa, the
monthly reports of off-line BIs are entered manually into IBEX by BoFED’s Financial
Administration Department every month to generate consolidated financial reports at the
regional level. Most BIs meet this deadline.
BoFED is required to submit its quarterly reports to MoFED within 30 days from the end of
each quarter. The first quarter report for the FY 2013/14 was submitted two months from the
end of the quarter and the second quarter report was submitted one month and 24 days from
the end of the quarter.
Channel 1a (MoFED to BoFED) projects and programs come under the Federal Government,
so in-year financial performance reports on them fall outside the scope of this assessment.
Reports are consolidated quarterly and submitted to donors and other users within 90 days from
the end of the quarter. This delay is due to the fact that data is consolidated primarily at woreda
level, then at regional level. There is no consolidated in-year report generated at federal level.
Channel 1a reports are generally submitted a few days before the reporting deadline agreed
with donors.
BoFED compiles monthly in-year reports on Channel 1b (DPs to BoFED) projects and
programs. The amounts are very small relative to total ORG expenditure (about 2 percent). It
was possible to compile these reports using IBEX codes up to FY 2010/11, enabling
consolidation with budgeted expenditures. Partly for connectivity reasons, reports were not
compiled in IBEX but instead used the original DP codes in FYs 2011/12 and 2012/13. Since
then, reports are again being compiled using IBEX codes, using a conversion protocol.
(iii) Quality of information
BoFED checks information submitted by the sector bureaus for accuracy. ZoFEDs also check
the quality of reports collected from woredas. The complete rollout of IBEX and
comprehensive financial audits by internal auditors improve the quality of reporting. High staff
turnover, however, reduces the quality of reporting, as newly recruited staff need training on
proper coding of transactions. Staff turnover also hinders clearance of long outstanding
receivables and payables.
Table 3.35 PI-24 Results Indicator Score
2010 Score
2014 Justification Performance change
PI-24 C+ C+ M1 No change. (i) C C Classification of data allows
direct comparison with the
budget, but only at the payment
stage, not at commitment stage.
No change.
(ii) A C Consolidated reports are
prepared quarterly and issued
within eight weeks of the end of
the quarter (although the law
requires them within one month).
Scores not comparable. 2010
assessment excludes the
consolidated reports, which then
took more than 1 month.
(iii) B B There are some concerns about
data accuracy, but these do not No change.
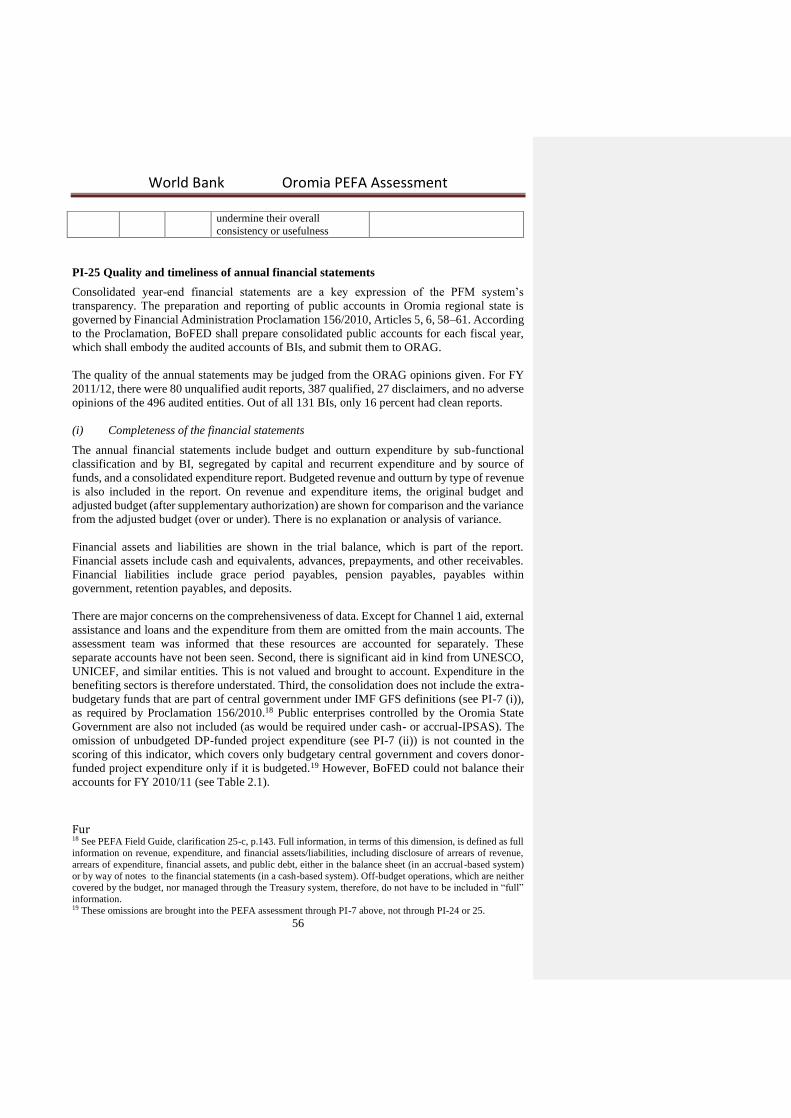
World Bank Oromia PEFA Assessment
56
undermine their overall
consistency or usefulness
PI-25 Quality and timeliness of annual financial statements
Consolidated year-end financial statements are a key expression of the PFM system’s
transparency. The preparation and reporting of public accounts in Oromia regional state is
governed by Financial Administration Proclamation 156/2010, Articles 5, 6, 58–61. According
to the Proclamation, BoFED shall prepare consolidated public accounts for each fiscal year,
which shall embody the audited accounts of BIs, and submit them to ORAG.
The quality of the annual statements may be judged from the ORAG opinions given. For FY
2011/12, there were 80 unqualified audit reports, 387 qualified, 27 disclaimers, and no adverse
opinions of the 496 audited entities. Out of all 131 BIs, only 16 percent had clean reports.
(i) Completeness of the financial statements
The annual financial statements include budget and outturn expenditure by sub-functional
classification and by BI, segregated by capital and recurrent expenditure and by source of
funds, and a consolidated expenditure report. Budgeted revenue and outturn by type of revenue
is also included in the report. On revenue and expenditure items, the original budget and
adjusted budget (after supplementary authorization) are shown for comparison and the variance
from the adjusted budget (over or under). There is no explanation or analysis of variance.
Financial assets and liabilities are shown in the trial balance, which is part of the report.
Financial assets include cash and equivalents, advances, prepayments, and other receivables.
Financial liabilities include grace period payables, pension payables, payables within
government, retention payables, and deposits.
There are major concerns on the comprehensiveness of data. Except for Channel 1 aid, external
assistance and loans and the expenditure from them are omitted from the main accounts. The
assessment team was informed that these resources are accounted for separately. These
separate accounts have not been seen. Second, there is significant aid in kind from UNESCO,
UNICEF, and similar entities. This is not valued and brought to account. Expenditure in the
benefiting sectors is therefore understated. Third, the consolidation does not include the extra-
budgetary funds that are part of central government under IMF GFS definitions (see PI-7 (i)),
as required by Proclamation 156/2010.18 Public enterprises controlled by the Oromia State
Government are also not included (as would be required under cash- or accrual-IPSAS). The
omission of unbudgeted DP-funded project expenditure (see PI-7 (ii)) is not counted in the
scoring of this indicator, which covers only budgetary central government and covers donor-
funded project expenditure only if it is budgeted.19 However, BoFED could not balance their
accounts for FY 2010/11 (see Table 2.1).
Fur 18 See PEFA Field Guide, clarification 25-c, p.143. Full information, in terms of this dimension, is defined as full
information on revenue, expenditure, and financial assets/liabilities, including disclosure of arrears of revenue,
arrears of expenditure, financial assets, and public debt, either in the balance sheet (in an accrual-based system)
or by way of notes to the financial statements (in a cash-based system). Off-budget operations, which are neither
covered by the budget, nor managed through the Treasury system, therefore, do not have to be included in “full”
information. 19 These omissions are brought into the PEFA assessment through PI-7 above, not through PI-24 or 25.
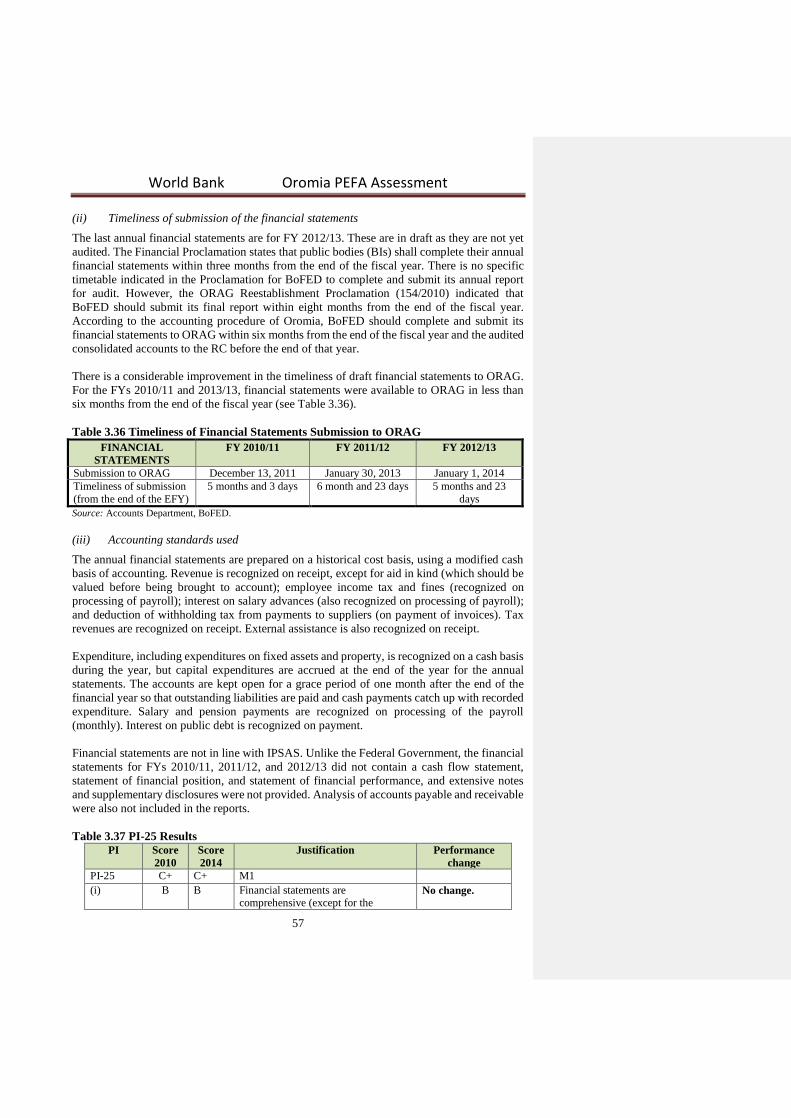
World Bank Oromia PEFA Assessment
57
(ii) Timeliness of submission of the financial statements
The last annual financial statements are for FY 2012/13. These are in draft as they are not yet
audited. The Financial Proclamation states that public bodies (BIs) shall complete their annual
financial statements within three months from the end of the fiscal year. There is no specific
timetable indicated in the Proclamation for BoFED to complete and submit its annual report
for audit. However, the ORAG Reestablishment Proclamation (154/2010) indicated that
BoFED should submit its final report within eight months from the end of the fiscal year.
According to the accounting procedure of Oromia, BoFED should complete and submit its
financial statements to ORAG within six months from the end of the fiscal year and the audited
consolidated accounts to the RC before the end of that year.
There is a considerable improvement in the timeliness of draft financial statements to ORAG.
For the FYs 2010/11 and 2013/13, financial statements were available to ORAG in less than
six months from the end of the fiscal year (see Table 3.36).
Table 3.36 Timeliness of Financial Statements Submission to ORAG
FINANCIAL
STATEMENTS FY 2010/11 FY 2011/12 FY 2012/13
Submission to ORAG December 13, 2011 January 30, 2013 January 1, 2014 Timeliness of submission (from the end of the EFY)
5 months and 3 days 6 month and 23 days 5 months and 23
days
Source: Accounts Department, BoFED.
(iii) Accounting standards used
The annual financial statements are prepared on a historical cost basis, using a modified cash
basis of accounting. Revenue is recognized on receipt, except for aid in kind (which should be
valued before being brought to account); employee income tax and fines (recognized on
processing of payroll); interest on salary advances (also recognized on processing of payroll);
and deduction of withholding tax from payments to suppliers (on payment of invoices). Tax
revenues are recognized on receipt. External assistance is also recognized on receipt.
Expenditure, including expenditures on fixed assets and property, is recognized on a cash basis
during the year, but capital expenditures are accrued at the end of the year for the annual
statements. The accounts are kept open for a grace period of one month after the end of the
financial year so that outstanding liabilities are paid and cash payments catch up with recorded
expenditure. Salary and pension payments are recognized on processing of the payroll
(monthly). Interest on public debt is recognized on payment.
Financial statements are not in line with IPSAS. Unlike the Federal Government, the financial
statements for FYs 2010/11, 2011/12, and 2012/13 did not contain a cash flow statement,
statement of financial position, and statement of financial performance, and extensive notes
and supplementary disclosures were not provided. Analysis of accounts payable and receivable
were also not included in the reports.
Table 3.37 PI-25 Results PI Score
2010 Score
2014 Justification Performance
change PI-25 C+ C+ M1
(i) B B Financial statements are
comprehensive (except for the No change.
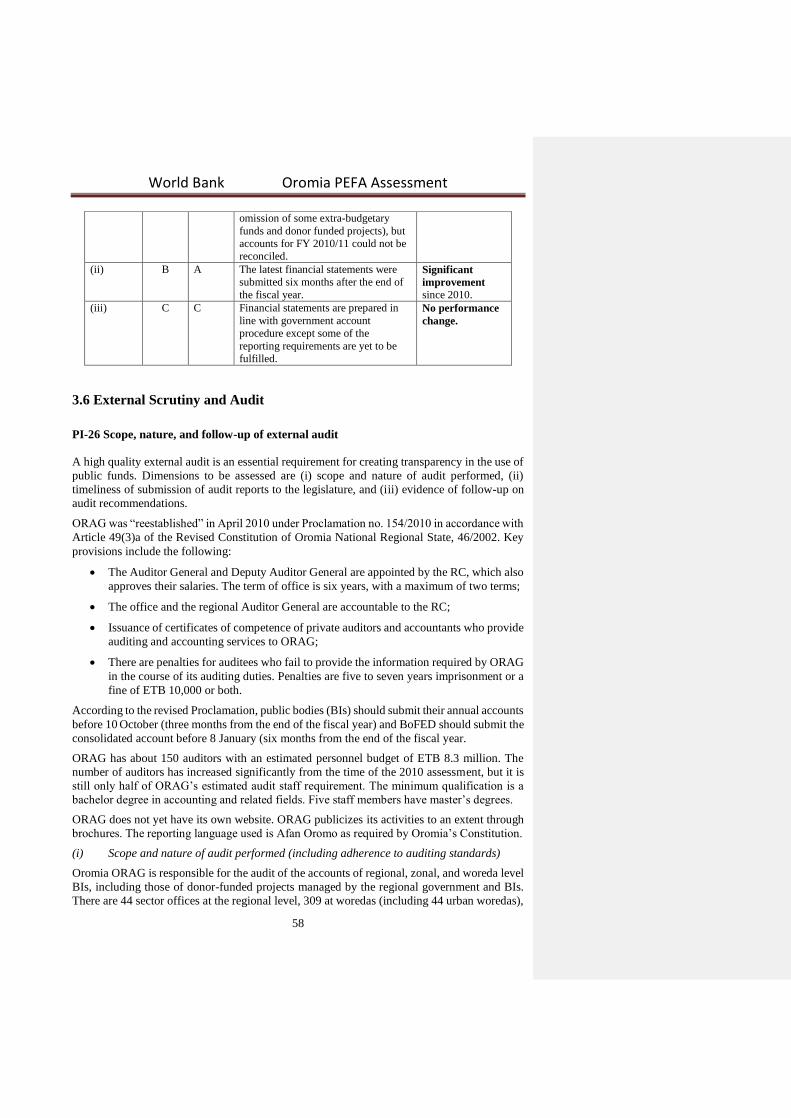
World Bank Oromia PEFA Assessment
58
omission of some extra-budgetary
funds and donor funded projects), but
accounts for FY 2010/11 could not be
reconciled. (ii) B A The latest financial statements were
submitted six months after the end of
the fiscal year.
Significant
improvement since 2010.
(iii) C C Financial statements are prepared in
line with government account
procedure except some of the
reporting requirements are yet to be
fulfilled.
No performance
change.
3.6 External Scrutiny and Audit
PI-26 Scope, nature, and follow-up of external audit
A high quality external audit is an essential requirement for creating transparency in the use of
public funds. Dimensions to be assessed are (i) scope and nature of audit performed, (ii)
timeliness of submission of audit reports to the legislature, and (iii) evidence of follow-up on
audit recommendations.
ORAG was “reestablished” in April 2010 under Proclamation no. 154/2010 in accordance with
Article 49(3)a of the Revised Constitution of Oromia National Regional State, 46/2002. Key
provisions include the following:
The Auditor General and Deputy Auditor General are appointed by the RC, which also
approves their salaries. The term of office is six years, with a maximum of two terms;
The office and the regional Auditor General are accountable to the RC;
Issuance of certificates of competence of private auditors and accountants who provide
auditing and accounting services to ORAG;
There are penalties for auditees who fail to provide the information required by ORAG
in the course of its auditing duties. Penalties are five to seven years imprisonment or a
fine of ETB 10,000 or both.
According to the revised Proclamation, public bodies (BIs) should submit their annual accounts
before 10 October (three months from the end of the fiscal year) and BoFED should submit the
consolidated account before 8 January (six months from the end of the fiscal year.
ORAG has about 150 auditors with an estimated personnel budget of ETB 8.3 million. The
number of auditors has increased significantly from the time of the 2010 assessment, but it is
still only half of ORAG’s estimated audit staff requirement. The minimum qualification is a
bachelor degree in accounting and related fields. Five staff members have master’s degrees.
ORAG does not yet have its own website. ORAG publicizes its activities to an extent through
brochures. The reporting language used is Afan Oromo as required by Oromia’s Constitution.
(i) Scope and nature of audit performed (including adherence to auditing standards)
Oromia ORAG is responsible for the audit of the accounts of regional, zonal, and woreda level
BIs, including those of donor-funded projects managed by the regional government and BIs.
There are 44 sector offices at the regional level, 309 at woredas (including 44 urban woredas),
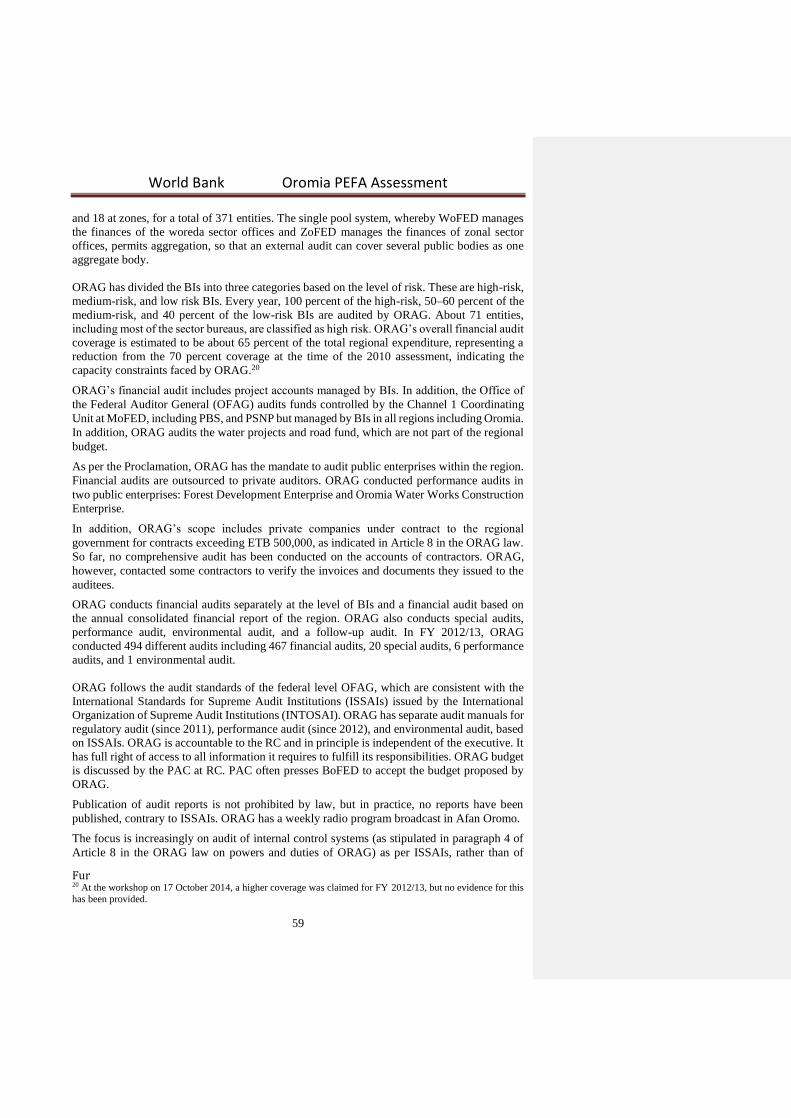
World Bank Oromia PEFA Assessment
59
and 18 at zones, for a total of 371 entities. The single pool system, whereby WoFED manages
the finances of the woreda sector offices and ZoFED manages the finances of zonal sector
offices, permits aggregation, so that an external audit can cover several public bodies as one
aggregate body.
ORAG has divided the BIs into three categories based on the level of risk. These are high-risk,
medium-risk, and low risk BIs. Every year, 100 percent of the high-risk, 50–60 percent of the
medium-risk, and 40 percent of the low-risk BIs are audited by ORAG. About 71 entities,
including most of the sector bureaus, are classified as high risk. ORAG’s overall financial audit
coverage is estimated to be about 65 percent of the total regional expenditure, representing a
reduction from the 70 percent coverage at the time of the 2010 assessment, indicating the
capacity constraints faced by ORAG.20
ORAG’s financial audit includes project accounts managed by BIs. In addition, the Office of
the Federal Auditor General (OFAG) audits funds controlled by the Channel 1 Coordinating
Unit at MoFED, including PBS, and PSNP but managed by BIs in all regions including Oromia.
In addition, ORAG audits the water projects and road fund, which are not part of the regional
budget.
As per the Proclamation, ORAG has the mandate to audit public enterprises within the region.
Financial audits are outsourced to private auditors. ORAG conducted performance audits in
two public enterprises: Forest Development Enterprise and Oromia Water Works Construction
Enterprise.
In addition, ORAG’s scope includes private companies under contract to the regional
government for contracts exceeding ETB 500,000, as indicated in Article 8 in the ORAG law.
So far, no comprehensive audit has been conducted on the accounts of contractors. ORAG,
however, contacted some contractors to verify the invoices and documents they issued to the
auditees.
ORAG conducts financial audits separately at the level of BIs and a financial audit based on
the annual consolidated financial report of the region. ORAG also conducts special audits,
performance audit, environmental audit, and a follow-up audit. In FY 2012/13, ORAG
conducted 494 different audits including 467 financial audits, 20 special audits, 6 performance
audits, and 1 environmental audit.
ORAG follows the audit standards of the federal level OFAG, which are consistent with the
International Standards for Supreme Audit Institutions (ISSAIs) issued by the International
Organization of Supreme Audit Institutions (INTOSAI). ORAG has separate audit manuals for
regulatory audit (since 2011), performance audit (since 2012), and environmental audit, based
on ISSAIs. ORAG is accountable to the RC and in principle is independent of the executive. It
has full right of access to all information it requires to fulfill its responsibilities. ORAG budget
is discussed by the PAC at RC. PAC often presses BoFED to accept the budget proposed by
ORAG.
Publication of audit reports is not prohibited by law, but in practice, no reports have been
published, contrary to ISSAIs. ORAG has a weekly radio program broadcast in Afan Oromo.
The focus is increasingly on audit of internal control systems (as stipulated in paragraph 4 of
Article 8 in the ORAG law on powers and duties of ORAG) as per ISSAIs, rather than of
Fur 20 At the workshop on 17 October 2014, a higher coverage was claimed for FY 2012/13, but no evidence for this
has been provided.
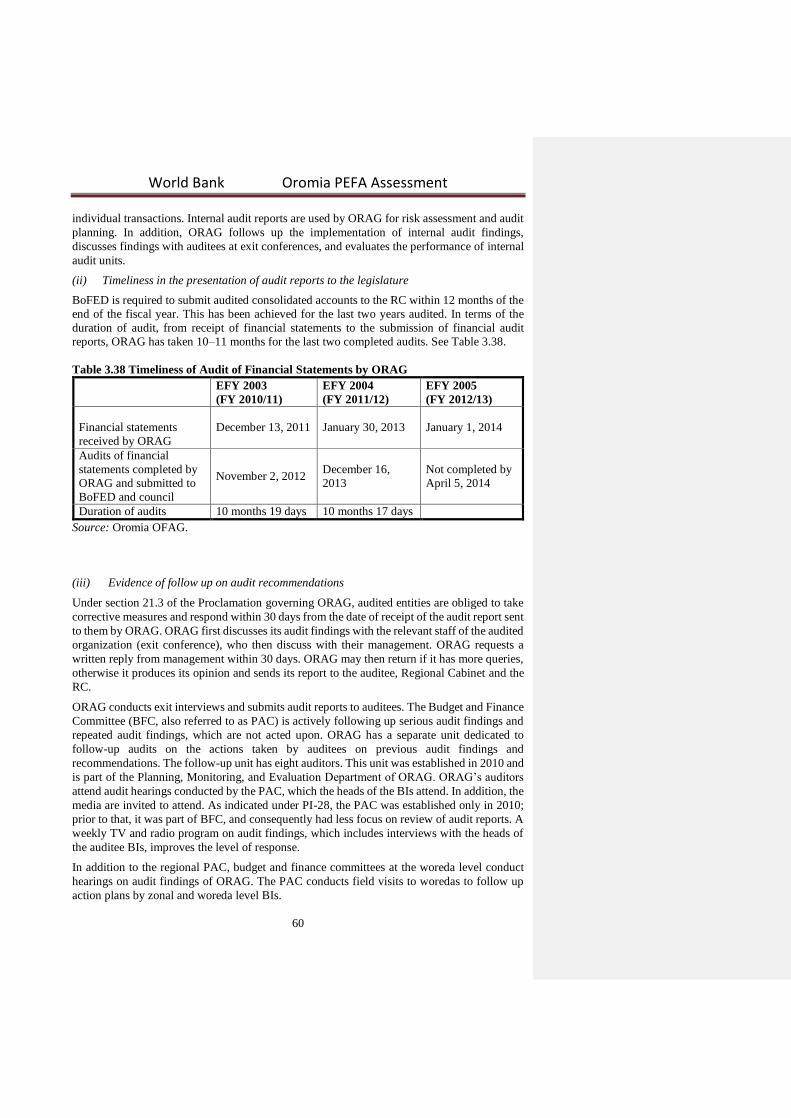
World Bank Oromia PEFA Assessment
60
individual transactions. Internal audit reports are used by ORAG for risk assessment and audit
planning. In addition, ORAG follows up the implementation of internal audit findings,
discusses findings with auditees at exit conferences, and evaluates the performance of internal
audit units.
(ii) Timeliness in the presentation of audit reports to the legislature
BoFED is required to submit audited consolidated accounts to the RC within 12 months of the
end of the fiscal year. This has been achieved for the last two years audited. In terms of the
duration of audit, from receipt of financial statements to the submission of financial audit
reports, ORAG has taken 10–11 months for the last two completed audits. See Table 3.38.
Table 3.38 Timeliness of Audit of Financial Statements by ORAG
EFY 2003
(FY 2010/11)
EFY 2004
(FY 2011/12)
EFY 2005
(FY 2012/13)
Financial statements
received by ORAG
December 13, 2011 January 30, 2013 January 1, 2014
Audits of financial
statements completed by
ORAG and submitted to
BoFED and council
November 2, 2012 December 16,
2013
Not completed by
April 5, 2014
Duration of audits 10 months 19 days 10 months 17 days
Source: Oromia OFAG.
(iii) Evidence of follow up on audit recommendations
Under section 21.3 of the Proclamation governing ORAG, audited entities are obliged to take
corrective measures and respond within 30 days from the date of receipt of the audit report sent
to them by ORAG. ORAG first discusses its audit findings with the relevant staff of the audited
organization (exit conference), who then discuss with their management. ORAG requests a
written reply from management within 30 days. ORAG may then return if it has more queries,
otherwise it produces its opinion and sends its report to the auditee, Regional Cabinet and the
RC.
ORAG conducts exit interviews and submits audit reports to auditees. The Budget and Finance
Committee (BFC, also referred to as PAC) is actively following up serious audit findings and
repeated audit findings, which are not acted upon. ORAG has a separate unit dedicated to
follow-up audits on the actions taken by auditees on previous audit findings and
recommendations. The follow-up unit has eight auditors. This unit was established in 2010 and
is part of the Planning, Monitoring, and Evaluation Department of ORAG. ORAG’s auditors
attend audit hearings conducted by the PAC, which the heads of the BIs attend. In addition, the
media are invited to attend. As indicated under PI-28, the PAC was established only in 2010;
prior to that, it was part of BFC, and consequently had less focus on review of audit reports. A
weekly TV and radio program on audit findings, which includes interviews with the heads of
the auditee BIs, improves the level of response.
In addition to the regional PAC, budget and finance committees at the woreda level conduct
hearings on audit findings of ORAG. The PAC conducts field visits to woredas to follow up
action plans by zonal and woreda level BIs.
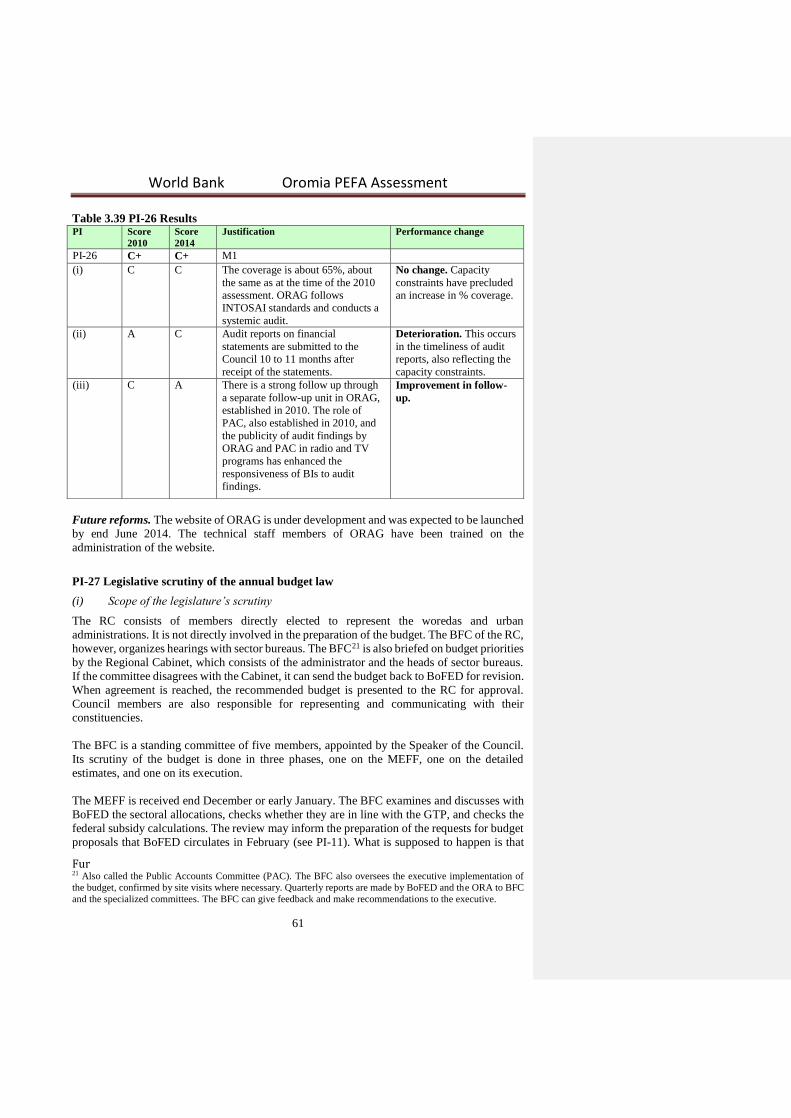
World Bank Oromia PEFA Assessment
61
Table 3.39 PI-26 Results PI Score
2010
Score
2014
Justification Performance change
PI-26 C+ C+ M1 (i) C C The coverage is about 65%, about
the same as at the time of the 2010
assessment. ORAG follows
INTOSAI standards and conducts a
systemic audit.
No change. Capacity
constraints have precluded
an increase in % coverage.
(ii) A C Audit reports on financial
statements are submitted to the
Council 10 to 11 months after
receipt of the statements.
Deterioration. This occurs
in the timeliness of audit
reports, also reflecting the
capacity constraints. (iii) C A There is a strong follow up through
a separate follow-up unit in ORAG,
established in 2010. The role of
PAC, also established in 2010, and
the publicity of audit findings by
ORAG and PAC in radio and TV
programs has enhanced the
responsiveness of BIs to audit
findings.
Improvement in follow-
up.
Future reforms. The website of ORAG is under development and was expected to be launched
by end June 2014. The technical staff members of ORAG have been trained on the
administration of the website.
PI-27 Legislative scrutiny of the annual budget law
(i) Scope of the legislature’s scrutiny
The RC consists of members directly elected to represent the woredas and urban
administrations. It is not directly involved in the preparation of the budget. The BFC of the RC,
however, organizes hearings with sector bureaus. The BFC21 is also briefed on budget priorities
by the Regional Cabinet, which consists of the administrator and the heads of sector bureaus.
If the committee disagrees with the Cabinet, it can send the budget back to BoFED for revision.
When agreement is reached, the recommended budget is presented to the RC for approval.
Council members are also responsible for representing and communicating with their
constituencies.
The BFC is a standing committee of five members, appointed by the Speaker of the Council.
Its scrutiny of the budget is done in three phases, one on the MEFF, one on the detailed
estimates, and one on its execution.
The MEFF is received end December or early January. The BFC examines and discusses with
BoFED the sectoral allocations, checks whether they are in line with the GTP, and checks the
federal subsidy calculations. The review may inform the preparation of the requests for budget
proposals that BoFED circulates in February (see PI-11). What is supposed to happen is that
Fur 21 Also called the Public Accounts Committee (PAC). The BFC also oversees the executive implementation of
the budget, confirmed by site visits where necessary. Quarterly reports are made by BoFED and the ORA to BFC
and the specialized committees. The BFC can give feedback and make recommendations to the executive.

World Bank Oromia PEFA Assessment
62
the detailed estimates are received through the Speaker by the end of May. Scrutiny is
organized first through the Coordinating Committee, which comprises the chairpersons of eight
specialized committees. The Coordinating Committee may propose minor changes. These are
addressed by BoFED and the draft budget is supposed to be submitted to the BFC by June 15
for detailed review. BIs and citizens may be called to the first hearing, which is supposed to be
completed by June 27. After three days, the bill is proposed to the full council by the BFC
Chairperson.
For FY 2011/12 (EFY 2004), the Coordinating Committee received the budget on June 8, 2011,
the motion to pass the bill was delivered on June 15, and was approved on July 11, about one
month after submission of the draft budget to the RC. The budget is normally approved a few
days after the beginning of the year (July 7), usually because of difficulty in convening all
members from across Oromia.
(ii) Extent to which the legislature’s procedures are well established and respected
Both the legislature and the executive are controlled by the party in power. The procedures are
well established and respected, although the convening of all members of the RC from across
Oromia can pose logistical difficulties. At the time of the 2010 assessment, technical manuals,
including one on budget preparation, were being prepared (with DP support) to assist BFC
members in their scrutiny of the draft budget. These manuals have helped to strengthen the
robustness of the procedures. The chairman of BFC at the time of the 2010 assessment
mentioned that procedures were not always respected due to the logistical difficulties involved
in ad-hoc part-time members being able to attend meetings when required, due to living in
other parts of the region. This appears to be less of a problem now.
(iii) Adequacy of time for the legislature to provide a response to budget proposals
As noted under PI-11, compliance with the budget preparation timetable slipped in relation to
preparing the FY 2013/14 budget, with the Coordinating Committee not receiving the budget
until the second half of June; this allowed for about three weeks of review instead of one month
prior to the approval of the budget on July 14, 2013 (itself late by a week). The total time for
review, taking into account the one-month review of the MEFF earlier in the year, is therefore
about seven weeks.
(iv) Rules for in-year amendments to the budget without ex-ante approval by the legislature
A supplementary appropriation is sought by the executive only if the approved aggregate
expenditure budget is insufficient. This usually happens once a year, and after six months
performance. BoFED seeks cabinet approval for an adjusted budget in January. This includes
all uses of the contingency budget. The procedure is shorter than for the original budget.
BoFED submits the supplementary budget to the BFC, which scrutinizes it and presents it to
the Council for approval. It should be noted that any reduction in expenditure below the
approved estimates, e.g., due to a shortfall of resources, is managed by BoFED and does not
require legislative authorization.
Reallocations within the approved aggregate expenditure budget are clearly defined by the
Financial Administration Proclamation 136/2010 Articles 22-24. BoFED has power to transfer
budgetary provisions between BIs, sectors, programs, and economic items, within the overall
ceiling. The only restriction is that savings on the capital budget cannot be transferred to
increase recurrent expenditure.

World Bank Oromia PEFA Assessment
63
Table 3.40 PI-27 Results
PI Score
2010 Score
2014 Justification Performance change
PI-27 D+ B+ M1 Overall improvement.
(i) C B The BFC review covers fiscal
policies and aggregates (the MEFF)
as well as detailed estimates of
revenue and expenditure.
Improvement in coverage.
(A rating requires coverage of
medium-term priorities,
which is not the case yet.)
(ii) C A The legislature’s procedures are
well established and respected and
include inputs from specialized
review committees.
Improvement. This is partly
due to the use by BFC
members of the technical
manuals being prepared for
them at the time of the 2010
assessment.
(iii) D B The legislature had about seven
weeks to review the draft FY
2013/14 budget between January
and July 2013.
Improvement. At the time of
the 2010 assessment, the BFC
was not reviewing the MEFF.
(iv) D B Clear rules exist and are respected,
but they allow extensive
administrative reallocations.
Improvement. The D score
in the 2010 assessment was
due to ex-post approval of
supplementary budgets.
PI-28 Legislative scrutiny of external audit reports
The Oromia State Council has a key role in scrutinizing the execution of the budget that it
approved. ORAG submits his reports through the speaker of the RC to the PAC, which was
split off from the BFC in January 2010. The PAC has five members appointed by the speaker
from council members for the term of the Council (five years). All belong to the ruling party
(there is no formal opposition).
(i) Timeliness of examination of audit reports by the legislature
ORAG conducts: (1) financial audits on each separate BI on which it sends quarterly reports
to the BFC; (2) a financial audit based on the annual consolidated financial statements of the
region; also (3) special audits, performance audits, environmental audits, and follow-up audits.
This dimension is concerned only with the examination of the financial audit report on the
consolidated financial statements.
The latest annual statements on which BFC has reported are for FY 2011/12 (EFY 2004). BFC
was expected to complete the review on FY 2012/13 (EFY 2005) by mid-May 2014, 10 months
after the end of the year. The PAC takes 4 months to review each report, somewhat longer than
the 2 months at the time of the 2010 assessment.
(ii) Extent of hearings on key findings undertaken by the legislature
ORAG quarterly reports on individual BIs provide the main basis of accountability to the RC.
Heads of all BIs receiving a qualified or adverse opinion (or disclaimer) from ORAG are called
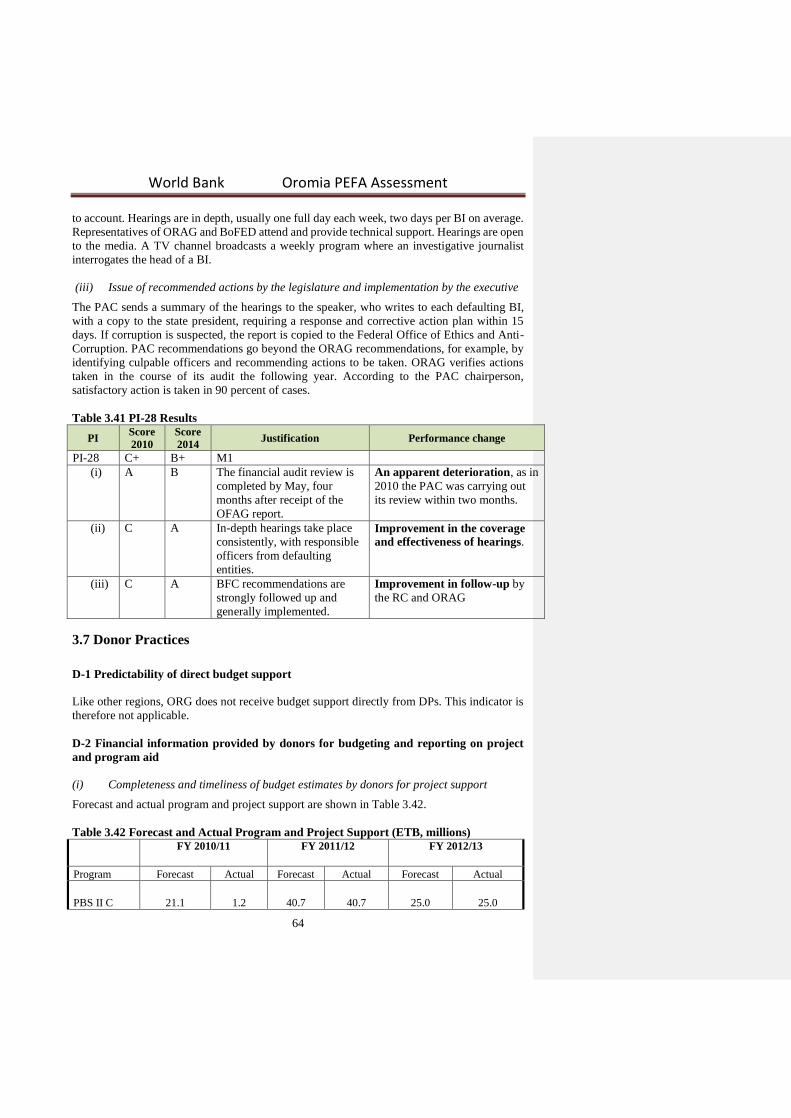
World Bank Oromia PEFA Assessment
64
to account. Hearings are in depth, usually one full day each week, two days per BI on average.
Representatives of ORAG and BoFED attend and provide technical support. Hearings are open
to the media. A TV channel broadcasts a weekly program where an investigative journalist
interrogates the head of a BI.
(iii) Issue of recommended actions by the legislature and implementation by the executive
The PAC sends a summary of the hearings to the speaker, who writes to each defaulting BI,
with a copy to the state president, requiring a response and corrective action plan within 15
days. If corruption is suspected, the report is copied to the Federal Office of Ethics and Anti-
Corruption. PAC recommendations go beyond the ORAG recommendations, for example, by
identifying culpable officers and recommending actions to be taken. ORAG verifies actions
taken in the course of its audit the following year. According to the PAC chairperson,
satisfactory action is taken in 90 percent of cases.
Table 3.41 PI-28 Results
PI Score
2010 Score
2014 Justification Performance change
PI-28 C+ B+ M1
(i) A B The financial audit review is
completed by May, four
months after receipt of the
OFAG report.
An apparent deterioration, as in
2010 the PAC was carrying out
its review within two months.
(ii) C A In-depth hearings take place
consistently, with responsible
officers from defaulting
entities.
Improvement in the coverage
and effectiveness of hearings.
(iii) C A BFC recommendations are
strongly followed up and
generally implemented.
Improvement in follow-up by
the RC and ORAG
3.7 Donor Practices
D-1 Predictability of direct budget support
Like other regions, ORG does not receive budget support directly from DPs. This indicator is
therefore not applicable.
D-2 Financial information provided by donors for budgeting and reporting on project
and program aid
(i) Completeness and timeliness of budget estimates by donors for project support
Forecast and actual program and project support are shown in Table 3.42.
Table 3.42 Forecast and Actual Program and Project Support (ETB, millions)
FY 2010/11
FY 2011/12
FY 2012/13
Program Forecast Actual Forecast Actual Forecast Actual
PBS II C 21.1 1.2 40.7 40.7 25.0 25.0
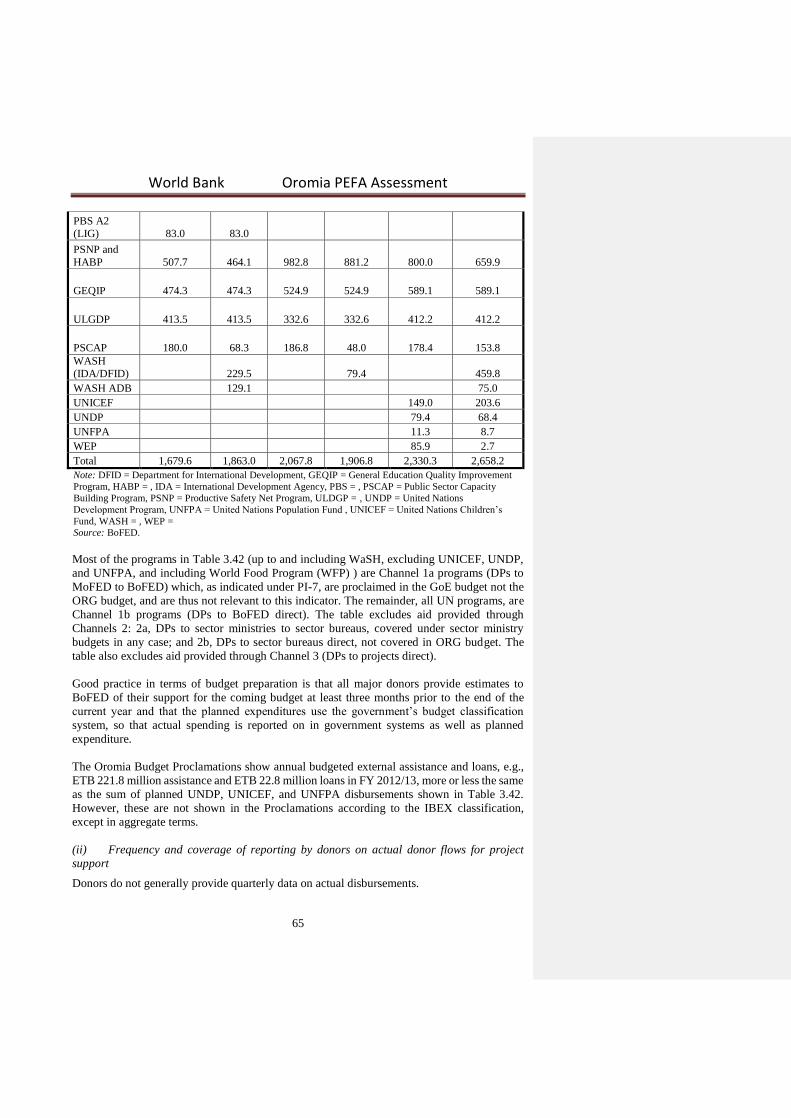
World Bank Oromia PEFA Assessment
65
PBS A2
(LIG) 83.0 83.0
PSNP and
HABP 507.7 464.1 982.8 881.2 800.0 659.9
GEQIP 474.3 474.3 524.9 524.9 589.1 589.1
ULGDP 413.5 413.5 332.6 332.6 412.2 412.2
PSCAP 180.0 68.3 186.8 48.0 178.4 153.8 WASH
(IDA/DFID) 229.5 79.4 459.8
WASH ADB 129.1 75.0
UNICEF 149.0 203.6
UNDP 79.4 68.4
UNFPA 11.3 8.7
WEP 85.9 2.7
Total 1,679.6 1,863.0 2,067.8 1,906.8 2,330.3 2,658.2
Note: DFID = Department for International Development, GEQIP = General Education Quality Improvement
Program, HABP = , IDA = International Development Agency, PBS = , PSCAP = Public Sector Capacity
Building Program, PSNP = Productive Safety Net Program, ULDGP = , UNDP = United Nations
Development Program, UNFPA = United Nations Population Fund , UNICEF = United Nations Children’s
Fund, WASH = , WEP =
Source: BoFED.
Most of the programs in Table 3.42 (up to and including WaSH, excluding UNICEF, UNDP,
and UNFPA, and including World Food Program (WFP) ) are Channel 1a programs (DPs to
MoFED to BoFED) which, as indicated under PI-7, are proclaimed in the GoE budget not the
ORG budget, and are thus not relevant to this indicator. The remainder, all UN programs, are
Channel 1b programs (DPs to BoFED direct). The table excludes aid provided through
Channels 2: 2a, DPs to sector ministries to sector bureaus, covered under sector ministry
budgets in any case; and 2b, DPs to sector bureaus direct, not covered in ORG budget. The
table also excludes aid provided through Channel 3 (DPs to projects direct).
Good practice in terms of budget preparation is that all major donors provide estimates to
BoFED of their support for the coming budget at least three months prior to the end of the
current year and that the planned expenditures use the government’s budget classification
system, so that actual spending is reported on in government systems as well as planned
expenditure.
The Oromia Budget Proclamations show annual budgeted external assistance and loans, e.g.,
ETB 221.8 million assistance and ETB 22.8 million loans in FY 2012/13, more or less the same
as the sum of planned UNDP, UNICEF, and UNFPA disbursements shown in Table 3.42.
However, these are not shown in the Proclamations according to the IBEX classification,
except in aggregate terms.
(ii) Frequency and coverage of reporting by donors on actual donor flows for project
support
Donors do not generally provide quarterly data on actual disbursements.
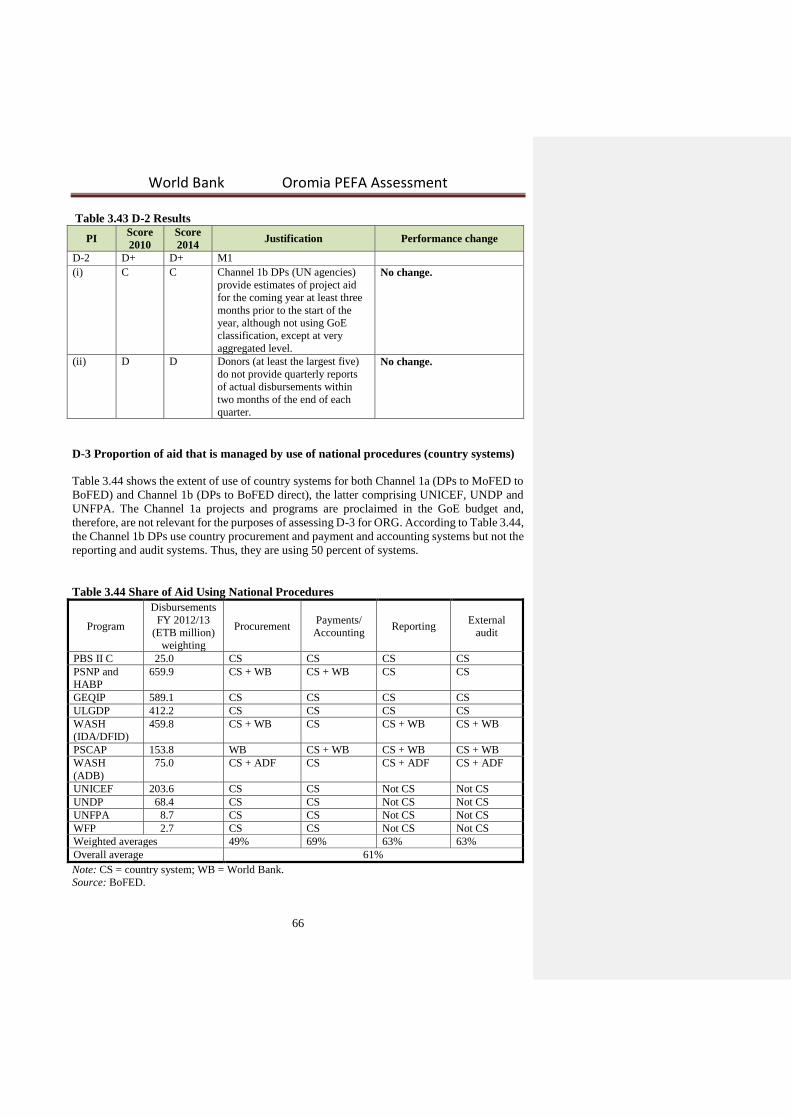
World Bank Oromia PEFA Assessment
66
Table 3.43 D-2 Results
PI Score
2010 Score
2014 Justification Performance change
D-2 D+ D+ M1 (i) C C Channel 1b DPs (UN agencies)
provide estimates of project aid
for the coming year at least three
months prior to the start of the
year, although not using GoE
classification, except at very
aggregated level.
No change.
(ii) D D Donors (at least the largest five)
do not provide quarterly reports
of actual disbursements within
two months of the end of each
quarter.
No change.
D-3 Proportion of aid that is managed by use of national procedures (country systems)
Table 3.44 shows the extent of use of country systems for both Channel 1a (DPs to MoFED to
BoFED) and Channel 1b (DPs to BoFED direct), the latter comprising UNICEF, UNDP and
UNFPA. The Channel 1a projects and programs are proclaimed in the GoE budget and,
therefore, are not relevant for the purposes of assessing D-3 for ORG. According to Table 3.44,
the Channel 1b DPs use country procurement and payment and accounting systems but not the
reporting and audit systems. Thus, they are using 50 percent of systems.
Table 3.44 Share of Aid Using National Procedures
Program
Disbursements
FY 2012/13
(ETB million)
weighting
Procurement Payments/
Accounting Reporting
External
audit
PBS II C 25.0 CS CS CS CS PSNP and
HABP 659.9 CS + WB CS + WB CS CS
GEQIP 589.1 CS CS CS CS ULGDP 412.2 CS CS CS CS WASH
(IDA/DFID) 459.8 CS + WB CS CS + WB CS + WB
PSCAP 153.8 WB CS + WB CS + WB CS + WB WASH
(ADB) 75.0 CS + ADF CS CS + ADF CS + ADF
UNICEF 203.6 CS CS Not CS Not CS UNDP 68.4 CS CS Not CS Not CS UNFPA 8.7 CS CS Not CS Not CS WFP 2.7 CS CS Not CS Not CS Weighted averages 49% 69% 63% 63% Overall average 61%
Note: CS = country system; WB = World Bank.
Source: BoFED.

World Bank Oromia PEFA Assessment
67
In terms of magnitudes, the relevant amounts of aid are those delivered through Channel 1b
(DPs direct to BoFED), Channel 2b (aid delivered directly to sector bureaus by DPs), and
Channel 3 (aid directly to projects, which have a service delivery agreement with sector
bureaus). The amount delivered through Channel 1b is very small (ETB 280 million, as shown
in Table 3.44); 50 percent of this uses government systems, as noted. The total amount
delivered through Channel 2b and 3 is not known (as indicated under PI-7 (ii)). None of it uses
country procedures.
About 33 percent of the block grants to BoFED from MoFED consist of the PBS budget support
provided by DPs, based on the 32.5 percent of the block grant allocated to Oromia (table 9,
GoE PEFA report). The total block grant to BoFED (excluding the MDG grant) was ETB
11,575 million in FY 2012/13 (Table 3.1 in this report under the HLG-1 PI), so the DP share
of this was ETB 3,762 million. By definition, country PFM systems are used in spending
budget support.
The sizeable amount of the DP share indicates that at least 50 percent of DP support is spent
using ORG systems, even under very optimistic projections of Channel 2b and Channel 3 aid.
Table 3.45 D-3 Results
PI Score
2010 Score
2014 Justification Performance change
D-3 D At least
C At least 50% of aid funds are
managed through national
procedures, due to the large amount
of PBS aid that is incorporated in the
block grant.
No change.a The
adjustment for the PBS
component of the block
grant was not made in the
2010 assessment, so the D
rating is probably an
underscore. a. MoFED indicated to the assessment team that this adjustment was valid, though in principle the MoFED and
DP contributions to the block grant are comingled and cannot be distinguished separately.
4. Government Reform Process
4.1 Recent and Ongoing Reforms
All government reforms, at all levels, are planned and managed within the overall national
plan, the Growth and Transformation Plan (GTP), a common framework for development and
achievement of the Millennium Development Goals (MDGs) in Ethiopia. The GTP (FY
2010/11-2014/15) was issued in November 2010, with the objectives of: (1) attaining high
growth within a stable macroeconomic framework; (2) achieving the MDGs in the social
sector; and (3) establishing a stable democratic and developmental state.
The GTP does not address issues relating to public financial management (PFM), with the
exception of strengthening financial audit. While the government has plans to continue reform
processes in budget formulation and execution, with the ongoing technical assistance of
development partners, they do not form part of the GTP.
The Public Sector Capacity Building Program (PSCAP) started in 2005 under the Ministry of
Capacity Development. It comprises six sub-programs: the Civil Service Reform Program
(CSRP); District Level Decentralization; Justice; Tax and Customs; Urban Management; and
Information and Communication Technology. The first phase ended in December 2012.
PSCAP II (FY 2013-2017) is funded by GOE, IDA, EU, DFID and IDC (USD 145 million). It
World Bank Oromia PEFA Assessment
68
has links with the Promoting Basic Services program (PBS III) and the ongoing Democratic
Institutions Program (DIP), coordinated by UNDP. The second phase of PSCAP it is planned
to forge strong synergies with these complementary actions or programs to ensure maximum
impact, avoid duplication and reduce transaction costs.
Ethiopia’s indicator for government effectiveness has shown trends of improvement over the
last seven years as a result of Public Sector Reform (PSR) efforts (World Bank April 2013).
The Civil Service Reform Program (CSRP) has five sub-programs, including the Expenditure
Management and Control Program (EMCP), which is implemented by MoFED. It covers all
phases of budget management of expenditure, and is divided into 12 projects; legal framework;
procurement; budget preparation; expenditure planning; accounts; internal audit; cash
management; IFMIS; property management; external audit; accounts and audit profession; and
financial transparency and accountability. The external audit project is managed by OFAG and
the other 11 projects are implemented by MoFED.
Ethiopia’s PBS Program (formerly the Protection of Basic Services Program) is a nationwide
program that aims to contribute to: (1) expanding access to basic services - education, health,
water supply, sanitation, rural roads and agricultural extension services; and (2) improving the
quality of these services. It funds block grants that support adequate staffing and recurrent
expenditures for these services, accompanied by measures to promote transparency and
accountability at the woreda level. It has also helped to strengthen the decentralized public
financial management system and supports local civil society organizations that improve
opportunities for citizens to provide feedback on service delivery to local administrators and
service providers. It serves the whole Ethiopian population, and has contributed to large gains
in human development and Ethiopia’s rapid progress toward many of the MDGs.
The PBS was established in 2006 and is now in its third phase, funded by GOE, the World
Bank, the ADB, DFID-UK, the EU, Austria and Italy. The social accountability component is
being supported by DFID, KfW (Germany), Irish Aid, and the EU. A PBS Secretariat was
established by the donors to facilitate and coordinate the dialogue on the program and its
implementation, and provide analytical support. MoFED is the implementing agency for the
program, coordinated by the Channel One Programs Coordinating Unit (COPCU) and the PBS
Secretariat (PBS II ICR, 2013).
4.2 Institutional Factors Supporting Reform planning and
Implementation
Government leadership and ownership of its PFM reforms is high. Most PFM reforms are
implemented within the Expenditure Management and Control Program (EMCP), coordinated
by the EMCP Coordinating Unit in MoFED. Reforms at the federal level are models for
adoption at the regional level.
The EMCP started in FY 2006/07 (EFY 1999) and is managed by a Steering Committee chaired
by the Minister of Finance, and including senior GOE officers and representatives of DPs.22
The program is divided into 12 projects, each of which has a designated Project Manager.
Performance is monitored against a rolling three-year action plan. The current action plan lists
Fur 22 MoFED (2011), Expenditure Management and Control Reform Program: Tasks and Implementation , 3rd
edition, July 2011
World Bank Oromia PEFA Assessment
69
56 activities, their implementation by year, and responsible bodies (MoFED Directorates, the
PPA, regional and woreda administrations, etc.).23 Progress is monitored weekly by project
managers, monthly by the EMCP Coordinating Unit in MoFED, and quarterly by the high level
Steering Committee. Progress reports are used to revise and update the action plan. External
diagnostic studies such as the CPAR and PEFA assessments are also major sources of data.
The Development Assistance Group of donor partners (DAG) provides harmonized support
and funding to the GTP, promotes the OECD DAC harmonization agenda, strengthens
government monitoring and evaluation systems, and provides strategic and coordinated support
to focus areas of the GTP, including education and gender mainstreaming. For PFM there is a
specialized Donor Group of interested donors, which at the time of the assessment was co-
chaired by DFID and the World Bank. The Joint Budget and Aid Reviews are a further
monitoring and coordinating mechanism. This is a platform for federal and regional
governments and donor partners to review the reform plans and achievements and to resolve
issue
Fur 23 MoFED/EMCP (2012) EMCP Action Plan for 2013-2015, November
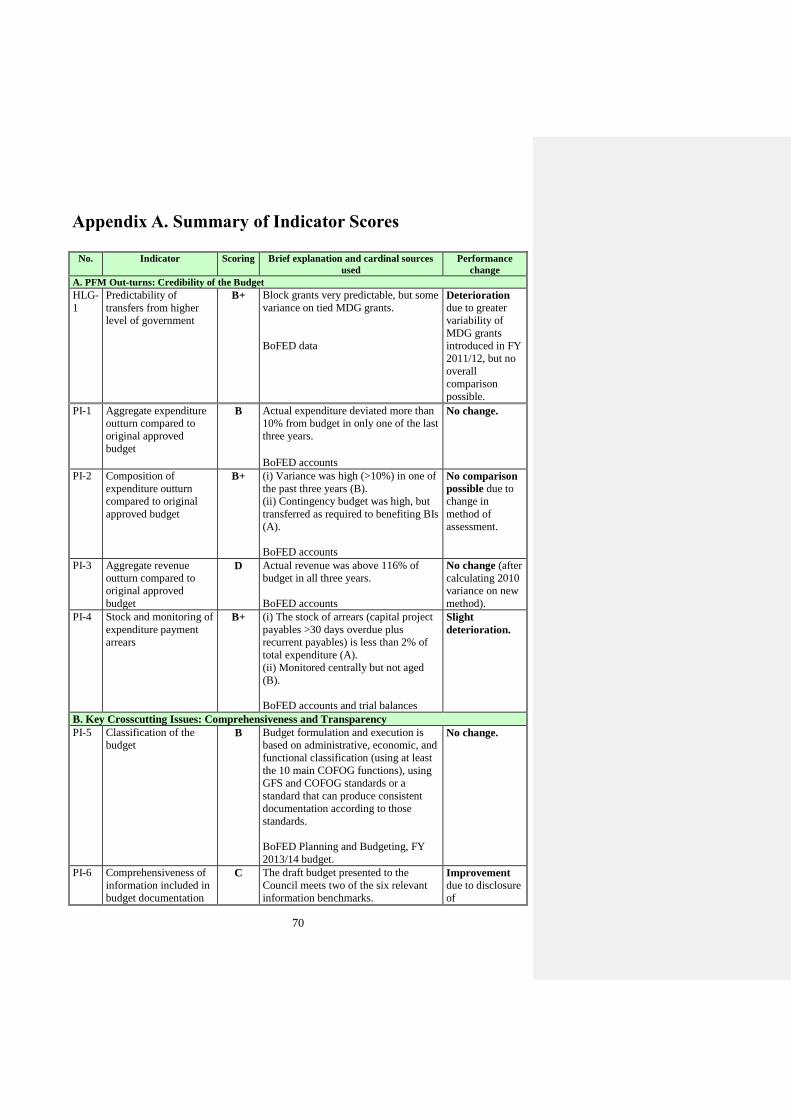
70
Appendix A. Summary of Indicator Scores
No. Indicator Scoring Brief explanation and cardinal sources
used
Performance
change
A. PFM Out-turns: Credibility of the Budget
HLG-
1
Predictability of
transfers from higher
level of government
B+ Block grants very predictable, but some
variance on tied MDG grants.
BoFED data
Deterioration due to greater
variability of
MDG grants
introduced in FY
2011/12, but no
overall
comparison
possible.
PI-1 Aggregate expenditure
outturn compared to
original approved
budget
B Actual expenditure deviated more than
10% from budget in only one of the last
three years. BoFED accounts
No change.
PI-2 Composition of
expenditure outturn
compared to original
approved budget
B+ (i) Variance was high (>10%) in one of
the past three years (B).
(ii) Contingency budget was high, but
transferred as required to benefiting BIs
(A).
BoFED accounts
No comparison
possible due to
change in
method of
assessment.
PI-3 Aggregate revenue
outturn compared to
original approved
budget
D Actual revenue was above 116% of
budget in all three years.
BoFED accounts
No change (after
calculating 2010
variance on new
method).
PI-4 Stock and monitoring of
expenditure payment
arrears
B+ (i) The stock of arrears (capital project
payables >30 days overdue plus
recurrent payables) is less than 2% of
total expenditure (A).
(ii) Monitored centrally but not aged
(B).
BoFED accounts and trial balances
Slight
deterioration.
B. Key Crosscutting Issues: Comprehensiveness and Transparency PI-5 Classification of the
budget B Budget formulation and execution is
based on administrative, economic, and
functional classification (using at least
the 10 main COFOG functions), using
GFS and COFOG standards or a
standard that can produce consistent
documentation according to those
standards.
BoFED Planning and Budgeting, FY
2013/14 budget.
No change.
PI-6 Comprehensiveness of
information included in
budget documentation
C The draft budget presented to the
Council meets two of the six relevant
information benchmarks.
Improvement
due to disclosure
of

World Bank Oromia PEFA Assessment
71
No. Indicator Scoring Brief explanation and cardinal sources
used
Performance
change
BoFED Planning and Budgeting, FY
2013/14 budget.
macroeconomic
assumptions and
budget
implications of
new initiatives
PI-7 Extent of unreported
government operations D+ (i) Most autonomous bodies are
included in the budget and accounts,
but not some noncommercial bodies
supervised by OPESA, whose
expenditures constitute 2.6% of total
expenditure (B).
(ii) Lack of information on Channel 2
and Channel 3: aid not brought into the
budget and accounts (D).
BoFED, Oromia PPESA, ORA
No change.
PI-8 Transparency of
intergovernmental fiscal
relations
B+ (i) 60% of the total grants are
unearmarked and allocated on a
formula basis. The rest are specific
grants, which are individually
negotiated (B).
(ii) Zones and woredas are provided
reliable information on their grant
ceilings before they complete their
budgets (B).
(iii) Fiscal data is collected from all
zones and woredas using the same chart
of accounts as at higher levels and
BoFED consolidates this into annual
reports within six months of the end of
the FY (A).
BoFED, East Shewa Zone ZoFED,
Lomie Woreda
No change.
PI-9 Oversight of aggregate
fiscal risk from other
public sector entities.
C+ (i) Extra-budgetary AGAs and PEs
submit fiscal reports to the Oromia
PPESA at least annually, but a
consolidated overview of fiscal risk is
missing (C).
(ii) Zones and woredas cannot generate
fiscal liabilities (A).
BoFED, Oromia PPESA, Oromia Road
Authority
Performance
not comparable due a change in
scope under (i),
as number of
enterprises
increased to
seven from one.
PI-10 Public access to key
fiscal information C The government makes available to the
public three of the applicable seven
elements of information (C).
BoFED Planning and Budgeting,
Accounts, ORAG, PPA, BoE, BoH
Improvement: two extra
elements made
available to
public.
C. Budget Cycle C (i) Policy-Based Budgeting
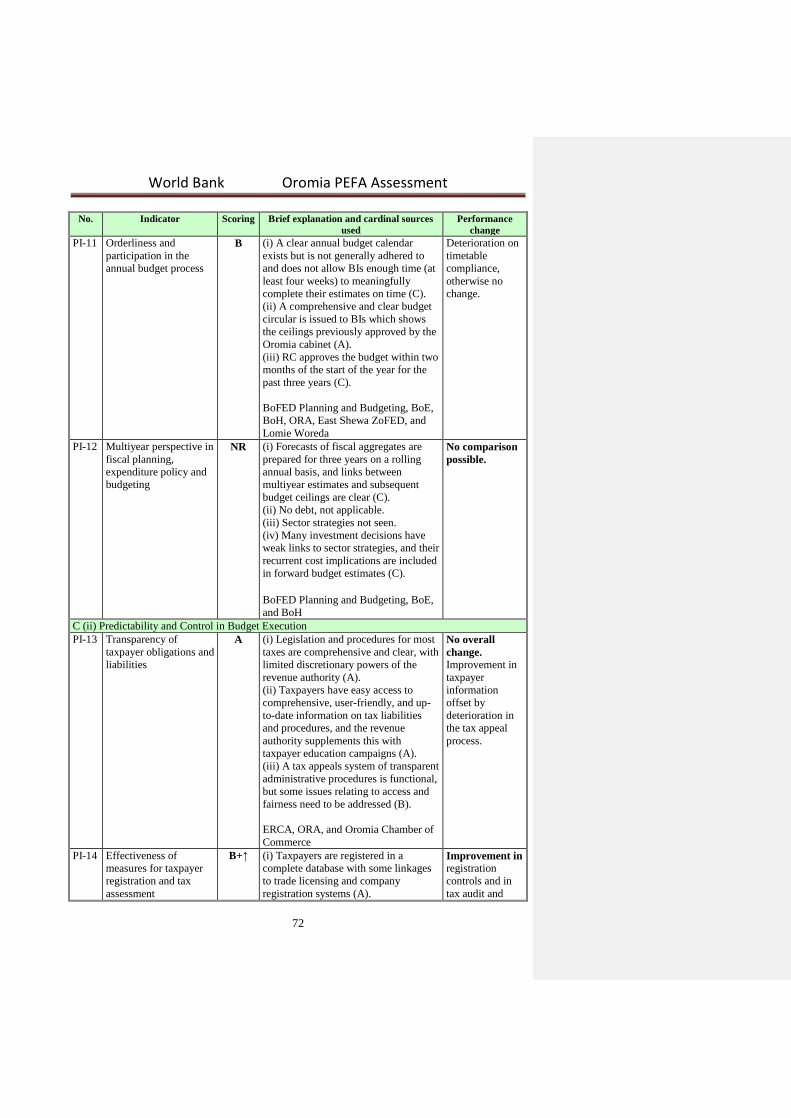
World Bank Oromia PEFA Assessment
72
No. Indicator Scoring Brief explanation and cardinal sources
used
Performance
change
PI-11 Orderliness and
participation in the
annual budget process
B (i) A clear annual budget calendar
exists but is not generally adhered to
and does not allow BIs enough time (at
least four weeks) to meaningfully
complete their estimates on time (C).
(ii) A comprehensive and clear budget
circular is issued to BIs which shows
the ceilings previously approved by the
Oromia cabinet (A).
(iii) RC approves the budget within two
months of the start of the year for the
past three years (C).
BoFED Planning and Budgeting, BoE,
BoH, ORA, East Shewa ZoFED, and
Lomie Woreda
Deterioration on
timetable
compliance,
otherwise no
change.
PI-12 Multiyear perspective in
fiscal planning,
expenditure policy and
budgeting
NR (i) Forecasts of fiscal aggregates are
prepared for three years on a rolling
annual basis, and links between
multiyear estimates and subsequent
budget ceilings are clear (C). (ii) No debt, not applicable. (iii) Sector strategies not seen. (iv) Many investment decisions have
weak links to sector strategies, and their
recurrent cost implications are included
in forward budget estimates (C).
BoFED Planning and Budgeting, BoE,
and BoH
No comparison
possible.
C (ii) Predictability and Control in Budget Execution
PI-13 Transparency of
taxpayer obligations and
liabilities
A (i) Legislation and procedures for most
taxes are comprehensive and clear, with
limited discretionary powers of the
revenue authority (A).
(ii) Taxpayers have easy access to
comprehensive, user-friendly, and up-
to-date information on tax liabilities
and procedures, and the revenue
authority supplements this with
taxpayer education campaigns (A).
(iii) A tax appeals system of transparent
administrative procedures is functional,
but some issues relating to access and
fairness need to be addressed (B).
ERCA, ORA, and Oromia Chamber of
Commerce
No overall
change. Improvement in
taxpayer
information
offset by
deterioration in
the tax appeal
process.
PI-14 Effectiveness of
measures for taxpayer
registration and tax
assessment
B+↑ (i) Taxpayers are registered in a
complete database with some linkages
to trade licensing and company
registration systems (A).
Improvement in registration
controls and in
tax audit and
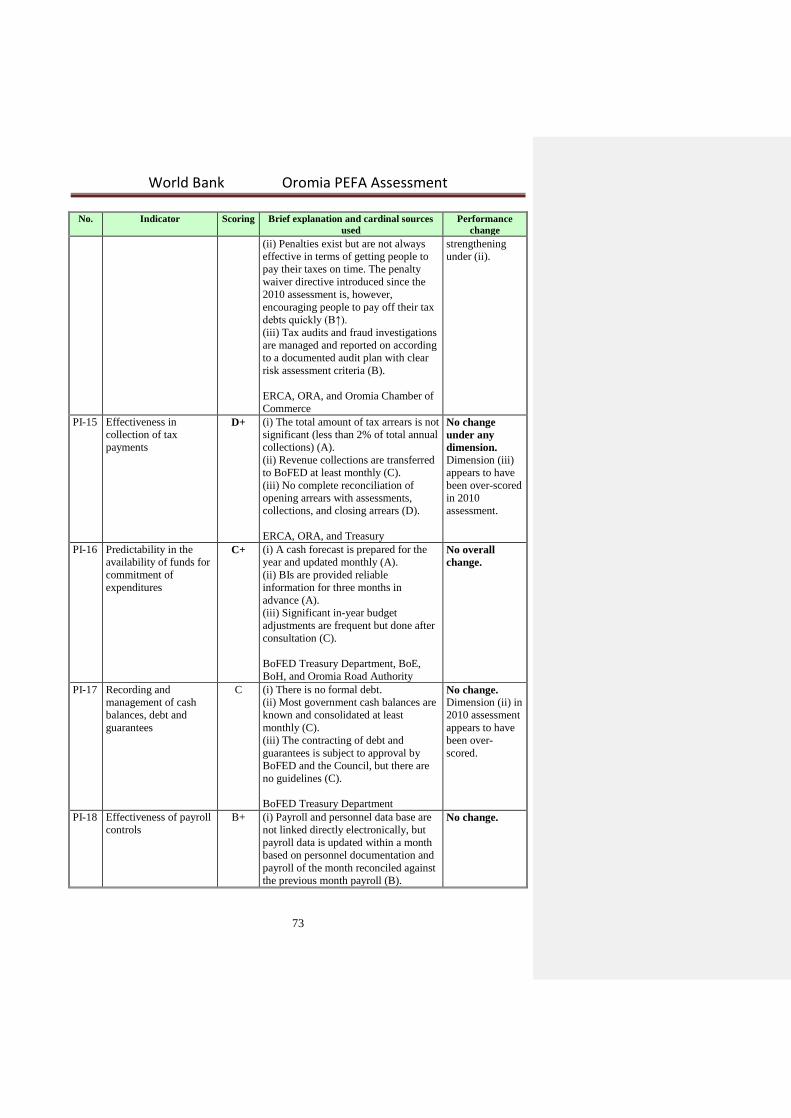
World Bank Oromia PEFA Assessment
73
No. Indicator Scoring Brief explanation and cardinal sources
used
Performance
change
(ii) Penalties exist but are not always
effective in terms of getting people to
pay their taxes on time. The penalty
waiver directive introduced since the
2010 assessment is, however,
encouraging people to pay off their tax
debts quickly (B↑).
(iii) Tax audits and fraud investigations
are managed and reported on according
to a documented audit plan with clear
risk assessment criteria (B).
ERCA, ORA, and Oromia Chamber of
Commerce
strengthening
under (ii).
PI-15 Effectiveness in
collection of tax
payments
D+ (i) The total amount of tax arrears is not
significant (less than 2% of total annual
collections) (A).
(ii) Revenue collections are transferred
to BoFED at least monthly (C).
(iii) No complete reconciliation of
opening arrears with assessments,
collections, and closing arrears (D).
ERCA, ORA, and Treasury
No change
under any
dimension. Dimension (iii)
appears to have
been over-scored
in 2010
assessment.
PI-16 Predictability in the
availability of funds for
commitment of
expenditures
C+ (i) A cash forecast is prepared for the
year and updated monthly (A).
(ii) BIs are provided reliable
information for three months in
advance (A).
(iii) Significant in-year budget
adjustments are frequent but done after
consultation (C).
BoFED Treasury Department, BoE,
BoH, and Oromia Road Authority
No overall
change.
PI-17 Recording and
management of cash
balances, debt and
guarantees
C (i) There is no formal debt.
(ii) Most government cash balances are
known and consolidated at least
monthly (C).
(iii) The contracting of debt and
guarantees is subject to approval by
BoFED and the Council, but there are
no guidelines (C).
BoFED Treasury Department
No change. Dimension (ii) in
2010 assessment
appears to have
been over-
scored.
PI-18 Effectiveness of payroll
controls
B+ (i) Payroll and personnel data base are
not linked directly electronically, but
payroll data is updated within a month
based on personnel documentation and
payroll of the month reconciled against
the previous month payroll (B).
No change.
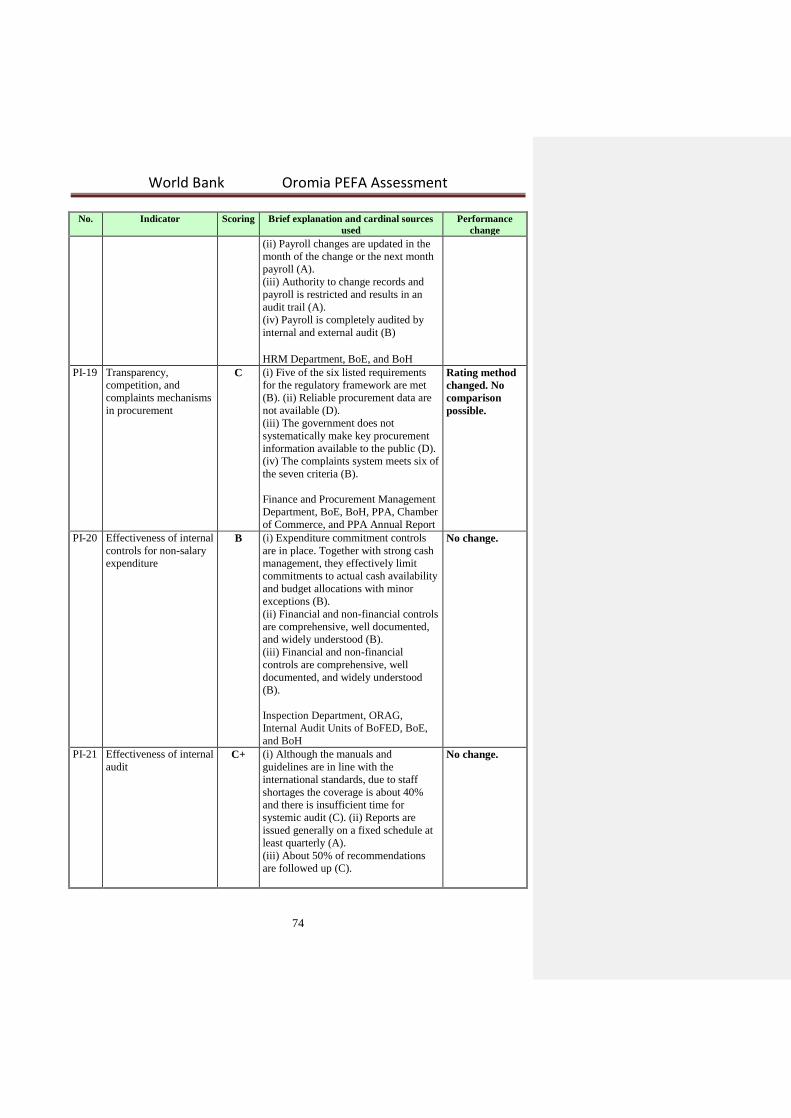
World Bank Oromia PEFA Assessment
74
No. Indicator Scoring Brief explanation and cardinal sources
used
Performance
change
(ii) Payroll changes are updated in the
month of the change or the next month
payroll (A). (iii) Authority to change records and
payroll is restricted and results in an
audit trail (A). (iv) Payroll is completely audited by
internal and external audit (B) HRM Department, BoE, and BoH
PI-19 Transparency,
competition, and
complaints mechanisms
in procurement
C (i) Five of the six listed requirements
for the regulatory framework are met
(B). (ii) Reliable procurement data are
not available (D).
(iii) The government does not
systematically make key procurement
information available to the public (D).
(iv) The complaints system meets six of
the seven criteria (B).
Finance and Procurement Management
Department, BoE, BoH, PPA, Chamber
of Commerce, and PPA Annual Report
Rating method
changed. No
comparison
possible.
PI-20 Effectiveness of internal
controls for non-salary
expenditure
B (i) Expenditure commitment controls
are in place. Together with strong cash
management, they effectively limit
commitments to actual cash availability
and budget allocations with minor
exceptions (B).
(ii) Financial and non-financial controls
are comprehensive, well documented,
and widely understood (B).
(iii) Financial and non-financial
controls are comprehensive, well
documented, and widely understood
(B).
Inspection Department, ORAG,
Internal Audit Units of BoFED, BoE,
and BoH
No change.
PI-21 Effectiveness of internal
audit C+ (i) Although the manuals and
guidelines are in line with the
international standards, due to staff
shortages the coverage is about 40%
and there is insufficient time for
systemic audit (C). (ii) Reports are
issued generally on a fixed schedule at
least quarterly (A).
(iii) About 50% of recommendations
are followed up (C).
No change.

World Bank Oromia PEFA Assessment
75
No. Indicator Scoring Brief explanation and cardinal sources
used
Performance
change
Inspection Department, ORAG,
Internal Audit Units of BoFED, BoE,
and BoH
C (iii) Accounting, Recording, and Reporting
PI-22 Accounts
reconciliations B (i) Bank accounts are reconciled on a
monthly basis for the majority of
treasury bank accounts within four
weeks from the end of the month (B).
(ii) Suspense accounts and advances are
reconciled at least annually and only a
few balances are carried forward to the
following year. Balances are mainly
attributable to previous years (B).
BoFED accounts
(i) Some
deterioration of
performance.
PI-23 Availability of
information on
resources received by
service delivery units
B Routine data collection provides
reliable information on resources
received by primary schools, health
centers, and health posts, both
resources paid in cash (GEQIP-
supported primary schools) and
resources received in kind (B). Annual
reports are compiled for the education
and health bureaus.
BoE and BoH
Improvement
due to (1) easier
tracking of
resources
provided to
primary schools
(due to GEQIP)
and (2)
submission of
annual reports to
education and
health bureaus.
PI-24 Quality and timeliness
of in-year budget
reports
C+ (i) Classification of data allows direct
comparison with the budget, but only at
the payment stage, not at commitment
stage (C).
(ii) Consolidated reports are prepared
quarterly and issued within eight weeks
of the end of the month (C).
(iii) There are some concerns about
data accuracy, but these do not
undermine their overall consistency or
usefulness (B).
BoFED accounts
No real change. 2010 assessment
did not take into
account delays in
consolidation.
PI-25 Quality and timeliness
of annual financial
statements
C+ (i) Financial statements are
comprehensive except that some extra-
budgetary funds and donor-funded
projects are not included (B).
(ii) The latest financial statements were
submitted six months after the end of
the fiscal year (A).
(iii) Financial statements are prepared
in line with government account
procedures, except some of the
reporting requirements are yet to be
fulfilled (C).
No change in
overall score. Significant
improvement in
timeliness of
annual accounts.
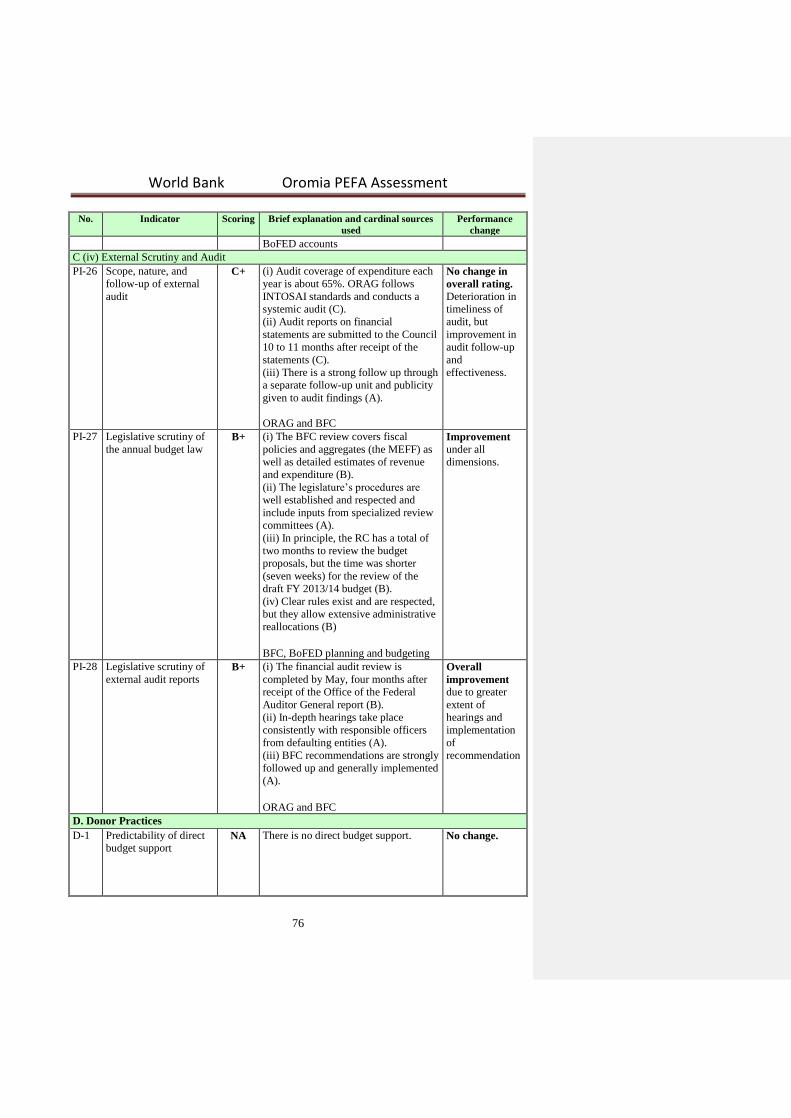
World Bank Oromia PEFA Assessment
76
No. Indicator Scoring Brief explanation and cardinal sources
used
Performance
change
BoFED accounts
C (iv) External Scrutiny and Audit
PI-26 Scope, nature, and
follow-up of external
audit
C+ (i) Audit coverage of expenditure each
year is about 65%. ORAG follows
INTOSAI standards and conducts a
systemic audit (C).
(ii) Audit reports on financial
statements are submitted to the Council
10 to 11 months after receipt of the
statements (C).
(iii) There is a strong follow up through
a separate follow-up unit and publicity
given to audit findings (A).
ORAG and BFC
No change in
overall rating. Deterioration in
timeliness of
audit, but
improvement in
audit follow-up
and
effectiveness.
PI-27 Legislative scrutiny of
the annual budget law B+ (i) The BFC review covers fiscal
policies and aggregates (the MEFF) as
well as detailed estimates of revenue
and expenditure (B). (ii) The legislature’s procedures are
well established and respected and
include inputs from specialized review
committees (A). (iii) In principle, the RC has a total of
two months to review the budget
proposals, but the time was shorter
(seven weeks) for the review of the
draft FY 2013/14 budget (B). (iv) Clear rules exist and are respected,
but they allow extensive administrative
reallocations (B) BFC, BoFED planning and budgeting
Improvement
under all
dimensions.
PI-28 Legislative scrutiny of
external audit reports B+ (i) The financial audit review is
completed by May, four months after
receipt of the Office of the Federal
Auditor General report (B). (ii) In-depth hearings take place
consistently with responsible officers
from defaulting entities (A). (iii) BFC recommendations are strongly
followed up and generally implemented
(A). ORAG and BFC
Overall
improvement due to greater
extent of
hearings and
implementation
of
recommendation
D. Donor Practices
D-1 Predictability of direct
budget support NA There is no direct budget support. No change.

World Bank Oromia PEFA Assessment
77
No. Indicator Scoring Brief explanation and cardinal sources
used
Performance
change
D-2 Financial information
provided by donors for
budgeting and reporting
on project and program
aid
D+ (i) Most large donors provide estimates
of project aid for the coming year at
least three months prior to the
classification (C).
(ii) Donors (at least the largest five) do
not provide quarterly reports of actual
disbursements within two months of the
end of each quarter (D).
BoFED finance
No change.
D-3 Proportion of aid that is
managed by use of
national procedures
At
least C
At least 50% of aid funds to the Oromia
State Government are managed through
country systems.
BoFED finance and donor partners
No change. The
adjustment for
the PBS
component of the
block grant was
not made in the
2010 assessment,
so the D rating is
probably an
underscore.
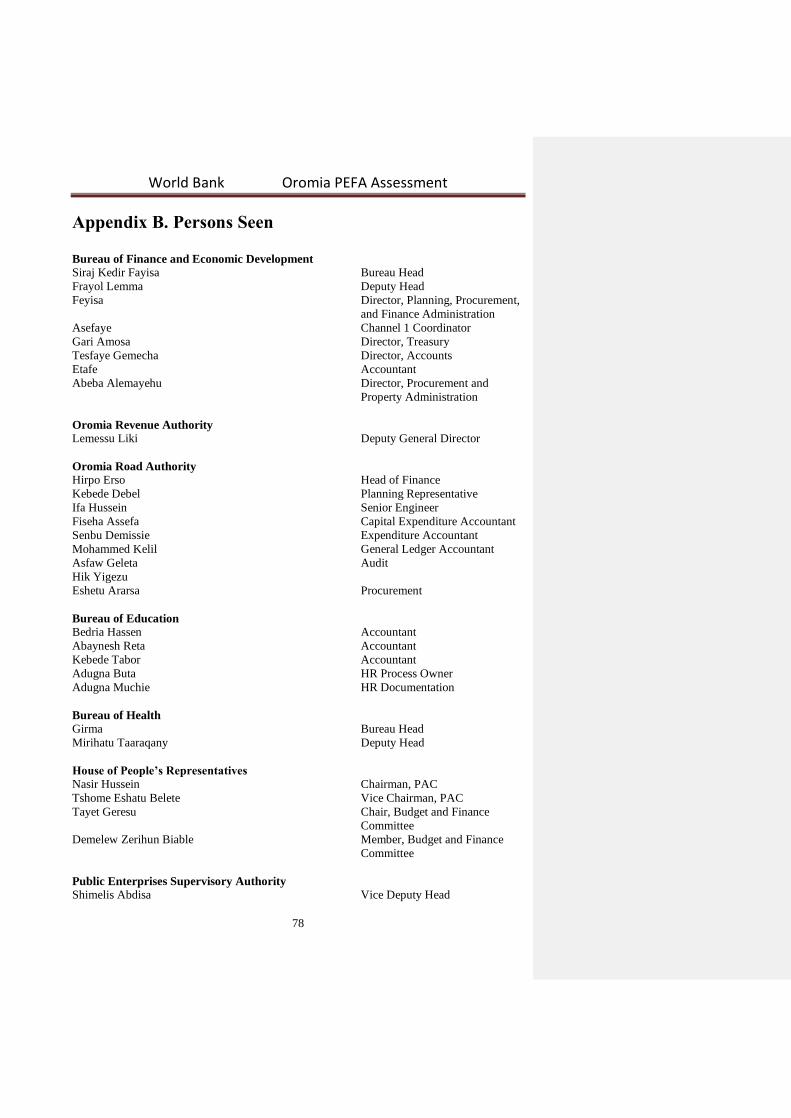
World Bank Oromia PEFA Assessment
78
Appendix B. Persons Seen
Bureau of Finance and Economic Development
Siraj Kedir Fayisa Bureau Head
Frayol Lemma Deputy Head
Feyisa Director, Planning, Procurement,
and Finance Administration
Asefaye Channel 1 Coordinator
Gari Amosa Director, Treasury
Tesfaye Gemecha Director, Accounts
Etafe Accountant
Abeba Alemayehu Director, Procurement and
Property Administration
Oromia Revenue Authority
Lemessu Liki Deputy General Director
Oromia Road Authority
Hirpo Erso Head of Finance
Kebede Debel Planning Representative
Ifa Hussein Senior Engineer
Fiseha Assefa Capital Expenditure Accountant
Senbu Demissie Expenditure Accountant
Mohammed Kelil General Ledger Accountant
Asfaw Geleta Audit
Hik Yigezu
Eshetu Ararsa Procurement
Bureau of Education
Bedria Hassen Accountant
Abaynesh Reta Accountant
Kebede Tabor Accountant
Adugna Buta HR Process Owner
Adugna Muchie HR Documentation
Bureau of Health
Girma Bureau Head
Mirihatu Taaraqany Deputy Head
House of People’s Representatives
Nasir Hussein Chairman, PAC
Tshome Eshatu Belete Vice Chairman, PAC
Tayet Geresu Chair, Budget and Finance
Committee
Demelew Zerihun Biable Member, Budget and Finance
Committee
Public Enterprises Supervisory Authority
Shimelis Abdisa Vice Deputy Head
World Bank Oromia PEFA Assessment
79
Office of the Regional Auditor General
Ayalech Ulfata Regional Auditor General
Oromia Chamber of Commerce
Franol Secretary
World Bank
Lead Economist and Sector Leader Lars Christian Moller
IMF
Resident Representative Jan Mikkelson
African Development Bank
Regional Financial Management Coordinator Francis Kanyerere Mkandawire
Senior Financial Management Officer Melaku Tadesse
European Union Delegation
Head of Section Jeroen Willems
Economist and PFM Specialist Ephraim Zewdie
Department for International Development, UK
Governance Adviser Ahmed Mohammed
Finance Manager John Moffat
USAID
Controller Frank Monticello
Supervisory Financial Analyst Kelemwa Kebede
Ireland Aid
Accountant and IT Officer Henock Abbay
World Bank Oromia PEFA Assessment
80
Appendix C. Documents Seen
IPE Global and B&M Development Consultants, Conducting an Assessment and Producing
Public Finance Management Institutionalized Training Strategic Action Plan, Oromia
Regional State, Final Report, Addis Ababa, April 2013.
Magalata Oromiyaa Proclamation no. 106/2005, “Proclamation to Define the Organization,
Duties, Conduct of the Members and Meeting Procedures of the Caffee.”
Magalata Oromiyaa Proclamation no. 154/2010, amending Proclamation 90/2005
“Reestablishing the Office of Oromia National Regional State Auditor General.”
Magalata Oromiyaa Proclamation no. 156/2010, “Financial Administrative Proclamation,”
per 2001 Revised Constitution of Oromia National Regional State, 2001.
Magalata Oromiyaa Proclamation no. 157/2010, “Proclamation on Public Procurement and
Property Administration.”
Ministry of Finance and Economic Development, Layperson’s Guide to the Public Budget
Process at Regional Level, A Prototype for Regions, Addis Ababa, August 2009.
Ministry of Finance and Economic Development, Oromia Regional Government PEFA
Assessment Report, amended by Proclamation 153/2009, Addis Ababa, October 2010.
Office of the President, Communication and Protocol Directorate, Oromiya Today, vol. 5, no.
4, December 2013.
Oromia Bureau of Finance and Economic Development, “Oromia in Brief,” Addis Ababa,
December 2012.
Oromia Bureau of Finance and Economic Development and Japan International Cooperation
Agency, Manual for Planning, Budgeting, Monitoring and Evaluation and Information
Management, Addis Ababa, September 2013
Websites:
www.oromiabofed.gov.et
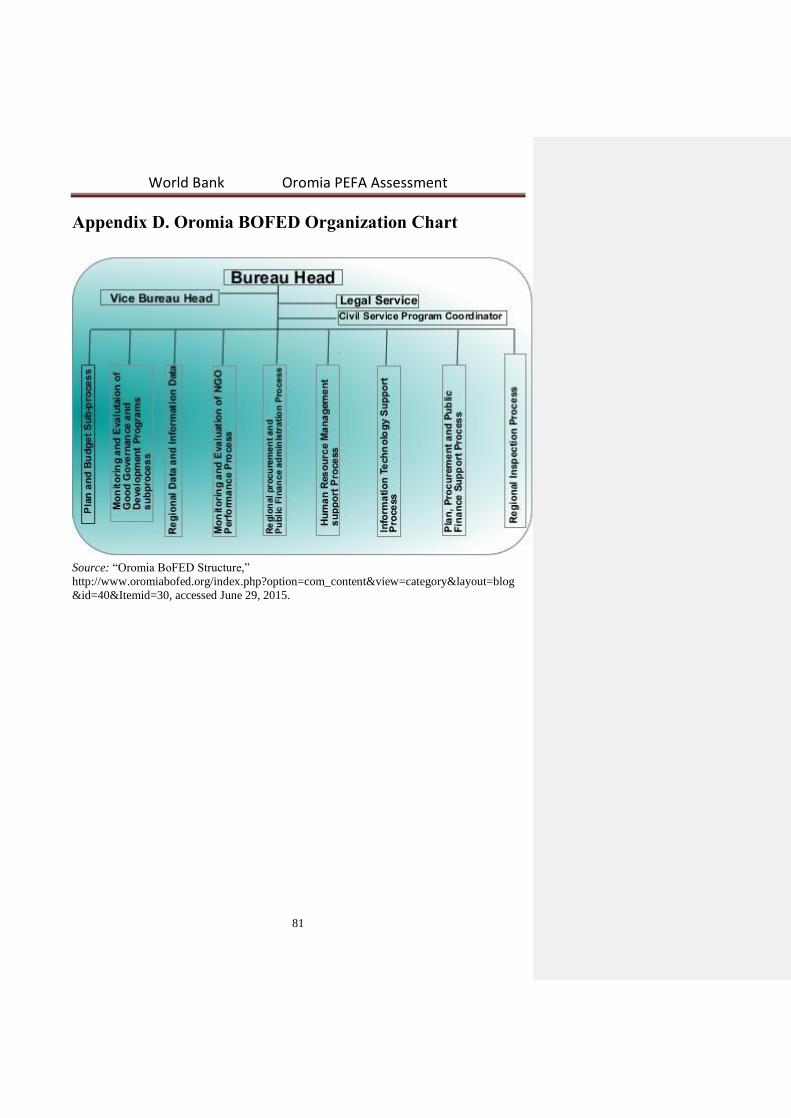
World Bank Oromia PEFA Assessment
81
Appendix D. Oromia BOFED Organization Chart
Source: “Oromia BoFED Structure,”
http://www.oromiabofed.org/index.php?option=com_content&view=category&layout=blog
&id=40&Itemid=30, accessed June 29, 2015.
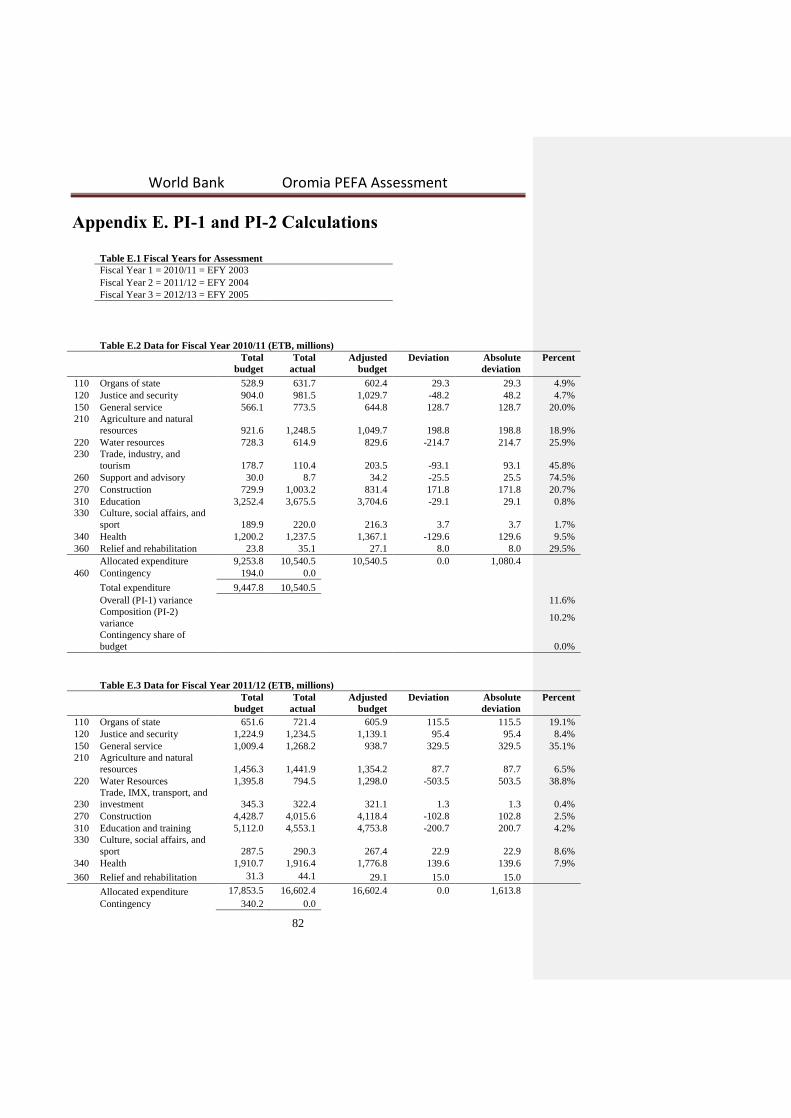
World Bank Oromia PEFA Assessment
82
Appendix E. PI-1 and PI-2 Calculations
Table E.1 Fiscal Years for Assessment
Fiscal Year 1 = 2010/11 = EFY 2003
Fiscal Year 2 = 2011/12 = EFY 2004
Fiscal Year 3 = 2012/13 = EFY 2005
Table E.2 Data for Fiscal Year 2010/11 (ETB, millions)
Total
budget
Total
actual
Adjusted
budget
Deviation Absolute
deviation
Percent
110 Organs of state 528.9 631.7 602.4 29.3 29.3 4.9%
120 Justice and security 904.0 981.5 1,029.7 -48.2 48.2 4.7%
150 General service 566.1 773.5 644.8 128.7 128.7 20.0%
210 Agriculture and natural
resources 921.6 1,248.5 1,049.7 198.8 198.8 18.9%
220 Water resources 728.3 614.9 829.6 -214.7 214.7 25.9%
230 Trade, industry, and
tourism 178.7 110.4 203.5 -93.1 93.1 45.8%
260 Support and advisory 30.0 8.7 34.2 -25.5 25.5 74.5%
270 Construction 729.9 1,003.2 831.4 171.8 171.8 20.7%
310 Education 3,252.4 3,675.5 3,704.6 -29.1 29.1 0.8%
330 Culture, social affairs, and
sport 189.9 220.0 216.3 3.7 3.7 1.7%
340 Health 1,200.2 1,237.5 1,367.1 -129.6 129.6 9.5%
360 Relief and rehabilitation 23.8 35.1 27.1 8.0 8.0 29.5%
Allocated expenditure 9,253.8 10,540.5 10,540.5 0.0 1,080.4
460 Contingency 194.0 0.0
Total expenditure 9,447.8 10,540.5
Overall (PI-1) variance 11.6%
Composition (PI-2)
variance 10.2%
Contingency share of
budget 0.0%
Table E.3 Data for Fiscal Year 2011/12 (ETB, millions)
Total
budget
Total
actual
Adjusted
budget
Deviation Absolute
deviation
Percent
110 Organs of state 651.6 721.4 605.9 115.5 115.5 19.1%
120 Justice and security 1,224.9 1,234.5 1,139.1 95.4 95.4 8.4%
150 General service 1,009.4 1,268.2 938.7 329.5 329.5 35.1%
210 Agriculture and natural
resources 1,456.3 1,441.9 1,354.2 87.7 87.7 6.5%
220 Water Resources 1,395.8 794.5 1,298.0 -503.5 503.5 38.8%
230
Trade, IMX, transport, and
investment 345.3 322.4 321.1 1.3 1.3 0.4%
270 Construction 4,428.7 4,015.6 4,118.4 -102.8 102.8 2.5%
310 Education and training 5,112.0 4,553.1 4,753.8 -200.7 200.7 4.2%
330 Culture, social affairs, and
sport 287.5 290.3 267.4 22.9 22.9 8.6%
340 Health 1,910.7 1,916.4 1,776.8 139.6 139.6 7.9%
360 Relief and rehabilitation 31.3 44.1 29.1 15.0 15.0
Allocated expenditure 17,853.5 16,602.4 16,602.4 0.0 1,613.8
Contingency 340.2 0.0
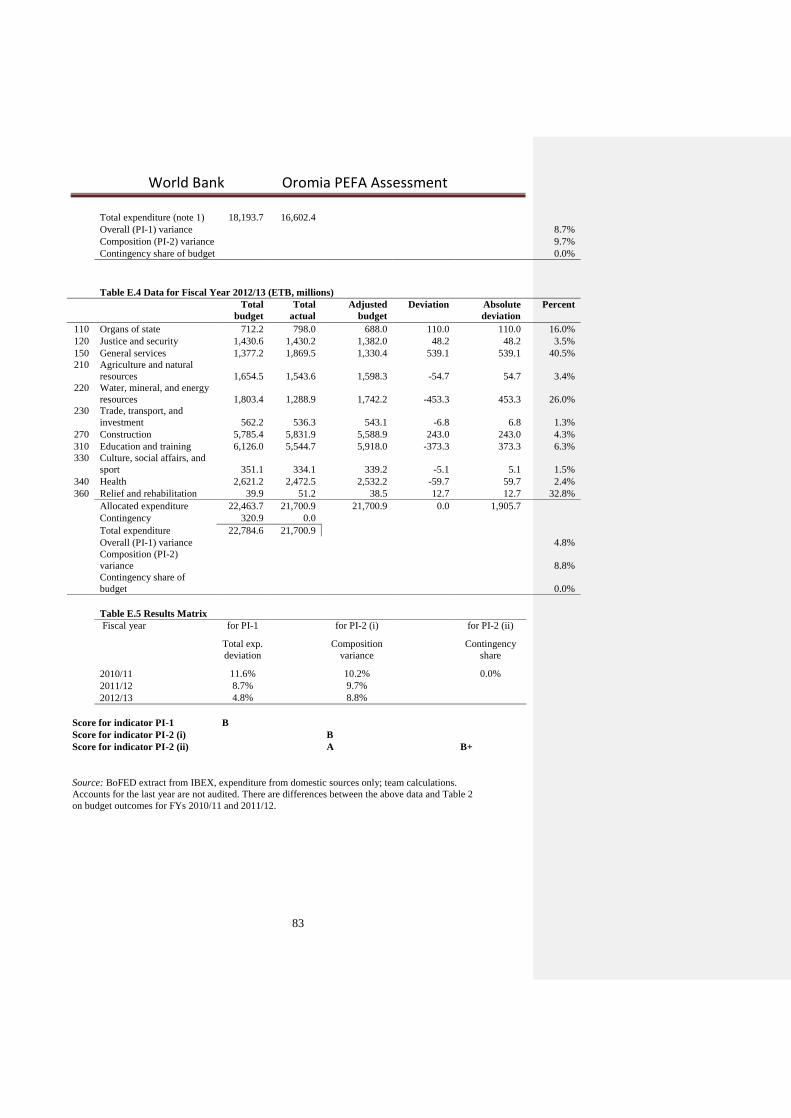
World Bank Oromia PEFA Assessment
83
Total expenditure (note 1) 18,193.7 16,602.4
Overall (PI-1) variance 8.7%
Composition (PI-2) variance 9.7%
Contingency share of budget 0.0%
Table E.4 Data for Fiscal Year 2012/13 (ETB, millions)
Total
budget
Total
actual
Adjusted
budget
Deviation Absolute
deviation
Percent
110 Organs of state 712.2 798.0 688.0 110.0 110.0 16.0%
120 Justice and security 1,430.6 1,430.2 1,382.0 48.2 48.2 3.5%
150 General services 1,377.2 1,869.5 1,330.4 539.1 539.1 40.5%
210 Agriculture and natural
resources 1,654.5 1,543.6 1,598.3 -54.7 54.7 3.4%
220 Water, mineral, and energy
resources 1,803.4 1,288.9 1,742.2 -453.3 453.3 26.0%
230 Trade, transport, and
investment 562.2 536.3 543.1 -6.8 6.8 1.3%
270 Construction 5,785.4 5,831.9 5,588.9 243.0 243.0 4.3%
310 Education and training 6,126.0 5,544.7 5,918.0 -373.3 373.3 6.3%
330 Culture, social affairs, and
sport 351.1 334.1 339.2 -5.1 5.1 1.5%
340 Health 2,621.2 2,472.5 2,532.2 -59.7 59.7 2.4%
360 Relief and rehabilitation 39.9 51.2 38.5 12.7 12.7 32.8%
Allocated expenditure 22,463.7 21,700.9 21,700.9 0.0 1,905.7
Contingency 320.9 0.0
Total expenditure 22,784.6 21,700.9
Overall (PI-1) variance 4.8%
Composition (PI-2)
variance 8.8%
Contingency share of
budget 0.0%
Table E.5 Results Matrix
Fiscal year for PI-1 for PI-2 (i) for PI-2 (ii)
Total exp.
deviation
Composition
variance
Contingency
share
2010/11 11.6% 10.2% 0.0%
2011/12 8.7% 9.7%
2012/13 4.8% 8.8%
Score for indicator PI-1 B
Score for indicator PI-2 (i) B
Score for indicator PI-2 (ii) A B+
Source: BoFED extract from IBEX, expenditure from domestic sources only; team calculations.
Accounts for the last year are not audited. There are differences between the above data and Table 2
on budget outcomes for FYs 2010/11 and 2011/12.
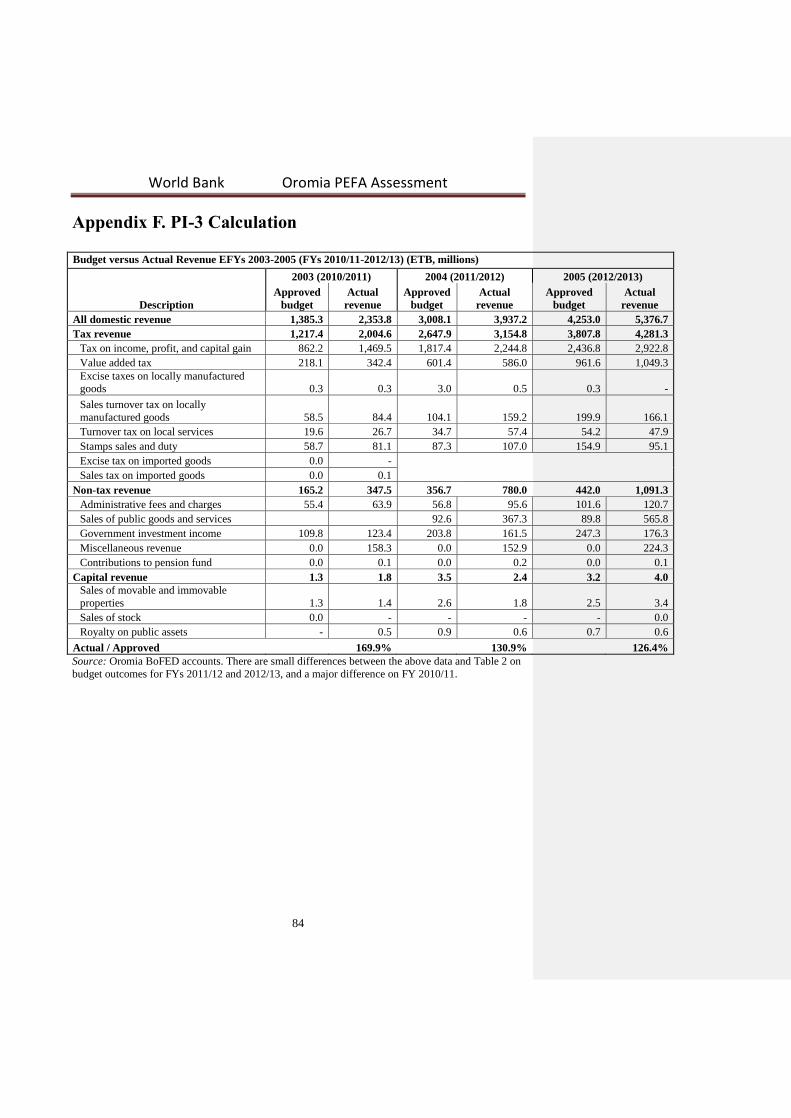
World Bank Oromia PEFA Assessment
84
Appendix F. PI-3 Calculation
Budget versus Actual Revenue EFYs 2003-2005 (FYs 2010/11-2012/13) (ETB, millions)
2003 (2010/2011) 2004 (2011/2012) 2005 (2012/2013)
Description Approved
budget Actual
revenue Approved
budget Actual
revenue Approved
budget Actual
revenue
All domestic revenue 1,385.3 2,353.8 3,008.1 3,937.2 4,253.0 5,376.7
Tax revenue 1,217.4 2,004.6 2,647.9 3,154.8 3,807.8 4,281.3
Tax on income, profit, and capital gain 862.2 1,469.5 1,817.4 2,244.8 2,436.8 2,922.8
Value added tax 218.1 342.4 601.4 586.0 961.6 1,049.3 Excise taxes on locally manufactured
goods 0.3 0.3 3.0 0.5 0.3 -
Sales turnover tax on locally
manufactured goods 58.5 84.4 104.1 159.2 199.9 166.1
Turnover tax on local services 19.6 26.7 34.7 57.4 54.2 47.9
Stamps sales and duty 58.7 81.1 87.3 107.0 154.9 95.1
Excise tax on imported goods 0.0 -
Sales tax on imported goods 0.0 0.1
Non-tax revenue 165.2 347.5 356.7 780.0 442.0 1,091.3
Administrative fees and charges 55.4 63.9 56.8 95.6 101.6 120.7
Sales of public goods and services 92.6 367.3 89.8 565.8
Government investment income 109.8 123.4 203.8 161.5 247.3 176.3
Miscellaneous revenue 0.0 158.3 0.0 152.9 0.0 224.3
Contributions to pension fund 0.0 0.1 0.0 0.2 0.0 0.1
Capital revenue 1.3 1.8 3.5 2.4 3.2 4.0 Sales of movable and immovable
properties 1.3 1.4 2.6 1.8 2.5 3.4
Sales of stock 0.0 - - - - 0.0
Royalty on public assets - 0.5 0.9 0.6 0.7 0.6
Actual / Approved 169.9% 130.9% 126.4% Source: Oromia BoFED accounts. There are small differences between the above data and Table 2 on
budget outcomes for FYs 2011/12 and 2012/13, and a major difference on FY 2010/11.

World Bank Oromia PEFA Assessment
85
Appendix G. Calculation of HLG-1 Variance
Table G.1 Fiscal Years for Assessment
Fiscal Year 1 = NA
Fiscal Year 2 = 2011/12 = EFY 2004
Fiscal Year 3 = 2012/13 = EFY 2005
Table G.2 Data for Fiscal Year 2011/12 (ETB, millions)
Total
budget
Total
actual
Adjusted
budget
Deviation Absolute
deviation
Percent
Block grant 9,932.4 9,958.0 9,733.3 224.7 224.7 2.3%
MDG-agriculture 138.2 129.0 135.4 -6.4 6.4 4.7%
MDG-health 438.1 409.1 429.3 -20.2 20.2 4.7%
MDG-education 551.0 514.6 540.0 -25.4 25.4 4.7%
MDG-water 433.4 404.8 424.7 -19.9 19.9 4.7%
MDG-rural roads 3,318.9 3,099.6 3,252.4 -152.8 152.8 4.7%
Total transfers 14,812.0 14,515.1 14,515.1 0.0 449.4
Overall (HLG-1 i) variance -2.0%
Composition (HLG-1 ii) variance 3.1%
Table G.3 Data for Fiscal Year 2012/13 (ETB, millions)
Total
budget
Total
actual
Adjusted
budget
Deviation Absolute
deviation
Percent
Block grant 11,575.4 11,575.4 11,040.3 535.1 535.1 4.8%
MDG-agriculture 85.4 74.4 81.5 -7.1 7.1 8.7%
MDG-health 728.7 635.0 695.0 -60.0 60.0 8.6%
MDG-education 801.7 698.6 764.6 -66.0 66.0 8.6%
MDG-water 684.2 596.3 652.6 -56.3 56.3 8.6%
MDG-rural roads 4,200.0 3,660.1 4,005.8 -345.7 345.7 8.6%
Total transfers 18,075.4 17,239.8 17,239.8 0.0 1,070.2
overall (HLG-1 i) variance -4.6%
composition (HLG-1 ii) variance 6.2%
Table G.4 Results Matrix
for HLG-1
(i)
for HLG-1
(ii)
Fiscal year Total exp.
deviation
Composition
variance
2010/11 10.6% NA
2011/12 -2.0% 3.1%
2012/13 -4.6% 6.2%

World Bank Oromia PEFA Assessment
86
Score for indicator HLG-1 (i) A
Score for indicator HLG-1 (ii) B
Source: BoFED data, Team calculations.