Embed Size (px)
Citation preview

THE REAL FACE OF CONSTRUCTIONA SOCIO-ECONOMIC ANALYSIS OF THE TRUE VALUE OF THE BUILT ENVIRONMENT

Researched and written by Brian Green, construction analyst and commentator. Follow Brian on Twitter: @brickonomicsPublished by the Chartered Institute of Building (CIOB) Twitter: @theCIOBFacebook: www.facebook.com/theCIOBLinkedIn: search ‘CIOB’YouTube: CIOBTV
CIOB, 1 Arlington Square, Downshire Way, Bracknell, RG12 1WA, UKRegistered Charity No. (England and Wales) 280795 and (Scotland) SC041725
www.ciob.orgTel: +44 (0) 1344 630700Email: [email protected]
The views expressed by the author are not necessarily those of the CIOB nor anyone connected with the CIOB. Neither the author nor CIOB accept any liability arising from the use of this publication.
Any data or analysis from this report must be reported accurately and not used in a misleading context. If using any information from the report, then its source and date of publication must be acknowledged.
Copyright CIOB 2014

CIOB – The Real Face of Construction 3
CONTENTSExecutive summary 4
Introduction 5
What does the construction industry create? 6
Why is improving the built environment so important? 7
What really is the construction industry? 8
Why is the existence of the construction industry important? 9
Construction’s role in building a better world 10
Example 1: The need and benefits of more and better housing 10
Example 2: Reducing the carbon footprint of NHS Property Services 11
How has the construction industry ridden the recession? 12
What are the challenges and opportunities for construction? 13
How are we improving the construction industry? 14
The regional perspective – a national comparison 16
Scotland 18
North East 20
North West 22
Yorkshire and the Humber 24
East Midlands 26
West Midlands 28
East of England 30
Wales 32
London 34
South East 36
South West 38
Where to from here for the construction industry? 40
Recommendations 40
Appendix 1 – Construction output in 2013 by type £ million at current prices 42
Appendix 2 – CITB Construction Skills Network industry employment projections 43
Notes and references 44
Your notes 46

4 CIOB – The Real Face of Construction
EXECUTIVE SUMMARYThis report seeks to display the Real Face of Construction; how it provides employment and support for millions; allows British expertise to be exported abroad; improves energy efficiency and, ultimately, how it affects every member of society.
Within the report, we have analysed each economic region of Great Britain*, highlighting how the construction sector has performed relative to its peak before the recession. Additionally, we have picked out areas of major upcoming investment that will provide regions with vital employment opportunities.
The report illustrates that, regionally, London is the only area where the industry has actually expanded over the past six years. In fact, the capital now accounts for a vast, and perhaps disproportionate, 20% of all construction work.
Construction’s recovery outside of London is beginning to take hold. While this is undoubtedly good news, it will bring with it the growing pains associated with rebuilding capacity after deep recession. As is routine with the boom and bust cycles that accompany construction, many personnel have left the sector since 2008 and the skills gap is widening. This is nothing new – previous CIOB research has consistently shown that there are severe skills shortages in the industry. But rather than accept this as the norm, construction’s rapidly modernising image instead presents a huge opportunity to attract a more diverse and lasting workforce. After all, a critical shortage of skilled workers could slow down the very projects that are important for economic growth.
The CIOB believes that regional investment is required to boost construction employment and encourage a new generation into the industry in areas harder hit by the recession, as well as to improve infrastructure and regenerate regional cities. In key regions, it would be advantageous to establish hubs of construction-related businesses, each to act as a centre for excellence. Strategically located near universities, they would help to stimulate innovation, open up greater scope for collaboration and ensure that firms are far more effective in their local markets. This close physical proximity would mean that research, training and support could be delivered more efficiently and effectively.
Public investment needs to be tied to training and job creation. The CIOB considers that this should be geared to the long-term aim of developing skilled young people who will be retained by the industry. This means not just training, but properly structured apprenticeship schemes, qualifications and mentoring, developed and/or accredited by professional bodies.
Finally, it is essential that long-term policies are put in place. This allows businesses and their supply chains to effectively plan their training, innovation and investment while eliminating the demands of adapting and readapting to rapidly changing regulations.
With the right planning, vision and of course people, the construction industry reduces pressure on the public purse and improves quality of life. If we are to rebalance the economy, then construction is surely the solution.
* Due to variations in how the region measures and reports data, Northern Ireland is not included within this report.

CIOB – The Real Face of Construction 5
INTRODUCTIONThe construction industry has a profound impact on the British economy and an even deeper effect on the lives of everyone. It creates the built environment in which we work, rest and play.
It is all too easy in our busy lives to take for granted or accept without question the quality of our built environment. But it affects every member of society. It influences productivity and wellbeing at home and at work.
For most people outside the industry, understanding how the construction industry operates and its impact on our lives is vague at best. This is to be expected. Most of the construction process happens away from view.
The aim of this document is to provide a clearer picture of the construction industry, what it is, what it does and how it influences communities throughout Britain. It seeks also to emphasise its immense economic, social and environmental importance.
We consider this will aid policy making and lead to sharper focus on how the industry can be improved. More importantly, we want to reveal the potential for the construction industry not just to build buildings and structures, but to create a better economy, a better society and a better environment.
The official figures suggest that the industry accounts for 6.3% of all national economic output. At about £100 billion annually, that is huge. But this figure grossly underestimates the true reach of the industry.
Calculations by one of the Britain’s leading construction economists, Dr Stephen Gruneberg at the University of Westminster, based on official sources, suggest that construction is equivalent to 15.3% of GDP. That amounts to almost £250 billion annually.
The industry, as defined by its sponsoring Government department, Business, Innovation & Skills, provides almost 3 million jobs. That’s one in 10. According to the Office for National Statistics (ONS) employment figures, it accounts for 40% of non-service sector employment.
It is huge and central to the British economy. It is pivotal in the effort to reduce greenhouse gas emissions, cut water and energy consumption and reduce waste. It is essential for building the homes, schools, hospitals and workplaces the nation desperately needs. The infrastructure it provides is crucial to improving the nation’s productivity.
With a weak construction industry we will fail to reshape adequately the nation’s built environment to meet the rapidly changing challenges we face in the coming decades.
But with a strong construction industry we can take advantage of the huge opportunities opening up to sell our expertise around the globe, while improving the lives of our citizens at home.
It would be a mistake to take our built environment and the construction industry that creates it for granted. Construction will determine our futures and the futures of our children.

6 CIOB – The Real Face of Construction
“Construction shapes and connects the places where we live and work. Those places sculpt our communities, our health, our wealth and our welfare. Construction, through creating our built environment, ultimately shapes who we are.”
Economies grow and people prosper through the accumulation of physical and human capital.
In 2013 the UK economy channelled about £190 billion into expanding and improving its physical capital (Chart 1, excluding intangible fixed assets). £140 billion of that (73%) went into dwelling and other new buildings and structures, broadly the products of construction1. This is a huge investment. We might ask, however, is it enough?
The total stock of UK homes, other buildings and structures, as they stand and excluding land, was worth more than £3,100 billion in 20122. That stock represents more than 83% of the accumulated value of all the nation’s physical assets (Net Capital Stock in chart 2).
That the proportion of stock of buildings and structures is far higher than the relative share of the annual investment is worth noting. Buildings and structures last for many years if not generations.
These are the product of the construction industry: our homes; schools; hospitals; factories; offices; shops; roads; railways; tunnels; bridges; and the like. These buildings and structures in turn greatly influence how we as a nation accumulate human capital.
It is worth noting too, if we include the value of land on which homes are built, which is increased because homes are built on it, the total asset value of the built environment is vastly increased.
Valued this way the UK’s built environment accounts for 90% of the nation’s physical assets and 84% of the entire nation’s total net worth, according to the national accounts3 (Asset Value in chart 2).
Excluding land, we estimate it would cost about £4,500 billion to replace the UK’s stock of buildings and structures4 (Gross Capital Stock in chart 2).Allowing for necessary changes and improvements along the way, at current rates of construction it would take almost half a century to rebuild the UK’s built environment.
WHAT DOES THE CONSTRUCTION INDUSTRY CREATE?
DwellingsOther buildings & structuresPlant machinery transport
THE VALUE OF THE UK’S BUILT ENVIRONMENT IN CONTEXT(£bn in current prices in 2012)
CIOB projections from 2009 Source: ONS
Asset value (What it would costs)
Gross Capital Stock(Replacement cost)
Net Capital Stock(Its worth net of land)
0
1,000
2,000
3,000
4,000
5,000
£7bn Transport equipment£44bn Other machinery & equipment£56bn Dwellings£85bn Other new buildings & structures£34bn Intangible fixed assets
THE ASSETS WE INVEST IN: GROSS FIXED CAPITAL FORMATION BY TYPE
Data for 2013 Source: ONS
2
1

CIOB – The Real Face of Construction 7
“The buildings and structures we create are not just for today. Not just for a term of a Government. They last often for generations. Investment in construction truly is long-term investment.”
Construction is the most vital cog in the economy for creating physical assets.
But its impact on human capital should not be ignored. Where would we be without good homes, schools, sanitation, hospitals, roads and railways?
Numerous studies have shown how poor buildings and poor infrastructure burden the economy and reduce our health, wealth and wellbeing. Here are just two examples.
Research by Ecotec in 2010 on the social impact of poor housing illustrates the importance to the public purse of good homes. It estimated that poor housing creates extra health costs of £2.5 billion a year, increases the cost of crime prevention by £1.8 billion and costs the economy £14.8 billion a year, through lowering educational standards5.
Meanwhile, the Confederation of British Industry (CBI) estimates that congestion on UK roads costs the economy up to £8 billion each year6.
The precise figures for the cost of a poor built environment are less important than the scale and the message they send. We pay heavily as a nation.
Furthermore, the built environment influences society and our quality of life. A lack of affordable housing or highly congested transport systems creates high levels of stress. Taking homelessness as just one of many indicators flashing red, 57,550 families were in temporary accommodation at the end of 2013.
Better buildings make us more efficient and are more sustainable. Energy used in our homes and buildings accounts for an estimated 45% of the nation’s carbon emissions7.
As Chart 3 shows, space heating is the second largest component of consumption of energy after transport8. Here the construction industry is making huge strides to reduce inefficiency in new and existing buildings.
The challenge for the construction industry is not just to maintain the old and build the new. It is to greatly improve and repurpose buildings and structures to meet the demands of the future. Our buildings need to be more resource efficient, using less energy, water and other materials. They need to adapt to cope with the climate change experts expect will take place over the next few decades. They need also to be adapted to match the extraordinary change technology is creating in how we live and work.
Construction is not only the vital cog in accumulating physical capital. It is vital to the accumulation of human capital and central in transforming the lives of everyone and improving the environment within which they live.
WHY IS IMPROVING THE BUILT ENVIRONMENT SO IMPORTANT?
Transport
Space heating
Lighting & appliances
Process use
Water heating
Other
Cooking/catering
Motors
Drying/separation
Compressed air
Cooling & ventilation
Computing
Refrigeration
20,000 40,000 60,0000
HOW THE UK CONSUMES ENERGY( THOUSAND TONNES OIL EQUIVALENT- ktoe )
Source: DECC
3

8 CIOB – The Real Face of Construction
“To the outside construction can be seen as men in hard hats building things. From the inside it is a complex of interconnected businesses and specialisms that reach into every corner of the economy.”
The official statistics provide an incomplete view of construction. But here are a few headline figures from official sources to provide some scale and shape:• Employment: 2,236,0001
• Employees: 1,292,0001
• Self-employed: 926,0001
• Men: 1,956,0001
• Women: 279,0001
• Output: £121.2 billion2
• Number of firms: 257,1253
• Total purchases of goods, materials and services: £117 million3
• Gross value added: £85.4 billion4
Sources: 1 ONS, Labour Market Statistics, March 2014; 2 ONS, Output in the Construction Industry, March 2014; 3 ONS, Annual Business Survey, 2012; 4 ONS, GDP(O) Low Level Aggregates 2014 Q1 - Month 2
As chart 49 shows, the industry has had a rough ride over recent years. The volatility in GVA (gross value added) shows how susceptible construction is to fluctuations in the wider economy. Sustained low economic growth leads to a construction recession. High economic growth leads to rapid acceleration in construction activity.
The statistics most often used to describe the progress of construction are the monthly output figures. These put construction activity at about £121 billion in cash terms in 201310. Even five years later with strong inflation this is below the 2008 peak of almost £129 million. In real terms, the industry in 2013 was 13% smaller than in 2008. A breakdown of the elements of construction output can be seen in Appendix 1.
While industry output is put at £121 billion, this ignores much of what most people think of as construction or construction-related. It ignores design work contributed by architects and engineers, the cash-in-hard work that goes on, construction work undertaken directly by non-construction firms, and it ignores all the real estate activities central to the development, management and sale of the built environment.
Meanwhile the GVA data, which suggests construction is 6.3% of the economy, is defined more narrowly. It considers just activities occurring on sites. It ignores the value added within equipment rental, building materials manufacturing, consultancy and design, and component production. In 2011, 56% of the inputs to construction came from outside the industry11.
When drawing up its construction industry strategy, the Department for Business, Innovation & Skills recognised the disparity between how construction is measured and what it really is. It defined the sector as: (i) the construction contracting industry; (ii) the provision of construction related professional services; and (iii) construction-related products and materials12. On this basis it estimated the industry to comprise of over 280,000 businesses, covering some 2.93 million jobs; 10% of total UK employment.
Calculations by Dr Stephen Gruneberg at the University of Westminster, based on official sources, suggest that construction is actually equivalent to 15.3% of GDP13. That would make its contribution equivalent to about £250 billion annually.
WHAT REALLY IS THE CONSTRUCTION INDUSTRY?
ANNUAL GROWTH RATES FOR CONSTRUCTION AND THE OVERALL ECONOMY( % CHANGE QUARTER ON SAME QUARTER A YEAR EARLIER )
Source: ONS
-20
-15
-10
-5
0
5
10
15
2004Q1
2005Q1
2006Q1
2007Q1
2008Q1
2009Q1
2010Q1
2011Q1
2012Q1
2013Q1
2014Q1
Total GVAConstruction GVA
4

CIOB – The Real Face of Construction 9
“The construction industry does not just shape the lives of those who consume its output. It shapes the lives of those who work within it, their families and neighbours. It spreads income and wealth deep into our communities. Furthermore, it provides a growing share of opportunities for those keen to work in manual employment.”
When judging the total value of an industry it is important to look beyond simply what it creates and look at what its very existence means to society and the wider economy.
One much undervalued benefit of construction is that it continues to employ large numbers of skilled and semi-skilled workers as employment in other non-service industries disappears.
Chart 514 shows how the share of construction jobs within the pool of non-service sector jobs has grown from below 20% in the 1970s to about 40% today.
For those who either struggle with academic life or prefer a more manual job, construction provides a route to a solid career. It allows those who start in trade roles to progress through to a professional status. It opens the way for them to create businesses of their own. And in a world where career paths are often determined from a young age and by one’s background, it offers a real chance of upward social mobility.
Many of the owners of successful construction businesses started out “on the tools”. Through graft, learning and the opportunities construction offers, they built firms that today generate revenues of tens if not hundreds of millions of pounds a year. To name just two: Laing O’Rourke founder Ray O’Rourke claims a “managed revenue” of £4.4 billion15; and Stewart Milne, of Stewart Milne Homes, generated revenues of £211 million16 in 2013.
The structure of the construction industry makes it easier than in other industries to grow firms from small beginnings. Yes, there are large firms. But they do not necessarily dominate. There are large numbers of firms across the size spectrum. Of the 257,125 firms17 counted in 2012 there were: 239, 130 employing fewer than 10; 15,824 employing 10 to 49, 1,854 employing 50 to 249 and 317 firms employing more than 250 people.
Construction also provides a pool of lower-skilled jobs, some casual, some longer-term. This means that in areas of high and embedded unemployment it can open up a potential pathway back into employment. If suitably delivered this provides jobs that engage local people in employment that directly benefits their local community.
Many, if not most, of the resources used in construction are sourced locally. Most labour is local. This makes investment in construction particularly attractive. The industry reaches deep into local economies and the benefits are felt nearby. There are the social and economic benefits created by the buildings and structures themselves. But importantly the money invested flows into local firms, who employ more people. These people then spend their earnings in local shops and on local services.
While there may be questions over the precise level of the multiplier effect caused by construction activity, economists see construction as one of the most effective ways to boost economic activity both in the short and longer term.
WHY IS THE EXISTENCE OF THE CONSTRUCTION INDUSTRY IMPORTANT?
CONSTRUCTION JOBS AS A PERCENTAGE OF ALL NON-SERVICE SECTOR WORKFORCE JOBS
Source: ONS
0
5
10
15
20
25
30
35
40
45
1978 1983 1988 1993 1998 2003 2008 2013
5

10 CIOB – The Real Face of Construction
Example 1: The need and the benefits of more and better housing
Currently house building in the UK is at a historic low. In 2013 fewer than 150,000 new homes were completed in the UK. That compares with a peak of more than 226,000 in 200718.
Even at peak in 2007 there was concern that more homes needed to be built. The Labour Government strategy “Homes for the Future” set a target for 2016 of 240,000 additional homes a year for England alone19.
A Government report “Estimating Housing Need”, published in November 201020, estimated that England was short about 2 million homes if the aim were to eliminate housing need as it was defined. Need is hard to measure, but the study highlights the scale of the challenge.
Poor housing costs the nation dear, leaving aside the misery it brings to individuals and families. It makes health, education, crime prevention and welfare provision much harder and more expensive, and raises the cost to the Exchequer of housing-related benefits. It restricts economic performance through reducing labour mobility and reduces both incomes and potential tax revenues. This is not in dispute.
Assessing the cost is not easy, although attempts have been made. The Building Research Establishment in 201021 assessed the costs of poor housing to the NHS in England at £600 million a year at least and wider societal cost at £1.5 billion.
In 2010 Ecotec22 produced various estimates of impact of poor housing. All estimates can be challenged, but that study put the added cost to the police of responding to crimes related to poor housing at £1.8 billion a year. It suggested the cost of lost earnings to the current generation from poor education was £14.8 billion. And it assessed costs associated with poor health at £2.5 billion a year.
There are other costs. Lack of housing reduces household mobility. This frustrates both households and employers and reduces economic activity. A 2010 study by Shelter23, “Counting the Cost”, found among social housing tenants alone the cost of lack of mobility was more than £300 million, suggesting a far larger sum when all households are considered.
Whatever the precise economic cost of inadequate housing, the sum appears to be measureable in many billions of pounds a year.
Naturally it takes investment to build homes. But this investment does not only result in better housing and reduced costs. There are huge economic benefits that stem from building new and improving old homes. Construction creates jobs, boosts the economy, creates tax revenue and can radically reduce energy consumption.
CONSTRUCTION’S ROLE IN BUILDING A BETTER WORLD

CIOB – The Real Face of Construction 11
Example 2: Reducing the carbon footprint of NHS Property Services
The creation of NHS Property Services under the Health and Social Care Act 2012 formed a huge operation to oversee the massive health service estate, which, including facilities, is valued at £3 billion24.
This is testimony to the efforts of the construction industry over past years in creating what now stands. It also represents a major challenge for industry in terms of renewal, adaption, replacement and improvement.
Looking solely at energy efficiency, there is a leading role for the industry. The buildings consume over £410 million worth of energy and produce 3.7 million tonnes of CO2 every year25. This presents huge scope within each building for energy saving and efficiency. This in turn allows the savings to be directly reinvested into patient care.
The NHS, however, is bigger than its buildings and has set ambitious targets to cut carbon dioxide emissions not just from buildings, but from travel and the procurement of goods and services.
And its approach states that: “All decisions about design and build of healthcare facilities must be explicit about how they encourage a broader approach to sustainability including transport, delivery of service and community engagement.26
This means the construction industry must not only look at how to make individual buildings less energy hungry, but how the total of the built assets within the organisation can work holistically more efficiently, while supporting the aims of NHS staff seeking to improve the nation’s health.
As the NHS adapts to address changes in demographics, changes in procedures, and changes in available treatments and technology, so the buildings too have to be adapted. This means the role of construction in supporting the NHS estate is, and should be, far more than simply building buildings to order.
Construction is helping the NHS save money; money that can be invested in improving people’s health and wellbeing.
Health CentresO�cesCare homesHospital-related propertiesGP surgeriesCommunity CentresLand assetsSupport buildings
TYPE AND NUMBER OF ASSETS
1774616
373411318
212163
137

12 CIOB – The Real Face of Construction
HOW HAS THE CONSTRUCTION INDUSTRY RIDDEN THE RECESSION?
“The construction industry’s decline into recession in 2008 was more rapid than at any time in the modern era. It came also at a time of extreme economic uncertainty and against a background of unprecedented global and technological change.”
Chart 6 illustrates how construction suffers badly from deep and prolonged recessions27. However, the plunge into the recession of 2008 was more severe than those that went before it. Within a year of peaking in the first quarter of 2008, output fell more than 15.5%. Since the data series was first collected in 1955 the fastest collapse into recession had been in 1980 when output fell 13.2% in the year from its peak in the final quarter on 1979.
Furthermore the plunge into recession came at a time of extreme economic uncertainty not witnessed since the interwar period of the early 20th century.
Surprisingly and encouragingly, as in other sectors of the economy, the cost to the industry in terms of job losses was less severe than might have been expected. The milder 1990s recession cost 19% of workforce jobs, whereas the numbers of jobs are now beginning to increase having dropped, at their lowest point, by less than 14% from peak28. However, the loss of jobs should be not underestimated. It deepened already through very deep structural faults.
It may surprise some when they see how the various sub-sectors of construction have fared through the recession. Public building output is in fact greater than in 2007. This, however, is because spending in 2007 was at a low relative to previous years and it was accelerated as the rest of the industry collapsed into recession. This provided a slight cushion, particularly for those larger contracting companies active in school building. The surge we see in Chart 7 was in large part down to this acceleration of public funded work. Work on new public buildings has, however, fallen sharply since 2010.
Infrastructure work was also in a lull in 2007 and this too flatters its relative performance since the recession. However, it has remained the darling sector of construction throughout recent years, with public investment of £100bn planned up to the year 2020.
We see elsewhere the ravages of recession. The huge new-housing and commercial sectors remain well below peak, despite recent strong growth in house building. The commercial sector tends to be slower to rebound. There are positive signs and the latest forecast from the Construction Products Association suggests the commercial sector will see annual growth of 5% by 201529.
The industry still has much ground to catch up but the forecast for construction is positive, suggesting a growth rate in excess of 4% for the next three years. This hopefully will provide confidence for investment in the supply chain and in recruitment and training.
CONSTRUCTION OUTPUT SINCE 1955 (£MILLIONS, QUARTERLY)
Source: ONS, CIOB adjustments
New seriesAdjusted old series
Series start 1955 Q1
0
5,000
10,000
15,000
20,000
25,000
30,000
35,000
1954 1959 1964 1969 1974 1979 1984 1989 1994 1999 2004 2009 2014
CHANGE IN CONSTRUCTIONOUTPUT (%), 2007 to 2013
New seriesAdjusted old series
New Housing
Infrastructure
Public building
Commercial& industrial
Housing RMI
Non-housingrepair & maint.
All new work
All repair& maintenance
-40 -20 0 20 40 60
6
7

CIOB – The Real Face of Construction 13
WHAT ARE THE CHALLENGES AND THE OPPORTUNITIES FOR CONSTRUCTION?
“Globalisation, climate change and information technology are reshaping our environment. The construction industry is critical to reshaping the built environment to match rapidly changing demands. Meanwhile the industry must step up to its own direct challenges and improve.”
As with all industries the challenges faced by construction are both from within and from outside. These challenges are, of course, brought into stark relief after a prolonged slump.
The industry needs to rebuild its supply base and, of paramount importance, it must attract new blood and train a new generation. The recession disproportionately robbed the industry of youth. Chart 830 shows how the pool of people employed in the industry younger than 25 years old shrank by 39%. Those aged 25 to 49 dropped 16% and those older than 50 fell by 8%.
Even before the recession, the industry was concerned at the lack of young blood. Skills from Eastern Europe provided a lifeline for companies eager to expand and find replacements for those leaving the industry. Since the recession the average age has risen by, on estimation, two years. Almost a third of the workforce is now older than 50.
Much of what is true of the site skills, as seen in Chart 8, will be reflected in the professions. Here too recruitment has been tight until fairly recently.
The post-Great Recession world will be different to what went before, not just economically. The industry must reshape itself to meet new demands, rethinking the services it provides. It will need to provide cost effective ways to repurpose and adapt the existing built environment. Structural changes in the economy, climate change, rapidly developing technology and major shifts in the demographic structure of the population mean that many existing building will become outmoded or redundant.
The need to create new clean energy sources and reduce energy consumption in buildings will mean radical changes to the design and construction of new buildings and demand a major programme of retrofitting and modification. Meanwhile, very evident stresses on the nation’s housing stock have created huge pressure to boost the production of new homes.
Construction is pivotal in solving some of the toughest social, political and economic challenges of our time within the UK.
Looking beyond our shores, transformative information technology has meant it is easier to win work abroad and “on-shore” it to UK offices. In part encouraged by recession at home, overseas trade in the services of construction professionals mushroomed in recent years. The ONS Pink Book shows a step change in exports of construction-related services. In 2012 the UK exported £1.5 billion of construction services, £342 million of architectural services, £202 million of surveying services and £5.9 billion of engineering services, a large slice of which will be related to built-environment projects31.
This opens the possibility of the UK becoming a global hub for the rapidly growing market for construction-related services throughout the world. If realised, this in turn would underpin significant advances in the services delivered within the UK.
FALL IN CONSTRUCTION EMPLOYMENT BY AGE GROUP FROM DEC 2008 to DEC 2013(number above, % on scale)
Source: ONS
16-24
132,600 237,000 53,100
25-49 50+0
5
10
15
20
25
30
35
45
40
8

14 CIOB – The Real Face of Construction
HOW ARE WE IMPROVING THE CONSTRUCTION INDUSTRY?
“Construction is a powerful industry for good or harm. Mistakes leave deep scars. Successes breed success. Over the past two decades the industry has worked hard to rethink its social, economic and environmental responsibilities and reshape its role as an employer.”
Few people working in construction would or should deny the industry’s chequered past. But for two decades the industry has been more united than ever to drive improvement, be that in the safety of its workforce, the education and training of its talent, its attitude to the public, its impact on the environment, nurturing innovation, improving efficiency or raising ethical standards.
This desire within the industry for improvement has in turn made it easier for legislators and policy makers to develop policies and regulation that are far more effective.
Health and safety is a key issue for construction. Chart 932 shows the impressive progress. In the 1980s, each year an average of almost 130 workers and 12 members of the public were killed. Today, though one death is of course too many, it is more likely to be a third of those figures. The statistics on major injuries are harder to interpret. Changes to procedure and practice of what is recorded can cause confusion. But it is clear there was a major improvement after the enactment of the Corporate Manslaughter and Corporate Homicide Act 2007. This has helped drive less ethical firms to raise their game and the results have been notable.
The drive to improve the industry that emerged after the 1990s recession also saw the creation of the Considerate Constructors Scheme, in which the CIOB was very active. The noisy, dirty, dangerous building sites of the past provided no advert for the industry and were often disrespectful of the local community. The change has been dramatic and improvements continue to be made.
The industry has looked to its relationship with the environment. For instance, it is the biggest single source of waste, producing about 100 million tonnes a year, about a third of the national total33. Working together the industry is cutting waste. Hard data on construction waste are sparse, but between 2004 and 2008 there was an 11% drop in waste despite rising construction activity34. Between 2008 and 2010 there appears to have been a further 18% fall35, although industry activity was 6% lower in 2010. Again legislation, such as the Landfill Tax, and policy support has prompted improvement.
The CIOB’s membership is drawn from a wide range of professional disciplines working within the built environment and the field of construction management. This includes clients, consultants and contractors as well as more specialist areas such as research, education and facilities management. We accredit university degrees, training programmes and vocational courses, and our qualifications are an indicator of the highest levels of professionalism.
REPORTED DEATHS AND NON-FATAL MAJOR INJURIES IN CONSTRUCTIONSource: HSE
Death [LHS]Non-fatal major injuries [RHS]
25
50
75
100
125
1,000
0
2,000
3,000
4,000
5,000
150
175
1982 1987/88 1992/3 1997/98
Introduction of corporatemanslaughter legislation
2002/3 2007/8 2012/13
9

CIOB – The Real Face of Construction 15
Training and education is therefore central to CIOB activities and critical to the industry as a whole. Construction is quite unique in terms of representing a growing proportion of non-service jobs alongside chartered professions. Many in the industry establish their own businesses while others follow a well-trodden path, especially through the CIOB, from skilled tradesperson to a professional with degree-level qualifications and more. This inclusive approach to recognising and qualifying members from different backgrounds offers significant career development opportunities.
The CIOB, along with the Construction Industry Training Board (CITB), recently supported a cross-party parliamentarians’ inquiry under the title No More Lost Generations36. The CIOB fully endorses the words printed on the cover: “One million NEETs aged 16-24. 182,000 construction jobs to be filled by 2018. Yet just 7,280 completed a construction apprenticeship last year. We have to do better.”
This is one area where the industry needs more support from parliamentarians.
The industry is regarded as slow to innovate. High risks and the high cost of mistakes do tend to favour a level of conservatism compared to other industries. Change tends to be iterative and cautious. However, the industry is currently embracing new technology in a transformative way.
Digital construction through BIM (Building Information Modelling) is potentially one of the most transformative developments to hit the industry in generations. In May 2011 the Government stated that it intended for all its “central projects” to have collaborative 3D BIM (with all project and asset information, documentation and data being electronic) by 201637.
What does this mean? Two things. Firstly, all the plans and documentation for every Government construction project will be electronic and structured for collaborative working. Secondly, this will in turn lead to an increasing share of private sector projects adopting BIM. This is another case of where the industry and policy makers can work together towards a common goal.
BIM has the potential to reduce waste, increase efficiency on site, reduce the carbon footprint of buildings, streamline after-care and maintenance, as well as reduce travel time and costs for professionals as they can collaborate remotely more easily. It will also document more precisely the development of a building, making it easier to learn lessons and make improvements on subsequent building projects. Furthermore, it provides the client with a far better idea of a structure’s layout and facilities before it is even built, so it will be better suited to its purpose. This should reduce costly changes. The system will also make it easier to manage the running, maintenance and improvements of the building throughout its life. Put bluntly, we will have better buildings.

16 CIOB – The Real Face of Construction
“Construction both benefits from regional economic growth and drives future growth. Business investment is drawn to regions with good infrastructure and an attractive building stock.”
The popular view is that the woes of the construction sector are behind and the industry is again on a strong growth path. This view misses significant nuances. There are large regional variations in fortune across construction as whole and, importantly, even larger regional variations between subsectors of the industry. To pick just one example, new housing work in London doubled in cash terms between 2007 and 2013. In the North West it shrank 40%.
Economic activity severely influences the amount and type of construction work in any place at any time. Where economic activity is low, expect a flagging construction sector. However, the relationship between economic activity and construction is symbiotic.
Construction is an essential building block of prosperity, providing it is directed to create the right things to meet the right needs at the right time. The political challenge, when economies wane, is to provide the vision and leadership to invest in construction and channel its creative skills to support economic rejuvenation. The political challenge when economies surge is to ensure the buildings and infrastructure delivered are sustainable in the long term. Buildings have a long legacy.
The challenge for construction, both nationally and locally, is to be flexible to those often rapidly changing demands and to provide its expertise in helping guide the decisions of policy makers.
Chart 1038 shows the change in construction output in cash terms by region between 2007 and 2013. Even at this highly-aggregate level, fortunes vary widely. When we take account of inflation, London grew 10%, the East of England held steady, while activity elsewhere dropped – in some cases, very sharply. London’s share of British construction output rose from 16% in 2007 to 20% in 2013.
This variation in fortune underlines the importance of economic growth to construction activity regionally.
But the link is not straightforward. Chart 1139 shows how London is bottom of the league when comparing construction as a share of economic activity (GVA), because it has a plethora of high-value-adding sectors.
Construction outside of London, on the narrow measure of the industrial sector’s GVA, accounts for between 6% and 9% on average each year of the total economic activity. Naturally much of the materials supply base (which is not included in the narrow measure) is situated outside London, while a large slice of the professionals that design construction works (also not included) are located in London and in other major cities throughout Britain.
When comparing regions, it is important to note that the spread of jobs does not directly match the spread of aggregate workloads. The type of work influences employment. In broad terms, refurbishment work is far more labour intensive than new-build work. Meanwhile, civil engineering is less labour intensive as it relies more heavily on plant and machinery than building work.
THE REGIONAL PERSPECTIVE – A NATIONAL COMPARISON
East England
East Midlands
Wales
North East
South West
Scotland
South East
West Midlands
North West
Yorks & Humb
London
8.5%
7.3%
7.1%
7.0%
6.9%
6.9%
6.9%
6.9%
6.8%
6.8%
4.5%
2.0 6.0 8.04.0 10.00
CONSTRUCTION’S SHARE IN 2011 OF REGIONAL GROSS VALUE ADDEDSource: ONS
10
11
London
South East
East England
North West
Scotland
South West
West Midlands
Yorks & Humb
East Midlands
Wales
North East
20.1%
14.9%
11.0%
9.9%
8.8%
8.1%
7.7%
7.0%
5.7%
3.7%
3.1%
20132007
10,000 20,000 30,0000
CONSTRUCTION OUTPUT BY REGION 2007 AND 2013( £m, current prices )
Source: ONS
CIOB – The Real Face of Construction 17
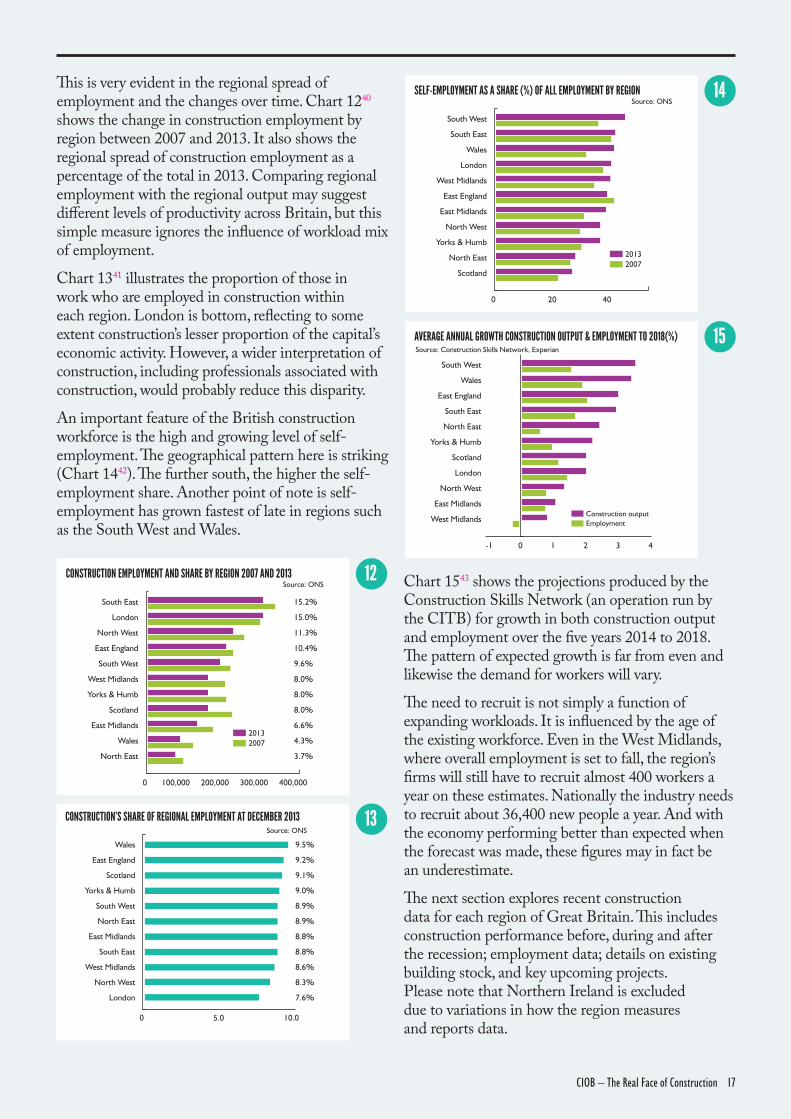
This is very evident in the regional spread of employment and the changes over time. Chart 1240 shows the change in construction employment by region between 2007 and 2013. It also shows the regional spread of construction employment as a percentage of the total in 2013. Comparing regional employment with the regional output may suggest different levels of productivity across Britain, but this simple measure ignores the influence of workload mix of employment.
Chart 1341 illustrates the proportion of those in work who are employed in construction within each region. London is bottom, reflecting to some extent construction’s lesser proportion of the capital’s economic activity. However, a wider interpretation of construction, including professionals associated with construction, would probably reduce this disparity.
An important feature of the British construction workforce is the high and growing level of self-employment. The geographical pattern here is striking (Chart 1442). The further south, the higher the self-employment share. Another point of note is self-employment has grown fastest of late in regions such as the South West and Wales.
Chart 1543 shows the projections produced by the Construction Skills Network (an operation run by the CITB) for growth in both construction output and employment over the five years 2014 to 2018. The pattern of expected growth is far from even and likewise the demand for workers will vary.
The need to recruit is not simply a function of expanding workloads. It is influenced by the age of the existing workforce. Even in the West Midlands, where overall employment is set to fall, the region’s firms will still have to recruit almost 400 workers a year on these estimates. Nationally the industry needs to recruit about 36,400 new people a year. And with the economy performing better than expected when the forecast was made, these figures may in fact be an underestimate.
The next section explores recent construction data for each region of Great Britain. This includes construction performance before, during and after the recession; employment data; details on existing building stock, and key upcoming projects. Please note that Northern Ireland is excluded due to variations in how the region measures and reports data.
12
13
14
15
South East
London
North West
East England
South West
West Midlands
Yorks & Humb
Scotland
East Midlands
Wales
North East
15.2%
15.0%
11.3%
10.4%
9.6%
8.0%
8.0%
8.0%
6.6%
4.3%
3.7%
20132007
100,000 200,000 300,000 400,0000
CONSTRUCTION EMPLOYMENT AND SHARE BY REGION 2007 AND 2013Source: ONS
Wales
East England
Scotland
Yorks & Humb
South West
North East
East Midlands
South East
West Midlands
North West
London
9.5%
9.2%
9.1%
9.0%
8.9%
8.9%
8.8%
8.8%
8.6%
8.3%
7.6%
5.0 10.00
CONSTRUCTION’S SHARE OF REGIONAL EMPLOYMENT AT DECEMBER 2013Source: ONS
South West
South East
Wales
London
West Midlands
East England
East Midlands
North West
Yorks & Humb
North East
Scotland
20132007
20 400
SELF-EMPLOYMENT AS A SHARE (%) OF ALL EMPLOYMENT BY REGIONSource: ONS
South West
Wales
East England
South East
North East
Yorks & Humb
Scotland
London
North West
East Midlands
West MidlandsConstruction outputEmployment
0 1-1 2 3 4
AVERAGE ANNUAL GROWTH CONSTRUCTION OUTPUT & EMPLOYMENT TO 2018(%)Source: Construction Skills Network, Experian

18 CIOB – The Real Face of Construction
SCOTLANDSince the recession, construction activity in Scotland has been on a rollercoaster ride. Initially it had more momentum than many other regions, but activity dipped hard in 2009, rose sharply in 2010 and then dipped again. It now appears to be on the rise, but in real terms is still well below peak levels44.
Relative to other sectors, Scottish construction suffered badly. It lost 68,600 jobs between 2007 and 201345. But worse was avoided thanks to expanding infrastructure work, which grew its share of output from less than 10% to almost 20%.
Both orders46 and output are now rising and the current forecast from the Construction Skills Network (CSN)47 is for an average regional construction growth over the next four years of 2% against a UK average of 2.2%. It is reasonable to hope this is an underestimate as economic prospects have recently improved above expectations.
CSN is expecting housing, both new and refurbishments, to drive this growth, although all sectors should see growth with the exception of public non-housing new buildings.
Underlying this growth in construction is the expanding economy, which is expected to grow averagely at about 1.7% annually up to 2018 against a 2% UK average.
This leads CSN to forecast a need to recruit about 6,000 new people into construction each year between 2014 and 2018.
Building Stock48
Homes 2,508,000Shops 53,000Offices 39,000Industrial 48,000Other building 16,000
Key Projects49
As a nation eager to express its identity and tap into its natural resources, Scotland’s portfolio of major construction projects is revealing. Green power is extremely evident in the top projects in Barbour ABI’s database. The massive carbon capture project at Peterhead Power Station progresses after the award of the Government FEED contract, while progress is also being made on Inch Cape, Stevenson, Viking and Neart Na Gaoithe offshore wind farms with investment of more than £4bn, and the £800m Coire Glas Hydro scheme. But there is more to Scotland than raw energy. The £650m Heartlands development, with a golf course close to its heart, will provide homes, shops and business as well as traditional leisure facilities at the former Polkemmet Colliery. Edinburgh too is set to get an injection of vitality from the £850m reconstruction of St James Centre, while in Glasgow the £850m New South Glasgow Hospital should be finished by early 2015.

CIOB – The Real Face of Construction 19
Construction firms’ performance in Scotland (£m)
Turnover Purchases Employ. costs
2008 6,372 2,809 1,588
2009 6,251 3,740 1,653
2010 5,728 3,515 1,363
2011 5,907 3,776 1,554
CONSTRUCTION OUTPUT BY SECTOR 2007 (INNER) TO 2013 (OUTER)
SCOTLAND CONSTRUCTION OUTPUT AND ORDERS FOR NEW WORK (FOUR-QUARTER MOVING TOTAL £M CURRENT PRICES)
Employment by sector 2013 2007 Change
Agriculture, energy & water 132,300 123,900 8,400
Manufacturing 201,300 261,200 -59,900
Construction 162,300 230,900 -68,600
Distribution, hotels & restaurants 476,600 461,200 15,400
Transport & communications 186,900 197,700 -10,800
Banking, finance and insurance 400,000 332,000 68,000
Public admin. education & health 769,100 787,300 -18,200
Other services 135,000 123,400 11,600
OutputOrders (for new work only)(Source: ONS)
Mar 94 Mar 98 Mar 02 Mar 06 Mar 10 Mar 14 0
3,000
6,000
9,000
12,000
HousingPrivate industrialOther RMIInfrastructure
RMI - Renovation Maintenance Improvement
Private commercialPublic new workHousing RMI(Source: ONS)
16 17
18
19

20 CIOB – The Real Face of Construction
NORTH EASTRegional construction activity in 2013 was down more than a quarter on 2007 levels in cash terms. That’s a bigger slump than in any other English region. Were it not for a swell in infrastructure work the pain would have been far worse.
With falls elsewhere, infrastructure’s share of regional construction jumped from 5% to 13%. This growth in infrastructure work seems set to continue. New orders over the four quarters to spring 2014 were four times up on 2007 levels, helping to boost orders overall.
The employment data show, in number and share, that construction bore the worst of the labour losses, with employment falling by more than 24,000.
Looking forward, sharply rising orders is one reason the CSN currently forecasts average annual regional construction growth over the next four years of 2.4%, above the 2.2% UK average. With economic prospects improving this may be edged up next time.
CSN is expecting housing and industrial work to expand in the coming four years to support growth from infrastructure. But with the economy growing at an average annual rate of 1.6%, slower than the 2% UK average, commercial building work will be fairly slow, while public non-domestic building declines.
CSN expects growth to lead to a demand for about 2,680 new recruits to construction annually between 2014 and 2018.
Building Stock
Homes 1,187,000Shops 25,000Offices 13,000Industrial 19,000Other building 6,000
Key Projects
Construction’s role in regenerating neighbourhoods where former centres of employment have disappeared is vital in the North East, as a selection of top projects pulled from the database of Barbour ABI illustrates. Among the projects is the ambitious £800m regeneration of the former Vaux Brewery in Sunderland. The £200m Downing Plaza redevelopment of the former Scottish & Newcastle Brewery is nearing completion. Its first phase now houses the University of Newcastle’s New Business School. The Homes & Communities Agency is persisting with its plans to redevelop Middlehaven Docks in Middlesbrough with homes, shops and leisure buildings. Meanwhile, developers have eyed a former opencast mine near Widdrington to transform into the planned £50m Blue Sky Forest holiday complex. Large construction projects in the region are, however, not just about regeneration. Stockton Council has agreed plans for the £100m 350-home retirement village Mount Leven development at Yarm. And two massive biomass energy projects at Middlesbrough and Billingham, together worth more than £600m, should help drive the growth in infrastructure

CIOB – The Real Face of Construction 21
Construction firms’ performance in North East (£m)
Turnover Purchases Employ. costs
2008 6,372 2,809 1,588
2009 6,251 3,740 1,653
2010 5,728 3,515 1,363
2011 5,907 3,776 1,554
CONSTRUCTION OUTPUT BY SECTOR 2007 (INNER) TO 2013 (OUTER)
NORTH EAST CONSTRUCTION OUTPUT AND ORDERS FOR NEW WORK (FOUR-QUARTER MOVING TOTAL £M CURRENT PRICES)
Employment by sector 2013 2007 Change
Agriculture, energy & water 36,100 33,300 2,800
Manufacturing 132,800 155,400 -22,600
Construction 81,300 105,500 -24,200
Distribution, hotels & restaurants 221,500 213,900 7,600
Transport & communications 83,700 91,300 -7,600
Banking, finance and insurance 143,500 122,200 21,300
Public admin. education & health 385,400 376,700 8,700
Other services 56,600 59,900 -3,300
OutputOrders (for new work only)(Source: ONS)
Mar 94 Mar 98 Mar 02 Mar 06 Mar 10 Mar 14 0
2,000
4,000
6,000
HousingPrivate industrialOther RMIInfrastructure
Private commercialPublic new workHousing RMI(Source: ONS)
20 21
22
23

22 CIOB – The Real Face of Construction
NORTH WESTBy the end of 2013, activity in both housing and commercial building was 40% lower in cash terms than in 2007. That’s a £3bn fall in annual spend. A rise in infrastructure and public building did ease some pain, but overall construction is far slimmer than in its peak years. The effect can be seen in the 32,000 loss of employment.
Commercial sector work (offices, shops etc.) in 2007 accounted for 30% of the region’s construction work. Today it is about 20%, a reflection of the economic struggle.
Despite more buoyancy evident in the output and orders figures, the latest forecast from CSN suggests that the share of overall work taken by commercial building will not grow and may in fact shrink over the coming few years.
It currently forecasts average annual regional construction growth over the next four years of 1.3%, below the 2.2% UK average. Encouragingly, the economy is doing better than expected when the forecast was made.
CSN expects infrastructure to be the biggest driver of growth, helped by the Mersey Gateway project. But with the economy expected to grow at an average annual rate of 1.8%, slower than the 2% UK average, it is understandable that CSN has low expectations for commercial building work.
The industry in the region will be recruiting. CSN expects a need for almost 3,000 new recruits annually between 2014 and 2018.
Building Stock
Homes 3,168,000Shops 79,000Offices 43,000Industrial 61,000Other building 19,000
Key Projects
The North West has tasted the transformative effects of construction – reverberations from building the Manchester Ship Canal echo today. But as a regional counterweight to London, construction is vital to its continued prosperity. Selected projects pulled from the database of Barbour ABI highlight how construction is enhancing the regional economy. Plans for four more phases of Media City, worth £460m, in Salford will seek to cement the region as an international media hub. Work to enhance the physical communications over the Mersey has started. The £600m Mersey Gateway project will by 2017 see a new six-lane toll bridge between the towns of Runcorn and Widnes. In Liverpool, plans for a £5.5bn Liverpool Waters Development are taking shape, further revitalising a vibrant city once deemed unsalvageable. And in Rochdale, a £500m regeneration of the town centre is on the move. Meanwhile, as home to Sellafield, the region will see a large slice of the £7bn planned nuclear decommissioning work over the next 10 to 15 years.

CIOB – The Real Face of Construction 23
Construction firms’ performance in North West (£m)
Turnover Purchases Employ. costs
2008 21,482 13,193 4,531
2009 19,118 11,170 3,951
2010 18,467 11,411 3,844
2011 18,741 11,451 3,756
CONSTRUCTION OUTPUT BY SECTOR 2007 (INNER) TO 2013 (OUTER)
NORTH WEST CONSTRUCTION OUTPUT AND ORDERS FOR NEW WORK (FOUR-QUARTER MOVING TOTAL £M CURRENT PRICES)
Employment by sector 2013 2007 Change
Agriculture, energy & water 74,500 73,700 800
Manufacturing 347,100 446,800 -99,700
Construction 228,100 260,200 -32,100
Distribution, hotels & restaurants 625,800 607,400 18,400
Transport & communications 248,800 290,100 -41,300
Banking, finance and insurance 496,400 409,300 87,100
Public admin. education & health 940,300 913,400 26,900
Other services 154,900 148,900 6,000
OutputOrders (for new work only)(Source: ONS)
Mar 94 Mar 98 Mar 02 Mar 06 Mar 10 Mar 14 0
15,000
5,000
10,000
HousingPrivate industrialOther RMIInfrastructure
Private commercialPublic new workHousing RMI(Source: ONS)
24 25
26
27

24 CIOB – The Real Face of Construction
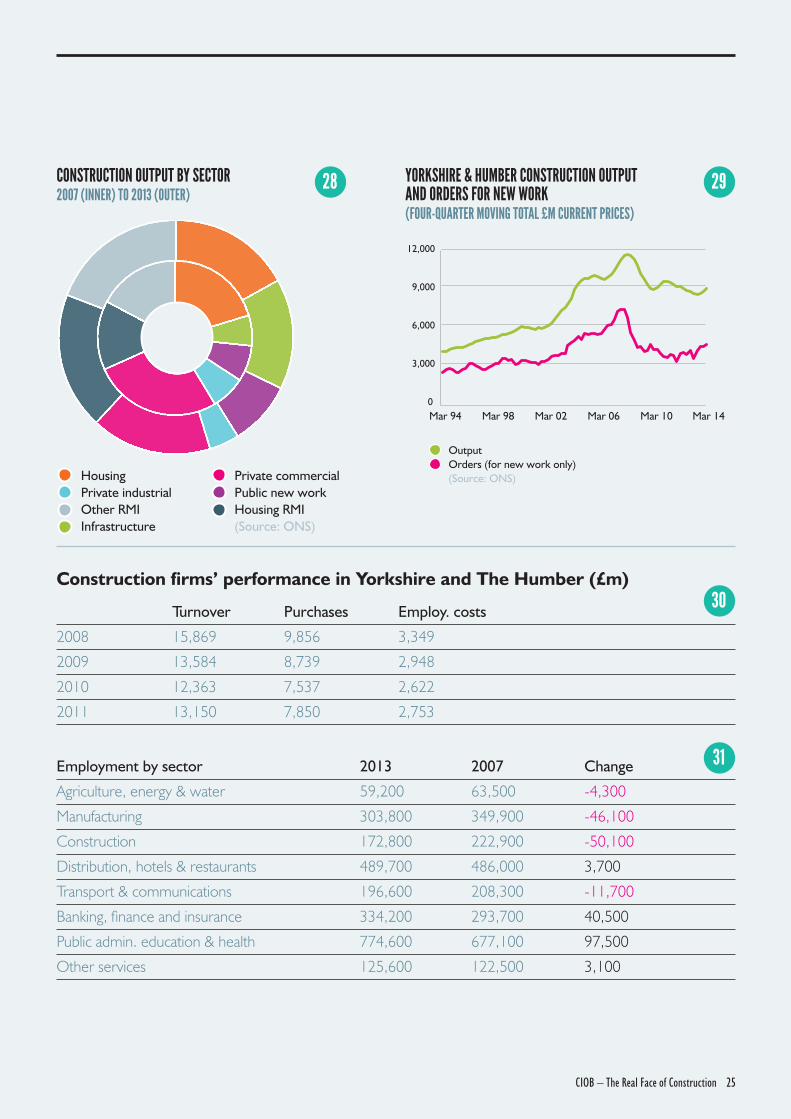
YORKSHIRE AND THE HUMBERAfter the North East, construction in Yorkshire and the Humber has suffered the most among the English regions, with output in cash terms estimated to be almost a quarter lower in 2013 than in 2007.
When inflation is taken into account, this is a painful drop and is reflected in employment data. In number and share, construction bore the worst of the labour losses in the region, with employment dropping by more than 50,000.
The commercial and industrial building sectors were hammered and stand at about half the peak level in cash terms, while new housing work is down almost 40%. But as with other northern regions, some pain was spared as infrastructure spending rose. As a share of regional construction it went from 6% to 15% in Yorkshire and the Humber.
Infrastructure is seen as driver of future growth in construction in the region, but more support is expected from new housing and commercial work, where orders have risen well of late.
CSN currently forecasts average regional construction growth over the next four years of 2.2%, equal to the UK average. This comes despite an expectation that the regional economy will grow at an average annual rate of 1.7%, slower than the 2% UK average.
CSN expects growth to lead to a demand for about 3,170 new recruits to construction annually between 2014 and 2018.
Building Stock
Homes 2,342,000Shops 56,000Offices 31,000Industrial 48,000Other building 14,000
Key Projects
Yorkshire and the Humber has long been an energy powerhouse and the pick of the projects selected from the database of Barbour ABI pay testimony to that. Power projects dominate, with the multi-billion Hornsea Offshore Wind Farm at the top. But vibrancy is as important as pure energy and the £350m Trinity East retail and commercial development is pumping life into the heart of Leeds. Nearby Bradford is looking to secure the £350m development to create its ambitious vision of a canal-side community. In Huddersfield, its regeneration scheme is the £200m Waterfront Quarter where Kirklees College recently opened a new campus. The economy needs more than energy and revitalisation, it needs communication. Plans continue to be pushed for the £400m Doncaster Inland Port, a major intermodal rail-road connection that could be started this year. And the economy needs innovation, in this regard the massive White Rose carbon capture project at Drax in Yorkshire progresses after the award of the government FEED contract.
CIOB – The Real Face of Construction 25
Construction firms’ performance in Yorkshire and The Humber (£m)
Turnover Purchases Employ. costs
2008 15,869 9,856 3,349
2009 13,584 8,739 2,948
2010 12,363 7,537 2,622
2011 13,150 7,850 2,753
CONSTRUCTION OUTPUT BY SECTOR 2007 (INNER) TO 2013 (OUTER)
YORKSHIRE & HUMBER CONSTRUCTION OUTPUT AND ORDERS FOR NEW WORK (FOUR-QUARTER MOVING TOTAL £M CURRENT PRICES)
Employment by sector 2013 2007 Change
Agriculture, energy & water 59,200 63,500 -4,300
Manufacturing 303,800 349,900 -46,100
Construction 172,800 222,900 -50,100
Distribution, hotels & restaurants 489,700 486,000 3,700
Transport & communications 196,600 208,300 -11,700
Banking, finance and insurance 334,200 293,700 40,500
Public admin. education & health 774,600 677,100 97,500
Other services 125,600 122,500 3,100
OutputOrders (for new work only)(Source: ONS)
Mar 94 Mar 98 Mar 02 Mar 06 Mar 10 Mar 14 0
12,000
6,000
3,000
9,000
28 29
30
31
HousingPrivate industrialOther RMIInfrastructure
Private commercialPublic new workHousing RMI(Source: ONS)

26 CIOB – The Real Face of Construction
EAST MIDLANDSThe East Midlands has, for many years, been a major deliverer of homes. In 2007 more than 27% of regional construction was building new homes - the highest share in any region.
The crash hit the East Midlands hard. £1bn less was spent building new homes in 2013 than in 2007. This contributed greatly to the 20% overall drop in construction activity in the region. The fall of 36,600 in construction employment is a testimony to the pain.
But housing still accounts for 21% of construction output and the revival of private housing leads CSN to believe it will be the biggest driver, along with industrial building, for the industry over the next four years.
Overall, the CSN forecast suggests that the East Midlands will be one of the weaker regions for construction, growing averagely by 1.1% annually against 2.2% for UK construction overall. This is on the basis of annual average overall economic growth of 1.8% against the UK’s 2%.
The growth we see in the orders is mainly driven by private housing and industrial, with the economy and house building picking up more than many expected this may suggest fairly strong upsides to the forecast.
Even on the basis of this fairly muted forecast, CSN expects a demand for almost 2,000 new recruits to construction annually between 2014 and 2018.
Building Stock
Homes 1,994,000Shops 41,000Offices 22,000Industrial 42,000Other building 12,000
Key Projects
The East Midlands is more accepting of new homes than most regions. So it is not surprising that top projects from Barbour ABI’s database should include the Eco Village at Ashton, the Towcester South Sustainable Urban Extension, the Swanpool redevelopment and the Thurmaston Urban Extension. These will bring huge investment, 16,000 or more much-needed new homes, schools, other valuable infrastructure and thousands of jobs. And there are plenty of other schemes in the region to create new communities. The region has also supported the nation in power generation. Today that means providing green energy, such as the planned £3bn Race Bank and the £1.8bn Triton Knoll offshore wind farms. But conventional power plants also feature high among the region’s major projects. The Willington and the West Burton combined cycle gas turbine power stations each represent £1bn of investment. Countrywide, new homes and power generation represent the toughest choices over balancing the demands between consumption and the environment, and national and local interest. The East Midlands clearly supports the nation’s needs.

CIOB – The Real Face of Construction 27
Construction firms’ performance in East Midlands (£m)
Turnover Purchases Employ. costs
2008 13,958 8,720 2,469
2009 11,492 6,560 2,191
2010 10,406 6,359 1,998
2011 11,272 7,013 2,216
CONSTRUCTION OUTPUT BY SECTOR 2007 (INNER) TO 2013 (OUTER)
EAST MIDLANDS CONSTRUCTION OUTPUT AND ORDERS FOR NEW WORK (FOUR-QUARTER MOVING TOTAL £M CURRENT PRICES)
Employment by sector 2013 2007 Change
Agriculture, energy & water 71,300 62,600 8,700
Manufacturing 305,900 357,300 -51,400
Construction 151,700 188,300 -36,600
Distribution, hotels & restaurants 402,500 430,700 -28,200
Transport & communications 178,300 181,600 -3,300
Banking, finance and insurance 278,700 247,900 30,800
Public admin. education & health 620,500 557,200 63,300
Other services 104,800 107,400 -2,600
OutputOrders (for new work only)(Source: ONS)
Mar 94 Mar 98 Mar 02 Mar 06 Mar 10 Mar 14 0
2,000
10,000
4,000
6,000
8,000
HousingPrivate industrialOther RMIInfrastructure
Private commercialPublic new workHousing RMI(Source: ONS)
32 33
34
35

28 CIOB – The Real Face of Construction
WEST MIDLANDSConstruction in the West Midlands suffered less than in its regional neighbours to the north, east and west. In cash terms, output is about 8% lower than in 2007. But the fall in workload did create a drop of 22% in employment between 2007 and 2013; proportionately a worse hit than suffered by manufacturing.
The fall would have been worse but for helpful public spending on new buildings and a boost to infrastructure work. Surging house refurbishment also helped, increasing this subsector from 15% to 19%.
Unlike most other regions there is little sign of a swell in orders. This and other indicators will have shaped the CSN view that the region will see the weakest construction annual growth at just 0.8% on average until 2014. This compares with the 2.2% UK average.
CSN sees the sector’s best hope for construction growth in housing, new build and refurbishment. The commercial sector, which has taken a hammering, is expected to continue to shrink. Encouragingly, industrial building work is expected to grow gently.
The CSN forecast is set against expected regional economic growth annually averaging 1.8%, slower than the national expectation of 2%.
CSN expects growth to lead to a demand for about 380 new recruits to construction annually between 2014 and 2018. That is by far the lowest of all regions.
Building Stock
Homes 2,398,000Shops 53,000Offices 30,000Industrial 53,000Other building 13,000
Key Projects
The powerhouse of Britain’s post-War manufacturing prowess, the West Midlands was less ravaged than the heavy-industry-reliant Northern regions over the years. But it has more recently had to adapt fast in the face of global competition and still does. Construction is central to the process of adaptation, helping to strengthen the heritage while facilitating new opportunities. It is fitting that top projects in the Barbour ABI database include the £355m new Jaguar Land Rover factory near Wolverhampton and the £130m National Automotive Innovation Centre at the University of Warwick. But in the construction projects we see strong signs of necessary regeneration and rebirth. A massive regeneration project at Selly Oak includes a world-class Life Sciences research centre. Coventry has plans for a £300m City Centre South redevelopment. In Stoke the £250m “City Sentral” redevelopment is underway and there are plans for a £170m central business quarter. Burton has plans for a new community near Branston Lock.

CIOB – The Real Face of Construction 29
Construction firms’ performance in West Midlands (£m)
Turnover Purchases Employ. costs
2008 17,148 10,401 3,357
2009 14,965 9,298 2,872
2010 14,041 8,493 2,801
2011 14,115 9,197 2,695
CONSTRUCTION OUTPUT BY SECTOR 2007 (INNER) TO 2013 (OUTER)
WEST MIDLANDS CONSTRUCTION OUTPUT AND ORDERS FOR NEW WORK (FOUR-QUARTER MOVING TOTAL £M CURRENT PRICES)
Employment by sector 2013 2007 Change
Agriculture, energy & water 67,400 60,400 7,000
Manufacturing 331,400 408,000 -76,600
Construction 165,300 210,800 -45,500
Distribution, hotels & restaurants 469,500 451,500 18,000
Transport & communications 208,600 217,200 -8,600
Banking, finance and insurance 338,200 308,500 29,700
Public admin. education & health 747,900 681,100 66,800
Other services 117,800 119,900 -2,100
OutputOrders (for new work only)(Source: ONS)
Mar 94 Mar 98 Mar 02 Mar 06 Mar 10 Mar 14 0
12,000
6,000
3,000
9,000
HousingPrivate industrialOther RMIInfrastructure
Private commercialPublic new workHousing RMI(Source: ONS)
36 37
38
39

30 CIOB – The Real Face of Construction
EAST OF ENGLANDAfter London, the East of England has enjoyed the best fortune as regards construction. In cash terms output is estimated to be almost 9% higher in 2013 than in 2007. Taking account of inflation that suggests the industry is more or less where it was at peak.
And while the region did see its construction employment fall 13,500 over the period, the sector fared less badly than manufacturing, which saw a 15% fall against a 5% fall in employment in construction.
It is not surprising then that the relatively small private industrial sector was the hardest hit. Output fell by more than half. Commercial work fell also, dropping from a 21% share of all work to just 16%.
Looking forward, the orders figures are promising, if not spectacular, with private industrial and infrastructure most buoyant.
These sectors, along with housing, are seen by CSN as the main drivers of regional construction growth over the next four years. Average annual growth should be about 3% comparing favourable with the 2.2% UK average. This will be supported by fairly strong overall economic growth of 2.1%, above the 2% UK average.
The expectation of strong employment growth has CSN forecasting a need for 5,150 new recruits to feed the regional construction industry annually between 2014 and 2018.
Building Stock
Homes 2,566,000Shops 49,000Offices 33,000Industrial 49,000Other building 17,000
Key Projects
A major driver of construction is population growth and the East England has grown faster since 1991 than any region other than London. This pattern is set to continue with housing and supporting infrastructure featuring heavily in the major projects in Barbour ABI’s database. The A14 Corridor road improvements, Huntingdon to Cambridge Toll road is due to start in 2016, there are widening plans for the M25 between junctions 16 and 23, and a hard-shoulder running scheme for the M1 in the region. Energy projects feature high in the list, including long-term plans for many phases of the £20bn East Anglia offshore wind farm and plans are afoot for a new nuclear plant at Sizewell. An expanding population needs homes. Major schemes dot the region with the region’s many disused airfields often seen as ideal sites. Huntingdonshire District Council is touting RAF Wyton as a site for 3,750 homes, while South Cambridgeshire District Council has backed plans for a 1,500-home new town at Waterbeach and Bourn airfield. Meanwhile, old ‘new towns’ such as Basildon and Stevenage are seeing regeneration with hundreds of millions of pounds investment in homes, shops, businesses, other infrastructure and, ultimately, jobs.

CIOB – The Real Face of Construction 31
Construction firms’ performance in East of England (£m)
Turnover Purchases Employ. costs
2008 19,007 11,900 3,727
2009 19,370 11,758 3,573
2010 19,916 11,963 3,930
2011 22,264 14,343 3,859
CONSTRUCTION OUTPUT BY SECTOR 2007 (INNER) TO 2013 (OUTER)
EAST ENGLAND CONSTRUCTION OUTPUT AND ORDERS FOR NEW WORK (FOUR-QUARTER MOVING TOTAL £M CURRENT PRICES)
Employment by sector 2013 2007 Change
Agriculture, energy & water 81,100 72,600 8,500
Manufacturing 279,500 330,700 -51,200
Construction 236,500 250,000 -13,500
Distribution, hotels & restaurants 519,300 508,400 10,900
Transport & communications 275,100 277,800 -2,700
Banking, finance and insurance 521,500 445,600 75,900
Public admin. education & health 841,400 712,500 128,900
Other services 156,800 157,800 -1,000
OutputOrders (for new work only)(Source: ONS)
Mar 94 Mar 98 Mar 02 Mar 06 Mar 10 Mar 14 0
15,000
5,000
10,000
HousingPrivate industrialOther RMIInfrastructure
Private commercialPublic new workHousing RMI(Source: ONS)
40 41
42
43

32 CIOB – The Real Face of Construction
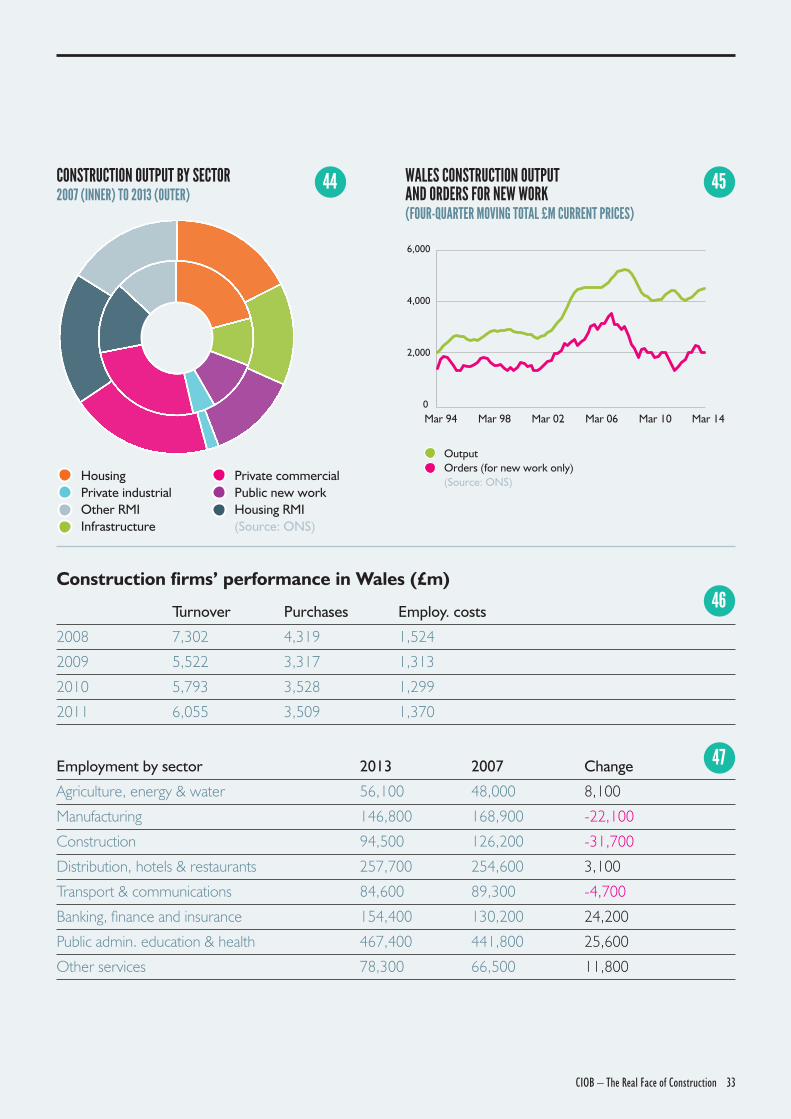
WALESBy the end of 2013, construction output in cash terms in Wales was down 14% on its 2007 level, with the biggest losses resulting from falling private commercial and housing activity. The biggest hit proportionately was taken in private industrial work, but this is a relatively small sector.
The cost to jobs has been heavy, a loss of 31,000, or about 25% of the sectors’ employment over the period. But a boost to housing refurbishment and new infrastructure work did take some sting out of the recession for Welsh construction. These significantly expanded their share of overall workload, with infrastructure growing from 10% to 14%.
This share is set to grow further if the latest CSN forecast proves accurate. It foresees average annual growth in double figures for infrastructure between now and 2018. This will be the big driver, with private housing also lifting growth. The recent rise in orders is largely down to infrastructure work, with private industrial and commercial work increasing more of late.
CSN currently expects average annual construction growth in Wales over the next four years of 3.4%, well above the 2.2% UK average. This comes despite an expectation that the regional economy will grow at an average annual rate of 1.6%, slower than the 2% UK average.
CSN expects growth to lead to a demand for about 3,570 new recruits to construction annually between 2014 and 2018.
Building Stock
Homes 1,389,000Shops 32,000Offices 15,000Industrial 26,000Other building 10,000
Key Projects
Stemming the economic decline caused by the retreat of traditional industry has been central to Wales’ recent policies. Despite low levels of construction spending, the nation typically invests in projects that tap into its natural resources, improve links to areas of activity, and that renew and help to consolidate both jobs and communities. These are very evident in the top projects in Barbour ABI’s database. High on the list is a scheme to improve the M4 corridor around Newport to reduce congestion. Meanwhile there are many power schemes at various stages, from the Swansea Bay tidal lagoon, the Wylfa nuclear power station, the Pen Y Cymoedd wind farm to Lateral Power’s £600m Anglesey biomass power plant. At a more human level there are the plans for a 1,700 new-home development at Bodelwyddan, plans for a £200m new town centre for Talbot Green, the £273m construction Gwent Care Centre in Cwmbran and tentative plans for a new £200m hospital with cancer care in Cardiff. Trading on its natural beauty, plans have been passed for a £120m holiday village in Holyhead.
CIOB – The Real Face of Construction 33
Construction firms’ performance in Wales (£m)
Turnover Purchases Employ. costs
2008 7,302 4,319 1,524
2009 5,522 3,317 1,313
2010 5,793 3,528 1,299
2011 6,055 3,509 1,370
CONSTRUCTION OUTPUT BY SECTOR 2007 (INNER) TO 2013 (OUTER)
WALES CONSTRUCTION OUTPUT AND ORDERS FOR NEW WORK (FOUR-QUARTER MOVING TOTAL £M CURRENT PRICES)
Employment by sector 2013 2007 Change
Agriculture, energy & water 56,100 48,000 8,100
Manufacturing 146,800 168,900 -22,100
Construction 94,500 126,200 -31,700
Distribution, hotels & restaurants 257,700 254,600 3,100
Transport & communications 84,600 89,300 -4,700
Banking, finance and insurance 154,400 130,200 24,200
Public admin. education & health 467,400 441,800 25,600
Other services 78,300 66,500 11,800
OutputOrders (for new work only)(Source: ONS)
Mar 94 Mar 98 Mar 02 Mar 06 Mar 10 Mar 14 0
6,000
2,000
4,000
HousingPrivate industrialOther RMIInfrastructure
Private commercialPublic new workHousing RMI(Source: ONS)
44 45
46
47

34 CIOB – The Real Face of Construction
LONDON London is often referred to as another country; in terms of construction, this cliché actually fits. In all other regions, output has shrunk or stagnated in real terms. But London’s construction output was 20% bigger in 2013 than in 2007 in cash terms and, unlike in all other regions, its workforce is the size it was in 2007.
What is also intriguing is how this growth has occurred when the giant commercial sector has declined by more than £2bn over the period, now accounting for 24% of output compared with almost 40% in 2007.
Infrastructure work should ease over the next four years according to the latest CSN forecast, but the gap will be more than filled by an expanding commercial sector and continued growth in housing. A sharp rise in orders for commercial and housing work should underpin growth.
CSN currently expects average annual construction growth for the capital over the next four years of 2.0%. This is slightly below the 2.2% UK average, despite CSN expecting the capital’s economy to grow at an average annual rate of 2.6%, the fastest in the UK. However, London has already enjoyed fast growth since early 2010 and this is growth from a high base.
CSN expects growth to lead to a demand for about 1,290 new recruits to construction annually between 2014 and 2018.
Building Stock
Homes 3,404,000Shops 98,000Offices 85,000Industrial 44,000Other building 14,000
Key Projects
London is currently at the epicentre of British construction. It accounts for 20% of all work and the market expanded despite the global financial crisis. Three things drive this market: the need to house more people; the need to provide more and better places for employment; and making life desirable so people can get around, be healthy and enjoy themselves. The phase of eye-catching skyscraper projects is waning. Transport and housing are most upfront and central today. The £15bn Crossrail project is well underway. Plans move to start the High Speed rail line to Birmingham and plans rumble on over expansion of Heathrow Airport. Outside of that, there are major housing projects, such as those planned for the redevelopment of Battersea Power Station, amid a host of others centred on Greenwich Peninsula and land in the former docklands. Additionally, work on necessary but less glamorous work also features, with the £4bn Thames Tideway Tunnel project just one example.

CIOB – The Real Face of Construction 35
Construction firms’ performance in London (£m)
Turnover Purchases Employ. costs
2008 35,969 21,757 5,898
2009 30,249 18,621 5,121
2010 31,348 19,779 5,251
2011 31,121 19,715 5,454
CONSTRUCTION OUTPUT BY SECTOR 2007 (INNER) TO 2013 (OUTER)
LONDON CONSTRUCTION OUTPUT AND ORDERS FOR NEW WORK (FOUR-QUARTER MOVING TOTAL £M CURRENT PRICES)
Employment by sector 2013 2007 Change
Agriculture, energy & water 39,700 45,100 -5,400
Manufacturing 140,900 232,500 -91,600
Construction 277,200 278,200 -1,000
Distribution, hotels & restaurants 628,000 581,000 47,000
Transport & communications 472,600 463,000 9,600
Banking, finance and insurance 986,700 878,700 108,000
Public admin. education & health 1,072,200 931,900 140,300
Other services 276,700 235,500 41,200
OutputOrders (for new work only)(Source: ONS)
Mar 94 Mar 98 Mar 02 Mar 06 Mar 10 Mar 14 0
25,000
5,000
15,000
10,000
20,000
HousingPrivate industrialOther RMIInfrastructure
Private commercialPublic new workHousing RMI(Source: ONS)
48 49
50
51

36 CIOB – The Real Face of Construction
SOUTH EASTThe effects of the recession on construction have been far milder in the South East than most other regions. In cash terms the regional output is about the same as it was in 2007. Take inflation into account and that means it has shrunk, but relatively not by much.
There are sectors that felt hurt. The commercial sector is much smaller, with annual spending down £1bn between 2007 and 2013. But a strong performance for infrastructure and housing refurbishment has provided compensation.
The recession has resulted in the loss of about 8% of the region’s construction employment, but this is a lighter loss than elsewhere.
Looking ahead, new housing is expected to lead the charge, according to the latest forecast from CSN, with infrastructure also performing strongly and all but public building work contributing to grow.
The net effect in CSN’s view is average annual regional construction growth over the next four years of 2.9%, well above the 2.2% UK average.
This comes against an expectation that the regional economy will grow at an average annual rate of 2.4%, comfortably higher than the 2% UK average.
CSN expects growth to lead to a demand for about 1,600 new recruits to construction annually between 2014 and 2018.
Building Stock
Homes 3,741,000Shops 75,000Offices 55,000Industrial 61,000Other building 23,000
Key Projects
Regionally, the South East is the largest market for construction after London. Its compact and well-established population provides particular and varied challenges. This is reflected in the variety of the top projects in Barbour ABI’s database. From the speculative £9bn Gatwick Airport expansion to the very real Great Western Railway mainline electrification. From the ongoing £600m Kilnwood Vale new community to planning strife over two schemes intended to deliver more than 6,000 homes at Aylesbury. From plans for a £500m redevelopment of MoD Bicester to the £750m regeneration of Bracknell town centre. Meanwhile, there is a green light for the £420m new Royal Sussex County Hospital in Brighton and plans are taking shape for a £2bn theme park in Swanscombe Peninsula on the Thames. The need to provide homes, schools, hospitals, roads, rail, airports, offices, shops and places of leisure is intense in the region. But the pressures not to do so are equally intense. The balance can be swung by the ingenuity and skill of the construction industry delivering what people need as sympathetically and sustainably as possible.

CIOB – The Real Face of Construction 37
Construction firms’ performance in South East (£m)
Turnover Purchases Employ. costs
2008 32,787 20,090 5,444
2009 29,531 18,232 5,025
2010 29,315 18,582 4,937
2011 29,003 18,150 5,055
CONSTRUCTION OUTPUT BY SECTOR 2007 (INNER) TO 2013 (OUTER)
SOUTH EAST CONSTRUCTION OUTPUT AND ORDERS FOR NEW WORK (FOUR-QUARTER MOVING TOTAL £M CURRENT PRICES)
Employment by sector 2013 2007 Change
Agriculture, energy & water 104,000 84,300 19,700
Manufacturing 356,800 425,500 -68,700
Construction 327,700 358,400 -30,700
Distribution, hotels & restaurants 738,200 770,600 -32,400
Transport & communications 441,300 473,900 -32,600
Banking, finance and insurance 787,700 669,700 118,000
Public admin. education & health 1,262,400 1,117,800 144,600
Other services 243,700 239,700 4,000
OutputOrders (for new work only)(Source: ONS)
Mar 94 Mar 98 Mar 02 Mar 06 Mar 10 Mar 14 0
20,000
10,000
5,000
15,000
HousingPrivate industrialOther RMIInfrastructure
Private commercialPublic new workHousing RMI(Source: ONS)
52 53
54
55

38 CIOB – The Real Face of Construction
SOUTH WESTConstruction in the South West as a whole has fared better than in most regions, but the value of work done in cash terms in 2013 was still 6% lower than in 2007. The pain of collapsing private and commercial work was eased by a big rise in public building works and, to a lesser degree, increasing infrastructure work and housing refurbishment.
Housing refurbishment now accounts for about a quarter of all construction in the South West. This partly reflects the migration of older and wealthier people into the region who, in turn, spend heavily refurbishing their new homes.
Despite this shift to refurbishment, the loss of jobs was heavy; employment fell by 33,700 between 2007 and 2013, representing a 15% drop.
With Hinkley Point factored into its thinking, CSN expects infrastructure to drive the strongest regional growth. Infrastructure is expected to expand at an average 10% a year, pushing overall regional construction growth over the next four years to an average 3.5% a year, well above the 2.2% UK average. This comes despite an expectation that the regional economy will grow at an average annual rate of 1.8%, slower than the 2% national average.
Housing work, both new and refurbishment, will also provide solid support for growth.
CSN expects this level of growth to lead to a demand for about 6,370 new recruits to construction annually between 2014 and 2018. That is the largest of any region.
Building Stock
Homes 2,436,000Shops 53,000Offices 29,000Industrial 49,000Other building 17,000
Key Projects
The South West loses its youth to London and the bright lights of other big cities. In return, it receives older people looking for a higher quality of life. Construction is a critical component in catering for the reality, while also challenging this cliché. It delivers facilities to retain employment, while providing a desirable place to live. This can be seen in the region’s top projects taken from Barbour ABI’s database. The enormous £14bn Hinkley Point C Nuclear Power Station project clearly dominates. But dig deeper. There are £350m of works associated with the Great Western Railway electrification that will speed links to the region. Plans were approved for a £280m innovation park and 250 Passivhaus homes near Barnstaple. In Taunton, the Firepool redevelopment on an old livestock market progresses, with phase 2 worth £270m. Gloucester has its £250m Kings Square development. Swindon looks to its £220m Granville Street redevelopment. And northeast of Bristol there is the £250m Brimsham Park urban extension.

CIOB – The Real Face of Construction 39
Construction firms’ performance in South West (£m)
Turnover Purchases Employ. costs
2008 15,040 9,295 2,657
2009 13,280 8,221 2,380
2010 13,646 8,046 2,704
2011 13,330 8,337 2,466
CONSTRUCTION OUTPUT BY SECTOR 2007 (INNER) TO 2013 (OUTER)
SOUTH WEST CONSTRUCTION OUTPUT AND ORDERS FOR NEW WORK (FOUR-QUARTER MOVING TOTAL £M CURRENT PRICES)
Employment by sector 2013 2007 Change
Agriculture, energy & water 88,000 64,700 23,300
Manufacturing 253,300 286,100 -32,800
Construction 194,900 228,600 -33,700
Distribution, hotels & restaurants 523,300 517,500 5,800
Transport & communications 190,200 199,900 -9,700
Banking, finance and insurance 387,400 361,100 26,300
Public admin. education & health 756,800 722,000 34,800
Other services 147,700 143,100 4,600
OutputOrders (for new work only)(Source: ONS)
Mar 94 Mar 98 Mar 02 Mar 06 Mar 10 Mar 14 0
3,000
6,000
9,000
12,000
HousingPrivate industrialOther RMIInfrastructure
Private commercialPublic new workHousing RMI(Source: ONS)
56 57
58
59

40 CIOB – The Real Face of Construction
WHERE TO FROM HERE FOR THE CONSTRUCTION INDUSTRY? The recovery is taking hold. This is good news for construction, although it will bring the recurring growing pains associated with rebuilding the capacity after yet another deep and destructive recession.
These pains, like the pains of the recession, were not evenly spread either by region or by sector of the industry. The regional breakdowns show how different the experiences are in the north compared with the south of the Britain.
The industry must recruit a new generation of people into its ranks. Not only has it lost hundreds of thousands of its younger people, those that remained have aged and the retirement rate can be expected to rise.
Furthermore, the recovery will not be back to where things were before the global economic crisis. Much has changed since then.
The Internet has become ever more part of how we work, shop and entertain ourselves. This is already having a profound impact on the type of buildings and infrastructure required. The population has continued to expand rapidly through the downturn. This too will put different demands on the construction industry to those asked of it a decade ago. And the case to decarbonise the built environment has grown, not weakened.
All this means building different buildings and building them differently. It means adapting existing buildings rapidly to reshape the stock to better match new purposes and meet new standards.
These tough challenges come at a time when the industry is embracing a revolution in how it handles information and how buildings are designed, built and maintained with the introduction of BIM, soft landings and digital construction.
There are huge challenges just coping with the here and now. But there is a once-in-many-generations opportunity that has opened up. The global construction market is expanding rapidly. The demand for the skills British construction firms can deliver is growing almost exponentially.
This is an opportunity to place the country at the centre of the global construction industry. The prize is not simply the potential for expanding overseas earnings and improving our trade balance. Placing Britain as a global hub for construction design and consultancy would bring high-grade jobs for our youngsters. It would
bring fresh ideas to the industry from facing different challenges globally. It would provide the bedrock on which to build a world-beating construction product design industry.
If the challenge for policy makers is to rebalance the economy, then construction is the answer.
RECOMMENDATIONSRegional investment: As the data illustrates, the gap between London and the rest of the UK is widening and this needs to be addressed. Despite being a major attractor of funding for private and commercial building, London also grabs a far larger slice of investment in public sector non-domestic buildings and infrastructure per capita than do other regions of England. Its share is about 22%, while it accounts for just over 16% of the population.
The CIOB believes that regional investment is needed to:
3Improve infrastructure to increase inter-trading between urban areas outside London and to increase business efficiency.
3Regenerate regional cities to make them more attractive to inward investment, so they retain and increase their economic dynamism and talent, as well as enhance the wellbeing of their communities.
3Boost construction employment and encourage new blood into the industry in areas harder hit by the recession.
Tie public investment to training and job creation: The construction industry is exceptionally flexible and will find labour and resources as it requires them. It is essential that this process is both efficient and in the best interests of the nation and local communities, especially where public funds are being invested. The loss of skills is already driving, and will continue to drive, firms to look abroad for labour. This will increase the attractiveness of the UK to migrants, but of course a central pillar of Government policy is to reduce immigration. By investing in skills developed within the UK, the nation will work to both reduce unemployment at home and reduce the need to rely as heavily on talent from abroad.
The CIOB considers that any public investment made should be geared to the long-term aim of developing skilled young people who will be retained by the industry. This means not just training, but proper apprenticeship schemes and mentoring, developed

CIOB – The Real Face of Construction 41
and/or accredited by professional bodies, which retain newly-trained construction personnel. Monitoring of any arrangements must be well structured and funded. Examples exist on projects around the country, but scaling this up remains the challenge.
Construction innovation and excellence hubs: In key regions, the Government should seek to promote ‘clusters’ of construction-related businesses, each to act as a hub for excellence. Local Enterprise Partnerships (LEPs) could be the fundamental vehicle to achieve this.
These hubs would be strategically located near universities with a strong tradition in construction and engineering. They would operate in a similar way to existing science parks, helping to cluster a range of construction-related businesses, including architects, engineers, contractors, builders, building materials firms, surveyors and other specialists. Close physical proximity through this would mean that training and support could be delivered more efficiently and effectively.
The aim would be to stimulate innovation, create greater opportunities for networking and sharing of ideas, provide a beacon for budding construction managers, engineers and builders, support new construction-related businesses, and open up greater scope for collaboration. This would make regional firms far more effective in their local market and far more attractive in the wider UK and overseas economies. They would also attract regional offices of major national and international firms.
Incentives would need to be provided, perhaps in the form of lower rents, lower rates or enhanced services. The quid pro quo would be a willingness to provide stronger connections with universities, be that student placements, specialist lectures, or site visits.
Green investment: The Government must look beyond the short-term costs of decarbonising the UK built environment and at the longer-term outcomes. These do not just include the reduction in greenhouse gases and more efficient use of energy and other limited resources. The benefits of encouraging a greener UK construction industry will place the UK and its construction businesses on a higher ranking internationally when competing for the ever-growing market for environmentally sustainable construction solutions. Green does not automatically mean more expensive.
Standards and regulation: The Government is right to seek to reduce the regulatory burden on business. But this should not come through dilution of standards; rather the opposite. The development of standards needs to take a longer-term
view, and they should be future proofed so that they are not in such constant flux. This will do more to reduce the regulatory burden on businesses and their supply chains as it will reduce uncertainty and the demands of adapting and readapting to rapidly changing standards. Stable long-term policies that provide clear pathways for businesses encourage a secure pipeline of training, innovation and investment.
Ethics: The UK is seen internationally as a bastion of fairness and transparency. But this reputation can easily be undermined.
CIOB research50 has shown that construction in the UK is susceptible to corruption, particularly as recent squeezed tender margins and reduced workloads have pressurised some businesses into corrupt practices as a means to survive. The Government must maintain vigilance and be seen as a driver for improving transparency and ethical standards in construction. This means investment in developing policies to enhance ethical standards, in policing the standards set and in prosecuting those who transgress.
Leadership and better behavioural understanding: Much emphasis in construction thinking and policy making focuses on the processes. Very little work is undertaken into the behavioural aspects of construction. The transformation of the UK car industry in the 1980s owes as much, if not more, of its success to improved understanding of and changes to behaviours (‘soft side’) as it does to changes to processes (‘hard side’) within the workplace. By comparison with the car industry, construction is more stressed, less certain, more complex and has more interfaces between firms and people.
Huge improvement may be possible through an improved understanding of soft skills. This was recognised in the Supply Chain Analysis into the Construction Industry51 research which was conducted in support of the Construction 2025 Industrial Strategy.
The Government should seek to support and/or prompt more research in conjunction with the industry into behavioural issues within construction. This would not only help to inform the introduction of better practises, but also help immediately to better inform management decisions and site leadership.

42 CIOB – The Real Face of Construction
APPENDIX 1 – CONSTRUCTION OUTPUT IN 2013 BY TYPE £ MILLION AT CURRENT PRICES52
All construction work 121,208
All new work 74,751
All new housing 22,563
Public housing 4,302
Private housing 18,261
All new infrastructure 14,944
Water 1,561
Sewerage 540
Electricity 3,657
Roads 2,559
Railways 4,600
Harbours 588
Other 1,439
Public non-housing new work 10,237
Factories 56
Warehouses 44
Oil, Steel, Coal 38
Schools & Colleges 4,246
Universities 1,134
Health 1,989
Offices 794
Entertainment 764
Garages, Shops 128
Agriculture, Miscellaneous 1,044
Private industrial new work 3,508
Factories 2,083
Warehouses 1,150
Oil, Steel, Coal 276
Private commercial new work 23,499
Schools, Universities 2,906
Health 1,190
Offices 6,945
Entertainment 4,852
Garages 424
Shops 4,488
Agriculture, Miscellaneous 2,695
All repair and maintenance 46,458
Public housing repair maintenance and improvement 7,500
Private housing repair maintenance and improvement 15,965
All housing repair maintenance and improvement 23,468
Infrastructure repair and maintenance 8,052
Public non-housing Infrastructure repair and maintenance 5,274
Private non-housing Infrastructure repair and maintenance 9,659

CIOB – The Real Face of Construction 43
APPENDIX 2 – CITB CONSTRUCTION SKILLS NETWORK INDUSTRY EMPLOYMENT PROJECTIONS53
Occupation 2014 2018 ARR*
Senior, executive, and business process managers 162,350 172,860 2,310
Construction project managers 47,440 51,630 400
Other construction process managers 183,380 201,900 640
Non-construction prof., tech., IT & other office-based staff 328,890 338,400 6,570
Construction trades supervisors 48,000 51,620 570
Wood trades and interior fit-out 244,700 260,860 4,260
Bricklayers 60,470 61,080 1,740
Building envelope specialists 99,540 103,300 1,520
Painters and decorators 104,600 106,700 2,680
Plasterers 44,330 42,630 1,050
Roofers 44,430 46,200 1,110
Floorers 27,380 27,810 510
Glaziers 29,240 29,640 770
Specialist building operatives nec** 50,760 51,470 650
Scaffolders 23,150 25,420 570
Plant operatives 39,850 42,310 530
Plant mechanics/fitters 38,710 45,210 1,880
Steel erectors/structural fabrication 22,710 21,940 110
Labourers nec** 111,910 109,420 1,230
Electrical trades and installation 176,720 185,470 1,950
Plumbing and HVAC Trades 154,810 159,130 1,540
Logistics 20,170 20,450 940
Civil engineering operatives nec** 22,430 25,220 440
Non-construction operatives 28,460 27,040 -
Civil engineers 51,940 54,940 1,170
Other construction professionals and technical staff 188,640 205,580 630
Architects 44,120 46,370 290
Surveyors 66,910 73,770 340
*ARR: Annual recruitment requirement which takes into account flows into and out of construction
**nec: not elsewhere classified

44 CIOB – The Real Face of Construction
NOTES AND REFERENCES
1 Gross fixed capital formation excluding intangible assets (intellectual property, goodwill etc.) at current prices. No account or adjustments have been made for external trade. ONS Gross Fixed Capital Formation – by sector and asset, 22 May 2014
2 Net Capital Stock at current prices. ONS tables for capital stock were available up to 2009. The figures represent CIOB estimated projections from ONS Capital stock, capital consumption and non-financial balance sheets, 2010, 2 August 2010
3 ONS, The Blue Book 2013, 31 July 2013
4 Gross Capital Stock at current prices. ONS tables for capital stock were available up to 2009. The figures represent CIOB estimated projections from ONS, Capital stock, capital consumption and non-financial balance sheets, 2010, 2 August 2010
5 Social impact of poor housing, Danny Freidman, Ecotec, March 2010 (link: http://www.settledhousing.co.uk/Portals/0/Socialmpactpoorhousing%5B1%5D.pdf )
6 Bold thinking A model to fund our future roads, Sana Nabi, CBI & Aggregate Industries, October 2012 (link: http://www.cbi.org.uk/media/1775599/cbi_roads_funding_report.pdf )
7 UK Green Building Council (link: http://www.ukgbc.org/content/energy-and-carbon)
8 DECC, Energy Consumption in the UK, Overall data tables, 2013 update
9 Gross Value Added at constant prices, ONS, GDP(O) Low Level Aggregates 2014 Q1 – Month 2, 22 May 2014
10 ONS, April 2014 Output in the Construction Industry dataset, 16 June 2014
11 ONS, The Blue Book 2013: Chapter 02: The Industrial Analyses, Table 2.1d: Summary Supply and Use Tables for the United Kingdom, 2011, 31 July 2013
12 BIS UK construction: an economic analysis of the sector, a supporting document to Construction 2025: industrial strategy for construction - government and industry in partnership, 2 July 2013
13 Provided in a note for this report by Dr Stephen Gruneberg: The question of the size of construction as a percentage of the economy rests on the difference between the net contribution of construction as an on-site activity only (i.e. the last stage in a process of assembly), and the share of the production of the built environment as a final good. Construction value added represents 7.4% of all value added, a concept used to establish the total size of the economy, avoiding counting the inputs into the construction process from other sectors such as manufacturing, real estate etc. When you take them into account then the value of construction output (i.e. GDP) increases. As the size of the economy remains the same,
the result is that construction is 15.3% of the economy. If this method were applied to aggregate all sectors of the economy there would be double counting in some areas and so, in theory, one would need to subtract those inputs from the relevant manufacturing sectors and do the same in other sectors to get an idea of how final goods make up the economy. The reason for this issue is that the share of construction in GDP is based on value added, which is used to find the total size of the economy without double counting, not the relative importance of construction gross output as a measure of an industry producing final goods. Dr Stephen Gruneberg is Reader at the Faculty of Architecture and the Built Environment University of Westminster. He is an expert in construction economics and the measurement of construction output
14 Workforce jobs by industry, ONS, Labour Market Statistics, May 2014 Release
15 These figures, which are not easily verifiable, are taken from company website. Laing O’Rourke’s consolidated accounts are filed off-shore. Its UK arm, Laing O’Rourke plc, files accounts at Companies House which show revenue of £1.6bn for the financial year 2013
16 This figure is taken from the company accounts
17 Number of enterprises by employment sizeband, ONS, Annual Business Survey 2012 Provisional Results, 14 November 2013
18 DCLG Statistics, Live tables on house building
19 Homes for the future: more affordable, more sustainable - Housing Green Paper, DCLG, July 2007
20 Estimating Housing Need, Professor Glen Bramley et al, DCLG, November 2010
21 The real cost of poor housing, M Davidson, M Roys, S Nicol, D Ormandy and P Ambrose, BRE, February 2010
22 Social impact of poor housing, Danny Friedman, Ecotec, March 2010
23 Counting Costs: The Economic and Social Impact of Reduced Mobility in Social Housing, Kevin Gulliver, Shelter, July 2010
24 Introducing NHS Property Services Ltd, NHS Property Services, July 2013
25 Carbon Reduction Strategy, Extended Chapter on Energy and Carbon Management, Sustainable Development Unit
26 Carbon Reduction Strategy, Extended Chapter on Designing the Built Environment, Sustainable Development Unit
27 ONS, April 2014 Output in the Construction Industry dataset, 16 June 2014, Table 2a & Output in the Construction Industry: April 2013 Table 2, adjusted from 2005 constant prices to 2010 constant prices

CIOB – The Real Face of Construction 45
28 Workforce jobs in construction seasonally adjusted, Workforce jobs by industry, ONS, Labour Market Statistics, May 2014 Release
29 Construction Products Association, Construction industry forecasts 2013-2017, Spring 2014
30 Employment in construction, ONS via nomis (Crown Copyright Reserved), annual population survey
31 United Kingdom Balance of Payments - The Pink Book, 2013 Part 1, Chapter 3 Tables: Trade in services, 31 July 2013
32 Health and Safety Executive, Table HISTINJ, Reported injuries in Great Britain by main industry and severity of injury, 1981 - 2000/01 and 2001/02 - 2012/13p. Note: deaths include members of the public, an average of 5 annually over the latest 10 years
33 Defra, Waste and recycling statistics, Demolition and Excavation waste generation estimate: England, 2010, March 2012 & DEFRA, Total UK Waste Generation by Sector 2004 to 2008, August 2011
34 Defra, Waste and recycling statistics, Total UK Waste Generation by Sector 2004 to 2008, August 2011
35 Defra, Waste and recycling statistics, Demolition and Excavation waste generation estimate: England, 2010, March 2012
36 House of Commons, No More Lost Generations, a cross-party parliamentarians’ inquiry, February 2014
37 Cabinet Office, Government Construction Strategy, May 2011
38 ONS, April 2014 Output in the Construction Industry dataset, 16 June 2014
39 ONS, Regional Gross Value Added (Income Approach) NUTS1 Tables. 11 December 2013
40 ONS, Annual population survey - workplace analysis, via nomis (Crown Copyright Reserved), download 12 June 2014
41 ONS, Annual population survey - workplace analysis, via nomis (Crown Copyright Reserved), download 12 June 2014
42 ONS, Annual population survey - workplace analysis, via nomis (Crown Copyright Reserved), download 12 June 2014
43 CITB, Construction Skills Network, Blueprint for Construction 2014-2018, January 2014
44 ONS, April 2014 Output in the Construction Industry dataset, 16 June 2014, the orders data does not include repair maintenance
45 ONS, Annual population survey - workplace analysis, via nomis (Crown Copyright Reserved), download 12 June 2014
46 Orders for New Construction: 2014 Q1, 13 June 2014
47 CITB, Construction Skills Network, Blueprint for Construction 2014-2018, January 2014
48 Valuation Office Agency, Business Floorspace (Experimental Statistics), May 2012 and Scottish Assessors Association, Valuation Roll by Property Classification Code/Assessor/Local Authority, downloaded 16 June, estimates made as appropriate
49 From a list of contracts kindly provided by Construction Industry Data Business Barbour ABI, June 2014
50 CIOB, Corruption in the Construction Industry, 2 October 2013
51 BIS, Supply chain analysis into the construction industry: a report for the construction industrial strategy, 23 October 2013
52 ONS, April 2014 Output in the Construction Industry dataset, 16 June 2014
53 CITB, Construction Skills Network, Blueprint for Construction 2014-2018, January 2014
NOTES AND REFERENCES

46 CIOB – The Real Face of Construction
YOUR NOTES

CIOB – The Real Face of Construction 47

The Chartered Institute of Building, 1 Arlington Square, Downshire Way, Bracknell, RG12 1WA, UKTel: +44 (0) 1344 630700Registered Charity No. (England and Wales) 280795 and (Scotland) SC04172 Copyright CIOB 2014