Embed Size (px)
Citation preview

THE REAL ESTATE BOARD OF NEW YORKNEW YORK CITY RESIDENTIAL SALES REPORT | FOURTH QUARTER 2017

NEW YORK CITY RESIDENTIAL SALES REPORT 4Q17 | 2
TABLE OF CONTENTS
Executive Summary
Total Consideration
Total Consideration History
All Homes
Condominiums
Cooperatives
One-To-Three Family Dwellings
Neighborhood Highlights
Bronx
Brooklyn
Manhattan
Queens
Staten Island
Appendix - Sales Data
Citywide and Borough
Bronx
Brooklyn
Manhattan
Queens
Staten Island
Manhattan Townhouse
3
3
3
4
5
6
7
8
8
9
10
11
12
13
13
17
22
32
36
46
50

NEW YORK CITY RESIDENTIAL SALES REPORT 4Q17 | 3
EXECUTIVE SUMMARY
The New York City residential sales market recorded a 12 percent decrease in citywide consideration (monetary value for completed transactions) totaling $10.7 billion in the fourth quarter of 2017, compared with the fourth quarter of 2016.
Despite the citywide decline this quarter, the overall consideration for all home sales completed in New York City in 2017 notched an all-time high of $50 billion. This consideration peak was driven by the $11.1 billion record high annual consideration achieved in Brooklyn.
Total residential sales consideration increased in three of the five boroughs during the fourth quarter of 2017 when compared to last year’s fourth quarter. Total residential sales consideration increased: four percent to $2.40 billion in Brooklyn; 12 percent to $2.35 billion in Queens; and 17 percent to $455 million in the Bronx. Total consideration decreased 12 percent to $4.79 billion in Manhattan and four percent to $675 million in Staten Island.
Citywide home sales volume decreased slightly in the fourth quarter of 2017 compared to the fourth quarter of 2016. The number of sales for all homes in the City slipped two percent from the fourth quarter of last year to 11,631. Year-over-year, the total number of home sales fell: five percent to 2,655 in Manhattan; one percent to 2,665 in Brooklyn; and 11 percent to 1,289 in Staten Island. Home sales increased one percent in the fourth quarter of 2017 to 3,943 in Queens and 10 percent to 1,079 sales in the Bronx.
The number of home sales ranging from $1 million to less than $3 million experienced a 10 percent jump, the largest increase in home sales by price range, in the fourth quarter of 2017 compared to the fourth quarter of 2016. Home sales recorded at $5 million or greater dropped 38 percent year-over-year, the biggest decrease in sales by price range this quarter.
TOTAL CONSIDERATION Borough Residential Sales 4Q17 Residential Sales 3Q17 Residential Sales 4Q16
NYC $10,663,940,105 $13,465,436,215 $10,958,502,541
Manhattan $4,785,762,552 $6,628,897,897 $5,459,898,885
Bronx $455,176,802 $448,159,688 $388,406,656
Brooklyn $2,402,293,284 $3,053,546,470 $2,320,321,464
Queens $2,345,498,807 $2,547,805,127 $2,089,441,978
Staten Island $675,208,659 $787,027,033 $700,433,557
Borough % Δ From 3Q17 % Δ From 4Q16
NYC -26.27% -2.69%
Manhattan -38.51% -12.35%
Bronx 1.54% 17.19%
Brooklyn -27.11% 3.53%
Queens -8.63% 12.25%
Staten Island -16.56% -3.60%
AVERAGE SALES PRICE % Δ FROM 4Q16TOTAL CONSIDERATION HISTORY
-20%
-15%
-10%
-5%
0%
5%
10%
15%
20%
25%
30%
35%
40%
45%
One-to-Three Family DwellingsCoopsCondosAll Homes
Staten IslandQueensBrooklynBronxManhattanNew York City
3000
6000
9000
12000
15000
0
3000
6000
9000
12000
15000
Con
side
ratio
n
Num
ber o
f Sal
es
4q17
2q17
4q16
2q16
4q15
2q15
4q14
2q14
4q13
2q13
4q12
2q12
4q11
2q11
4q10
2q10
4q09
2q09
4q08

NEW YORK CITY RESIDENTIAL SALES REPORT 4Q17 | 4
EXECUTIVE SUMMARY
ALL HOMES
-42
-20
0
36%
20
CONDOMINIUMS %Δ FROM 4Q16
COOPERATIVES %Δ FROM 4Q16
1-3 FAMILY DWELLINGS %Δ FROM 4Q16
The average sales price for a home (cooperatives, condominiums, and one-to-three-family dwellings) in New York City decreased one percent year-over-year to $917,000 in the fourth quarter of 2017. The average sales price of a home in Manhattan decreased seven percent from last year’s fourth quarter to $1,803,000.
When compared to the fourth quarter of last year, the average sales price of a home in Brooklyn rose five percent to $901,000; in Queens, grew 11 percent to $595,000; in the Bronx, increased seven percent to $422,000; and in Staten Island, rose eight percent to $524,000.
ALL HOMES - 4Q17 AVERAGE SALES PRICE CHANGE FROM 4Q16

NEW YORK CITY RESIDENTIAL SALES REPORT 4Q17 | 5
EXECUTIVE SUMMARY
CONDOMINIUMS
-40
-59
-20
0
135%
80
60
40
20
ALL HOMES %Δ FROM 4Q16
COOPERATIVES %Δ FROM 4Q16
1-3 FAMILY DWELLINGS %Δ FROM 4Q16
The average sales price of a condominium unit in New York City decreased 14 percent to $1,573,000 in the fourth quarter of 2017. The average sales price for a condominium in Manhattan was $2,405,000 in the fourth quarter of 2017, a 19 percent decrease year-over-year. This was the lowest average sales price posted for a Manhattan condo since the fourth quarter of 2015. The
average sales price for a condo in Brooklyn during the fourth quarter of 2017 was $1,014,000, a three percent increase year-over-year. High priced sales in Flushing and Long Island City pushed up the average sales price for a condo unit in Queens to $704,000, a 32 percent increase year-over-year.
CONDOMINIUMS - 4Q17 AVERAGE SALES PRICE CHANGE FROM 4Q16

NEW YORK CITY RESIDENTIAL SALES REPORT 4Q17 | 6
EXECUTIVE SUMMARY
COOPERATIVES
-41
-20
0
70%
40
20
ALL HOMES %Δ FROM 4Q16
CONDOMINIUM %Δ FROM 4Q16
1-3 FAMILY DWELLINGS %Δ FROM 4Q16
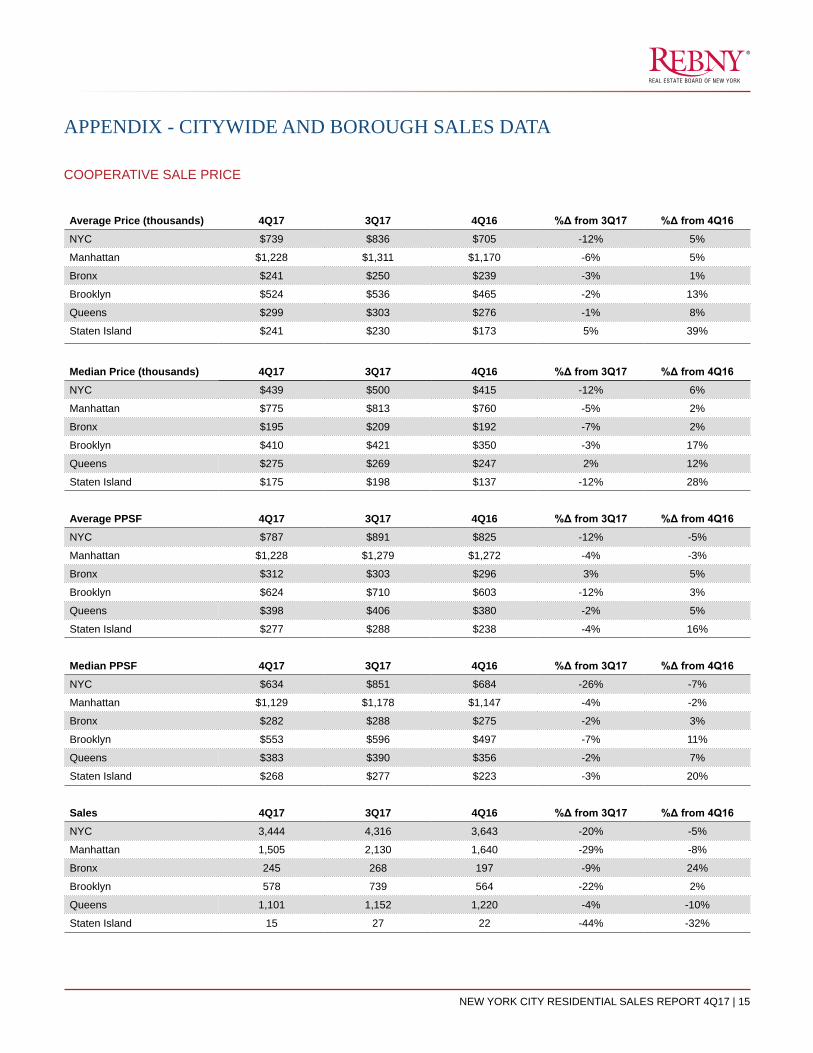
The average sales price of a cooperative unit in New York City during the fourth quarter of 2017 was $739,000, up five percent from last year’s fourth quarter average. The average sales price of a coop
in Manhattan increased five percent to $1,228,000; in Brooklyn, 13 percent to $524,000; and in Queens, eight percent to $299,000.
COOPERATIVES - 4Q17 AVERAGE SALES PRICE CHANGE FROM 4Q16

NEW YORK CITY RESIDENTIAL SALES REPORT 4Q17 | 7
EXECUTIVE SUMMARY
ONE-TO-THREE FAMILY DWELLINGS
-40
-20
-84
-60
0
91%
60
40
20
ALL HOMES %Δ FROM 4Q16
CONDOMINIUMS %Δ FROM 4Q16
COOPERATIVES %Δ FROM 4Q16
The average sales price of a one-to-three family dwelling in New York City during the fourth quarter of 2017 was $775,000, an eight percent increase from last year’s fourth quarter average.
The average sales price for a one-to-three family dwelling in the Bronx registered a new record high of $515,000 in the fourth quarter of 2017, which surpassed the previous peak of $507,000 recorded in the fourth quarter of 2006. This quarter’s average sales price in
the Bronx was 12 percent higher than last year’s fourth quarter average.
The average sales price for a one-to-three family dwelling increased five percent to $1,004,000 in Brooklyn; six percent to $710,000 in Queens; and eight percent to $551,000 in Staten Island. The average sales prices for a one-to-three family dwelling in Queens and Staten Island breached their previous all-time highs, which were set just last quarter.
ONE-TO-THREE FAMILY DWELLINGS - 4Q17 AVERAGE SALES PRICE CHANGE FROM 4Q16

RiverdaleFieldston
KingsbridgeJerome ParkBedford Park
Norwood
WoodlawnWilliamsbridge
BaychesterCoop City
BronxdalePelham Garden
Pelham Parkway North
Pelham Parkway SouthMorris Park
Van Nest
ParkchesterWestchester Square
Castle HillSoundview
City IslandPelham BayPelham StripCountry ClubThrogs NeckSchuylerville
FordhamBelmont
Kingsbridge HeightsUniversity Heights
HighbridgeMorris Heights
Mount HopeBathgate
Crotona ParkEast Tremont
MelroseMorrisania
Mott HavenPort MorrisHunts Point
NEW YORK CITY RESIDENTIAL SALES REPORT 4Q17 | 8
BRONX NEIGHBORHOOD HIGHLIGHTS
There were 129 one-to-three family home sales in Woodlawn / Williamsbridge this quarter, an eight percent increase year-over-year. The average sales price of a one-to-three family dwelling in the area was $482,000, an increase of 14 percent from the fourth quarter of 2016.
City Island / Pelham Bay / Pelham Strip / Country Club / Throgs Neck / Schuylerville had 126 one-to-three family dwelling sales this quarter, which was a one percent decrease from the fourth quarter of 2016. The average sales price of a one-to-three family dwelling in the area was $531,000, an increase of 11 percent year-over-year.

Greenpoint
Williamsburg
BushwickWycoff Heights
Cypress Hills
East New YorkSpring Creek
Canarsie
BergenBeach
MillBasin
GerritsenBeachSheepshead
Bay
Marine ParkMadison
ManhattanBeach
BrightonBeachConey
IslandSea Gate
GravesendMapleton
Bath Beach
Bemsonhurst
DykerHeights
Bay RidgeFort Hamilton
BoroughPark
KensingtonParkville
Midwood
FlatbushProspect
Park South
WindsorTerrace
Prospect Lefferts Gardens
BrownsvilleOcean Hill
Crown Heights
Bedford Stuyvesant
ProspectHeights
ParkSlope
Sunset Park
Red Hook
Columbia StreetWaterfront District
Cobble Hill
Brooklyn Heights
Vinegar HillDUMBO
Downtown
CarrollGardens
Gowanus
BoerumHill
ClintonHill
FortGreene
EastFlatbush
Flatlands
NEW YORK CITY RESIDENTIAL SALES REPORT 4Q17 | 9
BROOKLYN NEIGHBORHOOD HIGHLIGHTS
The average sales price of a Williamsburg condo decreased five percent this quarter to $1,138,000 compared to the fourth quarter of 2016. The number of condo sales in the neighborhood this quarter decreased 54 percent to 65 from 140 in the fourth quarter of 2016.
In Canarsie, the average sales price of a one-to-three family dwelling increased eight percent to $514,000 compared to the fourth quarter of last year. Year-over-year, the number of sales in Canarsie increased 39 percent to 122.

Inwood
Washington Hieghts
WestHarlem
Morningside Heights
East Harlem
Upper West Side
Upper East Side
Roosevelt Island
Midtown East
Gramercy Kips Bay
Midtown West
ChelseaFlatiron
Murray Hill
East Village
GreenwichVillage
West Village
SoHo
LowerEast Side
Tribeca
Battery Park City Financial
Seaport
NEW YORK CITY RESIDENTIAL SALES REPORT 4Q17 | 10
MANHATTAN NEIGHBORHOOD HIGHLIGHTS
In the fourth quarter of 2017, the average sales price of a condominium in the Financial District/South Street Seaport (Financial/Seaport) increased 44 percent to $1,695,000 compared to the fourth quarter of 2016. There were 83 sales in Financial/Seaport during the fourth quarter of 2017, an increase of 48 percent from the fourth quarter of last year.
Sales of cooperative units on the Upper East Side decreased nine percent this quarter to 381 compared to 417 in the fourth quarter of 2016. The average sales price of a coop unit on the Upper East Side decreased two percent year-over-year to $1,565,000.

Astoria
Long Island City
Middle VillageMaspeth
RidgewoodGlendale
Richmond HillSouth Ozone Park
Woodhaven
Howard Beach
Broad Channel
Breezy PointBelle Harbor
Rockaway Park
RockawaysAverne
LaureltonCambria Heights
St. AlbansRosedale
Queens VillageHollis
Jamaica EstatesHolliswood
Fresh Meadows Oakland Gardens
Springfield GardensJamaica
South JamaicaBaisley Park
BriarwoodJamaica Hills
Hillcrest
Jackson Heights
Elmhurst
Rego ParkForest Hills
Kew Gardens
CoronaEast
ElmhurstSunnysideWoodside
Flushing
WhitestoneBeechhurst
College Point
Bayside DouglastonLittle Neck
Floral ParkBellerose
NEW YORK CITY RESIDENTIAL SALES REPORT 4Q17 | 11
QUEENS NEIGHBORHOOD HIGHLIGHTS
Flushing continued to record the most condominium activity in Queens this quarter with 125 sales, an 84 percent increase from the fourth quarter of 2016. The average sales price of a condominium in Flushing was $961,000, a 79 percent increase year-over-year.
Rego Park / Forest Hills / Kew Gardens had 267 cooperative unit sales in the fourth quarter of 2017, a 17 percent decrease from the fourth quarter of last year. The average sales price of a cooperative unit in Rego
Park / Forest Hills / Kew Gardens was $334,000, a 15 percent increase from the fourth quarter of last year.
The number of one-to-three family dwelling sales in Richmond Hill/ South Ozone Park / Woodhaven increased nine percent to 347 sales this quarter compared to last year. Year-over-year, the average sales price of a one-to-three family dwelling in the area increased six percent to $558,000.

Arrochar / Shore Acres
Concord
Concord / Fox Hills
Stapleton Clifton
Stapleton
Tompkinsville
New BrightonSt. George
New BrightonLivingston
West New Brighton
SilverLakeClove
Lakes
GrymesHill
Sunnyside
ManorHeights
CastletonCorners
BullsHead
MarinersHarbor
PortRichmond
PortIvory
Bloomfield
Westerleigh
Willowbrook
Tottenville
RossvilleRichmond Valley
Rossville Charleston
RossvillePort Mobil
Pleasant Plains
Prince’sBay
HuguenotWoodrow
Rossville
Fresh Kills
Travis
Arden Heights
Annadale
Eltingville
Great Kills
Richmond
Oakwood
Great KillsBay Terrace
Oakwood Beach
New Dorp Beach
New Dorp
Midland Beach
Grant City
TodtHill
South Beach
DoganHills
Dogan Hills - Old Town
DoganHills-Colony
EmersonHill
GrasmereArrochar
Rosebank
New Springville
Richmond Lighthouse Hill
New Dorp Heights
NEW YORK CITY RESIDENTIAL SALES REPORT 4Q17 | 12
STATEN ISLAND NEIGHBORHOOD HIGHLIGHTS
The average sales price for a one-to-three family dwelling in Staten Island rose eight percent from the fourth quarter of 2016 to $551,000 in the fourth quarter of 2017.
The total number of one-to-three family dwelling sales in Staten Island declined 11 percent year-over-year to 1,139.

NEW YORK CITY RESIDENTIAL SALES REPORT 4Q17 | 13
APPENDIX - CITYWIDE AND BOROUGH SALES DATA
HOME SALE PRICE (includes all condominium, cooperative units, & one-to-three family dwellings)
Average Price (thousands) 4Q17 3Q17 4Q16 %Δ from 3Q17 %Δ from 4Q16NYC $917 $987 $924 -7% -1%
Manhattan $1,803 $1,839 $1,931 -2% -7%
Bronx $422 $414 $395 2% 7%
Brooklyn $901 $969 $858 -7% 5%
Queens $595 $594 $535 0% 11%
Staten Island $524 $521 $486 1% 8%
Median Price (thousands) 4Q17 3Q17 4Q16 %Δ from 3Q17 %Δ from 4Q16NYC $618 $650 $575 -5% 7%
Manhattan $1,013 $1,075 $967 -6% 5%
Bronx $418 $401 $390 4% 7%
Brooklyn $735 $770 $695 -5% 6%
Queens $525 $525 $469 0% 12%
Staten Island $499 $495 $457 1% 9%
Average PPSF 4Q17 3Q17 4Q16 %Δ from 3Q17 %Δ from 4Q16NYC $685 $743 $659 -8% 4%
Manhattan $1,485 $1,489 $1,491 0% 0%
Bronx $289 $282 $268 2% 8%
Brooklyn $654 $712 $599 -8% 9%
Queens $473 $475 $409 -1% 16%
Staten Island $335 $329 $300 2% 12%
Median PPSF 4Q17 3Q17 4Q16 %Δ from 3Q17 %Δ from 4Q16NYC $481 $519 $438 -7% 10%
Manhattan $1,350 $1,376 $1,304 -2% 4%
Bronx $262 $262 $248 0% 6%
Brooklyn $566 $600 $510 -6% 11%
Queens $424 $422 $381 1% 11%
Staten Island $319 $313 $283 2% 13%
Sales 4Q17 3Q17 4Q16 %Δ from 3Q17 %Δ from 4Q16NYC 11,631 13,636 11,837 -15% -2%
Manhattan 2,655 3,604 2,801 -26% -5%
Bronx 1,079 1,082 983 0% 10%
Brooklyn 2,665 3,152 2,703 -15% -1%
Queens 3,943 4,287 3,908 -8% 1%
Staten Island 1,289 1,511 1,442 -15% -11%

NEW YORK CITY RESIDENTIAL SALES REPORT 4Q17 | 14
APPENDIX - CITYWIDE AND BOROUGH SALES DATA
CONDOMINIUM SALE PRICE
Average Price (thousands) 4Q17 3Q17 4Q16 %Δ from 3Q17 %Δ from 4Q16NYC $1,573 $1,667 $1,837 -6% -14%
Manhattan $2,405 $2,524 $2,963 -5% -19%
Bronx $244 $246 $249 -1% -2%
Brooklyn $1,014 $1,154 $983 -12% 3%
Queens $704 $723 $535 -3% 32%
Staten Island $326 $321 $301 2% 8%
Median Price (thousands) 4Q17 3Q17 4Q16 %Δ from 3Q17 %Δ from 4Q16NYC $925 $990 $890 -7% 4%
Manhattan $1,465 $1,537 $1,550 -5% -5%
Bronx $185 $190 $159 -3% 17%
Brooklyn $857 $931 $806 -8% 6%
Queens $583 $685 $480 -15% 21%
Staten Island $325 $305 $295 7% 10%
Average PPSF 4Q17 3Q17 4Q16 %Δ from 3Q17 %Δ from 4Q16NYC $1,219 $1,259 $1,267 -3% -4%
Manhattan $1,686 $1,699 $1,765 -1% -4%
Bronx $265 $257 $256 3% 4%
Brooklyn $979 $1,042 $853 -6% 15%
Queens $770 $828 $576 -7% 34%
Staten Island $322 $320 $273 1% 18%
Median PPSF 4Q17 3Q17 4Q16 %Δ from 3Q17 %Δ from 4Q16NYC $1,208 $1,206 $1,180 0% 2%
Manhattan $1,538 $1,563 $1,527 -2% 1%
Bronx $224 $220 $203 2% 10%
Brooklyn $1,036 $1,106 $806 -6% 29%
Queens $698 $811 $553 -14% 26%
Staten Island $311 $307 $259 1% 20%
Sales 4Q17 3Q17 4Q16 %Δ from 3Q17 %Δ from 4Q16NYC 2,227 2,933 2,235 -24% 0%
Manhattan 1,111 1,432 1,117 -22% -1%
Bronx 124 118 90 5% 38%
Brooklyn 495 710 574 -30% -14%
Queens 362 522 310 -31% 17%
Staten Island 135 151 144 -11% -6%
NEW YORK CITY RESIDENTIAL SALES REPORT 4Q17 | 15
APPENDIX - CITYWIDE AND BOROUGH SALES DATA
COOPERATIVE SALE PRICE
Average Price (thousands) 4Q17 3Q17 4Q16 %Δ from 3Q17 %Δ from 4Q16NYC $739 $836 $705 -12% 5%
Manhattan $1,228 $1,311 $1,170 -6% 5%
Bronx $241 $250 $239 -3% 1%
Brooklyn $524 $536 $465 -2% 13%
Queens $299 $303 $276 -1% 8%
Staten Island $241 $230 $173 5% 39%
Median Price (thousands) 4Q17 3Q17 4Q16 %Δ from 3Q17 %Δ from 4Q16NYC $439 $500 $415 -12% 6%
Manhattan $775 $813 $760 -5% 2%
Bronx $195 $209 $192 -7% 2%
Brooklyn $410 $421 $350 -3% 17%
Queens $275 $269 $247 2% 12%
Staten Island $175 $198 $137 -12% 28%
Average PPSF 4Q17 3Q17 4Q16 %Δ from 3Q17 %Δ from 4Q16NYC $787 $891 $825 -12% -5%
Manhattan $1,228 $1,279 $1,272 -4% -3%
Bronx $312 $303 $296 3% 5%
Brooklyn $624 $710 $603 -12% 3%
Queens $398 $406 $380 -2% 5%
Staten Island $277 $288 $238 -4% 16%
Median PPSF 4Q17 3Q17 4Q16 %Δ from 3Q17 %Δ from 4Q16NYC $634 $851 $684 -26% -7%
Manhattan $1,129 $1,178 $1,147 -4% -2%
Bronx $282 $288 $275 -2% 3%
Brooklyn $553 $596 $497 -7% 11%
Queens $383 $390 $356 -2% 7%
Staten Island $268 $277 $223 -3% 20%
Sales 4Q17 3Q17 4Q16 %Δ from 3Q17 %Δ from 4Q16NYC 3,444 4,316 3,643 -20% -5%
Manhattan 1,505 2,130 1,640 -29% -8%
Bronx 245 268 197 -9% 24%
Brooklyn 578 739 564 -22% 2%
Queens 1,101 1,152 1,220 -4% -10%
Staten Island 15 27 22 -44% -32%

NEW YORK CITY RESIDENTIAL SALES REPORT 4Q17 | 16
APPENDIX - CITYWIDE AND BOROUGH SALES DATA
ONE - THREE FAMILY DWELLING SALE PRICE
Average Price (thousands) 4Q17 3Q17 4Q16 %Δ from 3Q17 %Δ from 4Q16NYC $775 $778 $719 0% 8%
Manhattan $6,818 $5,291 $5,241 29% 30%
Bronx $515 $506 $458 2% 12%
Brooklyn $1,004 $1,079 $955 -7% 5%
Queens $710 $697 $667 2% 6%
Staten Island $551 $549 $512 0% 8%
Median Price (thousands) 4Q17 3Q17 4Q16 %Δ from 3Q17 %Δ from 4Q16NYC $625 $620 $580 1% 8%
Manhattan $5,000 $4,075 $3,100 23% 61%
Bronx $499 $497 $445 1% 12%
Brooklyn $803 $837 $790 -4% 2%
Queens $665 $650 $631 2% 5%
Staten Island $520 $526 $478 -1% 9%
Average PPSF 4Q17 3Q17 4Q16 %Δ from 3Q17 %Δ from 4Q16NYC $448 $439 $410 2% 9%
Manhattan $1,957 $1,635 $1,323 20% 48%
Bronx $287 $281 $264 2% 9%
Brooklyn $559 $580 $539 -4% 4%
Queens $450 $424 $404 6% 11%
Staten Island $337 $331 $304 2% 11%
Median PPSF 4Q17 3Q17 4Q16 %Δ from 3Q17 %Δ from 4Q16NYC $384 $374 $354 3% 8%
Manhattan $1,405 $1,443 $1,042 -3% 35%
Bronx $268 $262 $252 2% 6%
Brooklyn $497 $495 $479 0% 4%
Queens $411 $392 $379 5% 9%
Staten Island $323 $317 $291 2% 11%
Sales 4Q17 3Q17 4Q16 %Δ from 3Q17 %Δ from 4Q16NYC 5,980 6,387 5,959 -6% 0%
Manhattan 39 42 44 -7% -11%
Bronx 710 696 696 2% 2%
Brooklyn 1,592 1,703 1,565 -7% 2%
Queens 2,480 2,613 2,378 -5% 4%
Staten Island 1,139 $1,333 1,276 -15% -11%

NEW YORK CITY RESIDENTIAL SALES REPORT 4Q17 | 17
APPENDIX - BRONX NEIGHBORHOOD SALES DATA
CONDOMINIUM SALE PRICE
Average Price (thousands) 4Q17 3Q17 4Q16 %Δ from 3Q17 %Δ from 4Q16
Bronx $244 $246 $249 -1% -2%
Bathgate / Crotona Park / East Tremont $235 $177
Baychester / Coop City $332
Bronxdale / Pelham Gardens / Pelham Parkway North $179 $225 $225 -20% -20%
City Island / Pelham Bay / Pelham Strip / Country Club / Throgs Neck / Schuylerville
$357 $378 $433 -6% -18%
Fordham / Belmont / Kingsbridge Heights / University Heights $175
Highbridge / Morris Heights / Mount Hope $230
Kingsbridge / Jerome Park /Bedford Park / Norwood $487 $262 $509 86% -4%
Melrose / Morrisania $235 $213 $223 11% 5%
Mott Haven / Port Morris / Hunts Point $700
Parkchester / Westchester Square / Castle Hill / Soundview $164 $180 $147 -9% 12%
Pelham Parkway South / Morris Park / Van Nest $285 $261
Riverdale / Fieldston $550 $641 $641 -14% -14%
Woodlawn / Williamsbridge $122 $173 -30%
Median Price (thousands) 4Q17 3Q17 4Q16 %Δ from 3Q17 %Δ from 4Q16
Bronx $185 $190 $159 -3% 17%
Bathgate / Crotona Park / East Tremont $235 $140
Baychester / Coop City $332
Bronxdale / Pelham Gardens / Pelham Parkway North $195 $225 $225 -13% -13%
City Island / Pelham Bay / Pelham Strip / Country Club / Throgs Neck / Schuylerville
$356 $357 $482 0% -26%
Fordham / Belmont / Kingsbridge Heights / University Heights $175
Highbridge / Morris Heights / Mount Hope $230
Kingsbridge / Jerome Park /Bedford Park / Norwood $637 $262 $595 143% 7%
Melrose / Morrisania $252 $220 $215 15% 17%
Mott Haven / Port Morris / Hunts Point $700
Parkchester / Westchester Square / Castle Hill / Soundview $135 $150 $125 -10% 8%
Pelham Parkway South / Morris Park / Van Nest $285 $261
Riverdale / Fieldston $515 $623 $510 -17% 1%
Woodlawn / Williamsbridge $122 $173 -30%

NEW YORK CITY RESIDENTIAL SALES REPORT 4Q17 | 18
APPENDIX - BRONX NEIGHBORHOOD SALES DATA
CONDOMINIUM SALE PRICE PER SQUARE FOOT
Average Price 4Q17 3Q17 4Q16 %Δ from 3Q17 %Δ from 4Q16
Bronx $265 $257 $256 3% 4%
Bathgate / Crotona Park / East Tremont $290 $224
Baychester / Coop City $336
Bronxdale / Pelham Gardens / Pelham Parkway North $194 $265 $198 -27% -2%
City Island / Pelham Bay / Pelham Strip / Country Club / Throgs Neck / Schuylerville
$369 $341 $353 8% 5%
Fordham / Belmont / Kingsbridge Heights / University Heights
Highbridge / Morris Heights / Mount Hope $252
Kingsbridge / Jerome Park /Bedford Park / Norwood $435 $202 $484 116% -10%
Melrose / Morrisania $223 $241 $187 -7% 20%
Mott Haven / Port Morris / Hunts Point $518
Parkchester / Westchester Square / Castle Hill / Soundview $207 $218 $191 -5% 9%
Pelham Parkway South / Morris Park / Van Nest $356 $298
Riverdale / Fieldston $486 $464 $514 5% -5%
Woodlawn / Williamsbridge $190 $268 -29%
Median Price 4Q17 3Q17 4Q16 %Δ from 3Q17 %Δ from 4Q16
Bronx $224 $220 $203 2% 10%
Bathgate / Crotona Park / East Tremont $290 $182
Baychester / Coop City $336
Bronxdale / Pelham Gardens / Pelham Parkway North $227 $265 $198 -14% 15%
City Island / Pelham Bay / Pelham Strip / Country Club / Throgs Neck / Schuylerville
$373 $355 $308 5% 21%
Fordham / Belmont / Kingsbridge Heights / University Heights
Highbridge / Morris Heights / Mount Hope $252
Kingsbridge / Jerome Park /Bedford Park / Norwood $540 $202 $517 168% 4%
Melrose / Morrisania $222 $251 $187 -12% 19%
Mott Haven / Port Morris / Hunts Point $518
Parkchester / Westchester Square / Castle Hill / Soundview $197 $208 $188 -5% 5%
Pelham Parkway South / Morris Park / Van Nest $356 $298
Riverdale / Fieldston $523 $426 $617 23% -15%
Woodlawn / Williamsbridge $190

NEW YORK CITY RESIDENTIAL SALES REPORT 4Q17 | 19
APPENDIX - BRONX NEIGHBORHOOD SALES DATA
COOPERATIVE SALE PRICE
Average Price (thousands) 4Q17 3Q17 4Q16 %Δ from 3Q17 %Δ from 4Q16
Bronx $241 $250 $239 -3% 1%
Bathgate / Crotona Park / East Tremont $130
Baychester / Coop City $133 $136 -3%
Bronxdale / Pelham Gardens / Pelham Parkway North $167 $174 $172 -4% -3%
City Island / Pelham Bay / Pelham Strip / Country Club / Throgs Neck / Schuylerville
$122 $114 $168 7% -28%
Fordham / Belmont / Kingsbridge Heights / University Heights $184 $155 $190 18% -3%
Highbridge / Morris Heights / Mount Hope $180 $180 $157 0% 15%
Kingsbridge / Jerome Park /Bedford Park / Norwood $170 $191 $180 -11% -6%
Melrose / Morrisania $292 $260 $258 12% 13%
Mott Haven / Port Morris / Hunts Point
Parkchester / Westchester Square / Castle Hill / Soundview $168 $176 $171 -5% -2%
Pelham Parkway South / Morris Park / Van Nest $152 $141 $151 8% 0%
Riverdale / Fieldston $294 $305 $281 -3% 5%
Woodlawn / Williamsbridge $148 $151 $163 -2% -9%
Median Price (thousands) 4Q17 3Q17 4Q16 %Δ from 3Q17 %Δ from 4Q16
Bronx $195 $209 $192 -7% 2%
Bathgate / Crotona Park / East Tremont $130
Baychester / Coop City $133 $136 -3%
Bronxdale / Pelham Gardens / Pelham Parkway North $178 $160 $175 11% 1%
City Island / Pelham Bay / Pelham Strip / Country Club / Throgs Neck / Schuylerville
$110 $114 $158 -3% -30%
Fordham / Belmont / Kingsbridge Heights / University Heights $195 $127 $155 54% 26%
Highbridge / Morris Heights / Mount Hope $180 $180 $157 0% 15%
Kingsbridge / Jerome Park /Bedford Park / Norwood $153 $175 $165 -13% -7%
Melrose / Morrisania $257 $265 $219 -3% 17%
Mott Haven / Port Morris / Hunts Point
Parkchester / Westchester Square / Castle Hill / Soundview $150 $177 $186 -15% -19%
Pelham Parkway South / Morris Park / Van Nest $131 $140 $145 -6% -9%
Riverdale / Fieldston $240 $255 $253 -6% -5%
Woodlawn / Williamsbridge $145 $164 $175 -12% -17%

NEW YORK CITY RESIDENTIAL SALES REPORT 4Q17 | 20
APPENDIX - BRONX NEIGHBORHOOD SALES DATA
COOPERATIVE SALE PRICE PER SQUARE FOOT
Average Price 4Q17 3Q17 4Q16 %Δ from 3Q17 %Δ from 4Q16
Bronx $312 $303 $295 3% 6%
Bathgate / Crotona Park / East Tremont
Baychester / Coop City
Bronxdale / Pelham Gardens / Pelham Parkway North $236 $263 $228 -10% 4%
City Island / Pelham Bay / Pelham Strip / Country Club / Throgs Neck / Schuylerville
$187 $165 $273 13% -31%
Fordham / Belmont / Kingsbridge Heights / University Heights $220 $184 $267 20% -17%
Highbidge / Morris Heights / Mount Hope
Kingsbridge / Jerome Park /Bedford Park / Norwood $222 $246 $210 -10% 6%
Melrose / Morrisania $389 $393 $294 -1% 32%
Mott Haven / Port Morris / Hunts Point
Parkchester / Westchester Square / Castle Hill / Soundview $163 $320 -49%
Pelham Parkway South / Morris Park / Van Nest $216 $368 $225 -41% -4%
Riverdale / Fieldston $367 $324 $330 13% 11%
Woodlawn / Williamsbridge $210 $184 $219 14% -4%
Median Price 4Q17 3Q17 4Q16 %Δ from 3Q17 %Δ from 4Q16
Bronx $282 $288 $275 -2% 3%
Bathgate / Crotona Park / East Tremont
Baychester / Coop City
Bronxdale / Pelham Gardens / Pelham Parkway North $250 $278 $230 -10% 8%
City Island / Pelham Bay / Pelham Strip / Country Club / Throgs Neck / Schuylerville
$193 $165 $261 17% -26%
Fordham / Belmont / Kingsbridge Heights / University Heights $215 $164 $201 32% 7%
Highbridge / Morris Heights / Mount Hope
Kingsbridge / Jerome Park /Bedford Park / Norwood $222 $236 $216 -6% 2%
Melrose / Morrisania $368 $376 $286 -2% 28%
Mott Haven / Port Morris / Hunts Point
Parkchester / Westchester Square / Castle Hill / Soundview $157 $367 -57%
Pelham Parkway South / Morris Park / Van Nest $211 $368 $166 -43% 27%
Riverdale / Fieldston $338 $320 $328 6% 3%
Woodlawn / Williamsbridge $202 $171 $212 18% -5%
NEW YORK CITY RESIDENTIAL SALES REPORT 4Q17 | 21
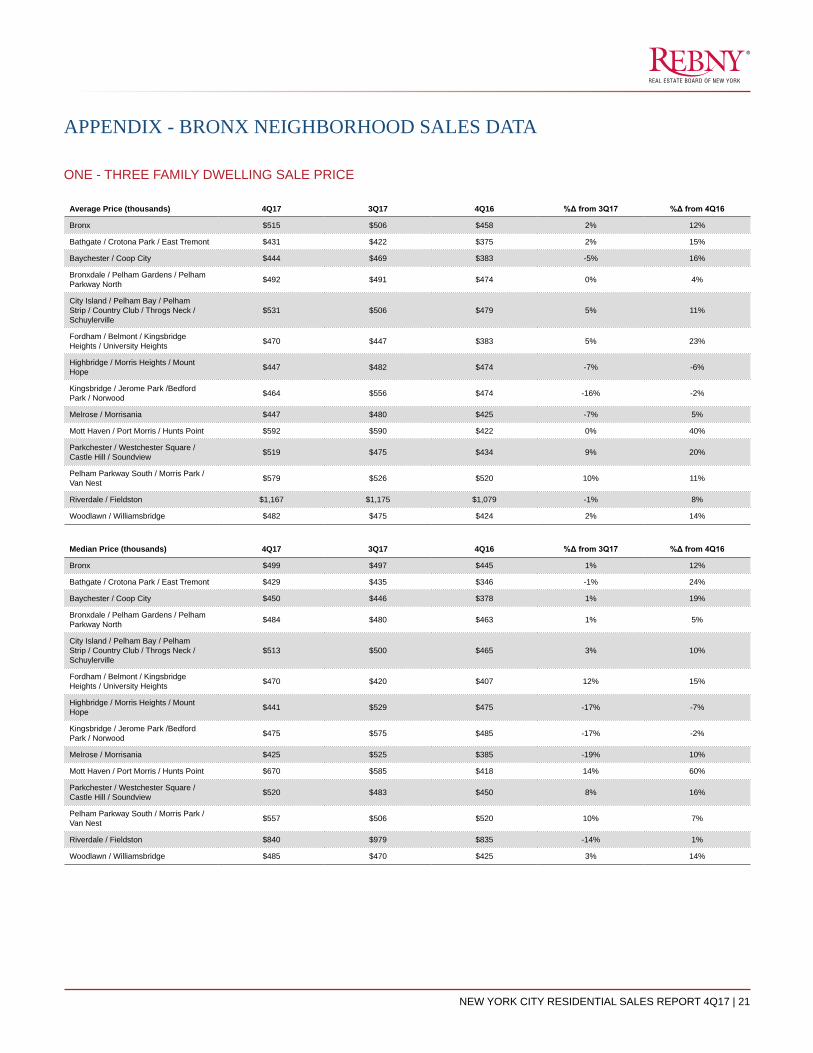
APPENDIX - BRONX NEIGHBORHOOD SALES DATA
ONE - THREE FAMILY DWELLING SALE PRICE
Average Price (thousands) 4Q17 3Q17 4Q16 %Δ from 3Q17 %Δ from 4Q16
Bronx $515 $506 $458 2% 12%
Bathgate / Crotona Park / East Tremont $431 $422 $375 2% 15%
Baychester / Coop City $444 $469 $383 -5% 16%
Bronxdale / Pelham Gardens / Pelham Parkway North $492 $491 $474 0% 4%
City Island / Pelham Bay / Pelham Strip / Country Club / Throgs Neck / Schuylerville
$531 $506 $479 5% 11%
Fordham / Belmont / Kingsbridge Heights / University Heights $470 $447 $383 5% 23%
Highbridge / Morris Heights / Mount Hope $447 $482 $474 -7% -6%
Kingsbridge / Jerome Park /Bedford Park / Norwood $464 $556 $474 -16% -2%
Melrose / Morrisania $447 $480 $425 -7% 5%
Mott Haven / Port Morris / Hunts Point $592 $590 $422 0% 40%
Parkchester / Westchester Square / Castle Hill / Soundview $519 $475 $434 9% 20%
Pelham Parkway South / Morris Park / Van Nest $579 $526 $520 10% 11%
Riverdale / Fieldston $1,167 $1,175 $1,079 -1% 8%
Woodlawn / Williamsbridge $482 $475 $424 2% 14%
Median Price (thousands) 4Q17 3Q17 4Q16 %Δ from 3Q17 %Δ from 4Q16
Bronx $499 $497 $445 1% 12%
Bathgate / Crotona Park / East Tremont $429 $435 $346 -1% 24%
Baychester / Coop City $450 $446 $378 1% 19%
Bronxdale / Pelham Gardens / Pelham Parkway North $484 $480 $463 1% 5%
City Island / Pelham Bay / Pelham Strip / Country Club / Throgs Neck / Schuylerville
$513 $500 $465 3% 10%
Fordham / Belmont / Kingsbridge Heights / University Heights $470 $420 $407 12% 15%
Highbridge / Morris Heights / Mount Hope $441 $529 $475 -17% -7%
Kingsbridge / Jerome Park /Bedford Park / Norwood $475 $575 $485 -17% -2%
Melrose / Morrisania $425 $525 $385 -19% 10%
Mott Haven / Port Morris / Hunts Point $670 $585 $418 14% 60%
Parkchester / Westchester Square / Castle Hill / Soundview $520 $483 $450 8% 16%
Pelham Parkway South / Morris Park / Van Nest $557 $506 $520 10% 7%
Riverdale / Fieldston $840 $979 $835 -14% 1%
Woodlawn / Williamsbridge $485 $470 $425 3% 14%

NEW YORK CITY RESIDENTIAL SALES REPORT 4Q17 | 22
APPENDIX - BROOKLYN NEIGHBORHOOD SALES DATA
CONDOMINIUM SALE PRICE
Average Price (thousands) 4Q17 3Q17 4Q16 %Δ from 3Q17 %Δ from 4Q16
Brooklyn $1,014 $1,154 $983 -12% 3%
Bath Beach $656 $651 $607 1% 8%
Bay Ridge / Fort Hamilton $678 $673 $854 1% -21%
Bedford Stuyvesant $833 $914 $623 -9% 34%
Bensonhurst $679 $634 $438 7% 55%
Bergen Beach $410 $408 $488 1% -16%
Boerum Hill $1,766 $1,476 $1,228 20% 44%
Borough Park $604 $743 $769 -19% -21%
Brighton Beach $715 $1,025 $782 -30% -9%
Brooklyn Heights $1,983 $2,887 $680 -31% 192%
Brownsville / Ocean Hill $547 $475
Bushwick / Wyckoff Heights $580 $652 $606 -11% -4%
Canarsie $306 $325 $282 -6% 9%
Carroll Gardens $1,349 $1,418 $1,033 -5% 31%
Clinton Hill $1,275 $1,013 $831 26% 53%
Cobble Hill $1,031 $1,205 $879 -14% 17%
Columbia Street Waterfront District $879 $1,091 $1,028 -19% -14%
Coney Island $469 $459 $517 2% -9%
Crown Heights $845 $775 $761 9% 11%
Cypress Hills
Downtown $1,028 $1,100 $1,087 -7% -5%
Dyker Heights $519 $488 6%
East Flatbush $408 $482 -16%
East New York / Spring Creek $270 $287 $255 -6% 6%
Flatbush / Prospect Park South $547 $692 $591 -21% -7%
Flatlands
Fort Greene $1,014 $1,159 $1,004 -13% 1%
Gerritsen Beach
Gowanus $1,358 $1,484 $1,074 -9% 26%
Gravesend / Mapleton $614 $793 $459 -23% 34%
Greenpoint $1,245 $1,219 $1,254 2% -1%
Kensington / Parkville $704 $563 $558 25% 26%
Manhattan Beach $975 $647
Marine Park / Madison $449 $514 $552 -13% -19%
Midwood $602 $520 16%
Mill Basin
Park Slope $1,199 $1,563 $1,008 -23% 19%
Prospect Heights $1,247 $1,071 $1,323 16% -6%
Prospect Lefferts Gardens $688 $707 $836 -3% -18%
Red Hook $905 $710 27%
Sea Gate $425 $502 -15%
Sheepshead Bay $517 $465 $456 11% 13%
Sunset Park $605 $784 $578 -23% 5%
Vinegar Hill / Dumbo $1,756 $1,946 $2,731 -10% -36%
Williamsburg $1,138 $1,201 $1,193 -5% -5%
Windsor Terrace $884 $1,027 $750 -14% 18%

NEW YORK CITY RESIDENTIAL SALES REPORT 4Q17 | 23
APPENDIX - BROOKLYN NEIGHBORHOOD SALES DATA
CONDOMINIUM SALE PRICE
Median Price (thousands) 4Q17 3Q17 4Q16 %Δ from 3Q17 %Δ from 4Q16
Brooklyn $857 $931 $806 -8% 6%
Bath Beach $658 $622 $625 6% 5%
Bay Ridge / Fort Hamilton $683 $632 $891 8% -23%
Bedford Stuyvesant $833 $878 $585 -5% 42%
Bensonhurst $688 $664 $420 4% 64%
Bergen Beach $405 $360 $513 13% -21%
Boerum Hill $1,833 $1,398 $1,194 31% 54%
Borough Park $565 $745 $770 -24% -27%
Brighton Beach $690 $835 $636 -17% 8%
Brooklyn Heights $1,370 $3,057 $730 -55% 88%
Brownsville / Ocean Hill $547 $399
Bushwick / Wyckoff Heights $585 $633 $616 -8% -5%
Canarsie $355 $308 $292 15% 22%
Carroll Gardens $1,073 $1,300 $993 -18% 8%
Clinton Hill $1,150 $855 $766 34% 50%
Cobble Hill $908 $1,223 $514 -26% 76%
Columbia Street Waterfront District $651 $1,090 $900 -40% -28%
Coney Island $410 $465 $499 -12% -18%
Crown Heights $888 $790 $740 12% 20%
Cypress Hills
Downtown $900 $901 $966 0% -7%
Dyker Heights $519 $465 12%
East Flatbush $408 $500 -19%
East New York / Spring Creek $274 $295 $271 -7% 1%
Flatbush / Prospect Park South $550 $570 $540 -4% 2%
Flatlands
Fort Greene $951 $1,166 $957 -18% -1%
Gerritsen Beach
Gowanus $1,400 $1,330 $1,113 5% 26%
Gravesend / Mapleton $610 $590 $465 3% 31%
Greenpoint $1,031 $1,060 $1,110 -3% -7%
Kensington / Parkville $740 $523 $533 42% 39%
Manhattan Beach $975 $647
Marine Park / Madison $462 $508 $557 -9% -17%
Midwood $603 $520 16%
Mill Basin
Park Slope $1,077 $1,460 $940 -26% 15%
Prospect Heights $975 $937 $1,350 4% -28%
Prospect Lefferts Gardens $688 $684 $854 1% -20%
Red Hook $905 $710 27%
Sea Gate $425 $525 -19%
Sheepshead Bay $500 $430 $472 16% 6%
Sunset Park $585 $610 $495 -4% 18%
Vinegar Hill / Dumbo $1,475 $1,500 $1,900 -2% -22%
Williamsburg $1,095 $1,076 $1,085 2% 1%
Windsor Terrace $884 $1,200 $900 -26% -2%

NEW YORK CITY RESIDENTIAL SALES REPORT 4Q17 | 24
APPENDIX - BROOKLYN NEIGHBORHOOD SALES DATA
CONDOMINIUM SALE PRICE PER SQUARE FOOT
Average Price 4Q17 3Q17 4Q16 %Δ from 3Q17 %Δ from 4Q16
Brooklyn $979 $1,042 $853 -6% 15%
Bath Beach $563 $544 $510 4% 10%
Bay Ridge / Fort Hamilton $725 $668 $701 8% 3%
Bedford Stuyvesant $866 $861 $749 0% 16%
Bensonhurst $528 $586 $396 -10% 33%
Bergen Beach $343 $379 $426 -10% -19%
Boerum Hill $1,386 $1,230 $1,211 13% 14%
Borough Park $516 $530 $452 -3% 14%
Brighton Beach $622 $728 $642 -15% -3%
Brooklyn Heights $1,306 $1,451 $1,267 -10% 3%
Brownsville / Ocean Hill $406 $473
Bushwick / Wyckoff Heights $916 $850 $781 8% 17%
Canarsie $360 $295 $282 22% 28%
Carroll Gardens $1,196 $1,050 $973 14% 23%
Clinton Hill $1,249 $1,104 $908 13% 38%
Cobble Hill $1,077 $1,052 2%
Columbia Street Waterfront District $948 $1,081 $1,090 -12% -13%
Coney Island $560 $534 $453 5% 24%
Crown Heights $952 $928 $792 3% 20%
Cypress Hills
Downtown $1,173 $1,180 $1,102 -1% 6%
Dyker Heights $518 $567 -9%
East Flatbush $455 $504 -10%
East New York / Spring Creek $349 $351 $355 -1% -2%
Flatbush / Prospect Park South $633 $690 $573 -8% 11%
Flatlands
Fort Greene $1,037 $1,122 $1,134 -8% -9%
Gerritsen Beach
Gowanus $1,245 $1,278 $1,277 -3% -2%
Gravesend / Mapleton $574 $640 $488 -10% 18%
Greenpoint $1,148 $1,160 $1,169 -1% -2%
Kensington / Parkville $688 $657 $398 5% 73%
Manhattan Beach $631 $525
Marine Park / Madison $513 $538 $420 -5% 22%
Midwood $568
Mill Basin
Park Slope $1,107 $1,272 $1,074 -13% 3%
Prospect Heights $1,373 $1,300 $1,013 6% 36%
Prospect Lefferts Gardens $716 $494 45%
Red Hook $719 $635 13%
Sea Gate $255 $305 -17%
Sheepshead Bay $536 $466 $526 15% 2%
Sunset Park $666 $840 $689 -21% -3%
Vinegar Hill / Dumbo $1,345 $1,325 $1,494 2% -10%
Williamsburg $1,116 $1,219 $1,004 -8% 11%
Windsor Terrace $752 $939 $927 -20% -19%

NEW YORK CITY RESIDENTIAL SALES REPORT 4Q17 | 25
APPENDIX - BROOKLYN NEIGHBORHOOD SALES DATA
CONDOMINIUM SALE PRICE PER SQUARE FOOT
Median Price 4Q17 3Q17 4Q16 %Δ from 3Q17 %Δ from 4Q16
Brooklyn $1,036 $1,106 $806 -6% 29%
Bath Beach $576 $548 $510 5% 13%
Bay Ridge / Fort Hamilton $767 $637 $696 20% 10%
Bedford Stuyvesant $888 $851 $746 4% 19%
Bensonhurst $461 $580 $396 -20% 17%
Bergen Beach $316 $354 $436 -11% -28%
Boerum Hill $1,407 $1,218 $1,117 16% 26%
Borough Park $529 $504 $421 5% 26%
Brighton Beach $620 $666 $638 -7% -3%
Brooklyn Heights $1,295 $1,349 $1,199 -4% 8%
Brownsville / Ocean Hill $406 $494
Bushwick / Wyckoff Heights $913 $866 $755 5% 21%
Canarsie $324 $291 $301 11% 8%
Carroll Gardens $1,179 $1,025 $984 15% 20%
Clinton Hill $1,227 $1,103 $864 11% 42%
Cobble Hill $1,073 $1,102 -3%
Columbia Street Waterfront District $959 $1,062 $1,098 -10% -13%
Coney Island $582 $557 $384 5% 52%
Crown Heights $978 $911 $747 7% 31%
Cypress Hills
Downtown $1,148 $1,199 $1,143 -4% 0%
Dyker Heights $518 $567 -9%
East Flatbush $455 $512 -11%
East New York / Spring Creek $362 $359 $373 1% -3%
Flatbush / Prospect Park South $600 $712 $527 -16% 14%
Flatlands
Fort Greene $984 $1,121 $1,150 -12% -14%
Gerritsen Beach
Gowanus $1,165 $1,361 $1,261 -14% -8%
Gravesend / Mapleton $553 $568 $478 -3% 16%
Greenpoint $1,119 $1,134 $1,151 -1% -3%
Kensington / Parkville $743 $620 $419 20% 78%
Manhattan Beach $631 $525
Marine Park / Madison $537 $533 $422 1% 27%
Midwood $558
Mill Basin
Park Slope $1,196 $1,296 $1,118 -8% 7%
Prospect Heights $1,353 $1,334 $1,071 1% 26%
Prospect Lefferts Gardens $716 $491 46%
Red Hook $719 $635 13%
Sea Gate $255 $271 -6%
Sheepshead Bay $518 $483 $527 7% -2%
Sunset Park $740 $864 $699 -14% 6%
Vinegar Hill / Dumbo $1,374 $1,290 $1,325 7% 4%
Williamsburg $1,197 $1,207 $1,108 -1% 8%
Windsor Terrace $752 $934 $864 -19% -13%

NEW YORK CITY RESIDENTIAL SALES REPORT 4Q17 | 26
APPENDIX - BROOKLYN NEIGHBORHOOD SALES DATA
COOPERATIVE SALE PRICE
Average Price (thousands) 4Q17 3Q17 4Q16 %Δ from 3Q17 %Δ from 4Q16
Brooklyn $524 $536 $465 -2% 13%
Bath Beach $298 $304 $268 -2% 11%
Bay Ridge / Fort Hamilton $360 $387 $334 -7% 8%
Bedford Stuyvesant $348
Bensonhurst $285 $229 $230 24% 24%
Bergen Beach
Boerum Hill $690 $963 $885 -28% -22%
Borough Park $466 $433 $421 8% 11%
Brighton Beach $377 $411 $332 -8% 14%
Brooklyn Heights $913 $1,015 $958 -10% -5%
Brownsville / Ocean Hill
Bushwick / Wyckoff Heights $257
Canarsie $159 $150 $151 6% 6%
Carroll Gardens $1,010 $998 $994 1% 2%
Clinton Hill $631 $667 $627 -5% 1%
Cobble Hill $747 $1,198 $927 -38% -19%
Columbia Street Waterfront District
Coney Island $348 $358 $338 -3% 3%
Crown Heights $460 $382 $430 20% 7%
Cypress Hills $210 $225 -7%
Downtown $690 $592 $562 17% 23%
Dyker Heights
East Flatbush $236 $245 $224 -3% 5%
East New York / Spring Creek
Flatbush / Prospect Park South $435 $451 $450 -3% -3%
Flatlands $193 $184 $168 5% 15%
Fort Greene $750 $645 $606 16% 24%
Gerritsen Beach
Gowanus $440 $585 $642 -25% -32%
Gravesend / Mapleton $283 $277 $235 2% 21%
Greenpoint $559 $867 $770 -36% -27%
Kensington / Parkville $439 $416 $377 5% 16%
Manhattan Beach
Marine Park / Madison $226 $185 $214 22% 6%
Midwood $283 $252 $321 12% -12%
Mill Basin $212 $174 $162 22% 31%
Park Slope $1,044 $912 $856 14% 22%
Prospect Heights $716 $801 $886 -11% -19%
Prospect Lefferts Gardens $497 $432 $354 15% 40%
Red Hook $599
Sea Gate
Sheepshead Bay $235 $244 $217 -4% 8%
Sunset Park $494 $404 $414 22% 19%
Vinegar Hill / Dumbo $1,850 $1,250 $1,090 48% 70%
Williamsburg $365 $358 $460 2% -21%
Windsor Terrace $645 $711 $642 -9% 1%

NEW YORK CITY RESIDENTIAL SALES REPORT 4Q17 | 27
APPENDIX - BROOKLYN NEIGHBORHOOD SALES DATA
COOPERATIVE SALE PRICE
Median Price (thousands) 4Q17 3Q17 4Q16 %Δ from 3Q17 %Δ from 4Q16
Brooklyn $410 $421 $350 -3% 17%
Bath Beach $278 $292 $242 -5% 15%
Bay Ridge / Fort Hamilton $335 $350 $315 -4% 6%
Bedford Stuyvesant $348
Bensonhurst $285 $218 $237 31% 20%
Bergen Beach
Boerum Hill $715 $785 $885 -9% -19%
Borough Park $506 $358 $491 42% 3%
Brighton Beach $310 $392 $318 -21% -2%
Brooklyn Heights $712 $850 $838 -16% -15%
Brownsville / Ocean Hill
Bushwick / Wyckoff Heights
Canarsie $156 $150 $138 4% 14%
Carroll Gardens $1,038 $1,140 $994 -9% 4%
Clinton Hill $643 $660 $585 -3% 10%
Cobble Hill $620 $1,038 $910 -40% -32%
Columbia Street Waterfront District
Coney Island $320 $350 $350 -9% -9%
Crown Heights $395 $350 $399 13% -1%
Cypress Hills $210 $225 -7%
Downtown $611 $537 $538 14% 14%
Dyker Heights
East Flatbush $255 $215 $214 19% 19%
East New York / Spring Creek
Flatbush / Prospect Park South $460 $427 $455 8% 1%
Flatlands $190 $178 $175 7% 9%
Fort Greene $790 $573 $510 38% 55%
Gerritsen Beach
Gowanus $440 $585 $642 -25% -32%
Gravesend / Mapleton $280 $267 $199 5% 41%
Greenpoint $555 $867 $770 -36% -28%
Kensington / Parkville $445 $375 $357 19% 25%
Manhattan Beach
Marine Park / Madison $216 $160 $198 35% 9%
Midwood $269 $254 $300 6% -10%
Mill Basin $205 $166 $170 23% 21%
Park Slope $920 $873 $846 5% 9%
Prospect Heights $625 $828 $710 -24% -12%
Prospect Lefferts Gardens $425 $358 $370 19% 15%
Red Hook $599
Sea Gate
Sheepshead Bay $210 $235 $200 -10% 5%
Sunset Park $416 $418 $395 0% 5%
Vinegar Hill / Dumbo $1,850 $1,250 $1,090 48% 70%
Williamsburg $375 $350 $361 7% 4%
Windsor Terrace $715 $707 $680 1% 5%

NEW YORK CITY RESIDENTIAL SALES REPORT 4Q17 | 28
APPENDIX - BROOKLYN NEIGHBORHOOD SALES DATA
COOPERATIVE SALE PRICE PER SQUARE FOOT
Average Price 4Q17 3Q17 4Q16 %Δ from 3Q17 %Δ from 4Q16
Brooklyn $624 $710 $611 -12% 2%
Bath Beach $429 $434 $350 -1% 23%
Bay Ridge / Fort Hamilton $541 $519 $492 4% 10%
Bedford Stuyvesant
Bensonhurst $284 $338 $298 -16% -4%
Bergen Beach
Boerum Hill $800 $1,035 $1,265 -23% -37%
Borough Park $512 $512 $558 0% -8%
Brighton Beach $510 $480 $365 6% 40%
Brooklyn Heights $1,108 $1,278 $1,167 -13% -5%
Brownsville / Ocean Hill
Bushwick / Wyckoff Heights
Canarsie
Carroll Gardens $1,063 $1,155 $1,096 -8% -3%
Clinton Hill $759 $1,030 $1,010 -26% -25%
Cobble Hill $1,085 $1,573 $1,204 -31% -10%
Columbia Street Waterfront District
Coney Island $469 $506 $501 -7% -6%
Crown Heights $650 $686 $760 -5% -14%
Cypress Hills $255 $281 -9%
Downtown $668 $863 $814 -23% -18%
Dyker Heights
East Flatbush $323 $325 $319 -1% 1%
East New York / Spring Creek
Flatbush / Prospect Park South $624 $596 $601 5% 4%
Flatlands $239 $222 $211 8% 13%
Fort Greene $710 $855 $757 -17% -6%
Gerritsen Beach
Gowanus
Gravesend / Mapleton $371 $426 $341 -13% 9%
Greenpoint #DIV/0! $974 $924
Kensington / Parkville $517 $551 $512 -6% 1%
Manhattan Beach
Marine Park / Madison $310 $279 $303 11% 2%
Midwood $419 $370 $422 13% -1%
Mill Basin $258 $228 $212 13% 22%
Park Slope $1,014 $1,130 $1,111 -10% -9%
Prospect Heights $1,089 $1,204 $1,058 -10% 3%
Prospect Lefferts Gardens $611 $423 $484 44% 26%
Red Hook
Sea Gate
Sheepshead Bay $326 $357 $297 -9% 10%
Sunset Park $607 $656 $633 -7% -4%
Vinegar Hill / Dumbo $746 $1,005
Williamsburg $929 $624 49%
Windsor Terrace $761 $874 $737 -13% 3%
NEW YORK CITY RESIDENTIAL SALES REPORT 4Q17 | 29
APPENDIX - BROOKLYN NEIGHBORHOOD SALES DATA
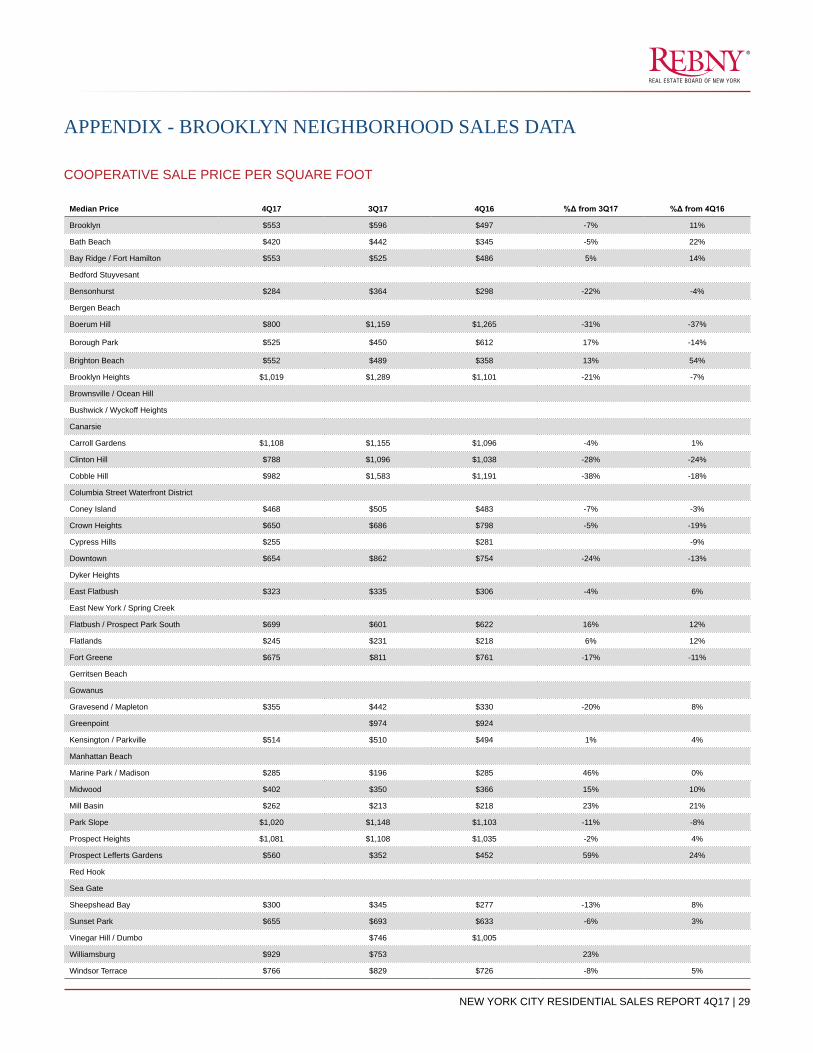
COOPERATIVE SALE PRICE PER SQUARE FOOT
Median Price 4Q17 3Q17 4Q16 %Δ from 3Q17 %Δ from 4Q16
Brooklyn $553 $596 $497 -7% 11%
Bath Beach $420 $442 $345 -5% 22%
Bay Ridge / Fort Hamilton $553 $525 $486 5% 14%
Bedford Stuyvesant
Bensonhurst $284 $364 $298 -22% -4%
Bergen Beach
Boerum Hill $800 $1,159 $1,265 -31% -37%
Borough Park $525 $450 $612 17% -14%
Brighton Beach $552 $489 $358 13% 54%
Brooklyn Heights $1,019 $1,289 $1,101 -21% -7%
Brownsville / Ocean Hill
Bushwick / Wyckoff Heights
Canarsie
Carroll Gardens $1,108 $1,155 $1,096 -4% 1%
Clinton Hill $788 $1,096 $1,038 -28% -24%
Cobble Hill $982 $1,583 $1,191 -38% -18%
Columbia Street Waterfront District
Coney Island $468 $505 $483 -7% -3%
Crown Heights $650 $686 $798 -5% -19%
Cypress Hills $255 $281 -9%
Downtown $654 $862 $754 -24% -13%
Dyker Heights
East Flatbush $323 $335 $306 -4% 6%
East New York / Spring Creek
Flatbush / Prospect Park South $699 $601 $622 16% 12%
Flatlands $245 $231 $218 6% 12%
Fort Greene $675 $811 $761 -17% -11%
Gerritsen Beach
Gowanus
Gravesend / Mapleton $355 $442 $330 -20% 8%
Greenpoint $974 $924
Kensington / Parkville $514 $510 $494 1% 4%
Manhattan Beach
Marine Park / Madison $285 $196 $285 46% 0%
Midwood $402 $350 $366 15% 10%
Mill Basin $262 $213 $218 23% 21%
Park Slope $1,020 $1,148 $1,103 -11% -8%
Prospect Heights $1,081 $1,108 $1,035 -2% 4%
Prospect Lefferts Gardens $560 $352 $452 59% 24%
Red Hook
Sea Gate
Sheepshead Bay $300 $345 $277 -13% 8%
Sunset Park $655 $693 $633 -6% 3%
Vinegar Hill / Dumbo $746 $1,005
Williamsburg $929 $753 23%
Windsor Terrace $766 $829 $726 -8% 5%

NEW YORK CITY RESIDENTIAL SALES REPORT 4Q17 | 30
APPENDIX - BROOKLYN NEIGHBORHOOD SALES DATA
ONE - THREE FAMILY DWELLING SALE PRICE
Average Price (thousands) 4Q17 3Q17 4Q16 %Δ from 3Q17 %Δ from 4Q16
Brooklyn $1,004 $1,079 $955 -7% 5%
Bath Beach $1,057 $1,044 $905 1% 17%
Bay Ridge / Fort Hamilton $1,185 $1,197 $1,096 -1% 8%
Bedford Stuyvesant $1,227 $1,398 $1,201 -12% 2%
Bensonhurst $1,144 $1,204 $1,016 -5% 13%
Bergen Beach $708 $784 $643 -10% 10%
Boerum Hill $2,505 $3,523 $3,755 -29% -33%
Borough Park $1,250 $1,301 $1,256 -4% 0%
Brighton Beach $694 $569 $556 22% 25%
Brooklyn Heights $6,912 $6,200 $6,683 11% 3%
Brownsville / Ocean Hill $694 $759 $661 -9% 5%
Bushwick / Wyckoff Heights $985 $958 $996 3% -1%
Canarsie $514 $558 $477 -8% 8%
Carroll Gardens $2,489 $2,968 $2,370 -16% 5%
Clinton Hill $2,268 $2,451 $2,144 -7% 6%
Cobble Hill $3,430 $4,383 $3,300 -22% 4%
Columbia Street Waterfront District $337 $2,650 $2,147 -87% -84%
Coney Island $704 $488 $456 44% 54%
Crown Heights $1,247 $1,083 $1,162 15% 7%
Cypress Hills $565 $550 $549 3% 3%
Downtown $4,010 $3,995 $2,100 0% 91%
Dyker Heights $1,050 $1,048 $1,055 0% 0%
East Flatbush $555 $588 $513 -6% 8%
East New York / Spring Creek $530 $507 $473 5% 12%
Flatbush / Prospect Park South $940 $1,100 $972 -15% -3%
Flatlands $539 $513 $513 5% 5%
Fort Greene $2,656 $2,555 $2,189 4% 21%
Gerritsen Beach $464 $421 $427 10% 9%
Gowanus $1,476 $1,938 $1,672 -24% -12%
Gravesend / Mapleton $1,131 $1,206 $979 -6% 16%
Greenpoint $1,790 $1,735 $1,613 3% 11%
Kensington / Parkville $1,519 $1,578 $1,254 -4% 21%
Manhattan Beach $1,271 $1,529 $1,280 -17% -1%
Marine Park / Madison $736 $689 $700 7% 5%
Midwood $1,076 $1,163 $1,190 -8% -10%
Mill Basin $728 $625 $625 17% 17%
Park Slope $2,631 $3,171 $2,169 -17% 21%
Prospect Heights $2,355 $2,314 $2,654 2% -11%
Prospect Lefferts Gardens $880 $855 $889 3% -1%
Red Hook $2,151 $1,676 $1,673 28% 29%
Sea Gate $632 $555 $485 14% 30%
Sheepshead Bay $828 $763 $761 9% 9%
Sunset Park $1,165 $1,129 $1,134 3% 3%
Vinegar Hill / Dumbo $2,795
Williamsburg $2,011 $2,146 $1,646 -6% 22%
Windsor Terrace $1,976 $1,645 $1,646 20% 20%

NEW YORK CITY RESIDENTIAL SALES REPORT 4Q17 | 31
APPENDIX - BROOKLYN NEIGHBORHOOD SALES DATA
ONE - THREE FAMILY DWELLING SALE PRICE
Median Price (thousands) 4Q17 3Q17 4Q16 %Δ from 3Q17 %Δ from 4Q16
Brooklyn $803 $837 $790 -4% 2%
Bath Beach $999 $973 $928 3% 8%
Bay Ridge / Fort Hamilton $1,175 $1,100 $1,099 7% 7%
Bedford Stuyvesant $1,160 $1,328 $1,169 -13% -1%
Bensonhurst $1,175 $1,230 $980 -4% 20%
Bergen Beach $740 $720 $650 3% 14%
Boerum Hill $2,700 $3,158 $4,030 -14% -33%
Borough Park $1,198 $1,050 $1,200 14% 0%
Brighton Beach $740 $628 $615 18% 20%
Brooklyn Heights $7,850 $5,499 $7,150 43% 10%
Brownsville / Ocean Hill $660 $815 $600 -19% 10%
Bushwick / Wyckoff Heights $975 $905 $950 8% 3%
Canarsie $542 $550 $492 -2% 10%
Carroll Gardens $2,405 $3,050 $2,375 -21% 1%
Clinton Hill $2,269 $2,600 $2,075 -13% 9%
Cobble Hill $3,200 $4,775 $3,450 -33% -7%
Columbia Street Waterfront District $337 $2,650 $2,490 -87% -86%
Coney Island $605 $517 $480 17% 26%
Crown Heights $1,050 $1,011 $1,145 4% -8%
Cypress Hills $595 $585 $599 2% -1%
Downtown $4,010 $3,995 $2,100 0% 91%
Dyker Heights $980 $965 $1,113 2% -12%
East Flatbush $535 $538 $497 -1% 8%
East New York / Spring Creek $515 $453 $450 14% 14%
Flatbush / Prospect Park South $940 $1,100 $972 -15% -3%
Flatlands $550 $493 $500 12% 10%
Fort Greene $2,545 $2,500 $2,094 2% 22%
Gerritsen Beach $468 $441 $425 6% 10%
Gowanus $1,208 $2,105 $1,450 -43% -17%
Gravesend / Mapleton $933 $990 $900 -6% 4%
Greenpoint $1,675 $1,700 $1,633 -1% 3%
Kensington / Parkville $1,320 $1,450 $1,100 -9% 20%
Manhattan Beach $1,260 $1,508 $1,262 -16% 0%
Marine Park / Madison $736 $689 $700 7% 5%
Midwood $900 $1,006 $935 -11% -4%
Mill Basin $618 $581 $531 6% 16%
Park Slope $2,400 $2,828 $2,200 -15% 9%
Prospect Heights $3,170 $2,465 $2,575 29% 23%
Prospect Lefferts Gardens $624 $772 $890 -19% -30%
Red Hook $2,367 $1,904 $1,700 24% 39%
Sea Gate $575 $500 $515 15% 12%
Sheepshead Bay $800 $800 $740 0% 8%
Sunset Park $1,210 $1,113 $1,033 9% 17%
Vinegar Hill / Dumbo $2,795
Williamsburg $2,130 $1,999 $1,500 7% 42%
Windsor Terrace $1,710 $1,675 $1,660 2% 3%

NEW YORK CITY RESIDENTIAL SALES REPORT 4Q17 | 32
APPENDIX - MANHATTAN NEIGHBORHOOD SALES DATA
CONDOMINIUM SALE PRICE
Average Price (thousands) 4Q17 3Q17 4Q16 %Δ from 3Q17 %Δ from 4Q16
Manhattan $2,405 $2,524 $2,963 -5% -19%
Battery Park City $1,600 $1,596 $1,428 0% 12%
Chelsea/Flatiron $3,413 $2,926 $4,887 17% -30%
East Harlem $878 $833 $726 5% 21%
East Village $1,756 $2,131 $1,290 -18% 36%
Financial/Seaport $1,695 $2,092 $1,177 -19% 44%
Gramercy/Kips Bay $1,688 $2,383 $1,931 -29% -13%
Greenwich Village $3,525 $4,520 $3,505 -22% 1%
Inwood $404 $368 $425 10% -5%
Lower East Side $1,714 $1,549 $1,372 11% 25%
Midtown East $4,306 $4,013 $6,266 7% -31%
Midtown West $2,119 $1,962 $2,869 8% -26%
Morningside Heights $1,195 $1,175
Murray Hill $1,181 $1,218 $1,219 -3% -3%
Roosevelt Island $685 $1,231 $1,689 -44% -59%
SoHo $3,062 $4,000 $3,824 -23% -20%
Tribeca $4,601 $4,995 $4,902 -8% -6%
Upper East Side $2,080 $2,422 $2,074 -14% 0%
Upper West Side $2,311 $2,368 $2,458 -2% -6%
Washington Heights $685 $620 $576 11% 19%
West Harlem $1,045 $1,019 $1,014 3% 3%
West Village $4,017 $6,310 $5,034 -36% -20%
Median Price (thousands) 4Q17 3Q17 4Q16 %Δ from 3Q17 %Δ from 4Q16
Manhattan $1,465 $1,537 $1,550 -5% -5%
Battery Park City $1,350 $1,141 $937 18% 44%
Chelsea/Flatiron $2,190 $2,225 $2,888 -2% -24%
East Harlem $675 $734 $648 -8% 4%
East Village $1,325 $1,533 $1,059 -14% 25%
Financial/Seaport $1,265 $1,425 $908 -11% 39%
Gramercy/Kips Bay $1,303 $1,375 $1,450 -5% -10%
Greenwich Village $2,110 $3,750 $2,300 -44% -8%
Inwood $402 $368 $475 9% -15%
Lower East Side $1,595 $1,515 $1,225 5% 30%
Midtown East $2,070 $1,950 $1,915 6% 8%
Midtown West $1,193 $1,396 $1,197 -15% 0%
Morningside Heights $1,195 $980
Murray Hill $1,175 $1,165 $1,145 1% 3%
Roosevelt Island $685 $1,000 $1,689 -31% -59%
SoHo $2,998 $2,948 $2,880 2% 4%
Tribeca $4,310 $3,989 $4,358 8% -1%
Upper East Side $1,650 $1,740 $1,600 -5% 3%
Upper West Side $1,460 $1,560 $1,660 -6% -12%
Washington Heights $600 $539 $510 11% 18%
West Harlem $964 $887 $925 9% 4%
West Village $1,855 $4,837 $2,958 -62% -37%

NEW YORK CITY RESIDENTIAL SALES REPORT 4Q17 | 33
APPENDIX - MANHATTAN NEIGHBORHOOD SALES DATA
CONDOMINIUM SALE PRICE PER SQUARE FOOT
Average Price 4Q17 3Q17 4Q16 %Δ from 3Q17 %Δ from 4Q16
Manhattan $1,686 $1,699 $1,765 -1% -4%
Battery Park City $1,383 $1,362 $1,359 2% 2%
Chelsea/Flatiron $1,943 $1,943 $2,208 0% -12%
East Harlem $1,038 $894 $793 16% 31%
East Village $1,623 $1,656 $1,605 -2% 1%
Financial/Seaport $1,495 $1,558 $1,367 -4% 9%
Gramercy/Kips Bay $1,575 $1,817 $1,654 -13% -5%
Greenwich Village $2,275 $2,326 $1,839 -2% 24%
Inwood $613 $591 $502 4% 22%
Lower East Side $1,658 $1,781 $1,368 -7% 21%
Midtown East $2,025 $1,962 $2,218 3% -9%
Midtown West $1,787 $1,862 $1,748 -4% 2%
Morningside Heights $1,011 $1,258
Murray Hill $1,343 $1,332 $1,333 1% 1%
Roosevelt Island $1,295 $1,240 4%
SoHo $2,002 $2,032 $1,943 -1% 3%
Tribeca $2,067 $2,123 $2,485 -3% -17%
Upper East Side $1,586 $1,650 $1,564 -4% 1%
Upper West Side $1,715 $1,695 $1,749 1% -2%
Washington Heights $770 $782 $781 -2% -1%
West Harlem $1,028 $1,017 $992 1% 4%
West Village $2,454 $2,510 $2,683 -2% -9%
Median Price 4Q17 3Q17 4Q16 %Δ from 3Q17 %Δ from 4Q16
Manhattan $1,538 $1,563 $1,527 -2% 1%
Battery Park City $1,383 $1,362 $1,359 2% 2%
Chelsea/Flatiron $1,697 $1,838 $1,936 -8% -12%
East Harlem $998 $950 $806 5% 24%
East Village $1,615 $1,680 $1,678 -4% -4%
Financial/Seaport $1,495 $1,558 $1,367 -4% 9%
Gramercy/Kips Bay $1,562 $1,658 $1,570 -6% -1%
Greenwich Village $2,225 $2,393 $1,781 -7% 25%
Inwood $618 $591 $537 5% 15%
Lower East Side $1,821 $1,875 $1,481 -3% 23%
Midtown East $1,591 $1,558 $1,426 2% 12%
Midtown West $1,615 $1,627 $1,469 -1% 10%
Morningside Heights $1,011 $1,077
Murray Hill $1,352 $1,334 $1,331 1% 2%
Roosevelt Island $1,295 $1,210 7%
SoHo $1,975 $1,957 $1,729 1% 14%
Tribeca $2,007 $2,006 $2,250 0% -11%
Upper East Side $1,531 $1,563 $1,451 -2% 6%
Upper West Side $1,536 $1,575 $1,546 -2% -1%
Washington Heights $786 $775 $762 1% 3%
West Harlem $1,024 $1,061 $1,009 -3% 1%
West Village $2,200 $2,396 $2,585 -8% -15%

NEW YORK CITY RESIDENTIAL SALES REPORT 4Q17 | 34
APPENDIX - MANHATTAN NEIGHBORHOOD SALES DATA
COOPERATIVE SALE PRICE
Average Price (thousands) 4Q17 3Q17 4Q16 %Δ from 3Q17 %Δ from 4Q16
Manhattan $1,228 $1,311 $1,153 -6% 6%
Battery Park City
Chelsea/Flatiron $1,073 $1,281 $1,093 -16% -2%
East Harlem $575 $783 $678 -27% -15%
East Village $885 $952 $1,048 -7% -16%
Financial/Seaport $880 $882 $854 0% 3%
Gramercy/Kips Bay $1,091 $1,072 $962 2% 13%
Greenwich Village $1,491 $1,683 $1,243 -11% 20%
Inwood $489 $473 $453 3% 8%
Lower East Side $798 $868 $758 -8% 5%
Midtown East $1,041 $1,019 $880 2% 18%
Midtown West $989 $861 $1,022 15% -3%
Morningside Heights $878 $997 $668 -12% 32%
Murray Hill $683 $649 $642 5% 6%
Roosevelt Island $970 $1,033 $1,634 -6% -41%
SoHo $2,617 $2,329 $2,259 12% 16%
Tribeca $2,343 $3,008 $3,348 -22% -30%
Upper East Side $1,565 $1,696 $1,591 -8% -2%
Upper West Side $1,496 $1,440 $1,246 4% 20%
Washington Heights $513 $547 $524 -6% -2%
West Harlem $559 $413 $525 35% 7%
West Village $1,188 $1,153 $1,066 3% 11%
Median Price (thousands) 4Q17 3Q17 4Q16 %Δ from 3Q17 %Δ from 4Q16
Manhattan $775 $813 $752 -5% 3%
Battery Park City
Chelsea/Flatiron $768 $899 $830 -15% -7%
East Harlem $598 $777 $660 -23% -9%
East Village $780 $688 $730 13% 7%
Financial/Seaport $775 $768 $742 1% 5%
Gramercy/Kips Bay $759 $760 $790 0% -4%
Greenwich Village $1,245 $1,250 $990 0% 26%
Inwood $523 $380 $390 38% 34%
Lower East Side $795 $783 $750 2% 6%
Midtown East $750 $725 $675 3% 11%
Midtown West $645 $670 $710 -4% -9%
Morningside Heights $720 $786 $630 -8% 14%
Murray Hill $523 $552 $517 -5% 1%
Roosevelt Island $771 $1,115 $808 -31% -5%
SoHo $2,275 $1,185 $2,223 92% 2%
Tribeca $2,248 $2,770 $3,595 -19% -37%
Upper East Side $872 $915 $838 -5% 4%
Upper West Side $1,043 $950 $850 10% 23%
Washington Heights $474 $480 $483 -1% -2%
West Harlem $584 $350 $460 67% 27%
West Village $766 $945 $835 -19% -8%

NEW YORK CITY RESIDENTIAL SALES REPORT 4Q17 | 35
APPENDIX - MANHATTAN NEIGHBORHOOD SALES DATA
COOPERATIVE SALE PRICE PER SQUARE FOOT
Average Price 4Q17 3Q17 4Q16 %Δ from 3Q17 %Δ from 4Q16
Manhattan $1,228 $1,279 $1,263 -4% -3%
Battery Park City
Chelsea/Flatiron $1,340 $1,459 $1,405 -8% -5%
East Harlem
East Village $1,000 $1,416 $1,445 -29% -31%
Financial/Seaport $1,190 $1,053 $1,060 13% 12%
Gramercy/Kips Bay $1,336 $1,307 $1,305 2% 2%
Greenwich Village $1,514 $1,614 $1,501 -6% 1%
Inwood $520 $624 $675 -17% -23%
Lower East Side $881 $965 $1,076 -9% -18%
Midtown East $1,159 $1,080 $1,095 7% 6%
Midtown West $1,287 $1,230 $1,288 5% 0%
Morningside Heights $1,013 $1,159 $1,061 -13% -5%
Murray Hill $1,042 $1,106 $1,071 -6% -3%
Roosevelt Island
SoHo $1,567 $1,425 $1,550 10% 1%
Tribeca $1,325 $1,579 $2,086 -16% -36%
Upper East Side $1,207 $1,264 $1,233 -5% -2%
Upper West Side $1,341 $1,328 $1,386 1% -3%
Washington Heights $660 $824 $722 -20% -9%
West Harlem $1,046 $961 $851 9% 23%
West Village $1,505 $1,726 $1,628 -13% -8%
Median Price 4Q17 3Q17 4Q16 %Δ from 3Q17 %Δ from 4Q16
Manhattan $1,129 $1,178 $1,144 -4% -1%
Battery Park City
Chelsea/Flatiron $1,313 $1,398 $1,422 -6% -8%
East Harlem
East Village $937 $1,212 $1,334 -23% -30%
Financial/Seaport $1,190 $1,053 $1,060 13% 12%
Gramercy/Kips Bay $1,250 $1,212 $1,228 3% 2%
Greenwich Village $1,427 $1,438 $1,415 -1% 1%
Inwood $513 $605 $659 -15% -22%
Lower East Side $854 $893 $964 -4% -11%
Midtown East $1,089 $1,027 $1,015 6% 7%
Midtown West $977 $1,198 $1,233 -18% -21%
Morningside Heights $994 $1,111 $1,080 -11% -8%
Murray Hill $1,030 $1,046 $1,070 -2% -4%
Roosevelt Island
SoHo $1,282 $1,378 $1,612 -7% -20%
Tribeca $1,417 $1,543 $2,086 -8% -32%
Upper East Side $1,077 $1,146 $1,060 -6% 2%
Upper West Side $1,189 $1,202 $1,180 -1% 1%
Washington Heights $720 $867 $712 -17% 1%
West Harlem $1,057 $961 $851 10% 24%
West Village $1,429 $1,666 $1,486 -14% -4%

NEW YORK CITY RESIDENTIAL SALES REPORT 4Q17 | 36
APPENDIX - QUEENS NEIGHBORHOOD SALES DATA
CONDOMINIUM SALE PRICE
Average Price (thousands) 4Q17 3Q17 4Q16 %Δ from 3Q17 %Δ from 4Q16
Queens $704 $723 $535 -3% 32%
Astoria $644 $621 $673 4% -4%
Bayside $622 $633 $584 -2% 6%
Beechhurst/Whitestone $620 $561 $516 11% 20%
Breezy Point/Belle Harbor/ Rockaway Park $461 $460 $404 0% 14%
Briarwood/Jamaica Hills/Hillcrest $444 $418 $426 6% 4%
College Point $585 $569 $499 3% 17%
Corona/East Elmhurst $395 $379 $399 4% -1%
Douglaston/Little Neck $499 $642 $613 -22% -18%
Floral Park/Bellerose
Flushing $961 $874 $537 10% 79%
Fresh Meadows/Oakland Gardens $506 $545 $524 -7% -3%
Howard Beach/Broad Channel $234 $302 $292 -23% -20%
Jackson Heights/Elmhurst $462 $473 $422 -2% 9%
Jamaica Estates/Holliswood $340 $343 $275 -1% 24%
Laurelton/Cambria Heights/ St. Albans/Rosedale $345
Long Island City $1,026 $1,041 $871 -1% 18%
Middle Village/Maspeth $462 $504 $433 -8% 7%
Queens Village/Hollis
Rego Park/Forest Hills/Kew Gardens $557 $519 $557 7% 0%
Richmond Hill/ South Ozone Park/Woodhaven $416 $345 $177 20% 135%
Ridgewood/Glendale $541 $599 $561 -10% -4%
Rockaways/Averne $369 $314 $311 18% 19%
Springfield Gardens/Jamaica/ South Jamaica/Baisley Park $251 $295 $187 -15% 35%
Sunnyside/Woodside $503 $493 $484 2% 4%

NEW YORK CITY RESIDENTIAL SALES REPORT 4Q17 | 37
APPENDIX - QUEENS NEIGHBORHOOD SALES DATA
CONDOMINIUM SALE PRICE
Median Price (thousands) 4Q17 3Q17 4Q16 %Δ from 3Q17 %Δ from 4Q16
Queens $583 $495 $480 18% 21%
Astoria $628 $625 $565 1% 11%
Bayside $636 $605 $610 5% 4%
Beechhurst/Whitestone $620 $570 $483 9% 28%
Breezy Point/Belle Harbor/ Rockaway Park $455 $385 $378 18% 20%
Briarwood/Jamaica Hills/Hillcrest $441 $440 $411 0% 7%
College Point $623 $480 $493 30% 26%
Corona/East Elmhurst $415 $390 $405 6% 2%
Douglaston/Little Neck $368 $540 $588 -32% -38%
Floral Park/Bellerose
Flushing $742 $500 $499 48% 49%
Fresh Meadows/Oakland Gardens $528 $565 $565 -7% -7%
Howard Beach/Broad Channel $209 $260 $299 -20% -30%
Jackson Heights/Elmhurst $440 $408 $410 8% 7%
Jamaica Estates/Holliswood $340 $335 $275 2% 24%
Laurelton/Cambria Heights/ St. Albans/Rosedale $345
Long Island City $962 $1,093 $848 -12% 13%
Middle Village/Maspeth $495 $298 $450 66% 10%
Queens Village/Hollis
Rego Park/Forest Hills/Kew Gardens $444 $480 $505 -7% -12%
Richmond Hill/ South Ozone Park/Woodhaven $409 $270 $136 51% 201%
Ridgewood/Glendale $541 $470 $563 15% -4%
Rockaways/Averne $250 $383 $290 -35% -14%
Springfield Gardens/Jamaica/ South Jamaica/Baisley Park $299 $193 $160 55% 87%
Sunnyside/Woodside $483 $408 $460 18% 5%

NEW YORK CITY RESIDENTIAL SALES REPORT 4Q17 | 38
APPENDIX - QUEENS NEIGHBORHOOD SALES DATA
CONDOMINIUM SALE PRICE PER SQUARE FOOT
Average Price 4Q17 3Q17 4Q16 %Δ from 3Q17 %Δ from 4Q16
Queens $770 $828 $576 -7% 34%
Astoria $923 $869 $844 6% 9%
Bayside $613 $625 $628 -2% -2%
Beechhurst/Whitestone $596 $573 $537 4% 11%
Breezy Point/Belle Harbor/ Rockaway Park $392 $341 $415 15% -6%
Briarwood/Jamaica Hills/Hillcrest $567 $560 $504 1% 13%
College Point $457 $409 $430 12% 6%
Corona/East Elmhurst $566 $582 $523 -3% 8%
Douglaston/Little Neck $582 $488 $440 19% 32%
Floral Park/Bellerose
Flushing $971 $1,010 $623 -4% 56%
Fresh Meadows/Oakland Gardens $619 $546 $568 13% 9%
Howard Beach/Broad Channel $262 $298 $283 -12% -7%
Jackson Heights/Elmhurst $593 $605 $520 -2% 14%
Jamaica Estates/Holliswood $402 $437 $360 -8% 12%
Laurelton/Cambria Heights/ St. Albans/Rosedale $197
Long Island City $1,126 $1,147 $1,011 -2% 11%
Middle Village/Maspeth $457 $571 $643 -20% -29%
Queens Village/Hollis
Rego Park/Forest Hills/Kew Gardens $657 $592 $563 11% 17%
Richmond Hill/ South Ozone Park/Woodhaven $391 $380 $177 3% 121%
Ridgewood/Glendale $674 $771 $370 -13% 82%
Rockaways/Averne $326 $323 $298 1% 9%
Springfield Gardens/Jamaica/ South Jamaica/Baisley Park $335 $355 $223 -6% 50%
Sunnyside/Woodside $730 $660 $672 11% 9%

NEW YORK CITY RESIDENTIAL SALES REPORT 4Q17 | 39
APPENDIX - QUEENS NEIGHBORHOOD SALES DATA
CONDOMINIUM SALE PRICE PRICE PER SQUARE FOOT
Median Price 4Q17 3Q17 4Q16 %Δ from 3Q17 %Δ from 4Q16
Queens $698 $581 $553 20% 26%
Astoria $982 $915 $819 7% 20%
Bayside $618 $616 $630 0% -2%
Beechhurst/Whitestone $596 $640 $537 -7% 11%
Breezy Point/Belle Harbor/ Rockaway Park $434 $376 $415 15% 5%
Briarwood/Jamaica Hills/Hillcrest $584 $502 $501 16% 17%
College Point $490 $526 $434 -7% 13%
Corona/East Elmhurst $566 $522 $547 8% 4%
Douglaston/Little Neck $592 $510 $467 16% 27%
Floral Park/Bellerose
Flushing $1,052 $650 $636 62% 65%
Fresh Meadows/Oakland Gardens $636 $553 $562 15% 13%
Howard Beach/Broad Channel $256 $259 $275 -1% -7%
Jackson Heights/Elmhurst $568 $516 $516 10% 10%
Jamaica Estates/Holliswood $402 $911 $360 -56% 12%
Laurelton/Cambria Heights/ St. Albans/Rosedale $197
Long Island City $1,159 $1,119 $1,045 4% 11%
Middle Village/Maspeth $439 $512 $643 -14% -32%
Queens Village/Hollis
Rego Park/Forest Hills/Kew Gardens $643 $545 $562 18% 14%
Richmond Hill/ South Ozone Park/Woodhaven $362 $345 $172 5% 111%
Ridgewood/Glendale $674 $428 $355 57% 90%
Rockaways/Averne $280 $305 $281 -8% 0%
Springfield Gardens/Jamaica/ South Jamaica/Baisley Park $369 $322 $185 15% 99%
Sunnyside/Woodside $718 $644 $695 11% 3%

NEW YORK CITY RESIDENTIAL SALES REPORT 4Q17 | 40
APPENDIX - QUEENS NEIGHBORHOOD SALES DATA
COOPERATIVE SALE PRICE
Average Price (thousands) 4Q17 3Q17 4Q16 %Δ from 3Q17 %Δ from 4Q16
Queens $299 $303 $276 -1% 8%
Astoria $362 $392 $331 -8% 9%
Bayside $300 $285 $267 5% 12%
Beechhurst/Whitestone $298 $304 $293 -2% 2%
Breezy Point/Belle Harbor/ Rockaway Park $214 $281 $181 -24% 18%
Briarwood/Jamaica Hills/Hillcrest $226 $216 $209 5% 8%
College Point
Corona/East Elmhurst $185 $178 $160 4% 15%
Douglaston/Little Neck $258 $231 $232 12% 11%
Floral Park/Bellerose $383 $417 $384 -8% 0%
Flushing $286 $274 $258 4% 11%
Fresh Meadows/Oakland Gardens $238 $252 $217 -6% 9%
Howard Beach/Broad Channel $180 $199 $148 -10% 22%
Jackson Heights/Elmhurst $331 $351 $322 -6% 3%
Jamaica Estates/Holliswood $190 $170 $190 11% 0%
Laurelton/Cambria Heights/ St. Albans/Rosedale $136 $124 $147 9% -8%
Long Island City $549 $700 $595 -22% -8%
Middle Village/Maspeth $253 $254 $201 0% 26%
Queens Village/Hollis $184 $191 $167 -4% 10%
Rego Park/Forest Hills/Kew Gardens $334 $338 $292 -1% 15%
Richmond Hill/ South Ozone Park/Woodhaven $165 $142 $240 16% -31%
Ridgewood/Glendale $220 $259 $188 -15% 17%
Rockaways/Averne $165 $124 34%
Springfield Gardens/Jamaica/ South Jamaica/Baisley Park $159 $158 $142 0% 12%
Sunnyside/Woodside $337 $334 $322 1% 4%

NEW YORK CITY RESIDENTIAL SALES REPORT 4Q17 | 41
APPENDIX - QUEENS NEIGHBORHOOD SALES DATA
COOPERATIVE SALE PRICE
Median Price (thousands) 4Q17 3Q17 4Q16 %Δ from 3Q17 %Δ from 4Q16
Queens $275 $269 $247 2% 12%
Astoria $349 $360 $340 -3% 3%
Bayside $267 $273 $261 -2% 2%
Beechhurst/Whitestone $275 $285 $264 -3% 4%
Breezy Point/Belle Harbor/ Rockaway Park $214 $243 $176 -12% 22%
Briarwood/Jamaica Hills/Hillcrest $225 $215 $210 5% 7%
College Point
Corona/East Elmhurst $180 $175 $155 3% 16%
Douglaston/Little Neck $260 $228 $230 14% 13%
Floral Park/Bellerose $302 $282 $284 7% 6%
Flushing $290 $270 $250 7% 16%
Fresh Meadows/Oakland Gardens $220 $261 $198 -16% 11%
Howard Beach/Broad Channel $170 $207 $139 -18% 22%
Jackson Heights/Elmhurst $327 $320 $280 2% 17%
Jamaica Estates/Holliswood $178 $163 $155 9% 15%
Laurelton/Cambria Heights/ St. Albans/Rosedale $135 $120 $157 13% -14%
Long Island City $526 $635 $615 -17% -14%
Middle Village/Maspeth $239 $260 $198 -8% 20%
Queens Village/Hollis $173 $184 $155 -6% 12%
Rego Park/Forest Hills/Kew Gardens $300 $305 $257 -1% 17%
Richmond Hill/ South Ozone Park/Woodhaven $165 $142 $240 16% -31%
Ridgewood/Glendale $230 $241 $185 -4% 24%
Rockaways/Averne $165 $124 34%
Springfield Gardens/Jamaica/ South Jamaica/Baisley Park $150 $148 $122 2% 23%
Sunnyside/Woodside $324 $336 $315 -4% 3%

NEW YORK CITY RESIDENTIAL SALES REPORT 4Q17 | 42
APPENDIX - QUEENS NEIGHBORHOOD SALES DATA
COOPERATIVE SALE PRICE PER SQUARE FOOT
Average Price 4Q17 3Q17 4Q16 %Δ from 3Q17 %Δ from 4Q16
Queens $398 $406 $378 -2% 5%
Astoria $489 $569 $650 -14% -25%
Bayside $388 $390 $357 0% 9%
Beechhurst/Whitestone $373 $376 $357 -1% 4%
Breezy Point/Belle Harbor/ Rockaway Park $363 $269 $298 35% 22%
Briarwood/Jamaica Hills/Hillcrest $293 $336 $317 -13% -8%
College Point
Corona/East Elmhurst $246 $272 $216 -9% 14%
Douglaston/Little Neck $314 $288 $289 9% 9%
Floral Park/Bellerose $407 $442 $411 -8% -1%
Flushing $393 $372 $347 6% 13%
Fresh Meadows/Oakland Gardens $383 $393 $363 -2% 6%
Howard Beach/Broad Channel $210 $239 $176 -12% 19%
Jackson Heights/Elmhurst $456 $477 $464 -5% -2%
Jamaica Estates/Holliswood $225 $223 $211 1% 7%
Laurelton/Cambria Heights/ St. Albans/Rosedale
Long Island City $688 $684 1%
Middle Village/Maspeth $340 $318 $301 7% 13%
Queens Village/Hollis $351 $473 -26%
Rego Park/Forest Hills/Kew Gardens $459 $453 $384 1% 20%
Richmond Hill/ South Ozone Park/Woodhaven
Ridgewood/Glendale $294 $352 $279 -17% 5%
Rockaways/Averne $138 $168 -18%
Springfield Gardens/Jamaica/ South Jamaica/Baisley Park $269 $253 $226 6% 19%
Sunnyside/Woodside $468 $499 $513 -6% -9%

NEW YORK CITY RESIDENTIAL SALES REPORT 4Q17 | 43
APPENDIX - QUEENS NEIGHBORHOOD SALES DATA
COOPERATIVE SALE PRICE PRICE PER SQUARE FOOT
Median Price 4Q17 3Q17 4Q16 %Δ from 3Q17 %Δ from 4Q16
Queens $383 $390 $355 -2% 8%
Astoria $499 $616 $659 -19% -24%
Bayside $401 $375 $342 7% 17%
Beechhurst/Whitestone $378 $377 $353 0% 7%
Breezy Point/Belle Harbor/ Rockaway Park $363 $269 $300 35% 21%
Briarwood/Jamaica Hills/Hillcrest $269 $276 $283 -2% -5%
College Point
Corona/East Elmhurst $244 $272 $205 -10% 19%
Douglaston/Little Neck $296 $281 $276 5% 7%
Floral Park/Bellerose $393 $462 $396 -15% -1%
Flushing $393 $369 $330 6% 19%
Fresh Meadows/Oakland Gardens $405 $395 $384 2% 5%
Howard Beach/Broad Channel $207 $236 $181 -12% 14%
Jackson Heights/Elmhurst $455 $484 $462 -6% -2%
Jamaica Estates/Holliswood $227 $223 $174 1% 30%
Laurelton/Cambria Heights/ St. Albans/Rosedale
Long Island City $688 $684 1%
Middle Village/Maspeth $336 $317 $300 6% 12%
Queens Village/Hollis $351 $473 -26%
Rego Park/Forest Hills/Kew Gardens $431 $458 $372 -6% 16%
Richmond Hill/ South Ozone Park/Woodhaven
Ridgewood/Glendale $294 $350 $265 -16% 11%
Rockaways/Averne $138 $168 -18%
Springfield Gardens/Jamaica/ South Jamaica/Baisley Park $243 $255 $233 -5% 4%
Sunnyside/Woodside $472 $471 $526 0% -10%
NEW YORK CITY RESIDENTIAL SALES REPORT 4Q17 | 44
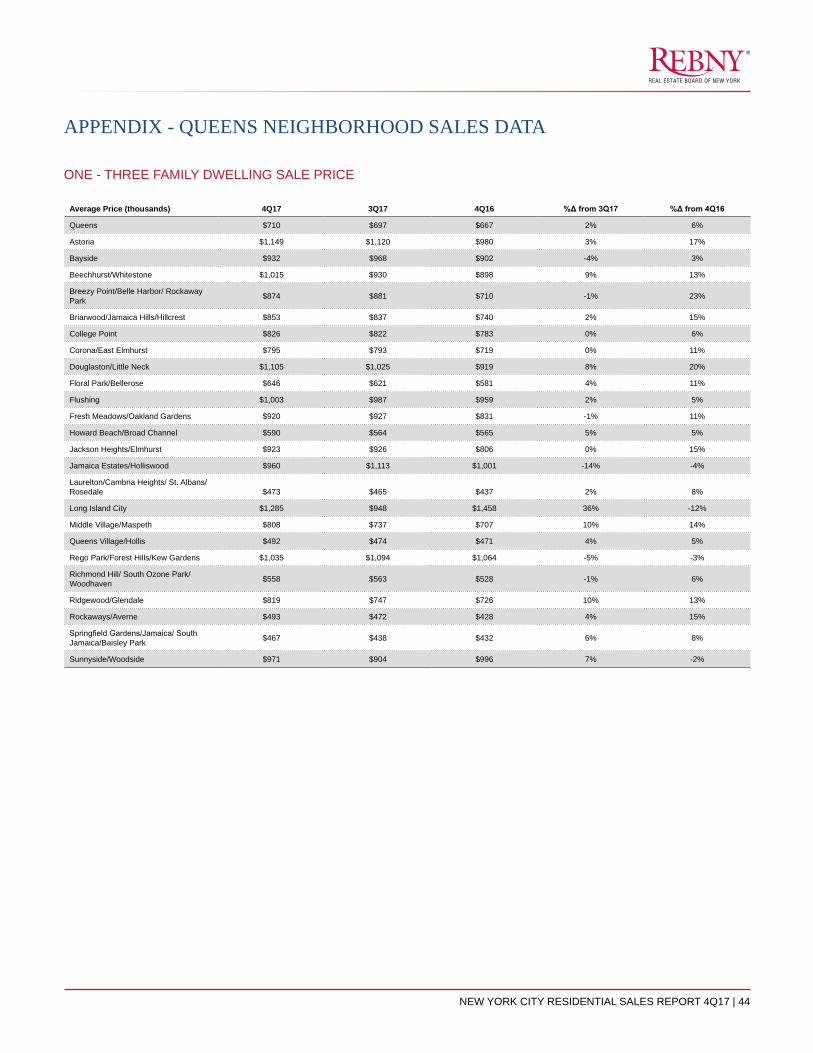
APPENDIX - QUEENS NEIGHBORHOOD SALES DATA
ONE - THREE FAMILY DWELLING SALE PRICE
Average Price (thousands) 4Q17 3Q17 4Q16 %Δ from 3Q17 %Δ from 4Q16
Queens $710 $697 $667 2% 6%
Astoria $1,149 $1,120 $980 3% 17%
Bayside $932 $968 $902 -4% 3%
Beechhurst/Whitestone $1,015 $930 $898 9% 13%
Breezy Point/Belle Harbor/ Rockaway Park $874 $881 $710 -1% 23%
Briarwood/Jamaica Hills/Hillcrest $853 $837 $740 2% 15%
College Point $826 $822 $783 0% 6%
Corona/East Elmhurst $795 $793 $719 0% 11%
Douglaston/Little Neck $1,105 $1,025 $919 8% 20%
Floral Park/Bellerose $646 $621 $581 4% 11%
Flushing $1,003 $987 $959 2% 5%
Fresh Meadows/Oakland Gardens $920 $927 $831 -1% 11%
Howard Beach/Broad Channel $590 $564 $565 5% 5%
Jackson Heights/Elmhurst $923 $926 $806 0% 15%
Jamaica Estates/Holliswood $960 $1,113 $1,001 -14% -4%
Laurelton/Cambria Heights/ St. Albans/Rosedale $473 $465 $437 2% 8%
Long Island City $1,285 $948 $1,458 36% -12%
Middle Village/Maspeth $808 $737 $707 10% 14%
Queens Village/Hollis $492 $474 $471 4% 5%
Rego Park/Forest Hills/Kew Gardens $1,035 $1,094 $1,064 -5% -3%
Richmond Hill/ South Ozone Park/Woodhaven $558 $563 $528 -1% 6%
Ridgewood/Glendale $819 $747 $726 10% 13%
Rockaways/Averne $493 $472 $428 4% 15%
Springfield Gardens/Jamaica/ South Jamaica/Baisley Park $467 $438 $432 6% 8%
Sunnyside/Woodside $971 $904 $996 7% -2%

NEW YORK CITY RESIDENTIAL SALES REPORT 4Q17 | 45
APPENDIX - QUEENS NEIGHBORHOOD SALES DATA
ONE - THREE FAMILY DWELLING SALE PRICE
Median Price (thousands) 4Q17 3Q17 4Q16 %Δ from 3Q17 %Δ from 4Q16
Queens $665 $650 $631 2% 5%
Astoria $1,150 $986 $955 17% 20%
Bayside $875 $870 $873 1% 0%
Beechhurst/Whitestone $880 $880 $829 0% 6%
Breezy Point/Belle Harbor/ Rockaway Park $865 $715 $725 21% 19%
Briarwood/Jamaica Hills/Hillcrest $833 $825 $728 1% 14%
College Point $845 $760 $750 11% 13%
Corona/East Elmhurst $795 $825 $700 -4% 14%
Douglaston/Little Neck $980 $892 $905 10% 8%
Floral Park/Bellerose $600 $600 $580 0% 3%
Flushing $950 $945 $904 1% 5%
Fresh Meadows/Oakland Gardens $905 $930 $860 -3% 5%
Howard Beach/Broad Channel $625 $615 $586 2% 7%
Jackson Heights/Elmhurst $864 $890 $790 -3% 9%
Jamaica Estates/Holliswood $940 $978 $930 -4% 1%
Laurelton/Cambria Heights/ St. Albans/Rosedale $460 $450 $436 2% 6%
Long Island City $1,385 $940 $1,038 47% 33%
Middle Village/Maspeth $762 $743 $700 3% 9%
Queens Village/Hollis $475 $489 $465 -3% 2%
Rego Park/Forest Hills/Kew Gardens $950 $987 $879 -4% 8%
Richmond Hill/ South Ozone Park/Woodhaven $545 $550 $510 -1% 7%
Ridgewood/Glendale $792 $700 $715 13% 11%
Rockaways/Averne $465 $432 $385 8% 21%
Springfield Gardens/Jamaica/ South Jamaica/Baisley Park $445 $410 $400 9% 11%
Sunnyside/Woodside $977 $915 $958 7% 2%

NEW YORK CITY RESIDENTIAL SALES REPORT 4Q17 | 46
APPENDIX - STATEN ISLAND NEIGHBORHOOD SALES DATA
ONE - THREE FAMILY DWELLING SALE PRICE
Average Price (thousands) 4Q17 3Q17 4Q16 %Δ from 3Q17 %Δ from 4Q16
Staten Island $551 $549 $512 0% 8%
Annadale $728 $738 $687 -1% 6%
Arden Heights $433 $437 $374 -1% 16%
Arrochar $605 $638 $490 -5% 24%
Arrochar / Shore Acres $250 $755 $406 -67% -38%
Bloomfield
Bulls Head $532 $513 $467 4% 14%
Castleton Corners $626 $520 $557 20% 12%
Clove Lakes $576 $603 $530 -5% 9%
Concord $375 $393 $354 -5% 6%
Concord / Fox Hills $339 $338 $316 0% 7%
Dongan Hills $685 $608 $601 13% 14%
Dongan Hills-Colony $707 $835 $915 -15% -23%
Dongan Hills-Old Town $390 $493
Eltingville $583 $531 $533 10% 10%
Emerson Hill $653 $1,049 $1,179 -38% -45%
Fresh Kills $791 $762
Grant City $643 $519 $455 24% 41%
Grasmere $646 $575 $635 12% 2%
Great Kills $546 $533 $479 2% 14%
Great Kills-Bay Terrace $579 $616 $491 -6% 18%
Grymes Hill $539 $633 $575 -15% -6%
Huguenot $771 $715 $663 8% 16%
Livingston $448 $531 $502 -16% -11%
Manor Heights $677 $642 $504 6% 34%
Mariners Harbor $364 $360 $315 1% 16%
Midland Beach $518 $451 $420 15% 23%
New Brighton $423 $477 $344 -11% 23%
New Brighton-St. George

NEW YORK CITY RESIDENTIAL SALES REPORT 4Q17 | 47
APPENDIX - STATEN ISLAND NEIGHBORHOOD SALES DATA
ONE - THREE FAMILY DWELLING SALE PRICE
Average Price (thousands) 4Q17 3Q17 4Q16 %Δ from 3Q17 %Δ from 4Q16
New Dorp $564 $572 $506 -1% 11%
New Dorp Beach $446 $401 $422 11% 6%
New Dorp Heights $643 $643 $654 0% -2%
New Springville $558 $596 $572 -6% -2%
Oakwood $675 $565 $485 19% 39%
Oakwood Beach $481 $508 $546 -5% -12%
Pleasant Plains $665 $740 $664 -10% 0%
Port Ivory $362 $397 $256 -9% 41%
Port Richmond $393 $378 $376 4% 4%
Prince’s Bay $712 $694 $764 3% -7%
Richmond $661 $760 $645 -13% 2%
Richmond - Lighthouse Hill $850 $730 $850 16% 0%
Rosebank $499 $512 $495 -3% 1%
Rossville $516 $659 $528 -22% -2%
Rossville Charleston $644 $572 $589 12% 9%
Rossville Port Mobil
Rossville Richmond Valley $768 $355
Silver Lake $618 $630 $627 -2% -2%
South Beach $551 $514 $475 7% 16%
Stapleton $370 $334 $321 11% 15%
Stapleton-Clifton $475 $406 $425 17% 12%
Sunnyside $614 $625 $498 -2% 23%
Todt Hill $1,445 $1,188 $1,451 22% 0%
Tompkinsville $470 $398 $427 18% 10%
Tottenville $682 $661 $613 3% 11%
Travis $496 $425 $404 17% 23%
West New Brighton $443 $442 $365 0% 21%
Westerleigh $578 $553 $515 4% 12%
Willowbrook $623 $649 $600 -4% 4%
Woodrow $544 $580 $549 -6% -1%

NEW YORK CITY RESIDENTIAL SALES REPORT 4Q17 | 48
APPENDIX - STATEN ISLAND NEIGHBORHOOD SALES DATA
ONE - THREE FAMILY DWELLING SALE PRICE
Median Price (thousands) 4Q17 3Q17 4Q16 %Δ from 3Q17 %Δ from 4Q16
Staten Island $520 $526 $478 -1% 9%
Annadale $748 $798 $675 -6% 11%
Arden Heights $390 $403 $350 -3% 11%
Arrochar $605 $584 $570 4% 6%
Arrochar / Shore Acres $250 $755 $335 -67% -25%
Bloomfield
Bulls Head $510 $513 $468 -1% 9%
Castleton Corners $600 $531 $560 13% 7%
Clove Lakes $540 $605 $525 -11% 3%
Concord $380 $378 $335 1% 13%
Concord / Fox Hills $354 $331 $290 7% 22%
Dongan Hills $655 $582 $554 13% 18%
Dongan Hills-Colony $717 $800 $885 -10% -19%
Dongan Hills-Old Town $390 $493
Eltingville $570 $530 $495 8% 15%
Emerson Hill $580 $1,106 $1,073 -48% -46%
Fresh Kills $764 $762
Grant City $575 $516 $430 12% 34%
Grasmere $605 $570 $618 6% -2%
Great Kills $545 $525 $465 4% 17%
Great Kills-Bay Terrace $498 $635 $535 -22% -7%
Grymes Hill $474 $610 $530 -22% -11%
Huguenot $775 $663 $657 17% 18%
Livingston $450 $500 $461 -10% -2%
Manor Heights $573 $625 $512 -8% 12%
Mariners Harbor $375 $366 $320 2% 17%
Midland Beach $500 $473 $453 6% 10%
New Brighton $388 $450 $319 -14% 21%
New Brighton-St. George

NEW YORK CITY RESIDENTIAL SALES REPORT 4Q17 | 49
APPENDIX - STATEN ISLAND NEIGHBORHOOD SALES DATA
ONE - THREE FAMILY DWELLING SALE PRICE
Median Price (thousands) 4Q17 3Q17 4Q16 %Δ from 3Q17 %Δ from 4Q16
New Dorp $547 $565 $455 -3% 20%
New Dorp Beach $461 $396 $410 16% 13%
New Dorp Heights $553 $578 $625 -4% -12%
New Springville $575 $586 $578 -2% 0%
Oakwood $648 $575 $539 13% 20%
Oakwood Beach $495 $525 $459 -6% 8%
Pleasant Plains $543 $745 $490 -27% 11%
Port Ivory $339 $370 $264 -8% 28%
Port Richmond $385 $380 $394 1% -2%
Prince’s Bay $690 $651 $684 6% 1%
Richmond $640 $658 $632 -3% 1%
Richmond - Lighthouse Hill $850 $730 $810 16% 5%
Rosebank $495 $502 $460 -1% 8%
Rossville $454 $617 $480 -26% -5%
Rossville Charleston $655 $585 $553 12% 19%
Rossville Port Mobil
Rossville Richmond Valley $768 $324
Silver Lake $600 $628 $590 -4% 2%
South Beach $520 $485 $465 7% 12%
Stapleton $383 $321 $300 19% 28%
Stapleton-Clifton $485 $379 $395 28% 23%
Sunnyside $603 $625 $500 -4% 21%
Todt Hill $1,405 $1,138 $1,575 24% -11%
Tompkinsville $430 $410 $404 5% 6%
Tottenville $650 $652 $603 0% 8%
Travis $470 $465 $429 1% 9%
West New Brighton $460 $402 $375 14% 23%
Westerleigh $543 $537 $510 1% 6%
Willowbrook $638 $600 $569 6% 12%
Woodrow $560 $550 $520 2% 8%

NEW YORK CITY RESIDENTIAL SALES REPORT 4Q17 | 50
APPENDIX - MANHATTAN TOWNHOUSE SALES DATA
Address Recorded Date Price NeighborhoodBldg Class Stories
Building Depth (Feet)
Building Front (Feet)
153 FRANKLIN STREET 10/30/2017 $18,000,000 TRIBECA A4 3 26 55
26 BANK STREET 11/3/2017 $17,850,000 WEST VILLAGE C0 3 19 52
39 WEST 70 STREET 12/1/2017 $15,000,000 UPPER WEST SIDE A4 4 20 76
117 EAST 79 STREET 10/25/2017 $15,000,000 UPPER EAST SIDE A4 5 20 60
24 WEST 71 STREET 12/13/2017 $13,715,675 UPPER WEST SIDE A4 4 20 66
77 JANE STREET 10/2/2017 $13,250,000 WEST VILLAGE C0 3 20 42
174 EAST 64 STREET 11/20/2017 $12,750,000 UPPER EAST SIDE A4 5 20 50
57 BANK STREET 11/27/2017 $12,550,000 WEST VILLAGE A4 3 18 36
33 CHARLES STREET 12/8/2017 $10,500,000 WEST VILLAGE A4 3 17 47
147 EAST 63 STREET 10/20/2017 $10,300,000 UPPER EAST SIDE A4 4 16 65
319 EAST 51 STREET 10/23/2017 $9,950,000 MIDTOWN EAST A4 4 18 42
154 EAST 38 STREET 11/15/2017 $9,750,000 MURRAY HILL A9 4 43 46
105 EAST 64 STREET 11/30/2017 $8,600,000 UPPER EAST SIDE B3 5 20 60
417 EAST 84 STREET 11/27/2017 $8,300,000 UPPER EAST SIDE A4 4 18 63
236 EAST 49 STREET 11/21/2017 $8,250,000 MIDTOWN EAST A4 4 19 48
320 WEST 80 STREET 11/15/2017 $7,649,000 UPPER WEST SIDE B3 5 17 55
311 WEST 91 STREET 12/19/2017 $7,600,000 UPPER WEST SIDE C0 5 25 55
41 BETHUNE STREET 10/10/2017 $7,220,000 WEST VILLAGE B9 3 20 40
37 WEST 94 STREET 10/10/2017 $6,575,000 UPPER WEST SIDE C0 3 17 50
381 WEST END AVENUE 11/13/2017 $5,000,000 UPPER WEST SIDE C0 3 29 40
208 LENOX AVENUE 12/12/2017 $4,590,000 WEST HARLEM C0 4 19 45
229 WEST 71 STREET 12/8/2017 $4,300,000 UPPER WEST SIDE B3 3 17 60
38 WEST 120 STREET 10/11/2017 $4,250,000 WEST HARLEM A4 3 18 70
471 WEST 144 STREET 10/26/2017 $3,922,000 WEST HARLEM C0 3 17 54
321 WEST 136 STREET 11/30/2017 $3,525,000 WEST HARLEM B9 2 13 48
533 MANHATTAN AVENUE 10/26/2017 $3,400,000 WEST HARLEM B1 3 15 56
457 WEST 140 STREET 11/24/2017 $3,300,000 WEST HARLEM A4 4 18 84
131 WEST 131 STREET 11/21/2017 $2,855,000 WEST HARLEM C0 3 16 53
226 WEST 132 STREET 10/30/2017 $2,720,000 WEST HARLEM A4 3 17 50
355 WEST 120 STREET 11/22/2017 $2,625,000 WEST HARLEM A5 3 18 62
421 EAST 118 STREET 10/6/2017 $2,310,000 EAST HARLEM C0 3 16 45
146 WEST 136 STREET 11/30/2017 $2,250,000 WEST HARLEM C0 3 17 56
2 WEST 123 STREET 10/12/2017 $1,975,000 WEST HARLEM B1 3 20 50
16 SYLVAN TERRACE 10/4/2017 $1,560,000 WASHINGTON HEIGHTS A9 2 19 25
611 WEST 142 STREET 12/12/2017 $1,330,000 WEST HARLEM B3 3 15 58
8 FT CHARLES PLACE 12/15/2017 $991,500 INWOOD B2 3 33 40
11 EAST 129 STREET 11/30/2017 $925,000 EAST HARLEM A4 3 16 38
55 ADRIAN AVENUE 11/3/2017 $637,500 INWOOD A1 3 22 37
170 WEST 225 STREET 11/30/2017 $610,950 INWOOD B2 2 21 56