Embed Size (px)
Citation preview
The Put Option Approach to Banking Crises in Emerging Markets:Valuing Implicit Deposit Insurance in Thailand
Idanna Kaplan
University of Washington
November 9, 1998
Abstract: In this paper, I develop an approach to evaluate deposit insurance as acontributing factor in banking crises in emerging markets. Deposit insurance, as agovernment guarantee of the banking system, acts as a subsidy to banks. As banks try toincrease this subsidy by growing rapidly and undertaking riskier lending, they createconditions that make banking crises possible. Using an established result that modelsdeposit insurance as a put option on the value of bank assets, I construct a program thatmaximizes a likelihood function relating the observed equity values of the bank to theunobserved asset values implied by the put option. Results show that the average value ofthis subsidy to Thai commercial banks between 1992 and 1996 was almost Bt 330 billionor 13 percent of total deposits. The guarantee, while sizeable during 1992-1995increased sharply in 1996. Large subsidy values prior to 1996 suggest that the crisis hadincubated for years and was not solely caused by the sudden fall in the Baht. Theincrease in the subsidy in 1996 reflects the lower net worth of banks and their greaterincentives for risk-taking. Moreover, those banks with the highest insurance subsidiesover the sample were the banks that were nationalized by the government or bought byforeign owners in 1998.
1
1. Introduction
In this paper, I develop an empirical approach to banking crises in emerging
markets based upon an estimation of the option value of deposit insurance to banks. This
paper shows that the put-option approach can serve as an early warning system to
regulators by indicating the depth of the dependence of the banking system on deposit
guarantees. Another advantage to the put-option approach is its ability to distinguish
unsafe banks before a crisis emerges.
In contrast, the empirical macroeconomic literature seeks to predict crises by
identifying variables that signal a crisis. By applying this methodology to Thailand, it is
found that a few variables “signal” a crisis during 1996. However, this approach is
unable to identify the crisis more than a year in advance. An alternative empirical
methodology uses balance sheet information to examine banking crises in the United
States. However, an examination of the balance sheets of Thai banks generates the
misleading conclusion that these banks were relatively healthy.
Following Merton (1977), a related empirical literature models deposit insurance
as a put option on the value of bank assets. By using the market's valuation of banks, this
approach includes information that is omitted by both the macro and balance sheet
approaches. Papers based on Merton’s insight calculate the fair insurance premiums that
would eliminate the moral hazard associated with the provision of deposit guarantees.
However, few empirical papers that calculate the price of fair deposit insurance to banks
examine the wider implications of the insurance subsidy.
I show that the implicit deposit insurance subsidies to individual banks can
explain much about the origins and incidence of Thailand’s 1997 banking crisis. Using
the fact that equity can be modeled as a call option on the value of the bank, I calculate
these subsidies from an indirect maximum likelihood approach that estimates the
unobserved value of bank assets and their volatility. I find that over 1992-1996 the
average value of deposit insurance for the Thai banking system was 13 percent of total
deposits or 7.5 percent of GDP. Moreover, the Thai banks with the highest values of
deposit insurance were later nationalized by the government or bought by foreign banks
in 1998.

2
Section 2 of this paper discusses the macroeconomic approach to the modeling of
banking crises and applies the empirical methodology to Thailand. Section 3 presents the
microeconomic approach to the modeling of banking crises and reviews the empirical
option-pricing methodology used in this paper. Section 4 discusses Thailand’s financial
system and the events of the 1997 banking crisis. Section 5 presents the results of the
option-pricing model. Section 6 compares these results with actual outcomes and balance
sheet data. Section 7 concludes the study.
2. The Macroeconomic Approach to Banking Crises
The macroeconomic approach to balance-of-payments and banking crises
emphasizes the behavior of the real exchange rate in response to external and internal
shocks. The banking system is a recipient of the crisis through the behavior of the
exchange rate and interest rates. In Krugman’s (1979) speculative attack model, a
government’s monetization of an unsustainable fiscal deficit produces a speculative
attack against the fixed exchange rate regime. Empirically, the lack of sizable fiscal
deficits in the EMU crisis in 1992, Latin America in 1995, and in East Asia in 1997,
suggests this model does not fit most contemporary balance-of-payments crises.
A more recent set of models posits that balance-of-payments crises are a result of
self-fulfilling expectations and are one of multiple equilibria present in the economy.
Calvo and Mendoza (1996) model Mexico’s 1995 crisis in a similar manner to Krugman
(1979). In this model, however, expansion of domestic credit is needed to rescue the
banking system. The authors accept the weakness of the banking system as a result of the
exchange rate policy and capital inflows. In an alternative model, Dornbusch and Werner
(1994) and Dornbusch, Goldfajn, and Valdes (1995) argue that inflation inertia produces
an overvalued real exchange rate, which eventually causes the collapse of the
stabilization program. In this model again, the overvalued exchange rate causes domestic
economic activity to collapse which eventually filters to the banking system. Kamin
(1996) and Kamin and Rogers (1996) give limited empirical support to the notion that
inertial inflation was responsible for Mexico’s 1995 crisis. Instead, they find the real
appreciation of the peso was more likely caused by an increase in domestic demand.
Calvo (1987, 1995), Calvo and Végh (1994), and Rebelo and Végh (1995) develop a
model in which the perceived impermanence of the exchange-rate regime leads to a

3
consumption boom and thus, an appreciation of the real exchange rate. The ultimate
devaluation of the currency further reduces confidence in the economy and undermines
future stabilization programs. Using a Markov switching analysis, Kaminsky and
Leiderman (1998) and Kaplan (1997) find evidence of a lack of credibility in Argentina
and Chile’s stabilization programs, respectively.
Empirical papers examining balance-of-payments and banking crises have
focused on constructing large panel data sets to examine the commonalities among crises.
By examining various macroeconomic variables, these studies hope to separate external,
contagion theories from internal, fundamental theories as causes of the crises. To
identify crises, empirical studies create an index of multiple macroeconomic variables.
Sachs, Tornell, and Velasco (1996) develop an index consisting of the weighted average
of the change in reserves and the devaluation rate with respect to the dollar. Kaminsky
and Reinhart (1996, 1998) use the same index for balance of payments crises and use
bank runs, the closure or merging of banks, or large-scale government assistance to banks
to identify banking crises. Frankel and Rose (1996) identify currency crises as instances
when the nominal exchange rate depreciated by 25 percent and the depreciation rate is at
least 10 percent greater than the past year. In examining a sample of over 20 countries,
Sachs, Tornell, and Velasco find that a high real exchange rate, an increase in bank
lending, and a high ratio of M2 to reserves account for movements in their index. Both
Frankel and Rose and Kaminsky and Reinhart look at over 100 crisis episodes and
examine the effects of variables on their index in a 15-18 month window on either side of
their crisis date. In a probit analysis, Frankel and Rose find currency crashes are more
likely when FDI inflows slow, reserves are low, domestic credit growth is high, when
U.S. interest rates are high, and when the real exchange rate is overvalued. Kaminsky
and Reinhart find a large portion of their financial variables, external variables, and real
variables exhibit deviations from their levels in “tranquil” times when their index
indicates a crisis.1 Kaminsky and Reinhart and Sachs, Tornell, and Velasco conclude that
“fundamentals” were likely to have played a role in balance-of-payments and banking
crises.
1 Financial variables include the M2 multiplier, the ratio of domestic credit to nominal GDP, real depositinterest rates, the ratio of lending to deposit interest rates, the ratio of M2 to reserves. External variablesinclude export growth, import growth, the terms of trade, the real exchange rate, and reserves. Outputgrowth and changes in equity prices measure the real sector.
4
One problem facing these analyses is that they use variables, which although
empirically relevant, have no strong underlying theoretical basis. Moreover, the ability
of these studies to predict crises is weak. Kaminsky and Reinhart find that the M2
multiplier, excess real M1 balances, and exports are statistically different from their
levels in tranquil times up to 18 months prior to the crisis. They do not report the number
of banking crises that would be predicted by these three indicators. Frankel and Rose use
their probit analysis to predict currency crashes one year in advance; they find they were
able to correctly predict crises in 5 out of 69 episodes. Part of this difficulty stems from
the implied assumption that crises develop over a short horizon, and not multiple years.
2.1 Empirical Application of Macroeconomic Approach to Thailand
In this section, I apply the methodology of Kaminsky and Reinhart (1996) to
Thailand and the results are qualitatively the same as theirs. Namely, most variables
during the crisis show a significant deviation from their pre-crisis levels, a few variables
show a deviation from their pre-crisis levels in the year preceding the crisis, and no
variables show a deviation from their pre-crisis levels more than a year preceding the
crisis.
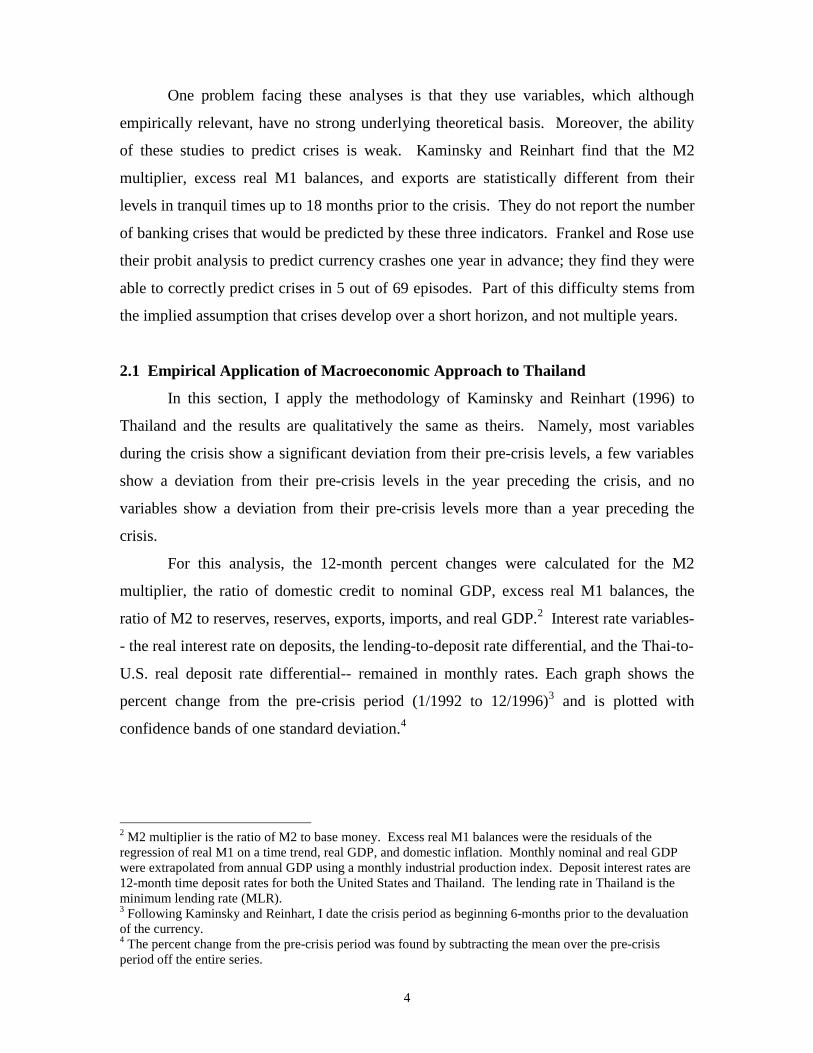
For this analysis, the 12-month percent changes were calculated for the M2
multiplier, the ratio of domestic credit to nominal GDP, excess real M1 balances, the
ratio of M2 to reserves, reserves, exports, imports, and real GDP.2 Interest rate variables-
- the real interest rate on deposits, the lending-to-deposit rate differential, and the Thai-to-
U.S. real deposit rate differential-- remained in monthly rates. Each graph shows the
percent change from the pre-crisis period (1/1992 to 12/1996)3 and is plotted with
confidence bands of one standard deviation.4
2 M2 multiplier is the ratio of M2 to base money. Excess real M1 balances were the residuals of theregression of real M1 on a time trend, real GDP, and domestic inflation. Monthly nominal and real GDPwere extrapolated from annual GDP using a monthly industrial production index. Deposit interest rates are12-month time deposit rates for both the United States and Thailand. The lending rate in Thailand is theminimum lending rate (MLR).3 Following Kaminsky and Reinhart, I date the crisis period as beginning 6-months prior to the devaluationof the currency.4 The percent change from the pre-crisis period was found by subtracting the mean over the pre-crisisperiod off the entire series.

5
Examining Graphs 1 through 12 shows that 10 variables indicate that the crisis
period was statistically different from the pre-crisis period. Moreover, it might be
claimed that certain variables “signal” a crisis before January 1997. 5 However, these
variables may simply indicate that the crisis began in the summer of 1996 rather than
January 1997. Indeed, the crisis can be dated as beginning in May 1996 with the collapse
of Bangkok Bank of Commerce.
5 These variables are: M2 to reserves beginning in April 1996, reserves beginning in July 1996, the lending-to-deposit rate differential beginning in March 1996, deposits beginning in August 1996, exports beginningin May 1996, and imports beginning in September 1996.

6
Graph 1
-20
-10
0
10
20
92 93 94 95 96 97
M2 Multiplier
Pe
rce
nt
Year
Graph 4
-50
0
50
100
150
200
250
1992 1993 1994 1995 1996 1997
M2 / Reserves
Per
cent
Year
Graph 2
-30
-20
-10
0
10
20
30
92 93 94 95 96 97
Domestic Credit to Real GDP
Pe
rce
nt
Year
Graph 5
-60
-40
-20
0
20
92 93 94 95 96 97
Reserves
Pe
rce
nt
Year
Graph 3
-60
-40
-20
0
20
40
60
92 93 94 95 96 97
Excess Real M1 Balances
Pe
rce
nt
Year
Graph 6
-15
-10
-5
0
5
10
15
1992 1993 1994 1995 1996 1997
Real GDP
Per
cent
Year

7
Graph 7
-6
-4
-2
0
2
4
1993 1994 1995 1996 1997
Real Interest Rate on Deposits
Per
cent
Year
Graph 10
-15
-10
-5
0
5
10
15
20
1992 1993 1994 1995 1996 1997
Deposits
Per
cent
Year
Graph 8
-2
-1
0
1
2
1993 1994 1995 1996 1997
Lending - Deposit Interest Rate Differential
Per
cent
Year
Graph 11
-40
-20
0
20
40
60
80
100
1992 1993 1994 1995 1996 1997
ExportsP
erce
nt
Year
Graph 9
-6
-4
-2
0
2
4
6
8
1993 1994 1995 1996 1997
Thai - U.S. Real Interest Rate on Deposits Differential
Pe
rce
nt
Year
Graph 12
-60
-40
-20
0
20
40
60
1992 1993 1994 1995 1996 1997
Imports
Per
cent
Year

9
3. The Microeconomic Approach to Banking Crises
The microeconomic approach to banking crises has emphasized the institutions
and incentives present in the banking system and, in particular, the role of deposit
guarantees. White (1991) presents the causes of the savings and loan crisis using banks’
balance sheets and anecdotal evidence. He shows that certain thrifts responded to
deregulation by increasing the size of their insurance subsidy. For over six years, the
S&Ls exploited the government guarantee through rapid growth of their insured
liabilities and more high-risk lending behavior. These themes reappear in Gunther and
Robinson’s (1990) and Horvitz’s (1992) studies on Texan thrift failures, Calomiris (1989,
1992) and Calomiris and Mason’s (1997) studies of bank failures in the United States
during the 1920s and 1930s, and Brock’s (1996) examination of the 1982-83 Chilean
banking crisis. Theoretical work has concentrated on designing optimal deposit
guarantee systems in the presence of moral hazard and adverse selection (Dewatripont
and Tirole 1994). Indeed, it is debated whether or not fairly priced deposit insurance is
even possible (Chan, Greenbaum, and Thakor 1992, Freixas and Rochet 1997).
Merton (1977) first showed that deposit insurance can be modeled as a put option
on the value of bank assets. Empirical papers beginning with Marcus and Shaked (1984)
and Ronn and Verma (1986) have focused on calculating actuarially fair deposit
insurance premiums for U.S. commercial banks. This focus stems from the hypothesis
that the moral hazard incentives produced by insurance could be eliminated if banks paid
actuarially fair premiums. Other papers have extended this analysis to different
institutions. Cordell and Gordon (1990) estimate the price of deposit guarantees for U.S.
savings and loans and show that the insurance value indicated at an earlier date those
banks that failed than traditional GAAP measures. Giammarino, Schwartz and Zechner
(1989) calculate deposit insurance premiums for Canadian banks and found that there
was cross-subsidization across banks. Fries, Mason and Perraudin (1993) and Sato,
Ramachandran and Kang (1990) estimate the value of deposit insurance to Japanese
banks. Numerous extensions to the option-pricing model have been proposed to include
forbearance (Nagarajan and Sealey 1995 and Allen and Saunders 1993), audit costs and
liquidation costs (Mullins and Pyle 1994), endogenous closure rules (Fries, Mella-Barral

10
and Perraudin 1997), and charter value (Acharya 1996). However, these extensions
cannot be used empirically.
In this paper, I will use the option-pricing approach to calculate the value of the
insurance subsidy to banks in Thailand. With the exception of Duan and Yu’s (1994)
treatment of Taiwan, no papers have applied the option approach to an emerging market.
Instead of concentrating on calculating actuarially fair premiums as in much of the
literature, I expand the option-pricing methodology to uncover the extent to which Thai
banks benefited from the deposit insurance subsidy. Moreover, I show the provision of
implicit deposit insurance in Thailand generated incentives for banks to grow and take on
risk that made Thailand’s 1997-98 banking crisis almost inevitable.
3.1 The Option-Pricing Model of Deposit Insurance
The option-pricing model of deposit insurance stems from Merton (1977). This
approach models a bank’s shareholders as holding a one-year European-style put option
on the value of the bank’s assets. Given a firm that issues a single, homogenous debt that
will mature to $B, the firm will be solvent if the value of its assets, V, are larger than the
value of its total debt. If the value of the firm is less than the value of its debt, then the
firm is insolvent and the insurer assumes the claims to the debt holder. To apply this
model to a bank, several assumptions are made. First, it is assumed that the bank’s debts
are equal to its deposits and that all deposits including their interest are insured.
Therefore, insured deposits are riskless and their book value, D, equals Be-rT. Second, it
is assumed that the time, T, until the maturity of the deposits is equal to the time until the
next annual audit of the bank. Finally, assuming the bank’s asset values follow geometric
Brownian motion:
tt dWdtVd �� ��ln , )1(
where:
V = the value of assets,
� = the instantaneous expected return on assets,
� = the instantaneous standard deviation of asset returns,
Wt = a standard Wiener process,
11
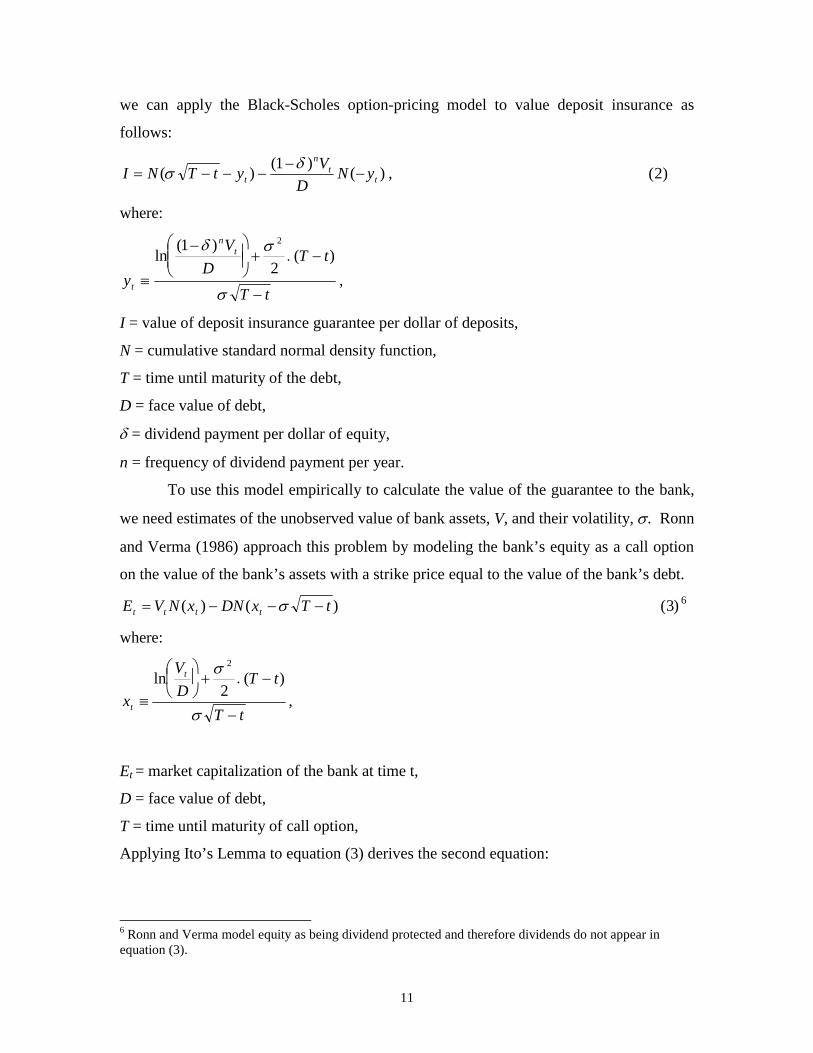
we can apply the Black-Scholes option-pricing model to value deposit insurance as
follows:
)()1(
)( tt
n
t yND
VytTNI �
�����
�� , )2(
where:
tT
tTD
V
y
tn
t�
������
���
�
��
��)(
2
)1(ln
2
,
I = value of deposit insurance guarantee per dollar of deposits,
N = cumulative standard normal density function,
T = time until maturity of the debt,
D = face value of debt,
� = dividend payment per dollar of equity,
n = frequency of dividend payment per year.
To use this model empirically to calculate the value of the guarantee to the bank,
we need estimates of the unobserved value of bank assets, V, and their volatility, �. Ronn
and Verma (1986) approach this problem by modeling the bank’s equity as a call option
on the value of the bank’s assets with a strike price equal to the value of the bank’s debt.
)()( tTxDNxNVE tttt ���� � )3( 6
where:
tT
tTD
V
x
t
t�
�����
��
��
�)(
2ln
2
,
Et = market capitalization of the bank at time t,
D = face value of debt,
T = time until maturity of call option,
Applying Ito’s Lemma to equation (3) derives the second equation:
6 Ronn and Verma model equity as being dividend protected and therefore dividends do not appear inequation (3).

12
)( tt
tE
xNV
E�� � , )4(
where,
�E = standard deviation of equity returns.
Using data on total debt, bank equity, and equity volatility, equations (3) and (4)
can be solved simultaneously for V and �. Given these values, equation (2) is used to
solve for the insurance premium per dollar of deposits. In order for this approach to be
valid, the time until maturity, T, of the put and call options must be the same. Ronn and
Verma use Merton’s assumption that the time until maturity of the debt is equal to the
time until the next audit. They interpret the strike price of the put option to be equal to
the total debt of the bank (total domestic deposits plus total borrowings) instead of just
total deposits. This assumes that all of the debts of the bank are insured and that they are
issued at the risk-free rate of interest.7
In this paper, I retain the basic structure of Ronn and Verma (1986), but utilize a
maximum likelihood framework based on Duan (1994).8 Equation (4) was derived by
applying Ito’s lemma to the call-option formula (equation (3)); therefore, equation (4)
cannot be used as a separate restriction from equation (3) in solving for V and �.
Duan (1994) shows that writing the log-likelihood function for the unobserved
asset values, Vt, in terms of the observed equity values will avoid these problems. Since
the unobserved values of the bank’s assets follows a continuous time lognormal process,
the log-likelihood function for V can be expressed as:
�� �
�
���
����
�
���
�
���
n
t t
ttt V
VnVL
2
2
12
2 ln2
1)2ln(
2
1),;( �
����� t=1,…,n (5)
Since the call-option formula (equation (3)) is an element-by-element transformation
from unobserved asset values to observed equity values, we can write the sample
log-likelihood function for equity as:
7 Ronn and Verma show that compounding the non-deposit debt of the bank by the rate paid anddiscounting it by the risk-free interest rate makes little empirical difference in the value of depositinsurance.8 Fries, Mason, and Perraudin (1993) use a similar technique to value deposit insurance for Japanesefinancial institutions.

13
� �� � �
�
�
���
����
���
n
t
n
t t
ttt
V
VxN
nEL
2 2
2
12
^2 )
)(ˆ)(ˆ
ln(2
1))(ln()2ln(
2
1),;( �
�
�
����� t=1,…,n (6) 9
where )(ˆ �tV is the unique solution to equation (3) for any �, and tx^
is xt evaluated with
)(ˆ �tV instead of Vt. Given starting values for � and � and data on equity values (Et) and
debt (D), equation (3) can be solved to yield a series of bank asset values (Vt). Equation
(6) is then used to solve for �̂ and �̂ . This process is iterated to find the maximum
likelihood estimates of �̂ and �̂ and their standard errors. Using the put option formula
for deposit insurance (equation (2)), one can then solve for the value of the guarantee per
dollar of deposits and its standard error.
4. Overview of the Thai Financial System and Current Banking Crisis
The Thai financial system consists of domestic commercial banks, foreign
commercial banks, finance companies, securities firms, credit fonciers, government
development banks, and insurance companies. Due to data limitations, I calculate the
value of the insurance subsidy solely for Thai commercial banks. From Figures A1 and
A2 in Appendix A it is apparent that commercial banks are the dominant providers of
credit and holders of deposits in the Thai economy. In 1997 commercial banks in
Thailand furnished 92% of the credit in the economy and held 83% of domestic
deposits.10 Foreign banks are limited to three branches and mostly provide trade finance
to multinational firms. Therefore, concentrating on the domestic commercial banking
system should not distort our perceptions of Thailand’s financial system.
Thailand experienced a banking crisis in the mid-1980s. In 1984 Asia Trust Bank
was taken over by the government and subsequently renamed Sayam Bank. Following
this event, in 1985, new banking legislation was approved that allowed the Bank of
9 Duan derives equation (6) showing that the likelihood function of observed equity values is equal to thelikelihood function of unobserved asset values (evaluated at the optimal sigma) minus the sum of thelogarithm of the first derivative of the observed equity values with respect to the unobserved asset values,
or � ��� ���
�
���
� �
��
T
tt
xNT
t V
E
2)ˆ(ln
2ln .
10 Prior to 1997 before the majority of finance companies were closed, commercial banks providedsomewhat less credit and held fewer deposits than indicated by Figures A1 and A2.

14
Thailand either to seize or to freeze assets and to replace bank management. The
legislation also created a Fund for the Rehabilitation and Development of the Financial
Institution System. Banks were required to provide annual contributions of 0.1% of their
total deposits. Empowered with these new tools, the Bank of Thailand assumed control
of First Bangkok City Bank and Siam City Bank. The Rehabilitation and Development
Fund assumed the bad debts of these banks, recapitalized the banks, and issued new
shares, which it sold to the private sector. Additionally, the Bank of Thailand closed 50
finance companies. According to Caprio and Klingebiel (1996), the three insolvent banks
comprised 14.1% of the assets of the commercial banking system and the cost to the
government from providing assistance to the finance companies totaled 0.5% of GNP.
The banking crisis in the mid-1980s was important because it established a precedent, as
well as the Fund, to undertake future bailouts.
Table 1 lists the 16 domestic commercial banks in Thailand as of 1998 and ranks
the banks according to their size in 1997. Our sample consists of 15 of these banks from
1992 to 1997. The central bank formed the 16th bank, Radansim Bank, in 1998 with the
assets of closed finance companies. Appendix B presents a chronology of the financial
events in Thailand since 1992. The following section details the important incidents in
Thailand’s banking crisis.
The Bank of Thailand’s provision of deposit insurance, coupled with poor
regulation and supervision of the banking system, generated incentives for banks to
exploit the government guarantee. One way for banks to increase the size of their
insurance subsidy was to grow quickly. Table 1 lists the average rate of growth over
1992 to 1997. These growth rates are substantially higher than the growth rate of
nominal GDP, which averaged 11% over this period. Furthermore, the most rapid
growth, when compared to the growth of nominal GDP, took place in 1997. Until 1997,
secured loans were not classified as nonperforming until no payments were made for over
one year. Banks, therefore, could make unsound loans to increase the value of the
government guarantee and there would be a lag before these actions became apparent to
regulators.

15
Table 1 : Thai Domestic Commercial Banks
Bank Name Bank Assets, 1997(Baht billions)
Growth in Bank Assets(percent per year 1992-97)
Bangkok Bank 1,416.0 16.3%Thai Farmers Bank 795.4 16.9%Krung Thai Bank 791.1 16.9%Siam Commercial Bank 717.2 21.4%Bank of Ayudhya 493.8 23.2%Thai Military Bank 388.5 20.4%First Bangkok City Bank 287.6 17.8%Siam City Bank 264.2 21.4%Bangkok Metropolitan Bank 190.3 16.4%Bangkok Bank of Asia 158.3 23.0%Bangkok Bank of Commerce 148.0 22.0%*The Thai Danu Bank 130.3 25.8%Union Bank of Bangkok 77.6 16.4%Nakornthon Bank 73.8 20.4%Laem Thong Bank 51.1 29.2%Radansim Bank Not in existence until 1998
Total 5,983.2 (120% of GDP)* Bangkok Bank of Commerce data excludes 1996 and 1997. Source: Datastream.
The proximate cause of the current banking crisis in Thailand was traced to the
collapse of Bangkok Bank of Commerce (BBC). Despite evidence of fraudulent
behavior by top management, the Bank of Thailand waited until BBC experienced bank
runs in May 1996 to take action. At that time, the Bank of Thailand injected Bt 13 billion
into BBC; this action reaffirmed the central bank’s guarantee of the banking system.
Throughout 1996, confidence in the Thai financial system eroded as details of BBC’s ties
to politicians and the central bank surfaced. In July 1996, the Central Bank Governor
resigned and the Finance Ministry began an investigation into the treatment of BBC.
In conjunction with lax supervision of the banking system, the central bank’s
interest rate policy contributed to the crisis. The Bank of Thailand pursued a tight
monetary policy designed to contain inflation, maintain the peg of the baht to the dollar,
attract capital inflows, and spur the development of Thailand’s offshore banking center.
Interest rates in Thailand rose to as much as 6 percent above comparable rates in the
United States. Commercial banks and finance companies concentrated on borrowing
overseas and re-lending in Thailand. As a result, the Thai financial system was heavily
dependent on the exchange rate regime and the private sector had a large external debt

16
burden.11 In July 1997, the central bank abandoned the exchange rate peg. By the end of
July the Bank of Thailand had suspended 58 finance companies. The assets of these
companies represented one-fifth of the total assets of Thai finance companies.
In October 1997 the government made a formal statement guaranteeing the
deposits of the 15 commercial banks and the remaining 33 finance companies. The
financial health of commercial banks continued to worsen throughout 1997 and 1998. In
1997, only seven of Thailand’s commercial banks reported profits for the year and these
profits were substantially less than in 1996. Table 2 reports the pretax profits of these
seven “marginal” banks. Table 3 presents the losses of Thailand’s other eight “bad”
banks. Under the IMF program Thailand maintained high interest rates to shore-up
confidence in the Baht. However, these high interest rates contributed to the collapse of
economic activity in Thailand.12 Non-performing loans and provisions have increased
dramatically because borrowers cannot repay their loans and because standards are being
tightened.13 Moreover, the central bank has increased the level of provisions that banks
have to provide against nonperforming loans. (See Appendix B) Tables 2 and 3 list the
provisions made by banks in 1997 and their percent change over 1996.14
Table 2: Marginal Banks, Selected Results in 1997
(Millions of Baht)Bank Profit Profit /Assets Change from 1996 Provisions Change from 1996
(pre-tax) (percent) (percent) (percent)Bangkok Bank 8,664 0.61% -72% 28,414 396%Bank of Ayudhya 2,727 0.55% -62% 7,085 474%Krung Thai Bank 338 0.04% -98% 18,973 503%Siam Commercial Bank 5,232 0.73% -57% 11,597 932%The Thai Danu Bank 63 0.05% -96% 2,236 375%Thai Farmers Bank 1,030 0.13% -94% 16,810 620%Thai Military Bank 1,962 0.50% -43% 3,505 776%Source: Datastream.
11 Following the devaluation in 7/1997, the debt-to-equity ratio of the private sector jumped from 100% to250%. EIU Country Report 3rd Quarter 1998.12 Real GDP is predicted to contract by 8% in 1998. EIU Country Report 2nd Quarter 1998.13 In October 1997, nonperforming loans were redefined as loans 6-months past due, and again in April1998, as loans 3-months past due.14 Data on nonperforming loans is not available.

17
Table 3: Bad Banks, Selected Results in 1997
(Millions of Baht)
Bank Profit Profit / Assets Change from 1996 Provisions Change from 1996(pre-tax) (percent) (percent) (percent)
Bank of Asia -374 -0.24% -115% 1,675 264%First Bangkok City Bank -31,476 -10.94% -605% 38,594 4724%Laem Thong Bank -891 -1.74% -397% 107 49%Nakornthon Bank -170 -0.23% -118% 1,053 792%Siam City Bank -13,809 -5.23% -390% 17,664 1907%Union Bank of Bangkok -3,431 -4.42% -1354% 2,958 4138%Bangkok Bk. of Commerce -15,644 -10.57% -37% N. A. N. A.Bangkok Metropolitan Bk. -23,590 -12.40% -1824% N. A. N. A.Source: Datastream.
In August 1998 the Thai legislature approved new legislation to speed the
resolution of the banking crisis. The central bank can now force finance companies and
commercial banks to merge and can issue bonds to recapitalize banks. As of November
1998 the Bank of Thailand has assumed control of 6 commercial banks and 63 finance
companies. The closed commercial banks include: Bangkok Bank of Commerce,
Bangkok Metropolitan Bank, Siam City Bank, First Bangkok City Bank, Laem Thong
Bank, and Union Bank of Bangkok. Foreign-owned banks bought Bank of Asia and the
Thai Danu Bank. Krung Thai Bank has already sought assistance from the FIDF to
recapitalize, while Bank of Ayudhya, Siam Commercial Bank, and Thai Military Bank
are likely to seek assistance. Only Bangkok Bank and Thai Farmers Bank have raised
new capital by issuing shares to foreign entities. (See Appendix C for more details.)
The costs thus far of Thailand’s banking crisis are staggering. As of April 1998
the Financial Institutions Development Fund (FIDF) had Bt 1.1 trillion in debt
outstanding. This amounts to over one-fifth of expected Thai GDP for 1998. In
September 1998, the Bank of Thailand announced that problem loans of the entire
financial system totaled Bt 1.72 trillion.
5. Estimating the Value of Deposit Insurance for Thai Banks
The data used in this paper includes market capitalization, total deposits, total
liabilities, dividends per baht, and dividend frequency for 15 Thai banks from 1992

18
through end-1996.15 The data comes from Datastream.16 Daily data was available for
market capitalization values, but total deposits and total liabilities were only available
annually. For equation (2), equation (3), and equation (6), I used a series of daily market
capitalization values for equity, end-of-year total deposits or total liabilities for D,
dividends per baht for ���and dividend frequency for n. Thus for each year and each
bank, I estimated the option value of deposit insurance using the December value of
deposits or liabilities, and daily, January through December values of market
capitalization for the bank. I retain the assumption that the put option expires in
December of the following year. The sample included all days the stock market was
open for trading.17
I constructed a constrained maximum likelihood estimation procedure that used as
inputs starting values for ��and ���and data on market capitalization, dividends, and debt
for one bank for one year.18 In the maximum likelihood estimation, � was constrained to
be positive because the put and call option formulas (equations (2) and (3)) are sensitive
to small values of �.19 The procedure then generated a daily series of implied asset
values using the call pricing formula (equation (3)). The implied asset values were used
to construct the likelihood function (equation (7)). Maximizing the likelihood function
produced estimates of the expected return on bank assets,�̂ ,�and their standard
deviation,�̂ ���The program iterated until optimal estimates of �̂ �and �̂ were found. The
maximum likelihood estimates were used in the call option formula (equation (3)) to
construct the end-year asset value, )(ˆ �V . Using the estimates )(ˆ �V and �̂ , the program
15 While data was available for 1997, I do not calculate the 1997 value of deposit insurance. This isbecause the 1997 put option expires at end-1998, and by this time all of the banks had already sold theirclaims to the insurer. Moreover, the standard deviation of asset returns is assumed to be constant over theyear in which the option is priced. This assumption is likely to be violated in 1997 when there was a sharpfall in asset prices.16 Market capitalization values are listed as datatype MV. Total deposits are total interest and non-interestbearing deposits (code 847) and equal the sum of fixed term deposits (844), deposits on demand (954),savings accounts (959), and other customer accounts (963). Total liabilities (code 2401) equals total shortand long-term liabilities. Dividends per baht are equal to dividends per share (code 190) divided by shareprice. Dividend frequency is reported as datatype DT.17 The number of days was 254 in 1992, 253 in 1993, 252 in 1994, 252 in 1995, and 254 in 1996.18 The estimation code was written in Gauss and utilized the optimization library, Optmum, and theconstrained maximum likelihood library, CML. The estimation code is available upon request.19 In most cases, the constraint that � is positive is not binding. In the few cases that the constraint wasbinding, standard errors of the estimates could not be calculated because the standard error of �̂ wasundefined.
19
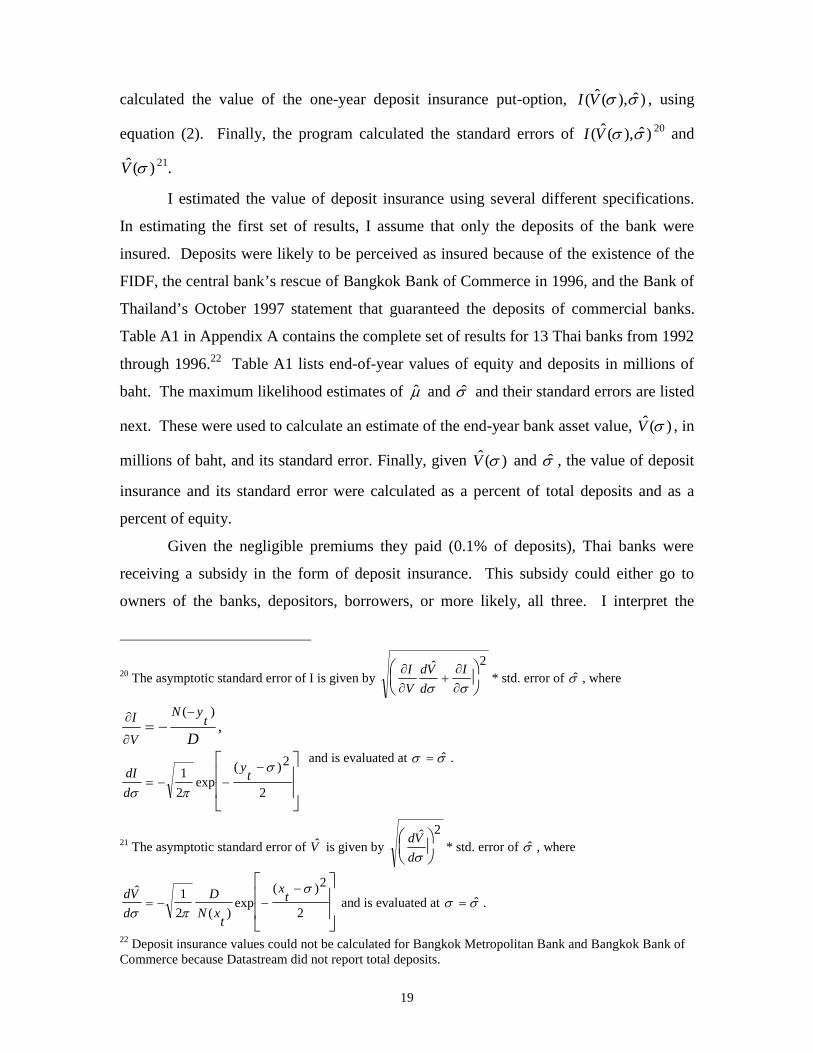
calculated the value of the one-year deposit insurance put-option, )ˆ),(ˆ( ��VI , using
equation (2). Finally, the program calculated the standard errors of )ˆ),(ˆ( ��VI 20 and
)(ˆ �V 21.
I estimated the value of deposit insurance using several different specifications.
In estimating the first set of results, I assume that only the deposits of the bank were
insured. Deposits were likely to be perceived as insured because of the existence of the
FIDF, the central bank’s rescue of Bangkok Bank of Commerce in 1996, and the Bank of
Thailand’s October 1997 statement that guaranteed the deposits of commercial banks.
Table A1 in Appendix A contains the complete set of results for 13 Thai banks from 1992
through 1996.22 Table A1 lists end-of-year values of equity and deposits in millions of
baht. The maximum likelihood estimates of �̂ and �̂ and their standard errors are listed
next. These were used to calculate an estimate of the end-year bank asset value, )(ˆ �V , in
millions of baht, and its standard error. Finally, given )(ˆ �V and �̂ , the value of deposit
insurance and its standard error were calculated as a percent of total deposits and as a
percent of equity.
Given the negligible premiums they paid (0.1% of deposits), Thai banks were
receiving a subsidy in the form of deposit insurance. This subsidy could either go to
owners of the banks, depositors, borrowers, or more likely, all three. I interpret the
20 The asymptotic standard error of I is given by 2ˆ
���
�
�
��
�
�
��
I
d
Vd
V
I* std. error of �̂ , where
�
�
��
�
�
��
����
�
�
�
2
2)(exp
2
1
)(,
�
��
ty
d
dI
tyN
V
I
D and is evaluated at �� ˆ� .
21 The asymptotic standard error of V̂ is given by 2ˆ
���
�
�d
Vd* std. error of �̂ , where
�
�
��
�
� ����
2
2)(exp
)(2
1ˆ �
��
tx
txN
D
d
Vd and is evaluated at �� ˆ� .
22 Deposit insurance values could not be calculated for Bangkok Metropolitan Bank and Bangkok Bank ofCommerce because Datastream did not report total deposits.

20
results in two different ways in order to illustrate the size of the subsidy. In the first case,
if bank owners captured the entire subsidy, the estimate of deposit insurance expressed as
a percent of equity (Table 4) would measure the portion of the stock market value of the
bank attributable to insurance. In other words, in the presence of deposit insurance,
banks are able to offer depositors a lower, riskless deposit rate. As a result, banks could
achieve higher spreads than if banks had to compensate depositors for some default risk.
Table 4: Estimates of Deposit Insurance as a percent of Equity
BANK 1992 1993 1994 1995 1996Bangkok Bank 57.59 25.94 49.07 19.90 39.08(BBL) (6.52) (3.24) (2.60) (2.41) (5.09)Bank of Asia 88.97 35.86 58.69 75.13 91.31(BOA) (9.27) (3.58) (3.81) (3.68) (8.07)Bank of Ayudhya 73.71 52.43 52.53 41.79 198.86(BAY) (7.15) (3.14) (6.22) 0.00 (10.58)First Bangkok 108.18 60.93 62.18 72.42 157.84City Bank (FBC) (6.72) (4.56) (3.83) (4.72) (17.41)Krung Thai Bank 77.26 35.58 44.48 27.19 199.62(KTB) (3.63) (4.06) (3.78) (7.32)Laem Thong 222.73 51.48 91.62 114.14 103.08Bank (LTB) (14.74) (5.63) (7.50) (8.17) (7.55)Nakornthon 72.30 59.88 76.17 55.57 80.03Bank (NTB) (16.40) (14.62) (3.65) (4.53) (5.89)Siam City Bank 76.21 37.92 35.58 41.86 196.49(SCB) (4.87) (3.64) (2.64) (3.92) (11.90)Siam Commercial 73.12 39.39 52.47 29.51 98.59Bank (SBB) (7.03) (4.41) (3.30) (3.34) (5.22)The Thai Danu 51.71 51.03 45.30 77.69 130.57Bank (TDB) (4.07) (3.68) (8.00) (8.00)Thai Farmers 52.73 40.53 30.33 15.54 56.71Bank (TFB) (6.00) (4.33) (2.00) (2.13) (6.54)Thai Military 115.23 46.77 63.15 50.48 76.25Bank (TMB) (11.77) (3.93) (4.20) (4.68) (4.54)Union Bank of 215.52 63.19 90.59 58.23 119.60Bangkok (UBB) (11.79) (5.29) (6.72) (7.28) (9.25)
Average 72.94 37.75 47.21 30.83 94.34Estimates of deposit insurance as a percent of equity correspond to results in Table A1, Appendix A.Model was estimated with total deposits. Standard errors of estimates in parentheses. When nostandard error is listed, the constraint that � is greater than zero is binding.
Another way to judge the magnitude of the insurance subsidy is to express the
estimate of deposit insurance as a percent of deposits (Table 5). In this case, depositors
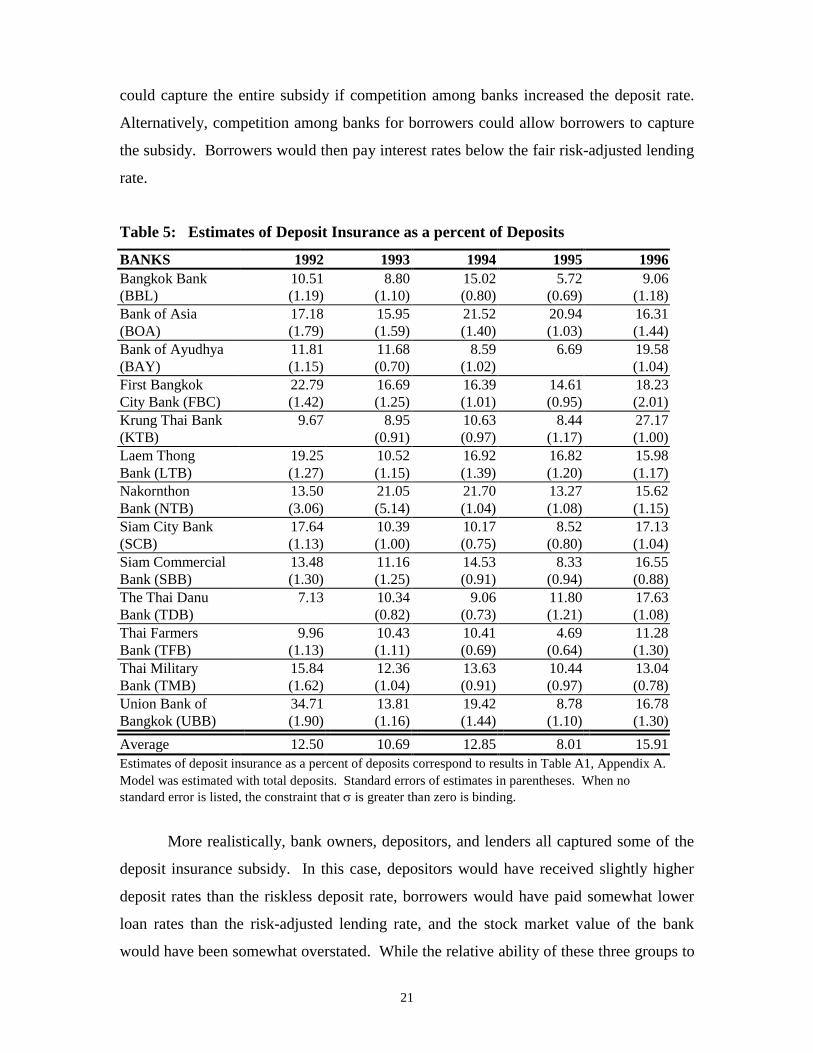
21
could capture the entire subsidy if competition among banks increased the deposit rate.
Alternatively, competition among banks for borrowers could allow borrowers to capture
the subsidy. Borrowers would then pay interest rates below the fair risk-adjusted lending
rate.
Table 5: Estimates of Deposit Insurance as a percent of Deposits
BANKS 1992 1993 1994 1995 1996Bangkok Bank 10.51 8.80 15.02 5.72 9.06(BBL) (1.19) (1.10) (0.80) (0.69) (1.18)Bank of Asia 17.18 15.95 21.52 20.94 16.31(BOA) (1.79) (1.59) (1.40) (1.03) (1.44)Bank of Ayudhya 11.81 11.68 8.59 6.69 19.58(BAY) (1.15) (0.70) (1.02) (1.04)First Bangkok 22.79 16.69 16.39 14.61 18.23City Bank (FBC) (1.42) (1.25) (1.01) (0.95) (2.01)Krung Thai Bank 9.67 8.95 10.63 8.44 27.17(KTB) (0.91) (0.97) (1.17) (1.00)Laem Thong 19.25 10.52 16.92 16.82 15.98Bank (LTB) (1.27) (1.15) (1.39) (1.20) (1.17)Nakornthon 13.50 21.05 21.70 13.27 15.62Bank (NTB) (3.06) (5.14) (1.04) (1.08) (1.15)Siam City Bank 17.64 10.39 10.17 8.52 17.13(SCB) (1.13) (1.00) (0.75) (0.80) (1.04)Siam Commercial 13.48 11.16 14.53 8.33 16.55Bank (SBB) (1.30) (1.25) (0.91) (0.94) (0.88)The Thai Danu 7.13 10.34 9.06 11.80 17.63Bank (TDB) (0.82) (0.73) (1.21) (1.08)Thai Farmers 9.96 10.43 10.41 4.69 11.28Bank (TFB) (1.13) (1.11) (0.69) (0.64) (1.30)Thai Military 15.84 12.36 13.63 10.44 13.04Bank (TMB) (1.62) (1.04) (0.91) (0.97) (0.78)Union Bank of 34.71 13.81 19.42 8.78 16.78Bangkok (UBB) (1.90) (1.16) (1.44) (1.10) (1.30)
Average 12.50 10.69 12.85 8.01 15.91Estimates of deposit insurance as a percent of deposits correspond to results in Table A1, Appendix A.Model was estimated with total deposits. Standard errors of estimates in parentheses. When nostandard error is listed, the constraint that � is greater than zero is binding.
More realistically, bank owners, depositors, and lenders all captured some of the
deposit insurance subsidy. In this case, depositors would have received slightly higher
deposit rates than the riskless deposit rate, borrowers would have paid somewhat lower
loan rates than the risk-adjusted lending rate, and the stock market value of the bank
would have been somewhat overstated. While the relative ability of these three groups to

22
capture the insurance subsidy is unknown, Tables 4 and 5 indicate that the size of this
subsidy was large. As a comparison, studies using the same maximum likelihood
technique found that the highest value of deposit insurance was 2.5% of liabilities for a
Taiwanese bank (Duan and Yu 1994), 2.4% for a Japanese bank (Fries, Mason, and
Perraudin 1993), and 0.5% for a U.S. bank (Duan 1994).
From 1992 to 1996, the average value of deposit insurance for the Thai
commercial banking system totaled nearly Bt 330 billion, 13 percent of deposits, or 53
percent of equity. The large subsidy values in 1992 most likely reflect the political crisis
that occurred when the military initiated a violent crackdown on protestors.23 After
falling slightly from 1992, the estimates of deposit insurance increased in 1996. The
larger subsidy to banks in 1996 reflects the erosion in bank assets. Moreover, following
the Bank of Thailand’s injection of funds into Bangkok Bank of Commerce, if banks
revised upward their belief that they would be bailed out by the central bank, this would
also make deposit insurance more valuable.
The next set of results employ total liabilities instead of total deposits as the strike
price of the deposit insurance put option. The assumption that the total liabilities of the
Thai banking system were insured is not unrealistic. The central bank’s pledge to keep
the baht pegged to the dollar was in effect a guarantee that banks would be able to repay
their foreign currency loans.
Data on total liabilities is available for all 15 of Thailand's banks. The results of
the maximum likelihood estimation using total liabilities are located in Appendix A,
Table A2. Table 6 and Table 7 below list the estimates of deposit insurance as a percent
of equity and deposits, respectively, when total liabilities are used. The value of the
insurance subsidy was not calculated for Bangkok Bank of Commerce in 1996 because
the bank was already receiving support from the Bank of Thailand. The high values of
the insurance subsidy as a percent of equity for Bangkok Bank of Commerce in 1993-95
illustrate the ability of this approach to identify weak banks. Table A2 reports the value
of deposit insurance as a percent of total liabilities as a comparison to Table 7.
23 Thai Military Bank was particularly hard hit by the military crackdown as depositors voiced theiropposition by withdrawing funds. Thai Military Bank was sufficiently concerned that they consideredchanging their name. (EIU Country Report 2nd Quarter 1992). This fact is evident in the estimate of theinsurance subsidy for TMB in 1992.

23
Table 6: Estimates of Deposit Insurance as a percent of Equity
BANKS 1992 1993 1994 1995 1996Bangkok Bank 64.57 28.20 54.76 22.00 43.47(BBL) (5.20) (2.84) (4.56) (2.40) (3.99)Bank of Asia 98.14 39.86 67.86 83.14 105.69(BOA) (7.34) (3.61) (5.34) (6.13) (7.57)Bank of Ayudhya 77.52 55.31 56.83 44.29 210.17(BAY) (5.63) (4.48) (13.22)First Bangkok 116.69 65.37 66.98 79.31 172.29City Bank (FBC) (7.91) (5.12) 7.91 (5.90) (10.83)Krung Thai Bank 61.19 36.75 46.68 29.42 212.89(KTB) (3.47) (4.18) (2.93) (12.76)Laem Thong 227.89 53.28 97.76 121.56 110.54Bank (LTB) (14.97) (4.83) (7.46) (8.93) (8.29)Nakornthon 106.24 52.47 95.20 63.30 99.00Bank (NTB) (6.98) (4.38) (6.64) (5.12) (7.17)Siam City Bank 81.87 40.31 38.02 45.28 215.51(SCB) (6.32) (3.80) (3.64) (4.23) (14.34)Siam Commercial 63.67 53.60 57.25 32.43 109.08Bank (SBB) (4.07) (4.75) (3.14) (7.98)The Thai Danu 67.74 55.01 51.71 92.99 146.58Bank (TDB) (4.73) (4.53) (10.03)Thai Farmers 57.63 42.87 32.17 16.65 60.05Bank (TFB) (4.55) (3.83) (3.08) (1.95) (5.01)Thai Military 127.074 50.12 68.30 55.73 115.88Bank (TMB) (4.24) (5.46) (4.68) (7.63)Union Bank of 236.27 66.63 98.16 62.22 127.25Bangkok (UBB) (13.48) (5.64) (7.45) (9.49)Bangkok Metropolitan 89.47 53.37 66.70 71.93 224.58Bank (BMB) (7.12) (4.77) (5.55) (6.16) (15.27)Bangkok Bank of 87.84 367.64 154.91 107.68Commerce (BBC) (7.07) (19.75) (8.51)
Average 75.54 46.54 52.86 36.02 106.74Estimates of deposit insurance as a percent of equity correspond to results in Table A2, Appendix A.Model was estimated with total liabilities. Standard errors of estimates in parentheses. When nostandard error is listed, the constraint that � is greater than zero is binding.
For all banks and for all years, the estimates of bank assets increase and their
volatility decrease when total liabilities are used instead of total deposits. The value of
deposit insurance as a percent of equity or deposits increased in all cases, with the
exceptions of KTB in 1992, NTB in 1993, and SBB in 1992. Therefore the broader
guarantee of the commercial banking system led to a larger subsidy to banks.

24
Table 7: Estimates of Deposit Insurance as a percent of Total Deposits
BANKS 1992 1993 1994 1995 1996Bangkok Bank 11.78 9.56 16.76 6.32 10.08(BBL) (0.95) (0.96) (1.39) (0.69) (0.93)Bank of Asia 18.95 17.74 24.89 23.17 18.88(BOA) (1.42) (1.61) (1.96) (1.71) (1.35)Bank of Ayudhya 12.42 12.32 9.29 7.09 20.70(BAY) (0.90) (1.00) (1.30)First Bangkok 24.58 17.91 17.66 16.00 19.90City Bank (FBC) (1.67) (1.40) (1.36) (1.19) (1.25)Krung Thai Bank 7.66 9.24 11.16 9.13 28.97(KTB) (0.87) (1.00) (0.91) (1.74)Laem Thong 19.70 10.89 18.05 17.92 17.14Bank (LTB) (1.29) (0.99) (1.38) (1.32) (1.29)Nakornthon 19.84 18.44 27.12 15.12 19.32Bank (NTB) (1.30) (1.54) (1.89) (1.22) (1.40)Siam City Bank 18.95 11.04 10.87 9.21 18.78(SCB) (1.46) (1.04) (1.04) (0.86) (1.25)Siam Commercial 11.73 15.19 15.85 9.15 18.31Bank (SBB) (1.15) (1.32) (0.89) (1.34)The Thai Danu 9.35 11.15 10.34 14.12 19.79Bank (TDB) (0.96) (0.91) (1.35)Thai Farmers 10.88 11.04 11.04 5.03 11.95Bank (TFB) (0.86) (0.99) (1.06) (0.59) (1.00)Thai Military 17.47 13.25 14.74 11.52 19.83Bank (TMB) (1.12) (1.18) (0.97) (1.31)Union Bank of 38.05 14.56 21.05 9.38 17.85Bangkok (UBB) (2.17) (1.23) (1.60) (1.33)
Average 12.95 11.72 14.02 8.76 17.67Estimates of deposit insurance as a percent of deposits correspond to results in Table A2, Appendix A.Model was estimated with total liabilities. Standard errors of estimates in parentheses. When no standarderror is listed, the constraint that � is greater than zero is binding. Note: Bangkok Bank of Commerceand Bangkok Metropolitan Bank are not listed on this table because deposit data for these banks is notavailable. The estimates of deposit insurance for these banks as a percent of liabilities are in Table A2.
6. Evaluating the Results
In this section, I analyze the estimates of the deposit guarantees to determine
whether the subsidy values can distinguish between safe and unsafe banks and explain
why the Thai banking crisis occurred. In particular, do the subsidy estimates match the
“marginal” and “bad” banks of Tables 2 and Table 3? Are the guarantee values
correlated with those banks that failed in 1998? Do the subsidy values and estimated
asset values uncover the exploitation of the government guarantee by certain banks?
Would reported balance sheet information lead to the same conclusions?

25
In Table 8, I list the banks in descending order according to their average
estimated deposit insurance subsidy as a percent of liabilities over 1992 to 1996.24 The
calculations used to construct Table 8 can be found in Table A3 in Appendix A. The
eight banks listed in bold correspond to the “bad” banks listed in Table 3. The seven
banks listed in italics had slightly lower insurance subsidies and correspond to the
“marginal banks” listed in Table 2. These rankings are based on the results using total
liabilities for the guarantee. However, the same banks are picked as the worst banks if
the estimated insurance subsidies employing total deposits are used.25
Table 8: Banks Ranked by their Deposit Insurance Subsidies in Descending Order
BANK OUTCOME OF THAI BANKS IN 1998
First Bangkok City Bank Nationalized by Central BankUnion Bank of Bangkok Nationalized by Central BankBank of Asia Bought by foreign ownersBangkok Bk of Commerce Nationalized by Central BankNakornthon Bank About to be bought by foreign ownersLaem Thong Bank Nationalized by Central BankThai Military Bank Will be recapitalized by Central BankKrung Thai Bank Has been recapitalized by Central BankSiam Commercial Bank Will be recapitalized by Central BankBank of Ayudhya Will be recapitalized by Central BankBangkok Metropolitan Bk Nationalized by Central BankSiam City Bank Nationalized by Central BankThe Thai Danu Bank Bought by foreign ownersThai Farmers Bank Recapitalized by issuing new shares to foreign firmsBangkok Bank Recapitalized by issuing new shares to foreign firmsBanks are ranked in descending order of average deposit insurance subsidy over 1992 –96. Estimates ofthe deposit insurance subsidy as a percent of liabilities are from Table A2, which uses total liabilities.
Table 8 describes the actions taken towards the banks in 1998. The “bad” banks
have all been nationalized by the government or bought by foreign owners. The
“marginal” banks, with the exception of The Thai Danu Bank, are able to participate in
the government’s recapitalization program. Only Bangkok Bank and Thai Farmers Bank
have recapitalized without government assistance by selling a minority stake to foreign
owners.
24 The analysis uses deposit insurance as a percent of total liabilities so that all banks could be compared,including the two without deposit data. The ratio of deposit insurance a percent of equity was not usedbecause equity is more volatile than liabilities. However the rankings using deposit insurance as percent ofequity find the 5 banks with the highest subsidy values are BBC, LTB , UBB, BMB , and FBC.25 The rankings using the estimated value of deposit insurance from Table 5 are: BOA, NTB, FBC, LTB ,UBB, KTB, SBB, TMB, TDB, BAY, SCB, BBL, and TFB.
26
Siam City Bank and Bangkok Metropolitan Bank are the only banks not grouped
with the other “bad” banks; however they are lumped in a middle group of banks with
Siam Commercial Bank, Thai Military Bank, Bank of Ayudhya, and Krung Thai Bank.
In several of these middle banks political factors may have played a role in their
outcomes: Krung Thai Bank is owned by the government, Siam Commercial Bank is
largely owned by the royal family, and Thai Military Bank is largely owned by the
military. Thus, the estimates of the deposit insurance subsidy over 1992 to 1996 match
the outcomes of Thai banks, both in terms of their profits (losses) in 1997 and the actions
taken against them in 1998.
In order to examine the ability of the insurance subsidy to classify the banks into
two groups prior to the crisis, I carried out the same analysis using the average deposit
insurance subsidy from 1992 to 1995. Whether total deposits or total liabilities are used,
the average subsidy value divides the banks into similar groupings as in Table 8.26 (See
Table A3). Moreover, the estimates of the insurance subsidy could be used on a yearly
basis to identify the worst banks. Table A3 indicates the worst banks for each year. Prior
to 1996, with a few exceptions, the values of deposit insurance routinely identify the
group of “bad” banks.
In contrast, examining the profit-to-asset ratios in 1996 would not reveal the same
distinction between banks as it did in Tables 2 and 3. With the exception of Laem Thong
Bank and Union Bank of Bangkok, the remaining banks all had profits ranging from 1%
to 2.7% of assets.27 Therefore, while the profit results at the end of 1997 are able to make
a distinction between “bad” and “marginal” banks, reported profits prior to the crisis
provide no such information.
The estimated insurance values were large prior to 1996 and then increased
sharply in that year. Banks may have attempted to maximize the size of this subsidy
either by expanding their insured liabilities or by financing riskier projects. White (1991)
showed that the failed S&Ls grew at faster rates and had more nontraditional loans and
investments than those thrifts that did not fail. The data available on Thailand’s banking
26 Using total liabilities the ranking becomes: FBC, UBB, BOA, BBC, NTB, LTB , TMB, SBB, BMB ,SCB, BAY, BBL, TDB, TFB, and KTB. Using total deposits the ranking becomes: UBB, BOA, FBC, NTB,LTB , TMB, SBB, SCB, BBL, BAY, TDB, KTB, and TFB.27 The profit to asset ratios are: 2.7% BBL, 1.7% BAY, 2.0% KTB, 2.2% SBB, 1.4% TDB, 2.6% TFB, 1%TMB, 2% BOA, 2.5% FBC, 0.7% LTB, 1.5% NTB, 2% SCB, 0.3% UBB.

27
sector does not separate investments and loans into different categories, so a similar,
detailed analysis is not possible.
In Table A4 and Table A5, in Appendix A, I present selected indicators from bank
balance sheets for the “marginal” and “bad” banks, respectively. The growth rate of
assets while fairly large, is not substantially different between groups.28 The division of
assets among investments, loans, and bad debt reserves is also fairly constant among
banks. Also, listed in Tables A4 and A5 are the q-ratios across banks. The q-ratio
indicates the equity value of the bank per baht of paid in capital. Prior to 1997, the q-
ratio is above one for most banks, indicating that the stock market viewed banks as a
good investment. However, a large portion of this stock market value can be attributed to
the deposit insurance subsidy. I have also included in Tables A4 and A5 the estimated
insurance subsidy as a percent of assets to be used as a comparison. Thus, using a
traditional approach to examine the banks’ balance sheets would not distinguish between
bank types.
Tables 9 and 10 list the capital-to-asset ratios, the market-value to asset ratios, and
the corrected-market-value to asset ratios for the “marginal” and “bad” banks,
respectively. Using the capital-to-asset ratios to examine the Thai banking system would
generate the wrong conclusion: that all banks were relatively healthy. The capital-to-
asset ratios do not even show deterioration in bank capital in 1997 (with the exception of
FCB and SCB whose capital was written down at the end of 1997). Bangkok Bank of
Commerce does have the lowest capital-to-asset ratios over the period, indicating that
regulators must have been aware of its weak condition in 1994-95. Despite capital-to-
asset ratios below the BIS norm of 8% for several banks, Thai banking regulators may
have been misled by the high market-value to asset ratios. The large market value of the
bank could reflect the franchise or future value of the bank. Regulators may have
believed that given the high market capitalization values, banks would eventually be able
to raise their paid-in capital.
28 The “bad” banks average growth rate of assets was 21% and for “marginal” banks asset growth averaged20%.

28
Table 9: Asset Ratios For "Marginal" Banks
Bangkok Bank 1992 1993 1994 1995 1996 1997Capital / Assets 6.81% 8.55% 8.67% 8.95% 9.29% 7.27%Mkt. Value / Assets 13.66% 25.32% 22.15% 21.16% 16.80% 6.08%Corrected MV / Assets 4.84% 18.18% 10.02% 16.51% 9.50%Bank of Ayudhya 1992 1993 1994 1995 1996 1997Capital / Assets 8.56% 8.53% 6.78% 6.01% 7.26% 5.31%Mkt. Value / Assets 13.67% 18.61% 13.41% 13.56% 8.07% 2.02%Corrected MV / Assets 3.07% 8.32% 5.79% 7.56% -8.90%Krung Thai Bank 1992 1993 1994 1995 1996 1997Capital / Assets 5.55% 5.36% 5.88% 7.01% 7.07% 5.79%Mkt. Value / Assets 10.90% 21.99% 19.81% 24.24% 11.06% 1.83%Corrected MV / Assets 4.23% 13.91% 10.56% 17.11% -12.48%Siam Commercial Bk. 1992 1993 1994 1995 1996 1997Capital / Assets 7.05% 8.05% 8.22% 7.78% 7.52% 5.82%Mkt. Value / Assets 14.48% 22.79% 20.88% 21.30% 12.38% 3.40%Corrected MV / Assets 5.26% 10.58% 8.93% 14.39% -1.12%Thai Danu Bank 1992 1993 1994 1995 1996 1997Capital / Assets 6.04% 7.00% 6.77% 6.66% 9.74% 6.99%Mkt. Value / Assets 10.71% 15.61% 13.86% 10.53% 9.28% 3.65%Corrected MV / Assets 3.45% 7.02% 6.69% 0.74% -4.32%Thai Farmers Bank 1992 1993 1994 1995 1996 1997Capital / Assets 7.42% 8.07% 9.17% 9.01% 9.62% 7.14%Mkt. Value / Assets 15.40% 21.01% 27.20% 24.06% 16.10% 6.03%Corrected MV / Assets 6.53% 12.00% 18.45% 20.05% 6.43%Thai Military Bank 1992 1993 1994 1995 1996 1997Capital / Assets 6.09% 7.53% 7.02% 7.42% 7.25% 5.72%Mkt. Value / Assets 11.50% 21.14% 16.91% 15.76% 13.23% 1.76%Corrected MV / Assets -3.11% 10.55% 5.36% 6.98% -2.10%Capital-to-Asset ratios and Market-Value to Asset ratios are from reported balance sheet data fromDatastream. The Corrected-Market-Value to Asset ratio was calculated by subtracting the insurancesubsidy (from Table 6) from the market value of the bank and dividing by total assets.
The corrected-market-value to asset ratios subtract off the portion of the market
value of the bank attributable to the insurance subsidy (Table 6). The corrected-market-
value to asset ratios more accurately capture the true franchise value of the banks. In
1995, all of the banks that were later nationalized by the central bank or bought by
foreign entities had corrected-market-value to asset ratios below 6.5%, with the exception
of Siam City Bank. The remaining banks all had corrected-market-value to asset ratios
above this figure. Examining the ratios, four banks: First Bangkok City Bank, Union
Bank of Bangkok, Bangkok Bank of Commerce, and Bangkok Metropolitan Bank had
corrected-market-value to asset ratios below their reported capital-to-asset ratios for all 5
years. The remaining “bad” banks, with the exception of Siam City Bank, had corrected

29
market value-to-asset ratios below their capital-to-asset ratios for 4 years. This suggests
that these banks were undercapitalized and had little franchise value. As a result, it was
unlikely that these banks would eventually grow out of their problems. With the
exceptions of Bangkok Bank and Thai Farmers Bank, all Thai banks had negative
corrected-market-value to asset ratios for 1996.
Table 10: Asset Ratios For "Bad" Banks
Bank of Asia 1992 1993 1994 1995 1996 1997Capital / Assets 7.04% 7.35% 7.71% 7.09% 8.91% 5.92%Mkt. Value / Assets 13.59% 30.02% 23.59% 20.47% 12.29% 3.21%Corrected MV / Assets 0.25% 18.05% 7.58% 3.45% -0.70%First Bangkok City Bk. 1992 1993 1994 1995 1996 1997Capital / Assets 7.14% 8.42% 10.70% 11.67% 10.61% -2.51%Mkt. Value / Assets 16.30% 21.44% 20.41% 15.27% 8.90% 2.85%Corrected MV / Assets -2.72% 7.42% 6.74% 3.16% -6.43%Laem Thong Bank 1992 1993 1994 1995 1996 1997Capital / Assets 6.88% 5.79% 6.25% 8.74% 8.53% 6.01%Mkt. Value / Assets 7.25% 16.22% 14.12% 10.74% 11.23% 5.02%Corrected MV / Assets -9.27% 7.58% 0.32% -2.32% -1.18%Nakornthon Bank 1992 1993 1994 1995 1996 1997Capital / Assets 6.48% 5.77% 6.69% 6.63% 7.48% 5.70%Mkt. Value / Assets 14.55% 24.69% 18.99% 16.93% 14.25%Corrected MV / Assets -0.91% 11.73% 0.91% 6.21% 0.14%Siam City Bank 1992 1993 1994 1995 1996 1997Capital / Assets 6.98% 7.36% 7.31% 7.07% 6.65% -0.05%Mkt. Value / Assets 17.21% 20.86% 21.47% 15.07% 6.29% 1.06%Corrected MV / Assets 3.12% 12.45% 13.31% 8.25% -7.26%Union Bk of Bangkok 1992 1993 1994 1995 1996 1997Capital / Assets 5.12% 7.23% 7.77% 6.07% 5.10% 1.65%Mkt. Value / Assets 11.98% 16.46% 14.95% 9.94% 10.09% 3.54%Corrected MV / Assets -16.33% 5.49% 0.27% 3.76% -2.75%Bangkok Metropolitan Bk 1992 1993 1994 1995 1996 1997Capital / Assets 9.06% 7.71% 8.36% 7.74% 7.60% -4.19%Mkt. Value / Assets 12.99% 16.28% 15.95% 11.52% 5.25% 0.98%Corrected MV / Assets 1.37% 7.59% 5.31% 3.23% -6.54%Bangkok Bk of Commerce 1992 1993 1994 1995 1996 1997Capital / Assets 5.00% 4.38% 4.89% 6.89% 8.39% -1.32%Mkt. Value / Assets 13.08% 8.17% 4.65% 9.03% 12.76%Corrected MV / Assets 1.59% -21.87% -2.55% -0.69%Capital-to-Asset ratios and Market-Value to Asset ratios are from reported balance sheet data fromDatastream. The Corrected-Market-Value to Asset ratio was calculated by subtracting the insurancesubsidy (from Table 6) from the market value of the bank and dividing by total assets.

30
7. Conclusion
This paper empirically examines the effect of deposit insurance as a contributing
factor in emerging market banking crises. When the franchise value of a bank is small,
the bank can extract the insurance subsidy by issuing more deposits, undertaking riskier
loans, or paying out large dividends to stockholders. Previous work on balance of
payments and banking crises in developing countries has used a macroeconomic
framework. In these models, the banking system is a recipient of the crisis through
shocks to the economy.
In this paper, I use a microeconomic approach that emphasizes that incentives and
institutions present in the banking system create conditions over several years to trigger
banking crises. Using the established result that deposit insurance can be modeled as a
put option on the value of bank assets, I maximize a likelihood function which relates the
observed market capitalization of the bank to the unobserved asset values implied by the
put option. The estimates of deposit insurance show that the size of the subsidy to the
banking system was large both as a percent of deposits and equity. Moreover, from as
early as 1992-93, the distribution of the subsidy routinely identified the worst banks. The
size of this subsidy, coupled with lax regulatory oversight, made the Thai banking crisis
nearly inevitable. The central bank now has control of eight of Thailand’s banks, has
agreed to the sale of three banks to foreign entities, and has planned for the eventual need
to recapitalize the remaining five banks.
This paper has wider implications for other emerging markets. Implicit deposit
insurance systems are present in most developing economies. Furthermore, multilateral
organizations are emphasizing the need to formalize deposit insurance arrangements.
Clearly, more research is needed to extend this approach to other emerging markets and
to extend the methodology into a predictive model. Additionally, in many emerging
markets, nontraded banks predominate. Therefore, an important extension would be the
incorporation of non-equity information into the put-option approach.

31
References
Acharya, Sankarshan. 1996. Charter Value, Minimum Bank Capital Requirement andDeposit Insurance Pricing in Equilibrium. Journal of Banking and Finance 20:351-375.
Allen, Linda and Anthony Saunders. 1993. Forbearance and Valuation of DepositInsurance as a Callable Put. Journal of Banking and Finance 17: 629-643.
Black, F. and M. Scholes. 1973. The Pricing of Options and Corporate Liabilities.Journal of Political Economy 81: 637-659.
Brock, Philip. 1996. High Real Interest Rates and Banking Crises in an Open Economy:A Case Study of Chile, 1975-83. Institute for Economic Research, University ofWashington Discussion Paper Series (August).
Calomiris, Charles. 1989. Deposit Insurance: Lessons from the Record. EconomicPerspectives, Federal Reserve Bank of Chicago (May/June).
Calomiris, Charles. 1992. Do “Vulnerable” Economies Need Deposit Insurance? Lessonsfrom U.S. Agriculture in the 1920s. In Philip Brock ed., If Texas Were Chile: APrimer on Banking Reform. ICS Press, San Francisco, 237-314.
Calomiris, Charles and Joseph Mason. 1997. Contagion and Bank Failures During theGreat Depression: The June 1932 Chicago Banking Panic. American EconomicReview 87 (5): 863-83.
Caprio, Gerard Jr. and Daniela Klingebiel. 1996. Bank Insolvencies: Cross-countryExperience. The World Bank Policy Research Working Paper 1620 (July).
Calvo, Guillermo. 1987. On the Costs of Temporary Policy. Journal of DevelopmentEconomics 27: 245-61.
Calvo, Guillermo. 1995. Varieties of Capital-Market Crises. Inter-American DevelopmentBank Working Paper 306 (August).
Calvo, Guillermo and Enrique Mendoza. 1996. Mexico’s Balance-of-Payments Crisis: AChronicle of Death Foretold. Journal of International Economics 41 (3-4): 235-64.
Calvo, Guillermo and Carlos Végh. 1994. Stabilization Dynamics and Backward-Looking Contracts. Journal of Development Economics 43: 59-84.
Chan, Yuk, Greenbaum, Stuart, and Anjan Thakor. 1992. Is Fairly Priced DepositInsurance Possible? Journal of Finance 47(1): 227-45.

32
Cordell, Lawrence and Douglas Gordon. 1990. An Option-Theoretic Approach toMeasuring Capital at Savings Associations. Office of Thrift Supervision ResearchPaper 90-03 (July).
Dewatripont, Mathias and Jean Tirole. 1994. The Prudential Regulation of Banks.Cambridge, Mass.: MIT Press.
Dornbusch, Rudiger and Alejandro Werner. 1994. Mexico: Stabilization, Reform, and NoGrowth. Brookings Papers on Economic Activity 0(1): 253-315.
Dornbusch, Rudiger, Goldfajn, Ilan, and Rodrigo Valdes. 1995. Currency Crises andCollapses. Brookings Papers on Economic Activity 2: 219-270.
Duan, Jin-Chuan. 1994. Maximum Likelihood Estimation Using Price Data of theDerivative Contract. Mathematical Finance 4(2): 155-167.
Duan, Jin-Chuan and Min-The Yu. 1994. Assessing the Cost of Taiwan’s DepositInsurance. Pacific-Basin Finance Journal 2: 73-90.
Economist Intelligence Unit. Country Reports. Various issues.
Economist Intelligence Unit. Financing Foreign Operations. Various issues.
Frankel, Jeffrey and Andrew Rose. 1996. Currency Crashes in Emerging Markets: AnEmpirical Treatment. Journal of International Economics 41 (3-4): 351-66.
Freixas, Xavier and Jean-Charles Rochet. 1997. Microeconomics of Banking. Cambridge,Mass.: MIT Press.
Fries, Steven, Mella-Barral, Pierre and William Perraudin. 1997. Optimal BankReorganization and the Fair Pricing of Deposit Guarantees. Journal of Bankingand Finance 21: 441-468.
Fries, Steven, Mason, Robin and William Perraudin. 1993. Evaluating Deposit Insurancefor Japanese Banks. Journal of the Japanese and International Economy 7: 356-386.
Giammarino, Ronald, Schwartz, Eduardo, and Josef Zechner. 1989. Market Valuation ofBank Assets and Deposit Insurance in Canada. Canadian Journal of Economics22(1): 109-27.
Gunther, Jeffrey and Kenneth Robinson. 1990. Empirically Assessing the Role of MoralHazard in Increasing the Risk Exposure of Texas Banks. Federal Reserve Bank ofDallas, Financial Industry Studies Working Paper 4-90 (October).
Horvitz, Paul. 1992. The Causes of Texas Bank and Thrift Failures. In Philip Brock ed.,If Texas Were Chile: A Primer on Banking Reform. ICS Press, San Francisco,131-192.

33
Kamin, Steven. 1996. Real Exchange Rates and Inflation in Exchange-Rate BasedStabilizations: An Empirical Examination. Board of Governors of the FederalReserve System, International Finance Discussion Papers 554 (June).
Kamin, Steven and John Rogers. 1996. Monetary Policy in the End-Game to Exchange-Rate Based Stabilizations: The Case of Mexico. Journal of InternationalEconomics 41(3-4): 285-307.
Kaminsky, Graciela and Leonardo Leiderman. 1998. High Real Interest Rates in theAftermath of Disinflation: Is it a Lack of Credibility? Journal of DevelopmentEconomics 55(1): 191-214.
Kaminsky, Graciela and Carmen Reinhart. 1996. The Twin Crises: The Causes ofBanking and Balance-of-Payments Problems. Board of Governors of the FederalReserve System, International Finance Discussion Papers 544 (March).
Kaminsky, Graciela and Carmen Reinhart. 1998. Financial Crises in Asia and LatinAmerica: Then and Now. American Economic Review 88 (2): 444-48.
Kaplan, Idanna. 1997. High Real Interest Rates in Chile Following the 1979Stabilization: A Markov-Switching Analysis. Unpublished Manuscript.
Krugman, Paul. 1979. A Model of Balance-of-Payments Crises. Journal of Money,Credit, and Banking 11: 311-25.
Marcus, Alan and Israel Shaked. 1984. The Valuation of FDIC Deposit Insurance UsingOption-Pricing Estimates. Journal of Money, Credit, and Banking 16: 446-460.
Merton, Robert. 1977. An Analytic Derivation of the Cost of Deposit Insurance and LoanGuarantees. Journal of Banking and Finance 1: 3-11.
Mullins, Helana and David Pyle. 1994. Liquidation Costs and Risk-Based Bank Capital.Journal of Banking and Finance 18: 113-138.
Nagarajan, S. and C.W. Sealey. 1995. Forbearance, Deposit Insurance Pricing, andIncentive Compatible Bank Regulation. Journal of Banking and Finance 19:1109-1130.
Rebelo, Sergio and Carlos Végh. 1995. Real Effects of Exchange Rate-BasedStabilization: An Analysis of Competing Theories. NBER Working Paper 5197(July).
Ronn, Ehud and Avinash Verma. 1986. Pricing Risk-Adjusted Deposit Insurance: AnOption-Based Model. The Journal of Finance 16: 871-895.
Sachs, Jeffrey, Tornell, Aaron, and Andres Velasco. 1996. Financial Crises in EmergingMarkets: The Lessons from 1995. NBER Working Paper 5576 (May).

34
Sato, Ryuzo, Ramachandran, Rama and Bohyong Kang. 1990. Risk Adjusted DepositInsurance for Japanese Banks. NBER Working Paper 3314 (April).
White, Lawrence. 1991. The S & L Debacle: Public Policy Lessons for Bank and ThriftRegulation. New York: Oxford University Press.

35
Appendix A – STATISTICAL APPENDIX
Figure A1 – Composition of the Financial System in Thailand, 1997 ( percent of deposits )
Source: Financing Foreign Operations , 2/98.Note: Numbers do not sum to 100% because the remaining 3.3% represent deposits fromthe 56 closed finance companies.
Figure A2 – Composition of the Financial System in Thailand, 1997 ( percent of credits)
Source: Financing Foreign Operations , 2/98.
Commercial Banks (83%)
Specialized Government Insitutions
Others
Domestic Banks Foreign Banks
The Government Savings Bank (5%)
Industrial Financial Corporation of Thailand The Government Housing Bank Bank for Agriculture and Agricultural cooperatives (1.2%)
Finance and Securities Companies (6%)
Insurance Companies (1.5%) Credit Foncier Companies
Finance Companies
Securit ies Companies
Finance and Securit ies Companies
Commercial Banks (92%)
Specialized Government Insitutions
Others
Domestic Banks Foreign Banks
The Government Savings Bank (1.5%)
Industrial Financial Corporation of Thailand The Government Housing Bank Bank for Agriculture and Agricultural cooperatives (1.5%)
Finance and Securities Companies (4%)
Insurance Companies (1%) Credit Foncier Companies
Finance Companies
Securit ies Companies
Finance and Securit ies Companies

36
Table A1: Estimates of Deposit Insurance for Thai Banks using DepositsBangkok Bank 1992 1993 1994 1995 1996Equity 90999.94 197999.94 200033.31 220280.44 195248.56Deposits 498753.80 583746.56 653635.07 766849.54 841931.01� 0.03 0.06 0.00 0.01 -0.01
(0.02) (0.02) (0.03) (0.02) (0.02)� 0.29 0.39 0.48 0.30 0.33
(0.01) (0.02) (0.02) (0.01) (0.01)V 553641.22 739042.02 769492.25 951535.18 973492.48
(5935.07) (6408.44) (5202.92) (5303.00) (9938.29)Insurance as 10.51 8.80 15.02 5.72 9.06% of Deposits (1.19) (1.10) (0.80) (0.69) (1.18)Insurance as 57.59 25.94 49.07 19.90 39.08% of Equity (6.52) (3.24) (2.60) (2.41) (5.09)Bank of Asia 1992 1993 1994 1995 1996Equity 7623.00 20944.00 19658.81 22198.66 15541.58Deposits 39470.13 47071.42 53602.77 79660.30 87002.86� 0.04 0.08 -0.02 0.01 -0.02
(0.03) (0.04) (0.04) (0.04) (0.02)� 0.43 0.61 0.66 0.56 0.37
(0.02) (0.03) (0.03) (0.02) (0.02)V 41021.76 60929.33 62148.66 86935.12 91425.89
(706.52) (750.37) (749.90) (817.26) (1254.09)Insurance as 17.18 15.95 21.52 20.94 16.31% of Deposits (1.79) (1.59) (1.40) (1.03) (1.44)Insurance as 88.97 35.86 58.69 75.13 91.31% of Equity (9.27) (3.58) (3.81) (3.68) (8.07)Bank of Ayudhya 1992 1993 1994 1995 1996Equity 23800.00 37400.00 38400.00 49999.99 33500.00Deposits 148557.36 167922.43 234828.11 312440.32 340151.04� 0.02 0.03 0.00 0.01 -0.02
(0.02) (0.02) (0.01) (0.01) (0.02)� 0.25 0.32 0.23 0.21 0.33
(0.01) (0.01) (0.01) (0.01)V 163408.05 192535.35 260782.42 348839.21 318962.32
(1701.43) (1175.19) (2390.07) (3544.14)Insurance as 11.81 11.68 8.59 6.69 19.58% of Deposits (1.15) (0.70) (1.02) (1.04)Insurance as 73.71 52.43 52.53 41.79 198.86% of Equity (7.15) (3.14) (6.22) 0.00 (10.58)First Bangkok City Bk. 1992 1993 1994 1995 1996Equity 20671.38 32714.70 36669.21 33217.99 22432.93Deposits 98116.62 119416.05 139115.31 164608.74 194191.94� 0.05 0.03 0.01 -0.01 -0.02
(0.03) (0.03) (0.03) (0.02) (0.02)� 0.52 0.47 0.44 0.35 0.30
(0.02) (0.02) (0.02) (0.02) (0.01)V 99293.56 135548.06 158175.70 181004.72 192253.25
(1388.84) (1491.88) (1403.85) (1567.26) (3904.62)Insurance as 22.79 16.69 16.39 14.61 18.23% of Deposits (1.42) (1.25) (1.01) (0.95) (2.01)Insurance as 108.18 60.93 62.18 72.42 157.84% of Equity (6.72) (4.56) (3.83) (4.72) (17.41)

37
Table A1, cont.Krung Thai Bank 1992 1993 1994 1995 1996Equity 39528.30 93442.69 110248.94 155347.44 79153.19Deposits 315706.11 371490.56 461377.02 500280.32 581628.67� 0.02 0.05 0.01 0.03 -0.04
(0.01) (0.02) (0.02) (0.02) (0.03)� 0.21 0.34 0.36 0.37 0.50
(0.01) (0.02) (0.02) (0.02)V 337840.15 437952.37 530115.61 621173.93 515447.96
(3390.84) (4480.05) (5878.20) (5797.55)Insurance as 9.67 8.95 10.63 8.44 27.17% of Deposits (0.91) (0.97) (1.17) (1.00)Insurance as 77.26 35.58 44.48 27.19 199.62% of Equity (3.63) (4.06) (3.78) (7.32)Laem Thong Bank 1992 1993 1994 1995 1996Equity 1030.00 3080.00 3300.00 3427.43 4616.53Deposits 11916.47 15065.57 17870.26 23256.32 29774.02� -0.01 0.05 0.00 0.00 0.01
(0.02) (0.02) (0.03) (0.02) (0.02)� 0.35 0.36 0.44 0.39 0.38
(0.02) (0.02) (0.02) (0.02) (0.02)V 10652.36 16559.93 18235.41 22974.24 29912.61
(151.85) (173.53) (247.60) (280.16) (348.53)Insurance as 19.25 10.52 16.92 16.82 15.98% of Deposits (1.27) (1.15) (1.39) (1.20) (1.17)Insurance as 222.73 51.48 91.62 114.14 103.08% of Equity (14.74) (5.63) (7.50) (8.17) (7.55)Nakornthon Bank 1992 1993 1994 1995 1996Equity 4232.80 9090.89 8495.66 9628.00 9185.00Deposits 22661.09 25860.96 29815.68 40317.46 47056.21� 0.04 0.06 0.00 0.01 0.00
(0.02) (0.12) (0.04) (0.03) (0.02)� 0.34 0.54 0.57 0.39 0.41
(0.02) (0.04) (0.08) (0.02) (0.02)V 24608.08 31259.92 32568.43 45726.03 49611.83
(694.33) (1329.12) (310.25) (435.81) (541.42)Insurance as 13.50 21.05 21.70 13.27 15.62% of Deposits (3.06) (5.14) (1.04) (1.08) (1.15)Insurance as 72.30 59.88 76.17 55.57 80.03% of Equity (16.40) (14.62) (3.65) (4.53) (5.89)Siam City Bank 1992 1993 1994 1995 1996Equity 17280.00 26208.00 34848.00 30350.50 14724.50Deposits 74639.94 95687.12 121927.06 149134.56 168947.36� 0.05 0.03 0.02 -0.01 -0.03
(0.03) (0.03) (0.03) (0.02) (0.02)� 0.48 0.40 0.40 0.31 0.31
(0.02) (0.02) (0.02) (0.01) (0.01)V 79796.11 112657.60 145214.72 168018.80 157388.80
(841.07) (954.51) (918.69) (1189.41) (1752.25)Insurance as 17.64 10.39 10.17 8.52 17.13% of Deposits (1.13) (1.00) (0.75) (0.80) (1.04)Insurance as 76.21 37.92 35.58 41.86 196.49% of Equity (4.87) (3.64) (2.64) (3.92) (11.90)

38
Table A1, cont.Siam Commercial Bk 1992 1993 1994 1995 1996Equity 39824.00 74099.94 76759.94 96564.13 67021.25Deposits 216079.81 261553.49 277295.36 342191.10 399291.14� 0.03 0.04 0.00 0.02 -0.02
(0.02) (0.02) (0.03) (0.02) (0.02)� 0.26 0.35 0.45 0.34 0.39
(0.01) (0.02) (0.02) (0.02) (0.02)V 243823.82 317339.58 319202.83 416683.77 408310.89
(2799.23) (3266.39) (2530.75) (3229.72) (3498.04)Insurance as 13.48 11.16 14.53 8.33 16.55% of Deposits (1.30) (1.25) (0.91) (0.94) (0.88)Insurance as 73.12 39.39 52.47 29.51 98.59% of Equity (7.03) (4.41) (3.30) (3.34) (5.22)
The Thai Danu Bank 1992 1993 1994 1995 1996Equity 4424.00 7980.00 9394.00 9191.00 11102.00Deposits 32066.70 39379.87 46981.79 60518.18 82235.12� 0.02 0.03 0.01 0.00 0.01
(0.01) (0.02) (0.02) (0.02) (0.02)� 0.21 0.32 0.29 0.27 0.36
(0.01) (0.01) (0.01) (0.02)V 34872.06 44082.60 53072.25 65106.68 81239.51
(324.54) (345.31) (735.02) (887.82)Insurance as 7.13 10.34 9.06 11.80 17.63% of Deposits (0.82) (0.73) (1.21) (1.08)Insurance as 51.71 51.03 45.30 77.69 130.57% of Equity (4.07) (3.68) (8.00) (8.00)Thai Farmers Bank 1992 1993 1994 1995 1996Equity 55999.98 92800.00 138399.94 140800.00 103999.94Deposits 296562.69 360421.89 403315.20 466573.31 522813.18� 0.03 0.03 0.03 0.00 -0.02
(0.02) (0.02) (0.03) (0.02) (0.02)� 0.25 0.36 0.42 0.29 0.33
(0.01) (0.02) (0.02) (0.01) (0.01)V 336828.03 423914.24 507026.65 589899.61 579231.82
(3361.60) (4015.22) (2772.35) (2994.61) (6799.10)Insurance as 9.96 10.43 10.41 4.69 11.28% of Deposits (1.13) (1.11) (0.69) (0.64) (1.30)Insurance as 52.73 40.53 30.33 15.54 56.71% of Equity (6.00) (4.33) (2.00) (2.13) (6.54)Thai Military Bank 1992 1993 1994 1995 1996Equity 17646.40 40888.00 38520.80 44905.59 44135.75Deposits 128347.42 154687.55 178514.00 217228.86 257979.87� 0.02 0.05 0.00 0.01 -0.02
(0.02) (0.02) (0.02) (0.02) (0.02)� 0.24 0.39 0.38 0.31 0.34
(0.01) (0.02) (0.02) (0.01) (0.02)V 137412.50 181013.92 197358.98 245564.10 273846.74
(2076.70) (1606.15) (1618.70) (2101.17) (2005.58)Insurance as 15.84 12.36 13.63 10.44 13.04% of Deposits (1.62) (1.04) (0.91) (0.97) (0.78)Insurance as 115.23 46.77 63.15 50.48 76.25% of Equity (11.77) (3.93) (4.20) (4.68) (4.54)
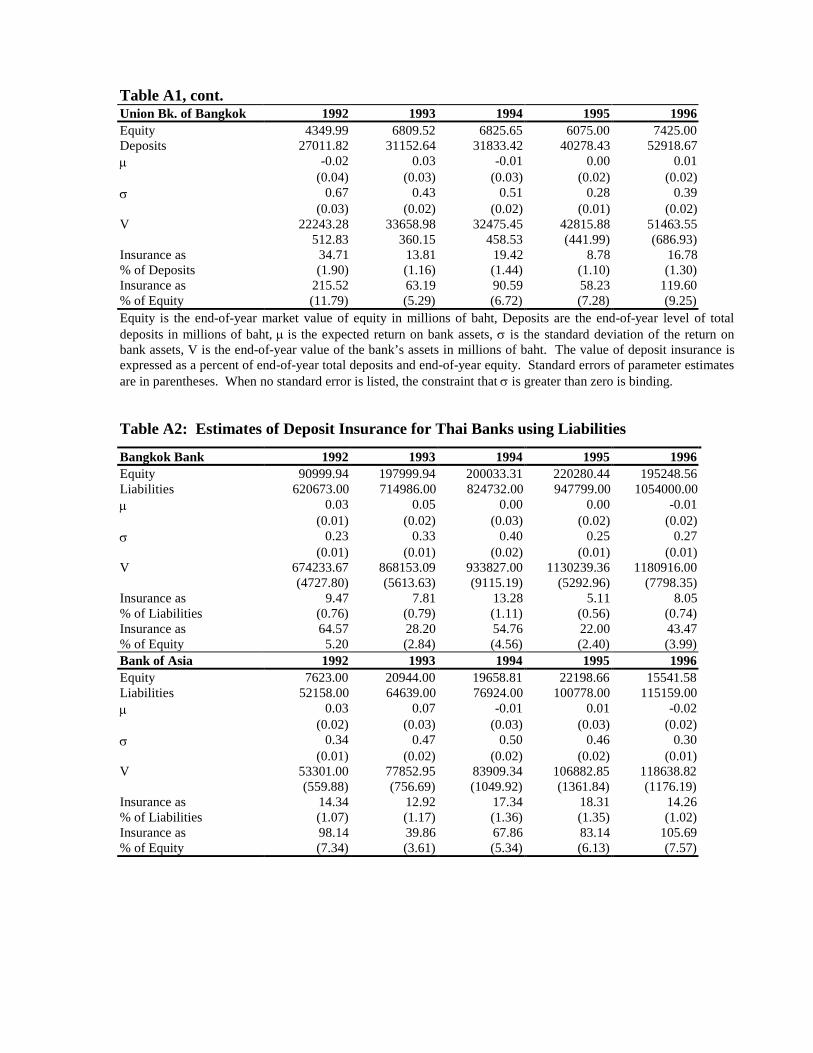
Table A1, cont.Union Bk. of Bangkok 1992 1993 1994 1995 1996Equity 4349.99 6809.52 6825.65 6075.00 7425.00Deposits 27011.82 31152.64 31833.42 40278.43 52918.67� -0.02 0.03 -0.01 0.00 0.01
(0.04) (0.03) (0.03) (0.02) (0.02)� 0.67 0.43 0.51 0.28 0.39
(0.03) (0.02) (0.02) (0.01) (0.02)V 22243.28 33658.98 32475.45 42815.88 51463.55
512.83 360.15 458.53 (441.99) (686.93)Insurance as 34.71 13.81 19.42 8.78 16.78% of Deposits (1.90) (1.16) (1.44) (1.10) (1.30)Insurance as 215.52 63.19 90.59 58.23 119.60% of Equity (11.79) (5.29) (6.72) (7.28) (9.25)Equity is the end-of-year market value of equity in millions of baht, Deposits are the end-of-year level of totaldeposits in millions of baht, ��is the expected return on bank assets, � is the standard deviation of the return onbank assets, V is the end-of-year value of the bank’s assets in millions of baht. The value of deposit insurance isexpressed as a percent of end-of-year total deposits and end-of-year equity. Standard errors of parameter estimatesare in parentheses. When no standard error is listed, the constraint that � is greater than zero is binding.
Table A2: Estimates of Deposit Insurance for Thai Banks using Liabilities
Bangkok Bank 1992 1993 1994 1995 1996Equity 90999.94 197999.94 200033.31 220280.44 195248.56Liabilities 620673.00 714986.00 824732.00 947799.00 1054000.00� 0.03 0.05 0.00 0.00 -0.01
(0.01) (0.02) (0.03) (0.02) (0.02)� 0.23 0.33 0.40 0.25 0.27
(0.01) (0.01) (0.02) (0.01) (0.01)V 674233.67 868153.09 933827.00 1130239.36 1180916.00
(4727.80) (5613.63) (9115.19) (5292.96) (7798.35)Insurance as 9.47 7.81 13.28 5.11 8.05% of Liabilities (0.76) (0.79) (1.11) (0.56) (0.74)Insurance as 64.57 28.20 54.76 22.00 43.47% of Equity 5.20 (2.84) (4.56) (2.40) (3.99)Bank of Asia 1992 1993 1994 1995 1996Equity 7623.00 20944.00 19658.81 22198.66 15541.58Liabilities 52158.00 64639.00 76924.00 100778.00 115159.00� 0.03 0.07 -0.01 0.01 -0.02
(0.02) (0.03) (0.03) (0.03) (0.02)� 0.34 0.47 0.50 0.46 0.30
(0.01) (0.02) (0.02) (0.02) (0.01)V 53301.00 77852.95 83909.34 106882.85 118638.82
(559.88) (756.69) (1049.92) (1361.84) (1176.19)Insurance as 14.34 12.92 17.34 18.31 14.26% of Liabilities (1.07) (1.17) (1.36) (1.35) (1.02)Insurance as 98.14 39.86 67.86 83.14 105.69% of Equity (7.34) (3.61) (5.34) (6.13) (7.57)

40
Table A2, cont.
Bank of Ayudhya 1992 1993 1994 1995 1996Equity 23800.00 37400.00 38400.00 49999.99 33500.00Liabilities 159198.00 183861.00 267017.00 346527.00 384766.00� 0.02 0.02 0.00 0.01 -0.01
(0.01) (0.02) (0.01) (0.01) (0.02)� 0.23 0.30 0.21 0.20 0.30
(0.01) (0.01) (0.01)V 173949.49 208216.16 292667.38 382667.45 361789.80
(1340.80) (1675.32) (4428.07)Insurance as 11.59 11.25 8.17 6.39 18.30% of Liabilities (0.84) (0.91) (1.15)Insurance as 77.52 55.31 56.83 44.29 210.17% of Equity (5.63) (4.48) (13.22)First Bangkok City Bk. 1992 1993 1994 1995 1996Equity 20671.38 32714.70 36669.21 33217.99 22432.93Liabilities 117766.00 139763.00 160409.00 192173.00 225405.00� 0.04 0.03 0.01 -0.01 -0.02
(0.03) (0.03) (0.02) (0.02) (0.02)� 0.44 0.42 0.39 0.31 0.27
(0.02) (0.02) (0.02) (0.01) (0.01)V 117942.82 155161.40 178724.04 207841.76 222527.33
(1635.35) (1675.82) (1886.43) (1958.26) (2430.30)Insurance as 20.48 15.30 15.31 13.71 17.15% of Liabilities (1.39) (1.20) (1.18) (1.02) (1.08)Insurance as 116.69 65.37 66.98 79.31 172.29% of Equity (7.91) (5.12) (5.14) (5.90) (10.83)Krung Thai Bank 1992 1993 1994 1995 1996Equity 39528.30 93442.69 110248.94 155347.44 79153.19Liabilities 342346.00 402236.00 523874.00 596026.00 665328.00� 0.02 0.04 0.01 0.02 -0.04
(0.01) (0.02) (0.02) (0.02) (0.03)� 0.19 0.31 0.32 0.32 0.45
(0.01) (0.01) (0.01) (0.02)V 364313.00 468223.66 591405.13 715254.86 591100.48
(3239.80) (4610.60) (4551.43) (10096.45)Insurance as 7.07 8.54 9.82 7.67 25.33% of Liabilities (0.81) (0.88) (0.76) (1.52)Insurance as 61.19 36.75 46.68 29.42 212.89Deposits (3.47) (4.18) (2.93) (12.76)Laem Thong Bank 1992 1993 1994 1995 1996Equity 1030.00 3080.00 3300.00 3427.43 4616.53Liabilities 13234.00 17889.00 21902.00 29123.00 37591.00� -0.01 0.04 0.00 0.00 0.01
(0.02) (0.02) (0.02) (0.02) (0.02)� 0.32 0.31 0.37 0.32 0.31
(0.01) (0.01) (0.02) (0.01) (0.01)V 11916.77 19328.01 22089.41 28650.16 37476.37
(154.25) (148.86) (246.15) (306.23) (382.95)Insurance as 17.74 9.17 14.73 14.31 13.58% of Liabilities (1.17) (0.83) (1.12) (1.05) (1.02)Insurance as 227.89 53.28 97.76 121.56 110.54% of Equity (14.97) (4.83) (7.46) (8.93) (8.29)
Table A2, cont.

41
Nakornthon Bank 1992 1993 1994 1995 1996Equity 4232.80 9090.89 8495.66 9628.00 9185.00Liabilities 27212.00 34701.00 41738.00 53094.00 59647.00� 0.03 0.05 0.00 0.01 0.00
(0.02) (0.03) (0.03) (0.02) (0.02)� 0.29 0.42 0.44 0.31 0.34
(0.01) (0.02) (0.02) (0.01) (0.01)V 29063.67 39801.51 43850.53 58211.64 61731.09
(295.60) (398.55) (564.47) (493.42) (659.00)Insurance as 16.53 13.75 19.38 11.48 15.25% of Liabilities (1.09) (1.15) (1.35) (0.93) (1.10)Insurance as 106.24 52.47 95.20 63.30 99.00% of Equity (6.98) (4.38) (6.64) (5.12) (7.17)Siam City Bank 1992 1993 1994 1995 1996Equity 17280.00 26208.00 34848.00 30350.50 14724.50Liabilities 93382.00 116416.00 150438.00 187167.00 218641.00� 0.04 0.02 0.02 -0.01 -0.03
(0.02) (0.02) (0.02) (0.02) (0.02)� 0.39 0.34 0.34 0.26 0.25
(0.02) (0.01) (0.02) (0.01) (0.01)V 97889.03 132939.54 173108.09 205387.67 205262.66
(1091.58) (995.89) (1267.80) (1283.02) (2111.14)Insurance as 15.15 9.08 8.81 7.34 14.51% of Liabilities (1.17) (0.86) (0.84) (0.69) (0.97)Insurance as 81.87 40.31 38.02 45.28 215.51% of Equity (6.32) (3.80) (3.64) (4.23) (14.34)Siam Commercial Bk. 1992 1993 1994 1995 1996Equity 39824.00 74099.94 76759.94 96564.13 67021.25Liabilities 255693.00 298916.00 337449.00 418095.00 500539.00� 0.02 0.04 0.00 0.01 -0.02
(0.01) (0.02) (0.02) (0.02) (0.02)� 0.22 0.31 0.39 0.29 0.32
(0.01) (0.02) (0.01) (0.01)V 283100.78 354128.07 377162.32 491506.25 505135.58
(3016.73) (3648.36) (3031.60) (5346.18)Insurance as 9.92 13.29 13.02 7.49 14.61% of Liabilities (1.01) (1.08) (0.73) (1.07)Insurance as 63.67 53.60 57.25 32.43 109.08% of Equity (4.07) (4.75) (3.14) (7.98)The Thai Danu Bank 1992 1993 1994 1995 1996Equity 4424.00 7980.00 9394.00 9191.00 11102.00Liabilities 38828.00 47544.00 63184.00 81444.00 107949.00� 0.02 0.02 0.01 0.00 0.01
(0.01) (0.02) (0.01) (0.01) (0.02)� 0.18 0.27 0.23 0.20 0.28
(0.01) (0.01) (0.01)V 41598.12 52129.74 69077.31 85774.83 106139.92
(377.39) (425.28) (1113.17)Insurance as 7.72 9.23 7.69 10.49 15.08% of Liabilities (0.79) (0.67) (1.03)Insurance as 67.74 55.01 51.71 92.99 146.58% of Equity (4.73) (4.53) (10.03)
Table A2, cont.Thai Farmers Bank 1992 1993 1994 1995 1996

42
Equity 55999.98 92800.00 138399.94 140800.00 103999.94Liabilities 336627.00 405966.00 462120.00 532468.00 583879.00� 0.03 0.03 0.03 0.00 -0.02
(0.01) (0.02) (0.02) (0.02) (0.02)� 0.23 0.32 0.38 0.26 0.30
(0.01) (0.01) (0.02) (0.01) (0.01)V 376591.89 468563.65 564566.23 654995.73 638482.47
(2548.04) (3554.63) (4265.15) (2747.08) (5214.20)Insurance as 9.59 9.80 9.63 4.40 10.70% of Liabilities (0.76) (0.88) (0.92) (0.52) (0.89)Insurance as 57.63 42.87 32.17 16.65 60.05% of Equity (4.55) (3.83) (3.08) (1.95) (5.01)Thai Military Bank 1992 1993 1994 1995 1996Equity 17646.40 40888.00 38520.80 44905.59 44135.75Liabilities 144051.00 178819.00 211801.00 263775.00 309340.00� 0.02 0.04 0.00 0.01 -0.02
(0.01) (0.02) (0.02) (0.02) (0.02)� 0.21 0.34 0.33 0.26 0.29
(0.02) (0.01) (0.01) (0.01)V 152980.75 204656.91 229743.72 291391.63 293461.82
(1735.05) (2103.59) (2102.92) (3369.03)Insurance as 15.57 11.46 12.42 9.49 16.53% of Liabilities (0.97) (0.99) (0.80) (1.09)Insurance as 127.07 50.12 68.30 55.73 115.88% of Equity 64.39 (4.24) (5.46) (4.68) (7.63)Union Bk of Bangkok 1992 1993 1994 1995 1996Equity 4349.99 6809.52 6825.65 6075.00 7425.00Liabilities 34437.00 38388.00 42109.00 57389.00 69836.00� -0.02 0.02 -0.01 0.00 0.01
(0.03) (0.02) (0.03) (0.01) (0.02)� 0.54 0.36 0.40 0.21 0.31
(0.02) (0.02) (0.02) (0.01)V 28869.97 40660.38 42234.47 59683.93 67812.53
586.49 384.13 508.64 (704.95)Insurance as 29.84 11.82 15.91 6.59 13.53% of Liabilities (1.70) (1.00) (1.21) (1.01)Insurance as 236.27 66.63 98.16 62.22 127.25% of Equity (13.48) (5.64) (7.45) (9.49)Bangkok Metropolitan Bk 1992 1993 1994 1995 1996Equity 11584.95 18268.57 21354.24 19520.88 10062.5Liabilities 81094 103574 122711 156280 176999� 0.039115 0.020346 0.009466 -0.005329 -0.019497
(0.02) (0.02) (0.02) (0.02) (0.01)� 0.34 0.31 0.35 0.26 0.23
(0.02) (0.01) (0.02) (0.01) (0.01)V 82314.17 112250.16 130221.48 162347.53 164944.82
(825.35) (871.72) (1184.54) (1202.78) (1536.95)Insurance as 12.78 9.41 11.61 8.98 12.77% of Liabilities (1.02) (0.84) (0.97) (0.77) (0.87)Insurance as 89.47 53.37 66.70 71.93 224.58% of Equity (7.12) (4.77) (5.55) (6.16) (15.27)
Table A2, cont.Bangkok Bk of Commerce 1992 1993 1994 1995 1996Equity 13233.97 9885.61 6700.00 16600.00

43
Liabilities 96102.00 115678.00 137067.00 171207.00� 0.04 (0.01) (0.01) 0.02
(0.02) (0.03) (0.02)� 0.32 0.51 0.16 0.25
(0.01) (0.02) (0.01)V 97711.09 89220.13 133388.16 169932.90
(935.16) (1952.55) (1413.34)Insurance as 12.10 31.42 7.57 10.44% of Liabilities (0.97) (1.69) (0.83)Insurance as 87.84 367.64 154.91 107.68% of Equity (7.07) (19.75) (8.51)Equity is the end-of-year market value of equity in millions of baht, Liabilities are the end-of-year level of liabilitiesin millions of baht, � is the expected return on bank assets, � is the standard deviation of the return on bank assets,V is the end-of-year value of the bank's assets in millions of baht. The value of deposit insurance is expressed asa percent of end-of-year total liabilities and end-of-year equity. Standard errors of parameter estimates are inparentheses. When no standard error is listed, the constraint that � is greater than zero is binding.
Table A3: Rankings of Banks using Estimated Subsidy as a Percent of LiabilitiesAverage Average
BANK 1992 1993 1994 1995 19961992-96 1992-95
First Bangkok City Bk 20.48% 15.30% 15.31% 13.71% 17.15% 16.39% 16.20%Union Bank of Bangkok 29.84% 11.82% 15.91% 6.59% 13.53% 15.54% 16.04%Bank of Asia 14.34% 12.92% 17.34% 18.31% 14.26% 15.44% 15.73%Bangkok Bk of Commerce 12.10% 31.42% 7.57% 10.44% 15.38% 15.38%Nakornthon Bank 16.53% 13.75% 19.38% 11.48% 15.25% 15.27% 15.28%Laem Thong Bank 17.74% 9.17% 14.73% 14.31% 13.58% 13.90% 13.99%Thai Military Bank 15.57% 11.46% 12.42% 9.49% 16.53% 13.09% 12.23%Krung Thai Bank 7.07% 8.54% 9.82% 7.67% 25.33% 11.68% 8.27%
Siam Commercial Bank 9.92% 13.29% 13.02% 7.49% 14.61% 11.66% 10.93%
Bank of Ayudhya 11.58% 11.25% 8.17% 6.39%18.30% 11.14% 9.35%
Bangkok Metropolitan Bk 12.78% 9.41% 11.61% 8.98% 12.77% 11.11% 10.70%
Siam City Bank 15.15% 9.08% 8.81% 7.34% 14.51% 10.98% 10.09%
Thai Danu Bank 7.72% 9.23% 7.69% 10.49% 15.08% 10.04% 8.78%
Thai Farmers Bank 9.59% 9.80% 9.63% 4.40% 10.70% 8.82% 8.36%
Bangkok Bank 9.47% 7.81% 13.28% 5.11% 8.05% 8.74% 8.92%
Deposit insurance values as a percent of liabilities are from Table A2 which used total liabilities as thestrike price. The banks listed in bold correspond to the “bad” banks of Table 3 and the “marginal” bankslisted in italics correspond to the banks of Table 2. For each year, the six banks with the highest insurancesubsidy values are listed in bold.
Table A4: Selected Indicators for "Marginal" BanksBangkok Bank 1992 1993 1994 1995 1996 1997asset growth 17.39% 15.50% 15.28% 11.62% 21.86%investments / assets 5.23% 5.27% 6.11% 6.27% 6.86% 4.76%net loans / assets 86.43% 84.55% 82.96% 82.92% 82.39% 72.95%

44
bad debt reserve / assets 2.26% 2.35% 2.43% 2.43% 2.59% 4.10%insurance / assets 7.87% 6.57% 10.87% 4.21% 6.57%q-ratio 2.01 2.96 2.56 2.36 1.81 -0.07Bank of Ayudhya 1992 1993 1994 1995 1996 1997asset growth 15.45% 42.49% 28.72% 12.53% 19.03%investments / assets 5.95% 5.18% 4.59% 4.89% 4.53% 3.54%net loans / assets 83.21% 86.59% 85.69% 83.21% 85.34% 81.61%bad debt reserve / assets 0.63% 0.61% 0.64% 0.75% 0.95% 2.22%insurance / assets 10.08% 9.75% 7.04% 5.67% 16.06%q-ratio 1.60 2.18 1.98 2.26 1.11 -0.02Krung Thai Bank 1992 1993 1994 1995 1996 1997asset growth 17.25% 30.97% 15.15% 11.71% 10.49%investments / assets 5.27% 4.29% 4.14% 4.31% 4.22% 2.95%net loans / assets 84.71% 84.12% 83.12% 85.97% 85.15% 84.69%bad debt reserve / assets 1.71% 2.03% 1.94% 2.02% 2.22% 4.39%insurance / assets 8.42% 7.82% 8.81% 6.59% 22.07%q-ratio 1.96 4.10 3.37 3.46 1.56 0.32Siam Commercial Bank 1992 1993 1994 1995 1996 1997asset growth 18.18% 13.10% 23.31% 19.38% 32.51%investments / assets 6.89% 6.07% 6.23% 6.17% 5.70% 5.30%net loans / assets 82.14% 80.36% 81.57% 83.35% 84.90% 78.08%bad debt reserve / assets 1.14% 1.14% 1.29% 1.24% 1.15% 2.53%insurance / assets 10.59% 8.98% 10.96% 6.29% 12.21%q-ratio 2.05 2.83 2.54 2.74 1.65 0.58Thai Danu Bank 1992 1993 1994 1995 1996 1997asset growth 23.70% 32.58% 28.74% 37.07% 8.92%investments / assets 5.14% 5.65% 7.79% 7.18% 6.86% 2.53%net loans / assets 83.50% 82.98% 82.43% 84.67% 83.88% 88.01%bad debt reserve / assets 1.05% 1.06% 1.14% 1.08% 1.18% 2.74%insurance / assets 5.54% 7.97% 6.28% 8.18% 12.12%q-ratio 1.77 2.23 2.05 1.58 0.95 0.52Thai Farmers Bank 1992 1993 1994 1995 1996 1997asset growth 21.45% 15.21% 15.03% 10.39% 23.12%investments / assets 7.46% 5.62% 5.48% 5.71% 6.63% 4.93%net loans / assets 82.57% 81.86% 85.13% 85.86% 85.43% 74.25%bad debt reserve / assets 0.99% 1.11% 1.19% 1.30% 1.53% 3.36%insurance / assets 8.12% 8.52% 8.25% 3.74% 9.13%q-ratio 2.08 2.60 2.97 2.67 1.67 0.84Thai Military Bank 1992 1993 1994 1995 1996 1997asset growth 26.08% 17.79% 25.08% 17.05% 16.50%investments / assets 5.99% 5.54% 4.71% 4.75% 4.77% 3.31%net loans / assets 84.33% 83.76% 85.29% 85.43% 84.82% 77.18%bad debt reserve / assets 1.81% 1.68% 2.43% 2.27% 1.84% 2.29%insurance / assets 13.26% 9.89% 10.68% 7.96% 10.09%q-ratio 1.89 2.81 2.41 2.12 1.83 0.31Data from Datastream.. The estimate of insurance as a percent of assets uses total liabilities (Table A2).The q-ratio measures the market capitalization of the bank per baht of paid-in capital.Table A5: Selected Indicators for "Bad" BanksBank of Asia 1992 1993 1994 1995 1996 1997asset growth 24.34% 19.47% 30.14% 16.55% 25.18%investments / assets 8.71% 6.18% 6.63% 13.23% 7.55% 5.08%net loans / assets 84.05% 83.62% 87.07% 80.91% 85.74% 84.20%bad debt reserve / assets 1.88% 1.74% 1.62% 1.38% 1.45% 2.19%

45
insurance / assets 12.09% 10.76% 13.84% 15.38% 11.23%q-ratio 1.93 4.09 3.06 2.89 1.38 0.54First Bangkok City Bank 1992 1993 1994 1995 1996 1997asset growth 20.33% 17.70% 21.12% 15.90% 14.07%investments / assets 4.34% 4.55% 4.39% 4.35% 4.19% 2.65%net loans / assets 83.86% 83.91% 86.42% 86.25% 88.72% 89.87%bad debt reserve / assets 1.18% 1.18% 1.29% 0.89% 0.91% 14.11%insurance / assets 17.63% 13.06% 12.69% 11.06% 14.04%q-ratio 2.28 2.55 1.91 1.31 0.84 -1.13Laem Thong Bank 1992 1993 1994 1995 1996 1997asset growth 33.61% 23.03% 36.59% 28.79% 24.29%investments / assets 4.41% 4.20% 4.33% 4.98% 3.92% 1.57%net loans / assets 76.06% 77.34% 76.98% 77.11% 82.33% 88.18%bad debt reserve / assets 2.78% 2.00% 2.08% 1.50% 0.99% 0.99%insurance / assets 16.14% 8.35% 12.94% 12.26% 11.58%q-ratio 1.05 2.80 2.26 1.23 1.32 0.83Nakornthon Bank 1992 1993 1994 1995 1996 1997asset growth 26.56% 21.46% 27.13% 13.37% 14.40%investments / assets 4.15% 4.61% 4.99% 6.37% 5.60% 4.56%net loans / assets 85.67% 84.66% 83.45% 83.34% 85.55% 80.60%bad debt reserve / assets 1.01% 0.99% 0.98% 0.88% 0.95% 2.25%insurance / assets 10.52% 14.78% 14.47% 9.41% 11.40%q-ratio 2.25 4.28 2.84 2.55 1.90 0.20Siam City Bank 1992 1993 1994 1995 1996 1997asset growth 25.18% 29.15% 24.09% 16.29% 12.82%investments / assets 5.78% 6.20% 6.69% 9.00% 7.41% 3.18%net loans / assets 83.60% 84.09% 84.17% 82.12% 81.51% 81.90%bad debt reserve / assets 1.60% 1.71% 2.48% 2.23% 2.63% 8.77%insurance / assets 13.12% 7.91% 7.64% 6.31% 12.35%q-ratio 2.47 2.83 2.94 2.13 0.95 -22.36
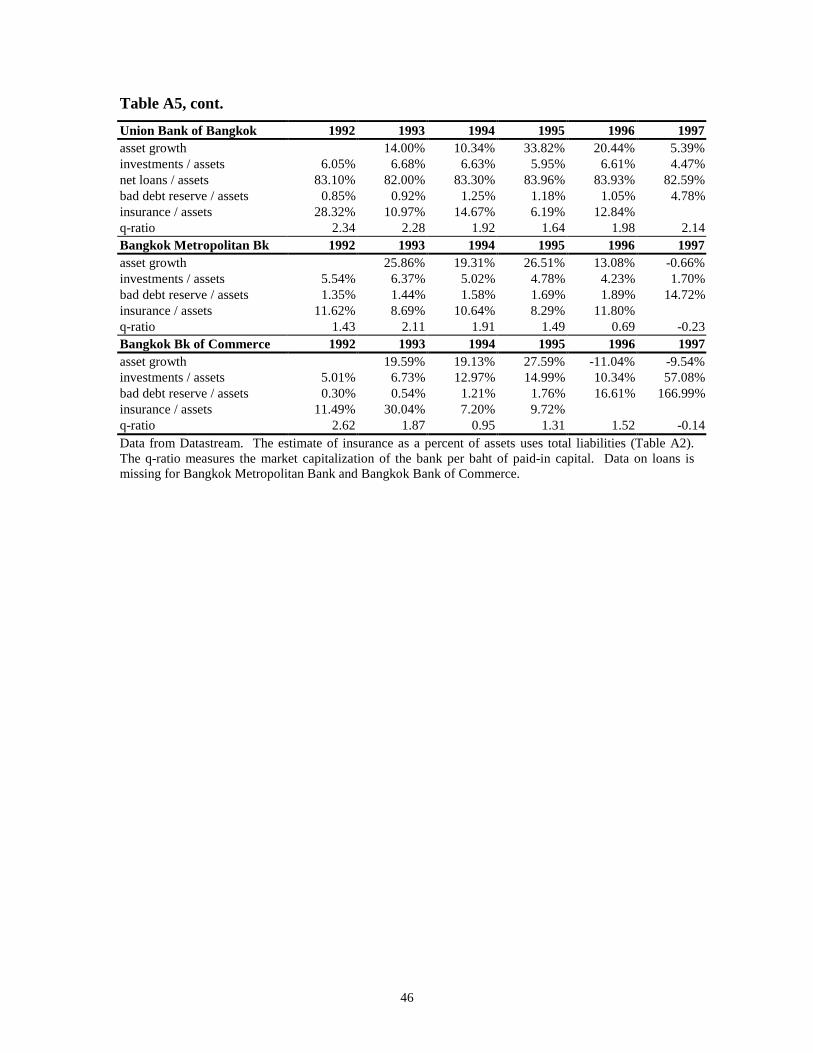
46
Table A5, cont.
Union Bank of Bangkok 1992 1993 1994 1995 1996 1997asset growth 14.00% 10.34% 33.82% 20.44% 5.39%investments / assets 6.05% 6.68% 6.63% 5.95% 6.61% 4.47%net loans / assets 83.10% 82.00% 83.30% 83.96% 83.93% 82.59%bad debt reserve / assets 0.85% 0.92% 1.25% 1.18% 1.05% 4.78%insurance / assets 28.32% 10.97% 14.67% 6.19% 12.84%q-ratio 2.34 2.28 1.92 1.64 1.98 2.14Bangkok Metropolitan Bk 1992 1993 1994 1995 1996 1997asset growth 25.86% 19.31% 26.51% 13.08% -0.66%investments / assets 5.54% 6.37% 5.02% 4.78% 4.23% 1.70%bad debt reserve / assets 1.35% 1.44% 1.58% 1.69% 1.89% 14.72%insurance / assets 11.62% 8.69% 10.64% 8.29% 11.80%q-ratio 1.43 2.11 1.91 1.49 0.69 -0.23Bangkok Bk of Commerce 1992 1993 1994 1995 1996 1997asset growth 19.59% 19.13% 27.59% -11.04% -9.54%investments / assets 5.01% 6.73% 12.97% 14.99% 10.34% 57.08%bad debt reserve / assets 0.30% 0.54% 1.21% 1.76% 16.61% 166.99%insurance / assets 11.49% 30.04% 7.20% 9.72%q-ratio 2.62 1.87 0.95 1.31 1.52 -0.14Data from Datastream. The estimate of insurance as a percent of assets uses total liabilities (Table A2).The q-ratio measures the market capitalization of the bank per baht of paid-in capital. Data on loans ismissing for Bangkok Metropolitan Bank and Bangkok Bank of Commerce.

47
Appendix B
CHRONOLOGY OF EVENTS 29
1/1992 – The Bank of Thailand instructs six banks (Bangkok Metropolitan Bank,Bangkok Bank of Commerce, Bank of Asia, Siam City Bank, and Union Bank ofBangkok) to increase their capital-asset-ratios to the BIS norm of 8 percent.
1/1992 – The Bank of Thailand instructs two banks (Bangkok Metropolitan Bank andUnion Bank of Bangkok) to increase their equity capital.
3/1992 – The National Assembly passes a bill removing loan rate ceilings.
3/1992 – The Securities Exchange Commission Bill is passed allowing for the creation ofa Securities Exchange Commission.
5/1992 – Protests of the installation of a non-elected military Prime Minister endsviolently with the deaths of numerous protestors.
9/1992- The government approves legislation to launch the offshore banking facility,Bangkok International Banking Facility (BIBF).
11/1992 – A Thai trader is arrested for stock manipulation after buying 20% of the sharesof Bangkok Bank of Commerce. The trader had accumulated a Bt 16 billion fundfor trading from loans from finance companies. Following the arrest of the trader,the Thai stock exchange falls dramatically. In response, the government makes Bt15 billion available to support the market. The government relaxes for one yearthe restriction that banks could only hold 20 percent of investments in stocks.
3/1993 – The Bank of Thailand intervenes in a finance company, First City Investments,which has a large number of nonperforming loans. The Rehabilitation andDevelopment Fund (FIDF) launched a rescue effort to save the company’sshareholders, which included the daughter of the former Democrat leader. Afterthe Fund took 80.5% of an issue of Bt 200 million in new shares, the companywas listed again on the Exchange in April 1993.
3/1993 – In order to encourage competition in the banking system, the Bank of Thailandawarded 47 licenses to banks to establish operations at the Bangkok InternationalBanking Facility (BIBF). Fifteen of these licenses go to domestic Thai banks.
4/1994 – The Bank of Thailand instructs Union Bank of Bangkok to withhold itsshareholders’ dividends in order to increase its provisions and paid-in capital.Bangkok Bank of Commerce, having trouble raising its debt provisions, asks toextend the deadline for such actions.
29 Information for this section comes from the Economist Intelligence Unit for material prior to 1996 andfrom the Dow Jones News Service after 1996, unless otherwise noted.

48
5/1994 – 40 finance companies apply to open the first-ever finance company branches.The branches must be located outside of Bangkok and are limited to lendingactivities.
6/1994 – The Bank of Thailand relaxes restrictions on commercial banks. Banks caninvest up to 20% of their capital in stocks and up to 10% in one company. Bankscan also freely open branches in areas with few banks. To better compete withbanks, finance companies can hold a higher proportion of their capital in foreigncurrencies.
9/1994 – Finance and security companies are being encouraged to split their businessesso that eventually finance companies will be able to upgrade to full bank status.
3/1995 – To spur competition, the government approves a plan to offer 5 newcommercial banking licenses for the foreign BIBF banks. The 14 foreign banksalready established in Thailand, as well as the foreign BIBF banks, will also beallowed to open 2 branches outside of Bangkok. The government also agrees, forthe first time in 20 years, to offer 5 new commercial banking licenses fordomestic banks.
6/1995 – The new government and new finance minister announce that operations ofnew banks would not start before April 1997, and plans for foreign banks to openbranches are also on hold.
10/1995 – The Bank of Thailand, the Finance Ministry, and the Stock Exchange ofThailand create a Bt 30 billion rescue fund to restructure margin credits owed bysmall investors.
1/1996 – Bids for the new foreign and domestic banking licenses are made. The centralbank plans to announce the winners in May.
5/1996 – Bank runs begin on Bangkok Bank of Commerce (BBC) and the Bank ofThailand injects Bt13 billion into BBC from the Rehabilitation Fund for a 32%stake. Details of the bank’s problems surface when the opposition in thegovernment release documents that indicate the bank had been insolvent for twoyears.
5/1996 – The central bank misses the deadline to announce the new banking licenses.
6/1996 – Bank of Thailand reveals that BBC’s questionable loans totaled Bt 77 billion.Top management borrowed 1/3 of the bank’s loans for a total of Bt 57 billion andpoliticians borrowed Bt 7 billion in loans with little collateral. One of theborrowers was the deputy finance minister.
7/1996 – Governor of Bank of Thailand resigns.
7/1996 – Plans to issue new banking licenses are on hold.

49
8/1996 – Moody’s downgrades the country’s short-term debt in response to Thailand’shigh exposure to short-term debt.
9/1996 – The Bank of Thailand announces that provisions for bad loans fell sharply in thefirst half of 1996 and that only Bangkok Bank had adequate provisions.
10/1996 – 7 BIBF banks were upgraded to full branch status.
2/1997 – Civil charges are dropped against the President of BBC when the Bank ofThailand “accidentally” allowed the statute of limitations to file charges to expire.
3/1997 – Three top administrators of the central bank are suspended.
3/1997 – For the first time, finance firms and credit fonciers will have to provideprovisions equal to 20%, and banks equal to 15% of nonperforming loans.
4/1997 – The Industrial Financial Corporation of Thailand assumes control of BBC.
5/1997 – The finance ministry launches another probe into the Bank of Thailand’shandling of BBC.
6/1997 – Finance One, Thailand’s largest finance company collapses and 15 otherfinance companies are suspended.
7/1997 – Under intense pressure, the Bank of Thailand abandons the peg of the Baht.
7/1997 – 42 more finance companies are suspended. Assets of 58 suspended financecompanies represent 1/5 of the finance sector total.
7/1997 – Governor of Bank of Thailand resigns.
8/1997 – Thailand and the IMF agree to a $17.2 billion bailout package.
9/1997 – The central bank increases the required capital-to-asset ratio for financecompanies to 8% from 7.5%.
10/1997 – The central bank raises the required capital-to-risk asset ratio to 8.5% forcommercial banks, with 5.5% in Tier I capital.
10/1997 – The government announces its financial restructuring package. The provisionsinclude:30
i) The creation of two agencies: the Financial Restructuring Agency (FRA) and theAsset Management Corporation (AMC) to supervise the rehabilitation orliquidation of the 58 finance companies and to restructure and sell off the assets ofthe closed finance companies, respectively.
30 This description of the October 14th packages uses material from EIU Country Report, 4th Quarter 1997.
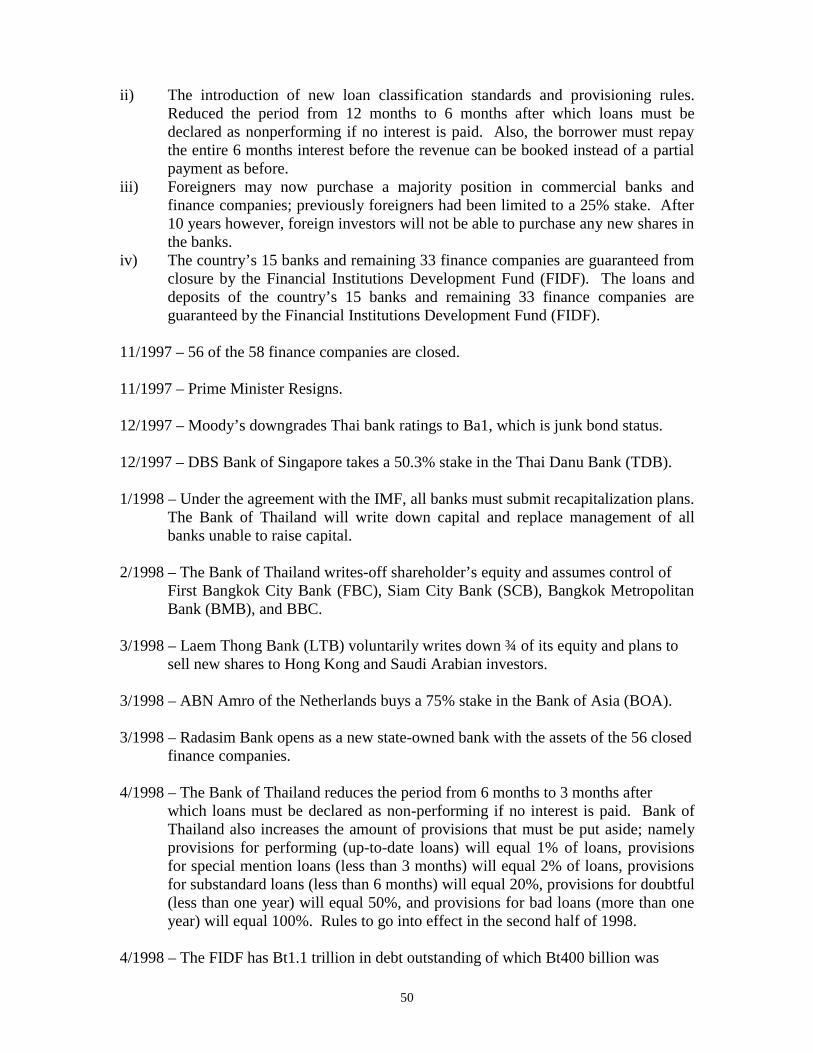
50
ii) The introduction of new loan classification standards and provisioning rules.Reduced the period from 12 months to 6 months after which loans must bedeclared as nonperforming if no interest is paid. Also, the borrower must repaythe entire 6 months interest before the revenue can be booked instead of a partialpayment as before.
iii) Foreigners may now purchase a majority position in commercial banks andfinance companies; previously foreigners had been limited to a 25% stake. After10 years however, foreign investors will not be able to purchase any new shares inthe banks.
iv) The country’s 15 banks and remaining 33 finance companies are guaranteed fromclosure by the Financial Institutions Development Fund (FIDF). The loans anddeposits of the country’s 15 banks and remaining 33 finance companies areguaranteed by the Financial Institutions Development Fund (FIDF).
11/1997 – 56 of the 58 finance companies are closed.
11/1997 – Prime Minister Resigns.
12/1997 – Moody’s downgrades Thai bank ratings to Ba1, which is junk bond status.
12/1997 – DBS Bank of Singapore takes a 50.3% stake in the Thai Danu Bank (TDB).
1/1998 – Under the agreement with the IMF, all banks must submit recapitalization plans.The Bank of Thailand will write down capital and replace management of allbanks unable to raise capital.
2/1998 – The Bank of Thailand writes-off shareholder’s equity and assumes control ofFirst Bangkok City Bank (FBC), Siam City Bank (SCB), Bangkok MetropolitanBank (BMB), and BBC.
3/1998 – Laem Thong Bank (LTB) voluntarily writes down ¾ of its equity and plans tosell new shares to Hong Kong and Saudi Arabian investors.
3/1998 – ABN Amro of the Netherlands buys a 75% stake in the Bank of Asia (BOA).
3/1998 – Radasim Bank opens as a new state-owned bank with the assets of the 56 closedfinance companies.
4/1998 – The Bank of Thailand reduces the period from 6 months to 3 months afterwhich loans must be declared as non-performing if no interest is paid. Bank ofThailand also increases the amount of provisions that must be put aside; namelyprovisions for performing (up-to-date loans) will equal 1% of loans, provisionsfor special mention loans (less than 3 months) will equal 2% of loans, provisionsfor substandard loans (less than 6 months) will equal 20%, provisions for doubtful(less than one year) will equal 50%, and provisions for bad loans (more than oneyear) will equal 100%. Rules to go into effect in the second half of 1998.
4/1998 – The FIDF has Bt1.1 trillion in debt outstanding of which Bt400 billion was

51
borrowed from short-term money markets.
4/1998 – Thai Farmers Bank (TFB) issues new shares giving foreign investors 49% of itsequity.
4/1998 – Bangkok Bank (BBL) issues new shares giving foreign buyers a 40% stake inthe bank.
5/1998 – Executive decrees are announced and include bringing the FIDF under thecontrol of the finance ministry to allow it to borrow long term. The FinanceMinistry is expected to issue $3-5 billion in bonds.
5/1998 – Governor of the Bank of Thailand is replaced.
5/1998 – The first insurance company is closed.
5/1998 – Bank of Thailand takes control of another 5 finance companies.
8/1998 – Bank of Thailand writes-off shareholder’s equity and assumes control of UnionBank of Bangkok (UBB) and Laem Thong Bank (LTB) and 5 more financecompanies. The Governor of the Bank of Thailand announces that the institutionsthe central bank intervened in had loans outstanding from the FIDF amounting toover twice shareholders’ equity.
8/1998 – The government announces a $7.5 billion financial system rehabilitation plan.This included the passage of four decrees by Thailand’s Lower House toimplement the plan. The decrees:
i) Allow the Finance Ministry to issue Bt500 billion in domestic bonds to swap forpreferred shares or subordinated bonds of commercial banks and financecompanies.
ii) Amend the 1962 Commercial Banks Act to facilitate mergers between banks bypreventing depositors or creditors from blocking the transfer of assets betweenbanks.
iii) Amend the 1979 Finance Companies Act to facilitate mergers between financecompanies.
iv) Allow commercial banks to set up asset management companies to administerproblem loans.
Given these new powers the government’s plan includes:
i) For the six strongest banks (BBL, KTB, TFB, SBB, BAY, and TMB), they will beable to swap preferred shares and bad loans for government bonds. However, ifbanks chose this option they must increase provisions to 100% of nonperformingloans calculated on a three-month basis. Otherwise, if these banks canrecapitalize on their own, the 100% provisioning will be phased in throughJanuary 2000.
ii) Gives foreign investors who invest in the banking system a five-year guaranteedminimum yield. The Thai Finance Minister announced that the restructuring plan

52
requires roughly $5 billion in new private foreign capital. The government hopesto find buyers for NTB, BMB, and SCB.
iii) The government announced the forced mergers of previously nationalized FBCwith the government-owned Krung Thai Bank (KTB). Also, the good assets ofBBC will be merged with KTB. UBB, the 5 finance companies suspended inMay 1998, the 5 finance companies suspended in August 1998, and the tworemaining suspended finance companies from July 1997, will be merged withKrungthai Thanakit, the government-owned finance company. LTB will bemerged with the new state-owned Radhanasin Bank. BBC will be turned into anasset management company and will cease to exist. The government plans torecapitalize BMB and SCB and sell them to the private sector.
9/1998 – Problem loans of the Thai financial system amount to Bt 1.72 trillion.
9/1998 – Siam Commercial Bank announces it will take part in the government’srecapitalization plan.
9/1998 – Nakornthon Bank signs a “memorandum of understanding” to sell amajority stake in the bank.
9/1998 – Krung Thai Bank announces it will raise 18.5 billion new shares at Bt 10 ashare to prepare for the merger with First Bangkok City Bank and Bangkok Bankof Commerce. The FIDF will buy the shares.
10/1998 – The Finance Ministry issues Bt 201 billion out of the approved Bt 500billion to replenish the FIDF and recapitalize the remaining banks.
10/1998 – The World Bank announces it will issue another $400 million tranche out ofa $1.5 billion package in January 1999. The loan will be used to improve thecentral bank supervision of financial institutions and to set up a deposit insuranceagency.
10/1998 – The central bank Governor announces that problem loans of the entirefinancial system are expected to be at least 40% of total loans.

53
Appendix C
RESOLUTION OF CRISIS FOR THAI BANKS
Bangkok BankIn April 1998, BBL sold 25 million new shares to foreign buyers to recapitalize the bank.The Bt 2.32 billion share issue represented 40% of the bank’s equity. BBL reportedNPLs at 22.6% of total loans for end-1997 using a 3-month past due standard.
Bangkok Bank of CommerceIn May 1996, the Bank of Thailand injected Bt 13 billion from the Rehabilitation Fundinto the bank for a 32% stake. In February 1998, the Bank of Thailand wrote-offshareholders equity and assumed control of the bank. In August 1998, the good loansand deposits of BBC were merged with KTB. BBC left with only bad assets, was madean asset management corporation and ceased to exist as a bank.
Bangkok Metropolitan BankIn February 1998, government wrote-down shareholders’ equity making the banks’ Bt 10par-value shares worth Bt.01 a share. The Tejapaibul family’s holdings fell by Bt 11.011billion to Bt 11 million giving the Bank of Thailand 99% of the bank. In August 1998,the government announced it plans to privatize BMB.
Bank of AsiaIn April 1998, ABN AMRO Holdings NV of the Netherlands purchased a 75% stake inBank of Asia by injecting $187 million in capital.
Bank of AyudhyaIf the Bank of Ayudhya cannot raise new capital, the bank will have to participate in thegovernment’s August 1998 recapitalization plan.
First Bangkok City BankIn February 1988 the Bank of Thailand took over and wrote down most of the equity ofFirst Bangkok City Bank giving the central bank 99.9% ownership. The FIDF injectedBt 32 billion into the bank and wrote down capital from Bt 10 per share to Bt 0.01 pershare. This action raised the capital adequacy of FBC to 10%. In August 1998, the Bankof Thailand announced FBC would be merged with Krung Thai Bank.
Krung Thai BankKTB is the government owned bank. In December 1997, it is announced that KTB willissue notes to cover the 42 finance companies closed in August 1997. In September1998, KTB announced it will sell 18.5 billion new shares at Bt 10 a share to the FIDF.The bank is participating in the government’s recapitalization plan in order to ready itselffor the acquisition of First Bangkok City Bank and the good assets of Bangkok Bank ofCommerce.
Laem Thong BankIn February 1998, LTB shareholders voluntarily wrote down ¾ of the bank’s equity andplanned to raise Bt 6 billion in fresh capital overseas. After being unable to raise new

54
capital, the Bank of Thailand assumed control of LTB in August 1998. LTB’s Bt 10 par-value shares were written down to Bt 0.01 a share. The FIDF took over LTB byswapping its loans for equity in LTB. Later in August, it was announced that LTB wouldbe merged with the state-owned Radhanasin Bank.
Nakornthon BankStandard Chartered Bank and Bank of Nova Scotia are interested in purchasing acontrolling stake in NTB. In September 1998, NTB signed a “memorandum ofunderstanding” to sell a majority stake in the bank.
Siam City BankIn February 1998, the Bank of Thailand took over Siam City Bank and wrote off most ofits capital. SCB’s paid up capital of Bt 6.16 billion was decreased to Bt 1 per share fromBt 10 par-value shares. The FIDF converted its loans to SCB to equity and bought all ofthe shares in a Bt 20 billion capital increase. This raised the capital adequacy of the bankto 10% and gave the Bank of Thailand 97% ownership of the bank. In August 1998, thegovernment announced it plans to privatize bank.
Siam Commercial BankThe largest shareholder of SBB is the Thai royal family’s Crown Property Bureau. SBBannounced its NPLs equaled 14.7% of total loans at end-1997 using a 3-month standard.SBB is likely to participate in the government’s August 1998 recapitalization program.
Union Bank of BangkokThe Bank of Thailand wrote-down shareholders equity from Bt 10 par-value shares to Bt0.01 a share and assumed control of UBB in August 1998. Later in August, UBB wasmerged with Krungthai Thanakit, the state-owned finance company.
Thai Danu BankIn December 1997, the Development Bank of Singapore Ltd. announced it wouldpurchase a 50.3% stake in TDB. TDB announced that its NPLs equaled 26.7% of totalloans at end-June 1998.
Thai Farmers BankBy April 1998, TFB had sold new equity to foreigners giving them 49% ownership of thebank. In May 1998, the bank announced its NPL at end-1997 were 22.2% of total loansusing a three-month standard.
Thai Military BankThe Thai military is the largest shareholder in TMB. In October 1998, TMB announcedits plan to issue Bt 6 billion in new equity to raise the bank’s capital-to-risk-assets ratio to10.5%. If the bank cannot complete the sale by June 1999, they will participate in thegovernment’s August 1998 recapitalization plan.