Embed Size (px)
Citation preview

Chapter 20
Option Valuation and Strategies

Portfolio 1– Buy a call option – Write a put option (same x and t as the call
option) What is the potential payoff of this portfolio?
St < =X St > X
Payoff of call owned 0 St - X
Payoff of put written - (X - St) 0
Total St - X St - X

Portfolio 2
– Buy the stock – Borrow the present value x
What is the potential payoff of this portfolio? St <= X St > X
Payoff of stock St St
Payoff of put written - X - X Total St - X St - X

Portfolio 1 and 2 have identical payoffs so they must be worth the same amount or else there would be an arbitrage opportunity.
C - P = S - X / (1 + rf)t
This is the put-call parity relationship

Put-Call Parity Arbitrage
Stock price = 110 Call price = $17 (T = 6 months, and X = 105) Put Price = $? (T = 6 months, and X =$105) rf = 5% for a six-month period What is the equilibrium value of the put option? Suppose the WSJ states that the above put is selling for $5,
is there an arbitrage opportunity? If so, then create a pure arbitrage.
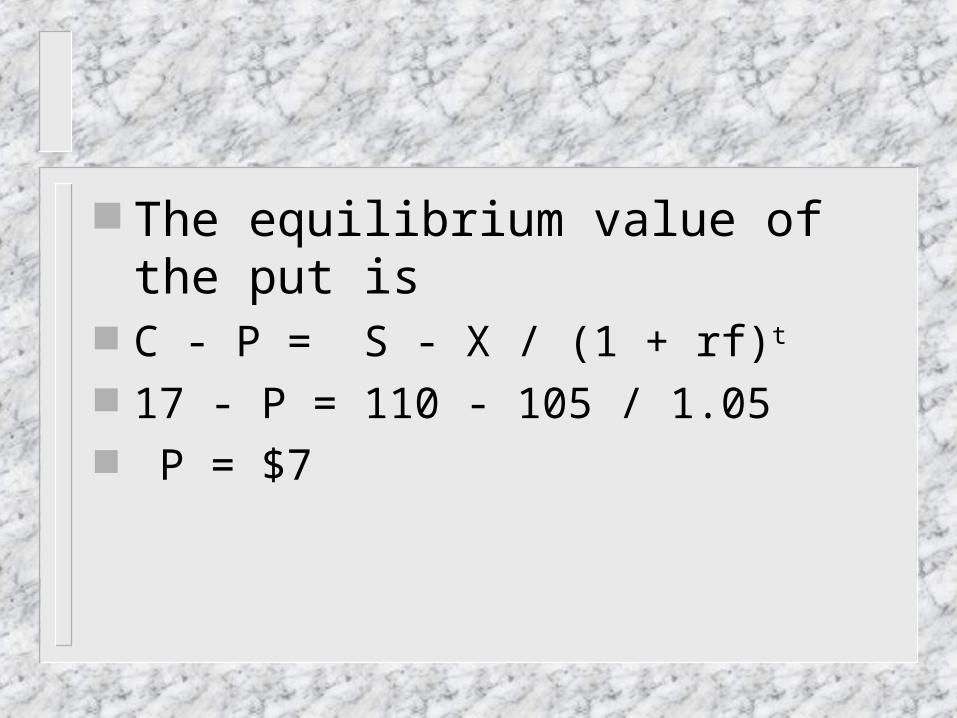
The equilibrium value of the put is C - P = S - X / (1 + rf)t
17 - P = 110 - 105 / 1.05 P = $7

If the put is selling for $5 then an arbitrage opportunity exists.
C - P = S - X / (1 + rf)t
17 - 5 = 110 - 105 / 1.05 12 > 10 Buy low sell high. So you would buy the right hand side of the
equation and sell the left hand side.

Buy the Stock and borrow the present value of the exercise price
Sell the call and buy the put option To be a pure arbitrage you must show that
there was zero net investment and that there is a guaranteed profit.

Cash flow in six months Position Initial CF St <= 105 St > 105
Buy Stock -110 St St
Borrow PV X +100 - 105 - 105 Sell Call +17 0 -(St - X)
Buy Put - 5 105 - St 0
Total 2 0 0

Black Scholes Option Pricing Model
Vo = Ps x F (d1) - (Pe / ert ) x F (d2)
d1 = ln (Ps / Pe) + { r + ( 2 / 2) } T
(T1/2)
d2 = d1 - (T1/2)
Example of Black Scholes Model
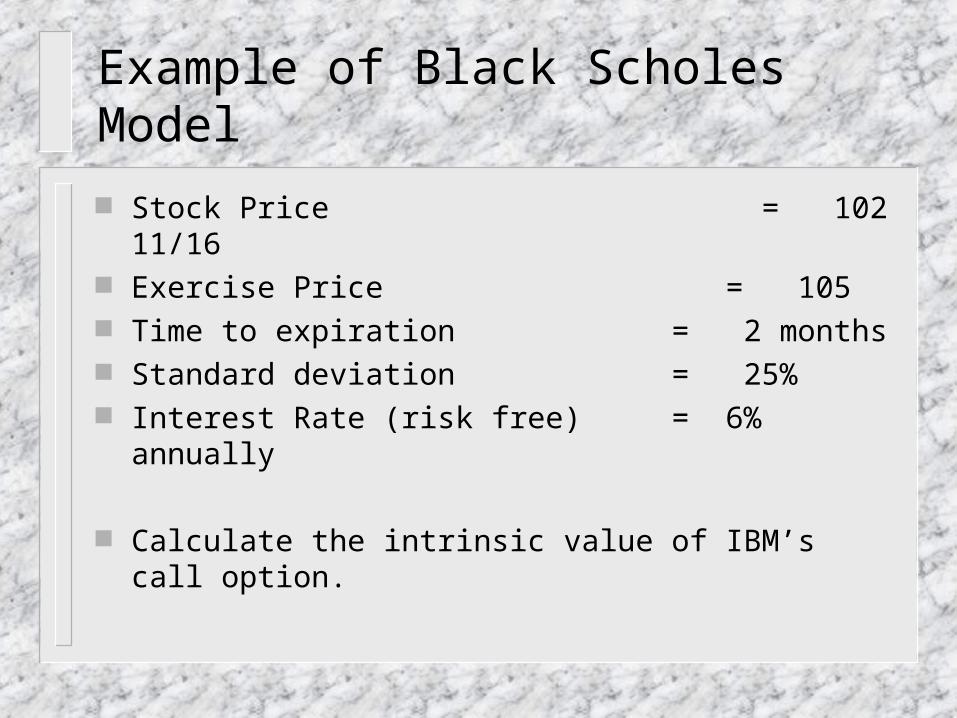
Stock Price = 102 11/16 Exercise Price = 105 Time to expiration = 2 months Standard deviation = 25% Interest Rate (risk free) = 6% annually
Calculate the intrinsic value of IBM’s call option.

Solution to B-S Problem
d1 = ln (102.69 / 105) + { .06 + ( .252 / 2) } .17 .25 (.171/2)d1 = -.065d2 = -.065 - .25 (.171/2)
d2 = -.1681
Vo = 102.69 x F (-.07) - (105 / e(.06)(.17) ) x F (-.17)V0 = 102.69 x .4721 - 103.93 x .4325
V0 = $3.53

The Hedge Ratio
The ratio of the change in the price of a call option to the change in the price of the stock.
The hedge ratio is also called the options delta. Is the delta positive or negative for a call option? Is the delta positive or negative for a put option?

How do you calculate the hedge ratio?
The numerical value of F(d1) is the hedge ratio.
d1 = ln (Ps / Pe) + { r + ( 2 / 2) } T
(T1/2)
Look in the cumulative normal distribution table to find F(d1).

Example of Hedge
In our example F(d1) = .4721, this means that the price of the option will rise $.47 for every $1 increase in the price of the stock. Thus if the investor owns 100 shares of stock and has written 2.12 calls, a $1 increase in the stock will generate a $1 decrease in the option. The gain in one position is exactly offset by the loss in the other position.
Example of Hedge (cont.)
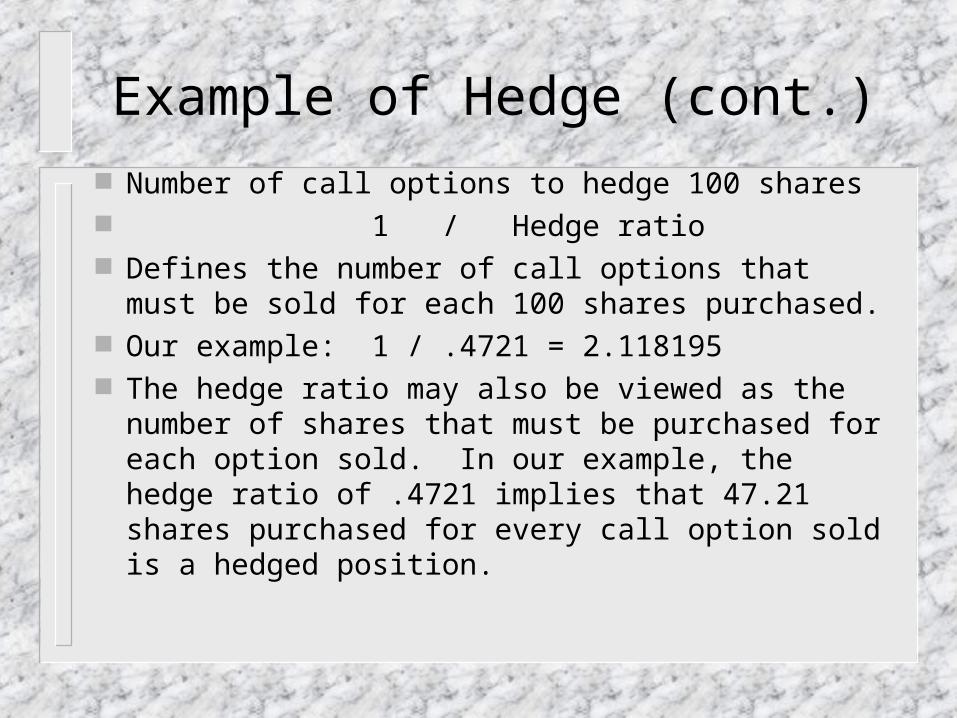
Number of call options to hedge 100 shares 1 / Hedge ratio Defines the number of call options that must be sold
for each 100 shares purchased. Our example: 1 / .4721 = 2.118195 The hedge ratio may also be viewed as the number of
shares that must be purchased for each option sold. In our example, the hedge ratio of .4721 implies that 47.21 shares purchased for every call option sold is a hedged position.

Additional Option Strategies
Covered Put Protective Put Straddle Bull Spread Bear Spread Butterfly Spread

Covered Put
Short the stock and sell the put Profit or Loss
Price of Stock

Protective Call
Short the stock and buy the call option Profit or Loss
Price of Stock

The Long Straddle
Purchase of a put and a call with the same exercise price
and expiration date. Profit or Loss
Price of Stock

The Short Straddle
Write a put and a call with the same exercise price and
expiration date. Profit or Loss
Price of Stock

The Bull Spread
Purchase the call option with the lower X and sell the call
option with the higher X Profit or Loss
Price of Stock
-$3.5
$1.5
The Bear Spread
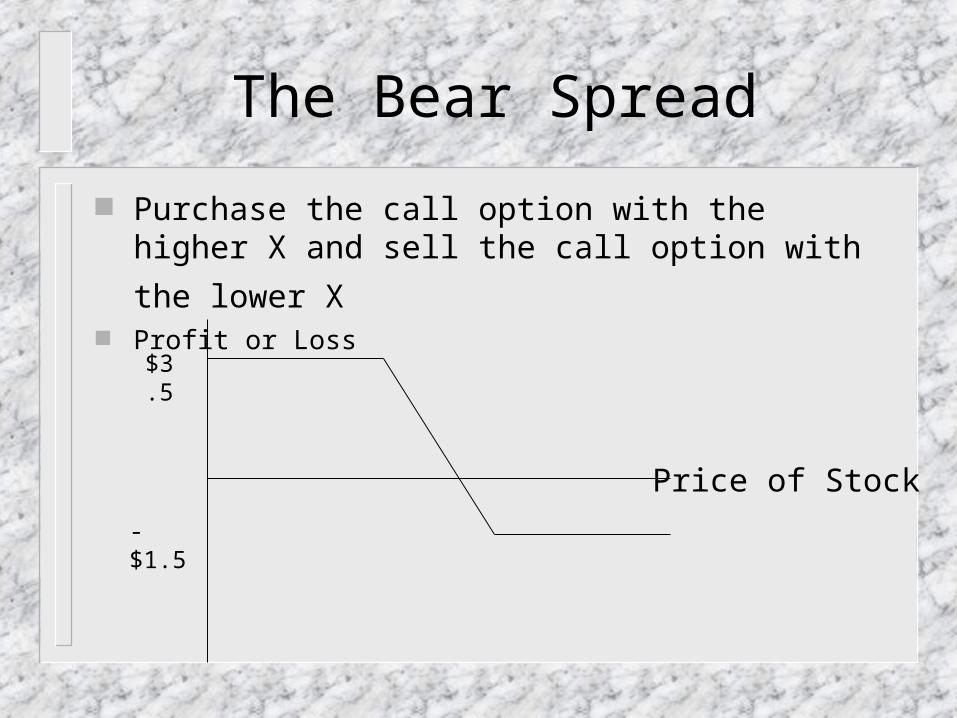
Purchase the call option with the higher X and sell the call
option with the lower X Profit or Loss
Price of Stock
$3.5
-$1.5

The Butterfly Spread
Involves three option at different strike prices. Example buy two of the options with the middle strike price and sell the options with the higher and lower strike prices
Profit or Loss
Price of Stock
$1
-$4
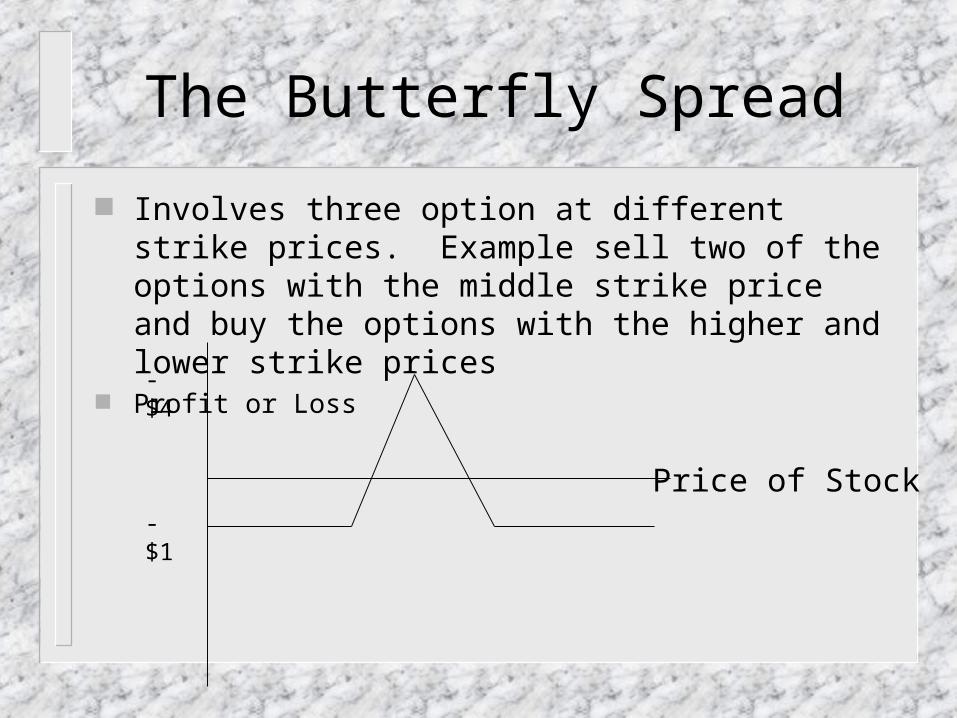
The Butterfly Spread
Involves three option at different strike prices. Example sell two of the options with the middle strike price and buy the options with the higher and lower strike prices
Profit or Loss
Price of Stock-$1
-$4