Embed Size (px)
Citation preview

Low-back pain is a highly prevalent condi-tion associated with work absenteeism,disability and large health care costs;
however, there is still disagreement about prog-nosis. For example, the European guidelines forthe management of low-back pain states that90% of patients with acute low-back painrecover in six weeks.1 In contrast, some well-conducted cohort studies show a less optimisticpicture, providing short-term estimates of recov-ery ranging from 39% to 76%.2,3 This wide rangeof estimates of prognosis is likely explained bydifferences in cohorts and definitions used todefine the onset or conclusion of an episode oflow-back pain. Because very different definitionsof recovery are often used, it is difficult to obtainpooled estimates of recovery rates. Instead, itmight be more useful to describe the clinicalcourse of low-back pain in terms of expectedchanges in pain or disability over time.
A recent systematic review4 summarized theprognostic factors for persistent disabling low-back pain but did not describe the clinical course.The only meta-analysis to investigate the clinicalcourse of acute low-back pain was published in2003.5 This review concluded that both pain anddisability improve rapidly within weeks (meanreduction of 58% of initial scores in the firstmonth) and recurrences are common. A limita-tion of this review was that, although it retrieved15 studies, only 5 were cohort studies; theremaining 10 were randomized controlled trials.Randomized trials often have narrow inclusioncriteria and low rates of participation, whichmake them less suitable for inferring prognosis.The best design to describe the prognosis of acondition is a cohort study enrolling a representa-tive sample of incident cases (i.e., by includingpatients at a similar early point in their condi-tion).6,7 Such studies are known as inception
The prognosis of acute and persistent low-back pain: a meta-analysis
Luciola da C. Menezes Costa PhD, Christopher G. Maher PhD, Mark J. Hancock PhD, James H. McAuley PhD,Robert D. Herbert PhD, Leonardo O.P. Costa PhD
Competing interests:Christopher Maher hasreceived grant funding fromthe National Health andMedical Research Councilof Australia for the study ofthe prognosis of back pain.He has also receivedsupplementary fundingfrom GlaxoSmithKline foran investigator-initiated trialof paracetamol for acutelow-back pain. JamesMcAuley has receivedsalary funding from theNational Health andMedical Research Councilof Australia and hasreceived funding from theGeorge Institute for GlobalHealth for attendingconferences. No competinginterests declared forLuciola Costa, RobertHerbert, Mark Hancock andLeonardo Costa.
This article has been peerreviewed.
Correspondence to: Christopher G. Maher,[email protected]
CMAJ 2012. DOI:10.1503/cmaj.111271
ResearchCMAJ
Background: Although low-back pain is ahighly prevalent condition, its clinical courseremains uncertain. Our main objective was tosystematically review the literature on the clini-cal course of pain and disability in patientswith acute and persistent low-back pain. Oursecondary objective was to investigate whetherpain and disability have similar courses.
Methods: We performed a meta-analysis ofinception cohort studies. We identified eligiblestudies by searching MEDLINE, Embase andCINAHL. We included prospective studies thatenrolled an episode-inception cohort ofpatients with acute or persistent low-back painand that measured pain, disability or recovery.Two independent reviewers extracted data andassessed methodologic quality. We used mixedmodels to determine pooled estimates of painand disability over time.
Results: Data from 33 discrete cohorts (11 166participants) were included in the review. The
variance-weighted mean pain score (out of amaximum score of 100) was 52 (95% CI 48–57)at baseline, 23 (95% CI 21–25) at 6 weeks, 12(95% CI 9–15) at 26 weeks and 6 (95% CI 3–10) at 52 weeks after the onset of pain forcohorts with acute pain. Among cohorts withpersistent pain, the variance-weighted meanpain score (out of 100) was 51 (95% CI 44–59)at baseline, 33 (95% CI 29–38) at 6 weeks, 26(95% CI 20–33) at 26 weeks and 23 (95% CI16–30) at 52 weeks after the onset of pain.The course of disability outcomes was similarto the time course of pain outcomes in theacute pain cohorts, but the pain outcomeswere slightly worse than disability outcomesin the persistent pain cohorts.
Interpretation: Patients who presented withacute or persistent low-back pain improvedmarkedly in the first six weeks. After that timeimprovement slowed. Low to moderate levels ofpain and disability were still present at one year,especially in the cohorts with persistent pain.
Abstract
© 2012 Canadian Medical Association or its licensors CMAJ 1
See related commentary by Buchbinder and Underwood at www.cmaj.ca/lookup/doi/10.1503/cmaj.120627
Early release, published at www.cmaj.ca on May 14, 2012. Subject to revision.
cohort studies. To the best of our knowledge, noreview has yet investigated the clinical course ofpain and disability among people with persistentlow-back pain (subacute and chronic). Thus, theprognosis for people with persistent low-backpain is still uncertain.
The aim of our study was to systematicallyreview the clinical course of pain and disabilityin patients with acute and persistent low-backpain. We included only inception cohort studies.Our second aim was to investigate whether painand disability have similar courses.
Methods
Study selectionWe searched MEDLINE, CINAHL and Embasedatabases from 1950 to Nov. 22, 2011, to identifypotentially eligible studies. The search strategyused the study population terms suggested by theCochrane Back Review Group together with astrategy for searching MEDLINE for prognosisstudies. The terms used to identify the study popu-lation included “low-back pain,” “back pain” or“backache.” Terms used to identify prognosis stud-ies included “inception,” “survival,” “life tables,”“log rank,” “prospective” and “follow-up studies.”The complete search strategies from all databasesare included in Appendix 1 (available at www.cmaj .ca/lookup /suppl /doi: 10.1503 /cmaj . 111271 /-/DC1). Additionally, we performed a comprehen-sive examination of reference lists from eligiblestudies. We included only studies published inpeer-reviewed journals. There were no language orgeographic restrictions.
Two reviewers screened the titles andabstracts of each citation (Luciola Costa and LeoCosta). For each potentially eligible study, theseauthors obtained the full article and assessedwhether the study fulfilled the inclusion criteria.In cases of disagreement, a third reviewer (C.M.or M.H.) was consulted and a decision was madeby consensus. We defined low-back pain as painor discomfort localized below the costal marginsand above the inferior gluteal folds, with or with-out leg pain. Nonspecific low-back pain, themost common form of low-back pain, is a classi-fication based on the exclusion of patients with aspecific cause for their low-back pain (e.g., frac-ture, infection, cancer). It is sometimes calledlow-back pain of unknown origin.1,8
We included studies that were prospectivecohort studies and that included a well-definedinception cohort (episode inception) of partici-pants with low-back pain. Specifically, weincluded studies that had (a) acute and subacutelow-back pain cohorts that included participantswith nonspecific low-back pain of less than 12
weeks duration and/or (b) persistent low-backpain cohorts that included participants with non-specific low-back pain for more than 12 weeksbut less than 12 months. For inclusion, the stud-ies had to report pain or disability outcomes or aglobal measure of recovery.
We excluded studies that included patients withspecific diseases such as tumours, fractures, arthri-tis or cauda equina syndrome (but not sciatica).
Data extractionFor each cohort, the following summary datawere obtained: sample source, sample size,inception time, outcomes (pain, disability andrecovery rates) and duration of follow-up. Con-tinuous outcomes (pain and disability) were con-verted to a common 0–100 scale. Recovery rateswere based on the definitions used in the individ-ual articles. If there were insufficient data pre-sented in a study report, we contacted theauthors to request these data.
We classified the study cohorts as acute low-back pain cohorts or persistent low-back paincohorts. This classification was based on themean or median duration of pain at study entry.If the cohort had a mean or median duration ofpain at study entry of less than six weeks, it wasclassified as an acute low-back pain cohort. If thestudy had mean or median duration of pain atstudy entry for greater than or equal to sixweeks, the study cohort was classified as a per-sistent low-back pain cohort. When means ormedians were not available, we used the mid-point of the range of the inclusion criteria forpain duration. We also extracted data with regardto prognostic factors from all cohorts. Becauseof the high variability of prognostic factorsinvestigated by each study and the different sta-tistical approaches used, we extracted data forunivariate analyses only.
Quality assessmentWe rated the quality of the studies using an adap-tation of the methodologic criteria suggested byAltman.6 These criteria relate to sampling (2items), completeness of follow-up (2 items) anddescription of prognostic outcomes (1 item). Thesame criteria have been used in previous system-atic reviews on the prognosis of acute low-backpain5 and whiplash.9
Statistical analysisWe conducted a meta-analysis using the pain anddisability outcome data. Pain and disability weremodelled as a function of time. Time was treatedin two ways. The first approach used the time ofstudy entry as the reference time. We called this“inception time uncorrected.” The second
Research
2 CMAJ

approach transformed the time data from eachstudy by adding the mean or median inceptiontime. We called this “inception time corrected.”Inception time uncorrected analyses provideprognoses that would apply at the time of studyentry, whereas inception time corrected analysesprovide prognoses that would apply at the timeof onset of acute or persistent low-back pain.
We obtained pooled estimates of the timecourse of pain and disability using linear mixedmodels. The mixed models included a randomstudy-specific intercept to account for the depen-dence of repeated observations within studies.Each study was assigned a weight equal to theinverse of the mean variance of the estimatesfrom that study. We modelled time as a continu-ous variable. Both pain and disability declinedlinearly with log time, so all analyses used log
time as an independent variable. The referencetime was considered to be day 1.
The regression model was used to obtainpooled point and interval estimates of outcomesat baseline and at 6, 26 and 52 weeks. Theexception was that estimates of baseline valueswere not obtained for analyses of inception timecorrected because this involved extrapolating thefitted curves substantially beyond the range ofthe data. To test if pain and disability had a simi-lar clinical course, we combined the pain anddisability data and added to the model an addi-tional covariate coded 0 for pain outcomes or 1for disability outcomes.
Results
We screened 28 613 potentially relevant studies
Research
CMAJ 3
Unique records screenedn = 23 514
Excluded n = 23 216 • Not related to low back pain, • RCTs • Mixed population (e.g. neck and back pain) • Ineligible designs (e.g., case-control studies, cross-sectional studies, systematic reviews) • Conference proceedings
Full-text articles assessed for eligibility n = 298
Excluded n = 255 • Not a inception cohort • No data related to prognosis • Reported only prognostic factors
Included articles n = 43
Unique cohorts n = 33
Included in the meta-analysis
n = 24
Reported recovery rates (descriptive analysis only)
n = 19
Records identifiedn = 28 613
Excluded • Duplicate record n = 5 099
Figure 1: Selection of studies for inclusion in the systematic review. RCT = randomized controlled trials.
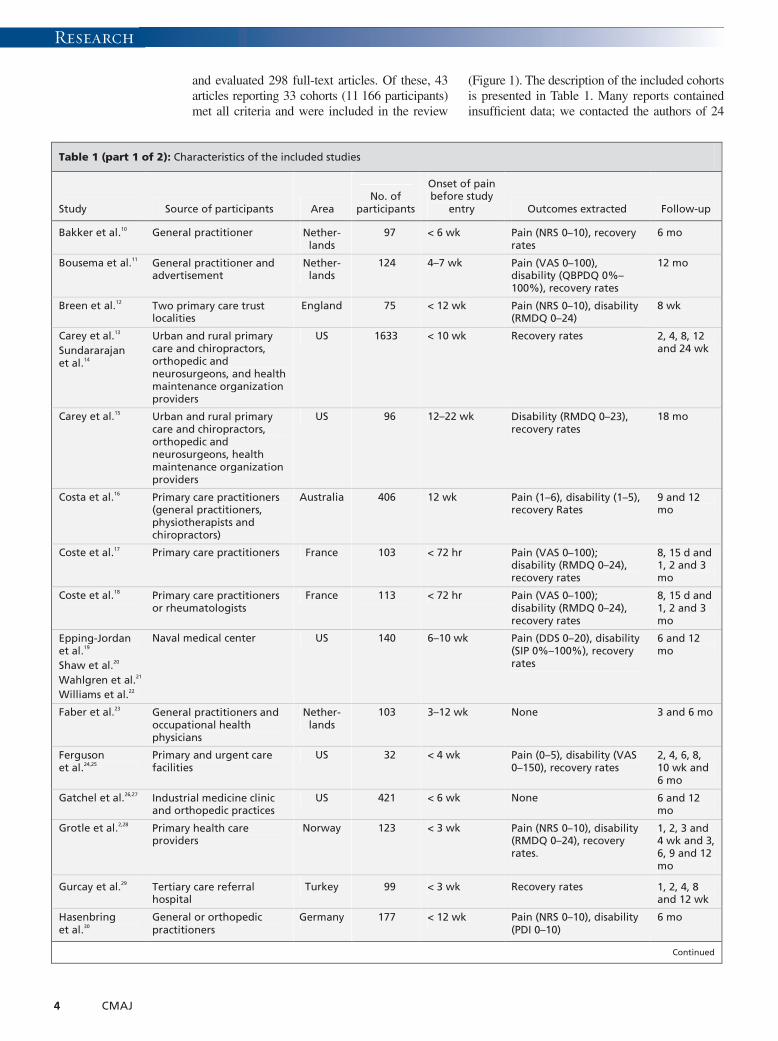
and evaluated 298 full-text articles. Of these, 43articles reporting 33 cohorts (11 166 participants)met all criteria and were included in the review
(Figure 1). The description of the included cohortsis presented in Table 1. Many reports containedinsufficient data; we contacted the authors of 24
Research
4 CMAJ
Table 1 (part 1 of 2): Characteristics of the included studies
Study Source of participants Area No. of
participants
Onset of pain before study
entry Outcomes extracted Follow-up
Bakker et al.10 General practitioner Nether-lands
97 < 6 wk Pain (NRS 0–10), recovery rates
6 mo
Bousema et al.11 General practitioner and advertisement
Nether-lands
124 4–7 wk Pain (VAS 0–100), disability (QBPDQ 0%–100%), recovery rates
12 mo
Breen et al.12 Two primary care trust localities
England 75 < 12 wk Pain (NRS 0–10), disability (RMDQ 0–24)
8 wk
Carey et al.13
Sundararajan et al.14
Urban and rural primary care and chiropractors, orthopedic and neurosurgeons, and health maintenance organization providers
US 1633 < 10 wk Recovery rates 2, 4, 8, 12 and 24 wk
Carey et al.15 Urban and rural primary care and chiropractors, orthopedic and neurosurgeons, health maintenance organization providers
US 96 12–22 wk Disability (RMDQ 0–23), recovery rates
18 mo
Costa et al.16 Primary care practitioners (general practitioners, physiotherapists and chiropractors)
Australia 406 12 wk Pain (1–6), disability (1–5), recovery Rates
9 and 12 mo
Coste et al.17 Primary care practitioners France 103 < 72 hr Pain (VAS 0–100); disability (RMDQ 0–24), recovery rates
8, 15 d and 1, 2 and 3 mo
Coste et al.18 Primary care practitioners or rheumatologists
France 113 < 72 hr Pain (VAS 0–100); disability (RMDQ 0–24), recovery rates
8, 15 d and 1, 2 and 3 mo
Epping-Jordan et al.19
Shaw et al.20
Wahlgren et al.21
Williams et al.22
Naval medical center US 140 6–10 wk Pain (DDS 0–20), disability (SIP 0%–100%), recovery rates
6 and 12 mo
Faber et al.23 General practitioners and occupational health physicians
Nether-lands
103 3–12 wk None 3 and 6 mo
Ferguson et al.24,25
Primary and urgent care facilities
US 32 < 4 wk Pain (0–5), disability (VAS 0–150), recovery rates
2, 4, 6, 8, 10 wk and 6 mo
Gatchel et al.26,27 Industrial medicine clinic and orthopedic practices
US 421 < 6 wk None 6 and 12 mo
Grotle et al.2,28 Primary health care providers
Norway 123 < 3 wk Pain (NRS 0–10), disability (RMDQ 0–24), recovery rates.
1, 2, 3 and 4 wk and 3, 6, 9 and 12 mo
Gurcay et al.29 Tertiary care referral hospital
Turkey 99 < 3 wk Recovery rates 1, 2, 4, 8 and 12 wk
Hasenbring et al.30
General or orthopedic practitioners
Germany 177 < 12 wk Pain (NRS 0–10), disability (PDI 0–10)
6 mo
Continued

studies2,3,11-23,26-35,37-39,42-44,46,49 and received additionaldata for 18 cohorts.2,3,11–19,21,22,28,30,33,35,38,39,42-44,46,49 Ourpooled analyses are based on summary data from24 cohorts (4994 participants).
Methodologic qualityAlmost all of the studies (97%) provided suffi-
cient definition of the sample: 17 (51.5%) studiesexplicitly described methods for assembling arepresentative sample. In total, 24 (72.7%)cohorts had a follow-up of at least 80%, and87.9% of cohorts had a follow-up for at least oneprognosis outcome at three months or longer(Table 2).
Research
CMAJ 5
Table 1 (part 2 of 2): Characteristics of the included studies
Study Source of participants Area No. of
participants
Onset of pain before study
entry Outcomes extracted Follow-up
Hazard et al.31
Reid et al.32 Vermont Department of Labor and Industry
US 166 within 11 d of low-back pain
None 3 mo
Heneweer et al.33
Primary care physical therapy centres
Nether-lands
66 < 12 wk Pain (VAS 0–100), Disability (QBPDQ 0%–100%), recovery rates
2, 4, 8 and 12 wk
Henschke et al.3 Primary care practitioners (general practitioners, physiotherapists and chiropractors)
Australia 969 > 24 h but < 2 wk
Pain (1–6), disability (1–5), recovery rates
6 wk, 3 and 12 mo
Klenerman et al.34
General practitioners England 300 < 1 wk Recovery rates 2 and 12 mo
Koleck et al.35 General practitioner France 99 10–90 d Pain (VAS 0–10), recovery rates
12 mo
Kovacs et al.36 Primary care centres Spain 366 < 12 wk Pain (VAS 0–10), disability (RMDQ 0–24)
2 wk and 8 wk
Lehmann et al.37
Occupational physicians US 60 2–6 wk None 6 mo
Melloh et al.38 Primary care settings New Zealand
62 < 12 wk Pain (NRS 0–100), disability (ODI 0–100), recovery rates,
3, 6, 12 wk and 6 mo
Poiraudeau et al.39
Rheumatologist France 443 4–12 wk Pain (4-points), disability (QBPDQ 0–20), recovery rates
3 mo
Reeser et al.40 Primary and tertiary care facilities
US 368 < 6 wk Disability (MODEMS 0–100)
6 wk, 3 and 12 mo
Schiottz-Christensen et al.41
General practices Denmark 524 < 14 d Recovery rates 1, 6 and 12 mo
Shaw et al.42-44 Community-based occupational health clinics
US 568 < 2 wk Pain (VAS 0–10), disability (RMDQ 0–100)
1 and 3 mo
Sieben et al.45 General practices Nether-lands and Belgium
44 < 2 wk Disability (RMDQ 0–24) 2 wk, 3 and 12 mo
Sieben et al.46 General practices Nether-lands
222 < 3 wk Pain (VAS 0–100), disability (QBPDQ 0–100)
3, 6 and 12 mo
Suri et al.47 Outpatient clinics US 77 < 12 wk Pain (NRS 0–10), disability (ODI 0–100)
6 wk
Swinkels-Meewisse et al.48
General practitioners and physiotherapists
Nether-lands
555 < 4 wk Pain (VAS 0–100), disability (RMDQ 0–24)
6 wk and 6 mo
Thomas et al.49 Community-based US 43 < 4 wk Pain (McGill), disability (RMDQ 0–24)
3, 6 and 12 wk
Valat et al.50 General practitioner and rheumatologist
France 2493 < 1 wk Recovery rates 7 ± 1 wk of follow-up
Note: Note: DDS = Descriptor Differential Scale, MODEMS = Musculoskeletal Outcomes Data Evaluation and Management System, NRS = Numerical Rating Scale, ODI = Oswestry Disability Index, QBPDQ = Quebec Back Pain Disability Questionnaire, RMDQ = Roland Morris Disability Questionnaire, SIP = Sickness Impact Profile, VAS = Visual Analogue Scale.

Clinical course of pain and disability Twenty-one cohorts reported pain outcomes.Fifteen cohorts2,3,10-12,17,18,24,25,28,30,36,42,43,44,46-49 wereclassified as acute low-back pain cohorts andsix16,19–22,33,35,38,39 were persistent low-back paincohorts. Twenty-two cohorts reported disabilityscores from at least one follow-up point: 16 of
these were acute low-back paincohorts2,3,11,12,17,18,,24,25,28,30,36,40,42-49 and 6 were persis-tent low-back pain cohorts.15,16,19,20,21,22,33,38,39 Painand disability data are shown in Figures 2 and3. In the acute pain cohorts, the inception timeuncorrected variance-weighted mean (95%confidence interval [CI]) pain score (out of a
Research
6 CMAJ
Table 2: Methodologic quality assessment of included cohorts
Study Defined sample* Representative
sample† Follow-up rate
> 80%‡ Follow-up time§ Prognosis¶
Bakker et al.10 Yes No Yes Yes Yes
Bousema et al.11 Yes No Yes Yes Yes
Breen et al.12 Yes No No No No
Carey et al.13
Sundararajan et al.14 Yes Yes Yes Yes Yes
Carey et al.15 Yes Yes No Yes Yes
Costa et al.16 Yes Yes Yes Yes Yes
Coste et al.17 Yes Yes Yes Yes Yes
Coste et al.18 Yes Yes Yes Yes Yes
Epping-Jordan et al.19
Shaw et al.20
Wahlgren et al.21
Williams et al.22
Yes Yes Yes Yes Yes
Faber et al.23 Yes Yes Yes Yes Yes
Ferguson et al.24,25 Yes No Yes Yes Yes
Gatchel et al.26,27 Yes No No Yes No
Grotle et al.2,28 Yes No Yes Yes Yes
Gurcay et al.29 Yes Yes Yes Yes Yes
Hasenbring et al.30 Yes Yes Yes Yes Yes
Hazard et al.31
Reid et al.32 No Yes Yes Yes Yes
Heneweer et al.33 Yes Yes Yes Yes Yes
Henschke et al.3 Yes Yes Yes Yes Yes
Klenerman et al.34 Yes No No Yes Yes
Koleck et al.35 Yes Yes Yes Yes Yes
Kovacs et al.36 Yes No Yes No Yes
Lehmann et al.37 Yes No Yes Yes Yes
Melloh et al.38 Yes Yes Yes Yes Yes
Poiraudeau et al.39 Yes Yes Yes Yes Yes
Reeser et al.40 Yes Yes No Yes Yes
Schiottz-Christensen et al.41 Yes No Yes Yes Yes
Shaw et al.42-44 Yes No Yes Yes Yes
Sieben et al.45 Yes No No Yes Yes
Sieben et al.46 Yes No No Yes Yes
Suri et al.47 Yes Yes No No Yes
Swinkels-Meewisse et al.48 Yes No No Yes Yes
Thomas et al.49 Yes No Yes Yes No
Valat et al.50 Yes No Yes No Yes
*Description of source of patients and inclusion and exclusion criteria. †Participants were selected as consecutive cases. ‡Outcome data were available for at least 80% of participants at one follow-up point. §At least one prognostic outcome was followed up at three months or later. ¶Raw data, percentages, survival rates or continuous outcome reported.

maximum of 100) was 52 (95% CI 48–57) atbaseline, 23 (95% CI 21–25) at 6 weeks, 12(95% CI 9–15) at 26 weeks and 6 (95% CI 3–10) at 52 weeks after entering the study. In thecohort with persistent pain, the score was 51(95% CI 44–59) at baseline, 33 (95% CI 29–38) at 6 weeks, 26 (95% CI 20–33) at 26 weeksand 23 (95% CI 16–30) at 52 weeks. The esti-mates of pain and disability (inception timecorrected and uncorrected) in the acute andpersistent low-back pain cohorts are shown inTable 3.
Within-study variationThe standard deviation of pain or disability out-comes was typically about 20 points on a 100-point scale. This was true for pain and disabilityoutcomes, for acute and persistent back pain andfor short-term and longer-term outcomes. Thisis indicative of a moderate degree of person-to-person variability in outcomes.
Between-study variation We used two statistics to quantify between-study variability. The first was tau, which is amodel-derived estimate of the standard devia-tion of outcomes on day 1. The second mea-sure of between-study variability was rho, theproportion of the total variance due tobetween-study variation on day 1. For theinception time uncorrected analyses, between-study variability was moderate: tau rangedfrom 8 to 14 and rho ranged from 0.60 to 0.73.For the inception time corrected analyses,between-study heterogeneity was moderate tohigh, particularly for the disability outcome:tau ranged from 14 to 22 and rho ranged from0.65 to 0.97.
Comparison of the clinical course of painand disabilityThe clinical course of pain and disability in theacute low-back pain cohorts was similar and the
Research
CMAJ 7
0
20
40
60
80
100
Pain
, sc
ore
ou
t o
f 1
00
0 10 20 30 40 50 60
Time since pain onset, wk
0
20
40
60
80
100
Pain
,sc
ore
ou
t o
f 1
00
0 10 20 30 40 50Time since study entry, wk
0
20
40
60
80
100
Pain
,sc
ore
ou
t o
f 1
00
0 10 20 30 40 50 60Time since pain onset, wk
0
20
40
60
80
100
Pain
,sc
ore
ou
t o
f 1
00
0 10 20 30 40 50Time since study entry, wk
Inception time corrected Inception time uncorrected
Acute low-back pain
Persistent low-back pain
Acute low-back pain
Persistent low-back pain
Figure 2: Course of pain in patients with acute and chronic low-back pain. Cohorts are represented by individual data points.

difference was not statistically significant (p =0.2). However, the clinical course of pain wasmore favourable than the clinical course of dis-ability in the persistent pain cohorts (p = 0.002).
Recovery from low-back painRecovery was measured in 19 (57.6%) of theincluded cohorts. Given the heterogeneity of thestudies in terms of the definitions of low-backpain, recovery and length of follow-up, it wasnot possible to pool the data. Most studiesreported that the majority of patients with acutelow-back pain had recovered by 12 weeks.Among patients with persistent low-back pain,recovery occurred in less than half of the patientsat the longest follow-up time. Recovery rate dataare presented in Table 4.
Prognostic factorsAppendix 2 (available at www.cmaj.ca /lookup/suppl/doi:10.1503/cmaj.111271/-/DC1) presents adescription of prognostic factors evaluated by each
study (when available). A large number of poten-tial prognostic factors were tested, with demo-graphic and clinical characteristics being the mostfrequently evaluated. Reporting of the strength ofassociation was very inconsistent among the stud-ies, which made it impossible to pool these data.
InterpretationThe results of our meta-analysis of the course ofacute and persistent low-back pain based on datafrom inception cohort studies are consistent withfindings from previous studies of acute low-backpain. Our review confirms the broad finding ofprevious reviews that the typical course of acutelow-back pain is initially favourable: there is amarked reduction in mean pain and disability inthe first six weeks. Beyond six weeks, improve-ment slows and thereafter only small reductionsin mean pain and disability are apparent up toone year. By one year, the average levels of painand disability for acute low-back pain were low(mean pain score [inception time uncorrected] of
Research
8 CMAJ
80
100
Dis
ab
ilit
y,s
core
ou
t o
f 1
00
0 20 40 60Time since pain onset, wk
0
20
40
60
80
100
Dis
ab
ilit
y, s
core
ou
t o
f 1
00
0 20 40 60Time since study entry, wk
0
20
40
60
80
100
Dis
ab
ilit
y, s
core
ou
t o
f 1
00
0 20 40 60 80 100Time since pain onset, wk
0
20
40
60
80
100
Dis
ab
ilit
y, s
core
ou
t o
f 1
00
0 20 40 60 80 100
Time since study entry, wk
0
20
40
60
detcerrocnu emit noitpecnIdetcerroc emit noitpecnI
niap kcab-wol etucAniap kcab-wol etucA
Persistent low-back pain Persistent low-back pain
Figure 3: Course of disability in patients with acute and chronic low-back pain. Cohorts are represented by individual data points.

6 and disability score of 13), suggesting thatpatients can expect to have minimal pain or dis-ability at one year.
People with persistent low-back pain also expe-rienced substantial improvement in the first sixweeks, but there were only very small reductionsin average pain and disability between 6 and 52weeks (mean reductions in pain and disabilityscore [inception time uncorrected] of 10 and 4,respectively). Patients with persistent low-backpain could expect to have moderate levels of painand disability at 12 months (mean pain and disabil-ity scores of 23 and 17, respectively). For bothacute and persistent low-back pain, there was mod-erate between-participant variability in outcomes.
We used a sensitive search strategy, whichnecessitated screening a large number of titles(28 613 titles screened, 43 eligible articles, num-ber needed to screen = 665 titles). This meansthat it is likely that most eligible studies wereincluded in our review. We included only incep-tion cohort studies because this type of designminimizes bias in studies of prognosis.7 We wereable to pool pain and disability outcomes frommost of the eligible cohorts. Unfortunately, sixstudies did not report continuous measures ofpain or disability, and the authors of these studiesdid not respond to requests to provide data.Therefore, not all studies that collected continu-ous measures of pain and disability wereincluded in our final analysis.
In this study, pooled estimates of the clinicalcourse of pain and disability were determinedusing mixed linear models. There are at least tworeasons why these data may provide inaccurateprognoses. First, there is obvious between-study
heterogeneity. That is, the mean outcomes ofsome cohorts differ substantially from the pooledestimate. The cause of this heterogeneity is notknown, but it could be real (e.g., because of varia-tion in characteristics of particular study cohorts)or due to bias (e.g., high rates of loss to follow-upin some cohorts). A second issue is that there wasevidence of a moderate amount of person-to-per-son variability within each study (which could bedue to, for example, initial pain intensity, dura-tion of symptoms, previous episodes, presence orabsence of sciatica, personal characteristics andcare received). The standard deviations for painand disability were consistently around 20. As theoutcomes were normally distributed, about one-third of patients would have prognoses that differby more than 20 points from the study mean. Thebest way to explore this variability and to gener-ate subject-specific prognoses that take intoaccount suspected prognostic factors would be toperform a meta-analysis using individual patientdata. It may be possible to conduct such studiesin the future.
Another possible explanation for the improve-ment of patients over time may be regression tothe mean, which is a consequence of randomvariation over time. Some of the randomnesswill be “true” variation caused by biological,psychological or sociological mechanisms (e.g.,people’s pain will fluctuate unpredictablybecause of their activity levels and mood) andsome will be measurement error (because peo-ple’s self-reports of their pain and disability willnot be perfectly precise). It is probably impossi-ble to properly partition out the contributions ofthese two sources of regression to the mean. But
Research
CMAJ 9
Table 3: Pooled estimates of mean pain and disability*
Group
Pooled estimate of mean pain (95% CI) Pooled estimate of mean disability (95% CI)
Inception time uncorrected
Inception time corrected
Inception time uncorrected
Inception time corrected
Acute low-back pain
Baseline 52 (48–57) 69 (61–78) 45 (42–48) 57 (52–62)
6 wk 23 (21–25) 28 (25–31) 24 (23–26) 28 (26–30)
26 wk 12 (9–15) 12 (8–15) 16 (15–18) 17 (15–19)
52 wk 6 (3–10) 4 (0–9) 13 (11–15) 11 (9–14)
Persistent low-back pain
Baseline 51 (44–59) NA† 27 (24–30) 51 (39–63)
6 wk 33 (29–38) 55 (46–63) 21 (19–22) 28 (25–31)
26 wk 26 (20–33) 29 (23–35) 18 (16–20) 19 (18–21)
52 wk 23 (16–30) 17 (7–27) 17 (14–19) 15 (12–18)
Note: CI = confidence interval, NA = not available. *All values are expressed in a scale ranging from 0 (i.e., no pain or disability) to 100 (i.e., maximum pain or disability). †The estimates of baseline values were not obtained for analyses of inception time corrected time for pain outcomes because this involved extrapolating the fitted curves substantially beyond the range of the data.

10 CMAJ
Table 4: Summary of recovery from low back pain
Study Inception time Recovery rates
Bakker et al.10 < 6 wk • 40% fully recovered by 12 wk and did not experience a recurrence within 6 mo
Bousema et al.11 4–7 wk • After 1 yr, 32% had no back pain complaints
Carey et al.13
Sundararajan et al.14 < 10 wk • 95% functionally recovered (a return to a functional status similar to that before the onset of low-
back pain) by 6 mo
• 69% considered themselves completely better at 6 mo
Carey15 12-22 weeks • 33% had no functionally limiting symptoms after 18 mo
• 16% had no back symptoms after 18 mo
Costa16 12 weeks • Only 11% of patients had not returned to work in their previous capacity at the onset of chronicity and, of those 46%, had returned to work by 12 mo
• The cumulative probability of being pain-free, maintained for one mon, was 35% at 9 mo and 42% at 12 mo after onset
• The cumulative probability of having no disability, maintained for one mo, was 39% at 9 mo and 47% at 12 mo after onset
• The cumulative probability of being completely recovered (pain-free, no disability and returned to prior work status maintained for one mo) was 35% at 9 mo and 41% at 12 mo after onset of chronic pain
Coste et al.17 < 72 h • 90% (95%CI 84%–96%) of patients recovered within the first 2 wk
• 98% (95%CI 95%–100%) of patients recovered after 3 mo
• 40% of patients lost no time from work and return to work was slower than recovery from back pain
Coste et al.18 < 72 h • 87% (95%CI 79%–95%) had recovered in 30 d
• 95% (95%CI 91%–100%) had recovered in 3 mo
Epping-Jordan et al.19 Shaw et al.20 Wahlgren et al.21
Williams et al.22
6–10 wk • 54% improved by 6 mo
• 67% improved by 12 mo
Ferguson et al.24,25 <4 wk • 68% of patients were not impaired according to functional performance, and 80% were not impaired in terms of pain by 14 to 18 wk
Grotle et al.2,28 < 3 wk • 76% had recovered (RMDQ < 4) after both 4 wk and 3 mo
• 83% of patients had recovered fully from their disability after 1 yr (RMDQ < 4)
Gurcay et al.29 < 3 wk • 27% recovered in the first wk
• 31% recovered in the second wk
• 23% recovered in the fourth wk
• 10% recovered at the eighth wk
• 1% recovered after 12 wk
• 9% developed chronic low-back pain
Heneweer et al.33 < 12 wk • 52% recovered in less than 4 wk
• 55% recovered at 12 wk, of whom 76% did not report work absenteeism
Henschke et al.3 > 24 h to < 2 wk • The cumulative probability of returning to work with pre–back pain work status and duties for those who reduced their work status at baseline because of low-back pain was 80% at 6 wk, 83% at 12 wk and 90% by 1 yr
• The cumulative probability of having no disability was 55% at 6 wk, 73% by 12 wk and 83% by 1 yr
• The cumulative probability of being pain free was 39% by 6 wk, 58% by 12 wk and 73% by 1 yr
• The cumulative probability of being completely recovered was 39% by 6 wk, 57% by 12 wk and 72% by 1 y
Klenerman et al.34 < 1 wk • 21% were classified as having no pain at 12 mo
• 28% were classified as having no intermittent pain at 12 mo
• 93% were classified as not having constant pain at 12 mo
Koleck et al.35 10–90 d • 67% of patients were classified as improved after 1 yr
• 67% were classified as not having chronic low-back pain after 1 yr
Melloh et al.38 < 12 wk • 75% were classified as nonpersistent low-back pain at 6 wk
• 25% were classified as persistent low-back pain at 6 wk
Poiraudeau et al.39 4–12 wk • 60% did not have persistent low-back pain at 3 mo
• 59% did not use sick leave during the 3 mo period
• 83% had returned to work at 3 mo
Schiottz-Christensen et al.41
< 14 d • 84% (95%CI 80%– 87%) of patients functionally recovered at 6 mo
• 92% (95%CI 89%–94%) functionally recovered at 12 mo
• 47% of patients completely recovered at 6 and 12 mo
Valat et al.50 < 1 wk • 61.3% had fully recovered at 7 wk
Note: CI = confidence interval, RMDQ = Roland Morris Disability Questionnaire.

for practical purposes, it is probably not neces-sary. The data have a useful pragmatic interpreta-tion because they indicate the time course ofself-reported reductions in pain and disability,even though the cause of the reduction is notknown.
To our knowledge, there has been only oneprevious systematic review that has quantitativelysynthesized study data on the clinical course oflow-back pain.5 A strength of our review is thatwe retrieved more studies than the previousreview, and we used an analysis approach thatcould accommodate outcomes measured at differ-ent times. We were thus able to provide more pre-cise estimates of the course of acute low-backpain. The availability of more cohorts also madeit practical to not include data from randomizedcontrolled trials. Typically, the inclusion andexclusion criteria in randomized controlled trialsare more restrictive than those used in cohortstudies,7 which means that cohort studies arelikely to provide more generalizable estimates ofprognosis. Unlike the previous quantitative syn-thesis that only considered the clinical course ofacute low-back pain,5 we also examined the clini-cal course of persistent low-back pain.
Although we acknowledge that the identifica-tion of prognostic factors is important, it is a chal-lenge to summarize this information because thereis great variability in the methods used to measureputative prognostic factors, build prognostic mod-els, and quantify and report prognostic value.6,51
These difficulties were also observed in previoussystematic reviews of acute low-back pain4,5 andwhiplash.9 One systematic review on the course ofacute low-back pain identified distress, previousepisodes of low-back pain and job satisfaction aslikely prognostic factors.5 The most recent reviewof prognostic factors for the development of per-sistent low-back pain4 found that maladaptive paincoping behaviours, nonorganic signs, functionalimpairment, general health status and presence ofpsychiatric comorbidities were the most importantprognostic factors.
LimitationsOnly a small proportion of eligible studiesexplicitly excluded patients with leg pain or sci-atica,17,18 while most studies either did not pro-vide any information on this distinction (12cohorts) or included some patients with leg painor sciatica (19 cohorts). It was common forauthors to refer to the presence of leg pain as sci-atica without differentiating whether the painwas somatic or radicular. Therefore, it is possiblethat our estimates of the prognosis of nonspecificlow-back pain may be influenced by the inclu-sion of some patients with radicular pain.
We classified studies as acute or persistentbased on the median or mean duration of symp-toms when provided or the midpoint of the rangeif not available. It is possible that some studieswith means or medians close to our threshold ofsix weeks could be similar to other cohorts witha different classification. Only one study39 thatprovided accurate information on the duration ofsymptoms had a mean duration within one weekof our threshold. Studies including patients typi-cally considered to have subacute low-back pain(6–12 weeks) were included in our persistentgroup. Although it is possible that these patientshave a more favourable prognosis, the reason-ably consistent pattern of results in our persistentcohorts suggests this was not the case.
ConclusionsWe found that patients with acute or persistentlow-back pain improved markedly in the first sixweeks, but beyond this time improvementslowed. Even at one year, patients had low tomoderate levels of pain and disability. Futureresearch is needed to make more precise recom-mendations on the standardization of recoverydefinitions of a low-back pain episode and todevelop an optimal search strategy to retrieveprognostic studies. These improvements inresearch will facilitate the development of futureprognostic systematic reviews.
References1. van Tulder M, Becker A, Bekkering T, et al. Chapter 3. European
guidelines for the management of acute nonspecific low-backpain in primary care. Eur Spine J 2006;15(Suppl 2):S169-91.
2. Grotle M, Brox JI, Veierød MB, et al. Clinical course and prog-nostic factors in acute low-back pain: patients consulting primarycare for the first time. Spine (Phila Pa 1976) 2005;30:976-82.
3. Henschke N, Maher CG, Refshauge KM, et al. Prognosis inpatients with recent onset low-back pain in Australian primarycare: inception cohort study. BMJ 2008;337:a171.
4. Chou R, Shekelle P. Will this patient develop persistent disablinglow-back pain? JAMA 2010;303:1295-302.
5. Pengel LH, Herbert RD, Maher CG, et al. Acute low-back pain:systematic review of its prognosis. BMJ 2003;327:323.
6. Altman DG. Systematic reviews of evaluations of prognosticvariables. BMJ 2001;323:224-8.
7. Grobbee DE, Hoes AW. Clinical epidemiology: principles,methods, and applications for clinical research. Burlingotn(MA): Jones and Bartlett; 2009.
8. Airaksinen O, Brox JI, Cedraschi C, et al. Chapter 4. Europeanguidelines for the management of chronic nonspecific low-backpain. Eur Spine J 2006;15(Suppl 2):S192-300.
9. Kamper SJ, Rebbeck TJ, Maher CG, et al. Course and prognos-tic factors of whiplash: a systematic review and meta-analysis.Pain 2008;138:617-29.
10. Bakker EW, Verhagen AP, Lucas C, et al. Spinal mechanicalload: A predictor of persistent low-back pain? A prospectivecohort study. Eur Spine J 2007;16:933-41.
11. Bousema EJ, Verbunt JA, Seelen HA, et al. Disuse and physicaldeconditioning in the first year after the onset of back pain. Pain2007; 130:279-86.
12. Breen AC, Carr E, Langworthy JE, et al. Back pain outcomes inprimary care following a practice improvement intervention: aprospective cohort study. BMC Musculoskelet Disord 2011;12:28.
13. Carey TS, Garrett J, Jackman A, et al. The outcomes and costs ofcare for acute low-back pain among patients seen by primary carepractitioners, chiropractors, and orthopedic surgeons. The North
Research
CMAJ 11

Carolina Back Pain Project. N Engl J Med 1995;333:913-7.14. Sundararajan V, Konrad TR, Garrett J, et al. Patterns and deter-
minants of multiple provider use in patients with acute low-backpain. J Gen Intern Med 1998;13:528-33.
15. Carey TS, Garrett JM, Jackman AM. Beyond the good progno-sis. Examination of an inception cohort of patients with chroniclow-back pain. Spine (Phila Pa 1976) 2000;25:115-20.
16. Costa LC, Maher CG, McAuley JH, et al. Prognosis for patientswith chronic low-back pain: inception cohort study. BMJ2009;339:b3829.
17. Coste J, Delecoeuillerie G, Cohen de Lara, et al. Clinical courseand prognostic factors in acute low-back pain: an inceptioncohort study in primary care practice. BMJ 1994;308:577-80.
18. Coste J, Lefrancois G, Guillemin F, et al. Prognosis and qualityof life in patients with acute low-back pain: insights from a com-prehensive inception cohort study. Arthritis Rheum 2004; 51:168-76.
19. Epping-Jordan JE, Wahlgren DR, Williams RA, et al. Transitionto chronic pain in men with low-back pain: predictive relation-ships among pain intensity, disability, and depressive symptoms.Health Psychol 1998;17:421-7.
20. Shaw WS, Means-Christensen A, Slater MA, et al. Shared andindependent associations of psychosocial factors on work statusamong men with subacute low-back pain. Clin J Pain 2007; 23:409-16.
21. Wahlgren DR, Atkinson JH, Epping-Jordan JE, et al. One-yearfollow-up of first onset low-back pain. Pain 1997;73:213-21.
22. Williams RA, Pruitt SD, Doctor JN, et al. The contribution ofjob satisfaction to the transition from acute to chronic low-backpain. Arch Phys Med Rehabil 1998;79:366-74.
23. Faber E, Burdorf A, Bierma-Zeinstra SM, et al. Determinants forimprovement in different back pain measures and their influenceon the duration of sickness absence. Spine 2006;31:1477-83.
24. Ferguson SA, Gupta P, Marras WS, et al. Predicting recoveryusing continuous low-back pain outcome measures. Spine J2001; 1:57-65.
25. Ferguson SA, Marras WS, Gupta P. Longitudinal quantitativemeasures of the natural course of low-back pain recovery. Spine(Phila Pa 1976) 2000;25:1950-6.
26. Gatchel RJ, Polatin PB, Kinney RK, et al. Predicting outcome ofchronic back pain using clinical predictors of psychopathology:a prospective analysis. Health Psychol 1995;14:415-20.
27. Gatchel RJ, Polatin PB, Mayer TG, et al. The dominant role ofpsychosocial risk factors in the development of chronic low-back pain disability. Spine 1995;20:2702-9.
28. Grotle M, Brox JI, Glomsrod B, et al. Prognostic factors in first-time care seekers due to acute low-back pain. Eur J Pain 2007;11: 290-8.
29. Gurcay E, Bal A, Eksioglu E, et al. Acute low-back pain: clinicalcourse and prognostic factors. Disabil Rehabil 2009;31:840-5.
30. Hasenbring MI, Hallner D, Klasen B, et al. Pain-related avoid-ance versus endurance in primary care patients with subacuteback pain: psychological characteristics and outcome at a 6-month follow-up. Pain 2012;153:211-7.
31. Hazard RG, Haugh LD, Reid S, et al. Early prediction of chronicdisability after occupational low-back injury. Spine (Phila Pa1976) 1996;21:945-51.
32. Reid S, Haugh LD, Hazard RG, et al. Occupational low-backpain: recovery curves and factors associated with disability. JOccup Rehabil 1997;7:1-14.
33. Heneweer H, Aufdemkampe G, van Tulder MW, et al. Psy-chosocial variables in patients with (sub)acute low-back pain: aninception cohort in primary care physical therapy in The Nether-lands. Spine (Phila Pa 1976) 2007;32:586-92.
34. Klenerman L, Slade PD, Stanley IM, et al. The prediction ofchronicity in patients with an acute attack of low-back pain in ageneral practice setting. Spine 1995;20:478-84.
35. Koleck M, Mazaux JM, Rascle N, et al. Psycho-social factorsand coping strategies as predictors of chronic evolution andquality of life in patients with low-back pain: a prospectivestudy. Eur J Pain 2006;10:1-11.
36. Kovacs FM, Abraira V, Zamora J, et al. The transition fromacute to subacute and chronic low-back pain: a study based ondeterminants of quality of life and prediction of chronic disabil-ity. Spine (Phila Pa 1976) 2005;30:1786-92.
37. Lehmann TR, Spratt KF, Lehmann KK, et al. Predicting long-term disability in low-back injured workers presenting to a spineconsultant. Spine 1993;18:1103-12.
38. Melloh M, Elfering A, Egli Presland C, et al. Predicting the tran-sition from acute to persistent low-back pain. Occup Med (Lond)
2011; 61:127-31.39. Poiraudeau S, Rannou F, Le Henanff A, et al. Outcome of suba-
cute low-back pain: influence of patients’ and rheumatologists’characteristics. Rheumatology (Oxford) 2006;45:718-23.
40. Reeser JC, Wiegmann SM, Hoover N, et al. Treatment of acutelow-back pain in Wisconsin: results of the State Medical Soci-ety’s Medical Outcomes Research Project. WMJ 2001;100:35-42.
41. Schiøttz-Christensen B, Nielsen GL, Hansen VK, et al. Long-term prognosis of acute low-back pain in patients seen in generalpractice: a 1-year prospective follow-up study. Fam Pract 1999;16: 223-32.
42. Shaw WS, Pransky G, Patterson W, et al. Patient clusters inacute, work-related back pain based on patterns of disability riskfactors. J Occup Environ Med 2007;49:185-93.
43. Shaw WS, Pransky G, Patterson W, et al. Early disability riskfactors for low-back pain assessed at outpatient occupationalhealth clinics. Spine (Phila Pa 1976) 2005;30:572-80.
44. Shaw WS, Pransky G, Winters T. The Back Disability RiskQuestionnaire for work-related, acute back pain: prediction ofunresolved problems at 3-month follow-up. J Occup EnvironMed 2009;51:185-94.
45. Sieben JM, Vlaeyen JW, Tuerlinckx S, et al. Pain-related fear inacute low-back pain: the first two weeks of a new episode. Eur JPain 2002;6:229-37.
46. Sieben JM, Vlaeyen JW, Portegijs PJ, et al. A longitudinal studyon the predictive validity of the fear-avoidance model in low-back pain. Pain 2005;117:162-70.
47. Suri P, Rainville J, Fitzmaurice GM, et al. Acute low-back painis marked by variability: An internet-based pilot study. BMCMusculoskelet Disord 2011;12:220.
48. Swinkels-Meewisse IE, Roelofs J, Schouten EG, et al. Fear ofmovement/(re)injury predicting chronic disabling low-back pain:a prospective inception cohort study. Spine (Phila Pa 1976)2006; 31:658-64.
49. Thomas JS, France CR. The relationship between pain-relatedfear and lumbar flexion during natural recovery from low-backpain. Eur Spine J 2008;17:97-103.
50. Valat JP, Goupille P, Rozenberg S, et al. Acute low-back pain:predictive index of chronicity from a cohort of 2487 subjects.Joint Bone Spine 2000:456-61.
51. Altman DG. Systematic reviews of evaluations of prognosticvariables. In: Egger M, editor. Systematic reviews in health care.London (UK): BMJ Books; 2001.
Affiliations: From the George Institute for Global Health(Menezes Costa, Maher, Herbert), the University of Sydney;the Faculty of Human Sciences (Hancock), Macquarie Uni-versity; the Faculty of Health Sciences (Hancock), Universityof Sydney; Prince of Wales Medical Research Institute(McAuley), Sydney, Australia; and the Masters in PhysicalTherapy (Menezes Costa, Costa), Universidade Cidade deSão Paulo, São Paulo, Brazil.
Contributors: All authors contributed to the design of thestudy. Luciola Menezes Costa and Leonardo Costa conductedthe searches, located and selected the studies, assessed thequality of the studies, extracted and interpreted the data andwrote the manuscript. Mark Hancock and Christopher Maherdouble-checked the data from eligible studies. Robert Herbertanalyzed the data. Christopher Maher, Mark Hancock, JamesMcAuley and Robert Herbert interpreted the data, advised onstatistical analysis and revised the manuscript. ChristopherMaher had full access to all of the data in the study and takesresponsibility for the integrity of the data and the accuracy ofthe data analysis. All authors approved the final version of themanuscript submitted for publication.
Funding: Luciola Menezes Costa was supported by a PhDscholarship from the University of Sydney during the courseof this study. Christopher Maher is supported by the AustraliaResearch Council and Robert Herbert is supported by Aus-tralia’s National Health and Medical Research Council.Leonardo Costa is supported by Fundação de Amparo aPesquisa do Estado de São Paulo, Brazil. There was no spe-cific funding for this study.
Research
12 CMAJ


![HEDIS Criteria for Lower Back Pain and Early Intervention and …€¦ · clinical management, and understanding prognosis [6]. Special concerns have been given to the increasing](https://img.dokumen.tips/doc/110x75/5f0789f37e708231d41d7b90/hedis-criteria-for-lower-back-pain-and-early-intervention-and-clinical-management.jpg)


![Back Talk - Back Pain Rescue[1]](https://img.dokumen.tips/doc/110x75/577d35821a28ab3a6b90a19c/back-talk-back-pain-rescue1.jpg)