Embed Size (px)
Citation preview

Hawai’i DBEDT
The Potential for Biofuels Production in Hawai’i
FINAL REPORT B&V Project Number 147375
January 2010
Black & Veatch Corporation 11401 Lamar
Overland Park, Kansas 66211 Tel: (913) 458-2000 www.bv.com

Principal Investigators: Black & Veatch: Jim Easterly, Project Manager Keith Cummer Nate Emsick Matt Hunsaker Bret Harper Scot Olson Bill Roush University of Hawai’i* Richard Ogoshi John Yanagida *University of Hawaii staff conducted the energy crop evaluation for this study, including identification of energy crop species, evaluation of available acreage, growing conditions, yields, and production cost estimates for Hawaii.
The Black & Veatch name and logo are registered trademarks of Black & Veatch Holding Company

The Potential for Biofuels Production in Hawai’i Table of Contents
TC-1
Table of Contents
1.0 Executive Summary ................................................................................................... 1-1
1.1 Biofuels ................................................................................................................ 1-1
1.2 Technologies for Biofuel Conversion .................................................................. 1-2
1.2.1 Commercial and Near Term Commercial Technologies ............................ 1-3
1.2.2 Emerging Biofuel Conversion Technologies .............................................. 1-4
1.2.3 Economies of Scale ..................................................................................... 1-6
1.3 Biofuel Potential from Hawai’i Resources .......................................................... 1-7
1.3.1 Potential from Biomass Residues in Hawai’i ............................................. 1-7
1.3.2 Potential from Dedicated Energy Crops in Hawai’i ................................... 1-7
1.4 Emerging Options for Biofuel Production ......................................................... 1-10
1.4.1 New Biomass Sources ............................................................................... 1-10
1.4.2 Options for Improving Biofuel Economics............................................... 1-11
1.5 Results and Discussion ...................................................................................... 1-11
1.5.1 Current Fuel Consumption and Biofuel Demand ..................................... 1-11
1.5.2 Biofuel Production Potential ..................................................................... 1-12
1.5.3 Crop Specific Considerations ................................................................... 1-14
1.5.4 Conclusions ............................................................................................... 1-15
2.0 Introduction ................................................................................................................ 2-1
2.1 Background .......................................................................................................... 2-1
2.2 Objective .............................................................................................................. 2-1
2.3 Approach .............................................................................................................. 2-1
3.0 Biomass Conversion Technology Options and Issues ............................................... 3-1
3.1 Ethanol ................................................................................................................. 3-1
3.1.1 Conventional Fermentation ......................................................................... 3-2
3.1.2 Advanced Processing Technologies ........................................................... 3-2
3.1.3 Feedstock Suitability ................................................................................... 3-4
3.1.4 Anticipated Cost Competitiveness .............................................................. 3-4
3.1.5 Ethanol Production Potential ...................................................................... 3-9
3.1.6 Other Potential Products ........................................................................... 3-10
3.2 Biodiesel ............................................................................................................ 3-10
3.2.1 Conventional Biodiesel Transesterification .............................................. 3-11
3.2.2 Other Renewable Diesel Technologies ..................................................... 3-11
3.2.3 Economics of Using On-Island Resources Compared to Imported Vegetable
Oils ..................................................................................................................... 3-11

The Potential for Biofuels Production in Hawai’i Table of Contents
TC-2
3.2.4 Feedstock Suitability ................................................................................. 3-12
3.2.5 Anticipated Cost Competitiveness ............................................................ 3-12
3.2.6 Biodiesel Production Potential .................................................................. 3-15
3.3 Biomass-Derived Hydrogen ............................................................................... 3-15
3.3.1 Methane Reformation ............................................................................... 3-16
3.3.2 Biomass Gasification ................................................................................ 3-16
3.3.3 Microorganisms ........................................................................................ 3-16
3.3.4 Feedstock Suitability ................................................................................. 3-17
3.3.5 Anticipated Cost Competitiveness ............................................................ 3-17
3.3.6 Hydrogen Production Potential ................................................................. 3-19
3.4 Other Biofuel Technology Options .................................................................... 3-19
3.4.1 Fisher-Tropsch Liquids ............................................................................. 3-20
3.4.2 Renewable Diesel via Direct Hydrogenation ............................................ 3-23
3.4.3 Pyrolysis Oils ............................................................................................ 3-25
3.4.4 Biogasoline ............................................................................................... 3-27
3.4.5 Biobutanol ................................................................................................. 3-28
3.4.6 Biological Conversion of Sugar to Conventional Fuels ........................... 3-28
3.5 Projected Costs and Suitability in Hawai’i ........................................................ 3-28
3.6 Additional Considerations for Biofuel Production in Hawai’i .......................... 3-30
3.6.1 Limitations on Transportation of Biomass ............................................... 3-31
3.6.2 Economies of Scale ................................................................................... 3-31
3.6.3 Distributed Processing & Centralized Refining ........................................ 3-34
4.0 Biomass Residue Availability .................................................................................... 4-1
4.1 Urban Waste......................................................................................................... 4-1
4.1.1 Solid Waste ................................................................................................. 4-2
4.1.2 Non-Solid Waste ....................................................................................... 4-13
4.2 Agricultural Residues and Waste Streams ......................................................... 4-20
4.2.1 Sugar ......................................................................................................... 4-20
4.2.2 Pineapple ................................................................................................... 4-22
4.2.3 Macadamia Nut Shells .............................................................................. 4-23
4.3 Animal Wastes ................................................................................................... 4-25
4.3.1 Swine Manure ........................................................................................... 4-26
4.3.2 Cattle Manure............................................................................................ 4-28
4.3.3 Poultry Manure ......................................................................................... 4-29
4.4 Wood Resources ................................................................................................ 4-30
4.4.1 Forest Products.......................................................................................... 4-32
4.4.2 Forest Resources ....................................................................................... 4-33
The Potential for Biofuels Production in Hawai’i Table of Contents
TC-3
4.5 Biomass Residue Resource Summary and Conclusions .................................... 4-36
4.6 Biofuel Production Potential .............................................................................. 4-37
4.6.1 Ethanol ...................................................................................................... 4-37
4.6.2 Biodiesel ................................................................................................... 4-38
4.6.3 Biomass Derived Hydrogen ...................................................................... 4-39
4.7 Potential Future Markets for Biomass Residues ................................................ 4-39
4.8 Conclusion ......................................................................................................... 4-42
5.0 Energy Crop Potential ................................................................................................ 5-1
5.1 Crop Land in Hawai’i .......................................................................................... 5-1
5.1.1 Estimating Biofuel Crop Yield ................................................................. 5-12
5.1.2 Recommendations for Non-irrigated Energy Crops ................................. 5-22
5.2 Energy Crop Yields on Prime Agricultural Lands ............................................. 5-24
5.2.1 Methods..................................................................................................... 5-24
5.2.1.1 Soil Characteristics and Land Areas ...................................................... 5-24
5.2.1.2 Yield Estimation .................................................................................... 5-24
5.2.2 Results ....................................................................................................... 5-25
5.2.3 Summary and Recommendations ............................................................. 5-42
6.0 Evaluation of Energy Crop Economics in Hawai’i .................................................... 6-1
6.1 Data ...................................................................................................................... 6-1
6.2 Framework for Economic Analysis ..................................................................... 6-2
6.3 Results .................................................................................................................. 6-3
6.3.1 Base Case, Rainfed Cases ........................................................................... 6-3
6.3.2 Sensitivities ............................................................................................... 6-10
6.3.3 Base Case, Irrigated Cases ........................................................................ 6-12
6.4 Summary ............................................................................................................ 6-14
7.0 Emerging and Innovative Options for Biofuel Production ........................................ 7-1
7.1 New Crop Alternatives ........................................................................................ 7-1
7.2 Microalgae ........................................................................................................... 7-1
7.2.1 The Potential for Microalgae ...................................................................... 7-2
7.2.2 Algae to Biofuels Technology Development .............................................. 7-2
7.2.3 Microalgae in Hawai’i ................................................................................ 7-3
7.3 Improvement of Existing Crops ........................................................................... 7-4
7.4 Biorefineries ......................................................................................................... 7-4
7.5 Multi Crop Strategies Integrated Food and Fuel Production ............................... 7-7
7.6 Tourism .............................................................................................................. 7-10

The Potential for Biofuels Production in Hawai’i Table of Contents
TC-4
7.6.1 Ecotourism ................................................................................................ 7-10
7.6.2 Agritourism ............................................................................................... 7-10
7.7 Plug-In Hybrid Electrics .................................................................................... 7-11
8.0 State and National Policies and Incentives ................................................................ 8-1
8.1 Federal Government Incentives ........................................................................... 8-1
8.1.1 Agricultural Policy and Incentives .............................................................. 8-2
8.1.2 Biodiesel and Ethanol Tax Credit ............................................................... 8-3
8.1.3 Alternative Fuel Infrastructure Tax Credit ................................................. 8-4
8.1.4 Alternative Motor Vehicle Credit ............................................................... 8-4
8.1.5 Clean School Bus USA ............................................................................... 8-4
8.1.6 Alternative Fuel Vehicles CAFE Credit ..................................................... 8-4
8.1.7 Cellulosic Biomass Ethanol and Municipal Solid Waste Loan Guarantee
Program ................................................................................................................ 8-5
8.2 Hawai’i State Government Incentives ................................................................. 8-5
8.2.1 Hawai’i/U.S. DOE Partnership ................................................................... 8-5
8.2.2 Alternative Fuel Development Support ...................................................... 8-5
8.2.3 State Vehicle Acquisition Requirements to Reduce Petroleum Dependency8-5
8.2.4 Ethanol Investment Tax Credit ................................................................... 8-6
8.2.5 Alternative Fuel Tax Rate ........................................................................... 8-6
8.3 Prospects and Potential Impacts of New Incentives ............................................ 8-6
8.4 Opportunities for New or Modified Incentives .................................................... 8-7
8.4.1 High Occupancy Vehicle Lane Incentives .................................................. 8-7
8.4.2 New Renewable Fuels ................................................................................. 8-7
9.0 Summary of Results ................................................................................................... 9-1
9.1 Biofuels Production Technologies ....................................................................... 9-1
9.2 Biofuels from Biomass Residues ......................................................................... 9-3
9.3 Land Availability ................................................................................................. 9-3
9.4 Biofuel Production from Energy Crops ............................................................... 9-4
9.4.1 Biofuel Production Optimization ................................................................ 9-4
9.4.2 Ethanol Breakeven Costs ............................................................................ 9-6
9.5 Potential Process Improvements .......................................................................... 9-6
10.0 Conclusions ............................................................................................................ 10-1
10.1 Biofuels Potential from Waste Residues and Energy Crops ............................ 10-1
10.2 Recommendations for Further Study ............................................................... 10-3
10.3 Obstacles .......................................................................................................... 10-4

The Potential for Biofuels Production in Hawai’i Table of Contents
TC-5
10.4 Crops Specific Considerations ......................................................................... 10-4
10.5 Final Observations ........................................................................................... 10-5
11.0 References .............................................................................................................. 11-1 Appendix A. Detailed Economic Analysis Assumptions for Sugarcane and Banagrass ........................................................................................................................................ A-1

The Potential for Biofuels Production in Hawai’i Table of Contents
TC-6
List of Tables
Table 1-1. Commercial and Near Term Biomass Conversion Technology Summary. .. 1-4
Table 1-2. Total Hawai’i Biofuel Potential from Waste. ................................................ 1-7
Table 1-3. Energy Crops Selected Evaluated for Hawai’i. ............................................. 1-8
Table 1-4. Energy Crop Potential and Biofuel Yield. ..................................................... 1-9
Table 1-5. Hawai’i Fuel Consumption, 2007. ............................................................... 1-11
Table 1-6. Maximum Theoretical Hawai’i Biofuel Production Potential. .................... 1-12
Table 1-7. Hawai'i Fuel Consumption, 2007. ................................................................ 1-13
Table 2-1. Biomass Conversion Technology Summary. ................................................ 2-3
Table 3-1. Biomass Conversion Technology Summary. ................................................ 3-1
Table 3-2. Energy Content of Liquid Fuels. ................................................................... 3-1
Table 3-3. Hawai’i Ethanol Conversion Cost Estimates Summary. ............................... 3-5
Table 3-4. Ethanol Yields. .............................................................................................. 3-9
Table 3-5. Hawai’i Biodiesel Conversion Cost Summary. ........................................... 3-13
Table 3-6. Biodiesel Yields. .......................................................................................... 3-15
Table 3-7. Hawai’i Hydrogen Production Cost Summary. ........................................... 3-18
Table 3-8. Hydrogen Yields. ......................................................................................... 3-19
Table 3-9. Daily Fuel Demand for Biomass Facilities. ................................................ 3-32
Table 4-1. End Use of Food Waste Diversions in Honolulu. ......................................... 4-3
Table 4-2. Waste Composition Summary by Solid Waste Facility - 2006. .................... 4-5
Table 4-3. Composition of the Material Entering the South Hilo Landfill Only*. ....... 4-10
Table 4-4. Summary of 2007 Solid Waste Characterization Conducted for Kaua`i County.4-12
Table 4-5. Kaua’i Commercial Tipping Fees per Ton. .................................................. 4-13
Table 4-6. Summary of Number, Location, and Ownership of Wastewater Treatment
Plants and Sludge Production and Amount Diverted from Land-Filling in
Hawai’i. ........................................................................................................ 4-15
Table 4-7. Summary of Treatment Process of Wastewater Treatment Plants and 2006
Sludge Production for Major Plants. ............................................................ 4-16
Table 4-8. Estimates of Urban Grease Resources in the State of Hawai’i Using Factors
from EPA (1997). ......................................................................................... 4-19
Table 4-9. Potential Bioenergy Feedstocks Generated by the Hawai’i Sugar Industry in
2006. ............................................................................................................. 4-20
Table 4-10. Summary of Swine Populations and Hog Farms Sizes in Hawai’i, 2006 Data.4-27
Table 4-11. Summary of Hog Populations and Manure Production by County. ........... 4-28
Table 4-12. Cattle and Calves: January 1 Inventory by Sex Classes and Weight, State of
Hawai’i, 2003-2007. ..................................................................................... 4-29
Table 4-13. Estimates of Chicken Inventories and Manure Resources in Hawai’i. ..... 4-29
The Potential for Biofuels Production in Hawai’i Table of Contents
TC-7
Table 4-14. State Forest Reserves. ................................................................................. 4-31
Table 4-15. Summary of Product Options and Associated Forest Area and Timber
Requirements for Hawai’i Processing Facilities. ......................................... 4-33
Table 4-16. Summary of Timber and Bioenergy Resource Estimates Based on a 15 Year
Harvest Schedule. ......................................................................................... 4-35
Table 4-17. Summary of Biomass Residues and Biomass Residue Utilization in the State
of Hawai’i Broken Down by County. .......................................................... 4-37
Table 4-18. Total Hawai’i Ethanol Potential from Available Residues. ....................... 4-38
Table 4-19. Total Hawai’i Biodiesel Potential. ............................................................ 4-39
Table 4-20. Total Hawai’i Hydrogen Potential. ............................................................. 4-39
Table 4-21. Summary of Biomass Residue Future Market Supply. .............................. 4-42
Table 4-22. Total Hawai’i Biofuel Potential from Waste. ............................................ 4-42
Table 5-1. Soil Temperature and Moisture Regimes, Nonprime Agricultural Land ..... 5-10
Table 5-2. Rainfed Dry Matter and Oil Yield of Crops ................................................. 5-14
Table 5-9. Land Areas of the Soil Temperature and Moisture Regimes within Prime
Agricultural Lands. ....................................................................................... 5-27
Table 8-1. U.S. Renewable Fuels Standard. ................................................................... 8-2
Table 8-2. Hawai’i Alternative Fuel Taxes. .................................................................... 8-6
Table 9-1. Commercial and Nearer Term Biomass Conversion Technology Summary. 9-2
Table 9-2. Total Hawai’i Biofuel Potential from Waste. ................................................ 9-3
Table 9-3. Hawai’i Agricultural Lands by Island (acres). .............................................. 9-4
Table 9-4. Hawai’i Energy Crop Potential. .................................................................... 9-4
Table 9-5. Maximum Energy Crop Potential and Biofuel Yield. ................................... 9-5
Table 9-6. Breakeven Costs for Fiber and Sugar Crops. ................................................ 9-6
Table 10-1 Maximum Theoretical Hawaii Biofuel Production Potential. ..................... 10-1
Table 10-2. Hawai'i Fuel Consumption, 2007. .............................................................. 10-2
List of Figures
Figure 3-1. Decline in Hawai’ian Sugar Cane Land (Source: Gay & Robinson). .......... 3-5
Figure 3-2. Projected Costs of Cellulosic Ethanol Production, Biochemical Pathways
(Source: NREL). ............................................................................................. 3-8
Figure 3-3. Projected Costs of Cellulosic Ethanol via Thermochemical Pathways
(Source: NREL). ............................................................................................. 3-9
Figure 3-4. Production Cost Distribution ($/gal) for a Typical 30 MGY Soy Biodiesel
Plant (Adapted from Building a Successful Biodiesel Business). ................ 3-13
Figure 3-5. Historical Palm Oil Prices .......................................................................... 3-14
Figure 3-6. Coal and Biomass to FT Liquids Process Schematic ................................. 3-21

The Potential for Biofuels Production in Hawai’i Table of Contents
TC-8
Figure 3-7. Refinery Integrated Renewable Diesel Options ......................................... 3-23
Figure 3-8. Stand-Alone Renewable Diesel Hydrotreating Schematic ........................ 3-24
Figure 3-9. Dynamotive BioThermTM Process Schematic ........................................... 3-26
Figure 3-10. Advanced Biofuel Production Costs ........................................................ 3-29
Figure 3-11. DOE Retail Gasoline and Diesel Projections ........................................... 3-30
Figure 3-12. Land Requirements for a 2,000 Ton/Day Facility ................................... 3-33
Figure 4-1. Hawai’i Food Waste. .................................................................................... 4-4
Figure 4-2. O`ahu Landfills and Waste-to-Energy Facility. ........................................... 4-6
Figure 4-3. Maui Solid Waste. ........................................................................................ 4-7
Figure 4-4. Big Island Landfill Locations....................................................................... 4-9
Figure 4-5. Kaua`i Landfill Location. ........................................................................... 4-11
Figure 4-6. Major Wastewater Treatment Plants on Hawai’ian Islands. ...................... 4-17
Figure 4-7. Fats, Oil, and Grease. ................................................................................. 4-18
Figure 4-8. Kaua`i Sugarcane & Pineapple Waste. ...................................................... 4-21
Figure 4-9. Maui Sugarcane & Pineapple Waste. ......................................................... 4-22
Figure 4-10. Summary of Pineapple Harvested Acreage and Production in Hawai'i for the
Period 1998 to 2007. .................................................................................... 4-23
Figure 4-11. Summary of Macadamia Nut Harvest Acreages and Nut-in-Shell Production
from 1998 to 2006. Crop year July 1 to June 30 .......................................... 4-24
Figure 4-12. Macadamia Nut Processing Locations. ..................................................... 4-25
Figure 4-13. Livestock Populations in Hawai'i for the Period from 1997 to 2007. ....... 4-26
Figure 4-14. Distribution of Hog Sizes in the 2008 Swine Industry. ........................... 4-27
Figure 4-15. Animal Wastes. ........................................................................................ 4-30
Figure 4-16. State of Hawai’i Forest Reserve System. ................................................. 4-32
Figure 4-17. Waiakea Timber Management Area. ....................................................... 4-34
Figure 5-1. State of Hawai’i Non-Irrigated Land Availability by Soil Type and Island 5-3
Figure 5-2. Soil Temperature Regimes, Nonprime on the Island of Hawai’i ................. 5-4
Figure 5-3. Soil Moisture Regimes, Nonprime on the Island of Hawai’i .......................... 5-4
Figure 5-4. Soil Temperature Regimes, Nonprime on the Island of Maui ..................... 5-5
Figure 5-5. Soil Moisture Regimes, Nonprime on the Island of Maui ........................... 5-5
Figure 5-6. Soil Temperature Regimes, Nonprime on the Island of Molokai ................ 5-6
Figure 5-7. Soil Moisture Regimes, Nonprime on the Island of Molokai ...................... 5-6
Figure 5-8. Soil Temperature Regimes, Nonprime on the Island of Kauai .................... 5-7
Figure 5-9. Soil Moisture Regimes, Nonprime on the Island of Kauai .......................... 5-7
Figure 5-10. Soil Temperature Regimes, Nonprime on the Island of Oahu ................... 5-8
Figure 5-11. Soil Moisture Regimes, Nonprime on the Island of Oahu ......................... 5-8
Figure 5-12. Soil Temperature Regimes, Nonprime on the Island of Lanai.................... 5-9

The Potential for Biofuels Production in Hawai’i Table of Contents
TC-9
Figure 5-13. Soil Moisture Regimes, Nonprime on the Island of Lanai .......................... 5-9
Figure 5-14. Location of Irrigation Ditches and Nonprime Agricultural Lands ........... 5-11
Figure 5-15. Biomass Potential by Crop Type and Island, Nonprime Ethanol ................ 5-21
Figure 5-16. Biomass Potential by Crop Type and Island, Nonprime Biodiesel. ......... 5-21
Figure 5-17. Non-Irrigated Crop Ethanol Potential, By Island (80 gallons/ton). ......... 5-23
Figure 5-18. State of Hawai’i Irrigate Land Availability by Soil Type and Island. ..... 5-26
Figure 5-19. Soil Temperature Regimes, Prime Lands on the Island of Hawai’i. ........ 5-28
Figure 5-20. Soil Moisture Regimes, Prime Lands on the Island of Hawai’i. .............. 5-28
Figure 5-21. Soil Temperature Regimes, Prime Lands on the Island of Maui. ............ 5-29
Figure 5-22. Soil Moisture Regimes, Prime Lands on the Island of Maui. .................. 5-29
Figure 5-23. Soil Temperature Regimes, Prime Lands on the Island of Molokai. ....... 5-30
Figure 5-24. Soil Moisture Regimes, Prime Lands on the Island of Molokai. ............. 5-30
Figure 5-25. Soil Temperature Regimes, Prime Lands on the Island of Kauai. ........... 5-31
Figure 5-26. Soil Moisture Regimes, Prime Lands on the Island of Kauai. ................. 5-31
Figure 5-27. Soil Temperature Regimes, Prime Lands on the Island of Oahu. ............ 5-32
Figure 5-28. Soil Moisture Regimes, Prime Lands on the Island of Oahu. .................. 5-32
Figure 5-29. Soil Temperature Regimes, Prime Lands on the Island of Lanai. ........... 5-33
Figure 5-30. Soil Moisture Regimes, Prime Lands on the Island of Lanai. ................. 5-33
Figure 5-31. Biomass Potential by Crop Type and Island, Ethanol. ............................. 5-41
Figure 5-32. Biomass Potential by Crop Type and Island, Biodiesel. .......................... 5-41
Figure 5-33. Irrigated Crop Ethanol Potential, By Island. ............................................ 5-42
Figure 6-1. Breakeven Ethanol Cost Components, Rainfed Feedstocks. ....................... 6-8
Figure 6-2. Banagrass Financial Model Sensitivities. .................................................. 6-10
Figure 6-3. Ethanol Yield Sensitivity Analysis. ........................................................... 6-11
Figure 6-4. Woody Feedstock Processing Cost Sensitivity Analysis. .......................... 6-12
Figure 6-5. Breakeven Ethanol Cost Components, Rainfed versus Irrigated. .............. 6-14
Figure 7-1. Input and Output Streams for a Conceptualized Algae Fed Biorefinery
(Source HR BioPetroleum). ........................................................................... 7-6
Figure 7-2. Alley Cropping of Herbaceous Plants with Trees (Source: USDA). ........... 7-8
Figure 7-3. Alley Cropping with Integrated Grazing (Source: USDA). ......................... 7-8

The Potential for Biofuels Production in Hawai’i 1.0 Executive Summary
1-1
1.0 Executive Summary
State of Hawai’i Act 240 (2006) emphasizes energy self-sufficiency by declaring
the State’s objective of having 20% of its transportation fuels from renewable sources by
2020. Act 240 created an alternative fuel standard (AFS) with intermediate goals of
providing 10% of transportation fuels from renewable sources by 2010 and 15% by 2015.
Black & Veatch, with the University of Hawaii as a subcontractor, were retained by the
State of Hawai’i Department of Business, Economic Development, and Tourism
(DBEDT) Strategic Industries Division to prepare a statewide multi-fuel biofuels
production assessment that will help in determining how the State could potentially meet
the alternative fuel goals in Act 240. This assessment addresses the potential feedstocks,
technologies, and economics of biofuels production utilizing Hawai’i resources.
1.1 Biofuels A significant amount of effort is underway to evaluate and commercialize new
feedstocks and conversion technologies for the production of biofuels. Ethanol and
biodiesel are two forms of biofuel that are the furthest along in establishing commercial
viability. In addition to ethanol and biodiesel, options for producing other liquid fuels
from biomass are also under development. These fuels include products that more
closely resemble petroleum based fuels, such as gasoline, conventional diesel, and jet
fuel.
Gaseous fuels, such as methane and hydrogen, can also be produced from biomass
through biological or thermal processes. However, there are clearly major challenges
associated with creating entirely new fuel storage, distribution and utilization systems for
gaseous fuels if they are to be used for transportation fuel. Due in large part to these
challenges, recent and ongoing efforts to develop transportation fuels from biomass have
focused much more on the production of liquid fuels as the end product, rather than
gaseous fuels such as hydrogen.
Finally, with the emergence of new options such as plug-in hybrid electric
vehicles, electricity produced from biomass and other renewable resources could also be
used to offset petroleum-based transportation fuel consumption. Unlike gaseous fuels,
the infrastructure for electricity distribution is generally well established in Hawai’i. This
could help lower barriers to using this form of energy for transportation. However, the
need for a new fleet of vehicles capable of using electricity is still a major hurdle for this
mode of transportation. Since the market value of electricity is generally high in Hawai’i,
the development of integrated biomass conversion facilities that co-produce biofuel and
electricity (for sale to the electric grid) could be economically attractive, depending on

The Potential for Biofuels Production in Hawai’i 1.0 Executive Summary
1-2
project-specific analyses in determining the greatest value for biomass feedstock use. It
is quite possible that the integrated production of biofuels and electricity will often be
attractive for project developers.
1.2 Technologies for Biofuel Conversion There are a variety of conversion technologies that could play a role in Hawaii’s
developing bioeconomy. Each technology has certain benefits and constraints,
particularly in relation to the type(s) of biomass feedstocks that are expected to be viable
in Hawai’i over the coming years, and the optimum scale for conversion technologies in
relation to the quantities of biomass that could be available. The development of biofuel
production technology is currently in an intensive, rapidly evolving mode, and the
marketplace will be sorting out the technologies that are the most competitive in
particular circumstances. For this report, Hawaii’s biofuel production potential was
quantified by first estimating the tons of biomass feedstock that could be available in the
future in the form of residues from agricultural, forestry, and urban activities, along with
estimates of the amount of biomass that could be supplied from energy crops grown on
various classifications of agricultural land. The corresponding amounts of biofuel that
could be produced from these feedstocks were then calculated for various conversion
technologies.
Since the scope of work defined at the outset of the project was to focus primarily
on ethanol and biodiesel potential, these fuels were addressed in a base-case
quantification of biofuels potential. Other emerging advanced biofuel production
technologies and pathways were also evaluated in the study. The estimates regarding
biomass feedstock availability and biofuel potential for the base-case examples should be
valuable reference information that can be useful in understanding and evaluating the
potential for various emerging biofuel conversion technologies, such as biomass-derived
“green” gasoline, “green” diesel, or “green” jet fuel. For example, the information
presented for characterizing biomass feedstock availability (which includes factors such
as available acreage, locations, microclimates, and agricultural classification) is useful for
understanding and evaluating feedstock supply availability for a wide range of biofuel
conversion pathways. The estimates made for ethanol fuel potential in energy units (e.g.,
Btu’s) can be viewed in general terms as a useful gage regarding the amount of other
forms of liquid fuel that could be produced from biomass (such as gasoline, diesel, or jet
fuel).
There are significant opportunities for R&D to improve the attractiveness of
bioenergy production in Hawai’i over the next few years. Potential improvements
include optimizing conversion systems designs (or selection) based on economy-of-scale
The Potential for Biofuels Production in Hawai’i 1.0 Executive Summary
1-3
factors, optimizing co-product strategies, development of new crop alternatives
(including crop varieties selected or tailored to specific micro-climate conditions in
Hawai’i), and improvements in the yields from existing crops (such as sugarcane).
1.2.1 Commercial and Near Term Commercial Technologies
Biofuel conversion technologies are selected to convert available biomass
resources as efficiently as possible. Three different biomass feedstock categories were
identified for this project: 1) sugars; 2) fats, oils, and greases (FOG); and 3) fibers. Sugar
feedstocks can be readily fermented to produce ethanol. FOG can be converted into
biodiesel through transesterification. Biodiesel is similar to conventional diesel, but
contains about 8.5% less energy per gallon. Cellulose fibers, which include biomass
material such as wood, tall grasses, and crop residues, can be converted into biofuel
through biochemical conversion pathways (such as enzymatic hydrolysis and
fermentation) or through thermal conversion, where intermediate gases or liquid products
are reformed to useable liquid fuels. Table 1-1 lists feedstock types and conversion
pathways that were used to arrive at base-case biofuel production estimates in this report.
The Potential for Biofuels Production in Hawai’i 1.0 Executive Summary
1-4
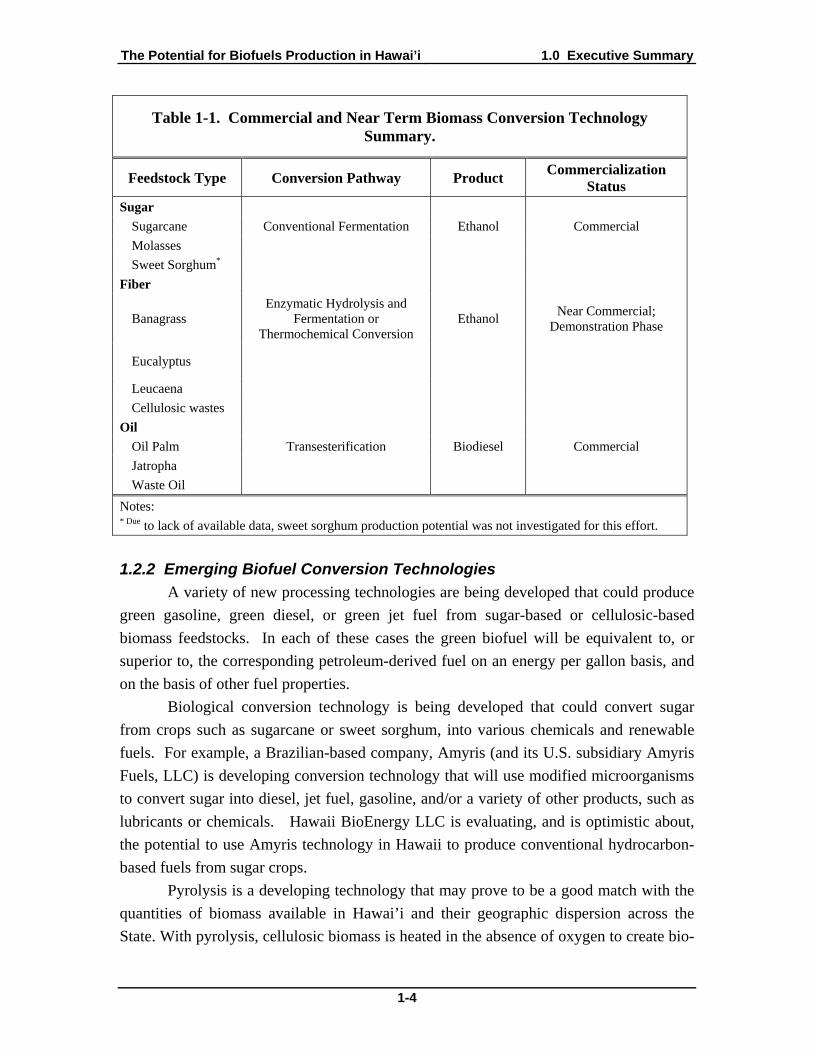
Table 1-1. Commercial and Near Term Biomass Conversion Technology Summary.
Feedstock Type Conversion Pathway Product Commercialization
Status
Sugar
Sugarcane Conventional Fermentation Ethanol Commercial
Molasses
Sweet Sorghum*
Fiber
Banagrass Enzymatic Hydrolysis and
Fermentation or Thermochemical Conversion
Ethanol Near Commercial;
Demonstration Phase
Eucalyptus
Leucaena
Cellulosic wastes
Oil
Oil Palm Transesterification Biodiesel Commercial
Jatropha
Waste Oil
Notes: * Due to lack of available data, sweet sorghum production potential was not investigated for this effort.
1.2.2 Emerging Biofuel Conversion Technologies
A variety of new processing technologies are being developed that could produce
green gasoline, green diesel, or green jet fuel from sugar-based or cellulosic-based
biomass feedstocks. In each of these cases the green biofuel will be equivalent to, or
superior to, the corresponding petroleum-derived fuel on an energy per gallon basis, and
on the basis of other fuel properties.
Biological conversion technology is being developed that could convert sugar
from crops such as sugarcane or sweet sorghum, into various chemicals and renewable
fuels. For example, a Brazilian-based company, Amyris (and its U.S. subsidiary Amyris
Fuels, LLC) is developing conversion technology that will use modified microorganisms
to convert sugar into diesel, jet fuel, gasoline, and/or a variety of other products, such as
lubricants or chemicals. Hawaii BioEnergy LLC is evaluating, and is optimistic about,
the potential to use Amyris technology in Hawaii to produce conventional hydrocarbon-
based fuels from sugar crops.
Pyrolysis is a developing technology that may prove to be a good match with the
quantities of biomass available in Hawai’i and their geographic dispersion across the
State. With pyrolysis, cellulosic biomass is heated in the absence of oxygen to create bio-

The Potential for Biofuels Production in Hawai’i 1.0 Executive Summary
1-5
oil, a mixture of hydrocarbons which resembles a low quality petroleum-based crude oil.
Numerous small to medium-scale pyrolysis systems could be used to produce an
intermediate bio-oil that can then be transported (via truck within an island, or via barge
or ship between islands) to a large centralized refining facility. Companies such as Ensyn
and Dynamotive have commercial pyrolysis systems that could be used in this type of
application. Further refining may then be able to convert the bio-oil into more readily
useable fuels, such as green gasoline, green diesel, and/or green jet fuel. One Hawaiian
petroleum refiner, Tesoro, is collaborating with a team of technology developers to begin
exploring the potential for refining biomass-derived pyrolysis oil into conventional fuels
in their refinery.
The Fischer-Tropsch (F-T) process, which is the conversion of biomass through
gasification and catalytic reformation of the biomass-derived syngas, offers the potential
to create a variety of different products including diesel fuel, gasoline, and jet fuel.
Based on current commercialization efforts, it appears that these F-T systems may need
to process 1,000 to 2,000 tons per day of biomass to be economically attractive. This
could be a drawback for development of these systems in Hawai’i, where geography
imposes limitations on resource availability and transportation. A commercial-scale
demonstration of this technology developed by CHOREN Industries will process about
235 tons/day of biomass to produce green diesel fuel at a facility in Germany; it will
provide useful information for smaller-scale Fischer-Tropsch-based systems that could
potentially be developed in Hawaii.
The use of microorganisms that can ferment syngas into ethanol may offer one
alternative approach to using catalysts for converting biomass-derived syngas to liquid
fuel It is possible that conversion units based on this syngas fermentation technology
can be commercially viable at a smaller scale than catalytic/Fischer-Tropsch systems for
converting syngas to liquid fuel – this could make the microorganism fermentation option
a good fit for the scale of biomass availability and system sizes suitable for Hawaii.
Companies such as Coskata, INEOS, and LanzaTech are developing these types of
conversion systems.
Emerging approaches are being developed that can convert FOG feedstocks to
“green” diesel via hydroprocessing or to jet fuels via deoxygenation and selective
cracking/isomerization. Since fats and greases are in limited supply in Hawai’i, the main
potential for FOG feedstocks would be plant oils. In our study of oil crop alternatives
and costs for Hawai’i, it was found that producing plant oil is distinctly more expensive
than producing cellulosic biomass. Vegetable oil from algae production offers significant
promise for producing large amounts of oil per acre of land; however, substantial
development efforts will be needed before the true viability of algal oil can be proven.

The Potential for Biofuels Production in Hawai’i 1.0 Executive Summary
1-6
The status of emerging biofuel technologies are discussed in greater detail in
Section 3.
1.2.3 Economies of Scale
Large biofuel production facilities are generally expected to experience economy-
of-scale benefits that will enable production of liquid fuel at a lower cost per gallon than
smaller facilities. This issue is of particular importance in Hawai’i where geography
imposes constraints on resource availability and transport of solid biomass feedstocks.
These constraints were taken into consideration in developing cost estimates for biofuels
production in Hawai’i. Detailed cost estimates for cellulosic ethanol production recently
updated by the National Renewable Energy Laboratory (NREL) showed cellulosic
ethanol conversion costs in the range of $0.92 per gallon (on a levelized basis) by the
year 2012 for large biochemical-based conversion facilities designed to process 2,200
tons per day of biomass feedstock (NREL, 2009). By comparison, in our base case
analysis for Hawai’i, a conversion cost estimate of $1.36 per gallon was used. This
estimate adjusts for economy-of-scale issues with the expectation that in Hawai’i, 500 to
800 tons per day may be a more likely scale for facilities based on acreage and transport
constraints. This potential economy-of-scale drawback for biofuel production in Hawaii
can be offset by the advantage that Hawaii facilities will have in marketing electricity co-
produced with biofuel for distinctly higher electricity prices than “mainland” facilities.
As noted earlier, technologies such as pyrolysis may offer solutions to the issues
of resource distribution and economies of scale related to biomass processing. Several
medium-scale (100 to 700 ton per day) pyrolysis facilities may be useful in converting
biomass into pyrolysis oil for processing at a centralized facility to produce transportation
fuels. It is likely that pyrolysis oil can be stored and transported with greater ease and at
lower cost than solid biomass feedstocks. The technology used in converting raw
biomass to pyrolysis oil is fairly straightforward and is generally well suited to small- to
medium-scale applications.
Although most conversion technologies options are likely to benefit from
economy-of-scale factors, not all will necessarily be affected to the same degree. For
example, the cost of transesterfication technologies used for producing biodiesel from
vegetable oils are generally not impacted as much by economy-of-scale issues as
conversion processes for producing ethanol from cellulosic biomass, such as biochemical
(e.g., enzymatic hydrolysis) or thermochemical (e.g. gasification) processes.

The Potential for Biofuels Production in Hawai’i 1.0 Executive Summary
1-7
1.3 Biofuel Potential from Hawai’i Resources There are two general categories of possible biomass resources that can be used
for biofuel production in Hawai’i: biomass residues and dedicated energy crops grown
specifically for fuel and energy production. The potential for these sources are
summarized below.
1.3.1 Potential from Biomass Residues in Hawai’i
Biomass residues encompass a wide variety of organic matter including
agricultural, forestry, and municipal waste. The waste streams evaluated in this effort for
their biofuel production potential include municipal solid waste, sewage sludge, FOG,
bagasse fiber, cane trash, molasses, pineapple processing waste, macadamia nut shells,
animal manures, and landfill gas. Table 1-2 shows biofuel production potential from
these wastes streams. Many of the identified waste streams are currently used for
processes other than biofuel production, so the economic and societal values of
competing uses will be important in determining the extent to which some of these
resources will be viable as feedstocks for biofuel production. The potential for ethanol
production from wastes shown in Table 1-2 is based on the use of net biomass residues
available, after current uses are subtracted from the total amount of waste currently
produced.
Table 1-2. Total Hawai’i Biofuel Potential from Waste.
Fuel Feedstock Total Hawai’i Potential Ethanol Cellulosic wastes 90 million gallons/yr
Ethanol Molasses 5 million gallons/yr
Biodiesel Waste oil 2.0 – 2.5 million gallons/yr
Methane Landfill gas 290 million scf/yr
A conversion process known as steam reformation could be used to convert the
methane in landfill gas into 950 million scf/yr of hydrogen. While there are other
theoretical paths for hydrogen production from biomass, none are expected to be
commercial transportation options to impact Hawai’i within the next two decades.
1.3.2 Potential from Dedicated Energy Crops in Hawai’i
The potential amount of crops that could be grown for biofuels production
throughout the state of Hawai’i was evaluated, including the estimated cost of producing
these crops. There are substantial variations in temperature and precipitation across the
Hawaiian Islands that will have significant bearing on the types of energy crops that can

The Potential for Biofuels Production in Hawai’i 1.0 Executive Summary
1-8
be successfully grown and the annual quantities of biomass that can be produced on
specific island locations. To evaluate the prime irrigated and non-prime rainfed options,
soil classifications were considered based on typical ambient temperatures and average
moisture conditions. This approach was also helpful in identifying the most appropriate
or promising pairings of different land types with different crops.
There are also significant variations in the suitability of soils for crop production,
as well as substantial variations in land slope that will impact the ability to grow and
harvest energy crops. To address these variations in microclimate, soil conditions, and
land slope, geographic information system (GIS) software was used to evaluate energy
crop suitability and energy crop productivity on land zoned for agriculture. The crop
production potential for rainfed non-prime agricultural land, and irrigated prime
agricultural land was quantified on each island.
There are a variety of potential herbaceous and woody plant species that could be
attractive as energy crops in Hawaii, which can be selected for suitability to the varied
microclimate and soil conditions found across the State’s islands. Some crops are well
known and substantial amounts of information and experience in growing these crops in
Hawaii is available. In other instances, crops with significant promise have been
identified and efforts to evaluate and field test productivity with the crops are underway.
The three crop categories considered for biofuel production are sugar, fiber, and oil crops.
Within these three categories, the six potential energy crops evaluated in detail in this
report are summarized in Table 1-3.
Table 1-3. Energy Crops Selected Evaluated for Hawai’i.
Sugar Crop Oil Crops Fiber Crops Sugarcane Jatropha
Oil Palm
Banagrass
Eucalyptus
Leucaena
Analysis performed by the University of Hawai’i found that fiber crops showed
the best potential for maximizing the tons of biomass that could potentially be produced
in Hawai’i. For example, an herbaceous crop such as banagrass could be grown on
warmer land (at lower elevations), and a woody crop such as Eucalyptus could be grown
on somewhat cooler land (at higher elevations). Table 1-4 shows the maximum
theoretical amount of biomass energy production potential in Hawai’i if all identified
lands were used for the production of these two crops. The estimates shown in Table 1-4
are based on the use of enzymatic hydrolysis as the conversion technology, which would
produce ethanol, as well as electricity as a co-product (where each ton of biomass is
The Potential for Biofuels Production in Hawai’i 1.0 Executive Summary
1-9
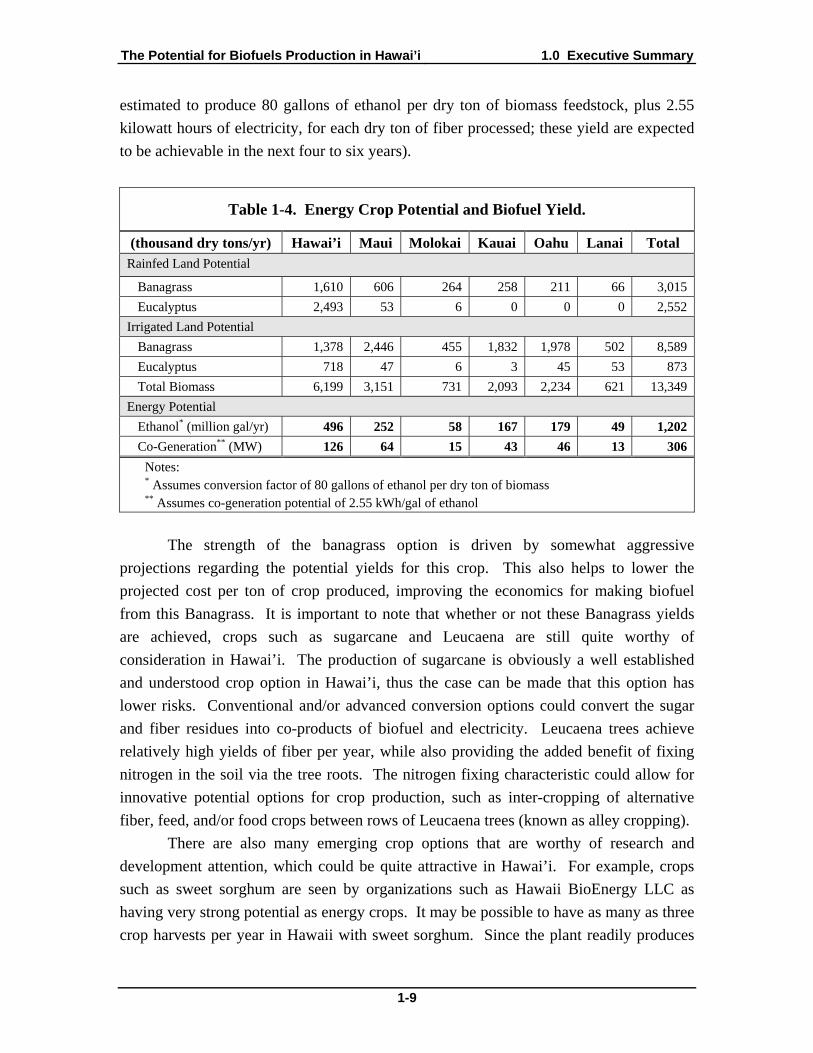
estimated to produce 80 gallons of ethanol per dry ton of biomass feedstock, plus 2.55
kilowatt hours of electricity, for each dry ton of fiber processed; these yield are expected
to be achievable in the next four to six years).
Table 1-4. Energy Crop Potential and Biofuel Yield.
(thousand dry tons/yr) Hawai’i Maui Molokai Kauai Oahu Lanai Total Rainfed Land Potential
Banagrass 1,610 606 264 258 211 66 3,015
Eucalyptus 2,493 53 6 0 0 0 2,552
Irrigated Land Potential
Banagrass 1,378 2,446 455 1,832 1,978 502 8,589
Eucalyptus 718 47 6 3 45 53 873
Total Biomass 6,199 3,151 731 2,093 2,234 621 13,349
Energy Potential
Ethanol* (million gal/yr) 496 252 58 167 179 49 1,202
Co-Generation** (MW) 126 64 15 43 46 13 306
Notes: * Assumes conversion factor of 80 gallons of ethanol per dry ton of biomass ** Assumes co-generation potential of 2.55 kWh/gal of ethanol
The strength of the banagrass option is driven by somewhat aggressive
projections regarding the potential yields for this crop. This also helps to lower the
projected cost per ton of crop produced, improving the economics for making biofuel
from this Banagrass. It is important to note that whether or not these Banagrass yields
are achieved, crops such as sugarcane and Leucaena are still quite worthy of
consideration in Hawai’i. The production of sugarcane is obviously a well established
and understood crop option in Hawai’i, thus the case can be made that this option has
lower risks. Conventional and/or advanced conversion options could convert the sugar
and fiber residues into co-products of biofuel and electricity. Leucaena trees achieve
relatively high yields of fiber per year, while also providing the added benefit of fixing
nitrogen in the soil via the tree roots. The nitrogen fixing characteristic could allow for
innovative potential options for crop production, such as inter-cropping of alternative
fiber, feed, and/or food crops between rows of Leucaena trees (known as alley cropping).
There are also many emerging crop options that are worthy of research and
development attention, which could be quite attractive in Hawai’i. For example, crops
such as sweet sorghum are seen by organizations such as Hawaii BioEnergy LLC as
having very strong potential as energy crops. It may be possible to have as many as three
crop harvests per year in Hawaii with sweet sorghum. Since the plant readily produces

The Potential for Biofuels Production in Hawai’i 1.0 Executive Summary
1-10
seeds for propagation, efforts to improve yields through plant selection techniques should
be able to progress rapidly. Similar to sugarcane, conventional conversion options (or
conventional, combined with advanced conversion options), could be used to convert the
sugar and as well as the fiber from sweet sorghum into co-products of biofuel and
electricity.
The survey of land potentially available for energy crop production in Hawai’i
concluded that there are approximately 810,000 acres of nonprime land and 300,000
acres of prime irrigated land within the state. It is believed that there would be less
competition for nonprime lands, making them more accessible for energy crop
production. However, irrigated lands offer significantly greater yields. Even though this
study identified significantly more non-prime land than prime land, the higher yields
achieved on prime irrigated lands lead to higher overall biomass production potential
from these lands than from unirrigated non-prime lands.
1.4 Emerging Options for Biofuel Production In addition to new biomass conversion methods, new crops and agricultural
approaches will likely lead to increased yields and may offer opportunities for farmers to
maximize their revenues with both energy and non-energy markets for their crops.
1.4.1 New Biomass Sources
Of the emerging biofuel options, production of biofuels from microalgae is a
particularly interesting alternative. A primary advantage of algae is its potential for
achieving very high yields per acre. It is theorized that some strains could yield as much
as 6,000 to 15,000 gallons per acre of usable plant oil, which is much greater than the
most productive land-based oil-seed crops. A substantial amount of research and
development is needed if these types of algal oil yields are to be achieved; however,
Hawai’i has the potential to become a center of microalgae research and development.
Several organizations are currently involved with research and development operations in
the state.
It is anticipated that algae would be grown in ponds. Land availability for
thousands of acres of ponds in Hawai’i would clearly present some unique challenges in
comparison to conventional crop production. Algae offers some key advantages,
including the ability to grow in brackish water (such as ocean water, instead of fresh
water), the ability to use/remove carbon dioxide from power plant stack gases (using the
CO2 for photosynthesis), and the ability to be produced on non-agricultural land.
Sweet sorghum and energy cane are other examples of herbaceous crops that may
prove to have significant potential in Hawai’i. However, since yield data for these crops
The Potential for Biofuels Production in Hawai’i 1.0 Executive Summary
1-11
is still being developed, the economics of these crops were not modeled in our study. As
noted earlier, sweet sorghum can produce both fermentable sugars as well as fiber.
Energy cane is a variation of sugar cane which produces less sugar but more cellulosic
biomass. New varieties of energy cane could be developed that maximize biofuel
production potential per acre of cane grown in Hawai’i.
1.4.2 Options for Improving Biofuel Economics
In addition to new crops, new processing and agricultural methods may have the
potential to improve the economics of crop and biofuel production. Integrated
biorefineries may be able to produce multiple co-products, including chemicals, animal
feed, fertilizer, pharmaceuticals, and/or food, in addition to energy in the form of liquid
fuels, electricity, or thermal energy. The mix of higher value products produced in the
biorefinery could reduce the cost of biofuel production. With respect to crop production,
new approaches such as alley cropping may be able to improve the profitability of
agricultural land, and help alleviate concerns over removing land from food production,
offering the potential for integrated food and fuel production.
1.5 Results and Discussion The following sections outline the total biofuel production potential of the state
relative to demand and the impact that pursuing a major biofuel expansion strategy would
have on land use. Recommendation and conclusions are also provided.
1.5.1 Current Fuel Consumption and Biofuel Demand
It is important to examine biofuel production potential in the context of current
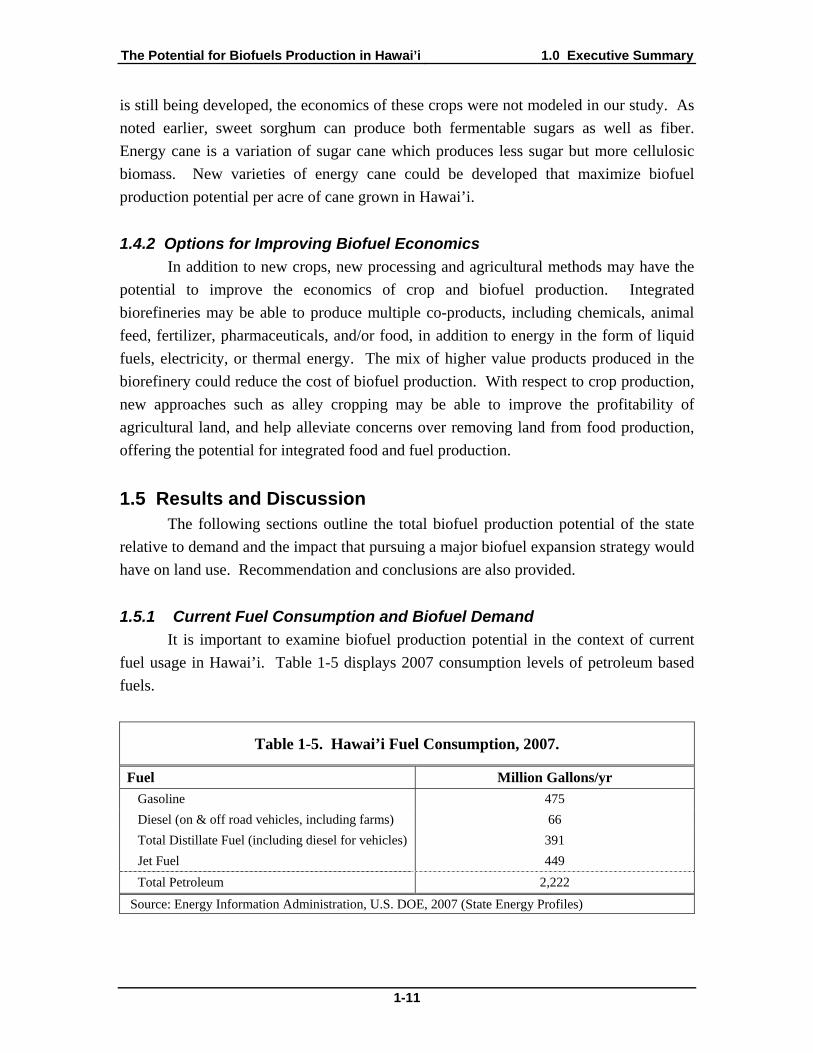
fuel usage in Hawai’i. Table 1-5 displays 2007 consumption levels of petroleum based
fuels.
Table 1-5. Hawai’i Fuel Consumption, 2007.
Fuel Million Gallons/yr
Gasoline 475
Diesel (on & off road vehicles, including farms) 66
Total Distillate Fuel (including diesel for vehicles) 391
Jet Fuel 449
Total Petroleum 2,222
Source: Energy Information Administration, U.S. DOE, 2007 (State Energy Profiles)
The Potential for Biofuels Production in Hawai’i 1.0 Executive Summary
1-12
If ethanol is used as a 10 percent blend in all gasoline sold in the state, the total
demand for ethanol in Hawai’i would be about 72 million gallons per year (adjusting for
equivalent gallons of gasoline, since ethanol has about two-thirds as much energy per
gallon as gasoline). Replacing 15 percent of the State’s gasoline demand, which is the
State’s goal for 2015, corresponds to 107 million gallons per year of ethanol, based on
gallons of gasoline equivalence; with the simplifying assumption that future demand
stays similar to current levels with advances in vehicle fuel efficiencies. Replacing 20
percent of the State’s gasoline consumption would require 143 million gallons per year of
ethanol on a gallon of gasoline-equivalence basis, which corresponds to the State’s
renewable fuel goal for the year 2020. Achieving the replacement of 15 to 20 percent of
gasoline consumption in Hawaii with ethanol would be facilitated if a portion of the
vehicle fleet includes flexible fuel vehicles that can use gasoline/ethanol blends with up
to 85 percent ethanol (E85). Alternatively, if biofuel in the form of “green” gasoline is
produced, then the 20 percent gasoline displacement target would not require flexible fuel
vehicles (and E85 fueling stations), and the 20 percent biofuel target would be about 95
million gallons of green gasoline consumption.
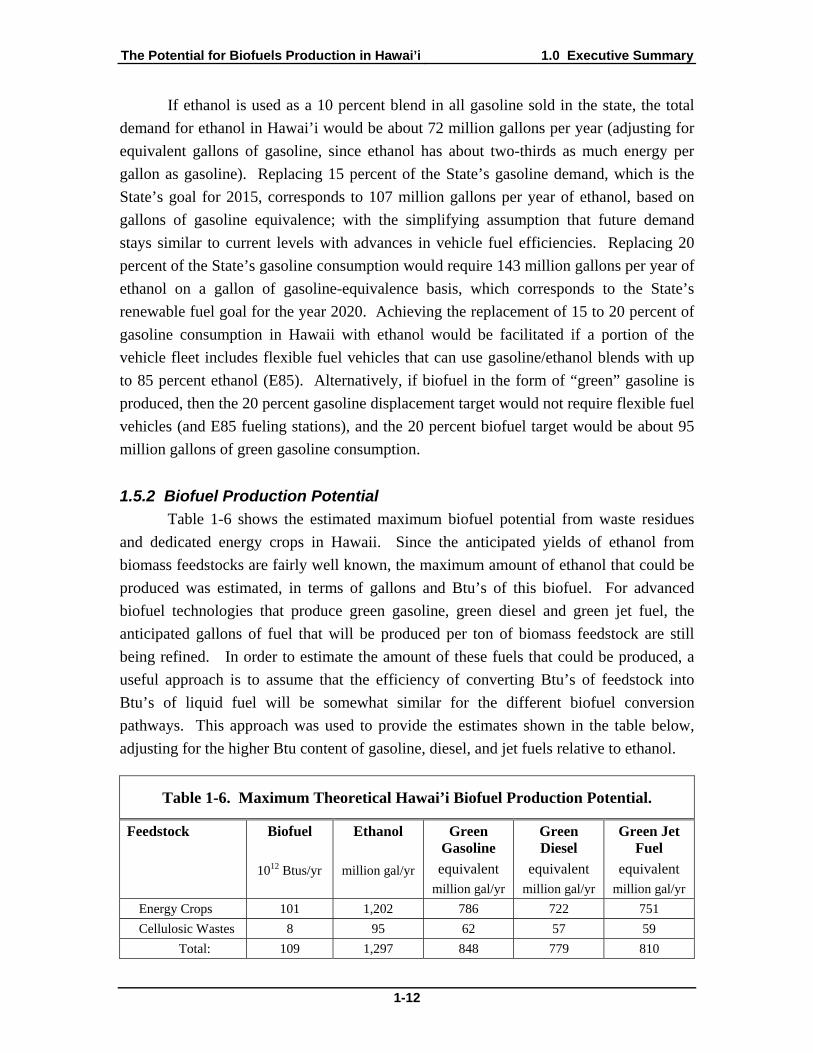
1.5.2 Biofuel Production Potential
Table 1-6 shows the estimated maximum biofuel potential from waste residues
and dedicated energy crops in Hawaii. Since the anticipated yields of ethanol from
biomass feedstocks are fairly well known, the maximum amount of ethanol that could be
produced was estimated, in terms of gallons and Btu’s of this biofuel. For advanced
biofuel technologies that produce green gasoline, green diesel and green jet fuel, the
anticipated gallons of fuel that will be produced per ton of biomass feedstock are still
being refined. In order to estimate the amount of these fuels that could be produced, a
useful approach is to assume that the efficiency of converting Btu’s of feedstock into
Btu’s of liquid fuel will be somewhat similar for the different biofuel conversion
pathways. This approach was used to provide the estimates shown in the table below,
adjusting for the higher Btu content of gasoline, diesel, and jet fuels relative to ethanol.
Table 1-6. Maximum Theoretical Hawai’i Biofuel Production Potential.
Feedstock Biofuel
1012 Btus/yr
Ethanol
million gal/yr
Green Gasoline
equivalent million gal/yr
Green Diesel
equivalent million gal/yr
Green Jet Fuel
equivalent million gal/yr
Energy Crops 101 1,202 786 722 751
Cellulosic Wastes 8 95 62 57 59
Total: 109 1,297 848 779 810

The Potential for Biofuels Production in Hawai’i 1.0 Executive Summary
1-13
The production levels shown in Table 1-6 assume utilization of all identified
agricultural land and unused biomass wastes/residues. Table 1-6 does not include yet-to-
be-determined production of feedstocks such as algae, which could be produced on land
that is not agriculturally zoned. Since there are many competing uses for agricultural
land, these production levels are meant to provide a broad maximum starting point in
understanding the potential for biofuel production in Hawaii. However, only a fraction of
the total potential is needed to meet the desired displacements for 2010, 2015, and 2020
targets in the State of Hawai’i Act 240.
The maximum theoretical case for potential biofuels production potential in
Hawai’i can serve as an important baseline to compare current consumption levels
against. Table 1-7 below compares current fuel usage to the energy content in the
maximum theoretical biofuel production case (cellulosic ethanol and fiber crops).
Table 1-7. Hawai'i Fuel Consumption, 2007.
Fuel Fuel Consumption*
(million gal/yr)
Energy Content
(Btu/gal)
Percent of Maximum Biofuel Potential for
Energy Crops Gasoline 475 128,900 8%
Diesel (on & off highway) 66 140,300 2%
Jet Fuel 449 135,000 12%
Total All Petroleum Uses 2,222 135,000 59%
* Source: Energy Information Administration, U.S. DOE
From Table 1-7 it can be seen that displacing 20 percent of the gasoline
consumption in Hawai’i would require about 8 percent of the maximum theoretical
potential from energy crops. Displacing 20 percent of the diesel fuel would require a
biofuel production capacity of approximately 2 percent of the maximum theoretical
potential from energy crops. Meeting the State’s goals under Act 240 for displacing 20
percent of gasoline and diesel fuel consumption combined, would require dedicating
about 10 percent of the potential land available for energy crop production, based on the
use of high-yielding energy crops. To gain a perspective on related land use issues, it can
be noted that the Hawaii BioEnergy members collectively oversee 150,000 acres of land
that they are evaluating for the production of energy crops and bioenergy products. The
magnitude this land area is equivalent to 13.5 percent of the total Hawai’i agricultural
land area identified for potential production of energy crops (i.e., 810,000 acres of non-
prime and 300,000 acres of prime land, as noted earlier). Overall, it appears that meeting

The Potential for Biofuels Production in Hawai’i 1.0 Executive Summary
1-14
the State’s goals under Act 240 for displacing 20 percent of gasoline and diesel fuel
consumption with biofuels seems quite achievable.
1.5.3 Crop Specific Considerations
It is important to recognize potential benefits and drawbacks of energy crops
considered in this evaluation. Sugar crops have been grown commercially in Hawai’i for
decades. This means there is a significant amount of knowledge, as well as identified
lands and equipment, for harvesting and processing sugarcane. In addition, food, biofuel,
and usable electricity are all potential products of sugarcane. For these reasons,
sugarcane production in is seen as one viable option as a feedstock for bioenergy
production in Hawaii.
In order for oil seed crops such as Oil Palm and Jatropha to be competitive in
Hawai’i, R&D would be needed to achieve higher yields per acre, reduce harvesting
costs, and/or develop high-value co-products.
According to the analysis performed by the University of Hawai’i, Banagrass
could be an attractive energy crop in Hawai’i, based on both potential yields and
economics. One challenge is the difficulty in finding locations in Hawai’i where
Banagrass will flower and seed. This poses a challenge for plant propagation and efforts
to improve yields for this crop, which need to be explored further to confirm the promise
for banagrass in Hawaii as a major energy crop alternative.
Sweet sorghum could offer strong potential as an energy crop for Hawaii. This
crop alternative is in a relatively early stage of evaluation, and reliable data on its
production potential was not available for this effort. Sweet sorghum readily produces
seeds in Hawaii; and, with the potential for planting and harvesting two to three crops per
year of sorghum in Hawai’i, this should enhance the ability to breed high-yielding
varieties of sorghum that produce more tons per year of sugar and fiber per acre.
Biofuel production from microalgae is in the early stages of development.
Researchers are still working to identify appropriate strains and develop production
techniques that are not susceptible to invasive microorganisms or lower yielding algae
strains that may be problematic. Most commercially produced algae is cultivated in
raceway ponds which require level horizontal surfaces; the option of developing
thousands of acres of algae ponds in Hawai’i is a distinct challenge, since much of the
terrain is sloped. As noted earlier, algae has a number of advantages, including being able
to use non-fresh water. In addition, algae can be used to capture waste carbon dioxide
from the exhaust of power facilities.

The Potential for Biofuels Production in Hawai’i 1.0 Executive Summary
1-15
1.5.4 Conclusions
It should be quite achievable for biofuels produced from in-state resources to
displace 20 percent of the gasoline and diesel fuel needed for vehicle transportation in
Hawai’i. This could be accomplished using about 10 percent of available agricultural
land for energy crop production to supply the required biomass feedstock.
There are a variety of energy crops and biofuel conversion technologies that could
be economically viable in Hawai’i. The State’s unique and varied geography,
microclimates, and infrastructure provide challenges in selecting and/or developing crops
and conversion technologies for commercially viable production of biofuels. Efforts in
the past to help the Hawaiian sugarcane industry address these state-specific challenges
provide a useful model for the needs of an emerging biofuel industry in Hawai’i. The
Hawaiian Sugar Planters' Association (now the Hawaii Agriculture Research Center
(HARC)) developed sugarcane varieties that were adapted to 13 different environments
in Hawai’i in order to address the range of microclimates and crop production challenges
found in the State. A similar effort to identify and optimize energy crops for the varied
environments in Hawai’i would help increase the likelihood that biofuel development
reaches its full potential in offsetting petroleum dependency and fostering economic
development centered on a new biofuel industry in Hawai’i.
The U.S. Department of Energy (DOE) and the National Renewable Energy
Laboratory (NREL) are engaged in a major initiative to support the development of
advanced biofuel conversion technologies in the U.S. With their expressed interest in
seeing Hawaii become a model for bioenergy production, they could play a valuable role
in ongoing efforts to identify and optimize conversion technologies suited to the
economy-of-scale and varied requirements for biofuel development and expansion in
Hawai’i.
In addition, identifying opportunities where some combination of biofuel, food,
electricity, and high value products can be produced at the same facility could help make
biofuel economics more favorable in specific circumstances.

The Potential for Biofuels Production in Hawai’i 2.0 Introduction
2-1
2.0 Introduction
2.1 Background This assessment of the potential amount of biofuels that could be produced in
Hawai’i from in-state resources was prepared for the State of Hawai’i Department of
Business, Economic Development, and Tourism (DBEDT) Strategic Industries Division.
Act 240, SLH 2006, established a statewide alternative fuels standard that ramps up to 20
percent by 2020. This act called for DBEDT “to conduct a statewide multi-fuel biofuels
production assessment of potential feedstocks and technologies, the economics of the
various renewable fuels pathways, and the potential for ethanol, biodiesel, and renewable
hydrogen production to contribute to Hawaii’s near-, mid-, and long-term energy needs.”
This report represents the analysis called for by that legislation, focusing on the potential
for biofuels production using a combination of waste biomass feedstocks available in
Hawai’i, and energy crop production.
2.2 Objective The objective of this project is to address the technical and economic prospects
for biofuels production in Hawai’i using the State’s existing and potential biomass energy
resources for biofuels production. This includes a consideration of potential waste
feedstocks, energy crops, biofuel conversion technologies, land and water availability,
agriculture infrastructure, regulatory issues, potential markets, and local and federal
policies and incentives. The information and analysis in this report is intended to assist
DBEDT in defining a roadmap to meet the objectives and targets established by the
alternative fuels standard created through Act 240.
2.3 Approach The potential supply of biomass residues available in Hawai’i was inventoried in
the report “Biomass and Bioenergy Resource Assessment for the State of Hawai’i;”
prepared for DBEDT by the University of Hawai’i, Hawai’i Natural Energy Institute in
2002 (the report is available online at the following website --
www.hawaii.gov/dbedt/info/energy/publications/biomass-assessment.pdf). That report
provided some useful baseline estimates of biomass residue availability, which has been
updated in the following report. Biomass residue sources reviewed in this study include
domesticated livestock wastes, forest products residues, agricultural residues, and urban
wastes. Agricultural wastes addressed include those generated from sugar cane,

The Potential for Biofuels Production in Hawai’i 2.0 Introduction
2-2
pineapple, and macadamia nut processing. The urban waste category was subdivided into
four types: municipal sold waste, food waste, sewage sludge or biosolids, and waste
greases.
This report also evaluates the potential amount of dedicated crops that could be
grown for biofuels production throughout the state of Hawai’i, including the estimated
cost of producing these crops. There are many potential plant species that could be
attractive as energy crops in Hawaii. Some crops are well known and substantial
amounts of information and experience in growing these crops in Hawaii is available. In
other instances, crops with significant promise have been identified and efforts to
evaluate and field test productivity with the crops are underway. The crops considered
for biofuel production represent sugar, fiber, and oil feedstocks. The potential energy
crops identified for this report includes:
Sugarcane (Saccharum officinarum)
Banagrass (Pennisetum purpureum)
Eucalyptus (Eucalyptus spp.)
Leucaena (Leucaena leucocephala)
Oil Palm (Elaeis guineensis), and
Jatropha (Jatropha curcas)
These crops were selected for evaluation because of their potential for biofuel production
in Hawai’i and because data is available for these crops in comparable climates to those
present in Hawai’i. As information and field test data becomes available in the future for
other crops that could be quite promising in Hawai’i (such as sweet sorghum or energy
cane), the information in this report should be quite useful for comparing/analyzing the
competitive merits of these alternative energy crop options.
In order to estimate the quantities of biofuels that could be produced in Hawai’i
from energy crops, the amount of land that could potentially be used for energy crop
production was evaluated. As a means for estimating Hawaii’s biofuel generation
potential, this report often focuses on the maximum theoretical potential based on full
production of all identified lands. In reality, it will not be possible for all identified lands
to be dedicated to production of energy crops because of competing uses for agriculture
and grazing. The lands evaluated in this study fall in to two primary categories, prime
irrigated agricultural lands and non-prime rainfed agricultural lands. Non-prime lands are
examined first because it is believed that these lands would be most accessible for biofuel
production. Prime irrigated lands have the advantage of producing significantly higher
yields per acre than non-prime lands, but there is likely to be more competition for these
lands with other forms of agriculture. It may be possible to use a portion of the prime

The Potential for Biofuels Production in Hawai’i 2.0 Introduction
2-3
lands for dedicated energy crops, and/or for producing food and fuel feedstocks with
integrated crop and processing strategies.
Across the Hawaiian Islands there are substantial variations in temperature and
precipitation that will have significant bearing on the types of energy crops that can be
successfully grown and the annual quantities of biomass that can be produced on specific
island locations. To evaluate the prime irrigated and non-prime rainfed options, soil
classifications were considered based on typical ambient temperatures and average
moisture conditions. This approach was also helpful in identifying the most appropriate
or promising pairings of different land types with different crops.
There are also significant variations in the suitability of soils for crop production,
as well as substantial variations in land slope that will impact the ability to grow and
harvest energy crops. To address these variations in microclimate, soil conditions, and
land slope, geographic information system (GIS) software was used to evaluate energy
crop suitability and energy crop productivity on land zoned for agriculture. The crop
production potential for rainfed non-prime agricultural land, and irrigated prime
agricultural land was quantified on each island.
Sugar feedstocks, such as sugarcane, can be used to produce ethanol through a
conventional fermentation process. Fiber crops such as Banagrass, Eucalyptus and
Leucaena can be used to produce ethanol through biochemical or thermochemical
conversion processes. For oil feedstocks such as Oil Palm and Jatropha,
transesterfication can be used to produce biodiesel. Table 2-1 below shows the
conversion pathways evaluated for each identified feedstock.
Table 2-1. Biomass Conversion Technology Summary.
Crop Type Conversion Pathway Product Commercialization
Status
Sugar
Sugarcane Conventional Fermentation Ethanol Commercial
Fiber
Banagrass Enzymatic Hydrolysis &
Fermentation or Thermochemical Conversion
Eucalyptus Ethanol Near Comercial, Demonstration Phase
Leucaena
Oil
Oil Palm Transesterification Biodiesel Commercial
Jatropha

The Potential for Biofuels Production in Hawai’i 2.0 Introduction
2-4
It should be noted that while conventional fermentation and transesterfication are
commercially available, various biochemical and thermochemical pathways for ethanol
production are still in the demonstration or pre-commercial phase.
Finally, efforts were made to estimate both the cost of production for each type of
biomass and the cost of converting this biomass to biofuels. For breakeven analysis, the
assumption was made that the market price of ethanol would be $2.41/gallon. These
economic evaluations help to identify the most promising opportunities for near term
biofuel production from energy crops in Hawai’i.

The Potential for Biofuels Production in Hawai’i 3.0 Conversion Technologies
3-1
3.0 Biomass Conversion Technology Options and Issues
There are a variety of different biofuels and conversion pathways for biofuel
production from available biomass resources in Hawai’i. Each technology has certain
benefits, constraints and feedstock requirements, which are discussed in further detail
below. Table 3-1 summarizes the biomass conversion technologies discussed in this
report. Table 3-2 below shows the density and energy content of different liquid fuels.
Table 3-1. Biomass Conversion Technology Summary.
Fuel Conversion Pathway Commercialization Status Ethanol Conventional Fermentation Commercial
Ethanol Enzymatic Hydrolysis Pre-Commercial
Ethanol Thermochemical Pre-Commercial
Biodiesel Transesterification Commercial
Renewable Diesel Fischer-Tropsch Pre-Commercial
Hydrogen Methane Reformation Commercial
Hydrogen Biomass Gasification Pre-Commercial
Hydrogen Microorganisms Research & Development
Table 3-2. Energy Content of Liquid Fuels.
Fuel Density Energy Content
(lb/gal) (Btu/gal) Ethanol 6.58 84,300
Biodiesel 7.50 127,700
Gasoline 6.16 128,900
Diesel 7.02 140,300
Jet Fuel 6.71 135,000
3.1 Ethanol Ethanol is an alcohol that can be used as a high-octane fuel, either blended with
gasoline or alone. Ethanol is traditionally made via fermentation of sugar- or starch-
containing feedstocks such as sugarcane or corn. There are also emerging technologies to
produce ethanol from cellulosic biomass feedstocks, such as wood, corn stover or
bagasse, through either a biochemical or thermochemical mechanism.

The Potential for Biofuels Production in Hawai’i 3.0 Conversion Technologies
3-2
3.1.1 Conventional Fermentation
Conventional fermentation is a biochemical reaction whereby microorganisms
(usually yeasts) break down sugars to make ethanol and carbon dioxide. After
fermentation, the mixture is distilled or mechanically separated to recover alcohol from
the reactor solution. For transportation fuel applications, pure ethanol is mixed with a
denaturant to render it unfit for human consumption.
In Hawai`i, the principal feedstock for conventional fermentation is sugar from
sugarcane. Although there is not a significant amount of ethanol being produced from
sugar feedstocks currently in Hawai’i (or elsewhere in the United States), Brazil and
other countries are actively producing ethanol from sugarcane, sugar beets, and molasses.
This demonstrates that it can be economically feasible to produce ethanol using these
feedstocks. However, the economic drivers for ethanol production in Hawai’i are
sufficiently different from those in Brazil to make direct economic comparisons difficult,
as discussed in more detail later in the following section.
3.1.2 Advanced Processing Technologies
Ethanol can also be produced via emerging technologies that utilize the
carbohydrates locked in cellulose and hemicellulose polymers found in plants. As an
example, bagasse is a fibrous sugar cane residue that cannot be converted to ethanol via
traditional fermentation. While it is currently burned in recovery boilers to produce
process steam, advanced cellulosic ethanol technologies process bagasse to produce
additional ethanol. Ethanol produced from these technologies is known as “cellulosic
ethanol.” Much attention is currently focused on commercializing cellulose-to-ethanol
technologies, which are described in greater detail below.
At present, there is limited information in the public domain regarding process
characteristics of advanced ethanol processing technologies, and only a fraction of the
information available is of a quantitative nature. In large part this is because these
technologies are still emerging and are not yet commercially established. Few of the
technology suppliers have begun construction of commercial-scale facilities, much less
begun commercial operation. Therefore, none of these technologies has been
successfully operated at scale to provide empirical performance that verifies the
theoretical performance suggested by process simulations. In addition, nearly all of the
developers of these technologies are private entities with little, if any, incentive to
disclose the process features that provide them with competitive advantage.
The Potential for Biofuels Production in Hawai’i 3.0 Conversion Technologies
3-3
Hydrolysis
Hydrolysis is the chemical process that breaks down biomass polymers into
component sugars. The hydrolysis breaks down cellulose and hemicellulose into simple
sugar compounds that can be fermented to ethanol. There are two principal hydrolysis
technologies: enzymatic hydrolysis and acid hydrolysis.
Enzymatic hydrolysis uses specific protein compounds (cellulose enzymes) to
break down complex carbohydrates. A recent technical development has been the
introduction of simultaneous saccharification and fermentation (SSF). In SSF, cellulose
enzymes and fermenting microbes are combined in the same reaction vessel. As sugars
are hydrolyzed, they are immediately fermented to ethanol.
Acid hydrolysis uses strong acids to break down cellulose and hemicellulose. The
process can use either concentrated acid or dilute acid. Dilute acid hydrolysis is the
oldest cellulosic ethanol technology. In dilute acid systems the acid is typically
neutralized in the final process stage, whereas with concentrated acid systems, the acid is
recaptured and recycled, while the sugars are neutralized and funneled to a fermentation
reactor.
Thermochemical
Another way to produce cellulosic ethanol is by thermally breaking down
lignocellulosic material into syngas (gasification) and catalytically converting the syngas
to alcohols. Gasification refers to the process in which biomass is heated in an oxygen-
starved environment to produce a mixture of carbon monoxide and hydrogen, known as
syngas. The oxygen content allowable for gasification is about one-third of the oxygen
needed for normal combustion. The syngas is catalytically reacted in a modified Fischer-
Tropsch synthesis process to make alcohols. Ethanol can then separated from other
alcohols and by-products. Compared to biochemical conversion technology,
thermochemical technology has the advantage of being able to convert the lignin that
binds the cellulose and hemicellulose material together into syngas and liquid fuel, as
well as converting the cellulose and hemicellulose to syngas and liquid biofuel, whereas
hydrolysis converts only the cellulose and hemicellulose to the plant matter, and another
use must be found for the lignin by-product (typically the lignin will be used as fuel to
meet the energy needed for the conversion process).
Thermochemical ethanol conversion has not yet been successfully demonstrated
at commercial scales, although there are many companies that have constructed pilot-
scale plants and are initiating construction of demonstration-scale plants. In Hawai`i,
Gay & Robinson is working with Clear Fuels Hawai’i to construct a demonstration-scale
gasification facility for the production of cellulosic ethanol from bagasse.

The Potential for Biofuels Production in Hawai’i 3.0 Conversion Technologies
3-4
3.1.3 Feedstock Suitability
For conventional ethanol, feedstocks that are high in sugar or starch, such as
sugarcane, sugar beets, molasses, or corn, are suitable for fuel production. In Hawai`i,
sugarcane is viewed as the preferred crop for sugar-based ethanol production, while
molasses is also a suitable feedstock.
For cellulosic ethanol, potential feedstocks include any lignocellulosic material,
including wood, energy crops, fibrous agricultural waste, and other municipal waste
streams. Sugarcane fiber, Banagrass, and Eucalyptus trees are some of the primary
cellulosic feedstocks that have been studied as potential sources in Hawai’i. Agricultural
wastes and municipal wastes are potentially attractive for the production of ethanol, as
they can often be obtained at lower costs than dedicated biomass energy crops.
3.1.4 Anticipated Cost Competitiveness
Ethanol is the most widely used biofuel and has the most mature markets when
compared to biodiesel and biomass-derived hydrogen. Some components of the ethanol
cost structure are outline below. A summary of the estimated costs for different ethanol
conversion technologies is outlined in Table 3-3.
Currently, a large number of technology suppliers are competing to become the
first commercial facility to produce ethanol from cellulosic feedstocks via a second
generation process. Most technologies remain at the pilot or demonstration stage.
Commercial data for ethanol yield, capital cost, operating cost, and efficiency for
different advanced processing technology companies has not been firmly established, so
estimates for these figures are expressed in ranges.
Advanced ethanol technologies are not currently cost competitive with
conventional ethanol technologies. Although both hydrolysis and thermochemical
processes have promise, the capital cost are significantly higher than conventional
fermentation. However, substantial development efforts are underway to reduce capital
costs and improve performance in the effort to commercialize advanced cellulosic
processes. Key advantages of advanced technologies are that they can utilize lower-value
feedstocks that can be considerably less expensive than sugar or starch feedstocks, and
the amount of cellulosic material that can be obtained per acre and from various sources
is much greater than the amount of sugar or starch that can be produced – thus the use of
cellulosic feedstocks could significantly increase the amount of biofuels that could be
produced on Hawai’i. The U.S. Department of Energy has set a cost target of $1.33 per
gallon by 2012 for cellulosic ethanol, and $1.17 per gallon by 2017. DOE has estimated
that at this price cellulose is can be competitive.

The Potential for Biofuels Production in Hawai’i 3.0 Conversion Technologies
3-5
Table 3-3. Hawai’i Ethanol Conversion Cost Estimates Summary.
Conversion Pathway Feedstock Costs ($/gal ethanol)
Capital Cost ($/gal annual capacity)
O&M Cost ($/gal ethanol)
Conventional Ethanol (Raw sugar)
1.50 2.10 – 2.40 0.90
Enzymatic Hydrolysis1 0.312 4.00 – 8.00 0.35
Thermochemical3 0.314 4.00 – 8.00 0.70 – 1.00
Notes: 1 Assumes bagasse feedstock 2 Assumes 80 gal/ton yields. Bagasse price is $25/ton, approximately equal to the avoided cost of
coal. 3 Assumes bagasse feedstock 4 Assumes 80 gal/ton yields. Bagasse price is $25/ton, approximately equal to the avoided cost of
coal.
Feedstock Costs
For mainland US conventional ethanol production, corn is the primary feedstock.
The most likely feedstock for ethanol production in Hawai’i is sugarcane, although there
has been a steady decline in land used for sugarcane crops since 1990 (see Figure 3-1).
The price of US sugar has been above world sugar prices because of government support
for domestic production. During the 2000s, US raw sugar prices have ranged from 19 to
22 cents per pound. One gallon of ethanol can be produced from 14 pounds of sugar,
equating to approximately 140 gallons of ethanol per ton of sugar. On a raw feedstock
basis, one ton of unprocessed sugarcane stalks yields around 20 gallons of ethanol.
Comparatively, one ton of molasses with 50 percent fermentable sugars yields about 70
gallons of ethanol.
0
30,000
60,000
90,000
120,000
150,000
180,000
1990
1992
1994
1996
1998
2000
2002
2004
Acr
es
Figure 3-1. Decline in Hawaiian Sugar Cane Land (Source: Gay & Robinson).

The Potential for Biofuels Production in Hawai’i 3.0 Conversion Technologies
3-6
For cellulosic ethanol, feedstock costs vary greatly depending on location.
Ethanol plants will be more economical if located at or near sugarcane processing
facilities. Transportation costs can be high for biomass, particularly feedstocks such as
bagasse with low density and/or high moisture content. The transportation component of
the total delivered cost can be greater than the raw resource cost for low value feedstocks.
In Hawai`i, the power generation sector would be a competitor with the cellulosic
ethanol sector for biomass wastes, as the state Renewable Portfolio Standard requires a
portion of electricity be generated by renewable sources, which could include biomass.
It is likely that the competition for cellulosic feedstocks will put upwards pressure on
biomass prices. As bagasse is currently used as boiler fuel for sugar processing, its
minimum cost would be the cost of replacement boiler fuel if the bagasse were used to
produce biofuels.
Capital Costs
Traditional sugarcane ethanol plants costs have been estimated by the USDA to
be around $2.401 per annual gallon of capacity. This is higher than corn-based ethanol
plants ($1.50 per gallon) primarily due to higher feedstock preparation equipment costs.
Developmentally, thermochemical cellulosic ethanol plants are still in the
demonstration stage. As such, it is difficult to estimate the capital costs of future
commercial facilities. Enzymatic hydrolysis plants are not yet fully commercialized.
The capital costs for cellulose-to-ethanol plants are currently estimated to be in the range
of $4.00-$8.00 per gallon. Many are expecting capital costs for both enzymatic and
thermochemical ethanol plants to become competitive with traditional ethanol plants by
2012.
O&M Costs
Ethanol production from sugarcane requires less steam and electricity than sugar
production. In addition, sugarcane trash can be either combusted for electricity or further
processed to produce cellulosic ethanol, depending on which option is technically and
economically advantageous. As one ton of bagasse is approximately equivalent to one
barrel of oil on an energy basis, there may be opportunities to use a different energy
sources for the generation of steam and electricity while converting bagasse to ethanol.
While replacing bagasse with another energy source that must be purchased would
increase operating costs, the sale of ethanol provides additional revenue. This tradeoff
may be attractive.
1 “The Economic Feasibility of Ethanol Production from Sugar in the United States”, USDA, July 2006.

The Potential for Biofuels Production in Hawai’i 3.0 Conversion Technologies
3-7
In the report “The Economic Feasibility of Ethanol Production from Sugar in the
United States” published by the USDA, the average cost to produce ethanol from
sugarcane in Brazil was estimate to be $0.81 per gallon, including feedstock processing
costs and excluding capital costs. The operating costs in Hawai’i would likely be higher
than in Brazil, as labor costs are greater. Additionally, the USDA estimates the
processing costs to produce ethanol from molasses at $0.91 per gallon. For comparison,
the production cost for dry milling of corn has been around $1.05 per gallon of ethanol,
with 50 percent of the cost resulting from corn procurement and 50 percent resulting from
processing costs (it should be noted that corn prices have doubled over the last year or so,
in large part to due to strong demand for corn-to-ethanol production, which raises the cost
to about $1.50 to produce a gallon of ethanol from corn at current prices). Processing
costs in sugarcane ethanol plants are lower because it is easier to make ethanol from
sugar than from starch in grains, even if capital costs are higher.
Until recently the cost of cellulose-digesting enzymes has been a key barrier to
economic production of ethanol via enzymatic hydrolysis. Many companies are working
on developing processes to substantially reduce enzyme costs to improve process
economics. For example, Novozymes and Genencor have created genetically modified
organisms to produce large quantities of cellulose-digesting cellulase enzymes. With this
breakthrough, the cost of enzymes dropped from around $5/gal ethanol to around $0.15-
$0.30/gal ethanol. Still, it appears that economic competitiveness of enzymatic
hydrolysis may be several years away.
Gasification processes tend to be relatively energy intensive, typically requiring
substantial amounts of electricity, process steam, and water. Energy costs can be
substantially reduced by extracting a portion of the syngas to use as fuel to meet process
steam/energy requirements. Although this would reduce the ethanol output by roughly
one-third, it would substantially avoid the need for other fuels, lowering O&M costs.
Predicted Costs
The costs of for advanced cellulose-to-ethanol technology are predicted to
decrease given the significant research and development efforts underway through
government and private sector initiatives. Figure 3-2 and Figure 3-3 illustrate
NREL/DOE cost projections for enzymatic hydrolysis processes and gasification/alcohol
synthesis processes respectively. NREL’s recent projections are that it will cost
approximately $1.49 per gallon in year 2012 to produce ethanol from cellulosic biomass
through enzymatic hydrolysis. Of this, the feedstock costs accounts for approximately
$0.60 per gallon, conversion costs are expected to account for the remaining $0.89 per
gallon. The production of ethanol through thermochemical means is expected to cost
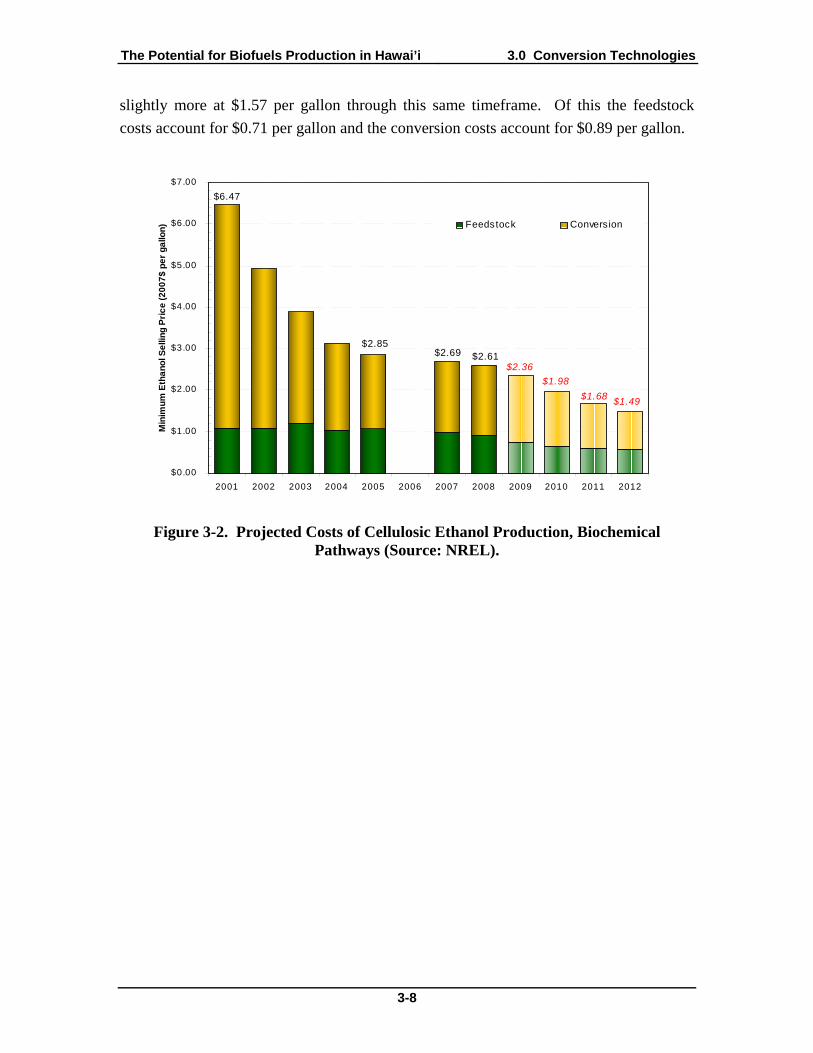
The Potential for Biofuels Production in Hawai’i 3.0 Conversion Technologies
3-8
slightly more at $1.57 per gallon through this same timeframe. Of this the feedstock
costs account for $0.71 per gallon and the conversion costs account for $0.89 per gallon.
$0.00
$1.00
$2.00
$3.00
$4.00
$5.00
$6.00
$7.00
2001 2002 2003 2004 2005 2006 2007 2008 2009 2010 2011 2012
Min
imu
m E
tha
no
l Se
llin
g P
ric
e (
20
07
$ p
er
ga
llon
) Feedstock Conversion
$6.47
$2.85 $2.69 $2.61
$2.36
$1.98
$1.68 $1.49
Figure 3-2. Projected Costs of Cellulosic Ethanol Production, Biochemical Pathways (Source: NREL).

The Potential for Biofuels Production in Hawai’i 3.0 Conversion Technologies
3-9
Figure 3-3. Projected Costs of Cellulosic Ethanol via Thermochemical Pathways (Source: NREL).
3.1.5 Ethanol Production Potential
The anticipated conversion rates for ethanol are listed in Table 3-4. Second
generation ethanol technologies are still being developed and have exhibited a range of
yields at different scales of production.
Table 3-4. Ethanol Yields.
Conversion Pathway Feedstock Typical Yield (gal/dry ton feedstock) Conventional Ethanol Raw sugar 135
Conventional Ethanol Molasses 69 – 72
Enzymatic Hydrolysis Bagasse 60 – 90*
Thermochemical (self-sufficient) Bagasse 80 – 95**
Thermochemical (maximum alcohol)
Bagasse 110 – 130**
Notes: * Lignin is used to provide process steam and power. ** Some of the syngas is diverted to provide process steam for self-sufficient operation. Under the
maximum alcohol operation, natural gas is used for process steam and all syngas is converted to alcohol. Other alcohols are typically produced in addition to ethanol, particularly methanol.
The Potential for Biofuels Production in Hawai’i 3.0 Conversion Technologies
3-10
It is expected that ethanol yields will increase as further development efforts
improve the processes. For example, the DOE estimates yield increasing up to 104
gal/dry ton feedstock by the year 2020 for both biochemical and thermochemical
pathways (see Figure 3-2 and Figure 3-3). By 2030, the targets are 115 gal/dry ton.
These figures predict improvements in both feedstock characteristics and process
engineering.
3.1.6 Other Potential Products
Methanol is an alcohol related to ethanol. Methanol can easily produced from
syngas via catalytic reactions. Methanol has multiple potential uses. Methanol can be
used as a fuel directly; alternatively, it is an important feedstock for the production of
biodiesel (representing about 10 to 20 percent of the feedstock used to make vegetable oil
into biodiesel via transesterification); and methanol has value in the chemical commodity
market. Many other complex organic compounds utilize methanol as building blocks or
reactants.
Second generation ethanol technologies can also produce steam and power as co-
products. For the hydrolysis pathway, the lignin component separated out of the
cellulosic biomass can be a useful boiler fuel to produce process steam and electricity in
excess of process requirements. The excess electricity can be fed directly to the grid as
renewable power. For the gasification pathway, syngas can be diverted from ethanol
production to fire a boiler for process steam and power generation. Although diverting
syngas for the production of process heat reduces ethanol yield, this also reduces the use
of fossil fuels in the production of ethanol.
3.2 Biodiesel Biodiesel is a fuel refined from vegetable oils (soy, rapeseed, palm, etc.) or
animal fats. It is a nontoxic, biodegradable, and renewable fuel that can be used in diesel
engines with little or no modification. The use of biodiesel for transportation applications
is a relatively new phenomenon but is gaining acceptance and growing rapidly. To put
the growth of this market into context, as recently as 2004 total biodiesel production
capacity amounted to only 25 million gallons per year (MGY). According to the
National Biodiesel Board (NBB), as of January 2008, there were 171 companies with
biodiesel manufacturing plants in the U.S. with installed capacity of 2.24 billion gallons
per year. According to NBB, actual biodiesel production in fiscal year 2007 was 450
million gallons. By comparison, total distillate fuel consumption in the US is about 60
billion gallons per year; and for the state of Hawai’i total distillate fuel consumption for
all uses was about 307 MGY in 2005.

The Potential for Biofuels Production in Hawai’i 3.0 Conversion Technologies
3-11
3.2.1 Conventional Biodiesel Transesterification
Transesterification is the most common way of producing biodiesel. In
transesterification, an alcohol, such as methanol, is reacted with the oil over the presence
of a catalyst, usually sodium or potassium hydroxide. This chemical reaction results in
glycerin (co-product) and methyl esters (biodiesel compounds). The methyl esters are
collected, washed, and filtered to yield pure biodiesel. The glycerin co-product has
several commercial uses in the cosmetics and chemicals industries, and research is
underway to explore new options for converting glycerin into fuel(s) or higher value
chemicals.
3.2.2 Other Renewable Diesel Technologies
Fischer-Tropsch (FT) diesel is produced from synthesis gas (“syngas”, a mixture
of mostly CO and H2) derived from the gasification of carbonaceous materials, such as
coal, biomass or natural gas. Based on the feedstock used, it is also known as CTL (“coal
to liquid”), GTL (“gas to liquid”), BTL (“biomass to liquid”), or some combination of
these routes. The term Fischer-Tropsch refers to a catalytic reaction where carbon
monoxide and hydrogen gas are converted to hydrocarbon chains. The main process
reaction is the following:
(2n+1)H2 + nCO CnH(2n+2) + nH2O
The reaction produces a range of different hydrocarbon fractions, but consists
largely of diesel, jet fuel, and low-octane gasoline (naphtha). FT diesel is virtually sulfur
free and has the same viability and functionality as diesel fuel. The main combustion
property of the fuel, the cetane index, is typically near 70. This is superior to most on-
road diesel blends which have cetane indexes of 40 to 50. Greater detail for the
economics and design of a BTL plant is presented in Section 3.4.
Other technology options are available for the production of diesel fuel, although
none have the commercial experience or economic potential as esterification and FT.
Greater detail for other alternatives will be presented later in this section.
3.2.3 Economics of Using On-Island Resources Compared to Imported
Vegetable Oils
To the extent possible, using on-island resources for biofuel production is
preferable to using imported resources. However, there is a low volume of animal fats
and vegetable oils currently produced in Hawai`i. For ethanol markets, Gay & Robinson
has estimated that ethanol produced locally in Hawai’i enjoys a $0.15 to $0.25 per gallon

The Potential for Biofuels Production in Hawai’i 3.0 Conversion Technologies
3-12
freight advantage over imported ethanol, depending on the island. It is expected that
biodiesel produced locally using local feedstocks would enjoy a similar cost advantage
over imported biodiesel or local biodiesel manufactured from imported vegetable oils.
3.2.4 Feedstock Suitability
As noted earlier, biodiesel can be produced from oils and sources of free fatty
acids, such as animal fat, vegetable oils, and waste greases. Algal oil is another feedstock
that has been investigated for technical and economic feasibility. There is ongoing
research into algal oil and results look promising, but commercialization is likely several
years away. Essentially all types of triglycerides or free fatty acids are suitable to make
biodiesel.
Animal fats and waste vegetable oils make excellent feedstocks for biodiesel
because they are low value products. Used oil from restaurants and eateries can be
obtained at low costs. Tallow and chicken fat are low value products from animal
rendering and poultry industry, respectively that are suitable feedstocks for biodiesel
production.
Suitable feedstocks for Fischer-Tropsch diesel are virtually the same as those for
thermochemical (gasification-based) ethanol production. Any lignocellulosic material,
including wood, energy crops, agricultural waste, and other municipal waste streams are
potentially suitable.
3.2.5 Anticipated Cost Competitiveness
Historically, biodiesel has not been economically competitive compared to
petroleum diesel without some type of governmental incentive. However, rising
petroleum oil prices, geopolitical concerns, and oil price volatility are improving
biodiesel economics. However, it is unlikely that there is enough waste oil and tallow to
be a major feedstock for biodiesel production in Hawai’i. A summary of the costs of
biodiesel and Fischer-Tropsch diesel conversion technologies is outlined in Table 3-5.

The Potential for Biofuels Production in Hawai’i 3.0 Conversion Technologies
3-13
Table 3-5. Hawai’i Biodiesel Conversion Cost Summary.
Conversion Pathway Feedstock Costs
($/gal)
Capital Cost
($/gal annual capacity) O&M Cost
($/gal) Transesterification* 0.45 – 0.55 0.80 – 1.20 0.20 – 0.40
Fischer-Tropsch Diesel** 0.29 2.50 – 3.50 0.70 – 1.00
Notes: * Assumes waste oil ** Assumes bagasse. Bagasse price is assumed to be approximately $25/ton, approximately equal to
the avoided cost of coal.
Feedstock Costs
The largest biodiesel production cost component is for the oil or fat feedstock (see
Figure 3-4). Depending on the size of the biodiesel production facility and the feedstock
used, the feedstock cost can account for up to 75 to 85 percent of the total production cost
per gallon.
Feedstock, $3.08, 89%
Chemical, $0.19, 5%
Energy, $0.03 , 1%
Overhead and Maintenance,
$0.06 , 2%
Depreciation, $0.08, 2%Labor, $0.03 , 1%
Figure 3-4. Production Cost Distribution ($/gal) for a Typical 30 MGY Soy Biodiesel Plant (Adapted from Building a Successful Biodiesel Business).
Malaysian palm oil has been the cheapest oil-based feedstock, but prices have
been on the rise, as shown in Figure 3-5. Several Asian countries have passed legislation

The Potential for Biofuels Production in Hawai’i 3.0 Conversion Technologies
3-14
to promote biofuel use, which has greatly increased palm oil demand. Moreover, there is
social pressure to prevent farmers from destroying rain forests to make more room for oil
crops, limiting supply growth.
Figure 3-5. Historical Palm Oil Prices2
Feedstock prices are largely tied to commodity markets and many oils have
competing markets in the food industries. As such, their prices are constantly shifting.
For example, soybean oil prices increased nearly 50 percent from 2006 to 2007. Waste
oil, fats, and grease are generally cheaper than vegetable oil, but their quantities are
substantially limited.
As more and more biodiesel facilities become operational, increasing demand for
feedstocks will maintain upward pressures on the vegetable oil and animal fat commodity
markets. In Hawai’i, there are currently two biodiesel facilities utilizing waste oil and
grease as the principle feedstock: one is on O`ahu, the other is on Maui. Both plants are
owned and operated by Pacific Biodiesel.
Capital Costs
Biodiesel facilities are relatively simple and easily scaled to meet local needs.
The process occurs at low temperature and pressure, which keeps costs relatively modest.
Two kinds of biodiesel production facilities are in operation today: batch plants and
continuous flow plants. Batch plants tend to be much smaller than continuous flow
plants and produce discrete “runs” of biodiesel. Continuous flow plants are usually much
2 Source: DailyWealth.com, June 2007, http://www.dailywealth.com/archive/2007/jun/2007_jun_15.asp

The Potential for Biofuels Production in Hawai’i 3.0 Conversion Technologies
3-15
larger, run continuously, and are capable of implementing more efficient processes than
those used in batch operations. At about $1/gallon, capital costs for biodiesel facilities
are relatively low.
O&M Costs
After feedstock costs, chemical costs (primarily methanol and catalyst) represent
the second largest contributor to biodiesel production costs at 10-15 percent of the overall
costs. Other production costs include equipment, energy, labor, and overhead and
maintenance. The O&M costs for biodiesel range from $0.20 to $0.40 per gallon.
Predicted Costs
Biodiesel prices are expected to continue to rise. Although current generation
biodiesel facilities are more efficient and benefit from economies of scale, feedstock
costs have remained high as competition has intensified. As biodiesel is particularly
sensitive to volatile feedstock costs, many smaller-scale biodiesel operations have shut
down in the US and Europe recently. The US biodiesel industry depends a great deal on
incentives such as the blender tax credit.
3.2.6 Biodiesel Production Potential
The current conversion rates for biodiesel are listed in Table 3-6. Fischer-
Tropsch diesel processes are still being developed and have exhibited a range of yields at
different scales of production.
3.3 Biomass-Derived Hydrogen Hydrogen offers potential as a fuel for vehicles, either for direct combustion
engines or fuel cell-based vehicles. Hydrogen is gaseous, flammable fuel that produces
water vapor when it is combusted. Although hydrogen is not used commonly as a fuel
Table 3-6. Biodiesel Yields.
Conversion Pathway Feedstock Typical Yield (gal/ton feedstock)
Transesterification Waste oil 250 – 280
Fischer-Tropsch Diesel Bagasse 75 – 89*
Notes: * Assumes an energy self-sufficient process that diverts approximately 28% of the syngas to
generate process steam.

The Potential for Biofuels Production in Hawai’i 3.0 Conversion Technologies
3-16
for transportation or electric generation, it holds promise as a clean-burning option.
Hydrogen can be obtained from both biomass and fossil fuels, but this study will focus on
hydrogen derived from biomass.
3.3.1 Methane Reformation
Methane reformation is the reaction of methane with steam to yield carbon
monoxide and hydrogen. Natural gas is the most common source of methane for
reformation, but in the context of this report, methane is considered to be derived from
biomass sources (i.e. landfill gas or biogas derived from anaerobic digestion). The
reaction is carried out under pressure in the presence of a catalyst. Because the reaction
is endothermic, heat must be supplied to the process for propagation. Methane
reformation is often combined with a water-gas shift reaction and pressure-swing
adsorption to maximize hydrogen and remove impurities. For biomass-derived hydrogen,
the methane is obtained from anaerobic digestion or landfill gas collection.
Since the amount of methane currently available in Hawai’i is relatively small,
hydrogen from methane reformation is not a strong biofuel option, at least for the near
term. However, the hydrogen available in Hawaii’s waste-to-methane sources may play a
role in niche markets, such as fuel cells.
3.3.2 Biomass Gasification
Biomass gasification is the most common route to produce hydrogen from
biomass. As described earlier, biomass gasification refers to the process in which
biomass is heated in an oxygen-poor environment to produce a mixture of carbon
monoxide and hydrogen, known as syngas. The oxygen content allowable for
gasification is about one-third of the oxygen needed for normal combustion. Similar to
methane reformation, biomass gasification can be combined with a water-gas shift
reaction to maximize hydrogen yield.
This is similar to the process to produce thermochemical cellulosic ethanol (see
section 3-2). However, instead of further reacting the hydrogen with carbon monoxide to
make alcohol compounds, the hydrogen is separated from the carbon monoxide.
3.3.3 Microorganisms
There are microbes such as green algae and cyanobacteria that can produce
hydrogen gas as a byproduct of metabolic activities. These microorganisms produce
hydrogen by different mechanisms, but they are catalyzed by the enzymes nitrogenase or
hydrogenase. This technology is still in early stages of R&D. The technology is

The Potential for Biofuels Production in Hawai’i 3.0 Conversion Technologies
3-17
promising, but will require significant additional research before large-scale hydrogen
production is feasible.
3.3.4 Feedstock Suitability
For methane reformation, the methane would likely come from landfill gas or
anaerobic digestion. Landfill gas is less expensive and more commercially ready than
anaerobic digestion on Hawai`i. The Landfill Methane Outreach Program administered
by the EPA lists 14 landfills that have potential for methane collection for energy use.
Anaerobic digestion can utilize municipal solid waste, sewage, or animal manure to
produce methane. There is little activity currently going on in Hawai’i with anaerobic
digestion of animal manure.
Feedstocks suitable for hydrogen produced via biomass gasification are the same
ones suitable for cellulosic ethanol. Any lignocellulosic materials, including wood,
energy crops, agricultural wastes, and other municipal waste streams are good feedstock
candidates. Sugarcane fiber, Banagrass, and Eucalyptus trees have been studied as
potential sources.
Microorganisms that generate hydrogen need an environment conducive to
sustained metabolic propagation. Some species can withstand a wide range of physical
conditions, while others are highly susceptible to poisoning or thermal disturbance.
Feedstocks free of foreign substances are most suitable for hydrogen produced from
microorganisms.
3.3.5 Anticipated Cost Competitiveness
Nearly 95 percent of the hydrogen produced today in the US is made via steam
methane reformation, mostly from natural gas. Most of the hydrogen is used for
petroleum refining and ammonia production for fertilizer.
Currently there is little infrastructure in Hawai’i to use hydrogen as a major fuel.
Considering all the upgrades necessary for production, distribution, and transportation,
hydrogen produced from biomass is not expected to be a cost-competitive fuel for
transportation for some time.

The Potential for Biofuels Production in Hawai’i 3.0 Conversion Technologies
3-18
Table 3-7. Hawai’i Hydrogen Production Cost Summary.
Conversion Pathway
Feedstock Costs Capital Cost
($/m3 H2 annual capacity)
O&M Cost
Methane Reformation
$2 - $5/MMBTU landfill gas
25 $0.0075/m3 hydrogen*
Biomass Gasification (bagasse)
$25/ton bagasse 30 – 32 $0.0086 – 0.0093/m3 hydrogen*
Microorganisms** Unknown Unknown Unknown
Notes: * HHV of hydrogen is 12,000 BTU/m3. **Still in R&D phases of development.
Feedstock Costs
For this study, the feedstock that appears most viable for methane reformation is
landfill gas. The price of landfill gas ranges substantially across the US and is affected
by landfill characteristics, landfill ownership, alternate uses for the landfill gas,
environmental regulations, among other things. Some utility-owned landfills have
essentially given away their landfill rights to project developers who have agreed to
operate and maintain landfill gas collection systems. Others landfills have indexed
landfill gas contract price to the price of natural gas, expressed as a $/MMBTU basis. A
price range of $2 to $5 per MMBTU can be considered indicative of landfill gas
feedstock prices.
Capital Costs
Natural gas methane reformation is a commercial process and as such the capital
costs are fairly well known. Utilizing landfill gas or digester gas is less common, but
much of the same processing and equipment can be used to isolate hydrogen with the
addition of gas cleanup equipment.
The process to produce hydrogen via biomass gasification is similar to the process
to the process to produce cellulosic ethanol via gasification. Hydrogen production does
not require catalytic conversion of syngas to alcohols, but does have greater gas cleanup
requirements if landfill gas is the feedstock. If bagasse is the feedstock, there is
additional equipment required for solids handling and enhanced gas cleanup, which
increases the overall capital cost.
Hydrogen production processes using microorganisms are still in R&D phases.
The capital costs are not yet well known, but the capital costs would need to allow the
economics to converge on the price of hydrogen produced via other pathways.

The Potential for Biofuels Production in Hawai’i 3.0 Conversion Technologies
3-19
O&M Costs
O&M costs for methane reformation run on the order of $0.0075/m3 of hydrogen
produced. This equals approximately $0.62/MMBTU of hydrogen.
Similar to capital costs, the O&M costs for hydrogen production from biomass
gasification range from 15 to 30 percent higher because of the additional solids handling
and gas cleanup. O&M costs for microorganisms are not well known at this time.
Predicted Costs
A mature market for hydrogen currently does not exist in Hawai’i. As the
industry is limited, it is difficult to project hydrogen prices. Several markets are
positioned as potential large-scale users of hydrogen, including transportation and electric
generation. However, there is little infrastructure to utilize hydrogen on a large scale in
the near term.
If large scale hydrogen production ramped up in the wake of increased industrial
usage, costs would likely decrease because of economies of scale. However, the
hydrogen market is not likely to grow substantially in the near term, so hydrogen prices
will likely remain relatively flat or increase slightly.
3.3.6 Hydrogen Production Potential
The current conversion rates for hydrogen are listed in Table 3-8. Gasification
and microorganism pathways for hydrogen are still being developed and have exhibited a
range of yields at different scales of production.
Table 3-8. Hydrogen Yields.
Conversion Pathway Feedstock Typical Yield Methane Reformation Landfill Gas 3 scf/scf landfill gas
Biomass Gasification Bagasse 787 m3/dry ton bagasse*
Microorganisms Cellulosic wastes Unknown
Notes: * D. Bowen, F. Lau, R. Dihu, S. Doong, R. Remick, R. Silmane, R. Zabransky, E. Hughs, and S.
Turn, “Techno-Economic Analysis of Hydrogen Production by Gasification of Biomass.” Final Report to U.S. Dept. of Energy, Contract DE-FC36-01GO11089, June 2003.
3.4 Other Biofuel Technology Options A number of other routes exist to convert fermentable sugars, cellulosic biomass,
waste greases, and vegetable oils to biofuels. Since each has specific niches where they
may be appropriate, the potential benefits and drawbacks of each must be considered in
the context of the potential site. Applications in Hawai’i present unique challenges for

The Potential for Biofuels Production in Hawai’i 3.0 Conversion Technologies
3-20
feedstock gathering and technology usage that make many alternatives unattractive based
on their cost and level of technical maturity.
The other biofuel pathways that are currently receiving research and
commercialization focus are FT liquids, direct hydrogenation of vegetable oils and
greases, biomass pyrolysis, routes to convert biomass to fungible gasoline, and
biobutanol production. Each is highlighted below, with a discussion for potential costs
and suitability for usage in Hawai’i.
3.4.1 Fisher-Tropsch Liquids
As mentioned earlier, the FT liquids process consists of conversion of carbon
containing feedstocks to syngas, with the syngas then cleaned and catalytically converted
to liquid transportation fuels. A simplified schematic of the processes needed in a
combined coal and biomass FT unit as developed by the US Department of Energy’s
National Energy Technology Laboratory3 (NETL) is shown in Figure 3-6. The schematic
includes equipment to capture and sequester CO2, which may or may not be included in a
biomass only design.
3 US Department of Energy, National Energy Technology Laboratory, “Affordable, Low-Carbon Diesel Fuel from Domestic Coal and Biomass”, DOE Report DOE/NETL-2009/1349, January 2009.

The Potential for Biofuels Production in Hawai’i 3.0 Conversion Technologies
3-21
Figure 3-6. Coal and Biomass to FT Liquids Process Schematic4
To produce FT liquids from biomass, biomass is first prepared for gasification.
This is done typically though sorting, grinding, and drying. Gasifiers appropriate for use
on biomass, namely air-blown, atmospheric pressure, circulating fluidized beds, would
likely be used. Gas cleaning consists of particulate removal, tar cracking, water-gas shift
to obtain the H2/CO ratio appropriate for the FT reactor, and potentially sulfur removal
depending on the sulfur content of the feedstock. The cleaned syngas would then be sent
through the FT unit, consisting of either iron or cobalt catalysts, at process conditions
around 300ºF and 500 psi. Since production of FT liquids is a very exothermic reaction,
FT reactor design is critical to removing the process heat and maintaining appropriate
process conditions. The raw FT products are then condensed and separated into their
constituent components. Further upgrading can either be performed on-site or at a
separate facility based on the desired disposition of the products. Non-condensable gases
are separated to remove the unreacted syngas, CO2, and light hydrocarbons. Unreacted
syngas is typically recycled back to the FT reactor to raise yields and improve process
economics.
4 Based on the feedstock used, some of the processes listed in this schematic may not be employed in a biomass only unit. For example, an Air Separation Unit (ASU) would be unnecessary if air-blown gasification is employed, certain sulfur conversion and removal units (COS Hydrolysis and Sulfur Polish) may not be needed if the sulfur content of the feedstock is low enough to not poison the FT catalyst, and hydrogen recovery/upgrading would not be employed if no upgrading is done on-site.

The Potential for Biofuels Production in Hawai’i 3.0 Conversion Technologies
3-22
The FT products consist largely of diesel fuel, jet fuel, and low-octane naphtha
(which can be used as a gasoline blending component or chemical feedstock). The diesel
and jet fuels are of excellent quality and need little upgrading prior to being used in
conventional distillate applications. The ratio of the three products (along with others
including light gases and heavy waxes) is dependent on a number of factors, including
reaction temperature, the H2/CO ratio of the syngas, catalyst type, and reactor design.
Other catalysts are available for producing other types of liquid fuels and chemicals such
as mixed alcohols and methanol. The alcohols pathway is discussed in more detail
during the cellulosic ethanol discussion, while the fungible fuel uses of methanol are
discussed in Section 3.4.4.
Because the process to produce FT products is very complicated and typically
requires some level of stabilization and upgrading of the final product, the capital and
operating costs are very high. While knowledge of the technology has been around since
the 1920’s, commercialization has only occurred in locations where crude oil has been
unavailable; oil prices have historically been too low to stimulate development of FT
units. Due to the large amount of process equipment needed, there is a major economy of
scale advantage to the development of large plants. This is why coal is considered as the
main feedstock for FT processes. The low BTU and high moisture content of biomass
relative to coal make it much more difficult to procure the amounts of biomass needed to
build facilities similar to those based on coal. NETL projected that commercial BTL
plants would be roughly one-tenth the size of CTL plants, with finished product costs
over $6/gallon. Besides the economy of scale disadvantage, BTL plants also suffer from
poor conversion rates and gasification difficulties relative to coal.
Both Sasol and Shell have commercially operating FT plants. Only Sasol has a
commercial CTL plant, with natural gas to FT liquids performed in Malaysia and in
Qatar. Only one small stand-alone BTL plant exists today: the 300 barrel per day Choren
BTL plant in Germany, which began commercial production in 2008. Due to recent
downturns in the price of oil from historically high levels, there have been few proposals
to move forward with a 100 percent biomass to liquids process. Two projects have been
proposed using Wisconsin biomass (NewPage and Flambeau River) and received DOE
funding, but have not proceeded beyond the design phase. A more typical use of biomass
in an FT plant is as a co-feedstock that would be fired in a small percentage at a CTL
unit. Other companies such as Rentech and Syntroleum have developed pre-commercial
FT processes, but the high capital costs and volatile finished product prices have
prevented further development.

The Potential for Biofuels Production in Hawai’i 3.0 Conversion Technologies
3-23
3.4.2 Renewable Diesel via Direct Hydrogenation
Besides the conventional esterification of fatty acids that is typically used for the
production of biodiesel, vegetable oils and greases can also be converted to diesel fuel via
direct hydrogenation. In this process, oils or fats are typically first pre-treated with acid,
caustic, and/or water. The treated material is then sent to a hydrotreater where the treated
oils and greases interact with hydrogen in the presence of a catalyst to remove
oxygenates, impurities, and create molecules of similar structure to that of petroleum
diesel.
Hydrotreating is a process common to the petroleum refining industry. The
simplest design would be to use an existing refinery hydrotreater to act as the main
process unit. In this configuration, the feedstock oils or greases would be pre-treated in a
separate unit, and then combined with a petroleum diesel stream before entering the
hydrotreater. Alternatively, a stand-alone hydrotreater could be designed, with the
finished product blended with petroleum diesel. A schematic of these types of
arrangements developed by UOP can be seen in Figure 3-7.
Figure 3-7. Refinery Integrated Renewable Diesel Options5
The co-processing option would only be available if existing petroleum refineries
had the necessary equipment and capacity to process an oil or grease stream. Hawaii’s
two refineries have very limited hydrotreater capacity; according to the US DOE, most of
the hydrotreating capacity (13,000 barrels per day) is for gasoline components, with the
remainder (3,000 barrels per day) for residual fuel oil treating. No dedicated on-road
diesel hydrotreating capacity is currently operational. Hydrotreating oils and greases also
5 UOP, Opportunities for Biorenewables in Oil Refineries, US Department of Energy Report as part of award DE-FG36-05GO15085, 2005.

The Potential for Biofuels Production in Hawai’i 3.0 Conversion Technologies
3-24
has the disadvantage of requiring high amounts of hydrogen, and potentially reducing the
catalyst life of the hydrotreater unit.
If utilization of refinery hydrotreaters is unavailable, development of a stand-
alone bio-oil treating unit would be necessary to produce renewable diesel in this fashion.
A schematic developed by UOP for a stand-alone design can be seen in Figure 3-8.
Figure 3-8. Stand-Alone Renewable Diesel Hydrotreating Schematic
Design and construction of a stand-alone renewable diesel hydrotreating unit
would be much more complicated than integration with a refinery hydrotreater or
development of a conventional esterification unit. Gas separation and reforming units
would need to be constructed to produce the necessary hydrogen and separate gases
produced in the hydrotreater. The location must be able to handle co-products of sour
water and non-diesel hydrocarbons. Given the complexity and level of other inputs
necessary to produce green diesel, it is unlikely that the cost would be attractive in
Hawai’i relative to conventional biodiesel production routes.
A few companies are commercially developing refinery integrated oil and grease
hydrotreating units today. Neste Oil, a Finnish refiner, has a small commercial plant
operational at their Porvoo, Finland refinery, and is currently building plants in Singapore
and Rotterdam. Petrobras, the main refiner in Brazil, has also developed an oil
hydrotreating process that is being commercialized in South America. Finally, UOP is
working with PNNL and NREL to commercialize an oil hydrotreating process in the US.

The Potential for Biofuels Production in Hawai’i 3.0 Conversion Technologies
3-25
3.4.3 Pyrolysis Oils
Raw biomass can be heated indirectly in an oxygen free environment at
temperatures lower than what is needed for gasification to produce pyrolysis oils. Under
pyrolysis conditions, charcoal, gases, water, and pyrolysis oil are produced. The ratios
vary depending on the conditions, but the yield of pyrolysis oil is typically in the 40
percent range. The oil produced is of very poor quality and not suitable for transportation
use. Upgrading of the oil must be performed to remove water, acids, and oxygen
components.
The development of a platform to commercialize pyrolysis oil technology is not a
new concept. Efforts have been underway since the 1980s. While there have been
limited niche successes, there has been no widespread commercialization as of yet.
Commercialization of pyrolysis initially appeared to have an advantage over other
cellulosic routes in the 1990s and earlier this decade, but it appears that the difficulty in
using and marketing the pyrolysis oil has now led to the technology falling behind. With
this in mind, it appears that significant breakthroughs in developing improved processes
are needed to make pyrolysis oil more useable in transportation applications. Major
disadvantages relative to other cellulosic methods include:
Oil Quality: Pyrolysis oil quality issues such as low energy content, water, and
high pH create issues that are not seen in other routes. Besides blending
problems, pyrolysis oils will need to be stored in material that will not corrode
due to the acidic character of the fuel.
Oil Blending: Pyrolysis oil is a mix of various chemical constituents that will
vary depending on the feedstock characteristics. This makes a heterogeneous mix
that is not ideal from the standpoint of processing/upgrading pyrolysis oil to more
pure marketable products compared with other cellulosic routes.
One major advantage of pyrolysis is that the technology offers a potentially
attractive scale match for medium scale conversion systems (e.g., 50 to 250 tons/day) that
could be deployed in a distributed strategy for storable liquid fuel production, or with
fairly convenient transport of stored liquid product to a centralized processing/upgrading
conversion facility. This can address some fundamental drawbacks with long-distance
transport of typically bulky biomass feedstocks to large centralized biomass conversion
facilities.
Distributed collection of bio-oils could be of particular interest in a location such
as Hawai’i where moving large quantities of raw biomass feedstock to a central
processing location is not feasible. A plant processing 120 tons/day of biomass could
theoretically produce roughly 8,500 gallons/day (200 barrels/day) of raw pyrolysis oil.

The Potential for Biofuels Production in Hawai’i 3.0 Conversion Technologies
3-26
This is equivalent to one tanker truck full, which could be easily transported to a central
collection point for transport via barge to a processing facility. Small to medium scale
pyrolysis oil conversion units are relatively simple pieces of equipment which could be
skid mounted and easily scalable, unlike many biofuel technologies that produce fungible
final products. Figure 3-9 below shows a process schematic for a process developed by
Dynamotive. Besides the main reactor, cyclone, and quench system, little other process
equipment is needed. The residual char could be burnt to provide on-site power and heat.
Figure 3-9. Dynamotive BioThermTM Process Schematic
The poor quality of the bio-oil produced means that integration with a petroleum
refiner or investment in upgrading equipment is necessary to make fungible fuels. This
factor, combined with the fact that commercialization of pyrolysis oils to transportation
fuels is behind other second generation biofuel routes, creates a competition issue that
will require technical advances to overcome. Since upgrading on-site is expensive and
impractical for small to medium scale units, partnering with a refinery or other type of
central upgrading facility would be necessary to make pyrolysis oil practical. In Hawai’i,
Tesoro has indicated interest in utilization of pyrolysis oils at their Kapolei refinery.
Pyrolysis oils could be combined with crude oils, or fed directly into the hydrotreating or
hydrocracking units. Removal of acidic compounds and water prior to charge to the
The Potential for Biofuels Production in Hawai’i 3.0 Conversion Technologies
3-27
refinery would likely be required to prevent corrosion. Utilization at Chevron’s Barbers
Point refinery could potentially also be an option; while it has limited hydrotreating and
hydrocracking capacity, it does possess a catalytic cracking unit (used for upgrading fuel
oils to gasoline) that could be suited for processing pyrolysis oils.
There are five main companies, and a number of smaller ones, pursuing
commercialization of pyrolysis oils: Dynamotive, Ensyn, BTG, PyTec, and ROI.
Dynamotive has been the strongest, most active company, with focus on applications
using pyrolysis oil in industrial turbines or boilers. Typically, the focus of most firms has
been on the use of pyrolysis oils for heat and power, not transportation fuels. However,
greater interest in upgrading of pyrolysis oils has been witnessed. Ensyn and UOP
recently partnered to create a joint venture, Envergent that specifically is working to
commercialize pyrolysis oil production and upgrading units. Most of the companies are
currently based in locations or have based their plants in areas with abundant and
inexpensive feedstock. The relatively high cost of Hawai’ian biomass may make
utilization of the pyrolysis pathway a challenge unless low cost upgrading options can be
made a reality.
3.4.4 Biogasoline
There are a number of different pathways possible for the production of
biogasoline from biomass, although none are actively in commercial demonstration. The
first is catalytic cracking of pyrolysis oils or raw oils/greases in refinery process units.
Similar to the renewable diesel option, this pathway requires the existence of very
specific process equipment and could negatively impact the operation of the refinery
units. The second option, which does have commercial experience and has been
proposed in future coal to liquids designs, is utilization of methanol-to-gasoline (MTG)
catalyst. In this process, biomass would be gasified to create syngas, similar to what is
done for FT production. The syngas would be cleaned and sent to a methanol reactor to
first produce methanol that would then feed the MTG section of the plant. Like FT
liquids production, this is a complicated, high capital cost design that is better suited to
coal feedstocks than natural gas. Finally, some novel processes are currently being
explored such as Terrabon’s MixAlco process, where biomass is treated by
microorganisms to produce carboxylic acids, the acids converted to salts, the salts to
ketones, the ketones to alcohols, and finally the alcohols to gasoline. None of these
processes are appear to be economically promising enough or commercially applicable
for the State of Hawai’i.
The Potential for Biofuels Production in Hawai’i 3.0 Conversion Technologies
3-28
3.4.5 Biobutanol
Similar to how fermentable sugars can be converted to ethanol, sugars from
biomass can also be converted to butanol via biological routes. The ABE (acetone,
butanol, and ethanol) process is well known and understood. There are no large-scale
ABE processes currently in-place due to the cost of the process, toxicity concerns of
butanol, and fuel certification and transport issues. For these reasons, it is unlikely that
biobutanol should be considered for application in Hawai’i.
3.4.6 Biological Conversion of Sugar to Conventional Fuels
Biological conversion technology is being developed that could convert sugar
from crops such as sugarcane or sweet sorghum, into various chemicals and renewable
fuels. For example, a Brazilian-based company, Amyris (and its U.S. subsidiary Amyris
Fuels, LLC) is developing conversion technology that will use modified microorganisms
to convert sugar into diesel, jet fuel, gasoline, and/or a variety of other products, such as
lubricants or chemicals. Hawaii BioEnergy LLC is evaluating, and is optimistic about,
the potential to use Amyris technology in Hawaii to produce conventional hydrocarbon-
based fuels from sugar crops.
3.5 Projected Costs and Suitability in Hawai’i There is a very wide range of costs possible for the biofuels reviewed above to
due major variability in feedstock costs, technology advancement potential, upgrading
needs, and co-product values. Potential cost ranges expected for the major biofuels
routes described relative to conventional ethanol using a set of broad assumptions can be
seen in Figure 3-10. More detailed analysis would be necessary to improve the accuracy
of these estimates.

The Potential for Biofuels Production in Hawai’i 3.0 Conversion Technologies
3-29
0 1 2 3 4 5 6 7
Cellulosic EtOH
Conv. EtOH
Pyrolysis Oils
Renewable Diesel
Green Gasoline
FT Fuels
Hawaii Specific Biofuel Production Cost ($/gallon)
Figure 3-10. Advanced Biofuel Production Costs
In general, cellulosic ethanol production routes similar to those explored in
greater detail elsewhere in the report have the greatest potential to produce transportation
fuels at lower cost the conventional ethanol routes. Other production routes are currently
too expensive, face too many technical hurdles, and/or have major unresolved issues
regarding upgrading needed to make them suitable for on-road usage. For these reasons,
cellulosic ethanol pathways should be the current major area of focus for alternative
transportation fuels at this time. Monitoring of novel processes should be performed to
determine their potential suitability as breakthroughs are achieved.
Based on the projected future prices of retail gasoline and diesel fuels and the
development pathways of the alternative fuels presented in this section, it would not be
expected that any alternative fuels besides conventional ethanol would be commercially
competitive until at least 2015. Conventional fuel prices are projected by the US DOE to
surpass $3.50/gallon (average US prices, 2007 dollars) at that date (see Figure 3-11
below); given the higher petroleum prices typically seen in Hawai’i and the potential cost
improvements for the alternative fuel pathways shown in Figure 3-10, this date
corresponds to the earliest potential timing that alternative fuels may likely be
competitive with petroleum.

The Potential for Biofuels Production in Hawai’i 3.0 Conversion Technologies
3-30
200.0
250.0
300.0
350.0
400.0
450.0
2006
2008
2010
2012
2014
2016
2018
2020
2022
2024
2026
2028
2030
Cen
ts p
er g
allo
n
Retail Gasoline Retail Diesel
Earliest timing for commercialization of alternative fuels and appropriate cost drivers
Figure 3-11. DOE Retail Gasoline and Diesel Projections
The alternative fuels discussed each have different promise with regards to cost
reduction. Some, such as FT diesel and renewable diesel, have limited improvement
potential due to the extensive catalyst research that has already been performed. The
complexity and limited integration potential with petroleum refineries on Hawai’i will
likely limit the ability of these routes to be a viable commercial alternative for biofuels.
On the other hand, cellulosic ethanol, green gasoline, and pyrolysis oil research could
yield breakthroughs that would make these routes competitive with fossil transportation
fuels. Both green gasoline and pyrolysis oil research needs further investigation into
catalyst improvements and upgrading options before they have the potential to be
commercially viable. This is especially true for stand-alone units in locations without
ready access to suitable upgrading equipment at petroleum refineries, such as Hawai’i.
Thermochemical and biochemical production routes for cellulosic ethanol may have the
greatest potential for lower cost biofuels. Different novel synthesis routes are being
explored, with many claiming significant future cost improvements if research progresses
as planned.
3.6 Additional Considerations for Biofuel Production in Hawai’i Biomass is a regionally specific issue. This is true with regards to both the type
and quantity of biomass available. There are several factors that can complicate the
supply of biomass feedstock for a given process. The supply of biomass may not be
consistent throughout the year due to seasonal variations. In addition it is often not
The Potential for Biofuels Production in Hawai’i 3.0 Conversion Technologies
3-31
practical or economical to transport biomass significant distances, or it may be difficult to
recover enough resources in a given area to make a biomass conversion process
economical. All of these forces put upward pressure on the economics of fuel derived
from biomass.
3.6.1 Limitations on Transportation of Biomass
By its nature biomass is dispersed over a large geographic area. In addition, when
biomass is in its raw unprocessed form it typically has a high moisture content and low
energy density. These characteristics often make it unpractical and uneconomical to
transport biomass significant distances. For mainland biomass conversion processes the
maximum practical transportation distances often range from 75 to 100 miles.
Hawaii’s geography, infrastructure and high fuel prices may also limit the radius
which biomass could be practically and economically gathered. For example the
limitations of existing highway infrastructure in places such as Kauai may prove an
additional obstacle in making the biofuel production in Hawai’i economical. Of course in
many cases the size of the islands in the Hawai’ian chain will limit the area that biomass
can be gathered from. It is unlikely that it would be economical to transport biomass
between islands in their raw and unprocessed forms.
3.6.2 Economies of Scale
Energy conversion processes generally benefit significantly from increased
economies of scale. Large electrical generation stations or biofuel production facilities
typically convert energy more efficiently and economically than similar facilities which
are smaller in size. Due to constraints on resource availability in a given area, processes
which use biomass as feedstock are not able to match the same economies of scale as
processes which rely on fossil fuel. Thus for biomass facilities to be economically
competitive they generally need to acquire feedstock’s at a lower cost in order to compete
with fossil fuels (in the absence of renewable energy incentives or regulations that
penalize fossil fuels).
Since biofuel facilities that utilize cellulosic biomass are just entering the
commercialization phase of development, one approach for gaining a perspective on
economy-of-scale issues is to consider biomass power facilities that are fueled with
cellulosic biomass (typically wood). Biomass power facilities are typically sized based
on the resources which can be recovered economically in a given area, mainland
standalone biomass generation facilities are typically no larger than 100 MW. Most often
biomass facilities range from 30 to 50 MW in size. By comparison, newer coal fired

The Potential for Biofuels Production in Hawai’i 3.0 Conversion Technologies
3-32
power plants are rarely smaller than 600 MW. Table 3-9 below shows typical fuel usage
for stand alone biomass power generation facilities.
Table 3-9. Daily Fuel Demand for Biomass Facilities.
Facility Size
(MW)
Heat Rate
(Btu/kWh)
Capacity Factor
Fuel (tons/day)
Trucks (load/day)
30 13,500 0.85 810 34
50 13,000 0.85 1300 54
100 12,300 0.85 2460 103
Notes: Heating Value of 5,100 Btu per ton of biomass assumed with 40% moisture content.
Economies of scale are also an important factor in the biofuel conversion
processes. Processing cost estimates for cellulosic ethanol production developed by the
National Renewable Energy Laboratory (NREL) have typically been based on a scale of
2,000 tons of biomass per day. While it is likely that this scale of production facility may
be difficult to achieve in Hawai’i, this cost estimate represents an industry target and
reflects the future technical potential.
Based on the information presented above in Table 3-9 a 2,000 ton per day
facility would roughly be equivalent to the demand created by an 80 MW biomass power
generation facility. Figure 3-12 below show the land required to support a 2,000 ton per
day cellulosic ethanol facility as a function of average yield of biomass per acre. The
assumption was made that 2,000 tons would be needed each day and the facility would
run 330 days each year. This would result in an annual demand of 660,000 tons of
biomass.

The Potential for Biofuels Production in Hawai’i 3.0 Conversion Technologies
3-33
0
10,000
20,000
30,000
40,000
50,000
60,000
70,000
0 10 20 30 40 50 60 70
Average Yield (tons/acre)
Lan
d
Req
uir
emen
t (a
cres
)
Figure 3-12. Land Requirements for a 2,000 Ton/Day Facility
Given that plantations in Hawai’i are likely to range from 5,000 to 10,000 acres
and yields will likely range from 10 to 50 tons per acre depending on crop and soil types,
there will be challenges associated with reaching the scale of a 2,000 ton per day
cellulosic ethanol facility in Hawai’i. Thus, production facilities may need to be smaller
than 2,000 tons per day or biomass would need to be brought from multiple locations.
And as previously mentioned both of these options have the potential to negatively
impact the economics of processing.
These constraints were taken into consideration in developing cost estimates for
biofuels production in Hawai’i. For example, detailed cost estimates for cellulosic
ethanol production recently updated by the National Renewable Energy Laboratory
(NREL), showed cellulosic ethanol conversion costs in the range of $0.92 per gallon (on
a levelized basis) by the year 2012 for large biochemical-based conversion facilities
designed to process 2,200 tons per day of biomass feedstock (NREL, 2009; see Chapter 9
for projections from NREL regarding anticipated conversion costs for biochemical and
thermochemical-based conversion systems). By comparison, in our base case analysis
for Hawai’i, a conversion cost estimate of $1.36 per gallon was used. This estimate
adjusts for economy-of-scale issues with the expectation that in Hawai’i, 500 to 800 tons
per day may be a more likely scale for facilities based on acreage and transport
constraints. (The conversion cost also factors in some cautiousness with respect to
progress in reducing advanced biofuel conversion costs.) This potential economy-of-
scale drawback for biofuel production in Hawaii can be offset by the advantage that

The Potential for Biofuels Production in Hawai’i 3.0 Conversion Technologies
3-34
Hawaii facilities will have in marketing electricity co-produced with biofuel for distinctly
higher electricity prices than “mainland” facilities.
Technologies such as pyrolysis may offer solutions to the issues of resource
distribution and economies of scale related to biomass processing. Several medium-scale
(250 to 700 ton per day) pyrolysis facilities may be useful in converting biomass into
pyrolysis oil for processing at a centralized facility to transportation fuels. It would be
easier to transport pyrolysis oil greater distances than raw biomass, and the liquid fuel is
generally easier to store than solid biomass feedstocks. The technology used in
converting raw biomass to pyrolysis oil is fairly straightforward and is generally well
suited to small- to medium-scale applications.
Although most conversion technologies options are likely to benefit from
economy-of-scale factors, not all will necessarily be affected to the same degree. For
example, the cost of transesterfication technologies used for producing biodiesel from
vegetable oils are generally not impacted as much by economy-of-scale issues as
conversion processes for producing ethanol from cellulosic biomass, such as biochemical
(e.g., enzymatic hydrolysis) or thermochemical (e.g. gasification) processes.
3.6.3 Distributed Processing & Centralized Refining
One potential solution to the competing forces of economies of scale and
recoverable resources is to use some form of intermediate processing to increase the
value or energy density of materials to be transported. This has the potential to make it
more feasible to transport feedstocks greater distances to large centralized biorefineries.
Pyrolysis which is discussed in Section 3.4.3 is one technology that may have promise for
this application.
The Potential for Biofuels Production in Hawai’i 4.0 Biomass Residue Availability
4-1
4.0 Biomass Residue Availability
Biomass residues encompass a wide variety of organic matter, ranging from wood
waste, to agricultural residues, to other plant and human by-products. Waste from the
production of primary marketable products is often an economically viable energy
source. In Hawai’i, bagasse (sugarcane waste) has been a traditional biomass energy
resource. However, the use of bagasse has decreased over the last three decades due to
the declining sugar industry in Hawai’i.6
The potential supply of biomass residues available in Hawai’i was inventoried in
the report “Biomass and Bioenergy Resource Assessment for the State of Hawai’i”
prepared for DBEDT by the University of Hawai’i, Hawai’i Natural Energy Institute in
2002 (the report is available online at the following website --
www.hawaii.gov/dbedt/info/energy/publications/biomass-assessment.pdf ). That report
served as a baseline which has been updated in the following report. Unless noted, the
information provided in the rest of this section has used a similar methodology to that
used in the earlier 2002 report. Biomass sources reviewed in this study include
domesticated livestock wastes, forest products residues, agricultural residues, and urban
wastes. Agricultural wastes addressed include those generated from sugar cane,
pineapple, and macadamia nut processing. The urban waste category was subdivided into
four types: municipal sold waste, food waste, sewage sludge or biosolids, and waste
greases.
4.1 Urban Waste Hawai’i counties are facing an increasing growth in population resulting in
increasing quantities of waste generated by people going about their daily lives. The
overall goal of urban waste management is to collect, treat, and dispose of solid and
liquid wastes generated by all population groups, even though some of those populations
exist in rural areas. This waste can be exploited for biofuel production instead of being
disposed of in a landfill. This section summarizes waste disposal inventories for
municipal solid waste, landfill gas, sewage sludge, and fat/oil/grease (FOG).
6 Anon. December 2006. A Catalog of Potential Sites for Renewable Energy in Hawaii. Produced for the State of Hawaii Department of Land and Natural Resources and the Department of Business, Economic Development, and Tourism by Global Energy Concepts, LLC in response to Act 95, Session Laws of Hawaii 2004.
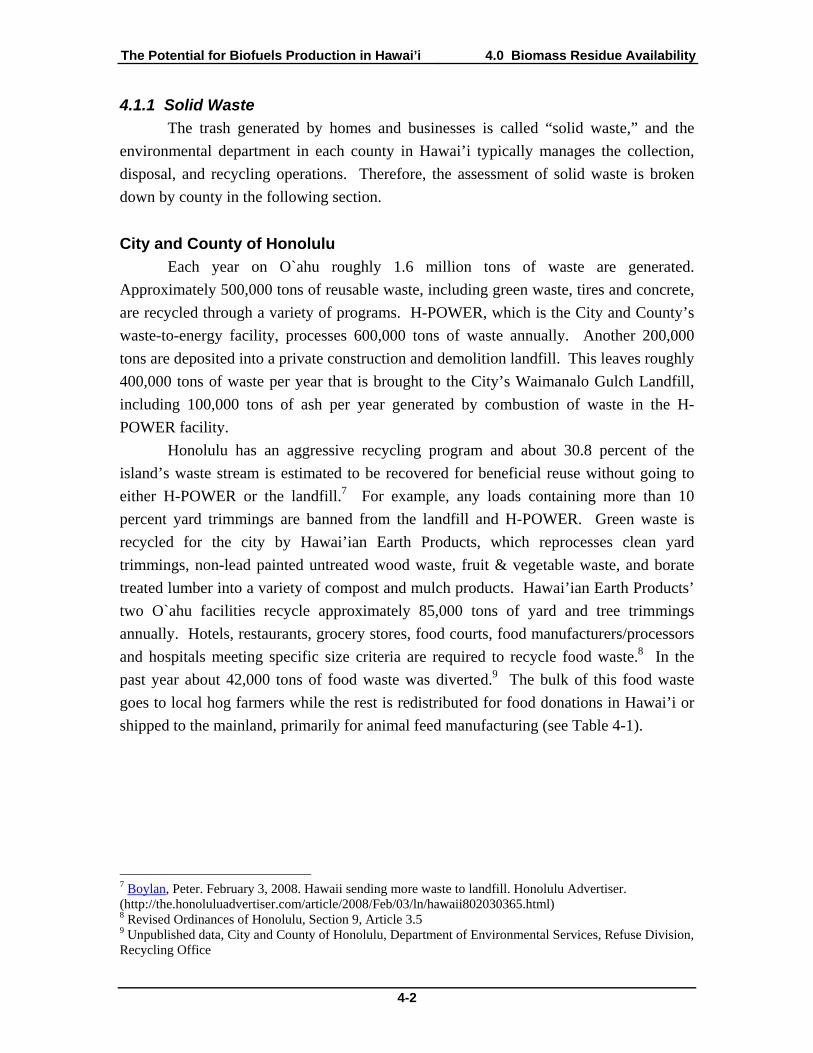
The Potential for Biofuels Production in Hawai’i 4.0 Biomass Residue Availability
4-2
4.1.1 Solid Waste
The trash generated by homes and businesses is called “solid waste,” and the
environmental department in each county in Hawai’i typically manages the collection,
disposal, and recycling operations. Therefore, the assessment of solid waste is broken
down by county in the following section.
City and County of Honolulu
Each year on O`ahu roughly 1.6 million tons of waste are generated.
Approximately 500,000 tons of reusable waste, including green waste, tires and concrete,
are recycled through a variety of programs. H-POWER, which is the City and County’s
waste-to-energy facility, processes 600,000 tons of waste annually. Another 200,000
tons are deposited into a private construction and demolition landfill. This leaves roughly
400,000 tons of waste per year that is brought to the City’s Waimanalo Gulch Landfill,
including 100,000 tons of ash per year generated by combustion of waste in the H-
POWER facility.
Honolulu has an aggressive recycling program and about 30.8 percent of the
island’s waste stream is estimated to be recovered for beneficial reuse without going to
either H-POWER or the landfill.7 For example, any loads containing more than 10
percent yard trimmings are banned from the landfill and H-POWER. Green waste is
recycled for the city by Hawai’ian Earth Products, which reprocesses clean yard
trimmings, non-lead painted untreated wood waste, fruit & vegetable waste, and borate
treated lumber into a variety of compost and mulch products. Hawai’ian Earth Products’
two O`ahu facilities recycle approximately 85,000 tons of yard and tree trimmings
annually. Hotels, restaurants, grocery stores, food courts, food manufacturers/processors
and hospitals meeting specific size criteria are required to recycle food waste.8 In the
past year about 42,000 tons of food waste was diverted.9 The bulk of this food waste
goes to local hog farmers while the rest is redistributed for food donations in Hawai’i or
shipped to the mainland, primarily for animal feed manufacturing (see Table 4-1).
7 Boylan, Peter. February 3, 2008. Hawaii sending more waste to landfill. Honolulu Advertiser. (http://the.honoluluadvertiser.com/article/2008/Feb/03/ln/hawaii802030365.html) 8 Revised Ordinances of Honolulu, Section 9, Article 3.5 9 Unpublished data, City and County of Honolulu, Department of Environmental Services, Refuse Division, Recycling Office

The Potential for Biofuels Production in Hawai’i 4.0 Biomass Residue Availability
4-3
Table 4-1. End Use of Food Waste Diversions in Honolulu.
Food Waste Use Tons of diverted food waste
Local hog feed a 20,000 – 30,000
Exports b 8,000
Distributed donations of food c 5,000
Fats, Oil, and Grease d 4,000
Total e 42,000
Notes: a No direct data available. Estimated based on the following assumptions: 1) ½ of hogs eat recycled
food waste, 2) 10 pigs per sow, 3) dry matter makes up 25% of food waste. Source: Zaleski, H. Personal communication between Halina Zaleski (University of Hawai’i Swine Extension specialist) and Bret Harper.
b The majority of exported food waste goes to the mainland U.S. where more facilities exist for animal feed processing. Source: Unpublished data, City and County of Honolulu, Department of Environmental Services, Refuse Division, Recycling Office
c This includes food that is donated or no longer suitable for sale, but is still edible and fit for human consumption. Source: Hawai’i Food Bank - http://www.hawaiifoodbank.org/default.asp?doctype=sm&C_ID=246 and Aloha Harvest 2006 annual report.
d The majority of this waste is processed into biodiesel and glycerin products. Estimates of urban grease resources in the State of Hawai’i using factors from (1997) Measuring Recycling: A guide for state and local governments. United States Environmental Protection Agency, Solid Waste and Emergency Response. EPA530-R-97-011. (http://www.epa.gov/recycle.measure/docs/guide1.pdf)
e Does not include pre-consumer produce waste.

The Potential for Biofuels Production in Hawai’i 4.0 Biomass Residue Availability
4-4
Figure 4-1. Hawai’i Food Waste.
In 2006, the activities of the population in the City & County of Honolulu
(Honolulu) generated approximately 940,000 tons10 of municipal solid waste.11
Currently, all municipal solid waste generated in Honolulu is transported to either the H-
POWER waste-to-energy facility or Waimanalo Gulch landfill. The typical waste
streams of these sold waste facilities are very different as the landfill receives primarily
materials which cannot be processed at H-POWER. The composition of Oahu’s
municipal solid waste stream is shown in Table 4-2. It is important to note that this
annual waste estimate represents only the amount of material for both the waste-to-
energy and municipal landfill waste facility. Approximately 20 percent of the waste
destined for energy recovery at H-POWER is rerouted and ultimately disposed of at the
Waimanalo Gulch Landfill due to H-POWER closures throughout the year. This
estimate does not include the ash or residue material that is produced as a result of waste
10 R.W. Beck. April 2007. 2006 Waste Characterization Study. 11 For the purposes of this report the term “municipal solid waste”, does not include C&D, diverted (recycled), or sewage sludge waste.

The Potential for Biofuels Production in Hawai’i 4.0 Biomass Residue Availability
4-5
processing and combustion at H-POWER. As of July 2007, the landfill is utilizing
101 acres of the 200-acre property and only engages the remaining usable acreage as
needed. Despite this room for growth, the immediate future of the only municipal landfill
in Honolulu is in question, and the city is actively looking at alternatives including
shipping the waste to the mainland, building another waste-to-energy facility, and/or
installing an advanced plasma arc waste gasification system.12 Although the majority of
urban biomass is already burned at H-POWER, the remaining organic waste may
represent an excellent opportunity as a bio-fuel feedstock.
Table 4-2. Waste Composition Summary by Solid Waste Facility - 2006.
H-POWER Waimanalo Gulch Landfill
Overall Aggregate
Material Mean %
Annual Weight (tons)
Mean %
Annual Weight (tons)
Mean %
Annual Weight (tons)
Paper 36.7 277,570 4.3 7,864 30.2 284,082
Green Waste 10.1 76,048 3.4 6,270 8.7 82,041
Wood 3.0 22,363 10.7 19,489 4.5 42,273
Other Organics *
24.1 181,937 27.6 50,788 24.8 232,874
Other Waste** 26.2 198,403 54.1 99,455 31.8 298,917
TOTAL 100 756,321 100 183,866 100 940,187
Source: R.W. Beck. April 2007. 2006 Waste Characterization Study for the City and County of Honolulu.
Notes: * May includes food, textiles, carpet, tires, and sewage sludge. ** Includes plastics, metals, glass, inorganics, HHW and other inorganic waste.
Various tipping fees are associated with refuse disposal. H-POWER and the
Waimanalo Gulch Landfill currently have a common tipping fee of $91 for every ton of
trash commercial haulers dump in either site.13 Such “tipping fees” subsidize free city
trash collection from homes, Honolulu’s recycling programs, and operations at the Office
of Solid Waste Management within the State Department of Health. Green waste is
recycled for the city by a private company with an associated commercial tipping fee of
12 Advertiser Staff. 2008. Decisions pending on Hawaii rubbish options. Honolulu Advertiser, (http://www.honoluluadvertiser.com/apps/pbcs.dll/article?AID=/20080109/NEWS04/801090390/1008/NE WS04) 13 Brannon, Johnny. May 1, 2007. Shipment of isle garbage hit snag. Honolulu Advertiser.
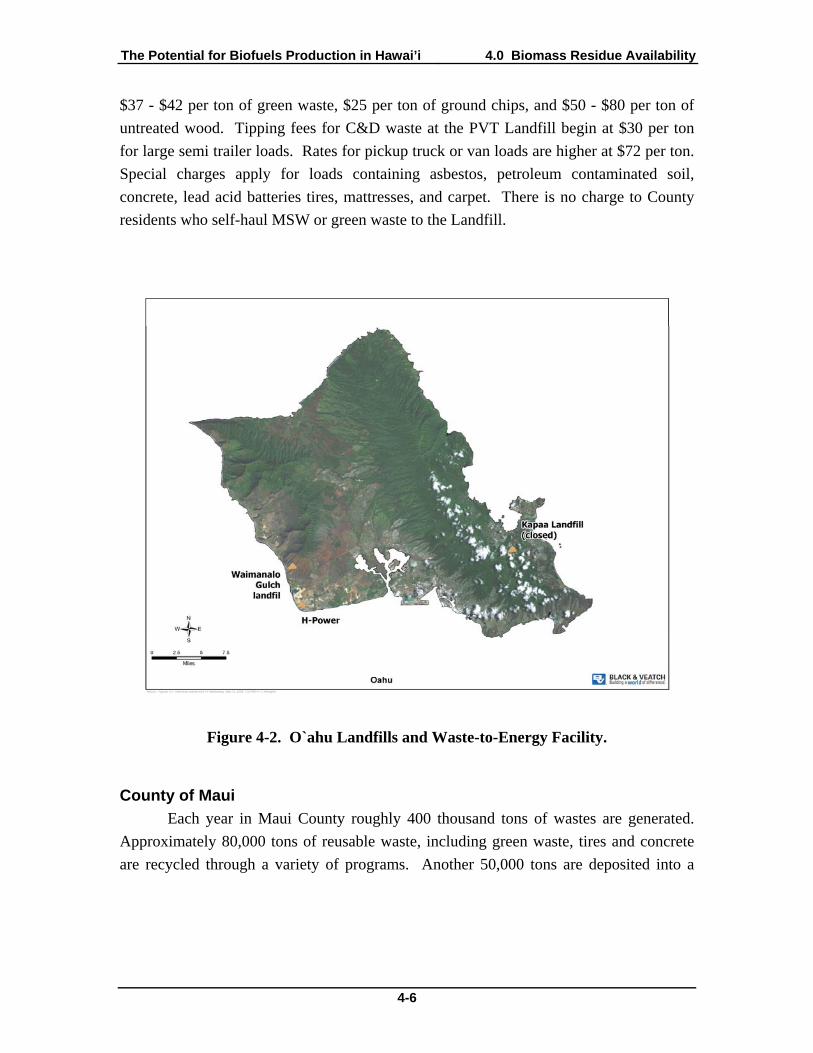
The Potential for Biofuels Production in Hawai’i 4.0 Biomass Residue Availability
4-6
$37 - $42 per ton of green waste, $25 per ton of ground chips, and $50 - $80 per ton of
untreated wood. Tipping fees for C&D waste at the PVT Landfill begin at $30 per ton
for large semi trailer loads. Rates for pickup truck or van loads are higher at $72 per ton.
Special charges apply for loads containing asbestos, petroleum contaminated soil,
concrete, lead acid batteries tires, mattresses, and carpet. There is no charge to County
residents who self-haul MSW or green waste to the Landfill.
Figure 4-2. O`ahu Landfills and Waste-to-Energy Facility.
County of Maui
Each year in Maui County roughly 400 thousand tons of wastes are generated.
Approximately 80,000 tons of reusable waste, including green waste, tires and concrete
are recycled through a variety of programs. Another 50,000 tons are deposited into a

The Potential for Biofuels Production in Hawai’i 4.0 Biomass Residue Availability
4-7
private construction and demolition landfill. This leaves roughly 270,000 tons a year that
is brought to the County’s four municipal landfills.14
Figure 4-3. Maui Solid Waste.
Maui has a recycling program and about 30 percent of the county’s waste stream
was estimated to be recovered for beneficial reuse without going into a municipal landfill
in 2006.15 For example, green waste diversion has grown dramatically in the last 5 years
and is recycled for the county by Maui EKO and Maui Earth. About 30,000 tons of yard
and tree trimmings are composted with sewage sludge annually. A facility on Molokai
composts approximately 3,000 tons of green waste per year.
In 2007, the activities of the population in the County of Maui generated nearly
280,000 tons of municipal solid waste.16 Currently, all municipal solid waste generated
on Maui goes to either the Central Maui Landfill (600 tons per day) or the Hana Landfill
14 A-Mehr, Inc. September 20, 2007. Landfill Capacity. Maui Solid Waste Advisory Committee’s Integrated Solid Waste Management Plan. 15 Anon. December 2006. Report to the Twenty-Fourth Legislature, State of Hawaii, 2007. State of Hawaii, Department of Health, Office of Solid Waste Management.

The Potential for Biofuels Production in Hawai’i 4.0 Biomass Residue Availability
4-8
(4 tons per day). All municipal solid waste generated on Moloka`i and Lana`i go to their
local landfills – 18 and 13 tons per day, respectively. Although a waste composition
study is currently in progress, Maui’s solid waste division estimates the composition of
Maui’s municipal solid waste stream to be 42 percent organic.17 As of September 2007,
the Central Maui Landfill has three years of remaining life in the currently permitted
phase. An additional 16 years of life will be added after expansion into the adjacent
quarry area. Given the tiny input at the Hana Landfill, the permitted capacity should last
far into the future. The private C&D landfill has an estimated 6 years of permitted life,
with an uncertain future. Eight years of permitted life exist at the Moloka`i Landfill, with
an additional 22 years of additional capacity within the existing area. The Lana`i landfill
has an estimated 13 years of permitted life, with an additional 4 years available with a
modest vertical expansion of the maximum height. Despite the fact that all County-
owned sites have an estimated 15 years status quo projected tonnage life available, the
future closure of the private C&D Landfill my represent an opportunity for diverting
biomass feedstock from the stressed Central Maui Landfill.18 There is no charge to
County residents who self-haul MSW or green waste to the landfill.
County of Hawai’i
Each year on the Big Island roughly 300 thousand tons of waste is generated.
Approximately 80,000 tons of reusable waste, including green waste, tires and concrete,
are recycled through a variety of programs. This leaves roughly 220,000 tons per year
that are brought to the County’s two municipal landfills, including nearly 18,000 tons of
construction and demolition waste and 2,000 tons of sewage sludge.19
16 For the purposes of this report, the term “municipal solid waste” does not include C&D, recycled or sewage sludge waste. 17 Includes food waste, large yard waste, leaves and grass, land clearing debris, disposable diapers, and wood. Does not include paper, rubber, or textiles. 18 A-Mehr, Inc. September 20, 2007. Landfill Capacity. Maui Solid Waste Advisory Committee’s Integrated Solid Waste Management Plan. 19 Anon. December 2006. Report to the Twenty-Fourth Legislature, State of Hawaii, 2007. Prepared by: State of Hawaii, Department of Health, Office of Solid Waste Management.

The Potential for Biofuels Production in Hawai’i 4.0 Biomass Residue Availability
4-9
Figure 4-4. Big Island Landfill Locations.
The Big Island has a recycling program and about 25.8 percent of the county’s
waste stream is estimated to be recovered for beneficial reuse without going into a
municipal landfill. For example, green waste diversion is recycled for the county by
EKO Compost, which recycles palm fronds, tree and hedge cuttings, grass clippings,
untreated and unpainted wood pallets, and small logs.
In 2006, the activities of the population of the Big Island generated approximately
200,000 tons of municipal solid waste.20 Currently, all municipal solid waste generated
on the Big Island goes to either the Hilo Landfill or Kona landfill at Pu`uanahulu.
Although a new waste composition study is currently in progress, the Big Island’s solid
waste management plan from 2002 estimates the composition of the landfill solid waste
stream to be about 43 percent organic. 21 The Hilo Landfill is slated to close in August
2010. The county council is awaiting a final offer from a private mainland firm to build a
waste-to-energy incinerator to replace Hilo’s landfill, but alternatives include hauling
20 For the purposes of this report, the term “municipal solid waste” does not include C&D, recycled or sewage sludge waste.

The Potential for Biofuels Production in Hawai’i 4.0 Biomass Residue Availability
4-10
trash to the Kona landfill, opening a new landfill in Hilo, or shipping the trash off the
island. The imminent closure of the Hilo Landfill may represent an opportunity for
diverting biomass feedstock to energy applications from the stressed Kona Landfill.22
Table 4-3. Composition of the Material Entering the South Hilo Landfill Only*.
Material Mean % Annual Weight (tons)
Paper 23.5 15,724
Green Waste 5.4 3,621
Wood 12.1 8,109
Other Organics ** 25 16,730
Other Waste 34 22,841
TOTAL* 100 67,025
Source: Anon. 2002. Final Draft Revision 1, November 15, 2002, Addendum to the Integrated Solid Waste management Plan for the County of Hawai’i. Harding ESE, Aiea, Hawai’i.
Notes: * South Hilo Landfill only receives about a third of the county’s waste. Another 2/3 goes to the
Kona Landfill. ** May includes food, textiles, and carpet.
Various tipping fees are associated with refuse disposal and these fees are
expected to increase in the future, possibly radically when the Hilo landfill closes.
According to the Final EIS, the capital and operating costs of a new Hilo Landfill with
the improvements to the County Wastewater Treatment facility necessary to handle
treatment of the leachate runoff from the dump would be $83.89 per ton. This is higher
than the $50 per ton currently paid to the Waste Management for operation of the existing
Hilo Landfill. The $50 figure, however, does not include leachate treatment nor does it
include contributions to post closure expenses. Together these items are projected to cost
$36.78.23 Leachate runoff and costs could be reduced by building a "bioreactor" type
landfill which is aerated, kept moist, and hosts garbage-decomposing microorganisms.
There is no charge to County residents who self-haul MSW or green waste to the
Landfill.
21 Includes food waste, large yard waste, leaves and grass, land clearing debris, disposable diapers, and wood. Does not include paper, rubber, or textiles. 22 Quirk, Jim. December 9, 2007. What will the county do in ’08? Hawaii Tribune Herald. 23 Walden, Andrew. December 8, 2005. Big Island Garbage Kept off Council Agenda. Hawaii Reporter, special from Hawaii Free Press.
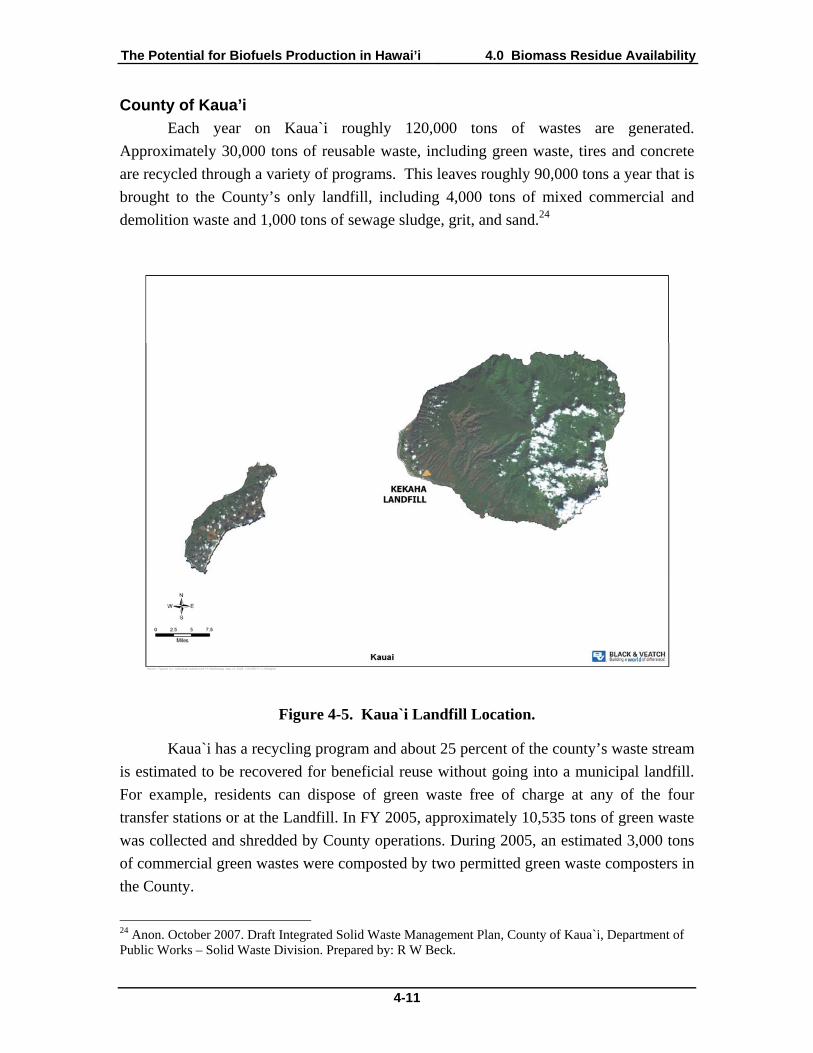
The Potential for Biofuels Production in Hawai’i 4.0 Biomass Residue Availability
4-11
County of Kaua’i
Each year on Kaua`i roughly 120,000 tons of wastes are generated.
Approximately 30,000 tons of reusable waste, including green waste, tires and concrete
are recycled through a variety of programs. This leaves roughly 90,000 tons a year that is
brought to the County’s only landfill, including 4,000 tons of mixed commercial and
demolition waste and 1,000 tons of sewage sludge, grit, and sand.24
Figure 4-5. Kaua`i Landfill Location.
Kaua`i has a recycling program and about 25 percent of the county’s waste stream
is estimated to be recovered for beneficial reuse without going into a municipal landfill.
For example, residents can dispose of green waste free of charge at any of the four
transfer stations or at the Landfill. In FY 2005, approximately 10,535 tons of green waste
was collected and shredded by County operations. During 2005, an estimated 3,000 tons
of commercial green wastes were composted by two permitted green waste composters in
the County.
24 Anon. October 2007. Draft Integrated Solid Waste Management Plan, County of Kaua`i, Department of Public Works – Solid Waste Division. Prepared by: R W Beck.

The Potential for Biofuels Production in Hawai’i 4.0 Biomass Residue Availability
4-12
In 2005, the activities of the population in the County of Kaua`i generated
approximately 84,000 tons of municipal solid waste.25 Currently, all municipal solid
waste generated on Kaua`i goes to the Kekaha Landfill (200 tons per day). The 2007
waste composition study, prepared by R W Beck, estimates the composition of Kaua`i
landfill waste stream to be approximately 29 percent organic. 26
Table 4-4. Summary of 2007 Solid Waste Characterization Conducted for Kaua`i County.
Material % Residential Waste Stream % of Commercial Waste Stream
Paper 33.8 38.5
Green Waste 8.0 5.5
Wood 2.0 4.7
Food Waste 15.7 13.5
Textiles and Leathers 3.2 4.6
Diapers 2.9 1.7
Rubber 0.2 0.3
Other Organics 0.8 0.7
Other Waste* 33.4 30.5
TOTAL 100 100
Source: Anon. October 2007. Draft Integrated Solid Waste Management Plan, County of Kaua`i, Department of Public Works – Solid Waste Division. Prepared by: R W Beck.
Notes: * Includes plastics, metals, glass, inorganics, HHW and other inorganic waste.
The current tipping fee paid by the private haulers and other commercial vehicles
at the landfill is shown in Table 4-5. There is no charge to county residents who self-haul
MSW or green waste to the landfill.
25 For the purposes of this report, the term “municipal solid waste” does not include C&D, recycled or sewage sludge waste. 26 Includes food waste, large yard waste, leaves and grass, land clearing debris, disposable diapers, and wood. Does not include paper, rubber, or textiles.

The Potential for Biofuels Production in Hawai’i 4.0 Biomass Residue Availability
4-13
Table 4-5. Kaua’i Commercial Tipping Fees per Ton.
Type of Waste Dollar per Ton
MSW and green wastes (except special wastes)* $56.00
Asbestos-containing materials $70.00
Dead animals $56.00
Source: Anon. October 2007. Draft Integrated Solid Waste Management Plan, County of Kaua`i, Department of Public Works – Solid Waste Division. Prepared by: R W Beck.
Notes: * There is no charge to County residents who self-haul MSW or green waste to the Landfill.
4.1.2 Non-Solid Waste
Non-solid waste refers to a gas and sludge produced by the biological breakdown
of organic matter in the absence of oxygen. Biogas is comprised primarily of methane (50
to 75 percent) and carbon dioxide (25 to 50 percent). Landfills and wastewater treatment
plants are the major sources of biogas in Hawai`i.
Landfill Gas
Compressed solid waste in landfills creates biogas, this trapped biogas can be
tapped with wells and piped to a small processing plant and either burned to generate
electricity, cleaned and used directly in compressed natural gas vehicles, or reformed to
create hydrogen. The technology to generate electricity is well established and has been
used in the past at the Kapa`a Landfill in Kailua, O`ahu; however, the amount of biogas
production from a landfill is well known to drop exponentially over time once the landfill
stops receiving waste. Developers are exploring landfill gas utilization at the Kapa`a
landfill in Kailua (on O`ahu), at Waena in Central Maui and at Pu`uanahulu in West
Hawai’i on the Big Island.27
In August 2005, Waste Management began full-time operation of a landfill gas
collection and control system at the Waimanalo Gulch Landfill on O`ahu. This gas
management system allows for the combustion of landfill gas in a controlled
environment, eliminating odors and destroying a potent greenhouse gas. Today there are
36 gas extraction wells throughout the site. A landfill gas to energy project will be
implemented sometime in the near future to convert landfill gas to electricity. Currently
Waste Management utilizes an enclosed flare at the site to burn off more than 400 cubic
27 HECO. Landfill Gas. Hawaii’s Energy Future, Renewable Energy Sources. (http://www.hawaiisenergyfuture.com/Articles/Landfill_Gas.html)
The Potential for Biofuels Production in Hawai’i 4.0 Biomass Residue Availability
4-14
feet per minute of methane gas from the landfill at approximately 1,800 degrees
Fahrenheit.28
The City and County of Honolulu has completed work necessary to solicit
contractors for bioenergy production at the Kapa`a landfill. The landfill produced about 3
MW from 1989 to 2002, until turbine problems forced closure. The gas analysis
confirmed that the methane BTU content of the gas sampled was consistent with landfills
of its age, and that sulfur and siloxane values were relatively low.29
The Kona landfill at Pu`uanahulu on the Big Island remains open, with 900,000
tons of waste in place and may produce about 300,000 cubic feet of biogas per day.30
There is only one viable landfill gas project on Kauai, located at the Kekaha
landfill. (There is one smaller landfill, but it is not suitable for development.) Black &
Veatch estimated the energy production of this project after the planned landfill closure
in 2009. In this case, the maximum gas flow is approximately 465 cubic feet per minute
and occurs in 2009.31
Sewage Sludge
Wastewater is treated at military, private, and public facilities in Hawai’i as
shown in Table 4-6.32 Most of these facilities, however, are small and do not have
dewatering capability. Standard practice is for these smaller wastewater plants to truck
their sludge to larger public facilities for dewatering, which has the effect of
consolidating potential sources of sewage sludge.
28 Anon. July 2007. Waste Management Report to the community: Landfill Operations and Community Involvement. Prepared by Waste Management. 29 Anon. December 2005. Progress Report to the Governor and the Legislature of the State of Hawaii Regarding State Support for Achieving Hawaii’s Renewable Portfolio Standards. By the State of Hawaii Department of Business, Economic Development, and Tourism. 30 EPA. Landfill Methane Outreach Program. (http://www.epa.gov/lmop/) 31 Anon. 2007. Unpublished report from the Kauai Island Utility Cooperative’s Final Report 2010 Landfill Gas. Prepared by Black & Veatch. 32 Anon. Listing of waste water treatment facilities, capacities, and aggregate sludge generation by island in Hawaii in 2006. Unpublished data from the Hawai`i Department of Health, Waste Water Branch Chief, Marshall Lum.

The Potential for Biofuels Production in Hawai’i 4.0 Biomass Residue Availability
4-15
Table 4-6. Summary of Number, Location, and Ownership of Wastewater Treatment Plants and Sludge Production and Amount Diverted from Land-Filling
in Hawai’i.
Tons Tons Island Public Federal Private Produced Diverted
Hawai`i 5 32 183 0
Kaua`i 5 1 28 246 0
Maui 3 21 3,352 3,352
Moloka`i / Lana`i
2 11 n.a.* n.a.*
O`ahu 8 3 51 16,576 891
Total 23 4 143 20.357 3,462
Source: Turn et al. 2002. Biomass and bioenergy resource assessment, State of Hawai’i. Hawai’i Natural Energy Institute, School of Ocean and Earth Sciences and Technology, University of Hawai’i.
Notes: * Data not available.
The largest wastewater facilities have activated sludge treatment, which use
microorganisms in secondary treatment. This process produces biogas that is 60 to 70
percent methane. At the Kailua Wastewater treatment plant about 20 percent of this
methane is burned to maintain the optimum temperature for the microorganisms, while
the rest is flared for ease of disposal. This biogas has the potential to be reformed into
hydrogen fuel.

The Potential for Biofuels Production in Hawai’i 4.0 Biomass Residue Availability
4-16
Table 4-7. Summary of Treatment Process of Wastewater Treatment Plants and 2006 Sludge Production for Major Plants.
Plant Treatment 2006 Sludge (tons) d Ahuimanu Screen a N/A
Ele`ele Activated sludge N/A
Hilo Bio-tower N/A
Honolulu Primary b 7,668
Kapehu Rock Media, secondary N/A
Kealakehe Oxidation pond N/A
Kihei Activated sludge 6,633
Kulaimano Activated sludge N/A
Lahaina Activated sludge 7,539
Lihue Bio-tower N/A
Papaikou Activated sludge N/A
Sand Island Primary c N/A
Wahiawa Activated sludge 828
Waianae Bio-tower N/A
Wailua Activated sludge N/A
Wailuku Activated sludge 10,567
Waimanalo Activated sludge 57
Waimea Activated sludge N/A
Source: Listing of waste water treatment facilities, capacities, and aggregate sludge generation by island in Hawai’i in 2006. Unpublished data from the Hawai’i Department of Health, Waste Water Branch Chief, Marshall Lum.
Notes: a Ahuimanu has been converted to a pretreatment facility and pump station. It no longer treats
wastewater but sends it to the Kailua Wastewater Treatment Plant for further processing after it is screened.
b The Honolulu plant has about a third of its flow treated to tertiary levels for reuse and the rest is still primary treated.
c Sand Island is considered as an advanced primary treatment plant. d Preliminary data for 2006. Note, the county of Kauai and Big Island did not submit data to the
Hawai’i State Department of Health.
At present, sludge reuse has been accomplished by composting biosolids with
green waste on Maui and O`ahu. Maui County’s program diverts all sewage biosolids to
compost production under contract to Maui EKO Systems, Inc. The Navy established a
biosolids treatment facility at Barbers Point that composts sludge from the Fort
Kamehameha and Schofield Barracks WWTP’s and the Honolulu WWTP operated by
the City and County of Honolulu. In 1999, 891 tons (dry basis) of the City and County’s
biosolids were composted with green waste. This value was increased to 10 tons (dry
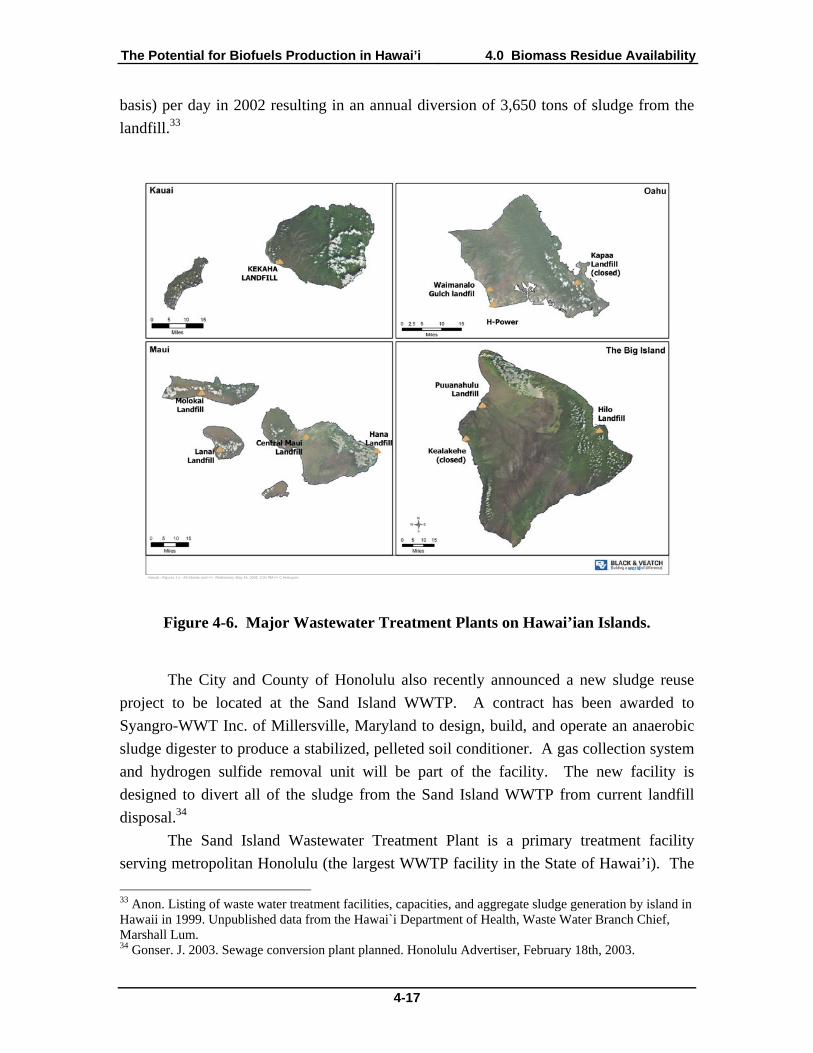
The Potential for Biofuels Production in Hawai’i 4.0 Biomass Residue Availability
4-17
basis) per day in 2002 resulting in an annual diversion of 3,650 tons of sludge from the
landfill.33
Figure 4-6. Major Wastewater Treatment Plants on Hawai’ian Islands.
The City and County of Honolulu also recently announced a new sludge reuse
project to be located at the Sand Island WWTP. A contract has been awarded to
Syangro-WWT Inc. of Millersville, Maryland to design, build, and operate an anaerobic
sludge digester to produce a stabilized, pelleted soil conditioner. A gas collection system
and hydrogen sulfide removal unit will be part of the facility. The new facility is
designed to divert all of the sludge from the Sand Island WWTP from current landfill
disposal.34
The Sand Island Wastewater Treatment Plant is a primary treatment facility
serving metropolitan Honolulu (the largest WWTP facility in the State of Hawai’i). The
33 Anon. Listing of waste water treatment facilities, capacities, and aggregate sludge generation by island in Hawaii in 1999. Unpublished data from the Hawai`i Department of Health, Waste Water Branch Chief, Marshall Lum. 34 Gonser. J. 2003. Sewage conversion plant planned. Honolulu Advertiser, February 18th, 2003.
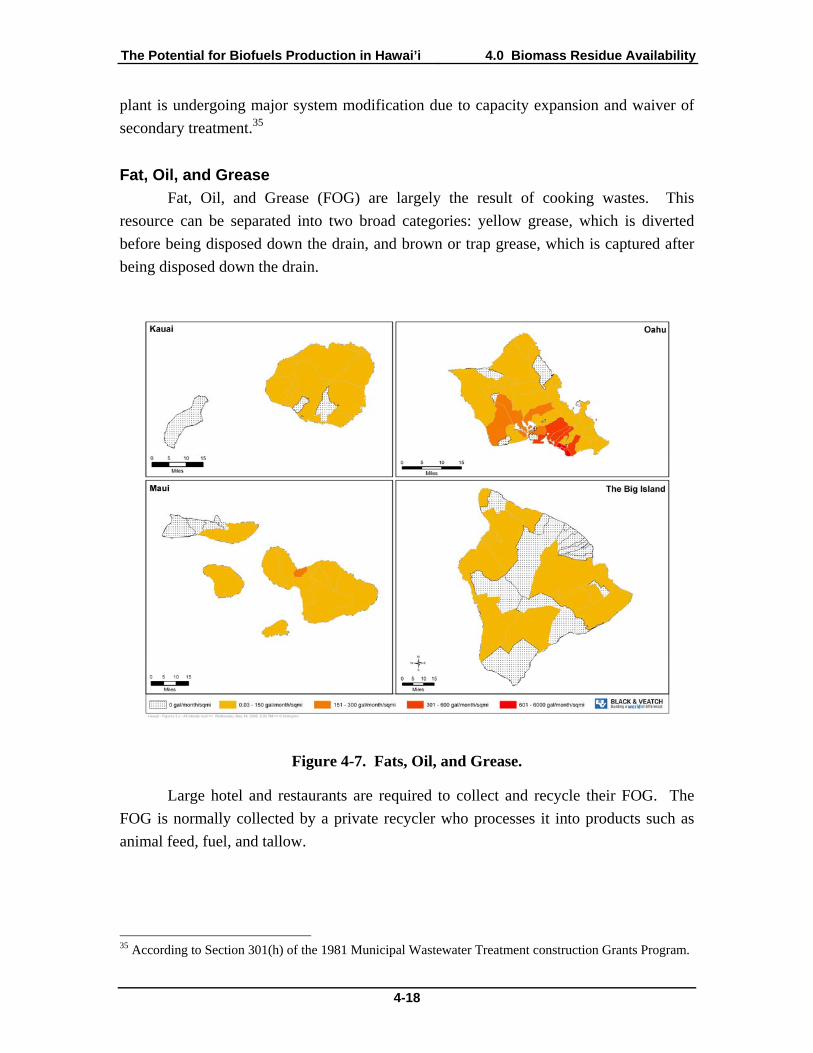
The Potential for Biofuels Production in Hawai’i 4.0 Biomass Residue Availability
4-18
plant is undergoing major system modification due to capacity expansion and waiver of
secondary treatment.35
Fat, Oil, and Grease
Fat, Oil, and Grease (FOG) are largely the result of cooking wastes. This
resource can be separated into two broad categories: yellow grease, which is diverted
before being disposed down the drain, and brown or trap grease, which is captured after
being disposed down the drain.
Figure 4-7. Fats, Oil, and Grease.
Large hotel and restaurants are required to collect and recycle their FOG. The
FOG is normally collected by a private recycler who processes it into products such as
animal feed, fuel, and tallow.
35 According to Section 301(h) of the 1981 Municipal Wastewater Treatment construction Grants Program.

The Potential for Biofuels Production in Hawai’i 4.0 Biomass Residue Availability
4-19
Table 4-8. Estimates of Urban Grease Resources in the State of Hawai’i Using Factors from EPA (1997).
County Defacto Population
Grease (tons/year)
Yellow Trap/Brown Total Honolulu 1,000,000 4,000 6,000 10,000
Hawai`i 200,000 900 1,000 1,900
Kaua`i 90,000 400 600 1,000
Maui 200,000 900 1,000 1,900*
Total 1,490,000 6,200 8,600 14,800
Source: Anon. 1997. Measuring Recycling: A guide for state and local governments. United States Environmental Protection Agency, Solid Waste and Emergency Response. EPA530-R-97-011. (http://www.epa.gov/recycle.measure/docs/guide1.pdf)
Notes: * The majority of this grease is probably already being utilized by Pacific Biodiesel
Grease traps are baffled tanks installed on drain lines of food preparation and
dishwashing sinks to prevent it from entering the sewer line. If too much FOG enters the
sewer system, it can accumulate on the walls of pipes and block sewer lines. These tanks
are designed to reduce the velocity of the flow allowing the FOG to float to the top and
become trapped by the baffles. Heavier sediment eventually collects on the bottom of the
tank as well. The efficiency of the trap decreases as more FOG accumulates and must be
emptied on a regular schedule, normally when the FOG accumulation fill about 25
percent of the trap capacity. Private pumper trucks collect the FOG.
Reclaimed FOG has a number of uses in the islands. For example, Island
Commodities sells reprocessed FOG as fuel to Young Drycleaners, which uses it in a
boiler. Hawaii’s only commercial experience with biodiesel is production from waste
cooking oil as a feedstock by Pacific Biodiesel on O`ahu and Maui. Currently, Pacific
Biodiesel produces about 700,000 gallons a year.36 Biodiesel can also be produced from
animal renderings – this source should be included in any analysis of biodiesel potential.
In general, animal renderings can be expected to yield nearly 60 gallons of biodiesel per
ton of renderings.37
36 Based in part on: Turn, Scott. Biomass and Bioenergy Resource Assessment. State of Hawaii, Hawaii Natural Energy Institute. December 2002, as well as Solid Waste Division, County of Hawaii. Study Relating to Used Cooking Oil Generation and Biodiesel Production Incentives in the County of Hawaii. December 2004, and 2002 U.S. Census Economic Census: Accommodation and Foodservices: Hawaii. 37 “Anything into Oil”, Brad Lemley, Discover Magazine, Vol. 24 No. 5. May 2003. (http://lists.envirolink.org/pipermail/ar-news/Week-of-Mon-20030804/004435.html)

The Potential for Biofuels Production in Hawai’i 4.0 Biomass Residue Availability
4-20
4.2 Agricultural Residues and Waste Streams Sugar cane bagasse and macadamia nut husks and shells are the two agricultural
residues produced in the largest quantities in Hawai’i; however, many other residues such
as pineapple wastes are prevalent on some islands. In addition to the quantity of waste
available, it is important to consider density and water content (which may restrict the
feasibility of transportation) and seasonality, which may restrict the ability of the
conversion plant to operate on a year-round basis. Facilities designed to use seasonal
biomass sources will need adequate storage space and should also be flexible enough to
accommodate alternative feedstocks such as wood residues or other wastes in order to
operate year-round. Some agricultural residues need to be left in the field in order to
increase soil tilth and to reduce erosion. However, some residues such as bagasse can be
removed after sugarcane processing without much difficulty.
4.2.1 Sugar
The sugar industry is the largest single source of agricultural biomass residues in
the State of Hawai’i. These residues can be categorized into bagasse, sugarcane trash,
and molasses. Bagasse is the fibrous material left after sugarcane processing. Sugarcane
trash includes the leaves and stalks left in the field after the harvest. Molasses is a semi-
liquid waste stream left after sugar processing. Both bagasse and molasses contain sugars
that are deemed uneconomic to recover. Bagasse typically contains about 2 percent
residual sugar while molasses normally contains about 50 percent sugar by mass.
Two sugar factories remain in Hawai’i: the Hawai’ian Commercial and Sugar
Company (HC&S) on Maui and the Gay & Robinson Company (G&R) on Kaua`i. The
bioenergy resources at the two factories are summarized in Table 4-9. In 2006, HC&S
produced about 430,000 tons of bagasse at 50 percent moisture content (215,000 tons of
fiber) and 60,000 tons of molasses.
Table 4-9. Potential Bioenergy Feedstocks Generated by the Hawai’i Sugar Industry in 2006.
1000’s tons Bagasse* Bagasse Fiber Molasses Cane Trash
Fiber
Hawai’ian Commercial & Sugar Co. 430 220 60 110
Gay & Robinson 100 50 10 30
Source: USDA.
Notes: * Bagasse at 50% moisture content

The Potential for Biofuels Production in Hawai’i 4.0 Biomass Residue Availability
4-21
Both factories produce electricity using bagasse-fired steam boilers. HC&S also
uses coal and fuel oil to firm their capacity in accordance with their power supply
contract. Their power plant has three boilers with a combined capacity of about 44 MW,
but normal operation only produce about 30 MW of power. G&R’s power plant is rated
at 4 MW, but only produces about 2 MW during normal operation. During the cane
grinding season more power is normally produced than is used by the facility. This
results in a net sale of electricity to the local electric cooperative. In the past, G&R sold
their excess bagasse to another biomass-to-energy facility that closed in December 2002.
Last year they unveiled plans for a multi-faceted “energy plantation”, but have not started
construction.38
Figure 4-8. Kaua`i Sugarcane & Pineapple Waste.
As noted above, both companies produce molasses as a by-product of raw sugar
manufacture. Production of ethanol via fermentation using molasses as a feedstock is a
proven technology at industrial scales and a yield of approximately 72 gallons of ethanol
per ton of molasses can be expected. On this basis, potential ethanol production from
38 Eagle, Nathan. January 15, 2008. Kaua`i lawmakers set session goals. The Garden Island.

The Potential for Biofuels Production in Hawai’i 4.0 Biomass Residue Availability
4-22
molasses for HC&S is nearly 4.3 million gallons per year. Similarly, at its current level
of molasses production, G&R could expect to produce around 0.7 million gallons of
ethanol per year.39
Figure 4-9. Maui Sugarcane & Pineapple Waste.
4.2.2 Pineapple
A summary of recent Hawai’i pineapple production statistics is shown in Figure
4-10. In 2005, pineapple harvested from roughly 14,000 acres in the state, totaled
212,000 tons. Of this total, half was sold as fresh fruit and the other half was processed.
There are three major pineapple producers in Hawai’i. Del Monte planted their last crop
in 2006 and expects to harvest the last rotation this year before giving up their lease on
39 Turn, S; V. Keffer, and M. Staackmann. 2002. Biomass and bioenergy resource assessment, State of Hawaii. Honolulu: Hawaii Natural Energy Institute, School of Ocean and Earth Sciences and Technology, University of Hawaii.

The Potential for Biofuels Production in Hawai’i 4.0 Biomass Residue Availability
4-23
5,100 acres. Dole announced they are considering selling some of their “non-core” land
as Maui Land & Pineapple has already been doing in recent years.40
Crop Acerage (100 acres)
Production
Processed
Fresh Market
0
50
100
150
200
250
300
350
400
1998 1999 2000 2001 2002 2003 2004 2005 2006 2007
crop year
pin
eap
ple
(1,
000
ton
s)
Figure 4-10. Summary of Pineapple Harvested Acreage and Production in Hawai'i for the Period 1998 to 2007.
O`ahu pineapple production is mainly sold as fresh product. Pineapples not
suitable for fresh sale are canned or frozen. Some pineapple residues are produced (about
10 dry tons per acre). These are normally reincorporated back into the soil. Under
circumstances that require a short turnaround time, these residues are disked, allowed to
dry, and then open field burned.
Pineapple production on Maui also produces a residue in the form of dewatered
skins. These are normally sold as feed to local cattle operations. This byproduct stream
is estimated to be about 9,000 tons in 2007 with an estimated moisture content of 50
percent.41 This translates to a dry matter stream of 4,500 tons on an annual basis. Field
trash in handled in way that is similar to the approach used on O`ahu.
4.2.3 Macadamia Nut Shells
Macadamia nuts are de-husked and delivered nut-in-shell to the processing
factories. A summary of this production from 1998 to 2006 is presented in Figure 4-11.
The acreage harvested during the period declined by 4,300 acres. New macadamia nuts
trees are being planted on retired sugarcane fields; however, this is not expected to be
40 Gomes, Andrew. December 3, 2007. Dole Food Co. may sell some of its Hawaii land. The Honolulu Advertiser.

The Potential for Biofuels Production in Hawai’i 4.0 Biomass Residue Availability
4-24
very large due to the risk of establishing new orchards. Most of the existing orchards
were planted at a time when tax laws encouraged orchard establishment.
Bearing Acerage
Production (tons)
0
5,000
10,000
15,000
20,000
25,000
30,000
1995 1996 1997 1998 1999 2000 2001 2002 2003 2004 2005 2006
crop year
nu
t in
sh
ell
pro
du
cti
on
Figure 4-11. Summary of Macadamia Nut Harvest Acreages and Nut-in-Shell Production from 1998 to 2006. Crop year July 1 to June 30
Nut-in-shell production has varied from 24,500 tons to 29,000 tons with the most
recent crop yield reporting 29,000 tons. Nut-in-shell normally arrives with the outer husk
attached. The outer husk is removed and represents about 50 percent of the nut-in-shell
mass. These husks are typically composted or used as a soil amendment. At this stage
the de-husked portion of the nut contains about 20 percent moisture. These nuts are dried
to about 1.5 percent moisture content before cracking. The kernel and shell have mass
proportions of 25 and 75 percent, respectively. The dried shells represent about 60
percent of the moist nut-in-shell mass.42 On this basis, an industry-wide resource of
17,000 tons per year of macadamia nut shells (at 1.5 percent moisture) is estimated.
41 Turn, S; V. Keffer, and M. Staackmann. 2002. Biomass and bioenergy resource assessment, State of Hawaii. Honolulu: Hawaii Natural Energy Institute, School of Ocean and Earth Sciences and Technology, University of Hawaii. 42 Turn, S; V. Keffer, and M. Staackmann. 2002. Biomass and bioenergy resource assessment, State of Hawaii. Honolulu: Hawaii Natural Energy Institute, School of Ocean and Earth Sciences and Technology, University of Hawaii.

The Potential for Biofuels Production in Hawai’i 4.0 Biomass Residue Availability
4-25
Figure 4-12. Macadamia Nut Processing Locations.
The macadamia nut shell resource is normally used as a boiler fuel to generate
heat for nut-in-shell drying operations. Other uses include electricity generation, orchard
road fill, and fuel in coffee drying operations in Kona. It is estimated that about ten
percent of the shell residues are bought and sold amongst factories. In 2002, Turn et al.
estimated this price to be $13 to $17/ton at the factory gate. Shells are normally sold by
the trailer load, and the estimated weight is based on an estimated trailer volume and
reasonable shell density (800 to 850 lb per cubic yard).
4.3 Animal Wastes The main domesticated livestock populations in the state are dairy and beef cattle,
hogs, and chickens. Figure 4-13 shows the population data for hogs and milk cows over
the past 10 years.43 Note that only dairy cattle numbers are shown in the figure.
Although beef cattle vastly outnumber dairy cattle, their numbers do not contribute to
potential manure supplies because of the dispersed character of the manure produced by
43 Anon. November 5, 2007. Livestock and Animals. United States Department of Agriculture, National Agricultural Statistics Service.

The Potential for Biofuels Production in Hawai’i 4.0 Biomass Residue Availability
4-26
the cattle per land area. All livestock populations in Hawai’i display a general decline for
the 10-year period shown in the figure.
milk cows
hogs
0
5000
10000
15000
20000
25000
30000
35000
1997 1998 1999 2000 2001 2002 2003 2004 2005 2006 2007
Figure 4-13. Livestock Populations in Hawai'i for the Period from 1997 to 2007.
4.3.1 Swine Manure
Hawaii’s total hog population is about 15,000 animals, with about 3,500 used as breeding
stock and the remainder sold to market. Geographic data on hog populations for 2006 are
shown in Table 4-10 (data for 2007 was not yet available). Hog farms in Honolulu
County are small and average only three acres in size.44
44 Zalefki, H. Personal communication between Halina Zalefki (University of Hawaii Swine Extension specialist) and Bret Harper.
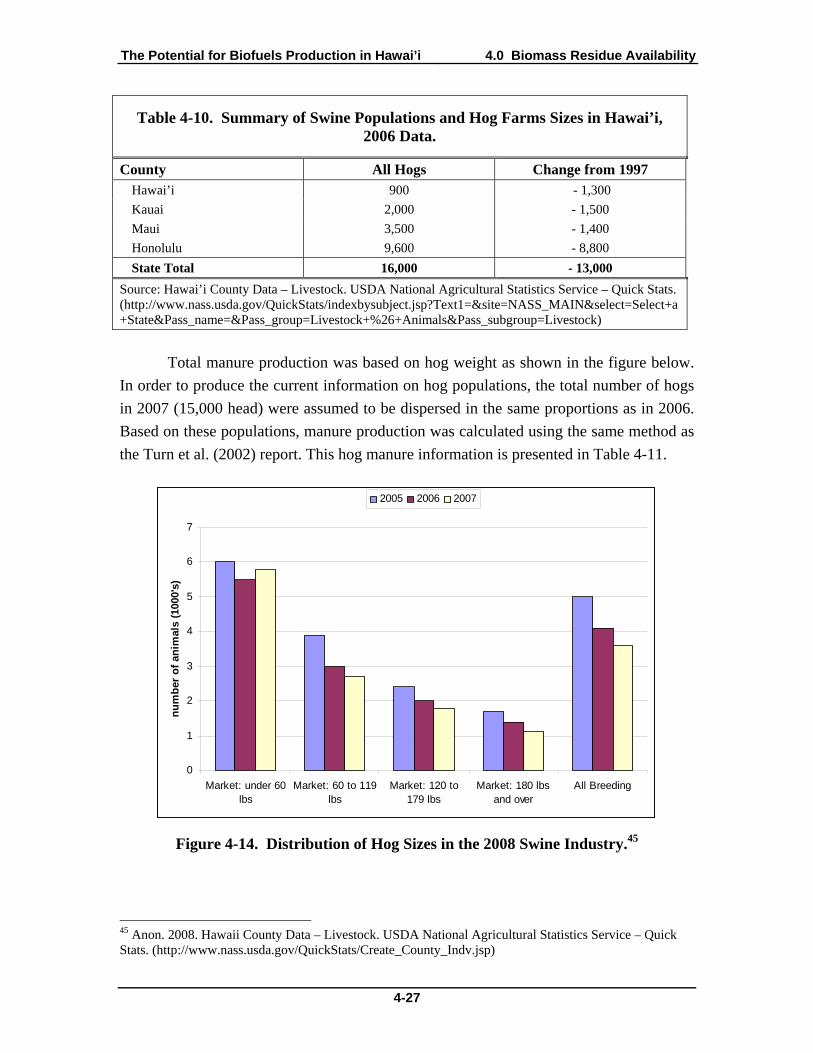
The Potential for Biofuels Production in Hawai’i 4.0 Biomass Residue Availability
4-27
Table 4-10. Summary of Swine Populations and Hog Farms Sizes in Hawai’i, 2006 Data.
County All Hogs Change from 1997 Hawai’i 900 - 1,300
Kauai 2,000 - 1,500
Maui 3,500 - 1,400
Honolulu 9,600 - 8,800
State Total 16,000 - 13,000
Source: Hawai’i County Data – Livestock. USDA National Agricultural Statistics Service – Quick Stats. (http://www.nass.usda.gov/QuickStats/indexbysubject.jsp?Text1=&site=NASS_MAIN&select=Select+a+State&Pass_name=&Pass_group=Livestock+%26+Animals&Pass_subgroup=Livestock)
Total manure production was based on hog weight as shown in the figure below.
In order to produce the current information on hog populations, the total number of hogs
in 2007 (15,000 head) were assumed to be dispersed in the same proportions as in 2006.
Based on these populations, manure production was calculated using the same method as
the Turn et al. (2002) report. This hog manure information is presented in Table 4-11.
0
1
2
3
4
5
6
7
Market: under 60lbs
Market: 60 to 119lbs
Market: 120 to179 lbs
Market: 180 lbsand over
All Breeding
nu
mb
er o
f an
imal
s (1
000'
s)
2005 2006 2007
Figure 4-14. Distribution of Hog Sizes in the 2008 Swine Industry.45
45 Anon. 2008. Hawaii County Data – Livestock. USDA National Agricultural Statistics Service – Quick Stats. (http://www.nass.usda.gov/QuickStats/Create_County_Indv.jsp)

The Potential for Biofuels Production in Hawai’i 4.0 Biomass Residue Availability
4-28
Table 4-11. Summary of Hog Populations and Manure Production by County.
1,000’s No. of Hogs a,
Y2006 Estimated No.
of Hogs b, Y2007
Estimated Annual Production Y2007 c,
(wet tons / year)
Estimated Annual Production, Y2007 d,
(dry tons / year)
Hawai’i County 0.9 0.8 1,000 90
Maui County 3.5 3.3 4,000 370
Honolulu County 9.6 9.0 11,100 1,020
Kaua`i county 2.0 1.9 2,200 200
Total 16 15 18,400 1,690
Source: Hawai’i County Data – Livestock. USDA National Agricultural Statistics Service – Quick Stats. (http://www.nass.usda.gov/QuickStats/Create_County_Indv.jsp).
Notes: a Data from USDA Statistics Service, 2008. b Based on county distribution from Y2006 and state total for Y2007. c Based on hog sizes shown in Figure 3-4, and manure estimates from Turn et al. (2002). d Based on moisture content of 90.8%.
4.3.2 Cattle Manure
As shown in Table 4-12, there were about 3,800 milk cows in Hawai’i in 2007.
The number of total cattle during the same period was about 158,000. When considering
options to collect biomass residues, only animals raised at high density present an
opportunity for manure collection at a reasonable cost. Beef cattle are typically raised on
pasture at low density, so dairy cows are the main source of cattle manure. As recently as
1980, Hawai’i had about two dozen dairies and was totally self-sufficient in milk. Since
1999, however, four dairies on O`ahu and three on the Big Island have closed. Pacific
Dairy, the last dairy on O`ahu shut down in early 2008, leaving the island’s 910,000
residents dependent on imported milk. The closing of Pacific Dairy in Waianae Valley
will leave Hawai’i with just two dairies, both on the Big Island, which produce milk
almost exclusively for that island46 and are also pasture based. This leaves no cattle
being raised at high density and therefore no biomass residues available from cattle.
46 Hao, Sean and Dan Nakaso. January 30, 2008. Last dairy closing in Oahu; milk a concern. USA Today.

The Potential for Biofuels Production in Hawai’i 4.0 Biomass Residue Availability
4-29
Table 4-12. Cattle and Calves: January 1 Inventory by Sex Classes and Weight, State of Hawai’i, 2003-2007.
Source: Anon. February 22, 2007. Hawai’i Cattle January 1. National Agricultural Statistics Service, United State Department of Agriculture in cooperation with the Hawai’i Department of Agriculture.
4.3.3 Poultry Manure
Published information on the number and size of chicken operations in Hawai’i is
limited because of the need to avoid disclosing information about individual farms. Data
on laying birds is available from United States Department of Agriculture (USDA).
Daily manure production values are based on the methods used by Turn’s 2002
Biomass and Bioenergy Resource Assessment, assuming no broiler chickens since the
closure of Pacific Poultry’s slaughter side of operations in late 2004. Using an estimate
of 550,000 chickens in the state, down from 883,000 in 2001, these chickens produce an
estimated 4,000 dry tons of manure per year.
Table 4-13. Estimates of Chicken Inventories and Manure Resources in Hawai’i.
Total Animal Inventory* (thousands) 550
Manure Production Rate (lb/animal/day) 0.16
Annual Manure Production (wet tons/year) 16,000
Annual Manure Production**(dry tons/year) 4,000
Notes: * 2006 inventory data from USDA ** Assumes moisture content of 75%
Poultry manure is high in nitrogen and is used directly as a soil amendment. It is
also being mixed with mulch and composted, then sold wholesale in bulk or retail bags.
Poultry manure also has potential for use as a feedstock in thermochemical and anaerobic
digestion processes.

The Potential for Biofuels Production in Hawai’i 4.0 Biomass Residue Availability
4-30
Figure 4-15. Animal Wastes.
4.4 Wood Resources The Hawai’ian Islands support a wide variety of forest types, ranging from low
elevation tropical rain forests to arid scrub forests to temperate sub-alpine woodlands to
cloud forests. These forests still cover roughly 1.7 of Hawaii’s 4.1 million acres, or about
41 percent of the state’s total land area. Approximately 60 percent of this area is
considered to be productive, healthy forest, covered primarily by ohia (Metrosideros
polymorpha), ohia-koa mix, and relatively pure koa (Acacia koa).47
47 Anon. 2001. Hawaii’s 5-Year Forest Stewardship Plan. State of Hawai`i, Department of Land and Natural Resources, Division of Forestry and Wildlife.
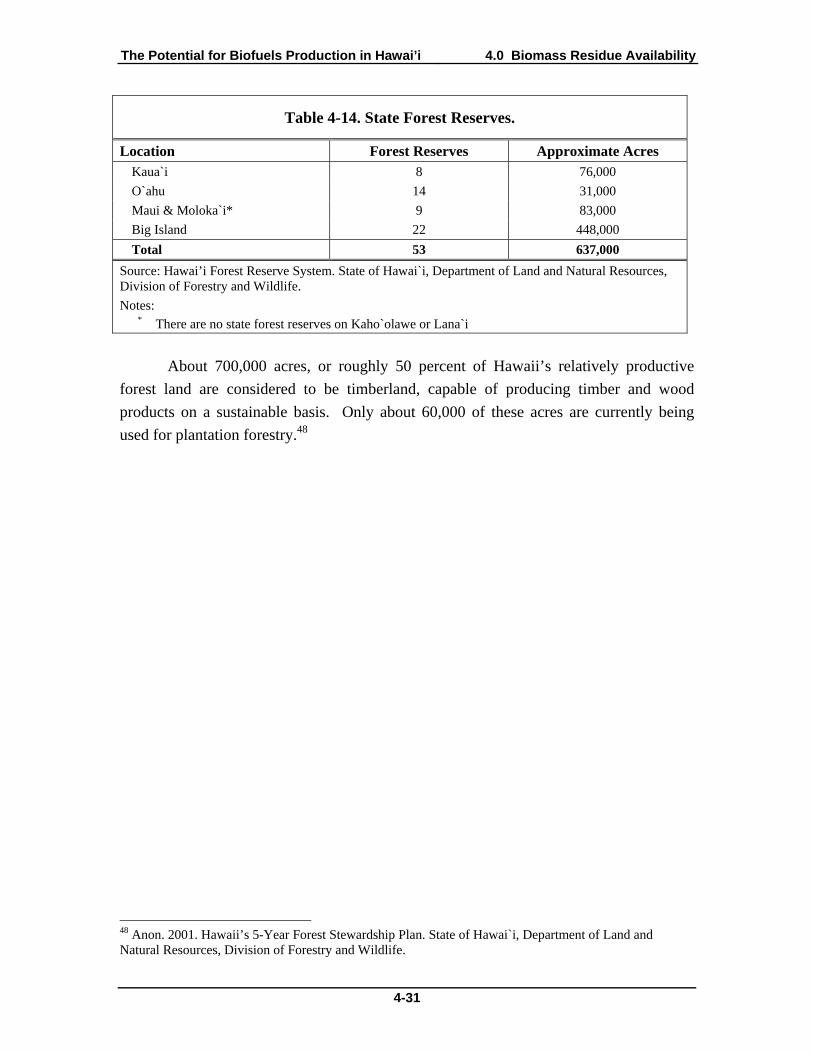
The Potential for Biofuels Production in Hawai’i 4.0 Biomass Residue Availability
4-31
Table 4-14. State Forest Reserves.
Location Forest Reserves Approximate Acres Kaua`i 8 76,000
O`ahu 14 31,000
Maui & Moloka`i* 9 83,000
Big Island 22 448,000
Total 53 637,000
Source: Hawai’i Forest Reserve System. State of Hawai`i, Department of Land and Natural Resources, Division of Forestry and Wildlife.
Notes: * There are no state forest reserves on Kaho`olawe or Lana`i
About 700,000 acres, or roughly 50 percent of Hawaii’s relatively productive
forest land are considered to be timberland, capable of producing timber and wood
products on a sustainable basis. Only about 60,000 of these acres are currently being
used for plantation forestry.48
48 Anon. 2001. Hawaii’s 5-Year Forest Stewardship Plan. State of Hawai`i, Department of Land and Natural Resources, Division of Forestry and Wildlife.

The Potential for Biofuels Production in Hawai’i 4.0 Biomass Residue Availability
4-32
Figure 4-16. State of Hawai’i Forest Reserve System.
4.4.1 Forest Products
A 1994 report49 estimated the required forest area and annual timber volume
necessary for various forest industry products. These are shown in Table 4-15. This
report assumed a ramp-up of the industry over 15 years. It also assumes that wood-waste
from lumber production would be integrated into the wood chip and fiberboard
production. If these industries were not integrated, more wood waste would be available
for biofuel production.
49 Anon. 1994. Hawaii Forestry Investment Memorandum. Prepared for the State of Hawaii Department of Business, Economic Development & Tourism by Groome Poyry Limited, Auckland, New Zealand.

The Potential for Biofuels Production in Hawai’i 4.0 Biomass Residue Availability
4-33
Table 4-15. Summary of Product Options and Associated Forest Area and Timber Requirements for Hawai’i Processing Facilities.
Product Required Forest Area (acre)
Required Annual Timber Volume*
(million cubic feet) Wood chips for export 30,000 17.7
Medium density fiberboard 10,000 6.4
Dimensional lumber 4,000 4.2
Veneer 15,000 1.1
Source: Hawai’i Forestry Investment Memorandum. Prepared for the State of Hawai’i Department of Business, Economic Development & Tourism by Groome Poyry Limited, Auckland, New Zealand.
Notes: * Volume requirement assumed integration of facilities.
4.4.2 Forest Resources
A second study50 completed in 2000, inventoried the timber available on State
Lands. Some of the details of this study are given in Table 4-16. The island of Hawai’i
has the greatest potential for commercial timber operations. About 12,000 acres of timber
exist on the Waiakea Timber Management Area. This area was originally planted in the
mid-1960 and some tracts have been harvested and replanted. Most of the species found
in the WTMA are non-native with the exception of about 500 acres of ohia and koa. The
Eucalyptus saligna and E. grandis species are most abundant. The WTMA is not a
contiguous parcel, but a collection of timber stands contained in a rectangle about 5 miles
wide and 12 miles long boarding Highway 19 leaving Hilo.
50 Anon. 2000. Market Research on Commodity Wood Products from 8 Non-Native, Hawaiian Grown Timber Species. Prepared by Jaakko Poyry Consulting (Asia-Pacific) Pty. Ltd. The Jaakko Poyry report was prepared for the Hawaii Forest Industry Association with funding from the Hawai`i Forestry & Communities Initiative.
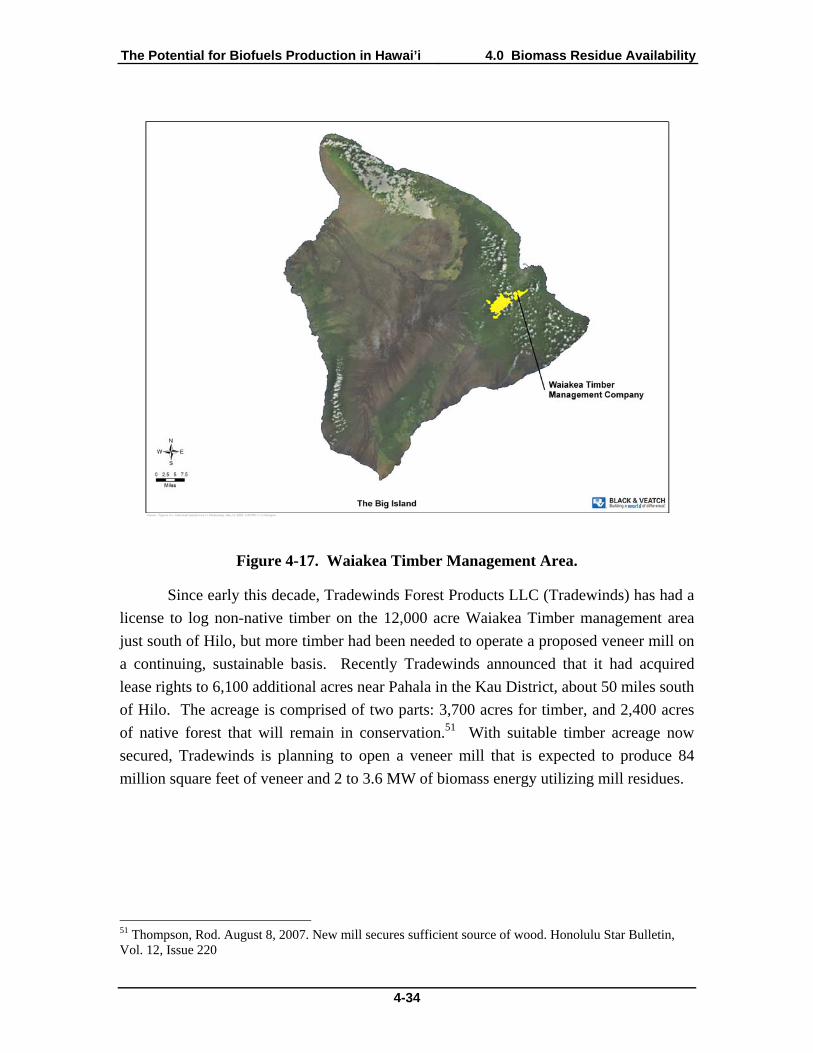
The Potential for Biofuels Production in Hawai’i 4.0 Biomass Residue Availability
4-34
Figure 4-17. Waiakea Timber Management Area.
Since early this decade, Tradewinds Forest Products LLC (Tradewinds) has had a
license to log non-native timber on the 12,000 acre Waiakea Timber management area
just south of Hilo, but more timber had been needed to operate a proposed veneer mill on
a continuing, sustainable basis. Recently Tradewinds announced that it had acquired
lease rights to 6,100 additional acres near Pahala in the Kau District, about 50 miles south
of Hilo. The acreage is comprised of two parts: 3,700 acres for timber, and 2,400 acres
of native forest that will remain in conservation.51 With suitable timber acreage now
secured, Tradewinds is planning to open a veneer mill that is expected to produce 84
million square feet of veneer and 2 to 3.6 MW of biomass energy utilizing mill residues.
51 Thompson, Rod. August 8, 2007. New mill secures sufficient source of wood. Honolulu Star Bulletin, Vol. 12, Issue 220

The Potential for Biofuels Production in Hawai’i 4.0 Biomass Residue Availability
4-35
Table 4-16. Summary of Timber and Bioenergy Resource Estimates Based on a 15 Year Harvest Schedule.
Harvestable Area (acres)
Annual Volume
(103 ft3)
Annual Sawmill Residues
(tons)
Annual Pulpwood
(tons)
Annual Sawdust & Bark (tons)
Annual Biomass Resource Estimate
(tons) Tradewinds 7,800 2,600 30,000 40,000 9,000 79,000 Hawai’i Island Hardwoods*
2,000 420 5,000 6,000 1,000 12,000
Other (Big Island)**
1,500 310 4,000 5,000 1,000 10,000
Other (Kaua`i)**
1,600 340 4,000 5,000 1,000 10,000
Total 12,900 3,670 43,000 56,000 12,000 111,000
Notes: * Based on Y2010 expectations, given similar acreage requirements and residue production as the
Tradewinds operation. ** Based on Hawai’i Forest Stewardship Program participation. These figures include acreage under
active management for the forest industry. As many as 40,000 additional acres may be available from private commercial forests and the Hamakua coast timber area on the Big Island.
Hawai’i Island Hardwoods LLC is also planning a new mill on the Big Island that
is being planned for a capacity of 2 million board feet of lumber per year in year one and
it is anticipated that production will increase to over 5 million board feet by year three.52
On Kaua`i, Green Energy Hawai’i has partnered with Hawai’ian Mahogany to
provide woodchips and other biomass for a planned 7.1 megawatt wood gasification
power plant. Hawai’ian Mahogany presently leases approximately 3,600 acres and has
planted more than one million trees. They also plan to grow trees on about 1,000 acres of
state land in Kaua`i. The bulk of their plantings use two particular species of Eucalyptus,
which provide high-grade quality, cabinet grade wood. The Eucalyptus is inter-mixed
with another tree, Albizia, which provides nitrogen and other nutrients. The Albizia trees
will be harvested as a woody energy crop to provide fuel for the Green Energy Hawai’i
gasifier. By using Albizia, Hawai’ian Mahogany has dramatically cut the need for
commercial fertilizers by 95 percent, which is both economically and environmentally
advantageous. However there have been some emerging concerns expressed that Albizia
is a non-native/invasive species. The Division of Forestry and Wildlife, in the Hawai’i
Department of Land and Natural Resources, has asked Green Energy Hawai‘i to provide
a 10-year plan showing a phasing from Albizia to a less invasive species on state lands.
52 Lucas, Carolyn. January 16, 2008. Wood You Believe? West Hawaii Today.

The Potential for Biofuels Production in Hawai’i 4.0 Biomass Residue Availability
4-36
Green Energy Hawai’i is developing plans to grow a non-invasive species as a
replacement for Albizia for the tree plantations gown on state lands.53 Green Energy
Hawai’i is working to finalize permits for its biomass-to-energy plant.54
4.5 Biomass Residue Resource Summary and Conclusions An assessment of the biofuel feedstock from residual sources was performed.
Urban, agricultural, livestock, and forest industry waste was considered. The urban waste
was divided by county. Agricultural waste included residues from the sugar, pineapple
and macadamia nut industries. Only domesticated livestock manure housed in relatively
high density was included in the livestock waste estimates.
Table 4-17 summarizes the biomass residues available in Hawai’i, along with an
estimation of the current utilization. Unutilized residues could be used for biofuel
production. Currently utilized residues could be diverted to higher value products, which
might include liquid biofuels production. The future availability of these resources will
depend on local, national, and international markets, policy, and regulations.
53 Paik, Shelly. April 4, 2006. Green Energy Hawaii Selected for Biomass-To-Energy Facility Project. Kaua`i Island Utility Cooperative. 54 Eagle, Nathan. January 15, 2008. Kaua`i lawmakers set session goals. The Garden Island.

The Potential for Biofuels Production in Hawai’i 4.0 Biomass Residue Availability
4-37
Table 4-17. Summary of Biomass Residues and Biomass Residue Utilization in the State of Hawai’i Broken Down by County.
Tons/yr Hawai’i Maui Kaua`i Honolulu Solid Waste As-received 300,000
(80,000)a
350,000
(80,000) a
120,000
(30,000) a
1,600,000
(500,000) a
Sewage Sludge
Dry 200 3,400
(3,400) a
200 16,600
(900) a
Fat, Oil, Grease
Dry 1,900 1,900
(1,900) a
1,000 10,000
(1,900) a
Bagasse Fiber Dry 220,000
(220,000) a
50,000
(50,000) a
Cane Trash Dry 110,000 30,000
Molasses As-received 60,000 10,000
Pineapple Processing Waste
Dry 4,500
(4,500) a
0
Macadamia Nut Shells
Dry 17,000
(17,000) a
Dairy Manure Dry 0 0
Poultry Dry 5,000
Swine Manure Dry 90 370 200 1,020
Forest Industry Dry 101,000 10,000
Gross Total 420,190 750,170 221,400 1,632,620
Landfill Gas Ft3/day 300,000 700,000 576,000
Notes: a Amount currently used.
4.6 Biofuel Production Potential Biofuel production potential can be evaluated based on the identified biomass
resources. The following sections look at potential for ethanol, biodiesel and hydrogen
derived from biomass.
4.6.1 Ethanol
Table 4-21 shows the amount of ethanol that can be produced in Hawai’i using
the biomass residue resource estimates presented in above. The ethanol potentials
expressed for enzymatic hydrolysis and thermochemical processes are mutually
exclusive, as both are derived from the same total statewide available feedstock.
Note that total gasoline consumption in Hawai’i was about 475 million gallons
per year (MGY) in 2007. If ethanol is used as a 10 percent blend in all gasoline sold in

The Potential for Biofuels Production in Hawai’i 4.0 Biomass Residue Availability
4-38
the state, the total demand for ethanol in Hawai’i would be about 72 MGY (adjusting for
equivalent gallons of gasoline). Replacing 15 percent of the State’s gasoline demand (the
State’s goal for 2015) corresponds to 107 MGY of ethanol (with the simplifying
assumption that demand stays the same as current levels with advances in vehicle fuel
efficiencies). Replacing 20 percent of the State’s gasoline consumption would require
143 MGY of ethanol (corresponding to the State’s renewable fuel goal for the year 2020).
Achieving the replacement of 15 to 20 percent of gasoline consumption in Hawaii with
ethanol would be facilitated if a portion of the vehicle fleet includes flexible fuel vehicles
that can use gasoline/ethanol blends with up to 85 percent ethanol (D85).
Table 4-18. Total Hawai’i Ethanol Potential from Available Residues.
Ethanol Type Feedstock Total Hawai’i Potential (million gal/yr)
Conventional Ethanol Molasses 4.8 – 5.0
Enzymatic Hydrolysis Cellulosic wastes* 66 – 99*
Thermochemical (self-sufficient) Cellulosic wastes* 88 – 100*
Thermochemical (maximum alcohol) Cellulosic wastes* 120 – 140*
Notes: * Resources include bagasse, sugar cane trash, macadamia nut shells, pineapple waste, and urban
cellulosic waste. These numbers include resources that would be diverted from the H-POWER generation facility.
4.6.2 Biodiesel
Table 4-19 shows the amount of biodiesel that can be produced in Hawai’i. For
Fischer-Tropsch diesel, the potential feedstock is the same as that for cellulosic ethanol.
As such, the potential listed for Fischer-Tropsch diesel is not additive with the potentials
listed in Table 4-18 for cellulosic ethanol.

The Potential for Biofuels Production in Hawai’i 4.0 Biomass Residue Availability
4-39
Table 4-19. Total Hawai’i Biodiesel Potential.
Conversion Pathway Feedstock Total Hawai’i Potential
(million gallons per year) Transesterification Waste oil 2.0 – 2.5 *
Fischer-Tropsch Diesel Cellulosic wastes** 83.0 – 98.0 **
Notes: * From Hawai’i Biofuels Summit Briefing Book. Based in part on: Turn, Scott. Biomass and
Bioenergy Resource Assessment. State of Hawai`i, Hawai’i Natural Energy Institute. December 2002, as well as Solid Waste Division, County of Hawai`i. Study Relating to Used Cooking Oil Generation and Biodiesel Production Incentives in the County of Hawai`i. December 2004, and 2002 U.S. Census Economic Census: Accommodation and Foodservices: Hawai`i.
** Resources include bagasse, sugar cane trash, macadamia nut shells, pineapple waste, and urban cellulosic waste. These numbers include resources that would be diverted from the H-POWER generation facility.
4.6.3 Biomass Derived Hydrogen
Table 4-20 shows the amount of hydrogen that can be produced in Hawai’i using
the identified residue resources. Both landfill gas and anaerobic digestion gas feedstocks
are limited in Hawai’i.
Table 4-20. Total Hawai’i Hydrogen Potential.
Residue Resource Feedstock Total Hawai’i Potential Methane Reformation Landfill Gas 950 million scf/yr
Biomass Gasification Cellulosic wastes 15 billion scf/yr*
Microorganisms Cellulosic wastes Unknown
Notes: * Assumes an average feedstock moisture content of 50%.
4.7 Potential Future Markets for Biomass Residues Of all forms of biofuel feedstocks, biomass residues offer the best immediate
opportunity for local feedstock supply, in addition to the social benefits such as waste
reduction (which is a major challenge on every island in the state). Biomass residues are
especially competitive when costs of production are partially defrayed due to production
activities associated with the processing of another product, e.g. sugar or macadamia
nuts. The potential future markets for each category of biomass residues are addressed
below.
Urban green waste flows have drastically grown amongst composting operations
throughout the state; however, these are likely to be leveling off. Both Honolulu and
Kaua`i already have laws prohibiting green waste at their landfill and waste-to-energy

The Potential for Biofuels Production in Hawai’i 4.0 Biomass Residue Availability
4-40
facilities. Even if the counties are successful in diverting more green waste from landfill
disposal, the waste composition studies show that the current landfill streams generally
contain less than 10 percent green waste. Urban waste is expected to grow proportionally
with Hawai’i de facto population at a rate of about 1.0 percent per year.
The cane sugar production for Hawai’i is up slightly at 1.78 million tons, which is
6 percent increase from the 1.68 million tons in 2006.55 A decade ago, Hawai’i was
regularly producing only 300,000 tons per year.56 Increased mechanization, increased
demand for sugar sales to the US mainland and renewable portfolio standard compliance
are some of the leading causes for expansion of the industry. Since 1992, ten out of 12
mills have closed with the most recent closing in 2000.57 Some of the currently operating
mills also have been losing money in recent years, but with demand for local ethanol
production on the rise, growth of the industry is expected in coming years. Production in
calendar year 2008 is forecast to increase modestly, ending a decade of rapid contraction
of the industry. Gay & Robinson last year unveiled a multi-faceted: “energy plantation”
and Green Energy Hawai’i is working to secure permits for its proposed biomass-to-
energy plant. Neither company has started construction.58 At the same time, however, the
pineapple industry is slumping as pineapples are being grown and shipped cheaply to the
United States from Thailand, the Philippines, Brazil, China, India, and Costa Rica. Del
Monte Fresh Produce has announced that in 2008, it will cease its pineapple production
in Hawai’i leaving only Maui Land and Pineapple and Dole to the industry. Macadamia
nut production has increased in recent years as more pineapple fields become available.59
The Hawai’i livestock and poultry industries, which include primarily small to
medium size business enterprises, are also declining. For many cattle producers, the main
source of income from cow-calf operations and the sale of weaned calves, grass finished
steers and heifers, and spent cows and bulls.60 During 2007, the total Hawai’i inventory
of cattle and calves declined by 2 percent from 2006 levels. The development and
increasing market demand for premium priced, locally grown, finished and branded
“organic” and “natural” beef on the Big Island has kept the total cattle marketing for
2006 at 61,000 head, up 13 percent from 2005 and the highest total in six years. The dairy
industry, however, totaled 3,800 head on January 1, 2007, a 17 percent or 800-head
55 Anon. December 5, 2007. Isle sugar cane production growing. Business Briefs, The Honolulu Advertiser. 56 Anon. 1997. The North American Sugar Market: Recent Trends and Prospects Beyond 2000. Proceedings of the Fiji/FAO 1997 Asia Pacific Conference. 57 Ruel, Tim. September 15, 2000. Amfac to quit farming on Kauai. Honolulu Star Bulletin. 58 Eagle, Nathan. January 15, 2008. Kaua`i lawmakers set session goals. The Garden Island. 59 Niesse, Mark. April 24, 2006. New crop flourishing in place of pineapple. Honolulu Star Bulletin, Vol. 11, Issue 114. 60 Anon. October 10, 2001. Five-Year Plan. Hawai`i State Department of Agriculture, Animal Industry Division, Livestock Disease Control & Veterinary Laboratory Branch.

The Potential for Biofuels Production in Hawai’i 4.0 Biomass Residue Availability
4-41
decrease from a year earlier. At the end of 2006, Hawai’i had five commercial dairies,61
but by early 2008 this number had dwindled down to two. The decline in Hawaii’s dairy
sector is the result of rising feed, shipping and land costs, environmental regulations, and
stagnant sales.62
During 2007, the hog inventory also declined by 15,000 head (-6 percent) from
2006. The inventory of hogs has been declining for several years and is down 35 percent
from 200363.
Hawai’i egg producers are in direct competition with US mainland producers for
Hawai’i markets. Egg production presents challenges anywhere, but Hawai’i companies
face added obstacles such as rising fuel prices, further boosting shipping costs of feed and
equipment. Higher costs for land, water, electricity, and labor have left only six
commercial egg producers statewide (four on O`ahu, one on the Big Island, and a smaller
operation on Maui). Medeiros farm on Kaua`i is the only farm in the state selling
“broilers,” all of which are consumed on Kaua`i. Pacific Poultry shut down the slaughter
side of operations late in 2004, so there no longer is a broiler chicken industry on
O`ahu.64
Forestry in Hawai’i is primarily about protecting the island watersheds, providing
habitat for rare and endangered species, and providing recreation for local people and
visitors. A small but important local forest industry is based on the harvest of native
woods such as koa and ohi`a, traditional Hawai’ian woods such as kamani and milo, and
exotic woods such as Eucalyptus and mango. These locally harvested timbers are
currently made into high-quality bowls, furniture, picture frames, and flooring. Small
forestry operations (<100 acres) that specialize in Hawai’ian hardwoods have been
encouraged by the State for many years with the hope of demonstrating Hawaii’s
viability to the larger lumber and veneer industry. With the expected opening of two new
medium sized saw mills on the Big Island, 2008 looks like a promising year for further
forest industry development.
61 Anon. February 22, 2007. Hawai`i Cattle January 1. National Agricultural Statistics Service, United State Department of Agriculture in cooperation with the Hawai`i Department of Agriculture. 62 Hao, Sean and Dan Nakaso. January 30, 2008. Last dairy closing in O`ahu; milk a concern. USA Today. 63 Anon. January 31, 2008. Hog inventory falls again, to 15,000. Business Briefs, Honolulu Advertiser. 64 Watanabe, June. December 4, 2005. Pork and poultry fall to isle market reality. Star Bulletin, Vol. 10, Issue 338.

The Potential for Biofuels Production in Hawai’i 4.0 Biomass Residue Availability
4-42
Table 4-21. Summary of Biomass Residue Future Market Supply.
Future residue supply
Urban Waste Up
Agricultural Residue Up
Livestock Manure Down
Forest Industry Residue Up
Sustained high world oil prices and the passage of the EPACT 2005 have
encouraged the collection and use of low-density residues from the urban, agricultural,
livestock, and forest industries; however, both the continued growth of the biofuels
industry and the long-term market potential for biofuels depends on larger quantities of
biomass feedstocks being produced. For each of the major biofuels (sugar-based ethanol,
cellulosic ethanol, and biodiesel) resolution of technical, economic, and regulatory issues
remain critical to further development of biofuels feedstocks in Hawai’i.
4.8 Conclusion There are significant opportunities for increased biofuel production from wastes
in Hawai’i. Table 4-22 shows the potential for ethanol, biodiesel, and hydrogen
production using Hawai’ian waste resources.
Table 4-22. Total Hawai’i Biofuel Potential from Waste.
Fuel Feedstock Total Hawai’i Potential Ethanol Cellulosic wastes 90 million gallons/yr*
Ethanol Molasses 5 million gallons/yr
Biodiesel Waste oil 2.0 – 2.5 million gallons/yr
Hydrogen Landfill gas 950 million scf/yr
Notes: * Represents a middle number common to both thermochemical and biochemical potentials.
The Potential for Biofuels Production in Hawai’i 5.0 Energy Crop Potential
5-1
5.0 Energy Crop Potential
The objective of this section is to estimate the feedstock production potential for
energy crops grown agricultural land in Hawai’i. Two different classes of land are
examined. First production potential from rainfed non-prime agricultural land is
investigated. Second production potential on irrigated prime land is explored. The
section has the following topics are addressed in this section:
Crop Land in Hawai’i—A description of the soils and climate in Hawai’i and
criteria for selecting potential biofuel crop land.
Estimating Crop Yield—The use of analogous environments to estimate
yield of the candidate crops on the selected lands.
Production of Biofuel Crops—Production of feedstock and a comparison of
fuel production and fuel consumption in Hawai’i.
Recommendations—Recommendations to increase production of fiber and
oil feedstock.
5.1 Crop Land in Hawai’i The Natural Resource Conservation Service (NRCS) has classified all soils in
Hawai’i and is an essential source of information for crop production (SCS, 1972; SCS,
1973). In its classification scheme, the NRCS uses factors such as soil temperature, soil
moisture, rockiness, land forms, and slope of the land to distinguish one type of soil from
another. The NRCS classifications have been used in this analysis.
There are four classes of soil temperature found in the tropics. The term isofrigid
describes soil that has a mean annual temperature of less than 46° F measured at 20 inch
depth. Isomesic means soil that has an average temperature between 46° F and 59° F.
Isothermic refers to soil with an average temperature between 59° F and 72° F.
Isohyperthermic describes soil that has an average temperature greater than 72° F. From
this point forward, the terms isomesic, isothermic, and isohyperthermic will be replaced
with cold, cool, and warm, respectively. Isofrigid soils are inappropriate for energy crop
use and are excluded from this analysis.
Soil moisture descriptions are based on the number of months that it can supply
water to plants. The supply of water is dependent on the amount of rain and the ability of
the soil to store water. The term aridic is applied to soils that can supply plant water
needs for less than half a year. Ustic describes soils that supply water to plants for 6 to 9
months of the year. Soils that supply water to plants for more than 9 months are called
udic. When soils have more water than can be evaporated or are saturated, they are

The Potential for Biofuels Production in Hawai’i 5.0 Energy Crop Potential
5-2
called perudic and aquic, respectively. The terms aridic, ustic, udic, perudic, and aquic
will be replaced with the common words dry, moist, wet, very wet, and saturated in this
analysis.
Certain soil types were excluded from this analysis because of their
inappropriateness for growing crops. Areas that have excessive stones, shallow soil,
and/or rock outcrops are poor for crop production. Slope of the land is an important
factor for tractor operation and runoff. Most crop lands have slopes less than 20 percent
while pasture has less than 35 percent slope.
In summary, the non-irrigated land in Hawai’i considered for biofuel production
is based on the following criteria:
Land is zoned for agriculture.
Land is not designated as prime or unique within the land zoned
agriculture.
Rough broken, very stony, and rocky lands are excluded.
Lava land is excluded.
Land slope is less than 20 percent.
Based on these characteristics, approximately 814,501 acres of total land is
suitable for biofuel crop production on the islands of Hawai’i, Maui, Molokai, Kauai,
Oahu, and Lanai.
Maps that show the distribution of these potential biofuel crop lands were
prepared from spatial data obtained from the Hawai’i Statewide Geographic Information
System (GIS) Program (Office of Planning, 2008). The maps were characterized to show
the soil temperature and moisture classes for each island (Figures 5-2 through 5-13). In
general, low lying lands are classified as warm and the class changes to cool and cold
when moving upslope. Soil moisture is higher along the windward (northeast) side of the
islands and drier on the leeward (southwest) side. Exceptions to this pattern are caused
by pockets of sandy soil that appear as drier soil in the middle of wet areas, or poorly
drained soil, which appears as pockets of wet in dry areas.
Most of the land is classified as moist or wet and is capable of supporting plant
growth, about 683,000 acres. These moist and wet lands run across temperature classes
that range from warm to cold. The Big Island of Hawai’i has 653,000 acres of the
potential biofuel crop land, 80 percent of the total available. Maui has the next largest
portion with 90,000 acres, or 11 percent. The remaining 9 percent is distributed among
Molokai, Kauai, Oahu, and Lanai. A summary breakdown by land type and island can be
seen in Figure 5-1.
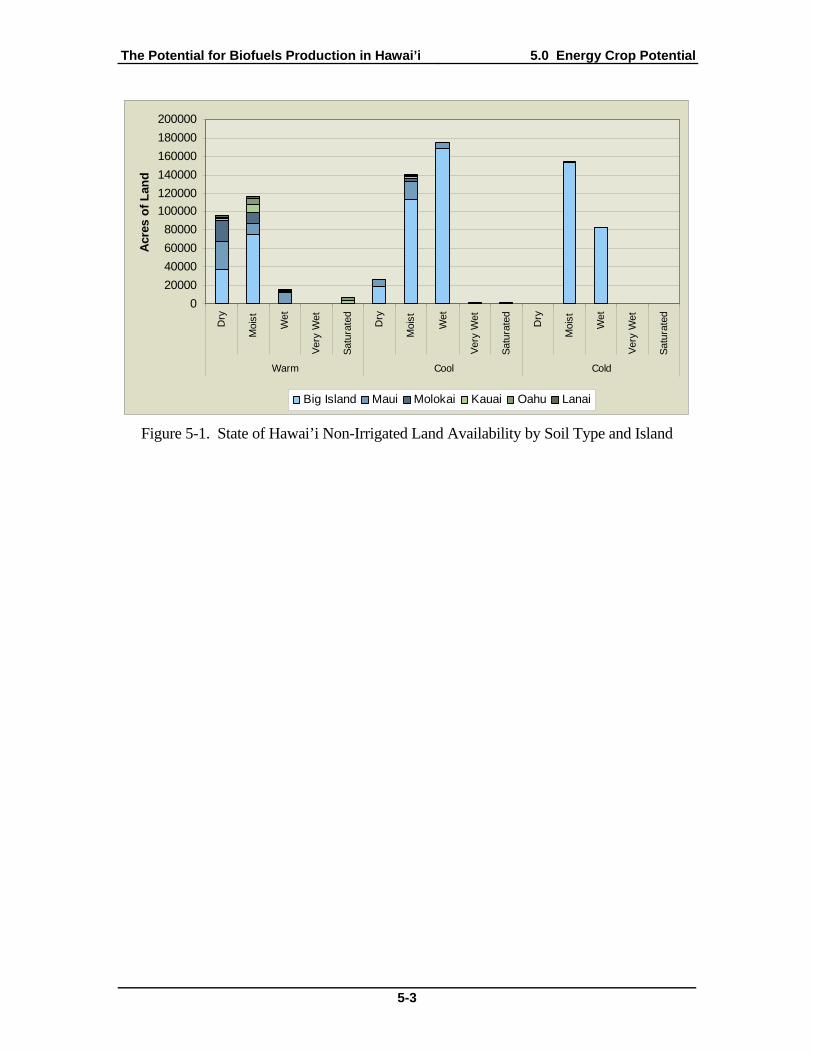
The Potential for Biofuels Production in Hawai’i 5.0 Energy Crop Potential
5-3
0
20000
40000
60000
80000
100000
120000
140000
160000
180000
200000
Dry
Moi
st
Wet
Ver
y W
et
Sat
urat
ed Dry
Moi
st
Wet
Ver
y W
et
Sat
urat
ed Dry
Moi
st
Wet
Ver
y W
et
Sat
urat
ed
Warm Cool Cold
Acr
es o
f L
and
Big Island Maui Molokai Kauai Oahu Lanai
Figure 5-1. State of Hawai’i Non-Irrigated Land Availability by Soil Type and Island
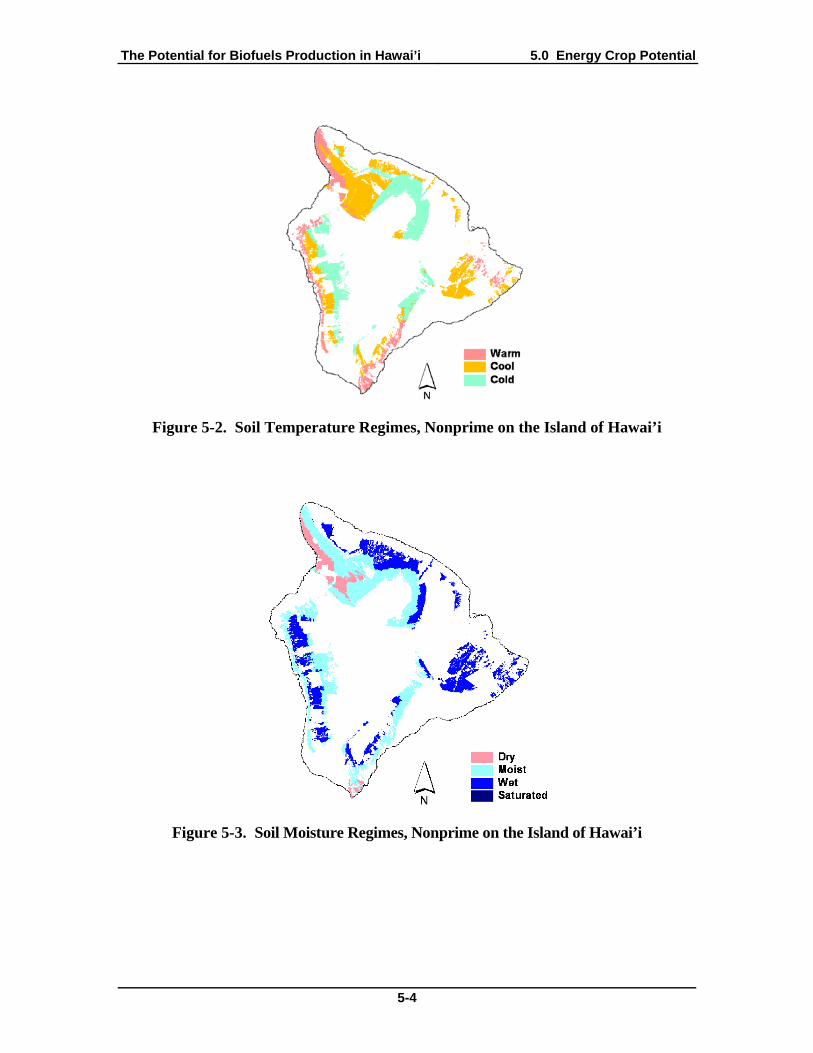
The Potential for Biofuels Production in Hawai’i 5.0 Energy Crop Potential
5-4
Figure 5-2. Soil Temperature Regimes, Nonprime on the Island of Hawai’i
Figure 5-3. Soil Moisture Regimes, Nonprime on the Island of Hawai’i
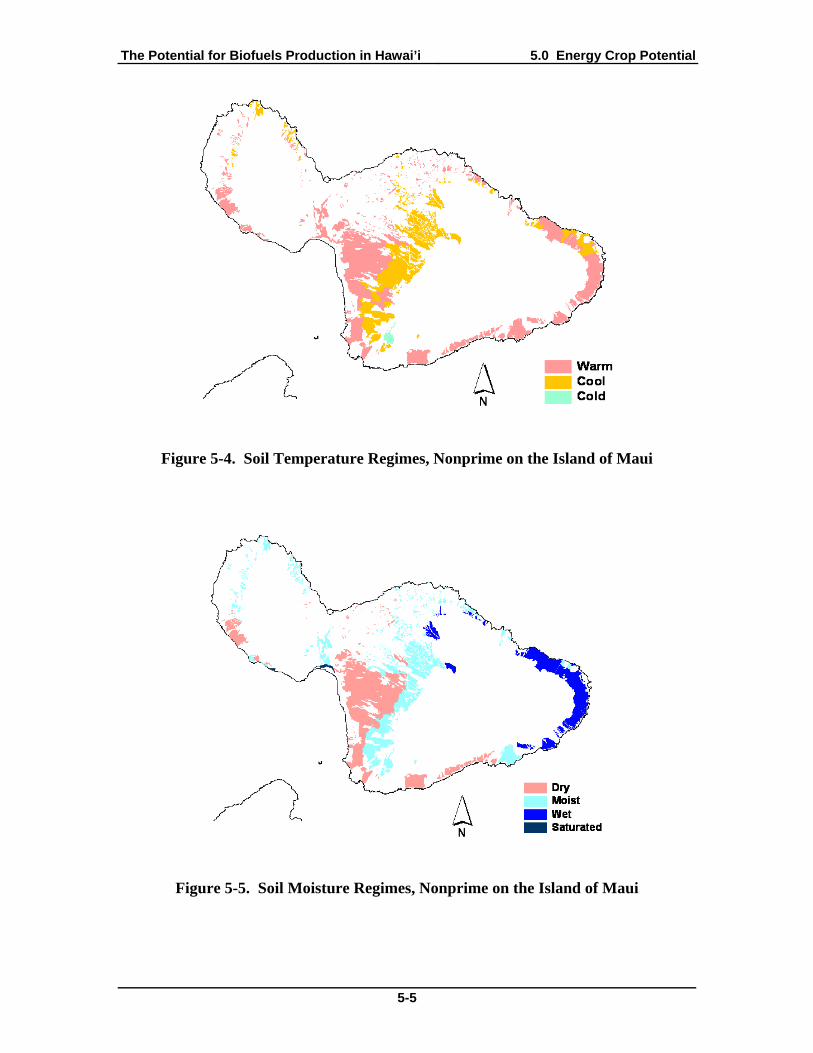
The Potential for Biofuels Production in Hawai’i 5.0 Energy Crop Potential
5-5
Figure 5-4. Soil Temperature Regimes, Nonprime on the Island of Maui
Figure 5-5. Soil Moisture Regimes, Nonprime on the Island of Maui
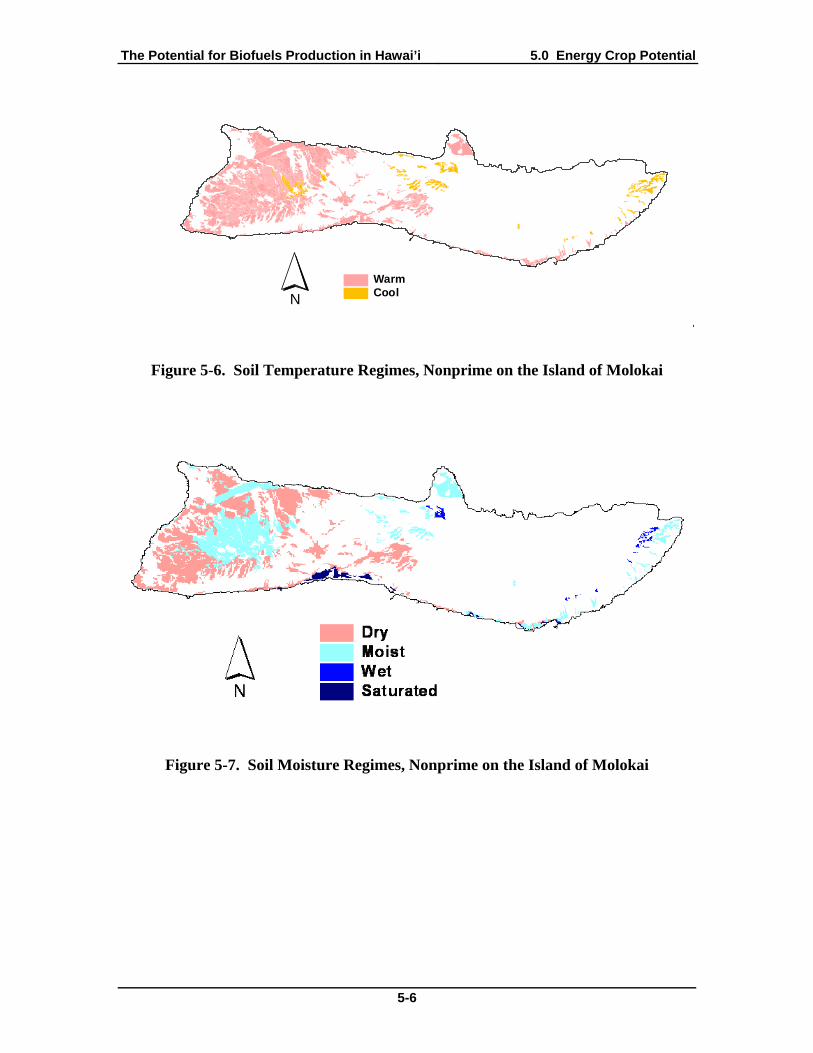
The Potential for Biofuels Production in Hawai’i 5.0 Energy Crop Potential
5-6
N
WarmCool
Figure 5-6. Soil Temperature Regimes, Nonprime on the Island of Molokai
Figure 5-7. Soil Moisture Regimes, Nonprime on the Island of Molokai

The Potential for Biofuels Production in Hawai’i 5.0 Energy Crop Potential
5-7
N WarmCool
Figure 5-8. Soil Temperature Regimes, Nonprime on the Island of Kauai
Figure 5-9. Soil Moisture Regimes, Nonprime on the Island of Kauai
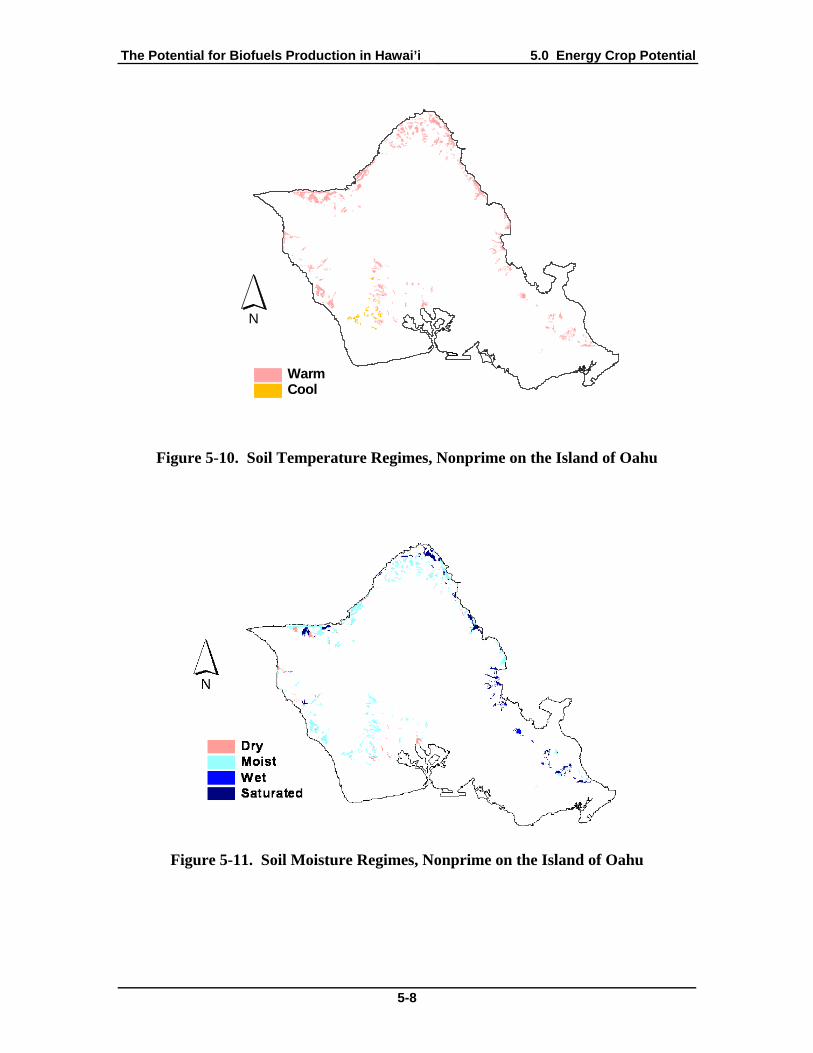
The Potential for Biofuels Production in Hawai’i 5.0 Energy Crop Potential
5-8
N
WarmCool
Figure 5-10. Soil Temperature Regimes, Nonprime on the Island of Oahu
Figure 5-11. Soil Moisture Regimes, Nonprime on the Island of Oahu

The Potential for Biofuels Production in Hawai’i 5.0 Energy Crop Potential
5-9
N
WarmCool
Figure 5-12. Soil Temperature Regimes, Nonprime on the Island of Lanai
Figure 5-13. Soil Moisture Regimes, Nonprime on the Island of Lanai

The Potential for Biofuels Production in Hawai’i 5.0 Energy Crop Potential
5-10
Table 5-1. Soil Temperature and Moisture Regimes, Nonprime Agricultural Land
Temp Moisture Nonprime Agricultural Land Area (acres)
Hawai’i Maui Molokai Kauai Oahu Lanai Total
Warm
Dry 37,071 30,649 22,347 2,470 915 3,020 93,452Moist 74,973 12,797 11,611 7,932 7,298 1,585 114,611Wet 0 12,093 0 2,074 467 1,181 14,634
Very wet Saturated 0 472 997 2,230 2,947 0 6,646
subtotal: 112,044 56,011 34,955 14,706 11,627 5,786 229,343
Cool
Dry 19,216 8,350 0 0 0 0 27,566
Moist 113,162 19,819 2,897 3,067 692 789 139,637
Wet 169,318 5,305 640 30 0 0 175,293
Very wet 0 0 0 2,023 0 0 2,023
Saturated 1,502 49 0 642 0 0 2,193
subtotal: 303,198 33,523 3,537 5,762 692 789 346,712
Cold
Dry
Moist 153,816 852 0 0 0 0 154,668
Wet 83,778 0 0 0 0 0 83,778
Very wet
Saturated
subtotal: 237,594 852 0 0 0 0 238,446
Total 652,836 90,386 38,492 20,468 12,319 6,575 814,501
Note: Shaded cells are regimes that do not exist on the nonprime agricultural lands.
Irrigation does not seem feasible for the majority of these lands, since the
distances between the irrigation ditches and the evaluated crop land suggests that
irrigation is not readily available (Figure 5-14). The topography of the islands will
further create issues in developing new irrigation to these lands. Biofuel crop production
will therefore likely rely on rainfall.

The Potential for Biofuels Production in Hawai’i 5.0 Energy Crop Potential
5-11
NIrrigation ditch
Figure 5-14. Location of Irrigation Ditches and Nonprime Agricultural Lands
(The lands that may be used for biofuel crop production are shaded black and irrigation ditches are blue lines.)

The Potential for Biofuels Production in Hawai’i 5.0 Energy Crop Potential
5-12
5.1.1 Estimating Biofuel Crop Yield
The crops considered for biofuel production represent sugar, fiber, and oil
feedstocks. Sugarcane (Saccharum officinarum) produces sugar feedstock. Banagrass
(Pennisetum purpureum), miscanthus (Miscanthus x giganteus), Eucalyptus (Eucalyptus
spp.), and Leucaena (Leucaena leucocephala) produce fiber feedstock. Oil Palm (Elaeis
guineensis) and Jatropha (Jatropha curcas) produce oil.
To estimate the yield of these crops, published reports were obtained. As much as
possible, data generated from Hawai’i was collected. The location where the data was
produced was classified according to the temperature and moisture regimes defined by
NRCS. The yield data were matched to the analogous environment in Hawai’i.
Sugarcane is an irrigated crop in Hawai’i. However, since irrigation may not be
available for certain types of lands, it was assumed in this section that sugarcane
depended on rainfall for its water requirement. Rainfed sugarcane yield is not readily
available, making it necessary to obtain yield data overseas. The sugarcane yield data
reported are based on 1 year cane and not the 2 year cane normally produced in Hawai’i.
The following sources of data were used to estimate yields for the crops:
Sugarcane: FAO, 2003; Government of Fiji and FAO, 1997
Banagrass: Vincente-Chandler et al., 1962; Vincente-Chandler et al., 1959;
Watkins and Lewy-Van Severin, 1951; Paterson, 1935; Wilsie et al., 1940;
Paterson, 1933.
Eucalyptus: Kinoshita and Zhou, 1999; Austin et al., 1997; Stape et al., 2004;
Whitesell et al., 1992; DeBell et al., 1997; Skolmen, 1986; Binkley and Ryan,
1998.
Leucaena: Glover, 1988; Kinoshita and Zhou, 1999; Sun, 1996; Shi, 2003;
Austin et al., 1997.
Oil Palm: Papademetriou and Dent, 2001; Hai, 2000; Udom, 2002;
Kallarackal et al., 2004; Oil World Annual 2004.
Jatropha: Heller, 1996; Foidl et al., 1996; Benge; Ishii and Takeuchi, 1987;
Wiesenhutter, 2003.
Miscanthus is currently being cultivated in Europe for use as an energy crop.
Miscanthus has also been investigated by institutions in the U.S. such as the University of
Illinois. However, no data generated from the tropics were found. Therefore, miscanthus
will be excluded from further analysis because of the uncertainty of the applicability of

The Potential for Biofuels Production in Hawai’i 5.0 Energy Crop Potential
5-13
yield data from temperate climates to the tropics. Yields for the other biofuel crops are
summarized in Table 5-2. Results of interest from the studies include the following:
Sugarcane yields more biomass than Banagrass. However, when considering
the range of yields, Banagrass may have a greater yield potential than
sugarcane. A side-by-side test under rainfed conditions would be needed to
resolve this issue.
Eucalyptus and Leucaena yield well under different conditions. In the warm-
moist environment, Leucaena produces more biomass than Eucalyptus.
However, Eucalyptus will yield more in a wetter or cooler environment.
Oil Palm produces nearly 400 gallons of oil/acre/year in a warm-wet
environment. But, the yield drops significantly in drier conditions. Jatropha
does not produce as much oil, but the range in yields seems to indicate that
Jatropha has the potential to yield well in the moist regime. The large range
in yields also indicates that care must be taken when growing Jatropha.
In general, sugarcane, the oil crops, and Leucaena yield well only in the warm
environments. In contrast, fiber yields from Banagrass and Eucalyptus are
relatively high even in colder environments. However, because of incomplete
data, an accurate description of how well these crops yield in all temperature
and moisture classes is not defined.
Table 5-3 through Table 5-6 show the yield of each major non-irrigated crop by
island and by soil type. Sugarcane cane and Leucaena dry matter production is estimated
to be 3.2 and 1.2 million tons/year, respectively. Oil Palm and Jatropha oil production is
estimated to be 32.4 and 16.1 million gallons/year in the same regions. Banagrass and
Eucalyptus produce more fiber because their production ranges into the cooler regions,
about 3.70 and 3.63 million tons/year.

The Potential for Biofuels Production in Hawai’i 5.0 Energy Crop Potential
5-14
Table 5-2. Rainfed Dry Matter and Oil Yield of Crops
Temp Moisture
Sugarcane (ton/acre/
year)
Banagrass (ton/acre/
year)
Eucalyptus (ton/acre/
year)
Leucaena (ton/acre/
year)
Oil Palm (gallons/
acre/year)
Jatropha (gallons/
acre/year)
Warm Dry
Moist 23.8 (19.4-28.3)
21.5 (8.7-38.0)
7.8 (6.7-10.7)
8.8 (1.2-19.3)
226 (119-298)
114 (29-381)
Wet 28.6 (24.1-34.0)
26.8 (15.2-38.3)
11.0 (9.0-13.0)
8.0 (5.4-10.5)
390 (262-500)
180 (48-286)
Very wet
Saturated 14.1 (6.4-21.8)
Cool Dry
Moist
Wet 9.9 (7.5-12.0)
Very wet
Saturated
Cold Dry
Moist
Wet 8.2 ()
9.7 (9.1-10.2)
2 (0.0-6.6)
Very wet
Saturated
Note: Values are averages and values in parentheses are ranges of the yield observed in analogous environments in Hawai’i or other locations. Blank cells have no data reported for regimes. Shaded cells are regimes that do not apply to the partitioned lands in Hawai’i that may produce biofuel feedstock crops.
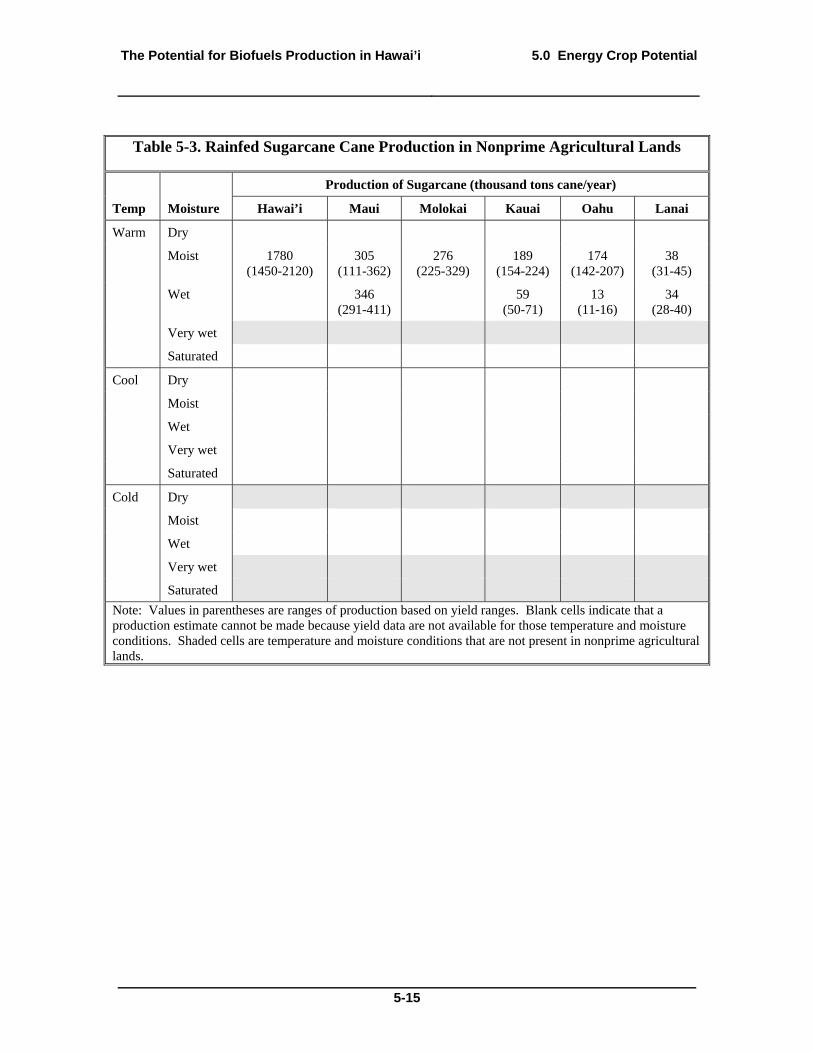
The Potential for Biofuels Production in Hawai’i 5.0 Energy Crop Potential
5-15
Table 5-3. Rainfed Sugarcane Cane Production in Nonprime Agricultural Lands
Temp Moisture
Production of Sugarcane (thousand tons cane/year)
Hawai’i Maui Molokai Kauai Oahu Lanai
Warm Dry
Moist 1780 (1450-2120)
305 (111-362)
276 (225-329)
189 (154-224)
174 (142-207)
38 (31-45)
Wet 346 (291-411)
59 (50-71)
13 (11-16)
34 (28-40)
Very wet
Saturated
Cool Dry
Moist
Wet
Very wet
Saturated
Cold Dry
Moist
Wet
Very wet
Saturated
Note: Values in parentheses are ranges of production based on yield ranges. Blank cells indicate that a production estimate cannot be made because yield data are not available for those temperature and moisture conditions. Shaded cells are temperature and moisture conditions that are not present in nonprime agricultural lands.

The Potential for Biofuels Production in Hawai’i 5.0 Energy Crop Potential
5-16
Table 5-4. Rainfed Banagrass Production in Nonprime Agricultural Lands
Temp Moisture
Production of Banagrass (thousand tons dry matter/year)
Hawai’i Maui Molokai Kauai Oahu Lanai
Warm Dry
Moist 1,610 (652-2,850)
275 (111-486)
250 (101-441)
171 (69.0-301)
157 (63.5-277)
34.1 (13.8-60.2)
Wet 0 324 (184-463)
0 55.5 (31.5-79.4)
12.5 (7.10-17.9)
31.7 (18.0-45.2)
Very wet
Saturated 0 6.65 (3.02-10.2)
14.1 (6.38-21.7)
31.4 (14.3-45.2)
41.6 (18.9-64.2)
0
Cool Dry
Moist
Wet
Very wet
Saturated
Cold Dry
Moist
Wet 687 ()
0 0 0 0 0
Very wet
Saturated
Note: Values in parentheses are ranges of production based on yield ranges. Blank cells indicate that a production estimate cannot be made because yield data are not available for those soil temperature and moisture conditions. Shaded cells are temperature and moisture regimes that are not present in nonprime agricultural lands.
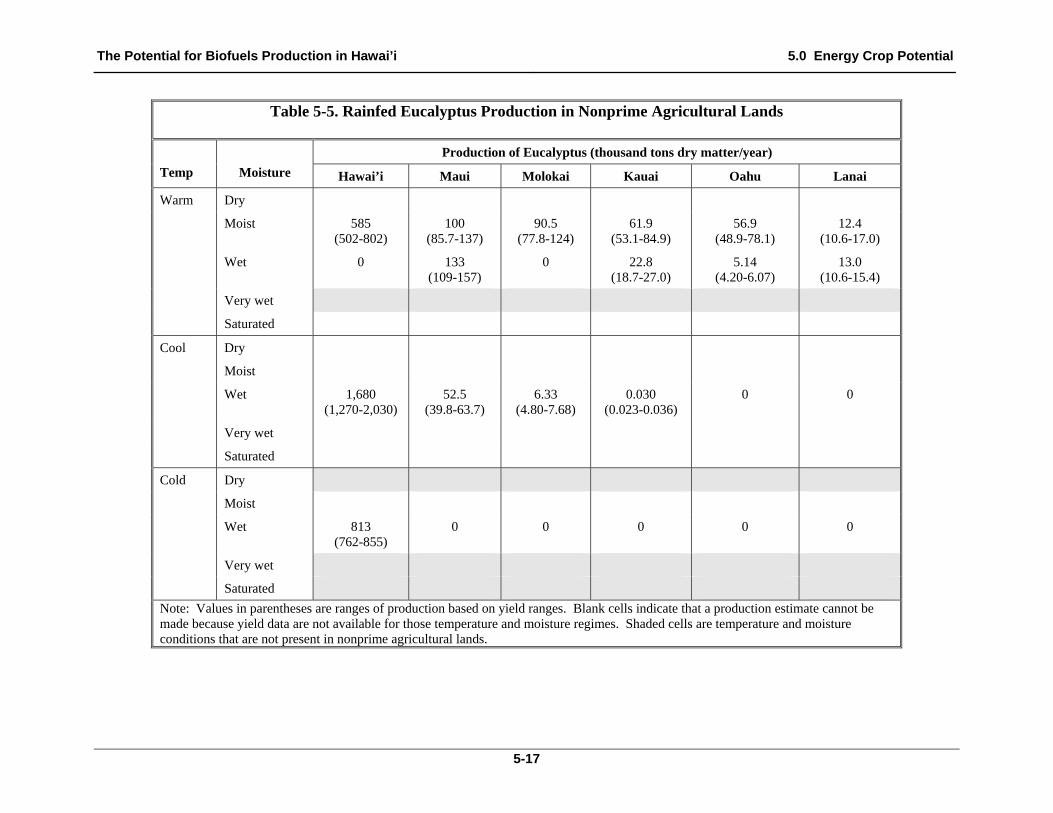
The Potential for Biofuels Production in Hawai’i 5.0 Energy Crop Potential
5-17
Table 5-5. Rainfed Eucalyptus Production in Nonprime Agricultural Lands
Temp Moisture
Production of Eucalyptus (thousand tons dry matter/year)
Hawai’i Maui Molokai Kauai Oahu Lanai
Warm Dry
Moist 585 (502-802)
100 (85.7-137)
90.5 (77.8-124)
61.9 (53.1-84.9)
56.9 (48.9-78.1)
12.4 (10.6-17.0)
Wet 0 133 (109-157)
0 22.8 (18.7-27.0)
5.14 (4.20-6.07)
13.0 (10.6-15.4)
Very wet
Saturated
Cool Dry
Moist
Wet 1,680 (1,270-2,030)
52.5 (39.8-63.7)
6.33 (4.80-7.68)
0.030 (0.023-0.036)
0 0
Very wet
Saturated
Cold Dry
Moist
Wet 813 (762-855)
0 0 0 0 0
Very wet
Saturated
Note: Values in parentheses are ranges of production based on yield ranges. Blank cells indicate that a production estimate cannot be made because yield data are not available for those temperature and moisture regimes. Shaded cells are temperature and moisture conditions that are not present in nonprime agricultural lands.

The Potential for Biofuels Production in Hawai’i 5.0 Energy Crop Potential
5-18
Table 5-6. Rainfed Leucaena Production in Nonprime Agricultural Lands
Temp Moisture
Production of Leucaena (thousand tons dry matter/year)
Hawai’i Maui Molokai Kauai Oahu Lanai
Warm Dry
Moist 660 (90.0-1,450)
113 (15.4-247)
102 (13.9-224)
69.8 (9.52-153)
64.2 (8.76-141)
13.9 (1.90-30.6)
Wet 0 96.7 (65.3-127)
92.7 (62.7-122)
16.6 (11.2-21.7)
3.74 (2.52-4.90)
9.45 (6.38-12.4)
Very wet
Saturated
Cool Dry
Moist
Wet
Very wet
Saturated
Cold Dry
Moist
Wet 168 (0.0-553)
0 0 0 0 0
Very wet
Saturated
Note: Values in parentheses are ranges of production based on yield ranges. Blank cells indicate that a production estimate cannot be made because yield data are not available for those temperature and moisture regimes. Shaded cells are temperature and moisture conditions that are not present in nonprime agricultural lands.

The Potential for Biofuels Production in Hawai’i 5.0 Energy Crop Potential
5-19
Table 5-7. Rainfed Oil Palm Oil Production in Nonprime Agricultural Lands
Temp Moisture
Oil Production from Oil Palm (million gallons/year)
Hawai’i Maui Molokai Kauai Oahu Lanai
Warm Dry
Moist 16.9 (8.92-22.3)
2.89 (1.52-3.81)
2.62 (1.38-3.46)
1.79 (0.944-2.36)
1.65 (0.868-2.17)
0.358 (0.046-0.472)
Wet 0 4.72 (3.17-6.05)
0 0.809 (0.543-1.04)
0.182 (0.122-0.234)
0.461 (0.309-0.591)
Very wet
Saturated
Cool Dry
Moist
Wet
Very wet
Saturated
Cold Dry
Moist
Wet
Very wet
Saturated
Note: Values in parentheses are ranges of production based on yield ranges. Blank cells indicate that a production estimate cannot be made because yield data are not available for those temperature and moisture regimes. Shaded cells are temperature and moisture conditions that are not present in nonprime agricultural lands.

The Potential for Biofuels Production in Hawai’i 5.0 Energy Crop Potential
5-20
Table 5-8. Rainfed Jatropha Oil Production in Nonprime Agricultural Lands
Temp Moisture
Oil Production from Jatropha (million gallons/year)
Hawai’i Maui Molokai Kauai Oahu Lanai
Warm Dry
Moist 8.55 (2.17-28.6)
1.46 (0.371-4.88)
1.32 (0.337-4.42)
0.904 (0.230-3.02)
0.832 (0.212-2.78)
0.181 (0.046-0.604)
Wet 0 2.18 (0.580-3.46)
0 0.373 (0.100-0.593)
0.084 (0.022-0.134)
0.213 (0.057-0.338)
Very wet
Saturated
Cool Dry
Moist
Wet
Very wet
Saturated
Cold Dry
Moist
Wet
Very wet
Saturated
Note: Values in parentheses are ranges of production based on yield ranges. Blank cells indicate that a production estimate cannot be made because yield data are not available for those temperature and moisture regimes. Shaded cells are temperature and moisture conditions that are not present in nonprime agricultural lands.

The Potential for Biofuels Production in Hawai’i 5.0 Energy Crop Potential
5-21
A summary of the total biomass potential for ethanol and biodiesel production by
crop type and island can be seen in Figure 5-15 and Figure 5-16. With most of the
available land on the Big Island, yields from the Big Island dominate both figures.
0
500
1000
1500
2000
2500
3000
3500
4000
Sugarcane Banagrass Eucalyptus Leucaena
Th
ou
san
d T
on
s P
er Y
ear
Big Island Maui Molokai Kauai Oahu Lanai
Figure 5-15. Biomass Potential by Crop Type and Island, Nonprime Ethanol.
0
5000
10000
15000
20000
25000
30000
35000
Palm Oil Jatropha
Th
ou
san
d G
allo
ns
Per
Yea
r
Big Island Maui Molokai Kauai Oahu Lanai
Figure 5-16. Biomass Potential by Crop Type and Island, Nonprime Biodiesel.
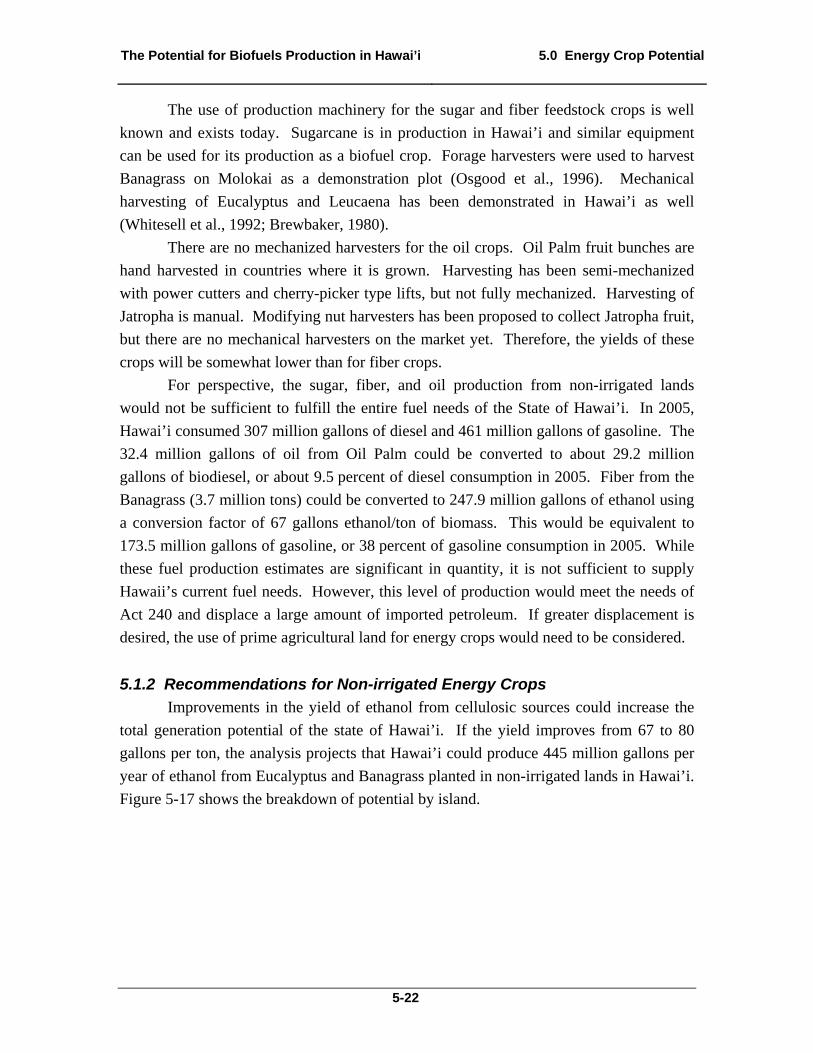
The Potential for Biofuels Production in Hawai’i 5.0 Energy Crop Potential
5-22
The use of production machinery for the sugar and fiber feedstock crops is well
known and exists today. Sugarcane is in production in Hawai’i and similar equipment
can be used for its production as a biofuel crop. Forage harvesters were used to harvest
Banagrass on Molokai as a demonstration plot (Osgood et al., 1996). Mechanical
harvesting of Eucalyptus and Leucaena has been demonstrated in Hawai’i as well
(Whitesell et al., 1992; Brewbaker, 1980).
There are no mechanized harvesters for the oil crops. Oil Palm fruit bunches are
hand harvested in countries where it is grown. Harvesting has been semi-mechanized
with power cutters and cherry-picker type lifts, but not fully mechanized. Harvesting of
Jatropha is manual. Modifying nut harvesters has been proposed to collect Jatropha fruit,
but there are no mechanical harvesters on the market yet. Therefore, the yields of these
crops will be somewhat lower than for fiber crops.
For perspective, the sugar, fiber, and oil production from non-irrigated lands
would not be sufficient to fulfill the entire fuel needs of the State of Hawai’i. In 2005,
Hawai’i consumed 307 million gallons of diesel and 461 million gallons of gasoline. The
32.4 million gallons of oil from Oil Palm could be converted to about 29.2 million
gallons of biodiesel, or about 9.5 percent of diesel consumption in 2005. Fiber from the
Banagrass (3.7 million tons) could be converted to 247.9 million gallons of ethanol using
a conversion factor of 67 gallons ethanol/ton of biomass. This would be equivalent to
173.5 million gallons of gasoline, or 38 percent of gasoline consumption in 2005. While
these fuel production estimates are significant in quantity, it is not sufficient to supply
Hawaii’s current fuel needs. However, this level of production would meet the needs of
Act 240 and displace a large amount of imported petroleum. If greater displacement is
desired, the use of prime agricultural land for energy crops would need to be considered.
5.1.2 Recommendations for Non-irrigated Energy Crops
Improvements in the yield of ethanol from cellulosic sources could increase the
total generation potential of the state of Hawai’i. If the yield improves from 67 to 80
gallons per ton, the analysis projects that Hawai’i could produce 445 million gallons per
year of ethanol from Eucalyptus and Banagrass planted in non-irrigated lands in Hawai’i.
Figure 5-17 shows the breakdown of potential by island.
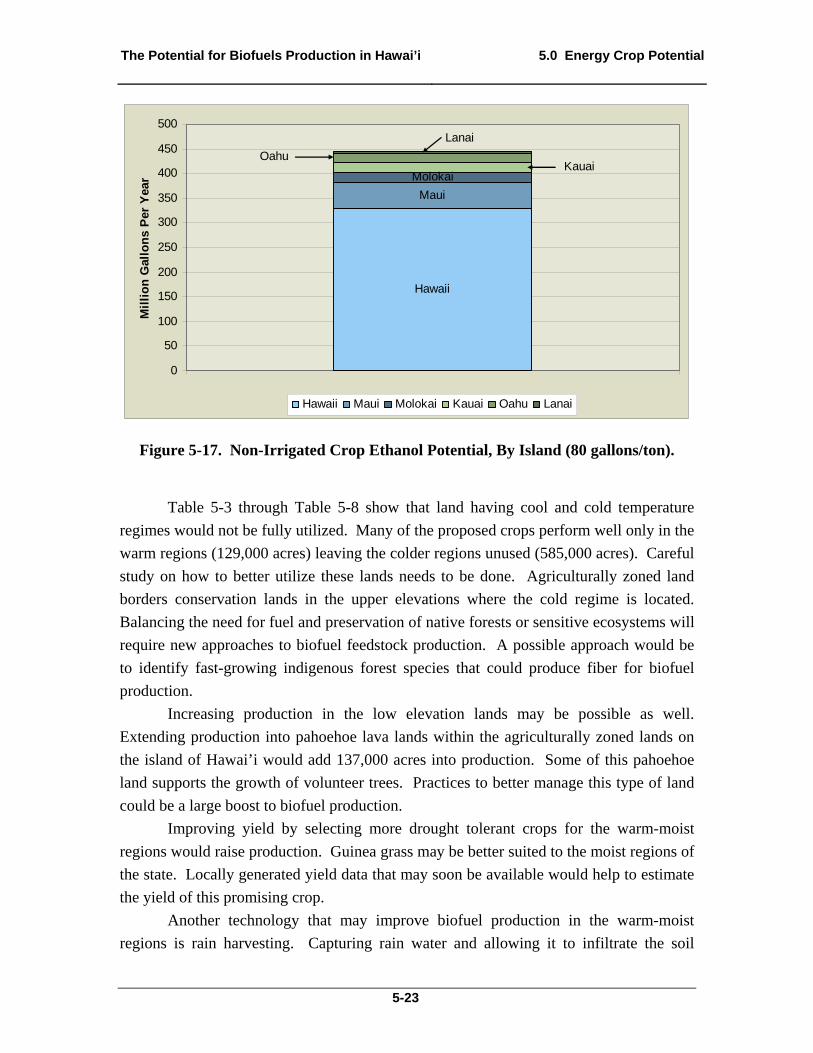
The Potential for Biofuels Production in Hawai’i 5.0 Energy Crop Potential
5-23
Hawaii
Maui
MolokaiKauai
Oahu
Lanai
0
50
100
150
200
250
300
350
400
450
500
Mil
lio
n G
allo
ns
Per
Yea
r
Hawaii Maui Molokai Kauai Oahu Lanai
Figure 5-17. Non-Irrigated Crop Ethanol Potential, By Island (80 gallons/ton).
Table 5-3 through Table 5-8 show that land having cool and cold temperature
regimes would not be fully utilized. Many of the proposed crops perform well only in the
warm regions (129,000 acres) leaving the colder regions unused (585,000 acres). Careful
study on how to better utilize these lands needs to be done. Agriculturally zoned land
borders conservation lands in the upper elevations where the cold regime is located.
Balancing the need for fuel and preservation of native forests or sensitive ecosystems will
require new approaches to biofuel feedstock production. A possible approach would be
to identify fast-growing indigenous forest species that could produce fiber for biofuel
production.
Increasing production in the low elevation lands may be possible as well.
Extending production into pahoehoe lava lands within the agriculturally zoned lands on
the island of Hawai’i would add 137,000 acres into production. Some of this pahoehoe
land supports the growth of volunteer trees. Practices to better manage this type of land
could be a large boost to biofuel production.
Improving yield by selecting more drought tolerant crops for the warm-moist
regions would raise production. Guinea grass may be better suited to the moist regions of
the state. Locally generated yield data that may soon be available would help to estimate
the yield of this promising crop.
Another technology that may improve biofuel production in the warm-moist
regions is rain harvesting. Capturing rain water and allowing it to infiltrate the soil

The Potential for Biofuels Production in Hawai’i 5.0 Energy Crop Potential
5-24
makes each rainfall event more productive instead of losing it to runoff. This can be
especially effective in the moist regions where water can limit crop growth. Rain
harvesting methods may be as simple as making low berms along the contour of slopes.
Making rain water more effective could increase yield tremendously in a water limited
environment.
5.2 Energy Crop Yields on Prime Agricultural Lands The objective of this section is to provide an estimate of biofuel feedstock crop
yields on prime agricultural lands in Hawai’i. The crops are sugarcane (Saccharum
officinarum), Banagrass (Pennisetum purpureum), Eucalyptus (mainly Eucalyptus
grandis), Leucaena spp., Oil Palm (Elaeis guineensis), and Jatropha (Jatropha curcas).
The same crops considered in the previous section were used for consistency to show the
differences in yields and total production.
5.2.1 Methods
Sugar and biomass yields were estimated from experiments conducted in Hawai’i
or the tropics. Characteristics of the soil at these experimental locations were used as a
basis for transferring these data to prime agricultural lands across the state of Hawai’i,
namely soil temperature and moisture.
5.2.1.1 Soil Characteristics and Land Areas
Soil map units and prime agricultural land maps in a geographic information
system format were obtained from the Office of Planning, State of Hawai’i (2008). The
maps were used to define prime agricultural land boundaries and the soils series. Soil
temperature and moisture regimes were obtained from the on-line soil database of the
Natural Resource Conservation Service (2008). The same soil temperature (isomesic,
isothermic, and isohyperthermic or cold, cool, and warm) and moisture characterizations
(aridic, ustic, udic, perudic, and aquic or dry, moist, wet, very wet, and saturated) used in
Section 5.1 were applied in this Section. The land areas of each temperature and
moisture combination were estimated for the Islands of Hawai’i, Maui, Lanai, Molokai,
Oahu, and Kauai. Land areas excluded from the analysis were those classified as beach,
fill land, lava, quarry, rocky, cinder pit, dune, rough broken, and slopes greater than
30 percent.
5.2.1.2 Yield Estimation
Irrigated sugarcane yield on soils found throughout the state was estimated by the
Soil Conservation Service. The yield data were associated with soil series in which soil

The Potential for Biofuels Production in Hawai’i 5.0 Energy Crop Potential
5-25
temperature and moisture were defined. Cane yield was estimated from sugar yield that
was assumed to compose 13 percent of the cane (NASS, 2006).
Irrigated Banagrass yields were estimated from previous research done in Hawai’i
and the tropics (Kinoshita and Zhou, 1999; Osgood et al., 1996; Vincente-Chandler et al.,
1962; Vincente-Chandler et al., 1959; Watkins and Lewy-Van Severin, 1951; Paterson,
1935; Wilsie et al., 1940; Paterson, 1933).
No irrigated yield data were found for the remaining crops. To mimic irrigated
data, rainfed crop yield data were collected and the lowest one-third of data deleted. The
remaining yields were used to calculated mean and range. The yield data was taken from
the following references:
Eucalyptus: Kinoshita and Zhou, 1999; Austin et al., 1997; Stape et al., 2004;
Whitesell et al., 1992; DeBell et al., 1997; Skolmen, 1986; Binkley and Ryan,
1998.
Leucaena: Glover, 1988; Kinoshita and Zhou, 1999; Sun, 1996; Shi, 2003;
Austin et al., 1997.
Oil Palm: Papademetriou and Dent, 2001; Hai, 2000; Udom, 2002;
Kallarackal et al., 2004; Oil World Annual 2004.
Jatropha: Heller, 1996; Foidl et al., 1996 ; Benge ; Ishii and Takeuchi, 1987 ;
Wiesenhutter, 2003; Ouwens et al., 2007.
The means were then used to extrapolate data to temperature and moisture classes
where no data were found. The extrapolation followed the general trend where lower
temperature and higher moisture (lower solar radiation) classes resulted in lower yield on
an annual basis. Eucalyptus and Oil Palm did not fit this trend.
5.2.2 Results
There is about 300,000 acres of prime agricultural land that has the potential for
biofuel feedstock production. Soil temperature and moisture regimes of these lands are
shown on Figure 5-2 through Figure 5-13 for each island. Most of the prime agricultural
lands are warm or cool temperature regimes and dry to moist. Seventy-four percent of
the prime lands are in the warm temperature regime, while forty-seven percent of the
lands are in the moist soil regime. A summary breakdown by land type and island can be
seen in Figure 5-18. Unlike the non-irrigated land potential, the irrigated land is more
evenly distributed throughout the islands.

The Potential for Biofuels Production in Hawai’i 5.0 Energy Crop Potential
5-26
0
20000
40000
60000
80000
100000
120000
140000
Dry
Moi
st
Wet
Sat
urat
ed Dry
Moi
st
Wet
Sat
urat
ed Dry
Moi
st
Wet
Sat
urat
ed
Warm Cool Cold
Acr
es o
f L
and
Big Island Maui Molokai Kauai Oahu Lanai
Figure 5-18. State of Hawai’i Irrigate Land Availability by Soil Type and Island.
The predicted yield of crops for the soil temperature and moisture regimes are
summarized in Figure 5-19. Key findings include the following:
In general, the grasses produce more biomass than the trees on an annual basis.
However, the yield advantage virtually disappears at the cold temperature regime.
Eucalyptus out yields Leucaena in the cooler, wetter areas. There are several species
of Leucaena, and it was assumed that in the cooler regions of the prime agricultural
lands, cold tolerant species or varieties would be planted. Leucaena is a nitrogen-
fixer that can be a major advantage in managing the crop’s fertilizer regimen.
Oil Palm produces more oil than Jatropha. Jatropha’s characteristic of producing oil
seed in dry, marginal soils is no advantage in irrigated, prime agricultural lands.
Production estimates of biomass and oil are given in Table 5-10 through Table
5-16 for each crop. In terms of total biomass production off the entire prime agricultural
lands in the state, sugarcane, Banagrass, Eucalyptus, and Leucaena could generate 11.2,
9.4, 2.8, and 3.2 million tons a year. Oil Palm and Jatropha could produce 66 and 62
million gallons of oil a year.

The Potential for Biofuels Production in Hawai’i 5.0 Energy Crop Potential
5-27
Table 5-9. Land Areas of the Soil Temperature and Moisture Regimes within Prime Agricultural Lands.
Temp Moisture Prime Agricultural Land Area (acres)
Hawai’i Maui Molokai Kauai Oahu Lanai Total
Warm
Dry 0 22,501 8,177 9,828 14,252 9,153 63,912 Moist 8,869 38,591 2,312 26,413 36,140 2,345 114,672 Wet 26,329 0 0 11,135 662 0 38,126 Saturated 124 119 16 5,344 562 0 6,165
subtotal: 35,322 61,211 10,505 52,720 51,616 11,498 222,875
Cool
Dry 0 77 0 0 0 241 318
Moist 12,133 4,600 621 207 3,125 5,002 25,687
Wet 47,669 4 0 71 1,178 0 48,922
Saturated 36 0 0 21 0 0 57
subtotal: 59,838 4,681 621 299 4,303 5,243 74,984
Cold
Dry
Moist 0 1 0 0 0 0 1
Wet 2,519 0 0 0 0 0 2,519
Saturated
subtotal: 2,519 1 0 0 0 0 2,520
Total 97,679 65,893 11,126 53,020 55,919 16,741 300,378
Note: Shaded cells are regimes that do not exist on the prime agricultural lands.

The Potential for Biofuels Production in Hawai’i 5.0 Energy Crop Potential
5-28
Figure 5-19. Soil Temperature Regimes, Prime Lands on the Island of Hawai’i.
N
MoistWetSaturated
Figure 5-20. Soil Moisture Regimes, Prime Lands on the Island of Hawai’i.

The Potential for Biofuels Production in Hawai’i 5.0 Energy Crop Potential
5-29
Figure 5-21. Soil Temperature Regimes, Prime Lands on the Island of Maui.
Figure 5-22. Soil Moisture Regimes, Prime Lands on the Island of Maui.

The Potential for Biofuels Production in Hawai’i 5.0 Energy Crop Potential
5-30
Figure 5-23. Soil Temperature Regimes, Prime Lands on the Island of Molokai.
Figure 5-24. Soil Moisture Regimes, Prime Lands on the Island of Molokai.

The Potential for Biofuels Production in Hawai’i 5.0 Energy Crop Potential
5-31
Figure 5-25. Soil Temperature Regimes, Prime Lands on the Island of Kauai.
Figure 5-26. Soil Moisture Regimes, Prime Lands on the Island of Kauai.

The Potential for Biofuels Production in Hawai’i 5.0 Energy Crop Potential
5-32
Figure 5-27. Soil Temperature Regimes, Prime Lands on the Island of Oahu.
Figure 5-28. Soil Moisture Regimes, Prime Lands on the Island of Oahu.
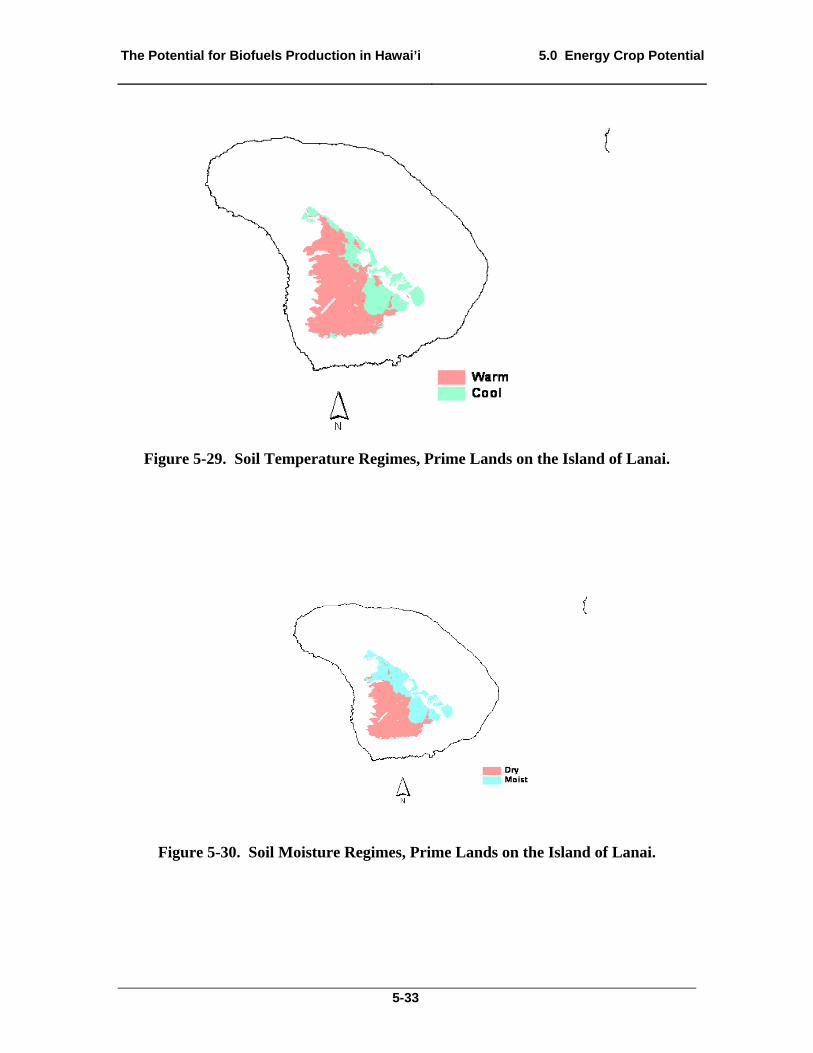
The Potential for Biofuels Production in Hawai’i 5.0 Energy Crop Potential
5-33
Figure 5-29. Soil Temperature Regimes, Prime Lands on the Island of Lanai.
Figure 5-30. Soil Moisture Regimes, Prime Lands on the Island of Lanai.

The Potential for Biofuels Production in Hawai’i 5.0 Energy Crop Potential
5-34
Table 5-10. Irrigated Dry Matter and Oil Yield of Crops Estimates
Temp Moisture Sugarcane
(tons/acre/year) Banagrass
(tons/acre/year) Eucalyptus
(tons/acre/year) Leucaena
(tons/acre/year)
Oil Palm (gallons/
acre/year)
Jatropha (gallons/
acre/year)
Warm Dry 52 (46 - 58)
45 (26 - 67)
8 ( )
13 (10 - 13)
300 ( )
290 ( )
Moist 52 (46 - 58)
37 (15 - 42)
9 (7 - 11)
12 (8 - 19)
300 ( )
290 ( )
Wet 35 (31 - 38)
37 ( )
11 (9 - 13)
8 (5 - 11)
433 (362 - 500)
210 ( )
Saturated
30 ( )
10 ( )
6 ( )
Cool Dry 29 (23 - 35)
12 ( )
9 ( )
10 ( )
Moist 29 (23 - 35)
10 ( )
10 ( )
9 ( )
Wet 19 (15 - 23)
10 ( )
12 (11 - 12)
6 (4 - 7)
Saturated 8 ( )
11 ( )
4 ( )
Cold Dry
Moist 19 (15 – 23)
7 (6 - 7)
8 ( )
7 ( )
Wet 13 (10 - 15)
7 ( )
10 ( )
5 ( )
Saturated Note: Values are averages and values in parentheses are ranges of the yield observed in analogous environments in Hawai’i or other locations. Blank cells have no data to base an extrapolated yield estimate. Shaded cells are regimes that do not apply to the prime agricultural lands in Hawai’i.

The Potential for Biofuels Production in Hawai’i 5.0 Energy Crop Potential
5-35
Table 5-11. Estimate of Irrigated Sugarcane Cane Production on Prime Agricultural Lands
Temp Moisture
Production of Sugarcane (thousand tons cane/year)
Hawai’i Maui Molokai Kauai Oahu Lanai
Warm Dry 464 (409 - 512)
1,177 (1,039 - 1,298)
428 (377 - 472)
514 (454 - 567)
745 (658 - 822)
479 (422 - 528)
Moist 1,377 (1,215 - 1,519)
2,018 (1,781 - 2,226)
121 (107 - 133)
1,382 (1,219 - 1,524)
1,890 (1,668 - 2,085)
123 (108 - 135)
Wet 4.3 (3.8 - 4.8)
385 (343 - 428)
23 (20 - 25)
Saturated
Cool Dry 2.3 (1.8 - 2.7)
7.0 (5.6 - 8.3)
Moist 355 (280 - 420)
134 (106 - 159)
18 (14 - 21)
6.1 (4.8 - 7.2)
91 (72-108)
146 (115 - 173)
Wet 917 (733 - 1,100)
0.08 (0.06 - 0.09)
1.4 (1.1 - 1.6)
23 (18 - 27)
Saturated
Cold Dry
Moist 0.02 (0.02 - 0.02)
Wet 33 (25 - 39)
Saturated
Note: Values in parentheses are ranges of production. Blank cells indicate that a production estimate cannot be made because yield data are not available. Shaded cells are temperature and moisture conditions that are not present in nonprime agricultural lands.

The Potential for Biofuels Production in Hawai’i 5.0 Energy Crop Potential
5-36
Table 5-12. Estimate of Irrigated Banagrass Production on Prime Agricultural Lands
Temp Moisture
Production of Biomass (thousand tons/year)
Hawai’i Maui Molokai Kauai Oahu Lanai
Warm Dry 399 (231 - 594)
1,013 (585 - 1,508)
368 (213 - 548)
442 (256 - 658)
641 (371 - 955)
412 (238 - 613)
Moist 974 (395 - 1,106)
1428 (579 - 1,621)
86 (35 - 97)
977 (396 - 1,109)
1,337 (542 - 1,518)
87 (35 - 98)
Wet 4.6 ( )
412 ( )
Saturated 3.6 ( )
0.5 ( )
0.6 ( )
Cool Dry 0.9 ( )
2.9 ( )
Moist 121 ( )
46 ( )
2.1 ( )
31 ( )
50 ( )
Wet 476 ( )
0.04 ( )
0.7 ( )
12 ( )
Saturated 0.3 ( )
0.2 ( )
Cold Dry
Moist 0.007 ( )
Wet 18 ( )
Saturated
Note: Values in parentheses are ranges of production. Blank cells indicate that a production estimate cannot be made because yield data are not available. Shaded cells are temperature and moisture conditions that are not present in nonprime agricultural lands.

The Potential for Biofuels Production in Hawai’i 5.0 Energy Crop Potential
5-37
Table 5-13. Estimate of Irrigated Eucalyptus Production on Prime Agricultural Lands
Temp Moisture
Production of Biomass (thousand tons/year)
Hawai’i Maui Molokai Kauai Oahu Lanai
Warm Dry 71 ( )
180 ( )
65 ( )
79 ( )
114 ( )
73 ( )
Moist 237 (184 - 290)
347 (270 - 425)
21 (16 - 25)
238 (185 - 291)
325 (253 - 398)
21 (16.26)
Wet 1.4 (1.1 - 1.6)
122 (100 - 145)
7.3 (6.0-8.6)
Saturated 1.2 ( )
0.2 ( )
0.2 ( )
5.6 ( )
Cool Dry 0.7 ( )
2.1 ( )
Moist 121 ( )
46 ( )
6.2 ( )
2.1 ( )
31 ( )
50 ( )
Wet 572 (524 - 572)
0.05 ( )
0.9 (0.8 - 0.9)
14 (13 - 14)
Saturated 0.4 ( )
0.2 ( )
Cold Dry
Moist 0.01 ( )
Wet 25 ( )
Saturated
Note: Values in parentheses are ranges of production. Blank cells indicate that a production estimate cannot be made because yield data are not available. Shaded cells are temperature and moisture conditions that are not present in nonprime agricultural lands.

The Potential for Biofuels Production in Hawai’i 5.0 Energy Crop Potential
5-38
Table 5-14. Estimate of Irrigated Leucaena Production on Prime Agricultural Lands
Temp Moisture
Production of Biomass (thousand tons/year)
Hawai’i Maui Molokai Kauai Oahu Lanai
Warm Dry 115 ( )
293 ( )
106 ( )
128 ( )
185 ( )
119 ( )
Moist 316 ( )
463 ( )
28 ( )
317 ( )
434 ( )
28 ( )
Wet 1.0 ( )
89 ( )
5.3 ( )
Saturated 0.7 ( )
0.1 ( )
0.1 ( )
3.4 ( )
Cool Dry 0.8 ( )
2.4 ( )
Moist 109 ( )
41 ( )
5.6 ( )
1.9 ( )
28 ( )
45 ( )
Wet 286 ( )
0.02 0.4 ( )
7.1 ( )
Saturated 0.1 ( )
( ) 0.01 ( )
Cold Dry
Moist 0.01
Wet 13 ( )
( )
Saturated
Note: Values in parentheses are ranges of production. Blank cells indicate that a production estimate cannot be made because yield data are not available. Shaded cells are temperature and moisture conditions that are not present in nonprime agricultural lands.

The Potential for Biofuels Production in Hawai’i 5.0 Energy Crop Potential
5-39
Table 5-15. Estimate of Irrigated Oil Palm Production on Prime Agricultural Lands
Production of Oil (thousand gallons/year)
Temp Moisture Hawai’i Maui Molokai Kauai Oahu Lanai
Warm Dry 2,643 ( )
6,705 ( )
2,437 ( )
2,929 ( )
4,247 ( )
2,728 ( )
Moist 7,846 ( )
11,577 ( )
689 ( )
7,871 ( )
10,770 ( )
699 ( )
Wet 54 (45 - 62)
4,821 (4,031 - 5,568)
287 (240 - 331)
Saturated
Cool Dry
Moist
Wet
Saturated
Cold Dry
Moist
Wet
Saturated
Note: Values in parentheses are ranges of production. Blank cells indicate that a production estimate cannot be made because yield data are not available. Shaded cells are temperature and moisture conditions that are not present in nonprime agricultural lands.

The Potential for Biofuels Production in Hawai’i 5.0 Energy Crop Potential
5-40
Table 5-16. Estimate of Irrigated Jatropha Production on Prime Agricultural Lands
Production of Oil (thousand gallons/year)
Temp Moisture Hawai’i Maui Molokai Kauai Oahu Lanai
Warm Dry 2,572 ( )
6,525 ( )
2,371 ( )
2,850 ( )
4,133 ( )
2,654 ( )
Moist 7,635 ( )
11,191 ( )
670 ( )
7,660 ( )
10,481 ( )
680 ( )
Wet 26 ( )
2,338 ( )
139 ( )
Saturated
Cool Dry
Moist
Wet
Saturated
Cold Dry
Moist
Wet
Saturated
Note: Values in parentheses are ranges of production. Blank cells indicate that a production estimate cannot be made because yield data are not available. Shaded cells are temperature and moisture conditions that are not present in nonprime agricultural lands.

The Potential for Biofuels Production in Hawai’i 5.0 Energy Crop Potential
5-41
A summary of the total biomass potential for ethanol and biodiesel production by
crop type and island can be seen in Figure 5-31 and Figure 5-32. Distribution of resource
potential is more even relative to the non-irrigated land. For ethanol production, only
sugarcane and Banagrass are impacted by this land type, since the woody crops gain little
yield advantage through irrigation. Palm oil production increases by a factor of two with
irrigation, while Jatropha oil is expected to more than triple.
0
2000
4000
6000
8000
10000
12000
14000
Sugarcane Banagrass Eucalyptus Leucaena
Th
ou
san
d T
on
s P
er Y
ear
Big Island Maui Molokai Kauai Oahu Lanai
Figure 5-31. Biomass Potential by Crop Type and Island, Ethanol.
0
10000
20000
30000
40000
50000
60000
70000
Palm Oil Jatropha
Th
ou
san
d G
allo
ns
Pe
r Y
ea
r
Big Island Maui Molokai Kauai Oahu Lanai
Figure 5-32. Biomass Potential by Crop Type and Island, Biodiesel.
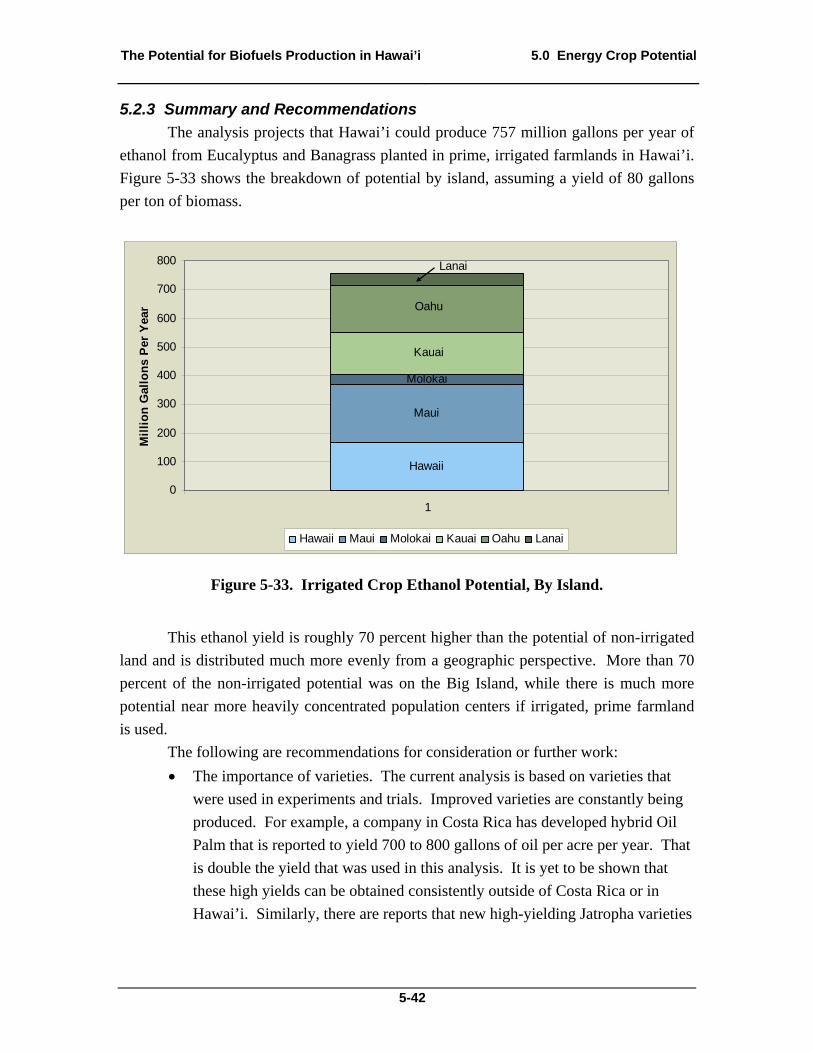
The Potential for Biofuels Production in Hawai’i 5.0 Energy Crop Potential
5-42
5.2.3 Summary and Recommendations
The analysis projects that Hawai’i could produce 757 million gallons per year of
ethanol from Eucalyptus and Banagrass planted in prime, irrigated farmlands in Hawai’i.
Figure 5-33 shows the breakdown of potential by island, assuming a yield of 80 gallons
per ton of biomass.
Hawaii
Maui
Molokai
Kauai
Oahu
Lanai
0
100
200
300
400
500
600
700
800
1
Mil
lio
n G
allo
ns
Per
Yea
r
Hawaii Maui Molokai Kauai Oahu Lanai
Figure 5-33. Irrigated Crop Ethanol Potential, By Island.
This ethanol yield is roughly 70 percent higher than the potential of non-irrigated
land and is distributed much more evenly from a geographic perspective. More than 70
percent of the non-irrigated potential was on the Big Island, while there is much more
potential near more heavily concentrated population centers if irrigated, prime farmland
is used.
The following are recommendations for consideration or further work:
The importance of varieties. The current analysis is based on varieties that
were used in experiments and trials. Improved varieties are constantly being
produced. For example, a company in Costa Rica has developed hybrid Oil
Palm that is reported to yield 700 to 800 gallons of oil per acre per year. That
is double the yield that was used in this analysis. It is yet to be shown that
these high yields can be obtained consistently outside of Costa Rica or in
Hawai’i. Similarly, there are reports that new high-yielding Jatropha varieties
The Potential for Biofuels Production in Hawai’i 5.0 Energy Crop Potential
5-43
are near production. It is yet to be seen whether these lines are released and
yielding as well as reported.
The yields reported are broad given a range of literature estimates. More
work is needed to confirm these yield estimates.
The yields reported are mostly based on experimental plots. Yields on
research stations are almost always higher than production fields.
The yields are assumed to be for fully irrigated fields. No attempt has been
made to estimate whether there is adequate water resources to fulfill the crop
requirements.

The Potential for Biofuels Production in Hawai’i 6.0 Energy Crop Economics
6-1
6.0 Evaluation of Energy Crop Economics in Hawai’i
The objectives of this section are to address the economic feasibility of selected bioenergy crops for Hawai’i and compare their cost competitiveness in terms of cost per Btu of feedstock produced. The selected feedstock consists of both ethanol and biodiesel producing crops. Ethanol feedstock includes sugar feedstock (sugarcane) and cellulosic feedstock (Banagrass, Eucalyptus, and Leucaena). Biodiesel feedstock consists of Jatropha and Oil Palm.
For the economic analysis a net economic returns model was used to select economically feasible feedstock for biofuel production. For each feedstock, net return, feedstock cost per Btu, and feedstock cost per gallon of ethanol/biodiesel, the breakeven price of feedstock and the breakeven price of ethanol/biodiesel were calculated.
It should be noted that the costs to convert cellulosic feedstock to ethanol are still preliminary, and results should be interpreted with caution. Although it appears that Banagrass is the leading biofuel crop candidate among the six selected crops, the process of converting cellulosic feedstock into ethanol is still in the demonstration phase, and results should be treated as preliminary.
6.1 Data The majority of the investigated crops are not widely grown in Hawai’i; hence,
finding appropriate field data for economic analysis is challenging. For Banagrass,
sugarcane, Eucalyptus, and Leucaena, data from previous studies were used. Production
of Jatropha was assumed as analog to macadamia nut. For analysis of crops such as Oil
Palm, data from foreign studies were used. Table 6-1 gives the basis for the data sources.
Table 6-1. Bioenergy Crop Data Source Locations.
Hawai’i Sources Production Similar to Other Crops (Analog) Analogous Climate
Banagrass Jatropha Oil Palm
Sugarcane
Eucalyptus
Leucaena
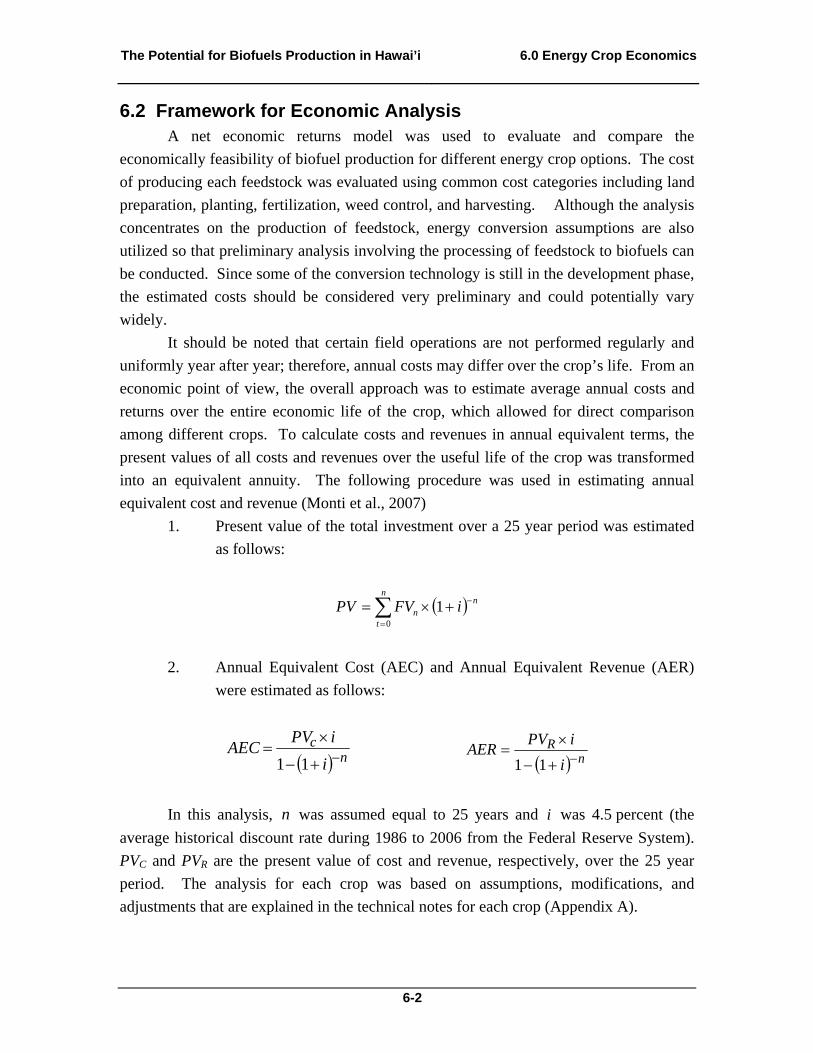
The Potential for Biofuels Production in Hawai’i 6.0 Energy Crop Economics
6-2
6.2 Framework for Economic Analysis A net economic returns model was used to evaluate and compare the
economically feasibility of biofuel production for different energy crop options. The cost
of producing each feedstock was evaluated using common cost categories including land
preparation, planting, fertilization, weed control, and harvesting. Although the analysis
concentrates on the production of feedstock, energy conversion assumptions are also
utilized so that preliminary analysis involving the processing of feedstock to biofuels can
be conducted. Since some of the conversion technology is still in the development phase,
the estimated costs should be considered very preliminary and could potentially vary
widely.
It should be noted that certain field operations are not performed regularly and
uniformly year after year; therefore, annual costs may differ over the crop’s life. From an
economic point of view, the overall approach was to estimate average annual costs and
returns over the entire economic life of the crop, which allowed for direct comparison
among different crops. To calculate costs and revenues in annual equivalent terms, the
present values of all costs and revenues over the useful life of the crop was transformed
into an equivalent annuity. The following procedure was used in estimating annual
equivalent cost and revenue (Monti et al., 2007)
1. Present value of the total investment over a 25 year period was estimated
as follows:
nn
tn iFVPV
10
2. Annual Equivalent Cost (AEC) and Annual Equivalent Revenue (AER)
were estimated as follows:
nc
i
iPVAEC
11
nR
i
iPVAER
11
In this analysis, n was assumed equal to 25 years and i was 4.5 percent (the
average historical discount rate during 1986 to 2006 from the Federal Reserve System).
PVC and PVR are the present value of cost and revenue, respectively, over the 25 year
period. The analysis for each crop was based on assumptions, modifications, and
adjustments that are explained in the technical notes for each crop (Appendix A).

The Potential for Biofuels Production in Hawai’i 6.0 Energy Crop Economics
6-3
Feedstock cost of ethanol per 1,000 Btu was estimated by dividing the cost per
acre of producing each feedstock by the corresponding crop’s total per acre energy
production. Total energy per gallon of ethanol and biodiesel are 76,300 Btu and
118,000 Btu, respectively (Jaeger et al., 2007). Feedstock cost of either a gallon of
ethanol or biodiesel was estimated by dividing the per acre cost of producing the
feedstock by the total gallons (per acre) of ethanol/biodiesel produced for each crop.
The breakeven price of feedstock is the price of feedstock at which the net
revenue equals zero. The breakeven price of ethanol or biodiesel is the price of energy at
which the net returns in terms of energy equal zero. The breakeven price is calculated as
cost divided by yield, where yield is either in terms of feedstock or the appropriate
conversion to energy.
6.3 Results
6.3.1 Base Case, Rainfed Cases
Table 6-2 and Table 6-3 provide a comparison of crop yields, ethanol/biodiesel
yields, feedstock costs per gallon, and feedstock costs per 1,000 Btu for the selected
crops, based on rainfed and irrigated land. Banagrass has the highest ethanol production
(1,440.5 gallons/acre/year) and Oil Palm has the highest biodiesel production (203.4
gallons/acre/year). Feedstocks used for producing ethanol have lower feedstock costs
(per gallon and per 1,000 Btu) than feedstocks used for the production of biodiesel.
Table 6-2 and Table 6-3 summarize the major components of the economic
analysis, including analysis involving the feedstock and conversion of the feedstock to
either ethanol or biodiesel. The major findings are as follows:
Net returns (based on feedstock price) are not available for Eucalyptus and Leucaena
because of the absence of feedstock price data. Of the remaining bioenergy crops
investigated, only Banagrass shows a positive net return per acre.
High production costs are primarily due to field operation costs (fertilizer, pesticides,
and other chemical application) and harvesting costs. With improved yields, the cost
component can be reduced and net returns improved.
Net returns after conversion to ethanol and biodiesel show irrigated Banagrass
production on prime land as having highest positive net returns from ethanol
production. This is due to the crop’s high energy yield (conversion to ethanol).
However, it should be noted that costs to convert cellulosic feedstock to ethanol are
still under investigation and, therefore, the results should be interpreted with caution.
Compared to ethanol, feedstock costs per gallon of biodiesel crops are higher.
Jatropha and Oil Palm research in Hawai’i is still in its infancy and yield

The Potential for Biofuels Production in Hawai’i 6.0 Energy Crop Economics
6-4
improvements, development of harvesting machinery, and improved production
practices could substantially reduce costs and improve net returns for these oil
producing crops.
Break-even prices for ethanol producing crops (sugarcane, Banagrass, Eucalyptus,
and Leucaena) are lower than biodiesel producing crops (Jatropha and Oil Palm).
With the assumptions used in the base case evaluation, the net returns analysis
showed that Banagrass grown on irrigated prime land had the highest positive net return
(i.e., when the price of Banagrass is measured as a feedstock or in terms of ethanol).

The Potential for Biofuels Production in Hawai’i 6.0 Energy Crop Economics
6-5
Table 6-2. Biofuel Yields and Feedstock Cost, Rainfed Land
Crop Yield (acre/yr)
Conversion Factor Ethanol (Biodiesel) (gallons/acre/ year)
Feedstock Cost (per 1000 BTU)
Feedstock Cost (per gal)
Ethanol
1. Sugarcane
Sugar fermentation 23.8 wet tons* 19.5 gal/wet tons cane* 464 $0.018 $1.25
Residue (cellulosic) 4 dry tons 80 gal/dry tons residue 324
Sugarcane total 788
2. Banagrass 21.5 dry tons 80 gal/dry ton 1,720 $0.010 $0.74
3. Eucalyptus 7.8 dry tons 80 gal/dry ton 624 $0.018 $1.31
4. Leucaena 8.8 dry tons 80 gal/dry ton 704 $0.010 $0.70
Biodiesel
5. Oil Palm 226 gal 0.9 gal biodiesel/gal oil 203 $0.090 $10.60
6. Jatropha 114 gal 0.9 gal biodiesel/gal oil 103 $0.154 $18.16
Notes:
* Moisture content for sugarcane can be approximated as 70 percent.

The Potential for Biofuels Production in Hawai’i 6.0 Energy Crop Economics
6-6
Table 6-3. Biofuel Yields and Feedstock Cost, Irrigated Land
Crop Yield (acre/yr)
Conversion Factor Ethanol (Biodiesel) (gallons/acre/ year)
Feedstock Cost (per 1000 BTU)
Feedstock Cost (per gal)
Ethanol
1. Sugarcane
Sugar fermentation 52 wet tons* 19.5 gal/wet tons cane* 1014 $0.03 $0.90
Residue (cellulosic) 8.8 dry tons 80 gal/dry ton residue 704
Sugarcane total 1718
2. Banagrass 37 dry tons 80 gal/dry ton 2960 $0.009 $0.58
3. Eucalyptus 9 dry tons 80 gal/dry ton 720 $0.020 $1.22
4. Leucaena 12 dry tons 80 gal/dry ton 960 $0.013 $0.59
Biodiesel
5. Oil Palm 300 gal 0.9 gal biodiesel/gal oil 270 $0.068 $7.98
6. Jatropha 290 gal 0.9 gal biodiesel/gal oil 261 $0.06 $7.14
Notes:
* Moisture content for sugarcane can be approximated as 70 percent.

The Potential for Biofuels Production in Hawai’i 6.0 Energy Crop Economics
6-7
Table 6-4. Economic Summary of Sugar and Cellulosic Feedstocks, Rainfed
Cost Items Unit Sugarcane Banagrass Eucalyptus Leucaena
1. Land Preparation $/acre/year $292.84 $34.94 $8.21 $8.24
2. Planting $/acre/year $28.94 $4.22 $4.24
Seeds/plants $/acre/year $1.66
3. Field Operations
Fertilizer $/acre/year $65.98 $187.98 $62.46 $42.20
Herbicides $/acre/year $171.89 $140.51 $109.82 $48.60
Other $/acre/year $35.67
4. Harvesting $/acre/year $290.07 $277.23 $490.54 $236.33
Other $/acre/year $224.06 $3.82 $40.92
5. Other Operations $/acre/year $282.92 $6.40 $54.99
6. Operating Overhead $/acre/year $84.97 $114.93 $72.11 $38.05
Total Costs $/acre/year $934.69 $1,264.24 $793.26 $473.56
Fixed Cost $/acre/year $93.47 $56.08 $79.33 $47.36
Total Variable Cost $/acre/year $841.22 $1,208.16 $713.94 $426.21
A. Feedstock Production
Primary Production Tons 47.60 (wet) 21.50 (dry) 7.80 (dry) 8.80 (dry)
Gross Revenue $/acre/year $815.08 $1,802.99
Net Revenue (per acre) acre/year -$119.61 $538.75
B. Production of Ethanol
Total Processing Cost $/acre/year $439.52 $2,339.20 $848.64 $957.44
Total Production Cost $/acre/year $1,890.02 $3,603.44 $1,641.90 $1,431.00
Gross Revenue (ethanol) $/acre/year $1,892.07 $4,137.50 $1,501.05 $1,693.49
Net Revenue (ethanol) $/acre/year $2.06 $534.06 -$140.86 $262.49
Feedstock Cost of Ethanol $/1,000 Btu $0.018 $0.010 $0.018 $0.010
Feedstock Cost of Ethanol $/gallon $1.21 $0.74 $1.27 $0.67
Breakeven Price of Feedstock $/ton $41.95 $58.80
Breakeven Price of Ethanol $/gallon $2.40 $2.10 $2.63 $2.03
A summary of the breakdown between production and harvesting costs for each
feedstock can be seen in Figure 6-1. For the base case assumptions used in this analysis
it appears that Banagrass and Leucaena could have an economic advantage compared to
sugarcane and Leucaena. Given the challenges associated with estimating future
projected energy crop yields, conversion efficiencies, and conversion costs for the these
emerging biofuel applications, the difference in the projected breakeven costs for these
four crops is not dramatic. As these options are commercialized, actual project and
production costs could swing up or down from those illustrated here, leaving room to
justify the continued exploration of all these energy crop alternatives.

The Potential for Biofuels Production in Hawai’i 6.0 Energy Crop Economics
6-8
Harvest Cost
Processing Cost
0
0.5
1
1.5
2
2.5
3
Sugarcane Banagrass Eucalyptus Leucaena
Bre
akev
en P
rice
of
Eth
ano
l ($
/gal
lon
)
Harvest Cost Processing Cost
Figure 6-1. Breakeven Ethanol Cost Components, Rainfed Feedstocks.
A summary of the cost components and the breakeven cost for biodiesel can be
seen in Table 6-5 below. Note that processing cost is only a very small proportion of the
breakeven sales value.

The Potential for Biofuels Production in Hawai’i 6.0 Energy Crop Economics
6-9
Table 6-5. Economic Summary of Feedstock and Biodiesel Data
Cost Items Unit Oil Palm
Jatropha
Scenario 1* Scenario 2**
1. Land Preparation $/acre/year $8.21 $8.21 $8.21
2. Planting $/acre/year $4.22 $4.22
Other $/acre/year $134.92
3. Field Operations
Machinery $/acre/year $130.29 $130.29
Labor $/acre/year $28.94 $212.28 $212.28
Fertilizer $/acre/year $359.11 $131.70 $131.70
Herbicides $/acre/year $114.06 $52.51 $52.51
4. Harvesting $/acre/year $874.65 $874.65
Machinery $/acre/year $23.06
Labor $/acre/year $307.83
Other $/acre/year $352.07
5. Other Operations $/acre/year $467.37 $141.52 $141.52
6. Operating Overhead $/acre/year $179.98 $155.54 $155.54
Total Variable Costs $/acre/year $1,979.76 $1,710.93 $1,710.93
Fixed Cost $/acre/year $175.90 $152.01 $152.01
Total Cost $/acre/year $2,155.66 $1,862.93 $1,862.93
A. Feedstock Production
Primary Production Gallons 226.00 114.00 114.00
Gross Revenue $/acre/year $447.25 $233.10 $396.30
Net Revenue (per acre) acre/year -$1,708.41 -$1,629.84 -$1,466.64
B. Production of Biodiesel
Total Processing Cost $/acre/year $133.34 $59.08 $59.08
Total Production Cost $/acre/year $2,289.00 $1,922.02 $1,922.02
Gross Revenue $/acre/year $454.62 $201.45 $342.49
Net Revenue from Biodiesel $/acre/year -$1,834.38 -$1,720.57 -$1,579.53
Feedstock Cost of Biodiesel $/1,000 Btu $0.090 $0.154 $0.154
Feedstock Cost of Biodiesel $/gallon $10.60 $18.16 $18.16
Breakeven Price of Feedstock $/ton $9.54 $16.34 $16.34
Breakeven Price of Biodiesel $/gallon $11.25 $18.73 $18.73
*Scenario 1: Palm oil price as a substitute for Jatropha oil price. **Scenario 2: Soybean oil price as a substitute for Jatropha oil price.

The Potential for Biofuels Production in Hawai’i 6.0 Energy Crop Economics
6-10
6.3.2 Sensitivities
The analysis explored the sensitivity of the economic model to variations in the major
inputs for the Banagrass case. The major items investigated are listed below:
Total Harvest Costs
Yield of biomass (tons per acre per year)
Processing cost
Yield of ethanol per ton
In the sensitivity analysis, each individual input was varied from the base case
while all other inputs were held constant. The effect on the breakeven ethanol sales price
was recorded and plotted against the corresponding input value. The results of the
analysis for each of these variables can be seen on Figure 6-2. While this analysis was
done specifically for the Banagrass case, the impacts of the variables are likely to be
similar for other feedstocks.
Harvest Costs
Tons per Acre
Processing Cost
Ethanol Yield per Ton
1.00
1.50
2.00
2.50
3.00
-50% -25% 0% 25% 50%
Percent Change in Variable From Base Case Assumption
Bre
ake
ve
n E
tha
no
l Sa
les
Pri
ce
($/g
allo
n)
Harvest Costs Tons per Acre Processing Cost Ethanol Yield per Ton
Figure 6-2. Banagrass Financial Model Sensitivities.
The lines on Figure 6-2 with the steepest slopes generally represent the inputs
with the greatest impact on the financial return. The two most significant inputs that

The Potential for Biofuels Production in Hawai’i 6.0 Energy Crop Economics
6-11
could improve the economics are the Harvest and Processing Costs. For an equivalent
change in input, these factors have a greater impact on the breakeven price of ethanol
relative to the yields of biomass per acre or the yield of ethanol per ton of biomass. The
tons of biomass per acre and gallons of ethanol per ton of biomass have almost identical
impacts on the economics if they were to improve; a 25 percent improvement in each
would reduce the breakeven ethanol sales price to just over $2 per gallon. This analysis
shows that improving processing cost, which is very uncertain at this time due to the
nascent technology available for cellulosic ethanol conversion, should be the area of
greatest focus to help improve the overall system economics.
One area commonly sited as being a major potential improvement in cellulosic
ethanol technology is increasing the yield of ethanol per ton of feedstock. The base case
assumed 80 gallons per ton of feedstock, which represents the anticipated state of
technology in the next four to five years. The impact on the breakeven price of cellulosic
ethanol ranging from a conservative conversion estimate of 67 gallons per ton to an
expected future potential of 100 gallons per ton for each of the four feedstocks can be
seen in Figure 6-3.
$1.50
$2.00
$2.50
$3.00
$3.50
60.00 70.00 80.00 90.00 100.00 110.00
Ethanol Yield (Gallons/Ton)
Bre
ake
ve
n P
ric
e o
f E
tha
no
l
Sugarcane Banagrass Eucalyptus Leucaena
Figure 6-3. Ethanol Yield Sensitivity Analysis.
Major improvements in conversion technologies may be able to raise the yield of
ethanol per ton to the 100 gallon range. While these sorts of improvements would be
helpful to lower the cost of production, the benefit is relatively modest (lowering
production costs by roughly $0.25/gallon for most feedstocks) given the major technical

The Potential for Biofuels Production in Hawai’i 6.0 Energy Crop Economics
6-12
improvement that this entails. Woody feedstocks are impacted more strongly due to their
lower ton yield per acre. The sensitivity in processing costs for Eucalyptus and Leucaena
is illustrated in Figure 6-4, where a lower processing cost of $1.36/gallon is compared to
a higher processing cost of $1.62/gallon, with a resulting difference of roughly 10 percent
in the breakeven costs of ethanol production.
$0.00
$0.50
$1.00
$1.50
$2.00
$2.50
$3.00
$3.50
Eucalyptus Leucaena
Bre
ak
ev
en
Pri
ce
of
Eth
an
ol
High Processing Cost Low Processing Cost
Figure 6-4. Woody Feedstock Processing Cost Sensitivity Analysis.
6.3.3 Base Case, Irrigated Cases
The results presented above specifically highlight the costs for ethanol production
from rainfed crops. The economic analysis also explored the production cost of ethanol
from irrigated Banagrass and sugarcane. While the costs for irrigation negatively impact
the economics of production, the higher yield from irrigation typically makes irrigation
cost effective. The results of this analysis can be seen in Table 6-6 below.
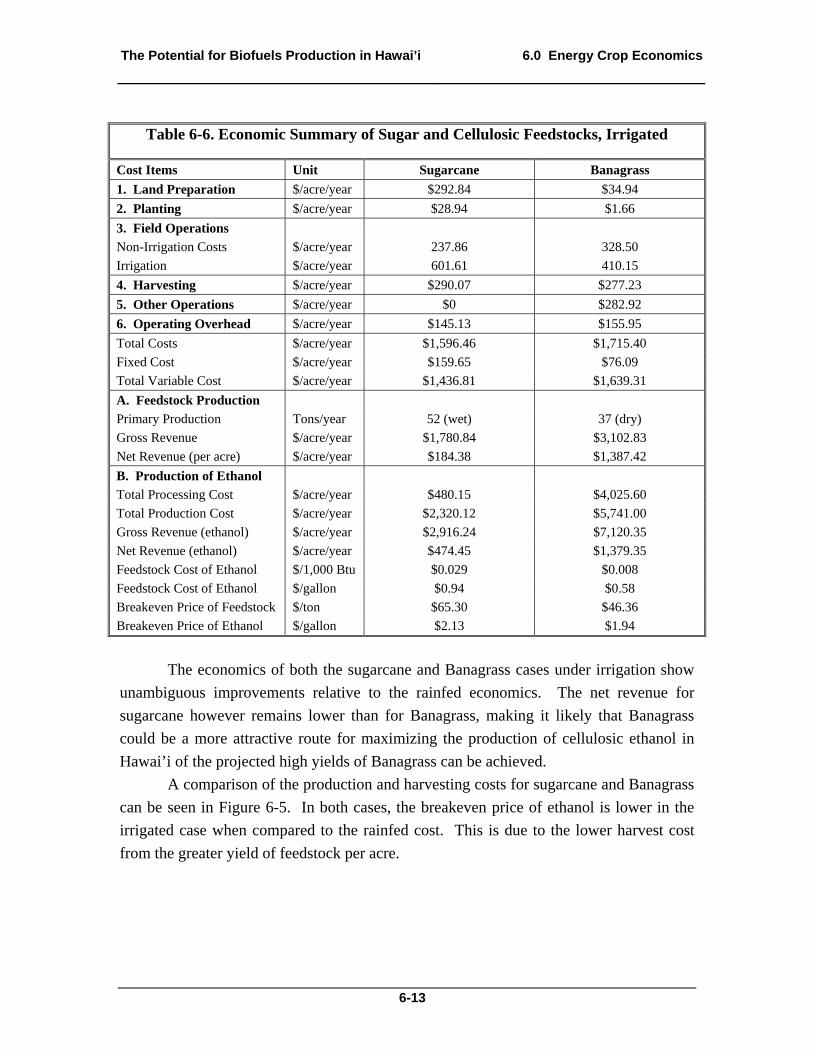
The Potential for Biofuels Production in Hawai’i 6.0 Energy Crop Economics
6-13
Table 6-6. Economic Summary of Sugar and Cellulosic Feedstocks, Irrigated
Cost Items Unit Sugarcane Banagrass
1. Land Preparation $/acre/year $292.84 $34.94
2. Planting $/acre/year $28.94 $1.66
3. Field Operations
Non-Irrigation Costs $/acre/year 237.86 328.50
Irrigation $/acre/year 601.61 410.15
4. Harvesting $/acre/year $290.07 $277.23
5. Other Operations $/acre/year $0 $282.92
6. Operating Overhead $/acre/year $145.13 $155.95
Total Costs $/acre/year $1,596.46 $1,715.40
Fixed Cost $/acre/year $159.65 $76.09
Total Variable Cost $/acre/year $1,436.81 $1,639.31
A. Feedstock Production
Primary Production Tons/year 52 (wet) 37 (dry)
Gross Revenue $/acre/year $1,780.84 $3,102.83
Net Revenue (per acre) $/acre/year $184.38 $1,387.42
B. Production of Ethanol
Total Processing Cost $/acre/year $480.15 $4,025.60
Total Production Cost $/acre/year $2,320.12 $5,741.00
Gross Revenue (ethanol) $/acre/year $2,916.24 $7,120.35
Net Revenue (ethanol) $/acre/year $474.45 $1,379.35
Feedstock Cost of Ethanol $/1,000 Btu $0.029 $0.008
Feedstock Cost of Ethanol $/gallon $0.94 $0.58
Breakeven Price of Feedstock $/ton $65.30 $46.36
Breakeven Price of Ethanol $/gallon $2.13 $1.94
The economics of both the sugarcane and Banagrass cases under irrigation show
unambiguous improvements relative to the rainfed economics. The net revenue for
sugarcane however remains lower than for Banagrass, making it likely that Banagrass
could be a more attractive route for maximizing the production of cellulosic ethanol in
Hawai’i of the projected high yields of Banagrass can be achieved.
A comparison of the production and harvesting costs for sugarcane and Banagrass
can be seen in Figure 6-5. In both cases, the breakeven price of ethanol is lower in the
irrigated case when compared to the rainfed cost. This is due to the lower harvest cost
from the greater yield of feedstock per acre.
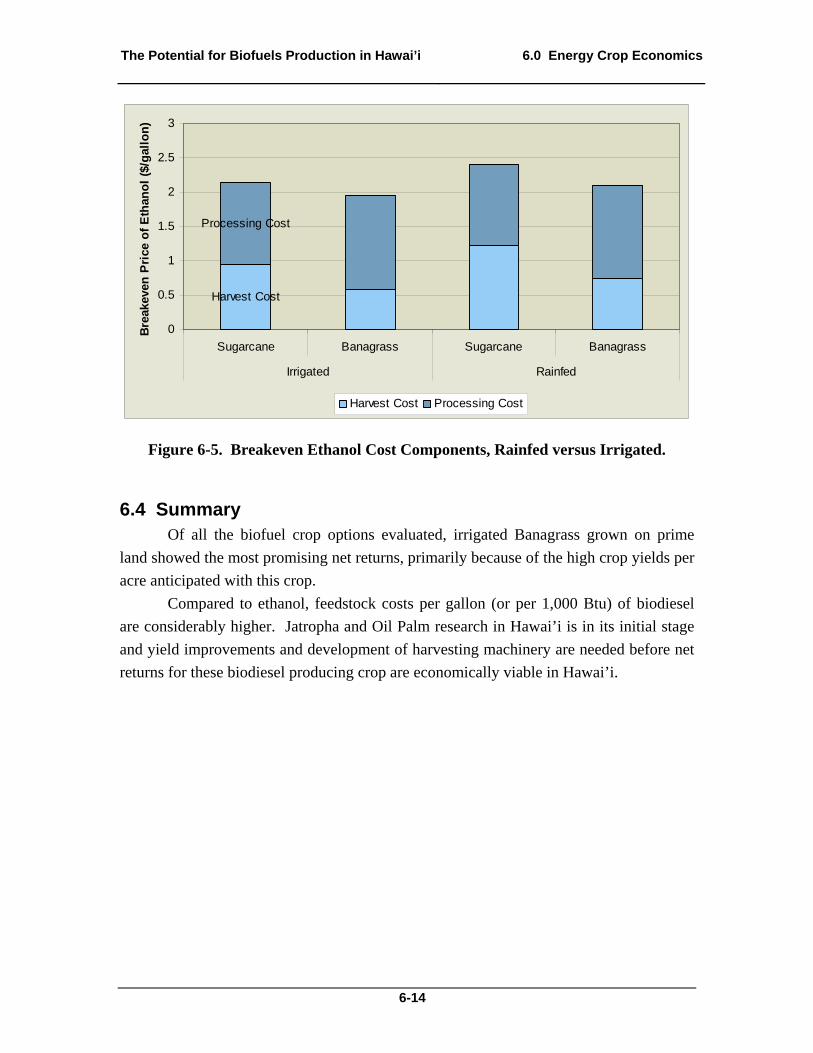
The Potential for Biofuels Production in Hawai’i 6.0 Energy Crop Economics
6-14
Harvest Cost
Processing Cost
0
0.5
1
1.5
2
2.5
3
Sugarcane Banagrass Sugarcane Banagrass
Irrigated Rainfed
Bre
akev
en P
rice
of
Eth
ano
l ($
/gal
lon
)
Harvest Cost Processing Cost
Figure 6-5. Breakeven Ethanol Cost Components, Rainfed versus Irrigated.
6.4 Summary Of all the biofuel crop options evaluated, irrigated Banagrass grown on prime
land showed the most promising net returns, primarily because of the high crop yields per
acre anticipated with this crop.
Compared to ethanol, feedstock costs per gallon (or per 1,000 Btu) of biodiesel
are considerably higher. Jatropha and Oil Palm research in Hawai’i is in its initial stage
and yield improvements and development of harvesting machinery are needed before net
returns for these biodiesel producing crop are economically viable in Hawai’i.

The Potential for Biofuels Production in Hawai’i
7.0 Emerging and Innovative Options for Biofuel Production
7-1
7.0 Emerging and Innovative Options for Biofuel Production
There are a number of emerging strategies and crop alternatives that offer promise
for biofuels production in Hawai’i. These include alternatives such as:
Selection and development of new crop species.
Microalgae production.
Research to improve existing crop yields.
Integrated “biorefinery” approaches that produce high value chemicals and fuels.
Strategies to produce food/feed and fuel from common acreage.
Multidimensional ecotourism or agritourism approaches linked to sustainable bioenergy farms and processing facilities.
These options are in various stages of development, requiring further research to
determine their full potential and viability. Highlights of these alternatives are
summarized below.
7.1 New Crop Alternatives In addition to the crops evaluated in detail in this study, there are other crops
which have the potential to play a role in Hawaii’s bioenergy future. The most notable of
these alternative crops are sweet sorghum and algae.
Sorghum is already grown commercially to produce food, fiber, and animal feed
around the world. There are several varieties of sorghum but many strains are well suited
to hot and arid regions that are not suitable for other forms of agriculture. In addition,
sorghum can produce high biomass yields, and up to three harvests per year may be
achievable in Hawaii’s climate.
Sweet sorghum is seen by organizations such as Hawaii BioEnergy LLC as
having very strong potential as an energy crop in Hawai’i. Since the plant readily
produces seeds for propagation, efforts to improve yields through plant selection
techniques should be able to progress rapidly. Similar to sugarcane, conventional
conversion options (or conventional, combined with advanced conversion options), could
be used to convert the sugar and as well as the fiber from sweet sorghum into co-products
of biofuel and electricity.
7.2 Microalgae Microalgae is one alternative crop that has been identified for its interesting
characteristics and biofuel production potential. With funding from the U.S. Department
The Potential for Biofuels Production in Hawai’i
7.0 Emerging and Innovative Options for Biofuel Production
7-2
of Energy (DOE), the National Renewable Energy Laboratory (NREL) engaged in algae
to biofuel research from the late 1970’s through the mid 1990’s. In recent years with the
volatility of petroleum based fuels and increasing concerns about climate change, this
work has been revisited and has gained interest from numerous organizations, including
major petroleum companies such as Chevron and Shell.
7.2.1 The Potential for Microalgae
There are a number of characteristics that make algae attractive as a potential
feedstock for the production of biofuels. One of the major advantages of algae is that it
does not compete directly for land and resources that could otherwise be used to grow
crops for food. Algae can survive in water with high salt content and use water that
would otherwise be deemed unusable. With recent controversies regarding the use of
agricultural land to produce crops for biofuels, these traits offer a significant advantage
over traditional oil seed crops for biofuels production.
High projected yields per acre are another reason that algae has been identified as
an attractive feedstock for biofuels production. Fast growth rates and high oil content
mean that algae can potentially produce 10 times or more lipids (oils) per acre than
soybeans or other oil seed crops. With continued development, it may be possible to
produce algae that has up to 70 percent of its mass in the form of usable oils, and this
combined with the fast growth rates lead to a high biological efficiency. Current
projections estimate that 6,000 to 15,000 gallons of biofuel per acre of algae may be
achievable.
7.2.2 Algae to Biofuels Technology Development
A primary challenge facing biofuels production from algae is economic.
Research is underway to identify the most appropriate strains. Work also continues on
refining methods for extracting and processing the oils. Although the process of making
biofuels from algae is already known and proven, there are obstacles that need to be
overcome before the process can be implemented on a commercial scale
Algae is already grown commercially in some parts of the world; primarily for the
production of food, dyes and pharmaceuticals. Open systems such as raceway-type
ponds have commonly been used in the cultivation of algae for these types of operations.
However, open systems can be susceptible to contamination by invasive strains of algae
or other microorganisms. This tends to limit the types of algae that can be effectively
cultivated in open ponds and raceways. For this reason, closed systems such as
photobioreactors (PBR) have been investigated for the production of algae for biofuels.
PBRs are transparent vessels which allow light in and essentially act like a greenhouse
The Potential for Biofuels Production in Hawai’i
7.0 Emerging and Innovative Options for Biofuel Production
7-3
preventing contamination and water losses due to evaporation. However, capital cost for
these closed systems are much higher comparatively than open systems and at this time it
appears unlikely that these systems will be economical in the near term. It may be more
likely that advances in breeding and genetics will lead to more robust strains where
closed systems are not needed.
It is clear that before algae-to-biofuel production sees widespread
commercialization there is significant research and development that still needs to be
done. Some of the main areas of current investigation include:
Faster growth, higher biological efficiency.
Resistance to biological attack.
Wider ambient growing conditions.
Higher percent of total biomass as oil.
Reduced water and nutrient requirements.
In addition, there are some novel approaches to algae cultivation still being
investigated and developed. One concept that has gained attention is the idea of using
algae to sequester carbon dioxide emissions. Since carbon dioxide is required for algae
to grow, the opportunity exists to use algae to capture carbon dioxide emitted from the
stack of a fossil fuel fired power plant.
7.2.3 Microalgae in Hawai’i
Hawai’i appears to be well positioned to emerge as a leader in the research,
development and production of biofuels from algae. The state’s climate is ideal for algae
aquaculture and the state’s dependence on imported liquid transportation fuels makes it a
promising place for marketing and developing new biofuels technologies. Several
organizations including large multinational energy companies have been involved with
the development of demonstration projects in Hawai’i.
HR BioPetroleum has partnered with a variety of companies including Royal
Dutch Shell and subsidiaries of Hawai’ian Electric Industries to develop technologies for
the commercial scale cultivation of algae for biofuels. One of the primary goals for HR
BioPetroleum is to identify strains ideal for oil production. In 2007, HR BioPetroleum
partnered with Royal Dutch Shell on a two-year demonstration project to grow 6 acres of
algae. In addition, HR BioPetroleum has intentions of developing a large scale
production facility on Maui. In July of 2009, HR BioPetroleum announced plans that it
would work with Alexander & Baldwin, Inc., Hawai’ian Electric Company and Maui
Electric Company to develop a commercial scale algae production facility. Alexander &
Baldwin, Inc. will provide land next to Maui Electric’s Ma’alaea Power Plant so that
stack gasses produced at the plant can be used to supply carbon dioxide to the algae. At

The Potential for Biofuels Production in Hawai’i
7.0 Emerging and Innovative Options for Biofuel Production
7-4
the time the announcement was made, predictions stated that the facility could be
operational as early as 2011.
Khuehnle AgroSystems is another Hawai’ian company involved in algae research.
The company has worked alongside HR BioPetroleum using natural and genetic
modification techniques to create customized strands specifically for biofuels production.
Two other companies Imperium Renewables Hawai’i and Kai BioEnergy Corp
have also announced plans for algae to biodiesel facilities in Hawai’i. Imperium
Renewables Hawai’i has announced plans to develop and build a $90 million biodiesel
plant in Kawolei. The facility will be adjacent to new a HECO power plant that will use
the fuel produced at the new biodiesel facility. Kai BioEnergy has announced plans to
develop a biodiesel from microalgae process on the Big Island.
Land availability for thousands of acres of algae ponds in Hawai’i would clearly
present some unique challenges in comparison to conventional crop production. As
noted above, commercially algae production strategies are expected use raceway ponds
for cultivation, which require level horizontal surfaces; this could be a challenge in
Hawai’i since much of the terrain is slopped.
7.3 Improvement of Existing Crops The science of agriculture is continually advancing. As crops selected for biofuel
production are grown in greater quantities, it is likely that progress will be made in the
science of these crops as well. Methods of crop production are also likely to improve
over time. Selected breeding and genetic modification techniques give agriculturalists
great control over trait selection and expression. Over time this may produce greater
yields or enhance the quantity or characteristics of the most desirable parts of the crop.
Even with established crops there may be a benefit to changing production
strategies as technology and markets for biofuels develop. One example of this is energy
cane, which is a variation of sugar cane that would produce greater overall cellulosic
biomass yields than plant varieties used for conventional sugar production. The
increased fiber yields would be attractive for bioenergy applications, either as feedstock
that could be converted to liquid fuel in advanced conversion systems, or as feedstock
that could be use for electric power production (using conventional boiler technology,
pyrolysis, or gasification). Energy cane would also produce significant amounts of easily
fermentable sugars that could be recovered for ethanol production.
7.4 Biorefineries The primary goal of refining is to add value to raw feedstock materials by
reorganizing elements into useful products. Traditional petrochemical refining utilizes
The Potential for Biofuels Production in Hawai’i
7.0 Emerging and Innovative Options for Biofuel Production
7-5
the mixture of carbohydrates found in crude oil and performs a variety of cracking and
separation processes to produce multiple streams of fuels and commodity chemicals. The
petrochemical refining model has evolved over the last century and markets for fuels and
commodities chemicals (such as those used to produce plastics) have evolved with the
refining process.
With biorefining the goals are the same, however since the structure and
properties of biomass differ significantly from that of fossil fuels, the processes and end
products will also vary. Traditional petrochemical refining relies primarily on
thermochemical processes. Biorefineries could use either biological processes such as
fermentation and enzymatic hydrolysis, or thermal processes such as gasification or
pyrolysis to breakdown biomass feedstocks and reassemble the constituents into various
products. Since there are a wide variety of biomass feedstocks and conversion processes
options, the type of products that could be produced at biorefineries is quite varied.
While the products of petrochemical refining are generally limited to fuels, energy and
chemicals, biorefineries are could produce food, animal feed or fertilizers in addition to
these products.
There are a number of visions of biorefining of different potential feedstocks, but
all produce a variety of different products and have the goal of maximizing the value
commodities produced and minimizing wastes. Hawai’ian company HR BioPetroleum
presents one vision of biorefining for algae feedstocks. Figure 7-1 below shows the
possible inputs and outputs for an algae based biorefinery operation.

The Potential for Biofuels Production in Hawai’i
7.0 Emerging and Innovative Options for Biofuel Production
7-6
Figure 7-1. Input and Output Streams for a Conceptualized Algae Fed Biorefinery (Source HR BioPetroleum).
Though the potential for biorefining is great, there are still numerous challenges
that must be worked through. The primary challenge is making fuel and other products
from biomass economically. To many consumers this translates into an expectation that
fuels and chemicals produced from biomass will have comparable pricing to their
petroleum-based predecessors.
A variety of factors can tend to put upward pressure on biomass feedstock costs in
comparison to fossil fuel costs. Biomass is more geographically dispersed, lower in
energy density, and there can be seasonal variations in the availability that are not found
with fossil fuels. In addition, the properties of biomass can vary significantly by type and
region, thus making it possible that different processes will need to be developed for
specific biomass feedstocks.
All these potential obstacles to developing a biobased economy reinforce the
need to seek high material utilization and to create high value products to the extent
possible. Both of these are goals for biorefining models. Just as petrochemical refining
evolved over the course of the 20th century, a similar evolution could occur in biorefining
over the course of the 21st century. While biorefining is in many ways still in its infancy,
models for biorefining are starting to take shape. Large agricultural processing plants,

The Potential for Biofuels Production in Hawai’i
7.0 Emerging and Innovative Options for Biofuel Production
7-7
such as those used to mill corn, process soybeans or produce ethanol, are adding
secondary processes to utilize fractions of the plant that were previously considered waste
materials. For example, some large ethanol plants have added anaerobic digestion or
gasification processes to recover energy from distiller’s grain, where the demand for this
co-product saturates animal feed markets.
The development of integrated biorefineries is seen as fundamental to building a
new bioeconomy. For this reason several government agencies have programs in place to
help advance the science of biorefining. Much of this development has been organized
through the US Department of Energy (DOE). The DOE’s activities to support
biorefining include:
Provided funding to the National Renewable Energy Laboratory (NREL) and
other public institutions to improve and develop new biochemical processes.
Collaborated on a multi-year effort with Cargill Inc. and Codexis, Inc. on the
development of technology to produce 3-hydroxypropionic acid (3-HP) from
biomass. 3-HP is seen as having significant potential as a chemical
intermediary for the production of a variety of commodity chemicals.
Provided funding for demonstration scale cellulosic ethanol technology at an
existing ethanol production facility. Operation of the cellulosic ethanol
demonstration facility is expected to begin in 2011.
The U.S. Department of Agriculture has also been involved with supporting the
development of biorefineries. The USDA Rural Development Program has established a
Biorefinery Assistance Program that will guarantee loans for up to $250 million dollars
for the development of integrated biorefinery facilities.
The Hawai’i – DOE Clean Energy Initiative could provide a framework for
supporting and fostering research, development, and demonstration of biorefinery
systems and applications in Hawaii.
7.5 Multi Crop Strategies Integrated Food and Fuel Production The practice of rotating or sequencing dissimilar crops on the same plot of
agricultural land has been used by farmers for centuries to prevent declines in soil
fertility. With these long standing principles in mind, new models of integrated food and
fuel production are beginning to emerge that have the potential to increase agricultural
yields and better serve the needs of the environment in Hawai’i.
Alley cropping is one emerging strategy that has potential for integrated food and
fuel production. With alley cropping, agricultural or horticultural crops are grown in-
between rows of trees or shrubs. This method of farming offers a number of potential

The Potential for Biofuels Production in Hawai’i
7.0 Emerging and Innovative Options for Biofuel Production
7-8
advantages over traditional industrialized agriculture where similar crops are planted over
a large area. Figure 7-2 below shows an example of alley cropping. Figure 7-3 below is
a diagram showing alley cropping with integrated animal grazing.
Figure 7-2. Alley Cropping of Herbaceous Plants with Trees (Source: USDA).
Figure 7-3. Alley Cropping with Integrated Grazing (Source: USDA).

The Potential for Biofuels Production in Hawai’i
7.0 Emerging and Innovative Options for Biofuel Production
7-9
Alley cropping has the potential to be a win-win situation, benefiting landowners
and the environment alike. For landowners there is a potential to diversify income
sources, which could make producers more resilient to market downturns or crop failure.
Also, since different crops are harvested at different times of the year, revenue is
generated more frequently. There are also opportunities to get greater utilization of idle
growing areas. This is especially true in cases where tree crops will take years to mature.
Idle areas in-between immature trees can be cultivated while other crops establish
themselves. Landowners also benefit from enhance land quality that results from the
environmental benefits of alley cropping.
Many of the potential environmental benefits of alley cropping are tied to
incorporating greater biodiversity into a given region. Increased biodiversity can reduce
the chances of pests or pathogens buildup that target a particular crop. A variety of plant
species also means there is a greater diversity of nutrient mechanisms present in a given
ecosystem. Different plants remove and contribute different mixtures of nutrients to the
soil. This can lead to beneficial relationships between complimentary plants. In Hawai’i
for example, Leucaena is known for its ability to fix atmospheric nitrogen into the soil.
This ability is noteworthy especially since most plants deplete nitrogen from the soil. In
addition to producing woody material as feedstock for energy uses, Leucaena is also a
good forage crop for animals -- all animals favor Leucaena, one of the few woody
tropical legumes that is highly digestible and relatively non-toxic. Other tropical
leguminous trees that could be researched include kiawe, haole koa, monkeypod and koa.
Even when plants rely on the same nutrients, alley cropping does not necessarily
lead to direct competition for nutrients or other resources such as water. Differences in
root penetrations for different plants mean that resources can be pulled from different
layers in the soil. This leads to greater water utilization and also helps with soil structure
and prevention of erosion. Furthermore, deep rooted plants such as trees can pull
nutrients from lower levels in the soil which end up in the foliage. As leaves fall to the
ground, the nutrients return to the top of the soil and are accessible to plants with lesser
root penetrations.
These opportunities for complimentary relationships between plants could lead to
increased yields and higher income farming practices in Hawai’i, offering the potential
for integrated food and fuel production from cropland. Large areas of land, such as
pastureland in Hawai’i, provide very low economic returns per acre to land owners;
multi-crop strategies for integrated fuel, fiber, food and/or forage production could offer
win-win solutions for economic development and energy independence in Hawai’i.

The Potential for Biofuels Production in Hawai’i
7.0 Emerging and Innovative Options for Biofuel Production
7-10
7.6 Tourism The incentives for conserving Hawaii’s natural areas are of clear economic
importance. While new models of fuel production and agriculture may arise to help
advance Hawaii’s energy independence, new models for tourism may develop alongside
these industries. Innovation that may help Hawai’i move towards energy independence
may also be a draw for people to the state and enhance the tourism experience.
7.6.1 Ecotourism
There is already a movement to promote more environmentally aware forms of
travel. Ecotourism is one such type of travel that has been promoted in relatively
undeveloped areas of Costa Rica, Ecuador, Nepal, Kenya and Madagascar. The ideas of
ecotourism are based around the following principals:
Minimize environmental impact.
Increase environmental awareness.
Provide direct benefits for conservation.
Provide financial benefits and empowerment for local people.
Respects local cultures.
Supports human rights and demographic movements.
The ecotourism model demonstrates that there is demand for travel which is
considered ecologically sensitive, which might be adaptable to Hawaii’s well established
tourism industry. Progress in Hawai’i toward developing a biofuels industry that is based
on sustainable feedstock supply production and conversion may be adaptable to
ecotourism principals and lead to enhanced tourism experiences and strengthening of
tourism revenues in Hawai’i.
7.6.2 Agritourism
Developing a new biofuels industry in Hawai’i would bring changes to agriculture
on the island. It is possible that these changes could encourage a new form of
agritourism with a focus on sustainability. Innovation towards creating a biobased
economy could make Hawai’i a destination for those interested in sustainable
development. Visitors could tour commercial farms and be given opportunities to see
how biofuels are grown and processed.

The Potential for Biofuels Production in Hawai’i
7.0 Emerging and Innovative Options for Biofuel Production
7-11
7.7 Plug-In Hybrid Electrics Though the primary focus of this report is on liquid biofuel production, the
emergence of plug-in hybrid electric vehicles (PHEV) in the marketplace provides
another potential pathway for bioenergy to offset petroleum based transportation fuels.
PHEVs are similar to hybrid electric vehicles (HEV) whose market share has grown
steadily for the last several years. However, PHEVs have larger batteries which can be
charged by connecting the vehicle to an electrical outlet. This means that electricity
generated from biomass could be used to displace petroleum transportation fuels.
There are a number of potential advantages to utilizing electricity for
transportation. First, PHEVs would be able to draw energy from the full portfolio of
generation capacity including other renewables such as wind, solar, and geothermal.
Since PHEVs are likely to be charged at off peak times like at night, PHEVs would likely
not be as impacted as much by the availability of solar energy. However, resources such
as wind and geothermal are often available at night when demand is low, thus PHEVs
could help to increase utilization of these resources during off peak times. The use of
biomass for power production, with its intrinsic ability to store energy in the form of
feedstock, could allow Hawai’i to take advantage of the full portfolio of renewable
generation to help insulate PHEV from disruptions in the supply of electricity.
Though the potential benefits of PHEV clearly could make the technology
attractive in Hawai’i, it is important to acknowledge that there are obstacles to the
widespread usage of PHEVs. A key obstacle is the cost of batteries which are critical to
the success of the technology. Since the price of batteries is a major cost component of
PHEV the cost of the vehicle will likely be directly related to amount of storage on board
and the distance the car can travel before relying on liquid fuels. However, one study
published by the Electric Power Research Institute (EPRI) in 2004 concluded that PHEVs
have already achieved comparative lifecycle costs with traditional vehicles based on their
lower fuel costs. In addition, battery prices are expected to decrease significantly as
production levels increase.
The need for a new fleet of vehicles capable of using electricity is clearly a major
hurdle for this mode of transportation. Since the market value of electricity is generally
higher in Hawai’i than in typical mainland U.S. locations, the profitability and overall
societal value of using biomass resources for electricity versus liquid fuels production is a
more complex choice in terms of maximizing value for businesses and for the overall
State. The viability of producing electricity and/or liquid fuels will generally depend on
project-specific analyses in determining the greatest value for producers and the state of
Hawai’i. It is quite possible that the most attractive approach would be to include the
integrated production of biofuels and electricity at the same site.

The Potential for Biofuels Production in Hawai’i
8.0 State and National Policies and Incentives
8-1
8.0 State and National Policies and Incentives
There are a number of incentives on both the national and state levels that
encourage biofuel production. Since biofuels are currently more expensive than
petroleum fuels, these policies and incentives are important for the continual
development of the biofuels industry. This section discusses some of the more important
government incentives and opportunities for new incentives.
8.1 Federal Government Incentives The Energy Policy Act of 2005 called for a renewable fuel standard and the U.S.
Environmental Protection Agency set the rules outlining compliance for refiners,
blenders and importers to meet the 2.78 volume percent renewable fuels requirement of
the Act.
In 2007, H.R. 6, The Energy Independence and Security Act increased the
renewable fuel standard to nine billion gallons in 2008 and progressively advances it to
36 billion gallons in the year 2022. By the year 2022, twenty-one billion gallons of the
total is required to be from advanced biofuels, such as cellulosic ethanol.
The passage of the American Recovery and Reinvestment Act (ARRA, also
known as the “Stimulus Bill”) in 2009 provided additional incentives to the development
of biofuels in the US. The majority of the incentives are in the form of research and
development grants as well as loan guarantees for new projects. The direct tax incentives
and usage requirements for biofuels remain unchanged. The main biofuels provisions in
ARRA are the following:
Advanced Energy Facility Investment Credit: Investment in facilities that
produce equipment used in renewable energy and biofuel production is
eligible for a 30 percent tax credit.
Federal Loan Guarantees: $6 billion in federal loan guarantees are eligible on
a competitive basis for advanced biofuel production that is in the development
stage and has the promise to reduce greenhouse gas emissions relative to other
transportation fuels.
Research Grants: The DOE has developed plans to award nearly $800 million
in federal research dollars to biofuel projects in the following areas:
integrated biorefineries at the pilot and demonstration scales, commercial
scale biorefineries, fundamental research of algae based biofuels, pilot plants,
and demonstrations of infrastructure compatible biofuels, and finally, ethanol
research.

The Potential for Biofuels Production in Hawai’i
8.0 State and National Policies and Incentives
8-2
The intent of this support is to spur development of advanced biofuels projects so
that they can reach commercial maturity in a shorter period of time. Technologies that
are already commercially mature, such as conventional ethanol and biodiesel production
routes, would benefit little from these provisions at this time.
Table 8-1. U.S. Renewable Fuels Standard.
Calendar Year Applicable Volume of Renewable Fuel
(billions of gallons)
Significant Markers
2006 4.0
2007 4.7
2008 9.0 5.4 (Previous Standard)
2009 11.1
2010 12.95
2011 13.95
2012 15.2 7.5 (Previous Standard)
2013 16.55
2014 18.15
2015 20.5
2016 22.25 Starting in 2016 all increases must be met with feedstock
other than corn starch
2017 24
2018 25
2019 28
2020 30
2021 33
2022 36
Source: U. S. Senate Committee on Energy & Natural Resources, H.R. 6 Energy Bill Summary Fact Sheet.
8.1.1 Agricultural Policy and Incentives
On January 1, 2008, unrestricted sugar trade began between the U.S. and Mexico
under provisions of the North American Free Trade Agreement (NAFTA). Mexico
produced a surplus of approximately 350,000 tons of sugar in 2007. Mexican sugar cane
is among the most expensive in the world, due partly to high transport costs. In 2008
NAFTA and rulings by the World Trade organization will require that Mexico allow
inexpensive corn syrup from the U.S. into its markets further impacting sugar pricing and

The Potential for Biofuels Production in Hawai’i
8.0 State and National Policies and Incentives
8-3
production.65 As recently as 1993 Mexico produced 40 million tons of raw sugar, but
trade liberalization, price controls and credit costs have limited production66 to
approximately 5.6 million metric tons in 2006/07.67
A new USDA Biomass Crop Assistance Program provides eligible biomass
feedstock suppliers with a matching dollar for dollar payment up to $45 for each ton of
feedstock. This program is summarized in the text box below.
8.1.2 Biodiesel and Ethanol Tax Credit
The Energy Policy Act of 2005 (Section 1344) extended the tax credit for
biodiesel producers though 2008. The credit is $1.00 per gallon of agri-biodiesel and
$0.50 per gallon of waste grease biodiesel. IRS Notice 2007-37 permits the co-processing
of biomass with petroleum feed stocks, allowing oil companies to receive the credit by
65 San Diego Union-Tribune, Reuters, Mica Rosenberg and Frank Jack Daniel, December 11, 2007. 66 Federal Research Division of the Library of Congress, Country Studies, 1986 to 1998. 67 Sugarbeet Grower Magazine, Fast Approaching: January 1, 2008, March 2007issue.
USDA Biomass Crop Assistance Program The Biomass Crop Assistance Program (BCAP) was authorized by Title IX of the Farm Security and Rural Investment Act of 2002, as amended by Title IX of the Food, Conservation, and Energy of 2008 Act (2008 Farm Bill). BCAP:
Assists agricultural and forest land owners and operators with matching payments for the amount paid for the collection, harvest, storage and transportation (CHST) of eligible material by a qualified Biomass Conversion Facility (BCF).
Supports establishing and producing eligible crops for the conversion to bioenergy through project areas and on contract acreage up to 5 years for annual and non-woody perennial crops or up to 15 years for woody perennial crops. This provision will be implemented in the future.
The CHST Matching Payment Program will provide eligible material owners matching payments for the sale and delivery of eligible material to a CHST-qualified BCF. These payments will be available to eligible material owners at the rate of $1 for each $1 per dry ton paid by the CHST-qualified BCF to the eligible material owners, limited to a maximum of $45 per dry ton and limited to a 2-year payment duration.
On May 5, 2009, President Obama issued a Presidential directive to aggressively accelerate the investment in and production of biofuels. The directive included a directive that Secretary Vilsack take steps to the extent permitted by law to expedite and increase production of and investment in biofuel development efforts which includes issuance of guidance and support for collection, harvest, storage, and transportation assistance of eligible materials for use in biomass conversion facilities.
On June 11, 2009, the USDA Commodity Credit Corporation published a Notice of Funds Availability (NOFA) announcing the implementation of the 2009-CHST Matching Payment Program. http://www.fsa.usda.gov/FSA/webapp?area=home&subject=ener&topic=bcap

The Potential for Biofuels Production in Hawai’i
8.0 State and National Policies and Incentives
8-4
making biodiesel in their refinery operations.68 The Energy Policy Act of 2005, Section
1345 allows a $0.10 per gallon tax credit to agri-biodiesel producers for up to 15 million
gallons. To be eligible, a producer must make less than 60 million gallons per year.
The Volumetric Ethanol Excise Tax Credit (VEETC), which provides ethanol
blenders/retailers with a $.51 per pure gallon tax credit, is in effect until 2010. Small
ethanol producers are now defined (by the Energy Policy Act of 2005, Section 1347) as
producers of up to sixty million gallons per year, up from 30 million gallons per year.
8.1.3 Alternative Fuel Infrastructure Tax Credit
Section 1342 of the Energy Policy Act of 2005 provides for a tax credit equal to
30 percent of the cost of alternative refueling property, up to $30,000 for business
property. The credit is intended to financially assist those who bear extra costs of
refueling station using alternative fuels including E85 and mixtures of B20 or more. The
credit is set to expire December 31, 2009.
8.1.4 Alternative Motor Vehicle Credit
Light-duty lean burn diesel vehicles are eligible for a tax credit equal to 50
percent of the incremental cost of the vehicle per Section 1341 of the Energy Policy Act
of 2005. IRS Notice 2006-54 establishes the procedures for manufacturers to certify to
the IRS that a vehicle meets the requirements to claim the credit.
8.1.5 Clean School Bus USA
This is a Federal program of cost shared grants to help school districts implement
pollution reduction measures involving their diesel bus fleet, including using biodiesel.
The program is funded at $55 million for both 2006 and 2007 and is authorized for 2009
and 2010.
8.1.6 Alternative Fuel Vehicles CAFE Credit
Section 772 of the Energy Policy Act of 2005 extended the CAFE (Corporate
Average Fuel Economy) credit given to alternative fueled vehicles through 2010. This
incentive is up to 1.2 miles per gallon toward an automobile manufacturer’s average fuel
economy which helps it avoid penalties.
68 Biodiesel Magazine, IRS Ruling on Renewable Diesel Tax Credit Fuels Debate. June 2007.

The Potential for Biofuels Production in Hawai’i
8.0 State and National Policies and Incentives
8-5
8.1.7 Cellulosic Biomass Ethanol and Municipal Solid Waste Loan
Guarantee Program
The U.S. Department of Energy can issue loan guarantees to private lending
institutions for up to 80 percent of the cost to construct ethanol production facilities and
commercial products from cellulosic, municipal waste, and/or sugar cane. The loans
must be for facility construction and the project must have at least 30 million gallons of
capacity.
8.2 Hawai’i State Government Incentives
8.2.1 Hawai’i/U.S. DOE Partnership
On January 28, 2008 the U.S. Department of Energy and the State of Hawai’i
signed a memorandum of understanding to set up working groups on efficiency,
generation, delivery, and transportation to develop a strategic implementation plan by
June, 2008 toward the goal of producing 70 percent of Hawaii’s energy needs from
renewable sources by 2030. DOE is committing technical and policy expertise to the
project. Using local crops for producing fuel and electricity is a stated goal of the effort.
8.2.2 Alternative Fuel Development Support
The Hawai’i alternative fuel standard, enacted by Act 240 (SLH 2006) is: 10
percent of highway fuel use to be alternative fuels by 2010, 15 percent by 2015 and 20
percent by 2020. Ethanol produced from cellulosic materials is considered the equivalent
of 2.5 gallons of non-cellulosic ethanol for the purposed of meeting this standard.69
8.2.3 State Vehicle Acquisition Requirements to Reduce Petroleum
Dependency
On June 25, 2009, Act 156 was enacted, under which the procurement policy for
all Hawai’i agencies purchasing or leasing light-duty motor vehicles shall be to reduce
dependence on petroleum for transportation energy. Priority for selecting vehicles is to
be as follows:
(1) Electric or plug-in hybrid electric vehicles;
(2) Hydrogen or fuel cell vehicles;
(3) Other alternative fuel vehicles;
(4) Hybrid electric vehicles; and
69 U.S. Department of Energy Alternative Fuels & Advanced Vehicles Data Center, http://www.eere.energy.gov/afdc/progs/view_ind_mtx.php/tech/ALLAF/HI/0 .
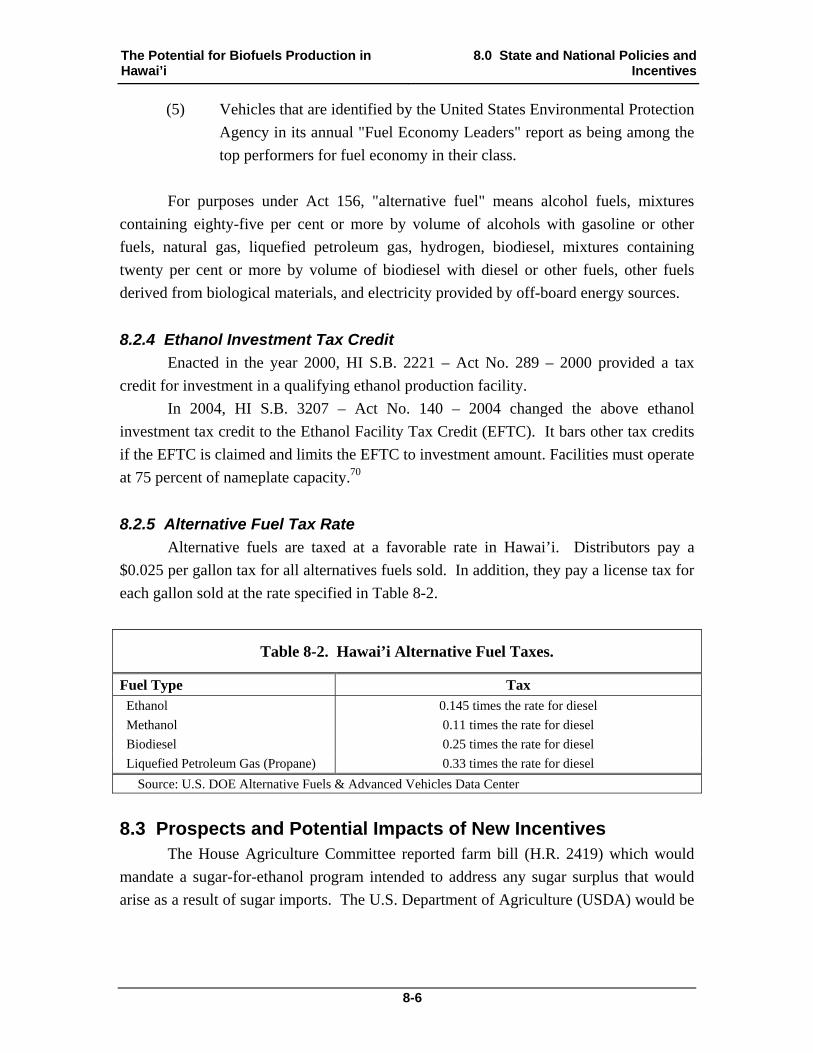
The Potential for Biofuels Production in Hawai’i
8.0 State and National Policies and Incentives
8-6
(5) Vehicles that are identified by the United States Environmental Protection
Agency in its annual "Fuel Economy Leaders" report as being among the
top performers for fuel economy in their class.
For purposes under Act 156, "alternative fuel" means alcohol fuels, mixtures
containing eighty-five per cent or more by volume of alcohols with gasoline or other
fuels, natural gas, liquefied petroleum gas, hydrogen, biodiesel, mixtures containing
twenty per cent or more by volume of biodiesel with diesel or other fuels, other fuels
derived from biological materials, and electricity provided by off-board energy sources.
8.2.4 Ethanol Investment Tax Credit
Enacted in the year 2000, HI S.B. 2221 – Act No. 289 – 2000 provided a tax
credit for investment in a qualifying ethanol production facility.
In 2004, HI S.B. 3207 – Act No. 140 – 2004 changed the above ethanol
investment tax credit to the Ethanol Facility Tax Credit (EFTC). It bars other tax credits
if the EFTC is claimed and limits the EFTC to investment amount. Facilities must operate
at 75 percent of nameplate capacity.70
8.2.5 Alternative Fuel Tax Rate
Alternative fuels are taxed at a favorable rate in Hawai’i. Distributors pay a
$0.025 per gallon tax for all alternatives fuels sold. In addition, they pay a license tax for
each gallon sold at the rate specified in Table 8-2.
Table 8-2. Hawai’i Alternative Fuel Taxes.
Fuel Type Tax Ethanol 0.145 times the rate for diesel
Methanol 0.11 times the rate for diesel
Biodiesel 0.25 times the rate for diesel
Liquefied Petroleum Gas (Propane) 0.33 times the rate for diesel
Source: U.S. DOE Alternative Fuels & Advanced Vehicles Data Center
8.3 Prospects and Potential Impacts of New Incentives The House Agriculture Committee reported farm bill (H.R. 2419) which would
mandate a sugar-for-ethanol program intended to address any sugar surplus that would
arise as a result of sugar imports. The U.S. Department of Agriculture (USDA) would be

The Potential for Biofuels Production in Hawai’i
8.0 State and National Policies and Incentives
8-7
required to purchase as much U.S.-produced sugar as necessary to maintain market prices
above established support levels. The purchased sugar would be sold to bioenergy
producers for processing into ethanol. H.R. 2419 has passed the U.S. House (July 2007)
and Senate (December 2007) with somewhat different versions and a conference
committee of Senators and Representatives has been meeting to work out differences in
the two versions. The Administration opposes limiting the USDA to disposing of sugar
only for ethanol production and prefers a no Federal cost sugar program.
NAFTA-designed free trade in sugar between the U.S. and Mexico just began
January 1, 2008 and the long term impact is uncertain. There is concern that inexpensive
corn syrup from the U.S. market will replace sugar in Mexican soft drinks and other
applications leaving either a devastated Mexican sugar industry long term or sales of
Mexican sugar to the U.S. market pushing prices down there.
8.4 Opportunities for New or Modified Incentives
8.4.1 High Occupancy Vehicle Lane Incentives
The SAFETEA-LU Transportation Act, passed in 2005, directed the EPA to issue
rulemaking regarding allowing single occupancy vehicles to use High Occupancy
Vehicle (HOV) lanes if they are certified to be “low emission and energy efficient”. On
May 24th, 2007 the EPA issued proposed rulemaking for public review. One of the
criteria for vehicle qualification would be that the vehicle be a “dedicated alternative fuel
vehicle”. If HOV programs are changed, the implementation would be by the U.S.
Department of Transportation and enforcement would be by individual states.
Contra-flow (HOV) lanes such as the Kalanianaole Highway‘s 0.6 miles and the
two-mile Nimitz Highway in Honolulu could be limited to vehicles that are energy
efficient and are dedicated alternative fuel vehicles.
8.4.2 New Renewable Fuels
Work is continuing on biobased fuels other than ethanol, biodiesel and hydrogen
that may be beneficial to Hawai`i. It may be advantageous for Hawai’i to develop, and
encourage Federal lawmakers to develop, incentives that encourage potentially
advantageous fuels that are currently in pre-commercial stages.
An example would be University of Wisconsin’s development of a process that
may enable more efficient mass production of DMF or 2.5-dimethyfuran. The fuel is
made from sugar, has energy content equal to gasoline (higher than ethanol) and is
70 Association of State Energy Research & Technology Transfer Institutions. Summary of State Incentives for Biofuels (Fall 2006).

The Potential for Biofuels Production in Hawai’i
8.0 State and National Policies and Incentives
8-8
insoluble to water in storage. Biobutanol is another example of a potential new fuel with
similar advantages, especially where a mix with gasoline is needed.

The Potential for Biofuels Production in Hawai’i 9.0 Summary of Results
9-1
9.0 Summary of Results
This report provides a means for understanding the biofuel production potential
from biomass waste residues and energy crops in the state of Hawai’i. It should be noted
that the estimates presented in this report often refer to maximum theoretical biofuel
production potential. This maximum potential would require using all identified lands
and waste materials appropriate for biofuel production. Since there are many competing
uses for agricultural land, these production levels are meant to provide a starting point in
understanding the potential for biofuel production in Hawai’i. It should be noted that
only a fraction of the total potential is needed to meet the desired displacements for 2010,
2015, and 2020 targets.
9.1 Biofuels Production Technologies Several biofuel production pathways were identified and characterized for this
report. Efforts were made to identify benefits and constraints of the currently commercial
and developing technologies that may play a role in Hawaii’s energy future. Though
there are a number of different biofuel conversion technologies currently under
development, practical estimates for yield, cost and availability for these developing
technologies are difficult to make at this time. For this reason, production estimates and
cost estimates evaluated for this report focused on conversion technologies for which
conversion and cost information has been the most thoroughly developed, which is for
ethanol and biodiesel production. Table 9-1 below shows the technologies that were used
to characterize and estimate Hawaii’s biofuel production potential, as well as the
feedstocks that can feed the associated conversion processes.
Several technologies are currently in research and development or demonstration
phases that offer the potential to create a variety of liquid transportation fuels from
biomass that more closely resemble petroleum based fuels including conventional diesel,
green gasoline, and green jet fuel. However, the performance and cost information
available for these options is generally at a more preliminary stage and is not particularly
reliable for projecting the costs and likely market penetration for these biofuels.

The Potential for Biofuels Production in Hawai’i 9.0 Summary of Results
9-2
Table 9-1. Commercial and Nearer Term Biomass Conversion Technology Summary.
Feedstock Type Conversion Pathway Product Commercialization
Status
Sugar
Sugarcane
Conventional Fermentation Ethanol Commercial Molasses
Sweet Sorghum*
Fiber
Banagrass
Enzymatic Hydrolysis and Fermentation or Thermochemical
Conversion Ethanol
Near Commercial; Demonstration Phase
Eucalyptus
Leucaena
Cellulosic wastes
Oil
Oil Palm
Transesterification Biodiesel Commercial Jatropha
Waste Fats, Vegetable Oil & Grease
Notes:
* Due to sparse data availability, sweet sorghum production potential was not investigated for this effort.
One factor that has an appreciable impact on the economics of biofuel production
is the scale of a production facility. This issue is of particular importance in Hawai’i
where geography imposes constraints on resource availability and transport of solid
biomass feedstocks. These constraints were taken into consideration in developing cost
estimates for biofuels production in Hawai’i. Detailed cost estimates for cellulosic
ethanol production recently updated by the National Renewable Energy Laboratory
(NREL) showed cellulosic ethanol conversion costs in the range of $0.92 per gallon (on a
levelized basis) by the year 2012 for large biochemical-based conversion facilities
designed to process 2,200 tons per day of biomass feedstock (NREL, 2009). By
comparison, the base case for this analysis uses a conversion cost estimate of $1.36 per
gallon for Hawai’i. This estimate adjusts for economy-of-scale issues with the
expectation that in Hawai’i, 500 to 800 tons per day may be a more likely scale for
facilities based on acreage and transport constraints. This conversion cost also factors in
some cautiousness with respect to progress in reducing advanced biofuel conversion
costs.

The Potential for Biofuels Production in Hawai’i 9.0 Summary of Results
9-3
9.2 Biofuels from Biomass Residues There are opportunities to significantly increase biofuel production in Hawai’i
using available biomass residues. Table 9-2 shows the potential for ethanol, biodiesel,
and methane production using Hawai’ian waste resources.
Table 9-2. Total Hawai’i Biofuel Potential from Waste.
Biofuel Type Feedstock Total Hawai’i Potential Ethanol Cellulosic wastes 90 million gallons/yr*
Ethanol Molasses 5 million gallons/yr
Biodiesel Waste oil 2.0 – 2.5 million gallons/yr
Hydrogen Landfill gas 290 million scf/yr**
Notes: * Represents a middle number common to both thermochemical and biochemical potentials. ** Assumes no waste is diverted from H-POWER.
From Table 9-2 it can be seen that the majority of available potential comes from
cellulosic wastes (municipal solid waste, sugar cane trash, and forestry residues). With
total 2007 gasoline consumption in Hawai’i at 477 million gallons per year (MGY),
ethanol from cellulosic wastes could be used to displace up to 12.5 percent of the current
fuel usage (on an equivalent gallons of gasoline basis).
To obtain the quantities of biomass resources that will be needed to meet the
combined future Hawai’i biofuel mandates for all transportation fuels; diesel, gasoline,
and (possibly) aviation fuel, producers will need to turn to energy crops in addition to
available Hawai’ian residues.
9.3 Land Availability In order to estimate energy crop production potential, the amount of land suitable
for energy crop production was investigated and estimated for this effort. Hawai’i has
about 300,000 acres of prime irrigated land and roughly 800,000 acres of non-prime
rainfed land which has been identified as appropriate for energy crop production. Since
the amount of available agricultural land in Hawai’i is not likely to increase in the future,
this is an important parameter for examining biomass production potential. New crops
and agricultural practices will likely lead to incremental increases in yield but the amount
of land available for production of crops will likely remain static or decrease with time as
development on the island continues. Table 9-3 shows prime and nonprime land for each
island.

The Potential for Biofuels Production in Hawai’i 9.0 Summary of Results
9-4
9.4 Biofuel Production from Energy Crops Information regarding land availability and theoretical crop yields were used to
develop an estimate of the theoretical production potential for energy crops. Table 9-4
below shows the maximum theoretical potential for each crop examined in this study. It
should be noted that the yield values displayed in Table 9-4 are not additive. Instead the
values in Table 9-4 assume that each crop is planted on all 300,000 acres of prime land
and 800,000 acres of nonprime land.
Table 9-4. Hawai’i Energy Crop Potential.
Non-prime Land Potential
Prime Land Potential Total Theoretical
Ethanol Crops (million tons/year) (million tons/year) (million tons/year)
Sugarcane 3.2* 11.2* 14.4*
Banagrass 3.7 9.4 13.1
Eucalyptus 3.6 2.8 6.4
Leucaena 1.2 3.2 4.4
Biodiesel Crops (million gal/year) (million gal/year) (million gal/year)
Oil Palm 32.4 66.3 98.7
Jatropha 16.1 62.0 78.1
Note:
( * ) Yields for sugarcane expressed in green or wet tons. All other values reported in bone tons. Moisture content for sugarcane can be approximated as 67 percent.
9.4.1 Biofuel Production Optimization
Analysis performed by the University of Hawai’i indicated that biomass yield
could be maximized by growing Banagrass in warmer/lower elevations and Eucalyptus in
cooler/higher elevations. In addition, it appears that these fiber crops are likely more
economically favorable over oil seed crops. Based on these results, fiber crops are
believed to offer the most attractive energy crop option for the state and for producers
alike. Table 9-5 shows theoretical biomass yields and resulting biofuel and energy
Table 9-3. Hawai’i Agricultural Lands by Island (acres).
Hawai’i Maui Molokai Kauai Oahu Lanai Total
Nonprime Rainfed Lands 652,836 90,386 38,492 20,468 12,319 6,575 814,501
Prime Irrigated Lands 97,679 65,893 11,126 53,020 55,919 16,741 300,378
Total 750,515 156,279 49,618 73,488 68,238 23,316 1,114,879

The Potential for Biofuels Production in Hawai’i 9.0 Summary of Results
9-5
production potential assuming all identified lands were used for the production of fiber
crops.
From Table 9-5 it can be seen that the theoretical potential of ethanol from energy
crops grown on all identified prime irrigated and nonprime rainfed lands is approximately
1.2 billion gallons per year. In comparison to biodiesel production from oil seed crops
the potential for cellulosic ethanol is clearly much greater. For example, it was found
that maximum oil seed production would occur if Jatropha were grown on prime land and
Oil Palm grown on nonprime lands, resulting in a total yield of 94 million gallons of
vegetable oil. This amount of oil could be converted into approximately 85 million
gallons of biodiesel. On an energy basis, full production of biodiesel crops would only
yield approximately 11 percent of the energy that full production of fiber crops would
offer in the production of ethanol.
Another advantage of producing biofuels through cellulosic energy processes is
that electricity can be generated as a co-product. For example, if enzymatic hydrolysis
technology is used to convert the cellulosic biomass to ethanol, unconverted lignin from
the process can be used as a boiler fuel to generate ~2.55 kWh of electricity for every
gallon of ethanol produced from cellulose. This type of conversion process is just
beginning the early commercialization phase of development.
Table 9-5. Maximum Energy Crop Potential and Biofuel Yield.
Hawaii Maui Molokai Kauai Oahu Lanai Total Rainfed Land Potential
Banagrass (1000s dry tons/yr) 1,610 606 264 258 211 66 3,015
Eucalyptus (1000s dry tons/yr) 2,493 53 6 0 0 0 2,552
Irrigated Land Potential
Banagrass (1000s dry tons/yr) 1,378 2,446 455 1,832 1,978 502 8,589
Eucalyptus (1000s dry tons/yr) 718 47 6 3 45 53 873
Total Biomass (1000s dry tons/yr)
6,199 3,151 731 2,093 2,234 621 13,349
Energy Potential
Ethanol* (million gal./yr) 496 252 58 167 179 49 1,202
Co-Generation** (MW) 126 64 15 43 46 13 306
Notes: * Assumes conversion factor of 80 gallons of ethanol per dry ton of cellulosic biomass ** Co-generation potential of ~2.55 kWh/gal of ethanol with enzymatic hydrolysis technology

The Potential for Biofuels Production in Hawai’i 9.0 Summary of Results
9-6
9.4.2 Ethanol Breakeven Costs
Banagrass was found to offer the highest ethanol production potential per acre
(1,720 gallons/acre/year) and Oil Palm was found to be the oil seed crop with the highest
biodiesel production potential (203 gallons/acre/year). Feedstocks used for producing
ethanol also were found to have lower feedstock costs (per gallon and per 1,000 Btu) than
oil seed crops evaluated for the production of biodiesel. Breakeven costs for ethanol
from Banagrass and Leucaena would be in the $2 to $2.25 range, depending on the type
of land used. The costs for producing Banagrass on irrigated prime land were found to be
somewhat lower than for producing this crop on rainfed non-prime land. Producing
ethanol from Sugarcane and Eucalyptus lead to slightly higher break even costs, but
prices are still comparable to the lower costs cellulose crops, as shown in Table 9-6
below.
Table 9-6. Breakeven Costs for Fiber and Sugar Crops.
Crop Prime Irrigated Land
($/gallon)
Non-prime Rainfed Land
($/gallon)
Leucaena 2.03
Banagrass 1.94 2.10
Sugarcane 2.13 2.40
Eucalyptus 2.63
In general, the economics for producing biodiesel from oil seed crops is unlikely
to be attractive in Hawai’i unless significant crop yield improvements are achieved
through R&D, or unless economics are improved through new marketing strategies to sell
non-fuel co-products from oil seed processing.
9.5 Potential Process Improvements For this report the base-case cellulosic ethanol conversion rates were assumed to
be 80 gallons per dry ton of biomass feedstock, based on the anticipated performance for
this technology in the next four to seven years. Future conversion rates of 100 gallons
per dry ton of feedstock may be achievable. Improvements in conversion yields for
cellulosic ethanol are one way that biofuel production estimates have the potential to
improve. Higher yields per ton of dry biomass would also improve the economics of
ethanol production for all fiber feedstocks.
The base-case conversion cost for cellulosic ethanol production used in this
analysis was $1.36 per gallon of facility processing capacity. This takes into account

The Potential for Biofuels Production in Hawai’i 9.0 Summary of Results
9-7
adjustments for ethanol facility development costs in Hawaii including construction,
labor costs, and economy-of-scale factors. Note that estimates of these conversion costs
are still quite preliminary, since the initial first-of-a-kind commercial facilities are only
now being constructed.
For both the biochemical and thermochemical ethanol production routes, technical
improvements may be able to lower the conversion cost of ethanol by roughly 35 percent
from where they are today. The higher cost of feedstock in Hawai’i will make realization
of breakeven selling prices of ethanol this low a challenge; even assuming 100 gallons of
ethanol per ton of biomass, it is unlikely that breakeven prices below $2 per gallon will
be possible.
While it is likely that the downward trend in production costs will continue for
cellulosic ethanol conversion technologies, it should be noted that this may be impaired
by current economic condition. There is some level of risk in bringing new technologies
to commercialization and while some might see this as an opportunity, it is possible that
this may lead to a lag in development.

The Potential for Biofuels Production in Hawai’i
10.0 Conclusions
10-1
10.0 Conclusions
The results of this study demonstrate that Hawai’i has the resources necessary to
meet the Renewable Fuel Standard (RFS) that has been laid out in Act 240, SLH 2006.
Meeting this target will require a focused effort to address and optimize energy crop
species and conversion technology pathways.
10.1 Biofuels Potential from Waste Residues and Energy Crops There is a potential to produce biofuels from Hawaii’s existing waste streams;
however, energy crops will be needed to meet the State’s RPS targets. Ethanol produced
from cellulosic wastes streams could be used to displace up to 12 percent of the current
gasoline consumption. However, biodiesel produced from waste fats, oils and greases
would account for less than half of one percent of current diesel fuel usage.
Table 10-1 shows the estimated maximum biofuel potential from waste residues
and dedicated energy crops in Hawaii. Since the anticipated yields of ethanol from
biomass feedstocks are fairly well known, the maximum amount of ethanol that could be
produced was estimated, in terms of gallons and Btu’s of this biofuel. For advanced
biofuel technologies that produce green gasoline, green diesel and green jet fuel, the
anticipated gallons of fuel that will be produced per ton of biomass feedstock are still
being refined. In order to estimate the amount of these fuels that could be produced, a
useful approach is to assume that the efficiency of converting Btu’s of feedstock into
Btu’s of liquid fuel will be somewhat similar for the different biofuel conversion
pathways. This approach was used to provide the estimates shown in the table below,
adjusting for the higher Btu content of gasoline, diesel, and jet fuels relative to ethanol.
The production levels shown in Table 10-1 assume utilization of all identified
agricultural land and unused biomass wastes/residues. Table 10-1 does not include yet-
Feedstock Biofuel
1012 Btus/yr
Ethanol
million gal/yr
Green Gasoline
equivalent million gal/yr
Green Diesel
equivalent million gal/yr
Green Jet Fuel
equivalent million gal/yr
Energy Crops 101 1,202 786 722 751
Cellulosic Wastes 8 95 62 57 59
Total: 109 1,297 848 779 810
Table 10-1. Maximum Theoretical Hawai’i Biofuel Production Potential

The Potential for Biofuels Production in Hawai’i
10.0 Conclusions
10-2
to-be-determined production of feedstocks such as algae, which could be produced on
land that is not agriculturally zoned. Since there are many competing uses for
agricultural land, these production levels are meant to provide a broad maximum starting
point in understanding the potential for biofuel production in Hawaii. However, only a
fraction of the total potential is needed to meet the desired displacements for 2010, 2015,
and 2020 targets in the State of Hawai’i Act 240.
The maximum theoretical case for potential biofuels production potential in
Hawai’i can serve as an important baseline to compare current consumption levels
against. Table 10-2 below compares current fuel usage to the energy content in the
maximum theoretical biofuel production case (cellulosic ethanol and fiber crops).
Table 10-2. Hawai'i Fuel Consumption, 2007.
Fuel Fuel Consumption*
(million gal/yr)
Energy Content
(Btu/gal)
Percent of Maximum Biofuel Potential for
Energy Crops Gasoline 475 128,900 8%
Diesel (on & off highway) 66 140,300 2%
Jet Fuel 449 135,000 12%
Total All Petroleum Uses 2,222 135,000 59%
* Source: Energy Information Administration, U.S. DOE
From Table 10-2 it can be seen that displacing 20 percent of the gasoline
consumption in Hawai’i would require about 8 percent of the maximum theoretical
potential from energy crops. Displacing 20 percent of the diesel fuel would require a
biofuel production capacity of approximately 2 percent of the maximum theoretical
potential from energy crops. Meeting the State’s goals under Act 240 for displacing 20
percent of gasoline and diesel fuel consumption combined, would require dedicating
about 10 percent of the potential land available for energy crop production, based on the
use of high-yielding energy crops. To gain a perspective on related land use issues, it can
be noted that the Hawaii BioEnergy members collectively oversee 150,000 acres of land
that they are evaluating for the production of energy crops and bioenergy products. The
magnitude this land area is equivalent to 13.5 percent of the total Hawai’i agricultural
land area identified for potential production of energy crops (i.e., 810,000 acres of non-
prime and 300,000 acres of prime land, as noted earlier). Overall, it appears that meeting
the State’s goals under Act 240 for displacing 20 percent of gasoline and diesel fuel
consumption with biofuels seems quite achievable.

The Potential for Biofuels Production in Hawai’i
10.0 Conclusions
10-3
10.2 Recommendations for Further Study There are a number of ongoing efforts in Hawai’i and around the world that are
working to advance the science of biofuel production. It will be important to monitor the
progress of the technologies evolving from these efforts to help identify those that are
most worthy of pursuing in Hawai’i.
New crops: Algae and sweet sorghum are two examples of crops which may hold
significant promise for the state of Hawai’i. Unfortunately at the time this
analysis was performed, adequate data was not available to make assumptions
regarding yield or biofuel potential for these crops. Further investigation into
these crops, as well as continuing efforts to identify other potentially promising
crops, will help maximize biofuel production potential and lead to a greater
understanding of best practices.
Crop trials: Testing and breeding of indentified crops will lead to a greater
understanding of the potential, agricultural techniques and the economics of
energy crop production in Hawai’i.
Economies of scale: It has been noted that restrictions to biomass supply that
result from Hawaii’s geography may result in higher biofuel costs due economy-
of-scale factors. Additional investigation would be useful regarding island-
specific constraints that will determine the quantities of energy crops that can be
aggregated in specific locations given the distribution of agricultural acres, land
ownership patterns, and road transport constraints. This information could be
used in conducting R&D to identify and optimize conversion technologies for the
scale(s) of biomass feedstock supplies likely to be available in Hawai’i from
energy crop plantations.
Agricultural methods: New agricultural methods of integrated food and fuel
production such as alley cropping may also offer some promise to increase yields
and reduce concerns over food versus fuel conflicts.
Biorefining and high value production of coproducts: New models of
producing multiple products from biomass at a single site have the potential to
enhance the economics of biofuel production. The production of biofuels,
electricity, commodity chemicals and animal feed from a microalgae production
facility is one example of the potential of these integrated biorefinery models.
Collaboration large land owners: Hawaii’s three largest landowners have
organized to form Hawai’i Bioenergy LLC to explore Hawaii’s biofuel production
potential. Active cooperation between landholders and researchers will help to
advance the science of energy crop production in the state. In addition,

The Potential for Biofuels Production in Hawai’i
10.0 Conclusions
10-4
cooperation will help to facilitate a free flow of information between interested
parties. (www.hawaiibioenergy.com)
10.3 Obstacles Though the potential for developing biofuels technologies has been highlighted,
there is of course inherent risk in planning around technologies which are not yet
commercially mature. It is always possible that issues such as concerns about the
economy or changing public perception about the benefits of biofuels may inhibit
investment. In turn this could delay the advancement and commercialization of
developing biofuel production technologies as those with capital avoid risk and adopt a
business as usual mindset. For this reason, fossil fuel displacement strategies will need to
be adaptive to take advantage of the technologies as they become available.
10.4 Crops Specific Considerations It is important to recognize potential benefits and drawbacks of energy crops
considered in this evaluation. Sugar crops have been grown commercially in Hawai’i for
decades. This means there is a significant amount of knowledge, as well as identified
lands and equipment, for harvesting and processing sugarcane. In addition, food, biofuel,
and usable electricity are all potential products of sugarcane. For these reasons,
sugarcane production in is seen as one viable option as a feedstock for bioenergy
production in Hawaii.
In order for oil seed crops such as Oil Palm and Jatropha to be competitive in
Hawai’i, R&D would be needed to achieve higher yields per acre, reduce harvesting
costs, and/or develop high-value co-products.
According to the analysis performed by the University of Hawai’i, Banagrass
could be an attractive energy crop in Hawai’i, based on both potential yields and
economics. One challenge is the difficulty in finding locations in Hawai’i where
Banagrass will flower and seed. This poses a challenge for plant propagation and efforts
to improve yields for this crop, which need to be explored further to confirm the promise
for banagrass in Hawaii as a major energy crop alternative.
Sweet sorghum could offer strong potential as an energy crop for Hawaii. This
crop alternative is in a relatively early stage of evaluation, and reliable data on its
production potential was not available for this effort. Sweet sorghum readily produces
seeds in Hawaii; and, with the potential for planting and harvesting two to three crops per
year of sorghum in Hawai’i, this should enhance the ability to breed high-yielding
varieties of sorghum that produce more tons per year of sugar and fiber per acre.
The Potential for Biofuels Production in Hawai’i
10.0 Conclusions
10-5
Biofuel production from microalgae is in the early stages of development.
Researchers are still working to identify appropriate strains and develop production
techniques that are not susceptible to invasive microorganisms or lower yielding algae
strains that may be problematic. Most commercially produced algae is cultivated in
raceway ponds which require level horizontal surfaces; the option of developing
thousands of acres of algae ponds in Hawai’i is a distinct challenge, since much of the
terrain is sloped. As noted earlier, algae has a number of advantages, including being able
to use non-fresh water. In addition, algae can be used to capture waste carbon dioxide
from the exhaust of power facilities.
10.5 Final Observations It should be quite achievable for biofuels produced from in-state resources to
displace 20 percent of the gasoline and diesel fuel needed for vehicle transportation in
Hawai’i. This could be accomplished using about 10 percent of available agricultural
land for energy crop production to supply the required biomass feedstock.
There are a variety of energy crops and biofuel conversion technologies that could
be economically viable in Hawai’i. The State’s unique and varied geography,
microclimates, and infrastructure provide challenges in selecting and/or developing crops
and conversion technologies for commercially viable production of biofuels. Efforts in
the past to help the Hawaiian sugarcane industry address these state-specific challenges
provide a useful model for the needs of an emerging biofuel industry in Hawai’i. The
Hawaiian Sugar Planters' Association (now the Hawaii Agriculture Research Center
(HARC)) developed sugarcane varieties that were adapted to 13 different environments
in Hawai’i in order to address the range of microclimates and crop production challenges
found in the State. A similar effort to identify and optimize energy crops for the varied
environments in Hawai’i would help increase the likelihood that biofuel development
reaches its full potential in offsetting petroleum dependency and fostering economic
development centered on a new biofuel industry in Hawai’i.
The U.S. Department of Energy (DOE) and the National Renewable Energy
Laboratory (NREL) are engaged in a major initiative to support the development of
advanced biofuel conversion technologies in the U.S. With their expressed interest in
seeing Hawaii become a model for bioenergy production, they could play a valuable role
in ongoing efforts to identify and optimize conversion technologies suited to the
economy-of-scale and varied requirements for biofuel development and expansion in
Hawai’i.

The Potential for Biofuels Production in Hawai’i
10.0 Conclusions
10-6
In addition, identifying opportunities where some combination of biofuel, food,
electricity, and high value products can be produced at the same facility could help make
biofuel economics more favorable in specific circumstances.

The Potential for Biofuels Production in Hawai’i
11.0 References
11-1
11.0 References
Austin, M. T., J. L. Brewbaker, R. Wheeler, and J. H. Fownes. 1997. “Short-rotation biomass trial of mixed and pure stands of nitrogen-fixing trees and Eucalyptus grandis.” Australian Forestry 60:161-163. Benge, M. D., Assessment of the Potential of Jatropha curcas (Biodiesel Tree) for Energy Production and Other Uses in Developing Countries. Binkley, D., and M. G. Ryan. 1998. “Net Primary Production and Nutrient Cycling in Replicated Stands of Eucalyptus saligna and Albizia facaltaria,” Forest Ecology and Management 112:79-85. Brewbaker, J. L. 1980. “Giant Leucaena (Koa haole) Energy Tree Farm: An Economic Feasibility Analysis for the Island of Molokai, Hawai’i,” Hawai’i Natural Energy Institute, University of Hawai’i, Honolulu. CTAHR Cost-of-Production Spreadsheets-Macadamia Nuts, Office of Communication Services, College of Tropical Agriculture and Human Resources, University of Hawai’i at Manoa. <http://www.ctahr.hawaii.edu/ocs/CoP_spreadsheets.html>. DBEDT. 2006. State of Hawai’i Data Book, Department of Business, Economic Development & Tourism, Honolulu, Hawai’i. DeBell, D. S., T. G. Cole, and C. D. Whitesell. 1997. “Growth, Development, and Yield in Pure and Mixed Stands of Eucalyptus and Albizia,” Forest Science 43:286-298. Easterly, J., Hunsaker, M., Harper, B., Roush, B., Cummer, K (Black & Veatch), and Kinoshita, C. (U. of Hawai’i). May 2008. “Task 1: Assessment of Existing Hawai’i Biomass Feedstocks,” State of Hawai’i Dept. of Business, Economic Development, and Tourism. FAO. 2003. “Selected Indicators of Food and Agriculture Development in Asia-Pacific Region 1992-2002,” RAP Publication 2003/10, Food and Agriculture Organization of the United Nations, Regional Office for Asia and the Pacific, Bangkok. Federal Reserve Bank. Historical Discount Rates 1914-2007, <http://minneapolisfed.org/ Research/data/us/disc.cfm). Foidl, N., G. Foidl, M. Sanchez, M. Mittelbach, and S. Hackel. 1996. “Jatropha Curcas as a Source for the Production of Biofuel in Nicaragua,” Bioresource Technology 58:77-82. Fukumoto, G. 2002. The Forages Website, Grasses. <http://www.ctahr.hawaii.edu/ ctahr2001/InfoCenter/Forages/grasses.html>.

The Potential for Biofuels Production in Hawai’i
11.0 References
11-2
Gieskes, T. and D. Hackett. 2003. Hawai’i ethanol alternatives, Report prepared for Department of Business, Economic Development & Tourism, State of Hawai’i. <http://hawaii.gov/dbedt/ert/new-fuel/files/ethanol-stillwater.pdf>. Glover, N. 1988. “Evaluation of Leucaena Species for Psyllid Resistance,” Leucaena Research Reports 9:15-18. Government of Fiji and FAO. 1997. Proceedings of the Fiji/FAO 1997 Asia Pacific Sugar Conference, Fiji, 29-31 October, 1997. Hai, T. C. 2000. “Land Use and the Oil Palm Industry in Malaysia,” World Wildlife Fund Forest Information System Database, Kuala Lumpur, Malaysia. Heller, J. 1996. Physic Nut, Jatropha Curcas L., Promoting the Conservation and Use of Underutilized and Neglected Crops, 1. Institute of Plant Genetics and Crop Plant Research, Gatersleben/International Plant Genetic Resources Institute, Rome. Ishii, Y. and R. Takeuchi. 1987. “Transesterified Curcas Oil Blends for Farm Diesel Engines, Transactions of the American Society of Agricultural Engineers,” 30:805-809. Ismail, A., M. A. Simeh, and M. M. Noor. 2002. “The production cost of Oil Palm fresh fruit bunches: The case of independent smallholders in Johor.” Malaysian Palm Oil Board, Kuala Lumpur, p 7. Jaeger, W. K., R. Cross, and T. M. Egelkraut. 2007. “Biofuel Potential in Oregon: Background and Evaluation of Options.” <http://extension.oregonstate.edu/pdf/sr/ sr1078.pdf>, May 19, 2008. Kallarackal, J. P. Jeyakumar, and S. J. George. 2004. “Water Use of Irrigated Oil Palm at Three Different Arid Locations in Peninsular India,” J. Oil Palm Research, 16:45-53. Kammen, D. M. and D. M. Hassenzahl. 2001. Should We Risk It? Exploring Environmental, Health and Technological Problem Solving, Princeton University Press, New Jersey. Kinoshita, C. M. and J. Zhou. 1999. “Siting Evaluation for Biomass-Ethanol Production in Hawai’i,” Prepared for National Renewable Energy Laboratory, October 1999, Department of Biosystems Engineering, University of Hawai’i, Honolulu, Hawai’i. Laughlin, M.D. 2005. Clean Cities Alternative Fuel Price Report, U.S. Department of Energy, Washington, D.C. McAloon, A., F. Taylor, W. Yee, K. Ibsen and R. Wooley. 2000. Determining the Cost of Producing Ethanol from Corn Starch and Lignocellulosic Feedstocks. US Department of Agriculture, National Renewable Energy Laboratory, NREL/TP-580-28893.
The Potential for Biofuels Production in Hawai’i
11.0 References
11-3
Monti, A., S. Fazio, V. Lychnaras, P. Soldatos, and G. Venturi. 2007. “A Full Economic Analysis of Switchgrass under Different Scenarios in Italy Estimated by BEE Model.” Biomass and Bio-energy, 31 (4): 177-185 Noor, M. M., M. A. Simeh, A. Ismail, and J. Latif. 2002. “Analysis of Oil Palm Cost of Production Survey,” Malaysian Palm Oil Board, Kuala Lumpur. Ogoshi, R. 2008. Crop Assessment Task B1, Report submitted to Black & Veatch, May 31, 2008. Oil World Annual 2004, http://www.fedepalma.org/statistics.shtm, Office of Planning, 2008, Hawai’i Statewide GIS Program. Department of Business, Economic Development, & Tourism, State of Hawai’i, http://hawaii.gov/dbedt/gis/. Osgood, R. V., N. S. Dudley, and L. A. Jakeway. 1996. “A Demonstration of Grass Biomass Production on Molokai,” Diversified Crop Report 16, Hawai’i Agricultural Research Center, Aiea, Hawai’i. Palisade Corporation. 2001. Guide to RISKOptimizer: Simulation Optimization for Microsoft Excel, New Field, New York. Papademetriou, M. K., and F. J. Dent (eds.). 2001. “Crop Diversification in the Asia-Pacific Region,” RAP Publication 2001/03, FAO, Bangkok, Thailand. Paterson, D. D. 1933. “The Influence of Time of Cutting on the Growth, Yield, and Composition of Tropical Fodder Grasses. I. Elephant Grass (Pennisetum purpureum),” Journal of Agricultural Science, 23:615-641. Paterson, D. D. 1935. “The Growth, Yield, and Composition of Certain Tropical Fodders,” Journal of Agricultural Science, 25:369-394. Radich A. 2004. “Biodiesel Performance, Costs and Use,” Energy Information Administration, <http://www.eia.doe.gov/oiaf/analysispaper/biodiesel/>. Robison, Lindon J. and P. J. Barry. 1987. The Competitive Firm’s Response to Risk, MacMillan Publishing Company, New York. Rocky Mountain Institute. 2008. Hawai’i’s Energy Future, Prepared for the State of Hawai’i Department of Business, Economic Development & Tourism, Strategic Industries Division. SCS. 1972. “Soil Survey of Islands of Kauai, Oahu, Maui, Molokai, and Lanai, State of Hawai’i,” Soil Conservation Service, US Dept. of Agriculture, Washington, D.C.

The Potential for Biofuels Production in Hawai’i
11.0 References
11-4
SCS. 1973. “Soil Survey of Island of Hawai’i, State of Hawai’i, Soil Conservation Service,” US Dept. of Agriculture, Washington, D.C. Shapouri, H., M. Salassi, and N. J. Fairbanks. 2006. The Economic Feasibility of Ethanol Production from Sugar in the United States, U.S. Department of Agriculture (USDA), Washington, D.C. Shi, Xuebo. 2003. “Genetic Improvement of Leucaena spp. and Acacia Koa Gray as High Value Hardwoods,” Dissertation, Department of Horticulture, University of Hawai’i, Honolulu, Hawai’i. Skolmen, R. G. 1986. “Performance of Australian Provenances of Eucalyptus grandis and Eucalyptus saligna in Hawai’i,” Res. Paper PSW-181, Pacific Southwest Forest and Range Experiment Station, Forest Service, US Dept. of Agriculture, Berkeley, CA. Stape, J. L., D. Binkley, and M. G. Ryan. 2004. “Eucalyptus Production and the Supply, Use and Efficiency of Use of Water, Light, and Nitrogen across a Geographic Gradient in Brazil,” Forest Ecology and Management, 193:17-31. Sun, W. 1996. Genetic Improvement of Leucaena and Acacia Koa, Ph.D. Dissertation, Department of Horticulture, University of Hawai’i. Surley, T. M., Foley, S. Turn, and M. Staackmann. 2007. “A Scenario for Accelerated Use of Renewable Resources for Transportation Fuels in Hawai’i,” Report prepared for State of Hawai’i Department of Business, Economic Development & Tourism. Udom, D. S. 2002. “Declining Yield of Oil Palm: A Case Study of Four Oil Palm Plantations in Nigeria and Cameroun,” Nigerian Agricultural Journal, 33:32-39. Vincente-Chandler, J. R., W. Pearson, F. Abruna, S. Silva. 1962. “Potassium Fertilization of Intensively Managed Grasses under Humid Tropical Conditions,” Agronomy Journal, 54:450-453. Vincente-Chandler, J. S. Silva, and J. Figarella. 1959. “The Effect of Nitrogen Fertilization and Frequency of Cutting on the Yield and Composition of Three Tropical Grasses,” Agronomy Journal, 51:202-206. Watkins, J. W., M. Lewy-Van Severin. 1951. “Effect of Frequency and Height of Cutting on the Yield, Stand, and Protein Content of Some Forages in El Salvador,” Agronomy Journal, 43:291-296. Wiesenhutter, J. 2003. “Use of the Physic Nut (Jatropha curcas L.) to Combat Desertification and Reduce Poverty; Possibilities and Limitations of Technical Solutions in a Particular Socio-economic Environment, the Case of Cape Verde,” Deutsche Gesellschaft fur Technische Zusammenarbeit (GTZ), Bonn, Germany.

The Potential for Biofuels Production in Hawai’i
11.0 References
11-5
Whitesell, C.D., D.S. DeBell, T.H. Schubert, R.F. Strand, and T.B. Crabb. 1992. “Short-Rotation Management of Eucalyptus: Guidelines for Plantations in Hawai’i,” General Technical Report PSW-GTR-137, Forest Service, US Department of Agriculture. Pacific Southwest Research Station, Albany, California. Wilsie, C. P., E. K. Akamine, and M. Takahashi. 1940. “Effect of Frequency of Cutting on the Growth, Yield and Composition of Napiergrass,” Journal of the American Society of Agronomy, 32:266-273.

The Potential for Biofuels Production in Hawai’i
Appendix A.
A-1
Appendix A. Detailed Economic Analysis Assumptions for
Sugarcane and Banagrass
Ethanol Production from Sugarcane on Irrigated Prime Lands
Items Unit Quantity Cost and Revenue
Cost and Revenue
Annual Equivalent Cost and Revenue
1999 2007
1. Land preparation Acre 1 $506.00 $612.53 $292.84Machinery
Labor 2. Planting Acre 1
seeds Acre 1 $50.00 $60.53 $28.94Machinery
Labor Chemicals
Other 3. Field operations
Machinery Labor
Fertilizer Acre 1 $114.00 $138.00 $65.98Herbicides Acre 1 $297.00 $359.53 $171.89Pesticides Irrigation Acre 1 $486.00 $615.57 $601.61
other 4. Harvesting Acre 1 $480.00 $290.07
Machinery Labor Other Acre 1
5. Other operations Acre 6. Operating overhead Acre $193.30 $178.62 $145.13 Total costs Acre 1 $2,126.30 $1,964.77 $1,596.46Fixed cost for machinery Acre 10% $196.48 $159.65Total variable cost Acre 1 $1,768.29 $1,436.81 A. Production of sugarcane 1. Primary production (per acre/crop) Tons 104.00 2. Secondary production (Silage) 3. Gross revenue $/acre $35.82 $1,780.84 B. Net revenue from sugarcane Net revenue acre/year -$1,964.77 $184.38
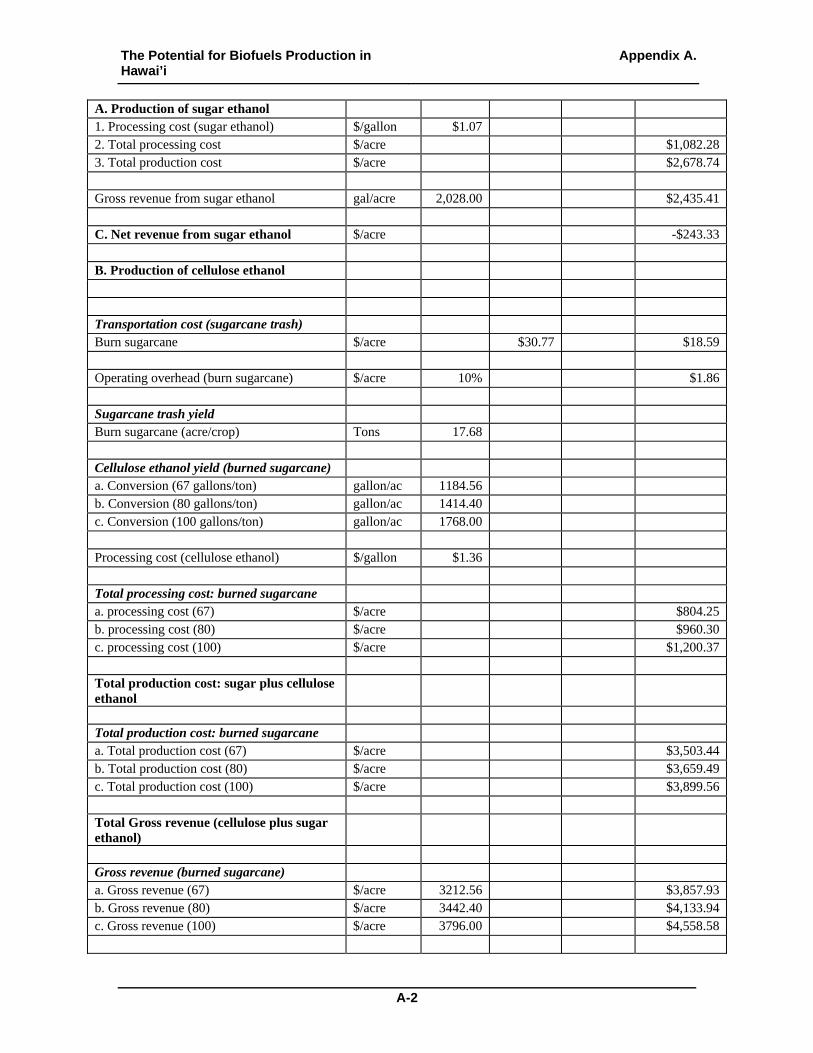
The Potential for Biofuels Production in Hawai’i
Appendix A.
A-2
A. Production of sugar ethanol 1. Processing cost (sugar ethanol) $/gallon $1.07 2. Total processing cost $/acre $1,082.283. Total production cost $/acre $2,678.74 Gross revenue from sugar ethanol gal/acre 2,028.00 $2,435.41 C. Net revenue from sugar ethanol $/acre -$243.33 B. Production of cellulose ethanol Transportation cost (sugarcane trash) Burn sugarcane $/acre $30.77 $18.59 Operating overhead (burn sugarcane) $/acre 10% $1.86 Sugarcane trash yield Burn sugarcane (acre/crop) Tons 17.68 Cellulose ethanol yield (burned sugarcane) a. Conversion (67 gallons/ton) gallon/ac 1184.56 b. Conversion (80 gallons/ton) gallon/ac 1414.40 c. Conversion (100 gallons/ton) gallon/ac 1768.00 Processing cost (cellulose ethanol) $/gallon $1.36 Total processing cost: burned sugarcane a. processing cost (67) $/acre $804.25b. processing cost (80) $/acre $960.30c. processing cost (100) $/acre $1,200.37 Total production cost: sugar plus cellulose ethanol
Total production cost: burned sugarcane a. Total production cost (67) $/acre $3,503.44b. Total production cost (80) $/acre $3,659.49c. Total production cost (100) $/acre $3,899.56 Total Gross revenue (cellulose plus sugar ethanol)
Gross revenue (burned sugarcane) a. Gross revenue (67) $/acre 3212.56 $3,857.93b. Gross revenue (80) $/acre 3442.40 $4,133.94c. Gross revenue (100) $/acre 3796.00 $4,558.58

The Potential for Biofuels Production in Hawai’i
Appendix A.
A-3
B. Net revenue from ethanol Net revenue: burned sugarcane acre/year a. Net revenue (67) $/acre 354.49b. Net revenue (80) acre/year 474.45c. Net revenue (100) acre/year 659.02 Burned Sugarcane Feedstock cost of ethanol (67) $/gallon $1.01Feedstock cost of ethanol (80) $/gallon $0.94Feedstock cost of ethanol 100) $/gallon $0.85Feedstock cost of ethanol (67-110) $/gallon $0.81Break even price of ethanol (67) $/gallon $2.18Break even price of ethanol (80) $/gallon $2.13Break even price of ethanol (100) $/gallon $2.00Break even price of ethanol (67-110) $/gallon $1.91
Notes: Sugarcane
1. Cost of production data are based on Kinoshita and Zhou (1999). Note: machinery and labor costs
are included in the respective operation category (e.g., land preparation, harvesting etc.).
2. Prices were inflated to 2007 using appropriate CPI difference between 1999 and 2007.
3. Cost of irrigation was included for the analysis as sugarcane production was considered for
irrigated prime lands.
4. Operating overhead is assumed to be 10% of total operational cost.
5. Sugarcane yield estimation for irrigated prime lands (warm moist regime) based on Ogoshi
(2008).
6. Sugarcane planting cycle is every two years.
7. Price per ton of sugarcane ($ 34.09) is based on National Agricultural Statistics Service data for
2004. Prices were inflated to 2007 using appropriate CPI for Honolulu.
8. Two types of ethanol production from sugarcane were considered. Type 1 is the sugar ethanol and
type 2 is the cellulose ethanol from sugarcane trash.
9. Sugarcane trash was estimated for unburned and burned sugarcane fields separately.
10. Transportation cost for sugarcane trash was estimated based on transportation cost of a ton of dry
matter of Banagrass.
11. Gallons of ethanol per ton of sugarcane = 19.5 (Shapouri et al. 2006).
12. Ethanol yield for a ton of sugarcane trash (67 gallons) was based on Gieskes and Hackett (2003).
Variable conversion rates were considered as follows:
Scenario 1: Conversion rate of ethanol per ton of dry matter = 67 gallons Scenario 2: Conversion rate of ethanol per ton of dry matter = 80 gallons Scenario 3: Conversion rate of ethanol per ton of dry matter = 100 gallons
The Potential for Biofuels Production in Hawai’i
Appendix A.
A-4
Scenario 4: Variable conversion rates of ethanol per ton of dry matter over time. For 1-5 years (67/65 gallons), for 6-10 years (80 gallons), for 11-15 years (90 gallons), for 16-20 years (100 gallons), for 21-25 years (110 gallons)
13. Processing cost for sugarcane = $ 0.063/pound of raw sugar equivalent in 2005$. 1 gallon = 14.77
lbs, therefore processing cost/gallon = 14.77 x 0.063 = $0.93 (Shapouri et al. 2006). Inflating to
2007$ = $ 0.93 x 1.06 = $0.98 (inflation factor = average US CPI 2005-2007) and adjusted to the
prices in Honolulu by multiplying by a factor of 1.083 (CPI adjusted factor for Honolulu as
compared to the US average) = $ 1.069/gallon.
14. Economic analysis was conducted for a 24 year period to represent complete crop cycles.
15. Price of ethanol in 2007 is $2.405523/gallon. This is rounded to $2.41/gallon
16. Cost and revenue figures may differ slightly due to rounding.

The Potential for Biofuels Production in Hawai’i
Appendix A.
A-5
Ethanol Production from Banagrass on Irrigated Prime Lands
Items Unit Quantity Cost and
Revenue Cost and Revenue
Annual Equivalent Cost and Revenue
1999 2007
1. Land preparation Acre 1 $126.00 $159.50 $34.94 Machinery
Labor 2. Planting
Seeds Acre 1 $6.00 $7.60 $1.66 Machinery
Labor Chemicals
Other 3. Field operations
Machinery Labor
Fertilizer Acre 1 $148.50 $187.98 $187.98 Herbicides Acre 1 $111.00 $140.51 $140.51 Pesticides Irrigation Acre 1
Other 4. Irrigation Acre $324.00 $410.15 $410.15
4. Harvesting Acre 1 $219.00 $277.23 $277.23 Machinery
Labor Other Acre 1 $177.00 $224.06 $224.06
5. Other operations Acre 1 $224 $282.92 $282.92 6. Operating overhead Acre 1 133.5 $169.00 $155.95 Total costs Acre 1 $1,468.50 $1,858.95 $1,715.40 Fixed cost for machinery Acre 4.44% $82.46 $76.09 Variable cost Acre 1 $1,776.49 $1,639.31 A. Production of Banagrass 1. Primary production** tons/ac/year 37.00 2. Secondary production 3. Gross revenue per acre Acre $3,102.83 $3,102.83 B. Net revenue from Banagrass Net revenue acre/crop $1,243.88 $1,387.42 Net revenue 1.5
crops/year $1,865.82 $2,081.14
C. Production of ethanol

The Potential for Biofuels Production in Hawai’i
Appendix A.
A-6
Processing cost $/gallon $1.36 a. processing cost (67) $/acre 2479.00 $3,371.44 $3,371.44 b. processing cost (80) $/acre 2960.00 $4,025.60 $4,025.60 c. processing cost (100) $/acre 3700.00 $5,032.00 $5,032.00 a. Total production cost (67) $/acre $5,230.39 $5,086.84 b. Total production cost (80) $/acre $5,884.55 $5,741.00 c. Total production cost (100) $/acre $6,890.95 $6,747.40 a. Gross revenue (67) $/acre $5,963.29 $5,963.29 b. Gross revenue (80) $/acre $7,120.35 $7,120.35 c. Gross revenue (100) $/acre $8,900.44 $8,900.44 C. Net revenue from ethanol a. Net revenue (67) $/acre $732.90 $876.45 b. Net revenue (80) $/acre $1,235.80 $1,379.35 c. Net revenue (100) $/acre $2,009.49 $2,153.03 Feedstock cost of ethanol (67) $/gallon $0.69 Feedstock cost of ethanol (80) $/gallon $0.58 Feedstock cost of ethanol 100) $/gallon $0.46 Break even price of Banagrass $/ton $46.36 Break even price of ethanol (67) $/gallon $2.05 Break even price of ethanol (80) $/gallon $1.94 Break even price of ethanol (100) $/gallon $1.82
Notes: Banagrass
1. Cost of production data are based on Kinoshita and Zhou (1999). Note: machinery and labor costs
are included in the respective operation category (e.g., land preparation, harvesting etc.).
2. Prices were inflated to 2007 using appropriate CPI for Honolulu.
3. Cost of land preparation includes both soil preparation and planting Banagrass.
4. Cost for other operations included road maintenance, crop control research, equipment,
landholding etc.
5. Cost of irrigation was included for the analysis as Banagrass production was considered for
irrigated prime lands.
6. Operating overhead is assumed to be 10% of total operational cost.
7. Average price of a ton of Banagrass dry matter ($80) was based on Kauai Island Utility
cooperative. Renewable energy technology assessment report, March 21, 2006 (URL:
http://www.kiuc.coop/pdf/KIUC%20RE%20Final%20Report%207%20-
%20Biomass%20&%20MSW.pdf).
8. Banagrass yield estimation for irrigated prime lands (warm moist regime) based on Ogoshi, R.
2008.

The Potential for Biofuels Production in Hawai’i
Appendix A.
A-7
9. Ethanol yield for a ton of Banagrass dry matter (67 gallons) was based on Gieskes and Hackett
(2003). Variable conversion rates were considered as follows:
Scenario 1: Conversion rate of ethanol per ton of dry matter = 67 gallons Scenario 2: Conversion rate of ethanol per ton of dry matter = 80 gallons Scenario 3: Conversion rate of ethanol per ton of dry matter = 100 gallons Scenario 4: Variable conversion rates of ethanol per ton of dry matter over time. For 1-5 years (67/65 gallons), for 6-10 years (80 gallons), for 11-15 years (90 gallons), for 16-20 years (100 gallons), for 21-25 years (110 gallons)
10. It is assumed that harvesting cycle of Banagrass is 8 months.
11. Processing cost for Banagrass is assumed to be the same as ethanol produced from corn stover.
Total processing ethanol from lignocellulose source like corn stover = $1.50/gallon less $0.49
stover cost/gallon (McAloon et al. 2000) = $1.01/gallon
(in 1999$).The processing cost for Banagrass ethanol processing inflated to 2007$ by a factor of
1.24 = $ 1.255 (US CPI average 1999-2007) and adjusted to the price in Honolulu by multiplying
a factor of 1.083 (CPI adjusted factor for Honolulu as compared to the US average) = $ 1.36.
12. Price of ethanol in 2007 is $2.405523/gallon. This is rounded to $2.41/gallon
13. Cost and revenue figures may differ slightly due to rounding.