Embed Size (px)
Citation preview

Journal of Development Economics 97 (2012) 322–338
Contents lists available at ScienceDirect
Journal of Development Economics
j ourna l homepage: www.e lsev ie r.com/ locate /devec
The political economy of linguistic cleavages☆
Klaus Desmet a,b,⁎, Ignacio Ortuño-Ortín a, Romain Wacziarg b,c,d
a Department of Economics, Universidad Carlos III de Madrid, 28903 Getafe, Madrid, Spainb CEPR, United Kingdomc UCLA Anderson School of Management, 110 Westwood Plaza, Los Angeles CA 90095, United Statesd NBER, United States
☆ We thank Francesco Caselli, Jim Fearon, ThierrySpolaore and three anonymous referees for helpfulacknowledges financial support from the Comunidad dethe Spanish Ministry of Science (ECO2008-01300). Ortedges financial support from the Spanish MinistryWacziarg gratefully acknowledges financial supporPresidential Fund for Innovation in International StudiInternational Business Education and Research.⁎ Corresponding author at: Department of Econom
Madrid, 28903 Getafe, Madrid, Spain. Tel.: +34 91 624E-mail addresses: [email protected] (K. Desme
(I. Ortuño-Ortín), [email protected] (R. Wacziarg).
0304-3878/$ – see front matter © 2011 Elsevier B.V. Adoi:10.1016/j.jdeveco.2011.02.003
a b s t r a c t
a r t i c l e i n f oArticle history:Received 6 March 2010Received in revised form 10 February 2011Accepted 23 February 2011
JEL classification:H1N4O4O5
Keywords:Ethnolinguistic cleavagesDiversityLinguistic treesCivil conflictRedistributionPublic goodsGrowth
This paper uses a linguistic tree, describing the genealogical relationship between all 6912world languages, tocompute measures of diversity at different levels of linguistic aggregation. By doing so, we let the data informus on which linguistic cleavages are most relevant for a range of political economy outcomes, rather thanmaking ad hoc choices. We find that deep cleavages, originating thousands of years ago, lead to betterpredictors of civil conflict and redistribution. The opposite pattern emerges when it comes to the impact oflinguistic diversity on growth and public goods provision, where finer distinctions between languages matter.
Mayer, John Roemer, Enricocomments. Desmet gratefullyMadrid (PROCIUDAD-CM), anduño-Ortín gratefully acknowl-of Science (ECO2010-19596).t from Stanford University'ses and from UCLA's Center for
ics, Universidad Carlos III de9845, fax: +34 91 624 9875.t), [email protected]
1 Fearon and Laitideterminant of thecontrast, argue thatcivil conflict.
2 Alesina et al. (2usually negatively rethese partial correla
3 For an excellenrelevant or salientsection 5.2.1, page 7
ll rights reserved.
© 2011 Elsevier B.V. All rights reserved.
1. Introduction
How does ethnolinguistic diversity affect political and economicoutcomes? In recent years, a vast literature has argued that suchcultural heterogeneity impacts a wide range of outcomes, fosteringcivil war, undermining growth, hindering redistribution and theprovision of public goods. However, evidence on this point remainssubject to some disagreement. For instance, there is a vibrant debateon the role of ethnolinguistic divisions as determinants of civil
wars.1 Econometric results on growth, redistribution and publicgoods provision also vary widely across studies, raising issues ofrobustness.2
These inconclusive results may stem in part from the inability toconvincingly define the ethnolinguistic groups used as primitives toconstruct measures of heterogeneity. When faced with the issue ofhow to define groups, researchers have either relied on readilyavailable classifications, such as the ones based on the Atlas NarodovMira or the Encyclopedia Britannica, or have carefully constructed theirown classifications.3 Both approaches are problematic: the former
n (2003) show that ethnic fractionalization is not an importantonset of civil wars. Montalvo and Reynal-Querol (2005), in
ethnic polarization is a significant determinant of the incidence of
003) argue that while ethnic and linguistic fractionalization arelated to growth and the quality of government, the significance oftions is sensitive to the specification.t discussion of the difficulties raised by the issue of definingethnolinguistic groups, see Alesina and La Ferrara (2005),
92.

323K. Desmet et al. / Journal of Development Economics 97 (2012) 322–338
runs the risk of missing the relevant cleavages, whereas the latter issubject to the criticism that groups are defined based on howimportant they are expected to be for the problem at hand. In thispaper, we propose a methodology that addresses both criticisms, andargue that the degree of coarseness of ethnolinguistic classificationshas profound implications for inference on the role of diversity.
The methodology we propose computes diversity measures atdifferent levels of aggregation. We do so by exploiting the informationof language trees. We refer to this as a phylogenetic approach, sincetree diagrams describe the family structure of world languages.Depending on how finely or coarsely groups are defined, the measureof linguistic diversity will be different. For example, if one takes thedifferent dialects of Italian to constitute different groups, then Italyappears to be very diverse. However, if one considers these differentdialects to be only minor variations of Italian, then Italy lookshomogeneous. Apart from allowing us to classify languages atdifferent levels of aggregation, this approach has the advantage ofgiving a historical dimension to our analysis. Coarse linguisticdivisions, obtained at high levels of aggregation, describe cleavagesthat go back thousands of years. In contrast, finer divisions, obtainedat low levels of aggregation, are the result of more recent cleavages.Since we rely on data that cover the entire set of 6912 worldlanguages, and examine effects of heterogeneity measures computedat all possible levels of aggregation, we are able to capture a widerange of linguistic classifications. Rather than choosing the “correct”classification ourselves, we let the data inform us as to whichlinguistic cleavages are most relevant for different outcomes ofinterest.4
Our empirical analysis reveals drastically different effects oflinguistic diversity at different levels of aggregation. We also findthat the relevant cleavages vary greatly across political economyoutcomes. Starting from the data, specifications and estimationmethods from major contributions to the literature on the politicaleconomy of ethnolinguistic diversity, we substitute our newmeasuresof diversity for those commonly used. For civil conflict and the extentof redistribution, issues that inherently involve conflicts of interest,coarse divisions seem to matter most. While we find only weakevidence that diversity (whether measured by fractionalization orpolarization) affects the onset of civil wars at any level of linguisticaggregation, the estimated effects do tend to be larger and moresignificant when considering a coarse classification. This finding isconsistent with existing conflicts in African countries, such as Chadand Sudan, on the border between the Afro-Asiatic family and theNilo-Saharan family. It may also help explain conflict in certain LatinAmerican countries, such as Mexico and Bolivia, where the Indo-European family coexists with different Amerindian languages. Forredistribution, the results are more robust, and suggest once againthat measures based on a high level of aggregation matter most. Incontrast, for economic growth, where coordination between indivi-duals or groups is essential and market integration is important, wefind that finer divisions lead to heterogeneity measures that mattermore. The same pattern holds across a wide array of measures ofpublic goods provision.
Thus, when the main issue involves conflicts of interest (as for theonset of civil wars and the extent of redistribution), deep differencesoriginating thousands of years ago matter most: different groups'interests differ more when cleavages are more deeply rooted. Incontrast, more superficial and recent divisions are negatively related
4 Our approach is related to existing work arguing that people identify withdifferent groups in different contexts (particularly the work of Crawford Young onsituational identity — see Young, 1976). For instance, ethnolinguistic cleavages thatmatter for voting behavior in local elections may differ from those that matter fornational elections. For a related point, see Posner's, 2005 book on ethnic politics inZambia. More generally, cleavages that matter for some outcomes may not matter forothers. There is no such thing as a “correct” classification of languages or ethnicities —this depends on the context.
to growth, an outcome related to the ease of coordination. Forinstance, to the extent that clusters of economic activity form aroundlanguage lines, linguistic divisions may limit the integration ofmarkets, and prevent economic growth. Even though Hindi andGujarati are not so different, this linguistic cleavage may hinder theintegration of the corresponding regions of India. What matters hereis whether two individuals or groups can interact effectively. In fact,finer linguistic classifications deliver heterogeneity measures thatmatter more for outcomes such as economic growth, which ishindered by lack of coordination and integration. As for publicgoods, they fall somewhere in between both cases: although theyhave a redistributive aspect, their effective provision also requirescoordination between groups or individuals. Empirically, we find thatfine linguistic divisions, based on more superficial cleavages, arecorrelated with lower public goods provision across a wide array ofindicators.
This paper is related to a vast literature in political economy.Various authors have studied how ethnolinguistic diversity affectsredistribution, growth and civil conflict (Alesina and La Ferrara,2005; Alesina et al., 1999, 2003; Easterly and Levine, 1997; Fearonand Laitin, 2003; La Porta et al., 1999, among many others).Measurement issues are central to recent research on these topics.One issue is that standard indices of diversity do not take into accountthe distance between groups (Desmet et al., 2009; Fearon, 2003;Spolaore and Wacziarg, 2009). Another possibility is that for certainissues, such as civil conflict, polarization may be more relevant thanfractionalization (Esteban and Ray, 1994; Montalvo and Reynal-Querol, 2005), an issue we revisit below. A third problem is thedifficulty of determining the right level of aggregation whencomputing heterogeneity measures, i.e., identifying the relevantethnolinguistic cleavages. This issue has received little attention, andit is the main focus of the present study.5
This paper is organized as follows. Section 2 describes conceptualissues related to the measurement of heterogeneity based onlanguage trees, and describes the data. Section 3 discusses the effectsof diversity on civil conflict and redistribution. Section 4 covers theeffects on public goods provision and economic growth. Section 5explores a number of robustness issues, and Section 6 concludes.
2. Aggregation and linguistic diversity
2.1. A tale of two countries
To illustrate our approach, we start with a comparative case study.Over the period 1965–2000, Chad andZambia experienced someof thelowest growth rates on the globe, their income per capita shrinking byan average of 1 percentage point per year (Table 1). The 2005 HumanDevelopment Index ranked Chad 170 and Zambia 165 out of a total of177 countries. It has long been argued that low growthmay be relatedto high ethnolinguistic diversity. With 135 languages spoken in Chad,and between 40 and 70 in Zambia, these countries certainly are verydiverse: taking the commonly used fractionalization index as ameasure of diversity, the Ethnologue database on languages gives avalue of 0.95 for Chad and 0.85 for Zambia, putting both countries inthe top decile. As highlighted by Easterly and Levine (1997), data for abroad cross-section of countries point more formally to a generalnegative relationship between ethnic heterogeneity and economic
5 Fearon (2003) does discuss at length the issue of how to define the “right list” ofethnic groups serving as the basis for computing heterogeneity measures, andrecognizes explicitly that not all cleavages may be relevant for a given outcome.However, he presents data on ethnic groups based on a single classification. Scarrittand Mozaffar (1999) present data on ethnic groups for Sub-Saharan countries usingthree different classifications, but do not examine the effects of using these differentclassifications on political and economic outcomes.

6 The difference in the experience of Chad and Zambia (or Afghanistan and SriLanka) is not related to the use of measures of linguistic fractionalization rather thanpolarization, but to the issue of aggregation. As Table 1 reveals, using a standardmeasure of polarization instead of fractionalization leads to the same conclusion: thedifference in polarization between Zambia and Chad is much more pronounced forhighly aggregated linguistic classifications than for disaggregated ones. Correspond-ingly, conflict and war has been continuous in Chad, but absent in Zambia. We discussthe important issue of how the distinction between polarization and fractionalization(which has to do with the functional form used to calculate measures of diversity)relates to the level aggregation (which has to do with the definition of relevantgroups) in Section 2.3.
7 This point was recognized going at least as far back as Charles Darwin, who wrote:“If we possessed a perfect pedigree of the mankind, a genealogical arrangement of theraces of man would afford the best classification of the various languages now spokenthroughout the world; and if all extinct languages, and all intermediate and slowlychanging dialects, were to be included, such an arrangement would be the onlypossible one. Yet it might be that some ancient language had altered very little and hadgiven rise to few new languages, whilst others had altered much owing to thespreading, isolation, and state of civilization of the several co-descended races, and hadthus given rise to many new dialects and languages. The various degrees of differencebetween the languages of the same stock, would have to be expressed by groupssubordinate to groups; but the proper or even the only possible arrangement wouldstill be genealogical; and this would be strictly natural, as it would connect together alllanguages, extinct and recent, by the closest affinities, and would give the filiation andorigin of each tongue.” (Darwin, 1902, p. 380).
Table 1Growth, conflict, redistribution and linguistic diversity in Chad and Zambia.
Chad Zambia
Per capita growth 1960–1990 (Easterly-Levine),% −1% −1%Per capita growth 1965–2000 (PWT 6.2),% −1% −1%Years of civil war 1965–1999 35 0Redistribution as % of GDP, 1985–1995 0.9% 3.8%ELF (most disaggregated level) 0.95 0.85ELF (at the aggregated level of language families) 0.55 0.01Polarization (most disaggregated level) 0.18 0.43Polarization (at the aggregated level of language families) 0.89 0.02
324 K. Desmet et al. / Journal of Development Economics 97 (2012) 322–338
performance. In our data, the 10% most diverse countries had anaverage per capita growth rate of a meager 0.54% over the period1960–2004, whereas the 10% least diverse countries posted a muchmore sturdyfigure of 2.59% (linguistic diversity here ismeasured usingthe most disaggregated classification of languages).
In spite of their high ethnolinguistic fractionalization, in terms ofconflict and civil war Chad and Zambia have been at opposite sides ofthe spectrum. Chad has been at war almost continuously sinceindependence, whereas Zambia has not witnessed any civil conflictworth speaking of. In Chad, during colonization, and after indepen-dence in 1960, the Christian South was privileged, and formed thepolitical elite, to the detriment of the Islamic and partly Arab-speakingNorth. Dissatisfaction by the North led to a civil war, which started in1965, and lasted for about a decade and a half, culminating in therebels taking over the capital and ending Southern dominance. Sincethen the country has remained unstable, partly because of theinverted power relation, with the North now dominating the South,but also because of power struggles within these regions. In recentyears, for example, there has been increasing ethnic tension betweenthe Zaghawa and Tama, two non-Arab groups. Zambia, in contrast, hashad a history of peaceful coexistence between the many groups andtribes. Although voting behavior in Zambia tends to run alonglanguage groups (Posner, 2003), it has not led to the violence seenin countries such as Chad. Income redistribution, which is an issueinvolving divergence of interests, is often interpreted as related toconflict. Data on redistribution confirm the contrast between bothcountries: figures on transfers and subsidies as a share of GDP revealthat on average between 1985 and 1995 Chad redistributed 0.9% ofGDP, compared to 3.8% in Zambia.
This example illustrates the main point of this paper: althoughcommonly used measures of diversity make Chad and Zambia lookvery similar, those measures mask one important differencebetween these countries in terms of diversity. Of the total populationin Chad, one third speaks an Afro-Asiatic language, a little over half aNilo-Saharan language, and the rest a language of the Niger-Congofamily. In contrast, in Zambia, 99.5% of the population speaks alanguage from the Niger-Congo family. This raises an importantpoint: whereas Chad and Zambia are amongst the most diversecountries on the globe, when considering language families ratherthan individual languages, we obtain a very different picture. WhileChad continues to be one of the most diverse countries, ranking 7 outof 225, Zambia now looks very homogeneous, ranking 176 out of225, similar to Portugal. In other words, when taking every languageas being different, Zambia is very diverse, similar to Chad, whereaswhen aggregating into language families, Zambia no longer appearsto be quite so heterogeneous.
In the example of Chad and Zambia, both countries are very diverseat low levels of aggregation, but only Chad continues to be very diverseat high levels of aggregation. It may be useful to consider an examplethat goes in the other direction. Afghanistan has about 50 languages,whereas Sri Lanka only 7, making Afghanistan relatively much morediverse at low levels of aggregation. However, at high levels ofaggregation both countries are similar: 80% of their populations speakan Indo-European language, with a 20%minority of mostly Dravidian in
the case of Sri Lanka and Altaic in Afghanistan. In this case, we wouldexpect both countries to exhibit similar levels of conflict, but Sri Lankashould outperform Afghanistan in terms of economic growth. Consis-tent with this prediction, between 1948 and 1999 Afghanistanexperienced civil conflict for 22 years and Sri Lanka for 18 years. Incontrast, annual growth in real GDP per capita between 1970 and 2000was−4% in Afghanistan, and +4% in Sri Lanka.
The experience of these different country pairs suggests that thetype of diversity that matters for economic growth is different fromthe type of diversity that matters for civil conflict and redistribution.The essential difference between the two types of diversity is thedegree of aggregation. The relevant degree of aggregation, and thusthe relevant definition of a group, depends on the problem at hand.This case study suggests that, for economic growth, fine differencesbetween languages may matter, whereas for civil conflict andredistribution, only coarse differences may play a role — as isconfirmed below in large samples.6
2.2. Language trees and linguistic diversity
2.2.1. The construction of language treesThis paper seeks to measure linguistic diversity at different levels
of aggregation. To do so, we use language trees. We refer to this as aphylogenetic approach (as the linguistics literature does), referring tothe fact that tree diagrams capture the genealogy of languages,classified in terms of their family structure.7 Using language treesgives a historical dimension to our analysis. Coarse linguistic divisions,such as that between Indo-European and non Indo-Europeanlanguages, describe cleavages that originate several thousand yearsago. In contrast, finer divisions, such as that between Dutch andGerman, tend to be the result of more recent splits. For instance, Grayand Atkinson (2003) estimate separation times between languagegroups within the Indo-European family. While the separationbetween Indo-European languages and all others is estimated tohave occurred prior to 8700 years ago, the separation time betweendifferent dialects of Modern Greek is estimated to have occurred only800 years ago. There are differences of opinion between linguists onthe precise dates, but the general point of an association between treestructure and separation times remains. We do not require that therebe a strict association between the coarseness of the linguisticclassification and the time since the linguistic split between groupsoccurred — we only point out that coarse classifications capturecleavages that tend to go back deeper in the past.
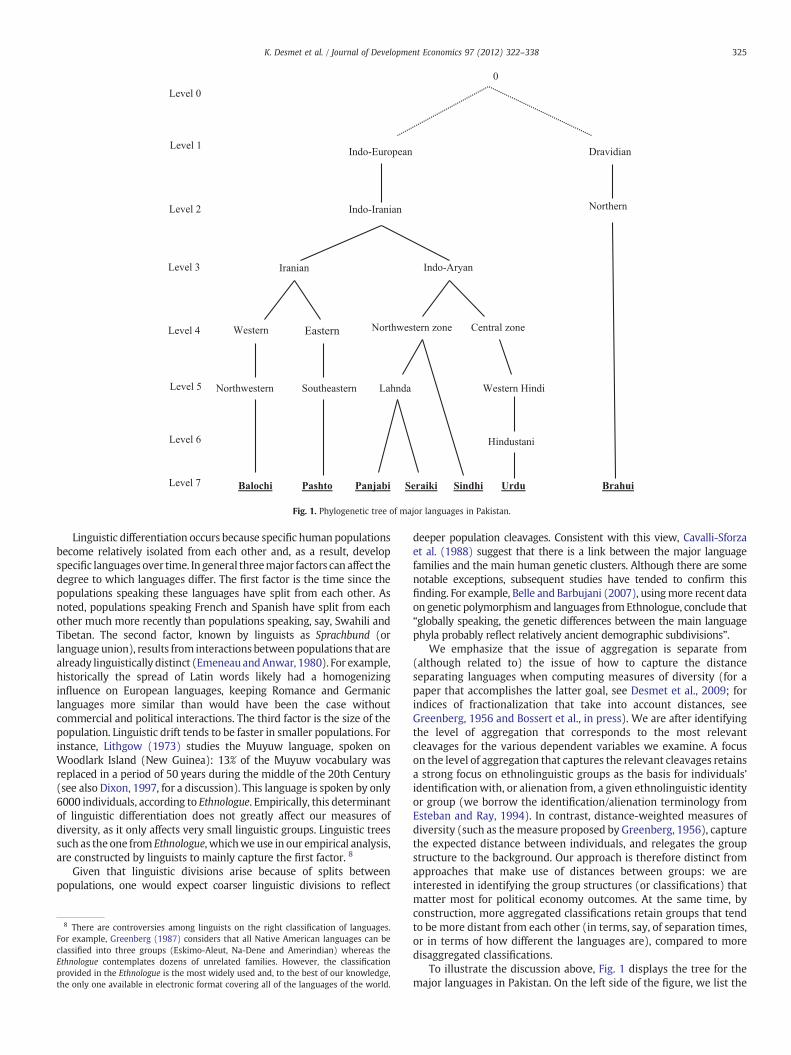
Fig. 1. Phylogenetic tree of major languages in Pakistan.
325K. Desmet et al. / Journal of Development Economics 97 (2012) 322–338
Linguistic differentiation occurs because specific human populationsbecome relatively isolated from each other and, as a result, developspecific languages over time. In general threemajor factors can affect thedegree to which languages differ. The first factor is the time since thepopulations speaking these languages have split from each other. Asnoted, populations speaking French and Spanish have split from eachother much more recently than populations speaking, say, Swahili andTibetan. The second factor, known by linguists as Sprachbund (orlanguage union), results from interactions between populations that arealready linguistically distinct (EmeneauandAnwar, 1980). For example,historically the spread of Latin words likely had a homogenizinginfluence on European languages, keeping Romance and Germaniclanguages more similar than would have been the case withoutcommercial and political interactions. The third factor is the size of thepopulation. Linguistic drift tends to be faster in smaller populations. Forinstance, Lithgow (1973) studies the Muyuw language, spoken onWoodlark Island (New Guinea): 13% of the Muyuw vocabulary wasreplaced in a period of 50 years during the middle of the 20th Century(see also Dixon, 1997, for a discussion). This language is spoken by only6000 individuals, according to Ethnologue. Empirically, this determinantof linguistic differentiation does not greatly affect our measures ofdiversity, as it only affects very small linguistic groups. Linguistic treessuch as the one from Ethnologue, whichwe use in our empirical analysis,are constructed by linguists to mainly capture the first factor. 8
Given that linguistic divisions arise because of splits betweenpopulations, one would expect coarser linguistic divisions to reflect
8 There are controversies among linguists on the right classification of languages.For example, Greenberg (1987) considers that all Native American languages can beclassified into three groups (Eskimo-Aleut, Na-Dene and Amerindian) whereas theEthnologue contemplates dozens of unrelated families. However, the classificationprovided in the Ethnologue is the most widely used and, to the best of our knowledge,the only one available in electronic format covering all of the languages of the world.
deeper population cleavages. Consistent with this view, Cavalli-Sforzaet al. (1988) suggest that there is a link between the major languagefamilies and the main human genetic clusters. Although there are somenotable exceptions, subsequent studies have tended to confirm thisfinding. For example, Belle and Barbujani (2007), usingmore recent dataon genetic polymorphism and languages fromEthnologue, conclude that“globally speaking, the genetic differences between the main languagephyla probably reflect relatively ancient demographic subdivisions”.
We emphasize that the issue of aggregation is separate from(although related to) the issue of how to capture the distanceseparating languages when computing measures of diversity (for apaper that accomplishes the latter goal, see Desmet et al., 2009; forindices of fractionalization that take into account distances, seeGreenberg, 1956 and Bossert et al., in press). We are after identifyingthe level of aggregation that corresponds to the most relevantcleavages for the various dependent variables we examine. A focuson the level of aggregation that captures the relevant cleavages retainsa strong focus on ethnolinguistic groups as the basis for individuals'identification with, or alienation from, a given ethnolinguistic identityor group (we borrow the identification/alienation terminology fromEsteban and Ray, 1994). In contrast, distance-weighted measures ofdiversity (such as themeasure proposed by Greenberg, 1956), capturethe expected distance between individuals, and relegates the groupstructure to the background. Our approach is therefore distinct fromapproaches that make use of distances between groups: we areinterested in identifying the group structures (or classifications) thatmatter most for political economy outcomes. At the same time, byconstruction, more aggregated classifications retain groups that tendto be more distant from each other (in terms, say, of separation times,or in terms of how different the languages are), compared to moredisaggregated classifications.
To illustrate the discussion above, Fig. 1 displays the tree for themajor languages in Pakistan. On the left side of the figure, we list the

Fig. 2. Hypothetical language tree.
326 K. Desmet et al. / Journal of Development Economics 97 (2012) 322–338
level of aggregation. At level 7, the most disaggregated level, there areseven main languages: Panjabi, Pashto, Sindhi, Seraiki, Urdu, Balochi,and Brahui. Going up the tree, the number of groups declines, as thelevel of aggregation rises. For instance, at level 4, there are only fivelinguistic groups — at that level, Panjabi, Seraiki and Sindhi areclassified as one and the same. At level 3, only three linguistic groupsare left (Iranian, Indo-Aryan and Northern Dravidian). Finally, ataggregation level one, there are two groups: Dravidian (Brahui) andIndo-European (all others). These classifications allow us to computemeasures of diversity at each level of aggregation.
2.2.2. Measuring diversity at different levels of aggregationHow precisely are the measures of diversity computed? An
example of how a language tree looks like is shown in Fig. 2. Theroot of the tree is represented by the upper-case letter O, whereas theleafs of the tree are represented by lower-case letters a through c. InFig. 2, all leafs have a common root, so that the tree is rooted (thisterminology is borrowed from the field of linguistics). As can be seen,the tree has three different levels. Each of the seven leafs at level 2represents a living language. The three nodes at level 1 represent the(extinguished) mother languages of the existing languages. Thesecorrespond to the proto-languages of the different families, such asIndo-European or Sino-Tibetan. The node at level 0 represents the
Fig. 3. Typical language tr
hypothetical common ancestor language of all families, referred to bylinguists as Proto-Human. The number below each living language atlevel 2 indicates the assumed shares of the population speaking thecorresponding language. The numbers below the (extinguished)mother languages at level 1 are the aggregated population shares oftheir corresponding daughter languages.
To compute diversity at different levels, we require that the tree berooted, and that thenumber of branches (or edges) between any leaf andthe root be identical. In this subsection, we focus on the widely usedindex of ethnolinguistic fractionalization (or ELF), the probability thattwo randomly picked individuals belong to different groups (in ourempirical work we also consider measures of polarization). Thediversity measure at a given level of aggregation is the ELF index forthe linguistic groups as they appear at that level. For example, diversityat level 2 is given by the ELF index, taking the seven living languages asthe relevant groups. Thus, ELF 2ð Þ = 1−3 × 0:22
� �−4 × 0:12
� �=
0:84. To calculate diversity at level 1, the seven living languages areaggregated into 3 distinct groups A, B and C, resulting in an ELF indexELF 1ð Þ = 1−0:42−2 × 0:12
� �= 0:66.
One difficulty remains. The linguistic tree from Ethnologue is arooted tree, but the number of branches varies among linguisticfamilies and subfamilies. Fig. 3 depicts a generic language tree such asthe one from Ethnologue. If we look at the proto-languages of the
ee from Ethnologue.

327K. Desmet et al. / Journal of Development Economics 97 (2012) 322–338
different families (Level 1), we can see that A has more descendentgenerations than B or C. As before, the leafs of the tree represent theexisting languages. They are denoted by the letters a11, a12, a21, a22,a31, a32, b11, b12, b2, c1 and c2. It is clear that for this type of tree wecannot use the method applied in Fig. 2, because at level 3 we wouldbe ignoring 3 of the 11 languages. The branches in the tree need to beextended, and there are two main ways to do this, as displayed in thetwo panels of Fig. 4. This ensures that all the existing languages arerepresented as leafs at the lowest level of aggregation.
The first approach, displayed in Panel I of Fig. 4, assumes that allliving languages are equally distant from the proto-languages of theirrespective families, where the distance between languages is definedby the number of branches or nodes separating them (in technicalterms, this assumes that the tree is ultrametric). Take, for example,language c1. We insert a fictitious language, c1*, at level 2, so that thetotal number of branches between c1 and the origin language of thefamily, C, is the same as for all other leafs. The second approach,displayed in Panel II of Fig. 4, assumes that c1 is only one branchremoved from its origin language C. In this case, Fig. 4 shows that tohave all living languages at the same level, we move c1 down to level
Fig. 4. Two differen
3, but assume that its mother and grandmother have all remained thesame as the origin language C.
In our empirical work, we favor measures based on the firstapproach, because it is reasonable to assume that languages wentthrough intermediate states between the proto-languages of theirrespective families and their current form. The second approach, incontrast, assumes that some origin languages remained unchangeduntil recently. A further advantage of the first approach is that it doesnot change the “family relations” of the original Ethnologue trees.For example, in Fig. 3 language b1 has a sister b2 and a mother B; thisis still so under the first approach, but not under the secondapproach, where the mother and the sister of b1 are now the samelanguage.
Although there are good reasons to prefer the first approach, for thesake of robustness we also computed and used measures based on thesecond approach. Using either approach did not make much differencefor our empirical results. Based on either approach, our empirical resultsshow that diversity measures based on either the highest level ofaggregationor the lowest level of aggregationmattermost. FromFig. 4 itis easy to see that, at the two extremes, both approaches are identical, so
t approaches.

Table 2Summary statistics for ethnolinguistic diversity measures.
Panel A. Means and standard deviations
Variable Mean Std. Dev. Min Max
ELF(1) 0.156 0.180 0.000 0.647ELF(3) 0.241 0.221 0.000 0.818ELF(6) 0.328 0.272 0.000 0.941ELF(10) 0.394 0.301 0.000 0.989ELF(15) 0.412 0.308 0.000 0.990POL(1) 0.283 0.314 0.000 0.999POL(3) 0.384 0.316 0.000 0.998POL(6) 0.423 0.297 0.000 0.996POL(10) 0.435 0.279 0.000 0.996POL(15) 0.432 0.278 0.000 0.996
Panel B. Correlations
ELF(1) ELF(3) ELF(6) ELF(10) ELF(15) POL(1) POL(3) POL(6) POL(10)
ELF(3) 0.770 1ELF(6) 0.579 0.826 1ELF(10) 0.544 0.708 0.848 1ELF(15) 0.526 0.672 0.798 0.977 1POL(1) 0.988 0.754 0.565 0.530 0.514 1POL(3) 0.720 0.939 0.788 0.683 0.651 0.737 1POL(6) 0.545 0.691 0.821 0.697 0.654 0.563 0.763 1POL(10) 0.444 0.568 0.643 0.664 0.638 0.466 0.637 0.838 1POL(15) 0.391 0.513 0.595 0.542 0.555 0.408 0.572 0.777 0.925
226 observations.
9 Although we find that the correlation between fractionalization and polarizationincreases with aggregation, it is easy to find counterexamples for which this is nottrue. The intuition for why this result does not always hold is related to the fact thatfractionalization decreases with aggregation, whereas polarization could increase ordecrease with aggregation. Of course, at the highest level of aggregation, mostcountries have only one or two groups left, in which case the two indices coincide (upto a constant). This explains the correlation of 0.988 between ELF(1) and POL(1).10 For instance, if we consider countries with more than half a million inhabitants, 23of the 30 most diverse countries in the world are located in Sub-Saharan Africa at themost disaggregated level (ELF(15)). At the least diaggregated level (ELF(1)), only 10 ofthe 30 most diverse countries are in this region.
328 K. Desmet et al. / Journal of Development Economics 97 (2012) 322–338
that using one or the other should make no difference (we report onthese empirical results in greater details in Section 5).
2.3. Measurement, summary statistics and specification
We consider two sets of commonly used measures of diversity:fractionalization and polarization. For i(j)=1,…,N(j) groups of size si(j),where j=1,…, J denotes the level of disaggregation at which the groupshares are considered, fractionalization is just the probability that twoindividuals chosen at random, will belong to different groups:
ELF jð Þ = 1� ∑N jð Þ
i jð Þ=1si jð Þh i2 ð1Þ
This measure is maximized when each individual belongs to adifferent group. Polarization, in contrast, is maximizedwhen there aretwo groups of equal size. We use the polarization measure fromMontalvo and Reynal-Querol (2005). This index satisfies the condi-tions for a desirable index of polarization in the axiomatic approach ofEsteban and Ray (1994):
POL jð Þ = 4 ∑N jð Þ
i jð Þ=1si jð Þh i2
1� si jð Þh i
ð2Þ
We compute these measures at each of the 15 levels of aggregationavailable in the linguistic classification in the 15th edition of Ethnologue,the source for our linguistic data (Ethnologue, 2005). The samplecontains 226 observations which include countries and their depen-dencies (due to data availability, our regression results are based on asmaller set of countries). Table 2 presents summary statistics for thediversity measures at 5 levels of aggregation (an online Appendixcontains the corresponding data series by country). To facilitate thequantitative assessment of the regression results, Panel A displaysmeans and standard deviations. When measured using the ELF index,the average degree of diversity rises as the level of aggregation falls, asexpected. When measured using a polarization index, diversity falls athigh levels of aggregation, and plateaus as aggregation falls further. Tosimplify the presentation of our results, in the empirical sections wefocus on only 3 levels of aggregation (levels 1, 6 and 15, with highernumbers denoting a lower degree of aggregation). All our empiricalresults are also available at the other levels.
Interesting information can also be gleaned from Panel B ofTable 2, displaying correlations. First, changing the level of aggrega-tion greatly affects the measures of diversity: the correlation betweenELF(1) and ELF(15) is only 0.526. Second, the correlation betweenpolarization and fractionalization, at the same levels of aggregation,rises as the level of aggregation increases (the correlation betweenPOL(15) and ELF(15) is only 0.555, while the correlation between ELF(1) and POL(1) is 0.988). This is intuitive as, when aggregating, fewergroups remain, and the distinction between polarization andfractionalization fades.9 Third, aggregating up is not the same asswitching from a measure of fractionalization to a measure ofpolarization: the correlation between ELF(1) and POL(15) is only0.391. This last observation indicates that the issue of aggregation isvery different from the choice of functional form to compute diversitymeasures. In our empirical work, we show that switching fromfractionalization to polarizationmeasures has relatively benign effectson the substantive results, while changing the level of aggregation tocompute either measure delivers vastly different estimates of theeffect of diversity on political economy outcome.
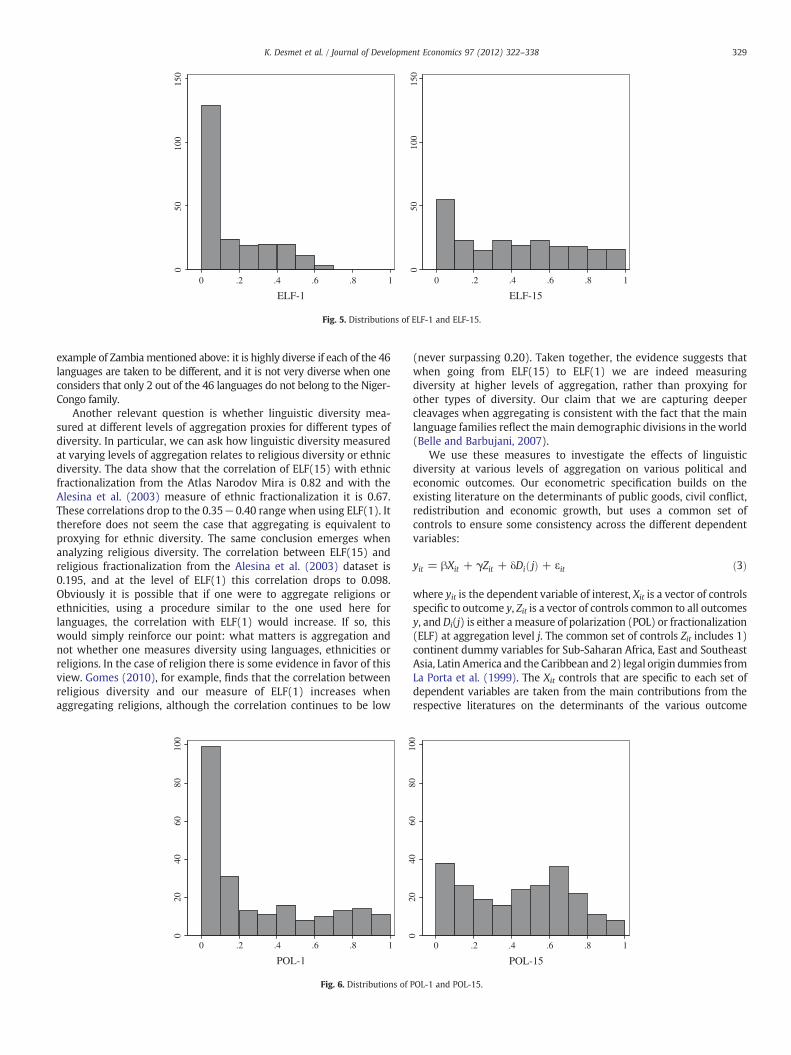
Finally, Figs. 5 and 6 display the full distributions of ELF(1), ELF(15),POL(1) and POL(15). As can be seen, at high levels of aggregation thedistributions of both fractionalization (ELF(1)) and polarization (POL(1))have a strongpositive skew. Thismakes sense:whenclassifying languagesto be different only when they pertain to entirely different families, mostcountries display low levels of diversity, and only a few exhibit highdiversity. In contrast, at low levels of aggregation the distributions offractionalization (ELF(15)) and polarization (POL(15)) are much moreuniform. That is, many of the countries that were not diverse when onlylooking at language families are now much more diverse.10 This is the
050
100
150
0 .2 .4 .6 .8 1
ELF-1
050
100
150
0 .2 .4 .6 .8 1
ELF-15
Fig. 5. Distributions of ELF-1 and ELF-15.
329K. Desmet et al. / Journal of Development Economics 97 (2012) 322–338
example of Zambiamentioned above: it is highly diverse if each of the 46languages are taken to be different, and it is not very diverse when oneconsiders that only 2 out of the 46 languages do not belong to the Niger-Congo family.
Another relevant question is whether linguistic diversity mea-sured at different levels of aggregation proxies for different types ofdiversity. In particular, we can ask how linguistic diversity measuredat varying levels of aggregation relates to religious diversity or ethnicdiversity. The data show that the correlation of ELF(15) with ethnicfractionalization from the Atlas Narodov Mira is 0.82 and with theAlesina et al. (2003) measure of ethnic fractionalization it is 0.67.These correlations drop to the 0.35−0.40 range when using ELF(1). Ittherefore does not seem the case that aggregating is equivalent toproxying for ethnic diversity. The same conclusion emerges whenanalyzing religious diversity. The correlation between ELF(15) andreligious fractionalization from the Alesina et al. (2003) dataset is0.195, and at the level of ELF(1) this correlation drops to 0.098.Obviously it is possible that if one were to aggregate religions orethnicities, using a procedure similar to the one used here forlanguages, the correlation with ELF(1) would increase. If so, thiswould simply reinforce our point: what matters is aggregation andnot whether one measures diversity using languages, ethnicities orreligions. In the case of religion there is some evidence in favor of thisview. Gomes (2010), for example, finds that the correlation betweenreligious diversity and our measure of ELF(1) increases whenaggregating religions, although the correlation continues to be low
020
4060
8010
0
0 .2 .4 .6 .8 1
POL-1
Fig. 6. Distributions of
(never surpassing 0.20). Taken together, the evidence suggests thatwhen going from ELF(15) to ELF(1) we are indeed measuringdiversity at higher levels of aggregation, rather than proxying forother types of diversity. Our claim that we are capturing deepercleavages when aggregating is consistent with the fact that the mainlanguage families reflect the main demographic divisions in the world(Belle and Barbujani, 2007).
We use these measures to investigate the effects of linguisticdiversity at various levels of aggregation on various political andeconomic outcomes. Our econometric specification builds on theexisting literature on the determinants of public goods, civil conflict,redistribution and economic growth, but uses a common set ofcontrols to ensure some consistency across the different dependentvariables:
yit = βXit + γZit + δDi jð Þ + εit ð3Þ
where yit is the dependent variable of interest, Xit is a vector of controlsspecific to outcome y, Zit is a vector of controls common to all outcomesy, and Di(j) is either a measure of polarization (POL) or fractionalization(ELF) at aggregation level j. The common set of controls Zit includes 1)continent dummy variables for Sub-Saharan Africa, East and SoutheastAsia, Latin America and the Caribbean and 2) legal origin dummies fromLa Porta et al. (1999). The Xit controls that are specific to each set ofdependent variables are taken from the main contributions from therespective literatures on the determinants of the various outcome
020
4060
8010
0
0 .2 .4 .6 .8 1
POL-15
POL-1 and POL-15.

Table 3Civil conflict and linguistic diversity (1945–1999). Dependent variable: onset of civil war, logit estimator.
(1) (2) (3) (4) (5) (6)ELF(1) ELF(6) ELF(15) POL(1) POL(6) POL(15)
ELF (at different levels of aggregation) 1.157 0.040 −0.165[0.545]⁎⁎ [0.417] [0.466]
POL (at different levels of aggregation) 0.720 −0.324 −0.669[0.318]⁎⁎ [0.427] [0.483]
Lagged civil war −0.901 −0.852 −0.845 −0.913 −0.870 −0.874[0.255]⁎⁎⁎ [0.257]⁎⁎⁎ [0.259]⁎⁎⁎ [0.257]⁎⁎⁎ [0.265]⁎⁎⁎ [0.259]⁎⁎⁎
Log lagged GDP/cap −0.616 −0.613 −0.627 −0.615 −0.619 −0.610[0.140]⁎⁎⁎ [0.152]⁎⁎⁎ [0.153]⁎⁎⁎ [0.140]⁎⁎⁎ [0.146]⁎⁎⁎ [0.143]⁎⁎⁎
Log lagged population 0.311 0.293 0.300 0.310 0.300 0.298[0.068]⁎⁎⁎ [0.071]⁎⁎⁎ [0.071]⁎⁎⁎ [0.067]⁎⁎⁎ [0.071]⁎⁎⁎ [0.069]⁎⁎⁎
% mountainous 0.009 0.009 0.009 0.009 0.008 0.009[0.005]⁎ [0.005]⁎ [0.005]⁎ [0.005]⁎ [0.005]⁎ [0.004]⁎⁎
Noncontiguous state dummy 0.616 0.518 0.511 0.639 0.445 0.432[0.357]⁎ [0.355] [0.349] [0.360]⁎ [0.365] [0.361]
Oil exporter dummy 0.621 0.724 0.746 0.601 0.742 0.783[0.246]⁎⁎ [0.243]⁎⁎⁎ [0.245]⁎⁎⁎ [0.248]⁎⁎ [0.241]⁎⁎⁎ [0.244]⁎⁎⁎
New state dummy (1st or 2nd year from independence) 1.766 1.775 1.780 1.763 1.783 1.793[0.367]⁎⁎⁎ [0.369]⁎⁎⁎ [0.368]⁎⁎⁎ [0.367]⁎⁎⁎ [0.370]⁎⁎⁎ [0.373]⁎⁎⁎
Instability dummy (3 years prior) 0.643 0.646 0.645 0.645 0.649 0.661[0.214]⁎⁎⁎ [0.218]⁎⁎⁎ [0.217]⁎⁎⁎ [0.213]⁎⁎⁎ [0.217]⁎⁎⁎ [0.217]⁎⁎⁎
Democracy lagged (Polity 2) 0.016 0.019 0.020 0.016 0.020 0.020[0.020] [0.021] [0.021] [0.020] [0.021] [0.021]
French legal origin dummy 1.383 1.453 1.553 1.396 1.571 1.686[0.648]⁎⁎ [0.673]⁎⁎ [0.665]⁎⁎ [0.646]⁎⁎ [0.651]⁎⁎ [0.640]⁎⁎⁎
UK legal origin dummy 0.947 1.152 1.267 0.938 1.252 1.399[0.672] [0.705] [0.725]⁎ [0.670] [0.668]⁎ [0.648]⁎⁎
Socialist legal origin dummy 1.126 1.237 1.282 1.133 1.299 1.408[0.694] [0.707]⁎ [0.697]⁎ [0.693] [0.701]⁎ [0.692]⁎⁎
Latin America and Caribbean dummy 0.094 0.112 0.054 0.113 −0.015 −0.107[0.385] [0.404] [0.407] [0.383] [0.412] [0.411]
Sub-Saharan Africa dummy 0.165 0.156 0.176 0.182 0.101 0.041[0.342] [0.330] [0.320] [0.344] [0.329] [0.335]
East and Southeast Asia dummy 0.246 0.266 0.294 0.275 0.263 0.270[0.298] [0.316] [0.324] [0.298] [0.309] [0.298]
Constant −4.425 −4.205 −4.160 −4.459 −4.108 −4.125[1.604]⁎⁎⁎ [1.627]⁎⁎⁎ [1.623]⁎⁎ [1.599]⁎⁎⁎ [1.611]⁎⁎ [1.604]⁎⁎
Robust standard errors, clustered at the level of countries, in parentheses.All columns involve 5733 observations from 142 countries from 1945 to 1999.The table reports logit coefficients, not marginal effects.Results are robust to controlling for the growth of GDP per capita, the growth of GDP per capita lagged, a lagged dichotomous indicator of democracy (instead of the Polity2 index), asquared term for ELF (or POL), a dummy for the new world (and interaction between the new world dummy and diversity), and an anocracy dummy. Results are also robust tointroducing ELF(1), ELF(6) and ELF(15) simultaneously (or, similarly, POL(1), POL(6) and POL(15)).The data is from Fearon and Laitin (2003), except for ELF (authors' calculations from Ethnologue database) and legal origin (from LLSV, 1999).
⁎ Significant at 10%.⁎⁎ Significant at 5%.⁎⁎⁎ Significant at 1%.
330 K. Desmet et al. / Journal of Development Economics 97 (2012) 322–338
variables under consideration (these are detailed in the followingsection — for instance, the civil conflict specification includes variablesfrom Fearon and Laitin, 2003).11 The estimation method also followsthese major contributions, though we strive to use cross sectionalapproacheswhenever possible since ourmeasures of linguistic diversitydo not vary through time (only in the case of civil conflict onset do weuse a pooled panel probit approach as this is the only way to study thedeterminants of conflict onset).
The main coefficient of interest in our study is δ, the partialcorrelation of linguistic diversity and each relevant political oreconomic outcome. Caution should be exercised when interpretingδ causally. We follow the literature in considering that linguisticdiversity is a highly time persistent variable that is likely to be largelyhistorically determined well before our dependent variables areobserved. On the other hand, the possibility of reverse causalitycannot be entirely ruled out, as discussed in Alesina et al. (2003) andCaselli and Coleman (2010). Thus, we refrain from causal statements,as causality is not the main focus of this paper.
11 Further, we use the broadest set of controls from these existing studies. Togetherwith the consistent addition of the Z variables in all specifications, this should limit theincidence of omitted variables bias.
3. Linguistic diversity, civil conflict and redistribution
3.1. Civil conflict
There is an ongoing academic debate on the relationship betweenethnolinguistic diversity and the onset of civil conflict. In a seminalpaper, Fearon and Laitin (2003) argued that once measures of incomeper capita are controlled for, measures of ethnic and religiousfractionalization areunrelated to theonsetof civil conflict.We reexaminethis issue using the baseline specification in Fearon and Laitin's study(column 1 of their Table 1, page 84), augmented with our Z controls.Using their data, their estimation method and their dependent variable(the onset of civil conflict), we simply substitute our measures oflinguistic heterogeneity for their measure of ethnic fractionalization.Results are presented in Table 3 for selected representative levels ofaggregation (1, 6 and 15). The standardized magnitude of the effects oflinguistic fractionalization on the probability of conflict onset isdisplayed graphically at all levels of aggregation in Fig. 7.12
12 The standardized magnitude is computed as the effect of a one standard deviationchange in linguistic diversity at each level of aggregation as a percentage of the meanprobability of conflict.

13 Our paper uses linguistic heterogeneity rather than ethnic differences, so by ourmeasures the US would look quite more homogeneous than if we focused on ethnicity.This would affect our results in the direction of making it less likely to find any effect ofdiversity on redistribution.
-5%
0%
5%
10%
15%
20%
25%
90% C.I. (upper bound)
-25%
-20%
-15%
-10%
1 3 5 7 9 11 13 15
Mar
gina
l eff
ect
of E
LF
on
the
prob
abili
ty o
f on
set
Level of aggregation
90% C.I. (lower bound)
Fig. 7. Marginal effect of a one standard deviation increase in ELF (as % of the mean probability of civil conflict onset).
331K. Desmet et al. / Journal of Development Economics 97 (2012) 322–338
The first and most important observation is that the effect offractionalization and the corresponding level of statistical significanceboth fall dramatically and monotonically when the level of aggregationfalls. At level j=1 (the most aggregated level), linguistic fractionaliza-tionhas a coefficient of 1.157with a t-statistic of 2.12, and the coefficientfalls to −0.165 with a t-statistic of 0.35 at level j=15. This pattern isrobust to using polarization instead of fractionalization. The secondobservation is that the coefficient on linguistic diversity is only positiveand significant when considering the most aggregated classification oflanguages — whether for polarization or for fractionalization. Thecoefficient remains significant at least at the 10% level for most of therobustness tests we conducted — but since the level of significancesometimes falls below 5%wewant to be cautious in claiming that thereexists a robust relationship even at this level of aggregation. Aconservative reading of our results suggests that, to the extent there isa statistically significant link between diversity and civil conflict, it onlyappears when the relevant cleavages are the deepest (aggregation level1). In terms of economic magnitude, the estimated effects are far fromtrivial at aggregation level 1. When evaluating marginal effects at themean of all the independent variables, a one standard deviation changein linguistic fractionalization (0.173) is associated with an increase inthe probability of conflict equal to roughly 13% of this variable's mean(the mean probability of civil war onset is 1.666% in the sample). Thiseffect quickly fades to zero as the level of aggregation falls, as displayedgraphically in Fig. 7. The standardized magnitude is similar forpolarization at aggregation level 1, and fades to zero also.
The pattern of coefficients across levels of aggregation is robust to awide range of modifications of the baseline specification for fraction-alization: 1) substituting a dichotomous measure of democracy for thecontinuous one, 2) controlling for intermediate levels of democracy(anocracy), 3) redefining civil wars to only include “ethnic” civil wars(as defined in Fearon and Laitin, 2003), 4) using the Correlates of Wardefinition of civil wars instead of Fearon and Laitin's, 5) controlling forGDP growth and lagged growth and 6) using the incidence of conflictrather than the onset, as Montalvo and Reynal-Querol (2005) did intheir study. These results are available upon request. In addition to thesechecks, which are specific to civil conflict, we also run a number offurther robustness tests that are common across the differentdependent variables. We discuss those in Section 5.
As shown in Figs. 5 and 6, most countries in the world appear veryhomogeneous at level 1. Countries that do feature such cleavages tendto coincide with the geographic breakpoints of major linguisticgroups, such as in Chad. Our results indicate that ethnolinguisticdivisions of this nature may matter for civil conflict, but that more
superficial divisions do not. Since there are few countries that featurehigh levels of diversity at the very aggregated level of linguisticfamilies, civil conflict related to this type of cleavage must berelatively rare.
Where does this leave us in the debate about the role ofethnolinguistic diversity as a determinant of civil wars? On the onehand, for all but one level of aggregation, ethnic diversity does notmatter. Aswas recognized in the past literature, this does not imply thatcivil conflicts do not often have an ethnic dimension — conditional onhaving a civil conflict, it may very well be waged along ethnic orlinguistic lines (for instance ethnolinguistic differences may helpidentify combatants, as in the famous Biblical example of theshibboleth). This is compatible with a finding that linguistic diversityis unrelated to the probability of conflict onset. On the other hand, wedidfind that the significance andmagnitudeof diversity rises as the levelof aggregation increases. To the extent that civil conflict is associatedwith the “us” versus “them” divide, this result helps clarify that “us” and“them” need to be separated by deep historical and cultural cleavagesfor these divides to have any claim of affecting the onset of civil conflict.Caselli and Coleman (2010) provide a possible explanation for thisfinding. They argue that large differences make groups less porous.Changing sides is difficult and costly, thus giving the winning groupexclusive access to the gains from the conflict.
3.2. Redistribution
Avast literatureexamines the roleof ethnic and linguistic differencesas a determinant of the extent of income redistribution. At themicroeconomic level, several authors have examined the propensityto redistribute. For instance, Luttmer and Fong (2009) find in anexperimental setting that people donate more money to HurricaneKatrina victims when the victims are perceived to be of the sameethnicity as the donor. In another study, Luttmer (2001) reports that“individuals increase their support for welfare spending as the share oflocal recipients from their own racial group rises”, using data from theUnited States, also suggesting a preference channel. These results are inline with those of Alesina et al. (2001), as well as Alesina and Glaeser(2004), arguing that the U.S. redistributes less than Europe in partbecause of its greater degree of ethnic heterogeneity.13

332 K. Desmet et al. / Journal of Development Economics 97 (2012) 322–338
At the cross-country level, results are more mixed. While thepreponderance of evidence points to a negative association betweenethnolinguistic fractionalization and redistribution, this finding is notalways robust to the use of alternative measures of diversity and tothe inclusion of controls. For instance, in Alesina et al. (2003), theeffect of ethnolinguistic fractionalization on the share of transfers andsubsidies to GDP appears sensitive, in terms of statistical significance,to the inclusion of several control variables. This study measuresfractionalization using a rather disaggregated classification of ethnicand linguistic groups. In a broad cross-country sample, Desmet et al.(2009) find that linguistic diversity, measured to account for thedistance between groups, is negatively associated with redistribution,measured by the share of transfers and subsidies in GDP. However,this result does not hold when measures of diversity do not accountfor the degree of linguistic distance between groups, suggesting thatthe depth of linguistic cleavages matters. In a wide variety of settings,ethnolinguistic diversity seems associated with lower redistribution,but what cleavages are more or less relevant to account for thesefindings has not been determined.
We start from the specification and data in Desmet et al. (2009) toexamine what level of linguistic aggregation matters for redistribution,i.e.what are the relevant cleavages. Thedependent variable is the averageshare of transfers and subsidies in GDP between 1985 and 1995. Thespecification is the one that involves the broadest set of control variables— including GDP per capita, country size and the percentage of thepopulation over 65 (Table 2, column8 inDesmet et al., 2009), augmentedby our Z controls. Table 4 present the results for fractionalization andpolarization. The results for both measures are similar, and reveal a
Table 4Redistribution and linguistic diversity (1985–1995). Dependent variable: transfers and sub
(1) (2)ELF(1) ELF(6)
ELF (at different levels of aggregation) −4.472 −1.812[2.036]⁎⁎ [1.364]
POL (at different levels of aggregation)
Log GDP per capita 1985–95 1.274 1.173[0.557]⁎⁎ [0.558]⁎⁎
Log population 1985–95 0.265 0.335[0.300] [0.302]
Population above 65 0.877 0.893[0.137]⁎⁎⁎ [0.147]⁎⁎⁎
Small island dummy −6.237 −5.766[2.336]⁎⁎⁎ [2.123]⁎⁎⁎
Latitude 4.137 5.080[4.735] [4.668]
UK legal origin dummy 3.879 3.297[2.633] [2.775]
French legal origin dummy 4.526 4.472[2.692]⁎ [2.857]
Socialist legal origin dummy 8.894 8.275[3.557]⁎⁎ [3.617]⁎⁎
Scandinavian legal origin dummy 5.548 4.751[2.915]⁎ [2.990]
Latin America & Caribbean dummy −1.845 −2.309[1.102]⁎ [1.168]⁎
Sub-Saharan Africa dummy −0.289 −0.343[1.132] [1.156]
East and Southeast Asia dummy −4.193 −4.193[1.834]⁎⁎ [1.845]⁎⁎
Constant −15.691 −16.099[7.933]⁎ [7.813]⁎⁎
Robust standard errors, in parentheses.All columns involve 103 country observations.Results are robust to controlling for religious affiliation (as in Desmet et al., 2009), a squaredworld dummy and diversity). Results are also robust to introducing ELF(1), ELF(6) and ELFThe data is from Desmet et al. (2009), except for diversity measures (authors' calculations
⁎ Significant at 10%.⁎⁎ Significant at 5%.⁎⁎⁎ Significant at 1%.
striking pattern: linguistic diversity negatively affects redistribution athigh levels of aggregation, but the effect declines in magnitude as thelevel of aggregation falls, and ceases to be statistically significant at the5%level after aggregation level 5: Fig. 8 displays this pattern, plotting thestandardized beta on fractionalization (i.e. the effect of a one standarddeviation increase in fractionalization as a fraction of a one standarddeviation change in the dependent variable) against the level ofaggregation. The effect of ELF(1) is substantial in magnitude, as it equals−9.6% and is significant at the 5% level. It falls to a statistically significant−7.5% for ELF(5) and ceases to be statistically significant thereafter.These results are robust to considering alternative sets of controls, as inDesmet et al. (2009),with the caveat thatwith a sufficiently restricted setof control variables, the effect of linguistic diversity remains statisticallysignificant even at low levels of aggregation, although significance isgreater for high levels of aggregation.
To summarize, we find that for redistribution, as for conflict, therelevant cleavages are those that capture deep ethnolinguistic splits,rather thandivisions that aremore recentandsuperficial. Commentatorsoften point out that solidarity does not travelwell across groups.Wefindthat solidarity travels without trouble across groups that are separatedby shallow gullies, but not across those separated by deep canyons.
4. Linguistic diversity, public goods and growth
4.1. Public goods
The effect of ethnolinguistic diversity on the provision of publicgoods raises interesting conceptual issues. On the one hand, public
sidies as share of GDP, least squares estimator.
(3) (4) (5) (6)ELF(15) POL(1) POL(6) POL(15)
−1.547[1.493]
−2.749 −2.134 −2.056[1.211]⁎⁎ [1.561] [1.828]
1.198 1.270 1.256 1.232[0.562]⁎⁎ [0.558]⁎⁎ [0.575]⁎⁎ [0.576]⁎⁎
0.352 0.288 0.284 0.284[0.306] [0.296] [0.296] [0.300]0.902 0.879 0.884 0.892[0.149]⁎⁎⁎ [0.138]⁎⁎⁎ [0.156]⁎⁎⁎ [0.154]⁎⁎⁎
−5.749 −6.125 −6.038 −6.075[2.148]⁎⁎⁎ [2.319]⁎⁎⁎ [2.130]⁎⁎⁎ [2.169]⁎⁎⁎
4.899 3.997 5.344 5.809[4.618] [4.735] [4.607] [4.616]3.417 3.864 2.938 3.186[2.821] [2.616] [2.795] [2.851]4.480 4.494 4.106 4.234[2.857] [2.677]⁎ [2.887] [2.895]8.359 8.905 8.000 8.053[3.628]⁎⁎ [3.539]⁎⁎ [3.595]⁎⁎ [3.609]⁎⁎
4.838 5.570 4.102 4.166[2.983] [2.897]⁎ [2.991] [2.980]
−2.242 −1.866 −2.347 −2.206[1.136]⁎ [1.102]⁎ [1.205]⁎ [1.176]⁎
0.178 −0.305 −0.379 −0.328[1.223] [1.131] [1.171] [1.241]
−4.182 −4.383 −4.788 −4.628[1.839]⁎⁎ [1.823]⁎⁎ [1.799]⁎⁎⁎ [1.742]⁎⁎⁎
−16.730 −15.910 −15.263 −15.518[7.876]⁎⁎ [7.867]⁎⁎ [7.667]⁎⁎ [7.816]⁎
term for ELF (or POL), a dummy for the new world (and interaction between the new(15) simultaneously (or, similarly, POL(1), POL(6) and POL(15)).from Ethnologue database).

14 We measure the latter as a ratio of kilometers per 1000 inhabitants, but the resultsare unchanged when using kilometers per square kilometer of land area instead.Results are available upon request.
-10%
-5%
0%
5%
1 3 5 7 9 11 13 15
90% C.I. (upper bound)
-20%
-15%
Mar
gina
l eff
ect
of E
LF
on
redi
stri
buti
on
Level of aggregation
90% C.I. (lower bound)
Fig. 8. Effect of a one standard deviation increase in ELF on redistribution (as % of standard deviation of redistribution).
333K. Desmet et al. / Journal of Development Economics 97 (2012) 322–338
goods entail a dimension of redistribution, and differences inpreferences may hinder their provision. In this sense, there is anelement of conflict of interest when it comes to public goods. Onthe other hand, free rider problems and coordination failures needto be overcome for the effective provision of public goods.Linguistic diversity may work to affect public goods through bothchannels.
Several studies have explored the relationship between publicgoods provision and ethnolinguistic diversity, both across and withincountries. In their important study of the cross-national determinantsof the quality of government, La Porta et al. (1999, henceforth LLSV)showed that ethnolinguistic fractionalization, measured by anaverage of five existing indices of fractionalization, generally had anegative impact on several measures of public goods, such as literacyrates, infant mortality, school attainment and infrastructure. Alesinaet al. (2003) broadly confirmed these results using new data onethnic, linguistic and religious fractionalization and polarization,although the results were somewhat sensitive to the chosen measureof diversity and specification. In a within country context, Alesina etal. (1999) showed that across cities, metropolitan areas and urbancounties of the United States, greater ethnic diversity was associatedwith lower provision of education, roads and sewers.
In a more microeconomic context, Habyarimana et al. (2007)report that in a variety of games, co-ethnic participants from a sampleof slum dwellers in Kampala, Uganda, play cooperative strategiesmore so than players from different ethnic groups. This is consistentwith findings in Miguel and Gugerty (2005), suggesting that publicgoods provision is lower inmore ethnically diverse locations in Kenya.Other studies include Vigdor (2004) who shows that higher racial,generational and socioeconomic heterogeneity across US counties isassociated with lower response rates to the 2000 Census question-naire, and Banerjee et al. (2005)who, in the context of rural India, findthat higher caste and religious fragmentation is associated with lowerprovision of a wide range of public goods. Although these results arecompelling, it is not clear what ethnolinguistic cleavages are mostrelevant as determinants of public goods provision.
To analyze empirically the relationship between diversity com-puted at different levels of aggregation and the provision of publicgoods, we start with the econometric specification and data in LLSV(1999). To minimize the potential for omitted variables bias, we focuson a specification that include a large set of control variables —
including legal origins, GNP per capita, latitude and regional dummies.
Instead of focusing on a broad set of measures of the quality ofgovernment as they did, we focus on the category of dependentvariables they label “output of public goods”. This includes log infantmortality, log of school attainment, the illiteracy rate, and an index ofinfrastructure quality.
The results are presented in the top panel of Table 5. For three ofthe four dependent variables, the statistical significance of thecoefficient on ELF rises as the level of aggregation goes from veryaggregated (j=1) to less aggregated (j=6). For two of those thestatistical significance further rises when moving to the finest level ofaggregation (j=15). For illustrative purposes, the evolution of thestandardized magnitude of the coefficient on fractionalization as thelevel of aggregation falls is displayed in Fig. 9 for the illiteracy rate. Thestandardized magnitude of the coefficient on ELF rises steadily from5% to 25%. The effects are of the expected signs, namely linguisticfractionalization is negatively associated with school attainment, butpositively associated with log infant mortality and the illiteracy rate.There is no significant association with the index of infrastructurequality at any level of aggregation (this was also the case in LLSV). TheLLSV measure of ethnolinguistic fractionalization is most highlycorrelated with ELF(15) — the correlation between the two measuresis 0.835, and falls steadily as the level of aggregation rises.Correspondingly, in quantitative terms the magnitude of ourestimates is very close to LLSV's when ELF is measured at aggregationlevel 15. Finally, comparing results on fractionalization and polariza-tion, we see that linguistic fractionalization is a slightly betterpredictor of public goods than linguistic polarization, but the samepattern emerges with respect to aggregation levels.
In order to investigate whether these results hold up to using abroader set of indicators of public goods provision, the bottom panelof Table 5 considers 6 additional dependent variables, taken from theWorld Development Indicators (World Bank, 2008). These includemeasures of health care (hospital beds per person, measles immuni-zation rates for children), measures of access to public services(availability of sanitation services and clean water), and specificmeasures of infrastructure (road and rail network density).14 Theresults show that: 1) for measures of sanitation and clean water, the

15 For a survey of the empirical literature on ethnolinguistic diversity and economicperformance at the level of countries, cities and villages in developing countries, seeAlesina and La Ferrara (2005). This is related to a more microeconomic approachhighlighting the costs and benefits of cultural and linguistic diversity within teams ororganizations. See for instance Cremer et al. (2007), Lazear (1999), and Prat (2002).While at the cross-country level the empirical results point to a negative relationshipbetween ethnolinguistic diversity and growth, the findings are more contrasted at thewithin-firm level, with some studies pointing to positive effects of diversity. At thecross-city level in the U.S., Ottaviano and Peri (2006) also point to a positive effect ofcultural diversity on the productivity of U.S. natives.16 Hauk and Wacziarg (2009), using simulations based on the Solow model, showthat running growth regressions using OLS on a single cross-section of countriesprovides the least biased coefficients on the determinants of growth in the presence ofa multiplicity of data problems, such as regressor endogeneity, cross-countryheterogeneity and measurement error.
Table 5Public goods and linguistic diversity, OLS estimates (dependent variable listed in the leftmost column).
ELF(1) ELF(6) ELF(15) POL(1) POL(6) POL(15) # ofobs.
Adj-R2min
Adj-R2max
Output of public goods (from LLSV, 1999)Log infant mortality 0.466 0.413 0.512 0.248 0.379 0.501 173 0.78 0.8
[0.199]⁎⁎ [0.122]⁎⁎⁎ [0.113]⁎⁎⁎ [0.107]⁎⁎ [0.113]⁎⁎⁎ [0.118]⁎⁎⁎
Log of school attainment −0.143 −0.261 −0.203 −0.050 −0.097 −0.003 101 0.74 0.76[0.215] [0.137]⁎ [0.142] [0.108] [0.109] [0.145]
Illiteracy rate 6.891 20.662 17.784 3.506 18.174 12.674 119 0.48 0.54[8.314] [5.166]⁎⁎⁎ [5.086]⁎⁎⁎ [4.746] [5.316]⁎⁎⁎ [6.344]⁎⁎
Infrastructure quality index −0.167 −0.095 0.229 −0.133 −0.077 −0.224 59 0.77 0.78[0.819] [0.452] [0.474] [0.496] [0.427] [0.463]
Additional measures of public goodsHospital beds (per 1000 people) −1.061 −0.595 0.058 −0.452 −0.227 −0.759 170 0.46 0.46
[1.000] [0.608] [0.637] [0.577] [0.760] [0.924]Measles immunization rates (% of children 12–23 months)
−23.203 −17.138 −13.152 −12.194 −12.545 −7.613 169 0.5 0.56[5.831]⁎⁎⁎ [3.805]⁎⁎⁎ [3.896]⁎⁎⁎ [3.439]⁎⁎⁎ [3.587]⁎⁎⁎ [4.172]⁎
Improved sanitation facilities (% of populationwith access)
−12.536 −16.374 −23.398 −5.481 −15.890 −10.908 147 0.72 0.76[8.487] [5.120]⁎⁎⁎ [5.217]⁎⁎⁎ [4.852] [5.056]⁎⁎⁎ [5.700]⁎
Improved water source (% of population withaccess)
−13.896 −6.985 −13.995 −7.790 −7.135 −3.920 157 0.59 0.62[7.195]⁎ [4.651] [4.074]⁎⁎⁎ [4.124]⁎ [4.162]⁎ [4.726]
Road network density (km per 1000 inhabitants) −4.426 −3.159 −1.870 −2.842 −1.505 −3.386 151 0.27 0.28[4.338] [1.812]⁎ [2.101] [2.259] [2.353] [2.509]
Rail network density (km per 1000 inhabitants) 0.299 −0.055 0.151 0.140 0.085 −0.107 89 0.33 0.35[0.311] [0.140] [0.164] [0.144] [0.183] [0.161]
Robust standard errors in brackets.For all regressions, the specification includes the following controls: Socialist legal origin dummy, French legal origin dummy, German legal origin dummy, Scandinavian legal origindummy, East and Southeast Asia dummy, Sub-Saharan Africa dummy, Latin America and Caribbean dummy, latitude and log GNP per capita. The table reports coefficient estimateson diversity indices at various levels of aggregation, in regressions where the dependent variable is the one listed in the leftmost column. The data is from LLSV (1999) and theWorldBank (2008), except for diversity measures (authors' calculations from Ethnologue database).
⁎ Significant at 10%.⁎⁎ Significant at 5%.⁎⁎⁎ Significant at 1%.
334 K. Desmet et al. / Journal of Development Economics 97 (2012) 322–338
effect of fractionalization becomes more statistically significant as thelevel of aggregation falls; 2) for measures of health services, the effectof ELF remains consistently significant for the measles immunizationrate across aggregation levels, but is insignificant for hospital beds; 3)infrastructure measures are unaffected by fractionalization whateverthe level of aggregation; and 4) fractionalization is usually a betterpredictor of public goods provision than polarization.
To summarize, across a wide range of measures of public goods, webroadly confirm results from the literature referenced above:ethnolinguistic diversity is negatively related to public goodsprovision. Public goods share both dimensions of conflict of interest(different tastes for public goods) and coordination (need toovercome free rider problems). Correspondingly we find that forseveral of the measures of public goods provision (infant mortality,measles immunization rates), diversity at all levels matters statisti-cally. However, we also find that, broadly speaking, measures offractionalization based on finer classifications of linguistic groups tendto matter more than those based on deep cleavages only. In contrastwith redistribution, for which only deep splits were important, evenrelatively recent and shallow linguistic cleavages seem sufficient tohinder the provision of public goods.
4.2. Growth
In recent years, scholars have focused on ethnolinguisticdiversity as a determinant of economic performance. Easterly andLevine (1997) argue that ethnic diversity, measured by an index offractionalization, may account for much of Africa's growth tragedy.These cross-country results were reinforced and extended inAlesina et al. (2003). In particular, the latter paper showed thatlinguistic diversity per se, not just ethnic diversity, has asignificantly negative effect on per capita income growth in apanel of countries, so that both ethnic and linguistic diversity arealternative ways to capture a broader concept of cultural hetero-
geneity. In addition, the paper found that fractionalization mea-sures were more robust predictors of growth than polarizationmeasures, an issue we revisit below.15
To examine the impact of linguistic cleavages at various levels ofaggregation, we start from a growth specification derived from theaugmented Solow model, which includes the investment rate, ameasure of human capital (the number of years of schooling in theadult population aged 25 and over — results do not change whenusing a flow measure such as the secondary school enrollment rate),and ameasure of population growth. In addition, we includemeasuresof market size used in Ades and Glaeser (1999) and Alesina et al.(2000), namely the ratio of imports plus exports to GDP, the log ofpopulation, and the interaction between these two variables. Finally,the regression includes our full set of regional and legal originsdummy variables. The timespan extends from 1970 to 2004, and theregressions are run on a single cross-section of 100 countries.16
Coefficient estimates are shown in Tables 6. The standardized betas onfractionalization are displayed in Fig. 10. The effect of ELF becomesgreater in magnitude and more significant when the level ofaggregation falls, with the standardized beta equal to 2.46% for j=1,

10%
15%
20%
25%
30%
35%
40%
90% C.I. (lower bound)
90% C.I. (upper bound)
-5%
0%
5%
1 3 5 7 9 11 13 15
Mar
gina
l eff
ect
of E
LF
on
infa
nt m
orta
ility
Level of aggregation
Fig. 9. Effect of a one standard deviation increase in ELF on illiteracy rate (as % of standard deviation of illiteracy rate).
335K. Desmet et al. / Journal of Development Economics 97 (2012) 322–338
rising steadily as the level of aggregation falls, and settling around 22%at levels j=11 and higher. The level of statistical significance also riseswith j, with ELF becoming significant at the 95% confidence level ataggregation level j=5. Consistent with findings in Alesina et al.(2003), polarization measures appear largely unrelated to growth.
To illustrate the quantitative importance of ethnolinguisticdiversity for economic growth, we analyze the case of the world'stwomost populous countries, China and India. Both have experiencedhigh growth rate in recent decades, although India continues to lagbehind its East Asian neighbor. According to the Penn World Tables(version 6.2), over the period 1970–2004 China averaged an annualgrowth rate in real GDP per capita of 6.93%, compared to 2.71% inIndia. China is also much less linguistically diverse than India: ataggregation level j=15, India's ELF index is 0.93, while China's is 0.49.Fitting the regression model in Column 3 of Table 6 to these twodatapoints, we calculate that 14.72% of the growth difference betweenIndia and China over 1970–2004 is accounted for by differencesbetween these two countries in ELF(15). Thus, taken at face valuelinguistic fractionalization at a high level of disaggregation canaccount for a substantial portion of the growth differential betweenIndia and China. In contrast, the share of the growth differentialaccounted for by differences in ELF(1) is only 2.11%, and is notstatistically significant.
In additional empirical work available upon request, we extendedthese results in various directions. First, we showed that the samepattern of increasing growth effects of fractionalization as aggregationfalls are obtained when using exactly the specification, estimationmethod and data in Easterly and Levine (1997).17 Second, we showedthat, in the augmented Solow model specification above, the samepattern obtains in a random effects or SUR panel context, instead of asingle cross-section of time averages.
To summarize, these results show that to capture the relevantcleavages that affect economic growth, focusing only on deepcleavages is not sufficient. Instead, one needs to take into accountfiner distinctions across linguistic groups. This does not imply that
17 In addition, using the Easterly and Levine (1997) setup, the basic pattern holds, oris even reinforced, when: 1) controlling for political assassinations, 2) controlling forpolitical assassinations plus financial depth, the black market premium, and the fiscalsurplus to GDP ratio, and 3) controlling for all of the above plus the number of coupsd'état, the number of revolutions, a dummy for civil wars and a measure of politicalrights (Gastil's index of democracy).
deep cleavages do not contribute to negatively affecting growth, asthese deep cleavages do contribute to diversity at lower levels ofaggregation: fractionalizationmeasured at low levels of aggregation isaffected by both deep and shallow cleavages. Fractionalizationmeasured at high levels of aggregation ignores many of the shallower,yet relevant, cleavages, and therefore amounts to a noisy measure topredict the effect of diversity on growth.
5. Robustness checks
In this sectionwe conduct a series of robustness checks common toeach set of dependent variables considered above. The correspondingeconometric estimates are available upon request.
In a first exercise, we examine whether the effects of linguisticdiversity might be nonlinear, by adding a quadratic term in diversityto the regressions. Ashraf and Galor (2010) have argued that therelationship between genetic diversity and development may behump-shaped: too little or too much diversity may be detrimental togrowth. Consistent with their findings, in the case of growth there isindeed some evidence of such a hump-shaped relationship, andconsistent with our results this is true only at low levels ofaggregation. In the case of child mortality there is also a slightnonlinearity, although the overall effect is always negative. For noneof the other dependent variables do we find any evidence of anonlinear relationship. In any case, none of these results change thebasic picture of which levels of aggregation matter most for differentdependent variables.
In a second robustness check, we examine whether the resultsdiffer between the New World and the Old World. This is importantbecause while linguistic cleavages largely reflect historical populationsplits of varying degrees of depth, in the New World languagereplacement may have severed or weakened the link betweenlinguistic cleavages and historic divisions. For instance, in the USboth Blacks and Whites speak English, and in Latin America people ofAmerindian descent often (though by no means always) speakEuropean languages. Consistent with this fact, when splitting up thesample into the Old World and the New World – defined as theAmericas and Oceania – we find the relationship between diversityand the different dependent variables to be less robust for the NewWorld. This may partly reflect the substantially smaller sample ofcountries in the New World. An alternative specification to test thishypothesis is to keep the whole sample, but to include a dummy

Table 6Growth and linguistic diversity. (Augmented Solow specification, OLS estimator, 1970–2004 panel).
(1) (2) (3) (4) (5) (6)
ELF(1) ELF(6) ELF(15) POL(1) POL(6) POL(15)
ELF (at various levels of aggregation) −0.279 −1.056 −1.412[0.933] [0.576]⁎ [0.473]⁎⁎⁎
POL (at various levels of aggregation) −0.205 −0.667 0.250[0.537] [0.531] [0.573]
Log initial real per capita GDP −1.209 −1.153 −1.143 −1.214 −1.208 −1.203[0.234]⁎⁎⁎ [0.219]⁎⁎⁎ [0.230]⁎⁎⁎ [0.234]⁎⁎⁎ [0.234]⁎⁎⁎ [0.231]⁎⁎⁎
Investment share of GDP 0.043 0.032 0.032 0.044 0.038 0.043[0.034] [0.031] [0.031] [0.034] [0.032] [0.034]
Avg. schooling years in total population aged 25+ 0.211 0.193 0.186 0.212 0.233 0.208[0.098]⁎⁎ [0.092]⁎⁎ [0.095]⁎ [0.097]⁎⁎ [0.095]⁎⁎ [0.096]⁎⁎
Growth of population −0.599 −0.524 −0.508 −0.595 −0.526 −0.634[0.196]⁎⁎⁎ [0.204]⁎⁎ [0.184]⁎⁎⁎ [0.198]⁎⁎⁎ [0.214]⁎⁎ [0.194]⁎⁎⁎
Log population 0.197 0.220 0.225 0.197 0.194 0.198[0.151] [0.147] [0.145] [0.150] [0.150] [0.151]
Interaction between openness and log population −0.005 −0.005 −0.004 −0.005 −0.005 −0.005[0.002]⁎⁎ [0.002]⁎⁎ [0.002]⁎⁎ [0.002]⁎⁎ [0.002]⁎⁎ [0.002]⁎⁎
Openness (imports+exports over GDP) 0.046 0.045 0.041 0.046 0.044 0.046[0.017]⁎⁎⁎ [0.017]⁎⁎ [0.017]⁎⁎ [0.017]⁎⁎⁎ [0.018]⁎⁎ [0.017]⁎⁎⁎
Latin America and Caribbean dummy −0.725 −0.990 −1.090 −0.726 −0.909 −0.673[0.309]⁎⁎ [0.289]⁎⁎⁎ [0.278]⁎⁎⁎ [0.306]⁎⁎ [0.286]⁎⁎⁎ [0.311]⁎⁎
Sub-Saharan Africa dummy −1.531 −1.656 −1.291 −1.536 −1.585 −1.491[0.528]⁎⁎⁎ [0.542]⁎⁎⁎ [0.516]⁎⁎ [0.529]⁎⁎⁎ [0.523]⁎⁎⁎ [0.526]⁎⁎⁎
East and Southeast Asia dummy 1.329 1.461 1.524 1.316 1.195 1.373[0.639]⁎⁎ [0.623]⁎⁎ [0.645]⁎⁎ [0.643]⁎⁎ [0.660]⁎ [0.651]⁎⁎
British legal origin dummy 0.286 0.377 0.491 0.291 0.367 0.214[0.402] [0.415] [0.417] [0.401] [0.418] [0.384]
French legal origin dummy 0.448 0.504 0.557 0.447 0.583 0.407[0.441] [0.434] [0.439] [0.440] [0.433] [0.388]
Socialist legal origin dummy 0.290 0.312 0.241 0.286 0.401 0.269[0.439] [0.469] [0.481] [0.440] [0.529] [0.416]
German legal origin dummy −0.066 0.016 −0.021 −0.070 0.181 −0.116[0.570] [0.565] [0.566] [0.570] [0.609] [0.574]
Constant 8.911 8.623 8.595 8.951 8.889 8.844[2.410]⁎⁎⁎ [2.336]⁎⁎⁎ [2.347]⁎⁎⁎ [2.421]⁎⁎⁎ [2.391]⁎⁎⁎ [2.389]⁎⁎⁎
R-squared 0.54 0.56 0.57 0.54 0.55 0.54
Robust standard errors in parentheses.All columns involve 100 countries.Investment, schooling, population growth, log population and openness are entered as period averages; log initial per capita income is for 1970. The data on income per capita,income growth, population, population growth, openness and investment are from the PennWorld Tables, version 6.2 (Heston et al., 2006). The data on human capital is from Barroand Lee (2000). The diversity measures are based on the authors' calculations using the Ethnologue database.
⁎ Significant at 10%.⁎⁎ Significant at 5%.⁎⁎⁎ Significant at 1%.
10%
0%1 3 5 7 9 11 13 15
-10%90%C.I.(upper bound)
-20%
-30%
Mar
gina
l eff
ect
of E
LF
on
grow
th
90%C.I.(lower bound)-40%
Level of aggregation
Fig. 10. Marginal effect of a standard deviation increase in ELF as a % of a standard deviation of growth.
336 K. Desmet et al. / Journal of Development Economics 97 (2012) 322–338

337K. Desmet et al. / Journal of Development Economics 97 (2012) 322–338
variable for the New World and an interaction term between thatdummy and linguistic diversity. When doing so, we find that theinteraction term is not significantly different from zero.
In a third exercise, we run a horserace between measures oflinguistic diversity at various levels of aggregation, by entering levelsj=1, 6, 15 all at once in the regressions. Doing so confirms our results.In the case of civil conflict and redistribution, only ELF(1) and POL(1)continue to be statistically significant at the 5% level, with themeasures at lower levels of aggregation being statistically insignifi-cant. In contrast, in the case of growth and public goods the lowerlevels of aggregation tend to matter most, except for the case ofilliteracy where diversity measured at an intermediate level ofaggregation is most significant.
In a fourth robustness check, we ran horseraces betweenfractionalization and polarization. It is worth pointing out that thesetwo measures of linguistic diversity tend to be highly correlated,particularly at very high levels of aggregation (j=1).18 Consistentwith this observation, we find that for outcomes for which diversity athigh levels of aggregation (deep cleavages) matter most (conflict andredistribution), multicollinearity is severe, and both ELF and POLbecome insignificant. In contrast, for outcomes where finer linguisticdisaggregation matters most (growth and public goods) and whereELF and POL are less collinear, we find that ELF wins out in a horseracewith POL.
Finally, we reran all the regressions using Approach 2 for theconstruction of linguistic cleavages (see Fig. 4 and the conceptualdiscussion in Section 2.2.2). The results are virtually unchanged. Thereason is straightforward. As discussed in the theoretical section,Approach 1 and Approach 2 give identical measures of diversity atboth extremes, i.e., for j=1 and j=15. Since in the cases of civilconflict and redistribution diversity measured at one extreme (thehighest levels of aggregation) matters most and in the cases of publicgoods and economic growth diversity measured at the other extreme(the lowest levels of aggregation) matters most, the results are boundnot to change substantially.
To summarize, these various robustness checks do not modify ourbasic result that deep cleavages matter most for conflict andredistribution, while more superficial linguistic cleavages are suffi-cient to hinder growth and the provision of public goods.
6. Conclusion
In this paper, we have uncovered new evidence on the relationshipbetween ethnolinguistic diversity and a range of political economyoutcomes, such as the onset of civil wars, the extent of redistribution,the provision of public goods, and economic growth. We sought toidentify the relevant linguistic cleavages to explain variation in theseoutcomes. We let the data tell us whether deep cleavages, originatingat an earlier time in history, are more or less important than moresuperficial cleavages that have arisen more recently. Doing so, wedeparted from the common approach relying on arbitrary definitionsof what constitutes a relevant ethnolinguistic group. Our results carryseveral lessons. When it comes to civil conflict and redistribution,deeper cleavages tend to matter more. In contrast, for economicgrowth and public goods, we found that diversity measured usingonly deep cleavages is not sufficient to predict significant differencesin growth. Instead, measures based on more disaggregated classifica-tions of linguistic groups, capturing finer distinctions betweenlanguages, are important correlates of growth and public goodsprovision both in terms of statistical significance and in terms ofeconomic magnitude.
How should we interpret these results? We have shown that thetype of cultural diversity that matters for outcomes involving
18 Table 2 shows that ELF(1) and POL(1) bear a 0.988 correlation with each other,falling to 0.555 for ELF(15) and POL(15).
conflicts of interest – civil wars, redistribution – is different fromthe type of diversity that matters for outcomes that entail issues ofefficiency and coordination, such as growth. When it comes toconflict and redistribution, preferences are of the essence. Thewillingness to settle disputes or to transfer resources across acultural divide depends on how deep the divide happens to be.Deep cleavages that go back thousands of years appear to be relatedwith more conflicts of interest, compared to more superficialcleavages.
In contrast, economic growth requires that groups have the abilityto coordinate, interact and organize in networks of production,knowledge and trade. This ability is affected by linguistic divisions. InIndia, for instance, the degree of integration between regions is likelyhindered by linguistic barriers — even linguistic barriers separaterelatively similar linguistic groups such as Hindi and Gujaratispeakers. Coordination, integration and more generally the ability toform knowledge, production and trading networks is hampered assoon as linguistic differentiation prevents interactions betweengroups, and this can occur between groups that are relatively similarlinguistically.
The case of public goods shares characteristics of both types ofoutcomes: public goods are inherently redistributive in nature, andtheir provision depends on differences in preferences amongparticipants. At the same time, the provision of public goods requirescoordination and interactions, that even superficial cleavages mighthamper. We found that, much as in the case of growth, for a widearray of measures of public goods, fine distinctions between linguisticgroups matter to hinder their provision. Even when cleavages areshallow, a country may fail to have well-functioning public services,not necessarily because people are unwilling to redistribute, butbecause of coordination failures.
Future work should seek to better understand the theoreticalmechanisms that account for the contrasting findings betweenconflict and redistribution on the one hand, and growth and publicgoods on the other hand. In particular, clarifying the differing effectsof diversity on efficiency and coordination (where fine distinctionsseem to matter more) and preferences (where coarse distinctionsseem of the essence) may help account for our results.
Finally, we have focused on linguistic diversity, as a measure of abroader concept of ethnolinguistic heterogeneity, and even morebroadly as a proxy for cultural diversity. One advantage of focusingon languages is that linguistic distinctions are quite objective: it iseasier to judge whether two populations speak different languagesthan to decide whether two populations belong to differentethnicities, a more amorphous concept (precisely for this reason,ethnic categorizations are often based on linguistic divisions,particularly for Africa). Another advantage is that data on linguisticdivisions, particularly in the form of trees, is more readily availablethan data on the genealogical structure of ethnic groups withincountries. There are, however, drawbacks to focusing on languages:to the extent that linguistic divisions are imperfect measures of thesource of diversity that matters most, this should lead to downwardbias on the estimates of the effect of diversity on political economyoutcomes. In principle, the methodology we have developed forlinguistic trees should be applicable to other kinds of differencesbetween populations. With advances in population genetics,population phylogenies have become more widely available.Although this data is not yet available in a single format such asthe Ethnologue for languages, applying our method to genetic datacould lead to fruitful advances in the study of the political economyof cultural diversity.
Appendix A. Supplementary data
Supplementary data to this article can be found online atdoi:10.1016/j.jdeveco.2011.02.003.
338 K. Desmet et al. / Journal of Development Economics 97 (2012) 322–338
References
Ades, A., Glaeser, E.L., 1999. Evidence on growth, increasing returns, and the extent ofthe market. Quarterly Journal of Economics vol. 114 (no. 3), 1025–1045 August.
Alesina, A., Glaeser, E.L., 2004. Fighting Poverty in the US and Europe: A World ofDifference. Oxford University Press, Oxford.
Alesina, A., La Ferrara, E., 2005. Ethnic diversity and economic performance. Journal ofEconomic Literature vol. 43, 762–800 September.
Alesina, A., Baqir, R., Easterly, W., 1999. Public goods and ethnic divisions. QuarterlyJournal of Economics vol. 114 (no. 4), 1243–1284 November.
Alesina, A., Spolaore, E., Wacziarg, R., 2000. Economic integration and politicaldisintegration. The American Economic Review vol. 90 (no. 5), 1276–1296December.
Alesina, A., Glaeser, E., Sacerdote, B., 2001. Why doesn't the United States have aEuropean-style welfare state? Brookings Papers on Economic Activity 2001 (2),187–254.
Alesina, A., Devleeschauwer, A., Easterly, W., Kurlat, S., Wacziarg, R., 2003. Fraction-alization. Journal of Economic Growth vol. 8 (no. 2), 155–194 June.
Ashraf, Q., Galor, O., 2010. The out of Africa hypothesis, human genetic diversity andcomparative development. Working Paper. Brown University.
Banerjee, A., Iyer, L., Somanathan, R., 2005. History, social divisions, and public goods inrural India. Journal of the European Economic Association 3 (2–3), 639–647.
Barro, R.J., Lee, J.W., 2000. International data on educational attainment: updates andimplications. Harvard CID Working Paper No. 42. . April.
Belle, E.M.S., Barbujani, G., 2007. Worldwide analysis of multiple microsatellites:language diversity has a detectable influence on DNA diversity. American Journal ofPhysical Anthropology 133 (4), 1137–1146.
Bossert,W., D’Ambrosio, C., La Ferrara, E., 2011. AGeneralized Index of Fractionalization.Economica 78 (312), 723–750.
Caselli, F., Coleman II, W.J., 2010. On the theory of ethnic conflict. Working Paper. DukeUniversity.
Cavalli-Sforza, L.L., Piazza, A., Menozzi, P., Mountain, J., 1988. Reconstruction of humanevolution: bringing together genetic, archaeological and linguistic data. Proceed-ings of the National Academy of Sciences of the United States of America 85,6002–6006.
Cremer, J., Garicano, L., Prat, A., 2007. Language and the theory of the firm. QuarterlyJournal of Economics vol. 122 (no. 1), 373–407 February.
Darwin, C., 1902. On the Origin of Species by Means of Natural Selection, or, ThePreservation of Favoured Races in the Struggle for Life, 6th edition. Grant Richards,London.
Desmet, K., Ortuño Ortín, I., Weber, S., 2009. Linguistic diversity and redistribution.Journal of the European Economic Association 7 (6), 1291–1318.
Dixon, R.M.W., 1997. The Rise and Fall of Languages. Cambridge University Press,Cambridge.
Easterly, W., Levine, R., 1997. Africa's growth tragedy: policies and ethnic divisions.Quarterly Journal of Economics vol. 112 (no. 4), 1203–1250 November.
Emeneau, M., Anwar, D., 1980. Language and Linguistic Area: Essays by Murray B.Emeneau. Stanford University Press, Palo Alto.
Esteban, J.M., Ray, D., 1994. On the measurement of polarization. Econometrica 62 (4),819–851.
Ethnologue, 2005. Ethnologue: Languages of the World, 15th Edition. SIL International.www.ethnologue.com.
Fearon, J., 2003. Ethnic and cultural diversity by country. Journal of Economic Growthvol. 8 (no. 2), 195–222 June.
Fearon, J., Laitin, D., 2003. Ethnicity, insurgency, and civil war. American PoliticalScience Review vol. 97 (no. 1), 75–90 February.
Gomes, Joseph F., 2010. The political economy of religious diversity. Working Paper.Universidad Carlos III.
Gray, R.D., Atkinson, Q.D., 2003. Language-tree divergence times support the Anatoliantheory of Indo-European origin. Nature vol. 426 (27), 435–439 November.
Greenberg, J.H., 1956. The measurement of linguistic diversity. Language vol. 32 (no. 1),109–115 Jamuary.
Greenberg, J.H., 1987. Language in the Americas. Stanford University Press, Palo Alto.Habyarimana, J., Humphreys, M., Posner, D., Weinstein, J., 2007. Why does ethnic
diversity undermine public goods provision? American Political Science Reviewvol. 101 (no. 4), 709–725 November.
Hauk, W., Wacziarg, R., 2009. A Monte Carlo study of growth regressions. Journal ofEconomic Growth vol. 14 (no. 2), 103–147 June.
Heston, A., Summers, R., Aten, B., 2006. Penn World Table Version 6.2. Center forInternational Comparisons of Production, Income and Prices. University ofPennsylvania. September.
La Porta, R., Lopez-de-Silanes, F., Shleifer, A., Vishny, R., 1999. The quality ofgovernment. Journal of Law, Economics, and Organization 15 (1), 222–279.
Lazear, E., 1999. Culture and language. Journal of Political Economy vol. 107 (no. 6),S95–S126 December.
Lithgow, D., 1973. Language change on Woodlark Island. Oceania vol. 44 (no. 2),101–108 December.
Luttmer, E.F.P., 2001. Group loyalty and the taste for redistribution. Journal of PoliticalEconomy vol. 109 (no. 3), 500–528 June.
Luttmer, E.F.P., Fong, C., 2009. What determines giving to Hurricane Katrina victims?Experimental evidence on racial group loyalty. American Economic Journal:Applied Economics vol. 1 (no. 2), 64–87 April.
Miguel, E., Gugerty, M.K., 2005. Ethnic diversity, social sanctions, and public goods inKenya. Journal of Public Economics 89 (11), 2325–2368.
Montalvo, J.G., Reynal-Querol, M., 2005. Ethnic polarization, potential conflict and civilwar. The American Economic Review vol. 95 (no. 3), 796–816 June.
Ottaviano, G.M., Peri, G., 2006. The economic value of cultural diversity: evidence fromU.S. cities. Journal of Economic Geography vol. 6 (no. 1), 9–44 January.
Posner, D., 2003. The colonial origins of ethnic cleavages: the case of linguistic divisionsin Zambia. Comparative Politics 35 (2), 127–146.
Posner, D., 2005. Institutions and Ethnic Politics in Africa. Cambridge University Press,Cambridge (UK).
Prat, A., 2002. Should a team be homogeneous? European Economic Review 46 (7),1187–1207.
Scarritt, J.R., Mozaffar, S., 1999. The specification of ethnic cleavages and ethnopoliticalgroups for the analysis of democratic competition in contemporary Africa.Nationalism and Ethnic Politics vol. 5 (no. 1), 82–117 March.
Spolaore, E., Wacziarg, R., 2009. The diffusion of development. Quarterly Journal ofEconomics vol. 124 (no. 2), 469–529 May.
Vigdor, J.L., 2004. Community composition and collective action: analyzing initial mailresponse to the 2000 census. The Review of Economics and Statistics 86 (1), 303–312.
World Bank, 2008. World Development Indicators 2008. World Bank, Washington, DC.Young, C., 1976. The Politics of Cultural Pluralism. University of Wisconsin Press,
Madison.