Embed Size (px)
Citation preview

Chapman UniversityChapman University Digital Commons
ESI Working Papers Economic Science Institute
3-25-2019
The Political Economy of Foreign Aid and Growth:Theory and EvidenceSultan MehmoodUniversity of Paris, [email protected]
Avner SerorChapman University, [email protected]
Follow this and additional works at: https://digitalcommons.chapman.edu/esi_working_papers
Part of the Econometrics Commons, Economic Theory Commons, and the Other EconomicsCommons
This Article is brought to you for free and open access by the Economic Science Institute at Chapman University Digital Commons. It has beenaccepted for inclusion in ESI Working Papers by an authorized administrator of Chapman University Digital Commons. For more information, pleasecontact [email protected].
Recommended CitationMehmood, S., & Seror, A. (2019). The political economy of foreign aid and growth: Theory and evidence. ESI Working Paper 19-10.Retrieved from https://digitalcommons.chapman.edu/esi_working_papers/268/

The Political Economy of Foreign Aid and Growth: Theory and Evidence
CommentsWorking Paper 19-10
This article is available at Chapman University Digital Commons: https://digitalcommons.chapman.edu/esi_working_papers/268

The Political Economy of Foreign Aid and Growth:
Theory and Evidence∗
Sultan Mehmood†
University of Paris - IX
Avner Seror‡
Chapman University
March 25, 2019
Abstract
In this paper, we demonstrate that even when foreign aid is used to fund patronage, it may still
have a positive - and significant - effect on economic growth in developing countries. First, we
present a theory that formalizes the effect of aid on economic growth and patronage. Next, we
provide evidence from Pakistan consistent with the predictions of the model that foreign aid
increases economic growth, despite being used for patronage. The identification strategy we
propose allows us to provide causal evidence for the predictions of the model.
JEL: F35, D72, O1
Keywords: Foreign aid, Economic growth, Political Economy, Patronage
∗We are grateful to Ekaterina Zhuravskaya, Thierry Verdier, Atif Mian, Sergei Guriev, Oeindrila Dube, Denis
Cogneau, Eric Monnet, Farooq Arby and seminar participants at IOEA 2017, PSE and Dauphine 2017. Sultan
Mehmood acknowledges the financial support from University of Paris-Dauphine, LEDa, PSL and Chair Government
and Regulation Lab. Avner Seror acknowledges the financial support of the Smith Institute for Political Economy and
Philosophy, Chapman University.†University of Paris-Dauphine, PSL, LEDa, Place du Marechal de Lattre de Tassigny, 75016 Paris, France.‡Chapman University, 1 University Drive, 92866 Orange, CA, USA.
1

1 Introduction
Foreign aid is one of the most important policy tools that rich countries use to fight global poverty.
Most studies examining the effect of foreign aid on economic growth find positive effects (see for
instance, Burnside and Dollar (2004); Sachs (2006); Clemens et al. (2011); Werker, Ahmed and
Cohen (2009); Arndt, Jones and Tarp (2016); Galiani et al. (2017)).1 Nevertheless, scholars have
long recognised that it can also fund patronage, breed conflict, ethnic favoritism, corruption and
consolidate autocratic regimes.2
In this paper, we reconcile these views in a theory that formalises the effect of foreign aid
on growth and patronage. We also document an overall positive effect of foreign aid on growth,
despite aid being used as a patronage mechanism. To provide causal evidence for the predictions
of the model, we estimate the effect of US aid on patronage and economic growth in Pakistan
using changes in aid legislations in the United States as an instrument for foreign aid flows coming
into Pakistan. Our estimates imply that exogenous aid shocks exert positive impact on economic
growth. We find that this positive effect of foreign aid on economic growth exists despite patronage,
as aid is used to fund public employment and is disproportionately spent in the region of birth of
the incumbent.
Our theoretical results show that when politicians cannot commit to public policies, they offer
public employment in their region of birth. By doing so, they credibly transfer resources to a
fraction of the citizenry, and consolidate their power. Inefficiencies on how foreign aid is spent
then arise in our model, because politicians are unable to commit (Acemoglu (2003), Robinson,
Torvik and Verdier (2006), Besley and Coate (1997), Robinson and Verdier (2013)). Some agents
are diverted from the private sector to less productive public employment, in the region of birth of
the incumbent. These inefficiencies - inherent to aid windfalls - are however counterbalanced by
another effect: foreign aid - when used to fund patronage - also increases the incumbent’s benefit
of staying in power, making public policies more efficient. This, in turn, can lead to lower rent
1Notable exceptions that find null effect (positive but statistically insignificant coefficient estimates) include (East-
erly, Levine and Roodman (2004) and Rajan and Subramanian (2008).2See, for instance, (Ahmed (2012); Nunn and Qian (2014); Hodler and Raschky (2014); Dreher et al. (2016),
Easterly and Pfutze (2008); Asongu (2012); Kono and Montinola (2009)
2

extraction and higher public investment. Hence, despite patronage, foreign aid can have a positive
effect on economic growth.
In the context where the scope of informal employment is large, the inefficiencies implied by
foreign aid on a less effective use of human resources are limited. Therefore, when resources are
diverted from informal activities to the public sector, the negative effect of foreign aid on growth
due to patronage is low. This explains why foreign aid - despite funding patronage - can lead to
a substantial growth effect. We can reasonably expect this to be the case for many developing
countries, including Pakistan where our data come from. Indeed, a large informal sector is typical
for many developing countries (International Labor Organization (2018)). Finally, in the case of
Pakistan, according to a recent 2017-2018 Labour Force Survey 71% of the total labour force
operates in the informal sector (Pakistan Bureau of Statistics (2018)).
Testing our key theoretical result that foreign aid has a causal and positive impact on growth,
however, faces an important empirical challenge: the decision to dispatch foreign aid is endogenous
to recipient country fundamentals. As is extensively noted in the literature, weak or in some cases
strong growth in aid recipient countries determines donors’ decision to dispatch aid. This makes the
aid-growth relationship endogenous. Formal analysis of instrumental variables used thus far points
towards important shortcomings (Bazzi and Clemens (2013)). This is because most instruments
employed exploit aid variations within the recipient countries “from factors such as geography,
population and income that naturally leave open many concerns about the exclusion restriction”
(Qian, 2015, p. 302). Therefore, in our identification strategy, instead of relying on an instrument
based on aid recipient country, we instrument foreign aid to Pakistan by changes driven by reasons
orthogonal to Pakistan’s domestic fundamentals. First, we use geopolitical events such as Soviet
Invasion of Afghanistan and 9/11 attacks in the United States to identify the effects of aid on growth
in Pakistan. Under the assumption, that these events are orthogonal to domestic fundamentals of
Pakistan, we can estimate the causal effect of US foreign aid on output growth in Pakistan. Second,
we examine the robustness of these results where we instrument foreign aid coming to Pakistan
with broad changes in aid legislations in the United States. Under the assumption that changes
in aid legislations in the US is determined by factors related to the US, not specificities of the
3

Pakistani economy, we can interpret the causal the effect of aid on growth.3
In accordance with the predictions of the model, we find that aid shocks are positively asso-
ciated with output growth. A typical US aid shock consisted of about 1% of Pakistans GDP and
equalled about USD 400 million. This is about half of what the government spent on education
and is a little more than what it spent on healthcare in 2015 (UNESCO, 2016; World Health Orga-
nization (2016)). The estimates imply that this aid shock is associated with an additional 1% GDP
per capita growth. Formal analysis of variance decomposition indicates that about 25% of total
variation in GDP per capita of Pakistan can be explained by these aid shocks. Similar results are
found with high frequency monthly output series with aid shock associated with an additional 1%
increase in output growth.
Likewise, we show that aid funds patronage. First, we document that US aid shocks are associ-
ated with an increase in public employment in Pakistan. In particular, employment of public school
teachers in Pakistan increases following the US aid shocks. Second, we show that US aid shocks
are also associated with an increase in public spending. Specifically, we show that the public ex-
penditure in Pakistan is 2% higher relative to the counterfactual of no such aid shock. Third, we
find evidence that during time of aid windfalls, the birth region of the incumbent leader witnesses
a disproportionate increase in output growth. In particular, output growth in the birthplace of the
incumbent leader is 2% higher during the aid windfalls.4
We provide evidence in favour of the key identification assumption that allows us to interpret
the differential impact of foreign aid at the birthplace of incumbent leader as causal. That is,
we find no evidence that there are differential trends prior to the aid shocks. First, we show that
the average industrial production in the birth-province of the incumbent leader (the treatment)
versus the average industrial production in the provinces where the leader is not in office (the
control), follows common trends prior to the geopolitical aid shocks. Second, we conduct a placebo
test where we show that one, two or three years before the region becomes the birth region of
the incumbent head of state during the geopolitical aid shock does not induce a disproportionate
3We provide evidence consistent with this interpretation of the results.4This is consistent with the cross-country evidence presented by Dreher et al. (2016).
4

increase in output growth.5
Finally, we provide evidence that the positive effect of aid on growth is robust to several al-
ternate explanations. In addition to the foreign aid channel, there are four leading alternative
channels. First, if the US aid is correlated with non-US global aid, then our estimates would be
biased upwards, with the geopolitical aid capturing the effect of total global aid flows. Second,
the US aid shocks may have accompanied a change in US trade policy where trade with the US,
not foreign aid, could have caused the change in economic performance. Third, the US aid shocks
could have accompanied lucrative investment deals with the United States. Therefore, it may be
that US investment, not aid, that explains the improved growth following the aid shocks. Fourth,
important geopolitical events such as the Soviet invasion of Afghanistan may have increased the
external threat perception in Pakistan. This may have led to increased investment in defence spend-
ing causing growth, instead of the aid shocks. We examine each of these explanations. We test
for the non-US aid, US trade, investments and defence spending explanations by examining how
these variables changed during the geopolitical shocks. We discover that following the geopoliti-
cal shocks, these variables are virtually unresponsive.6 Therefore, when we control for them in the
regressions, we observe no discernible effect on the qualitative as well as statistical significance of
the results.7
This paper relates to several stands of literature.8 First, our paper relates to the literature
on the political economy of aid, which demonstrate that foreign aid finances patronage and con-
solidates incumbent politicians (Ahmed (2012), Jablonski (2014)), erodes democratic institutions
(Djankov, Montalvo and Reynal-Querol (2008)), breeds conflict (Nunn and Qian (2014)), causes
moral hazard problems (Azam and Laffont (2003)) and deteriorates governance in recipient coun-
5We further show that many of the potentially confounding factors (such as US trade, FDI, non-US aid and military
spending) when interacted with the head of state dummy are statistically insignificant, while interaction term of head
of state incumbency with aid windfalls is significant.6We find similar results across three non-US aid flow series: total non-US global aid, UK aid (Pakistan’s largest
donor after the United States) and European Union aid.7Interestingly, the military spending as a proportion of public spending and defence component of GDP continue
to follow a downward trend even in ‘high external threat’ periods.8Here, we cannot do justice to the large aid-growth literature, for a recent review, see for instance Qian (2015).
5

tries (Wright and Winters (2010).9 Our model is robust enough to square the main issues raised
by this literature, as we show that incumbent politicians use the revenues at their disposal in order
to consolidate their power. Given that they are unable to commit to their future policies, incum-
bents disproportionately transfer revenues - through public employment - to their region of birth,
where they can credibly and cheaply increase their support. We show that this widely documented
political strategy in developing countries has a limited effect on growth when the informal sector
is large. Furthermore, we demonstrate that through patronage, incumbent politicians increase the
dynamic efficiency of public policies. This may explain the significant effect of foreign aid on
economic growth in developing countries, as we document for the case of Pakistan.
There are few theoretical studies on foreign aid, mainly focused on agency problems and the
allocation of aid in the presence of multiple donors or recipient countries.10 In this paper, we focus
on the effectiveness of unconditional aid from a single donor to a single recipient country. We
complement the existing theoretical literature by modelling the effect of foreign aid on the political
equilibrium in the recipient country. In doing so, we adapt the theory of Robinson, Torvik and
Verdier (2006) on the resource curse to the case of foreign aid.11 In particular, both papers show
that incumbents increase the scope of public employment in their own group (e.g. in their region
of birth), because they cannot commit to public policies. Although, we simplify the determination
of the political equilibrium, we extend Robinson, Torvik and Verdier (2006)’s model by assuming
that incumbents can extract rents from the tax collection and we model the informal sector in the
labour market. By doing so, we are able to demonstrate that foreign aid decreases rent extraction,
while a large informal sector necessarily induces a positive relationship between foreign aid and
economic growth.
Second, the paper speaks to the large cross-country literature on foreign aid and growth (Burn-
side and Dollar (2004); Easterly, Levine and Roodman (2004); Clemens et al. (2011); Arndt, Jones
9Bourguignon and Gunning (2016) provide a literature review on aid and governance.10See for instance the seminal studies of Adam and OConnell (1999) and Azam and Laffont (2003). Bourguignon
and Platteau (2017) provide a review of the theoretical literature on aid effectiveness, while they also present a frame-
work that studies the trade-off between needs and governance in the allocation of aid.11See as well the related studies of Robinson and Verdier (2013) and Robinson, Torvik and Verdier (2017).
6

and Tarp (2016)). The paper complements this cross-country literature, especially the recent stud-
ies that try to identify the causal effect of aid on growth (Rajan and Subramanian (2008); Dreher
and Langlotz (2017); Galiani et al. (2017); Temple and Van de Sijpe (2017)).12. We contribute
to this literature by estimating the impact of foreign aid on growth through relying on exogenous
variation in foreign aid based on changes plausibly exogenous to the aid recipient characteristics
at the national and subnational level.13 We also contribute to this literature by offering a national
and subnational setting, thus, overcoming most of the common identification issues that arise in
studies that exploit differences across countries.14 Third, our study complements the cross-country
literature on politically motivated aid by providing an alternate politically motivated aid shock and
introducing new identification strategies that rely on geopolitical events and changes in aid leg-
islations in the donor country (Kuziemko and Werker (2006); Faye and Niehaus (2012); Dreher,
Eichenauer and Gehring (2016)).
The remainder of the paper is organised as follows. In Section 2, we present a theory on the
effect of foreign aid on redistribution and growth. Section 3 tests the predictions of the model,
while Section 4 concludes. The mathematical proofs are relegated to the mathematical appendix.
2 The model
Public employment is widely regarded as a means of redistributing resources. For instance, Alesina,
Baqir and Easterly (2000) show that politicians use public employment as a redistributive device
12In this strand of literature, our paper is closes to recent work by Galiani et al. (2017). They use crossing of an
‘arbitrary’ World Bank’s IDA income threshold (that leads to drops in foreign aid for the crossing countries) as an
instrumental variable to document a positive impact of aid on growth. Nevertheless, Dreher and Lohmann (2015)
use the same IDA instrument at a more disaggregated level to document that once regional fixed effects are included,
positive effect of aid on growth disappears. Therefore, unobservable aid recipient characteristics might be confounding
the effect of aid on growth.13Nunn and Qian (2014) too use exogenous variations in donor countries, i.e., agricultural production in the United
States, to link foreign aid with conflict in a cross-country setting.14For instance, Easterly, Levine and Roodman (2004) demonstrates that in a cross-country regression one can strate-
gically select a sample of countries (and time periods) that can exhibit a positive, negative or null effect of foreign aid
on development.
7

in US cities. Similarly, Alesina, Danninger and Rostagno (2001) show for Italy that public em-
ployment allowed for transfer of resources from the North to the South. One major reason for the
use of public employment in redistributive politics is that even though politicians cannot commit,
they can credibly offer public jobs to their constituents.15 Indeed, commitment problems plague
policy-making (Acemoglu (2003)), especially in developing countries.
Following Robinson, Torvik and Verdier (2006) and Robinson and Verdier (2013), our key
premise is that the incumbent mitigates the commitment problem inherent to policy-making by
offering public employment to members of his region of birth before the election, as he cares for
their welfare. In turn, these agents have a higher likelihood of voting for the incumbent, because
they know that the ‘transfer’ they received is costly to reverse after the incumbent is reelected.16
In this model, we first set a theory of redistributive politics through public employment that
adapts the study of Robinson, Torvik and Verdier (2006) on the resource curse to the case of
foreign aid. Next, we study the effect of exogenous aid shocks on the size of the public sector
across regions, and then on the income generated by the country.
Consider a two-period probabilistic voting model and a society with two regions labelled A and
B. The incumbent originates from region A. For simplicity, the mass of voters is normalised to
unity, and each region is of equal size 1/2.
Voters have linear preferences in their own income:
V it ( j) = wi
t( j)− τit ( j), (2.1)
with wit( j) their wage and τ i
t ( j) a lump-sum tax paid by the voters from region i ∈ {A,B} in period
t ∈ {1,2}, when the incumbent originates from region j ∈ {A,B}. We denote gt( j) the fraction
of the labour force employed in the public sector in period t when the incumbent originates from
region j.
15Alesina, Baqir and Easterly (2000) suggest alternatively that public employments allow to transfer resources to
the poor less visibly than tax-transfer schemes.16Likewise, institutional changes mitigate commitment problems inherent to policy-making because they are not
easily reversed. See for instance Acemoglu and Robinson (2000), Bisin and Verdier (2017), Bisin et al. (2018) and
Iyigun, Rubin and Seror (2018).
8

For simplicity we assume that when an agent does not have a public employment, his wage is
equal to his marginal productivity, which we denote h > 0. By contrast, we posit that the produc-
tivity in the public sector is lower than in the private sector. We normalise the productivity in the
public sector to hp < h. Therefore, when the incumbent offers public jobs to private workers, he
necessarily reduces their productivity.
Finally, a fraction z ∈ [0,1] of the labour force is assumed to work in the informal sector. We
can reasonably expect z to be large in the developing world. In Pakistan for instance, according to a
recent 2017-2018 Labour Force Survey 71% of the total labour force operates in the informal sector
(Pakistan Bureau of Statistics (2018)). This is typical for many developing countries (International
Labor Organization (2018)).
The timing of the game is as follows:
1. In period 1, the incumbent offers public employments to a share g(A) of the agents in region
A and to a share g(B) of the agents in region B. He also sets the transfers τA1 (A) and τB
1 (A).
2. At the end of period 1, the agents vote for the incumbent or for his challenger from region B.
3. At the beginning of period 2, the incumbent from region j ∈ {A,B} sets the tax rates τA2 ( j)
and τB2 ( j) and possibly offers new public employments.
We assume that the incumbent values both the rents he extracts from the citizenry and the
welfare of the voters in his region of birth:
W At = v(rA
t )+αV At (A), (2.2)
with α > 0 his degree of altruism for the voters from region of birth A and V At (A) the preferences
of the voters in region A (see (2.1)). The utility function v(.) is assumed increasing and concave in
the level of rent extraction rAt .
The bias that the incumbent has for his region of birth in the specification above is backed
by a large empirical literature on the allocation of public spending. For instance, Hodler and
Raschky (2014) show for 38,427 subnational regions covering 126 countries that political leaders
divert foreign aid to their birth regions when in power where the transfer of resources is starkest in
9

weakly institutionalized countries. Similarly, Lehne, Shapiro and Eynde (2018) demonstrate that
politicians allocate infrastructure contracts to members of their own network in India. Luca et al.
(2018) also document similar ethnic favoritism, as nighttime lights are more intense in political
leaders’ ethnic homelands.
Furthermore, several anecdotal accounts point toward leaders in Pakistan favoring their birth-
place regions, especially at times of aid windfalls. One example provided was the use of foreign
aid to “give away” laptops, in the birthplace province of the incumbent leader (Telegraph (2012)).
Nevertheless, there are a plethora of examples where several political observers and politicians
from minority provinces have lamented the diversion of aid resources by incumbent leaders to
their respective home constituencies. For instance, in the case of US aid: ‘Why there are so many
US Aid tents found in Mardan and not anywhere else?”: Khan Hoti (Dawn (2015)). Likewise,
a prominent senator representing a ethnic minority from Balochistan province noted for Chinese
foreign aid: “It is, in fact, the China-Punjab (aid package) not China-Pakistan as stated officially,
because it will mainly benefit Punjab and not the other provinces.”: Senator Achakzai (quoted in
Dawn (2016)).
Credible policy:
A policy can be credible for two key reasons. Either it is ex post optimal for the incumbent, or the
incumbent cannot easily renege on a policy he has already implemented. Public employment falls
under the second category, as an incumbent can not easily renege in period 2 on a job he offered in
the public sector in the previous period. Offering a public employment before the election is then
a credible mean of transferring resources in this model. Furthermore, the incumbent can make no
credible transfer to the agent in region B, as he does not value their welfare. These agents then
expect τBt (A) = τ > 0 for any period t ∈ {1,2}, with τ a parameter that relates to the fiscal capacity
of the state. We assume that τ leaves the agents above their survival constraint. For simplicity, we
also assume that the incumbent’s degree of altruism α is low, so that he can not credibly promise
to the agents in his own region of birth a lower lump-sum tax, τAt (A) = τ > 0.
Since the incumbent only values the welfare of the agents in his region of birth, he will only
10

offer public jobs in his region of birth, g(B) = 0. Furthermore, as the incumbent faces no reelection
in period 2, he will not offer more public jobs in the last period of the game. We denote u the
minimum wage in the public sector in any period t ∈ {1,2}.
Assumption 1 The incumbent’s degree of altruism α is sufficiently low, so that τAt (A) = τ , while
he necessarily sets the wage of public employees to its minimum u > h.
This assumption is made for convenience, although it seems natural to assume that in a given
period, the incumbent always puts a higher value on a marginal increase in his own revenue than
on a marginal increase in the revenues of the agents in his region of birth.
Voting model:
As in standard probabilistic voting theory (e.g. Persson and Tabellini (2002)), each voter v has an
ideological bias σ v toward the incumbent. This ideological bias is uniformly distributed over the
segment [− 12β, 1
2β]. The parameter β > 0 accounts for the density in the distribution of the voters’
ideological biases. When β is large, then the voters are relatively homogeneous. The incumbent
also experiences a popularity shock θ in any period, with θ uniformly distributed over the segment
[− 12φ, 1
2φ], with φ > 0 a density parameter.
A voter v from group i ∈ {A,B} elects the incumbent when:
V it (A)+σ
v +θ >V it (B). (2.3)
An agent that does not have a public employment has a utility V it (A) = h− τ from choosing A.
Similarly, since B can not credibly commit to any platform, V it (B) = h− τ . It follows that an
agent that is not a public employee chooses the incumbent A when σ v + θ > 0. From simple
computations, we deduce that the incumbent gets half of the votes in the pool of agents with no
public employments. This is unsurprising; neither the incumbent nor his challenger makes credible
promises to these voters, which are then indifferent between the two types of candidates. A public
employee, however, knows that given that he has been offered a job by the incumbent from region
A, he will keep his public employment in the next period, so he elects A when:
u− τ +σv +θ > h− τ. (2.4)
11

We deduce that the probability that the incumbent is reelected which writes as follows:
P(g(A),wA2 ) =
12+
φg(A)2
(u−h). (2.5)
The higher the share of public employees, the larger the probability that the incumbent is re-
elected, given that u > h under assumption 1. Indeed, as long as the incumbent pays the public
employees a higher wage than what is attainable in the private sector h - and creates these employ-
ments in his region of birth - he increases his probability of winning.
Predictions:
We denote a1 > 0 the foreign aid that the incumbent receives in the first period, which we assume
exogenous with respect to the characteristics of the economy.17 The incumbent sets the rents
(rA1 ,r
A2 ) and the share of public employments g(A) so as to maximise
R(rA1 ,r
A2 ,g(A)) = v(rA
1 )+α(g(A)u+(1−g(A))h)+P(g(A))(v(rA2 )+α(g(A)u+(1−g(A))h),
(2.6)
given that
rA1 + rA
2 +2g(A)u≤ 2τ +a1. (2.7)
The aid a1 enters directly into the budget constraint of the incumbent, and therefore affects his
incentive to offer public employment and to extract rents. The optimal policy solves the following
first-order conditions:v′(r1)−P(g)v′(r2) = 0
(1+P(g))α(u−h)−2v′(r2)P(g)+dP(g)
dg [v(r2)+α(gu+(1−g)h] = 0,(2.8)
with r2 = 2τ +a1−2ug− r1.
The first line of (2.8) relates to the optimal level of extraction in period 1. When setting the
level of extraction in period 1, and for a given fraction of public employees, the incumbent trades-
off the marginal value of capturing rents in the current period with that of capturing rents in the
17In section 3, we back this by introducing an identification strategy and presenting evidence in support of this
contention for the case of the US aid to Pakistan.
12

next period. The higher the probability of being reelected P(g) then, the higher the marginal cost at
capturing rents in the first period, so the lower the level of extraction in period 1. We can then easily
deduce from the first line of (2.8) a locus r1(g), which is decreasing with g (as P(g) increases with
g). In other words, the optimal level of extraction is a decreasing function of the share of public
employments.
The second line of (2.8) gives the first-order condition with respect to the fraction of public
employees in the region of birth of the incumbent g. First, when increasing g, the incumbent
anticipates that he will increase his probability of winning, and hence the present value of the rents
that he extracts in period 2. This effect is given by the last term in the LHS of the second line of
(2.8), with dP(g)dg = φ
2 (u− h) > 0. Second, the incumbent internalizes that a marginal increase in
g will positively affect the welfare of the agents in his region of birth, since u > h. This effect is
given by the first term in the LHS of the second line of (2.8). Finally, the incumbent anticipates
that an increase in the share of public employees in the first period also means that he will be more
constrained when capturing rents in the next period. This is the second term in the LHS of the
equation.
As for the first first-order condition, we can show that the second line of (2.8) gives a locus
g(r1), which is decreasing in r1. Indeed, the higher the level of extraction in period 1, then the
lower the incentive of the ruler to transfer resources to the citizenry by creating public jobs. This
is because the present value of extracting resources in period 2 is low when the level of extraction
in period 1 is high. Hence, the incumbent has less incentive to offer public employments in order
to be reelected.
Given the previous analysis, the two loci that we deduced from the first-order conditions are
decreasing functions, so they intersect only once. There is a unique equilibrium. We establish the
following result.
Proposition 1 The share of public employments in the region of birth of the incumbent increases
with the level of aid a1.
Proof. The proof is available in Appendix A.1. �
13

An increase in the level of aid induces an income effect that increases both the incentive of
the incumbent to extract rents and to redistribute public jobs in his region of birth. Nevertheless,
since rent extraction and redistribution of public jobs are substitutes, the net effect of aid on public
employment is ambiguous. Indeed, as discussed previously, when the incumbent creates public
employment, he also increases the marginal cost at capturing rents in the first period of the game.
This is the key mechanism of this model: redistribution through public employment - by increasing
the likelihood of winning the election - also disciplines the incumbent in period 1. Foreign aid -
through patronage - increases the dynamic efficiency of the public policy. As it turns out, the
income effect induced by the aid flow increases the incentive of the incumbent to redistribute
resources through public jobs, and this effect is not offset by a higher level of rent extraction.
The income generated by the country is
Y1 = a1− r(a1)+h(1− (1− z)g(a1)
2)+
g(a1)
2hP, (2.9)
with hP the productivity in the public sector. Indeed, the income generated by the country is equal
to the sum of the production in the private sector h(1− (1− z)g(a1)2 , in the public sector g(a1)
2 hP
and the aid flow net of the rents extracted by the incumbent, a1− r(a1). We establish the following
result.
Proposition 2 The income generated by the country increases with the level of aid a1 when the
informal sector is sufficiently large.
Proof. The proof is available in Appendix A.2 �
In the general case, the effect of the aid flow a1 on the total income is ambiguous. Indeed,
there are three effects to consider. First, the aid flow increases the fraction of public employees,
as established in proposition 1. Therefore, a share of the workforce in the region of birth of
the incumbent is driven out of the private sector. A fraction (1− z)g(a1)2 of the agents in the
region of birth of the incumbent then switches from formal occupations in the private sector to
public jobs. This shifts their productivity from h to hP, with hP possibly below h. When hP < h,
the redistribution through public jobs leads to a negative effect on the aggregate income, as the
productivity of the workforce decreases.
14

The second effect to consider is that redistribution through public employment decreases the
scope of informality, as a fraction zg(a1)2 of the agents with informal occupations in the region of
birth of the incumbent now have formal jobs in the public sector. This tends to increase the reported
national income.
Finally, there is a third effect to consider, which is that the aid flow has a direct effect on
income, and so does the extraction of rents. The aid flow net of rents a1− r(a1) tends to increase
with the level of aid a1, which means that the aid flow is not completely dissipated in rents.
The aid flow has a positive net effect on the national income when the first effect above is
dominated by the sum of the two others. More specifically, aid increases the national income when
- despite the possible loss of productivity due to a shift of a fraction of the labour force from the
private to the public sector - the scopes of informality and rent extraction are sufficiently dimin-
ished. Again, the net effect of aid on national income crucially relies on the following mechanism:
redistribution through public employments - by increasing the benefit of staying in office - also
increases the dynamic efficiency of the public policy. This political channel could explain why
we observe a positive effect of foreign aid on economic growth. Aid unambiguously increases
the national income when the share of informal workers is sufficiently large, because in that case
the loss of productivity that is induced by the redistribution through less productive public jobs is
limited.
2.1 Bringing the theory to the data:
In order to test the predictions of this theory, we rely on data on US aid to Pakistan for two major
reasons. First, Pakistan is characterized by weak institutions and a large informal sector. This
makes the link between patronage and foreign aid particularly strong. Second, our data as well as
the identification strategy for US aid to Pakistan allows for causal inferences.18
18Another related reason for us focusing on United States foreign aid to Pakistan is data availability. We have a long
output series both at national and subnational level. Additionally, for Pakistan, the data availability, for instance data
on public employment, allows us to directly test for key prediction of the model. This is atypical for studies on foreign
aid where data constraints, particularly for aid recipient countries is particularly stark.
15

Pakistan and patronage:
First, Pakistan is a particularly interesting case study for this theory, as it is characterized by weak
institutions, a large informal sector, state resources subjected to elite capture and low level of trust
(see e.g. Williams, Shahid and Martınez (2016); Cheema, Mehmood and Imran (2016); Acemoglu
et al. (2018) ).19 In Pakistan, the link between aid and patronage is then particularly stark. In-
deed, given the institutional background, foreign aid programs in Pakistan have come under strong
criticism for their funding of patronage and lack of transparency (Kopetchny (2006)). As anecdo-
tal evidence first, the use of British foreign aid money to give away laptops in birthplace of the
incumbent leader (former prime minister Nawaz Sharif) ahead of elections caught attention of in-
ternational media and was heavily criticised (Telegraph (2012)). Likewise, the use of Chinese aid
to build infrastructure only around the birth-region of incumbent head of state led opposition leader
in parliament to proclaim: “Nawaz is not the Prime Minister of Pakistan, he is the Prime Minister
of Punjab (his home province)” Bilawal Bhutto quoted in Dawn (2016). In a well publicised World
Bank’s Evaluation of Assistance Report by Birdsall, Malik and Vaishnav (2005), it was noted that
although “growth rates were above the developing country average” during the aid program but
“managing the economy and implementing reforms are not institutionalized nor embedded in a
resilient and transparent system of government accountability or of adequate checks on abuse of
power. ” Likewise, Easterly (2001) considered Pakistan a “puzzle” where he posed the question
that “why in Pakistan the low human capital indicators ... social and institutional development did
not prevent a respectable growth rate of 2.2 percent per capita over 1950-99?”.
The theory above partly answers to this puzzle, as we show that despite aid being used to fund
patronage, it can still have a positive effect on growth. Our point is that incumbents use the foreign
aid to redistribute resources in their region of birth, as it allows them to alleviate the commitment
problems inherent in policy-making. This result is established in proposition 1. Nevertheless, we
demonstrate in proposition 2 that as incumbents consolidate their power - through redistribution -
19For instance, Khwaja and Mian (2005) estimates the costs from corruption due to borrowing from public banks
by politically connected firms in Pakistan to be in the range of 0.3 to 1.9% of GDP every year. Likewise, Khwaja and
Mian (2008) show how political connections and political volatility in Pakistan also weakens the financial system and
access to finance in the credit markets.
16

they also increase the present value of better public policies. This, we argue, is particularly true
in the context of the developing world, where the effect of patronage through public employment
on the reported income is limited. When the size z of the informal sector is sufficiently large for
instance - as it is the case for Pakistan - the effect of patronage on the reported national income
should be limited. Hence, after receiving aid revenues, incumbents may also increase their invest-
ments in public goods, and lower the rents they extract from the citizenry. This is precisely what
we find in the empirical section below.
Pakistan and the US aid:
Pakistan is also an interesting case study, as our data and identification strategy we propose allows
to provide causal evidence for the predictions of the model. Indeed, many scholars and policy
makers have noted the highly variable and potentially exogenous United States foreign aid to Pak-
istan and its dependence on strategic factors related to US not Pakistan needs (Kopetchny (2006);
Fair (2009); Haqqani (2013)). Analysis of foreign aid data confirm these observations where the
aid series is highly variable and shows dramatic shifts following major geopolitical events. For in-
stance, Pakistan was receiving about USD 500 million per year following the 9/11 attacks, whereas
virtually no US aid was flowing to Pakistan in the 1990s (see Figure 1).
Historically, the United States foreign aid to Pakistan has flowed with varying intensity since
Pakistan’s independence from the British colonial rule in 1947. The first recorded assistance pack-
age to Pakistan was approved by congress in 1953 and involved a transfer of USD 75 million.
The stated aim of this aid package was to cement strategic ties with Pakistan, following India’s
policy of “non-alignment” with the United States on several key geopolitical issues (Department
of State Bulletin, 1953).20 The second major assistance package was received following the Soviet
Invasion of Afghanistan in the December of 1979. To curb the ‘communist threat’ in the region,
the United States government began to lobby congress to resume foreign aid to Pakistan. This re-
sulted in the United States providing an assistance package of US$ 3.2 billion in the September of
20The United States mission in Islamabad noted “it is in the security interest of United States to extend assistance
to Pakistan for a friendly government of an important and strategic country” (Department of State Bulletin, 1953).
17

1981 (Gwertzman (1981)).21 Finally, the third, major aid package for Pakistan, was following the
9/11 attacks and to garner Pakistan’s support in the global war on terror. This assistance package
involved a transfer of “$1.5 billion in annual non-military aid payments to Pakistan” (Epstein and
Kronstadt (2012), 2013, p. 2).
This strategic nature of US aid was also noted in an US Congressional Oversight Hearing by
the head of United Nations Assistance Mission on Pakistan:
The variation in assistance (to Pakistan) appears to have little to do with Pakistan’s objective
needs; rather Washington’s changing policy priorities towards the country at different points in
time and efforts to achieve U.S. objectives towards the country” (Fair (2009)). Likewise, quanti-
tative analysis of the determinants of United States foreign aid to Pakistan shows that US aid is
uncorrelated with “official development objectives or the recipient need” (Anwar and Michaelowa
(2006), p. 195).
What seems to be highly correlated with United States foreign aid to Pakistan are major geopo-
litical events. For instance, on March 5, 1970, the Nuclear Non-Proliferation Treaty (NPT) was
signed between the US, the UK and the Soviet Union (Shaker (1980)). This reduced the US incen-
tive to give aid to Pakistan (given Pakistan’s nuclear ambitions). Similarly, in December of 1979
Soviet Russia invaded Afghanistan. This, amidst the Cold War, increased US incentive to give aid
to Pakistan. Our interpretation is that these geopolitical events exogenously vary foreign aid com-
ing into Pakistan, while they do not directly affect the domestic fundamentals of Pakistan, which
might be correlated with growth dynamics. From Figure 1, we observe that both aid allocations as
well as actual US aid disbursements peak following the geopolitical shocks of Soviet Invasion of
Afghanistan and 9/11 attacks.
In addition to the geopolitical events, foreign aid flowing to Pakistan is also correlated with
with changes in aid legislations in the United States. As can also be seen in Figure 1, when
aid legislations in the United States were expansive, this too resulted in inflows of US foreign
aid to Pakistan. Under the assumption that the changes in United States aid legislations occur
due to changes in domestic and internal policies of United States, this provides another source
21 An earlier assistance package of US$ 400 million was rejected, dubbed condescendingly as peanuts by President
General Zia (Bose and Jalal (2004)).
18

of exogenous variation to estimate the causal effect of foreign aid on growth and patronage in
Pakistan. Similar results using geopolitical events and changes in aid legislations in the United
States as instruments for foreign aid to Pakistan strengthens the case that the results we obtain are
causal. For a list of all changes in US aid legislations i.e. changes to the Foreign Assistance Act of
1961 from 1970 to 2015, see Table 1.22
3 Empirical evidence
3.1 Data Sources and Main Variables
We combine publicly available and archival data sources to construct a national time series and a
province-level panel for output series from 1972 to 2015.23 The data sources include US Green-
book of Aid, IMF historical archives, Central Bank of Pakistan archives, World Development
Indicators of the World Bank, Penn World Tables, Polity IV and ICRG institutional risk indices,
UNESCO Institute of Statistics (2018); Arby (2008), Pakistan Bureau of Statistics (2018) and
Global Terrorism Database (2018).
Outcome variables.—The main outcome variables are: annual national GDP per capita, annual
province-level panel for industrial production and a monthly series for industrial production. These
variables are converted to natural logarithms to simplify the interpretation and to remain in sync
with much of the aid-growth literature.24 The GDP figures are in constant per capita terms and
obtained from the Central Bank of Pakistan.25 The monthly industrial production data are obtained
from the IMF historical archives. The province-level industrial production series is retrieved from
a study commissioned by the Central Bank of Pakistan (Arby (2008)).
22For description of the content of each change in aid legislation, see Table C.1 in Appendix C.3.23We start from year 1972 primarily because in 1971 East Pakistan split into Bangladesh i.e. Pakistan was not
the same country before and after 1971. Although, we find similar results when we take full available sample of
1960-2015.24Juselius, Mller and Tarp (2014) discusses other advantages of the log transformation of aid variable such as
mitigating non-normality, non-linearity and explosive roots.25The results are robust if we consider the GDP series from the Penn World Tables 9.0 or the World Development
Indicators.
19

Foreign aid variables.—We employ four foreign aid regressors as explanatory variables. First,
is the “Economic Support Fund” (ESF). An unearmarked budget support fund deposited by the US
government to the Ministry of Finance in Pakistan. The stated aim of this “strategic” component
of foreign aid is to “advance U.S. foreign policy interests” (State Department Briefings, 2010, p.
39).26 As can we seen in Figure 1 (Panel A), the stated aim of this foreign aid matches well with
observed behaviour of US policy makers, in light of changing world events.
Second, we generate a month-specific measure of foreign aid that is constructed based on im-
portant geopolitical event dates that changed the US government’s incentive to give aid to Pakistan.
This dummy variable, also shown in Figure 1 (Panel A), takes the value 1 for positive aid shock
months such as the Soviet Invasion and 9/11 attacks, and zero otherwise. Third, we construct a
US Aid Legislation dummy variable. This variable switches on when the United States Congress
makes the US aid policy expansive (and switches off when it makes it restrictive). Shaded areas
in Figure 1 (Panel B) represent episodes of expansive foreign aid regimes in the United States.27
Fourth, we use the US Official Development Assistance (ODA) aid flows measure used in much
of the literature. The Economic Support Fund allocations as well as foreign aid flows are also
converted to natural logarithms and their overtime evolution can be seen in Figure 1.
Additional variables: We use several additional variables in the analysis. This includes non-
US aid, military aid, defence spending in Pakistan, US trade and investments. These variables
are obtained from Ministry of Finance, the World Development Indicators and the Central Bank of
Pakistan. The series for composite Polity IV index is obtained from database of Marshall, Gurr and
Jaggers (2016) and “ICRG” country risk indicators and policy indices are obtained from Political
Risk Services Group. Data on terrorism is obtained from the Global Terrorism Database (2018).
26We find similar results when we use standard measure of aid flows employed in much of literature, as defined by
the Development Assistance Committee (DAC), instead of the ESF. In fact, we find similar results across all the four
aid regressors.27The coding of aid legislation as expansive is rather straightforward since it involves formalization of a assistance
package as opposed to restrictive legislation that put explicit conditions on aid (e.g. no aid to human rights violators
as in Morgan Amendment or no aid to countries trying to acquire a nuclear weapon as in Symington and Pressler
Amendments). See Table 1 for the list of all the legislative changes to the Foreign Assistance Act and Table C.1 in the
Appendix C.3 for the descriptions of these changes in aid legislations.
20

The public expenditures on education series is obtained from UNESCO’s Institute for Statistics,
public employment data is obtained from Pakistan Bureau of Statistics (2018) the consumption
data is obtained from the Central Bank of Pakistan, province level controls such as the provincial
defence production, agricultural value added, value of construction projects is obtained from Arby
(2008).28
3.2 The Effect of Foreign Aid on Growth
Before estimating the impact of foreign aid on economic growth and a differential effect of aid at
the birth region of incumbent leader we note that output growth in Pakistan experiences a change in
trend around time of geopolitical events. A formal test confirms this. As can be seen from Figure 2,
GDP per capita and its cyclical component through the HP filter, respond heavily following major
geopolitical events. A similar relationship is observed with the monthly industrial production
series. Is this change in trend the result of the causal impact of foreign aid on output growth? In
this section, we present evidence consistent with the view that US foreign aid shocks have a causal
impact on output growth in Pakistan. Our baseline method is the Narrative Vector Autogression
(due to Romer and Romer (2010)). This method allows us to assess the dynamic impact of a
economic shock on aggregate outcomes. We also show that the results are robust to using an
alternate methodology.
We begin the analysis by estimating the bi-variate Narrative Vector Autoregression (NVAR,
henceforth) model. A parsimonious two variable NVAR is estimated as the baseline, since it pro-
vides greater transparency, especially when making causal claims (as in Romer and Romer (2010)).
To show the robustness of the results, we also estimate the NVAR with additional variables. The
salient feature of this methodology allows one to completely circumvent the ordering restrictions
which are needed to make causal claims in traditional VARs and allows us to trace the dynamic
overtime impact of a unit shock on aggregate output in a transparent manner (Ramey (2011); Mon-
net (2014)).28For more details on the sources and explanations of the variables see the variable description section in the online
Appendix B.1.
21
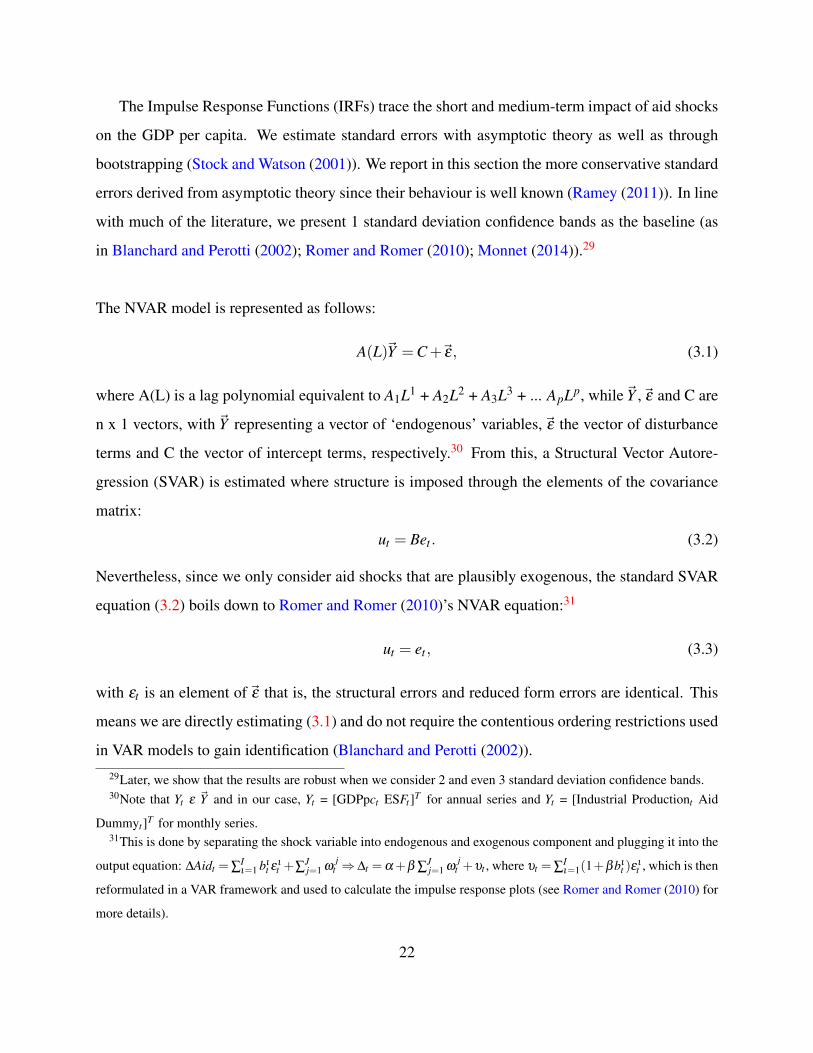
The Impulse Response Functions (IRFs) trace the short and medium-term impact of aid shocks
on the GDP per capita. We estimate standard errors with asymptotic theory as well as through
bootstrapping (Stock and Watson (2001)). We report in this section the more conservative standard
errors derived from asymptotic theory since their behaviour is well known (Ramey (2011)). In line
with much of the literature, we present 1 standard deviation confidence bands as the baseline (as
in Blanchard and Perotti (2002); Romer and Romer (2010); Monnet (2014)).29
The NVAR model is represented as follows:
A(L)~Y =C+~ε, (3.1)
where A(L) is a lag polynomial equivalent to A1L1 + A2L2 + A3L3 + ... ApLp, while~Y ,~ε and C are
n x 1 vectors, with ~Y representing a vector of ‘endogenous’ variables,~ε the vector of disturbance
terms and C the vector of intercept terms, respectively.30 From this, a Structural Vector Autore-
gression (SVAR) is estimated where structure is imposed through the elements of the covariance
matrix:
ut = Bet . (3.2)
Nevertheless, since we only consider aid shocks that are plausibly exogenous, the standard SVAR
equation (3.2) boils down to Romer and Romer (2010)’s NVAR equation:31
ut = et , (3.3)
with εt is an element of~ε that is, the structural errors and reduced form errors are identical. This
means we are directly estimating (3.1) and do not require the contentious ordering restrictions used
in VAR models to gain identification (Blanchard and Perotti (2002)).
29Later, we show that the results are robust when we consider 2 and even 3 standard deviation confidence bands.30Note that Yt ε ~Y and in our case, Yt = [GDPpct ESFt ]T for annual series and Yt = [Industrial Productiont Aid
Dummyt ]T for monthly series.31This is done by separating the shock variable into endogenous and exogenous component and plugging it into the
output equation: ∆Aidt =∑Iι=1 bι
t ε ιt +∑
Jj=1 ω
jt ⇒ ∆t =α+β ∑
Jj=1 ω
jt +υt , where υt =∑
Iι=1(1+βbι
t )ειt , which is then
reformulated in a VAR framework and used to calculate the impulse response plots (see Romer and Romer (2010) for
more details).
22
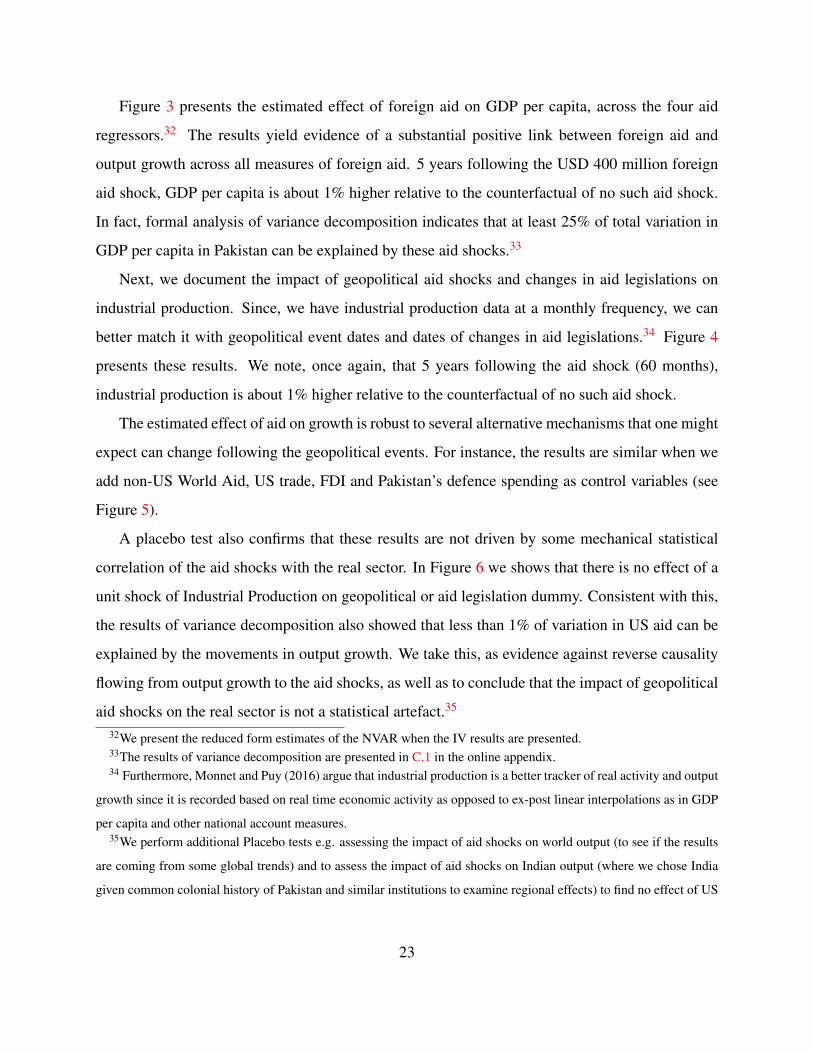
Figure 3 presents the estimated effect of foreign aid on GDP per capita, across the four aid
regressors.32 The results yield evidence of a substantial positive link between foreign aid and
output growth across all measures of foreign aid. 5 years following the USD 400 million foreign
aid shock, GDP per capita is about 1% higher relative to the counterfactual of no such aid shock.
In fact, formal analysis of variance decomposition indicates that at least 25% of total variation in
GDP per capita in Pakistan can be explained by these aid shocks.33
Next, we document the impact of geopolitical aid shocks and changes in aid legislations on
industrial production. Since, we have industrial production data at a monthly frequency, we can
better match it with geopolitical event dates and dates of changes in aid legislations.34 Figure 4
presents these results. We note, once again, that 5 years following the aid shock (60 months),
industrial production is about 1% higher relative to the counterfactual of no such aid shock.
The estimated effect of aid on growth is robust to several alternative mechanisms that one might
expect can change following the geopolitical events. For instance, the results are similar when we
add non-US World Aid, US trade, FDI and Pakistan’s defence spending as control variables (see
Figure 5).
A placebo test also confirms that these results are not driven by some mechanical statistical
correlation of the aid shocks with the real sector. In Figure 6 we shows that there is no effect of a
unit shock of Industrial Production on geopolitical or aid legislation dummy. Consistent with this,
the results of variance decomposition also showed that less than 1% of variation in US aid can be
explained by the movements in output growth. We take this, as evidence against reverse causality
flowing from output growth to the aid shocks, as well as to conclude that the impact of geopolitical
aid shocks on the real sector is not a statistical artefact.35
32We present the reduced form estimates of the NVAR when the IV results are presented.33The results of variance decomposition are presented in C.1 in the online appendix.34 Furthermore, Monnet and Puy (2016) argue that industrial production is a better tracker of real activity and output
growth since it is recorded based on real time economic activity as opposed to ex-post linear interpolations as in GDP
per capita and other national account measures.35We perform additional Placebo tests e.g. assessing the impact of aid shocks on world output (to see if the results
are coming from some global trends) and to assess the impact of aid shocks on Indian output (where we chose India
given common colonial history of Pakistan and similar institutions to examine regional effects) to find no effect of US
23

Next, we present the robustness of these results by instrumental variable regressions. Specifi-
cally, we instrument, the US foreign aid flows with geopolitical event and aid legislation dummies,
and estimate the reduced form NVAR with OLS and 2SLS, respectively:
yt = β0 +L.USAidt +Trend +SeasonalDummies+L.Xt + εt , (3.4)
where, yt is GDP per capita, US Aid is the US Official Development Assistance (ODA) aid flows
and Xt is a matrix of available control variables used in the analysis.36 Lag length is decided as in
the NVAR based on information criteria that gives the optimal statistical fit relative to complexity.37
Table 2 presents the results. The results yield strong evidence that foreign aid exerts a qualitatively
and statistically significant impact on output growth. Considering the aid legislation instrument,
a 1% increase in aid flows is associated with about a 0.15 percentage point increase in GDP per
capita growth the following year.38. Plotting the overtime impact of foreign aid with additional
lags shows that this effect is persistent (see Figure 7).
Nevertheless, if the expansive US aid legislations signal global investors that the United States
government favours Pakistan beyond its foreign aid policy, it might signal global investors that the
investment climate in Pakistan is about to improve in expectation due to being in good books of the
United States, then we might be picking up the impact of this favorable investment climate instead
of the actual impact of US aid. Although, we cannot completely rule out this mechanism, but we
conduct a placebo test that undermines this hypothesis. Since, there were several aid legislations
could not pass both houses of Congress, so we use expansive US aid legislations that were tabled
yet could not be enacted. Table 3 presents these results. The results show that instrumenting US
foreign aid to Pakistan on global or Indian output growth. Results are available on request.36We obtain similar results when we use Economic Support Fund (ESF) aid allocations instead of US ODA aid
flows as a measure of foreign aid.37Nevertheless, the results are not sensitive to the lag length ordering. In Figure 7, we plot coefficient estimates on
foreign aid with varying lag lengths and conclude that the impact of foreign aid is robust and persists.38This magnitude of the impact of foreign aid is consistent with recent reviews where a “one percentage-point
increase in Aid/GDP is typically followed an annual average real GDP per capita growth of 0.10.2 percentage points”
(Clemens et al. (2011), p. 609). Likewise, the downward bias of OLS estimate is consistent with recent work by
Galiani et al. (2017) Nevertheless, we should interpret the magnitudes here with caution as they do not capture the
overall dynamic effect of aid over the 5 years as in the VAR results.
24

foreign aid with failed expansive aid legislations has no impact on output growth in Pakistan.39
Finally, we provide evidence in favor of the exclusion restriction by conducting a check for
balance for all available potential confounders of US aid. Table 4 presents these results. We note
that detrended US FDI, trade, non-US aid, Pakistan’s military spending is statistically similar with
geopolitical dummy switched on and off but US aid flows, US aid allocations and GDP per capita
are not.40
3.3 The Effect of Foreign Aid on Patronage
This subsection is divided into two parts. First, consistent with the predictions of the model, we
present evidence that aid shocks leads to higher public employment and expenditures. Second, we
show how foreign aid shocks deferentially impact birth province of incumbent leaders.
A key theoretical prediction of the model is that foreign aid increases public employment.
Indeed, in proposition 1, we demonstrate that incumbents create public jobs as it is a credible
transfer, which allows them to increase the likelihood of staying in office. We test for this by
examining the impact of foreign aid on employment of public school teachers who are federal
employees in Pakistan. This is consistent with anecdotal accounts from Pakistan where politicians
use employment of public school teachers as a tool to dole out political favours (see for instance,
Aziz et al. (2014)). Figure 8 (Panel A) present these results. We find that the USD 400 million
foreign aid shock increases public employment by about 2% relative to the counterfactual of no
such aid shock. Similarly, aid shock also increases public expenditures on education (see Figure 8,
Panel B).
Next, we show that the gains from foreign aid are not homogeneously spread at the national
level. To test the prediction of the model that gains from foreign aid are differentially distributed
according to the birthplace of incumbent leader, we extend Nunn and Qian (2014) and Temple and
Van de Sijpe (2017) intuition of interact time-varying variable related to the donor with a time and
space varying variable related to the recipient, but at a subnational level. Specifically, we estimate
39Later, we also show that investment risk and other political risk indices in Pakistan do not change following the
geopolitical aid shocks.40Similar results are found with aid legislation dummy switched on and off.
25

the following equation:
ypt = β (GeographicalAidt xHeado f Statept)+ρHeado f StateBirthpt +X′pt .θ
+αp + γt + t.φp + εpt , (3.5)
where ypt is the industrial production in province p at year t, αp and γt are province and year fixed
effects, respectively. As different provinces can have different development trajectories, for exam-
ple due to different provincial policy choices, we control for these differential trends by adding
province-specific trend, t.φp, to equation (3.5).
Geopolitical aid shock is the geopolitical shock dummy variable used in the time series analy-
sis. The Heado f StateBirthpt is a province and time varying variable that takes the value of 1 for
the birthplace province, in the years that the head of state is in office (and zero otherwise). Fur-
thermore, we add the available province level controls (province agricultural output, construction
and housing value added) to the list of covariates (Xpt). The interaction between the head of states
birthplace and the geopolitical aid shock dummy is the main variable of interest. The coefficient
on this interaction (β ) gives us the estimate of the differential effect of the geopolitical aid shock
if the incumbent head of state was born in that province.
Table 5 presents these results. The results imply that output growth during the geopolitical aid
shocks is about 2 percentage points higher in the birthplace provinces of the incumbent leaders
relative to those that were not in power during the aid windfalls. In absence of geocoded US aid
data to Pakistan, we present two pieces of evidence that suggest that incumbent leaders divert aid
resources to their respective birth provinces. First, we present anecdotal accounts. Second, we
rule out several channels that might confound the results. Many anecdotal accounts point towards
leaders favoring their birthplace regions, especially at times of aid windfalls in Pakistan. One
example that was discussed with the use of foreign aid to “give away” laptops, in the birthplace
province of the incumbent leader(Telegraph (2012)). Similarly, several political observers and
politicians have lamented the diversion of aid resources by incumbent leaders to their respective
home constituencies.41.41“Why there are so many US Aid tents found in Mardan and not anywhere else in the province?”: Khan Hoti. or
26

In addition to the anecdotal accounts, we rule out several alternate channels that might result
in the confounding of the impact of aid and diversion of resources to incumbent head of states
birthplace during the aid windfalls. We add additional controls and their interactions to equation
(3.5) and examine how the coefficient estimate on the interaction of incumbent’s birthplace and aid
change. Table 6 presents these results. We note that results become more precise and that only the
US aid shocks result in a disproportionate increase in output growth in the birthplace of incum-
bent head of states and that adding non-US foreign aid, US exports, US FDI and other potential
confounders has no bearing on the results. We also present evidence that there are no differen-
tial trends prior to the aid shock. In particular, we show that average industrial production in the
birth-province of the incumbent leader (the treatment) versus the average industrial production in
the provinces where the leader is not in office (the control), follows common trends prior to the
geopolitical aid shocks (see, Figure 9) . Finally, in Table 7, we present the results of a placebo test
where we show that one, two or three years before the region becomes birth region of the incum-
bent head of state during the geopolitical aid shock does not induce a disproportionate increase in
output growth in Pakistan.
3.4 Robustness Checks
In this section we conduct additional robustness checks and sensitivity analysis of the results.
First, we show that the results are robust to additional alternative explanations linking US aid to
Pakistan’s output growth. Second, we conduct econometric stability checks on the results.
There are additional alternative channels that might link US foreign aid to output growth in
Pakistan. For one, even if the US economic assistance does not directly impact defense spending,
it might still increase defense production in Pakistan, if for example, the US economic support
funds were diverted to the military. Second, higher terrorism levels in Pakistan may draw more
US aid, then the higher consequent GDP per capita growth might not be due to increased aid
“It is, in fact, the China-Punjab (aid package) not China-Pakistan as stated officially, because it will mainly benefit
Punjab and not the other provinces.”: Senator Achakzai. Or “Nawaz is not the Prime Minister of Pakistan, he is the
Prime Minister of Punjab (his home province)”: Member Parliament, Bilawal Bhutto, quoted in Dawn (2016)
27

per se, but its conflict reducing effect. Third, geopolitical aid shocks might give rise to a new
political equilibrium which might in turn impact investment and political risk in Pakistan.42 The
placebo test that attempted to link failed aid legislations in the United States to output growth
in Pakistan, undermines this hypothesis to some extent, but it might not completely capture the
change in investment and political climate following successful changes in aid legislation and the
geopolitical shocks.
Although, it is impossible to completely rule out each of these channels, but we present ev-
idence against them. Figure 10 presents the results. From Panel A, we observe that foreign aid
exerts negligible impact on defence component of GDP in Pakistan. This implies that the defence
component of GDP is not impacted by foreign aid shocks. Furthermore, controlling for terrorism,
ICRG investor and Polity IV institutional index has no bearing on the results: foreign aid is still
positively associated with output growth in Pakistan (Figure 10, Panel B, C and D).43
Next, we conduct some key NVAR diagnostic tests that have been discussed in the literature
(Romer and Romer (2010); Lutkepohl and Schlaak (2018); Monnet (2014)). First, we show that
the results are not dependent on the chosen ordering restrictions that crucially determine standard
VAR results (see for example, Fernandez-Villaverde et al. (2007)’s critique of VARs on exactly this
point). From Panel A of Figure 11, we observe that varying the ordering restriction of the NVAR
has no impact on the qualitative as well as statistical significance of the results. Second, we show
the results are statistically strong i.e. they are robust even when we consider two or even three
standard deviation bands.44 Panel B of Figure 11 presents these results. We observe especially
from year 2 to 5, the IRF estimates are even within three standard deviation bands.
Finally, we show that results are robust to computing standard errors through bootstrapping in-
42Depending on whether geopolitical events increased or decreased domestic risk in Pakistan, it can lead to an
improvement or decline in economic performance.43In fact, none of the political and investment risk indices in Pakistan seem to change following the geopolitical
events or changes aid legislations in the United States. This is why controlling for them in the regressions has no
bearing on the main results.44Although, most of the empirical VAR literature uses one confidence interval bands (e.g. see Blanchard and Perotti
(2002); Monnet (2014)). Nevertheless, to demonstrate the statistical power of the relationship between US aid shocks
and output growth, we also report here the impulse responses with 95% and 99% confidence intervals.
28

stead of the asymptotic theory. Kilian (1998) and Pool, De Haan and Jacobs (2015) have suggested
using bootstrapped confidence intervals especially when working with small samples. Although,
we have continued to report more conservative standard errors, based on asymptotic theory, but in
Figure 11 (Panel C), we also compute standard errors by bootstrapping. We note that the results
remain unchanged.
4 Conclusion
In this paper, we have demonstrated that although foreign aid can fund patronage, it may still have
a positive - and significant - effect on economic growth in developing countries. By doing so, our
theory links two strands of literature that grew apart in the recent decades: one demonstrating the
positive effect of foreign aid on growth, the other emphasising the distortionary effects of foreign
aid on patronage, ethnic favoritism and corruption.
Pakistan provides a particularly interesting context to empirically examine the predictions of
the model, as political corruption is widespread, informal sector is large, while data on US aid,
identification strategy and subnational output series allows us to provide causal evidence. We
demonstrated that the effects of aid on patronage and economic growth are positive and significant.
An aid shock of about USD 400 million leads to an additional 1% increase in GDP per capita
growth and 2% increase in public employment. Moreover, the impact of aid is disproportionately
larger in the region of birth of the incumbent.
This study furthers the debate on the use of foreign aid in the developing world, foremost by
suggesting that aid - precisely because it funds patronage - increases incumbents’ benefit of staying
in power, making public policies more efficient. It also raises the important - and under-studied
issue - of the interaction between aid and institution building in the developing world. In particular,
since aid allows to increase the scope of commitment to future policies - through patronage - it may
also prevent developing countries from building more inclusive political institutions.
29

References
Acemoglu, Daron. 2003. “Why not a political Coase theorem? Social conflict, commitment, and
politics.” Journal of Comparative Economics, 31(4): 620–652.
Acemoglu, Daron, Ali Cheema, Asim I Khwaja, and James A Robinson. 2018. “Trust in State
and Non-State Actors: Evidence from Dispute Resolution in Pakistan.” National Bureau of Eco-
nomic Research.
Acemoglu, Daron, and James A. Robinson. 2000. “Why Did the West Extend the Franchise?
Democracy, Inequality, and Growth in Historical Perspective*.” The Quarterly Journal of Eco-
nomics, 115(4): 1167–1199.
Adam, C. S., and S. A. OConnell. 1999. “Aid, Taxation and Development in Sub-Saharan Africa.”
Economics & Politics, 11(3): 225–253.
Ahmed, Faisal Z. 2012. “The Perils of Unearned Foreign Income: Aid, Remittances, and Govern-
ment Survival.” American Political Science Review, 106(1): 146165.
Alesina, Alberto, Reza Baqir, and William Easterly. 2000. “Redistributive Public Employment.”
Journal of Urban Economics, 48(2): 219 – 241.
Alesina, Alberto, Stephan Danninger, and Massimo Rostagno. 2001. “Redistribution Through
Public Employment: The Case of Italy.” IMF Staff Papers, 48: 447–73.
Anwar, Mumtaz, and Katharina Michaelowa. 2006. “The political economy of US aid to Pak-
istan.” Review of Development Economics, 10(2): 195–209.
Arby, Muhammad Farooq. 2008. “Some issues in the national income accounts of Pakistan (re-
basing, quarterly and provincial accounts and growth accounting).”
Arndt, Channing, Sam Jones, and Finn Tarp. 2016. “What is the aggregate economic rate of
return to foreign aid?” The World Bank Economic Review, 30(3): 446–474.
30

Asongu, Simplice. 2012. “On the effect of foreign aid on corruption.” Economics Bulletin,
32(3): 2174–2180.
Azam, Jean-Paul, and Jean-Jacques Laffont. 2003. “Contracting for aid.” Journal of develop-
ment economics, 70(1): 25–58.
Aziz, Mehnaz, David E Bloom, Salal Humair, Emmanuel Jimenez, Larry Rosenberg, and
Zeba Sathar. 2014. “Education system reform in Pakistan: why, when, and how?” IZA Policy
Paper.
Bazzi, Samuel, and Michael A. Clemens. 2013. “Blunt Instruments: Avoiding Common Pit-
falls in Identifying the Causes of Economic Growth.” American Economic Journal: Macroeco-
nomics, 5(2): 152–86.
Besley, Timothy, and Stephen Coate. 1997. “An Economic Model of Representative Democracy.”
The Quarterly Journal of Economics, 112(1): 85–114.
Birdsall, Nancy, Adeel Malik, and Milan Vaishnav. 2005. “Poverty and the Social Sectors: The
World Bank in Pakistan 1990-2003.”
Bisin, Alberto, and Thierry Verdier. 2017. “On the Joint Evolution of Culture and Institutions.”
National Bureau of Economic Research Working Paper 23375.
Bisin, Alberto, Jared Rubin, Avner Seror, and Thierry Verdier. 2018. “Religious Legitimacy
and the Long Divergence.” Working Paper.
Blanchard, Olivier, and Roberto Perotti. 2002. “An empirical characterization of the dynamic
effects of changes in government spending and taxes on output.” the Quarterly Journal of eco-
nomics, 117(4): 1329–1368.
Bose, Sugata, and Ayesha Jalal. 2004. “Modern South Asia: History, Culture, Political Economy,
2e ed.”
Bourguignon, Francois, and Jan Willem Gunning. 2016. “Foreign aid and governance: A sur-
vey.” EDI-RA1 Working Paper.
31

Bourguignon, Francois, and Jean-Philippe Platteau. 2017. “Aid Effectiveness: Revisiting the
Trade-off Between Needs and Governance.” C.E.P.R. Discussion Papers CEPR Discussion Pa-
pers 12277.
Burnside, Craig, and David Dollar. 2004. “Aid, policies, and growth: reply.” American economic
review, 94(3): 781–784.
Cheema, Abdur Rehman, Abid Mehmood, and Muhammad Imran. 2016. “Learning from the
past: analysis of disaster management structures, policies and institutions in Pakistan.” Disaster
Prevention and Management, 25(4): 449–463.
Clemens, Michael A, Steven Radelet, Rikhil R Bhavnani, and Samuel Bazzi. 2011. “Counting
chickens when they hatch: Timing and the effects of aid on growth.” The Economic Journal,
122(561): 590–617.
Dawn. 2015. “Senators say CPEC turned into China-Punjab corridor.”
Dawn. 2016. “Nawaz is not PM of Punjab, he is PM of Pakistan.”
Djankov, Simeon, Jose G. Montalvo, and Marta Reynal-Querol. 2008. “The curse of aid.”
Journal of Economic Growth, 13(3): 169–194.
Dreher, Axel, Andreas Fuchs, Roland Hodler, Bradley Parks, Paul Raschky, and Michael J
Tierney. 2016. “Aid on demand: African leaders and the geography of China’s foreign assis-
tance.”
Dreher, Axel, and Sarah Langlotz. 2017. “Aid and growth. New evidence using an excludable
instrument.”
Dreher, Axel, and Steffen Lohmann. 2015. “Aid and growth at the regional level.” Oxford Review
of Economic Policy, 31(3-4): 420–446.
Dreher, Axel, Vera Z Eichenauer, and Kai Gehring. 2016. Geopolitics, aid, and growth: the
impact of UN security council membership on the effectiveness of aid. The World Bank.
32

Easterly, William. 2001. “The political economy of growth without development: A case study
of Pakistan.” Paper for the Analytical Narratives of Growth Project, Kennedy School of Govern-
ment, Harvard University.
Easterly, William, and Tobias Pfutze. 2008. “Where Does the Money Go? Best and Worst
Practices in Foreign Aid.” Journal of Economic Perspectives, 22(2): 29–52.
Easterly, William, Ross Levine, and David Roodman. 2004. “Aid, policies, and growth: com-
ment.” American economic review, 94(3): 774–780.
Epstein, Susan B, and K Alan Kronstadt. 2012. Pakistan: US foreign assistance. Congressional
Research Service Washington, DC.
Fair, C Christine. 2009. “US aid to Pakistan: planning and accountability.” Testimony presented
before the HoU. Se Subcommittee on National Security and Foreign Affairs.
Faye, Michael, and Paul Niehaus. 2012. “Political aid cycles.” American Economic Review,
102(7): 3516–30.
Fernandez-Villaverde, Jesus, Juan F Rubio-Ramırez, Thomas J Sargent, and Mark W Wat-
son. 2007. “ABCs (and Ds) of understanding VARs.” American Economic Review, 97(3): 1021–
1026.
Galiani, Sebastian, Stephen Knack, Lixin Colin Xu, and Ben Zou. 2017. “The effect of aid on
growth: evidence from a Quasi-experiment.” Journal of Economic Growth, 22(1): 1.
Global Terrorism Database. 2018. “Global Terrorism Database.”
Gwertzman, Bernard. 1981. “Pakistan Agrees to a US Aid Plan and F-16 Delivery.” The New
York Times, 16.
Haqqani, Husain. 2013. Magnificent delusions: Pakistan, the United States, and an epic history
of misunderstanding. PublicAffairs.
33

Hodler, Roland, and Paul Raschky. 2014. “Regional Favoritism.” The Quarterly Journal of Eco-
nomics, 129(2): 995–1033.
International Labor Organization. 2018. “International Labor Organization.”
Iyigun, Murat, Jared Rubin, and Avner Seror. 2018. “A Theory of Conservative Revivals.”
Jablonski, Ryan S. 2014. “How Aid Targets Votes: The Impact of Electoral Incentives on Foreign
Aid Distribution.” World Politics, 66(2): 293330.
Juselius, Katarina, Niels Framroze Mller, and Finn Tarp. 2014. “The Long-Run Impact of
Foreign Aid in 36 African Countries: Insights from Multivariate Time Series Analysis*.” Oxford
Bulletin of Economics and Statistics, 76(2): 153–184.
Khwaja, Asim Ijaz, and Atif Mian. 2005. “Do lenders favor politically connected firms? Rent
provision in an emerging financial market.” The Quarterly Journal of Economics, 120(4): 1371–
1411.
Khwaja, Asim Ijaz, and Atif Mian. 2008. “Tracing the impact of bank liquidity shocks: Evidence
from an emerging market.” American Economic Review, 98(4): 1413–42.
Kilian, Lutz. 1998. “Small-sample confidence intervals for impulse response functions.” Review
of economics and statistics, 80(2): 218–230.
Kono, Daniel Yuichi, and Gabriella R. Montinola. 2009. “Does Foreign Aid Support Autocrats,
Democrats, or Both?” The Journal of Politics, 71(2): 704–718.
Kopetchny, T. 2006. “Aid Effectiveness: A Debate Between Steve Radelet and William Easterly,
Nov 27.”
Kuziemko, Ilyana, and Eric Werker. 2006. “How much is a seat on the Security Council worth?
Foreign aid and bribery at the United Nations.” Journal of political economy, 114(5): 905–930.
34

Lehne, Jonathan, Jacob N. Shapiro, and Oliver Vanden Eynde. 2018. “Building connections:
Political corruption and road construction in India.” Journal of Development Economics, 131: 62
– 78.
Luca, Giacomo De, Roland Hodler, Paul A. Raschky, and Michele Valsecchi. 2018. “Ethnic
favoritism: An axiom of politics?” Journal of Development Economics, 132: 115 – 129.
Lutkepohl, Helmut, and Thore Schlaak. 2018. “Choosing Between Different Time-Varying
Volatility Models for Structural Vector Autoregressive Analysis.” Oxford Bulletin of Economics
and Statistics, 80(4): 715–735.
Marshall, Monty G, Ted Robert Gurr, and Keith Jaggers. 2016. “Polity IV project: Political
regime characteristics and transitions, 1800-2015.” Center for Systemic Peace.
Monnet, Eric. 2014. “Monetary policy without interest rates: Evidence from France’s Golden Age
(1948 to 1973) using a narrative approach.” American Economic Journal: Macroeconomics,
6(4): 137–69.
Nunn, Nathan, and Nancy Qian. 2014. “US food aid and civil conflict.” American Economic
Review, 104(6): 1630–66.
Pakistan Bureau of Statistics. 2018. “Labour Force Survey 2017-18.”
Persson, Torsten, and Guido Tabellini. 2002. Political Economics: Explaining Economic Policy.
Vol. 1. 1 ed., The MIT Press.
Pool, Sebastiaan, Leo De Haan, and Jan PAM Jacobs. 2015. “Loan loss provisioning, bank
credit and the real economy.” Journal of Macroeconomics, 45: 124–136.
Qian, Nancy. 2015. “Making Progress on Foreign Aid.” Annual Review of Economics, 7(1): 277–
308.
Rajan, Raghuram G, and Arvind Subramanian. 2008. “Aid and growth: What does the cross-
country evidence really show?” The Review of economics and Statistics, 90(4): 643–665.
35

Ramey, Valerie A. 2011. “Identifying government spending shocks: It’s all in the timing.” The
Quarterly Journal of Economics, 126(1): 1–50.
Robinson, James A., and Thierry Verdier. 2013. “The Political Economy of Clientelism.” Scan-
dinavian Journal of Economics, 115(2): 260–291.
Robinson, James A., Ragnar Torvik, and Thierry Verdier. 2006. “Political foundations of the
resource curse.” Journal of Development Economics, 79(2): 447 – 468. Special Issue in honor
of Pranab Bardhan.
Robinson, James A., Ragnar Torvik, and Thierry Verdier. 2017. “The political economy of
public income volatility: With an application to the resource curse.” Journal of Public Eco-
nomics, 145: 243 – 252.
Romer, Christina D, and David H Romer. 2010. “The macroeconomic effects of tax changes:
estimates based on a new measure of fiscal shocks.” American Economic Review, 100(3): 763–
801.
Sachs, Jeffrey D. 2006. The end of poverty: economic possibilities for our time. Penguin.
Shaker, Mohamed Ibrahim. 1980. The nuclear non-proliferation treaty: origin and implementa-
tion, 1959-1979. Vol. 3, Oceana publications.
Stock, James H, and Mark W Watson. 2001. “Vector autoregressions.” Journal of Economic
perspectives, 15(4): 101–115.
Telegraph, The. 2012. “Pakistan politicians accused of squandering money on school laptops as
British aid rolls in.”
Temple, Jonathan, and Nicolas Van de Sijpe. 2017. “Foreign aid and domestic absorption.”
Journal of International Economics, 108: 431–443.
UNESCO Institute of Statistics. 2018. “United Nations Educational, Scientific and Cultural Or-
ganization.”
36

Werker, Eric, Faisal Z Ahmed, and Charles Cohen. 2009. “How is foreign aid spent? Evidence
from a natural experiment.” American Economic Journal: Macroeconomics, 1(2): 225–44.
Williams, Colin C, Muhammad S Shahid, and Alvaro Martınez. 2016. “Determinants of the
level of informality of informal micro-enterprises: Some evidence from the city of Lahore,
Pakistan.” World Development, 84: 312–325.
World Health Organization. 2016. “WHO Pakistan.”
Wright, Joseph, and Matthew Winters. 2010. “The Politics of Effective Foreign Aid.” Annual
Review of Political Science, 13.
37

Figures
Figure 1: United States Foreign Aid to Pakistan (1971-2015)
(a) Economic Support Fund (ESF) allocations and Geopolitical Events
(b) ESF aid, ODA foreign aid flows, Geopolitical Events, Changes in Aid Legislations
Note: The figure shows evolution of US foreign aid flows and economic support fund allocations over time. Thick
vertical lines mark the geopolitical shocks of Soviet Invasion and 9/11 attacks. The thin vertical lines mark all the
amendments to US Foreign Assistance Act. This includes Sparkman Amendment, Symington Amendment, Morgan
Amendment, Symington Waiver, Pressler Amendment, Brownback Amendment and Kerry-Lugar Bill. Shaded areas
represent periods of expansive aid legislations (Sparkman, Symington Waiver, Brownback, Kerry-Lugar Bill) in Panel
B and geopolitical shocks of Soviet Invasion and 9/11 attacks in Panel A. See Table 1 and Table A in the appendix for
more details.
38

Figure 2: Output series and Geopolitical Events
(a) Aggregate GDP per capita series
(b) Cyclical Component of GDP per capita series through HP filter
(c) Aggregate Industrial Production Series
Note: The figures present evolution of output series from 1970 to 2015. Shaded areas represent time of geopolitical
aid shocks following the Soviet Invasion of Afghanistan and 9/11 attacks.
39

Figure 3: Impact of Foreign Aid on GDP per capita (annual)
(a) ESF Aid allocation shock on GDP per
capita(b) Foreign Aid flows shock on GDP per
capita
(c) Geopolitical Aid Dummy on GDP per capita
(reduced form)
(d) Aid Legislation Dummy on GDP per capita
(reduced form)
Note: The figures present the plots of impulse response functions from the baseline Narrative Vector Autoregression
where the respective aid variable is shocked on GDP per capita series. The lag length selection is done according to
information criteria (AIC and BIC).
40

Figure 4: Impact of Foreign Aid on Industrial Production (monthly)
(a) Impact of Geopolitical Shock Dummy on Industrial Production
(b) Impact of Aid Legislation Dummy on Industrial Production
Note: The figures present the plots of impulse response functions from the baseline Narrative Vector Autoregression
where the respective aid variable is shocked on monthly industrial production series.
41

Figure 5: Robustness to Alternative Explanations
(a) Impact of Foreign Aid on GDP per capita
(controlling for non-US World Aid)(b) Impact of Foreign Aid on GDP per capita
(controlling for US Trade)
(c) Impact of Foreign Aid on GDP per capita
(controlling for US FDI)
(d) Impact of Foreign Aid on GDP per capita
(controlling for Defense Spending)
Note: The figures present the plots of impulse response functions where additional controls are added to the baseline
Narrative Vector Autoregression. These includes non-US world aid, US exports, US FDI and Pakistan’s defense
spending.
42

Figure 6: Placebo Test Reverse Causality
(a) Impact of Industrial Production on Geopolitical Aid
(b) Impact of Industrial Production on Aid Legislation
Note: The figures present the plots of impulse response functions where instead of the aid variable being shocked on
the output series, the reverse is done: output series is shocked on the aid variable.
43

Figure 7: Plot of Coefficient Estimates in the IV regressions
Note: The graph plots coefficients of US foreign aid flows instrumented by aid legislation dummy with leads and lags.
Period 0 shows coefficient on the contemporaneous impact of aid, period 1 is one year lagged aid and so forth.
44

Figure 8: Effect of Foreign Aid on Patronage
(a) Impact of Foreign Aid on Public Employment
(b) Impact of Foreign Aid on Public Expenditures on Education
Note: The figures present the plots of impulse response functions where aid variable is shocked on public employment
(Panel A) and public expenditures variables (Panel B). 45

Figure 9: Industrial Production with Head of State Dummy taking the value of one (treatment)
versus Head of State Dummy taking the value of zero (control).
Note: The figure shows that average industrial production in the birth-province of the incumbent leader (the treatment)
versus the average industrial production in the provinces where the leader is not in office (the control), follows common
trends prior to the geopolitical aid shocks. Province level panel data is only available till 2004 so we are forced to
terminate the analysis in the year 2004.
46

Figure 10: Additional Alternative Explanations and Controls
(a) Impact of Foreign Aid on Defense Component
of GDP per capita
(b) Impact of Foreign Aid on GDP per capita
(controlling for terrorism)
(c) Impact of Foreign Aid on GDP per capita
(controlling for ICRG Risk Index)
(d) Impact of Foreign Aid on GDP per capita
(controlling for Combined Polity IV Index)
Note: The figure plots the impulse response functions with additional controls, especially controls for various political
and investment ‘risk’ factors.
47

Figure 11: NVAR Diagnostics
(a) Robustness to Ordering Restrictions
(b) Robustness to 2 and 3 Standard Deviation Bands
(c) Robustness to Bootstrapped Standard Errors
48

Tables
Table 1: Changes to Foreign Assistance Act of 1961 from 1970 to 2015
Name of Legislation Year Tabled Year Enacted Passed Aid Expansive
Sparkman Amendment 1973 1973 Yes Yes
Symington Amendment 1976 1976 Yes No
Humphrey Bill 1978 - No Yes
Morgan Amendment 1978 1979 Yes No
Symington Waiver 1982 1982 Yes Yes
Pressler Amendment 1985 1986 Yes No
Fascell-Hamilton Bill 1991 - No Yes
Clinton Bill 1994 - No Yes
Brownback Amendment 1999 1999 Yes Yes
Kerry-Lugar Bill 2009 2010 Yes Yes
Note: The aid legislation dummy switches on in the year of enactment. Failed aid legislation switches on in year the
legislation is tabled. Geopolitical Aid shock dummy for Soviet Invasion switches on from 1980 to 1985 for annual
data, and 12/1979 to 07/1985 for monthly data. Likewise, Geopolitical Aid shock dummy for 9/11 attacks switches on
from 2002 for annual data and 09/2001 for monthly data until the end of dataset. See Table A in the appendix B for
further details on these changes in aid legislations.
49

Table 2: Instrumental Variable Results
Log GDP per capita Geopolitical Aid Instrument Aid Legislation Instrument
OLS IV, 2ndStage IV, 2ndStage IV, 2ndStage IV, 2ndStage
(1) (2) (3) (4) (5)
L. Log Foreign Aid 0.00053 0.0047* 0.0029* 0.0014** 0.0015**
(0.00039) (0.0027) (0.0016) (0.00067) (0.00062)
Constant 0.0711 -0.0348 0.262* 0.0476 0.228*
(0.0765) (0.114) (0.140) (0.0827) (0.133)
Controls No No Yes No Yes
Observations 43 43 43 43 43
R-squared 0.995 0.987 0.993 0.995 0.995
Note: Robust standard errors in parentheses. In column (2) and (3) US aid flows is instrumented by geopolitical aid
shock dummy. In column (4) and (5) aid flows is instrumented by aid related legislative changes dummy. Lagged GDP
per capita as well as controls added in line with the NVAR specification. One-year lag is chosen as per Bayesian and
Akaike Information Criteria. Thus, estimates from this table can also be interpreted as a reduced form NVAR.
*** p < 0.01, ** p < 0.05, *p < 0.1
50

Table 3: Placebo Test Impact of Failed Aid Legislations
Logarithm of GDP per capita
IV, 2ndStage IV, 2ndStage IV, 2ndStage
(1) (2) (3)
L. Log Foreign Aid 0.0159 -0.000953 -0.00107
(0.0387) (0.00267) (0.00417)
Constant 6.032*** 0.108 0.167
(0.654) (0.0964) (0.164)
Controls No No Yes
Observations 43 43 43
R-squared 0.998 0.994 0.994
Note: In all columns, US aid flows is instrumented by failed aid legislation dummy variable that switches on when aid
legislation was tabled but failed to pass (See Table 1 and Table A in the appendix). In column (1), we present simple
bi-variate regression of GDP per capita and the instrumented foreign aid variable (without lagged GDP). In column (2)
and (3), we estimate the underlying NVAR reduced form in the main results, without and with controls, respectively
(instrumented by failed aid legislation). Robust standard errors are presented in the parentheses.
*** p < 0.01, ** p < 0.05, * p < 0.1
51

Table 4: A Check for the Exclusion Restriction - A Comparison of Means
Variables No Aid Shock Aid Shock Difference (p-value)
US Exports -0.05 0.06 -0.12 0.29
US FDI -0.10 0.08 -0.19 0.81
UK Aid -0.00 0.00 -0.00 0.95
EU Aid -0.06 -0.09 0.03 0.83
Military Spending 0.02 -0.01 0.03 0.44
US Aid Disbursements -2.32 2.24 -4.56 0.00
US ESF Aid -0.72 0.67 -1.39 0.00
Pakistan GDP 0.59 0.63 -0.04 0.00
Note: All variables (in logs) are regressed on a linear time trend to obtain their residuals, whose means are compared
when Geopolitical shock dummy switched off and on, respectively.
52
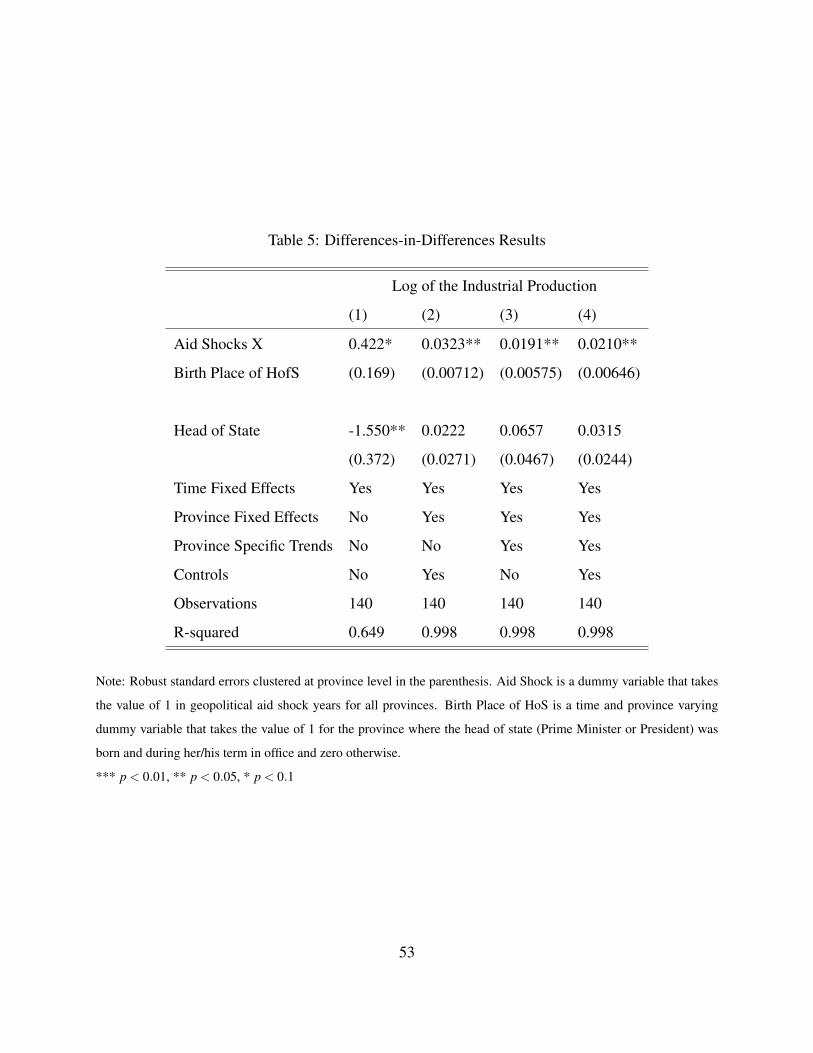
Table 5: Differences-in-Differences Results
Log of the Industrial Production
(1) (2) (3) (4)
Aid Shocks X 0.422* 0.0323** 0.0191** 0.0210**
Birth Place of HofS (0.169) (0.00712) (0.00575) (0.00646)
Head of State -1.550** 0.0222 0.0657 0.0315
(0.372) (0.0271) (0.0467) (0.0244)
Time Fixed Effects Yes Yes Yes Yes
Province Fixed Effects No Yes Yes Yes
Province Specific Trends No No Yes Yes
Controls No Yes No Yes
Observations 140 140 140 140
R-squared 0.649 0.998 0.998 0.998
Note: Robust standard errors clustered at province level in the parenthesis. Aid Shock is a dummy variable that takes
the value of 1 in geopolitical aid shock years for all provinces. Birth Place of HoS is a time and province varying
dummy variable that takes the value of 1 for the province where the head of state (Prime Minister or President) was
born and during her/his term in office and zero otherwise.
*** p < 0.01, ** p < 0.05, * p < 0.1
53

Table 6: Alternative Explanations, Additional Controls and Interactions
Log of the Industrial Production
(1) (2) (3)
Aid Shocks X Birth Place of HoS 0.0210** 0.0211** 0.0263***
(0.00646) (0.00644) (0.00348)
Head of State 0.0315 0.0315 -0.524
(0.0244) (0.0254) (0.578)
EU Aid X Birth Place of HoS 0.0465
(0.0393)
UK Aid X Birth Place of HoS 0.0709
(0.0604)
US FDI X Birth Place of HoS 0.00659
(0.00426)
US Exports X Birth Place of HoS -0.0328
(0.0331)
Defense Spending X Birth Place of HoS -0.0199
(0.0773)
Year and Province Fixed Effects Yes Yes Yes
Province Specific Trends Yes Yes Yes
Controls Yes Yes Yes
Additional Table 5 Controls No Yes Yes
Interaction Terms No No Yes
Observations 140 140 140
R-squared 0.998 0.998 0.99954

Table 7: Placebo Test
Log of the Industrial Production
(1) (2) (3) (4)
Head of State at t x Aid 0.0210**
(0.00646)
Head of State at t-1 x Aid 0.00736
(0.0118)
Head of State at t-2 x Aid -0.000743
(0.0122)
Head of State at t-3 x Aid -0.00742
(0.0125)
Head of State 0.0315 0.0269 0.0239 0.0210
(0.0244) (0.0209) (0.0179) (0.0166)
Time Fixed Effects Yes Yes Yes Yes
Province Fixed Effects Yes Yes Yes Yes
Province Specific Trends Yes Yes Yes Yes
Controls Yes Yes Yes Yes
Constant -39.08 30.22 24.56 -5.335
(143.9) (311.4) (288.2) (93.53)
Observations 140 136 132 128
R-squared 0.998 0.998 0.999 0.999
Robust standard errors in parentheses (clustered at province level).
*** p < 0.01, ** p < 0.05, * p < 0.1
55

For Online Publication: Online Appendix
Mathematical Appendix
A.1 Proof of Proposition 1
From (2.6) and (2.8), we deduce that
∂ 2R∂ r2
1= v′′(r1)+P(g)v′′(r2)< 0, (A.1)
and by differentiating the first line of (2.8) with respect to a1, we deduce that:
∂ r1
∂a1=
P(g)v′′(r2)
v′′(r1)+P(g)v′′(r2)< 1. (A.2)
Also, by differentiating the second line of (2.8) with respect to a1 and r1, we find that:
∂g∂a1
=−∂ 2R
∂a1∂g∂ 2R∂g2
, (A.3)
with ∂ 2R∂g2 < 0, so
∂g∂a1
=−−2v′′(r2)P(g)+
dP(g)dg v′(r2)
∂ 2R∂g2
(A.4)
and∂g∂ r1
=− ∂g∂a1
. (A.5)
Asdgda1
=∂g∂a1
+∂g∂ r1
∂ r∂a1
, (A.6)
We deduce from (A.2) and (A.5) that
dgda1
>∂g∂a1
+∂g∂ r1
= 0. (A.7)
This concludes the proof of proposition 1.
56

A.2 Proof of Proposition 2
By differentiating Y1 with respect to a1, we find:
dY1
da1= 1− dr
da1− 1
2((1− z)h−hP)
dgda1
. (A.1)
dgda1
> 0 from proposition (1).ddz
dY1
dda1Y1 =
h2
dgda1
> 0, (A.2)
so dY1da1
increases with z.
Furthermore,
1− drda1
= 1− ∂ r∂a1− ∂ r
∂g∂ga1
, (A.3)
with ∂ r∂a1
< 1, see the proof of proposition (1). As ∂ r∂g
∂ga1
< 0, we deduce that
1− drda1
> 0. (A.4)
This proves that aid tends to increase the national income by reducing the scope of rent extraction.
Furthermore, it also demonstrates that for z = 1, dY1da1
> 0 necessarily holds, so there exists a z < 1
such that if z > z, dY1da1
> 0. This concludes the proof of proposition 2.
57

B.1 Variable Definitions and sources
Real GDP per capita: logarithm of GDP per capita deflated by GDP deflator from Central
Bank of Pakistan.
Industrial Production (monthly) = logarithm of Industrial Production Index from Central
Bank of Pakistan (SBP).
Head of State Birth = This variable takes the value of 1 if: a) the head of state is born in that
province where head of state (president or the prime minister) b) the head of state is in office
Terrorism = Logarithm of annual terrorism deaths as coded by Global Terrorism Database
rubric. The data is obtained from the Global Terrorism Database (2018).
ESF: logarithm of Economic Support Fund from US Green Book of Aid. The section 202 of
the Foreign Assistance Act of 1971 outlines the motivation for creation of budget based Economic
Support Fund through Congressional legislation as follows: The Congress recognizes that, under
special economic, political, or security conditions, the national interests of the United States may
require economic support for countries in amounts which could not be justified solely under chap-
ter 1 of part I. In such cases, the President is authorized to furnish assistance to countries (under
the ESF), on such terms and conditions as he may determine, in order to promote national interest
of the United States. (FAA, 1971). The Economic Support Fund (ESF) promotes the economic and
political foreign policy interests of the United States by providing assistance to allies (FAA, 1961).
Aid Legislation = dummy variable that takes value 1 when an expansive aid legislation is en-
acted zero otherwise. For more details see Table 1.
Geopolitical Shock: dummy variable that takes value 1 in positive aid shock years such as
Soviet Invasion till withdrawal, 9/11 till the end of War on Terror and zero otherwise.
US Aid Flows: logarithm of bilateral aid flows from United States also referred to Official De-
velopment Assistance (ODA) in the literature, from World Development Indicators of the World
Bank. Constructed by Development Assistance Committee (DAC) criteria. US Exports = loga-
58

rithm of exports (in millions) to United States from Handbook of Statistics State Bank of Pakistan
(various issues)
Combined Polity IV Index: This is composite Polity IV index computed in Gur et al. (2015),
using the component AUTOC score and DEMOC score. The resultant combined polity scale
ranges from +10 being strongly democratic to 10 being strongly autocratic.
ICRG Risk Index: It is a composite risk rating of 12 risk country risk factors constructed
by Political Risk Services Group (PRSG): Government Stability, Socioeconomic Conditions, In-
vestment Profile, Internal Conflict, External Conflict, Corruption, Military in Politics, Religious
Tensions, Law and Order, Ethnic Tensions, Democratic Accountability and Bureaucracy Quality
Defense: logarithm of defense value added i.e. defense contribution to GDP, retrieved from Arby
(2008).
Public Education Expenditures: logarithm of total general (local, regional and central) gov-
ernment expenditure on education (current, capital, and transfers). It includes expenditure funded
by transfers from international sources to government. It refers to the current operating expendi-
tures in education, including wages and salaries and excluding capital investments in buildings and
equipment. Retrieved from UNESCO Institute of Statistics (UNESCO, 2016).
59

C.1 Additional Tables and Figures
C.2 Figures
Figure C.1: Variance Decomposition of baseline NVAR
C.3 Tables
60

Table C.1: Description of Changes to the Foreign Assistance Act
Name of Legislation DescriptionSparkman Amendment Increases overall aid budget of the United States.
Makes special appropriations for strategic partners(Egypt, Israel and Pakistan).
Symington Amendment Sanctions against all countries that attempt to acquirea nuclear weapon.
Humphrey Bill This bill attempted to increase the focus of foreignassistance on development, streamline bilateral andmultilateral US aid.
Morgan Amendment This bill curtailed foreign aid to all countries that wereinvolved in gross human right violations.
Symington Waiver This legislation declared that Symington amendmentinduced aid restrictions did not apply to strategic al-lies of United States.
Pressler Amendment This legislation mandated that all US aid to its strate-gic partners is to be halted, unless the US Presidentcertified that the country did not possess a nuclear de-vice.
Fascell-Hamilton Bill The bill attempted to reduce certification require-ments and micromanagement of foreign aid.
Clinton Bill The bill attempted to increase aid for democracies andbring aid allocation under one umbrella.
Brownback Amendment The legislation gave the US President, the executiveauthority to waive aid sanctions on Pakistan and India.
Kerry-Lugar Bill Assistance Package for Pakistans support in War onTerror.
Note: All the above amendments to the Foreign Assistance Act were enacted except for Humphrey, Fascell-Hamiltonand Clinton Bill, which failed to pass both houses of Congress.
61

Table C.2: Province-specific dummy that switches on when head of state is in power
Year Prime Minister President
1970-1971 5 11971-1973 5 21973-1977 2 11978-1985 - 51985-1988 2 11988-1990 2 31990-1993 1 31993-1996 2 11997-1999 1 11999-2002 1 22002-2004 4 2
Note: 1 represents Punjab, 2 is Sindh, 2 is Khyber Pakhtunkhwa (previously) NWFP, 4 is Baluchistan and 5 is birthoutside Pakistan e.g. British India. The dummy switches on when either the Prime Minister or the President from theprovince is in office. The entry for Prime Minister for 1978-1985 is missing due to banning of political parties in themartial law regime of General Zia-ul-Haq.
62


![[1962] A Political Theory of Foreign Aid](https://img.dokumen.tips/doc/110x75/5695cf0e1a28ab9b028c6796/1962-a-political-theory-of-foreign-aid.jpg)