Embed Size (px)
Citation preview

Policy Research Working Paper 9150
Elite Capture of Foreign Aid
Evidence from Offshore Bank Accounts
Jørgen Juel AndersenNiels Johannesen
Bob Rijkers
Development Economics Development Research GroupFebruary 2020
Produced by the Research Support Team
Abstract
The Policy Research Working Paper Series disseminates the findings of work in progress to encourage the exchange of ideas about development issues. An objective of the series is to get the findings out quickly, even if the presentations are less than fully polished. The papers carry the names of the authors and should be cited accordingly. The findings, interpretations, and conclusions expressed in this paper are entirely those of the authors. They do not necessarily represent the views of the International Bank for Reconstruction and Development/World Bank and its affiliated organizations, or those of the Executive Directors of the World Bank or the governments they represent.
Policy Research Working Paper 9150
Do elites capture foreign aid? This paper documents that aid disbursements to highly aid-dependent countries coincide with sharp increases in bank deposits in offshore financial centers known for bank secrecy and private wealth man-agement, but not in other financial centers. The estimates are not confounded by contemporaneous shocks such as
civil conflicts, natural disasters, and financial crises, and are robust to instrumenting with predetermined aid com-mitments. The implied leakage rate is around 7.5 percent at the sample mean and tends to increase with the ratio of aid to GDP. The findings are consistent with aid capture in the most aid-dependent countries.
This paper is a product of the Development Research Group, Development Economics. It is part of a larger effort by the World Bank to provide open access to its research and make a contribution to development policy discussions around the world. Policy Research Working Papers are also posted on the Web at http://www.worldbank.org/prwp. The authors may be contacted at [email protected], [email protected], and [email protected].

Elite Capture of Foreign Aid: Evidence from OffshoreBank Accounts∗
Jørgen Juel Andersen (BI Norwegian Business School)Niels Johannesen (University of Copenhagen and CEBI)
Bob Rijkers (The World Bank)
February 18, 2020
JEL: D73; F35, P16
∗Jørgen Juel Andersen: [email protected]; Niels Johannesen: [email protected]; Bob Ri-jkers: [email protected]. We thank Simeon Djankov, Shanta Devarajan, Eric Feyen, Caroline Freund,Francisco Ferreira, Penny Goldberg, Aart Kraay, Pablo Selaya, Stuti Khemani, Aaditya Mattoo, William Mal-oney, Steven Pennings, Finn Tarp, Emile Van Der Does De Willebois, and the World Bank’s Chief EconomistCouncil for excellent comments and Jarret Angbazo and Nicolas Gomez Parra for helpful research assistance.Research for this paper has been supported in part by the Knowledge for Change Program, the MultidonorTrust Fund for Trade and Development, and the Strategic Research Program of the World Bank. Andersengratefully acknowledges support from the Research Council of Norway, Grant. No. 275387, and from Centrefor Applied Macroeconomics and Commodity Prices, BI Norwegian Business School. Johannesen gratefullyacknowledges financial support from the Danish Council for Independent Research and the Danish NationalResearch Foundation. The findings, interpretations, and conclusions expressed in the paper are entirely thoseof the authors. They do not necessarily represent the views of the International Bank of Reconstruction andDevelopment / World Bank and its affiliated organizations, or those of the Executive Directors of the WorldBank or the countries they represent. All errors are our responsibility.
1 Introduction
The effectiveness of foreign aid remains controversial. A large literature studies how aid is spent
(Werker et al., 2009); how it is absorbed in the domestic economy (Temple and van de Sijpe,
2017); and how much it ultimately stimulates growth (Dalgaard et al., 2004), improves human
development outcomes (Boone, 1996), and reduces poverty (Collier and Dollar, 2002). In light
of the evidence, some scholars assert that aid plays a pivotal role in promoting economic devel-
opment in the poorest countries (Sachs, 2005) while others are highly skeptical (Easterly, 2006).
Many studies emphasize that aid effectiveness depends crucially on the quality of institutions
and policies in the receiving countries (Burnside and Dollar, 2000).
A concern often voiced by skeptics is that aid may be captured by economic and political
elites. The fact that many of the countries that receive foreign aid have high levels of corruption
(Alesina and Weder, 2002) invokes fears that aid flows end up in the pockets of the ruling
politicians and their cronies. This would be consistent with economic theories of rent seeking in
the presence of aid (Svensson, 2000) and resonate with colorful anecdotal evidence about failed
development projects and self-interested elites (Klitgaard, 1990). Yet, there is little systematic
evidence on diversion of aid.
In this paper, we study aid diversion by combining quarterly information on aid disburse-
ments from the World Bank (WB) and foreign deposits from the Bank for International Settle-
ments (BIS). The former dataset covers all disbursements made by the World Bank to finance
development projects and provide general budget support in its client countries. The latter
dataset covers foreign-owned deposits in all significant financial centers, both havens such as
Switzerland, Luxembourg, Cayman Islands and Singapore whose legal framework emphasizes
secrecy and asset protection and non-havens such as Germany, France and Sweden.
Equipped with this dataset, we study whether aid disbursements trigger money flows to
foreign bank accounts. In our main sample comprising the 22 most aid-dependent countries in
the world (in terms of WB aid), we document that disbursements of aid coincide, in the same
quarter, with significant increases in the value of bank deposits in havens. Specifically, in a
quarter where a country receives aid equivalent to 1% of GDP, its deposits in havens increase
by 3.4% relative to a country receiving no aid; by contrast, there is no increase in deposits held
in non-havens. While other interpretations are possible, these findings are suggestive of aid
diversion to private accounts in havens.
One may be concerned that the results are confounded by factors affecting both aid inflows
and capital outflows. We address this potential endogeneity in three ways. First, we augment
1
the baseline model with leads and lags of the aid variable. Reassuringly, we find no differen-
tial trends in deposits during the quarters prior to aid disbursements. Second, we instrument
disbursements with pre-determined aid commitments, which are plausibly exogenous to contem-
poraneous shocks (Kraay, 2012, 2014). The IV estimates are qualitatively similar, but somewhat
smaller than the OLS estimates. Third, we exclude observations where specific events such as
wars, natural disasters and financial crises might cause both inflows of aid and outflows of do-
mestic capital and introduce controls for potential confounders such as oil prices and exchange
rates. We also estimate specifications with country-year fixed effects where identification comes
exclusively from variation in the timing of disbursements within the year. The main results are
robust to all these tests.
While our results document cleanly and robustly that aid disbursements are associated with
wealth accumulation in offshore accounts, the macro nature of our deposit information represents
an important limitation: since we do not observe who stores wealth in havens in periods with
large aid disbursements, we cannot directly identify the economic mechanism underlying this
correlation.
Despite this inherent limitation, it is almost certain that the beneficiaries of the money
flowing to havens at the time of aid disbursements belong to economic elites. Recent research
using micro-data from data leaks and tax amnesties documents that offshore bank accounts
are overwhelmingly concentrated at the very top of the wealth distribution.1 By contrast, the
poorest segments in developing countries often do not even have a domestic bank account (World
Bank, 2017) and it is entirely implausible that they should control the money flows to havens.
While it is more difficult to identify the precise mechanism by which aid inflows cause
capital outflows to havens, aid capture by ruling politicians and bureaucrats is a salient and
plausible one. First, it can explain why the trail leads to havens rather than non-havens: if
the money derives from corruption and embezzlement, we should not be surprised to see it
flowing to jurisdictions with legal institutions emphasizing secrecy.2 Second, it can explain why
we observe a sharp and immediate increase in deposits in the disbursement quarter with no
increases in subsequent quarters: to the extent political elites divert aid to foreign accounts,
either directly or through kickbacks from private sector cronies, aid inflows and capital outflows
1Alstadsæter et al. (2019) find that around 50% of the assets hidden in havens by Scandinavians belong tothe 0.01% wealthiest households and 80% belong to the wealthiest 0.1%. Londono-Velez and Avila (2018) findsimilar results for Colombia.
2Anecdotally, havens are often associated with the laundering of proceeds from high-level corruption. Forinstance, a report by the Financial Action Task Force describes 32 cases of grand corruption of which 21 involvedbank accounts in havens (FATF, 2011).
2

should occur almost simultaneously. Third, our analysis of heterogeneity is consistent with
corruption mediating the effect of aid on wealth in havens: we find larger estimates in more
corrupt countries although the difference is not statistically significant. In any case, since money
is fungible we cannot distinguish between direct diversion of the funds disbursed by the donor
and diversion of other public funds freed up by the aid disbursement.
Some alternative interpretations exist, but we find them harder to reconcile with all the
patterns in the data. Most importantly, firms directly involved in aid-sponsored projects may
receive payments in quarters with aid disbursements and deposit some of these funds with foreign
banks. One set of results provides some support for this explanation: we find larger estimates in
countries with less private credit suggesting that foreign banks serve as a substitute for inefficient
domestic banks. However, this mechanism does not explain our finding that money only flows to
places like Zurich, the global center for bank secrecy and private wealth management (Zucman,
2017), and not to other international banking centers like New York, London and Frankfurt.
The dynamics in haven deposits, a permanent level shift at the time of aid disbursements, also
seems more consistent with personal wealth accumulation than firm cash management.
There are other mechanisms that we can more confidently rule out. First, firms in devel-
oping countries have been shown to engage in aggressive tax avoidance by shifting profits to
low-tax affiliates (Johannesen et al., 2016), but such profit shifting cannot explain our results
because of the way the BIS statistics are constructed: deposits belonging to the Bermuda sub-
sidiary of a Tanzanian company are assigned to Bermuda rather than Tanzania. Second, aid
may increase income more broadly in the economy by stimulating aggregate demand and may
therefore indirectly increase evasion of personal income taxes through havens; however, our
model accounts for aggregate income shocks by conditioning on GDP growth and the sharp
increase in haven deposits in the disbursement quarter does not mirror the typically protracted
expansionary effect of economic stimulus (Kaplan and Violante, 2014). Finally, we can exclude
that our results reflect portfolio adjustments by commercial or central banks as our deposit
variables only include foreign deposits belonging to non-banks.
It is natural to express the estimates as a leakage rate: the dollar increase in haven deposits
associated with a 100 dollar aid disbursement. Our model does not deliver this parameter
directly and we therefore rely on the following transformation. Our key estimate suggests that
aid corresponding to 1% of GDP increases deposits in havens by around 3.4%. While there
is considerable variation over time and across the highly aid dependent countries in our main
sample, the stock of deposits in havens stands at around 2.2% of GDP at the sample mean; hence
3
a 3.4% increase in haven deposits corresponds to around 0.075% of GDP (i.e. 2.2%*3.4%) and
the implied average leakage rate is approximately 7.5% (i.e. 0.075%/1%). A simple simulation
that weighs countries by their historical share of aid disbursements and accounts for cross-
country differences in the ratio of haven deposits to GDP, implies a leakage rate of around 5%
in aggregate disbursements. These modest leakage rates represent a lower bound in the sense
that they only include aid diverted to foreign accounts and not money spent on real estate,
luxury goods etcetera.
While the leakage estimates reported above are averages for those countries with annual aid
from the World Bank above 2% of GDP, we show that leakage rates exhibit a strong gradient in
aid-dependence, both within this sample and beyond. On the one hand, lowering the threshold
to 1% of GDP (sample of 46 countries), we cannot reject the null hypothesis of no leakage. This
suggests that the average leakage rate across all aid-receiving countries is much smaller than
the estimates obtained from the main sample, which account for less than 10% of all World
Bank aid. On the other hand, raising the threshold to 3% of GDP (sample of 7 countries), we
find a higher leakage rate of around 15%. This pattern is consistent with existing findings that
the countries attracting the most aid are not only among the least developed but also among
the worst governed (Alesina and Weder, 2002) and that very high levels of aid might foster
corruption and institutional erosion (Knack, 2000; Djankov et al., 2008).
While the comprehensive deposit dataset employed in the main analysis is restricted and
subject to confidentiality requirements, we also study publicly available series recently released
by the BIS. This allows us to study deposits in some individual havens: we find that bank
accounts in Switzerland and Luxembourg contribute significantly to the correlation between
aid disbursements and haven deposits whereas accounts in Belgium and Jersey do not. The
public series also allow us to extend the sample period to more recent years where financial
transparency has improved significantly. We find similar point estimates for the periods before
and after 2009 suggesting that the relationship between aid and hidden wealth is unchanged.
However, since our leakage estimates for short subperiods are imprecise, we cannot rule out that
financial transparency has curbed diversion of aid.
The paper contributes to the understanding of aid effectiveness by empirically identifying
and quantifying a mechanism that may render aid ineffective: elite capture. In doing so, we
contribute to literatures on the distributional effects of aid (Bjørnskov, 2010); hidden wealth
and its origins (Zucman, 2013); and capital flight (Johannesen and Pirttilla, 2016). Our results
and empirical approach are most closely related to the finding that petroleum rents are partly
4
shifted to bank accounts in havens when political institutions are weak (Andersen et al., 2017).
Last, our results contribute to the broader literature on political corruption (Olken and Pande,
2012).
The remainder of the paper is organized as follows. Section 2 describes our key variables.
Section 3 explains our empirical strategy. Section 4 presents the results. A final section con-
cludes.
2 Data
2.1 Cross-border bank deposits
We use data on foreign bank deposits from the Locational Banking Statistics of the Bank
for International Settlements (BIS). This quarterly dataset has information on the value of
bank deposits in 43 financial centers owned by residents of around 200 countries. The deposit
information is at the bilateral level, e.g. the value of deposits in Swiss banks owned by residents
of Tanzania, and builds on confidential reports from individual banks on their foreign positions.
Importantly, deposits are assigned to countries based on immediate ownership rather than
beneficial ownership; hence, if a Tanzanian firm has a subsidiary in Bermuda, which holds a
Swiss bank account, the account is assigned to Bermuda in the BIS statistics.
The dataset covers the vast majority of the world’s cross-border bank deposits: all significant
banking centers contribute to the dataset and within each banking center coverage is rarely below
90% (BIS, 2011). This is one of the most reliable sources for information about foreign assets and
is therefore frequently used by central banks to construct capital accounts; by macroeconomists
to gauge net wealth positions (Lane and Milesi-Ferretti, 2007; Zucman, 2013); and by public
finance economists to study offshore tax evasion (Johannesen, 2014; Johannesen and Zucman,
2014).
While the BIS generally makes deposit information publicly available at the country level
(e.g. deposits held by Tanzanians in all foreign banking centers combined and deposits held
in Cayman banks by all foreigners combined), it has traditionally restricted access to deposit
information at the bilateral level (e.g. deposits held by Tanzanians in Cayman banks) to central
bank staff and external researchers working under a confidentiality agreement with the BIS. In
the main analysis, we use a dataset with restricted information at the bilateral level up until
2010, which allows us to break down each country’s total foreign deposits into deposits in havens
and deposits in non-havens. In an auxiliary analysis, we exploit recently released information at
5

the bilateral level for selected banking centers. While the public dataset is not as comprehensive
as the restricted one, it allows us to extend the sample period beyond 2010 and to show results
for individual havens, which is prohibited under the confidentiality agreement governing the
restricted data.
Among the 43 financial centers contributing to the Locational Banking Statistics, we classify
17 as havens and the remaining 26 as non-havens.3 Havens generally have institutional charac-
teristics that make them attractive places to hide funds: bank secrecy rules that ensure strict
confidentiality and legal arrangements that facilitate asset protection by enabling investors to
nominally transfer asset ownership to a third party while retaining full control (e.g. trusts or
de facto anonymous shell corporations). Important havens in our dataset include Switzerland,
Luxembourg, Cayman Islands, Bahamas, Hong Kong and Singapore.4
We define Havenit as deposits owned by country i in the 17 havens in quarter t, and similarly
Nonhavenit as deposits owned in one of the other financial centers. We exploit the sectoral
breakdown in the BIS statistics to exclude interbank deposits from these measures.5 The BIS
statistics do not look through chains of ownership to the ultimate owners of deposits; our analysis
does therefore not include accounts held through foreign shell corporations (Omartian, 2017),
which is likely to reduce the estimated leakage. The dataset at our disposal spans the period
1977-2010, but we discard observations before 1990 because of a major data break in 1989.6
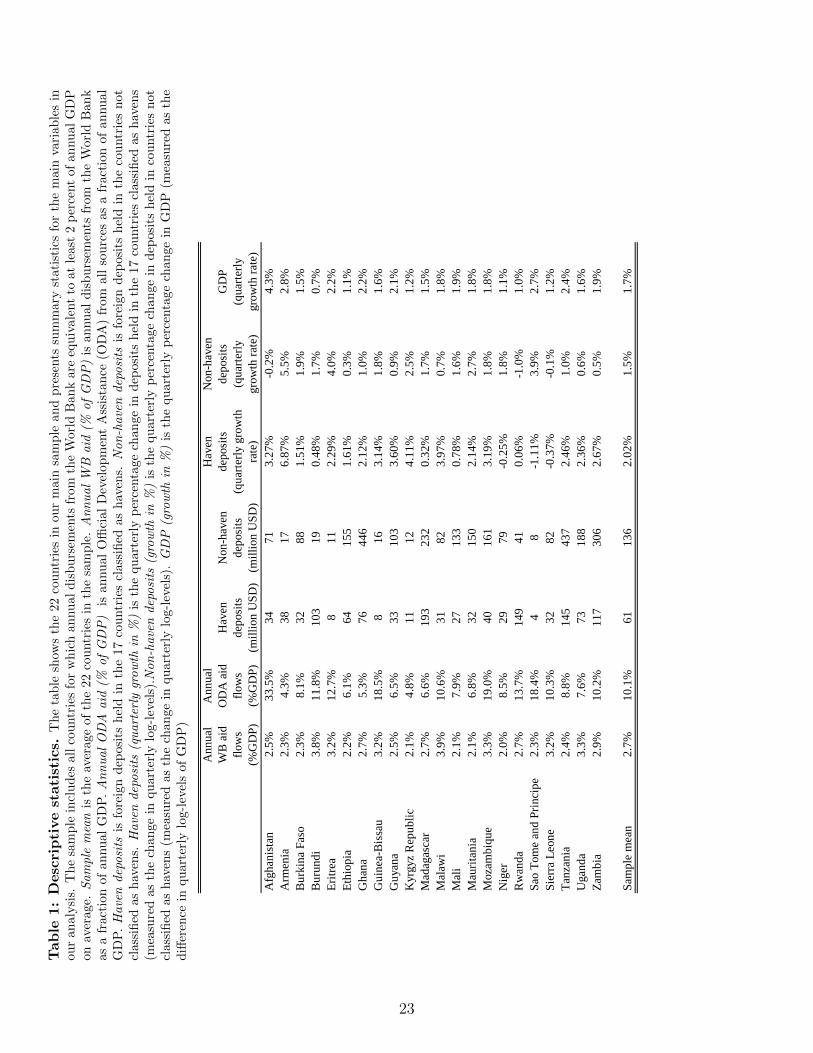
Table 1 presents summary statistics on the deposit measures. Average haven deposits range
from $4 million in Sao Tome and Principe to almost $200 million in Madagascar and generally
constitute around one third of all foreign deposits. Quarterly growth rates in haven deposits, our
main outcome variable, average 2.0%, which is significantly higher than the quarterly growth
rate in non-haven deposits and GDP. The distribution of growth rates in haven deposits is
displayed in Figure A1 in the Online Appendix.
3Our classification of financial centers as havens and non-havens follows Andersen et al. (2017): to the set offinancial centers identified by the OECD in 2008 as not providing bank information to foreign governments onrequest, they add Macao, SAR, China, and Hong Kong, SAR, China. Table A1 in the Online Appendix providesa list of havens ranked by the total value of foreign-owned deposits in their banks.
4In response to strong international pressure, legal institutions in havens have changed considerably in thepast decade. Starting around 2009, all havens committed to some measure of information exchange with othercountries for tax enforcement purposes (Johannesen and Zucman, 2014).
5This also excludes foreign deposits held by central banks, which is important to avoid confounding effectsthrough placement of foreign reserves.
6Until 1989, the Locational Banking Statistics did not include fiduciary deposits in Swiss banks, the lion’sshare of foreign-owned deposits in Switzerland, as they were considered off-balance sheet items by the BIS.
6
2.2 Foreign aid
We first construct a project-level database of aid disbursements from the World Bank through
its two principal institutions, the International Development Association (IDA) and the Inter-
national Bank for Reconstruction and Development (IBRD). From the World Bank Project
Database (so-called API data), we obtain information on approval date, commitment amount,
sector and instrument type for each project. We combine this dataset with monthly project-level
information on disbursements from Kersting and Kilby (2016).7
Next, we draw on this database to construct our main aid variable, Aidit, which aggregates
disbursements from the World Bank across all projects in a given country i in a given quarter
t. By construction, this variable does not include aid from other sources such as humanitarian
assistance and development aid from individual countries. It also excludes debt relief. The main
reason to focus on aid from the World Bank is that we observe the timing of disbursements within
the year, which is important for empirical identification because the main effect shows up at
quarterly frequency. Data on other sources of aid, including the leading aggregate measure
of development aid Official Development Assistance (ODA), is typically available only at the
annual frequency. Further, the fact that Word Bank disbursement data is available at the level
of individual projects allows us to implement an instrumental variables strategy (see below).
Our main sample consists of the 22 countries that, on average over the sample period 1990-
2010, receive annual disbursements from the World Bank equivalent to at least 2% of GDP.8 As
shown in Table 1, annual aid disbursements from the World Bank are almost 3% of GDP on
average whereas development aid from all sources exceeds 10% of GDP on average. Foreign aid
is thus a major source of income within this sample. The distribution of our main explanatory
variable, the ratio of quarterly aid disbursements from the World Bank to annual GDP, is
displayed in Figure A2 in the Online Appendix: aid disbursements exceed 1% of GDP in around
25% of the quarters and exceed 2% of GDP in around 5% of the quarters.
Aid disbursements are potentially endogenous to contemporaneous economic shocks and,
building on Kraay (2012, 2014), we therefore construct an instrument that exploits the time lag
between commitments and disbursements of aid.9 After a World Bank project is approved, dis-
7While the World Bank Project Database contains information on disbursements, it does not allow forbulk download. Kersting and Kilby (2016) retrieve the disbursement information from the database using anautomated script.
8In extensions, we also study a broader set of countries with annual disbursements above 1% of GDP.9Existing studies have used other instruments for aid. Werker et al. (2009) use oil price variation to instrument
aid provided by OPEC members. Galliani et al. (2017) exploit the crossing of the IDA eligibility threshold toassess the impact of aid on growth.
7

bursements are usually spread out over many quarters at different stages of the project. Actual
disbursements may deviate substantially from the originally planned disbursement schedule; for
instance, disbursements may be accelerated in response to natural disasters or delayed in the
face of civil conflict. However, the amount of aid disbursed in a given quarter is largely the
result of project approvals made in previous quarters, which creates variation in disbursements
that is arguably exogenous to contemporaneous shocks.
Following Kraay (2012, 2014), we build an instrument by predicting quarterly disbursements
for each project based on the initial commitment and the average disbursement schedule across
all other projects implemented in the same sector and the same geographical region. Summing
over predicted disbursement at the project-level, we predict aggregate disbursements for each
country and quarter.10 We never use predicted disbursements for the commitment quarter as
an instrument since it suffers from the same potential endogeneity as the actual disbursements.
In the most rigorous tests, we only use predicted disbursements related to projects approved at
least 3 quarters before as an instrument to strengthen the case for exogeneity.
2.3 Other variables
We collect information about events that may be associated with simultaneous changes in aid dis-
bursements and cross-border capital flows: Wars from the PRIO Armed Conflict Dataset; Coups
from Powell and Thyne (2011); Natural disasters from the International Disaster Database; Fi-
nancial crisis from Laeven and Valencia (2012); Petroleum rents and financial sector development
from World Development Indicators (WDI). We also collect information on country character-
istics that may mediate the effect of aid disbursements on haven deposits: Corruption from
Worldwide Governance Indicators (WGI); Disclosure requirements for members of parliament
from Djankov et al. (2010); Capital account openness from Chinn and Ito (2006); Political
regime characteristics from the Polity IV Project. We document these variables in more detail
and provide summary statistics in Table A2 in the Online Appendix.
3 Empirical strategy
To assess whether disbursements of aid are accompanied by money flows to havens, we estimate
the following baseline model:
∆ log(Havenit) = βAidit + γXit + µt + τi + εit
10The analysis is limited to projects that were approved after 1984.
8

where ∆ log(Havenit) measures the growth rate in haven deposits owned by country i in
quarter t, Aidit measures aid disbursements to country i in quarter t as a share of GDP, Xit is a
vector of control variables (including notably GDP growth) and µi and τt represent country and
time fixed effects respectively.11 Conceptually, the equation thus relates two flows of money:
flows from the World Bank on the right-hand side and (net) flows to foreign bank accounts on
the left-hand side.
The main parameter of interest, β, expresses the percentage change in haven deposits as-
sociated with an aid disbursement equivalent to one percent of GDP. It is measured relative
to the counterfactual change in haven deposits given by the other variables in the model: the
country’s long-run average growth rate in haven deposits (captured by country fixed effects),
global shocks to haven deposits (captured by the time fixed effects) and local shocks to income
(captured by the control for GDP growth). The presence of country fixed effects implies that β
is identified exclusively from within-country variation. We are effectively asking whether haven
deposits grow more than the country average in quarters where aid exceeds the country average
while absorbing the global trend in cross-border capital flows and the effect of the local business
cycle.
To distinguish between cross-border money flows motivated by secrecy and asset protection
and those motivated by other concerns, we also estimate the baseline model using the growth
rate in deposits in non-havens, ∆ log(Nonhaven), as dependent variable. We compare the esti-
mated coefficients on Aid in the two regressions and, as a more formal test for differential growth
rates in haven and non-haven deposits induced by aid disbursements, additionally estimate the
baseline model using the differential growth rate, ∆ log(Haven) − ∆ log(Nonhaven), directly
as dependent variable. This specification identifies the impact of aid on haven deposits while
absorbing any shocks to cross-border flows that are shared between haven and non-haven ac-
counts.This is a very conservative test for potential diversion, since it assumes aid capture would
only result in flows to havens; potential diversion to nonhavens would result in a downward bias.
The main threat to identification in the baseline model is the potential endogeneity of aid.
There could be macroeconomic shocks, such as financial crises or famine, that simultaneously
cause capital flight and a surge in foreign aid, leading to a spurious positive correlation between
aid disbursements and foreign deposits. Alternatively, opportunistic behavior by politicians
could result in capital flight and induce foreign donors to cut back on aid suggesting that the
correlation between aid and haven deposits might be spuriously negative.
11In the main specification, deposit and aid variables are winsorized at the 1%/99% level to reduce the impactof extreme values. We obtain similar results using non-winsorized variables as is shown in column 11 of Table 3.
9

We address this potential endogeneity problem in three ways. First, we exploit the high-
frequency nature of our data and test for pre-existing differential trends in haven deposits by
adding leading values of aid disbursements to the estimating equation. Non-zero coefficients on
the leading disbursements are suggestive of endogeneity. Second, we instrument aid disburse-
ments with their predetermined component as described in the previous section (Kraay, 2012,
2014). The exclusion restriction requires the predetermined component of aid flows, following
from aid commitments at least three quarters earlier, to be uncorrelated with contemporane-
ous shocks to haven deposits (conditional on controls). Third, we exclude observations where
specific events such as wars, natural disasters and financial crises might confound the inference;
introduce controls for potential confounders such as oil prices and exchange rates; and augment
the model with country-year fixed effects that restrict the identifying variation to changes in
disbursements within the year.
An important feature of all of our empirical specifications is the log-transformation of foreign
deposits, which captures the statistical assumption that foreign deposits change exponentially.
This assumption has strong economic foundations. First, absent withdrawals and new deposits,
compound interest mechanically makes account balances grow exponentially. Second, many
theoretical models will predict that changes in deposits in response to changes in the economic
environment, e.g. business cycles and policy interventions, are proportional to the stock of
deposits. Such considerations have led almost three decades’ of literature on foreign deposits
to estimate models in log-levels (Alworth and Andresen, 1992; Huizinga and Nicodeme, 2004;
Johannesen, 2014; Johannesen and Zucman, 2014; Menkhoff and Miethe, 2019; OECD, 2019)
or log-differences (Andersen et al., 2017).
The main disadvantage of the log-transformation is that the resulting model does not deliver
the structural parameter of interest, the leakage rate, directly. It is therefore natural to con-
sider alternatives, for instance to scale deposits by GDP. However, scaling does not preserve the
appealing features of the logarithmic transformation when countries are structurally different.
For instance, in case two countries exhibit a ratio of haven deposits to GDP of 2% and 10%
respectively, compound interest at the rate of 5% increases the ratio of haven deposits to GDP
by 0.1% in one country and by 0.5% in the other. Moreover, scaling both deposits (the depen-
dent variable) and aid (the explanatory variable) with GDP may create a mechanical positive
correlation. In light of these difficulties, we first estimate the model in log-differences and later
retrieve the leakage rate with a simple transformation.
10
4 Results
4.1 Main Findings
We present the results from our baseline model in Table 2. Controlling for GDP growth, country
fixed effects and time fixed effects, we find that aid disbursements are strongly associated with
increases in haven deposits, but do not vary systematically with non-haven deposits. Specifically,
as shown in Column (1), an aid disbursement equivalent to one percent of GDP in a given quarter
induces a statistically significant increase in haven deposits of around 3.4%. By contrast, as
shown in Column (2), the analogous effect on non-haven deposits is a statistically insignificant
decrease of around 1.5%. The final specification highlights the difference: an aid disbursement
equivalent to one percent of GDP is associated with a statistically significant increase in haven
deposits, measured over and above the increase in non-haven deposits, of around 5%, as shown
in Column (3).
The results are consistent with aid capture by ruling elites: diversion to secret accounts,
either directly or through kickbacks from private sector cronies, can explain the sharp increase
in money held in foreign banking centers specializing in concealment and laundering. If the
transfers to havens were caused by confounding shocks correlating with aid disbursements, we
should expect to see similar transfers to other foreign banking centers; however, there is no
evidence of such responses.
4.2 Robustness
As a first robustness check of the baseline results, we re-estimate the model while replacing the
continuous aid measure with a discrete variable indicating quarters with particularly large aid
inflows: disbursements from the World Bank in excess of 2% of GDP. Disbursements of this
magnitude occur in approximately 5% of the country-quarters in our sample (see Figure A2 in
the Online Appendix). The results are qualitatively similar to those obtained with the continu-
ous aid measure. Haven deposits increase by around 12% in quarters with a large disbursement
relative to the counterfactual with no large disbursement (Column 4). By comparison, non-
haven deposits decrease by around 3% (Column 5). Consequently, the growth rate in haven
deposits over and above the growth rate in non-haven deposits is around 15% (Column 6), which
is highly statistically significant.12
12Table A3 in the Online Appendix shows how the results vary with the threshold defining large disbursements.With a threshold of 1.5%, large disbursements increase haven deposits by 6% and increase haven deposits relativeto non-haven deposits by 10%; with a threshold of 2.5%, the increase in both outcomes is 15%.
11
Our first attempt to address the potential endogeneity of aid is to estimate quarterly changes
in foreign deposits in a two-year window around aid disbursements. Specifically, starting from
the model presented in Columns (1)-(3) of Table 2, we add four leads and four lags of the aid
variable. Figures 1-3 plot the estimated coefficients and their 95% confidence bounds. As shown
in Figure 1, aid is associated with a sharp increase in haven deposits precisely in the quarter
of the disbursement with a point estimate close to the baseline estimate of 3.4%; however,
the analogous effects in the four quarters before and after the disbursement are all economically
small and statistically indistinguishable from zero. As shown in Figures 2-3, aid is not associated
with significant changes in non-haven deposits, neither in the disbursement quarter nor in the
four quarters before and after, and the increase in haven deposits over and above the increase in
non-haven deposits is significant precisely in the disbursement quarter. We find similar patterns
when we use the dummy measure of large aid disbursements as shown in Figure A3 in the Online
Appendix.
These results have several important implications. First, the finding that aid disbursements
are not preceded by changes in haven deposits attenuates the concerns about endogeneity. If
haven deposits were increasing already before the disbursement quarter, one may have worried
that the same factors causing this increase were also causing the increase in the disbursement
quarter. The observed pattern supports a causal interpretation of the results. Second, the find-
ing that haven deposits increase precisely in the disbursement quarter and not in the following
quarters is suggestive that diversion is a key mechanism. If the correlation between aid and
money flows to foreign accounts reflected that aid raises incomes by stimulating aggregate de-
mand, we would have expected a protracted response mirroring the slower dynamics of a typical
business cycle.
To further address concerns about endogeneity, we estimate the baseline model (Table 2,
Column 1) while instrumenting actual disbursements with predicted disbursements as discussed
in the previous section. We employ two different specifications: one discarding disbursements
made in the same quarter as the commitment and another further discarding disbursements
made in the two quarters following the commitment. In the latter specification, the effect of aid
disbursements is identified only from predicted disbursements related to projects approved at
least 3 quarters before. In both cases, the first stage of the IV is very strong with a Kleibergen-
Paap Wald F-statistic for weak instruments of almost 100.13
Table 3 first reiterates the baseline OLS specification for ease of comparison (Column 1)
13The first stage regressions are documented in Table A4 and Figure A4 in the Online Appendix.
12

and then shows results for the IV specification excluding one quarter (Column 2) and three
quarters (Column 3) of post-commitment disbursements respectively. Both specifications yield
an estimate of the effect of aid on haven deposits that is statistically significant (in the latter
specification only at the 10% level) but somewhat smaller than the OLS baseline: an (instru-
mented) disbursement equivalent to one percent of GDP induces an increase in haven deposits
of around 2.5-3%.
We conduct a number of additional robustness tests of the relationship between aid dis-
bursements and haven deposits. First, we show how the estimates change when we exclude
country-quarters characterized by wars (Column 4), coups (Column 5), natural disasters (Col-
umn 6), and financial crises (Column 7). Each of these restrictions reduces the sample size
considerably, reflecting that the countries in our sample frequently suffer severe shocks. How-
ever, the coefficient on aid disbursements barely changes (except in the case of wars where it
drops to around 2.75) and remains statistically significant in all cases. Second, we show results
from the baseline model augmented with country-year fixed effects (Column 8). The estimated
effect of aid on haven deposits remains almost unchanged when identified exclusively from vari-
ation in disbursements within the year although the precision of the estimate decreases. Third,
we show that the baseline result is robust to controls for exchange rate movements14 (Column 9)
and resource rents15 (Column 10). Finally, we show that the baseline result does not depend on
the winsorization procedure employed to limit the effect of extreme observations: the coefficient
on aid increases marginally when growth rates in haven deposits are not winsorized (Column
11).
4.3 Implied leakage rates
We restate the baseline estimates so they express the leakage rate: the dollar increase in haven
deposits associated with a 1 dollar aid disbursement. This step helps assess the likely scale of
elite capture through offshore accounts. Since our empirical model does not deliver the leakage
rate directly, we need to rely on simple transformations to obtain it.
14Changes in exchange rates can cause changes in our deposit measures because they aggregate differentcurrencies into USD equivalents using contemporaneous exchange rates. The model in Column (9) controls forexchange rate movements by including a variable that expresses the mechanical change in deposits followingfrom exchange rate changes. We construct this variable as the average percentage change in exchange rates(relative to USD) weighted by country-specific currency shares in deposits (obtained from the BIS LocationalBanking Statistics).
15Andersen et al. (2017) show that rents from petroleum production are associated with money flows tohavens in countries with poor democratic governance. We control for resource rents by including the interactionbetween the time dummies and an indicator for petroleum producing countries.
13
We first provide an estimate of the leakage rate for the average country by evaluating at
the sample mean. The key estimate implies that disbursements corresponding to 1% of GDP
are associated with an increase in haven deposits of around 3.4%. At the sample mean, the
stock of deposits in havens is around 2.2% of GDP; hence, a 3.4% increase in haven deposits
corresponds to around 0.075% of GDP (i.e. 2.2%*3.4%) and the implied leakage is around 7.5%
(i.e. 0.0075%/1%).
From the perspective of a multilateral development bank, such as the World Bank, a more
relevant metric is leakage as a share of aggregate aid disbursements. To provide such a metric,
we assume that the key parameter estimated in the model applies uniformly to all countries
in the sample, but account for the fact that countries receive different shares of aggregate aid
and have different ratios of haven deposits to GDP. When weighted by the fraction of aid
received, the average stock of deposits in havens is around 1.4% of GDP; hence, for the average
dollar disbursed, a 3.4% increase in haven deposits corresponds to around 0.05% of GDP (i.e.
1.4%*3.4%) and the implied leakage rate for highly aid-dependent countries is around 5% (i.e.
0.05%/1%). Intuitively, the leakage rate in aggregate aid disbursements is slightly lower than
the leakage rate for the average country because countries that receive a larger share of the aid
disbursements tend to have slightly lower ratios of haven deposits to GDP (such that a given
percentage increase in haven deposits correspond to a smaller share of GDP).
These computations suggest that elite capture may contribute to the low effectiveness of aid
found in some studies, but also that the vast majority of aid is not diverted to foreign bank
accounts. The estimated leakage rate is directly comparable to Andersen et al. (2017) who
use a similar strategy to convert parameter estimates from a model in log-differences to leakage
rates. They find that 15% of petroleum rents in countries with poor governance are diverted to
bank accounts in havens; a leakage rate that is 2-3 times larger than the one we estimate in the
context of aid disbursements. The difference may be due to the fact that foreign aid is generally
subject to monitoring and control by the donors whereas there are no external constraints on
the use of petroleum rents.
The back-of-the-envelope computations are a useful way to assess the quantitative impor-
tance of aid leakage through elite capture, but also have several limitations. First, we clearly
underestimate the total leakage rate by only including funds flowing into foreign bank accounts
in the numerator (and not money spent on real estate, luxury goods etcetera) and may po-
tentially overestimate it by only including World Bank aid in the denominator (since aid from
14
multilateral agencies may crowd in bilateral aid).16 Second, the computations all rely on the
assumption that the parameter estimated in the model applies uniformly to all countries in the
sample. If the true effect is in fact larger (smaller) for countries with relatively low ratios of
haven deposits to GDP, the procedure will underestimate (overestimate) the average leakage
rate. Finally, the point estimate of 3.4% underlying the estimate of the leakage rate is associated
with statistical uncertainty: the lower bound of the 95% confidence interval implies an average
leakage rate of around 2.5%.
4.4 Heterogeneity
This section studies heterogeneity in the effect of aid inflows on money flows to havens with
the aim of learning more about the underlying mechanism. Our general approach is to, first,
construct indicators for being above and below the sample median in some dimension of hetero-
geneity and, then, re-estimate the baseline model while interacting the aid variable with both
of the two indicators.
As corruption features prominently among the possible mechanisms underlying our baseline
result, we first allow the effect of aid to vary across countries with more and less control over
corruption. Column (1) of Table 4 shows that a given aid disbursement is associated with
smaller increases in haven deposits when countries have more control over corruption. While
the baseline results suggested that receiving aid equivalent to 1% of GDP caused an increase
in haven deposits of 3.4%, these results suggest that the increase is 2.2% and 4.5% respectively
for countries with more and less control over corruption than the median. These results are
suggestive that corruption is an important mechanism through which aid increases wealth in
havens. However, like the rest of our heterogeneity analysis, the result has important limitations.
While the point estimates are consistently higher in countries with less control over corruption,
we cannot reject that they are identical at conventional confidence levels (p-value of 0.25 reported
at the bottom of the table). Moreover, although the effect of aid disbursements correlates with
corruption, we cannot exclude that this heterogeneity derives from other country characteristics
correlating with corruption.
We split the sample in other dimensions to further probe the corruption mechanism and test
alternative explanations. Column (2) shows that the effect of aid on haven deposits is larger in
16A simple exercise, reported in Table A5 in the Online Appendix, suggests that there is no crowding-in:regressing non-WB aid on WB aid (including country and time fixed effects) yields a point estimate on WB aidvery close to zero (with large standard errors). However, we cannot exclude that this annual-level regressionconceals a stronger within-year correlation.
15

the presence of disclosure rules for politicians. This result may reflect that disclosure rules create
stronger incentives for politicians to hide diverted funds on bank accounts in havens rather than
keeping them in the domestic financial system where they are disclosed. Column (3) shows that
the effect of aid on haven deposits is larger when the country’s capital account is more open. This
finding is suggestive that regulatory restrictions on cross-border capital flows may deter diversion
of aid through foreign bank accounts. Column (4) shows that the effect varies with institutional
quality : it is somewhat larger in autocracies than in countries with more democratic institutions.
This is consistent with Andersen et al (2017) who find that the checks-and-balances embedded in
democratic institutions are mediating the transformation of petroleum rents to political rents.
Finally, Column (5) shows that the effect of aid on haven deposits decreases with domestic
financial sector development. This suggests an alternative mechanism whereby firms involved in
aid-sponsored projects receive payments in the disbursement quarter and rely on foreign banks
for cash deposits when domestic banks are underdeveloped; however, this mechanism is difficult
to reconcile with the finding that money only flows to havens around disbursements and not to
banking centers without financial secrecy.
Moreover, we exploit the detailed information in the World Bank Project Database to ex-
plore differences between two types of aid: Development Policy Financing (DPF) supporting
policy programs and Investment Project Financing (IPF) supporting investment projects (World
Bank, 2017). One may hypothesize that the latter type of aid, tied to specific expenditure and
disbursed over a long time horizon, is more difficult to divert than the former, subject to
fewer constraints and disbursed more quickly. However, if anything, aid supporting investment
projects correlates more strongly with money flows to havens. As shown in Columns (1)-(3) of
Table 5, an aid disbursement of 1% of GDP is associated with an increase in haven deposits
of around 2.8% when the aid takes the form of DPF and 5.3% when it takes the form of IPF,
but the difference between the coefficients is not statistically significant. The difference between
the two forms of aid is much less pronounced when the increase in haven deposits is measured
relative to the increase in non-haven deposits as shown in Columns (7)-(9).
Last, we investigate whether there are systematic differences in the correlation between aid
disbursements and haven deposits across countries that differ in aid-dependence.17 While the
baseline analysis focused exclusively on the sample of 22 countries with average annual aid
disbursements from the World Bank above 2% of GDP, we now re-estimate the baseline model
17Table A6 in the Online Appendix reports descriptive statistics similar to Table 1 for the 24 countries thatare not part of the baseline analysis (because their ratio of annual aid from the World Bank to GDP is below2%) but enter this analysis (because their ratio of annual aid from the World Bank to GDP is above 1%)
16

while varying this threshold. The point estimates on aid disbursements, illustrated by the blue
bars in Figure 4, suggest a strong positive correlation between aid-dependence and aid diversion.
One the one hand, when we lower the threshold to 1% (sample of 46 countries), the estimate falls
to around 1.8%, which is not significantly different from zero. On the other hand, raising the
threshold to 3% (sample of 7 countries), the estimate increases to a highly significant 6%. The
implied leakage rates, illustrated by the red line in Figure 4, exhibit an even stronger gradient:
from a leakage rate of around 4% with a threshold of 1% to more than 15% with a threshold of
3%.18
The steep gradient in leakage rates has several important implications. First, it suggests that
our estimate of leakage out of aid disbursements to the main sample of highly aid-dependent
countries is a poor estimate of leakage out of aid disbursements more generally. The 22 highly
aid-dependent countries in our main sample account for around 10% of the aid disbursed by the
World Bank and the results in Figure 4 suggest that leakage rates are much lower (if not zero)
for less aid-dependent countries. Second, it constitutes novel evidence that aid capture may be
more salient in underdeveloped and poorly governed countries, which are also most in need of
development assistance (Alesina and Weder, 2002). While this association may simply reflect
that the combination of poor development and bad governance stimulates foreign aid, it is also
consistent with the view that very high levels of aid may foster corruption and institutional
erosion (Knack, 2000; Djankov et al., 2008).
4.5 Publicly available data
Up to this point, we have conducted the analysis with a restricted dataset from the BIS that
allows us to break down each country’s total foreign deposits, which is public information, into
deposits in havens and deposits in non-havens, which is not publicly available. To enhance
transparency and to facilitate work by other researchers on aid and foreign deposits, we show
that results similar to our main results can be obtained with a publicly available dataset from
the BIS. This recently released data includes quarterly data on cross-border deposits at the
bilateral level for a selected group of banking centers.
Table 6 summarizes the publicly available information. In our main sample of 22 highly aid-
dependent countries (Column 1), the average of total foreign deposits taken across all quarters
in the sample period 1999-2010 stands at $199 million (corresponding to the sum of Columns
2 and 3 in Table 1). With the public dataset, 29% of these deposits can be assigned to six
18Not only does the point estimate on aid increase as we raise the threshold, the ratio of haven deposits toGDP also increases, which implies a higher leakage rate for a given point estimate.
17
havens (Switzerland, Luxembourg, Belgium, Jersey, Guernsey and the Isle of Man) and 55%
can be assigned to 11 non-havens. Among the havens, for which bilateral deposit information
is publicly available, Switzerland is by far the most important. Around 16% of the total foreign
deposits cannot be assigned to individual banking centers. Even if all these unallocated deposits
are held in havens like Cayman Islands, Singapore and the Bahamas where public data is not
available at the bilateral level, the public series still allocate almost two thirds of all haven
deposits to individual havens for this particular sample.19
We first re-estimate the baseline model with the (incomplete) measures of haven and non-
haven deposits based on publicly available information while using the same sample period as
in the baseline analysis, 1990-2010. As shown in Column (1) of Table 7, an aid disbursement
equivalent to one percent of GDP in a given quarter induces a statistically significant increase
in haven deposits of around 2.5% and, as shown in Column (2), an insignificant decrease in
non-haven deposits of around 2%. The increase in haven deposits, measured over and above the
increase in non-haven deposits, is around 4.1%, as shown in Column (3). These estimates are
similar to the baseline estimates based on restricted deposit information (Columns 1-3 in Table
2), but somewhat smaller. A possible interpretation is that the havens not allowing for public
release of bilateral deposit data are also the havens where deposit responses to aid disbursements
are largest. Extending the sample period to include the most recent observations in the public
data yields almost identical results, as shown in Columns (4)-(6).
Next, we show results by individual banking centers; an exercise we are not allowed to
conduct with the restricted dataset due to confidentiality requirements.20 As shown in Columns
(7)-(10), the overall increase in haven deposits around aid disbursements is driven by accounts
in Switzerland and Luxembourg while the responses in Belgium and Jersey (combined with
Guernsey and Isle of Man) exhibit statistically insignificant changes. This is consistent with
the notion that the increase in haven deposits around aid disbursements reflect diversion to
secret private accounts. Throughout the period 1990-2010, Switzerland was a leading haven
with some of the strictest bank secrecy rules in the world and a share of the global market for
private wealth management of around 40% (Zucman, 2013; Zucman, 2017). There is evidence
that as much as 90-95% of the wealth managed in Switzerland is hidden from the authorities in
the owners’ home country (Alstadsæter et al., 2019).
19For the rest of the world (Column 2), the coverage of the publicly available deposit information is lower with35% that cannot be allocated to individual banking centers.
20A limitation of this analysis is that the total deposits owned by small and relatively poor countries in smalland relatively unimportant banking centers are not rarely zero, which translates into missing observations withour log-transformation of the dependent variable.
18

Finally, we exploit the public dataset to examine whether the correlation between aid and
haven deposits has diminished in the most recent years (not covered by the restricted dataset).
Since around 2009, all havens have enhanced financial transparency in response to pressure
by international organizations like the OECD (Johannesen and Zucman, 2014) and individual
countries like the United States (Johannesen et al., 2018). In the same period, a number of
data leaks by whistleblowers in the wealth management industry, e.g. Swiss Leaks and Panama
Papers, have increased the risk of exposure for public figures with undeclared money on foreign
accounts (Johannesen and Stolper, 2017). As shown in Column (11), there are no clear signs
that aid disbursements are associated with smaller increases in haven deposits in the period with
more financial transparency: the coefficient on the aid variable is almost identical in the periods
1990-2008 and 2009-2018. However, the standard errors are large and we also cannot reject
the null hypothesis of a zero correlation in the post-2009 period. In principle, it is possible
to conduct more high-powered tests that exploit country-level variation in transparency and
information exchange, but we leave that for future research.
5 Concluding remarks
We document that aid disbursements to the most aid-dependent countries coincide with signif-
icant increases in deposits held in offshore financial centers known for bank secrecy and private
wealth management. Aid capture by ruling politicians, bureaucrats and their cronies is con-
sistent with the totality of observed patterns: it can explain why aid does not trigger flows
to non-havens, why the capital outflows occur precisely in the same quarter as the aid inflows
and why the estimated effects are larger for more corrupt countries. Other explanations are
possible but we find them harder to reconcile with all the patterns in the data. We cannot
exclude that firms benefiting from aid-sponsored spending receive payments in quarters with
aid disbursements and deposit the funds with foreign banks; however, this mechanism cannot
explain why the money only flows to havens. It seems even less likely that the results reflect
profit shifting by multinational firms, the effect of aid on income through aggregate demand
and portfolio adjustments by commercial and central banks. Our estimates suggest a leakage
rate of around 7.5% for the average highly aid-dependent country.
References
[1] Alesina, Alberto and Beatrice Weder. 2002. “Do Corrupt Governments Receive Less Foreign
Aid?”. American Economic Review 92(4), 1126 – 1137.
[2] Alstadsæter, Annette, Niels Johannesen, and Gabriel Zucman. 2017. “Tax Evasion and
Inequality”. American Economic Review 109(6), p. 2073-2103.
[3] Alworth, Julian and Andresen, S., 1992. “The determinants of cross-border non-bank de-
posits and the competitiveness of financial market centers ”. Money Affairs July-December,
p. 105-133.
[4] Andersen, Jørgen J., Niels Johannesen, David D. Lassen, and Elena Paltseva. 2017. “Petro
Rents, Political Institutions, and Hidden Wealth: Evidence from Offshore Bank Accounts”.
Journal of the European Economic Association 15(4), 818 – 860.
[5] Boone, Peter. 1996. “Politics and the Effectiveness of Foreign Aid”. European Economic
Review 40, 289 – 329.
[6] Burnside, Craig and David Dollar. 2000. “Aid, Policies, and Growth”. American Economic
Review 90(4), 847 – 868.
[7] Bjørnskov, Christian. 2010. “Do elites benefit from democracy and foreign aid in developing
countries?”Journal of Development Economics 92(2), 115-124
[8] Chinn, Menzie D. and Hiro Ito (2006). “What Matters for Financial Development? Capital
Controls, Institutions, and Interactions”. Journal of Development Economics 81(1), 163-
192.
[9] Collier, Paul and David Dollar. 2002. “Aid Allocation and Poverty Reduction”. European
Economic Review 46, 1475 – 1500.
[10] Dalgaard, Carl-Johan, Henrik Hansen and Finn Tarp, 2004. “On The Empirics of Foreign
Aid and Growth”. Economic Journal 114, 191-216.
[11] Djankov, S., Montalvo, J.G. and Reynal-Querol, M., 2008. “The curse of aid.”. Journal of
economic growth 13(3), p. 169-194.
[12] Djankov, Simeon, Rafael La Porta, Florencio Lopez-de-Silanes and Andrei Shleifer, 2010.
“Disclosure by Politicians”. American Economic Journal: Applied Economics 2(2), 179-
209.
[13] Easterly, William. 2006. “The Big Push Deja Vu: A Review of Jeffrey Sachs’s The End of
Poverty: Economic Possibilities for Our Time”. Journal of Economic Literature XLIV, 96
– 105.
[14] FATF. 2011. “Laundering the Proceeds of Corruption”. Financial Action Task Force,
OECD, Paris.
20
[15] Galiani, Sebastian, Stephen Knack, Lixin Colin Xu, and Ben Zou. 2017. “The Effect of Aid
on Growth”. Journal of Economic Growth 22(1), 1 – 33.
[16] Guardian. 2009. “G20 Declares Door Shut on Tax Havens.”2 April.
http://www.guardian.co.uk/world/2009/apr/02/g20-summit-tax-havens. Accessed on
17 February, 2020.
[17] Huizinga, Harry and Gaetan Nicodeme, 2004. “Are international deposits tax-driven”.
Journal of Public Economics 88, p. 1093-1118.
[18] Johannesen, Niels. 2014. “Tax Evasion and Swiss Bank Deposits”. Journal of Public Eco-
nomics 111, p. 46-62.
[19] Johannesen, Niels and Gabrial Zucman. 2014. “The End of Bank Secrecy? An Evaluation
of the G20 Tax Haven Crackdown”. American Economic Journal: Economic Policy 6(1),
65 – 91.
[20] Johannesen, Niels and Jukka Pirtilla. 2016. “Capital Flight and Development: An Overview
of Concepts, Methods, and Data Sources”. WIDER Working Paper, No. 2016/95.
[21] Johannesen, Niels, Thomas Tørsløv, and Ludvig Wier. 2018. “Are Less Developed Countries
More Exposed to Multinational Tax Avoidance? Method and Evidence from Micro-Data”.
WIDER Working Paper, No. 2016/10. (World Bank Economic Review, forthcoming).
[22] Johannesen, N. and Stolper, T., 2017. “The deterrence effect of whistleblowing–an event
study of leaked customer information from banks in tax havens. ”Working Paper
[23] Johannesen, N., Langetieg, P., Reck, D., Risch, M. and Slemrod, J., 2018. “Taxing hidden
wealth: The consequences of US enforcement initiatives on evasive foreign accounts. ”NBER
Working Paper, No. 24366.
[24] Kersting, Erasmus K. and Christopher Kilby. 2016. “With a Little Help from My Friends:
Global Electioneering and World Bank Lending”. Journal of Development Economics 121,
153 – 165.
[25] Klitgaard, Robert. 1990. “Tropical Gangsters”. New York: Basic Books.
[26] Knack, S., 2000. “Aid dependence and the quality of governance: a cross-country empirical
analysis.”The World Bank.
[27] Kraay, Aart. 2012. “How Large is the Government Spending Multiplier?”. Quarterly Jour-
nal of Economics 127(2), 829 – 887.
[28] Kraay, Aart. 2014. “Government Spending Multipliers in Developing Countries: Evidence
from Lending by Official Creditors”. American Economic Journal: Macroeconomics 6(4),
170 – 208.
21
[29] Laeven, Luc and Fabian Valencia. 2012. “Systemic Banking Crises Database: An Update”.
IMF Working Paper WP/12/163, International Monetary Fund.
[30] Lane, Philip R. and Gian Maria Milesi-Ferretti. 2007. “The External Wealth of Nations
Mark II: Revised and Extended Estimates of Foreign Assets and Liabilities, 1970–2004”.
Journal of International Economics 73, 223 – 250.
[31] Londono-Velez, Juliana and Javier Avila-Mahecha. 2018. “Can Wealth Taxation Work in
Developing Countries? Quasi-Experimental Evidence from Colombia”. Job Market Paper
at the Department of Economics, University of California, Berkeley.
[32] Menkhoff, Lukas and Jakob Miethe, 2019. “Tax evasion in new disguise? Examining tax
havens’ international bank deposits.”Journal of Public Economics forthcoming.
[33] OECD, 2019. “Using bank deposit data to assess the impact of exchange of information.”
[34] Olken, Benjamin A. and Rohini Pande. 2012. “Corruption in Developing Countries”. An-
nual Review of Economics (4), 479 – 509.
[35] Omartian, James D.. 2017. “Do Banks Aid and Abet Asset Concealment: Evidence
from the Panama Papers”. Available at SSRN: https://ssrn.com/abstract=2836635 or
http://dx.doi.org/10.2139/ssrn.2836635
[36] Powell, Jonathan M. and Clayton L. Thyne. 2011. “Global Instances of Coups from 1950
to 2010: A New Dataset”. Journal of Peace Research 48(2), 249 – 259.
[37] Sachs, Jeffrey. 2005. “The End of Poverty: Economic Possibilities for Our Time”. New
York: Penguin Press.
[38] Svensson, Jakob. 2000. “Foreign Aid and Rent-Seeking”. Journal of International Eco-
nomics 51, 437 – 461.
[39] Temple, Jonathan and Nicolas Van de Sijpe. 2017. “Foreign Aid and Domestic Absorption”.
Journal of International Economics 108, 431 – 443.
[40] Werker, Erik, Faizal Z. Ahmed, and Charles Cohen. 2009. “How Is Foreign Aid Spent?
Evidence From a Natural Experiment”. American Economic Journal: Macroeconomics
1(2), 225 – 244.
[41] World Bank. 2017. “The 2017 Global Findex database”.
[42] Zucman, Gabriel. 2013. “The Missing Wealth of Nations”. Quarterly Journal of Economics
128(3), 1321 – 1364.
[43] Zucman, Gabriel. 2017. “The Hidden Wealth of Nations”. University of Chicago Press,
Second edition.
22
Table
1:Descriptivestatistics.
Th
eta
ble
show
sth
e22
cou
ntr
ies
inou
rm
ain
sam
ple
an
dp
rese
nts
sum
mary
stati
stic
sfo
rth
em
ain
vari
ab
les
inou
ran
alysi
s.T
he
sam
ple
incl
ud
esal
lco
untr
ies
for
wh
ich
an
nu
al
dis
bu
rsem
ents
from
the
Worl
dB
an
kare
equ
ivale
nt
toat
least
2p
erce
nt
of
an
nu
al
GD
Pon
aver
age.
Sample
mean
isth
eav
erag
eof
the
22co
untr
ies
inth
esa
mp
le.AnnualWB
aid
(%ofGDP)
isan
nu
al
dis
bu
rsem
ents
from
the
Worl
dB
an
kas
afr
acti
onof
annual
GD
P.AnnualODA
aid
(%ofGDP)
isan
nu
al
Offi
cial
Dev
elop
men
tA
ssis
tan
ce(O
DA
)fr
om
all
sou
rces
as
afr
act
ion
of
an
nu
al
GD
P.Havendeposits
isfo
reig
nd
epos
its
hel
din
the
17
cou
ntr
ies
class
ified
as
hav
ens.
Non-havendeposits
isfo
reig
nd
eposi
tsh
eld
inth
eco
untr
ies
not
clas
sifi
edas
hav
ens.
Havendeposits
(quarterly
growth
in%)
isth
equ
art
erly
per
centa
ge
chan
ge
ind
eposi
tsh
eld
inth
e17
cou
ntr
ies
class
ified
as
hav
ens
(mea
sure
das
the
chan
gein
qu
arte
rly
log-
leve
ls).Non-havendeposits
(growth
in%)
isth
equ
art
erly
per
centa
ge
chan
ge
indep
osi
tsh
eld
inco
untr
ies
not
clas
sifi
edas
hav
ens
(mea
sure
das
the
chan
gein
qu
art
erly
log-l
evel
s).GDP
(growth
in%)
isth
equ
art
erly
per
centa
ge
chan
ge
inG
DP
(mea
sure
das
the
diff
eren
cein
qu
arte
rly
log-
leve
lsof
GD
P)
An
nu
al
WB
aid
flow
s
(%G
DP
)
An
nu
al
OD
A a
id
flow
s
(%G
DP
)
Hav
en
dep
osi
ts
(mil
lion
US
D)
Non
-hav
en
dep
osi
ts
(mil
lion
US
D)
Hav
en
dep
osi
ts
(qu
arte
rly g
row
th
rate
)
Non
-hav
en
dep
osi
ts
(qu
arte
rly
gro
wth
rat
e)
GD
P
(qu
arte
rly
gro
wth
rat
e)
Afg
han
ista
n2
.5%
33
.5%
34
71
3.2
7%
-0.2
%4
.3%
Arm
enia
2.3
%4
.3%
38
17
6.8
7%
5.5
%2
.8%
Bu
rkin
a F
aso
2.3
%8
.1%
32
88
1.5
1%
1.9
%1
.5%
Bu
run
di
3.8
%1
1.8
%1
03
19
0.4
8%
1.7
%0
.7%
Eri
trea
3.2
%1
2.7
%8
11
2.2
9%
4.0
%2
.2%
Eth
iop
ia2
.2%
6.1
%6
41
55
1.6
1%
0.3
%1
.1%
Gh
ana
2.7
%5
.3%
76
44
62
.12
%1
.0%
2.2
%
Gu
inea
-Bis
sau
3.2
%1
8.5
%8
16
3.1
4%
1.8
%1
.6%
Gu
yan
a2
.5%
6.5
%3
31
03
3.6
0%
0.9
%2
.1%
Kyrg
yz
Rep
ub
lic
2.1
%4
.8%
11
12
4.1
1%
2.5
%1
.2%
Mad
agas
car
2.7
%6
.6%
19
32
32
0.3
2%
1.7
%1
.5%
Mal
awi
3.9
%1
0.6
%3
18
23
.97
%0
.7%
1.8
%
Mal
i2
.1%
7.9
%2
71
33
0.7
8%
1.6
%1
.9%
Mau
rita
nia
2.1
%6
.8%
32
15
02
.14
%2
.7%
1.8
%
Moza
mb
iqu
e3
.3%
19
.0%
40
16
13
.19
%1
.8%
1.8
%
Nig
er2
.0%
8.5
%2
97
9-0
.25
%1
.8%
1.1
%
Rw
and
a2
.7%
13
.7%
14
94
10
.06
%-1
.0%
1.0
%
Sao
Tom
e an
d P
rin
cip
e2
.3%
18
.4%
48
-1.1
1%
3.9
%2
.7%
Sie
rra
Leo
ne
3.2
%1
0.3
%3
28
2-0
.37
%-0
.1%
1.2
%
Tan
zan
ia2
.4%
8.8
%1
45
43
72
.46
%1
.0%
2.4
%
Ugan
da
3.3
%7
.6%
73
18
82
.36
%0
.6%
1.6
%
Zam
bia
2.9
%1
0.2
%1
17
30
62
.67
%0
.5%
1.9
%
Sam
ple
mea
n2
.7%
10
.1%
61
13
62
.02
%1
.5%
1.7
%
23

Table
2:M
ain
resu
lts.
Th
eta
ble
show
sou
rm
ain
resu
lts:
OL
ST
he
sam
ple
com
pri
ses
22
cou
ntr
ies
wit
hav
erage
an
nu
al
dis
bu
rsem
ents
from
the
Wor
ldB
ank
exce
edin
g2%
ofG
DP
.T
he
sam
ple
per
iod
is1990-2
010
an
dth
efr
equ
ency
isqu
art
erly
.In
colu
mn
s1
an
d4
the
dep
end
ent
vari
ab
leis
the
per
centa
gech
ange
inh
aven
dep
osit
s;in
colu
mn
s2
an
d5
itis
the
per
centa
ge
chan
ge
inn
on
-hav
end
eposi
ts;
wh
ile
inco
lum
ns
2an
d6
isth
ed
iffer
ence
bet
wee
nth
ep
erce
nta
gech
ange
inh
aven
and
non
-hav
end
eposi
ts.
Th
eex
pla
nato
ryva
riab
les
are
:Aid
(%GDP)
isqu
art
erly
dis
bu
rsem
ents
from
the
Wor
ldB
ank
asa
frac
tion
ofan
nu
alG
DP
.Highaid
disbursem
ent
isan
ind
icato
rfo
rqu
art
erly
dis
bu
rsem
ents
from
the
Worl
dB
an
kex
ceed
ing
2%
of
annu
alG
DP
.GDP
(%growth)
isth
equ
arte
rly
per
centa
ge
chan
ge
inG
DP
(mea
sure
das
on
equ
art
erof
the
an
nu
al
per
centa
ge
chan
ge)
.CountryFE
isa
vec
tor
ofco
untr
yfi
xed
effec
ts.Tim
eFE
isa
vect
or
of
tim
efi
xed
effec
ts.
All
per
centa
ge
chan
ges
are
ap
pro
xim
ate
dw
ith
the
diff
eren
cein
log-l
evel
s.T
he
dep
osit
and
aid
vari
able
sar
ew
inso
rize
dat
the
1st
and
99th
per
centi
le.
Sta
nd
ard
erro
rscl
ust
ered
at
the
cou
ntr
y-l
evel
are
pre
sente
din
pare
nth
eses
(***
p<
0.01
,**
p<
0.05
,*
p<
0.1)
(1)
(2)
(3)
(4)
(5)
(6)
ha
ven
n
on
-ha
ven
rati
oh
aven
n
on
-ha
ven
rati
o
Aid
(%
GD
P)
3.3
91
3***
-1.5
11
24
.97
32
***
(1.1
54
1)
(1.0
35
4)
(1.7
15
3)
Hig
h a
id d
isb
urs
emen
t0
.10
08
***
-0.0
28
30
.13
80
***
(Aid
>2
% G
DP
)(0
.03
22
)(0
.02
94
)(0
.04
32
)
GD
P (
%gro
wth
)0
.12
21
0.1
47
5**
-0.0
01
30
.10
68
0.1
55
5**
-0.0
23
9
(0.1
40
6)
(0.0
63
3)
(0.1
49
8)
(0.1
41
6)
(0.0
63
7)
(0.1
49
5)
Ob
serv
atio
ns
1,6
48
1,6
52
1,6
45
1,6
48
1,6
52
1,6
45
R-s
qu
ared
0.1
00
60
.09
18
0.0
76
00
.10
13
0.0
90
80
.07
59
cou
ntr
y F
EY
ES
YE
SY
ES
YE
SY
ES
YE
S
tim
e F
EY
ES
YE
SY
ES
YE
SY
ES
YE
S
24
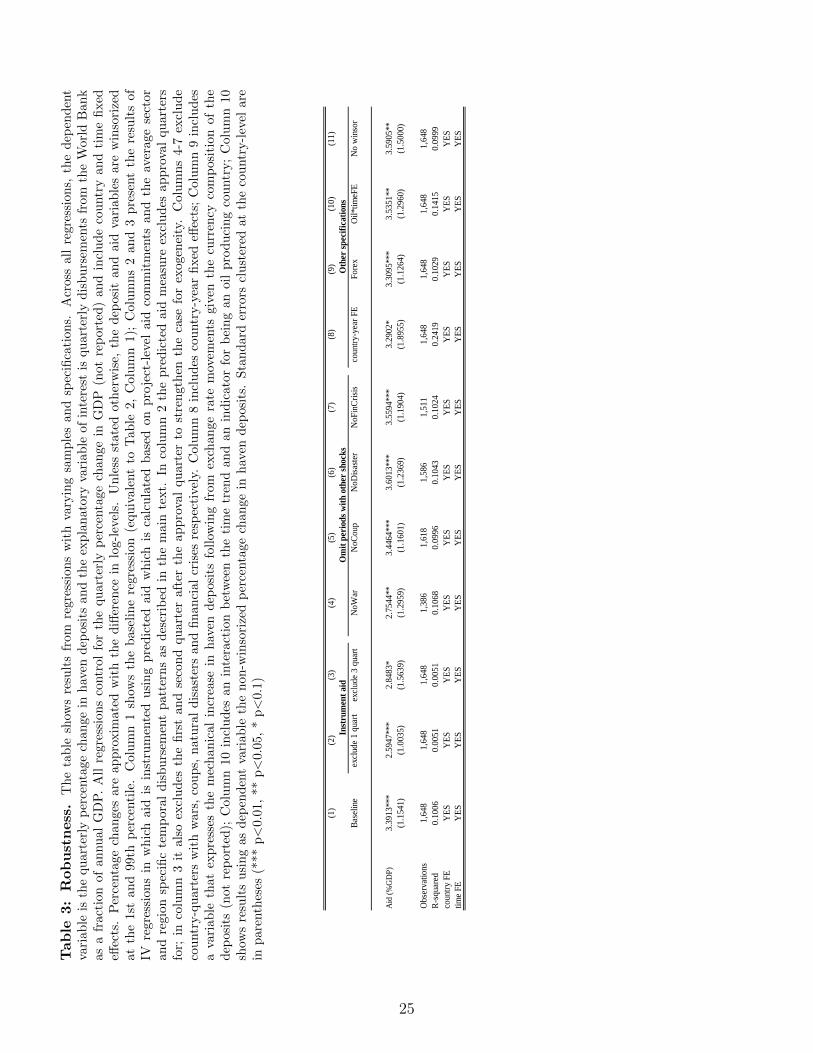
Table
3:Robustness.
Th
eta
ble
show
sre
sult
sfr
om
regre
ssio
ns
wit
hva
ryin
gsa
mp
les
an
dsp
ecifi
cati
on
s.A
cross
all
regre
ssio
ns,
the
dep
end
ent
vari
able
isth
equ
arte
rly
per
centa
gech
ange
inh
aven
dep
osi
tsan
dth
eex
pla
nato
ryva
riab
leof
inte
rest
isqu
art
erly
dis
bu
rsem
ents
from
the
Worl
dB
an
kas
afr
acti
onof
annu
alG
DP
.A
llre
gres
sion
sco
ntr
ol
for
the
qu
art
erly
per
centa
ge
chan
ge
inG
DP
(not
rep
ort
ed)
an
din
clu
de
cou
ntr
yan
dti
me
fixed
effec
ts.
Per
centa
gech
ange
sar
eap
pro
xim
ated
wit
hth
ed
iffer
ence
inlo
g-l
evel
s.U
nle
ssst
ate
doth
erw
ise,
the
dep
osi
tan
daid
vari
ab
les
are
win
sori
zed
atth
e1s
tan
d99
thp
erce
nti
le.
Col
um
n1
show
sth
eb
ase
lin
ere
gre
ssio
n(e
qu
ivale
nt
toT
ab
le2,
Colu
mn
1);
Colu
mn
s2
an
d3
pre
sent
the
resu
lts
of
IVre
gres
sion
sin
wh
ich
aid
isin
stru
men
ted
usi
ng
pre
dic
ted
aid
wh
ich
isca
lcu
late
dbase
don
pro
ject
-lev
elaid
com
mit
men
tsan
dth
eav
erage
sect
or
and
regi
onsp
ecifi
cte
mp
oral
dis
bu
rsem
ent
pat
tern
sas
des
crib
edin
the
main
text.
Inco
lum
n2
the
pre
dic
ted
aid
mea
sure
excl
ud
esap
pro
val
qu
art
ers
for;
inco
lum
n3
ital
soex
clu
des
the
firs
tan
dse
con
dqu
art
eraft
erth
eap
pro
val
qu
art
erto
stre
ngth
enth
eca
sefo
rex
ogen
eity
.C
olu
mn
s4-7
excl
ud
eco
untr
y-q
uar
ters
wit
hw
ars,
cou
ps,
nat
ura
ld
isas
ters
an
dfin
an
cial
cris
esre
spec
tive
ly.
Colu
mn
8in
clu
des
cou
ntr
y-y
ear
fixed
effec
ts;
Colu
mn
9in
clu
des
ava
riab
leth
atex
pre
sses
the
mec
han
ical
incr
ease
inh
aven
dep
osi
tsfo
llow
ing
from
exch
an
ge
rate
mov
emen
tsgiv
enth
ecu
rren
cyco
mp
osi
tion
of
the
dep
osit
s(n
otre
por
ted
);C
olu
mn
10in
clu
des
anin
tera
ctio
nb
etw
een
the
tim
etr
end
an
dan
ind
icato
rfo
rb
ein
gan
oil
pro
du
cin
gco
untr
y;
Colu
mn
10
show
sre
sult
su
sin
gas
dep
end
ent
vari
able
the
non
-win
sori
zed
per
centa
ge
chan
ge
inh
aven
dep
osi
ts.
Sta
nd
ard
erro
rscl
ust
ered
at
the
cou
ntr
y-l
evel
are
inp
aren
thes
es(*
**p<
0.01
,**
p<
0.05
,*
p<
0.1)
(1)
(2)
(3)
(4)
(5)
(6)
(7)
(8)
(9)
(10)
(11)
Bas
elin
eex
clude
1 q
uar
tex
clude
3 q
uar
tN
oW
arN
oC
oup
NoD
isas
ter
NoF
inC
risi
sco
untr
y-y
ear
FE
Fore
xO
il*t
imeF
EN
o w
inso
r
Aid
(%
GD
P)
3.3
913**
*2.5
947**
*2.8
483*
2.7
544**
3.4
464**
*3.6
013**
*3.5
594**
*3.2
902*
3.3
095**
*3.5
351**
3.5
905**
(1.1
541)
(1.0
035)
(1.5
639)
(1.2
959)
(1.1
601)
(1.2
369)
(1.1
904)
(1.8
955)
(1.1
264)
(1.2
960)
(1.5
000)
Obse
rvat
ions
1,6
48
1,6
48
1,6
48
1,3
86
1,6
18
1,5
86
1,5
11
1,6
48
1,6
48
1,6
48
1,6
48
R-s
quar
ed0.1
006
0.0
051
0.0
051
0.1
068
0.0
996
0.1
043
0.1
024
0.2
419
0.1
029
0.1
415
0.0
999
countr
y F
EY
ES
YE
SY
ES
YE
SY
ES
YE
SY
ES
YE
SY
ES
YE
SY
ES
tim
e F
EY
ES
YE
SY
ES
YE
SY
ES
YE
SY
ES
YE
SY
ES
YE
SY
ES
Inst
rum
ent
aid
Om
it p
erio
ds
wit
h o
ther
sh
ock
sO
ther
sp
ecif
icati
on
s
25

Table
4:Hetero
geneity.
Th
eta
ble
show
sh
owth
ere
sult
sva
ryacr
oss
cou
ntr
ies
wit
hd
iffer
ent
chara
cter
isti
cs.
Acr
oss
all
regre
ssio
ns,
the
dep
end
ent
vari
able
isth
equ
arte
rly
per
centa
gech
ange
inh
aven
dep
osi
ts.
Inea
chco
lum
nw
ein
tera
ctqu
art
erly
aid
dip
bu
rsem
ents
from
the
Worl
dB
an
kex
pre
ssed
asa
shar
eof
GD
Pw
ith
ind
icat
ors
for
bei
ng
abov
ean
db
elow
the
sam
ple
med
ian
inso
me
dim
ensi
on
of
het
erogen
eity
.A
tth
eb
ott
om
of
the
tab
lew
esh
owca
seth
ed
iffer
ence
inco
effici
ent
esti
mat
esac
ross
cou
ntr
ies
that
are
ab
ove
vers
us
bel
owth
em
edia
n,
as
wel
las
the
ass
oci
ate
dp
-valu
e.C
olu
mn
1d
isti
ngu
ish
esb
etw
een
cou
ntr
ies
bas
edon
wh
eth
erth
eyh
ave
hig
hfo
cus
on
contr
ol
of
corr
up
tion
from
the
Worl
dG
over
nan
ceIn
dic
ato
rs(w
ith
hig
her
contr
olof
corr
up
tion
imp
lyin
gle
ssco
rru
pti
on).
Colu
mn
2d
ivid
edco
untr
ies
base
don
the
pre
sen
ceofdisclosure
requirem
ents
as
mea
sure
dby
Dja
nko
vet
al.
(201
0).
Col
um
n3
div
ides
cou
ntr
ies
bas
edon
thei
rco
nte
mp
ora
neo
us
valu
eofcapitalaccountopenness
as
rep
ort
edby
Ch
inn
an
dIt
o(2
006).
Col
um
n4
exam
ines
het
erog
enei
tyas
soci
ated
wit
hdem
ocr
ati
cin
stit
uti
on
sas
cap
ture
dby
the
vari
ab
lep
oli
ty2
from
the
Poli
tyIV
Pro
ject
.C
olu
mn
5d
ivid
edco
untr
ies
onth
ebas
isof
domesticcredit
from
the
fin
anci
al
sect
or
rela
tive
toG
DP
as
rep
orte
din
the
Worl
dD
evel
op
men
tIn
dic
ato
rs.
All
regr
essi
ons
contr
olfo
rth
equ
arte
rly
per
centa
gech
an
ge
inG
DP
(not
rep
ort
ed)
an
din
clu
de
cou
ntr
yan
dti
me
fixed
effec
ts.
Per
centa
ge
chan
ges
are
app
roxim
ated
wit
hth
ed
iffer
ence
inlo
g-le
vel
s.T
he
dep
osi
tan
daid
vari
ab
les
are
win
sori
zed
at
the
1st
an
d99th
per
centi
le.
Sta
nd
ard
erro
rscl
ust
ered
atth
eco
untr
y-l
evel
are
inp
aren
thes
es(*
**p<
0.01,
**
p<
0.0
5,
*p<
0.1
)
con
tro
l o
ver
corr
up
tio
n
dis
clo
sure
rule
s
cap
ita
l
acc
ou
nt
dem
ocr
ati
c
in
stit
uti
on
s
cred
it
ma
rket
s
(1)
(2)
(3)
(4)
(5)
Aid
*(C
on
tro
l o
f co
rru
pti
on
=lo
w)
4.4
48
2*
*
(1.7
47
8)
Aid
*(C
on
tro
l o
f co
rru
pti
on
=h
igh
)2
.16
35
*
(1.0
51
2)
Aid
*(D
iscl
osu
re r
equ
ired
=0
)2
.75
71
**
(1.0
60
6)
Aid
*(D
iscl
osu
re r
equ
ired
=1
)4
.43
50
*
(2.3
60
0)
Aid
*(C
apit
al a
cco
un
t o
pen
nes
s=lo
w)
1.7
20
2
(1.0
98
0)
Aid
*(C
apit
al a
cco
un
t o
pen
nes
=h
igh
)4
.45
68
*
(2.4
13
9)
Aid
*(P
oli
ty l
ow
)3
.38
12
**
(1.4
93
6)
Aid
*(P
oli
ty h
igh
)1
.85
41
(1.8
22
4)
Aid
*(C
red
it=
low
)3
.70
33
*
(2.0
58
9)
Aid
*(C
red
it=
hig
h)
2.0
79
8*
(1.1
43
0)
Ob
serv
atio
ns
1,6
48
1,6
48
1,6
06
1,5
82
1,4
35
R-s
qu
ared
0.1
01
30
.10
09
0.1
09
10
.11
31
0.0
96
3
cou
ntr
y F
EY
ES
YE
SY
ES
YE
SY
ES
tim
e F
EY
ES
YE
SY
ES
YE
SY
ES
Aid
dis
bu
r*(h
igh
-lo
w)
-2.2
85
1.6
78
2.7
37
-1.5
27
-1.6
24
p-v
alu
e.2
47
.49
7.2
88
0.5
54
.47
7
26
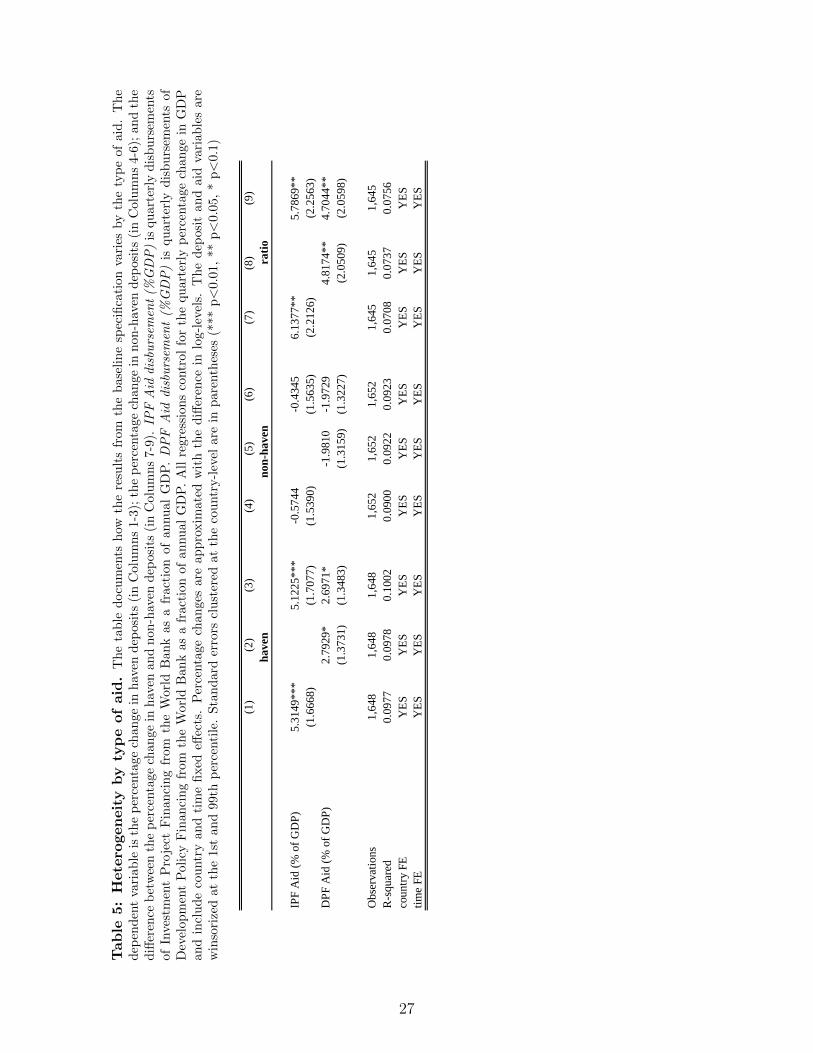
Table
5:Hetero
geneity
by
typeofaid.
Th
eta
ble
docu
men
tsh
owth
ere
sult
sfr
om
the
base
lin
esp
ecifi
cati
on
vari
esby
the
typ
eof
aid
.T
he
dep
end
ent
vari
able
isth
ep
erce
nta
gech
ange
inh
aven
dep
osi
ts(i
nC
olu
mn
s1-3
);th
ep
erce
nta
ge
chan
ge
innon
-hav
end
eposi
ts(i
nC
olu
mn
s4-6
);an
dth
ed
iffer
ence
bet
wee
nth
ep
erce
nta
gech
ange
inh
aven
an
dn
on
-hav
end
eposi
ts(i
nC
olu
mn
s7-9
).IP
FAid
disbursem
ent(%
GDP)
isqu
art
erly
dis
bu
rsem
ents
ofIn
vest
men
tP
roje
ctF
inan
cin
gfr
omth
eW
orld
Bank
as
afr
act
ion
of
an
nu
al
GD
P.DPF
Aid
disbursem
ent(%
GDP)
isqu
art
erly
dis
bu
rsem
ents
of
Dev
elop
men
tP
olic
yF
inan
cin
gfr
omth
eW
orld
Ban
kas
afr
act
ion
of
an
nu
al
GD
P.
All
regre
ssio
ns
contr
ol
for
the
qu
art
erly
per
centa
ge
chan
ge
inG
DP
and
incl
ud
eco
untr
yan
dti
me
fixed
effec
ts.
Per
centa
ge
chan
ges
are
ap
pro
xim
ate
dw
ith
the
diff
eren
cein
log-l
evel
s.T
he
dep
osi
tan
daid
vari
ab
les
are
win
sori
zed
atth
e1s
tan
d99
thp
erce
nti
le.
Sta
nd
ard
erro
rscl
ust
ered
at
the
cou
ntr
y-l
evel
are
inp
are
nth
eses
(***
p<
0.0
1,
**
p<
0.0
5,
*p<
0.1
)
(1)
(2)
(3)
(4)
(5)
(6)
(7)
(8)
(9)
IPF
Aid
(%
of
GD
P)
5.3
14
9*
**
5.1
22
5*
**
-0.5
74
4-0
.43
45
6.1
37
7*
*5
.78
69
**
(1.6
66
8)
(1.7
07
7)
(1.5
39
0)
(1.5
63
5)
(2.2
12
6)
(2.2
56
3)
DP
F A
id (
% o
f G
DP
)2
.79
29
*2
.69
71
*-1
.98
10
-1.9
72
94
.81
74
**
4.7
04
4*
*
(1.3
73
1)
(1.3
48
3)
(1.3
15
9)
(1.3
22
7)
(2.0
50
9)
(2.0
59
8)
Ob
serv
atio
ns
1,6
48
1,6
48
1,6
48
1,6
52
1,6
52
1,6
52
1,6
45
1,6
45
1,6
45
R-s
qu
ared
0.0
97
70
.09
78
0.1
00
20
.09
00
0.0
92
20
.09
23
0.0
70
80
.07
37
0.0
75
6
cou
ntr
y F
EY
ES
YE
SY
ES
YE
SY
ES
YE
SY
ES
YE
SY
ES
tim
e F
EY
ES
YE
SY
ES
YE
SY
ES
YE
SY
ES
YE
SY
ES
haven
non-h
aven
rati
o
27

Table
6:Covera
geofpublicdepositdata
.T
he
tab
lesh
ows
how
the
exte
nt
tow
hic
hto
tal
fore
ign
dep
osi
tsca
nb
eall
oca
ted
toin
div
idu
al
ban
kin
gce
nte
rsb
ased
onp
ub
licl
yav
aila
ble
dat
afr
om
the
BIS
Loca
tion
al
Ban
kin
gS
tati
stic
s.T
he
firs
tco
lum
nsh
ows
ou
rm
ain
sam
ple
of
22
hig
hly
aid
-dep
end
ent
cou
ntr
ies
wh
ile
the
seco
nd
colu
mn
show
sall
oth
erco
untr
ies
inth
ew
orl
dfo
rw
hic
hre
leva
nt
data
are
avail
ab
le.
Th
efi
rst
line
show
sth
ep
ub
licl
yav
aila
ble
stat
isti
cson
tota
ld
epos
its
by
cou
nte
rpart
cou
ntr
y.T
he
nex
tli
nes
show
the
fract
ion
of
this
tota
lca
nb
eall
oca
ted
tosp
ecifi
cb
an
kin
gce
nte
rs.
Th
eca
tego
ry”J
erse
y”
incl
ud
esJer
sey,
Gu
ern
sey
and
the
Isle
of
Man
.T
he
cate
gory
”O
ther
non
-hav
ens”
incl
ud
esA
ust
rali
a,
Bra
zil,
Den
mark
,F
inla
nd
,Ir
elan
d,
Jap
an,
Net
her
lan
ds,
Sw
eden
and
the
U.S
.T
he
cate
gory
”U
nall
oca
ted
”is
the
diff
eren
ceb
etw
een
100%
an
dth
esu
mof
the
per
centa
ges
abov
e.S
ourc
e:B
ank
for
Inte
rnat
ion
alS
ettl
emen
ts,
Loca
tion
al
Ban
kin
gS
tati
stic
s.
Hig
h A
idO
ther
Fore
ign d
eposi
ts200
17,0
97
Hav
en d
eposi
ts29%
22%
- S
wit
zerl
and
14%
9%
- L
uxem
bourg
3%
5%
- B
elgiu
m8%
5%
- J
erse
y e
tc.
5%
3%
Non-h
aven
dep
osi
ts56%
42%
Unal
loca
ted
15%
36%
28

Table
7:Resu
ltswith
publicdepositdata
.T
he
tab
lesh
ows
resu
lts
ob
tain
edw
ith
pu
bli
cly
avail
ab
led
eposi
td
ata
.T
he
dep
end
ent
vari
ab
leis
the
qu
arte
rly
per
centa
gech
ange
ind
epos
its
inall
hav
ens
wit
hp
ub
licl
yav
ail
ab
led
ata
(Colu
mn
1);
inall
non
-hav
ens
wit
hp
ub
licl
yav
ail
ab
led
ata
(Col
um
n2)
,in
allh
aven
sw
ith
pu
bli
cly
avai
lab
led
ata
over
an
dab
ove
the
chan
ge
inall
non
-hav
ens
wit
hp
ub
licl
yav
ail
ab
led
ata
(Colu
mn
3);
inin
div
idu
al
ban
kin
gce
nte
rsw
ith
pu
bli
cly
avai
lab
led
ata
(Colu
mn
s4-1
0).
Acr
oss
all
the
regre
ssio
ns,
the
exp
lan
ato
ryva
riab
leof
inte
rest
isqu
art
erly
dis
bu
rsem
ents
from
the
Wor
ldB
ank
asa
frac
tion
ofan
nu
alG
DP
.A
llre
gre
ssio
ns
contr
ol
for
the
qu
art
erly
per
centa
ge
chan
ge
inG
DP
(not
rep
ort
ed)
an
din
clu
de
cou
ntr
yan
dti
me
fixed
effec
ts.
Per
centa
gech
anges
are
ap
pro
xim
ate
dw
ith
the
diff
eren
cein
log-l
evel
s.T
he
dep
osi
tan
daid
vari
ab
les
are
win
sori
zed
at
the
1st
and
99th
per
centi
le(*
**p<
0.01
,**
p<
0.0
5,
*p<
0.1
)
(1)
(2)
(3)
(4)
(5)
(6)
(7)
(8)
(9)
(10
)(1
1)
hav
en
non-h
aven
rati
ohav
en
non-h
aven
rati
oS
wis
sL
ux
Bel
giu
mJe
rsey
etc
All
hav
en
Aid
(%
GD
P)
2.4
599*
-2.0
686
4.0
755**
2.3
821*
-2.4
209
4.6
067**
2.8
725*
2.7
165**
-1.0
347
-2.0
679
(1.3
198)
(1.2
631)
(1.5
999)
(1.3
295)
(1.4
551)
(1.7
131)
(1.5
627)
(1.1
969)
(0.7
264)
(2.0
260)
Aid
(%
GD
P)
× l
(pre
-2010)
2.4
143*
(1.3
702)
Aid
(%
GD
P)
× l
(post
-2010)
2.2
195
(2.0
202)
Obse
rvat
ions
1,6
69
1,6
45
1,6
41
2,3
45
2,3
19
2,3
15
2,3
34
1,7
96
2,0
75
1,3
04
2,3
45
R-s
quar
ed0.1
138
0.0
855
0.0
746
0.1
021
0.0
841
0.0
743
0.0
812
0.0
873
0.0
828
0.0
808
0.1
021
countr
y F
EY
ES
YE
SY
ES
YE
SY
ES
YE
SY
ES
YE
SY
ES
YE
SY
ES
tim
e F
EY
ES
YE
SY
ES
YE
SY
ES
YE
SY
ES
YE
SY
ES
YE
SY
ES
Vali
dati
on
(1990-2
010)
Lon
ger t
ime p
erio
d (
1990-2
018)
Hete
rogen
eity
by
haven
an
d p
erio
d
29
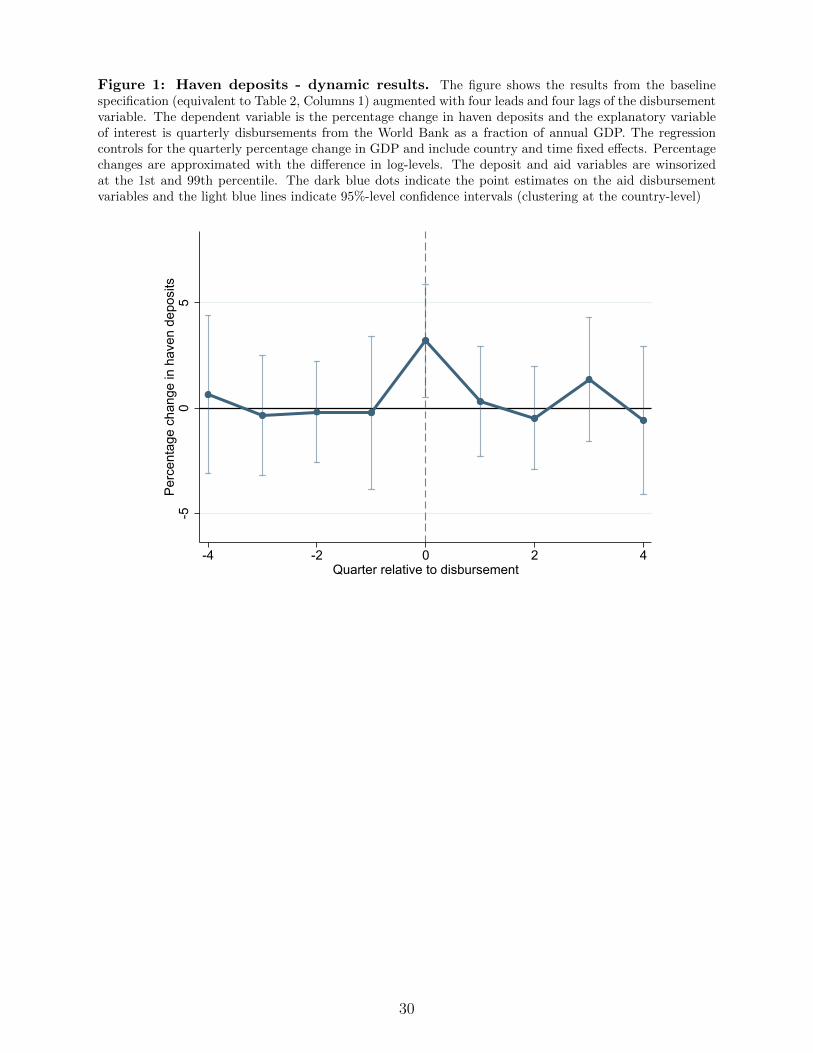
Figure 1: Haven deposits - dynamic results. The figure shows the results from the baselinespecification (equivalent to Table 2, Columns 1) augmented with four leads and four lags of the disbursementvariable. The dependent variable is the percentage change in haven deposits and the explanatory variableof interest is quarterly disbursements from the World Bank as a fraction of annual GDP. The regressioncontrols for the quarterly percentage change in GDP and include country and time fixed effects. Percentagechanges are approximated with the difference in log-levels. The deposit and aid variables are winsorizedat the 1st and 99th percentile. The dark blue dots indicate the point estimates on the aid disbursementvariables and the light blue lines indicate 95%-level confidence intervals (clustering at the country-level)
-50
5Pe
rcen
tage
cha
nge
in h
aven
dep
osits
-4 -2 0 2 4Quarter relative to disbursement
30

Figure 2: Non-haven deposits - dynamic results. The figure shows the results from the baselinespecification (equivalent to Table 2, Columns 2) augmented with four leads and four lags of the disbursementvariable. The dependent variable is the percentage change in non-haven deposits and the explanatoryvariable of interest is quarterly disbursements from the World Bank as a fraction of annual GDP. Theregression controls for the quarterly percentage change in GDP and include country and time fixed effects.Percentage changes are approximated with the difference in log-levels. The deposit and aid variables arewinsorized at the 1st and 99th percentile. The dark blue dots indicate the point estimates on the aiddisbursement variables and the light blue lines indicate 95%-level confidence intervals (clustering at thecountry-level)
-50
5Pe
rcen
tage
cha
nge
in n
on-h
aven
dep
osits
-4 -2 0 2 4Quarter relative to disbursement
31

Figure 3: Haven deposits relative to non-haven deposits - dynamic results. The figureshows the results from the baseline specification (equivalent to Table 2, Columns 3) augmented with fourleads and four lags of the disbursement variable. The dependent variable is the percentage change in havendeposits over and above the percentage change in non-haven deposits and the explanatory variable of interestis quarterly disbursements from the World Bank as a fraction of annual GDP. The regression controls forthe quarterly percentage change in GDP and include country and time fixed effects. Percentage changesare approximated with the difference in log-levels. The deposit and aid variables are winsorized at the 1stand 99th percentile. The dark blue dots indicate the point estimates on the aid disbursement variables andthe light blue lines indicate 95%-level confidence intervals (clustering at the country-level)
-50
5Pe
rcen
tage
cha
nge
in h
aven
to n
on-h
aven
ratio
-4 -2 0 2 4Quarter relative to disbursement
32
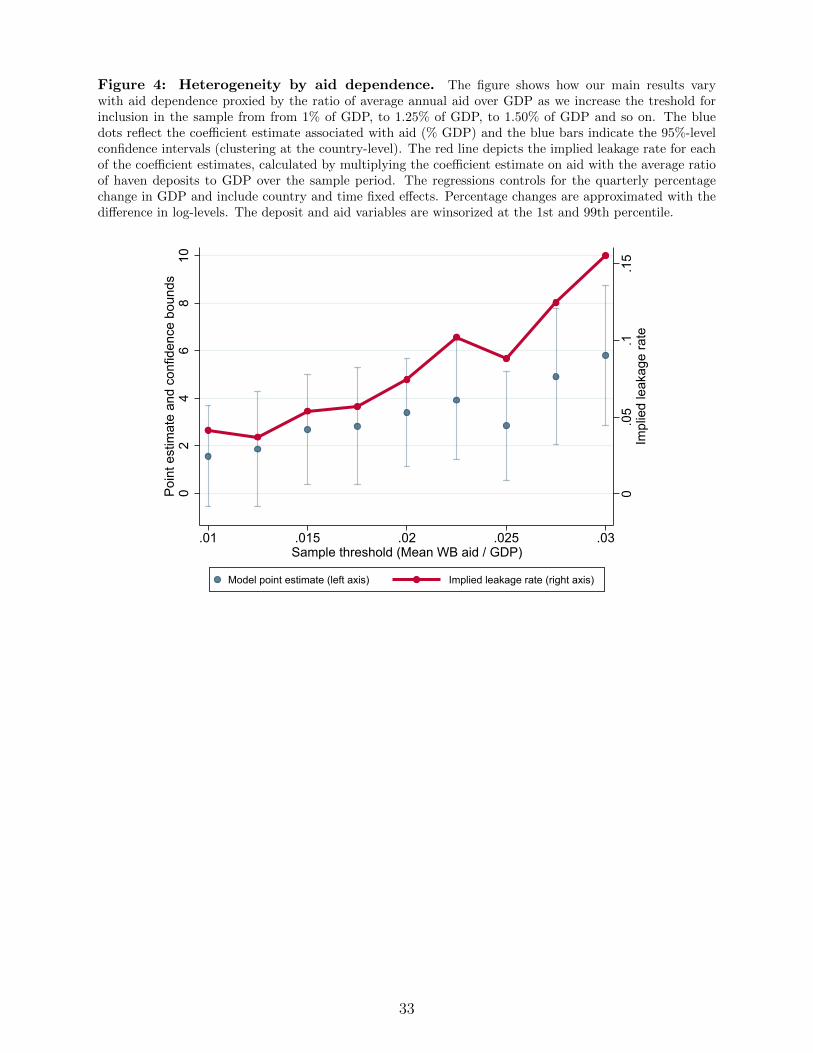
Figure 4: Heterogeneity by aid dependence. The figure shows how our main results varywith aid dependence proxied by the ratio of average annual aid over GDP as we increase the treshold forinclusion in the sample from from 1% of GDP, to 1.25% of GDP, to 1.50% of GDP and so on. The bluedots reflect the coefficient estimate associated with aid (% GDP) and the blue bars indicate the 95%-levelconfidence intervals (clustering at the country-level). The red line depicts the implied leakage rate for eachof the coefficient estimates, calculated by multiplying the coefficient estimate on aid with the average ratioof haven deposits to GDP over the sample period. The regressions controls for the quarterly percentagechange in GDP and include country and time fixed effects. Percentage changes are approximated with thedifference in log-levels. The deposit and aid variables are winsorized at the 1st and 99th percentile.
0.0
5.1
.15
Impl
ied
leak
age
rate
02
46
810
Poin
t est
imat
e an
d co
nfid
ence
bou
nds
.01 .015 .02 .025 .03Sample threshold (Mean WB aid / GDP)
Model point estimate (left axis) Implied leakage rate (right axis)
33
ONLINE
APPENDIX
34
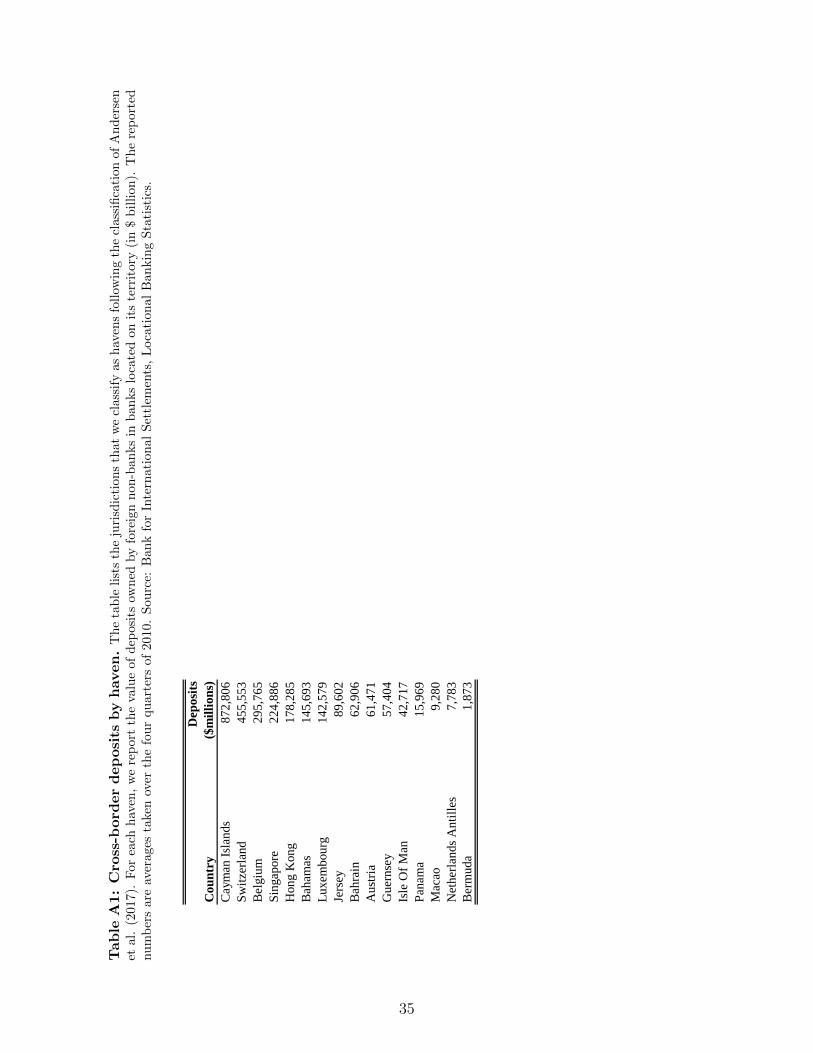
Table
A1:Cro
ss-b
ord
erdeposits
byhaven.
Th
eta
ble
list
sth
eju
risd
icti
on
sth
at
we
class
ify
as
hav
ens
foll
owin
gth
ecl
ass
ifica
tion
of
An
der
sen
etal
.(2
017)
.F
orea
chh
aven
,w
ere
por
tth
eva
lue
of
dep
osi
tsow
ned
by
fore
ign
non
-ban
ks
inban
ks
loca
ted
on
its
terr
itory
(in
$b
illi
on
).T
he
rep
ort
ednu
mb
ers
are
aver
ages
take
nov
erth
efo
ur
qu
arte
rsof
2010.
Sou
rce:
Ban
kfo
rIn
tern
ati
on
al
Set
tlem
ents
,L
oca
tion
al
Ban
kin
gS
tati
stic
s.
Cou
ntr
y
Dep
osi
ts
($m
illi
on
s)
Cay
man
Isl
ands
872,8
06
Sw
itze
rlan
d455,5
53
Bel
giu
m295,7
65
Sin
gap
ore
224,8
86
Hong K
ong
178,2
85
Bah
amas
145,6
93
Luxem
bourg
142,5
79
Jers
ey89,6
02
Bah
rain
62,9
06
Aust
ria
61,4
71
Guer
nse
y57,4
04
Isle
Of
Man
42,7
17
Pan
ama
15,9
69
Mac
ao9,2
80
Net
her
lands
Anti
lles
7,7
83
Ber
muda
1,8
73
35

Table
A2:Descriptivestatisticsofevents.
Th
eta
ble
show
sd
escr
ipti
vest
ati
stic
sfo
ra
nu
mb
erof
even
tva
riab
les
that
may
con
fou
nd
ou
ran
alysi
sfo
rth
e19
hig
hly
aid-d
epen
den
tco
untr
ies
inou
rm
ain
sam
ple
.War
ind
icate
sw
het
her
at
least
one
war
bet
wee
nth
egov
ern
men
tof
ast
ate
and
atle
ast
one
oth
erp
arty
has
resu
lted
inle
ast
1000
batt
le-r
elate
dd
eath
sw
ith
ina
cale
nd
ar
year
(sou
rce:
PR
IOA
rmed
Con
flic
tD
ata
set)
.Coup
ind
icat
esw
het
her
atle
ast
one
cou
pat
tem
pt
(eit
her
fail
edor
succ
essf
ul)
has
take
np
lace
ina
giv
enqu
art
er(s
ou
rce:
Pow
ell
an
dT
hyn
e,2011).
Disaster
ind
icat
esw
het
her
an
atura
ld
isas
ter
wit
hto
tal
dam
ages
exce
edin
g1%
of
GD
Ph
as
taken
pla
cew
ith
inth
eca
len
dar
yea
r(s
ou
rce:
EM
-DA
T).
Crisis
ind
icat
esw
het
her
one
ofth
efo
llow
ing
typ
esof
fin
an
cial
cris
esh
ave
take
np
lace
wit
hin
the
cale
nd
arye
ar:
syst
emic
ban
kin
gcr
isis
,cu
rren
cycr
isis
,so
vere
ign
deb
tcr
isis
and
sove
reig
nd
ebt
rest
ruct
uri
ng
(sou
rce:
Laev
enan
dV
ale
nci
a,
2012).
Oil
ind
icate
sw
het
her
the
cou
ntr
yis
pro
du
cin
goil
inth
ese
nse
that
oil
rents
are
pos
itiv
ein
any
year
inth
esa
mp
lep
erio
d(s
ou
rce:
Worl
dD
evel
op
men
tIn
dic
ato
rs).
Controlovercorruption
com
esfr
om
the
Wor
ldG
over
nan
ceIn
dic
ator
s.Disclosure
Rules
isa
bin
ary
ind
icato
ras
tow
het
her
poli
tici
an
sare
requ
ired
tod
iscl
ose
thei
rass
ets
(fro
mD
jan
kov
etal.
,20
10).
Capitalaccountopenness
com
esfr
omC
hin
an
dIt
o(2
006).
FinancialSectorDevelopmen
tis
mea
sure
das
dom
esti
ccr
edit
over
GD
Pfr
om
the
Wor
ldD
evel
opm
ent
Ind
icat
ors.
Polity
isa
mea
sure
of
dem
ocr
acy
take
nfr
om
the
Poli
tyIV
pro
ject
.
War
Co
up
Dis
aste
r
Fin
anci
al
Cri
sis
Oil
Pro
du
cer
Co
ntr
ol
over
Co
rru
pti
on
Dis
clo
sure
rule
s
Cap
ital
acco
un
t
op
enn
ess
Fin
anci
al
sect
or
dev
elo
pm
ent
Po
lity
Afg
han
ista
n1
00
.0%
0.0
%1
00
.0%
0.0
%1
-1.5
50
.2
.05
.
Arm
enia
0.0
%0
.0%
0.0
%0
.0%
0-0
.58
12
.11
16
.15
4.0
5
Bu
rkin
a F
aso
0.0
%0
.0%
0.0
%0
.0%
0-0
.27
0-0
.90
12
.61
-2.4
8
Bu
run
di
57
.1%
6.0
%5
7.1
%6
.0%
0-1
.12
0-1
.40
22
.43
0.7
6
Eri
trea
11
.6%
0.0
%1
1.6
%0
.0%
0-0
.28
0-1
.26
11
6.3
7-6
.58
Eth
iop
ia3
8.1
%0
.0%
38
.1%
0.0
%0
-0.6
60
-1.2
74
1.1
3-0
.67
Gh
ana
0.0
%0
.0%
0.0
%0
.0%
1-0
.12
1-1
.27
26
.70
3.2
9
Gu
inea
-Bis
sau
4.8
%7
.1%
4.8
%7
.1%
0-1
.13
0-1
.28
7.8
02
.19
Gu
yan
a0
.0%
0.0
%0
.0%
0.0
%0
-0.5
51
1.2
41
11
.69
4.7
6
Kyrg
yz
Rep
ub
lic
0.0
%0
.0%
0.0
%0
.0%
1-1
.01
11
.37
14
.13
-1.0
3
Mad
agas
car
0.0
%3
.6%
0.0
%3
.6%
1-0
.25
1-0
.52
16
.47
6.0
0
Mal
awi
0.0
%0
.0%
0.0
%0
.0%
0-0
.54
0-1
.32
16
.37
2.9
5
Mal
i9
.5%
2.4
%9
.5%
2.4
%0
-0.5
70
-0.9
01
3.7
65
.76
Mau
rita
nia
0.0
%3
.6%
0.0
%3
.6%
1-0
.46
0-1
.19
40
.37
-4.9
5
Mo
zam
biq
ue
14
.3%
0.0
%1
4.3
%0
.0%
1-0
.52
0-1
.30
8.1
42
.86
Nig
er0
.0%
3.6
%0
.0%
3.6
%1
-0.7
90
-0.8
41
0.4
73
.00
Rw
and
a4
2.9
%1
.2%
42
.9%
1.2
%0
-0.0
51
-1.0
91
2.0
6-4
.81
Sao
To
me
and
Pri
nci
pe
0.0
%2
.5%
0.0
%2
.5%
0-0
.40
10
.76
0.0
2.
Sie
rra
Leo
ne
42
.9%
6.0
%4
2.9
%6
.0%
0-0
.89
0-1
.26
34
.06
0.8
6
Tan
zan
ia0
.0%
0.0
%0
.0%
0.0
%0
-0.6
81
-1.1
61
3.6
4-2
.05
Ugan
da
57
.1%
0.0
%5
7.1
%0
.0%
0-0
.88
11
.08
9.5
7-3
.57
Zam
bia
0.0
%2
.4%
0.0
%2
.4%
0-0
.63
01
.02
36
.66
3.9
0
Sam
ple
mea
n1
5.6
%1
.8%
15
.6%
1.8
%0
.31
-0.6
10
.40
-0.5
32
6.8
30
.77
36

Table
A3:Altern
ativehighaid
disbursementmeasu
res.
Th
eta
ble
show
sh
owou
rm
ain
resu
lts
wh
enu
sin
gd
um
my
mea
sure
sfo
rh
igh
aid
dis
bu
rsem
ents
(pre
sente
din
colu
mn
s4-
6in
Tab
le2)
chan
ge
wh
enu
sin
galt
ern
ati
ve
tres
hh
old
sto
mea
sure
hig
haid
dis
bu
rsem
ents
.T
he
sam
ple
com
pri
ses
22co
untr
ies
wit
hav
erag
ean
nu
ald
isb
urs
emen
tsfr
om
the
Worl
dB
an
kex
ceed
ing
2%
of
GD
P.
Th
esa
mp
lep
erio
dis
1990-2
010
an
dth
efr
equ
ency
isqu
arte
rly.
Inco
lum
ns
1-4
the
dep
end
ent
vari
able
isth
ep
erce
nta
ge
chan
ge
inh
aven
dep
osi
ts,
win
sori
zed
at
the
1st
an
d99th
per
centi
le;i
nco
lum
ns
5-8
itis
the
diff
eren
ceb
etw
een
the
per
centa
gech
ange
inh
aven
an
dn
on
-hav
end
eposi
ts,
win
sori
zed
at
the
1st
an
d99th
per
centi
le.
All
regre
ssio
ns
contr
ol
for
qu
arte
rly
GD
Pgr
owth
(not
incl
ud
edin
the
tab
le).
CountryFE
isa
vect
or
of
cou
ntr
yfi
xed
effec
ts.Tim
eFE
isa
vect
or
of
tim
efi
xed
effec
ts.
All
per
centa
gech
ange
sar
eap
pro
xim
ated
wit
hth
ed
iffer
ence
inlo
g-l
evel
s.S
tan
dard
erro
rscl
ust
ered
at
the
cou
ntr
y-l
evel
are
pre
sente
din
pare
nth
eses
(***
p<
0.01
,**
p<
0.05
,*
p<
0.1)
(1)
(2)
(3)
(4)
(5)
(6)
(7)
(8)
Aid
dis
b >
1%
of
GD
P0.0
183
0.0
532**
(0.0
159)
(0.0
198)
Aid
dis
b >
1.5
% o
f G
DP
0.0
584**
0.1
034***
(0.0
233)
(0.0
348)
Aid
dis
b >
2.0
% o
f G
DP
0.1
008***
0.1
380
***
(0.0
322)
(0.0
432)
Aid
dis
b >
2.5
% o
f G
DP
0.1
550**
0.1
555*
(0.0
549)
(0.0
75
7)
Obse
rvat
ions
1,6
48
1,6
48
1,6
48
1,6
48
1,6
45
1,6
45
1,6
45
1,6
45
R-s
quar
ed0.0
958
0.0
991
0.1
013
0.1
025
0.0
722
0.0
765
0.0
759
0.0
733
Kle
iber
gen
-Paa
p r
k W
ald-F
N/A
N/A
N/A
N/A
N/A
N/A
N/A
N/A
countr
y F
EY
ES
YE
SY
ES
YE
SY
ES
YE
SY
ES
YE
S
tim
e F
EY
ES
YE
SY
ES
YE
SY
ES
YE
SY
ES
YE
S
# e
ven
ts751
354
178
97
751
354
178
97
haven
srati
o
37
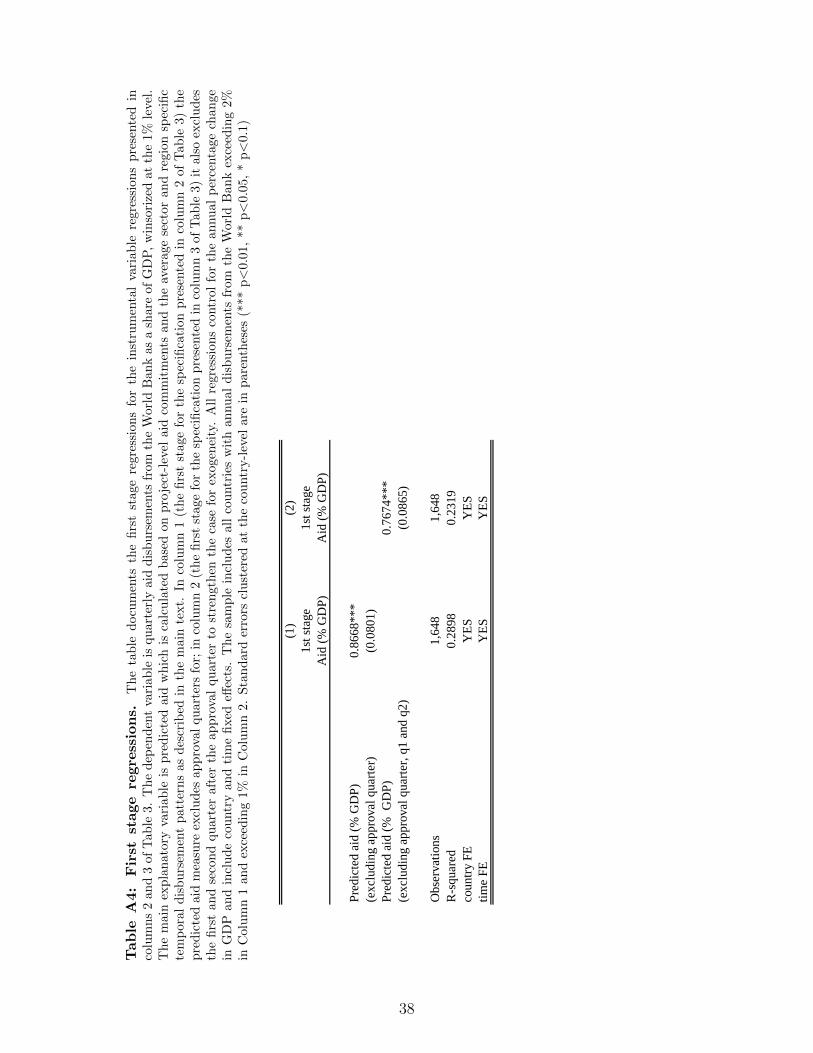
Table
A4:
First
stage
regre
ssions.
Th
eta
ble
docu
men
tsth
efi
rst
stage
regre
ssio
ns
for
the
inst
rum
enta
lva
riab
lere
gre
ssio
ns
pre
sente
din
colu
mn
s2
and
3of
Tab
le3.
Th
ed
epen
den
tva
riab
leis
qu
art
erly
aid
dis
bu
rsem
ents
from
the
Worl
dB
an
kas
ash
are
of
GD
P,
win
sori
zed
at
the
1%
leve
l.T
he
mai
nex
pla
nat
ory
vari
able
isp
red
icte
dai
dw
hic
his
calc
ula
ted
base
don
pro
ject
-lev
elaid
com
mit
men
tsan
dth
eav
erage
sect
or
an
dre
gio
nsp
ecifi
cte
mp
oral
dis
burs
emen
tp
atte
rns
asd
escr
ibed
inth
em
ain
text.
Inco
lum
n1
(the
firs
tst
age
for
the
spec
ifica
tion
pre
sente
din
colu
mn
2of
Tab
le3)
the
pre
dic
ted
aid
mea
sure
excl
ud
esap
pro
val
quar
ters
for;
inco
lum
n2
(th
efi
rst
stage
for
the
spec
ifica
tion
pre
sente
din
colu
mn
3of
Tab
le3)
itals
oex
clu
des
the
firs
tan
dse
con
dqu
arte
raf
ter
the
app
rova
lqu
art
erto
stre
ngth
enth
eca
sefo
rex
ogen
eity
.A
llre
gre
ssio
ns
contr
ol
for
the
an
nu
al
per
centa
ge
chan
ge
inG
DP
and
incl
ud
eco
untr
yan
dti
me
fixed
effec
ts.
Th
esa
mp
lein
clu
des
all
cou
ntr
ies
wit
han
nu
al
dis
bu
rsem
ents
from
the
Worl
dB
an
kex
ceed
ing
2%
inC
olu
mn
1an
dex
ceed
ing
1%in
Col
um
n2.
Sta
nd
ard
erro
rscl
ust
ered
at
the
cou
ntr
y-l
evel
are
inp
are
nth
eses
(***
p<
0.0
1,
**
p<
0.0
5,
*p<
0.1
)
(1)
(2)
1st
sta
ge
1st
sta
ge
Aid
(%
GD
P)
Aid
(%
GD
P)
Pre
dic
ted a
id (
% G
DP
)0.8
668***
(excl
udin
g a
ppro
val
quar
ter)
(0.0
801)
Pre
dic
ted a
id (
%
GD
P)
0.7
674***
(excl
udin
g a
ppro
val
quar
ter,
q1 a
nd q
2)
(0.0
865)
Obse
rvat
ions
1,6
48
1,6
48
R-s
quar
ed0.2
898
0.2
319
countr
y F
EY
ES
YE
S
tim
e F
EY
ES
YE
S
38

Table
A5:Cro
wding-in
ofnon-W
Bfore
ign
aid.
Th
eta
ble
docu
men
tsh
owaid
dis
bu
rsem
ents
from
the
Worl
dB
an
kco
rrel
ate
sw
ith
aid
from
oth
erso
urc
es.
Th
ere
sult
sar
eth
ees
tim
ated
coeffi
cien
tsfr
om
ap
an
elre
gre
ssio
nfo
rth
esa
mp
lep
erio
d1990-2
010
at
the
an
nu
al
freq
uen
cy.
Th
em
ain
exp
lan
ator
yva
riab
leis
annu
ald
isb
urs
emen
tsfr
om
the
Worl
dB
an
k(m
easu
red
as
the
sum
of
the
qu
art
erly
dis
bu
rsem
ents
that
ente
rou
rm
ain
regr
essi
ons)
.T
he
dep
end
ent
vari
able
isai
dfr
omoth
erso
urc
esth
an
the
Worl
dB
an
k(m
easu
red
as
Offi
cial
Dev
elopm
ent
Ass
ista
nce
net
of
dis
bu
rsem
ents
from
the
Wor
ldB
ank)
asa
frac
tion
ofG
DP
.B
oth
aid
vari
ab
les
are
win
sori
zed
at
the
1st
an
d99th
per
centi
le.
Both
regre
ssio
ns
contr
ol
for
the
an
nu
al
per
centa
gech
ange
inG
DP
and
incl
ud
eco
untr
yan
dti
me
fixed
effec
ts.
Th
esa
mp
lein
clu
des
all
cou
ntr
ies
wit
han
nu
al
dis
bu
rsem
ents
from
the
Worl
dB
ank
exce
edin
g2%
inC
olu
mn
1an
dex
ceed
ing
1%
inC
olu
mn
2.
Sta
nd
ard
erro
rscl
ust
ered
at
the
cou
ntr
y-l
evel
are
inp
are
nth
eses
(***
p<
0.0
1,
**
p<
0.05
,*
p<
0.1)
(1)
(2)
Sam
ple
WB
aid
> 2
%W
B a
id >
1%
Annual
non W
B a
id (
%
of
GD
P)
Annual
non W
B a
id (
%
of
GD
P)
Annual
WB
aid
(%
of
GD
P)
-0.0
53
8-0
.12
78
(0.3
85
0)
(0.2
61
0)
Annual
GD
P (
% g
row
th)
-0.0
47
6*
-0.0
23
6
(0.0
23
5)
(0.0
19
1)
Ob
serv
atio
ns
42
59
10
R-s
quar
ed0
.60
81
0.5
41
4
countr
y F
EY
ES
YE
S
tim
e F
EY
ES
YE
S
39
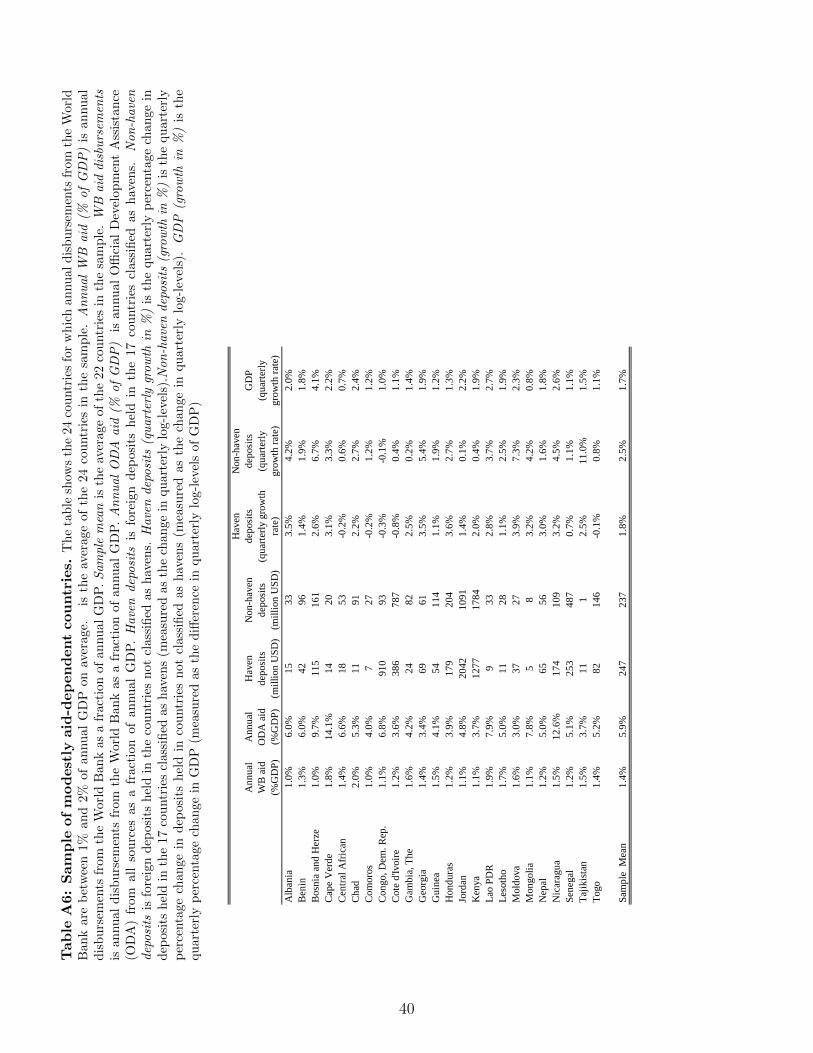
Table
A6:Sample
ofmodestly
aid-d
ependentcountries.
Th
eta
ble
show
sth
e24
cou
ntr
ies
for
wh
ich
an
nuald
isb
urs
emen
tsfr
om
the
Worl
dB
ank
are
bet
wee
n1%
and
2%of
annu
alG
DP
onav
erage.
isth
eav
erage
of
the
24
cou
ntr
ies
inth
esa
mp
le.AnnualWB
aid
(%ofGDP)
isan
nu
al
dis
bu
rsem
ents
from
the
Wor
ldB
ank
asa
frac
tion
of
an
nu
al
GD
P.Sample
mean
isth
eav
erage
of
the
22
countr
ies
inth
esa
mp
le.WB
aid
disbursem
ents
isan
nu
ald
isb
urs
emen
tsfr
omth
eW
orld
Ban
kas
afr
act
ion
of
an
nual
GD
P.AnnualODA
aid
(%ofGDP)
isan
nu
al
Offi
cial
Dev
elop
men
tA
ssis
tan
ce(O
DA
)fr
omal
lso
urc
esas
afr
acti
onof
annu
alG
DP
.Haven
deposits
isfo
reig
nd
eposi
tsh
eld
inth
e17
cou
ntr
ies
class
ified
as
hav
ens.
Non-haven
deposits
isfo
reig
nd
epos
its
hel
din
the
cou
ntr
ies
not
class
ified
as
hav
ens.
Havendeposits
(quarterly
growth
in%)
isth
equ
art
erly
per
centa
ge
chan
ge
ind
epos
its
hel
din
the
17co
untr
ies
clas
sifi
edas
hav
ens
(mea
sure
das
the
chan
ge
inqu
art
erly
log-l
evel
s).N
on-havendeposits
(growth
in%)
isth
equ
art
erly
per
centa
gech
ange
ind
epos
its
hel
din
cou
ntr
ies
not
class
ified
as
hav
ens
(mea
sure
das
the
chan
ge
inquart
erly
log-l
evel
s).GDP
(growth
in%)
isth
equ
arte
rly
per
centa
gech
ange
inG
DP
(mea
sure
das
the
diff
eren
cein
qu
art
erly
log-l
evel
sof
GD
P)
An
nu
al
WB
aid
(%G
DP
)
An
nu
al
OD
A a
id
(%G
DP
)
Hav
en
dep
osi
ts
(mil
lion
US
D)
Non
-hav
en
dep
osi
ts
(mil
lion
US
D)
Hav
en
dep
osi
ts
(qu
arte
rly g
row
th
rate
)
Non
-hav
en
dep
osi
ts
(qu
arte
rly
gro
wth
rat
e)
GD
P
(qu
arte
rly
gro
wth
rat
e)
Alb
ania
1.0
%6
.0%
15
33
3.5
%4
.2%
2.0
%
Ben
in1
.3%
6.0
%4
29
61
.4%
1.9
%1
.8%
Bosn
ia a
nd
Her
ze1
.0%
9.7
%1
15
16
12
.6%
6.7
%4
.1%
Cap
e V
erd
e1
.8%
14
.1%
14
20
3.1
%3
.3%
2.2
%
Cen
tral
Afr
ican
1.4
%6
.6%
18
53
-0.2
%0
.6%
0.7
%
Ch
ad2
.0%
5.3
%1
19
12
.2%
2.7
%2
.4%
Com
oro
s1
.0%
4.0
%7
27
-0.2
%1
.2%
1.2
%
Con
go,
Dem
. R
ep.
1.1
%6
.8%
91
09
3-0
.3%
-0.1
%1
.0%
Cote
d'Ivoir
e1
.2%
3.6
%3
86
78
7-0
.8%
0.4
%1
.1%
Gam
bia
, T
he
1.6
%4
.2%
24
82
2.5
%0
.2%
1.4
%
Geo
rgia
1.4
%3
.4%
69
61
3.5
%5
.4%
1.9
%
Gu
inea
1.5
%4
.1%
54
11
41
.1%
1.9
%1
.2%
Hon
du
ras
1.2
%3
.9%
17
92
04
3.6
%2
.7%
1.3
%
Jord
an1
.1%
4.8
%2
04
21
09
11
.4%
0.1
%2
.2%
Ken
ya
1.1
%3
.7%
12
77
17
84
2.0
%0
.4%
1.9
%
Lao
PD
R1
.9%
7.9
%9
33
2.8
%3
.7%
2.7
%
Les
oth
o1
.7%
5.0
%1
12
81
.1%
2.5
%1
.9%
Mold
ova
1.6
%3
.0%
37
27
3.9
%7
.3%
2.3
%
Mon
goli
a1
.1%
7.8
%5
83
.2%
4.2
%0
.8%
Nep
al1
.2%
5.0
%6
55
63
.0%
1.6
%1
.8%
Nic
arag
ua
1.5
%1
2.6
%1
74
10
93
.2%
4.5
%2
.6%
Sen
egal
1.2
%5
.1%
25
34
87
0.7
%1
.1%
1.1
%
Taj
ikis
tan
1.5
%3
.7%
11
12
.5%
11
.0%
1.5
%
Togo
1.4
%5
.2%
82
14
6-0
.1%
0.8
%1
.1%
Sam
ple
M
ean
1.4
%5
.9%
24
72
37
1.8
%2
.5%
1.7
%
40

Figure A1: Distribution of haven deposit growth rates. The figure shows the distributionof percentage changes in haven deposits (approximated with the difference in log-levels). The variable iswinsorized at the 1st and 99th percentile.
010
020
030
040
0Fr
eque
ncy
-1 -.5 0 .5 1 1.5Change in haven deposits (in log-levels)
Figure A2: Distribution of aid disbursements. The figure shows the distribution of quarterly aiddisbursements measured relative to annual GDP. The variable is winsorized at the 1st and 99th percentile.
050
100
150
200
250
Freq
uenc
y
0 .01 .02 .03 .04World Bank aid (relative to GDP)
41

Figure A3: Dynamic results with alternative disbursement measure. The figure showsthe results from the baseline specification where the disbursement variable is an indicator of quarterlydisbursements exceeding 2% of annual GDP. (equivalent to Table 2, Columns 4-6) augmented with fourleads and four lags of the disbursement variable. The dependent variable is the percentage change in havendeposits (Panel A) the percentage change in non-haven deposits (Panel B) the percentage change in havendeposits over and above the percentage change in non-haven deposits (Panel C). The regression controls forthe quarterly percentage change in GDP and include country and time fixed effects. Percentage changesare approximated with the difference in log-levels. The deposit and aid variables are winsorized at the 1stand 99th percentile. The dark blue dots indicate the point estimates on the aid disbursement variables andthe light blue lines indicate 95%-level confidence intervals (clustering at the country-level)
-.2-.1
0.1
.2Pe
rcen
tage
cha
nge
in h
aven
dep
osits
-4 -2 0 2 4Quarter relative to disbursement
A: Haven deposits
-.2-.1
0.1
.2
-4 -2 0 2 4Quarter relative to disbursement
B: Nonhaven deposits
-.2-.1
0.1
.2
-4 -2 0 2 4Quarter relative to disbursement
C: Haven relative to Nonhaven
42

Figure A4: First stage of the IV estimation. The figure shows an added-variable plot correspond-ing to the first stage of the IV estimations presented in columns 2 and 3 in Table 3. It plots the residual ofthe instrument predicted aid disbursements as a share of GDP excluding respectively, the approval quarterand an additional two quarters, regressed on the set of exogenous variables (i.e. GDP growth, country andtime fixed effects) plotted against the residual of aid disbursements from the World Bank regressed on thesame set of variables
-.01
0.0
1.0
2.0
3ai
d (re
sidu
aliz
ed)
-.01 0 .01 .02instrument (residualized)
coef = .87, se = .08
-.01
0.0
1.0
2.0
3ai
d (re
sidu
aliz
ed)
-.01 -.005 0 .005 .01instrument (residualized)
coef = .77, se = .09
43