Embed Size (px)
Citation preview
ESDM untuk Kesejahteraan Rakyat
MNISTRY OF ENERGY AND MINERAL RESOURCES
DIRECTORATE GENERAL OF ELECTRICITY
THE POLICY AND MEASURES FOR IMPROVING
ENERGY MIX AND BARRIERS TO BE SOLVED
Tokyo – Japan, September 2012
PRESENTATION OF GROUP E – ON ENERGY MIX REPORT 1. MR. S U R Y O U T O M O , ST., MT. (CHIEF) 2. MR. A G U N G S U L I S T I Y O, ST., MT. 3. MR. M I L A N M. N A I N G G O L A N, S.Si 4. MR. S Y A R I F U D D I N A C H M A D, SE.

ESDM untuk Kesejahteraan Rakyat
TABLE OF CONTENTS
I. ENERGY MIX FOR POWER PLANT 3
II. ENERGY MIX ENERGY MIX REALIZATION AND TARGET YEAR
2008 – 2015 (CONSOLIDATION) 6
III. LIST OF POWER PLANT – FAST TRACK PHASE II (MEMR
REGULATION NO: 01 YEAR 2012) 9
IV. THE REALIZATION OF THE PRIMARY ENERGY CONSUMPTION
UNTIL MAY 2012
1
1
V. THE ISSUES AND PROPOSED OF SOLVING PROBLEMS
1
3
APPENDIX
1
6

ESDM untuk Kesejahteraan Rakyat
I. ENERGY MIX DEVELOPMENT AND TARGET FROM YEAR 2008 to
2012 (CONSOLIDATION)
ESDM untuk Kesejahteraan Rakyat
0%
20%
40%
60%
80%
100%
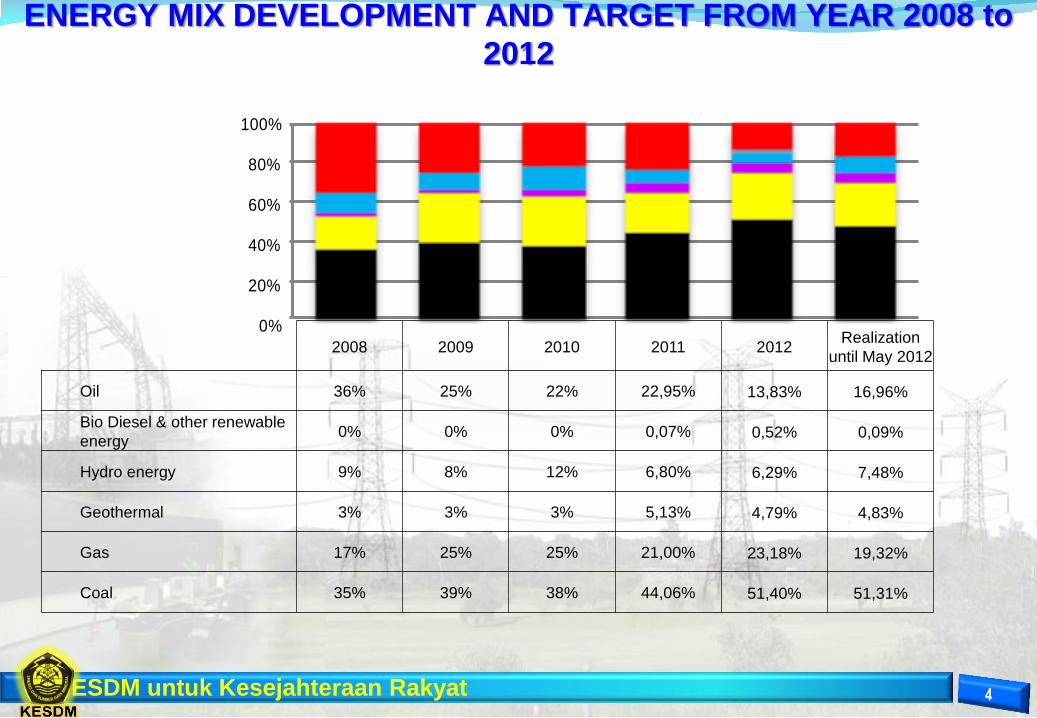
ENERGY MIX DEVELOPMENT AND TARGET FROM YEAR 2008 to
2012
2008 2009 2010 2011 2012 Realization
until May 2012
Oil 36% 25% 22% 22,95% 13,83% 16,96%
Bio Diesel & other renewable
energy 0% 0% 0% 0,07% 0,52% 0,09%
Hydro energy 9% 8% 12% 6,80% 6,29% 7,48%
Geothermal 3% 3% 3% 5,13% 4,79% 4,83%
Gas 17% 25% 25% 21,00% 23,18% 19,32%
Coal 35% 39% 38% 44,06% 51,40% 51,31%
ESDM untuk Kesejahteraan Rakyat
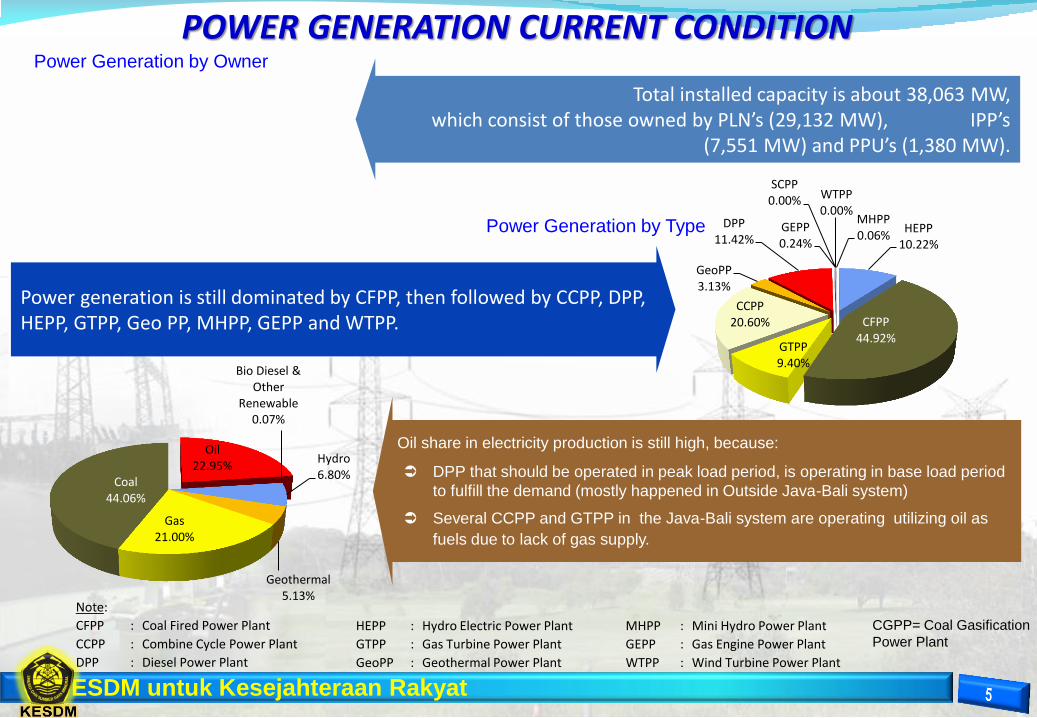
HEPP 10.22%
CFPP 44.92%
GTPP 9.40%
CCPP 20.60%
GeoPP 3.13%
DPP 11.42%
GEPP 0.24%
SCPP 0.00% WTPP
0.00% MHPP 0.06%
Oil share in electricity production is still high, because:
DPP that should be operated in peak load period, is operating in base load period
to fulfill the demand (mostly happened in Outside Java-Bali system)
Several CCPP and GTPP in the Java-Bali system are operating utilizing oil as
fuels due to lack of gas supply.
Total installed capacity is about 38,063 MW, which consist of those owned by PLN’s (29,132 MW), IPP’s
(7,551 MW) and PPU’s (1,380 MW).
POWER GENERATION CURRENT CONDITION Power Generation by Owner
Power Generation by Type
Power generation is still dominated by CFPP, then followed by CCPP, DPP, HEPP, GTPP, Geo PP, MHPP, GEPP and WTPP.
Note:
CFPP : Coal Fired Power Plant
CCPP : Combine Cycle Power Plant
DPP : Diesel Power Plant
HEPP : Hydro Electric Power Plant
GTPP : Gas Turbine Power Plant
GeoPP : Geothermal Power Plant
MHPP : Mini Hydro Power Plant
GEPP : Gas Engine Power Plant
WTPP : Wind Turbine Power Plant
CGPP= Coal Gasification
Power Plant
Oil 22.95%
Bio Diesel & Other
Renewable 0.07%
Hydro 6.80%
Geothermal 5.13%
Gas 21.00%
Coal 44.06%

ESDM untuk Kesejahteraan Rakyat
II. ENERGY MIX ENERGY MIX REALIZATION AND TARGET YEAR
2008 – 2015 (CONSOLIDATION)

ESDM untuk Kesejahteraan Rakyat
ENERGY MIX REALIZATION AND TARGET YEAR 2008 –
2015
2008 2009 2010 2011 2012 2013 2014 2015
BBM 36% 25% 22% 23.0% 13.8% 9.7% 7.2% 5.5%
Bio Diesel & EBT Lainnya 0% 0% 0% 0.1% 0.5% 0.5% 0.5% 0.5%
Hydro 9% 8% 12% 6.8% 6.3% 6.2% 5.8% 5.3%
Panas Bumi 3% 3% 3% 5.1% 4.8% 4.8% 4.5% 5.3%
Gas 17% 25% 25% 21.0% 23.2% 22.1% 24.5% 24.0%
Batubara 35% 39% 38% 44.1% 51.4% 56.7% 57.6% 58.8%
0%
20%
40%
60%
80%
100%
Realization of Primary Energy consumption for electric power generation from January to June 2012 : oil (16.51%),
biodiesel and other renewable energy (0.09%), Hydro (7.18%), geothermal (4.75 %), Gas (20.81%) and coal
(50.66%), West Java FSRU given entry in June 2012 and 10 000 MW Phase I Program for 1.888 MW of new entry in
Semester II 2012

POWER SECTOR INFRASTRUCTURE DEVELOPMENT 2011 – 2020 (1)
2011 2012 2013 2014 2015 2016 2017 2018 2019 2020
HPP - - - 2 - - 1 - 1 -
SPP 1 - - 5 - - - - - -
WTPP - - - 1 - - - - - -
CGPP 6 32 81 43 22 7 22 14 6 10
PS - - - - - 1,040 - - 450 950
HEPP 18 220 8 49 312 804 581 362 294 135
MHPP 20 39 234 139 51 4 6 5 2 2
DPP - 1 33 41 41 22 - 22 17 18
GTPP 222 509 1,132 790 140 30 85 480 75 630
CCPP 594 873 296 - - - - - 750 750
GeoPP 24 63 115 258 1,090 426 957 1,290 1,610 415
CFPP 4,383 5,456 3,073 2,947 4,289 4,832 4,785 2,008 1,829 1,972
-
1,000
2,000
3,000
4,000
5,000
6,000
7,000
8,000GENERATION (MW)
Total power generation that will be developed from 2011-2020 is about of 55 GW or in average 5.5 GW p.a (CFPP
will be developed about of 36 GW up to 2020 or 64% from total power generation)
PLN will develop about of 57% of the total capacity and the rest (43%) will develop by IPP/private
Diesel Power Plant is still developed, but only dedicated to isolated/remote area.
Source: RUPTL PLN 2011 – 2020
ESDM untuk Kesejahteraan Rakyat
III. LIST OF POWER PLANT – FAST TRACK PHASE II (MEMR
REGULATION NO: 01 YEAR 2012)
ESDM untuk Kesejahteraan Rakyat
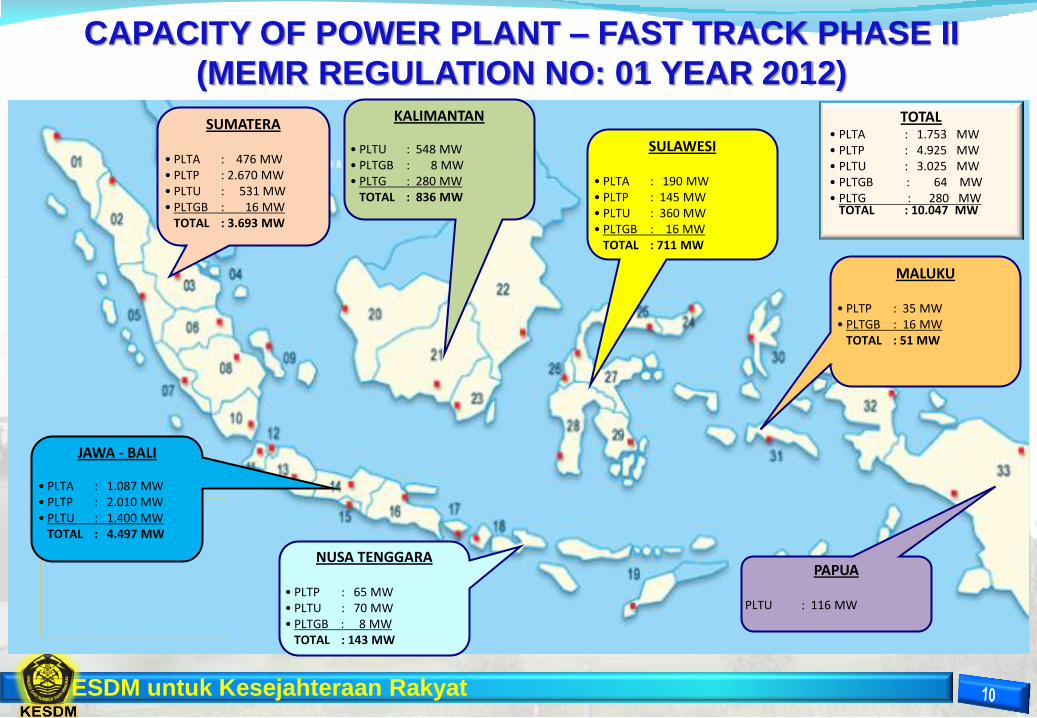
SUMATERA • PLTA : 476 MW • PLTP : 2.670 MW • PLTU : 531 MW • PLTGB : 16 MW TOTAL : 3.693 MW
JAWA - BALI
• PLTA : 1.087 MW • PLTP : 2.010 MW • PLTU : 1.400 MW TOTAL : 4.497 MW
KALIMANTAN
• PLTU : 548 MW • PLTGB : 8 MW • PLTG : 280 MW TOTAL : 836 MW
SULAWESI
• PLTA : 190 MW • PLTP : 145 MW • PLTU : 360 MW • PLTGB : 16 MW TOTAL : 711 MW
MALUKU
• PLTP : 35 MW • PLTGB : 16 MW TOTAL : 51 MW
NUSA TENGGARA
• PLTP : 65 MW • PLTU : 70 MW • PLTGB : 8 MW TOTAL : 143 MW
PAPUA
PLTU : 116 MW
TOTAL • PLTA : 1.753 MW • PLTP : 4.925 MW • PLTU : 3.025 MW • PLTGB : 64 MW • PLTG : 280 MW TOTAL : 10.047 MW
CAPACITY OF POWER PLANT – FAST TRACK PHASE II
(MEMR REGULATION NO: 01 YEAR 2012)
ESDM untuk Kesejahteraan Rakyat
IV. THE REALIZATION OF THE PRIMARY ENERGY CONSUMPTION
UNTIL MAY 2012
ESDM untuk Kesejahteraan Rakyat
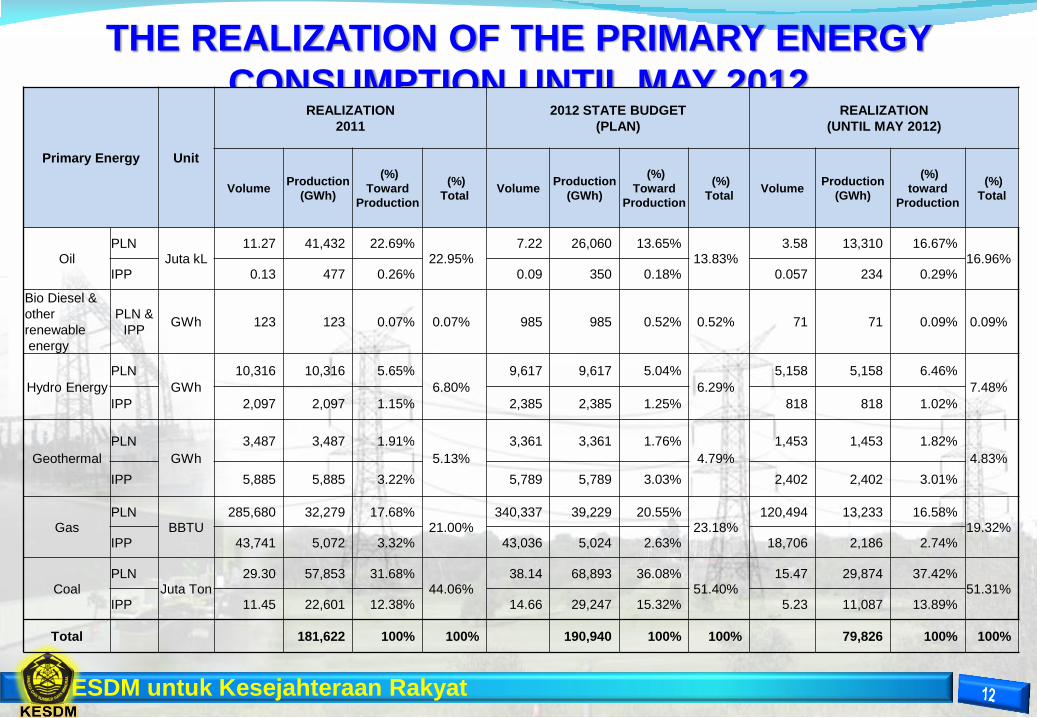
THE REALIZATION OF THE PRIMARY ENERGY
CONSUMPTION UNTIL MAY 2012
Primary Energy Unit
REALIZATION
2011
2012 STATE BUDGET
(PLAN)
REALIZATION
(UNTIL MAY 2012)
Volume Production
(GWh)
(%)
Toward
Production
(%)
Total Volume
Production
(GWh)
(%)
Toward
Production
(%)
Total Volume
Production
(GWh)
(%)
toward
Production
(%)
Total
Oil PLN
Juta kL 11.27 41,432 22.69%
22.95% 7.22 26,060 13.65%
13.83% 3.58 13,310 16.67%
16.96% IPP 0.13 477 0.26% 0.09 350 0.18% 0.057 234 0.29%
Bio Diesel &
other
renewable
energy
PLN &
IPP GWh 123 123 0.07% 0.07% 985 985 0.52% 0.52% 71 71 0.09% 0.09%
Hydro Energy
PLN
GWh
10,316 10,316 5.65%
6.80%
9,617 9,617 5.04%
6.29%
5,158 5,158 6.46%
7.48%
IPP 2,097 2,097 1.15% 2,385 2,385 1.25% 818 818 1.02%
Geothermal
PLN
GWh
3,487 3,487 1.91%
5.13%
3,361 3,361 1.76%
4.79%
1,453 1,453 1.82%
4.83%
IPP 5,885 5,885 3.22% 5,789 5,789 3.03% 2,402 2,402 3.01%
Gas PLN
BBTU 285,680 32,279 17.68%
21.00% 340,337 39,229 20.55%
23.18% 120,494 13,233 16.58%
19.32% IPP 43,741 5,072 3.32% 43,036 5,024 2.63% 18,706 2,186 2.74%
Coal PLN
Juta Ton 29.30 57,853 31.68%
44.06% 38.14 68,893 36.08%
51.40% 15.47 29,874 37.42%
51.31% IPP 11.45 22,601 12.38% 14.66 29,247 15.32% 5.23 11,087 13.89%
Total 181,622 100% 100% 190,940 100% 100% 79,826 100% 100%
ESDM untuk Kesejahteraan Rakyat
V. THE ISSUES AND PROPOSED OF SOLVING
PROBLEMS
ESDM untuk Kesejahteraan Rakyat
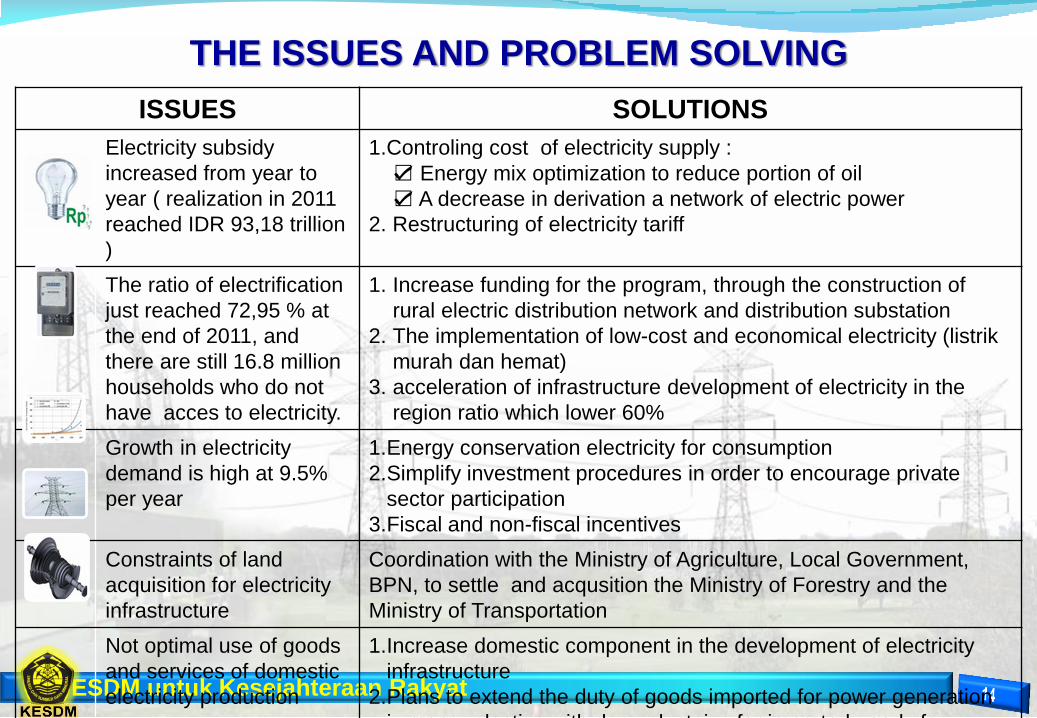
ISSUES SOLUTIONS
Electricity subsidy
increased from year to
year ( realization in 2011
reached IDR 93,18 trillion
)
1.Controling cost of electricity supply :
☑ Energy mix optimization to reduce portion of oil
☑ A decrease in derivation a network of electric power
2. Restructuring of electricity tariff
The ratio of electrification
just reached 72,95 % at
the end of 2011, and
there are still 16.8 million
households who do not
have acces to electricity.
1. Increase funding for the program, through the construction of
rural electric distribution network and distribution substation
2. The implementation of low-cost and economical electricity (listrik
murah dan hemat)
3. acceleration of infrastructure development of electricity in the
region ratio which lower 60%
Growth in electricity
demand is high at 9.5%
per year
1.Energy conservation electricity for consumption
2.Simplify investment procedures in order to encourage private
sector participation
3.Fiscal and non-fiscal incentives
Constraints of land
acquisition for electricity
infrastructure
Coordination with the Ministry of Agriculture, Local Government,
BPN, to settle and acqusition the Ministry of Forestry and the
Ministry of Transportation
Not optimal use of goods
and services of domestic
electricity production
1.Increase domestic component in the development of electricity
infrastructure
2.Plans to extend the duty of goods imported for power generation
is more selective with due selecteive for improted goods for
power generation consideration to the domestic
THE ISSUES AND PROBLEM SOLVING

TERIMA KASIH
THANK YOU

APPENDIX
JAVA AND BALI REGION :
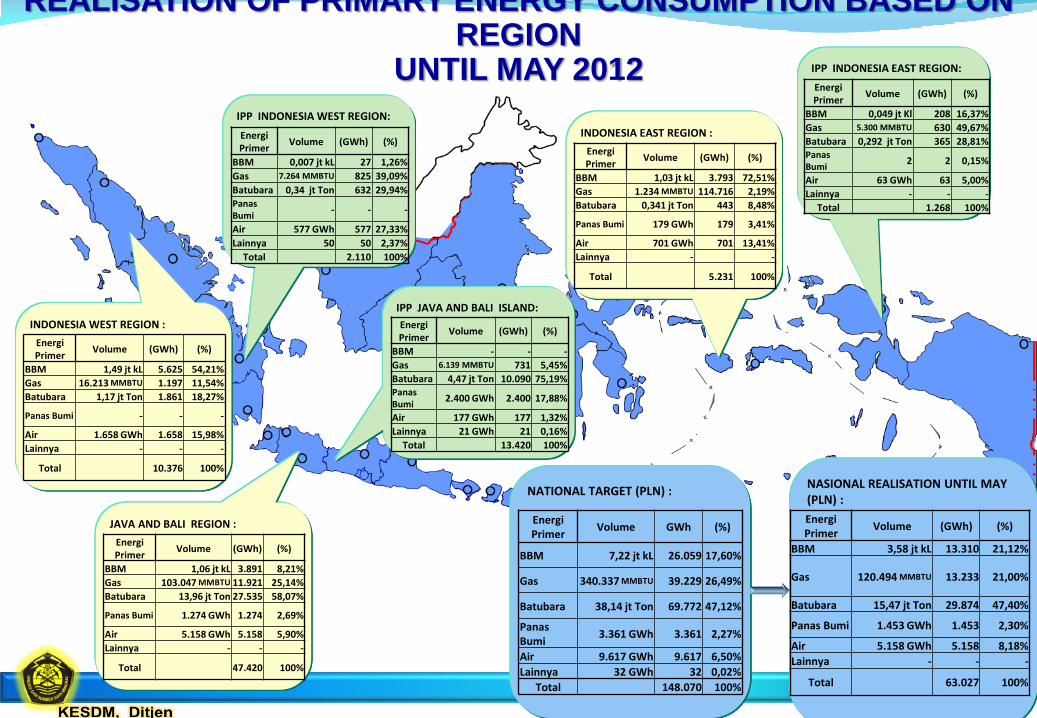
REALISATION OF PRIMARY ENERGY CONSUMPTION BASED ON REGION
UNTIL MAY 2012
IPP INDONESIA WEST REGION:
IPP INDONESIA EAST REGION:
IPP JAVA AND BALI ISLAND:
Energi Primer
Volume (GWh) (%)
BBM 1,06 jt kL 3.891 8,21%
Gas 103.047 MMBTU 11.921 25,14%
Batubara 13,96 jt Ton 27.535 58,07%
Panas Bumi 1.274 GWh 1.274 2,69%
Air 5.158 GWh 5.158 5,90%
Lainnya - - -
Total 47.420 100%
INDONESIA WEST REGION :
Energi Primer
Volume (GWh) (%)
BBM 1,49 jt kL 5.625 54,21%
Gas 16.213 MMBTU 1.197 11,54%
Batubara 1,17 jt Ton 1.861 18,27%
Panas Bumi - - -
Air 1.658 GWh 1.658 15,98%
Lainnya - - -
Total 10.376 100%
INDONESIA EAST REGION :
Energi Primer
Volume (GWh) (%)
BBM 1,03 jt kL 3.793 72,51%
Gas 1.234 MMBTU 114.716 2,19%
Batubara 0,341 jt Ton 443 8,48%
Panas Bumi 179 GWh 179 3,41%
Air 701 GWh 701 13,41%
Lainnya - -
Total 5.231 100%
Energi Primer
Volume (GWh) (%)
BBM 0,007 jt kL 27 1,26%
Gas 7.264 MMBTU 825 39,09%
Batubara 0,34 jt Ton 632 29,94% Panas Bumi
- - -
Air 577 GWh 577 27,33%
Lainnya 50 50 2,37%
Total 2.110 100%
Energi Primer
Volume (GWh) (%)
BBM 0,049 jt Kl 208 16,37%
Gas 5.300 MMBTU 630 49,67%
Batubara 0,292 jt Ton 365 28,81% Panas Bumi
2 2 0,15%
Air 63 GWh 63 5,00%
Lainnya - - -
Total 1.268 100%
Energi Primer
Volume (GWh) (%)
BBM - - -
Gas 6.139 MMBTU 731 5,45%
Batubara 4,47 jt Ton 10.090 75,19% Panas Bumi
2.400 GWh 2.400 17,88%
Air 177 GWh 177 1,32%
Lainnya 21 GWh 21 0,16%
Total 13.420 100%
NASIONAL REALISATION UNTIL MAY (PLN) :
NATIONAL TARGET (PLN) :
Energi Primer
Volume GWh (%)
BBM 7,22 jt kL 26.059 17,60%
Gas 340.337 MMBTU 39.229 26,49%
Batubara 38,14 jt Ton 69.772 47,12%
Panas Bumi
3.361 GWh 3.361 2,27%
Air 9.617 GWh 9.617 6,50%
Lainnya 32 GWh 32 0,02%
Total 148.070 100%
Energi Primer
Volume (GWh) (%)
BBM 3,58 jt kL 13.310 21,12%
Gas
120.494 MMBTU
13.233 21,00%
Batubara 15,47 jt Ton 29.874 47,40%
Panas Bumi 1.453 GWh 1.453 2,30%
Air 5.158 GWh 5.158 8,18%
Lainnya - - -
Total 63.027 100%
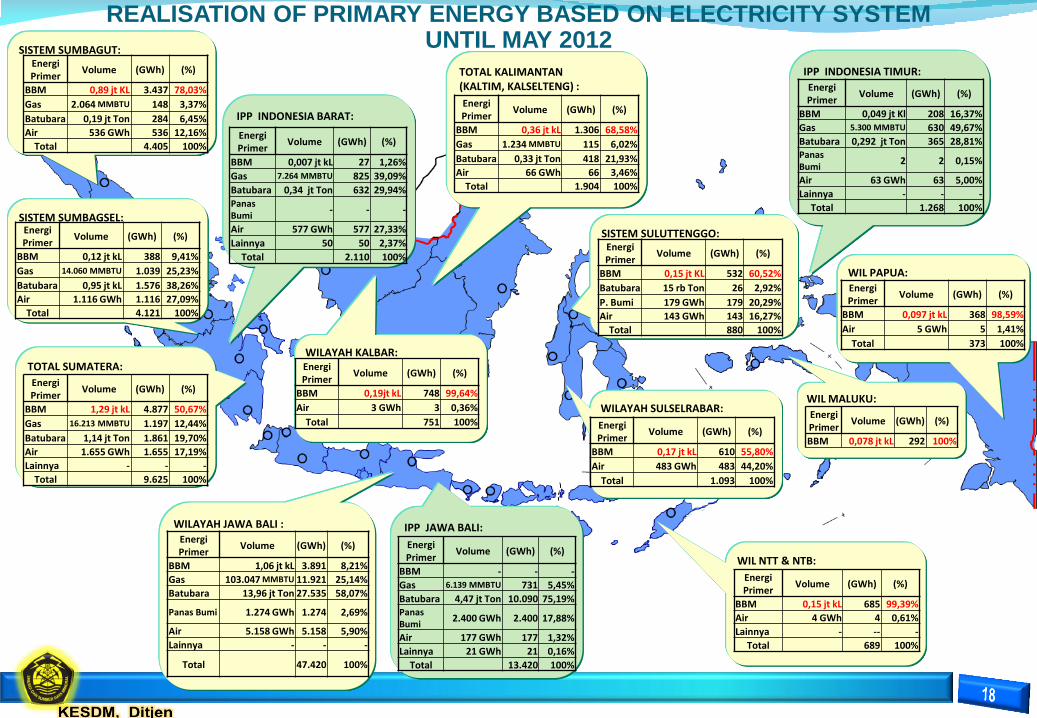
SISTEM SUMBAGUT:
TOTAL KALIMANTAN (KALTIM, KALSELTENG) :
REALISATION OF PRIMARY ENERGY BASED ON ELECTRICITY SYSTEM UNTIL MAY 2012
IPP INDONESIA BARAT:
TOTAL SUMATERA:
WILAYAH KALBAR:
WIL MALUKU:
WIL PAPUA:
Energi Primer
Volume (GWh) (%)
BBM 0,89 jt KL 3.437 78,03%
Gas 2.064 MMBTU 148 3,37%
Batubara 0,19 jt Ton 284 6,45%
Air 536 GWh 536 12,16%
Total 4.405 100%
SISTEM SUMBAGSEL:
Energi Primer
Volume (GWh) (%)
BBM 0,12 jt kL 388 9,41%
Gas 14.060 MMBTU 1.039 25,23%
Batubara 0,95 jt kL 1.576 38,26%
Air 1.116 GWh 1.116 27,09%
Total 4.121 100%
Energi Primer
Volume (GWh) (%)
BBM 1,29 jt kL 4.877 50,67%
Gas 16.213 MMBTU 1.197 12,44%
Batubara 1,14 jt Ton 1.861 19,70%
Air 1.655 GWh 1.655 17,19%
Lainnya - - -
Total 9.625 100%
Energi Primer
Volume (GWh) (%)
BBM 0,078 jt kL 292 100%
IPP INDONESIA TIMUR:
IPP JAWA BALI:
Energi Primer
Volume (GWh) (%)
BBM 0,19jt kL 748 99,64%
Air 3 GWh 3 0,36%
Total 751 100% WILAYAH SULSELRABAR:
Energi Primer
Volume (GWh) (%)
BBM 0,17 jt kL 610 55,80%
Air 483 GWh 483 44,20%
Total 1.093 100%
Energi Primer
Volume (GWh) (%)
BBM 0,36 jt kL 1.306 68,58%
Gas 1.234 MMBTU 115 6,02%
Batubara 0,33 jt Ton 418 21,93%
Air 66 GWh 66 3,46%
Total 1.904 100%
Energi Primer
Volume (GWh) (%)
BBM 0,097 jt kL 368 98,59%
Air 5 GWh 5 1,41%
Total 373 100%
WIL NTT & NTB:
Energi Primer
Volume (GWh) (%)
BBM 0,15 jt kL 685 99,39%
Air 4 GWh 4 0,61%
Lainnya - -- -
Total 689 100%
WILAYAH JAWA BALI :
SISTEM SULUTTENGGO:
Energi Primer
Volume (GWh) (%)
BBM 0,15 jt KL 532 60,52%
Batubara 15 rb Ton 26 2,92%
P. Bumi 179 GWh 179 20,29%
Air 143 GWh 143 16,27%
Total 880 100%
Energi Primer
Volume (GWh) (%)
BBM 0,007 jt kL 27 1,26%
Gas 7.264 MMBTU 825 39,09%
Batubara 0,34 jt Ton 632 29,94% Panas Bumi
- - -
Air 577 GWh 577 27,33%
Lainnya 50 50 2,37%
Total 2.110 100%
Energi Primer
Volume (GWh) (%)
BBM 0,049 jt Kl 208 16,37%
Gas 5.300 MMBTU 630 49,67%
Batubara 0,292 jt Ton 365 28,81% Panas Bumi
2 2 0,15%
Air 63 GWh 63 5,00%
Lainnya - - -
Total 1.268 100%
Energi Primer
Volume (GWh) (%)
BBM - - -
Gas 6.139 MMBTU 731 5,45%
Batubara 4,47 jt Ton 10.090 75,19% Panas Bumi
2.400 GWh 2.400 17,88%
Air 177 GWh 177 1,32%
Lainnya 21 GWh 21 0,16%
Total 13.420 100%
Energi Primer
Volume (GWh) (%)
BBM 1,06 jt kL 3.891 8,21%
Gas 103.047 MMBTU 11.921 25,14%
Batubara 13,96 jt Ton 27.535 58,07%
Panas Bumi 1.274 GWh 1.274 2,69%
Air 5.158 GWh 5.158 5,90%
Lainnya - - -
Total 47.420 100%

SISTEM SUMBAGUT:
TOTAL KALIMANTAN (KALTIM, KALSELTENG) :
REALIZATION OF USE MAY FUEL UNTIL 2012 PT PLN (Persero)
TOTAL SUMATERA:
WILAYAH KALBAR:
WIL MALUKU:
WIL PAPUA:
Energi Primer
Volume (GWh)
BBM 0,89 jt KL 3.437
SISTEM SUMBAGSEL:
Energi Primer
Volume (GWh)
BBM 0,12 jt kL 388
Energi Primer
Volume (GWh)
BBM 1,29 jt kL 4.877
Energi Primer
Volume (GWh)
BBM 0,078 jt kL 292
Energi Primer
Volume (GWh)
BBM 0,19jt kL 748 WILAYAH SULSELRABAR:
Energi Primer
Volume (GWh)
BBM 0,17 jt kL 610
Energi Primer
Volume (GWh)
BBM 0,36 jt kL 1.306
Energi Primer
Volume (GWh)
BBM 0,097 jt kL 368
WIL NTT & NTB:
Energi Primer
Volume (GWh)
BBM 0,15 jt kL 685
WILAYAH JAWA BALI:
SISTEM SULUTTENGGO:
Energi Primer
Volume (GWh)
BBM 0,15 jt KL 532
Energi Primer
Volume (GWh)
BBM 1,06 jt kL 3.891
TARGET NASIONAL (PLN) :
Energi Primer
Volume GWh
BBM 7,22 jt kL 26.059
REALISASI NASIONAL s.d MEI 2012 (PLN) :
Energi Primer
Volume (GWh)
BBM 3,58 jt kL 13.310
Realisasi Penggunaan BBM PT PLN (Persero) s.d Bulan Mei 2012 telah mencapai 3,58 juta kL (49,56%) dari Target APBN-P 2012 sebesar 7,22 juta kL
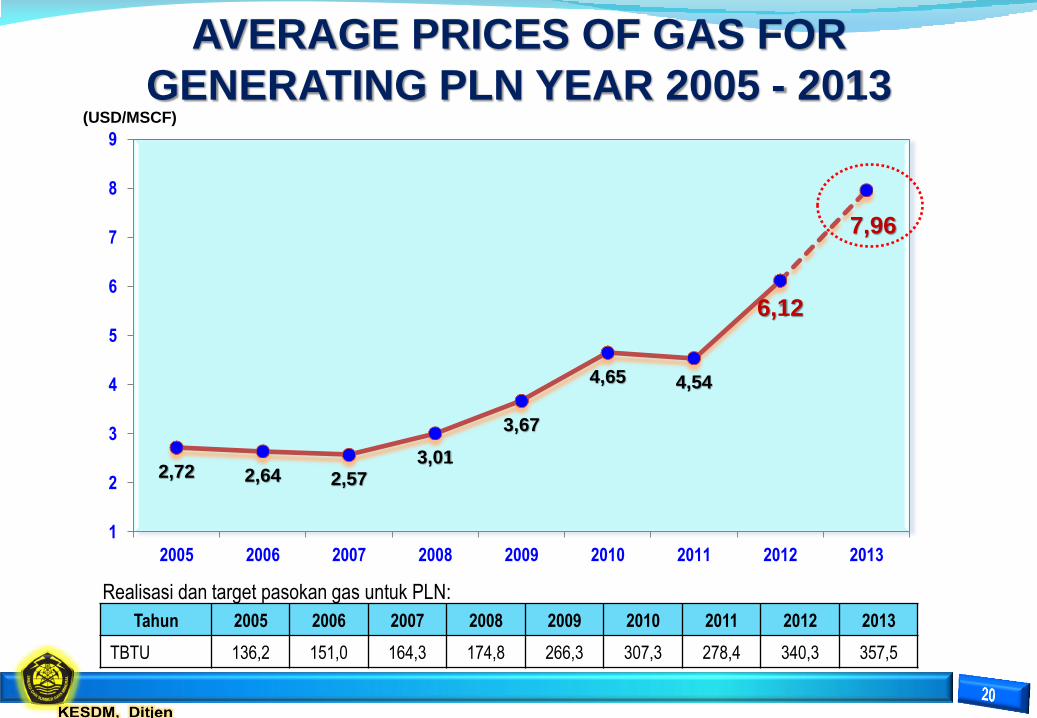
AVERAGE PRICES OF GAS FOR
GENERATING PLN YEAR 2005 - 2013
2,72 2,64 2,57 3,01
3,67
4,65 4,54
6,12
7,96
1
2
3
4
5
6
7
8
9
2005 2006 2007 2008 2009 2010 2011 2012 2013
(USD/MSCF)
Tahun 2005 2006 2007 2008 2009 2010 2011 2012 2013
TBTU 136,2 151,0 164,3 174,8 266,3 307,3 278,4 340,3 357,5
Realisasi dan target pasokan gas untuk PLN:

AVERAGE PRICE OF FUEL AND COAL FOR GENERATING
PLN YEAR 2005 - 2013
792 792
8356
9153
0
1,000
2,000
3,000
4,000
5,000
6,000
7,000
8,000
9,000
10,000
0
100
200
300
400
500
600
700
800
900
1000
2005 2006 2007 2008 2009 2010 2011 2012 2013
(Rp/Liter) (Rp/kg)
Batubara BBM (HSD)