Embed Size (px)
Citation preview

The Poisson Distribution
09 June 2010

The Poisson Distribution
This provides a model for ‘events’ which occur,
• randomly in time or space
• independently
• uniformly
• one at a time
The variable is the number of events.

For discussion.
Some examples of Poisson Random Variables:
• Number of typing errors/page by the secretary.
Uniformity - If she’s expected to make 0.8 errors/page she would be expected to make 1.6 error/2pages & 4 errors/5 pages etc.
• Number of phone calls made/hour by you.
• Number of cars passing a motorway bridge/minute.
• Number of accident claims/week received by an insurance company.

Definition
When the discrete random variable X follows a Poisson
distribution, with mean α we write X ~ Po(α) and
the probability distribution function is given by:
for r= 0,1,2,3....∞.
The variance of a Poison distribution is the same as the mean, therefore Var[X] = α.
So numerically,
E[X] = var[x] = α although the units will vary.
r
er!
rXP

Example:
The number of accidents occurring at an ‘accident blackspot’ per month follows a Poisson Distribution with mean 3.
What is the probability that in any given month there will be:
a) Exactly 5 accidents
b) Less than 3 accidents
c) At least 2 accidents?
d) What will be the probability that there will be exactly 10 accidents in 2 months?

Let X = number of accidents/month.X~ Po(3).
r
er!
rXP
5xP a) 3
5
e5!
3 0.0136
3xP b) 2 xP1 xP0xP
333
2
1
0
e2!
3e
1!
3e
0!
3
0.2240.14940.0498
0.4232

2xP c) 1 xP0xP -1
33
1
0
e1!
3e
0!
3 - 1
0.1494][0.0498-1
0.8008
Let Y = number of accidents/2 monthsY~Po(6).
10yP d) 6
10
e10!
6 0.0413

For any Poisson Distribution, X Po()
!
er
rXPr
Therefore:
α-e1)P(X
α-2
e2
α2)P(X
α-e0)P(X

Ex. A newsagent sells a weekly magazine. The number of sales follows a Poisson distribution, with a mean of 3 per day.The newsagent receives 15 copies per week. Find the probability that:
a) he sells two on Mondayb) he sells two on Monday and three on Tuesdayc) he sells 5 on Monday and Tuesdayd) he sells all copies before the end of Friday
(Assume that if he sells out he can order more).

Using Poisson Probability tables
09 June 2010

PROBABILITY TABLES – Poisson Distribution.
1. The Poisson tables contain information about the probability that X is less than or equal to a given value. P(X r).
2. The table contains sections for specific mean values
3. If the values of the mean are not in the table, we cannot use the tables. We must use either the formula or the shortcuts.
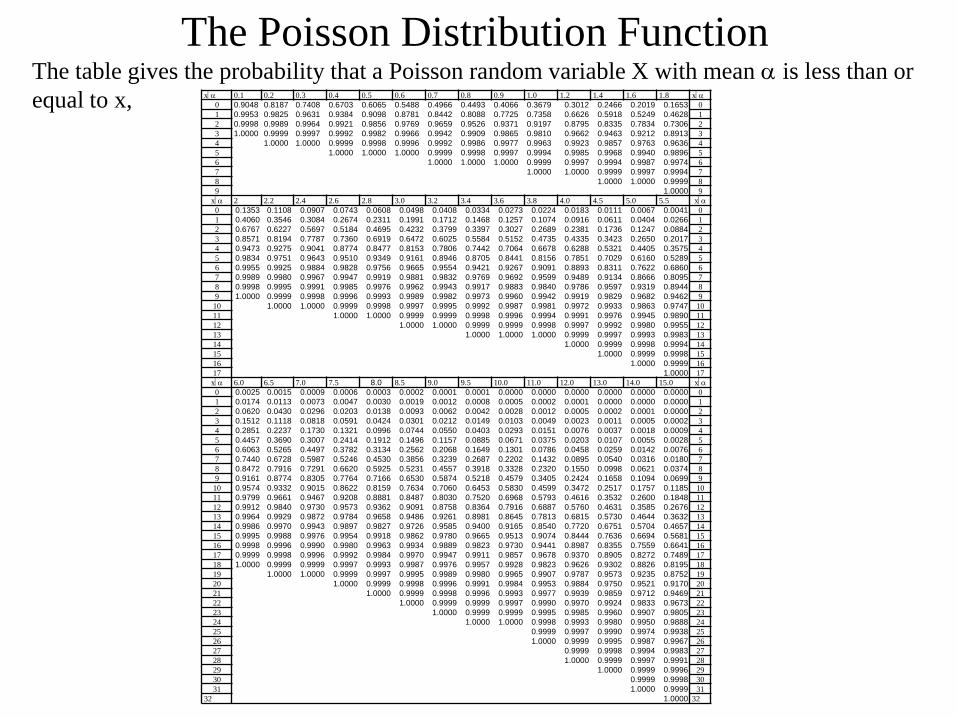
The Poisson Distribution FunctionThe table gives the probability that a Poisson random variable X with mean is less than or
equal to x, x 0.1 0.2 0.3 0.4 0.5 0.6 0.7 0.8 0.9 1.0 1.2 1.4 1.6 1.8 x
0 0.9048 0.8187 0.7408 0.6703 0.6065 0.5488 0.4966 0.4493 0.4066 0.3679 0.3012 0.2466 0.2019 0.1653 0
1 0.9953 0.9825 0.9631 0.9384 0.9098 0.8781 0.8442 0.8088 0.7725 0.7358 0.6626 0.5918 0.5249 0.4628 1
2 0.9998 0.9989 0.9964 0.9921 0.9856 0.9769 0.9659 0.9526 0.9371 0.9197 0.8795 0.8335 0.7834 0.7306 2
3 1.0000 0.9999 0.9997 0.9992 0.9982 0.9966 0.9942 0.9909 0.9865 0.9810 0.9662 0.9463 0.9212 0.8913 3
4 1.0000 1.0000 0.9999 0.9998 0.9996 0.9992 0.9986 0.9977 0.9963 0.9923 0.9857 0.9763 0.9636 4
5 1.0000 1.0000 1.0000 0.9999 0.9998 0.9997 0.9994 0.9985 0.9968 0.9940 0.9896 5
6 1.0000 1.0000 1.0000 0.9999 0.9997 0.9994 0.9987 0.9974 6
7 1.0000 1.0000 0.9999 0.9997 0.9994 7
8 1.0000 1.0000 0.9999 8
9 1.0000 9
x 2 2.2 2.4 2.6 2.8 3.0 3.2 3.4 3.6 3.8 4.0 4.5 5.0 5.5 x
0 0.1353 0.1108 0.0907 0.0743 0.0608 0.0498 0.0408 0.0334 0.0273 0.0224 0.0183 0.0111 0.0067 0.0041 0
1 0.4060 0.3546 0.3084 0.2674 0.2311 0.1991 0.1712 0.1468 0.1257 0.1074 0.0916 0.0611 0.0404 0.0266 1
2 0.6767 0.6227 0.5697 0.5184 0.4695 0.4232 0.3799 0.3397 0.3027 0.2689 0.2381 0.1736 0.1247 0.0884 2
3 0.8571 0.8194 0.7787 0.7360 0.6919 0.6472 0.6025 0.5584 0.5152 0.4735 0.4335 0.3423 0.2650 0.2017 3
4 0.9473 0.9275 0.9041 0.8774 0.8477 0.8153 0.7806 0.7442 0.7064 0.6678 0.6288 0.5321 0.4405 0.3575 4
5 0.9834 0.9751 0.9643 0.9510 0.9349 0.9161 0.8946 0.8705 0.8441 0.8156 0.7851 0.7029 0.6160 0.5289 5
6 0.9955 0.9925 0.9884 0.9828 0.9756 0.9665 0.9554 0.9421 0.9267 0.9091 0.8893 0.8311 0.7622 0.6860 6
7 0.9989 0.9980 0.9967 0.9947 0.9919 0.9881 0.9832 0.9769 0.9692 0.9599 0.9489 0.9134 0.8666 0.8095 7
8 0.9998 0.9995 0.9991 0.9985 0.9976 0.9962 0.9943 0.9917 0.9883 0.9840 0.9786 0.9597 0.9319 0.8944 8
9 1.0000 0.9999 0.9998 0.9996 0.9993 0.9989 0.9982 0.9973 0.9960 0.9942 0.9919 0.9829 0.9682 0.9462 9
10 1.0000 1.0000 0.9999 0.9998 0.9997 0.9995 0.9992 0.9987 0.9981 0.9972 0.9933 0.9863 0.9747 10
11 1.0000 1.0000 0.9999 0.9999 0.9998 0.9996 0.9994 0.9991 0.9976 0.9945 0.9890 11
12 1.0000 1.0000 0.9999 0.9999 0.9998 0.9997 0.9992 0.9980 0.9955 12
13 1.0000 1.0000 1.0000 0.9999 0.9997 0.9993 0.9983 13
14 1.0000 0.9999 0.9998 0.9994 14
15 1.0000 0.9999 0.9998 15
16 1.0000 0.9999 16
17 1.0000 17
x 6.0 6.5 7.0 7.5 8.0 8.5 9.0 9.5 10.0 11.0 12.0 13.0 14.0 15.0 x
0 0.0025 0.0015 0.0009 0.0006 0.0003 0.0002 0.0001 0.0001 0.0000 0.0000 0.0000 0.0000 0.0000 0.0000 0
1 0.0174 0.0113 0.0073 0.0047 0.0030 0.0019 0.0012 0.0008 0.0005 0.0002 0.0001 0.0000 0.0000 0.0000 1
2 0.0620 0.0430 0.0296 0.0203 0.0138 0.0093 0.0062 0.0042 0.0028 0.0012 0.0005 0.0002 0.0001 0.0000 2
3 0.1512 0.1118 0.0818 0.0591 0.0424 0.0301 0.0212 0.0149 0.0103 0.0049 0.0023 0.0011 0.0005 0.0002 3
4 0.2851 0.2237 0.1730 0.1321 0.0996 0.0744 0.0550 0.0403 0.0293 0.0151 0.0076 0.0037 0.0018 0.0009 4
5 0.4457 0.3690 0.3007 0.2414 0.1912 0.1496 0.1157 0.0885 0.0671 0.0375 0.0203 0.0107 0.0055 0.0028 5
6 0.6063 0.5265 0.4497 0.3782 0.3134 0.2562 0.2068 0.1649 0.1301 0.0786 0.0458 0.0259 0.0142 0.0076 6
7 0.7440 0.6728 0.5987 0.5246 0.4530 0.3856 0.3239 0.2687 0.2202 0.1432 0.0895 0.0540 0.0316 0.0180 7
8 0.8472 0.7916 0.7291 0.6620 0.5925 0.5231 0.4557 0.3918 0.3328 0.2320 0.1550 0.0998 0.0621 0.0374 8
9 0.9161 0.8774 0.8305 0.7764 0.7166 0.6530 0.5874 0.5218 0.4579 0.3405 0.2424 0.1658 0.1094 0.0699 9
10 0.9574 0.9332 0.9015 0.8622 0.8159 0.7634 0.7060 0.6453 0.5830 0.4599 0.3472 0.2517 0.1757 0.1185 10
11 0.9799 0.9661 0.9467 0.9208 0.8881 0.8487 0.8030 0.7520 0.6968 0.5793 0.4616 0.3532 0.2600 0.1848 11
12 0.9912 0.9840 0.9730 0.9573 0.9362 0.9091 0.8758 0.8364 0.7916 0.6887 0.5760 0.4631 0.3585 0.2676 12
13 0.9964 0.9929 0.9872 0.9784 0.9658 0.9486 0.9261 0.8981 0.8645 0.7813 0.6815 0.5730 0.4644 0.3632 13
14 0.9986 0.9970 0.9943 0.9897 0.9827 0.9726 0.9585 0.9400 0.9165 0.8540 0.7720 0.6751 0.5704 0.4657 14
15 0.9995 0.9988 0.9976 0.9954 0.9918 0.9862 0.9780 0.9665 0.9513 0.9074 0.8444 0.7636 0.6694 0.5681 15
16 0.9998 0.9996 0.9990 0.9980 0.9963 0.9934 0.9889 0.9823 0.9730 0.9441 0.8987 0.8355 0.7559 0.6641 16
17 0.9999 0.9998 0.9996 0.9992 0.9984 0.9970 0.9947 0.9911 0.9857 0.9678 0.9370 0.8905 0.8272 0.7489 17
18 1.0000 0.9999 0.9999 0.9997 0.9993 0.9987 0.9976 0.9957 0.9928 0.9823 0.9626 0.9302 0.8826 0.8195 18
19 1.0000 1.0000 0.9999 0.9997 0.9995 0.9989 0.9980 0.9965 0.9907 0.9787 0.9573 0.9235 0.8752 19
20 1.0000 0.9999 0.9998 0.9996 0.9991 0.9984 0.9953 0.9884 0.9750 0.9521 0.9170 20
21 1.0000 0.9999 0.9998 0.9996 0.9993 0.9977 0.9939 0.9859 0.9712 0.9469 21
22 1.0000 0.9999 0.9999 0.9997 0.9990 0.9970 0.9924 0.9833 0.9673 22
23 1.0000 0.9999 0.9999 0.9995 0.9985 0.9960 0.9907 0.9805 23
24 1.0000 1.0000 0.9998 0.9993 0.9980 0.9950 0.9888 24
25 0.9999 0.9997 0.9990 0.9974 0.9938 25
26 1.0000 0.9999 0.9995 0.9987 0.9967 26
27 0.9999 0.9998 0.9994 0.9983 27
28 1.0000 0.9999 0.9997 0.9991 28
29 1.0000 0.9999 0.9996 29
30 0.9999 0.9998 30
31 1.0000 0.9999 31
32 1.0000 32
Example:
The number of incoming calls to call centre has a mean of 7 calls per minute.
Using TABLES only find the probability that the switchboard has
a) Exactly 8 incoming calls per minute
b) Less than 5 incoming calls per minute
c) At least 12 incoming calls per minute
d) What will be the probability that there will be between 10 to 15 inclusive incoming calls in a 2 minute period

Let X = number of calls per minute.X~ Po(7).
8xP a) 7)P(x8)P(x
0.5987-0.7291
0.1304
5xP b) 4xP
0.1730
12xP c) 11xP -1
0.9467-1
0.0533

Let Y = number of calls in 2 minutesY~Po(14).
15x10P d) 9)P(x15xP
0.10940.6694
0.56