Embed Size (px)
Citation preview
incontext January 2006 www.incontext.indiana.edu
We may soon have to broaden
our definition of consumer
to include our furry friends.
The pet industry has become more
prevalent over the last five years and
might even be considered a “watch
industry” for the nation’s economic
well-being in terms of disposable
income (since having a pet is not a
necessity, nor are the kinds of pet
care services that are spreading across
the country). In 1988, 56 percent of
households owned a pet as compared
to 63 percent today, according to the
American Pet Products Manufacturers
Association.1
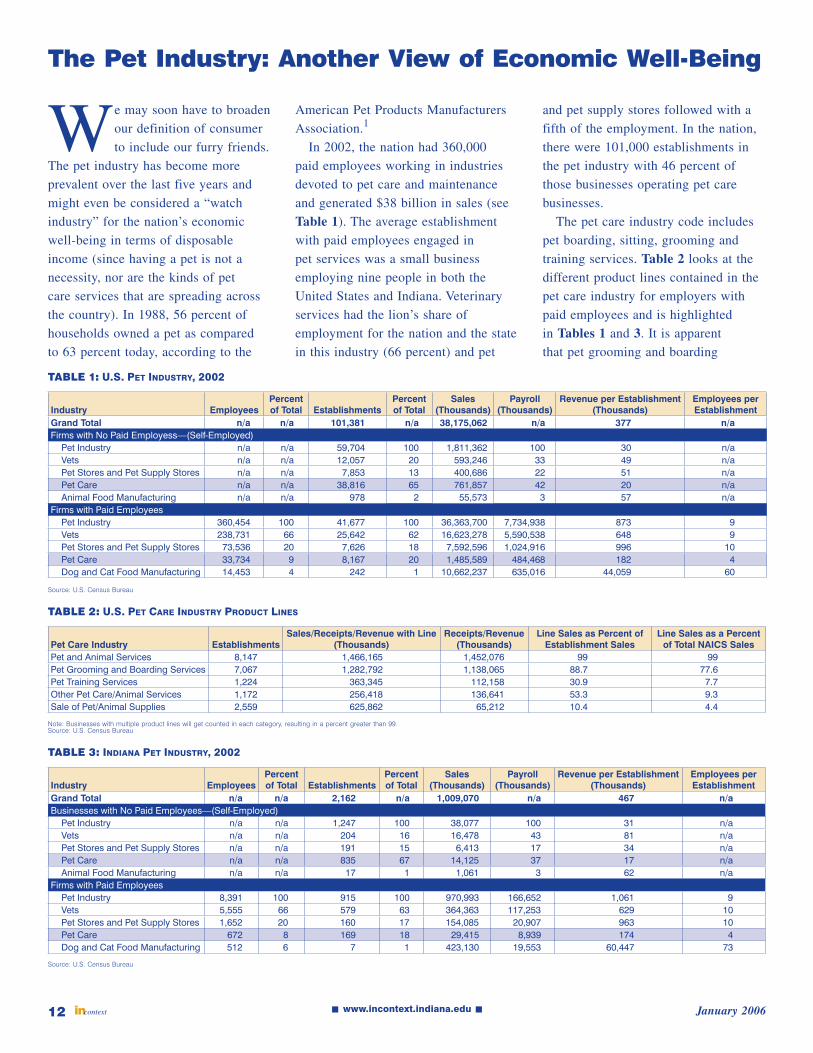
In 2002, the nation had 360,000
paid employees working in industries
devoted to pet care and maintenance
and generated $38 billion in sales (see
Table 1). The average establishment
with paid employees engaged in
pet services was a small business
employing nine people in both the
United States and Indiana. Veterinary
services had the lion’s share of
employment for the nation and the state
in this industry (66 percent) and pet
and pet supply stores followed with a
fifth of the employment. In the nation,
there were 101,000 establishments in
the pet industry with 46 percent of
those businesses operating pet care
businesses.
The pet care industry code includes
pet boarding, sitting, grooming and
training services. Table 2 looks at the
different product lines contained in the
pet care industry for employers with
paid employees and is highlighted
in Tables 1 and 3. It is apparent
that pet grooming and boarding
The Pet Industry: Another View of Economic Well-Being
Industry EmployeesPercent of Total Establishments
Percent of Total
Sales (Thousands)
Payroll(Thousands)
Revenue per Establishment (Thousands)
Employees per Establishment
Grand Total n/a n/a 101,381 n/a 38,175,062 n/a 377 n/aFirms with No Paid Employess—(Self-Employed)
Pet Industry n/a n/a 59,704 100 1,811,362 100 30 n/aVets n/a n/a 12,057 20 593,246 33 49 n/aPet Stores and Pet Supply Stores n/a n/a 7,853 13 400,686 22 51 n/aPet Care n/a n/a 38,816 65 761,857 42 20 n/aAnimal Food Manufacturing n/a n/a 978 2 55,573 3 57 n/a
Firms with Paid EmployeesPet Industry 360,454 100 41,677 100 36,363,700 7,734,938 873 9Vets 238,731 66 25,642 62 16,623,278 5,590,538 648 9Pet Stores and Pet Supply Stores 73,536 20 7,626 18 7,592,596 1,024,916 996 10Pet Care 33,734 9 8,167 20 1,485,589 484,468 182 4Dog and Cat Food Manufacturing 14,453 4 242 1 10,662,237 635,016 44,059 60
TABLE 1: U.S. PET INDUSTRY, 2002
Source: U.S. Census Bureau
Pet Care Industry EstablishmentsSales/Receipts/Revenue with Line
(Thousands)Receipts/Revenue
(Thousands)Line Sales as Percent of
Establishment SalesLine Sales as a Percent
of Total NAICS SalesPet and Animal Services 8,147 1,466,165 1,452,076 99 99Pet Grooming and Boarding Services 7,067 1,282,792 1,138,065 88.7 77.6Pet Training Services 1,224 363,345 112,158 30.9 7.7Other Pet Care/Animal Services 1,172 256,418 136,641 53.3 9.3Sale of Pet/Animal Supplies 2,559 625,862 65,212 10.4 4.4
TABLE 2: U.S. PET CARE INDUSTRY PRODUCT LINES
Note: Businesses with multiple product lines will get counted in each category, resulting in a percent greater than 99.Source: U.S. Census Bureau
Industry EmployeesPercent of Total Establishments
Percent of Total
Sales(Thousands)
Payroll(Thousands)
Revenue per Establishment(Thousands)
Employees per Establishment
Grand Total n/a n/a 2,162 n/a 1,009,070 n/a 467 n/aBusinesses with No Paid Employees—(Self-Employed)
Pet Industry n/a n/a 1,247 100 38,077 100 31 n/aVets n/a n/a 204 16 16,478 43 81 n/aPet Stores and Pet Supply Stores n/a n/a 191 15 6,413 17 34 n/aPet Care n/a n/a 835 67 14,125 37 17 n/aAnimal Food Manufacturing n/a n/a 17 1 1,061 3 62 n/a
Firms with Paid EmployeesPet Industry 8,391 100 915 100 970,993 166,652 1,061 9Vets 5,555 66 579 63 364,363 117,253 629 10Pet Stores and Pet Supply Stores 1,652 20 160 17 154,085 20,907 963 10Pet Care 672 8 169 18 29,415 8,939 174 4Dog and Cat Food Manufacturing 512 6 7 1 423,130 19,553 60,447 73
TABLE 3: INDIANA PET INDUSTRY, 2002
Source: U.S. Census Bureau
12

incontextJanuary 2006 www.incontext.indiana.edu
services is the biggest moneymaker
for businesses in the pet care industry.
Pet grooming and boarding services
boasts 77 percent of the sales for this
NAICS code and of those businesses
claiming to have pet grooming and
boarding services, 89 percent of total
sales is derived from pet grooming and
boarding. Also, some pet and pet supply
stores offer boarding and grooming
services and this constitutes 3.9 percent
of their sales.
The 50 largest firms only comprised
1.2 percent of all the businesses in the
pet care industry, indicating a lot of
small players in the market. However,
revenue is more concentrated with 15
percent of sales coming from the 50
largest firms.
There are 1,748 grocery and related-
product merchant wholesalers that have
pet food as a product line and generate
$13.5 billion from pet food sales. Of
those wholesalers with pet food as a
product line, 15 percent of their total
sales come from pet food.
Indiana had approximately 8,400
paid employees working in pet-related
industries that generated $1 billion in
sales for the year. Dog and cat food
manufacturers employed the greatest
number of employees and generated
the most revenue per establishment (see
Table 3). Like the nation, Indiana’s
greatest number of businesses is in
pet care and are individuals operating
36%
16%
47%
1%
Veterinarians
Pet Stores and Pet Supply Stores
Pet care
Dog and Cat Food Manufacturing
FIGURE 1: INDIANA PET BUSINESSES, 2002
Source: IBRC, using U.S. Census Bureau data
Pet Care
Pet and Pet Supply
Veterinary
Dog and Cat Food Manufacturing
What industries are driving the increase in self-employed pet-related establishments?
114
179 80
139
204
91
*Labels show change in number of establishments
Source: IBRC, using U.S. Census Bureau data
125 (1 county)
29 to 57 (4 counties)
12 to 28 (17 counties)
1 to 11 (66 counties)
Number of Businesses
*Labels indicate change in the number of businesses. Counties without labels indicate data were nondisclosable in 2002.
-1 2
11
50
1
01
45
0-1
30 7
4 22
0
43 8
33
23
80
32
1
01
6
3
1-3 11
-293
Vander-burgh Spencer
PoseyWarrick Perry
Floyd
Harrison
CrawfordDuboisGibson
PikeClark
OrangeWashington
ScottDaviess MartinKnox
JeffersonSwitzerland
Lawrence
OhioJackson
GreeneJennings
SullivanDearborn
Ripley
Brown BartholomewMonroe
DecaturOwen
Franklin
ClayVigo
Morgan JohnsonShelby
UnionRush FayettePutnam
Hendricks MarionHancock
Parke
WayneHenry
Verm
illio
n
BooneMontgomery
Hamilton
Randolph
Fountain
DelawareMadison
TiptonClinton
WarrenTippecanoe
Howard BlackfordJay
Grant
Benton
Carroll
CassWhite Wells
Adams
Miami
HuntingtonWabash
PulaskiFulton
Newton
Allen
Jasper
Whitley
Starke Kosciusko
Marshall
Noble De KalbLake Porter
Lagrange Steuben
ElkhartSt. JosephLa Porte
n/an/a
n/a
n/a
FIGURE 3: CHANGE IN NUMBER OF BUSINESSES, 2002:1 TO 2005:1
Source: IBRC, using Bureau of Labor Statistics data
13
FIGURE 2: GROWTH IN SELF-EMPLOYED BUSINESSES IN THE PET INDUSTRY, 2002 TO 2003

incontext January 2006 www.incontext.indiana.edu
their own pet-sitting, boarding and
grooming services (see Figure 1). The
pet industry has grown significantly
over the past five years as evidenced by
the unavailability of veterinary services
and pet care data in the 1997 economic
census.
From 2002 to 2004, the nation
has gained 1,667 pet industry private
businesses (excluding self-employed
individuals), 790 of which are pet
care businesses. This is a 4.0 percent
increase for the pet industry and a
9.7 percent increase for the pet care
industry. Indiana, on the other hand,
is growing slower with 16 new private
businesses overall (1.8 percent change),
11 of which are pet care businesses
(7.1 percent change). Indiana’s average
annual pay for workers in this industry
($20,520) is also $4,208 less than the
nation and the pay gap has widened
by $1,692 since 2002. Figure 2 shows
which industries are leading the
growth in the pet industry for the self-
employed with their own operation. The
majority of new pet businesses are in
the pet care industry in the Midwest.
There were 80 new establishments in
Indiana, 60 of which were in pet care.
In the first quarter of 2005, there
were 939 pet industry establishments
in Indiana, excluding those who were
self-employed. Figure 3 shows the
state’s distribution of establishments
covered by unemployment insurance in
the pet industry. The greatest number of
businesses are found in Marion County,
followed by Hamilton, Lake and Allen
counties. Porter County had the greatest
net increase in the number of new pet
establishments (11).
Figure 4 shows all of the pet
establishments in the state and the
population estimates for townships.
Assuming that a greater township
population would mean a greater pet
population, this map may be useful
for a new business in the pet industry
trying to locate within the state.
Notes1. American Pet Products Manufacturer’s
Association (APPMA): 2005/2006 National Pet Owners Survey.
—Amber Kostelac, Data Manager, Indiana Business Research Center, Kelley School of Business, Indiana University
Less than 1,0001,000 to 2,9993,000 to 5,000More than 5,000
Less than 66 to 15More than 15
Population, 2004
Pet Industry Establishments, 2005:1
FIGURE 4: POPULATION AND PET INDUSTRY ESTABLISHMENTS
Source: IBRC, using U.S. Census Bureau and Bureau of Labor Statistics data
14