Embed Size (px)
Citation preview

Clemson UniversityTigerPrints
All Theses Theses
5-2019
The Pedestrian Safety Problem and the EthicalImplications in the Age of Autonomous VehiclesKatherine BrunkClemson University, [email protected]
Follow this and additional works at: https://tigerprints.clemson.edu/all_theses
This Thesis is brought to you for free and open access by the Theses at TigerPrints. It has been accepted for inclusion in All Theses by an authorizedadministrator of TigerPrints. For more information, please contact [email protected].
Recommended CitationBrunk, Katherine, "The Pedestrian Safety Problem and the Ethical Implications in the Age of Autonomous Vehicles" (2019). All Theses.3131.https://tigerprints.clemson.edu/all_theses/3131

i
THE PEDESTRIAN SAFETY PROBLEM AND THE ETHICAL IMPLICATIONS IN THE AGE OF AUTONOMOUS VEHICLES
A Thesis Presented to
the Graduate School of Clemson University
In Partial Fulfillment of the Requirements for the Degree
Master of Science Civil Engineering
by Katherine Brunk
May 2018
Accepted by: Dr. Mashrur Chowdhury, Committee Chair
Dr. Patrick Gerard Dr. Catherine Mobley
Dr. Jennifer Ogle

ii
ABSTRACT
This thesis analyzes the important topic of pedestrian safety in a world of
conventional vehicles, as well as the future changes brought about by autonomous, or
self-driving, vehicles. Pedestrian safety has continued to decline with increased
pedestrian fatalities since 2009, as people walk more and are more distracted by handheld
devices. Further complications in solving the problem with pedestrian fatalities are
exacerbated by the ethical concerns that come into play when programming a robot to
make decisions that a human would have been responsible for in the past.
A literature review was conducted on pedestrian safety, ethics, and autonomous
vehicles. To explore the ethical decision making of current drivers and road-users,
specifically members of Generation Z, a group of Clemson students was surveyed and
interviewed. The majority of the participants stated that they make their decisions based
on situational factors, and that ethics is not black and white. This is despite most of the
respondents also being raised in religious households. However, the value of human life
was upheld by 97% of the respondents. Despite the consistency in opinion on the
importance of protecting human life, the respondents disagreed about which human life
should be protected, the pedestrian or the passenger in an autonomous vehicle. This
variation in opinions must be addressed as moral relativism collides with huge
technological shifts. However, this study concludes with an optimistic outlook that we
can address these issues through collaboration between the private and public sectors and
private competition to create the safest and most ethical vehicles possible.

iii
DEDICATION
I’d been feeling like a fish out of water for months – the irony of which was not
lost on me as I glanced around at the lake surrounding the dock my mom and I were
standing on. Just take the first step towards a change, my mom encouraged me. My dad
backed her up saying he also believed I had what it took to make a huge alteration in the
trajectory of my career. Without their encouragement, I would have never had what it
took to uproot my comfortable life, move to a state where I knew no one, and start over in
graduate school.
Throughout my life, my parents have taught me right from wrong, and have been
my biggest cheerleaders, challengers, and consultants. I cannot think of a single time they
have led me astray. For their sacrifices I will be forever grateful. This manuscript, and the
two years of graduate work that led up to it, are dedicated to my mom and dad.

iv
ACKNOWLEDGMENTS
I would like to acknowledge the support I have received from Dr. Mashrur
“Ronnie” Chowdhury over the past two years. This would not have been possible without
his belief in me.
I would also like to acknowledge the expertise of my committee, specifically Dr.
Mobley who offered valuable insight in the survey development phase of this project. I
could not have fine-tuned it to the same quality without her help. I would also like to
thank Dr. Gerard who was instrumental with statistical analysis. And finally, I would like
to thank Dr. Ogle, whose dedication to safety in our transportation systems inspired me to
address this topic.

v
TABLE OF CONTENTS
Page
TITLE PAGE .................................................................................................................. i ABSTRACT .................................................................................................................... ii DEDICATION .............................................................................................................. iii ACKNOWLEDGMENTS ............................................................................................ iv LIST OF FIGURES ..................................................................................................... vii
INTRODUCTION ......................................................................................................... 1 1.1 Problem Statement ................................................................................................. 1 1.2 Thesis Objectives ................................................................................................... 4
1.3 Thesis Organization ............................................................................................... 4
RELEVANT LITERATURE ........................................................................................ 6 2.1 Introduction ............................................................................................................ 6 2.2 Pedestrian Safety ................................................................................................... 6
2.3 General Ethics ....................................................................................................... 8 2.4 Survey Studies ........................................................................................................ 9
2.5 Autonomous Vehicles and Ethics ......................................................................... 10
METHOD ..................................................................................................................... 15 3.1 Safety Data and Analysis ..................................................................................... 15 3.2 Survey Design and Analysis ................................................................................. 15
THE PEDESTRIAN SAFETY PROBLEM .............................................................. 18 4.1. Data Analysis of Pedestrian Safety in the United States .................................... 18
4.2 Pedestrian Safety in Cities with 500,000 Population or Greater ........................ 23 4.3 The Pedestrian Safety Problem ............................................................................ 29
4.4 Autonomous Vehicle Crash Report Audit ............................................................ 29

vi
Table of Contents (Continued)
Page
SURVEY RESULTS .................................................................................................... 35 5.1 Summary of Survey Responses ............................................................................. 36 5.2 Chi Square Test for Independence ....................................................................... 44
IN-PERSON INTERVIEW RESPONSES ................................................................ 46 6.1 Post-Survey Video ................................................................................................ 46
6.2 Interviewee I ......................................................................................................... 47 6.3 Interviewee II ....................................................................................................... 48
6.4 Interviewee III ...................................................................................................... 48 6.5 Interviewee IV ...................................................................................................... 49
6.6 Interviewee V ....................................................................................................... 50 6.7 Interviewee VI ...................................................................................................... 51
6.8 Principal Conclusions Based on the Interviews .................................................. 51
CONCLUSION ............................................................................................................ 53 7.1 Challenges Preventing the Programming of Ethical Vehicles ............................ 53 7.2 Education ............................................................................................................. 55
7.3 Cyber-Physical Solutions ..................................................................................... 56 7.4 Human Resiliency ................................................................................................ 57
APPENDICES .............................................................................................................. 59 Appendix A: Safety Data ............................................................................................ 60
Appendix B: Survey for Clemson Students ................................................................. 68 Appendix C: Chi Square Test for Independence Results ........................................... 74
Appendix D: Institutional Review Board (IRB) Application ...................................... 79
REFERENCES ............................................................................................................. 88
vii
LIST OF FIGURES Figure Page
Figure 1 Moral Relativism by Generation ....................................................................... 9
Figure 2 Pedestrian Fatalities by Year vs. Population Growth .................................... 19
Figure 3 Pedestrian Fatalities by Age and Sex ............................................................. 20
Figure 4 Top Causes of Traffic Fatalities ..................................................................... 21
Figure 5 Percentage of Pedestrian Fatalities by Time of Day and Location, 2017 ...... 22
Figure 6 Fatalities Caused by Pedestrian Violation ..................................................... 23
Figure 7 Pedestrian Fatality Rate per 100,000 Population .......................................... 24
Figure 8 Pedestrian Fatality Rate by Population Density ............................................. 25
Figure 9 Pedestrian Fatality Rate by Median Household Income ................................ 26
Figure 10 Pedestrian Fatality Rate by Travel Time to Work ........................................ 27
Figure 11 Smart Phone Adoption and Use While Driving ............................................ 28
Figure 12 Autonomous Vehicle Crashes by Month ....................................................... 31
Figure 13 Autonomous Vehicle Crashes by Time Period .............................................. 31
Figure 14 Autonomous Vehicle Crash Type .................................................................. 32
Figure 15 Pedestrian/Cyclist Involvement in AV Crashes ............................................ 34
Figure 16 Survey Respondents by State ......................................................................... 35
Figure 17 Attitudes Towards Technology ...................................................................... 36
Figure 18 Attitudes Towards Autonomous Vehicles ...................................................... 38
Figure 19 Ethical Decision-Making Framework ........................................................... 39
Figure 20 Religious Upbringing and Current Participation ......................................... 40
Figure 21 Party Responsible for Ethical Standards ...................................................... 41
Figure 22 Respondents Driving Decision: .................................................................... 42
Figure 23 Value of Human Life ..................................................................................... 43
Figure 24 Cross Tabulation and Chi-Square Results .................................................... 45
Figure 25 TedEd Video Frame ...................................................................................... 46

1
CHAPTER ONE
INTRODUCTION
1.1 Problem Statement
In the United States, traffic-related fatalities are the number one cause of death for
people ages one to forty-four and contribute to the category of “unintended injury” which
is the third highest cause of death overall. For many years, pedestrian fatalities were
decreasing dramatically. In 2009, the number hit an all-time recorded low of 4,109. Since
then, the number of pedestrian fatalities has been rising, reaching over 6,000 in 2017, an
increase of 46%. This cause of death, which in 2009 was 12% of total traffic related
fatalities now represents over 16% of total traffic deaths as of 2017 (NHTSA, 2017).
Of the more than two-million annual vehicle crashes each year, 94% are caused by
human error, according to a 2017 study by the National Highway Traffic Safety
Administration (NHTSA, 2017). As technology advances, it is vital that we use these new
technologies to protect human life. One such advance is the development of autonomous,
or self-driving, vehicles. It is believed by many that the advent of fully autonomous
vehicles will eliminate the majority of traffic crashes by removing the human error that
occurs during vehicle operation. An autonomous vehicle will not become visually
distracted, can respond faster to external data and stimuli, and can manage significantly
more inputs than a human driver can.
There is a multitude of reasons to continue to develop self-driving cars, including
increased mobility for those who currently cannot drive (such as the blind, elderly, or
children), potential for improved operations on the roadway, reduced emissions, and most

2
importantly, increased safety. Since the vast majority of crashes are caused by human error,
it is logical to think that removing the human from the equation will reduce the error. For
this reason alone, to save human life, it is an honorable and worthwhile development to
explore the reality of that assumption, and if true, to find ways to put it into effect. Just as
with any new technology, there are also downsides to implementation.
While most of the risks of autonomous vehicles are similar to current driver-
operated vehicles, namely loss of life, injury and property damage, there is a sense of
expectation that the computer-programmed and operated vehicles will be perfect and
should not cause any crashes. In the individual cases of crashes caused by humans, even
when there is a tragic loss of life or injury, the human capacity to forgive other humans for
their reaction in a tough situation comes in to play. The same human forgiveness does not
as easily apply in the event of a computer-decided crash or loss of life when the human
involved in the crash cannot connect with the human who made the programming decision.
Furthermore, these vehicles, which are highly technical and constantly connected
to the surrounding environment through multiple future communication methods, will be
a vast source of personal data. This new era will bring about challenges that are typical of
highly technical and connected communication devices. These include the potential for
hacking, data privacy breaches or misuse, and most important to this research, ethical
concerns.
One significant ethical consideration requiring more research and discussion is the
controversial trade-off between self-preservation versus self-sacrifice in the event of a
crash. This choice between a vulnerable road user such as a pedestrian and the occupant or

3
occupants of the vehicle must be considered prior to the full-scale deployment of
autonomous vehicles. It should also be considered by society at large, as a risk assumed by
society when opting-in to riding in one, or when driving or walking in proximity to an
autonomous vehicle.
To add in another complicating factor, it is important to recognize a shift in the way
people approach morality and ethics in the 21st century. One study conducted by Barna
group in 2016 looked at 1500 people ages 13-18 and 1500 people 19 and older. The study
found that there is an increase in the perspective that morality is flexible over time and
based on individual opinions in younger generations. This begs the question; how this
large-scale technological shift will collide with the propensity towards moral relativism.
Although the timeline in which these vehicles will be commonplace on our roads
is uncertain, it is likely that the generation of young adults who are now in college will be
strongly impacted in the implementation and operation of these vehicles, as well as affect
how the vehicles are designed, coded, and launched into the market. As such it is valuable
to gather the opinions of college-aged students from different backgrounds to fully
understand their perspective on these ethical issues. In addition, it will be beneficial to
provide them an additional educational experience and to determine what, if any, changes
in their mentalities occur based on an educational video. Because the members of
Generation Z have been raised in an age of moral relativism, in which right and wrong are
subjective to individual experience, and a collectively agreed upon right and wrong is not
standard, ethical decisions made by this and future generations are more complex compared

4
to past generations. The implications of this complex and nebulous ethical climate will
likely play itself out in ways yet unknown.
While there are studies that explore each of these topics independently, few studies
focus solely on the ethical implications of autonomous vehicles, the pedestrian problem,
and how to agree upon a code of ethics for such a central part of daily life when we cannot
agree on what is and is not ethical.
1.2 Thesis Objectives
The objectives of this thesis are to analyze pedestrian safety data in recent years
with a special focus on how this issue will relate to autonomous vehicles; to explore the
ethical implications of programming autonomous vehicles in various ethical scenarios
where the decision is between the lives of one human and another, specifically pedestrian-
vehicle collisions; and to evaluate the ethical perspectives of the generation that has come
of age in an era of moral relativism, specifically pertaining to self-preservation versus self-
sacrifice. Finally, tying this information together, the objective is to propose several
solutions for addressing this intersection of ethics and technology and where we are going
as a society.
1.3 Thesis Organization
Chapter Two outlines relevant research and literature related to pedestrian safety as
well as the ethics of autonomous vehicles. Chapter Two also describes each of the major
ethical perspectives and compares these perspectives with moral relativism. Chapter Three
outlines the method used in this research. Chapter Four analyzes current United States

5
crash data specific to pedestrians. This data was sourced from the National Highway and
Transportation Safety Administration (NHTSA). Chapter Five transitions into part two of
this thesis, in which data was collected from Clemson University Students regarding their
ethical perspectives and opinions about the ethical programming of autonomous vehicles.
Chapter Five also discusses the survey distributed to the students and summarizes their
responses. Chapter Six describes the responses to in-person interviews following an
educational video and thought experiment with the participants. Chapter Seven is the final
chapter discussing potential mitigations and presenting conclusions.

6
CHAPTER TWO
RELEVANT LITERATURE
2.1 Introduction
This research revolves around the convergence of multiple disciplines namely
transportation safety, as well as autonomous vehicles and ethics. It simultaneously
discusses the increase in traffic-related pedestrian deaths over time, as well as the future
ethical implications of autonomous vehicles in vehicle-pedestrian conflicts. Therefore, the
literature reviewed below touches on pedestrian safety, autonomous vehicle public
attitudes, general ethics, and autonomous vehicle ethics studies.
2.2 Pedestrian Safety
It is well documented that a vital part of pedestrian safety is pedestrian and driver
awareness as well as non-verbal communication between the drivers of vehicles and
pedestrians intending to cross a road. One such non-verbal cue is driver-pedestrian eye
contact, which greatly increases the chances that the driver will stop to let the pedestrian
cross the road safely. A 2015 study of over 2500 drivers in France revealed that 68% of
drivers stopped when a pedestrian made eye contact, compared to 45% that stopped without
making eye contact (Guéguen, Meineri, & Eyssartier, 2015). Drivers are also slightly more
likely to stop for female pedestrians over male pedestrians, at a difference of about 7%. In
the future of autonomous vehicles, it can be assumed that the passengers of the car will be
occupied with other activities and will not be in a position to pay attention to pedestrians
or making eye contact with them.

7
One option for autonomous vehicle to pedestrian communication, proposed by
Mahadevan, Somanath, & Sharlin (2017), anthropomorphizes the vehicle by giving a voice
to the vehicle through an external speaker to communicate with the pedestrian or by putting
actual “eyes” on the front of the car in the place of headlights, that would be similar to
human eyes in that it can subtly communicate whether the car “sees you” and is stopping
or continuing. While this is not yet something that has widespread report, it is an intriguing
approach to solving the eye-contact problem with AVs and pedestrians.
A study conducted by Combs, Sandt, Clamann, & McDonald (2019) studied the
potential benefits and limitations of sensors, which could be used on AVs, for detecting
pedestrians and protecting the life of the pedestrians based on Fatality Analysis Reporting
System (FARS) data. For this study, the authors reviewed the 5,261 pedestrian fatalities in
2015, and determined that 3,386 of them would be preventable with proper sensors. They
concluded that although there are sensors that can help improve safety for pedestrians, there
is a tradeoff between cost and effectiveness. The most effective sensors are costly, perhaps
prohibitively so, for vehicle manufacturers to include and expect consumers to pay for. The
authors also point out that rather than rely on autonomous vehicles to detect the pedestrians,
there could be other systems-based solutions, such as priority zones for pedestrians or more
walkable designed roads, which might out-perform sensors or automated driving for
pedestrian safety.
A risk analysis study conducted by Bhavsar, Das, Paugh, Dey, & Chowdhury
(2017) used fault tree analysis to estimate the risk of the components of AVs and then
validated with real-world data. This study found the largest failure probability is the failure

8
of a communication system. The study also revealed that pedestrian-involved AV crashes
are a potential risk factor in autonomous driving in a mixed-traffic environment which
includes autonomous and non-autonomous vehicles. (Bhavsar, Das, Paugh, Dey, &
Chowdhury, 2017).
Another study by Rahman, Islam, Calhoun, & Chowdhury (2019) developed a
Vehicle-to-Pedestrian (V2P) application with edge computing based real-time pedestrian
detection. This application uses video camera data and determined the necessary bandwidth
by compressing the data at different quality levels and testing accuracy at each level. The
prediction was 98% accurate and reduced the necessary bandwidth from 9.82 Mbits/sec to
0.31 Mbits/sec. As a result, transportation engineers can use this method to detect and
protect pedestrians at intersections (Rahman, Islam, Calhoun, & Chowdhury, 2019).
One paper points out that with the proper implementation of Vehicle-to-Vehicle
(V2V) and Vehicle-to-Infrastructure (V2I) communication along with real-time traffic
management techniques and development of in-vehicle safety systems, it will be possible
to achieve a “zero-accident” infrastructure in the future with autonomous and connected
vehicles. (Sotelo, van Lint, Nunes, Blacic, & Chowdhury, 2012)
2.3 General Ethics
A study by Barna, a non-partisan research company, surveyed 1500 people 18 and
under, as well as 1500 people 18 and older (Barna, 2017). The generations were divided
into the following groups. Generation Z (1999-2015), Millennials (1984-1998), Gen X
(1965-1983), and Boomers (1946-1964). Breaking down the responses by generation, a
noticeable trend by age is depicted in Figure 1. This shows that compared to Generation X

9
and Baby Boomers, Millennials and Generation Z are more likely to strongly agree that
what is morally right or wrong depends on the individual, not the topic. The morality of
Generation Z and millennials is a fluid and relativist framework, based upon individual
opinion.
Figure 1 Moral Relativism by Generation
2.4 Survey Studies
A multitude of surveys have been conducted globally to gauge public interest in
advanced vehicle technologies. The majority of these studies conclude the public is
interested, specifically when there is a sizeable benefit to them, such as a decrease commute
time, a designated lane, or insurance savings. Very few of the studies discuss the ethical
components of autonomous vehicles.
One survey study, conducted by MIT, surveyed over 2 million respondents. This
survey created a multitude of trolley dilemma situations with varying choices. This study
0%
5%
10%
15%
20%
25%
Generation Z Millenials Generation X Boomers
% T
hat "
Stro
ngly
Agr
ee"
Generation

10
found that there are strong cultural differences in terms of ethics. A moral code that fully
addresses all these differences will be challenging to develop (Awad, et al., 2018).
A 2013 study conducted by carinsurance.com found that 75% of the respondents
believed they can drive better than an autonomous vehicle. When asked who should build
these AVs, the majority (54%) trust car manufacturers such as Honda or Toyota over
technology companies like Samsung or Google (CarInsurance.com, 2013).
A 2013 focus group study conducted by KPMG found that when discussing AVs
with women, the topics tended to focus on the positives of increased mobility. Men,
however, were more concerned about the negatives of digitally enforced speed limits and
the loss of personal choice (KPMG, 2013).
2.5 Autonomous Vehicles and Ethics
A 2014 study by Hevelke and Nida-Rümelin discusses the ethical implications of
autonomous vehicles in the instance of a crash (Hevelke & Nida-Rümelin, 2015). It is
assumed that the institution of autonomous vehicles will result in less frequent and less
severe crashes, otherwise, there would be no support for this technology. Indeed, there are
moral upsides if lives are saved. However, there is an ethical theory called “trading lives”
in which a non-victim in the current climate will become a future victim when new
technology is implemented. That is, someone who would not be in a car crash if
autonomous vehicles are never introduced will be in a crash if they are introduced. This is
a trade-off with ethical implications. One example of this is seat belts. In almost every case,
a seat belt is a life-saving device. However, in some situations, the seat belt can be the
cause of death. This is not reason enough to eliminate seat belts, because the overall effect

11
is life-saving. The same theory applies to autonomous vehicles if indeed the crash rates
will be as low as predicted. According to Hevelke and Nida-Rumelin (2014), the more
likely liability in an autonomous vehicle world will be a scenario in which all users share
the risk by way of a tax or mandatory insurance. An alternative liability scenario is that of
the user at the time of the incident is at fault. However, we do have a moral responsibility
to save lives, and must work out the details of how to make this happen.
Another study published in 2014 by Noah Goodall examines the ethics of
autonomous vehicles (Goodall, 2014). Goodall points out that safety applications of a
vehicle have a very short time frame to react, and thus the vehicle must be programmed in
advance to make a quick decision. However, in today’s society of varying ethical
perspectives, the experts disagree on how to best implement ethics into a vehicle. He goes
on to discuss nine points related to autonomous vehicles and the ethics involved. Amidst
these points, he notes, as many who have commented on ethics and autonomous vehicles
often do, that the famous “trolley problem” in which the subject has a choice between two
options (i.e. kill a child in the roadway or kill three adults in the lane over) is unrealistic.
Because there are so many unknown outcomes and consequences of a vehicle crash, the
complexity of an ethical decision is significantly increased. Goodall also points out that the
idea that an autonomous vehicle should simply minimize damage at all times is a utilitarian
ethical system which does not recognize the rights of the individual. After challenging the
nine main critiques of ethical considerations pertaining to autonomous vehicles, Goodall
explores other relevant work in moral modeling and machine ethics. He concludes that in

12
order to best develop an ethical machine, there will need to be a combination of ethical
theories implemented within the vehicle code.
A 2015 study at Stanford University by Gerdes and Thornton attempts to identify
implementable ethics (Gerdes & Thornton, 2015). The authors come to the same
conclusion that there is no one best fit for programming ethical decision-making into an
autonomous vehicle, and therefore a combination of ethical approaches must be used. The
authors also discuss the possibility of a human override, which they say results in yet
another ethical concern. Is it ethical to turn responsibility and control over to the human if
the vehicle has data to say that a collision is assured? The answer, the authors say, is to
understand what our society expects from autonomous vehicles. Whether they will be
expected to “take responsibility” for negative consequences or if they are just vehicles with
improved capabilities.
A 2015 study funded by the U.S. Army in conjunction with the University of
Alabama in Huntsville (UAH) developed a quantitative model called the “Metric of Evil.”
This model would conceptually model the harm caused by various courses of military
action based on ethical concerns. The researchers took an approach aimed at remaining as
objective and quantitative as possible. Pulling together a team of experts trained in religion,
psychology, ethics, military history, political science, and military command, the
researchers compared the experts’ quantitative analysis against the analysis of the others
and against the results of the models. While this is not directly relevant to autonomous
vehicles, it does pertain to the coding of human ethics (Reed & Jones, 2013).

13
The only current publication regarding an agreed upon Code of Ethics for
Autonomous Vehicles is a 2017 report by the German Ethics Commission on Automated
and Connected Driving (Luetge, 2017). The publication points out that the autonomous
vehicle is not the first “people mover” to have ethical concerns upon automation. The
elevator was equally critiqued, and rightfully so, when it switched from manual to
automatic operation. However, the authors mention that it does not mean that ethical
concerns should be belittled, just because similar technologies that have been criticized for
the same reasons have been successful. This code of ethics addresses all of the topics
covered in this research, such as dilemmatic situations, plus additional topics not discussed
in this thesis, such as liability and security threats. To create this code, a collection of
individuals with different backgrounds came together to discuss various topics. The group
included philosophers, judges, sociologists, automotive specialists, and programmers. The
topics included scenarios resulting in unavoidable harm, data, human-machine interactions,
ethical context beyond traffic, and scope of responsibility for software and infrastructure.
Key ethical rules included the importance of improving safety for all road users as the main
goal of automating transportation systems, the “protection of individuals taking precedence
of utilitarian consideration,” and that the purpose of government and regulatory decisions
to “promote the free development and protection of individuals.” Additionally, they stress
that it is of utmost importance to avoid all ethical conflicts in the programming phase of
developing AVs. When this is not possible, they stressed that “the protection of human life
enjoys top priority in a balancing of legally protected interests.” Finally, they express that

14
“any distinction based on personal features (age, gender, physical or mental constitution)
is strictly prohibited.”

15
CHAPTER THREE
METHOD
3.1 Safety Data and Analysis
In order to better understand the pedestrian vulnerabilities in the United States
today, an analysis of the available data was conducted. This data was sourced from the U.S.
Department of Transportation, the National Highway and Transportation Safety
Association, and the state of California Department of Transportation public data. Based
on this data, it was possible to identify the exact trends and concerns that require attention
in the future. The problem with pedestrians and vehicles will persist even at the advent of
autonomous vehicles. In the absence of other causes which can be programmed, there
spotlight on pedestrian safety requiring even more attention to finding a solution. The
safety of pedestrians is further complicated when a software programmer is the person
responsible for coding into the self-driving vehicle the ethical decision-making process.
Since collisions will still occur, it is essential to come to an agreement on a standard for
how these instances will be best handled.
3.2 Survey Design and Analysis
The data in this survey study were collected in Clemson, South Carolina, on the
Clemson campus. This accessible population was best to understand members of
Generation Z, those born between 1994 and 2015. The respondents to the survey were
required to be between eighteen and twenty-two years old. There were no other restrictions
other than age. An assumption was made that Clemson students are similar to the same age
students in other colleges.

16
The initial survey included 17 questions and was available via Qualtrics through
the Clemson subscription. The survey questions were divided into three parts. The
questions were almost entirely multiple choice and took the respondents approximately ten
minutes. The first part was designed to understand the respondents’ general ethical
decision-making approaches as well as current understanding and opinions about AVs. The
second part examined three different scenarios in which the participants were asked to
identify whether they would choose to preserve their own life or a pedestrian’s life in a
situation where no other solution was possible. While situations such as this will be rare,
understanding the current climate towards self-sacrificing autonomous vehicles is valuable
information for future legislation and general consensus. The third part of the survey
included important ethical markers such as religious upbringing and current practices as
well as general approaches to ethical decisions. The complete survey can be found in
Appendix B.
It is important to note that despite its popularity, this survey does not include the
infamous trolley dilemma. This philosophical mental exercise that has been around for
many years is tempting to conflate with the ethical considerations of autonomous vehicles
however it does not directly apply. The original trolley dilemma question is, is it ethical to
kill one person to save five others? However, in the trolley dilemma, it is the act itself that
is the ethical question. Specifically, the two scenarios are as follows. There is a trolley
barreling down the tracks and its brakes have gone out. On the trolley’s current path, there
are five people that will be killed in the collision. However, you have the opportunity to
pull a lever which will redirect the trolley onto new tracks, therefore only one person, on

17
the other track, will be killed in the crash. In the second scenario, the end result is the same,
one person dies instead of five, but the method is different. The second scenario takes a
different approach. In this scenario, you save the five lives by pushing one person onto the
tracks, thereby stopping the trolley from hitting the others. The ethical distinction here is
the difference between direct responsibility for someone’s death by pushing them versus
the unintended harm of pulling the lever which has a bad side effect but does not
deliberately have ill-intent. It is a question of active versus passive morality. Though it
might seem like semantics, this Doctrine of Double Effect, credited to Thomas Aquinas is
not about who dies or how, but the role that the participant in the thought experiment takes
in the result of loss of life (Aquinas, 1265). While many use this trolley dilemma to talk
about one life versus another, and it is not applicable in this sense, it is applicable when
determining culpability. However, mentioning it in order to remove it from the
conversation is worthwhile.
The final step in the data collection process was to conduct in-person conversations
with the participants. First, each participant viewed a brief educational video produced by
TedEd (Lin, 2017). After viewing the short animation, a brief 5-10-minute conversation
ensued to better understand the perspectives of the participant and determine if they have
changed their mind about any of the situations following the video.

18
CHAPTER FOUR
THE PEDESTRIAN SAFETY PROBLEM
4.1. Data Analysis of Pedestrian Safety in the United States
In the United States today, unintentional injuries are the third leading cause of death
overall, and the number one cause of death in people ages one to forty-four (CDC, 2018).
This category of unintentional injuries includes motor vehicle traffic deaths. In fact, 37,133
traffic fatalities occurred in 2017 alone (Fatality Analysis Reporting System, 2017). A
particularly vulnerable group of road-users people are pedestrians, defined by the
Department of Transportation as “any person on foot, walking, running, jogging, hiking,
sitting, or lying down” when the collision occurs (NHTSA, 2019). Although people might
walk less than they used to, at some point every day, each person is a pedestrian. Since
2009 pedestrian fatalities have been steadily increasing. In 2017, the nearly 6,000
pedestrian fatalities made up 16% of all traffic fatalities. Figure 2 shows the change in
pedestrian fatalities over time despite slowing population growth, according to World Bank
(World Bank, 2019). This section looks at the available pedestrian safety data since 2006.

19
Figure 2 Pedestrian Fatalities by Year vs. Population Growth
In terms of fatalities, age and sex play a large role, as shown in Figure 3. Males are
significantly overrepresented compared to population; three times as likely as females to
die in a traffic collision. Some claim that this is due to an inclination towards risk-taking
compared to more risk-averse females. The occurrence of fatalities by age group is highest
in the 55-64 age group, second highest in the 45-54 age group and third highest 25-34 age
group for men. For women, the age group with the highest fatalities is 45-54, followed
closely by 55-64 and 35-44. These age groups are mobile and therefore walk often, but
aging can begin to take a toll on the ability to recover from injuries.
0.00%
0.20%
0.40%
0.60%
0.80%
1.00%
1.20%
0
1000
2000
3000
4000
5000
6000
7000
2006 2007 2008 2009 2010 2011 2012 2013 2014 2015 2016 2017
Popu
latio
n Gr
owth
Pede
stria
n Fa
talit
ies
Year

20
Figure 3 Pedestrian Fatalities by Age and Sex
The top four causes of motor vehicle traffic fatalities, representing about 70% of
the total fatalities are improper turning, driving under the influence of drugs or alcohol,
unsafe speed, and pedestrian violation. The breakdown of these top four causes is shown
in Figure 4. The frequency of which these instances occur continues to mirror the overall
growth of crash fatalities overall. From this we can conclude that there has been a consistent
presence of improper turning, driving under the influence, unsafe speeds, and pedestrian
violations. Pedestrian violation, such as crossing at mid-block, outside of the crosswalk, or
at do-not walk times at the crosswalk, is the fourth most common cause of traffic fatality
has continued to grow. When autonomous vehicles are introduced, DUI, unsafe speed, and
improper turning will rarely, if ever occur. However, pedestrian violations will still be
present. Consequently, autonomous vehicles must account for pedestrian violations
throughout its travel paths.
0
100
200
300
400
500
600
700
800
900
0-4 5-14 15-24 25-34 35-44 45-54 55-64 65-74 75+
Num
ber o
f Fat
aliti
es
Age and Gender
Male
Female

21
Figure 4 Top Causes of Traffic Fatalities
When a pedestrian is involved in a crash, the police report typically describes the
location or action of the pedestrian at the time of the crash. The majority (73%) of
dangerous collisions between a pedestrian and vehicle occur when the pedestrian was not
at an intersection (i.e., mid-block crossing). A fatality is also more likely to occur at night
when it is dark as well as in crowded urban environments. In all of these conditions,
visibility is limited and thus the pedestrian is in more danger than well lit, spacious,
crosswalk situations. These characteristics are shown in Figure 5.
Furthermore, in 2017, there were 1,605 pedestrian fatalities that involved a sober
driver and a pedestrian who had been drinking. Of those pedestrians, 1,426 had a blood
alcohol content of .08 or greater, which is the legal limit for vehicle operation (FARS,
2017).
2010 2011 2012 2013 2014Pedestrian Violation 363 360 390 432 437Unsafe Speed 396 410 427 436 455DUI 477 539 526 568 569Improper Turning 509 526 578 544 539
0
500
1,000
1,500
2,000
2,500
Num
ber o
f Fat
aliti
es

22
Figure 5 Percentage of Pedestrian Fatalities by Time of Day and Location, 2017
While the majority of pedestrian fatalities are not caused by a pedestrian violation,
the percent of total pedestrian fatalities due to pedestrian violation has increased from 8%
to 9% in the United States from 2010 to 2014, representing an increase of nearly fifty
people per year. This growth is depicted in Figure 6. Each of these categories described in
this section continues to rise, with no sign of slowing down. As the number of pedestrian-
caused fatality crashes grows, the importance of implementing pedestrian protection into
AV programming is essential.
0% 10% 20% 30% 40% 50% 60% 70% 80% 90%
At intersectionNot at Intersection
Other
UrbanRural
DarkDaylight
DawnDusk
Percent of Total
Cras
h Co
nditi
on

23
Figure 6 Fatalities Caused by Pedestrian Violation
4.2 Pedestrian Safety in Cities with 500,000 Population or Greater
Of the 6,080 fatal crashes in 2016, 23% occurred in rural areas, 72% occurred in
urban areas, and 5% occurred in unknown areas. For the purpose of this study, and
according to NHTSA, the distinction between urban and rural areas are based on input by
state highway officials and are confirmed by the Federal Highway Administration
(NHTSA, 2018). While more fatal crashes occur in rural areas, the vast majority of
pedestrian fatalities are in urban areas. This is logical because people are much more likely
to walk in urban areas than rural areas based on the density of destinations in urban versus
rural areas. Focusing solely on the cities in the United States with half a million population
or greater as of 2017 would have eliminated 1,139 of the total 5,997 or 20% of the
nationwide fatalities.
2010 2011 2012 2013 20148% 8% 8% 9% 9%
Total 4302 4457 4818 4779 4910Fatal 363 360 390 432 437
0
1000
2000
3000
4000
5000
6000
Num
ber o
f Fat
aliti
es
Year

24
The average state fatality rate per 100,000 population is 1.69. Some cities have
extremely high fatality per 100,000 population such as Washington D.C., Phoenix, Detroit.
One potential solution would be to focus pilot studies in these areas targeted to reduce the
number and severity of pedestrian crashes. Figure 7 shows the top 34 cities and the fatality
rates per 100,000 population. The darker larger circles show cities that have double or triple
the state average.
Figure 7 Pedestrian Fatality Rate per 100,000 Population
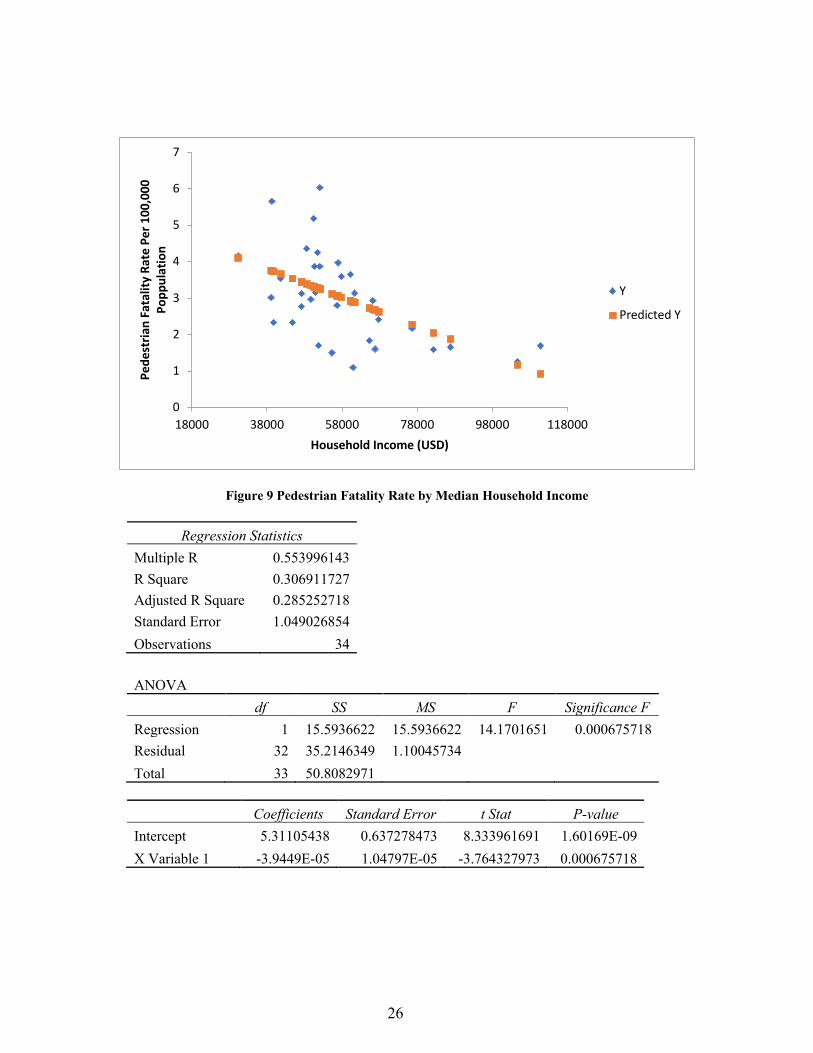
In an effort to determine what makes factors make certain cities more prone towards
high pedestrian fatalities, regression analysis was conducted based on population density
(people per square mile), median household income, and travel time to work. The
pedestrian fatality rate per 100,000 population was the dependent variable, and population
density, median household income, and travel time to work were the designated
independent variables.

25
Based on the United States most populous cities, the results were significant with
small p-values but with low R2 values. Were the data available to add smaller cities and
towns into the analysis, the results of the regression could become more valuable. Figures
8 through 10 show the results of the regression analysis.
Figure 8 Pedestrian Fatality Rate by Population Density
Regression Statistics Multiple R 0.584362699 R Square 0.341479764 Adjusted R Square 0.320901007 Standard Error 1.022531964 Observations 34
ANOVA
df SS MS F Significance
F Regression 1 17.3500053 17.3500053 16.593799 0.00028472 Residual 32 33.45829175 1.04557162 Total 33 50.80829706
Coefficients Standard Error t Stat P-value
Intercept 3.794618037 0.260537244 14.5645896 1.1353E-15 X Variable 1 -0.000127707 3.13503E-05 -4.0735487 0.00028472
0
1
2
3
4
5
6
7
- 5,000 10,000 15,000 20,000 25,000 30,000 35,000
Fata
lity
Rate
Per
100
,000
Pe
ople
People Per Square Mile
Y
Predicted Y
26
Figure 9 Pedestrian Fatality Rate by Median Household Income
Regression Statistics Multiple R 0.553996143 R Square 0.306911727 Adjusted R Square 0.285252718 Standard Error 1.049026854 Observations 34
ANOVA
df SS MS F Significance F Regression 1 15.5936622 15.5936622 14.1701651 0.000675718 Residual 32 35.2146349 1.10045734 Total 33 50.8082971
Coefficients Standard Error t Stat P-value
Intercept 5.31105438 0.637278473 8.333961691 1.60169E-09 X Variable 1 -3.9449E-05 1.04797E-05 -3.764327973 0.000675718
0
1
2
3
4
5
6
7
18000 38000 58000 78000 98000 118000
Pede
stria
n Fa
talit
y Ra
te P
er 1
00,0
00
Popp
ulat
ion
Household Income (USD)
Y
Predicted Y

27
Figure 10 Pedestrian Fatality Rate by Travel Time to Work
Regression Statistics
Multiple R 0.568864667 R Square 0.323607009 Adjusted R Square 0.302469728 Standard Error 1.036315227 Observations 34
ANOVA
df SS MS F Significance F Regression 1 16.44192106 16.44192106 15.30977471 0.000447218 Residual 32 34.366376 1.07394925 Total 33 50.80829706
Coefficients Standard Error t Stat P-value
Intercept 7.114335 1.0639826 6.686514619 1.51106E-07 X Variable 1 -0.152555 0.038989019 -3.91277072 0.000447218
0
1
2
3
4
5
6
7
18 23 28 33 38 43
Peds
tria
n Fa
talit
ies p
er 1
00,0
00 P
opul
atio
n
Travel Time to Work (min)
Y
Predicted Y

28
Perhaps a better indicator for cause of the increase in traffic related fatalities since
2009 is the introduction of the smart phone and the nearly full saturation of ownership as
well as an increase in cell phone use while driving and while walking. The NOPUS
(National Occupant Protection Use Survey) data collection is a survey conducted by human
data collectors observing driver behavior from the roadside (NHTSA, 2017). The data
collected through this process is presented in Figure 11.
Figure 11 Smart Phone Adoption and Use While Driving
As AVs continue to progress towards a greater saturation on the roadway, these
vehicles will continue to drive in and through cities. The presence of AVs on pedestrian-
heavy streets could create new conflicts that need to be resolved and could have ethical
implications we do not currently face in unintentional human reaction caused pedestrian
fatalities. Based on recent trends, pedestrian vehicle crashes will continue to increase.
0.00%
0.50%
1.00%
1.50%
2.00%
2.50%
0.00%
10.00%
20.00%
30.00%
40.00%
50.00%
60.00%
70.00%
2010 2011 2012 2013 2014 2015 2016 % o
f Driv
ers U
sing
Hand
held
Dev
iices
% C
ellu
lar S
atur
atio
n
Year
% Cell Saturation % of drivers visibly using handheld devices

29
Introducing AVs could make the situations more complex where pedestrians at fault are
the contributing factors in the crashes.
4.3 The Pedestrian Safety Problem
For the purpose of this thesis, it is assumed that autonomous vehicles will one day
be the majority of vehicles on the road and will eventually reach full market saturation.
Based on this assumption, it can be concluded that many of the causes of traffic fatalities
can be virtually eliminated through removing the possibility of an intoxicated driver and
by programming the vehicle to obey turning rules, operate within safe speeds, as well as
other traffic laws. Only during a malfunction of the vehicle will it fail to obey the rules of
the road. However, pedestrians will always remain unpredictable and analog. As such, the
pedestrian problem will persist even when we attain 100% autonomous vehicle saturation.
In fact, research shows that much of the pedestrian-vehicle interaction in current
times is heavily reliant upon eye contact between the driver and the pedestrian. Removing
this means of communication will actually increase the uncertainty for pedestrians. While
some pedestrians might err on the side of safety, others will expect the vehicle to be
programmed to stop for them in the roadway, thus increasing their risk-taking behavior.
Furthermore, protecting pedestrians will become a top priority in the absence of so many
other safety concerns in AV environments.
4.4 Autonomous Vehicle Crash Report Audit
Although autonomous vehicles are fairly new to the market, there has already been
a pedestrian death, which took place in Arizona in 2018. While the loss of life in traffic

30
collisions is unfortunately commonplace today, this crash drew extra attention, due to the
involvement of the AV as well as the human driver’s distraction and failure to intervene.
The final report shows that while the vehicle detected the pedestrian a full six seconds
before the crash, the pedestrian was misclassified as an unidentified object, so no action
was taken to avoid her. This crash shows that the technology is not currently advanced
enough to distinguish between humans and other objects in the road on a consistent basis.
As many states continue their pilot testing of AVs, there is an urgent need to address the
failures of the technology, and how to prevent loss of life whenever possible.
The state of California, a hotbed for AV testing, has required AV companies to
submit public incident reports involving self-driving vehicles. The following information
describes the data from an audit of these reports from January 2017 to March 2019 (State
of California Department of Motor Vehicles, 2019).
In this time period, there have been a total of 71 crashes involving Autonomous
Vehicles. While AV manufacturers are required to report every crash in which their
vehicles are involved, even when in manual driving mode, this report includes only those
crashes in which the vehicle was in Autonomous Mode. Of the 71 crashes, the distribution
between months and time periods are found in Figures 12 and 13. The majority of crashes
occurred in March and October, as well as between 2:00 and 5:00 PM. These higher
frequencies might correspond to the overall frequency of trips by AVs in those months and
times of day. However, the frequency with which a company runs its AVs for data
collection is private information, and as such a conclusion cannot be reached regarding
significance of these occurrences.

31
Figure 12 Autonomous Vehicle Crashes by Month
Figure 13 Autonomous Vehicle Crashes by Time Period Perhaps of more significance is the type of crash in which the Autonomous Vehicle
was involved. The frequency of each crash type is shown in Figure 14. Each crash report
includes a description of exactly what happened, which, while providing colorful details,
such as the instance in which a pedestrian purposefully jumped on the hood of the AV, also
allows analysis of what circumstances create a pattern in the crashes. Of the 71 crashes,
0123456789
10
January
February
March
AprilMay
JuneJuly
August
September
October
November
December
Num
ber o
f Cra
shes
Month
02468
101214161820
11:00 PM-2:00 AM
2:00 AM -5:00 AM
5:00 AM -8:00 AM
8:00 AM -11:00 AM
11:00 AM -2:00 PM
2:00 PM -5:00 PM
5:00 PM -8:00 PM
8:00 PM -11:00 PM
No TimeListed
Num
ber o
f Cra
shes
Time Period

32
66% occurred when the AV was rear-ended. In many of these crashes, the report states that
the AV was either waiting for a pedestrian, waiting for cross traffic to pass, or beginning
to accelerate from a stop or red light. While in some cases, such as one in which the vehicle
at fault hit a stopped AV at 39 miles per hour, most occur at a very low speed differential.
Often the report states that the AV was rear ended by a vehicle traveling at less than five
miles per hour. Based on experience and this data, it might be hypothesized that the driver
of the vehicles at fault assumed that the AV would accelerate faster than it did.
Figure 14 Autonomous Vehicle Crash Type Side swipe crashes were the second most common crash type reported. While some
of these crashes were caused by vehicles that drifted into an AV, the majority were vehicles
attempting to pass the AV and cutting it too close. Again, based on experience and
knowledge of human nature, this suggests impatience with the AV, resulting in aggressive
driving by the surrounding humans. Today, AVs are generally programmed to err on the
side of extreme safety in attempt to avoid collisions, but this extreme caution is causing
0369
1215182124273033363942454851
Side Swipe AV RearEnded
IntentionalContact
Vehicle RearEnded by AV
AV hit by bike
Num
ber o
f Cra
shes
Crash Type

33
different collisions in a mixed vehicle roadway, as other human drivers become irritated
with the AVs (State of California Department of Motor Vehicles, 2019).
There are also multiple accounts of a conventional vehicles drifting into the lane of
the AV, and as a response, the AV slows dramatically, causing a rear end collision. It is
difficult to prove whether or not the conventional vehicle at fault was following too close,
but it is possible that a human driver in a similar situation when a car drifts into the lane,
would adjust the trajectory of his or her own car, shifting to avoid the other car, rather than
slow to the point of being rear-ended.
Of all the AV-involved crashes in California since 2017, eleven included a
vulnerable road user. The involvement of pedestrians and cyclists in crashes is shown in
Figure 15. Seven of the crashes involved a pedestrian as a factor. This includes two
instances of intentional contact by a pedestrian, four instances of an AV waiting for a
pedestrian to clear the roadway, and one in which the driver of the vehicle at fault stated
that he or she was distracted by a pedestrian on the sidewalk. There were also four
collisions involving a cyclist, three of which were the fault of the cyclist, who either
intentionally or unintentionally collided with a stopped AV. One was related to a cyclist
in that the AV was stopped waiting for the cyclist to clear the roadway when the AV was
rear-ended by a conventional vehicle.

34
Figure 15 Pedestrian/Cyclist Involvement in AV Crashes
In summary, 100% AV saturation will diminish the likelihood of many of the
scenarios described in this paper, as these are human error based. One of the primary
purposes of autonomous vehicles is by design to improve the driving quality of vehicles.
However, pedestrians are humans, and are unpredictable and cannot be programmed. If
AVs increase mobility and resulting in an increase of Vehicle Miles Traveled (VMT), the
chances of collision circumstances might grow. This problem with pedestrians will persist
even in the era of AVs.
While a collision with a pedestrian based on human error can be understood as a
reaction with no malicious intent, the programming of autonomous vehicles to make these
decisions might not be malicious, but are certainly no longer a reaction, but a pre-decided
outcome. Determining who will make these ethical decisions is unclear at this time.
However, one thing that is clear is the lack of an ethical consensus in today’s moral outlook,
especially in younger generations.
85%
5%
9%
Pedestrian Not Involved Cyclist Involved Pedestrian Involved

35
CHAPTER FIVE
SURVEY RESULTS
The next portion of the study involved distribution of a survey to 30 Clemson
University students. The goal of this study was to understand the ethical decision-making
approaches of members of Generation Z, those born between 1995-2015, and how those
correlated to their ethical decisions in various autonomous vehicle scenarios. This research
assumes that younger generations will be both more involved in the development of, as
well as experience the effects of autonomous vehicles. This assumption is based on the
time it will take before we reach 100% adoption of AVs on the roads, which could be
decades.
The respondents primarily originate from the southeast, but some come from as far
as Seattle, WA and Boston, MA. Figure 16 shows the states represented by the survey
respondents.
Figure 16 Survey Respondents by State

36
5.1 Summary of Survey Responses
The first section of the survey explored general perspectives and opinions. These
questions were asked prior to the ethical scenarios to understand a baseline of how each
participant views different topics such as new technology and general ethical decision
making.
As shown in Figure 17, 77% percent of the participants indicated that they prefer
to wait a period of time before buying into new technology to see if it gets positive reviews,
regardless of whether or not they know the reviewer. Twenty percent indicated that they
are early adopters, likely to purchase a new technology even if no one else has tried it out.
No one indicated a stronger hesitation about technology such as general mistrust. One
person stated that none of the options apply, and that he or she does not buy something new
unless he needs it. These general attitudes towards technology were reflected in the
participants’ attitudes towards autonomous vehicles, in that most respondents do appreciate
and take interest in new technology, and therefore AVs as well.
77%
20%
3%
Wait for reviews Early Adopters Other
Figure 17 Attitudes Towards Technology

37
When asked about their interest level in autonomous vehicles, the following
responses were recorded. Thirteen percent of the participants believe that AV technology
is necessary and should be pursued as a priority. Forty-three percent of the respondents
think that self-driving cars are exciting but not urgently needed on the roads. Twenty-three
percent of the respondents are mildly concerned or intimidated by the technology. Ten
percent of the respondents indicated indifference. One person stated that this technology
should not be pursued at all. Two people explained that none of the options described them.
One person elaborated that he is “hopeful to see the future impact autonomous vehicles
have in society” but is “skeptical about how efficient we could get them to run…they
present an interesting design challenge.” The other stated that he wants to be excited about
this technology but has some doubts regarding the benefits and effectiveness. He explained
that his hesitancy comes from not understanding how it works or how it will affect
passengers or surrounding drivers. The distribution of responses is shown in Figure 18.

38
Figure 18 Attitudes Towards Autonomous Vehicles In terms of ethical decision making, sixty-one percent of the participants indicated
that they base their ethical decisions on the circumstances of the situation, with morality
varying case-by-case. This is the basic definition of moral relativism, with these responses
in line with what is expected based on other studies done. Seventeen percent choose their
course of action based on what he or she believes an ethical person would do (Virtuist).
Eleven percent base their ethical decisions on the expected outcomes (consequentialist).
Eleven percent base their decision on duty to do the right thing (deontologist). The
breakdown of ethical perspectives is shown in Figure 19.
13%
43%
10%
23%
3%7%
Necessary Exciting but not necessary
Indifferent Intimidating
Should not be pursued N/A

39
Despite the common persepective of moral relativism, the majority of the
respondents were raised in religious households, with the most staying involved in that
same religion today. These percentages are presented in Figure 20. While most religions
have a moral code that includes specific directives on what is right and wrong, perhaps this
is shifting as well. Based on this data, there is no observable relationship between religion
and moral code. Whereas one would expect religion to provide moral clarity for its
members, this is not the experience of the participants in this study.
63%17%
10%
10%
Moral Relativist VirtuistConsequantialist Deontological
Figure 19 Ethical Decision-Making Framework

40
Figure 20 Religious Upbringing and Current Participation
The next question asked what party should be primarily responsible for deciding
how autonomous vehicles will be programmed to make moral or ethical decisions. The
most common answer (40%) was industry agencies such as the Society of Automotive
Engineers. This was closely followed by 30% stating the federal government should make
those decisions. Ten percent indicated no opinion on this topic. Ten percent stated state
governments. Seven percent said private companies should make these decisions, and one
person said other, but declined to elaborate on who that should be. These percentages are
show in Figure 21.
0.00%
10.00%
20.00%
30.00%
40.00%
50.00%
60.00%
70.00%
Raised in a ReligiousHousehold and StillParticipate in that
Religion Today
Raised in a ReligiousHousehold and do not
Participate in thatReligion Today
Not Raised in a ReligiousHousehold and NotInvolved in Religion
Today
% o
f Res
pond
ents

41
Figure 21 Party Responsible for Ethical Standards
The next section outlined three specific autonomous vehicle scenarios described in
the following way. “Consider that you are driving a car, when
a(n) (adult/child/animal) runs out into the street when they should not, would you swerve
to avoid them, even if that means that you might get injured or die from hitting a tree, pole,
building, etc.? (Assume that there is not enough time to stop and there are other hazards
such as oncoming traffic or barriers limiting your available options).” The responses to
these questions are shown in Figure 22.
40%
40%
10%
7%
3%10%
Industry Standards Federal Government
No Opinion Private Companies
Other State Government

42
In this section, 84% of the respondents would swerve for an adult, 94% would
swerve for a child and 27% would swerve for an animal. Most of the respondents had
mixed responses, but one person indicated they would always choose self-preservation in
a situation where the only two options were self-preservation or to avoid the pedestrian.
The next question was designed to make participants consider the difference in
what they would do, and what autonomous vehicles should be programmed to do. In this
question, 57% of the respondents stated that the autonomous vehicle should swerve around
a pedestrian and 43% state that the car should preserve the passenger. This is a departure
from what the respondents indicated they themselves would do, indicating that they expect
the AV to operate differently and better than they would as human drivers.
When asked whether or not technology should use demographics as an input in
ethical decision making, 70% stated that things like age, gender, or ability should not be
used as inputs, treating all ages, genders, and abilities equally, while 30% believed the
vehicle should use this demographic data to make ethical decisions.
0% 20% 40% 60% 80% 100%
Swerve for adult
Not swerve
Swerve for child
Not swerve for child
Swerve for animal
Not swerve for animal
% of Respondents
Figure 22 Respondents Driving Decision: Self-Sacrifice vs. Self-Preservation

43
The majority of respondents (70%) either somewhat agree or strongly agree that it
is easier to forgive a human for making a mistake and causing a crash than it is if the car
itself was the cause of the incident, 20% somewhat or strongly disagree, and 10% feel there
is not a difference.
The majority (97%) agree that human life is more valuable than animal life or
property damage either strongly or somewhat, with 3% indicating that they do not agree
that human life is more valuable than animal life or property damage. This allocation is
shown in Figure 23.
Despite the majority concluding that an AV should protect the pedestrian at all
costs, 57% were either somewhat or extremely uncomfortable with this risk to them as the
passenger in the vehicle. Thirty-three percent feel neutral towards an AV programmed to
protect the pedestrian at the peril of the passenger, and 10% feel somewhat comfortable
with this idea.
0.0% 20.0% 40.0% 60.0% 80.0%
Strongly agree
Somewhat agree
Neutral
Somewhat disagree
Strongly disagree
% of Respondents
Figure 23 Value of Human Life

44
5.2 Chi Square Test for Independence
Using JMP Pro 14 to conduct cross-tabulation data analysis, a Chi Square Test was
conducted for independence between a number of variables from the survey. The null
hypothesis is below, with a = 0.05.
Ho – In the population, Variable A and Variable B are independent
Ha – In the population, Variable A and Variable B are not independent
Due to the small sample size of the survey (30), the author failed to reject the null
hypothesis for the majority of the variables, because there was no statistically significant
relationship between the variables at the 5% level. However, in one case, it was concluded
that there is a relationship between religious upbringing/current religious practice and the
use of demographic data for ethical decision making. To account for the cross-tabulation
in which more than 20% of the cells had a predicted count of less than 5, Fisher’s Exact
test was conducted. This resulted in a p-value of 0.0247. The p-value of 0.0247 indicates
that religious participation and use of demographic data for ethical decisions are not
independent of each other within the population and that there is a statistically significant
relationship between the variables. In rejecting the null hypothesis, there is a 2.47% chance
of Type I error. Figure 24 shows the statistical output of the Chi-Square Test for
Independence.

45
Figure 24 Cross Tabulation and Chi-Square Results
The remainder of the variables tested for independence were not statically
significant, but further research may dictate that they become so with a larger population
surveyed. For example, the difference between the observed frequency of swerving for
an animal between males and females was not significant with a p-value of 0.158 > 0.05.
With a larger population, it is possible to see this relationship become significant. The
results of each of these tests can be found in Appendix C.

46
CHAPTER SIX
IN-PERSON INTERVIEW RESPONSES
6.1 Post-Survey Video
The final step in data collection
was an educational video about the
ethical implications of autonomous
vehicles, followed by individual
interviews. The goal of this was to
determine if providing more
information and conducting a thought
experiment would change the minds of
any of the survey participants. For this portion, a Ted-Ed video by Patrick Lin was used
(Lin, 2017). This video summarizes the majority of the ethical concerns when it comes to
Autonomous Vehicles, while ignoring the temptation to talk about the trolley dilemma. As
such, it was the most effective video for the purpose of this study. The video discusses
what might happen if, in an autonomous vehicle traveling down a highway, the passengers
“find themselves boxed in” by a truck in front, an SUV to one side, and a motorcycle to
the other. Suddenly, freight falls off the truck, and the AV cannot stop in time. It must
select one of three options. Prioritizing the passenger safety by swerving to hit the
motorcyclist, the least dangerous option for the AV, hit the cargo that fell, risking the lives
of the passengers in the AV but protecting other road users, or swerve and hit the SUV,
which has the higher safety rating.
Figure 25 TedEd Video Frame

47
The video also addresses a situation in which the options for the AV are to either
hit a motorcyclist on the left who is wearing a helmet, or the motorcyclist to the right, who
is not wearing a helmet. To choose to hit the motorcyclist on the left, knowing that she is
taking safety precautions might save more lives, because the helmet could protect her head,
but at the same time, that decision penalizes her for taking precautions to protect herself.
The other option, to avoid the motorcyclist with the helmet, and hit the one without one
appears to be distribution of street justice. Finally, the video addresses that while these
hypothetical situations are just that, hypothetical, discussing them now will help us to form
the way AVs make decisions in the future.
This video served as a thought experiment for each person, and following the
viewing, a conversation ensued about what was seen, and what their thoughts might be
now that they have considered more information. Each of the following sections
summarizes the conversations after viewing and considering the video.
6.2 Interviewee I
After viewing the educational video in the follow-up interview session, a brief
discussion was held. Interviewee 1 stated that the thing she was most interested in is the
reality that we need to decide who will be making the ethical decisions for AVs. She also
stated that she does not like the idea of having her life in the control of a robot. When asked
how we can reach people to educate them, she stressed the importance of going beyond
those who are already interested, like those in STEM fields, and making sure we reach
students in the arts as well. She follows a lot of what Elon Musk does and is aware that this
technology is progressing quickly. She stated that if we want to reach people her age, she

48
recommends LinkedIn and Twitter. After considering the video and discussing the ethical
implications of autonomous vehicles, she did reconsider her survey response and does not
think demographic data should be used to make an ethical decision.
6.3 Interviewee II
Interviewee II has a particular interest in Tesla and considers himself relatively in
tune with the technology. He thinks it is important for everyone to be educated and believes
that the best way is for car manufacturers to advertise the benefits of AVs. He stated that
the news channels and articles only cover the bad things that happen, and the car
manufacturers need to combat that with the benefits if we are going to keep the technology
moving forward. He stressed that there “is no global right and wrong,” and that morality
depends on the view of the person. He did change his answer regarding forgiving humans
more than computers because of the perspective of a reaction compared to a coded decision.
He thinks that the AVs will always be kept up to date and should not ever malfunction.
This person was the most pro-autonomous vehicle, stating in multiple ways that we need
to embrace it.
6.4 Interviewee III
Interviewee III came into the project having viewed an episode of Minefield, which
discussed the trolley problem. He also had some knowledge on the topic based on the urban
transportation course he is enrolled in. Of all the participants, he was one of the most
educated about the ethical concerns, and also the most hesitant to embrace autonomous
vehicles. He stated that it’s very important for people to stay informed about the ethical

49
considerations of autonomous vehicles, especially if they are going to be a passenger in
one in the future. He thinks that most people are not aware of these issues outside of the
direct industry or academia. In terms of control of the ethical decisions, he stated that
government should do their part to educate people, perhaps through local trainings or ad
campaigns, but is not informed enough to be the ones regulating these decisions. However,
he points out that it will likely need to be done in partnership between private and public
sectors. He stressed that although he's usually quick to adopt new technology, something
this large scale makes him more hesitant. Since it implies that we are giving up control if
we are not the ones programming the vehicles, it takes a big leap of faith to be on board.
Finally, he stated that “a human life is a human life” and everyone should be treated equally
regardless of any data that can be gathered visually by the AV.
6.5 Interviewee IV
Interviewee IV approached this thought experiment differently. He stated that he
likes to be informed before making a decision, with his ethical approach being geared
towards the outcomes. He generally approaches decisions with a pros and cons list and
considers what could happen if he plays out different scenarios. He stated that there is a lot
of ethical grey area while considering AVs and did not have an opinion on these topics
going into the survey or before viewing the video. The one thing that stood out to him
during the video was the tradeoff between two motorcyclists – one with a helmet and one
without.

50
Considering if we should penalize the more responsible rider with a helmet just
because he or she might have a higher survival rate was thought provoking. He believes
that the experts in the fields of the technology, design, and intellectuals should make the
ethical decisions. He is not against government power but does not think they are the ethical
experts. He stated that since he has a selfless temperament, he would swerve for anyone at
his own risk. He is also a vegan, which he explained is why he would also swerve for the
animal scenario. He also stressed that no one has more value than anyone else, and we
should all be on the same playing field. In order to reach people his age or younger, social
media, such as a viral tweet, would be the best way to reach and educate people.
6.6 Interviewee V
Interviewee V was also informed regarding the ethical concerns of autonomous
vehicles, though extremely supportive of the technology. He is considering pursuing a
career in the field of autonomous vehicles from the hardware perspective. He believes the
most important task to address is what activities are allowed for the passengers of
autonomous vehicles. He thinks that most people are uninformed about AVs, and don’t
trust the technology. He says he gets most of his information from reddit. He stated that he
was the driver in his friend’s car that has adaptive cruise control and even he, as someone
who is very pro-AV did not trust it for the first five or so minutes. He stated that he thinks
that the car manufacturers should be the ones to decide how their cars will make ethical
decisions and can even use these features as selling points in advertising. He stated that in
the event that something goes wrong, the car companies know they will be in the spotlight
and will have to answer to a public outcry. He also believes that the vehicle should protect

51
the passenger at all costs, pointing out that cars now do not have external pedestrian safety
features. He does not believe that is the responsibility of the car.
6.7 Interviewee VI
The final interviewee stated that she was somewhat familiar with some of the
ethical concepts and the general pros and cons of autonomous vehicles from her Urban
Transportation course. She was also most thoughtfully provoked by the consideration
between two motorcyclists, one with a helmet and one without.
She stated that more of the “everyday person” would be supportive of AVs if they were
more educated on the benefits, but in the early stages, people who complain too loudly
could prevent the technology from moving forward. She thinks therefore that it is best to
involve citizens much later in the process, once more AVs are on the road. She certainly
believes that morals are relative and did not have an example of a moral issue that is always
right or wrong. Finally, we discussed what an AV should do in the event of a vehicle-
pedestrian collision. She stated that the in the event that the pedestrian is violating the rules
by crossing at mid-block or not waiting for a crosswalk light the vehicle should continue
its path if it was not able to stop. Personal responsibility dictates that that person should
look before crossing the road.
6.8 Principal Conclusions Based on the Interviews
For the most part, the educational video did not change the minds of the
participants. Their overall mentality stayed consistent even with the new information.
However, everyone did struggle with the ethical questions while we discussed them. In

52
each instance, the participants expressed that these were difficult decisions, and were not
necessarily sure that they had the answers. After watching the video, each interviewee and
I discussed their original survey responses to see if anything had changed, or if they had
anything to add to their answers.
Despite the overall mentality of moral relativism, most people still upheld the
inherent importance and dignity of human life, indicating that they likely agree that there
is moral value to each person. For each of the participants who agreed to participate in the
follow up study, everyone who stated that demographic or visually perceived data should
not be programed into the AVs as part of the ethical framework in the survey maintained
this would be wrong. The one participant, Interviewee I who initially thought this data
should be used to make decisions explained that she misunderstood the question and
thought that just because someone is older, or a certain race or gender should not be used
in this decision.
Conducting post-survey interviews provided context for understanding the opinions
of each of the participants. As each struggled to make these ethical choices, it was obvious
that successfully making these ethical decisions will require a sincere effort of involved
parties and a collaboration of the experts. Weighing out the ethical implications of various
situations is a worthy endeavor for anyone to participate in, and we should encourage this
across all generations.

53
CHAPTER SEVEN
CONCLUSION As hypothesized, the majority of the survey respondents have a moral relativist
ethical framework. This lack of agreement on moral right and wrong could have egregious
results as we struggle as a society to treat each other the way we want to be treated. As
such, it is the author’s conclusion that unless we can instill the same set of values in
everyone, we should not and cannot try to create vehicles that will please everyone.
Based on the results of this analysis, it is likely that the issues with pedestrian safety
will grow and will become more complex when the human reaction is coded out of
existence. The companies developing AVs will need to address ethical considerations that
do not exist in a split-second decision of a human driver. Therefore, there is an urgent need
to address how pedestrians will be identified and treated in autonomous vehicle algorithms.
What level of priority will their individual safety be? What will the output of a one-to-one
comparison of the passenger of an AV versus a pedestrian be, in the event that the vehicle
cannot brake in time to stop a collision?
7.1 Challenges Preventing the Programming of Ethical Vehicles
The challenge of addressing ethical concerns in self-driving vehicles is two-fold.
First, while future generations might not have completely agreed on all right-versus-wrong
arguments, it has undoubtedly become more divided over time. As a society, as we are no
longer on the same page with values or ethical approaches to decision making, it will be an
extreme challenge to agree on how these vehicles should be programmed to act, and what
the vehicles should value. To address this challenge, on the basis of this research, the author

54
believes that public safety discussions should begin at the local government level, elevating
best practices from there to a state government level, before bringing it to a federal
government level. This allows the local citizens and residents to address each situation
more directly in their locality, honoring the framework of our constitution which places
much governmental power at the hands of the state governments.
However, because it is vital that these vehicles work across state lines, gathering
together a consensus of regional states that border one another could be the next step. This
could be followed by a federal evaluation of the state recommendations and the creation of
a limited but adequate code of ethics set to protect the individual as well as address thing
like liability in the event of an unavoidable crash or vehicle malfunction. The final result
of this process could be a federal reinforcement of the value of the human individual,
regardless of race, religion, ability, etc. similar to the Code of Ethics put forth by Germany.
This can be achieved by gathering together a group of trained experts with balanced views
in the fields of ethics, politics, computer programming, business and other relevant
expertise to create the most basic code of ethics that they can agree upon. It is essential not
to overregulate the industry, and to allow for private enterprise to continue to raise the bar
and compete to create the safest and best product. As such this code of ethics should
empower these businesses to progress, while providing minimal limitations, namely the
reinforcement of the protection of individual rights.
It will be challenging to practically implement these broad values to a computer.
Each situation will not be perfectly programmed due to the variety of inputs. There will be
a certain level of adjustment and machine-learning over time. The human brain is vastly

55
capable of judgment in a way that no other being is truly adept. Turning this judgment into
code will be challenging even for the most talented computer scientists. However, with the
freedom to seek this solution and rely on the market to dictate what is and is not acceptable
by people living in this country, a solution can be found.
Another final ethical concern is that the United States does not go the way of the
social rankings like some countries, for fear of using this data as a decision-making factor
in difficult situations. This is obviously an extremely unethical way to approach
programming a vehicle. While it seems far-fetched today, it is vital that we eliminate that
possibility before it even becomes more socially acceptable. This should be included in
the federal code of ethics, protecting people from becoming the sum of their data.
7.2 Education
One important aspect of any new technology is stakeholder education. For example,
when the serious consequences of distracted driving while using a cell phone became clear,
many educational endeavors were undertaken by public and private sector alike. Similarly,
it will be vital to provide all the information possible to those affected by the decisions
made by the producers of the vehicles, the programmers, legislators, and others in power.
Knowledge is power, and people can by and large choose what to do with that information.
A serious effort is being made by USDOT regarding pedestrian safety. A dedicated page
on the NHTSA website called Pedestrian Safety lists a series of resources as well as tips
for safe walking as well as safe driving. In Driver’s Education, we are all taught to be
defensive drivers. Pedestrians would benefit from taking a similar approach of defensive
walking. A similar approach can be taken using webinars, publications, classes, and other

56
media to educate pedestrians on safe use of the sidewalks and roads in the new autonomous
vehicle environment.
As part of the responsibility of the government to protect the safety for the
individuals within a country, the Department of Motor Vehicles, or a future version of this
agency can offer safe pedestrian courses. This is an idea that can be implemented now in
preparation for the future but will require future versions to adapt to the new information
that comes out.
Furthermore, NHTSA could take it upon themselves in these coming months to
spread a similar educational program with informational video and survey to make people
think. Then it could show them where other people stack up so they can realize the reality
of the problem.
7.3 Cyber-Physical Solutions
Some researchers have conducted research to develop a smart phone alert system
for pedestrians which would let them know if they are in the path of a vehicle. However,
this solution relies on pedestrians being on their phones, which already puts them at risk
due to distracted walking.
A preferable approach is to equip the vehicles with applications which can use
pedestrian path direction, or heading, and speed to predict whether or not a pedestrian will
be in the path of a vehicle. Connecting the AV to the surrounding environment and using
available data will make it more effective in avoiding pedestrians and collisions in general.
This can also be implemented in a mixed environment with non-connected vehicles using
variable messaging signs. The flexibility of use in a mixed vehicle environment allows

57
early exploration of the method prior to reaching full saturation and tweaking the algorithm
as technology advances and autonomous vehicles slowly trickle on to the roads. It can also
be assumed that this approach can be implemented with C-V2X, 5G, or whatever low
latency communication methods of the future. More information regarding the importance
of cyber-physical systems can be found in various literature, including Transportation
Cyber-Physical Systems by Deka, Khan, Chowdhury, & Ayres (2018).
7.4 Human Resiliency
While many of the results of this study are inconclusive, this only strengthens the
point that the topic of ethics and autonomous vehicles must be a focus of not only those
involved in the process of developing autonomous vehicles, but society at large. While
most hypothetical scenarios are exactly that, hypothetical, perhaps never occurring in the
real world, AV collisions with pedestrians will persist, and under a brighter spotlight in the
absence of other crashes. Determining the main causes of pedestrian fatalities and
preventing them with AVs will be valuable in the future.
If there is one thing that is certain about the human race, it is that we are inherently
adaptable. As change comes our way, we respond accordingly, adjusting to the new
demands, even if it takes time. Keeping our inherent value as humans in mind, we can
approach this issue with a balanced mindset and clear approach. It will be possible to save
more human lives from vehicle crashes, while also treating each person with dignity.
Allowing private companies to pursue ethically strong and effective AVs should be
a primary focus of any government regulation. This natural competition between different
companies to create the best and safest vehicle, just as they do now with conventional

58
vehicles, will likely result in the best solution, even if it takes time. This can be conducted
within the bounds of a very general code of ethics at the state or federal level, reinforcing
human dignity and value regardless of demographic or societal value.

59
APPENDICES

60
Appendix A: Safety Data
2010 2011 2012 2013 2014
Fatal
Injury
Fatal Injury Fatal
Injury Fatal
Injury Fatal
Injury
PRIMARY COLLISION
FACTOR 1/
Driving or Bicycling Under
Influence of Alcohol or Drug
477
12,567
539 12,347 526 12,540 568 11,861 569 12,351
Pedestrian Or "Other" Under
1
1
Pedestrian Fatalities Year Change from previous year Population Growth4795 2006 0.96%4699 2007 -2.00% 0.95%4414 2008 -6.07% 0.95%4109 2009 -6.91% 0.88%4302 2010 4.70% 0.83%4457 2011 3.60% 0.74%4818 2012 8.10% 0.75%4779 2013 -0.81% 0.71%4910 2014 2.74% 0.75%5494 2015 11.89% 0.76%6080 2016 10.67% 0.73%5977 2017 -1.69% 0.71%
5348.545455 AVG 2.20% AVG
Pedestrian Fatalities by Age and Sex Male Female0-4 47 245-14 81 5215-24 453 17725-34 652 23635-44 582 25845-54 748 29955-64 819 29565-74 394 20375+ 362 206

61
Influence of Alcohol or Drug
Impeding Traffic 2 71 3 83 1 81 2 92 1 106 Unsafe Speed 39
6 49,338
410 48,272 427 48,065 436 48,050 455 49,400
Following Too Closely
3 3,810
4 3,667 5 3,820 3 3,587 1 3,752
Wrong Side of Road
167
5,499
128 5,573 168 5,769 129 5,257 139 4,832
Improper Passing 18 945 24 983 15 989 22 975 19 941 Unsafe Lane
Change 47 6,35
3 43 6,155 45 6,347 56 6,521 54 6,714
Improper Turning 509
21,877
526 21,617 578 21,703 544 21,863 539 22,801
Automobile Right-Of-Way
158
25,062
176 24,837 167 24,374 215 24,247 196 25,622
Pedestrian Right-Of-Way
83 4,364
89 4,402 81 4,569 97 4,199 96 4,588
Pedestrian Violation
363
3,889
360 3,885 390 4,026 432 3,796 437 4,189
Traffic Signals and Signs
112
12,799
129 12,610 137 12,807 138 12,494 130 13,331
Unsafe Starting or Backing
11 3,111
11 3,109 6 2,961 12 2,802 12 2,786
Hazardous Parking 3 100 5 99 1 87 2 96 1 80 Lights
44 3 53 1 59 1 56 1 48
Brakes
33 1 37 1 34
28
30 Other Equipment 1 94 2 90 2 88 2 80 6 86 Other Hazardous
Violation 11 1,67
3 18 1,598 12 1,633 25 1,416 19 1,474
Other Improper Driving
8 818 7 766 8 768 5 687 14 632
Fell Asleep 2/
18
10
8
10
8 Other Than Driver 41 2,33
8 44 2,377 49 2,403 54 2,385 47 2,273
Unknown 60 3,212
56 3,182 75 3,219 49 3,225 60 3,015
Not Stated* 50 3,078
50 3,362 63 3,346 61 3,182 86 3,683
TOTAL 2,520
161,094
2,628 159,115 2,758
159,696
2,853
156,909
2,882
162,742

62
Top Reasons for Fatal Crash 2010 2011 2012 2013 2014 Improper Turning 509 526 578 544 539
DUI 477 539 526 568 569 Unsafe Speed 396 410 427 436 455
Pedestrian Violation 363 360 390 432 437
Pedestrian Crash Data (cont’d)
Frequency by Time Period Crash Type11:00 PM-2:00 AM 3 Side Swipe 182:00 AM - 5:00 AM 2 AV Rear Ended 475:00 AM - 8:00 AM 6 Intentional Contact 28:00 AM - 11:00 AM 14 Hit & Run 711:00 AM - 2:00 PM 12 Vehicle Rear Ended by AV 12:00 PM - 5:00 PM 18 AV hit by bike 35:00 PM - 8:00 PM 68:00 PM - 11:00 PM 9 Vulnerable User InvolvedNo Time Listed 1 Pedestrian Involved 7
Pedestrian Not Involved 64Month Freq. Cyclist Involved 4January 4February 5 AV Motion StatusMarch 9 AV Stopped 31April 1 AV in Motion 40May 5June 5July 8August 7September 7October 9November 8December 3

63
City Data (Demographics vs. Ped Fatality Rate)
City Populatio
n
Pop per
square
mile
Median Age
%Male
Median HH
Income
Mean TT
to Wor
k
%Below
Poverty Level
Average High Temp
Ped Fatalities per
100,000
New York, NY
8,622,69
8
28,70
8
36.6 48 60879 41.8 18 62 1.1
Los Angeles,
CA
3,999,72
9
8,534
35.8 50 60197 31.8 17.4 75 2.9
Chicago, IL 2,716,46
2
11,94
9
34.6 49 55295 34.9 18.6 59 1.51
Houston, TX
2,313,23
0
3,634
33.1 50 50896 27.8 20.6 80 3.16
Phoenix, AZ
1,626,08
5
3,141
33.8 50 52080 26.3 16.8 87 6.03
Philadelphia, PA
1,580,86
3
11,78
2
34.4 47 39759 33.1 25.7 65 2.34
San Antonio,
TX
1,461,62
3
3,171
33.2 49 49711 24.1 18.6 80 2.98
San Diego, CA
1,419,48
8
4,371
34.5 51 76662 24.7 13.1 70 2.18
Dallas, TX 1,341,10
3
3,945
32.4 49 50627 26.8 18.5 77 3.88
San Jose, CA
1,035,35
3
5,833
36.8 50 104675 31.3 8.4 71 1.26
Austin, TX 950,714
2,964
33.4 51 67755 24.1 13.1 80 2.42
Jacksonville, FL
892,064
1,193
35.8 48 51497 25.2 15.1 79 4.26
San Francisco,
CA
884,363
18,85
4
38.3 51 110816 33.9 10 64 1.7
Columbus, OH
881,901
4,034
32.2 49 51708 21.6 19.8 63 1.71
Fort Worth, TX
876,060
2,541
32.9 49 60205 27 12.9
3.66

64
Indianapolis, IN
857,386
2,372
34.2 48 47225 23.4 17.5 63 3.13
Charlotte, NC
859,052
2,806
34.4 48 61350 25.4 12.4 71 3.14
Seattle, WA 724,764
8,645
35.6 50 86822 28.3 11.1 61 1.66
Denver, CO 704,621
4,596
34.5 50 65224 26 12.2 64 1.84
Washington, DC
693,972
11,35
1
34 47 82372 30.8 16.6 67 1.59
Boston, MA
683,015
14,12
8
32.3 48 66758 30.8 18.7 59 1.61
El Paso, TX 683,583
2,656
33.4 49 44754 23.2 19.3
2.34
Detroit, MI 673,103
4,852
34.6 47 30344 25.4 34.5 59 4.16
Nashville, TN
665,967
1,399
34.3 48 57737 24.8 14.6 70 3.6
Memphis, TN
652,231
2,055
33.6 47 39333 21.5 24.6 73 5.67
Portland, OR
648,121
4,856
36.8 50 66187 27 14.7 63 2.93
Oklahoma City, OK
643,574
1,062
34.2 50 52062 21.3 15.8 72 3.88
Las Vegas, NV
641,708
4,762
37.8 50 56699 25.2 14.5 80 2.81
Baltimore, MD
611,648
7,556
35.3 47 47131 31.6 22.2 65 2.78
Milwaukee, WI
595,365
6,191
31.9 48 39098 22.4 25 56 3.02
Albuquerque, NM
558,558
2,984
37 49 50456 22 15.2
5.19
Tucson, AZ 535,676
2,260
34.1 50 41613 22.3 22.1
3.55
Fresno, CA 527,422
4,644
31.5 49 48600 22.7 23.7
4.36
Sacramento, CA
501,890
5,141
35.2 49 56943 26.3 15.6 74 3.98
Autonomous Vehicle Crash Audit
Month Year Time Self-Driving
vehicle in motion?
Other Vehicle in motion?
Crash Type
5 18 12:15 AM
Yes Yes Side Swipe, passing vehicle
3 19 1:29 AM
Yes Yes Rear End hit and run

65
3 18 1:54 AM
Yes Yes Rear End, Cyclist in roadway, AV Slowed, taxi rear ended and drove away
10 17 2:35 AM
Yes Yes Rear End, Driver Leg Cramp
9 17 3:20 AM
Yes Yes Rear End
2 19 6:04 AM
Yes Yes Rear End
11 18 6:33 AM
No Yes Side swipe hit and run
2 19 6:56 AM
No Yes Rear End
5 18 7:27 AM
Yes Yes Rear End, waiting for pedestrian, AV stopped
7 18 7:35 AM
Yes Yes Pedestrian intentionally hit the AV
10 17 7:40 AM
Yes Yes Rear End, Pedestrian entered roadway, AV slowed, rear ended
8 18 8:18 AM
Yes Yes Rear End
8 18 8:23 AM
Yes Yes Side Swipe, passing vehicle, hit and run
2 17 8:38 AM
Yes Yes Rear End
2 19 9:08 AM
No Yes Rear End
10 17 9:16 AM
Yes Yes Side Swipe, passing vehicle
12 17 9:34 AM
Yes Yes Side swipe, Van in front slowed, AV stopped lane change, motorcycle had cut in, and noticing the AV coming back,
fell over, motorcycle determined at fault 8 18 9:36
AM Yes Yes Side Swipe, passing vehicle
6 18 9:41 AM
Yes Yes Rear ended by another AV in conventional mode
1 18 9:43 AM
No Yes Rear End, waiting for Pedestrian,
12 18 9:59 AM
Yes Yes Side Swipe, passing vehicle
12 18 10:34 AM
No Yes Stopped for cyclist, hit front of the car, rode away
3 17 10:36 AM
No Yes Side Swipe in construction Zone
5 18 10:50 AM
No Yes Rear end
7 17 10:54 AM
Yes Yes Side swipe
1 18 11:12 AM
Yes Yes Side Swipe, passing vehicle
11 18 11:16 AM
No Yes Rear End
1 19 11:29 AM
Yes Yes Rear End
11 18 11:30 AM
No Yes Rear End
6 17 11:48 AM
Yes Yes Rear End hit and run

66
4 18 12:17 PM
No Yes Rear end, hit and run
9 18 12:21 PM
Yes Yes Rear End
3 18 12:53 PM
Yes Yes Side Swipe from rear, aggressive driver multiple lane changes
3 18 12:55 PM
Yes Yes Rear end
3 17 1:30 PM
Yes Yes Rear End
10 17 1:34 PM
Yes Yes Side Swipe, passing vehicle
8 18 1:55 PM
No Yes Rear End
8 18 2:25 PM
Yes No Rear End
10 18 2:31 PM
No Yes Rear End
7 18 2:47 PM
No Yes Rear End
6 18 2:52 PM
Yes Yes Rear End
7 18 2:56 PM
No Yes Rear End
8 18 2:58 PM
No Yes Rear End
3 18 3:12 PM
Yes Yes Side Swipe, passing vehicle
7 18 3:15 PM
No Yes Side Swipe, passing vehicle
11 18 3:25 PM
No Yes Rear End
9 18 3:47 PM
No Yes Side swipe
5 18 3:51 PM
No Yes Broadside by vehicle leaving parking spot
7 18 4:03 PM
No Yes Rear End
10 17 4:06 PM
No Yes Rear End, Scooter entered roadway, AV slowed, rear ended
11 18 4:30 PM
No Yes Rear End
3 17 4:50 PM
Yes Yes Rear End
7 18 4:52 PM
Yes No AV rear ended conventional vehicle
9 18 4:58 PM
No Yes Rear End
2 18 4:58 PM
Yes Yes Side Swipe, passing vehicle
5 17 5:26 PM
Yes Yes Rear End, Cyclist
10 17 5:41 PM
No Yes Rear End, Pedestrian entered roadway, AV slowed, rear ended
7 18 5:52 PM
No Yes Rear ended

67
9 17 6:20 PM
No Yes Rear End, Driver on Cell Phone
8 18 6:52 PM
Yes Yes Side Swipe, passing vehicle
9 18 7:03 PM
No Yes Rear End
6 18 8:29 PM
No Yes Rear end
3 18 8:34 PM
Yes Yes Rear end, hit and run
10 18 9:07 PM
No Yes Rear End
10 17 9:09 PM
No Yes Rear end, distracted driver
9 17 9:09 PM
Yes Yes Rear End
11 18 9:16 PM
Yes Yes Cyclist in violation of red light hit the autonomous vehicle
1 18 9:27 PM
Yes Yes Pedestrian intentionally hit the AV
11 18 10:04 PM
No Yes Rear End
11 17 10:05 PM
Yes Yes Side swipe, driver did not shift with lanes
6 17
Yes Yes Rear End

68
Appendix B: Survey for Clemson Students
The following survey dives into various topics such as technological attitudes, general ethics and morality, as well as ethics related to autonomous vehicles. A fully autonomous vehicle is a vehicle in which here is no human driver, and the car drives itself. Essentially, the car is programmed to have its own “brain” and make decisions. These decisions include things such as distance between your car and the car in front of you, best route to take to a destination, and things like what to do when there might be a collision with another vehicle, person, animal, or object. Certain questions on this survey are required in order for the research team to draw conclusions. However, you are free to abandon the survey at any time if you do not want to complete a required question. None of the information that is linked to your identity will be published. Your email, collected for purposes of contacting you during this study, will be kept in a password protected document and will be destroyed at the completion of the project. The survey will likely take you less than ten minutes to complete. Introductory Questions
1. Which of the following best describes your perspective on technology?
a. I regularly anticipate and embrace new technology. I like to be the first of my friends to own new gadgets.
b. I like to wait a period of time before purchasing a new piece of technology to see if others give it positive feedback, such as online reviews, even if I do not know the reviewer.
c. I usually wait until my family or my group of trusted friends have tried something new before I try it.
d. I do not often embrace new technology because I am wary of it regardless of family, friends or other positive reviews.
e. None of these describe me. Explain. ___
2. When confronted with an ethical or moral situation, which of the following best describes your general mindset or approach?
a. I base my actions on the potential future outcomes b. I base my actions on my moral duty or obligation, regardless of the outcome c. I base my actions on what I think an ethical person would do in the situation d. I base my actions on information relative to each situation on a case by case
basis e. None of these describe me. Explain. ____
Autonomous Vehicle Opinions
3. Which one of the following best describes your thoughts about autonomous (fully self-driving) vehicles?
a. They are an exciting and necessary technology that should be a top priority in the tech world.

69
b. They are an exciting technology that I look forward to using but there is not an urgent need to get them on the roads right now.
c. I’m indifferent and feel neutral about autonomous vehicles. d. They are an intimidating technology that I am hesitant to use myself. e. This technology should not be pursued by the tech world because it will do more
harm than good. I absolutely do not support autonomous vehicles. f. None of these describe my attitude toward technology. Explain. ____
4. When new technologies are introduced, there are often standards, or legal obligations, that are
developed for the new technology. Who do you think should be responsible for the way an autonomous vehicle makes ethical or moral decisions?
a. The federal government b. State governments c. Industry standards (such as the Society of Automotive Engineers) d. Other ___________ e. I do not know.
Driving Scenarios
5. Scenario One: Consider that you are driving a car, and an adult pedestrian runs out into the street when they should not, would you swerve to avoid them, even if that means that you might get injured or die from hitting a tree, pole, building, etc.? Assume that there is not enough time to stop and there are other hazards such as oncoming traffic or barriers limiting your available options.
a. I would swerve to avoid a pedestrian even at the risk of my own safety b. I would not swerve to avoid this pedestrian at the risk of my own safety
6. Scenario Two: Consider that you are driving a car, and a child runs out into the street when
they should not, would you swerve to avoid them, even if that means that you might get injured or die from hitting a tree, pole, building, etc.? Assume that there is not enough time to stop and there are other hazards such as oncoming traffic or barriers limiting your available options.
a. I would swerve to avoid a child even at the risk of my own safety b. I would not swerve to avoid a child at the risk of my own safety
7. Scenario Three: Consider that you are driving a car, and a dog or cat runs out into the street
when they should not, would you swerve to avoid them, even if that means that you might get injured or die from hitting a tree, pole, building, etc.? Assume that there is not enough time to stop and there are other hazards such as oncoming traffic or barriers limiting your available options.
a. I would swerve to avoid a dog or cat even at the risk of my own safety b. I would not swerve to avoid a dog or cat at the risk of my own safety.
Autonomous Vehicle Scenarios

70
8. Consider that you are going to be a passenger in a self-driving car, and it is programmed to risk your life by swerving to avoid killing a human pedestrian that walks out into the street when they should not, what do you think the vehicle should do?
a. I think that the autonomous vehicle should swerve even at the risk of injuring you as
the passenger in the autonomous vehicle b. I think the autonomous vehicle should maintain the course of action even at the risk
of injuring the pedestrian.
9. Consider you are the pedestrian walking out into the street in the previous scenario. Does your view change?
a. I believe the driver/rider of the autonomous vehicle should preserve itself even at the
risk of the pedestrian b. I believe the driver/rider of the autonomous vehicle should sacrifice itself for the
pedestrian
10. Consider that there is technology in which an autonomous vehicle can determine the age, gender, or ability of a pedestrian in the roadway. There is also technology that could effectively hide that data from the computer, making all humans register the same to an autonomous vehicle. Knowing this, which of the following best describes your opinion?
a. I believe that a self-driving car should not use data from any visually perceived factors such as age, gender, or ability to determine a course of action where a collision might occur.
b. I believe that a self-driving car should use data from visually perceived factors such as age, gender, or ability to determine a course of action where a collision might occur.
Agree or Disagree?
11. It would take me a longer time to emotionally process and move on from a collision caused by an autonomous vehicle in which a person or animal was injured than it would to emotionally process and move on from the same situation in which a human driver had made an error and caused the same collision.
a. Strongly agree b. Somewhat agree c. Neutral d. Somewhat disagree e. Strongly disagree
12. Human life should always be valued over animal life or property damage.
a. Strongly agree b. Somewhat agree c. Neutral d. Somewhat disagree e. Strongly disagree

71
Conclusion 13. Now that you have considered these scenarios in which an autonomous vehicle is presented
with a choice between injury of a pedestrian or injury of the vehicle occupants, how comfortable are you with the idea of a “utilitarian” autonomous vehicles where the vehicle might risk injuring the passenger in the vehicle to avoid a collision with a pedestrian or animal?
a. Very comfortable b. Somewhat comfortable c. Neutral d. Somewhat uncomfortable e. Very uncomfortable
14. Would you be willing to participate in a simulation study regarding the scenarios above? The
simulation will take approximately 15-20 minutes on one day. If you are interested, you will be contacted with more information. A $10 Amazon gift card will be provided to participants who complete the simulation.
a. Yes b. No
15. If yes, what is your Clemson email address _____________
Demographics/Identification
16. Birth Month/Year ____ (i.e. 05/1999)
17. Gender a. Male b. Female c. Other __________ d. Prefer not to specify
18. What is your home zip code? (Not your Clemson Zip Code) __________
19. What is your major? (if you have not declared a major, write Undecided) ____________
20. Which of the following best describes your experience regarding your religious upbringing?
a. I was raised in a family that practiced a specific religion which I still practice today b. I was raised in a family that practiced a specific religion which I no longer practice
today c. I was raised in a family that did not practice a specific religion, but I do practice one
today d. I was raised in a family that did not practice a specific religion and I do not currently
practice a specific religion today
21. What is your primary mode of transportation? You may make multiple selections if you use the modes of transportation relatively equally.
a. Personal Vehicle b. Bus c. Bicycle
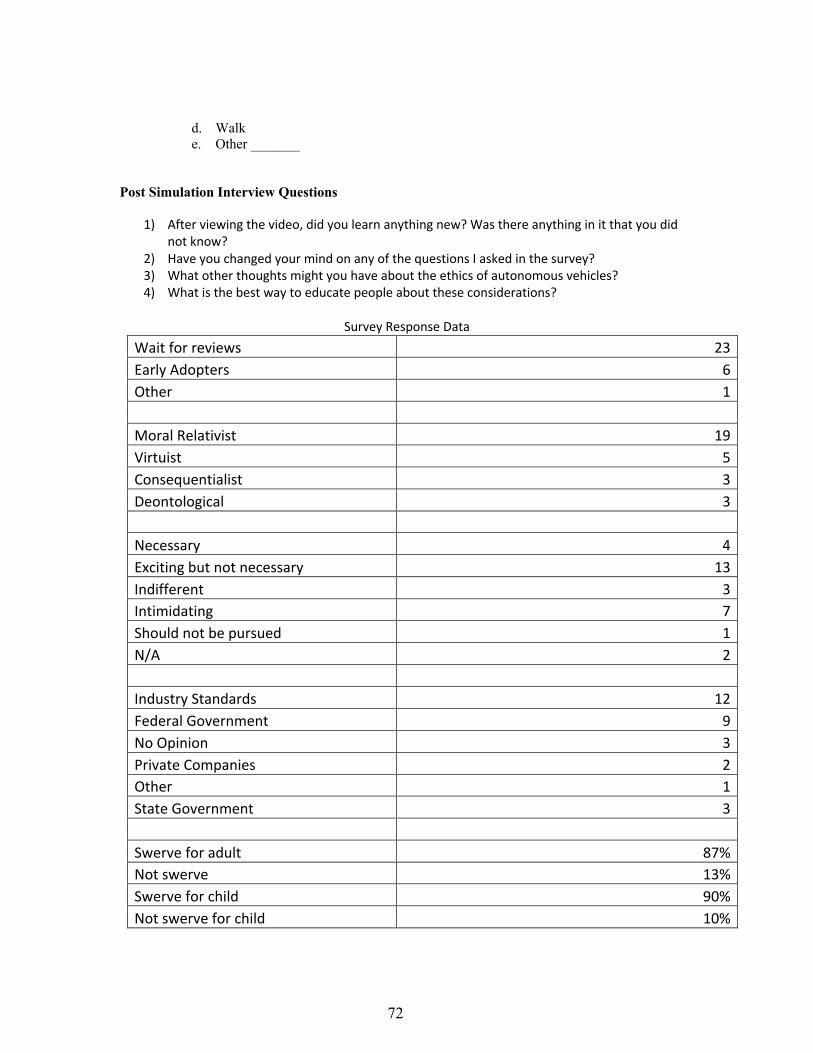
72
d. Walk e. Other _______
Post Simulation Interview Questions
1) After viewing the video, did you learn anything new? Was there anything in it that you did not know?
2) Have you changed your mind on any of the questions I asked in the survey? 3) What other thoughts might you have about the ethics of autonomous vehicles? 4) What is the best way to educate people about these considerations?
Survey Response Data
Wait for reviews 23 Early Adopters 6 Other 1
Moral Relativist 19 Virtuist 5 Consequentialist 3 Deontological 3
Necessary 4 Exciting but not necessary 13 Indifferent 3 Intimidating 7 Should not be pursued 1 N/A 2
Industry Standards 12 Federal Government 9 No Opinion 3 Private Companies 2 Other 1 State Government 3
Swerve for adult 87% Not swerve 13% Swerve for child 90% Not swerve for child 10%

73
Swerve for animal 27% Not swerve for animal 73%
AV should swerve 56.70% AV should not 43%
AV should not use data 70.00% AV should use data 30.00%
Human error Strongly agree 26.7% somewhat agree 43.3% neutral 10.0% somewhat disagree 16.7% strongly disagree 3.3%
Human life value Strongly agree 70.0% Somewhat agree 26.7% Neutral Somewhat disagree 3.3% Strongly disagree Utilitarian car comfort extremely uncomfortable 10.00% somewhat uncomfortable 46.70% neutral 33.30% somewhat comfortable 10.00% extremely comfortable 0.00%
Religious Experience Raised in a Religious Household and Still Participate in that Religion Today 63.30% Raised in a Religious Household and do not Participate in that Religion Today 26.70% Not Raised in a Religious Household and Not Involved in Religion Today 10%

74
Appendix C: Chi Square Test for Independence Results
Variable A: Moral outlook Variable B: Swerve for animal (1=yes, 2 =no)

75
Variable A: Gender (1=male, 2=female) Variable B: Swerve for Animal (1=yes, 2=no)

76
Variable A: Interest in autonomous vehicles Variable B: A human driver is easier to forgive (1=strongly agree, 5 = strongly disagree)

77
Variable A: Religious experience Variable B: Inherent value of human life

78
Variable A: Moral Outlook Variable B: Swerve for Adult (1=yes, 2=no)

79
Appendix D: Institutional Review Board (IRB) Application

80

81

82

83

84
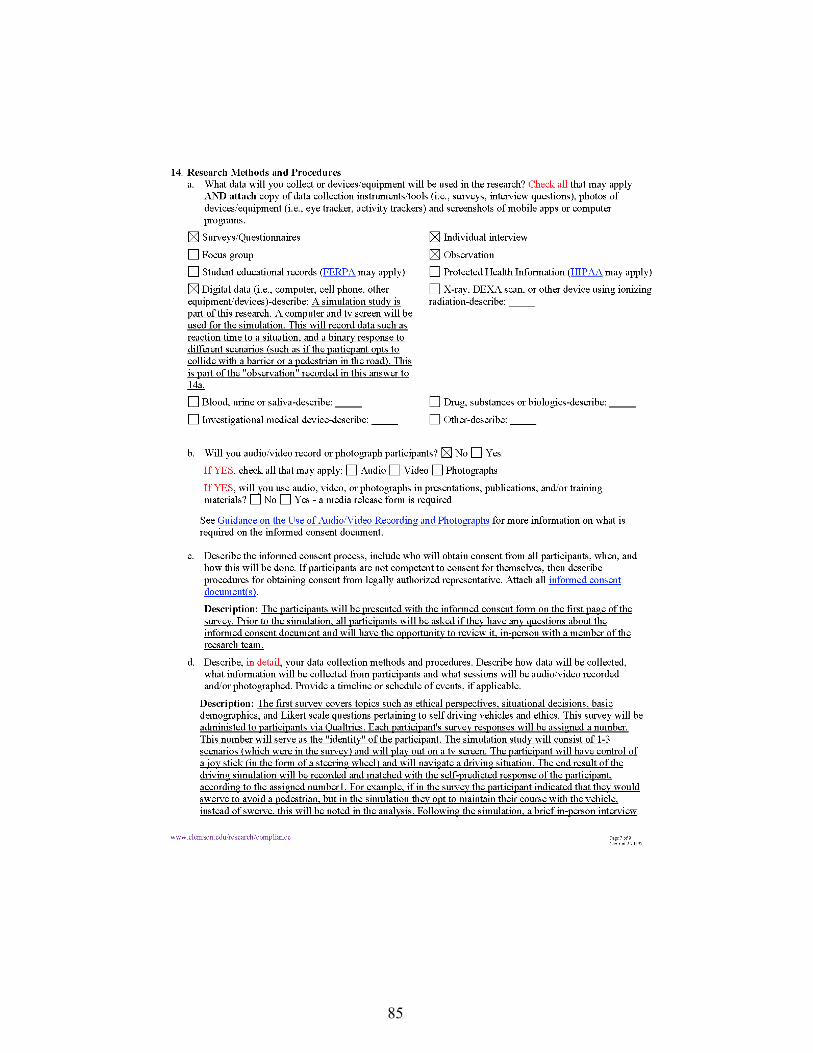
85

86

87

88
REFERENCES Aquinas, T. (1265). Summa Theologica, Question 64, Article 7. Awad, E., Dsouza, S., Kim, R., Schulz, J., Henrich, J., Shariff, A., . . . Rahwan, I. (2018,
October 24). The Moral Machine Experiment. Nature Internation Journal of Science, pp. 59-64.
Barna. (2017). Generation Z Morality. Retrieved from Barna Research:
https://www.barna.com/research/gen-z-morality/ Bhavsar, P., Das, P., Paugh, M., Dey, K., & Chowdhury, M. (2017). Risk Analysis of
Autonomous Vehicles in Mixed Traffic Streams. Journal of the Transportation Research Board(2625), 51-61.
CarInsurance.com. (2013, September). Carinsurance.com. Retrieved from Autonomous
Cars Ready: http://www.carinsurance.com/Articles/autonomous-cars-ready.aspx Combs, T., Sandt, L., Clamann, M., & McDonald, N. (2019). Automated Vehicles and
Pedestrian Safety: Exploring the Promise and Limits of Pedestrian Detection. American Journal of Preventative Medicine, 1-7.
Deka, L., Khan, S., Chowdhury, M., & Ayres, N. (2018). Transportation Cyber-Physical
Systems and its Importance for Future Mobility. In D. Lipika, & M. Chowdhury, Transportation Cyber-Physical Systems (pp. 1-19). Elsevier.
Fatality Analysis Reporting System. (2017). Annual Report File. Goodall, N. (2014). Machine Ethics and Autonomous Vehicles. Springer, 93-102. Guéguen, N., Meineri, S., & Eyssartier, C. (2015). A Pedestrian's Stare and Drivers'
Stopping Behavior: A Field Experiment at the Pedestrian Crossing. Safety Science.
Hevelke, A., & Nida-Rümelin, J. (2015, June). Responsibility for Crashes of
Autonomous Vehicles: An Ethical Analysis. Science and Engineering Ethics, 21(3), 619-630.
KPMG. (2013). Self-Driving Cars: Are We Ready? KPMG. Lin, P. (2017, December 8). The Ethical Dilemma of Self-Driving Cars. Retrieved from
YouTube: https://www.youtube.com/watch?v=ixIoDYVfKA0 Luetge, C. (2017, December). The German Ethics Code for Automated and Connected
Driving. Philosophy & Technology, 30(4), 547-558.

89
Mahadevan, K., Somanath, S., & Sharlin, E. (n.d.). Communicating Awareness and Intent in Autonomous Vehicle-Pedestrian Interaction. University of Calgary.
National Highway Traffic Safety Administration. (2017, June). Crash Stats: Driver
Electronic Device Use in 2016. Retrieved 2019, from Department of Transportation: https://crashstats.nhtsa.dot.gov/Api/Public/ViewPublication/812426
NHTSA. (2017). Traffic Safety Facts: Pedestrians. Washington, D.C.: Department of
Transportation. NHTSA. (2018). Traffic Safety Facts: Pedestrians. Washington, D.C.: Department of
Transportation. NHTSA. (2019). Traffic Safety Facts: Pedestrians. Washington, D.C.: Department of
Transportation. Rahman, M., Islam, M., Calhoun, J., & Chowdhury, M. (2019). Real-Time Pedestrian
Detection Approach with an Efficient Data Communication Bandwidth Strategy. Transportation Research Record: Journal of the Transportation Research Board, DOI: 10. 1177 / 0361198119843255, (2019)
Reed, G. S., & Jones, N. (2013, October). Toward Modeling and Automating Ethical
Decision Making: Design, Implementation, Limitations, and Responsibilities. Topoi, 32(2), 237-250.
Sotelo, M. Á., van Lint, J., Nunes, U., Blacic, L. B., & Chowdhury, M. (2012, March).
Introduction to the Special Issue on Emergent Cooperative Technologies in Intelligent Transportation Systems. IEEE Transactions on Intelligent Transportation Systems, 13(1).
State of California Department of Motor Vehicles. (2019). Report of Traffic Collision
Involving an Autonomous Vehicle. Retrieved from DMV: https://www.dmv.ca.gov/portal/dmv/detail/vr/autonomous/autonomousveh_ol316
World Bank. (2019). Population Growth. Retrieved from
https://data.worldbank.org/indicator/sp.pop.grow