Embed Size (px)
Citation preview
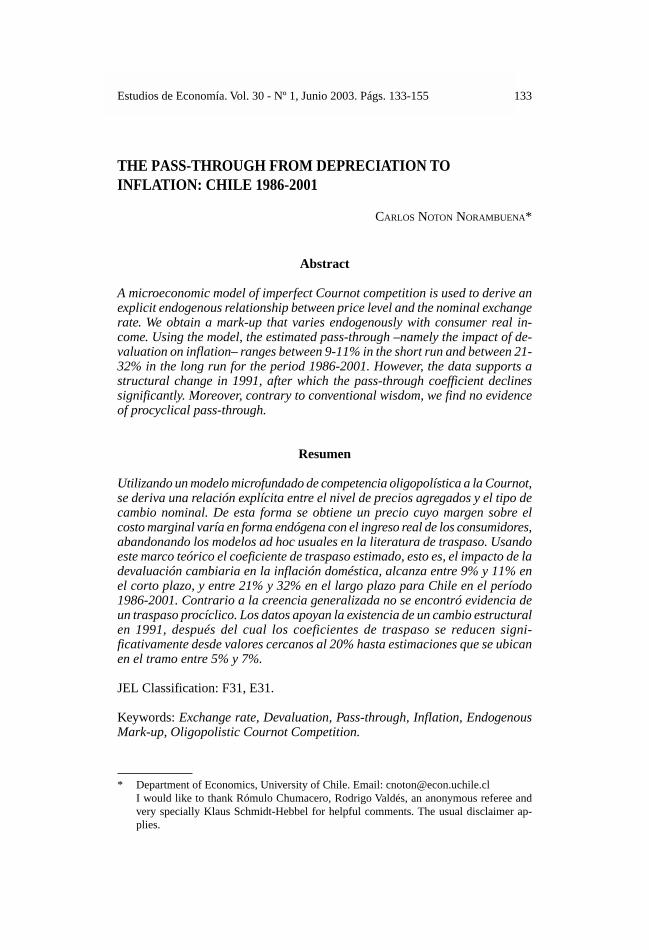
The Pass-through from Depreciation… / Carlos Noton Norambuena 133Estudios de Economía. Vol. 30 - Nº 1, Junio 2003. Págs. 133-155
THE PASS-THROUGH FROM DEPRECIATION TOINFLATION: CHILE 1986-2001
CARLOS NOTON NORAMBUENA*
* Department of Economics, University of Chile. Email: [email protected] would like to thank Rómulo Chumacero, Rodrigo Valdés, an anonymous referee andvery specially Klaus Schmidt-Hebbel for helpful comments. The usual disclaimer ap-plies.
Abstract
A microeconomic model of imperfect Cournot competition is used to derive anexplicit endogenous relationship between price level and the nominal exchangerate. We obtain a mark-up that varies endogenously with consumer real in-come. Using the model, the estimated pass-through –namely the impact of de-valuation on inflation– ranges between 9-11% in the short run and between 21-32% in the long run for the period 1986-2001. However, the data supports astructural change in 1991, after which the pass-through coefficient declinessignificantly. Moreover, contrary to conventional wisdom, we find no evidenceof procyclical pass-through.
Resumen
Utilizando un modelo microfundado de competencia oligopolística a la Cournot,se deriva una relación explícita entre el nivel de precios agregados y el tipo decambio nominal. De esta forma se obtiene un precio cuyo margen sobre elcosto marginal varía en forma endógena con el ingreso real de los consumidores,abandonando los modelos ad hoc usuales en la literatura de traspaso. Usandoeste marco teórico el coeficiente de traspaso estimado, esto es, el impacto de ladevaluación cambiaria en la inflación doméstica, alcanza entre 9% y 11% enel corto plazo, y entre 21% y 32% en el largo plazo para Chile en el período1986-2001. Contrario a la creencia generalizada no se encontró evidencia deun traspaso procíclico. Los datos apoyan la existencia de un cambio estructuralen 1991, después del cual los coeficientes de traspaso se reducen signi-ficativamente desde valores cercanos al 20% hasta estimaciones que se ubicanen el tramo entre 5% y 7%.
JEL Classification: F31, E31.
Keywords: Exchange rate, Devaluation, Pass-through, Inflation, EndogenousMark-up, Oligopolistic Cournot Competition.
Estudios de Economía, Vol. 30 - Nº 1134
I. INTRODUCTION
Is there a theory that supports a pass-through from devaluation to inflation?What is the magnitude of this supposed transfer? What determines the pass-through? Is this relationship constant all of the time? These are the questionsthat we will try to answer, using Chilean data from the period 1986-2001.
The importance of the relationship between the nominal exchange rate anddomestic prices is crucial for all those countries that must decide its interven-tion when faced with movements in the nominal exchange rate (NER). Theabandonment of a fixed exchange rate regime also brings the same concernabout repercussions in national prices because of the free exchange rate move-ment. Therefore, the decision of some degree of exchange rate intervention orits absence will be conditioned by the prospective magnitudes of the mentionedpass-through. Likewise, this determination could consider the macroeconomiccontext in which the exchange movements are made, not allowing for a con-stant pass-through in all eventualities or a structural break.
There is a vast body of literature about the relationship between the nominalexchange rate and prices. In the theoretical field (Dornbusch 1987, Taylor 2000),there are recurrent contexts of oligopolistic competition or slow adjustment ofprices to justify an incomplete pass-through or one conditioned by other factors.
There are two extreme theories about setting prices on tradable goods. First,Producer-Currency pricing: in this perspective the law of one price is assumedto hold across all individual goods, as in Obstfeld and Rogoff (1998). If it holdstrue, there is a full pass-through at least in all tradable goods.
Second, Local-Currency pricing supports completely the disconnection be-tween NER and prices, so pass-through is equal to 0%. That is because exportfirms can set their prices in foreign currencies (home and foreign markets aresegmented), so in the short run its decisions are not affected by NER changes.Devereux, Engel and Storgaard (2003) show firms that choose the currency inwhich to set their prices, so an endogenous pass-through arises.
Another vision centered the attention on distribution cost for a retail sale,which is to incorporate a non-tradable cost in a tradable sector, so domesticfactors arise in costs and incorporate a wedge between retail prices in differentcountries and obviously the shift in tradable / non-tradable relative price.Burstein, Neves and Rebelo (2001) found that this cost is really important (40%in US tradable price) and studied this implication for exchange rate basedstabilizations.
Those theories just consider tradable goods, but Kikuchi and Sumner (2002)emphasized that the NER effect on long run export price is only through rawmaterial import prices. Given that in Chile imported inputs are very important, itjustifies a pass-through analysis from NER to aggregate consumer domestic price.
In the empirical literature (Feenstra and Kendal (1994), Borensztein and DeGregorio (1999), Goldfajn and Werlang (2000), Campa and Goldberg (2002)),we find an incomplete pass-through whose magnitude is notably dissimilaramong countries, spells of time and macroeconomic contexts.
For American countries Goldfajn and Werlang (2000) found a pass-throughclose to 20% in a 3-month horizon analysis. After, the pass-through coefficientincreases the longer the time horizon analyzed. The NER pass-through coeffi-cient has its maximum value in a 12-month horizon.
The Pass-through from Depreciation… / Carlos Noton Norambuena 135
For Chile in particular, García and Restrepo (2001), assumed sticky pricesin the short run that makes price changing costly, so they derive an equation forprices and wages. Modeling wages and prices as I(2) series they find that anominal devaluation has real effects that disappear in the long run.
Bravo and García (2002), using a VAR, estimate a NER pass-through of10% in a year and 20% in two years. Choosing different periods of the samplethey found a decreasing pass-through.
Morandé and Tapia (2002) showed a decreasing coefficient (using a recur-sive VAR), from close to 40% in the middle of the 90’s, to between 10 and 15%at the end of the sample. Through OLS estimations, the authors find that thecoefficient is explained by inflation volatility, output gap, real exchange ratemisalignment and an exchange rate regime dummy. They also suggest otherreasons for a decreasing pass-through: i) shifts in people’s reaction to NERfluctuation, ii) development of financial instruments that allow hedging the ex-change rate risk, iii) reduction of margins in retail activity.
The present paper seeks to contribute to the discussion of pass-through fromdevaluation to inflation at the theoretical level, developing a microeconomicmodel that shows an explicit relationship between the exchange rate and prices.At the empirical level, we estimate the magnitude and temporary characteris-tics of the pass-through in Chile between the years 1986-2001.
The paper is structured as follows: in section II the microeconomic model isdeveloped, relating the nominal exchange rate to domestic prices; in section IIIthe econometric estimations use data from Chile (1986-2001), and finally theconclusions are presented in section IV.
II. THEORETICAL MODEL
The main objective of this model is to develop, starting from microeconomicfoundations, and using a context of oligopolistic Cournot competition, an explicitrelationship between final prices and the NER, which could be conditioned bymicroeconomic theory variables and by other macroeconomic aspects.
II.1. Representative consumer
In this section, after the utility maximization of a representative agent whofaces a budgetary restriction, the demand functions are obtained, whose argu-ments are income and prices. This demand is observable by the firms. They willlater use this demand to determine the optimal price policy.
The representative consumer, who consumes two kinds of goods (tradableand non-tradable) faces an interest rate r. The representative consumer lives forinfinite periods, maximizing his utility, subject to his budgetary restriction, whichis expressed in nominal terms for every period.
( ) { , } ( )
( )
. . : ( ) ˙ ( )
( ) ( )1
1
21
1 1
0C CMax U
C Cexp t dt
s t b rbe
w L F F P C P C
tT
tN
tT
tN
t tt
t t tN
tT
tT
tT
tN
tN
=( )
−
−
∞
= + + + − −
− −
∫ζ ζ χ
χρ
Estudios de Economía, Vol. 30 - Nº 1136
The agent’s utility is determined by the consumption of the quantities CNand CT, to its respective nominal prices PN and PT, b is the stock of internationalassets, and e is the nominal exchange rate (pesos/dollar), ρ is the temporal dis-count rate and (1/χ) is the substitution intertemporal rate. The nominal incomesare represented by wage w (for each unit of work of L); the agent also receivesa FN and FT (payment to a fixed factor of each representative production func-tion (land, or any other specific factor).
To solve this problem, Ponzi games should not be allowed, that is:
(3)T
limr
bT
T→ ∞ +
=1
10
To find the demand functions for both goods, we assume r =ρ, and the usualassumption of NPG. To solve the demand in a simple form, the future nominalprices of each kind must be known, so we assumed that the consumer has staticexpectations:
(4) P P P P jtT
t jT
tN
t jN= = ∀ ≥+ +; 1
Solving the demand for each one of the goods:
(5) CY
PQT
TT d= =ζ
( )
(6) CY
PQN
NN d= − =( )
( )1 ζ
Where Y represents the consumer’s total wealth, in nominal terms:
(7) Y r r e b w L F F rt dtt t tT
tN= + + + + −
∞
∫( ) ( ) exp( )1 0 00
II.2. Representative Firms
In this section the optimal price policy will be derived. We assume a Cournotoligopolistic competition and a representative Cobb-Douglas production func-tion firm, which, using consumer’s known demands, finds a mark-up that de-pends on prices and consumer’s income.
The price policy allows us to bind a steady state, where the firm’s numberwould eliminate any revenues, reaching a zero-profit situation. The next step isto model the price transition after an exogenous change in consumer’s incometo achieve a new steady state.
The Pass-through from Depreciation… / Carlos Noton Norambuena 137
Regarding the production function, it would be a technology with a con-stant marginal cost and a fixed cost; with two inputs:1 work L and a productivefactor M, that represents machinery or any other imported factor (includingretail sales).
The tradable sector includes production and import firms.2 The non-trad-able sector corresponds to production firms of goods for domestic consumptiononly.
The minimization of costs, subject to technology is:
(8) Min C wL sM FL M{ , }
= + +
s.t.: (9) Q A M L= −( ) ( )α α1
where F is the nominal fixed cost, L represents the input work (nominal unitarycost of w) and M is the foreign input, where price s depends on internationalprices IP and the nominal exchange rate e (s=IP*e). Notice that since bothsectors have in their inputs labor and import factors then the nominal exchangerate affects both sectors’ prices.
Total costs are:
(10) C Q w sQ
Aw s F( , , ) ( ) ( )=
( ) −
+−
+− − −1 1
1 1α α α αα
αα
α
Therefore, marginal cost percentage variation is:
(11) CMg w s Aˆ ( ) ˆ ˆ ˆ= − + −1 α α
II.3. Steady State
Once costs structure is defined, we can analyze Nash’s equilibrium in Cournotoligopolistic competition with symmetrical firms. Differences among sectors,are given only by parameters, therefore the reasoning shown can be generalizedto both sectors.
Formally, each firm maximizes profits individually (Πi), according to itsown production consequences on price.
(12) { }( ) ( )
qi
Max P Q q C qi i iΠ = −
Therefore, the first order condition is:
1 Similar to oligopolistic technology in Dixit and Stiglitz (1977).2 See Morandé (1986).
Estudios de Economía, Vol. 30 - Nº 1138
(13)∂
∂+ − ∂
∂=P Q
qq P Q
C q
qii
i
i
( )( )
( )0
where Q represents total production (sum of the individual productions of eachfirm):
(14) Q q nqQ
q
q
qiin
i
jjn
i
= = ∂∂
=∂
∂==
=∑∑
11 1;
The demands (5) and (6), in (13) determine the quantity and equilibriumprice (denoted *), defining the price policy, where n (number of firms), con-sumer preference parameters,3 income and nominal marginal cost are constant.
(15) qn
n
Y
CMg* = −
12
ε
(16) Q nqn
n
Y
CMg* *= = −
1 ε
(17) Pn
nCMg
nCMg* =
−
= +
−
1
11
1
To find a steady state, the number of firms must be adjusted in such a way asto achieve zero-profits, as in Dixit and Stiglitz (1977). The number of firms,until now exogenous, determines quantities, prices and mark-up.
Each firm’s nominal profits are:
(18) Π( )nY
nF=
−ε
2
So that the number of firms allows for profits, however it is clear that rev-enues will attract or will take out firms from the market, thus in a long termperspective, the market will force the firm’s number to this zero-profits condi-tion:
(19) Π( *) *n nY
F
Y
FR
R
= ⇔ = =0ε ε
3 ε could represent both sectors’ parameter: tradable (ξ) or non-tradable (1–ξ).
The Pass-through from Depreciation… / Carlos Noton Norambuena 139
In (19), we can transform the nominal relationship into a real one, using acommon denominator. From the last equation an increase in consumer’s realincome implies that the firms’ number will be greater, so we find an explicitrelationship between the consumer’s real income and the number of firms persector.
II.4. Price Dynamics
Once price policy and long term conditions are characterized, we can intro-duce price dynamics. So that changes in demand, caused by income alterations,move prices and each producer’s quantities.
The transition can be characterized by a partial adjustment in each sector’saggregate production. Thus, exogenous income movement does not imply aninstantaneous adjustment in the firm numbers, nor in each individual produc-tion. This could be due to different technological, financial and legal obstacles,restrictions of capacity, etc. It is assumed that the firm’s entrance or exit fromthe market is gradual, displacing the price-quantity relationship through thenew demand.
The gradual adjustment of individual firm quantity (where t indicates a spe-cific moment in time, and F means new steady production state) will be mod-eled as a simple partial adjustment process, being justified with models likeCalvo (1983):
(20) Q Q Q Q Q Qt F t F t F= − + = + −− −( ) ( )1 1 1λ λ λ
Neither an individual firm’s quantity of goods, nor the number of firms canmake an instantaneous adjustment in the short run. This could be justified be-cause convex investment adjustment costs make a gradual investment of capac-ity optimal. Some congestion in the producer’s requirements forces a non-in-stantaneous adjustment of the number of firms.
Although the transition will not distinguish the movement of each one ofthose variables, their new steady state values are known. We already know thatafter an increase in consumer’s income, the number of firms of each sector andthe long-term production of each firm will be greater; and following the model,the price will be smaller.
Replacing gradual adjustment (20) in goods demand (5) and (6), the equi-librium price is obtained for each instant. We noted 0 for initial state, 1 for thenext one and so on. The final state (and new steady state) is noted by F:
(21) PY
QCMg
n0
0
0 011
1=
= +−
ε
(22) PY
Q
Y
Q Q Q
F F
F F1
1 0=
=+ −
ε ελ ( )
Estudios de Economía, Vol. 30 - Nº 1140
(23) PY
Q
Y
Q Q Qii
F
i
F
F i F+
+=
=+ −
∀ ∈11
ε ελ ( )
; Ν
(24) PY
QCMg
nF
F
F F=
= +−
ε1
1
1
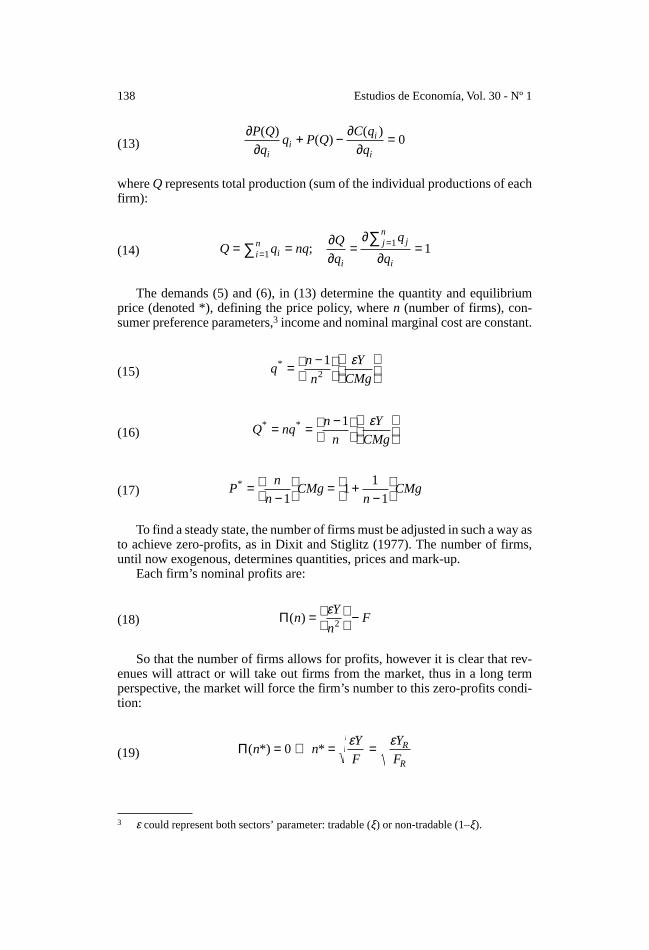
The new steady state is independent of adjustment speed. In the short run, ifthe adjustment is sufficiently gradual, a procyclical mark-up4 can be observed(Graph 1).
4 See proof in appendix 10.
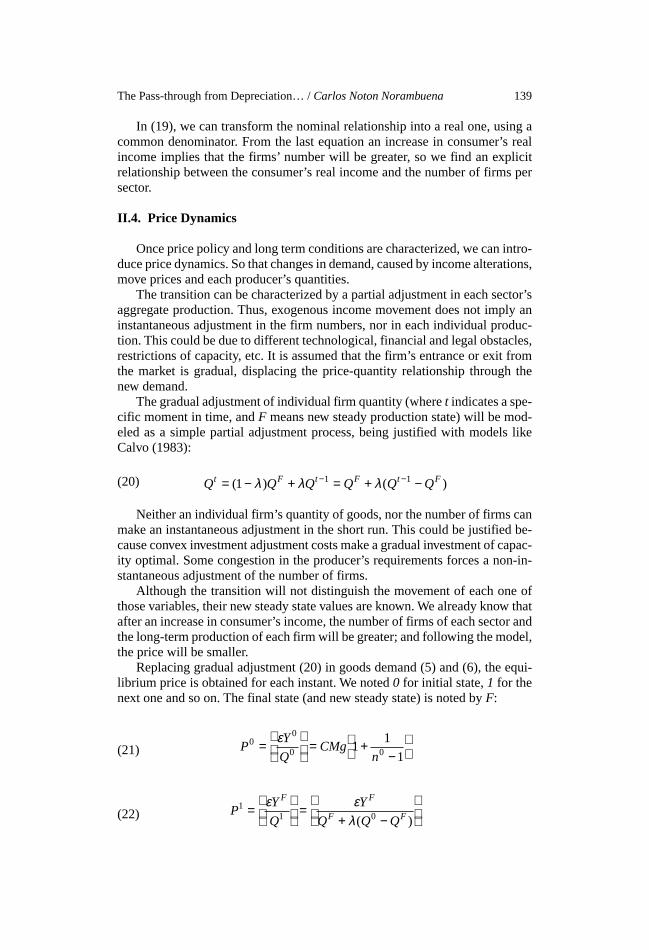
This gradual adjustment in aggregate production makes profits possible inthe short term. The transitory benefits are shown in Graph 2.
GRAPH 1PROCYCLICAL PRICE IN TRANSITION TO NEW EQUILIBRIUM
QQFQ0 Q1
CMe
C
B
AP0
PF
P1
D0
GRAPH 2REVENUES BECAUSE OF GRADUAL ADJUSTMENT
P
Cme(i)
Pi
CMe
D0
Q0 Qi QF
DF
Q

The Pass-through from Depreciation… / Carlos Noton Norambuena 141
II.5. Effect on Wages
We also assume that the labor offer doesn’t have an infinite elasticity, so anexpansion in labor demand will necessarily bring an increase in real wages.Therefore, it has consequences in firm costs, changing the steady state.
II.6. Price Summary Dynamics
The price effects can be summarized in Graph 3. After a consumer incomeincrease, the following must be expected:5
1. An increase in number of firms, in the long run.
2. An increase in each quantity of firm output.6
3. Given the assumed technology, this necessarily implies a drop in price.
4. A wage increase in the labor market implies an increase in the firm’s costs.
5. A gradual adjustment of the output quantity generates a procyclical mark-up (if adjustment speed is not too fast).
5 Without loss of generality one can obtain the inverse results for an income decrease.6 See Proof in appendix 11.
GRAPH 3SYNTHESIS OF THE TRANSITION MOVEMENTS OF PRICE
Q
A
B
D
P
P(w1, Q0, Y0)
P(w1, Q2, YF)
P(w2, QF , YF)
P(w1,Q1, YF)
Q(w1, Q0, Y0) Q(w1, Q2, YF)Q(w2, QF, YF)Q(w1, Q1, YF)
C
CMe(w2)
CMe(w1)
The effect of gradual adjustment is shown as the discreet displacement fromthe initial equilibrium A to B, over higher income demand. Since aggregatequantity is not enough for new demand, in the short run, a high price makes afirm’s positive profits possible.
Therefore, a gradual output increase (graphically a gradual movement fromB to C over the initial medium costs) decreases the price. In this context, a pricelower than A is always implied.
DF
D0
Estudios de Economía, Vol. 30 - Nº 1142
Finally, a higher labor demand increases the real wages (from W1 to W2)and forces a higher marginal cost, reflected in the output price (from C to D).
In the short run, because of gradual adjustment, the prices are procyclical.In the long run, the final price is uncertain because of the unknown magnitudeof opposing forces.
Thus, a change in price levels can be caused by exogenous increases ofinput price, or changes in consumer’s income, so that the pass-through fromcosts to final price depends on the economic environment.
In this model, from equation 17, 19 and incorporating the effect on wages,we could say that prices are a non-linear function of consumer’s income andmarginal costs, so implicitly:
(25) P G Y CMgR= ( )
Where G(.) is a non-linear function of real income. It can always be locallyapproximated by a linear function G Y YR R( ) ≈θ0 , so that price variation couldbe written as follows:
(26) ˆ ˆ ˆ ˆ ˆP Y CMg CMgYR R= + +θ θ0 0
Finally, using equation 11:
(27) ˆ ˆ ( ) ˆ ˆ ˆ ( ) ˆ ˆ ˆ ˆ ˆ ˆP Y w s A Y w Y s Y Aj jR
j jj
j jR
j jR
jR
j= + − + − + − + −θ α α θ α θ α θ1 1
Where j indicates each sector (tradable or non tradable), j T N∈ { , }.
II.7. Aggregate Domestic Prices
Since domestic price level (PD) can be disassembled into tradable and non-tradable components, maintaining a homogeneous relationship of grade 1:
(28) PD P P P PT N T N= ⇒ = + −−( ) ( ) ˆ ( ) ˆ( )φ φ φ φ1 1Π
Where φ represents the tradable goods share in total price level and inflationwill be denoted Π.
For this paper, we attempt to determine the pass-through from the nominalexchange rate (NER) to inflation; therefore we do include money in the model.7
Replacing equation 27 in 28, we obtain the central equation:
(29) Π tT
tT
tT
t tT T T
t tT T
t tT
t tTY w s A Y w Y s Y A= + − + − + − + −( )φ θ α α θ α θ α θˆ ( ) ˆ ˆ ˆ ( ) ˆ ˆ ˆ ˆ ˆ ˆ1 1
+ − + − + − + − + −( )( ) ˆ ( ) ˆ ˆ ˆ ( ) ˆ ˆ ˆ ˆ ˆ ˆ1 1 1φ θ α α θ α θ α θNt
Nt
Nt t
N N Nt t
N Nt t
Nt t
NY w s A Y w Y s Y A
7 In appendix 12, there is a possible way of including money and its effects on price level.
The Pass-through from Depreciation… / Carlos Noton Norambuena 143
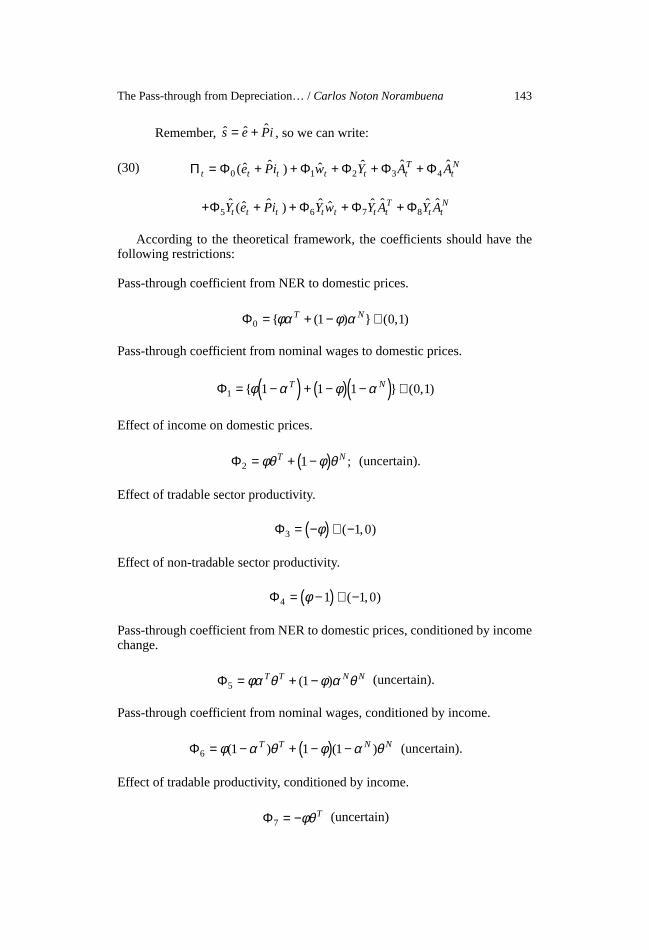
Remember, ˆ ˆ ˆs e Pi= + , so we can write:
(30) Π Φ Φ Φ Φ Φt t t t t tT
tNe Pi w Y A A= + + + + +0 1 2 3 4( ˆ ˆ ) ˆ ˆ ˆ ˆ
+ + + + +Φ Φ Φ Φ5 6 7 8ˆ ( ˆ ˆ ) ˆ ˆ ˆ ˆ ˆ ˆY e Pi Y w Y A Y At t t t t t t
Tt t
N
According to the theoretical framework, the coefficients should have thefollowing restrictions:
Pass-through coefficient from NER to domestic prices.
Φ0 1 0 1= + − ∈{ ( ) } ( , )φα φ αT N
Pass-through coefficient from nominal wages to domestic prices.
Φ1 1 1 1 0 1= −( ) + −( ) −( ) ∈{ } ( , )φ α φ αT N
Effect of income on domestic prices.
Φ2 1= + −( )φθ φ θT N ; (uncertain).
Effect of tradable sector productivity.
Φ3 1 0= −( ) ∈ −φ ( , )
Effect of non-tradable sector productivity.
Φ4 1 1 0= −( ) ∈ −φ ( , )
Pass-through coefficient from NER to domestic prices, conditioned by incomechange.
Φ5 1= + −φα θ φ α θT T N N( ) (uncertain).
Pass-through coefficient from nominal wages, conditioned by income.
Φ6 1 1 1= − + −( ) −φ α θ φ α θ( ) ( )T T N N (uncertain).
Effect of tradable productivity, conditioned by income.
Φ7 = −φθT (uncertain)

Estudios de Economía, Vol. 30 - Nº 1144
Effect of non-tradable productivity, conditioned by income.
Φ8 1= −( )φ θN (uncertain)
Some of the most interesting implications of the model are:
• Pass-through from nominal exchange rate must be identical to internationalprices pass-through.
• The sum of the effects of the nominal exchange rate and nominal wagesshould be 1 to keep the homogeneity of grade one, between input prices andoutput prices.
• The sum of productivity coefficients should be -1, so that, an increase inproductivity implies a decrease in prices.
• NER pass-through to inflation will never be 100%, because NER is just ashare of the total costs of each sector.
• In contrast to a perfect market, this model price will never be equal to mar-ginal costs due to fixed costs. The fixed cost determines the necessary mark-up (through the number of firms) to reach zero-profits in the long run.
• The main difference with a perfect market is a price associated to consum-ers’ income. A way to validate the model would be to test if income coeffi-cients are statistically significant.
III. EMPIRICAL ANALYSIS
III.1. Data
This paper uses the quarterly data of Chile from 1986:1 to 2001:1 (domesticprices, product, nominal wages, observed nominal exchange rate, externalprices), which are based on official information from the Central Bank of Chile(BCCh) and the National Institute of Statistics (INE). A detailed description ofthe sources, the methodologies and the descriptive statistic of the annual per-centage of the variation of every series are in Noton (2002).
III.2. Econometric Estimations
The central equation to estimate is equation 30, which relates to inflationand NER movement. We have made all of the following possible specifications.
A) Liberation from theoretical restriction. So the NER pass-through coefficientis not obliged to be identical to international prices (abbreviated series CPI)pass-through coefficient.
B) We have considered a static version (only includes contemporary variables)and a dynamic version (includes lagged dependent variable).
C) To approximate income, we have used GDP growth (abbreviated series GDP)and also the gap between effective and potential outcome, the latter wasobtained through an HP filter (abbreviated series GAP).
The Pass-through from Depreciation… / Carlos Noton Norambuena 145
D) The External prices (abbreviated series IPE) built by the BCCh were usedand USA inflation (abbreviated series CPI). The results obtained using thelatter are supported by the theory. Therefore, IPE estimates (sensitive to thedevaluations of trade partners) are only included in the appendix.
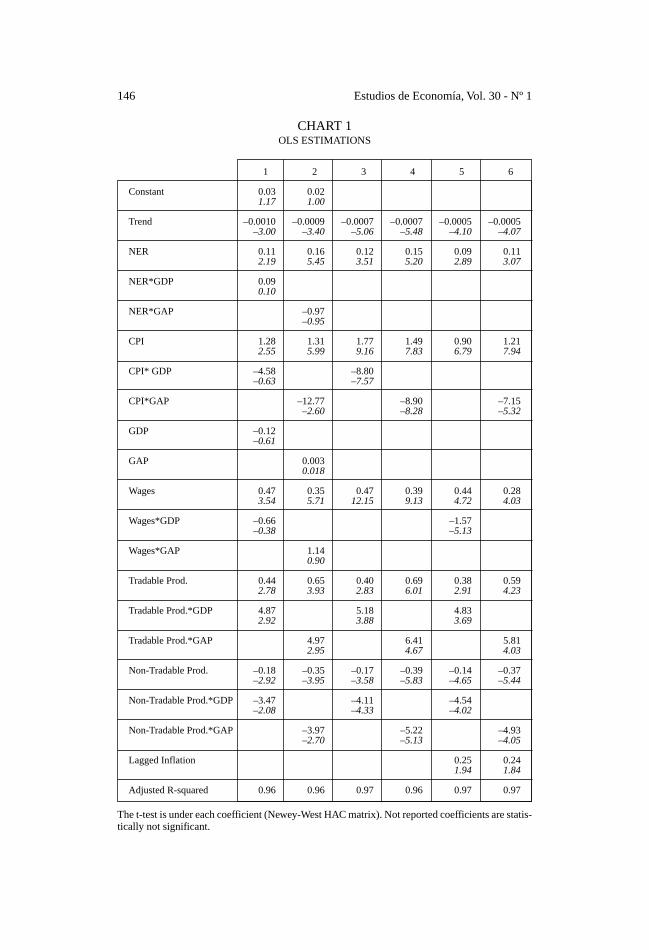
In all the following charts, the calculated t-test will be shown under eachestimated coefficient. The variances and covariance’s matrix used was Newey-West, which considers heteroskedasticity and autocorrelation (third order). Thefirst two columns always include all variables.
We call the equations that just include contemporaneous variables “static”representations, because the estimates will be the long run coefficients. Wecall the equation that includes a dependent variable lagged “dynamic” repre-sentation, because the specification allows finding a short and a long run co-efficient.
The 3rd and 4th columns are the best static representations. The last twocolumns (5th and 6th) are the best dynamic representations. The odd columnsuse growth of GDP and the even columns use the gap between outcome andpotential outcome (GAP). A constant and a deterministic trend have been in-cluded in order to model the successful reduction targeting inflation policy.That implies a stationary inflation trend in the period analyzed, where shocksare transitory around the decreasing trend in the 90’s.
The estimates in Chart 1 do not impose restrictions on NER pass-throughand international prices pass-through (point A).
As a result of this first approach by OLS we can say:
• NER pass-through, in static specifications, is between 12% and 15%.
• NER pass-through, in dynamic specifications, is between 9% and 11% inthe short run, while in the long run it is between 12% and 14%.
• GDP growth or gap does not explain much of the inflation.
• Change in wage transfers to prices between 39% and 47% in the long term,and between 28% and 44% in the short run.
• Increase in non-tradable productivity implies a decrease in domestic prices;but tradable productivity is not transferred to domestic prices.
• A deterministic trend is always negative and significant, showing the infla-tion targeting policy.
• Dynamic versions indicate that lagged inflation explains 24% or 25% ofinflation forecast.
• The null hypothesis that all coefficients related to income are simultaneouslynot significant is rejected.
A possible critique to recent estimations is that inflation determines NER inthe contemporary relationship. Moreover, in this period a system of exchangerate bands was established by the monetary authority, which determined thefeasible range for NER.
Estudios de Economía, Vol. 30 - Nº 1146
CHART 1OLS ESTIMATIONS
1 2 3 4 5 6
Constant 0.03 0.021.17 1.00
Trend –0.0010 –0.0009 –0.0007 –0.0007 –0.0005 –0.0005–3.00 –3.40 –5.06 –5.48 –4.10 –4.07
NER 0.11 0.16 0.12 0.15 0.09 0.112.19 5.45 3.51 5.20 2.89 3.07
NER*GDP 0.090.10
NER*GAP –0.97–0.95
CPI 1.28 1.31 1.77 1.49 0.90 1.212.55 5.99 9.16 7.83 6.79 7.94
CPI* GDP –4.58 –8.80–0.63 –7.57
CPI*GAP –12.77 –8.90 –7.15–2.60 –8.28 –5.32
GDP –0.12–0.61
GAP 0.0030.018
Wages 0.47 0.35 0.47 0.39 0.44 0.283.54 5.71 12.15 9.13 4.72 4.03
Wages*GDP –0.66 –1.57–0.38 –5.13
Wages*GAP 1.140.90
Tradable Prod. 0.44 0.65 0.40 0.69 0.38 0.592.78 3.93 2.83 6.01 2.91 4.23
Tradable Prod.*GDP 4.87 5.18 4.832.92 3.88 3.69
Tradable Prod.*GAP 4.97 6.41 5.812.95 4.67 4.03
Non-Tradable Prod. –0.18 –0.35 –0.17 –0.39 –0.14 –0.37–2.92 –3.95 –3.58 –5.83 –4.65 –5.44
Non-Tradable Prod.*GDP –3.47 –4.11 –4.54–2.08 –4.33 –4.02
Non-Tradable Prod.*GAP –3.97 –5.22 –4.93–2.70 –5.13 –4.05
Lagged Inflation 0.25 0.241.94 1.84
Adjusted R-squared 0.96 0.96 0.97 0.96 0.97 0.97
The t-test is under each coefficient (Newey-West HAC matrix). Not reported coefficients are statis-tically not significant.
The Pass-through from Depreciation… / Carlos Noton Norambuena 147
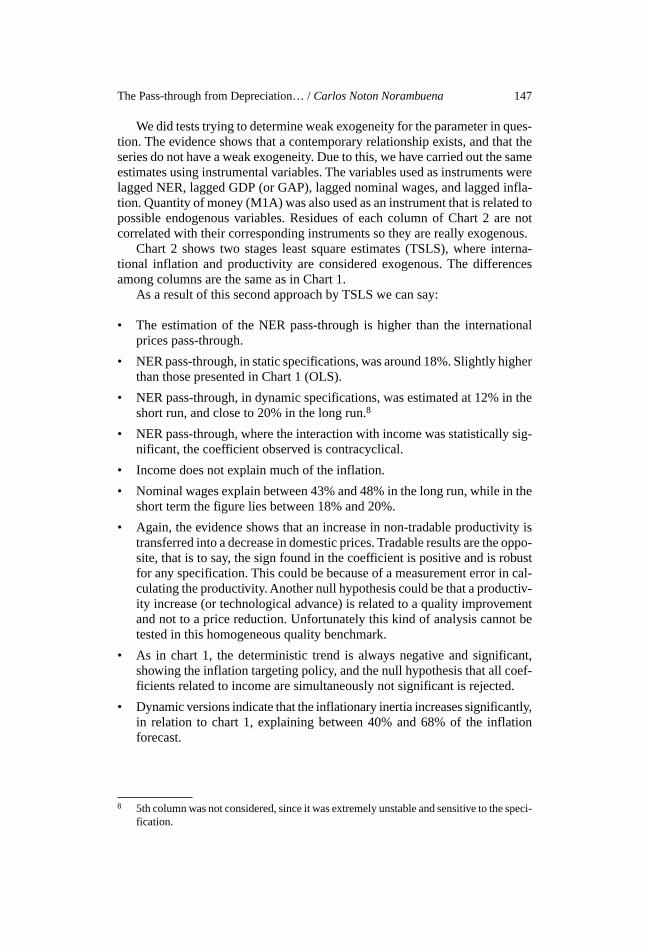
We did tests trying to determine weak exogeneity for the parameter in ques-tion. The evidence shows that a contemporary relationship exists, and that theseries do not have a weak exogeneity. Due to this, we have carried out the sameestimates using instrumental variables. The variables used as instruments werelagged NER, lagged GDP (or GAP), lagged nominal wages, and lagged infla-tion. Quantity of money (M1A) was also used as an instrument that is related topossible endogenous variables. Residues of each column of Chart 2 are notcorrelated with their corresponding instruments so they are really exogenous.
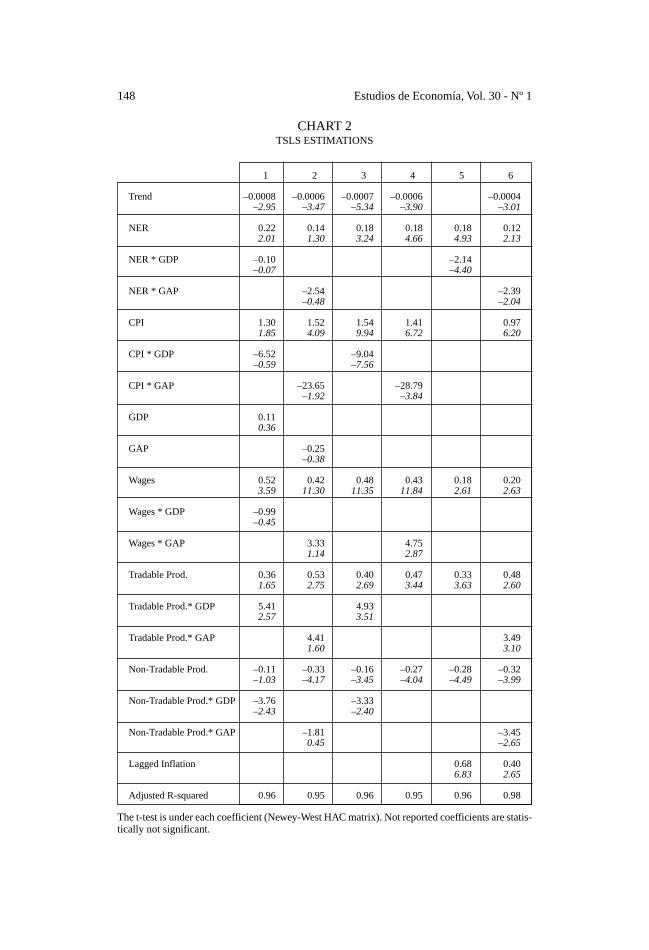
Chart 2 shows two stages least square estimates (TSLS), where interna-tional inflation and productivity are considered exogenous. The differencesamong columns are the same as in Chart 1.
As a result of this second approach by TSLS we can say:
• The estimation of the NER pass-through is higher than the internationalprices pass-through.
• NER pass-through, in static specifications, was around 18%. Slightly higherthan those presented in Chart 1 (OLS).
• NER pass-through, in dynamic specifications, was estimated at 12% in theshort run, and close to 20% in the long run.8
• NER pass-through, where the interaction with income was statistically sig-nificant, the coefficient observed is contracyclical.
• Income does not explain much of the inflation.
• Nominal wages explain between 43% and 48% in the long run, while in theshort term the figure lies between 18% and 20%.
• Again, the evidence shows that an increase in non-tradable productivity istransferred into a decrease in domestic prices. Tradable results are the oppo-site, that is to say, the sign found in the coefficient is positive and is robustfor any specification. This could be because of a measurement error in cal-culating the productivity. Another null hypothesis could be that a productiv-ity increase (or technological advance) is related to a quality improvementand not to a price reduction. Unfortunately this kind of analysis cannot betested in this homogeneous quality benchmark.
• As in chart 1, the deterministic trend is always negative and significant,showing the inflation targeting policy, and the null hypothesis that all coef-ficients related to income are simultaneously not significant is rejected.
• Dynamic versions indicate that the inflationary inertia increases significantly,in relation to chart 1, explaining between 40% and 68% of the inflationforecast.
8 5th column was not considered, since it was extremely unstable and sensitive to the speci-fication.
Estudios de Economía, Vol. 30 - Nº 1148
CHART 2TSLS ESTIMATIONS
1 2 3 4 5 6
Trend –0.0008 –0.0006 –0.0007 –0.0006 –0.0004–2.95 –3.47 –5.34 –3.90 –3.01
NER 0.22 0.14 0.18 0.18 0.18 0.122.01 1.30 3.24 4.66 4.93 2.13
NER * GDP –0.10 –2.14–0.07 –4.40
NER * GAP –2.54 –2.39–0.48 –2.04
CPI 1.30 1.52 1.54 1.41 0.971.85 4.09 9.94 6.72 6.20
CPI * GDP –6.52 –9.04–0.59 –7.56
CPI * GAP –23.65 –28.79–1.92 –3.84
GDP 0.110.36
GAP –0.25–0.38
Wages 0.52 0.42 0.48 0.43 0.18 0.203.59 11.30 11.35 11.84 2.61 2.63
Wages * GDP –0.99–0.45
Wages * GAP 3.33 4.751.14 2.87
Tradable Prod. 0.36 0.53 0.40 0.47 0.33 0.481.65 2.75 2.69 3.44 3.63 2.60
Tradable Prod.* GDP 5.41 4.932.57 3.51
Tradable Prod.* GAP 4.41 3.491.60 3.10
Non-Tradable Prod. –0.11 –0.33 –0.16 –0.27 –0.28 –0.32–1.03 –4.17 –3.45 –4.04 –4.49 –3.99
Non-Tradable Prod.* GDP –3.76 –3.33–2.43 –2.40
Non-Tradable Prod.* GAP –1.81 –3.450.45 –2.65
Lagged Inflation 0.68 0.406.83 2.65
Adjusted R-squared 0.96 0.95 0.96 0.95 0.96 0.98
The t-test is under each coefficient (Newey-West HAC matrix). Not reported coefficients are statis-tically not significant.

The Pass-through from Depreciation… / Carlos Noton Norambuena 149
III.3. Model and Estimates
In general terms, using data for Chile 1986-2001, the theoretical micro-economic restrictions enumerated in section II are rejected (we don’t find rea-sonable structural parameters), however it is necessary to highlight that in allthe estimates the null hypothesis of perfect competition is rejected. Thereforewe can say that the model developed an explanatory variable correctly, leavinga perfect market paradigm, but we did not find the right restriction set sustainedby the data.
III.4. Analysis of Pass-through Parameter Stability
Another important issue is if the NER pass-through parameter has beenconstant in all periods of analysis. Focusing on the NER parameter and tryingto find a structural break date in an endogenous way, Hansen (2001) shows asequential search of the change in some parameter. The chosen structural breaktime will be the episode that minimizes the sum of squared errors.
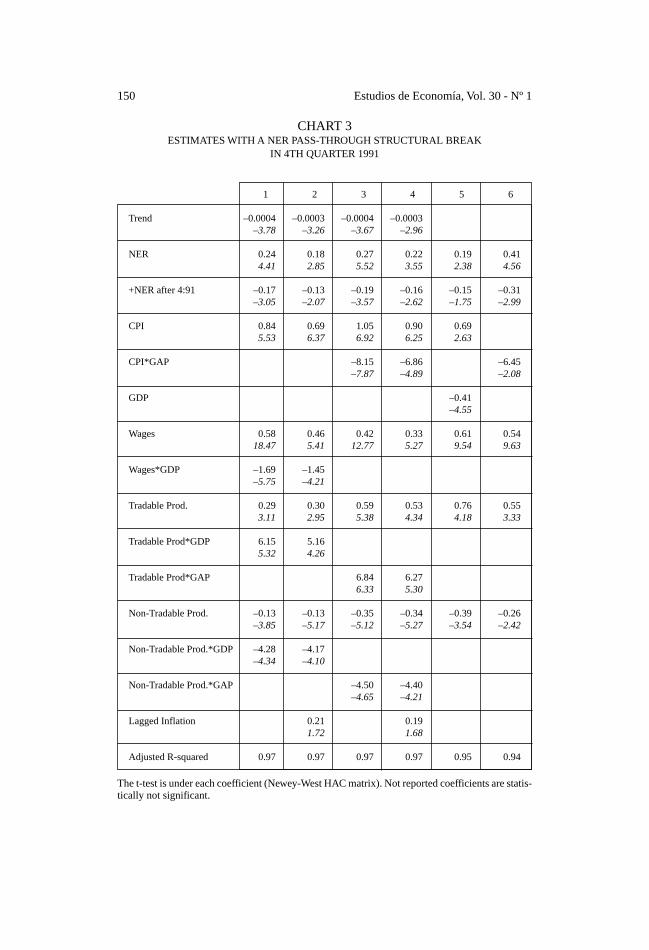
Graph 4 shows how sample variance changes when breaks are allowed inthe pass-through coefficient (using the specification described in the 5th col-umn of Chart 1), starting from each particular moment (search was restrictedbetween 1989:3 and 1999:1 quarters).
The structural break dates that best fit are: 1991:4 and 1993:2. The fourthquarter of 1991 was considered because of econometric properties9 and esti-mated minimum variance value. The results are in Chart 3, where the first 2
GRAPH 4SAMPLE VARIANCE AS A FUNCTION OF STRUCTURAL BREAKS IN
THE NER PASS-THROUGH COEFFICIENT
9 1993’s pass-through estimates had worse econometric properties than the 1991 ones.
0,000105
0,000107
0,000109
0,000111
0,000113
0,000115
0,000117
0,000119
0,000121
Sam
ple
Var
ianc
e
1989
:319
90:1
1990
:319
91:1
1991
:319
92:1
1992
:319
93:1
1993
:319
94:1
1994
:319
95:1
1995
:319
96:1
1996
:319
97:1
1997
:319
98:1
1998
:3
Structural Break Date
Estudios de Economía, Vol. 30 - Nº 1150
CHART 3ESTIMATES WITH A NER PASS-THROUGH STRUCTURAL BREAK
IN 4TH QUARTER 1991
1 2 3 4 5 6
Trend –0.0004 –0.0003 –0.0004 –0.0003–3.78 –3.26 –3.67 –2.96
NER 0.24 0.18 0.27 0.22 0.19 0.414.41 2.85 5.52 3.55 2.38 4.56
+NER after 4:91 –0.17 –0.13 –0.19 –0.16 –0.15 –0.31–3.05 –2.07 –3.57 –2.62 –1.75 –2.99
CPI 0.84 0.69 1.05 0.90 0.695.53 6.37 6.92 6.25 2.63
CPI*GAP –8.15 –6.86 –6.45–7.87 –4.89 –2.08
GDP –0.41–4.55
Wages 0.58 0.46 0.42 0.33 0.61 0.5418.47 5.41 12.77 5.27 9.54 9.63
Wages*GDP –1.69 –1.45–5.75 –4.21
Tradable Prod. 0.29 0.30 0.59 0.53 0.76 0.553.11 2.95 5.38 4.34 4.18 3.33
Tradable Prod*GDP 6.15 5.165.32 4.26
Tradable Prod*GAP 6.84 6.276.33 5.30
Non-Tradable Prod. –0.13 –0.13 –0.35 –0.34 –0.39 –0.26–3.85 –5.17 –5.12 –5.27 –3.54 –2.42
Non-Tradable Prod.*GDP –4.28 –4.17–4.34 –4.10
Non-Tradable Prod.*GAP –4.50 –4.40–4.65 –4.21
Lagged Inflation 0.21 0.191.72 1.68
Adjusted R-squared 0.97 0.97 0.97 0.97 0.95 0.94
The t-test is under each coefficient (Newey-West HAC matrix). Not reported coefficients are statis-tically not significant.
The Pass-through from Depreciation… / Carlos Noton Norambuena 151
columns were estimated by OLS, both using GDP growth, in static (1) anddynamic (2) specifications. Columns 3 and 4 use the gap between potential andeffective GDP. Columns 5 and 6 are TSLS static estimates (using GDP andGAP respectively), with the same instruments already mentioned.
After this third approach, we can say:
• In OLS static estimates, we could not reject the null hypothesis that theNER pass-through fell from 24% or 27% (before last quarter of 1991) to 7%or 8 (after that date).
• In OLS dynamic estimations, there is also evidence that short run NER pass-through decreased from 18% or 22% to 5% or 6%. The long run pass-throughcoefficients also decreased from a range between 23-27% to 6-7% range.
• In TSLS estimations, before 1991:4, NER coefficients are highly dissimilar(19% and 41%); however, after the structural break they became closer (be-tween 4% and 10%).
• The international inflation pass-through coefficient decreased (estimatedcoefficients higher than 1 were no longer found). This coefficient was al-ways different from the NER pass-through.
• There were not significant changes (statistical significance or coefficientsign) from previous charts in the other variables.
It is necessary to point out that the last estimates were obtained, after allow-ing a structural break in the NER pass-through. In theoretical terms it is hard tojustify a structural break at some arbitrary date. A priori undiscarded hypoth-esis is based on Taylor (2000). This paper shows how an economic agent per-ception of a price stability environment diminishes the cost pass-through, ifthese cost variations are perceived as transitory movements.
IV. CONCLUSIONS
To study the nominal exchange rate pass-through to inflation, a micro-economic model of oligopolistic Cournot competition has been developed. Wehave obtained an explicit endogenous relationship between price level and thenominal exchange rate; which is based on a mark-up that varies endogenouslywith real consumer income and justifies a relationship between prices and eco-nomic cycle, abandoning the usual ad-hoc models in the literature on exchangerate pass-through; however we don’t find reasonable structural parameters withthe Chilean data.
The nominal exchange rates’ pass-through to inflation was estimated underdifferent econometric techniques, definitions of variables and specifications.As a result, the exchange rate pass-through in Chile (years 1986-2001) was12% in the short run, while the long run total effect should be expected to bearound 18%.
Regarding the pass-through evolution, we did a sequential search to find anendogenous structural break date. The evidence does not reject the hypothesisof a break in the last quarter of 1991, after which, the exchange rate pass-throughdecreased from coefficients of around 20% to values between 5-7%. Contraryto conventional wisdom, we find no evidence of procyclical pass-through.
In another result the firms had different reactions if the input price increasewas caused by nominal exchange rate movements or international price move-

Estudios de Economía, Vol. 30 - Nº 1152
ments. In the latter, a higher pass-through shows evidence of a special sensitiv-ity to international inflation shocks.
V. REFERENCES
Borensztein, E. and J. De Gregorio (1999). “Devaluation and Inflation AfterCurrency Crises”. Mimeo CEA, University of Chile.
Bravo, H. and C. García (2002). “Medición de la Política Monetaria y el Traspaso(Pass-Through) en Chile”, Economía Chilena, Vol. 5, Nº 3, 5-28.
Burstein, A.; J. Neves and S. Rebelo (2001). “Distribution Costs and Real Ex-change Rate Dynamics during Exchange-Rate-based-stabilizations”,forthcoming Journal of Monetary Economics.
Calvo, G. (1983). “Staggered Prices in to Utility-Maximizing Framework”,Journal of Monetary Economics, 12 (3), 383-398.
Campa, J. and L. Goldberg. (2002). “Exchange Rate Pass-through into ImportPrices: A Macro or Micro Phenomenon?”, NBER Working Paper Nº 8934.
Devereux, M.; C. Engel and P. Storgaard (2003). “Endogenous Exchange RatePass-through when Nominal Prices are set in Advance”. Manuscript,University of Wisconsin.
Dixit, A. and J. Stiglitz (1977). “Monopolistic Competition and Optimum ProductDiversity”, American Economic Review, 67, 297-308.
Dornbusch, R. (1987). “Exchange Rates and Prices”, American Economic Re-view, 77, 93-106.
Feenstra, R. and J. Kendal (1994). “Pass-Through of Exchange Rates and Pur-chasing Power Parity”, NBER Working Paper Nº 4842.
García, C. and J. Restrepo (2001). “Price inflation and Exchange Rate Pass-through in Chile”, Central Bank of Chile, Working Paper Nº 128, De-cember 2001.
Goldfajn, I. and S. Werlang (2000). “The Pass-Through from Depreciation toInflation: A Panel Study”, Banco Central do Brasil, Working Paper 5.
Hansen, B. (2001). “New The Econometrics of Structural Change: DatingChanges in U.S. Work Productivity”, Journal of Economic Perspectives,15, 117-128.
Kikuchi, A. and M. Sumner (2002). “Exchange Rate Pass-through in JapaneseExport Pricing”, Applied Economics, 34, 279-284.
Morandé, F. (1986). “Domestic Prices Importable of Goods in Chile and theLaw of One Price: 1975-1982”, Journal of Development Economics, 21,131-147.
Morandé, F. and M. Tapia (2002) “Política Cambiaria en Chile: El Abandonode la Banda y la Experiencia de Flotación”, Economía Chilena, Vol. 5,Nº 3, 67-94.
Noton, C. (2002). “Traspaso desde el tipo de cambio nominal hacia la inflacióndoméstica: modelo y evidencia empírica para Chile”, MA Dissertation,University of Chile.
Obstfeld, M. and K. Rogoff (1998). “Risk and Exchange Rates”, NBER Work-ing Paper Nº 6694.
Taylor, J.B. (2000). “Low Inflation, Pass-Through, and the Pricing Power ofFirms”, European Economic Review, 44, 1389-1408.
The Pass-through from Depreciation… / Carlos Noton Norambuena 153
APPENDIX
Description of data:
1. Domestic prices: the National Institute of Statistics (INE) publishes theseries of Chilean consumer price index (IPC). The frequency is monthlyand through a simple 3 month average the quarter value is obtained. Theinflation is the annual percentage variation of the price level.
2. Nominal Exchange Rate (NER): The series of observed dollar price (pe-sos/dollar) is published by the Central Bank of Chile (BCCh). The frequencyis monthly and the quarter value is obtained through a simple 3 month aver-age. The devaluation is the annual percentage variation of the observed price.
3. USA inflation (CPI) and index of external prices for Chile (IPE): Thereis no unanimous opinion about which indicator is closer to internationalinflation. There is an indicator of external prices concerning Chile (IPE),developed by the BCCh. The IPE average is figured by the commercial im-portance of the wholesaler price index of each trade partner of Chile. Thisindex is expressed in dollars, so it is extremely sensitive to commercial part-ner devaluations. After exchange rate movements in the second half of the90’s, this index points out deflations of –5% and inflations near to 10%.That is why our estimates use U.S. consumer price index (CPI) which, al-though it includes non-tradable goods, is not susceptible to internationaldevaluations.
4. Geographical Product (GDP): The quarterly GDP series is published bythe Central Bank of Chile (BCCh).
5. Gap Effective-Potential product (GAP): The last concept is defined byreferring to the gap between effective product and potential product. Thereare a lot of theoretical and methodological options. The present paper optedfor the Hodrick-Prescott filter (HP). The difference in effective growth isdenominated by the effective-potential product gap (abbreviated as GAP).
6. Nominal Wage (WN): The wage series is published by The National Insti-tute of Statistics (INE). It has a monthly frequency and the quarter value isobtained through a simple 3 month average.
7. Tradable Productivity: In previous papers, the product per worker has beena proxy of productivity. The ratio is built with the tradable outcome (pub-lished by BCCh) and the tradable sector number of workers (published byINE). The following have been considered as tradable sectors: agriculture,fishing, mining and the manufacturing industry. Given the technology as-sumed, the outcome-workers ratio implies that the imported input-workersratio remains constant in the period 1987-2001. Formally:
Estudios de Economía, Vol. 30 - Nº 1154
If Q A M LQ
LA
M
LT = ⇒ =−( ) ( ) ( )α α α1 ; Then ˆ
ˆˆQ
LA
M
L
= +
α
8. Non-Tradable Productivity: Applying the same methodology indicatedfor the non-tradable sector, we consider the following to be non-tradablesectors: construction, hotels and restaurants, transport and communications,trade, energy, financial, community and personal services.
9. Model Budget restrictions:
1) Tradable Firms: P Q wL sM FtT
tT
tT
tT
tT= + +
2) Non Tradable Firms: P Q wL sM FtN
tN
tN
tN
tN= + +
3) Balance in Non Tradable Market: Q CtN
tN=
4) Consumers:•
= + + + + − −bt tt
tN
tN
tT
tT
tT
tN
tN
tT
tTrb
ew F L w F P C P C
1( )
5) Aggregate Economy:•
= + − −bt tt
tT
tT
tT
tT
trbe
P Q P C sM1
( )
10. Adjustment speed procyclical condition:
P PY Q Y Q
Y Q Q
F F
F0 1
0 0
0 0< ⇔ > −−
λ
( ) where QY F Y
CMgj
j j
= −
ε ε2
11. Relationship between Income and each firms quantity:
It can be derived directly from equation 15 and 19:
∂∂
=
>q
Y CMg
F
YR R
R
R
1
20
ε
12. Money in the model:
We believe that long term inflation is a monetary phenomenon. The modeldeveloped does not include money, since it assumes that movements in moneyquantity determine nominal prices of inputs. So that:
ˆ ˆwt Dt t= +η and ˆ ˆet Dt t= +ζ

The Pass-through from Depreciation… / Carlos Noton Norambuena 155
Where D is quantity of money, η and ξ are shocks of each nominal price(wages and the nominal exchange rate, respectively). We do not replacethese equations because we are looking for a NER pass-through coefficient.
13. CHART 4: OLS Estimates, using the BCCh International PriceIndex (IPE):
1 2 3 4
Constant 0.09 0.08 0.043.75 3.27 1.80
Trend –0.0014 –0.0014 –0.0007–3.87 –3.83 –1.86
NER 0.16 0.23 0.08 0.143.18 4.36 1.71 2.59
NER*GAP –2.01–3.26
IPE 0.34 0.18 0.10 0.095.22 3.25 1.46 1.57
IPE* GDP –3.28–4.63
IPE*GAP –4.32 –2.21–6.26 –2.37
GDP –0.41–6.26
GAP –0.36–4.76
Wages 0.38 0.29 0.28 0.115.00 3.87 4.65 2.37
Wages * GDP –1.20–4.49
Tradable Prod. 0.85 0.69 0.35 0.396.73 5.23 2.62 3.42
Tradable Prod.* GDP 2.382.13
Tradable Prod.* GAP 3.012.19
Non-Tradable Prod. –0.35 –0.32 –0.20 –0.23–4.82 –3.90 –3.97 –3.41
Non-Tradable Prod.* GDP –2.47–2.35
Lagged Inflation 0.58 0.526.08 5.45
Adjusted R-squared 0.95 0.96 0.97 0.97
The t-test is under each coefficient (Newey-West HAC matrix). Not reported coefficients are statis-tically not significant.