Embed Size (px)
DESCRIPTION
An Empirical Analysis of Pass-Through of Oil Prices to Inflation: Evidence from Nigeria . *. AUWAL, Umar Department of Economics, Ahmadu Bello University, Nigeria – West Africa [email protected] , [email protected] +234 803 227 4567 , +234(0)705 727 6029. Organization of the work. - PowerPoint PPT Presentation
Citation preview
AN EMPIRICAL ANALYSIS OF PASS-THROUGH OF OIL PRICES TO INFLATION: EVIDENCE
FROM NIGERIA.*
AUWAL, UmarDepartment of Economics,
Ahmadu Bello University, Nigeria – West Africa
[email protected] , [email protected]
+234 803 227 4567 , +234(0)705 727 6029
1

ORGANIZATION OF THE WORK
Introduction. Received Knowledge vs. Objective(s). Data Source and Estimation techniques. Models Specification. Unit Root test. Models Estimation, interpretation and
Analysis. Summary and Conclusions.
2

1.0 INTRODUCTION Oil prices have risen sharply over the last year,
leading to concerns that we could see a repeat of the 1970s, when rising oil prices were accompanied by severe recessions and surging inflation.
The oscillation of global oil prices has always been a major concern in market instability. This instability resulted into inflation. Consequently, the price of oil and inflation are often seen as being connected within a cause and effect framework. As oil prices move up or down, inflation follows in the same direction. The reason why this happens may be that oil is a major input in the economy - it is used in critical activities such as fueling transportation or goods made with petroleum products - and if the costs of intermediate input rise, so should the cost of end output (http://www.investopedia.com/ask/answers/06/oilpricesinflation.asp) .
3

INTRODUCTION (CONT…) Crude Oil Prices Period of high price strategy in the oil market Period of substantial decrease in crude oil
prices - It reached a peak of $147 in july,2008 and decrease to $38.6 in December, 2008 and now is below $80 (Abosedra, 2009).
Nigeria : (i)a mono-cultural economy
(ii)recognized as one of the most volatile economies in the world
Volatility: a major constraint on development Causes: planning more problematic and
investment more risky (Ukwu et.al, 2003) 4
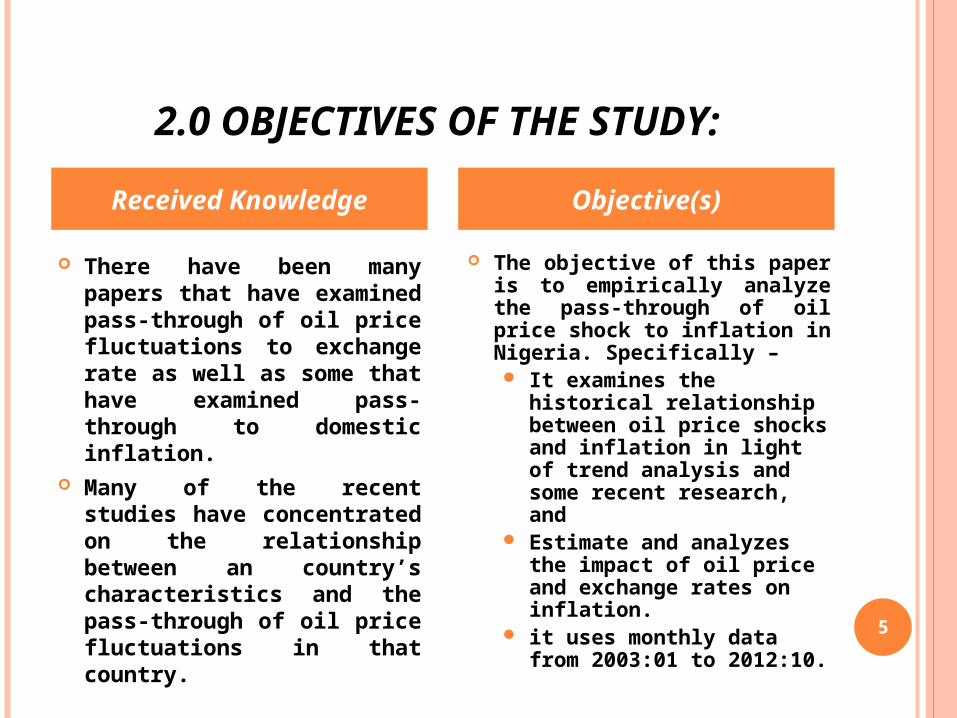
2.0 OBJECTIVES OF THE STUDY:
There have been many papers that have examined pass-through of oil price fluctuations to exchange rate as well as some that have examined pass-through to domestic inflation.
Many of the recent studies have concentrated on the relationship between an country’s characteristics and the pass-through of oil price fluctuations in that country.
The objective of this paper is to empirically analyze the pass-through of oil price shock to inflation in Nigeria. Specifically – It examines the
historical relationship between oil price shocks and inflation in light of trend analysis and some recent research, and
Estimate and analyzes the impact of oil price and exchange rates on inflation.
it uses monthly data from 2003:01 to 2012:10.
Received Knowledge Objective(s)
5

3.0 DATA SOURCE AND METHODOLOGY
Monthly data :2003:01 - 2012:10
Type : Crude Oil Prices, Exchange rates and Inflation
Source: Central Bank of Nigeria’s website – Data and Statistics division
OLS, VAR-VECM and Granger Causality model were employed to analyze the data.
Data Source Models employed
6

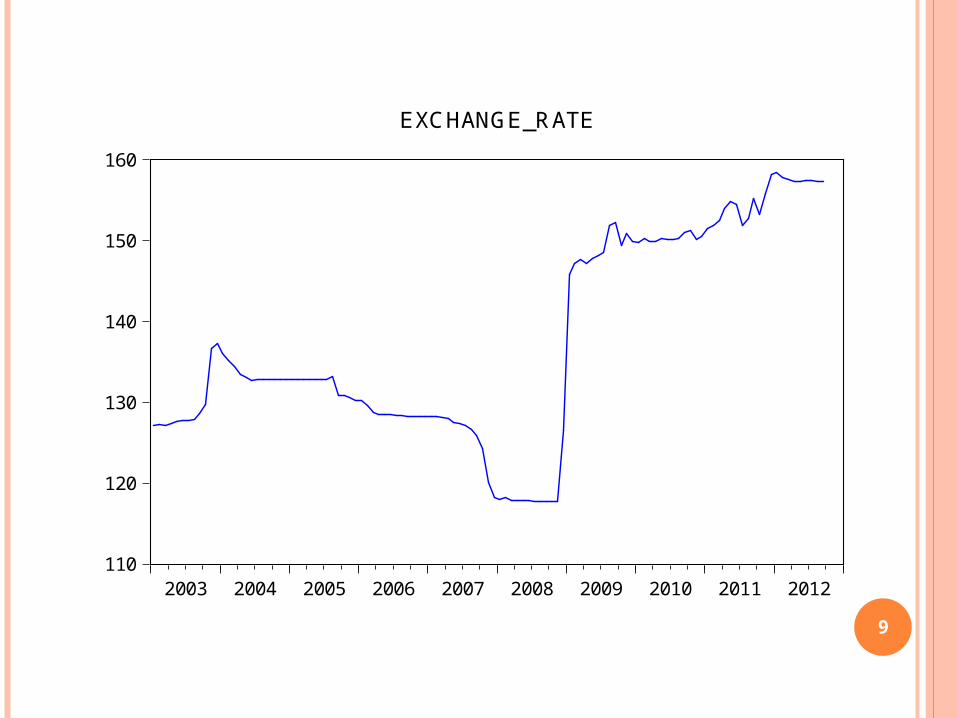
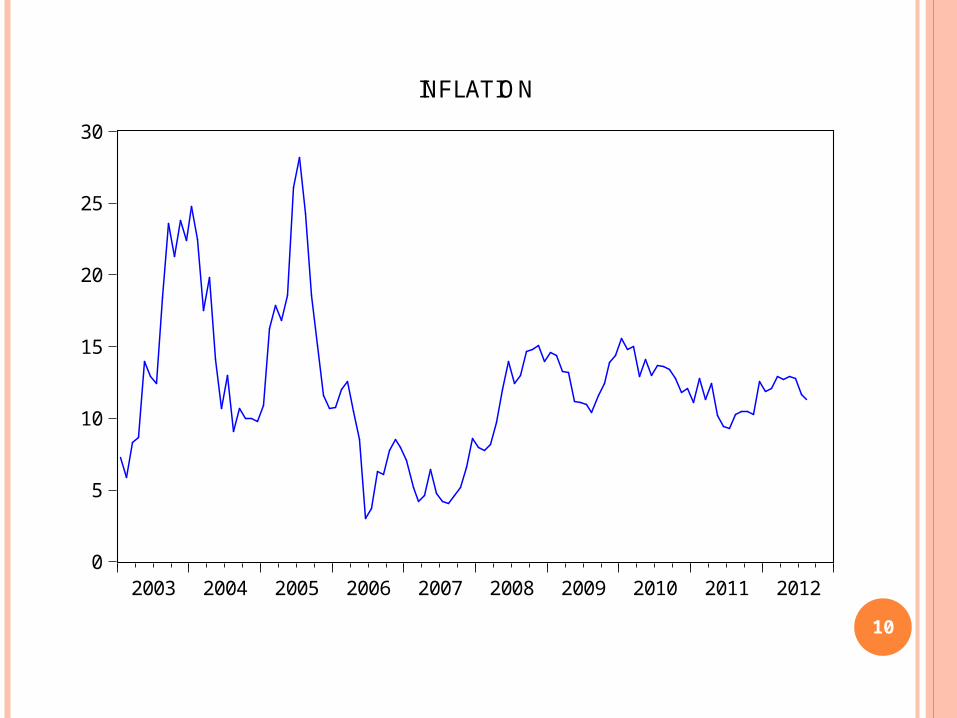
TREND ANALYSIS
7

8
20
40
60
80
100
120
140
2003 2004 2005 2006 2007 2008 2009 2010 2011 2012
OIL_PRICE
9
110
120
130
140
150
160
2003 2004 2005 2006 2007 2008 2009 2010 2011 2012
EXCHANGE_RATE
10
0
5
10
15
20
25
30
2003 2004 2005 2006 2007 2008 2009 2010 2011 2012
INFLATION

Model Model SpecificationOLS, VAR-VECM This study employs OLS and VAR-VECM for empirical
analysis and only focusses on three chosen variables: Oil Price (Bonny light, $/B), Exchange rates (N/$) and Inflation (All items – year on change).
Where Inft is Inflation rate for period t. OPt is Crude Oil Price for period t, and EXt is exchange rates for period t. To get the best result, the equation must be in log for all variables.
Pre – estimation tests conducted
Lag selection criteria, Johansen test of Co-integration, System equation estimation
4.0 Models Specification
11
),( EXOPfInf tttt EXOPInf
210
tttt EXOPInf lnlnln 210
)(OPfInf

12
ADF – TEST
Variable Order of Integration Critical ValuesComputed Values
Crude Oil Price I(1)-3.4900 (1%) -2.8874(5%)-2.5804 (10%
-4.672726
Exchange Rate I(1)3.4900 (1% )-2.8874 (5% ) -2.5804 (10% )
-4.329422
Inflation Rate I(1)-3.4900 (1%)
-2.8874 (5%)
-2.5804 (10%
-4.267187
5.0 Unit Root Test

6.0 MODEL PRESENTATION, ESTIMATION
& ANALYSIS OF THE RESULTS:
13

ORDINARY LEAST SQUARES OUTPUT
14
Dependent Variable: INF Method: Least Squares Date: 04/22/13 Time: 16:38 Sample (adjusted): 2003M01 2012M09 Included observations: 117 after adjustments
Variable Coefficient Std. Error t-Statistic Prob.
OP -0.061926 0.015108 -4.098788 0.0001EX 0.111950 0.035382 3.164009 0.0020C 1.327876 4.604224 0.288404 0.7736
R-squared 0.150036 Mean dependent var 12.19744Adjusted R-squared 0.135124 S.D. dependent var 4.902558S.E. of regression 4.559316 Akaike info criterion 5.897529Sum squared resid 2369.759 Schwarz criterion 5.968354Log likelihood -342.0054 Hannan-Quinn criter. 5.926283F-statistic 10.06164 Durbin-Watson stat 0.244726Prob(F-statistic) 0.000095

GRANGER CAUSALITY TEST
Pairwise Granger Causality TestsDate: 04/22/13 Time: 17:31Sample: 2003M01 2012M12Lags: 2
Null Hypothesis: Obs F-Statistic Prob.
EX does not Granger Cause OP 115 1.70448 0.1866 OP does not Granger Cause EX 2.61122 0.0780
INF does not Granger Cause OP 115 0.70705 0.4953 OP does not Granger Cause INF 0.52597 0.5925
INF does not Granger Cause EX 115 0.91917 0.4019 EX does not Granger Cause INF 0.47069 0.6258
15
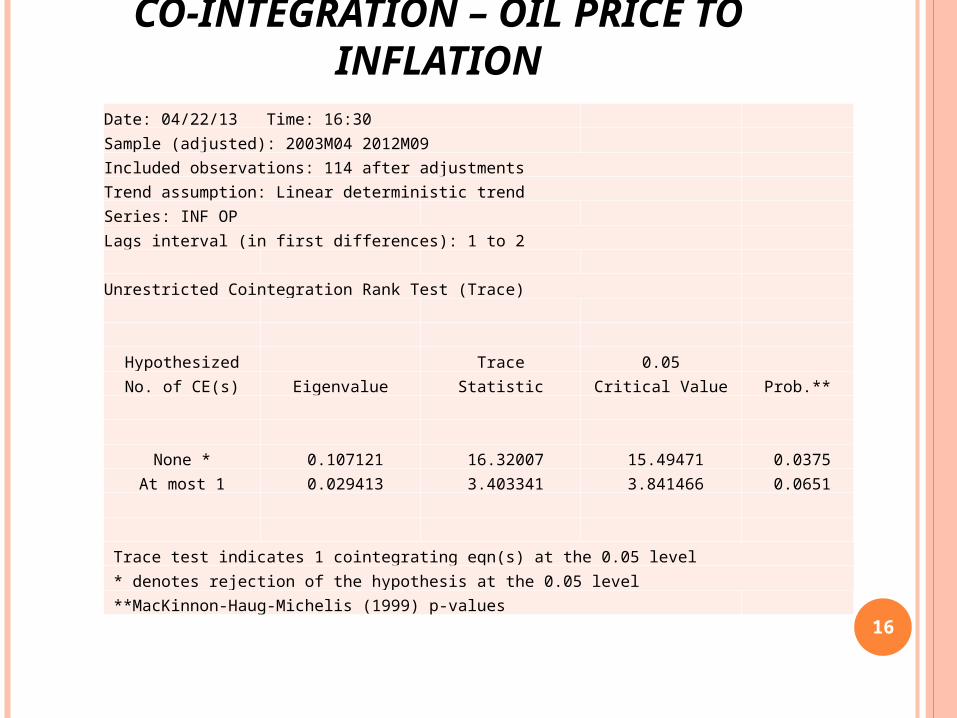
CO-INTEGRATION – OIL PRICE TO INFLATION
16
Date: 04/22/13 Time: 16:30
Sample (adjusted): 2003M04 2012M09
Included observations: 114 after adjustments
Trend assumption: Linear deterministic trend
Series: INF OP
Lags interval (in first differences): 1 to 2
Unrestricted Cointegration Rank Test (Trace)
Hypothesized Trace 0.05
No. of CE(s) Eigenvalue Statistic Critical Value Prob.**
None * 0.107121 16.32007 15.49471 0.0375
At most 1 0.029413 3.403341 3.841466 0.0651
Trace test indicates 1 cointegrating eqn(s) at the 0.05 level
* denotes rejection of the hypothesis at the 0.05 level
**MacKinnon-Haug-Michelis (1999) p-values

VECM ESTIMATESError Correction: D(INF) D(OP)
CointEq1 -0.136008 -0.215053 (0.04255) (0.12746) [-3.19644] [-1.68723]
D(INF(-1)) 0.196687 -0.022662 (0.09350) (0.28008) [ 2.10365] [-0.08091]
D(INF(-2)) 0.083269 0.018721 (0.09499) (0.28454) [ 0.87665] [ 0.06579]
D(OP(-1)) 0.007182 0.364237 (0.03169) (0.09491) [ 0.22667] [ 3.83752]
D(OP(-2)) -0.005914 0.075168 (0.03196) (0.09573) [-0.18506] [ 0.78523] C 0.036832 0.424848 (0.19651) (0.58866) [ 0.18743] [ 0.72172]
17
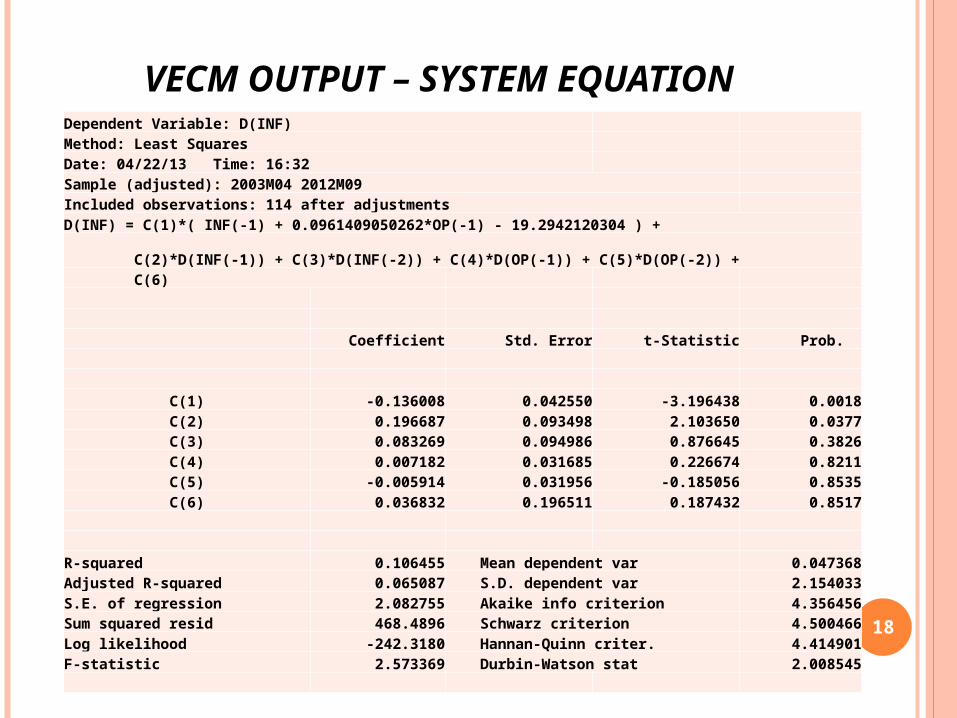
VECM OUTPUT – SYSTEM EQUATION
18
Dependent Variable: D(INF) Method: Least Squares Date: 04/22/13 Time: 16:32 Sample (adjusted): 2003M04 2012M09 Included observations: 114 after adjustments D(INF) = C(1)*( INF(-1) + 0.0961409050262*OP(-1) - 19.2942120304 ) +
C(2)*D(INF(-1)) + C(3)*D(INF(-2)) + C(4)*D(OP(-1)) + C(5)*D(OP(-2)) + C(6)
Coefficient Std. Error t-Statistic Prob.
C(1) -0.136008 0.042550 -3.196438 0.0018C(2) 0.196687 0.093498 2.103650 0.0377C(3) 0.083269 0.094986 0.876645 0.3826C(4) 0.007182 0.031685 0.226674 0.8211C(5) -0.005914 0.031956 -0.185056 0.8535C(6) 0.036832 0.196511 0.187432 0.8517
R-squared 0.106455 Mean dependent var 0.047368Adjusted R-squared 0.065087 S.D. dependent var 2.154033S.E. of regression 2.082755 Akaike info criterion 4.356456Sum squared resid 468.4896 Schwarz criterion 4.500466Log likelihood -242.3180 Hannan-Quinn criter. 4.414901F-statistic 2.573369 Durbin-Watson stat 2.008545

COEFFICIENT TEST – WALD TEST APPROACH
Wald Test: Equation: EQN
Test Statistic Value df Probability
F-statistic 2.573369 (5, 108) 0.0306Chi-square 12.86684 5 0.0247
Null Hypothesis: C(1)=C(2)=C(3)=C(4)=C(5)=0Null Hypothesis Summary:
Normalized Restriction (= 0) Value Std. Err.
C(1) -0.136008 0.042550C(2) 0.196687 0.093498C(3) 0.083269 0.094986C(4) 0.007182 0.031685C(5) -0.005914 0.031956
Restrictions are linear in coefficients.
19
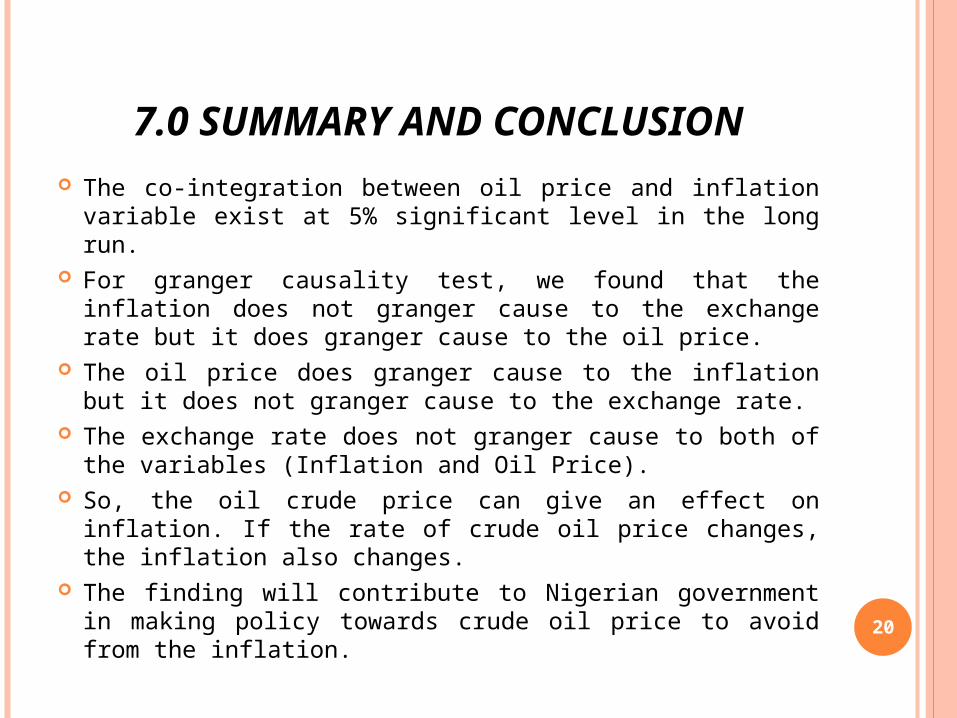
7.0 SUMMARY AND CONCLUSION The co-integration between oil price and inflation
variable exist at 5% significant level in the long run. For granger causality test, we found that the inflation
does not granger cause to the exchange rate but it does granger cause to the oil price.
The oil price does granger cause to the inflation but it does not granger cause to the exchange rate.
The exchange rate does not granger cause to both of the variables (Inflation and Oil Price).
So, the oil crude price can give an effect on inflation. If the rate of crude oil price changes, the inflation also changes.
The finding will contribute to Nigerian government in making policy towards crude oil price to avoid from the inflation.
20

THANK YOU FOR YOUR ATTENTION
21