Embed Size (px)
Citation preview
7. Exp. Biol. (1961), 38, 93-107 93)jVith 1 text-figure
Printed in Great Britain
THE OXYGEN CAPACITY OF GOLDFISH (CARASSIUSAURATUS L.) BLOOD IN RELATION TO
THERMAL ENVIRONMENT*
BY E. H. ANTHONY
Department of Zoology, University of Cambridge^
(Received 26 July i960)
INTRODUCTION
The exchange of respiratory gases between vertebrate animals and their environmentalways takes place through water and usually involves specialized structures suchas lungs or gills. The transport of oxygen from the site at which it is acquired tothe remaining parts of the body in which it is needed is the primary function of theblood. It is generally held that the presence of a respiratory pigment facilitatesthis function of the blood. The same pigment, haemoglobin, is found in the bloodof all vertebrates, but, as Barcroft (1928) pointed out, no two haemoglobins appearto be the same.
When the conditions under which the respiratory exchange occurs are considered,it is evident that fish encounter greater variations in such important factors ashydrogen-ion concentration, oxygen concentration and temperature, than any air-breathing vertebrate. This is particularly true for freshwater species. Knowledgeof the relationship between the biochemistry of haemoglobin and mammalianrespiration raised questions regarding the adaptation of fish to the situations pre-sented by their habits and habitats. Temperature, for instance, is known to havea marked effect upon the oxygen dissociation curve of mammalian blood (Krogh,1941). By analogy, the oxygen transporting efficiency of fish blood would beexpected to fall with decreasing temperature, yet many fish remain active over afairly wide thermal range—particularly if the transition from one temperature toanother is not too abrupt. Thus fish offer promising material with which to combinestudies of ecology and physiology. A number of reviews deal with the literaturerelevant to the physiology of fish respiration; the more recent are by E. C. Blackin Hoar, Black & Black (1951) and Fry in Brown (1957).
The general problem consists of relating the behaviour of the intact fish to theproperties of its blood in vitro. The blood of fish exhibits a number of interspecificdifferences, including haemoglobin content (Hall & Gray, 1929), affinity foroxygen, and the extent to which the oxygen dissociation curve is displaced bycarbon dioxide (Krogh & Leitch, 1919; Root, 1931; Willmer, 1934; Black, 1940).
• This study was carried out under tenure of scholarships from the National Research Councilof Canada, and with assistance during one year from Department of Veterans Affairs, Canada.
t Author's present address: Institute of Oceanography, Dalhousie University, Halifax, N.S.,Canada.
94 E. H. ANTHONY
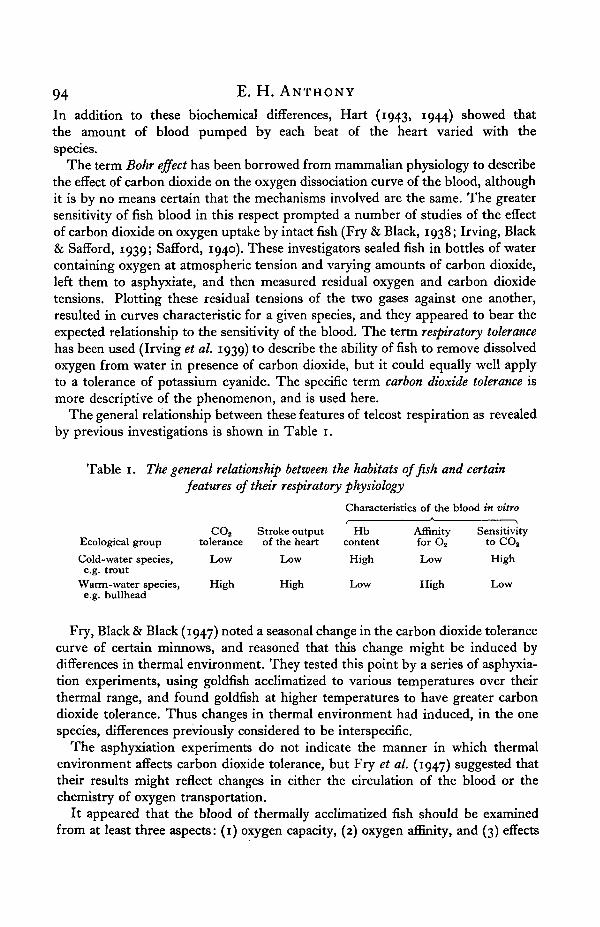
In addition to these biochemical differences, Hart (1943, 1944) showed thatthe amount of blood pumped by each beat of the heart varied with thespecies.
The term Bohr effect has been borrowed from mammalian physiology to describethe effect of carbon dioxide on the oxygen dissociation curve of the blood, althoughit is by no means certain that the mechanisms involved are the same. The greatersensitivity of fish blood in this respect prompted a number of studies of the effectof carbon dioxide on oxygen uptake by intact fish (Fry & Black, 1938; Irving, Black& Safford, 1939; Safford, 1940). These investigators sealed fish in bottles of watercontaining oxygen at atmospheric tension and varying amounts of carbon dioxide,left them to asphyxiate, and then measured residual oxygen and carbon dioxidetensions. Plotting these residual tensions of the two gases against one another,resulted in curves characteristic for a given species, and they appeared to bear theexpected relationship to the sensitivity of the blood. The term respiratory tolerancehas been used (Irving et al. 1939) to describe the ability of fish to remove dissolvedoxygen from water in presence of carbon dioxide, but it could equally well applyto a tolerance of potassium cyanide. The specific term carbon dioxide tolerance ismore descriptive of the phenomenon, and is used here.
The general relationship between these features of teleost respiration as revealedby previous investigations is shown in Table 1.
Table 1. The general relationship between the habitats of fish and certainfeatures of their respiratory physiology
Characteristics of the blood in vitro
CO2 Stroke output Hb Affinity SensitivityEcological group tolerance of the heart content for O2 to CO2
Cold-water species, Low Low High Low Highe.g. trout
Warm-water species, High High Low High Lowe.g. bullhead
Fry, Black & Black (1947) noted a seasonal change in the carbon dioxide tolerancecurve of certain minnows, and reasoned that this change might be induced bydifferences in thermal environment. They tested this point by a series of asphyxia-tion experiments, using goldfish acclimatized to various temperatures over theirthermal range, and found goldfish at higher temperatures to have greater carbondioxide tolerance. Thus changes in thermal environment had induced, in the onespecies, differences previously considered to be interspecific.
The asphyxiation experiments do not indicate the manner in which thermalenvironment affects carbon dioxide tolerance, but Fry et al. (1947) suggested thattheir results might reflect changes in either the circulation of the blood or thechemistry of oxygen transportation.
It appeared that the blood of thermally acclimatized fish should be examinedfrom at least three aspects: (1) oxygen capacity, (2) oxygen affinity, and (3) effects
Oxygen capacity of goldfish blood 95
of carbon dioxide upon the oxygen dissociation curve. This paper reports theresults of measuring oxygen capacity of blood from goldfish acclimatized to tempera-tures near the extremes of their range.
MATERIAL AND METHODS
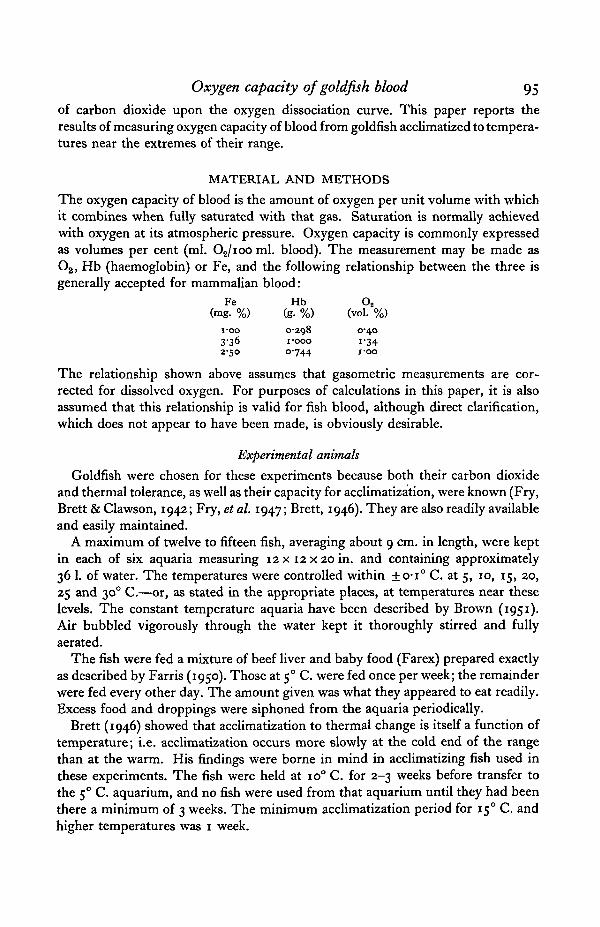
The oxygen capacity of blood is the amount of oxygen per unit volume with whichit combines when fully saturated with that gas. Saturation is normally achievedwith oxygen at its atmospheric pressure. Oxygen capacity is commonly expressedas volumes per cent (ml. O2/ioo ml. blood). The measurement may be made asO2, Hb (haemoglobin) or Fe, and the following relationship between the three isgenerally accepted for mammalian blood:
Fe Hb O2
(mg. %) (g. %) (vol. %)
i-oo 0-298 0-403-36 i-ooo :-342-50 °'744 i*oo
The relationship shown above assumes that gasometric measurements are cor-rected for dissolved oxygen. For purposes of calculations in this paper, it is alsoassumed that this relationship is valid for fish blood, although direct clarification,which does not appear to have been made, is obviously desirable.
Experimental animals
Goldfish were chosen for these experiments because both their carbon dioxideand thermal tolerance, as well as their capacity for acclimatization, were known (Fry,Brett & Clawson, 1942; Fry, et al. 1947; Brett, 1946). They are also readily availableand easily maintained.
A maximum of twelve to fifteen fish, averaging about 9 cm. in length, were keptin each of six aquaria measuring 12 x 12 x 20 in. and containing approximately36 1. of water. The temperatures were controlled within ±o-i° C. at 5, 10, 15, 20,25 and 300 C.—or, as stated in the appropriate places, at temperatures near theselevels. The constant temperature aquaria have been described by Brown (1951).Air bubbled vigorously through the water kept it thoroughly stirred and fullyaerated.
The fish were fed a mixture of beef liver and baby food (Farex) prepared exactlyas described by Farris (1950). Those at 50 C. were fed once per week; the remainderwere fed every other day. The amount given was what they appeared to eat readily.Excess food and droppings were siphoned from the aquaria periodically.
Brett (1946) showed that acclimatization to thermal change is itself a function oftemperature; i.e. acclimatization occurs more slowly at the cold end of the rangethan at the warm. His findings were borne in mind in acclimatizing fish used inthese experiments. The fish were held at io° C. for 2-3 weeks before transfer tothe 50 C. aquarium, and no fish were used from that aquarium until they had beenthere a minimum of 3 weeks. The minimum acclimatization period for 150 C. andhigher temperatures was 1 week.
96 E. H. ANTHONY
Collection of blood samples
Blood from larger species of fish from local rivers and streams was used inworking out analytical techniques. It was found that several analytical proceduresapplicable to mammalian blood were unsuitable for fish blood.
All fish were rendered unconscious before removal of blood. Larger fish werestruck on the head, while for smaller ones one of two anaesthetics was used. Fiveper cent procaine hydrochloride was administered directly to the brain by hypo-dermic syringe after Kisch (1947). This rapidly produces unconsciousness withoutstopping the heart. Alternatively, 5 % urethane was administered by placing the fishin a bath until it lost consciousness. This method proved most satisfactory withgoldfish. Blood was collected directly from the heart or ventral aorta. The peri-cardial cavity was exposed from the ventral side and the area dried with filter-paper.A paraffined needle attached to a small polyethylene tube was inserted, usually intothe bulbus or ventral aorta, and the heart was allowed to pump out blood into asmall polyethylene vessel under slight negative pressure applied by mouth. Withvery small fish the needle was inserted into the ventricle. Clotting was preventedby dusting the interior of the collecting apparatus with dry heparin. Goldfish at50 C. often lacked sufficient cardiac vigour to pump blood into the tube. Where thisoccurred, the pericardial cavity was blotted dry, an incision was made in the heart,and the blood collected by suction as it leaked into the surrounding cavity, the areahaving been dusted with heparin.
Measurement of oxygen capacity
Attempts to measure the oxygen capacity of blood using the Van Slyke mano-metric apparatus and the method of Sendroy (1931) were disappointing becauseof lack of consistency in replicates. Following Prof. Roughton's suggestion, thecarbon monoxide method was adopted, with minor modifications from Roughton &Root (1945). In what follows, the terms CO capacity and O2 capacity are taken tobe synonymous and used interchangeably.
Because of discrepancies between Van Slyke results and alkaline haematinanalyses, to be described, it was thought advisable to check whether the van Slykemethod could extract all the CO combined with the blood. This was not a questionof time, since it had been ascertained that the 5 min. period was adequate forextraction to constant volume. It was a question of whether there was an unextract-able fraction. The method was to reduce a sample of blood completely, then to adda known volume of CO, to measure the quantity of CO remaining after absorptionby the blood, and finally to conduct a Van Slyke analysis. Results are shown inFig. 1 A, and they indicate that the Van Slyke method as commonly used is entirelyreliable. Hence it was taken as a standard to which other methods of analysis couldbe compared. The need for another method for measuring oxygen capacity arosefrom the fact that o-i ml. of blood was required for each measurement by theVan Slyke method, and this quantity was as much or more blood than could beobtained from each of the experimental fish. Preliminary experiments indicated
Oxygen capacity of goldfish blood 97
that oxygen capacity measurements were not comparable unless measurements ofcellular content were also made concurrently. These considerations made itnecessary to find a method whereby oxygen capacity could be determined usingnot more than 0-025 m ^ °f blood. Alternate methods that were tried includedmeasurement of the iron content of the blood and several methods common toclinical haemoglobinometry.
• Fish whole blood
O Fish Hb solution
• Mammalian whole blood
3 Mammalian Hb solution
• Goldfish blood at 26°
y Goldfish blood at 5°
18
16
14
12
10
8
I I I I I I i I I
y
• /
B. Iron analysis
I I < I I I 1 I I
18
16
14
12
10
8
/ \
I I I I I I I I I I I
-
-_
A. CO absorption /
- V -•V -
: X" :
-*/ :". . . I I I "
A *
- /
• • Of»T^Po
- # /- • /^ •
y D. Alkaline haematin
I I i I i i i i I i I
I I I I I I
" C. Haldane
<y
/
VcrII IIII II
E. Pyridinehaemochromogen
•O
- ° /- /
1 1 1 1 1 1
1 1 1 1 1
-
A---ii iiii II
a
* • / -
----
i i i i
10 12 14 16 18 20 8 10 12 14 16
Oxygen capacity by Van Slyke vol '
8 10 12 14 16
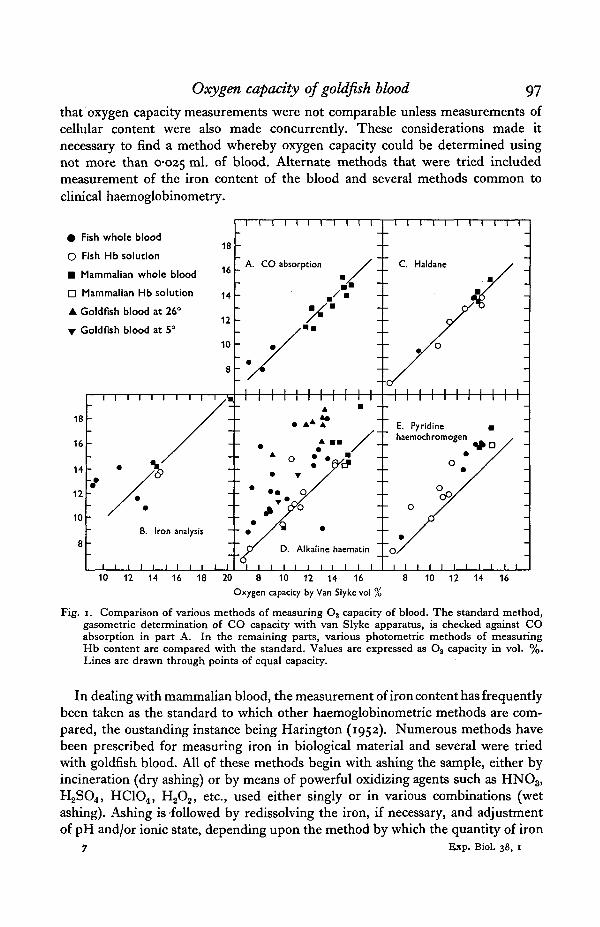
Fig. i. Comparison of various methods of measuring O2 capacity of blood. The standard method,gasometric determination of CO capacity with van Slyke apparatus, is checked against COabsorption in part A. In the remaining parts, various photometric methods of measuringHb content are compared with the standard. Values are expressed as O8 capacity in vol. %.Lines are drawn through points of equal capacity.
In dealing with mammalian blood, the measurement of iron content has frequentlybeen taken as the standard to which other haemoglobinometric methods are com-pared, the oustanding instance being Harington (1952). Numerous methods havebeen prescribed for measuring iron in biological material and several were triedwith goldfish blood. All of these methods begin with ashing the sample, either byincineration (dry ashing) or by means of powerful oxidizing agents such as HNO3,H2SO4, HC1O4, H2O2, etc., used either singly or in various combinations (wetashing). Ashing is followed by redissolving the iron, if necessary, and adjustmentof pH and/or ionic state, depending upon the method by which the quantity of iron
7 Exp. Biol. 38, 1
98 E. H. ANTHONY
is to be measured. Results presented in Fig. iB were obtained by wet ashingfollowed by photometric measurement using an absorptiometer and either oc-a'-dipyridyl (Hill, 1931) or catechol-3 (the disodium salt of 1,2-dihydroxybenzene-3,5-disulphonate) (Yoe & Jones, 1944) as an indicator. The latter indicator wasfavoured because it is specific for ferric ion, hence its use precluded reduction,a step that frequently resulted in cloudy solution.
The quantity of Hb in blood is a diagnostic observation in human medicine, andit has long been considered important for the practitioner to be able to makereasonably accurate measurements of the pigment. Numerous methods and relatedapparatus have been developed in response to this need. Photometric methodsinvolving five Hb derivatives were tried in the course of the present work: alkalinehaematin, carboxy-haemoglobin (Haldane), cyanhaematin, oxyhaemoglobin, andpyridine haemochromogen. All but the latter derivative were extensively tested bythe Medical Research Council (MRC) (Harington, 1952). Their recommendationsas to preparing the derivative and selecting a suitable filter for light absorptionmeasurements was followed closely. A brief description of these methods follows:
Alkaline haematin method
0-023 ml. of blood was added to 4*975 ml. of N/IO NaOH with rapid stirring andthe solution heated for 4 min. in boiling water. After cooling, the solution wastransferred to a 1 cm. optical cell and read in an absorptiometer using IlfordSpectrum filter 605. For most of the determinations, an artificial standard (Gibson& Harrison, 1945) was used. Five ml. of this standard were heated along with theblood samples, then cooled and read in the same cells. A natural haematin standardwas prepared by dissolving 38-0 mg. of haematin hydrochloride (B.D.H.) containing8-46 % iron in about 100 ml. of borate buffer (19-07 g. Na^O? . ioH2O and 100 ml.of N/I NaOH per litre), leaving it in the refrigerator to 'age' for 2 days, and thenmaking it up to 500 ml. with the same buffer. Results with either standard agreedwithin 1 %.
Cyanhaematin method
0-025 ml- °f blood was added to 2-5 ml. of N/IO HC1, stirred into solution, andallowed to stand for 15 min. 2-5 ml. of N/IO NaOH containing 2% NaCN wasadded, and the solution was thoroughly mixed. It was then transferred to 1 cm.optical cell and read in an absorptiometer using Ilford Spectrum filter 605.Standard cyanhaematin solution was prepared by dissolving 14-6 mg. of crystallinehaematin containing 8-46% iron in 500 ml. of N/IO NaOH containing 1 % NaCN.
Haldane (COHb) method
0-025 ml. of blood was added to dilute ammonia (0*4 ml. cone. NH4OH per litre)in a standard Haldane tube and the volume was immediately made up to thegraduation with the dilute ammonia. The tube was then stoppered with a fingertip and the blood was shaken into solution. A minute amount of capryl alcohol wasused to prevent foaming while pure CO was bubbled through the solution for 2 min.
Oxygen capacity of goldfish blood 99
The sample solutions were compared with a standard Haldane solution sealed ina matching tube. A special metal adaptor enabled these comparisons to be madein the absorptiometer using Ilford Spectrum filter 605.
Oxyhaemoglobin method
In some instances the blood samples were treated as in the Haldane method exceptthat neither capryl alcohol nor CO were added. No permanent standard is avail-able, but the Haldane standard was used for comparison and its equivalencederived by a correction factor in accordance with the MRC method.
Alternatively, 0-025 m ^ °f blood was added to 4-975 ml. of the dilute ammoniaas used in the Haldane method and stirred rapidly into solution. The solution wasthen transferred to a 1 cm. optical cell and read in an absorptiometer with IlfordSpectrum filters 604 or 605. The concentration of Hb was then computed fromthe optical density by employing the MRC factors 0-330 and 0-498 as the respectiveoptical densities with the two filters of blood containing 14-8 g. % Hb and diluted1:200.
Pyridine haemochromogen method
The following method was based upon that of Collier (1944). 0*025 m^- °f bloodwas added to 4-975 ml. of N/IO NaOH and the solution was heated and cooled as inthe alkaline haematin method. 2 ml. of pyridine were added to the solution and,after thorough mixing, it was left to stand for 30 min. It was then reduced by theaddition of about 5 mg. of N^SgC^, transferred to a 1 cm. optical cell, and read inthe absorptiometer with Ilford Spectrum filter 604. 0-25 ml. of standard haematinsolution was treated in the same manner. The standard solution was prepared bydissolving 66 mg. of crystalline haematin hydrochloride containing 8-46 % iron in100 ml. of N/IO NaOH. Since the standard was 1 mH with respect to iron, it wastheoretically equivalent to an oxygen capacity of 22-4 vol. %, but the total quantityof liquid in the final dilutions of blood and standard samples differed, being7-000 for blood and 7-225 for the standard. Consequently, the standard was takento be equivalent to an oxygen capacity of 22-4 x 7-000/7-225:21-70 vol. %.
In using both the iron method and the clinical methods, advantage was taken ofa service of the MRC whereby subscribers may obtain periodically samples of bloodof which the Hb content has been measured by the best modern techniques. Thesesamples, presumably human blood, make up some of the points in Fig. 1. Allphotometric measurements were made with a Hilger 'Spekker' Absorptiometer.
Measurement of cellular content
The erythrocytes were enumerated in the standard manner using a Thomadiluting pipette and a haemocytometer slide. At first Hayem's diluting fluid wasused, but subsequently that of George (1952) was found to be more satisfactory.The concentration of stain was reduced by a factor of four in order to get betterresults with fish blood.
7-2
ioo E. H. ANTHONY
Microhaematocrit tubes were used to determine the percentage of erythrocytes inthe blood. They were centrifuged at 3000 rev./min. for 30 min. Duplicates usuallyagreed within 1 %.
It should be emphasized that, in dealing with the experimental fish, all threemeasurements—oxygen capacity, haemocytometer and haematocrit—were madeupon aliquots from the same sample of blood. Hb solutions were prepared fromfish blood by laking erythrocytes that had been washed 3 times in about 10 vol. ofcold 0-9 % NaCl with gentle centrifugation. Laking was brought about either byalternate freezing and thawing in 10 vol. of the saline solution or by adding 1 vol.of cells to 10 vol. of distilled water while stirring rapidly. The cellular debris wasthen removed by centrifugation. Solutions of mammalian Hb prepared in thismanner are said to be about 95 % pure.
From haemocytometer counts of the number of red blood cells (RBC), thepercentage of RBC in the blood (haematocrit), and the oxygen capacity of thewhole blood, the following values were derived as shown:
(1) Mean corpuscular volume:
MCV - ° / ° R B C x i Q = .a
Millions of RBC/mm.3 ^ "
(2) Oxygen capacity of 100 ml. of erythrocytes:
™T^ Whole blood capacity x 100 . . .R B C = %RBC = vo1- %"
(3) Oxygen capacity of single cells:Whole blood capacity x 10""Millions of RBC/mm.3
_ 3= *
RESULTSThe results of tests to find a micro-method for measuring oxygen capacity areshown in Fig. 1. Fig. 1B shows that iron analyses agree with Van Slyke measure-ments upon mammalian blood and fish Hb solutions, but exhibit considerablescatter when whole fish blood is used. While the results are too few to be conclusive,they draw attention to the fact that difficulties attending the use of iron content asa basis for haemoglobinometry are not limited to analytical techniques, but extendto interpretation of results. The scatter may have been due to varying amounts ofnon-Hb iron. Part of this non-Hb iron is in the plasma, but, as Lemberg & Legge(1949) point out, a larger portion is contained within the erythrocytes. The observa-tion of Catton (1951) that there is a greater amount of debris in films of fish bloodprepared for histological examination than in corresponding preparations ofmammalian blood, has been confirmed in the present work. There appeared to bemore ' ghosts' and general debris in haemocytometer preparations from fish bloodthan from human or sheep blood, and this was so even where clarity of plasma inhaematocrits showed that no haemolysis had occured. If the debris results from
Oxygen capacity of goldfish blood 101
erythrocytes breaking down in the blood stream, then presumably the Hb becomesdenatured, and the scatter observed in results of iron analysis may reflect Catton'smorphological observation. In any event, the measurement of iron content of fishblood was not considered to be a suitable alternative to the Van Slyke method ofmeasuring oxygen capacity.
The use of the alkaline haematin method for determining Hb in mammalianblood is fairly well established from reports of the MRC and from the work ofGibson & Harrison (1945), who prepared an artificial standard that is commerciallyavailable. The results of the present work are shown in Fig. 1D and they indicatethat while the method is satisfactory for mammalian blood and fish Hb solutions,with fish blood it gives very erratic results that tend to be much higher than VanSlyke.
There have been conflicting reports of the suitability of the alkaline haematinmethod to other than mammalian blood. Bankowski (1942), for instance, concludedthat it was not satisfactory for avian blood, which resembles fish blood in havingnucleated erythrocytes. From the present results it is thought to be unsuitable forfish blood.
The cyanhaematin method proved unsuitable because of difficulty with the firststep, the conversion of Hb in the blood to acid haematin. Fish blood mixes morereadily with acid than with alkaline solution, but the preparations frequently becomecloudy. This is scarcely surprising inasmuch as Hb denatured by acid does notform a true solution but a colloidal suspension (Lemberg & Legge, 1949). The acidhaematin method has been widely used in clinical medicine, where it is associatedwith the name of Sahli (Wintrobe, 1942), and has frequently been applied to non-mammalian blood, e.g. Schlicher (1926), Dombrowski (1953) and Black (1955).Admirable ingenuity has been displayed by some workers attempting to avoid orovercome the difficulties of applying the acid haematin method (Dukes & Schwarte,1930; Elvehjem, 1931), but it appears simpler and more advisable to abandon themethod.
The most obvious derivative to use is oxyhaemoglobin, but its use in anabsorptiometer suffers from lack of a permanent standard. The MRC haveattempted to overcome this lack by publishing what amount to extinction coefficientsfor a number of filters used in conjunction with certain Hb derivatives in bothvisual and photoelectric photometers. While the use of extinction coefficients is wellestablished in spectrophotometry where very narrow portions of the spectrum areused, it has not been widely practised in obsorptiometry where exact reproducibilityof filter characteristics is regarded with some doubt. This method was tried both byusing the MRC factors for Ilford filters 604 and 605 directly, with the solution in1 cm. cuvettes, and also by using the Haldane tubes and correcting the value ofthe Haldane standard by means of the MRC factors. Both of these methods gavegood results, nevertheless more confidence was felt in using a method for which apermanent standard was available.
Results of the Haldane method (Fig. 1C) were found to agree consistently withthe Van Slyke methods; indeed the two methods appear to be interchangeable.
102 E. H. A N T H O N Y
The pyridine haemochromogen method is not as convenient as the others in theseries, but was found to be quite simple in practice, and gave precise results as isshown in Fig. i E. All results fell above the line of theoretical agreement with theVan Slyke method, but agreement is achieved by multiplying the pyridine haemo-chromogen values by 0878. Theoretically the Haldane method should be betterthan the pyridine haemochromogen one for measuring oxygen capacity, sinceany so-called ' inactive' fractions of Hb present in blood would be converted tohaemochromogen. It is of interest to note that the unidentified substances whichinterfered with the alkaline haematin method appeared to have no effect uponmeasurements of pyridine haemochromogen.
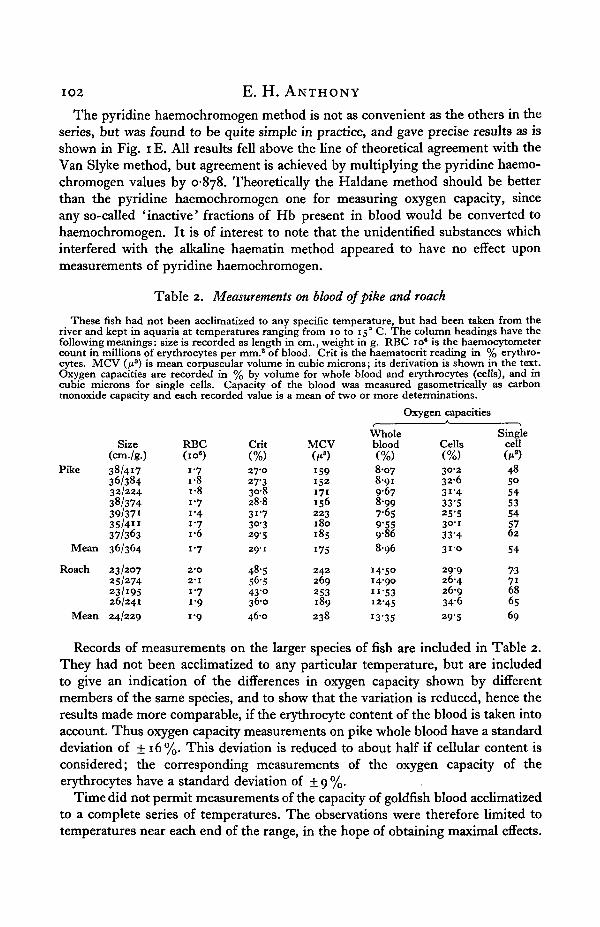
Table 2. Measurements on blood of pike and roach
These fish had not been acclimatized to any specific temperature, but had been taken from theriver and kept in aquaria at temperatures ranging from 10 to 150 C. The column headings have thefollowing meanings: size is recorded as length in cm., weight in g. RBC io8 is the haemocytometercount in millions of erythrocytes per mm.8 of blood. Crit is the haematocrit reading in % erythro-cytes. MCV (fi3) is mean corpuscular volume in cubic microns; its derivation is shown in the text.Oxygen capacities are recorded in % by volume for whole blood and erythrocytes (cells), and incubic microns for single cells. Capacity of the blood was measured gasometrically as carbonmonoxide capacity and each recorded value is a mean of two or more determinations.
Pike
Size(cm./g.)38/41736/38432/22438/37439/37135/4"37/36336/364
23/20725/27423/19526/24124/229
RBCdo")
1-7i-8i-8i -7i - 41-7i -6
1-7
2-O2*11-71-9
1-9
Crit(%)27-027-330-828-831-730-329-529-1
48-556-543-o36-046-0
MCV(/*')159152171156223180185
175
242269253189
238
Wholeblood(%)8-078 9 19-678-997-659-559-868-96
14-5°14-90n-53!2-45'3-35
Oxygen capacities
Cells(%)30-232-63i-433-525-53°-i33-431-0
2 9 926-426-934-629-5
Singlecell(f8)485°5453545762
54
737 i686569
Mean
Roach
Mean
Records of measurements on the larger species of fish are included in Table 2.They had not been acclimatized to any particular temperature, but are includedto give an indication of the differences in oxygen capacity shown by differentmembers of the same species, and to show that the variation is reduced, hence theresults made more comparable, if the erythrocyte content of the blood is taken intoaccount. Thus oxygen capacity measurements on pike whole blood have a standarddeviation of +16%. This deviation is reduced to about half if cellular content isconsidered; the corresponding measurements of the oxygen capacity of theerythrocytes have a standard deviation of + 9 %.
Time did not permit measurements of the capacity of goldfish blood acclimatizedto a complete series of temperatures. The observations were therefore limited totemperatures near each end of the range, in the hope of obtaining maximal effects.

Oxygen capacity of goldfish blood 103
Some difficulty was experienced in maintaining fish in a condition of good healthat temperatures below io° C. Some individuals in the cold, which appeared to beotherwise healthy, had blood that was abnormal in appearance. Only valuesobtained from blood of normal appearance from fish of normal appearance arequoted in Table 3.
Table 3. Measurements on blood of thermally acclimatized goldfish
The column headings have the same meanings as for Table 2. The capacity measurements weremade upon whole blood by the Haldane (carboxyhaemoglobin) method using an absorptiometerand each value is a mean of two or more determinations.
Oxygen capacities
Goldfish
MeanGoldfish
Mean
Size(cm./g.)
acclimatized8-o/ 8-38-o/ 8-98-8/i2-i
——
8-2/9-1
acclimatized10-4/20-39-0/ —
11-0/26-59-8/19-5
10-1/22-1
Goldfish acclimatized
Mean
Goldfish
Mean
10-8/25-09-S/I9-S9-5/17-59-5/18-58-7/15-59-8/19-09-3/17-19-6/19-0
acclimatized9-4/12-69-6/I5-59-4/16-29-8/14-29-8/14-99-6/14-7
to
to
to
to
RBC(10°)
5°C.2 - 12-O1-72-O2 - 2
2-O
6°C.1-22 - 22-72-1
2-1
26° C.2-11-6i-61-71-7i-61-71-7
30° Ci-3i-82-Oi-81-9i-8
Crit(%)
39-335-932-532-531-034-2
24-840-045-533-536-0
41-031-436-738-741-039-334-i37-5
25-033-038-329-528-530-9
MVC(f3)
184178188166144172
2 1 2180171z63181
193193233226240240205
219
188185192165152176
Wholeblood(%)
II-2OIO-678-929-71
io-6oIO-22
6 6 99-75
15-5413-18n-29
13-209-20
13-1113-1112-31I3-3I11-7812-29
6-659-36
12-509-968-599-41
Cells(%)
28-629-727-529-834-230-0
27-024-434-i39-331-2
32-229-335-733-930-033'934-53 2 9
26-628-332-633-830-230-3
Singlecell(M3)
5253525°485 i
5744586456
6256847772817 i72
5°5263564653
The peculiar features which appeared in blood of some of the fish at low tempera-tures included low counts and low haematocrit values. The blood also was some-times 'fragile', that is, exhibited considerable spontaneous haemolysis, usuallywithout clotting. Excessive amounts of cellular debris and white cells were observedin the haemocytometer preparations. The erythrocytes also appeared to have anunusual refractive index, for they were nearly invisible in the counting fluid.
The results of measuring the oxygen capacity of blood from thermally acclima-tized goldfish are shown in Tables 3 and 4, the former showing the variation fromfish to fish. Before discussing these results, consideration should be given to whatmight be expected by way of changes in oxygen capacity.
104 E. H. ANTHONY
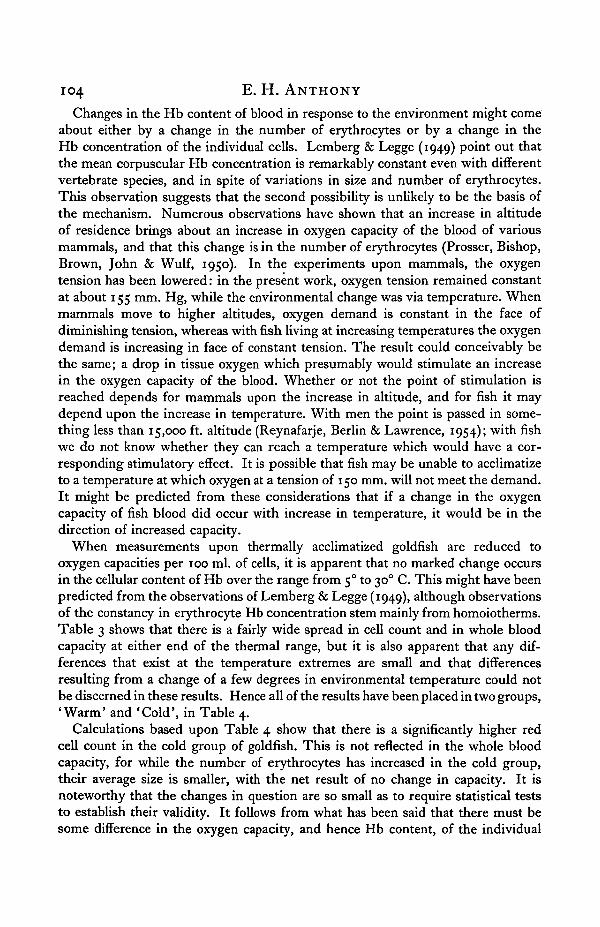
Changes in the Hb content of blood in response to the environment might comeabout either by a change in the number of erythrocytes or by a change in theHb concentration of the individual cells. Lemberg & Legge (1949) point out thatthe mean corpuscular Hb concentration is remarkably constant even with differentvertebrate species, and in spite of variations in size and number of erythrocytes.This observation suggests that the second possibility is unlikely to be the basis ofthe mechanism. Numerous observations have shown that an increase in altitudeof residence brings about an increase in oxygen capacity of the blood of variousmammals, and that this change is in the number of erythrocytes (Prosser, Bishop,Brown, John & Wulf, 1950). In the experiments upon mammals, the oxygentension has been lowered: in the present work, oxygen tension remained constantat about 155 mm. Hg, while the environmental change was via temperature. Whenmammals move to higher altitudes, oxygen demand is constant in the face ofdiminishing tension, whereas with fish living at increasing temperatures the oxygendemand is increasing in face of constant tension. The result could conceivably bethe same; a drop in tissue oxygen which presumably would stimulate an increasein the oxygen capacity of the blood. Whether or not the point of stimulation isreached depends for mammals upon the increase in altitude, and for fish it maydepend upon the increase in temperature. With men the point is passed in some-thing less than 15,000 ft. altitude (Reynafarje, Berlin & Lawrence, 1954); with fishwe do not know whether they can reach a temperature which would have a cor-responding stimulatory effect. It is possible that fish may be unable to acclimatizeto a temperature at which oxygen at a tension of 150 mm. will not meet the demand.It might be predicted from these considerations that if a change in the oxygencapacity of fish blood did occur with increase in temperature, it would be in thedirection of increased capacity.
When measurements upon thermally acclimatized goldfish are reduced tooxygen capacities per 100 ml. of cells, it is apparent that no marked change occursin the cellular content of Hb over the range from 50 to 30° C. This might have beenpredicted from the observations of Lemberg & Legge (1949), although observationsof the constancy in erythrocyte Hb concentration stem mainly from homoiotherms.Table 3 shows that there is a fairly wide spread in cell count and in whole bloodcapacity at either end of the thermal range, but it is also apparent that any dif-ferences that exist at the temperature extremes are small and that differencesresulting from a change of a few degrees in environmental temperature could notbe discerned in these results. Hence all of the results have been placed in two groups,'Warm1 and 'Cold', in Table 4.
Calculations based upon Table 4 show that there is a significantly higher redcell count in the cold group of goldfish. This is not reflected in the whole bloodcapacity, for while the number of erythrocytes has increased in the cold group,their average size is smaller, with the net result of no change in capacity. It isnoteworthy that the changes in question are so small as to require statistical teststo establish their validity. It follows from what has been said that there must besome difference in the oxygen capacity, and hence Hb content, of the individual
Oxygen capacity of goldfish blood 105
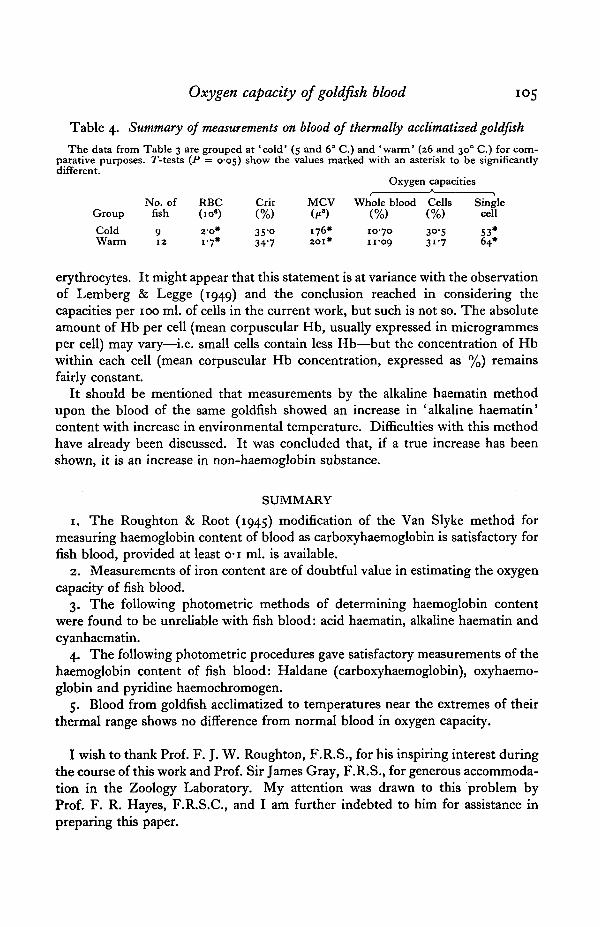
Table 4. Summary of measurements on blood of thermally acclimatized goldfish
The data from Table 3 are grouped at 'cold' (5 and 6° C.) and 'warm' (26 and 300 C.) for com-parative purposes. T-tests (P = 0-05) show the values marked with an asterisk to be significantlydifferent.
Oxygen capacities
No. of RBC Crit MCV Whole blood Cells SingleGroup fish (io«) (%) (M3) (%) (%) cell
Cold 9 2-0* 35-0 176* 1070 30-5 S3*Warm 12 1-7* 34-7 201* 11-09 3I-7 64*
erythrocytes. It might appear that this statement is at variance with the observationof Lemberg & Legge (1949) and the conclusion reached in considering thecapacities per 100 ml. of cells in the current work, but such is not so. The absoluteamount of Hb per cell (mean corpuscular Hb, usually expressed in microgrammesper cell) may vary—i.e. small cells contain less Hb—but the concentration of Hbwithin each cell (mean corpuscular Hb concentration, expressed as %) remainsfairly constant.
It should be mentioned that measurements by the alkaline haematin methodupon the blood of the same goldfish showed an increase in 'alkaline haematin'content with increase in environmental temperature. Difficulties with this methodhave already been discussed. It was concluded that, if a true increase has beenshown, it is an increase in non-haemoglobin substance.
SUMMARY
1. The Roughton & Root (1945) modification of the Van Slyke method formeasuring haemoglobin content of blood as carboxyhaemoglobin is satisfactory forfish blood, provided at least o-i ml. is available.
2. Measurements of iron content are of doubtful value in estimating the oxygencapacity of fish blood.
3. The following photometric methods of determining haemoglobin contentwere found to be unreliable with fish blood: acid haematin, alkaline haematin andcyanhaematin.
4. The following photometric procedures gave satisfactory measurements of thehaemoglobin content of fish blood: Haldane (carboxyhaemoglobin), oxyhaemo-globin and pyridine haemochromogen.
5. Blood from goldfish acclimatized to temperatures near the extremes of theirthermal range shows no difference from normal blood in oxygen capacity.
I wish to thank Prof. F. J. W. Roughton, F.R.S., for his inspiring interest duringthe course of this work and Prof. Sir James Gray, F.R.S., for generous accommoda-tion in the Zoology Laboratory. My attention was drawn to this problem byProf. F. R. Hayes, F.R.S.C., and I am further indebted to him for assistance inpreparing this paper.
106 E. H. ANTHONY
REFERENCESBANKOWSKI, R. A. (1942). Studies of the hemoglobin content of chicken blood and evaluation of
methods for its determination. Amer. J. Vet. Res. 3, 373.BARCROFT, J. (1928). The Respiratory Function of the Blood. Part II. Haemoglobin. Cambridge
University Press.BLACK, E. C. (1940). The transport of oxygen by the blood of freshwater fish. Biol. Bull., Woods Hole,
79. 215-BLACK, E. C. (1955). Blood levels of hemoglobin and lactic acid in some freshwater fishes following
exercise. J. Fish. Res. Bd. Canad. 12, 917.BRETT, J. R. (1946). Rate of gain of heat tolerance in goldfish (Carassius auratus). Publ. Ont. Fish.
Res. Lab. no. 53.BROWN, M. E. (1951). The growth of brown trout. J. Exp. Biol. 28, 473.BROWN, M. E. (1957). The physiology of fishes. Vol. I. Metabolism. New York: Academic Press.CATTON, W. T. (1951). Blood cell formation in certain teleosts. Blood, 6, 39.COLLIER, H. B. (1944). The standardization of blood haemoglobin determinations. Canad. Med.
Ass. J. 50, 550.DOMBROWSKI, H. (1953). Untersuchungen iiber das Blut des Karpfens (Cyprinus carpio L.) und
einiger anderer Susswasserfischarten. Biol. Zbl. 73, 182.DUKES, H. H. & SCHWARTE, L. H. (1930). The hemoglobin content of the blood of fowls. Amer. J.
Physiol. 96, 89.ELVEHJEM, C. A. (193I). The preparation of standard acid hematin solutions from hemen. J. Biol.
Chem. 93, 203.FARRIS, E. J. (1950). The Care and Breeding of Laboratory Animals. New York: John Wiley & Sons.FRY, F. E. J. & BLACK, E. C. (1938). The influence of carbon dioxide on the utilization of oxygen by
certain species of fish in Algonquin Park, Ontario. Anat. Rec. 72 (suppl. 33).FRY, F. E. J., BLACK, V. S. & BLACK, E. C. (1947). Influence of temperature on the asphyxiation
of young goldfish (Carassius auratus L.) under various tensions of oxygen and carbon dioxide.Biol. Bull., Woods Hole, 92, 217.
FRY, F. E. J., BLACK, E. C. & SCOTT, W. J. (1939). The effect of carbon dioxide on the rate of oxygenuptake by fresh water fish. Anat. Rec. 75, 104.
FRY, F. E. J., BRETT, J. R. & CLAWSON, G. H. (1942). Lethal limits of temperature for younggoldfish. Rev. Canad. Biol. I, 50.
GEORGE, O. T. (1952). A diluting fluid for counting erythrocytes which simultaneously stains thecells and makes them lie flat within a single focal plane. J. Lab. & Clin. Med. 40, 479.
GIBSON, Q. H. & HARRISON, D. C. (1945). An artificial standard for use in the estimation of haemo-globin. Biochem. J. 39, 490.
HALL, F. G. & GRAY, E. I. (1929). The hemoglobin concentration of the blood of marine fishes.J. Biol. Chem. 81, 589.
HARINGTON, C. R. and Sub-committee on analytical methods, Medical Research Council (1952).The estimation of haemoglobin. Collected reprints from Lancet.
HART, J. S. (1943). The cardiac output of four fresh water fish. Canad. J. Res. 21, 77.HART, J. S. (1944). The circulation and respiratory tolerance of some Florida fresh water fishes.
Proc. Fla Acad. Sci. 7, 221.HILL, R. (193 I) . A method for the estimation of iron in biological material. Proc. Roy. Soc. B,
107, 205.HOAR, W. S., BLACK, V. S. & BLACK, E. C. (1951). Some aspects of the physiology of fish. Publ.
Ont. Fish. Res. Lab. no. 71. University Toronto Press.IRVING, L., BLACK, E. C. & SAFFORD, V. (1939). The respiratory tolerance of some Pennsylvania
fish. Amer. J. Physiol. 126, 545.KISCH, B. (1947). A method to immobilize fish for cardiac and other experiments with procaine.
Biol. Bull., Woods Hole, 93, 208.KROGH, A. (1941). The Comparative Physiology of Respiratory Mechanisms. Philadelphia.KROGH, A. & LEITCH, I. (1919). The respiratory function of the blood in fishes. J. Physiol. 52,
288.LEMBERG, R. & LEGGE, J. W. (1949). Hematin Compounds and Bile Pigments. New York and London:
Interscience Publ. Inc.PROSSER, C. L., BISHOP, D. W., BROWN, F. A., JOHN, T. L. & WULF, V. J. (1950). Comparative
Animal Physiology. W. B. Saunders Co.REYNAFARJE, C , BERLIN, N. I. & LAWRENCE, J. H. (1954). Red cell life span in acclimatization to
altitude. Proc. Soc. Exp. Biol, N.Y., 87, 101.
Oxygen capacity of goldfish blood 107ROOT, R. W. (1931). The respiratory function of the blood of marine fishes. Biol. Bull., Woods Hole,
61, 427.ROUGHTON, F. J. W. & ROOT, W. S. (1945). The estimation of small amounts of carbon monoxide
in blood. J. Biol. Chem. 160, 123.SAFFORD, V. (1940). Asphyxiation of marine fish with and without CO8 and its effect on the gas
content of the swimbladder. J. Cell Comp. Physiol. 16, 165.SCHLICHER, J. (1926). Vergleichend Physiologische Untersuchungen der Blutkorperchenzahlen bei
Knochenfischen. Zool. Jb. 43, 121.SENDROY, J. (1931). Manometric determination of hemoglobin by the oxygen capacity method.
J. Biol. Chem. 91, 307.WILLMER, E. N. (1934). Some observations on the respiration of tropical fresh water fishes. J. Exp.
Biol. 2, 283.WINTRODE, M. W. (1942). Clinical Haematology. London: Henry Kempton.YOE, J. H. & JONES, A. L. (1944). Colorimetric determination of iron with disodium-i, 2-dihydroxy-
benzene-3,s,disulfonate. Indust. Engng Chem. (Anal, ed.), 16, m .