Embed Size (px)
Citation preview

American Economic Review 2013, 103(1): 1–46 http://dx.doi.org/10.1257/aer.103.1.1
1
The “Out of Africa” Hypothesis, Human Genetic Diversity, and Comparative Economic Development†
By Quamrul Ashraf and Oded Galor*
This research advances and empirically establishes the hypothesis that, in the course of the prehistoric exodus of Homo sapiens out of Africa, variation in migratory distance to various settlements across the globe affected genetic diversity and has had a persistent hump-shaped effect on comparative economic development, reflecting the trade-off between the beneficial and the detrimental effects of diversity on productivity. While the low diversity of Native American popula-tions and the high diversity of African populations have been detri-mental for the development of these regions, the intermediate levels of diversity associated with European and Asian populations have been conducive for development. (JEL N10, N30, N50, O10, O50, Z10)
Prevailing hypotheses of comparative economic development highlight various determinants of the remarkable inequality in income per capita across the globe. The significance of geographical, institutional, and cultural factors, human capital, eth-nolinguistic fractionalization, colonialism, and globalization has been at the heart of a debate concerning the genesis of the astounding transformation in the pattern of comparative development over the past few centuries. While early research focused on the proximate forces that contributed to the divergence in living standards in the post–Industrial Revolution era, attention has shifted gradually toward some
* Ashraf: Department of Economics, Williams College, 24 Hopkins Hall Dr., Williamstown, MA 01267 (e-mail: [email protected]); Galor: Department of Economics, Brown University, 64 Waterman St., Providence, RI 02912 (e-mail: [email protected]). The authors are grateful to five anonymous referees, Alberto Alesina, Kenneth Arrow, Alberto Bisin, Dror Brenner, John Campbell, Kenneth Chay, Steve Davis, Andrew Foster, David Genesove, Douglas Gollin, Sergiu Hart, Saul Lach, Ross Levine, Anastasia Litina, Nathan Nunn, Ola Olsson, Mark Rosenzweig, Antonio Spilimbergo, Enrico Spolaore, Alan Templeton, Romain Wacziarg, and David Weil; seminar participants at Aix-Marseille, Bar-Ilan, Barcelona, Ben-Gurion, Brown, Boston College, Chicago GSB, Copenhagen, Doshisha, Groningen, Haifa, Harvard, Hebrew U., Hitotsubashi, the IMF, Keio, Kyoto, Luxembourg, MIT, Osaka, Porto, Princeton, St. Gallen, Sciences Po, Tel Aviv, Tokyo, Tufts, UCLA Anderson, UPF, Williams, the World Bank, Yale, and Zurich; and conference participants of the CEPR EHRTN Summer Workshop on From Stagnation to Growth: Unified Growth Theory in Florence, the second Annual Conference on Macroeconomics across Time and Space at the Philadelphia Fed, the Korean Economic Association’s International Employment Forum in Seoul, the SED Annual Meeting, the NBER Summer Institute, the NBER Political Economy Group Meeting, the fourth Migration and Development Conference at Harvard, the ninth IZA Annual Migration Meeting, the MOVE Workshop on Social Economics in Barcelona, the eighth BETA Workshop in Historical Economics in Strasbourg, and the International Conference on Intergenerational Transmission of Entrepreneurship, Occupation, and Cultural Traits in the Process of Long-Run Economic Growth in Naples for helpful comments and suggestions. The authors also thank attendees of the Klein Lecture, the Kuznets Lecture, and the Maddison Lecture, and they are especially indebted to Yona Rubinstein for numerous insightful discussions and to Sohini Ramachandran for sharing her data. Desislava Byanova and Daniel Doran provided excellent research assistance. Financial support from the Watson Institute for International Studies and the Population Studies and Training Center (PSTC) at Brown University is gratefully acknowledged. The PSTC receives core support from the Eunice Kennedy Shriver National Institute of Child Health and Human Development (5R24HD041020). Ashraf’s research is supported by a Hellman Fellows Grant through Williams College. Galor’s research is supported by National Science Foundation (SES-0921573).
† To view additional materials, visit the article page at http://dx.doi.org/10.1257/aer.103.1.1.

2 THE AMERICAN ECONOMIC REVIEW fEbRuARy 2013
ultimate, deep-rooted, prehistoric factors that may have affected the course of com-parative development since the emergence of human civilization.
This research argues that deep-rooted factors, determined tens of thousands of years ago, have had a significant effect on the process of economic development from the dawn of humankind to the contemporary era. It advances the hypothesis that, in the course of the exodus of Homo sapiens out of Africa, variation in migra-tory distance from the cradle of humankind in East Africa to various settlements across the globe affected genetic diversity and has had a long-lasting hump-shaped effect on the pattern of comparative economic development that is not captured by geographical, institutional, and cultural factors.
Consistent with the predictions of the theory, the empirical analysis finds that the level of genetic diversity within a society has a hump-shaped effect on development outcomes in the precolonial as well as in the modern era, reflecting the trade-off between the ben-eficial and the detrimental effects of diversity on productivity. While the low degree of diversity among Native American populations and the high degree of diversity among African populations have been detrimental forces in the development of these regions, the intermediate levels of genetic diversity prevalent among European and Asian popu-lations have been conducive for development. This research thus highlights one of the deepest channels in comparative development, pertaining not to factors associated with the onset of complex agricultural societies as in the influential hypothesis of Diamond (1997), but to conditions innately related to the very dawn of humankind itself.
The hypothesis rests upon two fundamental building blocks. First, migratory dis-tance from the cradle of humankind in East Africa had an adverse effect on the degree of genetic diversity within ancient indigenous settlements across the globe. Following the prevailing hypothesis, commonly known as the serial founder effect, it is postulated that, in the course of human expansion over planet Earth, as sub-groups of the populations of parental colonies left to establish new settlements fur-ther away, they carried with them only a subset of the overall genetic diversity of their parental colonies. Indeed, as depicted in Figure 1, migratory distance from East Africa has an adverse effect on genetic diversity in the 53 ethnic groups across the globe that constitute the Human Genome Diversity Cell Line Panel, compiled by the Human Genome Diversity Project (HGDP) in collaboration with the Centre d’Etudes du Polymorphisme Humain (CEPH).
Second, there exists an optimal level of diversity for each stage of economic devel-opment, reflecting the interplay between the opposing effects of diversity on the devel-opment process. The adverse effect pertains to the detrimental impact of diversity on the efficiency of the aggregate production process. Heterogeneity raises the likeli-hood of disarray and mistrust, reducing cooperation and disrupting the socioeconomic order. Higher diversity is therefore associated with lower productivity, which inhibits the capacity of the economy to operate efficiently relative to its production possibil-ity frontier. The beneficial effect of diversity, on the other hand, concerns the positive role of heterogeneity in the expansion of society’s production possibility frontier. A wider spectrum of traits is more likely to contain those that are complementary to the advancement and successful implementation of superior technological paradigms.1
1 The following two mechanisms further illustrate this argument. First, in an economy where the labor force is characterized by heterogeneity in a wide array of traits, to the extent that some of these traits lead to specialization in

3AshrAf And GAlor: diversity And developmentvol. 103 no. 1
Higher diversity therefore enhances society’s capability to integrate advanced and more efficient production methods, expanding the economy’s production possibility frontier and conferring the benefits of improved productivity.
Higher diversity in a society’s population can therefore have conflicting effects on the level of its productivity. Aggregate productivity is enhanced on the one hand by an increased capacity for technological advancement while diminished on the other by reduced cooperation and efficiency.2 Further, if the beneficial effects of population diversity dominate at lower levels of diversity and the detrimental effects prevail at higher ones (i.e., if there are diminishing marginal returns to both diversity and homogeneity), the theory would predict a hump-shaped effect of genetic diver-sity on productivity throughout the development process.
The hypothesized channels through which genetic diversity affects aggregate productivity follow naturally from separate well-established mechanisms in the field of evolutionary biology and experimental evidence from scientific studies on organisms that display a relatively high degree of social behavior in nature (e.g., living in task-directed hierarchical societies and engaging in cooperative rearing
task-oriented activities, higher diversity will increase productivity for society as a whole, given complementarities across different tasks. Second, in an environment in which only individuals with sufficiently high levels of cogni-tive abilities can contribute to technological innovation, greater variance in the distribution of these traits across the population will lead to higher productivity.
2 This hypothesis is consistent with evidence on the costs and benefits associated with intrapopulation heteroge-neity, primarily in the context of ethnic diversity, as reviewed by Alesina and La Ferrara (2005).
Figure 1. Expected Heterozygosity and Migratory Distance from East Africa
Note: This figure depicts the negative impact of migratory distance from East Africa on expected heterozygosity (genetic diversity) across the 53 ethnic groups that constitute the HGDP-CEPH Human Genome Diversity Cell Line Panel.
0.55
0.6
0.65
0.7
0.75
Exp
ecte
d he
tero
zygo
sity
0 5 10 15 20 25
Migratory distance from East Africa (in thousand km)
Africa Middle East Europe Asia Oceania Americas

4 THE AMERICAN ECONOMIC REVIEW fEbRuARy 2013
of offspring).3 The benefits of genetic diversity, for instance, are highlighted in the Darwinian theory of evolution by natural selection, according to which diversity, by permitting the forces of natural selection to operate over a wider spectrum of traits, increases the adaptability and, hence, the survivability of a population under changing environmental conditions.4 On the other hand, to the extent that genetic diversity is associated with a lower average degree of relatedness among individu-als in a population, kin selection theory, which emphasizes that cooperation among genetically related individuals can indeed be collectively beneficial as it ultimately facilitates the propagation of shared genes to the next generation, is suggestive of the hypothesized mechanism through which diversity confers costs on aggregate productivity.
Population geneticists typically measure the extent of diversity in genetic mate-rial across individuals within a given population (such as an ethnic group) using an index called “expected heterozygosity.” Like most other measures of diversity, this index may be interpreted simply as the probability that two individuals, selected at random from the relevant population, differ genetically from one another with respect to a given spectrum of traits. Specifically, the expected heterozygosity measure for a given population is constructed by geneticists using sample data on allelic frequencies; i.e., the frequency with which a gene variant or allele (e.g., the brown versus blue variant for the eye color gene) occurs in the population sample. Given allelic frequencies for a particular gene or DNA locus, it is possible to com-pute a gene-specific heterozygosity statistic (i.e., the probability that two randomly selected individuals differ with respect to the gene in question), which when aver-aged over multiple genes or DNA loci yields the overall expected heterozygosity for the relevant population.
The most reliable and consistent data for genetic diversity among indigenous pop-ulations across the globe consists of 53 ethnic groups from the HGDP-CEPH Human Genome Diversity Cell Line Panel. According to anthropologists, these groups are not only historically native to their current geographical locations but have also been isolated from genetic flows from other ethnic groups. Empirical evidence pro-vided by population geneticists (e.g., Ramachandran et al. 2005) for these 53 ethnic groups suggests that, indeed, migratory distance from East Africa has an adverse linear effect on genetic diversity as depicted in Figure 1. Migratory distance from East Africa for each of the 53 ethnic groups was computed using the great circle (or geodesic) distances from Addis Ababa, Ethiopia to the contemporary geographical coordinates of these ethnic groups, subject to five obligatory intermediate waypoints (i.e., Cairo, Egypt; Istanbul, Turkey; Phnom Penh, Cambodia; Anadyr, Russia; and Prince Rupert, Canada) that capture paleontological and genetic evidence on prehis-toric human migration patterns.
Nonetheless, while the existing data on genetic diversity pertain only to ethnic groups, data for examining comparative development are typically available at the country level. Moreover, many national populations today are composed of multiple
3 Section H of the online Appendix provides a detailed discussion of the evidence from evolutionary biology on the costs and benefits of genetic diversity.
4 Moreover, according to a related hypothesis, genetically diverse honeybee colonies may operate more effi-ciently and productively as a result of performing specialized tasks better as a collective, and thereby gain a fitness advantage over colonies with uniform gene pools (Robinson and Page 1989).

5AshrAf And GAlor: diversity And developmentvol. 103 no. 1
ethnicities, some of which may not be indigenous to their current geographical loca-tions. This presents two complex tasks. First, one needs to construct a measure of genetic diversity for national populations, based on genetic diversity data at the ethnic group level, accounting for diversity not only within each component group, but for diversity due to differences between ethnic groups as well. Second, it is necessary to account for the possibility that nonindigenous ethnic groups may have initially migrated to their current locations due to the higher economic prosperity of these locations.
To tackle these difficulties, this study adopts two distinct strategies. The first restricts attention to development outcomes in the precolonial era when, argu-ably, regional populations were indigenous to their current geographical locations. Specifically, in light of the serial founder effect, the presence of multiple indig-enous ethnicities in a given region would have had a negligible impact on the diversity of the regional population during this period. The second, more complex strategy involves the construction of an index of genetic diversity for contempo-rary national populations that accounts for the expected heterozygosity within each subnational group as well as the additional component of diversity at the country level that arises from the genetic distances between its precolonial ances-tral populations. The examination of comparative development under this second strategy would have to account additionally for the potential inducement for mem-bers of distinct ethnic groups to relocate to relatively more lucrative geographical locations.
The interpretation of productivity in the agricultural phase of development reflects the Malthusian viewpoint. Improvements in the technological environment during the Malthusian epoch brought about only transitory gains in per capita income, eventually leading to a larger but not richer population (Ashraf and Galor 2011). Thus, the relevant variable gauging comparative economic development during this era is population density as opposed to income per capita. This study therefore employs cross-country historical data on population density as the dependent vari-able of interest in the historical analysis and examines the hypothesized effect of human genetic diversity within societies on their population densities in the year 1500 Common Era (ce).
Using data on genetic diversity observed at the ethnic group level, the histori-cal analysis reveals, consistent with the proposed hypothesis, a highly significant hump-shaped relationship between genetic diversity and log population density in the year 1500 ce. In particular, accounting for the influence of the timing of the Neolithic Revolution, the natural productivity of land for agriculture, as well as other geographical characteristics that may affect population density in the prein-dustrial era, the estimated linear and quadratic coefficients associated with genetic diversity imply that a 1 percentage point increase in diversity for the least diverse society in the regression sample would be associated with a 58 percent rise in its population density, whereas a 1 percentage point decrease in diversity for the most diverse society would be associated with a 23 percent rise in it its population density. Despite the statistical significance and robustness of these relationships, however, the analysis is subsequently expanded upon to lend further credence to these find-ings by alleviating concerns regarding sample size limitations and potential endo-geneity bias.

6 THE AMERICAN ECONOMIC REVIEW fEbRuARy 2013
The issue of data limitations encountered by the analysis stems from the fact that diversity data at the ethnic group level currently spans only a modest subset of the sample of countries for which historical population estimates are available. The potential endogeneity issue, on the other hand, arises from the possibility that genetic diversity within populations could partly reflect historical processes such as interregional migrations that were, in turn, determined by historical patterns of com-parative development. Furthermore, the direction of the potential endogeneity bias is a priori ambiguous. For example, while historically better-developed regions may have been attractive destinations to potential migrants, serving to increase genetic diversity in relatively wealthier societies, the more advanced technologies in these societies may also have conferred the necessary military prowess to prevent or mini-mize foreign invasions, thereby reducing the likelihood of greater genetic diversity in their populations.5
In surmounting the aforementioned data limitations and potential endogeneity issues, this research appeals to the “out of Africa” theory regarding the origins of Homo sapiens. According to this well-established hypothesis, the human species, having evolved to its modern form in East Africa some 150,000 years ago, thereafter embarked on populating the entire globe in a stepwise migration process beginning about 70,000–90,000 Before Present (BP).6 Using archeological data combined with mitochondrial and Y-chromosomal DNA analysis to identify the most recent common ancestors of contemporary human populations, geneticists are able not only to offer evidence supporting the origin of humans in East Africa but also to trace the prehis-toric migration routes of the subsequent human expansion into the rest of the world. In addition, population geneticists studying human genetic diversity have argued that the contemporary distribution of diversity across populations should reflect a serial founder effect originating in East Africa. Accordingly, since the populating of the world occurred in a series of stages where subgroups left initial colonies to create new colonies farther away, carrying with them only a portion of the overall genetic diversity of their parental colonies, contemporary genetic diversity in indigenous populations should be expected to decrease with increasing distance along prehis-toric migratory paths from East Africa.7 Indeed, several studies in population genetics
5 The history of world civilization abounds with examples of both phenomena. The so-called Barbarian inva-sions of the Western Roman Empire in the Early Middle Ages is a classic example of historical population diffusion occurring along a prosperity gradient, whereas the Great Wall of China, built and expanded over centuries to mini-mize invasions by nomadic tribes, serves (literally) as a landmark instance of the latter phenomenon.
6 An alternative to this “recent African origin” (RAO) model is the “multiregional evolution accompanied by gene flow” hypothesis, according to which early modern hominids evolved independently in different regions of the world and thereafter exchanged genetic material with each other through migrations, ultimately giving rise to a relatively uniform dispersion of modern Homo sapiens throughout the globe. In light of surmounting genetic and paleontological evidence against it, however, the multiregional hypothesis has by now almost completely lost ground to the RAO model of modern human origins (Stringer and Andrews 1988).
7 In addition, population geneticists argue that the reduced genetic diversity associated with the founder effect is due not only to the subset sampling of alleles from parental colonies but also to a stronger force of genetic drift that operates on the new colonies over time. Genetic drift arises from the fundamental tendency of the frequency of any allele in an inbreeding population to vary randomly across generations as a result of random statistical sampling errors alone (i.e., the random production of a few more or less progeny carrying the relevant allele). Thus, given the inherent memoryless (Markovian) property of allelic frequencies across generations, the process ultimately leads, in the absence of mutation and natural selection, to either a 0 percent or a 100 percent representation of the allele in the population (Griffiths et al. 2000). Moreover, since random sampling errors are more prevalent in circumstances where the law of large numbers is less applicable, genetic drift is more pronounced in smaller populations, thereby allowing this phenomenon to play a significant role in the founder effect.

7AshrAf And GAlor: diversity And developmentvol. 103 no. 1
(e.g., Prugnolle, Manica, and Balloux 2005; Ramachandran et al. 2005; and Wang et al. 2007) have found strong empirical evidence in support of this prediction.
The present study exploits the explanatory power of migratory distance from East Africa for genetic diversity within ethnic groups in order to overcome the data limitations and potential endogeneity issues encountered by the initial analysis dis-cussed above. In particular, the strong ability of prehistoric migratory distance from East Africa in explaining observed genetic diversity permits the analysis to generate predicted values of genetic diversity (using migratory distance) for all countries of the world, including those for which diversity data are currently unavailable. This enables a subsequent analysis to estimate the effects of genetic diversity, as pre-dicted by migratory distance from East Africa, in a much larger sample of countries. Moreover, given the obvious exogeneity of migratory distance from East Africa with respect to development outcomes in the Common Era, the use of migratory distance to project genetic diversity alleviates concerns regarding the potential endogeneity between observed genetic diversity and economic development.
The main results from the historical analysis, employing predicted genetic diver-sity in the extended sample of countries, indicate that, controlling for the influence of land productivity, the timing of the Neolithic Revolution, and continent fixed effects, a 1 percentage point increase in diversity for the most homogenous society in the sample would raise its population density in 1500 ce by 36 percent, whereas a 1 percentage point decrease in diversity for the most diverse society would raise its population density by 29 percent. Further, a 1 percentage point change in diversity in either direction at the predicted optimum of 0.683 would lower population den-sity by 1.5 percent.8
Moving to the contemporary period, the analysis, as discussed earlier, constructs an index of genetic diversity at the country level that not only incorporates the expected heterozygosities of the precolonial ancestral populations of contempo-rary subnational groups, as predicted by the migratory distances of the ancestral populations from East Africa, but also incorporates the pairwise genetic distances between these ancestral populations, as predicted by their pairwise migratory dis-tances. Indeed, the serial founder effect studied by population geneticists not only predicts that expected heterozygosity declines with increasing distance along migra-tory paths from East Africa but also that the genetic distance between any two popu-lations will be larger the greater the migratory distance between them.
The baseline results from the contemporary analysis indicate that the genetic diversity of contemporary national populations has an economically and statis-tically significant hump-shaped effect on income per capita. This hump-shaped impact is robust to controls for continent fixed effects, ethnic fractionalization, various measures of institutional quality (i.e., social infrastructure, an index gaug-ing the extent of democracy, and constraints on the power of chief executives),
8 Moreover, the partial R 2 associated with diversity suggests that residual genetic diversity explains roughly 7 percent of the cross-country variation in residual log population density in 1500 ce, conditional on land produc-tivity, the timing of the Neolithic Revolution, and continent fixed effects. Consistent with the predictions of the proposed hypothesis, the robustness analysis in Section A of the online Appendix demonstrates that the nonmono-tonic effect of genetic diversity on development outcomes is prevalent in earlier historical periods as well. Further, the impact of genetic diversity on economic development in the preindustrial era is robust to controls for the spatial influence of regional technological frontiers, via trade and the diffusion of technologies, and controls for microgeo-graphical factors gauging terrain quality and proximity to waterways.

8 THE AMERICAN ECONOMIC REVIEW fEbRuARy 2013
legal origins, major religion shares, the share of the population of European descent, years of schooling, disease environments, and other geographical factors that have received attention in the empirical literature on cross-country compara-tive development.
The direct effect of genetic diversity on contemporary income per capita, once institutional, cultural, and geographical factors are accounted for, indicates that (i) increasing the diversity of the most homogenous country in the sample (Bolivia) by 1 percentage point would raise its income per capita in the year 2000 ce by 41 per-cent; (ii) decreasing the diversity of the most diverse country in the sample (Ethiopia) by 1 percentage point would raise its income per capita by 21 percent; (iii) a 1 per-centage point change in genetic diversity (in either direction) at the optimum level of 0.721 (that most closely resembles the diversity level of the United States) would lower income per capita by 1.9 percent; (iv) increasing Bolivia’s diversity to the optimum level prevalent in the United States would increase Bolivia’s per capita income by a factor of 5.4, closing the income gap between the United States and Bolivia from a ratio of 12:1 to 2.2:1; and (v) decreasing Ethiopia’s diversity to the optimum level of the United States would increase Ethiopia’s per capita income by a factor of 1.7 and thus close the income gap between the United States and Ethiopia from a ratio of 47:1 to 27:1. Moreover, the partial R 2 associated with diversity suggests that residual genetic diversity explains about 16 percent of the cross-country variation in residual log income per capita in 2000 ce, conditional on the institutional, cultural, and geographical covariates in the baseline regres-sion model.
Reassuringly, the highly significant and stable hump-shaped effect of genetic diversity on income per capita in the year 2000 ce is not an artifact of postco-lonial migrations toward prosperous countries and the concomitant increase in ethnic diversity in these economies. The hump-shaped effect of genetic diversity remains highly significant and the optimal diversity estimate remains virtually intact if the regression sample is restricted to (i) countries that do not belong to the Organisation for Economic Co-operation and Development (OECD) (i.e., econo-mies that have been less attractive to migrants); (ii) non–Neo-European countries (i.e., excluding the United States, Canada, Australia, and New Zealand); (iii) non–Latin American countries; (iv) non–sub-Saharan African countries; and, perhaps most importantly, (v) countries for which the indigenous population is larger than 97 percent of the entire population (i.e., under conditions that virtually eliminate the role of migration in contributing to diversity). Moreover, consistent with the overall hump-shaped effect of diversity on the contemporary standard of living, the analysis indicates that genetic diversity is negatively associated with the extent of cooperative behavior, as measured by the prevalence of interpersonal trust, and positively associated with innovative activity, as measured by the intensity of sci-entific knowledge creation.
The remainder of the paper is organized as follows. Section I briefly reviews some related literature. Section II presents a basic model that predicts a hump-shaped effect of diversity on economic development. Sections III and IV cover the historical analysis, discussing the empirical strategy as well as the relevant data and data sources before presenting the empirical findings. Sections V and VI do the same for the contemporary analysis, and, finally, Section VII concludes.

9AshrAf And GAlor: diversity And developmentvol. 103 no. 1
I. Related Literature
The existing literature on comparative development has emphasized a variety of factors underlying some of the vast differences in living standards across the globe. The influence of geography has been stressed from a historical perspective by Jones (1981), Diamond (1997), and Pomeranz (2000), and it has been highlighted empirically by Gallup, Sachs, and Mellinger (1999) and Olsson and Hibbs (2005). Institutions, on the other hand, are given historical precedence by North and Thomas (1973), Mokyr (1990), and Greif (1993), and they are emphasized empirically by Hall and Jones (1999); La Porta et al. (1999); Rodrik, Subramanian, and Trebbi (2004); and Acemoglu, Johnson, and Robinson (2005). In related strands of the literature on institutions, Sokoloff and Engerman (2000), and Acemoglu, Johnson, and Robinson (2005) have stressed the role of colonialism, while the effects of ethnolinguistic fractionalization are examined by Easterly and Levine (1997) and Alesina et al. (2003). Moreover, the historical impact of sociocultural factors has been highlighted by Weber (1930) and Landes (1998), and their importance is sup-ported empirically by Barro and McCleary (2003); Tabellini (2008); and Guiso, Sapienza, and Zingales (2009). Finally, the importance of human capital formation has been underlined in unified growth theory (e.g., Galor 2011) and has been dem-onstrated empirically by Glaeser et al. (2004).
This research is the first to argue that the variation in prehistoric migratory dis-tance from the cradle of humankind to various settlements across the globe has had a persistent effect on the process of development and on the contemporary varia-tion in income per capita across the globe. The paper is also unique in its attempt to establish the role of genetic (rather than ethnic) diversity within a society as a significant determinant of its development path and thus its comparative economic performance across space and time.
The employment of data and empirical results from the field of population genet-ics places this research in proximity to a recent insightful paper by Spolaore and Wacziarg (2009), who have appealed to data on genetic distance between human populations to proxy for the effect of sociocultural differences between societies on the diffusion of economic development.9 Specifically, the authors argue that genetic distance between populations, which captures their divergence in biological and cultural characteristics over time, has been a barrier to the horizontal diffusion of technological innovations across populations. They show that F st genetic distance, a measure that reflects the time elapsed since two populations shared a common ancestor, confers a statistically significant positive effect on both historical and contemporary pairwise income differences. In contrast, the genetic diversity metric within populations exploited by this paper facilitates the analysis of the effect of the variation in traits across individuals within a society on its development process.
Unlike Spolaore and Wacziarg (2009), where genetic distance between populations diminishes the rate of technological diffusion and reduces productivity, the hypothe-sis advanced and tested by the current analysis suggests that genetic diversity within a
9 See also Desmet et al. (2011), who demonstrate a strong correlation between genetic and cultural distances among European populations to argue that genetic distance can be employed as an appropriate proxy to study the effect of cultural distance on the formation of new political borders in Europe.

10 THE AMERICAN ECONOMIC REVIEW fEbRuARy 2013
population confers both social costs, in the form of miscoordination and distrust arising from genetic differences across members of society, and social benefits in the form of diversity-driven knowledge accumulation. Hence, the overall effect of genetic diversity on developmental outcomes would be hump-shaped, rather than monotonically nega-tive. Indeed, the results of the empirical analysis conducted in this study suggest that the previously unexamined beneficial effect of genetic differences is a significant factor in the overall influence of the genetic channel on comparative development.
The examination of the effects of genetic diversity along with the influence of the timing of agricultural transitions also places this paper in an emerging strand of the literature that has focused on empirically testing the assertion of Diamond (1997) regarding the long-standing impact of the Neolithic Revolution.10 According to his hypothesis, the luck of being dealt a favorable hand thousands of years ago with respect to biogeographical endowments, particularly exogenous factors contributing to the emergence of agriculture and facilitating the subsequent diffusion of agricultural tech-niques, is the single most important driving force behind the divergent development paths of societies throughout history that ultimately led to the contemporary global differences in standards of living. Specifically, an earlier transition to agriculture from primitive hunting and gathering techniques gave some societies an initial advantage by conferring the benefits of a production technology that generated resource surpluses and enabled the rise of a non–food-producing class whose members were instrumental for the advancement of science and written language, urbanization, technology-based military powers, and nation states. The early technological superiority of these societ-ies persisted over time and was further sustained by their subjugation of less-devel-oped societies through exploitative geopolitical processes like colonization.
While the long-standing influence of the Neolithic Revolution on comparative development in the precolonial as opposed to the modern era remains a compelling argument, this research demonstrates that, contrary to the unicausal hypothesis of Diamond (1997), the composition of human populations with respect to their genetic diversity has been a significant and persistent factor that affected the course of eco-nomic development from the dawn of human civilization to the present. Moreover, in estimating the economic impact of human genetic diversity while controlling for the channel emphasized by Diamond (1997), the current research additionally establishes the historical significance of the timing of agricultural transitions for precolonial pop-ulation density, which, as already argued, is the relevant variable capturing economic development during the Malthusian epoch of stagnation in income per capita.11
10 See, for example, Olsson and Hibbs (2005) and Putterman (2008). Contrary to the conjecture of Diamond (1997), however, this paper finds that the variation in the timing of the Neolithic Revolution has no robust statisti-cally significant explanatory power for contemporary comparative development (see Tables 6 and 7).
11 Note that, although the genetic diversity channel raised in this study is conceptually independent of the timing of the agricultural transition, an additional genetic channel that interacts with the time elapsed since the Neolithic Revolution has been examined by Galor and Moav (2002, 2007). These studies argue that the Neolithic transition triggered an evolutionary process resulting in the natural selection of certain genetic traits (such as preference for higher-quality children and greater longevity) that are complementary to economic development, thereby implying a ceteris paribus positive relationship between the timing of the agricultural transition and the representation of such traits in the population. Indeed, the empirical evidence recently uncovered by Galor and Moav (2007) is consistent with this theoretical prediction. Thus, while the significant reduced-form effect of the Neolithic Revolution observed in this study may be associated with the Diamond hypothesis, it could also be partly capturing the influence of this addi-tional genetic channel. See also Lagerlöf (2007), Dalgaard and Strulik (2010), and Galor and Michalopoulos (2012) for complementary evolutionary theories regarding the dynamics of human body size and entrepreneurial spirit in the process of economic development.
11AshrAf And GAlor: diversity And developmentvol. 103 no. 1
II. Diversity and Productivity: A Basic Model
Consider an economy where the level of productivity is affected by the degree of genetic diversity in society. Specifically, genetic diversity generates conflicting effects on productivity. A wider spectrum of traits is complementary to the adoption or implementation of new technologies. It enhances knowledge creation and fos-ters technological progress, thereby expanding the economy’s production possibil-ity frontier. A wider spectrum of traits also reduces the likelihood of cooperative or trustful behavior, however, generating inefficiencies in the operation of the economy relative to its production possibility frontier.
Suppose that the degree of genetic diversity, ω ∈ [0, 1], has a positive but dimin-ishing effect on the level of technology that is available for production. Specifically, the level of technology, A, and thus the economy’s production possibility frontier, is determined by a vector of institutional, geographical, and human capital factors, z, as well as by the degree of diversity, ω.12 That is,
(1) A = A (z, ω),
where A(z, ω) > 0, A ω (z, ω) > 0, and A ωω (z, ω) < 0 for all ω ∈ [0, 1], and the mar-ginal effect of diversity on the level of technology satisfies the boundary conditions li m ω→0 A ω (z, ω) = ∞ and li m ω→1 A ω (z, ω) = 0.
Suppose further that the position of the economy relative to its production pos-sibility frontier is adversely affected by the degree of genetic diversity. In particular, a fraction, α ω, of the economy’s potential productivity, A(z, ω), is lost due to lack of cooperation and resultant inefficiencies in the production process.
Output per worker is therefore determined by the level of employment of factors of production, x, the level of productivity, A(z, ω), and the degree of inefficiency in production, α ∈ (0, 1);
(2) y = (1 − α ω) A (z, ω) f (x) ≡ y (x, z, ω),
where x is a vector of factor inputs per worker and α ω is the extent of erosion in pro-ductivity due to inefficiencies in the production process.13 Hence, as follows from equation (2), y(x, z, ω) is a strictly concave hump-shaped function of ω. Specifically,
12 Several mechanisms could generate this reduced-form relationship. Suppose that the labor force is character-ized by heterogeneity in equally productive traits, each of which permits individuals to perform complementary specialized tasks. The quantity of trait i in the population is x i , and it is distributed uniformly over the interval [0, ω]. The level of productivity is therefore
A (z, ω) = z ∫ 0 ω
x i θ di; θ ∈ (0, 1).
Hence, an increase in the spectrum of traits, ω, (holding the aggregate supply of productive traits constant) will increase productivity at a diminishing rate. Alternatively, if there exists a hierarchy of traits and only traits above the cutoff ξ ∈ (0, ω) contribute to productivity, then an increase in the spectrum of traits, ω, could increase productivity at a diminishing rate.
13 If the degree of inefficiency is α(ω), the results of the model would remain intact as long as the contribution of homogeneity to efficiency is diminishing (i.e., as long as α(ω) is nondecreasing and weakly convex in ω).

12 THE AMERICAN ECONOMIC REVIEW fEbRuARy 2013
(3) y ω (x, z, ω) = [ (1 − α ω) A ω (z, ω) − α A (z, ω) ] f (x);
y ωω (x, z, ω) = [ (1 − α ω) A ωω (z, ω) − 2α A ω (z, ω) ] f (x) < 0;
li m ω→0 y ω (x, z, ω) > 0; and li m ω→1 y ω (x, z, ω) < 0.
Thus, there exists an intermediate level of diversity, ω * ∈ (0, 1), that maximizes the level of output per worker. In particular, ω * satisfies
(4) (1 − α ω * ) A ω (z, ω * ) = α A (z, ω * ).
III. Historical Analysis: Data and Empirical Strategy
This section discusses the data and the empirical strategy employed to exam-ine the impact of genetic diversity on comparative development in the precolo-nial era.
A. Dependent Variable: Historical Population Density
As argued previously, the relevant variable reflecting comparative develop-ment across countries in the precolonial Malthusian era is population density. The empirical examination of the proposed genetic hypothesis therefore aims to employ cross-country variation in observed genetic diversity and in genetic diversity pre-dicted by migratory distance from East Africa to explain cross-country variation in historical population density.14 Data on historical population density are obtained from McEvedy and Jones (1978), who provide figures at the country level; i.e., for regions defined by contemporary national borders, over the period 400 bce–1975 ce.15 Given the greater unreliability (and less availability in terms of observations) of population data for earlier historical periods, however, the baseline regression specification adopts population density in 1500 ce as the preferred dependent vari-able to examine. The analysis in Section A of the online Appendix additionally examines population density in 1000 ce and 1 ce to demonstrate the robustness of the genetic channel for earlier time periods.
B. Independent Variable: Genetic Diversity
The most reliable and consistent data for genetic diversity among indigenous pop-ulations across the globe consists of 53 ethnic groups from the HGDP-CEPH Human
14 Admittedly, historical data on population density is afflicted by measurement error. While measurement error in explanatory variables leads to attenuation bias in ordinary least squares (OLS) estimators, however, mismeasurement of the dependent variable in an OLS regression, as a result of yielding larger standard errors for coefficient estimates, leads to rejecting the null when it is in fact true. As such, if OLS coefficients are precisely estimated, then confidence that the true coefficients are indeed different from zero rises even in the presence of measurement error in the depen-dent variable. In addition, Table D17 in Section D of the online Appendix establishes that the baseline results from the extended-sample historical analysis are qualitatively robust to using alternative measures of economic development in 1500 ce, including log population size and log urbanization rate, as opposed to log population density.
15 The reader is referred to Section F of the online Appendix for additional details.

13AshrAf And GAlor: diversity And developmentvol. 103 no. 1
Genome Diversity Cell Line Panel.16 According to anthropologists, these 53 ethnic groups are not only historically native to their current geographical locations but have also been isolated from genetic flows from other ethnic groups. Population geneticists typically measure the extent of diversity in genetic material across indi-viduals within a given population (such as an ethnic group) using an index called expected heterozygosity. Like most other measures of diversity, this index may be interpreted simply as the probability that two individuals, selected at random from the relevant population, are genetically different from one another. Specifically, the expected heterozygosity measure for a given population is constructed by geneti-cists using sample data on allelic frequencies; i.e., the frequency with which a gene variant or allele occurs in the population sample. Given allelic frequencies for a particular gene or DNA locus, it is possible to compute a gene-specific heterozygos-ity statistic (i.e., the probability that two randomly selected individuals differ with respect to a given gene), which when averaged over multiple genes or DNA loci yields the overall expected heterozygosity for the relevant population.17
Consider a single gene or locus l with k observed variants or alleles in the popula-tion, and let p i denote the frequency of the i th allele. Then, the expected heterozy-gosity of the population with respect to locus l, H exp l
, is
(5) H exp l = 1 − ∑
i=1
k
p i 2 .
Given allelic frequencies for each of m different genes or loci, the average across these loci then yields an aggregate expected heterozygosity measure of overall genetic diversity, H exp , as
(6) H exp = 1 − 1 _ m ∑ l=1
m
∑ i=1
k l
p i 2 ,
where k l is the number of observed variants in locus l.
16 For a more detailed description of the HGDP-CEPH Human Genome Diversity Cell Line Panel dataset, the inter-ested reader is referred to Cann et al. (2002). A broad overview of the HGDP is given by Cavalli-Sforza (2005). The 53 ethnic groups are listed in Section E of the online Appendix.
17 It should be noted that sources other than HGDP-CEPH exist for expected heterozygosity data. Specifically, the online Allele Frequency Database (ALFRED) represents one of the largest repositories of such data, pooled from across different datasets used by numerous studies in human population genetics. The data from ALFRED, however, while corresponding to a much larger sample of populations (ethnic groups) than the HGDP-CEPH sam-ple, are problematic for a number of reasons. First, the expected heterozygosity data in ALFRED are not compa-rable across populations from the individual datasets in the collection because they are based on different DNA sampling methodologies (as dictated by the scientific goals of the different studies). Second, the vast majority of the individual datasets in ALFRED do not provide global coverage in terms of the different populations that are sampled and, even when they do, the sample size is considerably less than that of the HGDP-CEPH panel. Third, in comparison to the 783 loci employed by Ramachandran et al. (2005) to compute the expected heterozygosities for the 53 HGDP-CEPH populations, those reported for the non-HGDP populations in ALFRED are on average based on allelic frequencies for less than 20 DNA loci, which introduces a significant amount of potentially systematic noise in the heterozygosity estimates for these other populations. Fourth, unlike the microsatellite loci used by Ramachandran et al. (2005) for the HGDP-CEPH populations, the expected heterozygosities reported for many non-HGDP populations in ALFRED capture allelic variations across individuals in loci that reside in protein-coding regions of the human genome, thus reflecting diversity in phenotypic expressions that may have been subject to the environmental forces of natural selection. Finally, in contrast to the HGDP-CEPH populations, many of the non-HGDP populations in ALFRED represent ethnic groups that have experienced significant genetic admixture in their recent histories, particularly during the post-1500 era, and this introduces an endogeneity problem for the current analysis since genetic admixtures are, in part, the result of migrations occurring along spatial economic prosperity gradients.

14 THE AMERICAN ECONOMIC REVIEW fEbRuARy 2013
Empirical evidence uncovered by Ramachandran et al. (2005) for the 53 ethnic groups from the HGDP-CEPH Human Genome Diversity Cell Line Panel suggests that migratory distance from East Africa has an adverse linear effect on genetic diversity. They interpret this finding as providing support for a serial founder effect originating in East Africa, reflecting a process where the populating of the world occurred in a series of discrete steps involving subgroups leaving initial settlements to establish new settlements farther away and carrying with them only a subset of the overall genetic diversity of their parental colonies.
In estimating the migratory distance from East Africa for each of the 53 ethnic groups in their dataset, Ramachandran et al. (2005) calculate great circle (or geodesic) distances using Addis Ababa, Ethiopia as the point of common origin and the contemporary geographical coordinates of the sampled groups as the des-tinations. Moreover, these distance estimates incorporate five obligatory inter-mediate waypoints, used to more accurately capture paleontological and genetic evidence on prehistoric human migration patterns that are consistent with the widely held hypothesis that, in the course of their exodus from Africa, humans did not cross large bodies of water. The intermediate waypoints, depicted on the world map in Figure 2 along with the spatial distribution of the ethnic groups from the HGDP-CEPH sample, are Cairo, Egypt; Istanbul, Turkey; Phnom Penh, Cambodia; Anadyr, Russia; and Prince Rupert, Canada. For instance, as illus-trated in Figure 2, the migration path from Addis Ababa to the Papuan ethnic group in modern-day New Guinea makes use of Cairo and Phnom Penh, whereas that to the Karitiana population in Brazil incorporates Cairo, Anadyr, and Prince Rupert as intermediate waypoints.18 The migratory distance between endpoints (i.e., Addis Ababa and the location of a group) is therefore the sum of (i) the great circle distances between these endpoints and the waypoint(s) in the path connect-ing them and (ii) the distance(s) between waypoints if two or more such points are required.
The empirical analysis of Ramachandran et al. (2005) establishes migratory dis-tance from East Africa as a strong negative predictor of genetic diversity at the ethnic group level. Based on the R 2 of their regression, migratory distance alone explains almost 86 percent of the cross-group variation in within-group diversity.19
18 Based on mitochondrial DNA analysis, some recent studies (e.g., Macaulay et al. 2005) have proposed a southern exit route out of Africa whereby the initial exodus into Asia occurred not via the Levant but across the mouth of the Red Sea (between modern-day Djibouti and Yemen), thereafter taking a beachcombing path along the southern coast of the Arabian Peninsula to India and onward into Southeast Asia. Moreover, a subsequent northern offshoot from the Persian Gulf region ultimately lead to the settlement of the Near East and Europe. This scenario therefore suggests the use of Sana’a (Yemen) and Bandar Abbas (Iran) as intermediate waypoints instead of Cairo. Adopting this alternative route for computing migratory distances, however, does not qualitatively alter the main results.
19 These results are similar to those uncovered in an independent study by Prugnolle, Manica, and Balloux (2005) that employs a subset of the HGDP-CEPH sample encompassing 51 ethnic groups whose expected hetero-zygosities are calculated from allelic frequencies for 377 loci. Despite their somewhat smaller sample at both the ethnic group and DNA analysis levels, Prugnolle, Manica, and Balloux (2005) find that migratory distance from East Africa explains 85 percent of the variation in genetic diversity. On the other hand, using an expanded dataset comprised of the 53 HGDP-CEPH ethnic groups and an additional 24 Native American populations, Wang et al. (2007) find that migratory distance explains a more modest 74 percent of the variation in genetic diversity based on allelic frequencies for 678 loci. The authors attribute their somewhat weaker results to the fact that the additional Native American ethnic groups in their augmented sample were historically subjected to a high degree of gene flow from foreign populations (i.e., European colonizers), which obscured the genetic legacy of a serial founder effect in these groups.

15AshrAf And GAlor: diversity And developmentvol. 103 no. 1
In addition, the estimated OLS coefficient is highly statistically significant, possess-ing a t-statistic of −9.770 ( p-value < 1 0 −4 ), and suggests that expected heterozy-gosity falls by 0.076 percentage points for every 10,000 km increase in migratory distance from East Africa.20 This is the relationship depicted earlier in Figure 1.
The present study exploits the explanatory power of migratory distance from East Africa for the cross-sectional variation in ethnic group expected heterozygosity in order to advance the empirical analysis of the effect of diversity on development in two dimensions. First, given the potential endogeneity between observed genetic diversity and economic development as discussed earlier, the use of genetic diversity values predicted by migratory distance from East Africa alleviates concerns regard-ing endogeneity bias. Specifically, the identifying assumption being employed here is that distances along prehistoric human migration routes from Africa have no direct effect on economic development during the Common Era. Second, the strong capac-ity of migratory distance in predicting genetic diversity implies that the empirical analysis of the genetic hypothesis proposed in this study need not be restricted to the 53 HGDP-CEPH ethnic groups that span only 21 countries, especially since data on the dependent variable of interest (i.e., population density in the year 1500 ce) are available for a much larger set of countries.
To further elaborate, the current analysis tests the proposed genetic hypothesis both using observed genetic diversity in a limited sample of 21 countries, spanned
20 This effect corresponds to roughly one-third of the full (worldwide) range of expected heterozygosity values observed across the HGDP-CEPH sample of ethnic groups.
Figure 2. The 53 HGDP-CEPH Ethnic Groups and Migratory Paths from East Africa
Note: This figure depicts on a world map (i) the locations (denoted by crosses) of the 53 HGDP-CEPH ethnic groups; (ii) the locations (denoted by dots) of the intermediate waypoints used to construct migratory paths from Addis Ababa to these ethnic groups; and (iii) some migratory paths (denoted by solid lines) based on these waypoints.

16 THE AMERICAN ECONOMIC REVIEW fEbRuARy 2013
by the 53 ethnic groups in the HGDP-CEPH dataset, and using genetic diversity predicted by migratory distance from East Africa in an extended sample of 145 countries. In the 21-country sample, genetic diversity and migratory distance are aggregated up to the country level by averaging across the set of ethnic groups located within a given country.21 For the extended sample, however, the distance calculation methodology of Ramachandran et al. (2005) is adopted to first construct migratory distance from East Africa for each country, using Addis Ababa as the origin and the country’s modern capital city as the destination along with the afore-mentioned waypoints for restricting the migration route to landmasses as much as possible.22 This constructed distance variable is then applied to obtain a predicted value of genetic diversity for each country based on the slope coefficient from the regression of expected heterozygosity on migratory distance across the 53 HGDP-CEPH ethnic groups. Hence, it is this predicted genetic diversity at the country level that is employed as the explanatory variable of interest in the extended sample of countries.23
It is relevant to note that the expected heterozygosity measure in the sample of 53 HGDP-CEPH ethnic groups is based on microsattelites, i.e., DNA loci in nonpro-tein-coding regions of the human genome that do not directly result in phenotypic expression. Therefore, this measure of observed genetic diversity has the advantage of not being confounded by the forces of natural selection that may have operated on these populations since their prehistoric exodus from Africa. Importantly, how-ever, the effects associated with heterozygosity in microsattelites capture the effects of diversity in phenotypically-expressed genomic material since the serial-founder effect, associated with the “out of Africa” migration process, is indeed reflected in other dimensions of within-group diversity, including diversity in various cranio-metric traits (Manica et al. 2007).
21 A population-weighted averaging method is infeasible in this case due to the current unavailability of popula-tion figures for the HGDP-CEPH ethnic groups.
22 Clearly, there is some amount of measurement error that is introduced by following this methodology since actual migration paths are only approximated due to the use of five major intercontinental waypoints. For instance, using this general method to calculate the migratory distance to Iceland, which was settled in the ninth century ce by a Norwegian population, fails to capture Oslo as an additional case-specific waypoint. The overall sparseness of historical evidence, however, regarding the actual source of initial settlements in many regions makes a more refined analysis infeasible. Nonetheless, it is credibly postulated that the absence of case-specific waypoints from the analysis does not introduce significant mismeasurement at the global scale. The same argument applies in defense of using modern capital cities as destination points for the migratory paths, although historical evidence suggests that, at least for many cases in the Old World, modern capitals were also some of the major centers of urbanization throughout the Common Era (see, e.g., Bairoch 1988 and McEvedy and Jones 1978).
23 As argued by Pagan (1984) and Murphy and Topel (1985), the OLS estimator for this two-step estimation method yields consistent estimates of the coefficients in the second stage regression but inconsistent estimates of their standard errors as it fails to account for the presence of a generated regressor. This inadvertently causes naïve statistical inferences to be biased in favor of rejecting the null hypothesis. To surmount this issue, the current study employs a two-step bootstrapping algorithm to compute the standard errors in all regressions that use the extended sample containing predicted genetic diversity at the country level. The bootstrap estimates of the standard errors are constructed in the following manner. A random sample with replacement is drawn from the HGDP-CEPH sample of 53 ethnic groups. The first stage regression is estimated on this random sample, and the corresponding OLS coefficient on migratory distance is used to compute predicted genetic diversity in the extended sample of countries. The second stage regression is then estimated on a random sample with replacement drawn from the extended cross-country sample and the OLS coefficients are stored. This process of two-step bootstrap sampling and least-squares estimation is repeated 1,000 times. The standard deviations in the sample of 1,000 observations of coefficient estimates from the second stage regression are thus the bootstrap standard errors of the point estimates of these coefficients.

17AshrAf And GAlor: diversity And developmentvol. 103 no. 1
C. Control Variables: Neolithic Transition Timing and Land Productivity
The hypothesis of Diamond (1997) has identified the timing of the Neolithic Revolution as a proximate determinant of economic development, designating ini-tial geographical and biogeographical conditions that governed the emergence and adoption of agricultural practices in prehistoric hunter-gatherer societies as the ulti-mate determinants in this channel. Some of these geographical and biogeographical factors, highlighted in the empirical analysis of Olsson and Hibbs (2005), include the size of the continent or landmass, the orientation of the major continental axis, type of climate, and the numbers of prehistoric plant and animal species amenable for domestication.
The current analysis controls for the ultimate and proximate determinants of development in the Diamond channel using cross-country data on the aforemen-tioned geographical and biogeographical variables as well as on the timing of the Neolithic Revolution.24 Given the empirical link between the ultimate and proxi-mate factors in Diamond’s hypothesis, however, the baseline specification focuses on the timing of the Neolithic transition to agriculture as the relevant control vari-able for this channel.25 The results from an extended specification that incorporates initial geographical and biogeographical factors as controls are presented in Section A of the online Appendix to demonstrate robustness.
The focus of the historical analysis on economic development in the precolonial Malthusian era also necessitates controls for the natural productivity of land for agriculture. Given that resource surpluses in a Malthusian environment are primar-ily channeled into population growth, with per capita incomes largely remaining at or near subsistence, regions characterized by natural factors generating higher agricultural crop yields should, ceteris paribus, also exhibit higher population densi-ties (Ashraf and Galor 2011).26 If diversity in a society influences its development through productivity (comprised of both social capital and technological know-how), then controlling for the natural productivity of land would constitute a more accurate test of the effect of diversity on the Malthusian development outcome; i.e., population density.
In controlling for the agricultural productivity of land, this study employs mea-surements of three geographical variables at the country level: (i) the percentage of arable land; (ii) absolute latitude; and (iii) an index gauging the overall suitabil-ity of land for agriculture based on ecological indicators of climate suitability for
24 The data source for the aforementioned geographical and biogeographical controls is Olsson and Hibbs (2005) whereas that for the timing of the Neolithic Revolution is Putterman (2008). See Section F of the online Appendix for the definitions and sources of all primary and control variables employed by the analysis.
25 The Neolithic transition timing variable, employed throughout the current analysis, reflects the number of years elapsed, as of the year 2000 ce, since the onset of sedentary agriculture. Tables D15 and D16 in Section D of the online Appendix demonstrate that all the results of the historical analysis are qualitatively robust to the use of an alternative definition of the Neolithic transition timing variable where this variable reflects the number of years elapsed, as of the year 1500 ce, since the onset of sedentary agriculture.
26 It is important to note, in addition, that the type of land productivity being considered here is largely inde-pendent of initial geographical and biogeographical endowments in the Diamond channel and is thus somewhat orthogonal to the timing of agricultural transitions as well. This holds due to the independence of natural factors conducive to domesticated species from those that were beneficial for the wild ancestors of eventual domesticates. As argued by Diamond (2002), while agriculture originated in regions of the world to which the most valuable domesticable wild plant and animal species were native, other regions proved more fertile and climatically favor-able once the diffusion of agricultural practices brought the domesticated varieties to them.
18 THE AMERICAN ECONOMIC REVIEW fEbRuARy 2013
cultivation, such as growing degree days and the ratio of actual to potential evapo-transpiration, as well as ecological indicators of soil suitability for cultivation, such as soil carbon density and soil pH.27
D. Baseline Regression Specifications
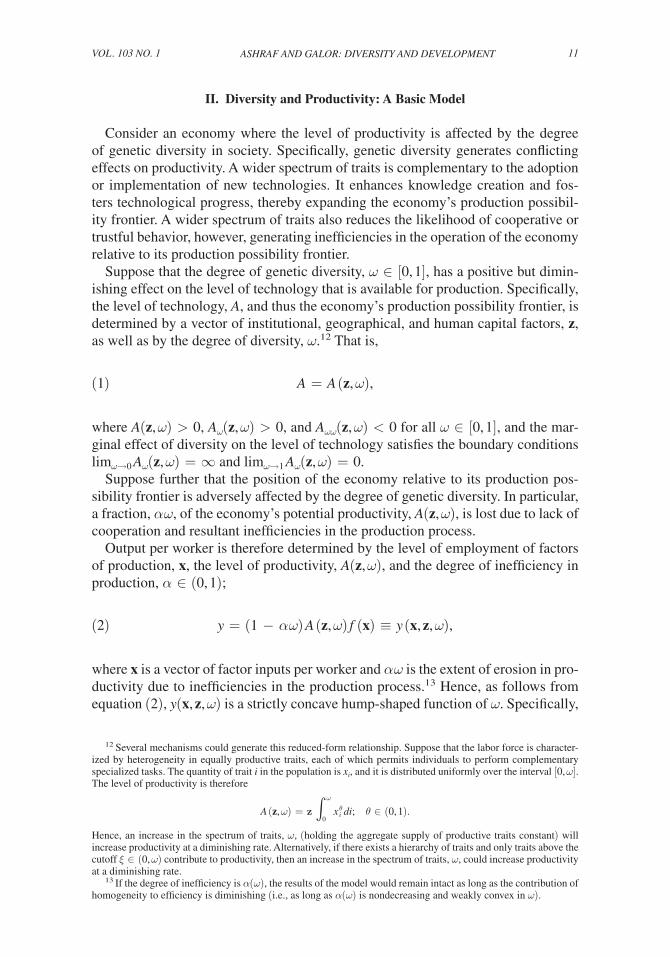
In light of the proposed genetic diversity hypothesis as well as the roles of the Neolithic transition timing and land productivity channels in agricultural develop - ment, the following specification is adopted to examine the influence of observed genetic diversity on economic development in the limited sample of 21 countries:
(7) ln P it = β 0t + β 1t G i + β 2t G i 2 + β 3t ln T i + β 4t ′ ln X i + β 5t ′ ln Δ i + ε it ,
where P it is the population density of country i in a given year t; G i is the average genetic diversity of the subset of HGDP-CEPH ethnic groups that are located in country i; T i is the time in years elapsed since country i ’s transition to agriculture; X i is a vector of land productivity controls; Δ i is a vector of continent fixed effects; and ε it is a country-year–specific disturbance term.28
Moreover, considering the remarkably strong predictive power of migratory distance from East Africa for genetic diversity, the baseline regression specification employed to test the proposed genetic channel in the extended cross-country sample is given by
(8) ln P it = β 0t + β 1t G i + β 2t G i 2 + β 3t ln T i + β 4t ′ ln X i + β 5t ′ ln Δ i + ε it ,
where G i is the genetic diversity predicted by migratory distance from East Africa for country i using the methodology discussed in Section IIIB. Indeed, it is this regression specification that is estimated to obtain the main empirical findings.29
27 The data for these variables are obtained from the World Bank (2006), the Central Intelligence Agency’s (2006) World Factbook, and Michalopoulos (2012), respectively. The country-level aggregate data on the land suit-ability index from Michalopoulos (2012) are, in turn, based on more disaggregated geospatial data on this index from the ecological study of Ramankutty et al. (2002). See Section F of the online Appendix for additional details.
28 The fact that economic development has been historically clustered in certain regions of the world raises concerns that these disturbances could be nonspherical in nature, thereby confounding statistical inferences based on the OLS estimator. In particular, the disturbance terms may exhibit spatial autocorrelation, i.e., cov[ ε i , ε j ] > 0, within a certain threshold of distance from each observation. Keeping this possibility in mind, the limited-sample analyses presented in the text are repeated in Tables D2 and D3 in Section D of the online Appendix, where the stan-dard errors of the point estimates are corrected for spatial autocorrelation across disturbance terms, following the methodology of Conley (1999). Relatedly, Table D18 in the same Appendix section demonstrates that the baseline findings from both the extended-sample historical analysis and the contemporary analysis are qualitatively robust to employing estimators that allow for spatial autocorrelation in either the dependent variable or the disturbance term or both.
29 Tables G1 and G2 in Section G of the online Appendix present the descriptive statistics of the limited 21-coun-try sample employed in estimating equation (7), while Tables G3 and G4 present those of the extended 145-country sample used to estimate equation (8). As reported therein, the finite-sample moments of the explanatory variables in the limited and extended cross-country samples are remarkably similar. Specifically, the range of values for pre-dicted genetic diversity in the extended sample falls within the range of values for observed diversity in the limited sample. This is particularly reassuring because it demonstrates that the methodology used to generate the predicted genetic diversity variable did not project values beyond what is actually observed, indicating that the HGDP-CEPH collection of ethnic groups is indeed a representative sample for the worldwide variation in within-country genetic diversity. Moreover, the fact that the finite-sample moments of log population density in 1500 ce are not signifi-cantly different between the limited and extended cross-country samples foreshadows the encouraging similarity of the regression results that are obtained under observed and predicted values of genetic diversity.

19AshrAf And GAlor: diversity And developmentvol. 103 no. 1
Before proceeding, it is important to note that the regression specifications in equa-tions (7) and (8) above constitute reduced-form empirical analyses of the genetic diversity channel in Malthusian economic development. Specifically, according to the proposed hypothesis, genetic diversity has a nonmonotonic impact on society’s level of development through two opposing effects on the level of its productivity: a detri-mental effect on social capital and a beneficial effect on the knowledge frontier. Given the absence of measurements for the proximate determinants of development in the genetic diversity channel, however, a more discriminatory test of the hypothesis is infeasible. Nonetheless, the results to follow are entirely consistent with the theoretical prediction that, in the presence of diminishing marginal effects of genetic diversity on productivity in a Malthusian economy, the overall reduced-form effect of genetic diver-sity on cross-country population density should be hump-shaped; i.e., that β 1t > 0 and β 2t < 0. Moreover, as will become evident, the unconditional hump-shaped relation-ship between genetic diversity and development outcomes does not differ significantly between the adopted quadratic and alternative nonparametric specifications.
IV. Historical Analysis: Empirical Findings
This section presents the results from empirically investigating the relationship between genetic diversity and log population density in the precolonial Malthusian era. Results for observed diversity in the limited 21-country sample are examined in Section IVA. Section IVB discusses the baseline results associated with examining the effect of predicted diversity on log population density in 1500 ce in the extended sample of 145 countries. The robustness of the diversity channel with respect to alternative concepts of distance, including the aerial distance from East Africa as well as migratory distances from several “placebo” points of origin across the globe, are presented in Section IVC.
The analysis of comparative development in the precolonial era is expanded upon in Section A of the online Appendix to demonstrate the robustness of the diversity channel with respect to (i) explaining comparative development in earlier historical periods, specifically log population density in 1000 ce and 1 ce; (ii) the technology diffusion hypothesis that postulates a beneficial effect on development arising from spatial proximity to regional technological frontiers; (iii) controls for microgeo-graphical factors including the degree of variation in terrain and access to water-ways; and, finally, (iv) controls for the exogenous geographical and biogeographical factors favoring an earlier onset of agriculture in the Diamond channel.
A. Results from the Limited Sample
The initial investigation of the proposed genetic diversity hypothesis using the limited sample of countries is of fundamental importance for the subsequent empiri-cal analyses, performed using the extended sample, in three critical dimensions. First, since the limited sample contains observed values of genetic diversity whereas the extended sample comprises values predicted by migratory distance from East Africa, similarity in the results obtained from the two samples would lend cre-dence to the main empirical findings associated with predicted genetic diversity in the extended sample of countries. Second, the fact that migratory distance from

20 THE AMERICAN ECONOMIC REVIEW fEbRuARy 2013
East Africa and observed genetic diversity are not perfectly correlated with each other makes it possible to test, using the limited sample of countries, the asser-tion that migratory distance affects economic development through genetic diversity only and is therefore appropriate for generating predicted genetic diversity in the extended sample of countries.30 Finally, having verified the above assertion, the limited sample permits an instrumental variables regression analysis of the proposed hypothesis with migratory distance employed as an instrument for genetic diversity. This then constitutes a more direct and accurate test of the genetic diversity chan-nel given possible concerns regarding the endogeneity between genetic diversity and economic development. As will become evident, the results obtained from the limited sample are reassuring on all three aforementioned fronts.
Explaining Comparative Development in 1500 ce.—Table 1 presents the limited-sample results from regressions explaining log population density in 1500 ce.31 In particular, a number of specifications comprising different subsets of the explanatory variables in equation (7) are estimated to examine the independent and combined effects of the genetic diversity, transition timing, and land productivity channels.
Consistent with the predictions of the proposed diversity hypothesis, column 1 reveals the unconditional cross-country hump-shaped relationship between genetic diversity and log population density in 1500 ce. Specifically, the estimated linear and quadratic coefficients, both statistically significant at the 1 percent level, imply that a 1 percentage point increase in genetic diversity for the most homogenous society in the regression sample would be associated with a rise in its population density in 1500 ce by 114 percent, whereas a 1 percentage point decrease in diversity for the most diverse society would be associated with a rise in its population density by 64 percent. In addition, the coefficients also indicate that a 1 percentage point change in diversity in either direction at the predicted optimum of 0.683 would be associated with a decline in population density by 3 percent.32 Furthermore, based on the R 2 coefficient of the regression, the genetic diversity channel appears to explain 42 per-cent of the variation in log population density in 1500 ce across the limited sample of countries. The quadratic relationship implied by the OLS coefficients reported in column 1 is depicted together with a nonparametric local polynomial regression line
30 The possibility that migratory distance from East Africa may be correlated with other potential geographi-cal determinants of genetic diversity, particularly factors like the dispersion of land suitability for agriculture and the dispersion of elevation that have been shown to give rise to ethnic diversity (Michalopoulos 2012), raises the possibility that migratory distance may not be the only source of exogenous variation in genetic diversity. Table D1 in Section D of the online Appendix, however, indicates that these other factors have little or no explanatory power for the cross-country variation in actual genetic diversity beyond that accounted for by migratory distance via the serial founder effect. Specifically, the OLS coefficient as well as the partial R 2 associated with migratory distance remain both quantitatively and qualitatively robust when the regression is augmented with these geographical con-trols, all of which are statistically insignificant in explaining genetic diversity. The reader is referred to Section F of the online Appendix for detailed definitions of the additional control variables used by the analysis in Table D1.
31 Corresponding to Tables 1 and 2 in the text, Tables D2 and D3 in Section D of the online Appendix present results with standard errors and two-stage least squares (2SLS) point estimates corrected for spatial autocorrelation across observations.
32 The magnitude of these effects can be derived directly from the estimated linear and quadratic coefficients associated with genetic diversity. Specifically, letting β 1 and β 2 denote the estimated coefficients on genetic diver-sity and genetic diversity square, equation (7) can be used to show that the proportional effect on population density of a ΔG change in diversity at the specified level
_ G is given by: ΔP/P = exp{ΔG( β 1 + 2 β 2
_ G +
_ G ΔG)} − 1.

21AshrAf And GAlor: diversity And developmentvol. 103 no. 1
in Figure 3.33 Reassuringly, as illustrated therein, the estimated quadratic falls within the 95 percent confidence interval band of the nonparametric relationship.34
The unconditional effects of the Neolithic transition timing and land productivity channels are reported in columns 2 and 3, respectively. In line with the Diamond hypothesis, a 1 percent increase in the number of years elapsed since the transition to agriculture increases population density in 1500 ce by 2.4 percent, an effect that is also significant at the 1 percent level. Similarly, consistent with the predictions of the land productivity channel, population density in 1500 ce possesses statistically significant positive elasticities with respect to both the percentage of arable land as well as the index gauging the suitability of land for agriculture. Moreover, the agricultural transition timing and land productivity channels independently explain 54 percent and 57 percent of the limited cross-country sample variation in log popu-lation density in 1500 ce.
Column 4 presents the results obtained from exploiting the combined explana-tory power of all three channels for log population density in the year 1500 ce. Not
33 For consistency with Figure 1, which depicts the negative effect of increasing migratory distance from East Africa on genetic diversity, the horizontal axes in Figures 3–5 represent genetic homogeneity (i.e., 1 minus genetic diversity) so as to reflect increasing as opposed to decreasing migratory distance from East Africa.
34 Correspondingly with Figure 3, Figure C1 in Section C of the online Appendix compares the quadratic fit with a restricted cubic spline (as opposed to nonparametric) regression. The figure indicates that the quadratic fit falls within the 95 percent confidence interval band of the cubic spline regression in much the same way as it does with respect to the nonparametric relationship. The notes to Figures 3 and C1 provide additional details on the estimation procedures underlying the nonparametric and cubic spline regressions, respectively.
Table 1—Observed Diversity and Economic Development in 1500 ce
log population density in 1500 ce
(1) (2) (3) (4) (5)Observed diversity 413.504*** 225.440*** 203.814*
(97.320) (73.781) (97.637)Observed diversity square −302.647*** −161.158** −145.717*
(73.344) (56.155) (80.414)log Neolithic transition timing 2.396*** 1.214*** 1.135
(0.272) (0.373) (0.658)log percentage of arable land 0.730** 0.516*** 0.545*
(0.281) (0.165) (0.262)log absolute latitude 0.145 −0.162 −0.129
(0.178) (0.130) (0.174)log land suitability for agriculture 0.734* 0.571* 0.587
(0.381) (0.294) (0.328)
Optimal diversity 0.683*** 0.699*** 0.699***(0.008) (0.015) (0.055)
Continent fixed effects No No No No Yes
Observations 21 21 21 21 21 R 2 0.42 0.54 0.57 0.89 0.90
Notes: This table establishes the significant hump-shaped relationship between observed genetic diversity and log population density in 1500 ce in the limited 21-country sample while controlling for the timing of the Neolithic Revolution, land productivity, and continent fixed effects. Heteroskedasticity-robust standard errors are reported in parentheses.
*** Significant at the 1 percent level. ** Significant at the 5 percent level. * Significant at the 10 percent level.

22 THE AMERICAN ECONOMIC REVIEW fEbRuARy 2013
surprisingly, given the small sample size as well as the pairwise correlations between covariates reported in Table G2 in Section G of the online Appendix, the estimated conditional effects are sizeably reduced in magnitude in comparison to their uncon-ditional estimates presented in earlier columns. Nonetheless, the OLS coefficients associated with all channels retain their expected signs and continue to remain highly statistically significant. To interpret the conditional effects of the genetic diversity channel, the estimated linear and quadratic coefficients associated with genetic diver-sity imply that, accounting for the influence of the transition timing and land pro-ductivity channels, a 1 percentage point increase in genetic diversity for the most homogenous society in the regression sample would be associated with a rise in its population density in 1500 ce by 58 percent, whereas a 1 percentage point decrease in diversity for the most diverse society would be associated with a rise in its popula-tion density by 23 percent. Further, a 1 percentage point change in diversity in either direction at the predicted optimum of 0.699 would be associated with a decline in population density by 1.6 percent. Additionally, by exploiting the combined explana-tory power of all 3 channels, the estimated model explains an impressive 89 percent of the limited-sample cross-country variation in log population density.
Finally, the results from estimating the regression model in equation (7) are reported in column 5, which indicates that the results from previous columns were not simply reflecting the possible influence of some unobserved continent-specific attributes. In spite of the sample size limitations and the smaller variability of covariates within
Figure 3. Observed Genetic Diversity and Population Density in 1500 ce
Notes: This figure depicts the unconditional hump-shaped relationship, estimated using either a least-squares qua-dratic fit or a nonparametric regression, between observed genetic homogeneity (i.e., 1 minus observed genetic diversity) and log population density in 1500 ce in the limited 21-country sample. The nonparametric regression line is estimated using local second-degree polynomial smoothing based on a Gaussian kernel function and a ker-nel bandwidth of 0.06. The shaded area represents the 95 percent confidence interval band associated with the non-parametric regression line.
CAF
DZA
KEN
NAM
NGASEN
ZAF
ZAR
FRA
GBR
ITA
RUS
CHNISR
JPN
KHM
PAK
PNG
BRA
COL
MEX
−4
−2
0
2
4lo
g po
pula
tion
dens
ity in
150
0 C
E
0.25 0.3 0.35 0.4 0.45
(Observed) Genetic homogeneity
Africa Europe Asia Oceania Americas
Nonparametric Quadratic

23AshrAf And GAlor: diversity And developmentvol. 103 no. 1
continents in comparison to that across continents, genetic diversity continues to possess a significant hump-shaped relationship with economic development in a manner consistent with theoretical predictions. Reassuringly, the estimated average within-continent relationship of diversity with log population density in 1500 ce is very similar to the cross-continental relationship reported in column 4, and the implied optimal level of diversity remains intact, lending credence to the assertion that the hump-shaped relationship between diversity and development is not reflec-tive of unobserved continental characteristics.35
To summarize, the limited-sample results presented in Table 1 demonstrate that genetic diversity has a statistically significant hump-shaped relationship with log population density in the year 1500 ce. The analysis, however, also reveals sig-nificant effects associated with the Neolithic transition timing and land productivity channels. Indeed, the nonmonotonic relationship of diversity with log population density prevails under controls for these other explanatory channels, and it remains remarkably stable in magnitude regardless of whether the cross-country variations exploited by the analysis are within or across continents. While these results may initially appear to be more illustrative rather than conclusive given the obvious limitations of the sample employed, they are in fact reassuringly similar to those obtained in the extended sample of countries, as will become evident in Section IVB below. This similarity provides further assurance regarding the validity of the infer-ences made with the main empirical findings that are associated with predicted as opposed to observed values of genetic diversity.
Establishing the Exogeneity of Migratory Distance.—As already mentioned, the fact that the limited cross-country sample comprises observed genetic diversity, which is strongly but not perfectly correlated with migratory distance from East Africa, permits a formal examination of whether migratory distance influences pop-ulation density solely via the serial founder effect on genetic diversity. This is a par-ticularly important test since, if migratory distance from East Africa actually affects economic development either directly or via some other unobserved channels, then the main empirical analysis conducted using predicted values of diversity would be attributing this latent influence to the genetic diversity channel.36
35 Despite controls for continent fixed effects, the fact that (i) the hump-shaped relationship between genetic diversity and economic development appears to be, in part, identified by a relatively smaller number of observations from the Americas on the downward-sloping side of the relationship, coupled with the fact that (ii) equations (7)–(9) a priori impose a quadratic relationship between genetic diversity and economic development, could potentially raise concerns that the empirical models being estimated in this paper are misspecified in that the true relationship between diversity and development is logarithmic rather than quadratic in nature. If the relationship is indeed loga-rithmic then, upon reestimating the baseline specifications using logged diversity and the square of logged diversity, one should not expect the latter quadratic term to survive in the regressions. Table D4 in Section D of the online Appendix presents the results from such an analysis, demonstrating that empirical model misspecification need not be a source of concern. In particular, the results indicate that the baseline findings from both the limited- and extended-sample variants of the historical analysis, as well as those from the contemporary analysis, are qualita-tively unaltered when quadratic specifications using logged genetic diversity are employed to examine the impact of diversity on development.
36 Figures C6(a)–C6(c) in Section C of the online Appendix illustrate that, unlike the significant impact of migra-tory distance from East Africa on genetic diversity, migratory distance has no systematic relationship with a number of observed physiological characteristics of populations, including average skin reflectance, average height, and average weight, conditional on geographical factors such as the intensity of ultraviolet exposure, absolute latitude, the percentage of arable land, the shares of land in tropical and temperate zones, elevation, access to waterways, and continent fixed effects. Since the physiological characteristics examined in Figures C6(a)–C6(c) represent

24 THE AMERICAN ECONOMIC REVIEW fEbRuARy 2013
To implement the aforementioned test, the current analysis examines a speci-fication that includes migratory distance from East Africa rather than genetic diversity to explain the cross-country variation in log population density in 1500 ce. The associated results are then compared with those obtained from estimat-ing an alternative specification including both migratory distance and genetic diversity as covariates. Unless migratory distance and genetic diversity are ulti-mate and proximate determinants within the same channel, then genetic diversity, when included in the regression, should not capture most of the explanatory power otherwise attributed to migratory distance. While column 1 of Table 2 reveals a highly statistically significant unconditional hump-shaped effect of migratory dis-tance from East Africa on log population density, however, this effect not only becomes insignificant but also drops considerably in magnitude once genetic diver-sity is accounted for in column 2. Further, although the linear and quadratic coef-ficients associated with genetic diversity, conditional on migratory distance from East Africa, are admittedly somewhat weaker in magnitude when compared to their unconditional estimates in Table 1, they continue to remain statistically significant at conventional levels of significance.
The results of the “horse race” regression in column 2 are perhaps even more striking given the prior that genetic diversity, as opposed to migratory distance, is likely to be afflicted by larger measurement errors. Nevertheless, since migratory distance is measured as the sum of aerial distances between intercontinental way-points, it may also be viewed as a noisy proxy of the distance along actual migration routes taken by prehistoric humans during their exodus out of Africa. In order to test whether genetic diversity survives a horse race with a less noisy measure of migra-tory distance from East Africa, columns 3 and 4 repeat the preceding analysis using migratory distance based on the index of human mobility employed previously by Ashraf, Galor, and Özak (2010). This index captures the average distance from Addis Ababa to the HGDP ethnic groups located within a given country, along “optimal” land-restricted routes that minimize the time cost of movement on the surface of the earth in the absence of steam-powered transportation technologies. The index thus accounts for natural impediments to human mobility, including various meteoro-logical and topographical conditions, and incorporates information on the time cost of travelling under such conditions. Reassuringly, as revealed in columns 3 and 4, while distance from East Africa based on the mobility index possesses a significant hump-shaped correlation with log population density, this unconditional relation-ship virtually disappears once genetic diversity is accounted for by the analysis, lending further support to the claim that distance along prehistoric human migration routes from East Africa confers an effect on development outcomes through genetic diversity alone.37
their averages for contemporary national populations, the migratory distance measure is adjusted to account for the modern ethnic compositions of these populations resulting from cross-country migrations in the post-1500 era.
37 The difference in the number of observations between columns 1 and 2 (21 observations) and columns 3 and 4 (18 observations) arises due to the fact that the mobility index cannot be calculated for countries that can only be accessed from Addis Ababa by crossing at least one body of water. Restricting the sample used in columns 1 and 2 to that in columns 3 and 4 does not qualitatively alter the findings. In addition, the unavailability of the mobil-ity index measure for several countries (due to the aforementioned strict land-accessibility constraint) makes this measure less suitable, in comparison to the baseline migratory distance measure of Ramachandran et al. (2005), to predict genetic diversity in the extended cross-country sample. Nevertheless, Table D5 in Section D of the online

25AshrAf And GAlor: diversity And developmentvol. 103 no. 1
The analysis now turns to address concerns regarding the fact that diversity and economic development may be endogenously determined. In particular, column 5
Appendix demonstrates that the main findings from both the extended-sample historical analysis and the contem-porary analysis remain qualitatively robust to using genetic diversity predicted by the more sophisticated mobility index, rather than by the baseline waypoints-restricted migratory distance measure of Ramachandran et al. (2005).
Table 2—Migratory Distance from East Africa and Economic Development in 1500 ce
log population density in 1500 ce
OLS OLS OLS OLS 2SLS 2SLS(1) (2) (3) (4) (5) (6)
Observed diversity 255.219** 361.421** 285.190*** 243.110***(100.586) (121.429) (88.064) (63.880)
Observed diversity square −209.808** −268.514***−206.576***−179.581***(73.814) (87.342) (66.852) (52.038)
Migratory distance 0.505*** 0.070(0.148) (0.184)
Migratory distance square −0.023*** −0.014(0.006) (0.009)
Mobility index 0.353** 0.051(0.127) (0.154)
Mobility index square −0.012*** −0.003(0.004) (0.006)
log Neolithic transition 1.014*** 1.119** timing (0.361) (0.487)log percentage of arable 0.608*** 0.634*** land (0.188) (0.211)log absolute latitude −0.209* −0.133
(0.121) (0.127)log land suitability for 0.494** 0.549** agriculture (0.233) (0.253)
Continent fixed effects No No No No No Yes
Observations 21 21 18 18 21 21 R 2 0.34 0.46 0.30 0.43 — —
p-value for joint significance of linear and quadratic terms in: Observed diversity 0.023 0.027 Migratory distance 0.235 Mobility index 0.905
Notes: This table (i) performs an informal identification test, which demonstrates that the significant uncondi-tional hump-shaped impact of migratory distance from East Africa on log population density in 1500 ce in the lim-ited 21-country sample almost entirely reflects the latent influence of observed genetic diversity; and (ii) employs migratory distance as an excluded instrument for observed genetic diversity to establish the causal hump-shaped effect of genetic diversity on log population density in 1500 ce in the limited 21-country sample while controlling for the timing of the Neolithic Revolution, land productivity, and continent fixed effects. For the 2SLS regressions in columns 5 and 6, since the second stage is quadratic in the endogenous regressor, it is necessary to instrument for both genetic diversity and its squared term in order for the system to be exactly identified. Thus, following Wooldridge (2010), the instrumentation technique introduces a zeroth stage to the analysis where genetic diversity is first regressed on migratory distance and all the second-stage controls to obtain predicted (i.e., fitted) values of diversity. The predicted genetic diversity from the zeroth stage is squared, and this squared term is then used as an excluded instrument in the second stage along with migratory distance. The zeroth- and first-stage results of these 2SLS regressions are collected in Table D6 in Section D of the online Appendix. Heteroskedasticity-robust standard errors are reported in parentheses.
*** Significant at the 1 percent level. ** Significant at the 5 percent level. * Significant at the 10 percent level.

26 THE AMERICAN ECONOMIC REVIEW fEbRuARy 2013
presents the results from estimating the preferred regression specification, with genetic diversity instrumented by migratory distance. The results from a similar analysis that also accounts for continent fixed effects are reported in column 6. Interestingly, in comparison to their OLS counterparts in Table 1, the estimated 2SLS coefficients associated with the diversity channel remain relatively stable in magnitude, suggesting that the potential endogeneity between genetic diversity and economic development need not be a source of concern, conditional on controls for the transition timing and land productivity channels. Overall, the results uncovered here provide support for the inferences made with predicted genetic diversity in the main empirical analysis to follow.
B. Baseline Results from the Extended Sample
This section establishes the hump-shaped impact of genetic diversity, predicted by migratory distance from East Africa, on log population density in 1500 ce, using the extended sample of 145 countries. To reveal the independent and combined effects of the genetic diversity, transition timing, and land productivity channels, Table 3 presents the results from estimating a number of specifications spanning relevant subsets of the explanatory variables in equation (8).
Table 3—Predicted Diversity and Economic Development in 1500 ce
log population density in 1500 ce
(1) (2) (3) (4) (5) (6)Predicted diversity 250.986*** 213.537*** 203.017*** 195.416*** 199.727**
(66.314) (61.739) (60.085) (55.916) (80.281)Predicted diversity −177.399*** −152.107*** −141.980*** −137.977*** −146.167*** square (48.847) (45.414) (44.157) (40.773) (56.251)log Neolithic transition 1.287*** 1.047*** 1.160*** 1.235*** timing (0.170) (0.188) (0.143) (0.243)log percentage of 0.523*** 0.401*** 0.393*** arable land (0.117) (0.096) (0.103)log absolute latitude −0.167* −0.342*** −0.417***
(0.093) (0.096) (0.124)log land suitability 0.189 0.305*** 0.257*** for agriculture (0.124) (0.094) (0.096)
Optimal diversity 0.707*** 0.702*** 0.715*** 0.708*** 0.683***(0.021) (0.025) (0.110) (0.051) (0.110)
Continent fixed effects No No No No No Yes
Observations 145 145 145 145 145 145 R 2 0.22 0.26 0.38 0.50 0.67 0.69
Notes: This table establishes the significant hump-shaped effect of genetic diversity, as predicted by migratory dis-tance from East Africa, on log population density in 1500 ce in the extended 145-country sample while controlling for the timing of the Neolithic Revolution, land productivity, and continent fixed effects. Bootstrap standard errors, accounting for the use of generated regressors, are reported in parentheses.
*** Significant at the 1 percent level. ** Significant at the 5 percent level. * Significant at the 10 percent level.

27AshrAf And GAlor: diversity And developmentvol. 103 no. 1
The unconditional hump-shaped relationship between genetic diversity and log population density in 1500 ce is reported in column 1.38 In particular, the estimated linear and quadratic coefficients, both statistically significant at the 1 percent level, imply that a 1 percentage point increase in genetic diversity for the least diverse society in the regression sample would raise its population density by 59 percent, whereas a 1 percentage point decrease in genetic diversity for the most diverse society would raise its population density by 24 percent.39 Further, population den-sity in 1500 ce is unconditionally predicted by the regression to be maximized at an expected heterozygosity value of about 0.707, which roughly corresponds to the diversity predicted (by migratory distance from East Africa) for southern China. Indeed, a 1 percentage point change in genetic diversity in either direction at the pre-dicted optimum lowers population density by 1.8 percent. Moreover, based on the R 2 of the regression, the cross-country variation in genetic diversity alone explains 22 percent of the cross-country variation in population density.
Column 2 reports the unconditional effect of the timing of the agricultural transition on population density in 1500 ce. In line with the Diamond hypothesis, a 1 percent increase in the number of years elapsed since the Neolithic transition to agriculture is associated with a 1.3 percent increase in population density, an effect that is also statistically significant at the 1 percent level. Furthermore, 26 percent of the cross-country variation in population density is explained by the cross-country variation in the timing of the agricultural transition alone. Perhaps unsurprisingly, as foreshad-owed by the sample correlations in Table G4 in Section G of the online Appendix, the unconditional effects of both the genetic diversity and agricultural transition timing channels are somewhat weakened in magnitude once they are simultaneously taken into account in column 3, which reduces the omitted variable bias afflicting the coef-ficient estimates reported in earlier columns. The coefficients on both channels, how-ever, retain their expected signs and continue to remain statistically significant at the 1 percent level with the combined cross-country variation in genetic diversity and transi-tion timing explaining 38 percent of the cross-country variation in population density.
The results of examining the combined explanatory power of the genetic diver-sity and land productivity channels are reported in column 4. Once again, given the sample correlations, the linear and quadratic coefficients associated with genetic diversity are naturally somewhat weaker when compared to their unconditional esti-mates in column 1. More importantly, the coefficients remain highly statistically significant and also rather stable in magnitude relative to those estimated while con-trolling for the timing of the Neolithic transition. In addition, the overall significance of the land productivity channel is also confirmed, particularly by the estimated coefficients on the log percentage of arable land and log absolute latitude variables,
38 This quadratic relationship is depicted in Figures C2(a) and C2(b) in Section C of the online Appendix along with a nonparametric local polynomial regression line and a restricted cubic spline regression line, respectively. As in the limited-sample historical analysis, the estimated quadratic falls within the 95 percent confidence interval bands of both the nonparametric and cubic spline relationships. The figure notes provide additional details on the estimation procedures underlying the nonparametric and cubic spline regressions.
39 Following the earlier discussion regarding the expected heterozygosity index, these effects are therefore asso-ciated with a 0.01 change in the probability that two randomly selected individuals from a given population are genetically different from one another. See footnote 32 for details on how these effects may be computed based on the estimated linear and quadratic coefficients associated with genetic diversity.

28 THE AMERICAN ECONOMIC REVIEW fEbRuARy 2013
which indeed appear to possess their expected signs.40 Nonetheless, these estimates continue to reflect some amount of omitted variable bias resulting from the exclu-sion of the transition timing channel. For instance, the fact that log agricultural tran-sition timing has a sample correlation of 0.28 with genetic diversity and one of 0.32 with log absolute latitude implies that the estimated effects of these variables on log population density in column 4 may be partially capturing the latent influence of the excluded Neolithic transition timing channel.
Column 5 presents the results from exploiting the explanatory power of all three identified channels for log population density in 1500 ce. In line with the theoretical predictions of each hypothesis, the coefficient estimates possess their expected signs and are all statistically significant at the 1 percent level. Moreover, in comparison to their estimates in columns 3 and 4, the linear and quadratic coefficients associated with the diversity channel remain largely stable. In particular, the estimated coef-ficients of interest imply that, controlling for the influence of land productivity and the timing of the Neolithic Revolution, a 1 percentage point increase in genetic diversity for the least diverse society in the sample would raise its population den-sity in 1500 ce by 43 percent, whereas a 1 percentage point decrease in diversity for the most diverse society would raise its population density by 18 percent. Further, population density in 1500 ce is predicted to be maximized at an expected hetero-zygosity value of 0.708, where a 1 percentage point change in diversity in either direction would lower population density by 1.4 percent. Overall, based on the R 2 of the regression, the cross-country variations in genetic diversity, agricultural transi-tion timing, and land productivity together explain 67 percent of the cross-country variation in population density in 1500 ce.
Finally, column 6 reports the results from estimating the baseline regression model, specified in equation (8), which allows the analysis to capture unobserved continent-specific attributes that could potentially have an influence on population density. Despite the more modest cross-country variation in genetic diversity within continents as opposed to that across continents, the coefficients associated with diversity remain rather stable, increasing slightly in magnitude with the inclusion of continent fixed effects, although the statistical significance of the linear coefficient drops to the 5 per-cent level.41 Specifically, the coefficients associated with the diversity channel indicate
40 To interpret the coefficients associated with the land productivity channel, a 1 percent increase in the fraction of arable land and in absolute latitude corresponds, respectively, to a 0.5 percent increase and a 0.2 percent decrease in population density. While this latter effect may seem unintuitive, given the positive relationship between absolute latitude and contemporary income per capita, it accurately reflects the fact that agricultural productivity in the past has typically been higher at latitudinal bands closer to the equator. In addition, this finding is also consistent with the “reversal of fortune” hypothesis documented by Acemoglu, Johnson, and Robinson (2005).
41 Table D7 in Section D of the online Appendix demonstrates that the baseline findings for genetic diversity from both the limited- and extended-sample variants of the historical analysis, as well as those from the contem-porary analysis, remain qualitatively intact under alternative regression specifications that control for some of the individual ecological components of the land suitability index, including temperature, precipitation, and soil fertil-ity, in lieu of the baseline control for the overall suitability of land for cultivation.
In addition, consistent with the fact that the baseline control for the timing of the Neolithic Revolution should be expected to capture the contemporaneous effect of the mode of subsistence on population density in the precolonial Malthusian era, Table D8 establishes that augmenting the baseline specifications for examining population density in the years 1500 ce and 1000 ce with an explicit control for the mode of subsistence, while diminishing somewhat the explanatory power of the transition timing channel, does not affect the main findings for genetic diversity. Note that, given underlying data availability constraints on constructing a proxy for the mode of subsistence prevalent in the year 1500 ce, coupled with the fact that cross-country subsistence patterns in 1000 ce should be expected to be highly correlated with those existing in 1500 ce, the analysis in Table D8 controls only for the mode of subsistence

29AshrAf And GAlor: diversity And developmentvol. 103 no. 1
that, controlling for the influence of land productivity, the timing of the Neolithic Revolution, and continent fixed effects, a 1 percentage point increase in diversity for the most homogenous society in the sample would raise its population density in 1500 ce by 36 percent, whereas a 1 percentage point decrease in diversity for the most diverse society would raise its population density by 29 percent. In addition, a 1 per-centage point change in genetic diversity in either direction at the predicted optimum level of 0.683, which roughly corresponds to the diversity predicted (by migratory distance from East Africa) for Japan, would lower population density by 1.4 percent. Reassuringly, the optimal level of predicted diversity in the extended sample is quite similar to that obtained for observed diversity in the limited 21-country sample.
To place the worldwide effect of the diversity channel into perspective, the coef-ficients reported in column 6 imply that increasing the expected heterozygosity of the most homogenous native South American populations by 11 percentage points to the predicted optimum would have raised their population density in 1500 ce by a factor of 6.1. On the other hand, decreasing the expected heterozygosity of the most heterogenous East African populations by 9.1 percentage points to the optimum would have raised their population density by a factor of 3.4. The hump-shaped effect of genetic diversity on log population density in 1500 ce, conditional on the timing of the Neolithic transition, land productivity, and continent fixed effects, is depicted in Figure 4.42 Moreover, the partial R 2 associated with genetic diversity suggests that residual genetic diversity explains about 7 percent of the cross-country variation in residual log population density in 1500 ce, conditional on the covariates from the baseline regression model.
To summarize the results reported in Table 3, genetic diversity as predicted by migratory distance from East Africa is found to have a highly statistically significant nonmonotonic effect on population density in 1500 ce. This finding is entirely con-sistent with the theoretical prediction of the proposed genetic diversity channel that comprises both an adverse effect of diversity on Malthusian economic development, via diminished social capital, and a favorable effect arising from increased technologi-cal creativity. The analysis also confirms the significant beneficial effects of an earlier Neolithic transition to agriculture as well as geographical factors conducive to higher agricultural yields. Nevertheless, controlling for these additional explanatory channels hardly affects the hump-shaped relationship between genetic diversity and population density, a finding that remains robust to the inclusion of continent fixed effects as well.
C. Robustness to Aerial Distance and Migratory Distances from Placebo Points of Origin across the Globe
The results from the limited-sample analysis discussed earlier demonstrate that the cross-country variation in migratory distance from East Africa has a signifi-cant nonmonotonic influence on comparative development in 1500 ce and that this
prevalent in the year 1000 ce in augmented regressions explaining population density in both time periods. For detailed definitions of additional control variables used by the robustness analyses in Tables D7 and D8, the inter-ested reader is referred to Section F of the online Appendix.
42 Plots depicting the partial regression lines associated with the first- and second-order effects of genetic homo-geneity on log population density in 1500 ce are presented in Figures C3(a)–C3(b) in Section C of the online Appendix.

30 THE AMERICAN ECONOMIC REVIEW fEbRuARy 2013
impact runs exclusively via the serial founder effect on genetic diversity. This find-ing, however, does not preclude the possibility that alternative measures of distance, potentially correlated with migratory distance from East Africa, may also explain the historical cross-country variation in economic development in a similar non-monotonic fashion. Indeed, if this is the case, then the role previously ascribed to the “out of Africa” migration of Homo sapiens as a deep determinant of comparative development becomes suspect, undermining the credibility of the proposed genetic diversity channel. Nonetheless, alternative distances, as will become evident, do not impart any significant influence, similar to that associated with migratory distance from East Africa, on log population density in 1500 ce.
The current analysis compares regression results obtained using migratory distance from East Africa in the baseline specification with those obtained under several alterna-tive concepts of distance. The alternative concepts of distance considered by the analysis include the aerial or “as the crow flies” distance from East Africa (i.e., Addis Ababa) as well as migratory distances from placebo points of origin in other continents across the globe, namely, London, Tokyo, and Mexico City, computed using the same waypoints
AGO
BDI
BEN
BFABWA
CAF
CIV
CMR
COG DZA
EGY
ETH
GAB
GHA
GIN
GMB
GNB
KEN
LBR
LBYLSO
MARMDG
MLI
MOZ MRT
MWI
NAM
NER
NGA
RWA
SDN
SENSLESOM
SWZTCD TGO
TUN
TZA
UGA ZAF
ZMB
ZWE
ALB
AUT
BEL
BGR
BIH
BLR
CHE
CZEDEU
DNK
ESP
EST
FIN
FRA
GBR
GRC
HRVHUN
IRLITA
LTU
LVA
MDA
MKD
NLD
NORPOL
PRT
ROM
RUS
SVN
SWE
UKR
AFG
ARE
ARMAZE
BGD
CHN
GEOIDN
IND
IRN
IRQ
ISR
JOR
JPN
KAZ
KGZ
KHM
KOR
KWT
LAO
LBN
LKA
MMR
MNG
MYS
NPL
OMN
PAK
PHL
PRK
QATSAU
SYR
THA
TJK
TKM
TUR
UZB
VNM
YEM
AUS
NZL
PNG
ARG
BLZ
BOL
BRA
CAN
CHL
COL
CRI
CUB
DOM
ECU
GTM
GUY
HND
HTI
MEX
NIC
PANPER
PRY
SLV
SUR
URYUSA
VEN
12
13
14
15
16
17
0.2 0.25 0.3 0.35 0.4 0.45
log
popu
latio
n de
nsity
in 1
500
CE
(Predicted) Genetic homogeneity
Africa Europe Asia Oceania Americas
Figure 4. Predicted Genetic Diversity and Population Density in 1500 CE
Notes: This figure depicts the hump-shaped effect, estimated using a least-squares quadratic fit, of predicted genetic homogeneity (i.e., 1 minus genetic diversity as predicted by migratory distance from East Africa) on log popula-tion density in 1500 CE in the extended 145-country sample, conditional on the timing of the Neolithic Revolution, land productivity, and continent fixed effects. This figure is an augmented component-plus-residual plot rather than the typical added-variable plot of residuals against residuals. Specifically, the vertical axis represents fitted val-ues (as predicted by genetic homogeneity and its square) of log population density plus the residuals from the full regression model. The horizontal axis, on the other hand, represents genetic homogeneity rather than the residuals obtained from regressing homogeneity on the control variables in the model. This methodology permits the illustra-tion of the overall nonmonotonic effect of genetic homogeneity in one scatter plot.

31AshrAf And GAlor: diversity And developmentvol. 103 no. 1
employed in constructing migratory distance from East Africa.43 As revealed in Table G4 in Section G of the online Appendix, with the exception of migratory distance from Tokyo, these other distances are rather strongly correlated with migratory distance from East Africa. Despite some of these high correlations, however, the results presented in Table 4 indicate that migratory distance from East Africa is the only concept of distance that confers a significant nonmonotonic effect on log population density.
Specifically, consistent with the proposed diversity hypothesis, column 1 reveals a highly statistically significant hump-shaped relationship between migratory distance from East Africa and log population density in 1500 ce, conditional on controls for the Neolithic transition timing and land productivity channels. In contrast, the linear and quadratic effects of aerial distance from East Africa, reported in column 2, are not statistically different from zero at conventional levels of significance. Similarly, as shown in columns 3–5, the migratory distances from placebo points of origin do
43 The choice of these alternative points of origin do not reflect any systematic selection process, other than the criterion that they belong to different continents in order to demonstrate, at a global scale, the neutrality of migra-tory distance from locations outside of East Africa. Indeed, other points of origin in Europe, Asia, and the Americas yield qualitatively similar results.
Table 4 —Robustness to Alternative Distances
log population density in 1500 ce
Distance from: Addis Ababa Addis Ababa London Tokyo Mexico City(1) (2) (3) (4) (5)
Migratory distance 0.138** −0.040 0.052 −0.063(0.061) (0.063) (0.145) (0.099)
Migratory distance square −0.008*** −0.002 −0.006 0.005(0.002) (0.002) (0.007) (0.004)
Aerial distance −0.008(0.106)
Aerial distance square −0.005(0.006)
log Neolithic transition 1.160*** 1.158*** 1.003*** 1.047*** 1.619*** timing (0.144) (0.138) (0.164) (0.225) (0.277)log percentage of arable 0.401*** 0.488*** 0.357*** 0.532*** 0.493*** land (0.091) (0.102) (0.092) (0.089) (0.094)log absolute latitude −0.342*** −0.263*** −0.358*** −0.334*** −0.239***
(0.091) (0.097) (0.112) (0.099) (0.083)log land suitability for 0.305*** 0.254** 0.344*** 0.178** 0.261*** agriculture (0.091) (0.102) (0.092) (0.080) (0.092)
Observations 145 145 145 145 145 R 2 0.67 0.59 0.67 0.59 0.63
Notes: This table establishes that, unlike migratory distance from East Africa, alternative concepts of distance, including aerial distance from East Africa and migratory distances from placebo points of origin in other continents across the globe, do not possess any systematic relationship, hump-shaped or otherwise, with log population density in 1500 CE while controlling for the timing of the Neolithic Revolution and land productivity. Heteroskedasticity-robust standard errors are reported in parentheses.
*** Significant at the 1 percent level. ** Significant at the 5 percent level. * Significant at the 10 percent level.

32 THE AMERICAN ECONOMIC REVIEW fEbRuARy 2013
not impart any statistically discernible effect, linear or otherwise, on log population density in the year 1500 ce.
These results strengthen the assertion that conditions innately related to the pre-historic migration of humans out of Africa have had a lasting impact on comparative development. Given the high correlations between migratory distance from East Africa and some of these alternative distance concepts, the fact that these other distances fail to reveal any significant effects makes the argument in favor of the “out of Africa” hypothesis even stronger. Together with earlier findings establishing migratory distance from East Africa and genetic diversity as ultimate and proximate determinants in the same channel, the findings from these placebo tests of distance lend further credence to the proposed diversity hypothesis.
V. Contemporary Analysis: Data and Empirical Strategy
This section discusses the data and the empirical strategy employed to examine the impact of genetic diversity on contemporary comparative development.
A. The Index of Contemporary National Population Diversity
The index of genetic diversity for contemporary national populations accounts for their ethnic compositions resulting from population flows among countries in the post-1500 era, the genetic diversity of the precolonial ancestral population of each component ethnic group, and the genetic distances between these ancestral populations. Specifically, given the genetic diversity of the ancestral populations of the source countries, data on post-1500 population flows can be used to construct a weighted average expected heterozygosity measure for the national population of each country in the contemporary period.44 This measure alone, however, would not capture the full extent of genetic diversity in contemporary national populations as it would fail to account for the diversity arising from differences between subnational ethnic groups.
To additionally incorporate the between-group component of diversity in con-temporary national populations, the index makes use of the concept of F st genetic distance from the field of population genetics. Details regarding the construction of this ancestry-adjusted measure of genetic diversity, that also accounts for the diver-sity arising from differences between subnational ethnic groups, are presented in Section B of the online Appendix.
Reassuringly, the ancestry-adjusted measure of genetic diversity dominates the unadjusted measure in predicting economic development in the contemporary peri-od.45 In line with the diversity hypothesis, column 1 in Table 5 reveals a significant
44 The data on ethnic compositions are obtained from the World Migration Matrix, 1500–2000 of Putterman and Weil (2010) who compile, for each country in their dataset, the share of the country’s population in 2000 ce that is descended from the population of every other country in 1500 ce.
45 Table D9 in Section D of the online Appendix establishes that migratory distance from East Africa, adjusted to reflect the weighted average of migratory distances of the precolonial ancestral populations of a country today, is the only distance concept that confers a significant hump-shaped effect on income per capita in 2000 ce. As shown in the table, the other distance concepts, including (i) the unadjusted measure of migratory distance from East Africa (used in the historical analysis); (ii) the aerial distance from East Africa; and (iii) the ancestry-adjusted aerial

33AshrAf And GAlor: diversity And developmentvol. 103 no. 1
unconditional hump-shaped relationship between the adjusted measure of diversity and income per capita in the year 2000 ce.46
Column 2 establishes that the unconditional quadratic relationship from column 1 remains qualitatively intact when conditioned for the impact of continent fixed effects. As revealed in columns 3 and 4, however, while the unadjusted measure also possesses a significant unconditional hump-shaped relationship with income per capita across countries, the relationship disappears once the regression is augmented to account for continent fixed effects. Moreover, examining jointly the explanatory powers of the ancestry-adjusted and unadjusted measures of genetic diversity for income per capita, columns 5 and 6 demonstrate the superior relative performance of the adjusted measure, regardless of whether continent fixed effects are accounted for, lending further credence ex post to the methodology employed in constructing the index of contemporary population diversity.
distance from East Africa, do not confer any systematic nonmonotonic effect on income per capita in 2000 ce, given that the ancestry-adjusted migratory distance measure is accounted for by the regression.
46 This quadratic relationship is depicted in Figures C4(a) and C4(b) in Section C of the online Appendix along with a nonparametric local polynomial regression line and a restricted cubic spline regression line, respectively. As in the preceding historical analysis, the estimated quadratic falls within the 95 percent confidence interval bands of both the nonparametric and cubic spline relationships. The figure notes provide additional details on the estimation procedures underlying the nonparametric and cubic spline regressions.
Table 5 —Adjusted versus Unadjusted Diversity
log income per capita in 2000 ce
(1) (2) (3) (4) (5) (6)
Predicted diversity 541.792*** 248.699*** 524.240*** 374.297** (ancestry adjusted) (130.250) (86.798) (172.284) (189.015)Predicted diversity square −387.026***−172.552*** −370.660***−264.700* (ancestry adjusted) (91.148) (61.446) (123.664) (137.333)Predicted diversity 140.903*** 10.152 −1.063 −67.278 (unadjusted) (51.614) (52.732) (74.681) (84.783)Predicted diversity square −107.686*** −7.418 −2.002 52.844 (unadjusted) (38.133) (38.000) (57.317) (67.248)
Continent fixed effects No Yes No Yes No Yes
Observations 143 143 143 143 143 143 R 2 0.13 0.47 0.08 0.45 0.14 0.48
p-value for joint significance of linear and quadratic terms in: Adjusted diversity 0.010 0.039 Unadjusted diversity 0.419 0.748
Notes: This table establishes that, when explaining log income per capita in 2000 ce, the ancestry-adjusted mea-sure of genetic diversity outperforms the unadjusted measure in terms of (i) the qualitative robustness of the hump-shaped effect to continent fixed effects, and (ii) maintaining explanatory power in regressions that perform a horse race between the two measures of diversity. Bootstrap standard errors, accounting for the use of generated regres-sors, are reported in parentheses.
*** Significant at the 1 percent level. ** Significant at the 5 percent level. * Significant at the 10 percent level.

34 THE AMERICAN ECONOMIC REVIEW fEbRuARy 2013
B. The Empirical Model
Maintaining symmetry with the earlier historical analysis, a regression specifica-tion similar to that employed for the historical regressions is adopted initially to examine the impact of genetic diversity on log income per capita in the year 2000 ce while controlling for the Neolithic transition timing and land productivity channels. The current specification, however, is further augmented with controls for insti-tutional, cultural, and additional geographical factors that have received attention in the literature. This permits the examination of the direct impact of the diversity channel, as opposed to its overall impact that additionally captures indirect effects through contemporary cultural and institutional factors.
Formally, the following specification is adopted as a baseline to examine the direct influence of contemporary population diversity on the modern world income distribution:
(9) ln y i = γ 0 + γ 1 G i + γ 2 G i 2 + γ 3 ln T i + γ 4 ′ ln X i + γ 5 ′ ln Λ i + γ 6 ′ ln Γ i + η i ,
where y i is the income per capita of country i in the year 2000 ce; G i is the index of contemporary population diversity for country i; T i and X i are the Neolithic transi-tion timing and land productivity controls for country i; Λ i is a vector of institutional and cultural controls for country i; Γ i is a vector of additional geographical controls for country i; and, finally, η i is a country-specific disturbance term.47
VI. Contemporary Analysis: Empirical Findings
A. Results for Comparative Development
The empirical findings indicate that the highly significant hump-shaped effect of genetic diversity on macroeconomic outcomes in the preindustrial period is pres-ent in the contemporary period as well. Furthermore, the persistent hump-shaped impact of genetic diversity on the pattern of comparative economic development is a direct effect that is not captured by contemporary geographical, institutional, and cultural factors.48
47 The data on income per capita are from the Penn World Table (Heston, Summers, and Aten 2006). The institutional and cultural controls include the social infrastructure index of Hall and Jones (1999), the share of the population of European descent based on the World Migration Matrix, 1500–2000 of Putterman and Weil (2010), legal origin dummies and the shares of the population affiliated with major world religions from the dataset of La Porta et al. (1999), as well as the ethnic fractionalization index of Alesina et al. (2003). The additional geographical controls include the share of the population at risk of contracting falciparum malaria from Gallup and Sachs (2001), as well as the share of the population living in Köppen-Geiger tropical zones and distance from the nearest coast or sea-navigable river, both from the dataset of Gallup, Sachs, and Mellinger (1999). See Section F of the online Appendix for further details.
48 Since (i) genetic diversity for contemporary national populations is partly based on the F st genetic distances between their precolonial ancestral groups, and (ii) F st genetic distances and relative expected heterozygosities, even among populations in the precolonial era, are in part codetermined by migratory distances, it is necessary to ensure that the observed hump-shaped effect of genetic diversity on comparative development, in both the precolo-nial and contemporary eras, is not reflecting the latent impact of genetic distance to either the cradle of humankind or the world technological frontier, via channels related to the diffusion of development (Spolaore and Wacziarg 2009). Table D10 in Section D of the online Appendix demonstrates that the baseline findings for genetic diversity from both the limited- and extended-sample variants of the historical analysis, as well as those from the contempo-rary analysis, are virtually unaffected when the regression specifications are augmented to account for appropriate

35AshrAf And GAlor: diversity And developmentvol. 103 no. 1
Using a sample of 143 countries for which data are available for the entire set of control variables used in the baseline regression for the year 1500 ce, column 1 of Table 6 reveals a significant hump-shaped effect of genetic diversity on income per capita in 2000 ce, accounting for the set of baseline controls employed in the his-torical analysis; i.e., the logs of the timing of the Neolithic transition, the percent-age of arable land, absolute latitude, and the suitability of land for agriculture, as
measures of F st genetic distance to Ethiopia and to the world technology frontier relevant for the time period being examined. For detailed definitions of the various genetic distance controls used by the robustness analysis in Table D10, the reader is referred to Section F of the online Appendix.
Table 6—Diversity and Economic Development in 2000 ce and 1500 ce
log income per capitain 2000 ce
log population density in1500 ce
(1) (2) (3) (4)
Predicted diversity 203.443** 235.409*** 242.886*** (ancestry adjusted) (83.368) (83.493) (81.773)Predicted diversity square −142.663** −165.293*** −169.960*** (ancestry adjusted) (59.037) (59.393) (58.252)Predicted diversity 198.587** (unadjusted) (79.225)Predicted diversity square −145.320*** (unadjusted) (55.438)log Neolithic transition 0.062 0.005 timing (ancestry adjusted) (0.263) (0.306)log Neolithic transition −0.151 1.238*** timing (unadjusted) (0.197) (0.241)log percentage of arable −0.112 −0.122 −0.140 0.378*** land (0.103) (0.108) (0.112) (0.108)log absolute latitude 0.163 0.171 0.191 −0.423***
(0.117) (0.119) (0.143) (0.122)log land suitability for −0.192** −0.176* −0.187* 0.264*** agriculture (0.096) (0.102) (0.102) (0.095)log population density in 0.047 1500 ce (0.097)
Optimal diversity 0.713*** 0.712*** 0.715*** 0.683***(0.225) (0.033) (0.043) (0.095)
Continent fixed effects Yes Yes Yes Yes
Observations 143 143 143 143 R 2 0.57 0.57 0.57 0.68
Notes: This table (i) establishes the significant hump-shaped effect of ancestry-adjusted genetic diversity on log income per capita in 2000 ce in a 143-country sample while controlling for the timing of the Neolithic Revolution, land productivity, and continent fixed effects; and (ii) demonstrates that the hump-shaped effect of genetic diversity is robust to (a) adjusting the control for the timing of the Neolithic Revolution to incorporate information on post-1500 population flows and (b) accounting for historical inertia in the effect of genetic diversity by way of control-ling for log population density in 1500 ce. Bootstrap standard errors, accounting for the use of generated regressors, are reported in parentheses.
*** Significant at the 1 percent level. ** Significant at the 5 percent level. * Significant at the 10 percent level.

36 THE AMERICAN ECONOMIC REVIEW fEbRuARy 2013
well as continent fixed effects.49 Further, consistent with the notion that the optimal level of diversity increased in the process of industrialization, as the beneficial forces associated with greater diversity became intensified in an environment characterized by more rapid technological progress, the findings indicate that the optimal level of diversity with respect to the modern world income distribution is indeed higher than that obtained with respect to population density in the precolonial Malthusian era. Specifically, while the estimate for the optimal level in 1500 ce is 0.683 (column 4), the estimated optimum in 2000 ce, under the same set of controls, is 0.713.
Column 2 shows that the hump-shaped effect of diversity on income per capita remains virtually intact when the control for the Neolithic transition is adjusted to capture the average time elapsed since the precolonial ancestral populations of each country today experienced the transition to agriculture (i.e., traits that are embodied in the country’s population today, rather than the country’s geographical attributes). In particular, the estimated linear and quadratic coefficients on genetic diversity are both statistically significant at the 1 percent level. They imply that increasing the diversity of the most genetically homogenous country in the sample (Bolivia) by 1 percentage point would raise its income per capita in 2000 ce by 30 percent, whereas decreasing the diversity of the most genetically diverse country in the sam-ple (Ethiopia) by 1 percentage point would raise its income per capita by 21 percent. Further, a 1 percentage point change in diversity (in either direction) at the optimum level of 0.712 would lower income per capita by 1.6 percent.50
Importantly, the hump-shaped effect of genetic diversity on income per capita in 2000 ce does not reflect an inertia originating from its effect on technology and thus on population density in 1500 ce. As established in column 3, the results are essen-tially unchanged if the regression accounts for the potentially confounding effect of population density in 1500 ce. Namely, the effect of genetic diversity on income per capita in 2000 ce does not operate through its impact on population density in the year 1500 ce.
The findings uncovered by the analysis thus far suggest that genetic diversity has a highly significant hump-shaped effect on income per capita in the year 2000 ce. Moreover, as established by the analysis to follow, this overall effect comprises a direct impact that does not operate through institutional, cultural, and other geo-graphical factors.
Using a sample of 109 countries for which data are available for the institutional and cultural controls that are employed in the examination, column 1 of Table 7 dem-onstrates that genetic diversity has a hump-shaped effect on income per capita in the year 2000 ce, accounting for the set of baseline controls employed in the historical analysis; i.e., the logs of the weighted timing of the Neolithic transition, the percent-age of arable land, and absolute latitude, as well as continent fixed effects.51 The
49 Tables G5 and G6 in Section G of the online Appendix present the relevant descriptive statistics for this 143-country sample. The difference in sample size with the 145-country sample used in the historical analysis arises from the fact that there exist observations for which data are unavailable for both income per capita in 2000 ce and population density in 1500 ce.
50 Table D13 in Section D of the online Appendix reports the standardized beta coefficient and partial R 2 associ-ated with each regressor in the baseline regressions for both the historical and contemporary analyses.
51 The agricultural suitability index was not found to enter significantly in any of the specifications examined in Table 7 and is therefore dropped from the analysis. Tables G7 and G8 in Section G of the online Appendix present the relevant descriptive statistics for the 109-country sample employed in Tables 7 and 8.

37AshrAf And GAlor: diversity And developmentvol. 103 no. 1
estimated linear and quadratic coefficients associated with the diversity channel are both statistically significant at the 1 percent level, and the estimate for the optimal level of diversity is 0.713. The regression in column 2 examines the robustness of the results to the inclusion of a measure of institutional quality, as captured by the social infrastructure index of Hall and Jones (1999). The estimated hump-shaped
Table 7—Diversity and Other Determinants of Economic Development in 2000 ce
log income per capita in 2000 ce
Full sample Schooling sample
(1) (2) (3) (4) (5) (6) (7) (8)Predicted diversity 311.865*** 232.786*** 227.325*** 251.522*** 281.173*** 264.464*** 271.262*** 219.955*** (ancestry adjusted) (83.997) (64.965) (65.074) (68.815) (70.459) (83.157) (72.343) (64.696)Predicted diversity −218.579***−160.645***−156.930***−174.234***−195.010***−183.405*** −188.845***−153.875*** square (ancestry adjusted)
(59.364) (46.006) (46.002) (48.474) (49.764) (58.195) (51.761) (46.072)
log Neolithic −0.270 −0.082 0.048 0.366 0.417* 0.374 0.125 −0.037 transition timing (ancestry adjusted)
(0.271) (0.202) (0.189) (0.242) (0.231) (0.240) (0.233) (0.210)
log percentage of −0.221*** −0.162*** −0.175*** −0.216*** −0.189*** −0.190*** −0.091 −0.089 arable land (0.061) (0.049) (0.048) (0.047) (0.049) (0.049) (0.056) (0.056)log absolute latitude 0.121 0.078 0.031 0.112 0.003 −0.003 0.001 −0.012
(0.123) (0.100) (0.102) (0.095) (0.105) (0.105) (0.096) (0.086)Social infrastructure 2.375*** 2.407*** 2.109*** 1.867*** 1.812*** 1.515*** 0.908**
(0.269) (0.254) (0.371) (0.404) (0.419) (0.420) (0.420)Ethnic −0.701** −0.522* −0.351 −0.365 0.027 −0.134 fractionalization (0.275) (0.316) (0.276) (0.289) (0.274) (0.262)Percentage of −0.504 −0.483 −0.723* −0.715** population at risk of contracting malaria
(0.344) (0.369) (0.383) (0.349)
Percentage of −0.314 −0.291 −0.410** −0.192 population living in tropical zones
(0.199) (0.204) (0.208) (0.197)
Mean distance to −0.373** −0.372** −0.189 −0.067 nearest waterway (0.184) (0.186) (0.215) (0.189)Percentage of 0.211 population of European descent
(0.618)
Years of schooling 0.134***(0.043)
Optimal diversity 0.713*** 0.725*** 0.724*** 0.722*** 0.721*** 0.721*** 0.718*** 0.715***(0.013) (0.044) (0.028) (0.013) (0.016) (0.055) (0.099) (0.032)
OPEC fixed effect No No No No Yes Yes Yes YesLegal origin fixed effects
No No No Yes Yes Yes Yes Yes
Major religion shares No No No Yes Yes Yes Yes Yes
Observations 109 109 109 109 109 109 94 94 R 2 0.74 0.84 0.85 0.87 0.90 0.90 0.91 0.93
Notes: This table establishes, using a feasible 109-country sample, that the significant hump-shaped effect of ancestry-adjusted genetic diversity on log income per capita in 2000 ce, while controlling for the ancestry-adjusted timing of the Neolithic Revolution, land productivity, and continent fixed effects, is robust to additional controls for institutional, cultural, and geographical determinants of development, including social infrastructure, ethnic frac-tionalization, legal origins, major religion shares, tropical disease environments, access to waterways, and natural resource endowments, as well as controls for the share of the population of European descent and human capital for-mation. All regressions include sub-Saharan Africa and continent fixed effects. Bootstrap standard errors, account-ing for the use of generated regressors, are reported in parentheses.
*** Significant at the 1 percent level. ** Significant at the 5 percent level. * Significant at the 10 percent level.

38 THE AMERICAN ECONOMIC REVIEW fEbRuARy 2013
effect of genetic diversity remains highly statistically significant and rather stable, while the optimal level of diversity increases to 0.725.52
The regression in column 3 is designed to examine whether the effect of genetic diversity operates via ethnic fractionalization. It demonstrates that the effect of genetic diversity is virtually unaffected by the potentially confounding impact of ethnic fractionalization.53 While, as established earlier in the literature, ethnic frac-tionalization does indeed confer a significant adverse effect on income per capita in the year 2000 ce, the hump-shaped impact of genetic diversity remains highly statistically significant. Moreover, the estimate for the optimal level of diversity, 0.724, is effectively unchanged in comparison to earlier columns.
Column 4 demonstrates the robustness of the hump-shaped effect of genetic diversity to the inclusion of additional cultural and institutional controls (i.e., legal origins and the fraction of the population affiliated with major religions). The coefficients associated with genetic diversity remain highly significant statistically and rather stable in mag-nitude, while the estimated optimal level of diversity, 0.722, remains virtually intact.
Column 5 establishes the robustness of the results to the inclusion of controls for the health environment (i.e., percentage of the population at risk of contracting malaria and percentage of the population in tropical zones), additional geographical controls gauging access to waterways, and a dummy variable for the Organization of the Petroleum Exporting Countries (OPEC). The results in this column, which reflects the baseline specification for examining the impact of diversity on develop-ment in the modern world, therefore reveal the direct effect of genetic diversity, once institutional, cultural, and geographical factors are accounted for.54 The direct hump-shaped impact of genetic diversity on log income per capita in 2000 ce, as established in column 5, is depicted in Figure 5.55 Moreover, the partial R 2 associ-ated with genetic diversity suggests that residual genetic diversity explains about 16 percent of the cross-country variation in residual log income per capita in 2000 ce, conditional on the covariates from the baseline regression model.
The coefficients associated with the diversity channel in column 5 imply that (i) increasing the diversity of the most homogenous country in the sample (Bolivia) by 1 percentage point would raise its income per capita in the year 2000 ce by
52 The inclusion of measures from the Polity IV dataset (Marshall and Jaggers 2005), reflecting the extent of democracy or the degree of constraints on the power of chief executives, as additional controls for institutional quality do not affect the results for genetic diversity. Moreover, because these measures enter insignificantly in the regression once social infrastructure has been controlled for, they are excluded from the analysis in Table 7.
53 Results (not shown) from estimating a similar specification that included ethnic fractionalization square as an additional explanatory variable did not reveal any discernible nonmonotonic relationship between ethnic fractional-ization and income per capita in 2000 ce. Importantly, the regression coefficients associated with genetic diversity, as well as the estimate for the optimal level of diversity, were unaffected.
54 As established by Table D11 in Section D of the online Appendix, the baseline results for diversity in the con-temporary analysis are qualitatively robust to (i) controls for region (rather than continent) fixed effects (column 1); (ii) dropping observations (columns 2–4) associated with sub-Saharan Africa and Latin America that, given their laggard development in comparison to other regions, along with their relatively higher and lower levels of genetic diversity respectively, may a priori be considered to be influential for generating the worldwide hump-shaped rela-tionship between diversity and development; and (iii) restricting the regression sample (column 5) to only countries in the potentially influential sub-Saharan Africa and Latin America regional clusters. These results demonstrate that the direct hump-shaped effect of genetic diversity on income per capita in the modern world is not simply a reflec-tion of worldwide cross-regional variations in diversity and economic development.
55 Plots depicting the partial regression lines associated with the first- and second-order effects of genetic homo-geneity on log income per capita in 2000 ce are presented in Figures C5(a) and C5(b) in Section C of the online Appendix.

39AshrAf And GAlor: diversity And developmentvol. 103 no. 1
41 percent; (ii) decreasing the diversity of the most diverse country in the sample (Ethiopia) by 1 percentage point would raise its income per capita by 21 percent; (iii) a 1 percentage point change in genetic diversity (in either direction) at the optimum level of 0.721 (that most closely resembles the diversity level of the United States) would lower income per capita by 1.9 percent; (iv) increasing the diversity of Bolivia to the level prevalent in the United States would increase Bolivia’s per capita income by a factor of 5.4, closing the income gap between the two countries from a ratio of 12:1 to 2.2:1; and (v) decreasing the diversity of Ethiopia to the level prevalent in the United States would increase Ethiopia’s per capita income by a factor of 1.7 and thus close the income gap between the two countries from a ratio of 47:1 to 27:1.
The regression in column 6 examines the robustness of the baseline results to accounting for the potentially confounding effect of the share of the population of European descent. The results indicate that the coefficients associated with genetic diversity remain highly statistically significant and reassuringly stable in magnitude, while the estimated optimal level of diversity is virtually unaffected.56
56 Since the share of the population of European descent is expected to be highly correlated with unobserved fixed effects associated with European countries as well as the Neo-Europes (i.e., the United States, Canada,
AGO
BDI
BEN
BFA
BWA
CAF
CIV
CMR
COG
DZA
EGY
ETH
GAB
GHA
GIN
GMB
GNB
KEN
LSO
MAR
MDG
MLI
MOZMRT
MWI
NAMNER
NGA
RWA
SDN
SEN
SLE
SOM
SWZ
TCD
TGO
TUN
TZA
UGA
ZAF
ZMB
ZWE
AUT
BEL
BGR
CHECYPDEU
DNK
ESPFIN
FRAGBR
GRC
HUNIRL
ITANLDNORPOL
PRT
ROMSWE
BGD
CHN
IDN
IND
IRN
IRQ
ISR
JOR
JPNKOR
LKA
MYS
OMN
PAK
PHL
SAU
SYR
THA
TUR
AUS
NZL
PNG
ARG
BOL
BRA
CAN
CHL
COL
CRI
DOM
ECU
GTM
GUY
HND
HTI
JAM
MEX
NIC
PAN
PER
PRY
SLV
TTO
URY
USA
VEN
13.5
14
14.5
15
15.5
16
0.2 0.25 0.3 0.35 0.4
Africa Europe Asia Oceania Americas
log
inco
me
per
capi
ta in
200
0 C
E
(Predicted) Ancestry-adjusted genetic homogeneity
Figure 5. Ancestry-Adjusted Genetic Diversity and Income per Capita in 2000 ce
Notes: This figure depicts the hump-shaped effect, estimated using a least squares quadratic fit, of ancestry-adjusted genetic homogeneity (i.e., one minus ancestry-adjusted genetic diversity) on log income per capita in 2000 ce in a 109-country sample, conditional on the ancestry-adjusted timing of the Neolithic Revolution, land productivity, a vector of institutional, cultural, and geographical determinants of development, and continent fixed effects. This figure is an augmented component-plus-residual plot rather than the typical added-variable plot of residuals against residuals. Specifically, the vertical axis represents fitted values (as predicted by ancestry-adjusted genetic homo-geneity and its square) of log income per capita plus the residuals from the full regression model. The horizontal axis, on the other hand, represents ancestry-adjusted genetic homogeneity rather than the residuals obtained from regressing homogeneity on the control variables in the model. This methodology permits the illustration of the over-all nonmonotonic effect of genetic homogeneity in one scatter plot.

40 THE AMERICAN ECONOMIC REVIEW fEbRuARy 2013
Moreover, as reported in column 8, even if one accounts for the contribution of human capital formation over the time period 1960–2000, the hump-shaped effect of genetic diversity on income per capita in 2000 ce remains highly statistically signifi-cant. Further, the estimated optimal level of diversity drops only moderately from 0.718 (as presented in column 7, which accounts for the smaller sample of 94 coun-tries for which data on education and all other variables are available) to 0.715.
Reassuringly, the highly significant and stable hump-shaped effect of genetic diversity on income per capita in 2000 ce is not an artifact of postcolonial migra-tion toward prosperous countries and the concomitant increase in ethnic diversity in these economies. Importantly, for the sample of countries whose national popula-tions are largely indigenous to their current geographical locations, the hump-shaped effect of genetic diversity on contemporary income per capita is highly significant and virtually identical to the one observed in the entire sample. Thus, since genetic diversity in these populations is the level of diversity predicted by migratory distance from East Africa, rather than the actual one, the potential concern about endogeneity between genetic diversity and income per capita in the modern world is alleviated.
In particular, as established in Table 8, the hump-shaped effect of genetic diver-sity remains highly significant and the optimal diversity estimate remains virtu-ally intact if the sample is restricted to (i) non-OECD economies (i.e., economies that were less attractive to migrants) in column 2; (ii) non–Neo-European coun-tries (i.e., excluding the United States, Canada, Australia, and New Zealand) in column 3; (iii) non–Latin American countries in column 4; (iv) non–sub-Saharan African countries in column 5; and (v) countries for which the indigenous popula-tion is larger than 97 percent of the entire population (i.e., under conditions that virtually eliminate the role of migration in contributing to diversity over the last 500 years) in column 6.57
B. The Costs and Benefits of Genetic Diversity
This section presents empirical evidence on some of the channels through which genetic diversity confers a hump-shaped effect on income per capita across coun-tries in the modern world. In line with the theory that diversity should be expected to confer costs on productivity, in the form of lower social capital, and benefits, in the form of more rapid knowledge creation, it establishes that countries with greater diversity are also characterized, on average, by a lower prevalence of interpersonal trust and a higher intensity of scientific knowledge creation. Specifically, exploit-ing cross-country variations in the degree of interpersonal trust and the annual average number of scientific articles per capita in the 1981–2000 time period, the analysis demonstrates that genetic diversity has a statistically significant negative
Australia, and New Zealand), Table D12 in Section D of the online Appendix repeats the analysis from columns 5 and 6 in Table 7 on different cuts of the cross-country sample, focusing primarily on countries where the share of Europeans in the population is not confoundingly close to one. Importantly, the findings therein suggest that the baseline results are robust to controlling for the share of Europeans in the population even when the sample is restricted to non-OECD countries (columns 3 and 4), non–Neo-European countries (columns 5 and 6), and non-European countries (columns 7 and 8).
57 This result reflects the well-known fact from the field of population genetics that the overwhelming major-ity of genetic diversity in human populations stems from the diversity within groups, as opposed to the diversity between groups (see, e.g., Barbujani et al. 1997).

41AshrAf And GAlor: diversity And developmentvol. 103 no. 1
relationship with the prevalence of trust but a positive one with scientific produc-tivity, conditional on a similar set of baseline controls employed in the preceding analysis of contemporary comparative development.58
58 Consistent with empirical findings in the existing literature, Table D14 in Section D of the online Appendix demonstrates that the prevalence of trust and the intensity of scientific knowledge creation both individually pos-sess statistically significant positive correlations with log income per capita in 2000 ce. These correlations hold both unconditionally (columns 1 and 4) and conditional on either the baseline set of controls from the historical analysis (columns 2 and 5) or a more comprehensive set of institutional, cultural, and geographical controls from the contemporary analysis (columns 3 and 6). For details on the definitions and data sources of the variables gaug-ing the prevalence of trust and the intensity of scientific knowledge creation, the reader is referred to Section F of the online Appendix.
Table 8—Addressing Endogenous Post-1500 Migrations
log income per capita in 2000 ce
Omit Countries withOmit Omit Omit sub-Saharan population at
Full OECD Neo-European Latin American African least 97 percentsample countries countries countries countries indigenous
(1) (2) (3) (4) (5) (6)
Predicted diversity 281.173*** 266.494*** 266.198*** 412.214*** 267.379*** 304.735** (ancestry adjusted) (70.459) (84.381) (72.371) (148.805) (103.063) (111.588)Predicted diversity square −195.010*** −185.223*** −185.113*** −287.058*** −185.698** −213.389** (ancestry adjusted) (49.764) (59.302) (50.915) (102.036) (74.434) (77.255)log Neolithic transition 0.417* 0.415 0.376 0.517* 0.085 0.448* timing (ancestry adjusted) (0.231) (0.283) (0.231) (0.298) (0.442) (0.254)log percentage of arable −0.189*** −0.238*** −0.205*** −0.189*** −0.215** −0.104 land (0.049) (0.060) (0.053) (0.050) (0.093) (0.061)log absolute latitude 0.003 −0.021 −0.029 −0.139 0.202 −0.074
(0.105) (0.119) (0.109) (0.126) (0.227) (0.130)Social infrastructure 1.867*** 1.373** 1.485*** 2.044*** 1.618*** 1.311*
(0.404) (0.575) (0.501) (0.545) (0.479) (0.716)Ethnic fractionalization −0.351 −0.450 −0.404 −0.752** 0.069 −0.044
(0.276) (0.375) (0.297) (0.348) (0.404) (0.412)Percentage of population at −0.504 −0.593 −0.585 −0.308 −0.434 −0.153 risk of contracting malaria (0.344) (0.376) (0.363) (0.486) (0.547) (0.434)Percentage of population −0.314 −0.199 −0.300 −0.520** −0.520 −0.339 living in tropical zones (0.199) (0.239) (0.215) (0.252) (0.332) (0.312)Mean distance to nearest −0.373** −0.389* −0.450** −0.494*** −0.725 −0.367* waterway (0.184) (0.222) (0.208) (0.186) (0.481) (0.201)
Optimal diversity 0.721*** 0.719*** 0.719*** 0.718*** 0.720*** 0.714***(0.016) (0.069) (0.014) (0.023) (0.154) (0.012)
Observations 109 83 105 87 71 37 R 2 0.90 0.82 0.89 0.93 0.87 0.98
Notes: This table addresses concerns regarding the endogeneity, arising from endogenous post-1500 population flows, of ancestry-adjusted genetic diversity to economic development by establishing that the significant hump-shaped effect of ancestry-adjusted genetic diversity on log income per capita in 2000 ce is robust to restricting the sample to (i) non-OECD economies (i.e., economies that were less attractive to migrants); (ii) non–Neo-European countries (i.e., excluding the United States, Canada, Australia, and New Zealand); (iii) non–Latin American coun-tries; (iv) non–sub-Saharan African countries; and (v) countries for which the indigenous population is larger than 97 percent of the entire population (i.e., under conditions that virtually eliminate the role of migration in contribut-ing to diversity), while controlling for the ancestry-adjusted timing of the Neolithic Revolution, land productivity, a vector of institutional, cultural, and geographical determinants of development, and continent fixed effects. All regressions include controls for major religion shares as well as OPEC, legal origin, and continent fixed effects. All regressions, with the exception of column 5, also include a fixed effect for sub-Saharan Africa. Bootstrap standard errors are reported in parentheses in columns 1–5. Heteroskedasticity-robust standard errors are reported in paren-theses in column 6.
*** Significant at the 1 percent level. ** Significant at the 5 percent level. * Significant at the 10 percent level.

42 THE AMERICAN ECONOMIC REVIEW fEbRuARy 2013
Using a sample of 58 countries for which trust data as well as data on all baseline controls employed by the analysis are available, column 1 of Table 9 shows that genetic diversity has a statistically significant negative effect on the prevalence of trust, accounting for the Neolithic transition timing and land productivity channels, as well as contemporary cultural, geographical, and institutional factors. The coef-ficient corresponding to the diversity channel indicates that a 1 percentage point increase in genetic diversity is associated with a 2 percentage point decrease in the prevalence of trust. Moreover, as demonstrated in column 2, this adverse impact of diversity on trust remains intact when the regression specification is augmented to account for the effect of average years of schooling in the population.
In contrast, using a sample of 93 countries for which data on scientific productiv-ity as well as data on the full set of baseline controls are available, column 4 shows
Table 9—Costs and Benefits of Diversity
Degree of interpersonal trust
Scientific articles per capita per year 1981–2000
Full Full Common Full Full Commonsample sample sample sample sample sample
(1) (2) (3) (4) (5) (6)
Predicted diversity −1.880** −2.226** −1.920** 2.484*** 1.860*** 3.023** (ancestry adjusted) (0.829) (0.862) (0.940) (0.566) (0.550) (1.222)log Neolithic transition 0.069 0.089 0.091 −0.085* −0.080* −0.189** timing (ancestry adjusted) (0.062) (0.063) (0.060) (0.047) (0.046) (0.085)log percentage of arable 0.004 −0.002 −0.014 0.008 0.005 −0.005 land (0.019) (0.018) (0.019) (0.016) (0.015) (0.037)log absolute latitude −0.003 0.003 −0.008 0.046* 0.055** 0.079
(0.027) (0.028) (0.031) (0.024) (0.023) (0.073)Social infrastructure 0.200*** 0.146* 0.149* 0.702*** 0.547*** 0.627***
(0.069) (0.079) (0.081) (0.109) (0.125) (0.197)Ethnic fractionalization 0.060 0.048 0.054 0.091 0.073 0.088
(0.065) (0.064) (0.067) (0.094) (0.093) (0.155)Percentage of population at −0.063 −0.033 −0.048 0.093* 0.135*** 0.026 risk of contracting malaria (0.090) (0.092) (0.100) (0.054) (0.048) (0.120)Percentage of population −0.074 −0.040 −0.046 0.020 0.051 0.113 living in tropical zones (0.053) (0.059) (0.062) (0.057) (0.055) (0.181)Mean distance to nearest 0.094 0.098 0.077 0.104*** 0.115*** 0.159** waterway (0.064) (0.060) (0.058) (0.038) (0.035) (0.067)Years of schooling 0.013 0.017* 0.031*** 0.021
(0.010) (0.010) (0.008) (0.023)
Observations 58 58 56 93 93 56 R 2 0.79 0.79 0.81 0.80 0.82 0.82
Notes: This table establishes that ancestry-adjusted genetic diversity has a significant negative effect on social capi-tal, as reflected by the prevalence of interpersonal trust among individual respondents of the World Values Survey in the 1981–2008 time period (World Values Survey 2009), and a significant positive effect on the intensity of scien-tific knowledge creation, as reflected by the annual average number of scientific articles per capita in the 1981–2000 time period (World Bank 2010), while controlling for the ancestry-adjusted timing of the Neolithic Revolution, land productivity, a vector of institutional, cultural, and geographical determinants of development, human capital formation, and continent fixed effects. All regressions include additional geographical controls for terrain charac-teristics as well as OPEC, legal origin, sub-Saharan Africa, and continent fixed effects. Heteroskedasticity-robust standard errors are reported in parentheses.
*** Significant at the 1 percent level. ** Significant at the 5 percent level. * Significant at the 10 percent level.

43AshrAf And GAlor: diversity And developmentvol. 103 no. 1
that genetic diversity has a statistically significant positive effect on the average annual number of published scientific articles per capita. Specifically, the coefficient of interest indicates that a 1 percentage point increase in genetic diversity is associ-ated with an increase in the annual number of scientific articles per capita of about 0.02, conditional on the influence of Neolithic transition timing, land productivity, and contemporary cultural, geographical, and institutional factors. In addition, as established by column 5, accounting for the effect of average years of schooling in the population does not qualitatively alter the beneficial impact of diversity on scientific productivity in the 1981–2000 time period.
Finally, columns 3 and 6 demonstrate that the conditional detrimental effect of genetic diversity on trust as well as its beneficial effect on scientific productivity both remain fully intact when the relevant regressions are performed on a common sample of countries, thereby lending further support to the theoretical assertion that diversity confers conflicting effects on productivity, generating inefficiencies in the production process while, at the same time, fostering the expansion of society’s production possibility frontier.
VII. Concluding Remarks
This paper argues that deep-rooted factors, determined tens of thousands of years ago, had a significant effect on the course of economic development from the dawn of human civilization to the contemporary era. It advances and empirically estab-lishes the hypothesis that, in the course of the exodus of Homo sapiens out of Africa, variation in migratory distance from the cradle of humankind to various settlements across the globe affected genetic diversity and has had a long-lasting effect on the pattern of comparative economic development that is not captured by geographical, institutional, and cultural factors.
The level of genetic diversity within a society is found to have a hump-shaped effect on development outcomes in the precolonial era, reflecting the trade-off between the beneficial and the detrimental effects of diversity on productivity. Moreover, the level of genetic diversity in each country today (as determined by the genetic diver-sities and genetic distances among its ancestral populations) has a nonmonotonic effect on income per capita in the modern world. While the low degree of diversity among Native American populations and the high degree of diversity among African populations have been detrimental forces in the development of these regions, the intermediate levels of genetic diversity prevalent among European and Asian popu-lations have been conducive for development.
Finally, this research contributes to the understanding of the role of European colonialism in reshaping comparative development across countries over the last 500 years. Specifically, the results suggest that the cross-country migrations that occurred during the course of European colonization significantly altered the genetic diversity and, hence, the composition of human capital in colonized countries. In particular, the level of diversity that existed in these locations during the precolonial era changed substantially, toward the optimal level for devel-opment, in the post-1500 time period. Moreover, consistent with documented patterns of European colonization, the change in diversity was larger in those locations where initial population density was lower. Thus, reversals of fortune

44 THE AMERICAN ECONOMIC REVIEW fEbRuARy 2013
in comparative development over the last 500 years can be traced to a larger change in the genetic diversity of countries that were less developed during the preindustrial era.
REFERENCES
Acemoglu, Daron, Simon Johnson, and James A. Robinson. 2005. “Institutions as a Fundamental Cause of Long-Run Growth.” In Handbook of Economic Growth. Vol 1A, edited by Philippe Aghion and Steven N. Durlauf, 385–472. Amsterdam: North-Holland.
Alesina, Alberto, Arnaud Devleeschauwer, William Easterly, Sergio Kurlat, and Romain Wacziarg. 2003. “Fractionalization.” Journal of Economic Growth 8 (2): 155–94.
Alesina, Alberto, and Eliana La Ferrara. 2005. “Ethnic Diversity and Economic Performance.” Jour-nal of Economic Literature 43 (3): 762–800.
Ashraf, Quamrul, and Oded Galor. 2011. “Dynamics and Stagnation in the Malthusian Epoch.” Ameri-can Economic Review 101 (5): 2003–41.
Ashraf, Quamrul, and Oded Galor. 2013. “The ‘Out of Africa’ Hypothesis, Human Genetic Diver-sity, and Comparative Economic Development: Dataset.” American Economic Review. http://dx.doi.org/10.1257/aer.103.1.1.
Ashraf, Quamrul, Oded Galor, and Ömer Özak. 2010. “Isolation and Development.” Journal of the European Economic Association 8 (2–3): 401–12.
Bairoch, Paul. 1988. Cities and Economic Development: From the Dawn of History to the Present. Translated by Christopher Braider. Chicago: University of Chicago Press.
Barbujani, Guido, Arianna Magagni, Eric Minch, and L. Luca Cavalli-Sforza. 1997. “An Appor-tionment of Human DNA Diversity.” Proceedings of the National Academy of Sciences 94 (9): 4516–19.
Barro, Robert J., and Rachel M. McCleary. 2003. “Religion and Economic Growth across Countries.” American Sociological Review 68 (5): 760–81.
Cann, Howard M., Claudia de Toma, Lucien Cazes, Marie-Fernande Legrand, Valerie Morel, Lau-rence Piouffre, Julia Bodmer et al. 2002. “A Human Genome Diversity Cell Line Panel.” Science 296 (5566): 261–62.
Cavalli-Sforza, L. Luca. 2005. “The Human Genome Diversity Project: Past, Present and Future.” Nature Reviews Genetics 6 (4): 333–40.
Central Intelligence Agency. 2006. The World Factbook 2006. https://www.cia.gov/library/publications/the-world-factbook/index.html (accessed March 18, 2007).
Conley, T. G. 1999. “GMM Estimation with Cross Sectional Dependence.” Journal of Econometrics 92 (1): 1–45.
Dalgaard, Carl-Johan, and Holger Strulik. 2010. “The Physiological Foundations of the Wealth of Nations.” University of Copenhagen Department of Economics Discussion Paper 10-05.
Desmet, Klaus, Michel Le Breton, Ignacio Ortuno-Ortin, and Shlomo Weber. 2011. “The Stability and Breakup of Nations: A Quantitative Analysis.” Journal of Economic Growth 16 (3): 183–213.
Diamond, Jared. 1997. Guns, Germs and Steel: The Fates of Human Societies. New York: W. W. Nor-ton and Co.
Diamond, Jared. 2002. “Evolution, Consequences and Future of Plant and Animal Domestication.” Nature 418 (6898): 700–07.
Easterly, William, and Ross Levine. 1997. “Africa’s Growth Tragedy: Policies and Ethnic Divisions.” Quarterly Journal of Economics 112 (4): 1203–50.
Gallup, John Luke, and Jeffrey D. Sachs. 2001. “The Economic Burden of Malaria.” American Journal of Tropical Medicine and Hygiene 64 (1–2): 85–96.
Gallup, John Luke, Jeffrey D. Sachs, and Andrew D. Mellinger. 1999. “Geography and Economic Development.” International Regional Science Review 22 (2): 179–232.
Galor, Oded. 2011. Unified Growth Theory. Princeton, NJ: Princeton University Press.Galor, Oded, and Stelios Michalopoulos. 2012. “Evolution and the Growth Process: Natural Selection
of Entrepreneurial Traits.” Journal of Economic Theory 147 (2): 759–80.Galor, Oded, and Omer Moav. 2002. “Natural Selection and the Origin of Economic Growth.” Quar-
terly Journal of Economics 117 (4): 1133–91.Galor, Oded, and Omer Moav. 2007. “The Neolithic Revolution and Contemporary Variations in Life
Expectancy.” Brown University Department of Economics Working Paper 2007-14.Glaeser, Edward L., Rafael La Porta, Florencio Lopez-de-Silanes, and Andrei Shleifer. 2004. “Do
Institutions Cause Growth?” Journal of Economic Growth 9 (3): 271–303.

45AshrAf And GAlor: diversity And developmentvol. 103 no. 1
Greif, Avner. 1993. “Contract Enforceability and Economic Institutions in Early Trade: The Maghribi Traders’ Coalition.” American Economic Review 83 (3): 525–48.
Griffiths, Anthony J. F., Jeffrey H. Miller, David T. Suzuki, Richard C. Lewontin, and William M. Gel-bart. 2000. An Introduction to Genetic Analysis. New York: W. H. Freeman and Co.
Guiso, Luigi, Paola Sapienza, and Luigi Zingales. 2009. “Cultural Biases in Economic Exchange?” Quarterly Journal of Economics 124 (3): 1095–131.
Hall, Robert E., and Charles I. Jones. 1999. “Why Do Some Countries Produce So Much More Output Per Worker Than Others?” Quarterly Journal of Economics 114 (1): 83–116.
Heston, Alan, Robert Summers, and Bettina Aten. 2006. “Penn World Table Version 6.2.” Center for International Comparisons of Production, Income and Prices at the University of Pennsylvania. https://pwt.sas.upenn.edu/php_site/pwt62/pwt62_form.php (accessed February 14, 2007).
Jones, Eric L. 1981. The European Miracle: Environments, Economies and Geopolitics in the History of Europe and Asia. Cambridge, UK: Cambridge University Press.
Lagerlöf, Nils-Petter. 2007. “Long-Run Trends in Human Body Mass.” Macroeconomic Dynamics 11 (3): 367–87.
Landes, David S. 1998. The Wealth and Poverty of Nations: Why Some are so Rich and Some so Poor. New York: W.W. Norton and Co.
La Porta, Rafael, Florencio Lopez-de-Silanes, Andrei Shleifer, and Robert W. Vishny. 1999. “The Quality of Government.” Journal of Law, Economics, and Organization 15 (1): 222–79.
Macaulay, Vincent, Catherine Hill, Alessandro Achilli, Chiara Rengo, Douglas Clarke, William Mee-han, James Blackburn et al. 2005. “Single, Rapid Coastal Settlement of Asia Revealed by Analysis of Complete Mitochondrial Genomes.” Science 308 (5724): 1034–36.
Manica, Andrea, William Amos, François Balloux, and Tsunehiko Hanihara. 2007. “The Effect of Ancient Population Bottlenecks on Human Phenotypic Variation.” Nature 448 (7151): 346–48.
Marshall, Monty G., and Keith Jaggers. 2005. “Polity IV Project: Political Regime Characteristics and Transitions, 1800–2004.” Center for Systemtic Peace, Vienna, VA. http:www.systemicpeace.org/polity/polity4.htm (accessed August 1, 2007).
McEvedy, Colin, and Richard Jones. 1978. Atlas of World Population History. New York: Penguin Books.Michalopoulos, Stelios. 2012. “The Origins of Ethnolinguistic Diversity.” American Economic Review
102 (4): 1508–39.Mokyr, Joel. 1990. The Lever of Riches: Technological Creativity and Economic Progress. New York:
Oxford University Press.Murphy, Kevin M., and Robert H. Topel. 1985. “Estimation and Inference in Two-Step Econometric
Models.” Journal of Business and Economic Statistics 3 (4): 370–79.North, Douglass C., and Robert P. Thomas. 1973. The Rise of the Western World: A New Economic
History. Cambridge, UK: Cambridge University Press.Olsson, Ola, and Douglas A. Hibbs. 2005. “Biogeography and Long-Run Economic Development.”
European Economic Review 49 (4): 909–38.Pagan, Adrian. 1984. “Econometric Issues in the Analysis of Regressions with Generated Regressors.”
International Economic Review 25 (1): 221–47.Pomeranz, Kenneth. 2000. The Great Divergence: China, Europe, and the Making of the Modern
World Economy. Princeton, NJ: Princeton University Press.Prugnolle, Franck, Andrea Manica, and Francois Balloux. 2005. “Geography Predicts Neutral Genetic
Diversity of Human Populations.” Current Biology 15 (5): R159–60.Putterman, Louis. 2008. “Agriculture, Diffusion and Development: Ripple Effects of the Neolithic
Revolution.” Economica 75 (300): 729–48.Putterman, Louis, and David N. Weil. 2010. “Post-1500 Population Flows and the Long-Run Deter-
minants of Economic Growth and Inequality.” Quarterly Journal of Economics 125 (4): 1627–82.Ramachandran, Sohini, Omkar Deshpande, Charles C. Roseman, Noah A. Rosenberg, Marcus W.
Feldman, and L. Luca Cavalli-Sforza. 2005. “Support from the Relationship of Genetic and Geo-graphic Distance in Human Populations for a Serial Founder Effect Originating in Africa.” Proceed-ings of the National Academy of Sciences 102 (44): 15942–47.
Ramankutty, Navin, Jonathan A. Foley, John Norman, and Kevin McSweeney. 2002. “The Global Dis-tribution of Cultivable Lands: Current Patterns and Sensitivity to Possible Climate Change.” Global Ecology and Biogeography 11 (5): 377–92.
Robinson, Gene E., and Robert E. Page. 1989. “The Genetic Basis of Division of Labor in an Insect Society.” In The Genetics of Social Evolution, edited by Michael D. Breed and Robert E. Page, Jr., 61–80. Boulder, CO: Westview Press.
Rodrik, Dani, Arvind Subramanian, and Francesco Trebbi. 2004. “Institutions Rule: The Primacy of Institutions over Geography and Integration in Economic Development.” Journal of Economic Growth 9 (2): 131–65.
46 THE AMERICAN ECONOMIC REVIEW fEbRuARy 2013
Sokoloff, Kenneth L., and Stanley L. Engerman. 2000. “Institutions, Factor Endowments, and Paths of Development in the New World.” Journal of Economic Perspectives 14 (3): 217–32.
Spolaore, Enrico, and Romain Wacziarg. 2009. “The Diffusion of Development.” Quarterly Journal of Economics 124 (2): 469–529.
Stringer, Chris B., and Peter Andrews. 1988. “Genetic and Fossil Evidence for the Origin of Modern Humans.” Science 239 (4845): 1263–68.
Tabellini, Guido. 2008. “Institutions and Culture: Presidential Address.” Journal of the European Eco-nomic Association 6 (2–3): 255–94.
Wang, Sijia, Cecil M. Lewis Jr., Mattias Jakobsson, Sohini Ramachandran, Nicolas Ray, Gabriel Bedoya, Winston Rojas et al. 2007. “Genetic Variation and Population Structure in Native Ameri-cans.” PLoS Genetics 3 (11): 2049–67.
Weber, Max. 1930. The Protestant Ethic and the Spirit of Capitalism. Translated by Talcott Parsons and Anthony Giddens. London: Allen and Unwin.
Wooldridge, Jeffrey M. 2010. Econometric Analysis of Cross Section and Panel Data. second ed. Cam-bridge, MA: MIT Press.
World Bank. 2006. The World Development Indicators 2006. World Bank, Washington, DC. http://data.worldbank.org/data-catalog/world-development-indicators (accessed February 15, 2007).
World Bank. 2010. The World Development Indicators 2010. World Bank, Washington, DC. http://data.worldbank.org/data-catalog/world-development-indicators (accessed January 10, 2011).
World Values Survey. 2009. “World Values Survey 1981–2008 Official Aggregate, v.20090914.” World Values Survey Association, Stockholm. http://www.wvsevsdb.com/wvs/WVSData.jsp (accessed August 24, 2010).

This article has been cited by:
1. Marcella Alsan. 2015. The Effect of the TseTse Fly on African Development. American EconomicReview 105:1, 382-410. [Abstract] [View PDF article] [PDF with links]
2. Areendam Chanda, C. Justin Cook, Louis Putterman. 2014. Persistence of Fortune: Accountingfor Population Movements, There Was No Post-Columbian Reversal. American Economic Journal:Macroeconomics 6:3, 1-28. [Abstract] [View PDF article] [PDF with links]
3. Enrico Spolaore,, Romain Wacziarg. 2013. How Deep Are the Roots of Economic Development?.Journal of Economic Literature 51:2, 325-369. [Abstract] [View PDF article] [PDF with links]
4. Quamrul Ashraf,, Oded Galor. 2013. Genetic Diversity and the Origins of Cultural Fragmentation.American Economic Review 103:3, 528-533. [Abstract] [View PDF article] [PDF with links]