Embed Size (px)
Citation preview

The Opportunities for Distributed Renewable Energy in Kentucky
June 18, 2012
Rory McIlmoil Nathan Askins Jason Clingerman Downstream Strategies, LLC 295 High Street, Suite 3 Morgantown, WV 26505 304.292.2450

ii | P a g e
The Opportunities for Distributed Renewable Energy in Kentucky
Rory McIlmoil, Nathan Askins, Jason Clingerman
ABOUT THE PROJECT TEAM
Rory McIlmoil, M.A., Project Manager, Energy Program, Downstream Strategies. Mr. McIlmoil has a background in environmental science and policy with a focus on the analysis and presentation of scientific and economic data relevant to environmental policy and energy development. He has five years of experience working on energy and economic policy issues in Central Appalachia.
Nathan Askins, B.A., Staff Environmental Analyst, Downstream Strategies. Mr. Askins is experienced in environmental management, field-based data collection, geographic information systems, and energy savings research and analysis. Askins has a background in environmental protection, environmental microbiology, and sustainable design.
Jason Clingerman, M.S., Project Aquatic Ecologist, Downstream Strategies. Mr. Clingerman is experienced in natural resources science and management, specifically in aquatic ecology and water monitoring. He also has six years of experience utilizing geographic information systems for natural resource applications.
ABOUT THE PROJECT
This project aims to inform the efforts of the Mountain Association for Community Economic Development (MACED) and the Kentucky Sustainable Energy Alliance (KYSEA). These organizations are supporting passage of the Clean Energy Opportunity Act (House Bill 167, 2012), which aims to “Promote energy independence and security by diversifying the portfolio of energy sources used for generating electricity for Kentucky electric customers; stabilize long-term energy prices and encourage economic growth; and create high-quality jobs, training, business, and investment opportunities in the Kentucky energy sector.” The legislation would require Kentucky’s regulated utilities to provide 12.5% of their retail sales of electricity from renewable energy resources, and to achieve a 10.25% reduction in energy consumption through various energy efficiency initiatives. This report provides information and analysis illustrating the opportunities for developing distributed forms of renewable energy in Kentucky and the potential for such technologies to contribute to achieving and even exceeding the target requirements of the Clean Energy Opportunity Act.
ACKNOWLEDGEMENTS
We would first like to acknowledge Blue Moon Fund for providing the funding for this report, MACED for their support in promoting and crafting the scope of the report, KYSEA for participating in the visioning process, and the West Virginia Center for Budget and Policy for serving as the fiscal agent.
We would like to specifically recognize the support received from Kristin Tracz and Jason Bailey of MACED, whose patience and encouragement have been greatly appreciated. We also appreciate the resources and information on distributed energy systems provided by Thomas Casten of Recycled Energy Development.
Representatives of state and federal agencies were also helpful in providing vital information and assistance for this report. These include the Kentucky Department of Energy Development and Independence, the Kentucky Division of Waste Management, and the United States Environmental Protection Agency.
Finally, we greatly appreciate the support of everyone who contributed to this effort, and who are committed to promoting sustainable energy and economic diversification in Appalachia.

iii | P a g e
TABLE OF CONTENTS
EXECUTIVE SUMMARY ......................................................................................................................................... VII
1. INTRODUCTION ............................................................................................................................................. 1
1.1 DEFINING DISTRIBUTED AND CENTRALIZED ENERGY GENERATION ................................................................................. 1 1.2 THE GROWTH IN DISTRIBUTED ENERGY GENERATION IN THE UNITED STATES .................................................................. 2 1.3 WHY KENTUCKY SHOULD SUPPORT THE EXPANSION OF DISTRIBUTED ENERGY GENERATION ............................................... 3 1.4 BARRIERS TO DISTRIBUTED RENEWABLE ENERGY ....................................................................................................... 4 1.5 PURPOSE AND STRUCTURE OF THIS REPORT ............................................................................................................. 5
2. THE CASE FOR DISTRIBUTED RENEWABLE ENERGY ........................................................................................ 6
2.1 KENTUCKY’S ELECTRICITY GENERATING INFRASTRUCTURE IS IDEAL FOR DISTRIBUTED ENERGY ............................................. 6 2.2 ENERGY COSTS AND EXPENDITURES IN KENTUCKY ARE RISING FAST ............................................................................... 8 2.3 DISTRIBUTED RENEWABLE ENERGY CAN PROVIDE SIGNIFICANT ECONOMIC AND ENVIRONMENTAL BENEFITS ........................ 11
3. OPPORTUNITIES FOR DEVELOPING DISTRIBUTED ENERGY IN KENTUCKY ..................................................... 19
3.1 SOLAR PHOTOVOLTAIC ELECTRICITY GENERATION .................................................................................................... 21 3.2 SOLAR HEATING AND COOLING ............................................................................................................................ 29 3.3 SMALL-SCALE AND COMMUNITY-OWNED WIND ...................................................................................................... 32 3.4 FOREST BIOMASS ............................................................................................................................................. 39 3.5 COMBINED HEAT AND POWER............................................................................................................................. 45 3.6 LANDFILL GAS- TO-ENERGY ................................................................................................................................. 53 3.7 SMALL AND LOW-POWER HYDROELECTRIC ............................................................................................................. 59 3.8 GEOTHERMAL HEATING ..................................................................................................................................... 66
4. EXISTING POLICIES AFFECTING DISTRIBUTED RENEWABLE ENERGY IN KENTUCKY ....................................... 68
4.1 NET METERING ................................................................................................................................................ 68 4.2 INTERCONNECTION STANDARDS .......................................................................................................................... 69 4.3 FINANCIAL INCENTIVES PROVIDED BY THE COMMONWEALTH .................................................................................... 70 4.4 TENNESSEE VALLEY AUTHORITY .......................................................................................................................... 71 4.5 CONCLUSION................................................................................................................................................... 72
5. POLICY OPTIONS FOR KENTUCKY ................................................................................................................. 73
5.1 RENEWABLE ENERGY PORTFOLIO STANDARD WITH DISTRIBUTED GENERATION REQUIREMENT .......................................... 73 5.2 IMPLEMENT A FEED-IN TARIFF ............................................................................................................................. 77 5.3 STRENGTHEN THE STATE NET METERING LAW ......................................................................................................... 78 5.4 UPGRADE THE STATE’S INTERCONNECTION STANDARDS ............................................................................................ 78 5.5 PROVIDE MORE EFFECTIVE FINANCIAL INCENTIVES ................................................................................................... 79 5.6 IMPLEMENT POLICIES THAT MAXIMIZE THE SUSTAINABILITY AND ECONOMIC BENEFITS OF DISTRIBUTED RENEWABLE ENERGY .. 81
6. CONCLUSIONS AND RECOMMENDATIONS FOR OVERCOMING BARRIERS TO DISTRIBUTED GENERATION ... 82
6.1 THE CASE FOR DISTRIBUTED RENEWABLE ENERGY .................................................................................................... 82 6.2 OPPORTUNITIES FOR DISTRIBUTED RENEWABLE ENERGY DEVELOPMENT IN KENTUCKY .................................................... 83 6.3 RECOMMENDATIONS ........................................................................................................................................ 84
REFERENCES ......................................................................................................................................................... 87

iv | P a g e
TABLE OF TABLES
Table 1: Installed capacity of selected distributed energy technologies in the United States ............................. 3 Table 2: Distributed renewable energy development and undeveloped potential in Kentucky ........................ 20 Table 3: Average job creation per megawatt of generating capacity, by energy source ................................... 23 Table 4: Solar irradiance, photovoltaic capacity, and supporting policies and incentives in select states ........ 25 Table 5: Estimated potential for solar photovoltaic capacity and electrical generation .................................... 27 Table 6: Installations of solar energy systems in the US, by technology, historically and for 2010 ................... 29 Table 7: Estimated cost and payback period for residential hot water systems ................................................ 30 Table 8: Growth trends for the small distributed wind market in the US, 2001-2010 ....................................... 32 Table 9: Community wind projects in Minnesota, 2010 ..................................................................................... 38 Table 10: Estimated logging residues and potential distributed generation from forest biomass .................... 42 Table 11: Combined heat and power plants in Kentucky through 2009 ............................................................ 49 Table 12: State rankings for percent of total commercial and industrial electricity consumption from combined heat and power, 2009 ........................................................................................................................ 50 Table 13: Current and potential electricity generation from combined heat and power in Kentucky .............. 51 Table 14: Existing and potential landfill gas-to-energy development and production in Kentucky, 2010 ......... 55 Table 15: General characteristics of small and low-power hydroelectric systems ............................................. 60 Table 16: Existing and potential small and low-power hydroelectric generating capacity in the US (MWa) ..... 61 Table 17: Existing and potential hydropower from small and low-power hydro resources in Kentucky and other Appalachian states .................................................................................................................................... 64 Table 18: Summary of existing and potential distributed renewable energy in Kentucky, by technology ........ 83
TABLE OF FIGURES
Figure 1: Electric service areas by utility provider in Kentucky, 2011 .................................................................. 7 Figure 2: Percent of electricity customers and sales serviced by Kentucky utilities, by ownership, 2009 ........... 8 Figure 3: Electricity generation by energy resource, 2009 ................................................................................... 9 Figure 4: Delivered price of coal to Kentucky’s electric utilities, and average price of electricity, 1990-2009 .. 10 Figure 5: Average residential monthly electricity bill, by state, 2010 ................................................................ 11 Figure 6: Annual and cumulative solar photovoltaic capacity growth in the US, 1998-2010 ............................. 21 Figure 7: Installed costs for solar photovoltaic systems in the US, by system size, 1998-2010 ......................... 22 Figure 8: Solar photovoltaic installations and existence of supporting policies in Appalachian states.............. 26 Figure 9: Distributed small wind power capacity in select Appalachian states through 2010 ........................... 37 Figure 10: Estimated logging residues in Kentucky, by county, average for 2009 and 2010 ............................. 43 Figure 11: Megawatts of installed combined heat and power nameplate capacity in the US, 2009 ................. 46 Figure 12: Operational landfill gas-to-energy projects and “Candidate” landfills in Kentucky, 2011 ................ 57 Figure 13: Power capacity of hydroelectric plants in the US, by plant class (mean annual MW, 2006) ............ 59 Figure 14: Policy design and targets for renewable energy portfolio standards in the US in 2011 ................... 75

v | P a g e
ABBREVIATIONS
AWEA American Wind Energy Association
BAU business-as-usual
C&I commercial and industrial
C-BED Community-Based Energy Development
CEOA Clean Energy Opportunity Act
CHP combined heat and power
CSI California Solar Initiative
DEDI Kentucky Department of Energy Development and Independence
EIA Energy Information Administration
EKPC East Kentucky Power Cooperative
EPRI Electric Power Research Institute
FIT feed-in tariff
GHP geothermal heat pump
HB House Bill
IEEE Institute of Electrical and Electronics Engineers
INEEL Idaho National Engineering and Environmental Laboratory
IOU investor-owned utility
IPP independent power producer
IREC Interstate Renewable Energy Council
ITC investment tax credit
KU Kentucky Utilities
kWh kilowatt-hour
kWt thermal kilowatt
KYSEA Kentucky Sustainable Energy Alliance
LFG landfill gas
LFGTE landfill gas-to-energy
LG&E Louisville Gas and Electric
LIHI Low Impact Hydropower Institute
MACED Mountain Association for Community Economic Development
Mcf thousand cubic feet
mmBtu million British thermal units
MSW municipal solid waste
MW megawatt
MWa annual mean power in megawatts
MWe megawatt-equivalent
MWh megawatt-hour
MWt thermal megawatt
NREL National Renewable Energy Laboratory
PBF public benefit fund
PBI performance-based incentive
PPA power purchase agreement
PSC Kentucky Public Service Commission
PTC production tax credit
PV photovoltaic
REC renewable energy credit

vi | P a g e
RECC rural electric cooperative company
REPS renewable and efficiency portfolio standard
RPS renewable (energy) portfolio standard
SACE Southern Alliance for Clean Energy
SREC solar renewable energy credit
TVA Tennessee Valley Authority
US United States
USDOE United States Department of Energy
USEPA United States Environmental Protection Agency
USFS United States Forest Service
USGAO United States Government Accountability Office
W watt
COVER PHOTOS
From top to bottom: Mountain Association for Community Economic Development, “Solar photovoltaic installation on MACED office in Berea, Kentucky;” Lock 7 Hydro Partners, LLC, “Mother Ann Lee Hydroelectric Station, Lock and Dam 7 on the Kentucky River, Kentucky;” Dogwood Alliance (www.dogwoodalliance.org), “White Marsh Clearcut, outside of the Green Swamp, North Carolina;” Leonard, Todd, “Maysville-Mason County landfill (2009).”
SUGGESTED REFERENCE
McIlmoil, Rory; Askins, Nathan and Jason Clingerman (2012) The opportunities for distributed renewable energy in Kentucky. Downstream Strategies. Jun 18.
vii | P a g e
EXECUTIVE SUMMARY
This report examines the potential for distributed renewable energy development to help diversify Kentucky’s energy portfolio, stabilize long-term energy prices, diversify local and state economies, and reduce the social and environmental impacts of energy production. It describes the benefits of distributed renewable energy generation compared to centralized fossil fuel-based generation, analyzes the opportunities for developing distributed renewable energy in Kentucky, reviews Kentucky’s existing policies affecting distributed renewable energy, and details various policy options that Kentucky could implement to expand the development of distributed renewable energy and ensure that Kentucky reaps the benefits of growing regional and national markets.
In 2008, Kentucky Governor Steve Beshear released a seven-point energy plan titled “Intelligent Energy Choices for Kentucky’s Future.” This plan cited the need to “improve the quality of life for all Kentuckians by simultaneously creating efficient energy solutions and strategies, protecting the environment, and creating a base for strong economic growth.” While the plan was never implemented, it cited Kentucky’s need to reduce greenhouse gas emissions and diversify the state’s energy portfolio through the development of renewable energy. The plan recognized that Kentucky has sufficient supplies of renewable resources to contribute to a clean energy future; however, it asserted that Kentucky lacks significant utility-scale renewable resources and that the majority of new renewable systems will be widely distributed and relatively small in scale. Kentucky’s ability to develop a substantial amount of renewable energy will therefore require developing distributed forms of renewable energy generation.
For the purposes of this report, distributed energy generation is defined as the generation of electricity and heat, or the capture and reuse of waste heat, at or near the point of consumption. Distributed generation contrasts with the historically dominant form of electrical and heat generation in the United States—centralized generation—which is characterized by remotely located, large-scale power plants transmitting electricity or natural gas through transmission or distribution lines over long distances to a large number of consumers. Until recently, centralized generation has generally referred to large coal, nuclear, natural gas, and hydroelectric power plants; however, renewable energy technologies such as concentrated solar thermal generators and industrial wind farms that feed electricity directly into the transmission system for consumption elsewhere are also considered centralized energy. Conversely, fossil fuels can be and in fact are used as sources of distributed generation. However, the focus of this report is on distributed energy generated from renewable sources.
Based upon a review and analysis of previous research, this report finds that there are sufficient renewable energy resources in Kentucky to provide the annual equivalent of 39 million megawatts of electricity from small-scale distributed energy technologies alone, which could account for 34% of the state’s electricity generation in 2025.
The technologies and related resources examined for this report include solar photovoltaic electricity, solar heating and cooling, small and community-owned wind power, forest biomass, combined heat and power, landfill gas-to-energy, small and low-power hydroelectric, and geothermal heating. Table ES-1 presents the results of our findings for each technology and/or resource.

viii | P a g e
Table ES-1: Distributed renewable energy development and undeveloped potential in Kentucky
Resource/technology
Developed capacity (MWe)
Undeveloped (MWe)
Total potential (MWe)
Generating potential
(million MWh) Percent 2025
generation
Solar photovoltaic 0 5,639 5,639 7.4 6%
Solar hot water n/a n/a 1,120 9.8 9%
Small/community wind 0 61 61 0.1 0%
Forest biomass (logging) 5 449 454 3.4 3%
Combined heat and power 122 2,878 3,000 13.3 12%
Landfill gas-to-energy 17 43 60 0.5 0%
Small/low-power hydro 777 273 1,050 7.9 7%
Geothermal heating n/a n/a n/a n/a n/a
Totals 921 10,463 11,384 39.0 34%
Note: MWe represents “megawatt-equivalent.” More information is provided in the report.
Developing any significant amount of distributed renewable energy requires aggressive state investments and the establishment of new, targeted policies. There are numerous reasons for Kentucky to implement such policies and transition away from centralized fossil fuel-based energy production toward a greater reliance on small distributed renewable energy generation.
Kentucky’s electricity infrastructure is ideal for distributed energy. The high number of publicly-owned rural electric cooperative companies and municipally-owned utilities allow for the possibility of more public participation in and greater local control over energy development decisions. The electricity generated is also more likely to be consumed locally because cooperatives and municipal utilities distribute electricity to local customers. It is also more likely to be customer-owned or influenced because members can participate in the energy decisions of local entities more than they can investor-owned utilities. These conditions render the development, distribution, and consumption of distributed energy more feasible than if the state’s electrical infrastructure were more centralized and dominated by a small number of investor-owned utilities.
Energy costs are rising in Kentucky largely due to a heavy reliance on coal. Prior to 2000, states that relied heavily on coal for electricity generation experienced some of the lowest energy costs in the nation. However, since 2005, states dependent on coal have experienced the highest electricity price increases. Kentucky is no different. In 2009, Kentucky ranked sixth in the use of coal for electricity in the United States, with coal accounting for 93% of total generation. Kentucky’s electricity prices have risen by an annual average of 8% since 2005, largely as a result of a heavy reliance on coal for electricity generation (see Figure ES-1). While Kentucky still had the fourth-lowest electricity price as of 2010, Kentucky residents paid a higher average monthly electric bill than 29 other states. Due to continued price increases for coal and new cost pressures such as regulatory compliance costs and increased global demand for Appalachian coal, a continued reliance on coal will only lock Kentucky into additional cost increases in the coming decades.
Distributed renewable energy has the potential to provide greater economic benefits for Kentucky compared to energy generated by fossil fuels. The economic benefits of distributed renewable energy as compared to centralized generation from fossil fuels are substantial. For instance, developing each of the technologies examined in this report generates more total jobs per unit of generating capacity than both coal and natural gas. As an example, developing new solar photovoltaic generating capacity creates twice as many total jobs as coal-fired electricity generation. Additionally, local ownership of distributed generating systems as much as triples the economic impact of energy development in terms of both jobs and tax revenues. The cost of energy resulting from developing distributed technologies is also on par with the cost of energy generated by traditional fossil fuels, or will soon due to efficiency advancements and rapid declines in costs.

ix | P a g e
Figure ES-1: Delivered price of coal to Kentucky’s electric utilities, and average price of electricity, 1990-2009
Distributed renewable energy provides numerous additional benefits for Kentucky’s utilities and electricity customers. In addition to the direct economic benefits, other potential benefits of distributed renewables include:
the replacement of inefficient and occasionally unreliable centralized energy generation; the addition of a significant amount of baseload power during times of peak load; a reduction in the total value of subsidies required per unit of energy produced; greater security against fossil fuel depletion and volatile energy prices; reduced costs for new centralized generation, infrastructure, and pollution control; more efficient generation, transmission, and distribution of electricity; increased energy security and grid security; more rapid deployment than centralized generation; diversification of Kentucky’s energy portfolio; growth and diversification of state and local economies; and significant environmental and public health improvements.
Additionally, Kentucky’s financial support for distributed renewable energy is substantially less than the level of support provided in other states, including many in Appalachia. Besides a few tax incentives, there are no other statewide policies supporting the development of renewable energy. As a result, other states are reaping the economic and environmental benefits, while Kentucky lags behind.
0
1
2
3
4
5
6
7
0
50
100
150
200
250
Price
of e
lectricity (ce
nts pe
r kWh
)
De
live
red
pri
ce o
f co
al (c
en
ts p
er
mil
lio
n B
tu)
Year
Delivered price of coal
Average price of electricity

x | P a g e
Using solar photovoltaic electricity as an example, Kentucky’s solar resource is roughly equal to that of other Appalachian states, many of which have made great strides in installing distributed solar photovoltaics in recent years. Through 2010, Pennsylvania, Ohio, and Maryland had developed approximately 55, 21, and 11 megawatts of solar, respectively. By comparison, total installed capacity in Kentucky was 0.2 megawatts. The primary reason for this difference is that the other three states have enacted mandatory renewable energy portfolio standards and created solar renewable energy credit markets by requiring a certain percentage of electricity generation to come from solar photovoltaic installations. Tennessee does not have a portfolio standard but has strong utility incentive programs provided through the Tennessee Valley Authority.
Figure ES-2 illustrates the significant difference in the development of solar photovoltaic capacity in the coal-producing states of Kentucky, Maryland, Ohio, Pennsylvania, Tennessee, Virginia, and West Virginia.
Figure ES-2: Solar photovoltaic installations and supporting policies in Appalachian states

xi | P a g e
To provide long-term support for distributed renewable energy, Kentucky should look beyond tax incentives while improving the existing policies governing interconnection and net metering.
There are many policy options available to Kentucky that would bolster the development of distributed renewable energy. This report details some of the more effective policy options available, each of which has been implemented in other states. As such, they represent reasonable options for Kentucky and can be implemented individually or as a complementary policy package. Together, these policies would provide strong and comprehensive support for distributed renewable energy development.
Implement a renewable energy portfolio standard with a distributed generation “set-aside” requirement. Kentucky is one of only 13 states in the United States without either a mandatory or voluntary renewable energy portfolio standard. However, portfolio standards are one of the stronger policy options for supporting the development of renewable energy. Kentucky should adopt a renewable energy portfolio standard with targets that reflect the amount of resources that are available and that incentivize the use of small-scale distributed technologies. To achieve that goal, the state should include a set-aside in the standard that requires a portion of the energy to be developed using distributed technologies.
The Clean Energy Opportunity Act (House Bill 167), introduced to the Kentucky Legislature in 2012 but not adopted, would have established a portfolio standard requiring that 12.5% of each electric utility’s total retail sales of electricity come from renewable energy sources by 2022. The legislation also included a solar set-aside requirement of 1%. Existing research and the findings of this report suggest that the Act called for a reasonable, if not conservative, target for Kentucky and it is recommended that the legislation be adopted in 2013, but with the scope expanded to include a set-aside for all distributed renewable energy technologies.
Implement a feed-in-tariff. A feed-in-tariff is an energy supply policy that offers a payment guarantee to renewable energy developers for the electricity they produce. Feed-in-tariffs can support all renewable technologies, but are often aimed more directly at supporting distributed energy systems. Well-designed policies offer a cost-effective method for fostering rapid development of renewable energy, thereby benefiting ratepayers, developers, and society. The Clean Energy Opportunity Act would have established a feed-in-tariff for Kentucky. It required the Public Service Commission to “develop guidelines for a tariff to be filed by each retail electric supplier establishing the interconnection procedures and rate at which an eligible electric generating facility will be compensated for renewable electricity generated and fed into the distribution system or transmission grid of that retail electric supplier.” In combination with a renewable energy portfolio standard with a solar or distributed energy set-aside, a feed-in-tariff would help ensure that Kentucky can meet the renewable energy requirements set by the Clean Energy Opportunity Act while supporting local economic development and the diversification of the state’s energy portfolio.
Strengthen the state’s net metering law. Net metering laws are among the most important policy drivers for distributed renewable energy systems because they set individual and aggregate capacity limits and enable system owners to recover some of their investment through savings on their electricity bill. Kentucky’s current net metering law caps the capacity of individual systems at 30 kilowatts and the aggregate capacity at 1% of a utility’s peak load. These limits restrict the development of larger distributed energy systems as well as the overall growth of distributed renewable energy. The effectiveness of Kentucky’s net metering law could be improved by significantly increasing both the individual and aggregate capacity limits.
House Bill 187, also introduced in 2012, would have revised the current law by expanding the capacity limit for individual distributed energy systems to 2 megawatts, bringing Kentucky’s capacity limit in line with that of other states. The bill did not address the aggregate capacity limit. However, given that the current net metering law severely constrains distributed energy development, it is recommended that the Kentucky Legislature adopt the proposed revision in 2013 and consider increasing the aggregate capacity limit.

xii | P a g e
Upgrade the state’s interconnection standards. Kentucky’s interconnection standards include requirements that restrict the connection of distributed energy systems to the grid. However, interconnection can be a critical component of a successful distributed energy project, as it enables a facility to purchase supplemental power from the grid as needed, sell excess power to the utility, and maintain grid frequency and voltage stability. To reduce uncertainty and take advantage of the benefits of distributed generation—without compromising grid safety or reliability—Kentucky should adopt and implement standardized interconnection rules as proposed by the United States Environmental Protection Agency and adopted by other states.
Standardized rules would: establish clear and uniform processes and technical requirements for interconnection; ensure consistent costs of interconnection that are appropriate given the size, nature, and scope of a particular project; provide a level of certainty about the time and costs involved in the application process and the technical requirements for interconnection; and ensure that project interconnection meets the safety and reliability needs of both the energy end-user and the utility.
Provide more effective financial incentives. To provide long-term support for distributed renewable energy and guarantee that the economic and environmental benefits will continue to grow, Kentucky should strengthen and expand its financial incentives for distributed renewable energy and combine them with other policy programs such as a renewable energy portfolio standard and feed-in-tariff. There are many types of model incentives available, including investment tax credits and production tax credits, sales tax and property tax exemptions, policies that allow for third-party ownership and investment, targeted performance-based incentives, cash grants, rebates, and low-interest loans. A public benefits fund could also be established in order to finance grants, rebates, and loan programs that support renewable energy investments. Each of these incentives would reduce up-front costs associated with distributed renewable energy development or reward the value of the energy produced over time.
Implement policies that maximize the sustainability and economic benefits of distributed renewable energy. Kentucky should establish policies aimed at maximizing the sustainability (minimizing the environmental impact) and/or the economic benefits of distributed renewable energy.
≈≈≈
In sum, Kentucky has significant renewable energy resources, many of which are suitable for distributed energy technologies. With the appropriate mix of new policies and incentives, this sector has the potential to expand rapidly and to provide a variety of economic and environmental benefits to the state.

1 | P a g e
1. INTRODUCTION
In 2008, Kentucky Governor Steve Beshear released a seven-point energy plan titled “Intelligent Energy Choices for Kentucky’s Future.” This plan cited the need to “improve the quality of life for all Kentuckians by simultaneously creating efficient energy solutions and strategies, protecting the environment, and creating a base for strong economic growth” (Beshear, 2008, p. ii). It aimed to use the state’s energy resources in an environmentally sound manner and help Kentucky achieve energy independence. To this end, the plan called for the establishment of a renewable and efficiency portfolio standard (REPS), requiring that 25% of Kentucky’s energy needs in 2025 be provided through energy efficiency, conservation, and renewable energy.
While the plan was never implemented—Governor Beshear never introduced a REPS bill—it cited Kentucky’s need to reduce greenhouse gas emissions and diversify the state’s energy portfolio. In fact, it called for the development of 1,000 megawatts (MW) of renewable energy. The plan recognized that Kentucky has sufficient supplies of renewable resources to contribute to a clean energy future; however, it asserted that Kentucky lacks significant utility-scale renewable resources and that the majority of new renewable systems will be widely distributed and relatively small in scale (Beshear, 2008).
Kentucky’s ability to develop a substantial amount of renewable energy will therefore require developing distributed forms of renewable energy generation. As originally recognized in the plan, doing so will require aggressive state investments in renewable energy. It will also require that the state establish new, targeted policies specifically aimed at supporting distributed renewable energy development.
As an example of such a policy, House Bill 167 (HB 167)—the Clean Energy Opportunity Act (CEOA)—was introduced to the Kentucky Legislature during the 2012 session by Representatives Mary Lou Marzian and seven co-sponsors. The bill, which was not passed by the Legislature, would have required that 12.5% of Kentucky’s retail electricity sales come from renewable energy resources by 2022, with a requirement that 1% of those sales be provided by solar energy technologies. The CEOA, if enacted in the future, would serve as a strong policy support for the development of both distributed and centralized renewable energy.
Based on the findings of this report, the targets called for in the CEOA are reasonable and highly achievable for Kentucky, and would, as stated in the legislation:
promote energy independence and security by diversifying the portfolio of energy sources used for generating electricity for Kentucky electric customers; stabilize long-term energy prices and encourage economic growth; and create high-quality jobs, training, business, and investment opportunities in the Kentucky energy sector (Kentucky Legislative Research Commission, 2012a).
1.1 Defining distributed and centralized energy generation
Simply put, distributed energy is the opposite of centralized energy generation, which currently stands as the dominant structure of energy generation in Kentucky. Distributed energy is defined in many ways, most often in relation to electricity generation. One definition of a distributed energy system is a small, modular power-generating technology placed at or near the point of energy consumption (Alanne and Saari, 2006). Another definition is “geographically disbursed” electricity generation that “connects to the existing (distribution) electric grid infrastructure” (Farrell, 2011a, p. i). Other research states that “in the ultimate case, distributed energy generation means that single buildings can be completely self-supporting in terms of [energy]” (Alanne and Saari, 2006, p. 540).

2 | P a g e
These definitions capture what distributed generation is in terms of electricity generation, but fail to adequately include co-generation—or rather, the recycling of heat energy from industrial processes or power plants to generate electricity and useful heat simultaneously (Casten and Downes, 2005). Therefore, for the purpose of this report, we define distributed energy generation as the generation of electricity or heat, or the capture and reuse of waste heat, at or near the point of consumption.1
Distributed generation contrasts with the historically dominant form of electrical and heat generation in the United States (US)—centralized generation—which is characterized by remotely located, large-scale power plants transmitting electricity or natural gas through transmission or distribution lines over long distances to a large number of consumers. Until recently, centralized generation has generally referred to large nuclear, hydroelectric, coal, and natural gas plants; however, renewable energy technologies such as concentrated solar thermal generators and industrial wind farms that feed electricity directly into the transmission system for consumption elsewhere are also considered centralized energy.
Conversely, fossil fuels can be and in fact are used as sources of distributed generation. For example, manufacturing plants often burn coal or natural gas onsite to generate the heat necessary for forging steel. Small or even industrial-scale natural gas generators are used to provide power for manufacturing and industrial purposes. Both of these examples can be characterized as distributed generation, and many believe that the use of fossil fuels for distributed generation is necessary to provide supplementary or backup generation for distributed renewable energy systems (The National Council on Electricity Policy, 2009). Such generators can provide greater savings for energy users; Casten and Downes (2005) note that “building combined cycle gas turbine plants near users and recycling waste heat saves [users] money, reducing required costs by $25 per megawatt-hour [MWh] versus the same technology built remotely” (p. 29).
While fossil fuels may be used to fuel distributed generators of electricity and heat, the focus of this report is on distributed energy generated from renewable sources. However, we also include combined heat and power (CHP) since it results in reduced fuel and energy consumption, and therefore greater energy efficiency.
1.2 The growth in distributed energy generation in the United States
Distributed energy development in the US and around the world has expanded rapidly in recent years. For instance:
approximately 883 MW of “grid-tied” solar photovoltaic (PV) capacity was installed in the US in 2010, which was more than double the capacity installed in 2009 (Barbose et al., 2011);
solar water heating capacity grew by 6% in 2010 (Sherwood, 2011); geothermal heat pump (GHP) capacity grew 11% from 2007 to 2008 (Cross and Freeman, 2009); distributed small wind power capacity grew by 26% from 2009 to 2010 (AWEA, 2011); and total capacity in the US for CHP or independently produced electrical power fueled by biomass
resources such as landfill gas (LFG) grew from 9,499 MW to 10,668 MW between 2006 and 2009, reflecting an overall growth of 10.5% and an average annual growth of 333 MW (EIA, 2011a).
Table 1 presents the total installed capacity of various distributed energy technologies as of 2009 or 2010.
1 Our definition of distributed energy generation does not imply customer ownership nor direct connection to the electricity grid. In other words, distributed energy systems may be either customer- or utility-owned, grid-tied or grid-independent. The economics of the system, as well as the distribution of the benefits, differ significantly depending on the type of ownership and whether the system is tied to the grid. These differences will be addressed throughout this report.

3 | P a g e
Table 1: Installed capacity of selected distributed energy technologies in the United States
Distributed energy technology Total installed capacity
(MWe) Year of data
Solar photovoltaic 2,137 2010
Solar water and space heating 24,000 2009
Geothermal heating 12,031 2009
Small distributed wind 179 2010
Distributed biopower 10,498 2009
Note: MWe represents “megawatt-equivalent.”
While distributed energy constitutes a small portion of total US energy generation, it represents a rapidly growing sector of both energy and economic development, and:
The rapid growth of distributed renewable energy has led utility planners and state and local governments to examine what the new rules of electricity generation and distribution will be in an age where households and businesses will be both producers and consumers of electricity. The result is a historic opportunity to democratize energy, [achieve] energy self-reliance and renew local communities (Farrell, 2011a, p. i).
The greatest growth in distributed energy is happening in states that provide strong policy or financial supports, including California, New Jersey, and New York as well as the Appalachian states of Pennsylvania, North Carolina, and Ohio. In fact, sixteen out of twenty-nine states that have adopted renewable energy standards have included mandates for solar and other distributed energy technologies (Farrell, 2011a). By comparison, Kentucky ranks poorly in terms of the support and development of distributed energy. However, it is not the result of a lack of resources, but rather a lack of initiative and strong policy support. While the economic development opportunities for distributed energy development are being taken advantage of in other states across the US, including several in Appalachia, Kentucky continues to lag behind.
1.3 Why Kentucky should support the expansion of distributed energy generation
Rising energy costs, an aging and inefficient electrical grid, the economic potential of distributed energy, and the increasing impacts to public health and the environment associated with coal-fired electricity generation all suggest the need to diversify Kentucky’s energy portfolio and shift away from centralized fossil fuel-based energy production toward a greater reliance on small distributed renewable energy generation. The potential benefits for Kentucky of transitioning away from centralized energy fueled by non-renewable resources to distributed energy based on renewable resources are substantial. As described in this report, these include:
The replacement of inefficient and occasionally unreliable centralized energy generation; The addition of a significant amount of baseload power during times of peak load; A reduction in the total value of subsidies required per unit of energy produced; Greater security against fossil fuel depletion and volatile energy prices; Reduced costs for new centralized generation, infrastructure, and pollution control; More efficient generation, transmission, and distribution of electricity; Increased energy security and grid security; More rapid deployment than centralized generation; Diversification of Kentucky’s energy portfolio; Growth and diversification of state and local economies; and Significant environmental and public health improvements.
Despite these many benefits, significant barriers to distributed renewable energy remain in Kentucky, and so far state policymakers have done little to overcome those barriers.
4 | P a g e
1.4 Barriers to distributed renewable energy
A historical reliance on centralized forms of energy production and historically cheap sources of fuel such as coal has resulted in the build-up of substantial barriers to distributed renewable energy in Kentucky. In addition, the perception that the state depends on coal to provide cheap energy, jobs, and tax revenues has led to a resistance to any shift away from the traditional energy paradigm. Perceptions alone are not preventing the growth of distributed renewable energy development in Kentucky, however. There are a number of barriers that stem from a combination of existing energy economics, poor understanding of available renewable energy resources, poor access to renewable energy development for certain sectors and income classes, and general misconceptions about renewable energy. Many of these can be overcome with a concerted effort to support the development of distributed renewable energy.
The main factors driving the current centralized energy paradigm in Kentucky include existing energy prices, economies of scale, and regulations and incentives favoring larger generating facilities and centralized generation. For instance, many distributed energy technologies cannot compete with prices for coal-fired electricity generation or even for large-scale renewable energy. This is due to a number of factors.
First, existing coal-fired power plants are decades old, so the price of coal-fired electricity no longer reflects the capital costs associated with the construction of the facilities. This is changing as a result of new costs associated with pollution control and the pending retirement of many coal-fired units. Additionally, the price of coal-fired electricity does not reflect the full social costs of coal, which include direct tax subsidies, damage to roads, environmental impacts and public health costs (Epstein et al., 2011). These costs are paid for through general taxes on the public, lost revenue potential and/or higher medical costs, for instance. Finally, the full range of economic and social benefits resulting from renewable energy is not captured in the price of that energy. As a result, the price of coal-fired electricity remains artificially low, while that of renewable electricity remains artificially high.
Related to distortions in energy prices is the issue of economies of scale. Developing larger, centralized forms of energy generation is generally more cost effective than developing many smaller-scale technologies and distributed energy systems. However, this does not automatically require a commitment to centralized energy. One reason is that renewable resources in Kentucky are insufficient for achieving any future renewable energy goals solely with large-scale systems. Additionally, the difference in the cost of development between centralized and distributed renewable energy technologies is small and shrinking. As a result, targeted low-cost policies can easily overcome economies of scale.
There are also significant regulatory, financial, and technical barriers to distributed energy development. For instance, Kentucky’s standards for connecting distributed generators to the grid are highly restrictive and costly and may render many smaller projects economically prohibitive. Kentucky’s tax incentives and other public subsidies favor the development of larger systems, do little to support distributed generation due to a low cap on the maximum incentive value, and are not accessible to non-taxable entities such as municipal or county governments. In addition, the current management and structure of the electrical grid may not be able to handle a substantial amount of distributed energy development. Each of these barriers must be addressed if Kentucky is to achieve its renewable energy goals and take advantage of the economic and environmental benefits of developing distributed renewable energy.

5 | P a g e
1.5 Purpose and structure of this report
This report does not claim that distributed renewable energy can replace centralized generation or traditional fuels such as coal. In fact, our findings prove that doing so is not possible, primarily due to a lack of resources. Instead, this report shows that existing renewable energy resources and technologies can support a substantial amount of distributed renewable energy development, which would result in a wealth of economic and environmental benefits for Kentucky. To that end, the report is structured as follows:
Section 2: The Case for Distributed Renewable Energy. The section describes the many benefits that distributed renewable energy provides in comparison to centralized fossil fuel-based generation, and dispels common misconceptions surrounding renewable and distributed energy.
Section 3: Opportunities for Developing Distributed Energy in Kentucky. This section describes proven and economically mature distributed energy technology options that are available for Kentucky, and shows that Kentucky’s renewable resources are substantial and can provide far more renewable energy than is being pursued in the proposed REPS as detailed in the Governor’s energy plan. In addition, this section details challenges and barriers specific to individual technologies or resources, and presents case studies highlighting successful distributed energy projects in Kentucky.
Section 4: Review of Policies Affecting Distributed Renewable Energy in Kentucky. This section analyzes Kentucky’s existing policies and incentives as they relate to distributed renewable energy development. The information informs the policy options detailed in Section 5.
Section 5: Policy Options for Kentucky. This section describes various policy options available that would help expand the development of distributed renewable energy and ensure that Kentucky reaps the benefits of growing markets. Implementing these policies would address key barriers that exist in Kentucky and would help to ensure that its renewable resources are developed sustainably and that the economic benefits are maximized. Two of the policies—a renewable energy portfolio standard and a feed-in tariff—have been proposed as part of the Clean Energy Opportunity Act, introduced in the Kentucky Legislature in 2012 as part of House Bill 167.
Section 6: Conclusions and Recommendations.

6 | P a g e
2. THE CASE FOR DISTRIBUTED RENEWABLE ENERGY
This section details the reasons why Kentucky should increase support for renewable energy generally, but more specifically for distributed forms of renewable energy. The overarching reasons include the facts that energy costs are rising as the price of coal increases and becomes more volatile; that the external costs of coal—including the impacts to public health and the environment resulting from the mining, processing, and burning of coal—continue to grow; and that Kentucky is falling behind other states in taking advantage of rapidly expanding renewable energy markets and is thus losing out on creating new jobs and revenue sources that could help diversify state and local economies.
This section also dispels many misconceptions surrounding renewable energy development and the costs and impacts of distributed versus centralized energy production. Distributed renewable energy technologies, such as solar PV, small wind turbines, and CHP, offer a more secure, modern, reliable, and robust electricity system than the nation’s current centralized grid paradigm (USDOE, 2008). Further, distributed renewable energy can provide greater potential benefits than centralized generation, regardless of whether the central generators are reliant on fossil fuels or renewable resources (although the benefits of distributed generation are greater compared to centralized fossil fuel-based generators than to renewable energy generators). In fact, “decentralized [distributed] generation…significantly improves every key outcome from power generation” when compared to centralized generation (Casten and Downes, 2005, p. 27).
2.1 Kentucky’s electricity generating infrastructure is ideal for distributed energy
Kentucky’s structure of electricity providers is conducive to the development of distributed energy. This is due to the high number of publicly-owned rural electric cooperative companies (RECCs) and municipally-owned utilities (“munis”). The electricity generated is more likely to be consumed locally—particularly in the case of munis— because cooperatives and municipal utilities distribute electricity to local customers. It is also more likely to be customer-owned or influenced because members can participate in the energy decisions of local entities more than they can investor-owned utilities. These conditions render the development, distribution, and consumption of distributed energy more feasible than if the state’s electrical infrastructure was more centralized and dominated by a small number of investor-owned utilities (IOUs).
Electricity in Kentucky is provided to customers by utility companies regulated by the Kentucky Public Service Commission (PSC), munis, and the Tennessee Valley Authority (TVA) and its distributors. There are two types of PSC-regulated suppliers: IOUs and RECCs. An IOU is a for-profit electric company owned by stockholders, whereas a RECC is a nonprofit electric utility that is owned by the members it serves. Four IOUs operate in Kentucky, including Duke Power Kentucky, the Kentucky Power Company (a subsidiary of American Electric Power), Kentucky Utilities (KU), and Louisville Gas and Electric (LG&E). The PSC regulates 19 RECCs, 16 of which jointly own and purchase power from the East Kentucky Power Cooperative (EKPC). The remaining three jointly own and purchase power from the Big Rivers Electric Corporation (DEDI, 2010).
The 18 munis operating in Kentucky are owned by units of local government, such as a cities or towns, and either self-generate the electricity they sell—through owned and/or operated facilities—or they purchase electricity at wholesale and distribute it to local customers. As for unregulated utilities, five RECCs and 10 munis secure all of their electricity from TVA. These RECCs and muni’s then resell and distribute electricity to customers within their service territories. Separately, TVA also serves several large industrial customers directly. In addition to utilities, independent power producers (IPPs) also generate electricity in Kentucky and can sell power to utilities in-state or to customers out of state. According to EIA, IPPs accounted for less than 1% of all electricity generated in Kentucky in 2010 (EIA, 2011b).
Figure 1 maps Kentucky’s service areas and associated electricity providers.

7 | P a g e
Figure 1: Electric service areas by utility provider in Kentucky, 2011
Source: PSC (2011a).
In 2009, IOUs serviced 55% of all electricity customers in Kentucky, generating and selling 64% of all electricity consumed by residents, businesses, and industries. RECCs accounted for 36% of customers serviced and 29% of electricity sales, while munis served the remaining 9% of customers and 7% of sales. Overall, not including munis that purchase power from TVA to redistribute to their customers, publicly owned (RECCs) or influenced (munis) electric utilities served 34% of all Kentucky electricity customers and accounted for 29% of all sales in 2009 (see Figure 2). This is a substantial portion of electricity generation that is owned or controlled locally, relative to a fully centralized model of electricity generation and distribution.

8 | P a g e
Figure 2: Percent of electricity customers and sales serviced by Kentucky utilities, by ownership, 2009
Source: EIA (2010a).
Of all electric utilities, prices for electricity sold by RECCs or munis serviced by TVA were the highest of all utilities in 2009. For instance, RECCs that purchased electricity from TVA paid an average price of 9.6 cents per kilowatt hour (kWh), compared to the average of 7.1 cents per kWh for all RECCs. The same was true for electricity from TVA purchased and sold by munis, which averaged 8.7 cents per kWh compared to an average of 7.6 cents per kWh for all munis. This trend was the same regardless of the type of customer, whether residential, commercial, or industrial. Comparing non-TVA prices, overall, electricity sold by non-TVA RECCs or munis averaged 6.7 cents per kWh, while sales from IOUs averaged 6.1 cents per kWh.
One implication of these trends is that developing distributed energy generation is more economical and more beneficial—in the short term—for customers and utilities serviced by TVA and for municipalities. However, as shown in Figure 4, the rapidly rising average price of electricity for the state as a whole suggests a need to expand distributed energy development so as to stabilize electricity prices for all customers throughout the state over the long term.
2.2 Energy costs and expenditures in Kentucky are rising fast
Prior to 2000, states that relied heavily on coal for electricity generation generally experienced some of the lowest energy costs in the nation. However, that trend has shifted. Since 2005, states dependent on coal experienced the highest electricity price increases. For instance, the average retail price of electricity in the US increased by 22%, going from 8.1 cents per kilowatt-hour in 2005 to 9.9 cents per kilowatt-hour in 2010. But the two most coal-dependent regions—the East South Central region comprised of Tennessee, Kentucky, Mississippi, and Alabama and the East North Central region comprised of Michigan, Ohio, Indiana, Illinois, and Wisconsin—saw their rates increase by 34% and 32%, respectively (Lacey, 2011).
0%
10%
20%
30%
40%
50%
60%
70%
Utilities Cooperatives Municipalities
Pe
rce
nt
of c
ust
om
ers
an
d e
lect
rici
ty s
ales
Customers Sales

9 | P a g e
In 2009, Kentucky ranked sixth in the use of coal for electricity production in the US. Kentucky utilities generated 90 million MWh of electricity, of which coal accounted for 93% (see Figure 3) (EIA, 2011b).
Figure 3: Electricity generation by energy resource, 2009
Source: EIA (2011b).
Overall, the average price of electricity in Kentucky in 2009 was 6.5 cents per kWh.2 This represents an increase of 56% over the 2000 price, meaning electricity prices have increased by an average of 6% annually. The rate of increase since 2005 has been even greater, amounting to an annual increase of 8% (EIA, 2011c).
The rapid increase in electricity prices over the last decade is due primarily to Kentucky’s heavy reliance on coal for electricity generation, and a continued reliance on coal will only lock Kentucky into additional cost increases in the coming decades.
For instance, the delivered price of coal to Kentucky’s power plants rose by nearly 8% annually between 2000 and 2009 (see Figure 4). In the coming years, new cost pressures such as regulatory compliance costs and global competition for Appalachian coal are likely to accelerate the rising cost of coal and coal-fired electricity for Kentucky.
2 Of the electricity generated in 2009, 30% was consumed by the residential sector, 21% by the commercial sector, and 49% by the industrial sector. On average, residential customers paid 8.4 cents per kWh, commercial customers 7.6 cents, and industrial customers 4.9 cents (EIA, 2011c).
Coal93%
Hydroelectric Conventional
4% Petroleum2%
Natural Gas1%
Other0%

10 | P a g e
Figure 4: Delivered price of coal to Kentucky’s electric utilities, and average price of electricity, 1990-2009
Source: EIA (2011c and d).
Despite the recent increases, Kentucky still had the fourth-lowest electricity price in 2010 (EIA, 2011c). However, “People pay bills…they don’t pay electricity rates,” (Jason Bailey of MACED, as quoted in Peterson, 2011) and due to poor housing and low energy efficiency, the average monthly bill for Kentucky electricity customers is higher than the US average for 37% of the state’s population (Peterson, 2011). Overall, Kentucky residents paid an average monthly electric bill of $107.80 in 2010, ranking lower than 29 other states. The national average was $110.55 (see Figure 5) (EIA, 2011d). Additionally, Kentucky as a whole spent $20.3 billion for energy in 2007, up 85% from 2000. These increased expenditures were driven, in part, by higher coal costs (DEDI, 2009).
Energy costs for all sectors are set to increase in the coming years. Some of the larger utilities regulated by PSC are requesting rate increases as a result of new anticipated regulations. The new regulations will cover emissions of sulfur dioxide, nitrogen oxides, and mercury, as well as the storage of coal combustion wastes, and will require utilities to upgrade their power plants by installing pollution control equipment. The utilities are requesting rate increases to recover the cost of upgrades to meet the new regulatory requirements.
As of the writing of this report, PSC had approved an 18% increase for LG&E customers, a 9.7% increase for KU customers by 2016 (Howington, 2011), and had yet to decide on a 20% increase requested by Big Rivers Electric Corporation (Musgrave, 2011). These rate increases reflect a continuing reliance on coal-fired generators, and are the result of more than $2 billion being recovered to retrofit and upgrade aging, inefficient, centralized coal-fired power plants dependent on finite fuels with increasingly volatile prices.
0
1
2
3
4
5
6
7
0
50
100
150
200
250
Price
of e
lectricity (ce
nts pe
r kWh
)
De
live
red
pri
ce o
f co
al (c
en
ts p
er
mil
lio
n B
tu)
Year
Delivered price of coal
Average price of electricity

11 | P a g e
Figure 5: Average residential monthly electricity bill, by state, 2010
Source: EIA (2011e).
2.3 Distributed renewable energy can provide significant economic and environmental benefits
2.3.1 Replaces inefficient and occasionally unreliable centralized generation
The net electric efficiency of power production in the US peaked in about 1910, when nearly all generation was located near users and was tied to the recycling of waste heat. Efficiency then dropped to 33% over a span of fifty years as the power industry moved to electric-only central generation, and, as evidenced by the efficiency of aged, centralized power plants today, “industry efficiency has not improved in four decades” (Casten and Downes, 2005, p. 27).
Conventional, centralized generators, largely fueled by coal, natural gas, and nuclear materials, are largely inefficient. For instance, coal-fired electricity generators consume approximately two-thirds of the embodied energy in each ton of coal, leaving only one-third of that energy available for end-users. In other words, the thermal efficiency of a conventional coal-fired power plant is around 33% (Eisenhauer and Scheer, 2009). Natural gas combined-cycle plants can achieve a thermal efficiency of around 50% (Spath and Mann, 2000), while that of nuclear is also around 33%.
Overall, a significant portion of the energy contained in non-renewable fuels purchased and burned to generate electricity is wasted as heat, and provides no benefit to society. One example of the efficiency improvements that could result from distributed energy generation is CHP plants, which are located onsite or near the end-user. CHP plants can achieve 65-97% net electrical efficiency by recycling wasted process and/or electrical heat and by avoiding transmission and distribution losses (Casten and Downes, 2005).
$0
$20
$40
$60
$80
$100
$120
$140
$160
$180

12 | P a g e
Some renewable technologies are often criticized for being intermittent and unreliable—a point which is used as an argument against developing these technologies (Foley, 2011). For example, wind power is only available when the wind blows, and solar power is only available during the day. It is true that one major challenge with renewable energy, particularly distributed renewable energy, is the variability in output, which at low levels of development results in additional backup requirements and costs for fossil fuel-based generators. However, a growing body of research is showing that traditional, centralized, fossil fuel-based generators are themselves unreliable, and that geographic dispersion and increased penetration of distributed renewable energy technologies greatly reduces backup costs and concerns about variability.
For instance, data from the North American Electric Reliability Council for all generators in the US for 2003 to 2007 show that coal-fired generators were shut down an average of 12.3% of the time (4.2% without warning); nuclear, 10.6% (2.5% without warning); and gas-fired, 11.8% (2.8% without warning) (Hansen and Lovins, 2010). These data suggest that centralized generators are not always reliable.
Farrell (2011a) addresses the issue of backup costs by noting that the amount of backup power (e.g., spinning reserve) required to support renewable energy decreases as more distributed renewables are developed, and that such costs can be reduced in excess of 90% by developing more distributed generation dispersed across a broad region. Using solar as an example, a single solar PV power plant has backup costs for the utility of around 4 cents per kWh (to have other power plants available to cover variations in output). However, if 25 solar power plants are dispersed across a broad region such as a metropolitan area, these backup costs fall by 93%, to far less than 1 cent per kWh (Farrell, 2011a).
Despite these findings, it is true that compared to distributed energy technologies that rely on “intermittent” sources such as solar and wind, centralized generators have traditionally provided greater reliability. Advances in energy management, storage, and technological efficiency, however, are greatly improving the reliability of renewable energy generators by helping to reduce the variability in electricity generation, thereby rendering the energy output more useful to the grid (Wald, 2011).
2.3.2 Can provide baseload power and reduce peak demand
Related to the concern about reliability is the argument that renewable resources cannot provide baseload generation because utility and grid operators are unable to control the availability of the wind and sun for generating power. However, it has been argued that “‘baseload’ remains a valid and useful technical term that utilities apply to generating assets, but its definition is economic, not physical” (Hansen and Lovins, 2010, unnumbered). In other words, for the utility, the baseload resource is that which provides the cheapest electrical service over time, and that once the required resources have been purchased, the utility’s baseload resource is whichever resource costs the least to run (no matter what it cost to build).
In effect, the definition of ‘baseload’ says nothing about size, technology, or even whether the resource produces or saves electricity. One example is that, traditionally, big thermal or hydroelectric power plants have been the default choice under both definitions of baseload, but “nowadays, new competitors—efficiency, many renewables, cogeneration—typically cost less to buy and to run, so big thermal plants now provide a minority and shrinking share of the world’s new electricity production” (Hansen and Lovins, 2010, unnumbered).
As distributed generation becomes more widely developed and geographically dispersed, the reliability, predictability, and manageability of distributed energy increases. As this occurs, the benefits of distributed energy generation increase, thereby helping lower the cost of electricity generation.
In this sense, distributed generation becomes both more economical and reliable, and can begin to provide a greater share of baseload power.

13 | P a g e
Additionally, because onsite generation is essentially a source of load reduction, many distributed energy technologies serve to reduce peak demand on distribution grids. For example, solar PV delivered close to 60% of its rated capacity during the peak demand period (hot, sunny days) in California’s Pacific Gas and Electric service area in 2007 (Itron, Inc., 2008). Reducing peak demand in turn can reduce the need for utilities to purchase additional energy at higher marginal prices during times of normally high demand. Perez et al. (2011) estimated the value of these avoided costs at 6-11 cents per kWh for New York.
It is important to note that there may be a limit to the level of distributed generation that can be developed without causing disruptions to the grid. A significant increase in distributed generation will require revamping the physical and regulatory structure of the electricity network, particularly the distribution network (as opposed to the transmission network) (Martin, 2009). However, a greater amount of distributed generating capacity can be developed without causing disruption issues if there are improvements to the management and operation of the grid and of existing power z`plants. In addition, there are examples of high penetration of distributed generators without causing significant issues in managing the integration of distributed power.
For instance, a 700 kW solar array in Kona, Hawaii provides 35% of the capacity of the local distribution feeder network. In Las Vegas, a total of 10 MW of commercial solar PV on a distribution line provides 50% of the capacity on the line and even up to 100% during periods of low total load. And in Atlantic City, New Jersey, commercial solar PV accounts for 24% of the total capacity on the distribution line, and up to 63% during low load periods. In none of these cases were significant issues reported (Farrell, 2011a).
2.3.3 Needs fewer subsidies than traditional energy sources and centralized generation
Another common argument against renewable energy, including distributed sources, is that renewable energy is not economical without subsidies. However, an honest evaluation of the ability of renewable energy to compete with conventional energy sources is only possible by comparing the economic feasibility of all energy development with and without public subsidies.
All energy resources are subsidized, either directly through regulatory or fiscal policy, or indirectly through the externalization of costs throughout the development lifecycle. For instance, according to EIA, in the electricity sector, coal, natural gas, petroleum liquids and nuclear energy received a total of $4.3 billion in federal subsidies in fiscal year (FY) 2010, while renewables received a total of approximately $6.6 billion (of which wind received nearly $5 billion) (EIA, 2011f). While this suggests that renewables received more subsidies than conventional fuels, EIA notes that these numbers do not include other less direct subsidies.
Two substantial subsidies that were excluded are the domestic manufacturing deduction, which benefits domestic oil and gas producers and refiners, and trust funds such as the Abandoned Mine Reclamation Fund, which benefits the coal industry if it turns out that the Fund has not generated sufficient revenues for covering all abandoned mine reclamation costs through 2022, when the Fund is set to expire. Thus far, data provided by regulatory agencies in Virginia and West Virginia suggest that there will be a reclamation funding shortfall of nearly $1 billion for these two states alone (McIlmoil et al., 2010 and 2012).
Another report analyzing federal subsidies for energy from FY2002 to FY2008 found that total subsidies for fossil fuels totaled $72 billion over the study period, while total subsidies for renewables amounted to $29 billion (Environmental Law Institute, 2009). Another report tallied the average annual subsidy for conventional and renewable energy sources starting with the year in which the resource was first subsidized. The report found that the oil and gas industry received an average of $4.86 billion per year in federal subsidies from 1918 to 2009, the nuclear industry $3.5 billion per year from 1947 to 1999, and non-biofuels renewable energy resources only $370 million per year from 1994 to 2009 (Pfund and Healey, 2011).

14 | P a g e
Energy subsidies are provided on the state level as well. For instance, the Commonwealth of Kentucky provided the state’s coal industry with nearly $85 million in tax subsidies in FY2006 while directly spending an additional $270 million to support and regulate the industry (Konty and Bailey, 2009). The total tax expenditure supporting coal in West Virginia amounted to $150 million in FY2009, with direct expenditures supporting the industry adding another $114 million to the total state subsidy for coal (McIlmoil et al., 2010). These estimates represent only the subsidies provided to the coal mining industry, and do not account for the additional subsidies provided to electric utilities operating coal- and natural gas-fired power plants.
Renewable energy industries in these two states do not likely receive nearly the level of tax subsidies. This is evidenced by the fact that DEDI provided over $3.6 million in grants supporting coal education and energy commercialization and research related to coal and other non-renewable energy sources, while grants supporting renewable energy amounted to approximately $650,000: approximately $450,000 for algae-based biofuels research and $200,000 supporting the development of Kentucky’s Climate Action Plan. No funds were granted for other renewable energy technologies such as solar PV, wind, or geothermal (DEDI, 2009).
Despite the wide gap in subsidies between conventional fuels and renewables, “some renewable technologies…[already] compete with fossil fuel generation, while others—like solar—are rapidly becoming less expensive” (Farrell, 2011a, p. 3). However, even within the renewable energy sector, subsidies are heavily concentrated towards large centralized generators (Farrell, 2011a).
Overall, conventional and fossil fuel-based energy industries have historically received far greater subsidies than have renewable energy industries. This continues to be the case even today when including both direct and indirect subsidies in the calculations. To what extent subsidies are required for the development of any energy resource to be economically feasible remains unknown; however, it is disingenuous to claim that renewable energy cannot compete without the provision of subsidies when mature, traditional fuels and energy technologies continue to take advantage of the same. Only by removing all subsidies for each energy industry and internalizing the costs of energy production currently borne by society can there be an honest appraisal of which energy resources can compete, and which are too costly for us to continue to rely on.
2.3.4 Can help stabilize energy prices
As described in Section 2.2, the average price of electricity in Kentucky has increased by 6% annually since 2000. Should coal prices continue to increase, so will electricity prices. Anticipated rate increases resulting from proposed equipment upgrades of many of Kentucky’s coal-fired power plants will only add to the rise in electricity prices. As a result, residents, businesses, and industries will all experience increasing energy costs as a result of a reliance on centralized, fossil fuel-based electricity generation.
Distributed renewable energy generation helps to hedge against the depletion of fossil fuel supplies and therefore the cost of electricity generated using such fuels. Reducing the level of consumption of fossil fuels conserves those resources so that they are available over a longer period of time. The lower demand will help alleviate some of the upward pressure on fuel prices. For instance, the avoided costs associated with fuel price mitigation resulting from solar PV development in New York has been estimated at 3-5 cents per kWh, representing around 20% of the average price of electricity in 2010 (Perez et al., 2011).
Despite the obvious benefit of distributed renewable energy in mitigating or avoiding future energy cost increases, one of the most widely used criticisms of renewable energy generally is that more renewable power will raise the cost of electricity and cause harm to the economy. For instance, a study by the Heritage Foundation concluded that a national renewable electricity standard of 37.5% by 2035 would raise electricity prices by 36% for households and 60% for industries (Kreutzer et al., 2010). Virginia state regulators rejected a deal to purchase wind power, stating that “the ratepayers…must be protected from costs for renewable energy that are unreasonably high” (Wald and Zeller, 2010, unnumbered).

15 | P a g e
In Kentucky, in response to a request by Kentucky Power to purchase electricity from a wind farm in Illinois, Attorney General Jack Conway opposed the deal, arguing that it would increase residential rates by 0.7%. Kentucky Power, arguing in favor of the deal, stated that the contract would help the utility “better meet growing environmental requirements and impending government portfolio mandates for renewable energy” (Wald and Zeller, 2010, unnumbered).
Federal studies also undermine the price increase argument. A 2008 review of the impact of 25 mandatory and four voluntary state renewable portfolio standards (RPSs) found that the electricity rate increases associated with the policies amounted to 1% or less, and that renewable electricity “appears to be priced competitively with fossil generation” (Wiser and Barbose, 2008, p. 1). Additionally, an analysis of a national 25% renewable electricity standard found that it would not affect national average electricity prices until after 2020, as compared to business as usual. By 2025, the impact would be a meager 2.7-2.9%. However, by 2030, “electricity prices are projected to be little changed from the reference case…with 2030 prices less than 1% higher than in the reference case” (EIA, 2009a, p. vi). The maximum projected increase for any single state is 6% above business as usual levels. While these studies do not provide conclusive evidence of the impact of renewable energy on electricity prices, they do show that the argument that renewable energy significantly raises electricity costs is largely unfounded. This is especially true when other factors such as public health and environmental benefits are taken into account.
Additionally, utility statements suggest that there is little fear on the part of electric utilities that purchasing or developing renewable energy resources will increase rates. For instance, Xcel Energy, in modeling the projected impact on energy prices in Minnesota of a proposed wind power expansion plan, determined a price impact of 0.3 cents per kWh compared to a baseline scenario. The utility stated that renewable energy such as wind has become very competitive with traditional generating sources, and that adding renewable energy resources to its system reduces its environmental regulatory risk and is a good way to protect against rate increases resulting from volatile natural gas prices (Haugen, 2011). In North Carolina, rates for Progress Energy customers rose 3.7% in December 2011, primarily to recover fuel costs for coal and natural gas. Of particular relevance, however, is that the rate increase actually included a decrease in rates associated with the charge for meeting state-mandated renewable energy requirements (Progress Energy Carolinas, 2011).
2.3.5 Reduces costs for new centralized generation, infrastructure, and pollution control
In addition to fuel prices, future costs of new power plants, transmission capacity and regulatory compliance are uncertain, making a continued reliance on centralized fossil fuel-based generators increasingly risky. For instance, it has been estimated that relying solely on developing distributed generation to meet expected US load growth could avoid $326 billion in capital costs by 2020 and reduce incremental power costs by $53 billion (3.14 cents per kWh) when compared to a scenario where 100% of load growth was met with centralized generation (Casten and Downes, 2005).
Regarding new transmission capacity, developing distributed energy represents a smarter and more economical choice when considering new transmission lines. Permitting, siting, and public acceptance issues all arise when proposing new lines, but many forms of distributed generation can help eliminate these issues and can sometimes even eliminate the need for new transmission, thereby reducing overall system costs (The National Council on Electricity Policy, 2009).
The same is true when considering the potential costs of complying with anticipated federal regulations, as described in Section 2.2. For instance, in a rate agreement submitted to PSC by LG&E and KU, the cost of upgrading coal-fired power plants with pollution control equipment to meet new standards for emissions of air pollutants would be $2.5 billion (PSC, 2011b). The two utilities also plan to retire three coal-fired power plants and replace them by investing an additional $700 million to construct a new natural gas power plant and purchase an existing one (LG&E and KU, 2011a).

16 | P a g e
While developing distributed renewable energy also comes with a significant, albeit declining cost, it does not require major investments in new generating, transmission or distribution capacity or pollution control equipment, and can in fact serve as a source of pollution control. Additional benefits in terms of cost reduction—whether associated with the displacement of existing centralized generating capacity or as an alternative to future capacity additions—include reduced costs for storage of captured pollutants and combustion byproducts, reduced water consumption per unit of electricity generated, and a significant reduction in external costs associated with conventional fossil-fuel powered generation.
2.3.6 Reduces electricity losses from transmission and distribution
One of the most significant benefits of distributed generation is that local production allows for local consumption, which reduces electricity losses from the transmission and distribution of electricity from centralized generators. Such losses “account for approximately 8-10 percent of all power generated in the [US]” and can “amount for up to 30% of the cost of delivery electricity on average” (Martin, 2009, p. 10).
Distributed generation reduces transmission and distribution losses in two ways: (1) from the electricity flowing directly to end-users, thereby avoiding the 5-10% line losses, and (2) by reducing current flows, which reduces line losses on the remaining centrally generated power. As a result, one MWh of electricity produced by distributed generators displaces 1.13 MWh of central generation. This represents the minimum impact. Adding grid operator control of the local generation power factor can increase the displacement ratio, whereby one MWh of distributed generation could displace up to 1.47 MWh of centralized generation (Munson, undated). In effect, this means that with more efficient control of the grid and the distribution of electricity, distributed energy development can reduce electricity demand by up to 47%.
The true displacement value is dependent on the distance of both centralized and distributed generators to end-users, the capacity of distributed generators relative to the load on distribution networks, and the specifications of the distribution grid (Perez et al., 2011). However, the fact that distributed generation has the potential to reduce electricity demand by nearly 50% per unit of electricity consumed has significant implications for developing a sound and economically beneficial energy policy in Kentucky. Since many of Kentucky’s electricity consumers reside in rural areas far from the sources of electricity generation suggests that these consumers are paying higher energy costs due to the extra transmission losses. Therefore, the potential to avoid such losses makes developing distributed generation particularly beneficial and “especially feasible in rural areas where transmission losses are even higher than average” (Martin, 2009).
2.3.7 Increases energy security and grid security
Distributed generation increases national energy security because having a greater number of dispersed and smaller generators rather than fewer, larger generators results in a decreased likelihood of large areas losing power in the case of a failure, thereby helping to maintain grid stability (Farrell, 2011a). Distributed generators also enhance energy security by serving as backup generators, which help to prevent operational failures in the case of network problems. Finally, expanding distributed energy generation can serve to diversify the portfolio of fuel and energy resources used to generate energy by adding more power fueled by solar, wind, geothermal, and LFG (methane) resources.
Distributed energy can also help reduce the risk of power outages and rolling blackouts caused by high demand and stress on transmission and distribution systems. Overall, there were 123 reported major disturbances to the grid across the US in 2010, 75 of which were weather related, and 48 of which were associated with grid disruption (EIA, 2011g). The average number of affected customers was nearly 130,000. Outages such as these cost the US economy between $80 billion and $100 billion each year (Gellings and Yeager, 2004; Casten and Downes, 2005), thereby adding 29-45% to the cost of US power (Casten and Downes, 2005).

17 | P a g e
As an example of how distributed energy can reduce grid disruption, one study found that 1,000 community-scale solar plants totaling 500 MW dispersed across the Northeast US could have prevented the Northeast blackout in 2003, and would have saved the economy $6 billion (Farrell, 2011a). To put that cost into perspective, at approximate 2010 installed prices for solar PV ($6,200 per kW) (Barbose et al., 2011), developing 500 MW of community-scale solar would cost around $3.1 billion. Additionally, Perez et al. (2011) estimated that the value of solar PV for enhancing grid security in New York amounts to 2-3 cents per kWh.
Despite these benefits, there is a question as to what level of development is possible without impacting grid stability or requiring prohibitive operation and management costs. The limit will be specific to each distribution network, and therefore this is a question that will require further study as distributed generation grows. However, there is some anecdotal evidence that provides a general idea of possible limits. For instance, one study showed that at low penetration—regarded for solar, for instance, as capacity penetration of up to 30%—the extra cost of managing and operating such a level of distributed generation is negligible, and would require only localized, demand-side load management, storage, or backup operations. At higher penetration levels, localized measures would become too expensive (Perez et al., 2011). However, Alanne and Saari (2006) conclude that “although the amount of technology in a system principally increases due to decentralization…the vulnerability of the whole system decreases” (p. 545).
2.3.8 Deploys more rapidly than centralized generation
Distributed generators and generating systems are smaller, require little if any additional transmission or distribution lines, and do not—for most technologies and models—require an extensive permit process or environmental impact analysis or the need to meet siting requirements. As a result, distributed generators can come online faster than new centralized generators. This is illustrated by the fact that just over 1,000 MW of centralized solar thermal power had been developed globally through 2010, while Germany installed 7,400 MW of distributed solar PV capacity in 2010 alone (Farrell, 2011a).
Rapid development also provides cost assurance. From inception to installation and interconnection, costs associated with distributed energy development change little, if at all (again depending on the technology or system model). Therefore, the cost of developing a distributed energy system is known throughout the process. The same cannot be said for new centralized coal-fired power plants, nuclear plants, or even natural gas combined cycle plants. For example, when Duke Energy Carolinas first proposed a two-unit coal-fired power plant called Cliffside in summer 2006, the estimated total cost was around $2 billion. By that fall, the cost had risen to $3 billion, not including financing costs. As of 2008, after one of the units had been refused a permit, the cost of developing the remaining single unit had risen to $1.8 billion, or nearly as much as the estimated cost for two units when the plant was first proposed only two years prior (Schlissel et al., 2008).
2.3.9 Can help diversify Kentucky’s energy portfolio
Distributed energy technologies can accommodate a larger range of fuel and energy resources than centralized generation. A concentration of energy generation from a small number of resources renders the system vulnerable to price volatility, competing resource demand and costly repairs and upgrades. Kentucky can generate a substantial amount of electricity and heat from a wide variety of resources (see Section 3), and nearly every state, including Kentucky, could meet 20% of its electricity needs with solar PV alone (Farrell, 2011a). Using these resources to support distributed energy would allow greater flexibility in local and state energy planning while reducing the vulnerability of customers to future increases in energy prices.

18 | P a g e
2.3.10 Provides substantial economic benefits and helps to diversify state and local economies
Distributed energy can promote local business opportunities, support products and services based on local raw materials and labor, create new jobs, provide landowners with extra income, and improve the efficiency of energy consumption (Alanne and Saari, 2006). Additionally, the penetration of local economies with renewable resources can provide a faster path to economic development than large-scale fossil fuel power plants, creating more jobs per unit energy than coal and natural gas (Wei et al., 2010).
As an example, solar PV is widely regarded as having the greatest economic impact per unit of energy, regardless of whether the comparison is with conventional fossil fuels or other renewables. Over the life of the system, developing one MW of solar PV generates an average of 1.29 jobs in construction, installation, and manufacturing and 0.37 jobs in operations and maintenance, for a total of 1.66 jobs per MW (Sterzinger, 2006). By comparison, the total impact of coal plants is estimated at 0.8 jobs per MW, including mining, transportation, plant component manufacturing, and operations and maintenance (Singh and Fehrs, 2001). Solar PV therefore generates about twice as many jobs per MW as a coal-fired power plant.
Distributed renewable energy jobs are also more likely to be localized construction and installation jobs, and local development and ownership of distributed energy also generates more revenue per unit energy and results in more dollars staying in the local economy. For instance, it is estimated that locally owned energy development produces 1.5 to 3.4 times greater economic returns when compared to absentee ownership (Farrell, 2010a). Additionally, operating and maintaining energy systems requires special expertise, and the required number of workers increases when the energy system is decentralized (Alanne and Saari, 2006).
As for future economic impacts from distributed renewable energy development, the US market for solar panels, wind turbines, CHP systems, and biomass engines may reach $226 million a year by 2016 (Makower et al., 2007, as cited in Tracz and Bailey, 2010). This may be a conservative estimate, as the Iowa Policy Project (2010) modeled the economic impacts of developing 300 MW of solar energy in Iowa, and found that by the fifth year, 5,000 jobs would be created—not including potential impacts from manufacturing jobs or permanent operations and maintenance jobs—and $332 million would be added to the state’s economy. So far, while other Appalachian states such as Pennsylvania, Ohio, and Tennessee are experiencing strong growth in solar and other distributed renewable energy industries, Kentucky is falling behind. However, Kentucky has a wealth of renewable energy resources, each of which has the potential to generate more jobs and revenues per unit of installed capacity than conventional fossil fuels, and “This information can be useful for policy makers who are designing long range energy policies or short-term government programs to provide economic stimulus or incentives for direct employment” (Wei et al., 2010, p. 928).
2.3.11 Provides significant environmental and public health benefits
Distributed energy generation also reduces the external costs associated with centralized coal-fired generation. Such costs include the environmental and health impacts of mining, processing, transporting, and burning coal for electricity generation, as well as the impacts associated with the storage of coal combustion waste. These costs are substantial, but are not included in the price of electricity.
Regardless, society does pay these costs in a variety of ways. For instance, the life cycle impacts of coal alone cost the US public one-third to over one-half trillion dollars each year, adding 18-27 cents per kWh to the price of electricity. The impacts include: mining accidents, fatalities, and illnesses such as black lung disease; stream pollution from underground and surface mining operations; greenhouse gas emissions from land disturbance; the storage of processing and coal combustion waste; air and water contamination from process-related toxins, heavy metals, and radioactive elements; annual deaths from lung cancer and heart, respiratory and kidney disease in mining communities; ecological damage from acid rain; costs for abandoned mine reclamation; and climate change impacts, among others (Epstein et al., 2011).
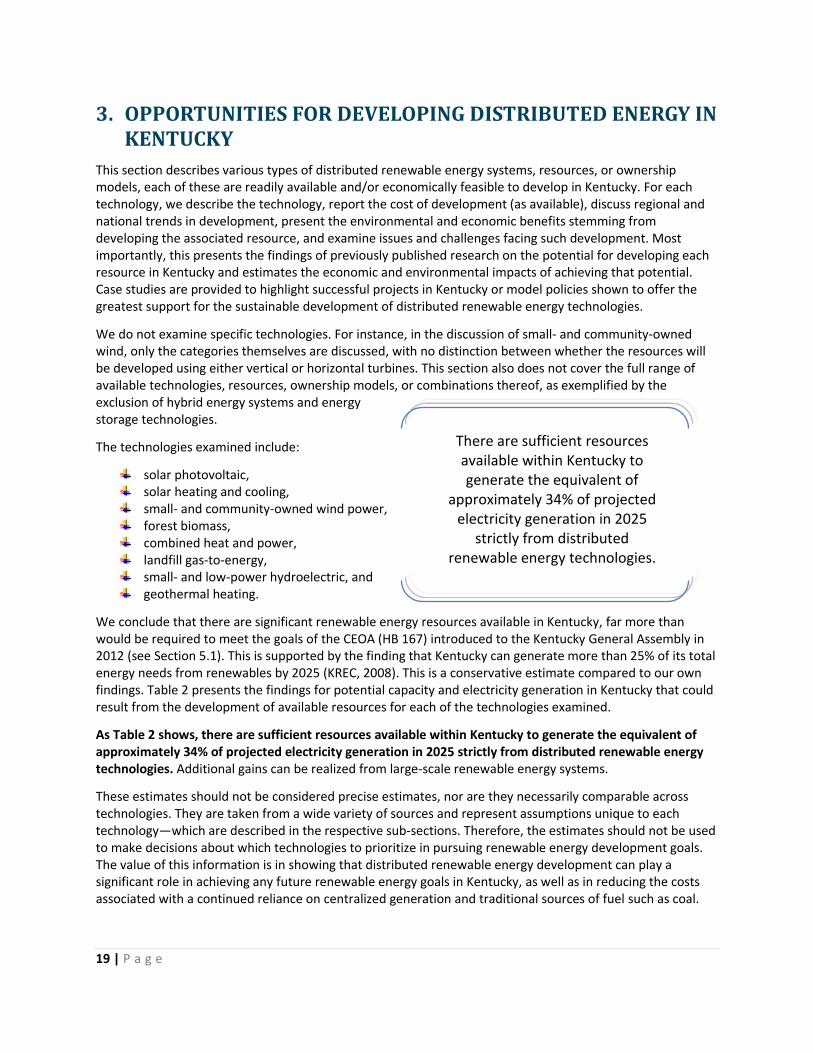
19 | P a g e
3. OPPORTUNITIES FOR DEVELOPING DISTRIBUTED ENERGY IN KENTUCKY
This section describes various types of distributed renewable energy systems, resources, or ownership models, each of these are readily available and/or economically feasible to develop in Kentucky. For each technology, we describe the technology, report the cost of development (as available), discuss regional and national trends in development, present the environmental and economic benefits stemming from developing the associated resource, and examine issues and challenges facing such development. Most importantly, this presents the findings of previously published research on the potential for developing each resource in Kentucky and estimates the economic and environmental impacts of achieving that potential. Case studies are provided to highlight successful projects in Kentucky or model policies shown to offer the greatest support for the sustainable development of distributed renewable energy technologies.
We do not examine specific technologies. For instance, in the discussion of small- and community-owned wind, only the categories themselves are discussed, with no distinction between whether the resources will be developed using either vertical or horizontal turbines. This section also does not cover the full range of available technologies, resources, ownership models, or combinations thereof, as exemplified by the exclusion of hybrid energy systems and energy storage technologies.
The technologies examined include:
solar photovoltaic, solar heating and cooling, small- and community-owned wind power, forest biomass, combined heat and power, landfill gas-to-energy, small- and low-power hydroelectric, and geothermal heating.
We conclude that there are significant renewable energy resources available in Kentucky, far more than would be required to meet the goals of the CEOA (HB 167) introduced to the Kentucky General Assembly in 2012 (see Section 5.1). This is supported by the finding that Kentucky can generate more than 25% of its total energy needs from renewables by 2025 (KREC, 2008). This is a conservative estimate compared to our own findings. Table 2 presents the findings for potential capacity and electricity generation in Kentucky that could result from the development of available resources for each of the technologies examined.
As Table 2 shows, there are sufficient resources available within Kentucky to generate the equivalent of approximately 34% of projected electricity generation in 2025 strictly from distributed renewable energy technologies. Additional gains can be realized from large-scale renewable energy systems.
These estimates should not be considered precise estimates, nor are they necessarily comparable across technologies. They are taken from a wide variety of sources and represent assumptions unique to each technology—which are described in the respective sub-sections. Therefore, the estimates should not be used to make decisions about which technologies to prioritize in pursuing renewable energy development goals. The value of this information is in showing that distributed renewable energy development can play a significant role in achieving any future renewable energy goals in Kentucky, as well as in reducing the costs associated with a continued reliance on centralized generation and traditional sources of fuel such as coal.
There are sufficient resources available within Kentucky to generate the equivalent of
approximately 34% of projected electricity generation in 2025
strictly from distributed renewable energy technologies.
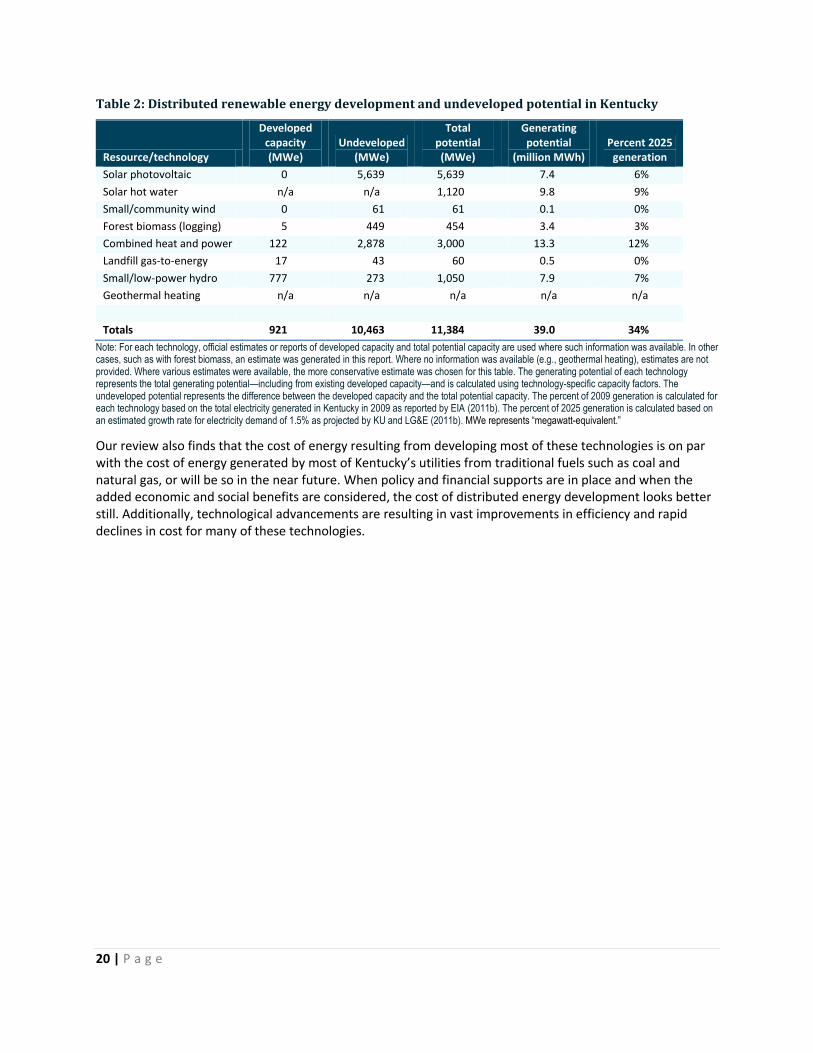
20 | P a g e
Table 2: Distributed renewable energy development and undeveloped potential in Kentucky
Resource/technology
Developed capacity (MWe)
Undeveloped (MWe)
Total potential (MWe)
Generating potential
(million MWh) Percent 2025
generation
Solar photovoltaic 0 5,639 5,639 7.4 6%
Solar hot water n/a n/a 1,120 9.8 9%
Small/community wind 0 61 61 0.1 0%
Forest biomass (logging) 5 449 454 3.4 3%
Combined heat and power 122 2,878 3,000 13.3 12%
Landfill gas-to-energy 17 43 60 0.5 0%
Small/low-power hydro 777 273 1,050 7.9 7%
Geothermal heating n/a n/a n/a n/a n/a
Totals 921 10,463 11,384 39.0 34%
Note: For each technology, official estimates or reports of developed capacity and total potential capacity are used where such information was available. In other cases, such as with forest biomass, an estimate was generated in this report. Where no information was available (e.g., geothermal heating), estimates are not provided. Where various estimates were available, the more conservative estimate was chosen for this table. The generating potential of each technology represents the total generating potential—including from existing developed capacity—and is calculated using technology-specific capacity factors. The undeveloped potential represents the difference between the developed capacity and the total potential capacity. The percent of 2009 generation is calculated for each technology based on the total electricity generated in Kentucky in 2009 as reported by EIA (2011b). The percent of 2025 generation is calculated based on an estimated growth rate for electricity demand of 1.5% as projected by KU and LG&E (2011b). MWe represents “megawatt-equivalent.”
Our review also finds that the cost of energy resulting from developing most of these technologies is on par with the cost of energy generated by most of Kentucky’s utilities from traditional fuels such as coal and natural gas, or will be so in the near future. When policy and financial supports are in place and when the added economic and social benefits are considered, the cost of distributed energy development looks better still. Additionally, technological advancements are resulting in vast improvements in efficiency and rapid declines in cost for many of these technologies.

21 | P a g e
3.1 Solar photovoltaic electricity generation
Solar PV systems convert energy from sunlight directly into electricity. Solar panels are typically rated at around 200 watts (W). Since each individual panel generates only a small amount of electricity, most systems typically include multiple panels. These systems can be roof-mounted or ground-mounted, and can generate electricity for use onsite and/or for sale into the grid.
Solar PV is a rapidly expanding form of electricity generation in the US. Led by California and New Jersey, approximately 883 MW of grid-tied solar PV capacity was installed in the US in 2010, which was more than double the capacity installed in 2009. At the end of 2010, total installed capacity in the US was 2,137 MW. By comparison, total installed capacity in 2000 was only 18.1 MW; therefore, grid-tied solar PV capacity has grown by an average annual rate of 62% since 2000 (Barbose et al., 2011) (see Figure 6).
Due to strong policy and financial supports, other countries have experienced even greater growth. For instance, Germany—which receives far less solar radiation than nearly anywhere in the continental US, including Kentucky—installed 7,400 MW in 2010 alone, more than triple the total installed capacity of the US. Globally, solar PV capacity grew from 16,000 MW to nearly 40,000 MW from 2008 to 2010 (EPIA, 2011).
Figure 6: Annual and cumulative solar photovoltaic capacity growth in the US, 1998-2010
Source: Barbose et al. (2011).
Of the total capacity installed in 2010, 30% was on residential buildings, 39% on commercial and other non-residential buildings, and 32% by electric utilities (Barbose et al., 2011). The average size of all solar PV systems has increased steadily since 2000. The average system size varies from state to state depending on available incentives, interconnection standards, net metering regulations, solar resources, retail electricity rates, and other factors (Sherwood, 2011).
0
500
1,000
1,500
2,000
2,500
0
100
200
300
400
500
600
700
800
900
1,000
1998 1999 2000 2001 2002 2003 2004 2005 2006 2007 2008 2009 2010
Cu
mu
lative cap
acity (MW
)
An
nu
al c
apac
ity
(MW
)
Year
US Annual capacity additions
US Cumulative capacity
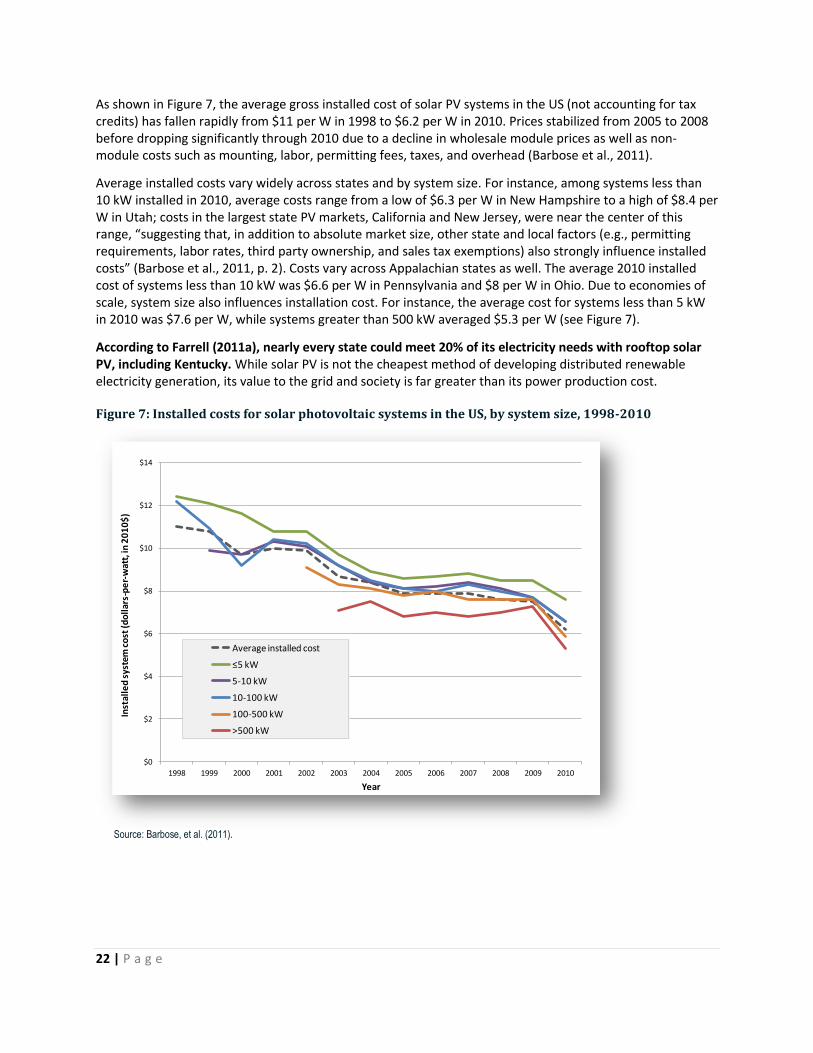
22 | P a g e
As shown in Figure 7, the average gross installed cost of solar PV systems in the US (not accounting for tax credits) has fallen rapidly from $11 per W in 1998 to $6.2 per W in 2010. Prices stabilized from 2005 to 2008 before dropping significantly through 2010 due to a decline in wholesale module prices as well as non-module costs such as mounting, labor, permitting fees, taxes, and overhead (Barbose et al., 2011).
Average installed costs vary widely across states and by system size. For instance, among systems less than 10 kW installed in 2010, average costs range from a low of $6.3 per W in New Hampshire to a high of $8.4 per W in Utah; costs in the largest state PV markets, California and New Jersey, were near the center of this range, “suggesting that, in addition to absolute market size, other state and local factors (e.g., permitting requirements, labor rates, third party ownership, and sales tax exemptions) also strongly influence installed costs” (Barbose et al., 2011, p. 2). Costs vary across Appalachian states as well. The average 2010 installed cost of systems less than 10 kW was $6.6 per W in Pennsylvania and $8 per W in Ohio. Due to economies of scale, system size also influences installation cost. For instance, the average cost for systems less than 5 kW in 2010 was $7.6 per W, while systems greater than 500 kW averaged $5.3 per W (see Figure 7).
According to Farrell (2011a), nearly every state could meet 20% of its electricity needs with rooftop solar PV, including Kentucky. While solar PV is not the cheapest method of developing distributed renewable electricity generation, its value to the grid and society is far greater than its power production cost.
Figure 7: Installed costs for solar photovoltaic systems in the US, by system size, 1998-2010
Source: Barbose, et al. (2011).
$0
$2
$4
$6
$8
$10
$12
$14
1998 1999 2000 2001 2002 2003 2004 2005 2006 2007 2008 2009 2010
Inst
alle
d s
yste
m c
ost
(do
llar
s-p
er-
wat
t, in
20
10
$)
Year
Average installed cost
≤5 kW
5-10 kW
10-100 kW
100-500 kW
>500 kW

23 | P a g e
3.1.1 Environmental and economic benefits
Solar PV can serve as an important component of a state’s electricity portfolio due to its numerous benefits (see Section 2.3). The economic values for three of these benefits are estimated as follows:
The economic benefit of solar PV for electric utilities and customers in New York is between 15 and 41 cents per kWh (Perez et al., 2011).
The environmental and health-related benefits of solar PV amount to 3-6 cents per kWh, as the electricity from solar power displaces the negative impacts associated with mining, drilling, and emissions resulting from fossil fuel-based generation (Perez et al., 2011).
Electrical outages associated with centralized power cost the US economy $80-100 billion each year, and add 29-45% to the cost of US power (Casten and Downes, 2005). Research also suggests that 1,000 community-scale solar PV plants totaling 500 MW of capacity dispersed across the Northeast US could have prevented the 2003 blackout and saved the economy $6 billion (Farrell, 2011a).
Solar PV creates more jobs per MW of installed capacity than traditional energy sources such as coal, natural gas, and nuclear (see Table 3). For this reason, expanding solar PV can help increase employment while diversifying local and state economies. Over the life of the system, developing a MW of solar PV generates 1.29 jobs in construction, installation, and manufacturing and 0.37 jobs in operations and maintenance, for a total of 1.66 jobs per MW (Sterzinger, 2006).
Table 3: Average job creation per megawatt of generating capacity, by energy source
Resource
Construction, installation,
manufacturing Operations and
maintenance Total
Solar photovoltaic 1.29 0.37 1.66
Coal 0.21 0.59 0.80
Natural gas 0.03 0.77 0.80
Nuclear 0.38 0.70 1.08
Sources: As cited in Wei et al. (2010), solar PV estimates from Sterzinger (2006), coal estimates from Singh and Fehrs (2001), natural gas estimates from Heavner and Churchill (2002), and nuclear estimates from Kenley et al. (2004). Note: these values represent the average number of jobs created over the life of the system.
Additionally, an Iowa model of the economic impacts of developing 300 MW of solar energy found that 5,000 jobs would be created—not including manufacturing or operations and maintenance jobs—and $332 million would be added to Iowa’s economy. Overall, the US solar industry is growing, with over 120,000 grid-tied systems installed and nearly 100,000 jobs created in the solar industry through 2010, “putting thousands of people to work in highly skilled and well-paid solar industry jobs each year” (Iowa Policy Project, 2011, p. 7).
3.1.2 Issues and challenges
There are four main economic and political impediments to solar PV development in Kentucky: (1) the cost of developing solar PV remains high despite the sharp declines in prices in recent years; (2) the price of electricity in Kentucky is still low compared to the levelized cost of solar; (3) unfounded beliefs in high infrastructure, operational (backup), and management costs associated with distributed solar generation are pervasive, leading to a failure to recognize and reward the numerous benefits to the grid and utilities provided by distributed energy; and (4) as a result of some or all of these interconnected issues, there is a lack of sufficient governmental support for solar PV in the form of public policy or financial supports.
24 | P a g e
Regarding the cost of developing solar PV, there are two issues to consider. First, permitting costs for smaller systems (5 kW or less)—suitable for residential or commercial buildings—account for 10-17% of the installed cost. As module and installation costs continue to fall, the fixed permitting costs may inhibit solar PV from achieving grid parity with traditional energy sources. Implementing more efficient and standardized permitting best-practices could reduce permitting costs by up to 75% (Farrell, 2011b). Second, the cost of solar PV has declined rapidly, and projections indicate that this trend will continue (Sherwood, 2011). As costs continue to fall, the gap between the price of electricity from solar and conventional fuels will shrink, especially as the price of electricity in Kentucky continues to rise with increasing fuel and regulatory costs.
As for the belief that distributed solar generation will impose additional costs for utilities and grid operators as a result of short-term, rapid changes in energy output and unreliable production, a growing body of research has concluded that increased development and geographic dispersion of solar PV systems can eliminate these concerns. As solar PV penetration increases, the aggregated output stabilizes, thereby reducing the resources required to accommodate and manage the variability experienced at low penetration rates (Mills and Wiser, 2010). Research also shows that the costs are negligible or, at worst, manageable up to and even greater than 30% penetration, and the benefits to the grid provided by distributed energy generation actually reduce overall costs for electric utilities (Farrell, 2011a) (see Section 2.3). For instance, the value of distributed generation to the grid in Kentucky is estimated at 8.5 cents per kWh (Farrell, 2011c).
Partially as a result of the lack of information on the costs and benefits of distributed energy, the economic benefits are not being recognized or rewarded, despite the fact that these benefits exceed the power production costs (Farrell, 2011a). This results in a lack of sufficient public policies or financial supports for all distributed energy technologies.
Federal incentives, improvements in capital markets, and declines in installed costs have all supported the growth in solar PV. However, state policies and incentives play the most important role in encouraging investment by removing barriers to solar energy development (Sherwood, 2011). State RPS requirements have led to the creation of strong SREC markets, resulting in increased demand for distributed solar installations; of the top 10 states for solar PV development, six have state or utility rebate programs that have been the most significant driver of solar market growth (Sherwood, 2011).
3.1.3 Prospects for solar photovoltaic electricity in Kentucky
Kentucky’s solar resource is roughly equal to that of other Appalachian states, many of which have made great strides in developing distributed solar PV in recent years while Kentucky has developed very little (see Section 3.1.3). For instance, through 2010, the Appalachian states of Pennsylvania, Maryland and New Jersey had developed approximately 55, 11, and 260 MW of solar PV capacity, respectively. By comparison, total installed capacity in Kentucky was 0.2 MW (see Table 4). This discrepancy suggests that development is less constrained by resource availability than by supporting policies. Kentucky’s energy plan supported this conclusion: “the lack of significant development of solar energy in Kentucky is not because of a lack of solar energy resource, but rather, a reflection of historical economic conditions which have favored fossil-based energy resources” (Beshear, 2008, p. 32).
Kentucky has a sufficient solar resource for rapid growth in solar PV
development, but the state lacks targeted policies supporting
renewable energy and distributed generation, and few incentives have
been provided for promoting solar PV.

25 | P a g e
In other words, Kentucky has a sufficient solar resource for rapid growth in solar PV development, but the state lacks targeted policies supporting renewable energy and distributed generation, and few incentives have been provided for promoting solar PV.
Table 4: Solar irradiance, photovoltaic capacity, and supporting policies and incentives in select states
Solar irradiance (kWh/m
2/day)
Solar PV capacity, 2010 (MW)
Portfolio standard? SREC?
State/local incentives
North Carolina 5.2 40.0 Yes Yes Various financial
Virginia 5.0 2.8 Voluntary No Various financial
Maryland 4.8 10.9 Yes Yes Various financial
Pennsylvania 4.8 54.8 Yes Yes Various financial
Tennessee 4.8 4.7 No No Various financial
Kentucky 4.7 0.2 No No Various financial
West Virginia 4.6 0.1 Voluntary No Tax credit
Ohio 4.5 20.7 Yes Yes Various financial
New Jersey 4.7 259.9 Yes Yes Various financial
California 6.6 1,021.7 Yes TREC Feed-in-tariff;
various financial
Sources: Solar irradiance from The Solar Foundation (2011) and NREL’s PV Watts Viewer (2011a); installed solar PV capacity from The Solar Foundation (2011) and NREL’s Open PV Project database (2011b); policy and incentive information from The Solar Foundation (2011) and the Database of State Incentives for Renewable Energy (IREC, 2011). Note(s): since reporting is voluntary, data for some installations are likely missing from the NREL database for many states, including Kentucky. One example is the Berea Municipal Utilities’ community-supported solar farm. The overall portfolio requirement in West Virginia is mandatory, but includes both “alternative” and renewable energy resources; there is no specific requirement for renewables.
The primary reason for the difference in solar energy development between Kentucky and the states of Pennsylvania, Maryland and New Jersey is that each of the three states has enacted a mandatory RPS and has created an SREC market by requiring a certain percentage of electricity generation to come from solar energy. Figure 8 illustrates the significant difference in the development of solar PV in the coal-producing states of Kentucky, Maryland, Ohio, Pennsylvania, Tennessee, Virginia, and West Virginia.
The states outlined in orange have enacted a mandatory RPS with a solar carve-out, and have experienced significant growth in the development of solar PV capacity as a result. Other than Tennessee—which does not have a RPS but has strong utility incentive programs provided through TVA—states that lack these policies are lagging far behind, particularly Kentucky and West Virginia.

26 | P a g e
Figure 8: Solar photovoltaic installations and existence of supporting policies in Appalachian states
Source: Solar insolation data from NREL (2011a); self-reported data for solar installations from NREL’s Open PV Project database (NREL, 2011b). Note(s): Note(s): since reporting is voluntary, data for some installations are likely missing from the NREL database for many states, including Kentucky. One example is the Berea Municipal Utilities’ community-supported solar farm. NREL cross-checks the self-reported data with other reported estimates of state-level capacity and finds that total state capacity falls within a reasonable range of these other estimates.
Two studies have estimated Kentucky’s potential for solar PV capacity and electricity generation. One assumes the development of only 15% of Kentucky’s total solar potential, and estimates a maximum feasible capacity for solar PV of 5,639 MW—including from both roof- and ground-mounted systems. This would amount to 24% of Kentucky’s total installed generating capacity in 2009. Using a 15% capacity factor, 5,639 MW of solar would generate 7.4 million MWh of electricity, amounting to 8% of Kentucky’s 2009 electricity generation (see Table 5) (EIA, 2011a and b).

27 | P a g e
A second estimate concludes that full utilization of Kentucky’s solar resource could achieve even greater development of solar PV, with roof-mounted solar PV providing 19% of total electricity generation and ground-mounted systems another 51% (Farrell, 2011c), equating to 70% of total 2009 electricity generation, or approximately 63.4 million MWh. At a 15% capacity factor, this would equal the development of 35,000 MW of ground-mounted PV capacity and 13,000 MW of roof-mounted capacity (see Table 5).
Table 5: Estimated potential for solar photovoltaic capacity and electrical generation
Potential capacity (MW)
Percent of state generating capacity
Potential generation (million MWh)
Percent of state electricity generation
SACE (2009)
Roof 111 0% 0.1 0%
Ground 5,528 23% 7.3 8%
Total 5,639 24% 7.4 8%
Farrell (2011c)
Roof 13,000 54% 17.1 19%
Ground 35,000 146% 46.0 51%
Total 48,000 200% 63.1 70%
Sources: SACE estimates of potential capacity taken directly from SACE (2009), with estimates of potential generation calculated using a 15% capacity factor. Percent of state electricity generation was then calculated using data from EIA (2011b). Farrell estimates for potential capacity were back-calculated using estimated percent of state generation that could be provided by solar (Farrell, 2011c), state generation data from EIA (2011b), and a 15% capacity factor. Percent of state generating capacity was calculated by dividing potential solar capacity by total state generating capacity from EIA (2011a). Note: SACE estimates are based on development of only 15% of Kentucky’s solar PV potential; Farrell’s estimates are based on full utilization of that capacity.
New Jersey—which requires 5.3 million MWh of solar by 2026—added 132 MW of grid-tied solar PV in 2010. Because New Jersey has a significantly smaller solar resource than Kentucky, we conclude that strong support for solar PV in Kentucky could achieve an even higher level of development than New Jersey: 150 MW. Developing 150 MW each year starting in 2012 would result in a cumulative capacity of 1,650 MW by 2022, which represents only 30% of SACE’s conservative estimate. At a 15% capacity factor, this would generate 2.2 million MWh of electricity annually.
Assuming that demand grows 1.5% per year from 2009 to 20223 and that efficiency improvements are minimal, solar PV could then provide 2% of total generation in 2022. Notably, 2.2 million MWh is double what would be required to achieve the target of 1% from the combination of various solar technologies as was proposed in the CEOA (see Section 5.1) (Kentucky Legislative Research Commission, 2012a).
The job impacts from this effort would be significant. Based on the estimate of 1.66 total jobs created per MW of developed capacity (See Table 3), 1,650 MW of solar PV would generate 2,740 jobs in the Kentucky solar industry by 2022. However, while other Appalachian states such as Virginia, Pennsylvania, and Maryland are experiencing strong employment growth in their respective state’s solar industries—totaling over 8,000 jobs as of 2010 (The Solar Foundation, 2011)—Kentucky has yet to take advantage of the growing market.
In summary, Kentucky has vast potential for developing distributed energy from solar PV. Achieving even a modest level of development over the next decade is highly feasible and could generate thousands of new jobs while diversifying the state’s energy portfolio. Doing so would provide numerous benefits to the grid, reducing the costs for utilities of generating electricity while helping to stabilize electricity prices for customers. Solar PV development has started to happen in Kentucky (see the following Case study). However, such development is limited, and Kentucky policymakers could do more to support the growth of solar PV.
3 This projection assumes that all utilities in the state will have approximately the same rate of growth that LG&E and KU (2011b) projected for their service territory, prior to the impact of energy efficiency programs.

28 | P a g e
Case study: Berea Municipal Utilities’ community supported solar farm
Ownership: Berea Municipal Utilities (BMU) is owned by the City of Berea, Kentucky. Customers participating in the program lease solar panels from the utility.
Stated purpose: “To provide customers who want to invest in local solar generation an opportunity to do so. The program invites community members to come together in moving Berea toward a better energy future” (BMU, 2011).
Program details:
Customer cost: One-time investment of $750 per panel, 235 watts per panel
Average price: $3.19 per watt
Lease period: 25 years
Cost of electricity: The average price of electricity for each panel amounts to 9.7 cents per kWh over 25 years. The average price of electricity for Berea’s customers in 2009 was 7.2 cents per kWh (EIA, 2010a), which is anticipated to increase by 5% per year (BMU, 2011).
System size: The program is being developed in phases. Each phase consists of 60 panels, for a total of approximately 14 kW per phase.
Other details: The two-panel limit only applies for the first 60-panel array. The panels are owned and maintained by BMU and located on BMU property. Participating customers receive a credit on their monthly bill for the electricity generated by the panels they lease.
Financing: Financing for the initial array was provided through an Energy Efficiency and Conservation Block Grant from USDOE and the State of Kentucky. Subsequent arrays will be financed solely through customer participation.
Key benefits: Allowing people of all income levels to participate in solar energy, greater local retention of income, the opportunity to support local nonprofits and churches, and reducing energy price volatility.
Photo obtained from http://bereautilities.com/

29 | P a g e
3.2 Solar heating and cooling
Solar PV is not the only technology available for harnessing solar energy. Solar heating and cooling—collectively known as solar thermal—also represent growing uses of solar power, and actually stand as the least expensive solar technologies available, providing the greatest return for the least investment. Solar thermal systems offer a wide variety of uses such as heating water for residential or commercial use, heating spaces such as houses or offices, or even providing heat for industrial processes or space cooling (Sherwood, 2011). These systems accounted for 71% of all solar installations in the US between 1994 and 2010, and 52% of installations in 2010. In terms of capacity, they amounted to 814 thermal MW4 (MWt) of installed capacity in 2010, accounting for 47% of total installed solar capacity (see Table 6). Of this, approximately 20% were for heating and cooling and 80% for solar pool heating (Sherwood, 2011).
Table 6: Installations of solar energy systems in the US, by technology, historically and for 2010
Installations,
1994-2009 Percent of
total Installations,
2010 Percent of
total
Installed capacity,
2010 (MW) Percent of
total
Solar pool heating 354,000 40% 22,000 18% 656 38%
Solar heating and cooling 274,000 31% 42,000 34% 158 9%
Grid-connected photovoltaics 154,000 17% 52,000 42% 883 51%
Off-grid photovoltaics 104,000 12% 8,000 6% 50 3%
Total 886,000
124,000
1,747
Sources: Sherwood (2011), except for 2010 installed capacity for grid-connected PV, which is from Barbose et al. (2011).
Solar hot water systems use a system of tubes and collectors to provide all or part of the water heating needs for a building. The primary components include solar collectors (commonly flat plate or evacuated tubes), a hot water storage tank, and a circulation system. With a typical residential solar water heating system, a heat transfer fluid captures the solar energy and is circulated through the collectors and then through insulated pipes to a heat exchanger. At the heat exchanger, the fluid transfers its heat to the home water supply. This heated water is then stored in an insulated tank until needed, which is often the existing home water tank (KYSEA, 2009). By providing pre-heated water to the existing tank, solar hot water heaters reduce or even eliminate the energy required from gas or electricity to maintain the set water temperature in the tank. During the summer months, solar hot water heaters can provide up to 100% of a home’s water heating needs, and typically provide 50-80% of water heating demand over the course of a year (KREC, 2008).
A typical residential solar hot water system has a capacity of 60-80 gallons for a household of three or four people. Such a system can cost $2,000 to $4,000, depending on the type of system, the amount of hot water used each day, whether a new storage tank is required, the size of the home, whether the system is installed by the homeowner or professional contractor, and available tax credits and rebates. The annual financial savings will depend on the type of fuel used by the conventional water heater, its cost, and the amount of water used. As energy costs rise, financial savings increase and payback periods decrease (KYSEA, 2009).
The US solar hot water industry is generally driven by markets in five key states: Florida, California, Arizona, Hawaii, and Oregon, which collectively represent over 60% of national demand (EIA, 2011h). Of all solar hot water system shipments in 2009, 86% provided hot water, 6.5% space heating, and 6% a combination (EIA, 2011i). Residential systems accounted for 84% of all solar hot water installations in 2010 (Sherwood, 2011).
4 A MWt is essentially the same as an electrical MW, except that it serves as a measure of the generating capacity of a heat-generating system rather than one that generates electricity. Sherwood (2011) notes that data sources usually report installed solar thermal capacity in units of area, typically square feet. To convert the installed area to a measure of capacity, Sherwood (2011) uses a conversion factor of 0.65 thermal kW (kWt) per square foot. Therefore, one MWt of solar hot water heating capacity represents approximately 15,385 square feet of installed solar water heating. As the typical residential solar water heating installation is 50 square feet in area (Sherwood, 2011), one MWt of solar water heating represents the equivalent of approximately 300 residential systems.

30 | P a g e
Solar pool heating is the most common, fastest growing, and least expensive form of solar heating and cooling. Approximately 80% of all solar thermal installations in 2010 were for solar pool heating. These systems are 6-10 times cheaper per unit energy than solar hot water systems, and therefore represent a better investment (SEIA, 2010). Incentives and rebates for commercial systems have spurred massive growth in the commercial market. Should these incentives continue, and should more states add similar programs, market growth will continue. Residential applications will also grow, but at a slower pace, as incentives for residential solar pool heating systems exist in only a few states and are relatively modest (Sherwood, 2011).
Finally, there is an emerging market for solar thermal process heating systems, which use the sun to power industrial processes (Sherwood, 2011). Installations of these systems accounted for 5% of the total solar heating and cooling market in 2009, up from 0.3% in 2008 (EIA, 2011i).
3.2.1 Environmental and economic benefits
Solar thermal systems provide significant environmental benefits, as they reduce the demand for energy from conventional sources of heat and electricity such as fossil fuels and nuclear power. This helps improve air and water quality and reduces emissions of carbon dioxide (KYSEA, 2009). As an example, installing a single 64 square foot solar hot water heater on 20% of the new homes built in Kentucky between now and 2025 would reduce carbon dioxide emissions by 0.23 million tons each year (KREC, 2008).
Economically, solar thermal systems can save energy, lower total energy costs, provide security against rising fuel prices, and create jobs. For example, solar hot water systems can provide 50-80% of a household’s or business’s annual water heating needs (KREC, 2008). For a typical home, the annual savings can amount to $180 to $500, depending on the fuel source being displaced (KYSEA, 2009). Using these savings, Table 7 estimates the payback period for a typical solar hot water system in Kentucky, with and without accounting for federal tax credits and Kentucky’s solar rebate. Not accounting for these incentives, the estimated system cost is $3,000; with the incentives, the cost of the system is reduced to $1,600.
Table 7: Estimated cost and payback period for residential hot water systems
System cost
Payback (years) at annual savings of $180
Payback (years) at annual savings of $500
No incentives $3,000 16.7 6.0
With tax credit and rebate $1,600 8.9 3.2
As for job creation, under the 20% market penetration scenario, 840 new jobs would be created for installers and retailers of solar hot water heaters (Colliver et al., 2008), and according to a recent survey, 40% of nationwide respondents representing solar water or pool heating installers and technicians anticipated hiring new workers in 2011 (The Solar Foundation, 2011).
3.2.2 Issues and challenges
Because solar thermal systems are so cost-effective and provide a relatively short payback period, there are few barriers for residents and business owners to install them. Some factors, however, may limit the feasibility of solar thermal for both residents and businesses in Kentucky, including low individual, family or business income levels, lack of exposure to the sun, and/or insufficient state incentives.
The lack of specific data on solar thermal installations in Kentucky makes it difficult to assess the extent to which these factors limit development. However, as described in Section 2.2, the average monthly utility bill for homes in Kentucky is higher than 29 other states, and more than 40% of Kentucky homes use electricity for heat (EIA, 2009b). Therefore, it can be expected, particularly as electricity prices rise, that heating costs for many homes in Kentucky will also rise, making solar hot water or space heating systems more attractive.

31 | P a g e
Finally, even though companies exist in Kentucky that install solar thermal systems, should the solar thermal industry grow, these and newer companies may experience difficulty hiring workers with sufficient knowledge or experience. According to a recent survey, 24% of national respondents looking to hire solar water or pool heating installers or technicians experienced “great difficulty” hiring experienced workers, while another 38% had “some difficulty,” even though 53% of employers reported receiving a sufficient number of applications for job openings (The Solar Foundation, 2011).
There are likely to be other impediments to expanding the solar thermal industry in Kentucky. To ensure that Kentucky takes full advantage of the economic opportunity provided by the solar heating and cooling industries, these impediments should be examined further and policies implemented to help overcome any and all barriers. A few incentives are available for solar thermal systems in Kentucky, but the state is one of only a handful that do not offer incentives for solar pool heating systems.
3.2.3 Prospects for solar heating and cooling in Kentucky
According to the Kentucky Sustainable Energy Alliance (KYSEA), "Kentucky’s climate is well-suited for solar hot water systems...[which] are cost-effective in Kentucky at today’s energy prices, meaning they can pay for themselves in a reasonable amount of time” (KYSEA, 2011, unnumbered). While this is true, existing data fail to provide a measure of the level of development of solar thermal systems in Kentucky, and anecdotal information suggests that this technology is not widely used. Many factors may contribute to this, including simply a lack of awareness on the part of home and business owners.
According to Kentucky’s energy plan, installing modest-sized systems on 20% of all new homes built by 2025 would displace 2.0 trillion Btu of energy (Beshear, 2008), or the equivalent of 586,000 MWh of electricity generation every year.5 Based on an estimate of 1 MW of solar hot water heating capacity per 300 homes (see footnote 4) and an estimated 1.7 million housing units in Kentucky (US Census Bureau, 2012), installing solar water heating systems on 20% of existing homes would displace 33.4 trillion Btu of energy, or the equivalent of 9.8 million MWh of electricity generation every year.
Regardless of the true potential for developing solar heating and cooling capacity in Kentucky, its potential growth is significant. Kentucky can do more to support the development of solar thermal industries and distributed renewable heat energy.
5 Including non-residential applications, the estimated potential reduction in energy consumption from solar hot water heating could amount to 3.4 trillion Btu, which is equivalent to nearly 1 million MWh of electricity generation (Beshear, 2008).
“Kentucky’s climate is well-suited for solar hot water
systems...[which] are cost-effective in Kentucky at today’s energy prices, meaning they can
pay for themselves in a reasonable amount of time”
(KYSEA, 2011)

32 | P a g e
3.3 Small-scale and community-owned wind
Wind power is the fastest growing source of renewable energy in the US. However, wind installations have been dominated by utility-scale wind turbines developed in large arrays of hundreds of MW. These arrays, commonly referred to as wind farms, are considered centralized systems of electricity generation. Wind power serves as a source of distributed generation as well, however. There are two basic forms of distributed wind generation: small wind and community-owned wind. This section considers both.
Small wind is generally defined according to the size of the wind turbine; those less than 100 kW are considered small (AWEA, 2011). Modern small turbines typically have a hub height of 10 to 30 meters, while large turbines typically have a hub height of 70 to 100 meters (Wiser and Bolinger, 2011). Small turbines can provide distributed power directly to homes, farms, schools, businesses, industrial facilities, and even towns and municipalities, offsetting the need to purchase some portion of the host’s electricity from the grid.
The definition of small wind says nothing about whether arrays of small wind turbines can exceed 100 kW in total capacity. For the purposes of this report, we assume that small wind systems provide a portion or all of the onsite electricity needs of the installer (with the possibility of any excess power being sold to the distribution network for grid-tied systems), and therefore that small wind turbines will only be installed with the intent of providing distributed electricity generation.
While the cutoff for small wind stands at 100 kW, 96% of small wind turbines installed in 2010 had a capacity of less than 10 kW. In fact, the capacity of all small wind turbines installed in 2010 averaged just over 3 kW. For grid-tied units only, the average capacity was much higher: 8.4 kW. Most off-grid installations are less than 1 kW (AWEA, 2011).
Table 8 shows recent growth trends for the small wind market. Through 2010, 144,000 small wind turbines totaling 179 MW (179,000 kW) of capacity have been developed in the US. Annual installations and installed capacity of small wind turbines have grown rapidly over the last decade, as 44% of installations and 55% of installed capacity have occurred since 2000. Small distributed wind power is clearly a rapidly growing market. This trend is exemplified by the fact that annual installations have risen from 2,100 turbines and 2.1 MW in 2001 to over 7,800 turbines and 25.6 MW in 2010.
Table 8: Growth trends for the small distributed wind market in the US, 2001-2010
Year Number of
turbines Capacity
additions (kW) Average
capacity (kW) Sales revenue
(million $)
2001 2,100 2,100
2002 3,100 3,100
2003 3,200 3,200
2004 4,671 4,878 1.0 $17.2
2005 4,324 3,285 0.8 $11.1
2006 8,329 8,565 1.0 $35.8
2007 9,092 9,737 1.1 $43.1
2008 10,386 17,374 1.7 $73.5
2009 9,820 20,375 2.1 $91.0
2010 7,811 25,618 3.3 $139.2
10-year total 62,833 98,232 1.6 $410.8
All-time 144,000 179,000 1.2 n/a
Source: AWEA (2011).

33 | P a g e
In recent years there has also been a trend toward larger, grid-tied systems and higher capacity turbines. For instance, the installed capacity of turbines ranging from 1 to 10 kW—those most often used in the grid-tied residential market—grew from a total of less than 2 MW in 2006 to 8 MW in 2009, while sales of turbines ranging from 11 to 100 kW—often used for grid-tied commercial, industrial, and government applications—grew from 3 MW to nearly 10 MW (Wiser and Bolinger, 2011). As a result, the average capacity of installed turbines has risen from 1 kW in 2004 to 3.3 kW in 2010 (see Table 8) (AWEA, 2011).
Average costs for small wind turbines range from $3,000 to $6,000 per kW (not including installation costs), equating to a cost of electricity of 15 to 20 cents per kWh (AWEA, 2011). Even though they have a higher cost than utility-scale systems, small wind systems compete with retail rather than wholesale electricity prices, and retail prices are higher. Utility-scale systems typically compete with wholesale prices (NREL, 2008). As with any technology, the per-kW price decreases as the size of the turbine increases. The mean installed cost for small turbines 1 to 19 kW in size was $7,500 per kW from 2007 to 2009, and $5,100 per kW for turbines 20 to 100 kW in size (Wiser and Bolinger, 2011).
Even though the price of small wind energy is on par with that of solar PV, small wind has experienced much smaller growth due to issues of siting and permitting (AWEA, 2011). However, the small wind industry is experiencing strong growth that has been attributed to a large extent to federal tax incentives and a variety of state incentive programs. In fact, the availability and quality of state incentives and net metering policies are ranked as the most important factors in determining project feasibility, followed by the average annual wind speed of the site and the prevailing costs of electricity (AWEA, 2011).
States that offer small wind consumer incentives of $2,000 per kW have attracted the strongest share of the market, including California, New York, Massachusetts, Arizona, and Ohio (AWEA, 2011). As more states begin to provide incentives for distributed energy technologies, strengthen their net metering laws, and streamline the permitting process, the small wind industry will likely continue to experience strong growth. In fact, leading manufacturers of small wind turbines project that the US will install over 1,000 MW of new capacity between 2011 and 2015 (AWEA, 2011), which is more than five times the total installed capacity through 2010. This growth will be due in large part to strong net metering policies that open up markets for turbines 10 kW and above and to financial incentives for residential consumers, which strengthen markets for turbines 20 kW and smaller (AWEA, 2011).
Community-owned wind (hereafter referred to as simply “community wind”) represents another rapidly growing model of distributed wind energy, and is generally defined as a locally-owned commercial-scale wind project that optimizes local benefits. Locally-owned means that a local resident, a collection of resident landowners, or a community as a whole (e.g., a municipality) has a significant direct financial stake and decision-making authority in the development of the wind project (other than through land lease payments, tax revenue, or payments in lieu of taxes) (Windustry, 2011). Commercial-scale means projects are large enough to provide bulk power generation and sale to a retail electric utility company distributing electricity locally, or for distribution to a non-residential electricity user.
Community wind projects can range in size from a single 1 kW turbine owned by a school to a 50 MW wind farm consisting of 25 turbines with capacities of 2 MW each. For a community wind project to be a distributed wind project, it would have to primarily provide electricity locally. Community wind projects can meet this requirement even if they are on the scale of tens of MW, and in fact, the larger the turbine, the cheaper the cost of electricity. In this sense, distributed community wind provides greater opportunities for maximizing both the energy produced by distributed wind generation as well as local economic benefits (as described in Section 3.3.1).

34 | P a g e
Of the more than 25,000 MW of wind capacity installed at the start of 2009, approximately 1,090 MW was community-owned. Community wind projects existed in 27 states, although only four states made up 90% of total capacity: Minnesota, Washington, Nebraska and California (Daniels, 2009). Not all of these projects qualify as distributed generation, but this illustrates the vast potential for developing wind energy projects that can provide a significant portion of a community’s electrical needs while also being at least partially owned by the community. Under this model, the price of electricity will be lower as compared to the typical small wind installation, while the environmental and economic benefits will be maximized. However, the size of any distributed wind installation is dependent on the electricity demand and financial capability of the customer, so while larger wind turbines may be appropriate for municipally-owned projects, small wind is likely more appropriate for individual residents.
3.3.1 Environmental and economic benefits
The benefits of small and community wind are substantial. For small wind, a single residential-scale turbine displaces the carbon dioxide produced by 1.5 cars each year, and the 179 MW of installed small wind capacity in the US—which provides enough energy to power 20,000 homes—prevents the emission of 180,000 tons of carbon dioxide annually (AWEA, 2011). In terms of jobs, the small wind industry employed 1,500 full-time workers in 2010 in the manufacturing, installation, maintenance, and sales of the turbines. An estimated 50 full time jobs are created per MW of installed US wind capacity. While this number will shrink as the industry expands, if US manufacturers are correct in their prediction that 1,000 new MW of small wind will be installed by 2015, that means as many as 50,000 new jobs in the US (AWEA, 2011). Just as with solar PV, the job impact of small distributed wind is greater than for utility-scale installations, because developing wind in smaller increments requires more labor per unit of power produced.
Small wind systems also provide economic benefits for the turbine owner, the community, and the utility:
Turbine owners benefit through reduced utility bills, tax incentives and renewable energy credits. In addition to local jobs, the community also benefits from revenue derived from permit fees, sales tax and, in some cases, property taxes. Utility benefits include decreased distribution and maintenance costs, decreased fuel required to run plants, decreased demand on the distribution system, emission mitigation and increased ability to meet renewable portfolio standard requirements. Small wind systems supply power close to the point of consumption. This reduces the burden on the electric distribution system and increases energy security (AWEA, 2011, p. 20)
Small wind systems have several benefits and advantages over utility-scale wind development. These include:
Meeting onsite loads or offsetting retail purchases via net metering. Utility-scale wind projects usually produce electricity in excess of onsite needs, and in most states the maximum capacity allowed for net metering is too small to be of benefit to large projects.
Delivery costs for large wind—including transmission upgrades—can average 0.3 cents per kWh for every 100 miles of line, meaning that a 300-mile delivery of electricity from a centralized wind farm could cost almost 1 cent more per kWh than a distributed wind system (Farrell and Morris, 2008).
Smaller turbines have lower maintenance costs than large wind turbines; for example, they do not require a crane to perform maintenance (Farrell and Morris, 2008).
Community wind projects generate more local jobs and revenues than corporate-owned projects due to several factors. First, the wind projects are locally owned, meaning the revenues stay within the community. Second, owning the turbines provides greater revenues than leasing land to a private developer. Third, community projects tend to use local labor and materials during project development and operations, whereas privately-owned projects are less likely to do so. Fourth, community wind projects provide dividends to local shareholders and often patronize local banks for project financing (Lantz and Tegen, 2009).

35 | P a g e
Finally, all wind power projects are typically located in rural areas due to the property or project acreage required for proper turbine function and compliance with zoning codes; therefore, as with all wind development, community wind provides an opportunity for often-impoverished regions to diversify their economies. These impacts have been well documented, as “several studies have investigated the difference between local and absentee owned wind turbines and all have found substantial increases in economic benefits when turbines are locally owned, both in jobs and in total economic output,” and “in all but one of the studies, the economic impact of community wind projects more than tripled that of an absentee owned wind farm” (Farrell and Morris, 2008, p. 22).
3.3.2 Issues and challenges
Historically, one of the greatest issues facing all wind development in Kentucky has been the belief that Kentucky’s wind resources are insufficient for developing either small-scale or utility-scale wind power. For instance, it had been previously reported that Kentucky has the capacity to develop only 34 MW of wind power, including both small wind and utility-scale wind, and that the wind power potential is limited as a result of insufficient wind resources (Beshear, 2008). However, since the late 1990s, wind turbine technology and assessment capabilities have advanced significantly, and new estimates of Kentucky’s wind potential have been suggest the state has a stronger wind resource than previously believed (see Section 3.3.3). In addition, numerous companies have developed advanced technologies to identify regions with the greatest average wind speeds, and turbines are now taller, of greater capacity, and are more efficient (NREL, 2010). As a result, it is now well understood that substantial small- and utility-scale wind resources exist in Kentucky.
Despite the fact that more companies now use computer modeling to identify sites with small-wind potential, small-scale wind resources are not well understood. The best available wind resource maps only present wind resources at heights of 50, 80, and 100 meters above ground, which correspond to the hub heights of large-scale turbines. Therefore, without the benefit of time or funding to purchase direct measurement devices, small-turbine site assessors must extrapolate from these data to evaluate the wind resources for small systems, which typically reach no higher than 30 meters (AWEA, 2011).
Other issues may inhibit the development of distributed small and community wind in Kentucky, the most significant of which include permitting and zoning, utility resistance, competitive economics, fragile incentive programs, financing, and burdensome regulations (AWEA, 2011). The most prominent barriers to small wind projects have been identified as being: (1) that small projects do not enjoy economies of scale in terms of turbine pricing, construction costs, and operations and maintenance costs; (2) that fixed costs such as permitting, engineering, legal and financial expenses, and crane mobilization become a greater percentage of the project costs; (3) that interconnection costs are higher and more uncertain because interconnection to distribution systems are governed by state and local laws and regulations; and (4) that utilities may oppose or impede a project if they view it as a threat (Kandt et al., 2007).
For community wind projects consisting of large turbines that are likely to sell some of the generated electricity back into the grid, integration costs can be significant, amounting to between $5 and $10 per MWh (EnerNex Corporation, 2011). In addition, concentrated corporate ownership of land and ridgelines—which is a significant issue for mineral-producing regions of Appalachia (ALOTF, 1981)—serves as a barrier to community wind development by reducing the degree to which wind resources are available.
One of the greatest issues facing all wind development in Kentucky has
been the incorrect belief that Kentucky’s wind resources are
insufficient for developing either small-scale or utility-scale wind power.

36 | P a g e
Finally, there is a lack of policy geared specifically toward supporting wind-based distributed energy technologies. For instance, despite the documented benefits of community wind, none of the states in Appalachia has policies in place that specifically incentivize it, including Kentucky. Even Pennsylvania, which has a moderately strong RPS, does not require or incentivize small or community wind, and it only has a mandated distributed energy requirement for solar PV, thereby favoring solar over small wind.
3.3.3 Prospects for small and community wind in Kentucky
Kentucky’s wind resource is small relative to other US and Appalachian states; however, the state does have sufficient wind potential to develop a substantial amount of distributed small and community wind capacity. To date, the state has failed to take advantage of these opportunities, while surrounding states have instituted supporting policies and, as a result, have experienced relatively strong growth in small distributed wind (see Figure 9).
Through 2010, no industrial-scale wind had been developed in Kentucky, and AWEA does not report any small wind installations (AWEA, 2011). However, it has been estimated that Kentucky has substantial wind resources, although the size of the resource depends on turbine hub height and average capacity factor. For instance, at an 80 meter hub height and a 30% capacity factor, Kentucky’s estimated resource is 61 MW—nearly twice the previous estimate of 34 MW. At a 100 meter hub height, the estimated resource is more than 11 times greater, at 699 MW (NREL, 2010).6 Therefore, Kentucky can develop a substantial amount of community wind power since such projects are typically developed with large turbines.
As for small wind, as previously noted, the older estimate included the potential for both small- and utility-scale wind development at Class 3 or higher wind speeds. This suggests that a portion of the currently estimated 61 MW of wind potential at 80 meters is also viable for small wind development. For this study, no reports could be found which provide a specific estimate for small wind potential in Kentucky. Despite that, the estimates for utility-scale wind potential do suggest that there is a substantial amount of potential for small wind development. This is due to the fact that small wind turbines normally require no more than a Class 2 wind resource to be economically feasible (AWEA, 2011), and most of Kentucky has Class 2 or better wind resources.7 In other words, small wind turbines have lower wind speed requirements than large turbines, so more locations can accommodate and harvest wind for electricity generation (NREL, 2008).8
Based on available estimates of Kentucky’s wind energy potential at higher altitudes and wind speeds, the feasibility of applying community ownership models to large wind turbines, and the fact that small wind turbines can take advantage of lower wind speeds, we assume that Kentucky’s potential for developing small and community wind power amounts to a minimum of 61 MW. This amount of small and community wind could generate up to 130,000 MWh of wind energy annually.
Federal and state policies and incentives and a decline in small and large turbine costs have all supported the growth in wind power of all sizes across Appalachia. For instance, through 2010, Ohio had installed between 2,500 and 5,000 kW of small wind capacity, with more than 1,000 kW installed in 2010. Tennessee, Virginia, and North Carolina have each installed between 10 and 250 kW of cumulative small wind capacity, while Illinois has installed between 500 and 999 kW. Also in Appalachia, Maryland has installed between 250 and 500 kW, while Pennsylvania has installed between 10 and 250 kW. As noted, no small wind installations are reported for Kentucky (see Figure 9) (AWEA, 2011).
6 At a 100 meter hub height and a lower average capacity factor of 25%—conditions unlikely to be feasible in the short-term, but highly likely to be feasible at higher wholesale power prices —the estimated resource is 48,000 MW (NREL, 2010). 7 Class 2 wind resources are described by an average annual wind speed of 4.5 meters per second. According to the wind resource map produced for NREL by AWS Truepower, only limited portions of Kentucky exhibit an average wind speed of less than 4.5 meters per second: http://www.windpoweringamerica.gov/images/windmaps/ky_80m.jpg 8 It is useful to note that every MW of small wind potential can support 125 small 8 kW wind turbines (the average grid-tied small wind turbine in 2010 had a capacity of 8.4 kW).

37 | P a g e
In other words, Kentucky is surrounded by the growth of a small wind market, but has yet to encourage the growth of the industry in-state. However, it is reported that small wind is most cost-effective where utility rates are greater than 10 cents per kWh (AWEA, 2011), suggesting that merely a small increase in the average price of electricity for a number of Kentucky’s utilities will make small wind an affordable option for Kentucky’s electricity customers.
Figure 9: Distributed small wind power capacity in select Appalachian states through 2010
Source: AWEA (2011).

38 | P a g e
Spotlight: Support for community wind in Minnesota and Maine
Minnesota and Maine are leaders in community wind development. In 2005, the Minnesota Legislature enacted Community-Based Energy Development (C-BED) tariffs, which provide higher payments for the first 10 years to wind projects that are small-scale and locally owned. Higher up-front payments incentivize the development of community-based wind projects. Between 2005 and 2010, the C-BED program resulted in the installation of 17 community wind projects totaling 179 MW. An additional 199.8 MW of capacity in two community wind projects were under contract or negotiation by December 2010.
Table 9: Community wind projects in Minnesota, 2010
Project name County Year Number of
turbines Capacity
(MW)
Mountain Lake Cottonwood 2007 1 1.3
Wing River Wind Wadena 2007 1 2.5
Marshall Wind Farm Lyon 2008 9 14.7
Cisco Wind Energy Nobles 2008 4 8.0
Ewington Wind Farm Nobles 2008 10 20.0
GRE HQ Wind Turbine Hennepin 2008 1 0.2
Odin Cottonwood/Watonwan 2008 10 20.0
Brewster Wind Nobles 2008 1 2.1
Welcome Wind Martin 2008 1 2.1
Jeffers Cottonwood 2008 20 50.0
Hilltop Power Pipestone 2009 1 2.0
Willmar Kandiyohi 2009 2 4.0
Shakopee Mdewakanton Sioux Community
Scott 2009 1 1.5
Uilk Pipestone 2010 3 4.5
Woodstock Pipestone 2010 1 0.8
Grant County Grant 2010 10 20.0
Ridgewind Pipestone/Murray 2010 11 25.3
Total 13 counties 4 years 87 178.9
Source: Minnesota Department of Commerce (2010).
In 2009, Maine enacted a Community-Based Renewable Energy Act, which created a six-year pilot program that supports community wind by encouraging the State to “purchase its power from community-based renewable energy projects to the greatest extent possible,” and establishing a green power purchasing option allowing utility customers to voluntarily pay higher rates for electricity coming from community-based renewable energy facilities (Maine Rural Partners, 2009). Direct incentives include a dedicated long-term power-purchase agreement with fixed rates and the awarding of 150% multipliers to RECs, which provides additional value to the electricity generated. The Act also includes restrictions to ensure that increasing community wind development does not increase electricity rates, including limiting total program capacity to 50 MW and individual system capacity to 10 MW. The outcome of the Act is still emerging, but projects comprising the full 50 MW limit are at various stages in the planning process (Jones, 2011).

39 | P a g e
3.4 Forest biomass
Kentucky has a strong agricultural and forestry base, which lends itself to the harvesting of biomass for distributed energy production. Biomass is organic material that can be used to generate energy in the form of electricity, heat, and liquid fuels. Wood is by far the largest source of biomass currently in use, but other sources include food crops, grassy and woody plants, residues from agriculture or forestry, algae, and organic wastes. This section only addresses the potential for distributed generation of electricity from the use of underutilized primary forest residues; while secondary residues, primarily from saw- or pulp mills, are also available, most of these residues are already used as boiler fuel or for other applications (Beshear, 2008).
Biomass-based electricity generation is a relatively cost-effective renewable technology for Kentucky, but the economics generally require that the generating facility be located near the fuel source. In fact, forest biomass harvesting is normally only cost-effective where haul distances are short and when the biomass is being harvested simultaneously with higher value wood products (Caputo, 2009).
Primary forest biomass resources include the tops of trees, tree limbs and stems, which are often left to decompose in the forest following a timber operation. Because of the nature of their production, such resources are also known as logging residues. However, logging residues are not the only type of forest biomass available. Forest thinning and improved forest management both often involve the removal of small-diameter, low-value trees that may also be used as fuel for distributed electricity generation. While the costs associated with removing these trees are higher than those associated with collecting logging residue (Caputo, 2009), the development of distributed biomass generators may render the harvesting of low-value timber economically feasible (Han et al., 2008 and Arnosti et al., 2008, as cited in Caputo, 2009).
A variety of technologies can be used to convert forest biomass into energy for residential, commercial, and industrial uses. These systems range from capacities of less than 1 MW to greater than 100 MW and can generate electricity, space heat, or process heat (Badger et al., 2007). To generate electricity, the most common method is direct combustion: burning the biomass directly in a boiler. Other methods such as gasification (heating biomass at high temperatures in the presence of oxygen) or pyrolysis (heating biomass at high temperatures in the absence of oxygen) can be used as well. These technologies create a second fuel that is then burned in a boiler (Badger et al., 2007). In either process, the combustion heat is used to create steam, which turns turbines to generate electricity. As with coal, only about one-third of the energy in the wood is converted into electricity, with the remaining energy converted into waste heat. This waste heat can be captured in a CHP system in order to increase the efficiency of the system and further reduce consumption of conventional, centralized sources of heat and electricity (see Section 3.5).
3.4.1 Environmental and economic benefits
Using forest biomass for electricity generation provides environmental and economic benefits:
Not only is wood a ready substitute for fossil feedstocks…but it is a renewable, low carbon resource. If developed carefully, this resource can contribute substantially to [generating renewable electricity]…aid in the efforts to halt global climate change, revitalize rural economies, and, most importantly, provide a valuable tool for sustainable, science-based stewardship of our diverse forests and woodlands for a full range of environmental and social values (Caputo, 2009, p. 3).
More specific to Kentucky:
A well managed environmentally conscious approach to utilizing forest slash, inferior quality trees, and dedicated production for bioenergy can help Kentucky diversify its energy portfolio while protecting water quality, improving air quality, creating jobs, increasing tax revenue, and improving our state’s energy independence (Kentucky Division of Forestry, 2011, p. 1).

40 | P a g e
As with coal and natural gas, biomass-based power plants emit nitrogen oxides and sulfur dioxide. The amounts emitted depend on the type of biomass burned and the type of generator used. However, per unit of energy output, biomass contains much less sulfur and nitrogen than coal; therefore, when biomass replaces coal-fired electricity, sulfur dioxide and nitrogen oxides emissions decrease.
Although burning biomass also produces carbon dioxide, the primary greenhouse gas, these emissions are mitigated by the fact that plants take up carbon dioxide from the air while growing and then return it to the air when burned, thereby causing no net increase except for the energy used in harvesting and processing the biomass (Caputo, 2009). The true net carbon impact of biomass-based generation depends on harvest method and intensity, transportation distance, and other factors. Sustainable harvest and forest management practices can help minimize the emissions and other environmental impacts associated with the use of biomass for electricity generation, but it is important to note that the fuels being replaced—coal and natural gas—also must be mined, processed, and transported, and each of these processes add to the environmental impact of these conventional fuels as well.
Economically, forest managers and landowners view new markets for forest biomass as an opportunity to generate new revenue streams, which would add value to working forests and provide the potential to conserve forest resources and manage them sustainably. New revenue would help to offset the high costs of timber stand improvement and forest stewardship activities such as habitat restoration, hazardous fuel reduction, or wildlife habitat management (Caputo, 2009).
Distributed generation using forest biomass resources would also help stabilize and even reduce electricity costs, reduce environmental and health-related impacts of electricity generation, and provide a source of new jobs that would help diversify local economies. The added benefit of using biomass, however, is that it provides an opportunity to generate both electricity and heat, thereby enhancing the efficiency of the resource. In addition, any remaining material can be used for other beneficial purposes.
Co-firing biomass with coal generates 0.21 construction, installation, and manufacturing jobs and 1.21 operations and maintenance jobs per MW of co-firing capacity (Singh and Fehrs, 2001). Because expanding distributed biomass generation would result in the development of numerous small generating plants in addition to the added employment created by new demands for harvesting and processing, the job impacts of distributed biomass generation are likely much higher than these estimates. Even comparing biomass co-firing to coal-only generation, biomass creates more total jobs per MW (Singh and Fehrs, 2001).
3.4.2 Issues and challenges
Three key concerns associated with expanding biomass-based energy production are whether bioenergy is cost-effective and competitive with traditional fuels, whether it would impact existing industries by increasing competition for resources, and whether the added demand for forest resources would result in over-harvesting and poor management practices, thereby degrading the health of the forests.
There is a general belief that the high costs associated with the harvest, collection, and transport of forest biomass renders biomass-based energy noncompetitive with fossil fuels or other renewables, and that the costs increase with longer transportation distances, inappropriate harvesting equipment, and operator inexperience with biomass harvesting (Hummell and Calkin, 2005 and Li et al., 2006, as cited in Caputo, 2009). The real or perceived inability to harvest biomass cost-effectively is seen by many stakeholders as the biggest barrier to greater use of forest biomass resources for energy production (USGAO, 2006 as cited in Caputo, 2009). It is true that in some cases the use of forest biomass for energy production may not be cost effective, particularly if less-costly alternatives are available. However, this can only be determined on a case-by-case basis, and the economics could change if appropriate incentives are put in place.

41 | P a g e
To address the ecological impacts of harvesting logging residues and other forest materials for use in biomass generation, there is a concern that the failure to protect Kentucky’s forests from over-harvesting and poor management practices could jeopardize one of the state’s largest resources for renewable energy, threaten the sustainability of Kentucky’s forests, and harm traditional forest industries (Kentucky Division of Forestry, 2011). Harvesting forests for biomass energy production potentially removes much more woody material, such as smaller and less economically desirable trees, tree tops and limbs, and other down material normally left behind after harvesting. This could result in possible impacts to soil productivity, soil compaction, water quality and quantity, wildlife habitat, all of which influence forest sustainability (Kentucky Division of Forestry, 2011). Logging residue provides refuge and foraging habitat for many species of wildlife, is a source of soil nutrients, and supports forest regeneration following natural or man-made disturbances (Grushecky et al., 1998). These concerns should be addressed in any planning or policy-making efforts directed at regulating the management of forest resources. Understanding the amount of forest biomass resources available from logging residues and timber stand improvement will help ensure that demand is met in a sustainable manner.
The question of whether an expansion in biomass energy production would impact other wood-using industries must also be addressed. Doing so requires simply restricting distributed biomass generation to the sustainable use of underutilized forest resources or potential resources resulting from expanding sustainable forestry practices. However, the concern that additional pressures from an emerging energy sector could easily create conflict between industries and harm the forest resource base remains valid, and a “focus on forest management education and land-use policies will be necessary to ensure that Kentucky can provide a truly sustainable supply of woody biomass for all its needs” (Beshear, 2008, p. 37).
3.4.3 Prospects for distributed biomass in Kentucky
According to KREC (2008):
Kentucky has one of the most diverse hardwood species mixes in the nation with about 12 million acres of forestland. The Commonwealth is 47 percent forested. Eighty-nine percent of Kentucky’s forestland is privately owned. Kentucky’s timber industry generates more than $4.5 billion of revenue annually from the primary and secondary wood industries. There are more than 3,500 forest industries in the state. These industries employ more than 30,000 Kentuckians (p. 21).
Kentucky has a large potential for developing distributed electricity generation using logging residues and forest thinnings, as well as an experienced workforce for enhancing both the sustainability and productivity of Kentucky’s forests. In fact, it is estimated that Kentucky’s forest resource can potentially contribute more than 50% of the state’s renewable energy potential, including fuel production (Beshear, 2008).
As of 2007, Kentucky’s total biomass generating capacity was approximately 110 MW, of which only 5 MW was fueled primarily by wood waste (KREC, 2008). Previous estimates suggest that a total of 329 MW of biomass generating capacity could be fueled by Kentucky’s forest resources, generating 2.5 million MWh of electricity at an 85% capacity factor (SACE, 2011). This would amount to 3% of total state electricity generation in 2009. Achieving that level of generation would require approximately 1.5 million dry tons of forest biomass residues each year (see final row in Table 10).9,10
9 Estimates of the heat content (as measured in million Btus, or mmBtu) of forest biomass vary. However, a conversion rate of 17.2 mmBtu of heating potential per dry ton of forest biomass was provided by EIA (Smith, 2011) and reported by Antares Group, Inc. (1996). This is the conversion rate chosen for this study. 10 The calculation for estimating dry tons of forest biomass accounts for the fact that only one-third of the energy content is converted to useful energy (Vanderburg, 2011).
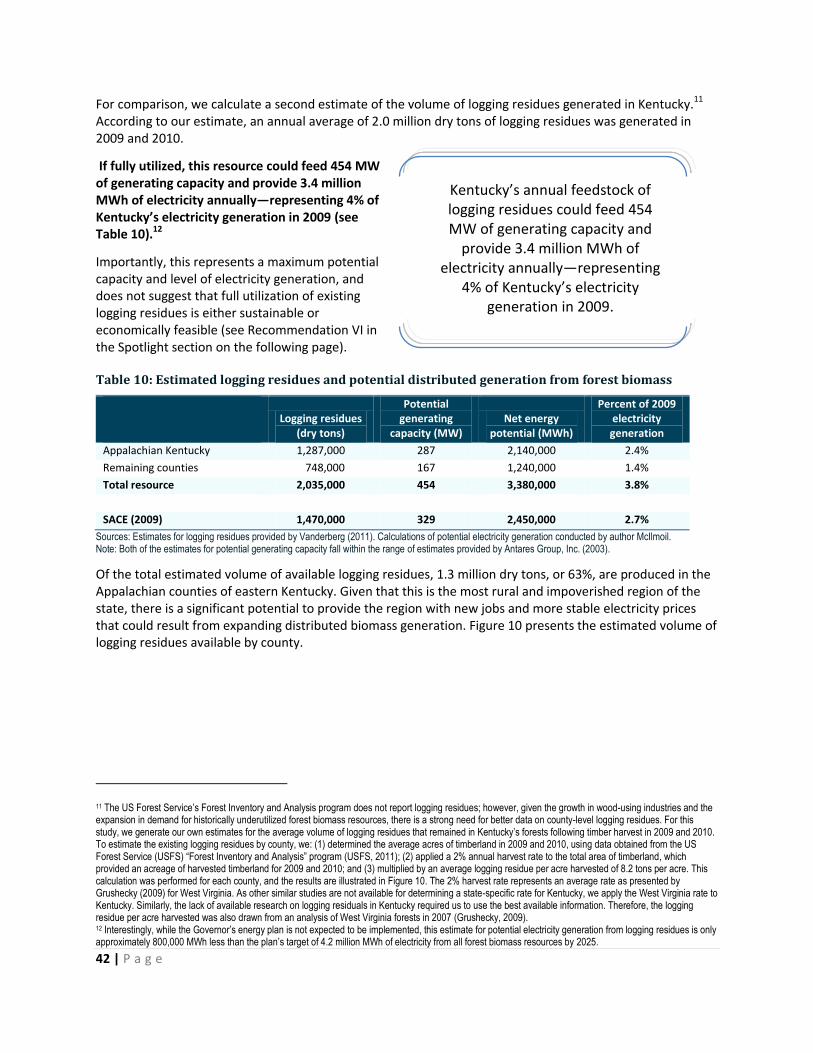
42 | P a g e
For comparison, we calculate a second estimate of the volume of logging residues generated in Kentucky.11 According to our estimate, an annual average of 2.0 million dry tons of logging residues was generated in 2009 and 2010.
If fully utilized, this resource could feed 454 MW of generating capacity and provide 3.4 million MWh of electricity annually—representing 4% of Kentucky’s electricity generation in 2009 (see Table 10).12
Importantly, this represents a maximum potential capacity and level of electricity generation, and does not suggest that full utilization of existing logging residues is either sustainable or economically feasible (see Recommendation VI in the Spotlight section on the following page).
Table 10: Estimated logging residues and potential distributed generation from forest biomass
Logging residues
(dry tons)
Potential generating
capacity (MW) Net energy
potential (MWh)
Percent of 2009 electricity generation
Appalachian Kentucky 1,287,000 287 2,140,000 2.4%
Remaining counties 748,000 167 1,240,000 1.4%
Total resource 2,035,000 454 3,380,000 3.8%
SACE (2009) 1,470,000 329 2,450,000 2.7%
Sources: Estimates for logging residues provided by Vanderberg (2011). Calculations of potential electricity generation conducted by author McIlmoil. Note: Both of the estimates for potential generating capacity fall within the range of estimates provided by Antares Group, Inc. (2003).
Of the total estimated volume of available logging residues, 1.3 million dry tons, or 63%, are produced in the Appalachian counties of eastern Kentucky. Given that this is the most rural and impoverished region of the state, there is a significant potential to provide the region with new jobs and more stable electricity prices that could result from expanding distributed biomass generation. Figure 10 presents the estimated volume of logging residues available by county.
11 The US Forest Service’s Forest Inventory and Analysis program does not report logging residues; however, given the growth in wood-using industries and the expansion in demand for historically underutilized forest biomass resources, there is a strong need for better data on county-level logging residues. For this study, we generate our own estimates for the average volume of logging residues that remained in Kentucky’s forests following timber harvest in 2009 and 2010. To estimate the existing logging residues by county, we: (1) determined the average acres of timberland in 2009 and 2010, using data obtained from the US Forest Service (USFS) “Forest Inventory and Analysis” program (USFS, 2011); (2) applied a 2% annual harvest rate to the total area of timberland, which provided an acreage of harvested timberland for 2009 and 2010; and (3) multiplied by an average logging residue per acre harvested of 8.2 tons per acre. This calculation was performed for each county, and the results are illustrated in Figure 10. The 2% harvest rate represents an average rate as presented by Grushecky (2009) for West Virginia. As other similar studies are not available for determining a state-specific rate for Kentucky, we apply the West Virginia rate to Kentucky. Similarly, the lack of available research on logging residuals in Kentucky required us to use the best available information. Therefore, the logging residue per acre harvested was also drawn from an analysis of West Virginia forests in 2007 (Grushecky, 2009). 12 Interestingly, while the Governor’s energy plan is not expected to be implemented, this estimate for potential electricity generation from logging residues is only approximately 800,000 MWh less than the plan’s target of 4.2 million MWh of electricity from all forest biomass resources by 2025.
Kentucky’s annual feedstock of logging residues could feed 454 MW of generating capacity and
provide 3.4 million MWh of electricity annually—representing
4% of Kentucky’s electricity generation in 2009.

43 | P a g e
Figure 10: Estimated logging residues in Kentucky, by county, average for 2009 and 2010
Source: Vanderberg (2011).
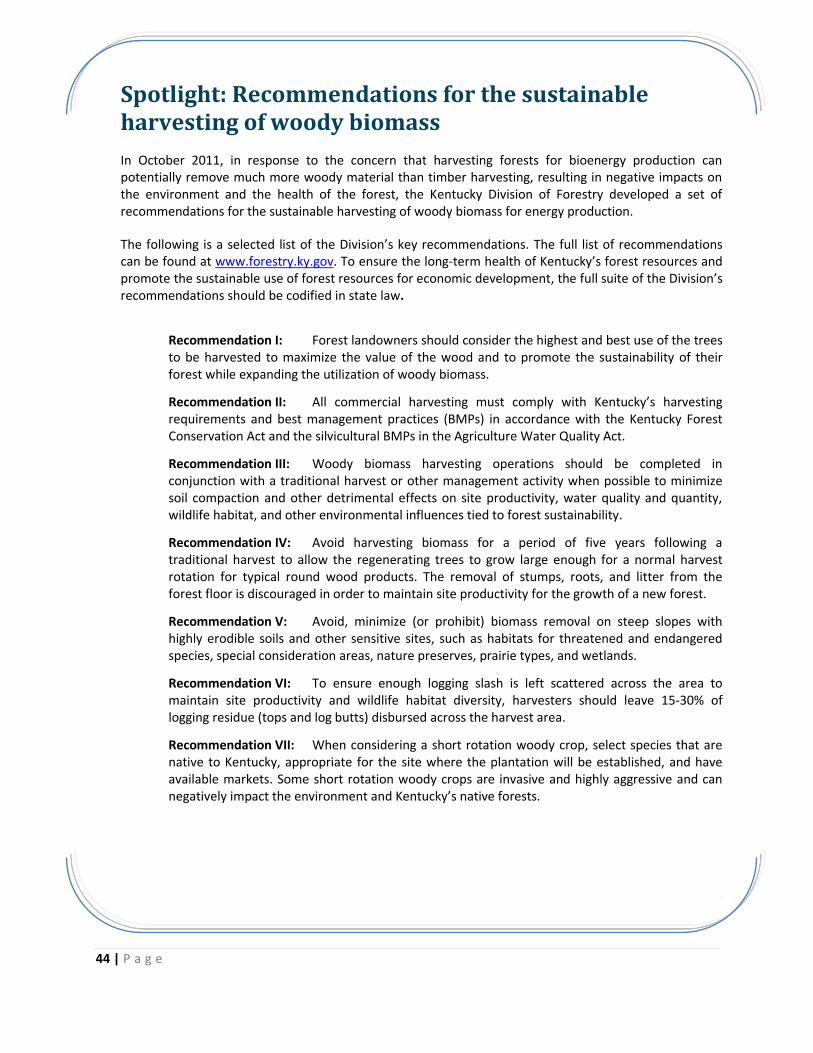
44 | P a g e
Spotlight: Recommendations for the sustainable harvesting of woody biomass
In October 2011, in response to the concern that harvesting forests for bioenergy production can potentially remove much more woody material than timber harvesting, resulting in negative impacts on the environment and the health of the forest, the Kentucky Division of Forestry developed a set of recommendations for the sustainable harvesting of woody biomass for energy production.
The following is a selected list of the Division’s key recommendations. The full list of recommendations can be found at www.forestry.ky.gov. To ensure the long-term health of Kentucky’s forest resources and promote the sustainable use of forest resources for economic development, the full suite of the Division’s recommendations should be codified in state law.
Recommendation I: Forest landowners should consider the highest and best use of the trees to be harvested to maximize the value of the wood and to promote the sustainability of their forest while expanding the utilization of woody biomass.
Recommendation II: All commercial harvesting must comply with Kentucky’s harvesting requirements and best management practices (BMPs) in accordance with the Kentucky Forest Conservation Act and the silvicultural BMPs in the Agriculture Water Quality Act.
Recommendation III: Woody biomass harvesting operations should be completed in conjunction with a traditional harvest or other management activity when possible to minimize soil compaction and other detrimental effects on site productivity, water quality and quantity, wildlife habitat, and other environmental influences tied to forest sustainability.
Recommendation IV: Avoid harvesting biomass for a period of five years following a traditional harvest to allow the regenerating trees to grow large enough for a normal harvest rotation for typical round wood products. The removal of stumps, roots, and litter from the forest floor is discouraged in order to maintain site productivity for the growth of a new forest.
Recommendation V: Avoid, minimize (or prohibit) biomass removal on steep slopes with highly erodible soils and other sensitive sites, such as habitats for threatened and endangered species, special consideration areas, nature preserves, prairie types, and wetlands.
Recommendation VI: To ensure enough logging slash is left scattered across the area to maintain site productivity and wildlife habitat diversity, harvesters should leave 15-30% of logging residue (tops and log butts) disbursed across the harvest area.
Recommendation VII: When considering a short rotation woody crop, select species that are native to Kentucky, appropriate for the site where the plantation will be established, and have available markets. Some short rotation woody crops are invasive and highly aggressive and can negatively impact the environment and Kentucky’s native forests.
45 | P a g e
3.5 Combined heat and power
CHP, also known as cogeneration, is the concurrent production of electricity or mechanical power and useful thermal energy (heating and/or cooling) from a single source of energy, which is most often natural gas, coal, biomass, biogas, or oil. While CHP cannot be generally described as a source of renewable energy—particularly as it describes a system for making existing energy use more efficient rather than developing a new source of energy—CHP is a type of distributed generation because it is located at or near the point of consumption (USDOE, 2008). In addition, unlike other sources of distributed energy, CHP can operate 24
hours a day in any climate or location in the US.
CHP’s efficiency comes from recovering and using the heat that would normally be wasted while generating power. By capturing and using waste heat, CHP requires less fuel than separate heat and power systems that produce an equivalent amount of energy. Instead of purchasing electricity from a local utility and then burning fuel in a furnace or boiler to produce thermal energy, consumers use CHP to provide the same amount of energy in one energy-efficient step (USDOE, 2008).
CHP is not a single technology like solar PV or wind power, but is best understood as a group of technologies that can use a variety of fuels to efficiently generate electricity, mechanical power, and/or thermal energy (Pew Environment Group, 2011). CHP has a wide variety of applications including large and small industrial facilities, commercial buildings, single- and multi-family housing, institutional facilities, campuses, and district energy and heating systems. Installation capacities can range from a few kW to several hundred MW, and are typically scaled according to the thermal consumption and waste output of the user (USDOE, 2008).
CHP most often takes one of two forms. The first involves capturing the waste heat produced during electricity generation and using it for space heating. Generally, one-third of the fuel used in a power plant is converted into electricity, while the other two-thirds are lost as waste heat, which can be recycled with CHP. The second form involves capturing the heat generated by industrial processes and using it for heating or cooling in the same or nearby buildings, or to generate low-cost, clean electricity that can either be consumed onsite or sold back to the grid. Either approach can save between one-half and two-thirds of fuel costs and emissions associated with producing and consuming electricity and heat separately—compared to remote or central generation of the same power. The most efficient CHP systems can achieve 90% or greater efficiency converting fuel to useful energy (Cohen and Lovins, 2010).
The two most common CHP technological configurations include using a gas turbine or engine equipped with a heat recovery unit or using a steam boiler fitted with a steam turbine. Gas turbine or reciprocating engine CHP systems burn fuel to generate electricity, and then use a heat recovery unit to capture heat from the combustion system’s exhaust stream, which is then converted into useful thermal energy in the form of steam or hot water. Gas turbines and engines are ideally suited for large industrial or commercial CHP applications that consume a significant amount of electricity and heat. Unlike gas turbines or reciprocating engine CHP systems, where heat is a byproduct of electricity generation, steam turbines normally do the opposite and generate electricity using the byproduct of heat generation—steam. Such systems are typically used in industrial processes where solid fuels or waste products are used to fuel a boiler, which produces steam as a byproduct (USEPA, 2011a).
CHP can save between one-half and two-thirds of fuel costs and
emissions associated with producing and consuming
electricity and heat separately—compared to remote or central generation of the same power.

46 | P a g e
Reported costs for installing CHP systems are $1,500 to $2,000 per kW (USDOE, 2008; Hedman, 2011), and the net cost of delivered electricity for CHP plants in New Jersey ranged from 7 to 14 cents per kWh (after accounting for avoided fuel costs), with larger systems generating power at a lower price than smaller systems (Hedman, 2011). By comparison, the average cost of new coal-fired power plants is $2,500 per kW, amounting to an average cost of electricity of 10 to 12 cents per kWh (USDOE, 2009).
When certified renewable fuels such as biomass or biogas (methane) are used, CHP can qualify as a renewable form of distributed energy generation. One example is landfill gas-to-energy (LFGTE) projects, where the heat from electricity generation can be captured and used for evaporating leachate pools or for heating onsite buildings (see Section 3.6). Another example is using sustainably harvested, underutilized logging residues or tree thinnings as a biomass fuel source (see Section 3.4). As the cost of fossil fuels increases, LFG or biomass might provide the best economics for a project, while allowing the project to qualify for incentives due to the use of renewable fuels (USEPA, 2011a).
Through 2010, more than 3,700 facilities in the US had installed CHP systems, representing the chemical, paper, food, metals, refining, commercial, and other industries. Total capacity at these facilities amounted to 82,000 MW—nearly 9% of the nation’s generating capacity (Hedman, 2011). Leading the way are Texas, California, Louisiana, New York, and Michigan, which accounted for 51% of the nation’s installed CHP capacity at the end of 2009 (see Figure 11).
By comparison, the seven Northern and Central Appalachian coal-producing states of Kentucky, Maryland, Ohio, Pennsylvania, Tennessee, Virginia, and West Virginia accounted for a total CHP capacity of just under 7,000 MW, representing 9% of CHP capacity in the US. Installed CHP in Kentucky represents only 2% of total capacity in the selected Appalachian states.
Figure 11: Megawatts of installed combined heat and power nameplate capacity in the US, 2009
Source: EIA (2011a).
Texas17,834
California7,017
Louisiana6,782
New York3,827
Michigan3,487
All other states29,975
Appalachian states6,761

47 | P a g e
Due the higher efficiencies achieved by CHP systems as compared to other energy sources, the CHP share of US electricity generation was even greater than for installed capacity in 2009, representing 12% of total generation (USDOE, 2009). The federal target of developing an additional 85,000 MW of CHP capacity in the US by 2020 would double total installed capacity, save as much fuel energy as currently consumed by half of all US households (USDOE, 2008), and help avoid the need to build more than 200 midsize (500 MW) power plants (Pew Environment Group, 2011). The target for 2030 is for CHP to provide 20% of US generating capacity, which would require a total of 241,000 MW of installed CHP (USDOE, 2009).
Total CHP capacity additions in the US amounted to 696 MW in 2010, with Texas leading the way at 395 MW. Another 2,396 MW of capacity is in development or under construction, including 75 MW in Virginia and 60 MW in Kentucky (Hedman, 2011).
3.5.1 Environmental and economic benefits
CHP systems produce significant environmental benefits when compared with generating electricity and heat from centralized sources. By capturing and utilizing heat that would otherwise be wasted from the production of electricity, CHP systems require less fuel than separate heat and power systems to produce the same amount of energy. Because less fuel is being burned for energy, the negative environmental impacts associated with lifecycle coal and natural gas process are avoided for each unit of energy generated by CHP, and emissions such as carbon dioxide, sulfur dioxide, and nitrogen oxides are reduced. Developing more CHP can also reduce or eliminate the need to clear new sites for energy development, as CHP systems are often developed on pre-existing properties. Finally, because CHP systems can recover and recycle thermal energy in the form of steam—thereby reducing the need for condensers or cooling towers—CHP consumes far less water than centralized generators.
As an example of the potential environmental benefits of expanding CHP in the US, the estimated environmental benefits of developing 241,000 MW of CHP capacity by 2030 include: reduced annual energy consumption of approximately 1.6 billion MWh, a total annual reduction in carbon dioxide emissions of 933 million tons, and the preservation of 189 million acres of forest (USDOE, 2009).
The economic benefits of CHP are also substantial. A recent study found that developing a combination of distributed CHP, renewable energy, and demand response programs could meet anticipated growth in Texas’ electricity needs—thereby eliminating the need for centralized power plants—while also limiting consumer energy costs, creating new jobs, and contributing to the growth of the state’s economy. The study also estimated that the implementation of policies supporting distributed and renewable energy technologies and efficiency measures would result in net cumulative consumer energy savings of $37.4 billion, create more than 38,000 new jobs in manufacturing and installation, and contribute more than $1.6 billion in new net wages to the Texas economy by 2023 (Laitner et al., 2007).
CHP also benefits businesses and industries. As rising energy prices pressure US companies to reduce costs, CHP offers a way to stabilize and reduce the costs of operation, receive a quick return on investment, and generate new income from the sale of excess electricity. The extra income allows companies to reinvest the savings from CHP in expanding or improving their businesses.
Expanding CHP can also reduce energy costs for all electricity customers. For instance, when the generated electricity is distributed locally, electricity from coal in a CHP plant costs 1.1 to 2.7 cents per kWh less than centralized generation (Casten and Downes, 2005). Additionally, several studies have shown how reducing natural gas consumption—the primary fuel consumed at commercial and industrial plants—as a result of CHP helps to lower pressure on wholesale natural gas prices. The studies conclude that reducing natural gas consumption by 5-6% can result in a 20% reduction in gas prices (Elliot et al., 2003).

48 | P a g e
Finally, developing a substantial amount of CHP capacity can create new jobs and investments. For instance, every MW of new CHP capacity requires an investment of $1.5 to $2.0 million and creates 6-8 jobs (USDOE, 2008; Hedman, 2011). Therefore, if Kentucky were to develop just 1,000 MW of CHP capacity, it could result in up to $2 billion in new investments and 6,000 to 8,000 new jobs. In rural areas where most industrial plants are located, this can have a significant impact on local economies.
3.5.2 Issues and challenges
USDOE identifies the most significant barriers to CHP development as being an unfamiliarity with CHP; technology limitations; utility business practices; regulatory ambiguity; environmental permitting approaches that do not acknowledge and reward the energy efficiency and emissions benefits; uneven tax treatment; and interconnection requirements, processes, and enforcement.
The following are more detailed descriptions of some of the more urgent barriers:
1. Regulated fees and tariffs. In many states, utility revenues are linked to a utility’s sale of electricity. This provides a disincentive for utilities to encourage customer-owned, distributed forms of energy such as CHP. In addition, many of CHP’s benefits to the grid and to society are not accounted for in ratemaking processes. Since facilities with CHP systems still require standby or backup service from the utility for providing power during times of routine maintenance or unplanned outages, utilities charge the facilities for the standby/backup capacity for supplying on-demand electricity as needed. These charges are often a point of contention between the utility and the facility, and without a requirement for the utility to account for all of the benefits associated with CHP, these charges can create barriers for CHP development (USDOE, 2008).
2. Interconnection issues. CHP helps to diversify the electricity generation portfolio, reduce stress on transmission and distribution systems, and stabilize the electrical grid. Despite these benefits, in some states CHP systems are unable to reliably and economically connect with the existing grid. This serves to reduce the economic incentives for developing distributed sources of generation. The Energy Policy Act of 2005 calls for state commissions to consider certain standards for electric utilities based on Institute of Electrical and Electronics Engineers (IEEE) Standard 1547 (Standard for Interconnecting Distributed Resources with Electric Power Systems), but does not require them to adopt the standard. Adoption of technical interconnection standards, including their application within interconnection agreements, varies by state, limiting CHP’s deployment (USDOE, 2008).
3. Environmental permitting. CHP generates both electricity and heat onsite, and as a result, can potentially increase onsite emissions even while it reduces total onsite and offsite emissions. As of 2009, environmental permitting regulations did not recognize these net emissions benefits. As a result, emissions permitting can be a barrier to CHP development. In other words, existing permitting rules and requirements do not account for the net emissions benefits of CHP (USDOE, 2008).
4. Technical barriers. Technological barriers such as system and component costs, emissions control, fuel cost and flexibility, and overall risk have impeded full market deployment of CHP. In addition, improper installation or lack of coordination between developers and utilities in the planning and installation process can result in technical complications related to grid operations and interconnection (USDOE, 2008).

49 | P a g e
3.5.3 Prospects for combined heat and power in Kentucky
Kentucky has the potential to eliminate wasted energy and greatly reduce overall energy consumption in the commercial and industrial (C&I) sectors, as there are a large number of C&I companies and sites consuming vast amounts of energy that could benefit from CHP. Overall, these two sectors accounted for approximately 20% and 50%, respectively, of total electricity consumption in Kentucky in 2009 (EIA, 2010a). As shown in Figure 4, the average price of electricity for all sectors has been rapidly increasing since the late 1990s; therefore, improving the energy efficiency of business and industrial activity through expanded CHP development is vital for ensuring that Kentucky’s businesses can remain competitive over the long-term.
Kentucky has developed a fairly small amount of CHP capacity compared with other states. Through 2009, there were seven installations with a total capacity of 121.9 MW. Four of the projects are at wood product manufacturing facilities. Following a surge in CHP development between 2000 and 2002, no CHP project has been installed in Kentucky since 2002 (Energy and Environmental Analysis, 2010). However, 60 MW of new CHP capacity was either in development or under construction as of October 2011 (Hedman, 2011).
Table 11: Combined heat and power plants in Kentucky through 2009
Year installed Facility name City Industry/application
Capacity (MW) Fuel type
1966 Western Kentucky Gas Co. Owensboro Office buildings 0.4 Natural gas
1988 Young Manufacturing Company Beaver Dam Wood products 0.3 Waste
1993 Cox Interior, Inc. Campbellsville Wood products 4.0 Wood
2000 Calvert City Chemical Plant Calvert City Chemicals 23.0 Natural gas
2001 Willamette Industries Inc/KY Mills Hawesville Wood products 88.0 Waste
2001 Lafarge Gypsum Silver Grove Stone, clay, glass 5.2 Natural gas
2002 Cox Lumber Campbellsville Wood products 1.0 Waste
Total 121.9
Source: Energy and Environmental Analysis (2010). Note: “Waste” denotes one or a combination of the following: wood waste, waste heat, municipal solid waste, black liquor, blast furnace gas, petroleum coke, and process gas. The reported capacity for Cox Interior, Inc. presented in this table is less than the capacity of 5.2 MW reported by the Southeast CHP Application Center (undated) that is presented in the Spotlight summary later in this section. No reason could be found for the discrepancy, but the 5.2 MW figure is also reported by Berg and Monroe (2007).
As shown in Table 12, among all states with greater than 10 million MWh of total C&I electricity generation and consumption, Kentucky ranks 41st in terms of the percent of total C&I electricity consumption generated by CHP. This is a lower ranking than all other Appalachian states. Louisiana is ranked first at 39%, and the highest-ranking state in Appalachia is Pennsylvania, which generates 12% of total C&I consumption from CHP. In terms of total CHP capacity installed through 2009 (not shown in Table 12), Texas ranks first with over 17,800 MW, and Kentucky ranks 42nd with 121.9 MW.
Improving the energy efficiency of business and industrial activity
through expanded CHP development is vital for ensuring that Kentucky’s businesses can
remain competitive over the long-term.

50 | P a g e
Table 12: State rankings for percent of total commercial and industrial electricity consumption from combined heat and power, 2009
Rank State CHP generation (million MWh)
Total C&I sales and generation (million MWh)
CHP as percent total C&I
1 Louisiana 30.7 79.6 39%
2 Hawaii 3.7 10.8 34%
3 Maine 5.4 19.2 28%
4 Texas 79.2 294.6 27%
5 Oregon 7.4 37.4 20%
6 California 38.9 224.4 17%
7 Alabama 9.2 60.5 15%
8 Wyoming 2.3 16.1 14%
9 New Jersey 9.8 78.6 12%
10 Pennsylvania 13.3 113.2 12%
11 Indiana 8.8 75.6 12%
12 Arkansas 3.2 29.4 11%
13 Michigan 8.0 77.3 10%
14 Florida 12.1 121.3 10%
15 Delaware 1.1 12.0 9%
16 Oklahoma 3.1 36.0 9%
17 Nevada 2.2 26.1 8%
18 Virginia 5.2 68.7 8%
19 Connecticut 2.2 30.5 7%
20 New York 10.5 152.5 7%
21 West Virginia 1.4 20.1 7%
22 Wisconsin 3.1 48.0 7%
23 Utah 1.2 20.1 6%
24 Mississippi 1.8 29.8 6%
25 Georgia 4.5 80.0 6%
26 North Carolina 4.1 75.4 5%
27 Idaho 0.8 15.0 5%
28 Washington 3.2 61.6 5%
29 Maryland 3.3 63.5 5%
30 Minnesota 2.2 44.1 5%
31 Iowa 1.5 31.5 5%
32 South Carolina 2.4 49.2 5%
33 Colorado 1.6 35.2 5%
34 Massachusetts 2.6 59.3 4%
35 Montana 0.6 13.2 4%
36 Tennessee 2.2 56.7 4%
37 New Mexico 0.5 15.7 3%
38 Illinois 3.3 157.5 2%
39 Arizona 0.6 41.2 1%
40 Ohio 1.4 106.5 1%
41 Kentucky 0.7 62.8 1%
42 Missouri 0.3 45.7 1%
43 Nebraska 0.1 18.9 0%
Source: EIA (2010a; 2011b). Note: States with less than 10 million MWh of total C&I sales of electricity and onsite CHP generation are not shown.

51 | P a g e
Electricity generated by CHP systems in 2009 accounted for less than 1% of both total C&I consumption and total electricity sales to all sectors in Kentucky. Following the installation of the 60 MW of new capacity that is currently in development or under construction, total CHP generation will increase to over 800,000 MWh per year and account for 1.3% of total C&I electricity consumption.
However, based on estimates of Kentucky’s CHP potential, it is possible for CHP to eventually account for between 21% and 56% of total C&I electricity consumption and 15% to 39% of total state consumption (see Table 13).13 In other words, CHP has the potential to reduce C&I purchases of electricity by as much as 56%.
Table 13: Current and potential electricity generation from combined heat and power in Kentucky
Current (2009) Potential, low Potential, high
CHP capacity (MW) 122 3,000 8,000
Electricity generation (MWh) 481,519 13,278,689 35,409,836
Total C&I consumption (MWh) 62,765,271 62,765,271 62,765,271
CHP as percent total C&I consumption (2009) 0.8% 21% 56%
Total state consumption (MWh) 89,920,175 89,920,175 89,920,175
CHP as percent total consumption (2009) 0.5% 15% 39%
Sources: CHP capacity from EIA (2011a); CHP generation from EIA (2011b); estimates for low and high CHP potential for Kentucky from USDOE (2008). Notes: Percentage values are rounded to the nearest 1%. Low and high potential electricity generation calculated using the average net capacity factor for 2006-2009 from existing CHP projects in Kentucky (50%) (EIA, 2011a; 2011b), which was significantly below the national average of 70% in 2008 (USDOE, 2009).
At an average installed cost of $2,000 per kW, and assuming no change in costs over time, developing 8,000 MW of CHP capacity in Kentucky would cost $16 billion. Using the average cost of electricity in 2010 of 5.1 cents per kWh for industrial customers in Kentucky, the total value of the electricity generated by the CHP plants would amount to $1.8 billion. Therefore, according to this basic analysis, the system would pay for itself in under 9 years, and the average price of the electricity generated over a span of 20 years—not including operation and maintenance costs—would amount to 2.3 cents per kWh.
In economic terms, 3,000 to 8,000 MW of new CHP capacity would generate $6 to $16 billion in new capital investment in Kentucky. At an estimated job impact of four jobs created per $1 million in investment, it is possible that achieving Kentucky’s potential for CHP capacity development could generate between 48,000 and 64,000 new jobs for the state (USDOE, 2008).
With growing demand for energy and increasing environmental constraints, extracting the maximum output from primary fuel sources through efficiency is critical to sustained economic development and environmental stewardship…CHP’s proven performance and potential for wider use are evidence of its near-term applicability and, with technological improvements and further elimination of market barriers, of its longer term promise to address the country’s most important energy and environmental needs (USDOE, 2008, p. 28).
Significant barriers to development remain for businesses seeking to maintain or improve their competitiveness by increasing the efficiency of their operations and saving money on fuel and energy costs. Investing in CHP will also help Kentucky’s businesses meet pending emissions and other environmental standards while creating tens of thousands of new jobs.
13 Current (2009) values for total C&I and total state consumption represent the sum of total sales of electricity by Kentucky’s electric utilities and the electricity generated by CHP plants. The values for total C&I and state consumption for each of the three future scenarios presented in Table 13 are the same as current consumption because this analysis assumes that total demand/consumption will remain unchanged. New CHP generation will replace a portion of electricity sales, thereby constituting a greater portion of C&I and total state electricity consumption.

52 | P a g e
Spotlight: Cox Interior, Inc. waste-to-energy combined heat and power system Location: Campbellsville, Kentucky
Overview: Cox Interior is a manufacturer of interior and exterior home-finishing wood products, including molding, doors, stairs, and fireplace mantels. Its products are made from a variety of tree species, and the company generates over 100 tons of wood waste every day.
Project background: The CHP system, installed in 1994, consists of two wood-waste boilers and a steam turbine generator. The plant burns 300 tons of wood waste per day, producing 1.2 million pounds of steam per hour and generating electricity at a capacity of 5.2 MW. The waste heat is captured and used to dry lumber. Additionally, using wood waste as fuel helps eliminate costs associated with waste disposal. Cox Interior was the first small energy producer to sign a power contract with EKPC.
Project details: Installation year: 1994
Generating capacity: 5.2 MW
Generating equipment: Steam turbine
Fuel type/volume: Wood waste, 300 tons per day
Annual generation: 14,000 MWh
Annual carbon dioxide offset: 44,000 tons
Financial details: Information on system installation cost is unavailable. However, the
capture and use of waste heat to dry lumber saved Cox Interior $4.5 million in 2006. An additional $980,000 was saved in electricity costs, and the plant was able to sell 1,267 MWh of electricity worth $48,000 to EKPC. With a total gross savings of $5.5 million and an operating cost of $2.6 million, the CHP project yielded a net savings of $2.9 million in 2006.
Sources: Project information from Berg and Monroe (2007) and the Southeast CHP Application Center (undated).
Photo: Picture of wood waste pile at Cox Interior manufacturing facility.

53 | P a g e
3.6 Landfill gas- to-energy
NREL credits new technologies and regulatory changes as being the primary drivers behind the increased use of natural gas for power generation, and notes that biogas may play a more important role in powering gas-fueled distributed generation in coming years (NREL, 2009a). One source of biogas is LFG, which is created when MSW at landfills decomposes anaerobically, or in the absence of oxygen. LFG is comprised of approximately 50% methane, 50% carbon dioxide, and less than 1% of non-methane organic compounds (USEPA, 2011b). Unless captured and burned, LFG is released directly to the atmosphere (Hansen et al., 2006). This represents a significant loss of a potential energy resource, as the wasted methane could be captured and harnessed for a variety of energy-related uses.14 Methane is also a potent greenhouse gas.
The predominant use of LFG is for electricity generation; 1 million tons of MSW in place can be used to generate approximately 0.78 MW of electricity (USEPA, 2011b). The gas can be burned using microturbines (for small projects, 30-250 kW), internal combustion engines (medium projects, 100 kW to 3 MW), or gas turbines (large projects, 800 kW to 10.5 MW). The electricity can either be used directly at the landfill or sold into the grid. Alternatively, LFG can be used directly in boilers for generating heat, thereby replacing the use of conventional fuels; 1 million tons of MSW can generate 432 thousand cubic feet (Mcf) per day of gas (USEPA, 2011b), which can be used at the landfill or to heat other nearby buildings such as local community or government buildings, wastewater treatment facilities, schools, prisons, colleges, or greenhouses (Hansen et al., 2006). Finding direct users close to the landfill can be important to the financial viability of a LFGTE project (Hansen et al., 2006).
Other high-impact uses of LFG may include CHP, whereby the heat could be used, for example, to evaporate leachate pools at the landfill, reducing energy and disposal costs; the production and sale of ethanol and/or biodiesel; and the sale of purified and compressed methane to natural gas companies (Hansen et al., 2006).
3.6.1 Environmental and economic benefits
LFGTE projects reduce harmful emissions while providing energy to support local businesses and communities. Landfills are the third-largest source of human-related methane emissions in the US, accounting for 17% of such emissions in 2009 (USEPA, 2011b). When burned, methane is converted to carbon dioxide, which is 21 times less potent of a greenhouse gas. By offsetting the use of coal and natural gas for electricity and heat, LFGTE projects also help reduce emissions of sulfur dioxide, nitrogen oxides, and particulate matter. Locally, these projects reduce odors and harmful emissions of organic compounds. Because of these benefits, LFGTE projects may qualify as pollution control projects under New Source Review standards (USEPA, 2010a).
LFGTE projects also benefit the local economy. Jobs are created in the design, construction, and operation of the gas recovery and energy systems, and economic output is increased as a result of equipment and labor expenditures. A typical 3 MW facility will generate at least 5 direct jobs in construction and installation and $1.5 million in equipment expenditures. Such a project would generate a $4.3 million increase in economic output and create 20-26 jobs, when accounting for direct and indirect impacts (USEPA, 2010b).
Finally, like all distributed renewable energy systems, LFGTE projects can help provide customers with a long-term hedge against energy price volatility. By ensuring a more stable or even fixed price of heat or electricity, or by reducing the amount of energy purchased at retail prices from utilities or gas companies, these projects can provide substantial economic benefits for private landfill operators or local governments and businesses.
14 The average LFGTE project can capture 60-90% or more of the emitted methane (USEPA, 2010c).

54 | P a g e
3.6.2 Issues and challenges
The three overarching issues affecting project feasibility are the size of the landfill, whether the landfill is publicly or privately owned, and whether the landfill is open or closed.
In relation to size, small landfills generate less LFG. As a result, these small landfills—defined as having less than 2.5 million tons of waste in place—are generally exempt from federal regulations that require the capture and flaring of LFG. Therefore, the landfills are not required to install the wells, vents, and flaring equipment that could form the basis of LFGTE projects. Because these costs are fixed, the cost of developing a LFGTE project is significant, and it is difficult for small landfill operators to justify the expense given the expectation of a low return on investment due to the low generation of LFG (Hansen et al., 2006). By comparison, large landfills—defined as having greater than 2.5 million tons of waste in place—are required by federal regulation to drill wells and vent or flare the LFG, meaning that the cost of developing these systems is a mandated cost, regardless of whether an LFGTE system is installed. Therefore, the cost of developing LFGTE systems at large landfills will be much smaller, while ensuring a higher return on investment as a result of greater LFG generation and conversion to useful energy.
As for ownership, private landfills are owned and operated by private companies, whereas public landfills are owned by solid waste authorities or local governments. The type of ownership impacts the ability to implement LFGTE projects due to the difference in revenues. For instance, the goal of publicly owned landfills operated by local government agencies is to provide long-term waste disposal for their constituents at the lowest possible cost. However, this results in generally smaller landfills that must charge higher tipping fees (the fees haulers pay the landfill to dispose of the waste) to cover their fixed costs. Even with higher tipping fees, the smaller size of public landfills limits total revenues. By contrast, privately owned landfills are profit-driven and aim to maximize the amount of waste stored at the landfill. Because of this, private landfills tend to import waste from a broader area, leading to larger landfills, which allows operators to charge a smaller tipping fee while still generating substantial revenues (Hansen et al., 2006). Therefore, the size and ownership of a landfill are interrelated, and it is generally more difficult for smaller, publicly-owned landfills to develop LFGTE projects than it is for larger, privately owned landfills.
Whether a landfill is open or closed also plays a role in determining the feasibility of LFGTE projects. On the one hand, because LFG emissions decline following closure of a landfill, open landfills are typically the most economical for LFGTE projects (Hansen et al., 2006). Additionally, while the closing of a landfill requires the installation of LFG management systems, which are often comprised of wells and vents and in many cases flares, the systems installed to achieve the standards for closing a landfill are not exactly the same as what would be installed for LFGTE projects (Hansen et al., 2006). However, when a landfill closes, funds set aside through up-front financial assurance bonds—such as in Kentucky—or from tipping fees during the operation of the landfill—such as in West Virginia—are available to cover the costs associated with closing a landfill. These funds are not currently available for uses other than ensuring compliance with state regulations for closed landfills; however, should these or other funds be made available in the future for use in developing LFGTE projects, they could provide a significant source of financing that could help render LFGTE development financially feasible.
Other factors that may impact the feasibility of developing a LFGTE project include proximity to electrical distribution lines, gas distribution lines, or energy end-users; availability and willingness of end users or utilities to purchase the energy; power price; and availability of RECs or carbon offsets. Each of the issues described in this section should be considered when identifying good candidates for LFGTE projects as well as when considering policies or incentives aimed at supporting the expansion of LFGTE development.

55 | P a g e
3.6.3 Prospects for landfill gas-to-energy in Kentucky
Many landfills in the US have installed systems for capturing LFG and converting it to electricity or heat. By the end of 2010, 555 operational LFGTE projects existed in 46 states, generating a combined 14 million MWh of electricity and 102 billion cubic feet of usable gas annually (USEPA, 2011c). Kentucky accounted for seven of these projects, six of which generate electricity with the remaining project using the gas to generate heat in a boiler. The six electricity generating projects account for approximately 0.9% of all electricity generated by LFGTE projects in the US as of 2011 (USEPA, 2011c). All of these projects are owned and operated by EKPC, and their total capacity of 16.8 MW is enough to power 10,000 homes (Maynard, 2010).
The seventh LFGTE project, the Outer Loop Recycling and Disposal Facility owned by Waste Management of Kentucky, captures 263 million cubic feet per year and sells the gas to a nearby industrial park for use in steam boilers. The landfill actually contains three times more waste, by weight, than the second largest landfill in Kentucky, and is capturing only a small portion of the LFG generated by the landfill.
USEPA categorizes landfills according to whether the landfill has at least 1 million tons of waste in place, is still open or has only closed within the last five years, and has a depth of at least 40 feet (Hansen et al., 2006). If a landfill meets all three criteria, it is listed as a “Candidate” for LFGTE development. If not, it is listed as a “Potential” landfill. Of the 38 landfills in Kentucky, seven have operating LFGTE projects, 18 are listed as candidates, and the remaining 13 are listed as having potential for LFGTE development but fail to meet at least one of the criteria for candidacy (USEPA, 2011d). Of the eighteen “Candidate” projects, six could be developed at publicly-owned sites and another 12 at privately-owned sites.
In total, Kentucky’s “Candidate” landfills could generate a substantial amount of local electricity or gas for heating and other purposes, equivalent to either 337,250 MW of electricity or 8,647 million cubic feet of gas annually (or some combination thereof) (see Table 14).
Table 14: Existing and potential landfill gas-to-energy development and production in Kentucky, 2010
Potential annual production
Number of landfills
Estimated waste in place (million tons)
Generating capacity (MW)
Electricity (MWh)
Gas (million cubic feet)
Operational (existing)
Electricity 6 21.7 16.8 132,451 n/a
Boiler 1 25.6 n/a n/a 263
Candidate
Public 6 17.3 13.5 106,393 2,728
Private 12 37.5 29.3 230,856 5,919
Total “Candidate” 18 54.8 42.8 337,250 8,647
Potential
Public 7 9.7 7.5 59,511 1,526
Private 6 9.0 7.0 55,407 1,421
Total “Potential” 13 18.7 14.6 114,918 2,947
Source: Landfill designation of “Operational,” “Candidate,” and “Potential,” as well as data on tons of waste in place from EPA (2011d). Note: Potential electricity generation and gas production are both reported; however, these values represent the maximum energy potential for individual, exclusive uses and cannot be combined. Generating capacity was estimated using USEPA’s conversion factor of 0.78 MW per million tons of waste in place. Potential electricity generation (MWh) was calculated using a 90% capacity factor. Estimates of LFG production were generated using USEPA’s conversion factor of 432 Mcf per day per million tons of waste in place. Finally, while the Outer Loop facility could capture a greater amount of its LFG emissions for use in energy production, as there is an LFGTE project already in place, we do not include the facility as a “Candidate” for additional development. However, it is estimated that the facility could potentially generate 20 MW of electricity by fully utilizing the site’s LFG emissions for electricity generation.

56 | P a g e
Because many of Kentucky’s landfills will continue to receive additional MSW for many years, the potential for energy production from LFGTE projects can be expected to increase over time. For instance, 23 of the 25 landfills designated by USEPA as “Operational” or “Candidate” landfills are listed as being open and receiving new waste, and only four of those landfills are expected to close before 2020.
According to the Kentucky Division of Waste Management (2011), an average of 5.1 million tons of new MSW was added to the state’s landfills each year between 2006 and 2010. This is the equivalent of adding either 4 MW or 800 million cubic feet of gas to Kentucky’s LFGTE potential each year. Therefore, the estimates provided in Table 14 represent only a snapshot in time of the LFGTE potential in Kentucky, and it can be assumed that the LFG resource available for distributed energy generation will continue to grow.
Figure 12 shows the location and relative size of landfills in Kentucky with operational LFGTE projects, as well as landfills designated as candidates for potential LFGTE development. Landfills designated as having merely the potential for LFGTE development are not represented.
Kentucky’s “Candidate” landfills could generate a substantial
amount of local electricity or gas for heating and other purposes,
equivalent to either 337,250 MW of electricity or 8,647 million cubic
feet of gas annually.

57 | P a g e
Figure 12: Operational landfill gas-to-energy projects and “Candidate” landfills in Kentucky, 2011
Source: USEPA (2011d).
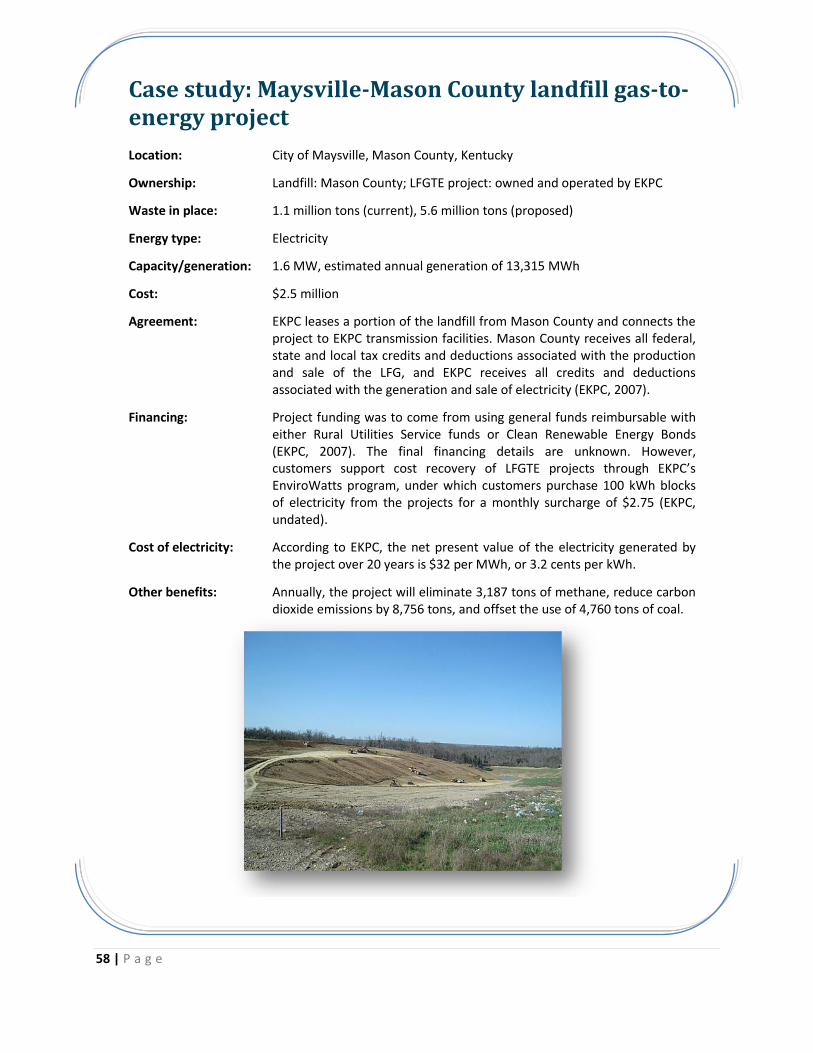
58 | P a g e
Case study: Maysville-Mason County landfill gas-to-energy project
Location: City of Maysville, Mason County, Kentucky
Ownership: Landfill: Mason County; LFGTE project: owned and operated by EKPC
Waste in place: 1.1 million tons (current), 5.6 million tons (proposed)
Energy type: Electricity
Capacity/generation: 1.6 MW, estimated annual generation of 13,315 MWh
Cost: $2.5 million
Agreement: EKPC leases a portion of the landfill from Mason County and connects the project to EKPC transmission facilities. Mason County receives all federal, state and local tax credits and deductions associated with the production and sale of the LFG, and EKPC receives all credits and deductions associated with the generation and sale of electricity (EKPC, 2007).
Financing: Project funding was to come from using general funds reimbursable with either Rural Utilities Service funds or Clean Renewable Energy Bonds (EKPC, 2007). The final financing details are unknown. However, customers support cost recovery of LFGTE projects through EKPC’s EnviroWatts program, under which customers purchase 100 kWh blocks of electricity from the projects for a monthly surcharge of $2.75 (EKPC, undated).
Cost of electricity: According to EKPC, the net present value of the electricity generated by the project over 20 years is $32 per MWh, or 3.2 cents per kWh.
Other benefits: Annually, the project will eliminate 3,187 tons of methane, reduce carbon dioxide emissions by 8,756 tons, and offset the use of 4,760 tons of coal.
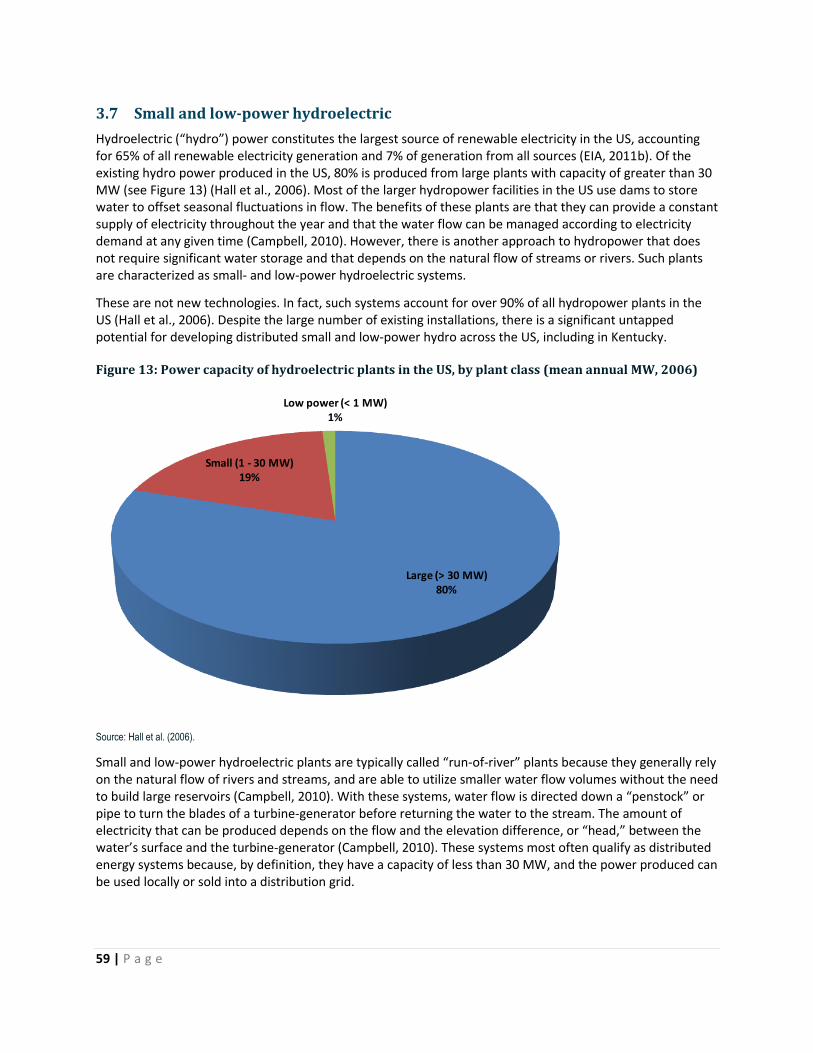
59 | P a g e
3.7 Small and low-power hydroelectric
Hydroelectric (“hydro”) power constitutes the largest source of renewable electricity in the US, accounting for 65% of all renewable electricity generation and 7% of generation from all sources (EIA, 2011b). Of the existing hydro power produced in the US, 80% is produced from large plants with capacity of greater than 30 MW (see Figure 13) (Hall et al., 2006). Most of the larger hydropower facilities in the US use dams to store water to offset seasonal fluctuations in flow. The benefits of these plants are that they can provide a constant supply of electricity throughout the year and that the water flow can be managed according to electricity demand at any given time (Campbell, 2010). However, there is another approach to hydropower that does not require significant water storage and that depends on the natural flow of streams or rivers. Such plants are characterized as small- and low-power hydroelectric systems.
These are not new technologies. In fact, such systems account for over 90% of all hydropower plants in the US (Hall et al., 2006). Despite the large number of existing installations, there is a significant untapped potential for developing distributed small and low-power hydro across the US, including in Kentucky.
Figure 13: Power capacity of hydroelectric plants in the US, by plant class (mean annual MW, 2006)
Source: Hall et al. (2006).
Small and low-power hydroelectric plants are typically called “run-of-river” plants because they generally rely on the natural flow of rivers and streams, and are able to utilize smaller water flow volumes without the need to build large reservoirs (Campbell, 2010). With these systems, water flow is directed down a “penstock” or pipe to turn the blades of a turbine-generator before returning the water to the stream. The amount of electricity that can be produced depends on the flow and the elevation difference, or “head,” between the water’s surface and the turbine-generator (Campbell, 2010). These systems most often qualify as distributed energy systems because, by definition, they have a capacity of less than 30 MW, and the power produced can be used locally or sold into a distribution grid.
Large (> 30 MW)80%
Small (1 - 30 MW)19%
Low power (< 1 MW)1%

60 | P a g e
The two categories of small and low-power hydropower have specific defining characteristics. Small hydro refers to systems with a power potential between 1 and 30 MW, and are installed in streams or rivers with hydraulic heads greater than 30 feet. Low-power hydro systems are 1 MW or smaller and operate in waters with heads less than 30 feet. The low-power category is further divided into three sub-categories depending on the technology most appropriate for the hydraulic head of the stream. For instance, conventional hydro turbines operate best in streams with a head of 8 to 30 feet, while unconventional systems designed for lower flow volumes are best suited for heads less than 8 feet. Each of these systems normally has a power capacity between 100 kW and 1 MW. The third category, microhydro, is associated with technologies with capacities of less than 100 kW (Hall et al., 2004).
Table 15: General characteristics of small and low-power hydroelectric systems
Plant class/type Hydraulic head Power capacity (MW)
Small > 30 feet 1 - 30 MW
Low-power < 30 feet < 1 MW
Conventional 8 - 30 feet 100 kW to 1 MW
Unconventional < 8 feet 100 kW to 1 MW
Microhydro < 30 feet < 100 kW
Source: Hall et al. (2004).
The development of small and low-power hydro resources can provide a substantial amount of new electric generating capacity, particularly as a replacement for aging or decommissioned large hydro facilities. For instance, relicensing requirements under the Federal Energy Regulatory Commission may lead to existing conventional hydropower projects being removed. These are best replaced with small or low-head hydropower projects for a number of reasons. For one, large hydro projects require long development periods and large capital investments, and usually generate public opposition (Beshear, 2008). Additionally, existing hydropower sites already have much of the infrastructure in place that is needed for small and low-power systems, which can help reduce the cost of development.
More relevant for this report, potential small and low-power sites are numerous and uniformly distributed across the US, and as such can offer significant sources of distributed power without the need for reservoirs (Hall et al., 2004). Due to their small size, such projects are likely to serve single end-users and/or connect into distribution grid networks, and the rationale for most projects will be based more on providing power for onsite or local consumption rather than producing power for sales revenues. Building small or low-power hydropower close to existing distribution lines can reduce the costs of projects (Campbell, 2010).
In 2004, the Idaho National Engineering and Environmental Laboratory (INEEL) conducted detailed assessments of state and national low-power and small hydro potential, and found that states with the highest concentrations of low-power potential are all located in the eastern US (Hall et al., 2004). INEEL estimated the total available power potential for “high power” (large hydro), “high head/low power” (small hydro), and “low head/low power” (low-power) stream segments for the 20 hydrologic regions of the US, and summed the results for each state (Hall et al., 2004). The study did not evaluate development potential.
A follow-up report built upon the 2004 assessment and evaluated the low-power and small hydro water energy resource sites that were identified in the prior study to determine the feasibility of their development. The feasibility criteria considered site accessibility, load or transmission proximity, and land use or environmental sensitivities that would make development unlikely. Water energy resource sites that met the feasibility criteria were designated as “feasible potential” project sites (see Table 16). A second level of analysis was conducted based on the feasibility of actually developing a low-power or small hydro generating system up to 30 MW at the sites with feasible potential. This provided more realistic estimates of the power potential for each site (Hall et al., 2006).

61 | P a g e
The assessment identified approximately 130,000 sites meeting the feasibility criteria with a total potential of nearly 100,000 MWa.15 Further analysis resulted in a total potential of nearly 30,000 MWa for small and low-power hydro, which was approximately equal to the total MWa generated by existing US hydroelectric plants in 2006 (Hall et al., 2006). The 5,400 sites that could potentially be developed as small hydro plants have a total potential of over 18,000 MWa. If developed, these projects would result in a greater than 50% increase in hydroelectric generation (Hall et al., 2006). The development potential for low-power hydro is approximately 11,000 MWa (see Table 16). Overall, the majority of the “development” potential could be harnessed using existing and proven technologies and without constructing new dams (Hall et al., 2006).
Table 16: Existing and potential small and low-power hydroelectric generating capacity in the US (MWa)
Developed Feasible potential
Development potential
Minimum total potential
Small hydro 4,406 54,161 18,450 22,856
Total low power 298 22,848 10,988 11,286
Conventional 241 17,729 6,297 6,538
Unconventional 37 2,355 1,640 1,677
Microhydro 20 2,763 3,052 3,072
Total small and low-power 4,704 77,009 29,438 34,142
Source: Hall et al. (2006). Note: “Minimum total potential” represents the sum of “Developed” and “Development potential,” and therefore represents the minimum total potential for small and low-power hydro in the US. The maximum feasible potential would represent the sum of “Developed” and “Feasible potential.”
The cost of distributed hydro varies according to system size. For instance, a 300 W microhydro system costs $1,300 to $1,800 per kW (in 2005 dollars), while both 1 kW and 100 kW systems cost between $2,300 and $3,000 per kW. Taking into account the capacity factor of these systems, average generating costs are estimated at 15.1 cents per kWh for 300 W systems and 11 cents per kWh for 100-kW systems. The cost to develop a 5 MW small hydro system is similar to developing low-power systems, ranging from $2,100 to $2,600, with an average generating cost of 7.0 cents per kWh (in 2005 dollars) (The World Bank Group, 2006).
The actual cost of developing small and low-power hydroelectric systems is determined by numerous site-specific factors. However, the cost of developing these systems is on par with centralized coal and hydro generation as well as some distributed renewable energy sources such as small wind and CHP, and is less expensive than solar PV. In terms of generating cost, small hydro systems with capacities of over 1 MW are more on par with, and even less expensive than retail prices for coal-fired electricity, while low-power systems are likely to be competitive in the near future.
3.7.1 Environmental and economic benefits
Compared to centralized fossil fuel-based generation, hydroelectric power plants of all sizes serve to significantly reduce the environmental impact of electricity generation. In terms of carbon dioxide emissions alone, developing the 29,438 MWa of small and low-power hydro potential in the US would reduce emissions by approximately 125 million tons annually.16 This is the equivalent of the emissions from the combustion of approximately 50 million tons of coal each year, and does not include additional emissions associated with the mining, processing, or transportation of the coal. Other harmful emissions that would be reduced as a result of developing additional hydroelectric power have been described throughout this report.
15 “MWa” denotes megawatts of “annual mean power,” and is different from “MW,” which is commonly used to represent the megawatts of nameplate, or rated capacity of power generating systems. MWa represents the actual, average annual capacity after accounting for the system’s capacity factor, which incorporates plant efficiency and outages. The use of MWa for representing power potential is directly convertible to estimated energy production by multiplying MWa by 8,760 hours per year (Hall et al., 2004). 16 This calculation was performed using equations provided by Francfort (1997). The calculation was revised to reflect a lower recent national dependency on coal for electricity generation (45%), and uses a conversion factor of 2.14 pounds of emissions per kWh.
62 | P a g e
Small and low-power hydroelectric plants also have substantial environmental benefits when compared to conventional, large-scale hydro, which has become increasingly controversial in recent years due to concerns over potential and existing environmental impacts. The benefits of smaller systems stem primarily from the lack of a need to impede stream or river flow and construct large dams. When dams flood significant portions of land upstream, the change in habitat can affect wildlife and negatively impact migratory fish populations. The development of dams can also affect water quality, as the clearing of trees can result in soil erosion which can lead to a buildup of sediments and clogged streams. Additionally, spilling water from dams can force atmospheric gases into solution; fish in these waters can then be killed (Campbell, 2010).
The construction of large dams can also in some cases endanger nearby communities. For instance, the Wolf Creek Dam, a large hydroelectric dam located on the Kentucky River, was built over a bed of karst topography consisting of underground caverns and caves carved out of limestone by water seeping through cracks in the rock layers. In 1968 it was found that seepage from the dam was causing sinkholes below, thereby threatening the stability of the dam. The US Army Corps of Engineers has estimated potential damages resulting from the failure of the dam at $3 billion, and the cost of repair at nearly $600 million (US Army Corps of Engineers, 2011). Work to secure the dam is ongoing and emergency protocols are now in place.
While this example represents an extreme case where the development of large hydro projects can have significant impacts on public safety, it does illustrate how small hydro projects can eliminate any potential safety concerns associated with large structures. Given that low-power sites in the US are sufficiently numerous and uniformly distributed to offer significant sources of distributed power without the need for reservoirs, alternatives for developing new hydropower capacity without imposing unnecessary and potentially costly risks on the environment and the public are readily available.
There is a national certification program for minimizing the environmental impacts of all hydroelectric power development, regardless of size. The program was developed by the Low Impact Hydropower Institute (LIHI), “a non-profit organization dedicated to reducing the impacts of hydropower generation through the certification of hydropower projects that have avoided or reduced their environmental impacts pursuant to [LIHI’s] criteria” (LIHI, 2011a). The criteria standards cover eight areas: river flows, water quality, fish passage and protection, watershed protection, and recreation, among others.
Economically, each MWa of small hydro development could generate 0.26 jobs in construction, installation, and manufacturing and 2.07 jobs in operations and maintenance (0.14 and 1.14, respectively, per MW of nameplate capacity) (EPRI, 2001). It can be roughly estimated that developing the nation’s small hydro potential of 18,450 MWa could generate nearly 5,000 short-term jobs in construction, installation, and manufacturing and an additional 38,000 long-term jobs in the operation and maintenance of the generating systems. Additional jobs would be created by developing the nation’s low-power hydro potential.
Small and low-power hydro sites are sufficiently numerous and uniformly distributed to offer
significant sources of distributed power without imposing
unnecessary and potentially costly risks on the environment and the
public.

63 | P a g e
3.7.2 Issues and challenges
There are very few issues or challenges associated with small and low-power hydro development other than general challenges of financing and policy support that face all forms of distributed energy generation. However, perhaps the most significant challenge facing small and low-power hydro is that the resources, technologies, and development potential are not well understood, and they can only be developed on streams with sufficient hydraulic head and flow. Such resources are less ubiquitous than solar or wind. INEEL and other federal agencies are hoping to address this challenge by providing ongoing research and analysis of small hydro resources and paths to development.
Smaller projects, particularly low-power projects, may have to shut down during seasonal periods of low flow, particularly during the summer (Campbell, 2010). In this sense they are similar to most other distributed renewable energy technologies in that they provide maximum power during certain portions of the year, a characteristic that allows for generally predictable power generation. At the same time, small and low-power hydro systems are less available than large hydroelectric dams or other large centralized generators.
Environmentally, in most cases small hydropower generating stations have relatively low environmental impacts compared to larger systems because they are constructed in a smaller area, and rarely cause significant shoreline flooding or require large river diversions or impoundments. Most of the negative environmental impacts of small hydro development can be mitigated by good design and operating practices to avoid interference with seasonal water flows and minimize impacts on fish and flooding patterns. Nonetheless, environmental impacts can occur (Campbell, 2010).
3.7.3 Prospects for small and low-power hydro in Kentucky
Hydroelectric power is Kentucky’s largest source of developed renewable energy, accounting for 90% of renewable energy generation in 2009, as well as 4% of total generation from all sources (EIA, 2011b). With the goal of supporting expanded hydropower generation, in 2008 the Kentucky Legislature authorized the Kentucky River Authority to promote private investment in the installation of hydroelectric generating units on all existing constructed and reconstructed dams along the Kentucky River. However, such projects are likely to be larger given the use of dams. Based on concerns over competing uses for water and impacts on fish and wildlife, any new hydropower development is expected to occur at sites with an existing impoundment, or as small or low-power run-of-river projects (Beshear, 2008).
Opportunities for both types of projects are substantial; however, estimates of Kentucky’s small and low-power hydro “feasible” potential suggest that there is a large untapped resource suitable for smaller generating systems that, if developed, could alone more than double current generation from existing hydroelectric power plants. Total developed hydropower capacity in Kentucky as of 2006 was 777 MW, with the average mean power potential amounting to 383 MWa (see footnote 15).17
Total feasible development potential of new small and low-power hydro for Kentucky is 518 MWa (see Table 17). This is the equivalent of 1,050 MW of gross potential capacity, and over 4.5 million MWh of annual electricity generation, which if developed would account for 5% of total generation in Kentucky for 2009, bringing the total hydropower contribution—including large-scale hydro—to 9% of generation.
17 Total capacity in 2009 was 804 MW.

64 | P a g e
Table 17: Existing and potential hydropower from small and low-power hydro resources in Kentucky and other Appalachian states
State Developed capacity
(MW) Developed power potential (MWa)
Feasible power potential (MWa)
Potential increase
Kentucky 777 383 518 135%
Maryland 494 203 91 45%
Ohio 128 63 319 506%
Pennsylvania 775 284 953 336%
Tennessee 2,418 1,082 655 61%
Virginia 740 147 418 284%
West Virginia 325 140 484 346%
Source: Hall et al. (2006).
Roughly 85% of Kentucky’s small and low-power hydropower potential is for small hydro, amounting to 441 MWa, with the remaining 77 MWa being available for low-power technologies (SACE, 2009). As noted previously, the majority of the nation’s small hydropower potential is estimated for system capacities of less than 10 MW—an appropriate scale for distributed energy generation. A 1998 INEEL study on Kentucky found a similar result, estimating that 65% of Kentucky’s undeveloped small and low-power hydro resource was suitable for small hydro sites less than 10 MW (Conner and Francfort, 1998).
Compared to the other Appalachian states included in Table 17, Kentucky ranks behind only Tennessee in developed hydropower, and third in potential for small and low-power development. Federal incentives, utility green power programs, consumer attitudes about clean energy, and current trends in electricity prices are rendering small and low-power hydro development economically viable in Kentucky, and as exemplified by the revitalization of the Mother Ann Lee Hydroelectric station, small hydropower is already being developed (see Case study on the next page). Fully developing Kentucky’s remaining resource could provide a significant amount of distributed renewable energy generation while creating roughly 1,200 new jobs.

65 | P a g e
Case study: Mother Ann Lee “low impact” small hydroelectric plant
Location: Lock and Dam #7, Kentucky River, eastern Kentucky
Ownership: Lock 7 Hydro Partners, LLC, a partnership between Shaker Landing Hydro Associates, Inc. and Salt River Electric Cooperative
Year built: Original plant: 1928 (shut down in 1999); Revitalized: 2007
Capacity/generation: 2.0 MW, annual generation of 8,300 MWh (0.95 MWa)
Estimated cost: $2.75 million
Cost of electricity: At a cost of $2.75 million and 8,300 MWh of annual generation over 20 years, the base wholesale price of electricity is 1.7 cents per kWh.
Details and financing: The small hydro plant is a run-of-river plant located in the KU service area. The plant generates revenue from electricity sales to Salt River Electric Co-op and through the sale of RECs. Each REC represents one MWh of hydropower generation and is sold for between $5 and $10 to E.On US, the parent company of KU. Additionally, a portion of KU’s green energy sales revenue goes to the Mother Ann Lee station to help it remain competitive.
LIHI certification: The plant became the first hydropower project in Kentucky to be certified as low impact through LIHI.
Other benefits: Annual emissions reduction of 60+ tons of sulfur dioxide, 20+ tons of nitrogen oxide, and 10,000+ tons of carbon dioxide (equivalent to 4,500 tons of coal).
Mother Ann Lee Hydroelectric Station, project information and photo credit: LIHI (2011b).

66 | P a g e
3.8 Geothermal heating
Geothermal energy is stored in the earth’s crust and can be harnessed using a variety of technologies and used for heating and cooling as well as to generate electricity. Geothermal energy technologies can be broken into four major categories: conventional hydrothermal, low-temperature, enhanced geothermal, and direct use, the latter of which includes GHPs. The first three categories generate electricity, while the fourth is used primarily for heating and cooling (Cross and Freeman, 2009).
The US leads the world in geothermal electricity production. Through 2010, over 3,000 MW of geothermal electricity generating capacity was in place—predominantly in western states—with another 722 MW of new capacity under development (Jennejohn, 2011). While advancements in low-temperature and enhanced geothermal technologies may render geothermal electricity generation feasible in the coming years, it is believed that “Kentucky does not have readily accessible reservoirs of steam, hot water or hot rocks for the production of electricity from geothermal resources” (Beshear, 2008, p. 32).
This section therefore focuses on Kentucky’s geothermal potential using GHPs—the most readily available direct use application for geothermal in the state. Kentucky’s GHP industry is growing, and offers the potential for further enhancing energy efficiency and reducing demand for centralized sources of heating and cooling power (including both electricity and gas).
GHPs consist of three parts: a ground heat exchanger, the heat pump unit, and the air delivery system. The heat exchanger is typically a system of pipes called a loop. The loop is buried in shallow ground near the building to be heated. A water-based heat-capturing fluid is circulated through the loop to transfer heat between the earth and the building. In the winter, the GHP captures heat from the earth and pumps it into the indoor air delivery system. The reverse happens in the summer, when the pump moves heat from the indoor air into the heat exchanger, where it is then pumped back underground (NREL, 2011c).
All areas of the US have nearly constant shallow-ground temperatures ranging between 50° and 60°F, which are suitable for GHPs. This makes the installation possible nearly anywhere. GHPs can be used for a wide variety of applications, including residential, commercial, institutional, and multifamily buildings. Even though installation costs exceed those for conventional heating and cooling systems, monthly energy bills are always lower with GHPs. Therefore, the cumulative energy savings eventually exceed installation costs, after which heating and cooling costs are less than those associated with conventional systems (Duffield and Sass, 2003)
In addition to the widespread nature of shallow geothermal resources and the cost effectiveness of the technology, GHPs are commercially available and are often treated and incentivized as an energy efficiency measure. As a result, more than 1 million GHP units have been installed in the US, with installations spread somewhat evenly between the residential and commercial sectors (Massachusetts Institute of Technology, 2006). As of 2008/2009, GHPs were installed in one out of every 38 new US homes, and the retrofit market for schools has been growing, with more than 600 schools installing GHP systems in recent years (Cross and Freeman, 2009). We estimate that total installed GHP capacity in the US in 2009 was approximately 14,833 MWt (Cross and Freeman, 2009; EIA, 2010b). This amounts to a four-fold increase over 2008, and is equivalent to the annual consumption of 13.2 million MWh of electricity.
Average installed costs for 2008 were $5,000 to $6,000 per ton of heating and cooling capacity for residential units (equivalent to $1,400 to $1,700 per kWt), and $6,000 to $10,000 per ton for commercial applications ($1,700 to $2,900 per kWt) (Cross and Freeman, 2009).

67 | P a g e
3.8.1 Environmental and economic benefits
Heat pumps provide significant energy savings and environmental benefits. The use of a GHP for heating reduces energy consumption by more than 75% compared to electric baseboard heating and between 30% and 60% relative to other methods of heating and cooling such as natural gas (Duffield and Sass, 2003). Recognizing the benefit of reduced energy demand, many utilities have subsidized the installation of GHPs to help reduce peak demand for electric power. This has further allowed utilities to avoid or postpone construction of new power plants (Duffield and Sass, 2003).
While the environmental impact of installing GHP systems is minimal, the environmental benefits stem from the displacement of fossil fuel consumption for providing heat. For instance, in the case where a GHP system replaces heat from an electric baseboard heater, every MWt generated onsite displaces at least three MWt generated at a coal-fired power plant due to efficiency and transmission losses. The environmental benefits will vary depending on which fuel source is being displaced; however, using coal as an example, every MWh of thermal energy from coal displaced by GHPs reduces emissions of carbon dioxide by approximately 1 ton.
Economically, GHPs are a labor-intensive technology to manufacture and install, with each installation requiring 24 hours of manufacturing labor and 32 hours of installation labor. For every 18 installations, one permanent job is created (Cross and Freeman, 2009). As a result, direct employment in GHP manufacturing alone amounted to 1,832 full-time-equivalent jobs in 2009 (EIA, 2010c). Using the ratio of one job per 18 installations and data for total GHP shipments originating in and delivered to states in the US, we estimate that the GHP industry as a whole supported over 22,600 domestic jobs in 2009 (EIA, 2010b). While GHPs are being installed all across the country, it is notable that the midwestern and southern regions are home to the major GHP manufacturers and have more personnel trained in GHP installation and maintenance than any other region (Cross and Freeman, 2009). Even though Kentucky ranked ninth in imports of GHP units in 2009, not a single GHP manufacturer resides in Kentucky (EIA, 2010b and c).
3.8.2 Issues and challenges
Despite steady growth, the GHP market still faces significant barriers in many states. These include high installation and capital costs, a lack of consumer awareness about the technology, and insufficient market delivery infrastructure (Cross and Freeman, 2009). GHP systems are generally more expensive than conventional heating and cooling systems due to the costs associated with installation of the ground connection. Overcoming the lack of consumer awareness can support the growth of the GHP market, thereby reducing installation and capital costs (Cross and Freeman, 2009). Additionally, integrating GHP installations into state weatherization programs and improving financial supports, particularly for low-income residents that would most benefit from geothermal heating, would broaden the potential consumer base for GHP.
3.8.3 Prospects for geothermal heating in Kentucky
Given that geothermal resources are available everywhere for installing GHP, Kentucky’s potential for reducing energy consumption and heating costs substantial, especially since Kentucky ranks eighth highest in energy consumption per capita (EIA, 2010d). Despite the need to improve energy efficiency and reduce per-capita energy use, Kentucky has somewhat neglected the opportunities and benefits provided by GHP and geothermal generally (Beshear, 2008).
Regardless of the lack of state support, Kentucky still ranked 5th in total energy consumption from geothermal resources and 12th in imports of GHP units in 2009 (EIA, 2011j; 2010b). This suggests strong market performance. However, Pennsylvania and Ohio each imported nearly double the number of GHP units as Kentucky, suggesting that Kentucky can do more to support additional growth in the GHP industry. Doing so would provide significant energy savings for Kentucky’s residents and businesses.

68 | P a g e
4. EXISTING POLICIES AFFECTING DISTRIBUTED RENEWABLE ENERGY IN KENTUCKY
This section reviews the policies and incentives in place in Kentucky that support, or in some cases inhibit, the development of distributed renewable energy. The policies that currently have the greatest impact are the state net metering policy and interconnection standards. In addition, this section summarizes the few financial incentives available for supporting renewable energy. TVA’s Green Power Providers, Renewable Standard Offer, and EnergyRight Solutions Heat Pump program are also discussed.
4.1 Net metering
Net metering polices are “market-based incentives addressing the market barrier of project economics that exist for most high ‘initial’ cost renewable energy technologies” whose purpose is to “create incentives for private investment in distributed energy technologies by providing value to the electricity generation that exceeds the customer’s own electricity demand” (Doris et al., 2009, p. 1). Net metering policies place limits on distributed electricity generation and set rules for compensating owners of these systems.
Net metering is one of the most important policy drivers for distributed renewable energy systems because it enables system owners to recover some of their investment through savings on their electricity bill (Coughlin and Cory, 2009). Typical implementation is simple. A utility customer’s billing meter runs backward as electricity is generated and exported to the grid, and runs forward as electricity is consumed from the grid. At the end of a billing period, the customer receives a bill for the net electricity, which is the amount of electricity consumed less the amount produced and exported into the grid (Price and Margolis, 2010).
Forty-three states in the US have adopted net metering policies, including Kentucky (IREC, 2012a). The policies vary in regard to capacity limits, the type of utilities to which the policy applies, and the technologies eligible for net metering. Each of these factors plays a role in the degree to which distributed energy can contribute to diversifying a state’s energy portfolio and achieving renewable energy goals.
Capacity limits tend to restrict the usefulness of net metering policies more than either of the other two factors. The limits set the maximum capacity allowed for an individual net-metered system as well as the total amount of distributed energy capacity that utilities are required to connect. In many states, such as West Virginia and Pennsylvania, capacity limits vary by sector, with higher limits for industrial customers and lower limits for residential customers. Some states like Kentucky have lower overall ‘aggregate’ capacity limits, while other states have higher limits or even no limit at all, as is the case with Ohio (IREC, 2012a).
Other policy elements may include a determination of how excess generation is handled when a customer’s system generates more electricity in a single month or year than the customer consumes, the ownership of RECs generated by the system, and whether individual electricity meters can be aggregated—a detail which addresses co-ownership of a distributed energy system and the distribution of benefits or credits.
Kentucky’s net metering policy is structured as follows:
Eligible technologies: Solar PV, wind, biomass, biogas, and small hydroelectric Applicable utilities: IOUs and RECCs, but not munis Applicable sectors: Residential, commercial, industrial Single-system capacity limit: 30 kW Aggregate capacity limit: 1% of a utility’s single-hour peak load during the previous year Excess generation: Credited to customer’s bill at retail rate, carries over indefinitely REC ownership: Customer owns the RECs Meter aggregation: Not addressed

69 | P a g e
As compared to numerous other states, Kentucky’s net metering policy can be regarded as only minimally supportive of distributed energy development. The main concern about the policy is that the low capacity limit, both for individual systems and in the aggregate, limits the development of larger systems as well as the growth of distributed renewable energy.
First, the 30 kW limit on individual systems restricts the development of certain technologies such as small hydroelectric systems that can range from less than 1 kW to as large as 20 MW, LFGTE systems that are often developed in the range of 1-10 MW, and CHP systems that generate excess electricity beyond what is consumed onsite. The capacity limit, combined with a lack of policy addressing meter aggregation, also potentially restricts opportunities for the development of community-owned distributed energy systems, which can be larger than 30 kW. For instance, community-owned wind farms, whether consisting of small or large wind turbines, are defined as having a total capacity of less than 30 MW (Windustry, 2010). Community-owned commercial and industrial-scale solar systems are also restricted by the 30 kW capacity limit.
Second, the aggregate capacity limit of 1% of a utility’s single-hour peak load severely limits the potential for distributed energy to contribute to renewable energy development in Kentucky because the nature of the resource requires development to be “widely distributed and relatively small in scale” (Beshear, 2008, p. 32).
4.2 Interconnection standards
Interconnection standards govern the manner in which non-utility electric power generators connect to the electrical grid. The model set of standards for distributed energy is series IEEE 1547—“Standard for Distributed Resources Interconnected with Electric Power Systems.” The base standard details the requirements relating to the access, performance, operation, testing, safety considerations, and maintenance of the grid interconnection. Additional standards in this series address interconnection system testing, applications, monitoring, information exchange and control, intentional islanding, and network systems (NREL, 2009b).
Some in the distributed energy industry have identified utility opposition to grid interconnection as the greatest barrier to the development of distributed generation technologies in some states:
Historically, utilities have made it difficult for distributed generation to connect to their distribution lines…[and] have done so both to protect their monopoly as well as through concern (legitimate or otherwise) about the safety of connecting independent power generation of any size to the grid (Kubert and Sinclair, 2009, p. 27).
Additionally, “some [electric] utilities…place overly conservative restrictions on interconnected systems, creating added costs that may make an installation economically unfeasible” (NREL, 2009b, unnumbered). Such costs may include high costs for liability insurance, safety equipment, and/or grid or line upgrades. Smaller projects, which are more likely under restrictive capacity limits, are also more likely to fail due to higher cost requirements and restrictions. Larger projects are more likely to succeed since they benefit from economies of scale and can therefore absorb higher interconnection costs.
Kentucky’s current interconnection standards include the following elements:
Eligible technologies: Solar photovoltaics, wind, biomass, biogas, small hydroelectric
Applicable utilities: IOUs, RECCs, but not municipal utilities
System capacity limit: 30 kW
Net metering: Required
REC ownership: Customer retains RECs
Larger systems: may interconnect only after approval from the PSC Siting Board

70 | P a g e
In 2008, USEPA assessed the status of interconnection standards in all 50 states and graded each state’s standards according to their “friendliness” to distributed generation based on four categories: “favorable,” “unfavorable,” “neutral,” and “no policy in place.” Of the 32 states that had interconnection standards in place, five had unfavorable policies, and Kentucky was among the five (USEPA, 2008). An unfavorable designation by USEPA means that a state’s policy included restrictive requirements such as allowing only small units to interconnect, having high liability insurance requirements, requiring owners and operators of distributed energy systems to pay large interconnection study fees, and inclusion of other burdensome requirements (USEPA, 2008). Another key issue associated with Kentucky’s standards, not addressed by USEPA, includes the omission of CHP and LFGTE as eligible technologies. The persistence of each of these barriers resulted in Kentucky’s standards receiving a grade of “F” in a report by the Network for New Energy Choices, which was co-authored by the Interstate Renewable Energy Council (IREC) and others (Network for New Energy Choices, 2011). Overall, Kentucky’s current interconnection standards restrict the interconnection, and therefore the development of distributed renewable energy systems in Kentucky.
4.3 Financial incentives provided by the Commonwealth
Kentucky offers a few financial supports for renewable energy. Two corporate incentives will help commercial- and industrial-scale distributed energy projects, while the third supports smaller customer-owned distributed renewable energy systems. The state does not currently have any other programs or incentives in place that support distributed renewable energy development. The strongest financial incentives and programs in the state are offered by TVA, which accounts for only 25% of the total electricity generated in the state and is not regulated by PSC. Overall, Kentucky’s fiscal and programmatic support for renewable energy, particularly distributed energy systems, is substantially less than the level of support provided in many other states in Appalachia (see Section 5.5). However, TVA’s programs do provide an in-state working model of how certain state-level programs could be structured and how successful they can be.
4.3.1 Tax exemption for large-scale renewable energy projects
The Incentives for Energy Independence Act was established in 2007 to promote the development of renewable energy and alternative fuel facilities, energy efficient buildings, alternative fuel vehicles, research and development activities, and other energy initiatives. For renewable energy facilities, the Act provides incentives to companies that build or renovate facilities that utilize renewable energy. The Act defines a renewable energy facility as one that generates at least 50 kW of electricity from solar power or at least 1 MW from LFG, wind, biomass, hydropower, or similar renewable resources. The electricity must be sold to an unrelated party. The minimum capital expenditure must be $1 million, which is defined to include various non-capital costs such as labor. The available tax incentives include a sales tax exemption of up to 100% of the Kentucky sales and use tax paid on materials, machinery, and equipment used to construct, retrofit, or upgrade an eligible project; a corporate income and limited liability entity tax exemption of up to 100%; and a tax credit of 4% of the total gross wages paid by the company’s employees.
4.3.2 Corporate renewable energy tax credit
In April 2008, Kentucky established a 30% state income tax credit for certain solar, wind, and geothermal installations on single- or multi-family residences and on commercial property. The applicable corporate sectors include the commercial, industrial, and agricultural sectors. Eligible technologies include passive and active solar space heat, solar water heat, combination active solar space heat and water heat, solar PV, wind, and GHPs. The incentive amounts to $3 per W of installed solar PV and 30% of eligible costs for the other technologies. This would appear to be a strong incentive; however, the maximum incentive for solar and wind installations is capped at $1,000 per taxpayer for multi-family residential units and commercial properties. It is also capped at $500 for single-family residential units and $250 for GHP investments. The credit is set to expire in 2015.

71 | P a g e
4.3.3 Personal renewable energy tax credit
Finally, Kentucky offers a personal renewable energy tax credit that is similar to the corporate credit. The same eligible technologies apply, but eligible sectors include residential and multi-family residential. The structure of the incentive is the same as for the corporate credit: $3 per W for solar PV and 30% of eligible costs for all other technologies. The personal credit is more limited than the corporate credit, as it limits the maximum incentive to $500 for solar and wind technologies (the incentive for GHPs is unchanged, at $250). Due to the low cap, the tax credit will have little impact on the cost of installing solar and wind technologies on residential properties. For instance, an incentive of $500 will only reduce the cost of an average 2 kW solar PV system by 4%. This tax credit is also set to expire in 2015.
4.4 Tennessee Valley Authority
TVA offers a number of programs and incentives for supporting distributed renewable energy development of various types, including both electricity generating technologies and heating systems. TVA’s two strongest programs are the Green Power Providers program and the Renewable Standard Offer.
4.4.1 Green Power Providers
TVA’s Generation Partners Program was developed in 2003 as a pilot program aimed at supporting residential, commercial, nonprofit, and government installations of small-scale renewable energy systems.18 Due to its success over the first eight years, TVA is revising the program in 2012 and changing its name to the Green Power Providers program. Eligible technologies include solar PV, wind, biomass, and low-impact hydroelectric, and the eligible system size ranges from 500 W to 50 kW (TVA, 2011).
The program works similar to a feed-in tariff (FIT), which guarantees a standard rate for electricity generated by customer-owned renewable energy systems. In this sense it is a performance-based incentive (PBI). Participants who want to install renewable energy systems must apply and be accepted into the program. Under the new program, once an application is approved, the participant signs a 20-year contract with TVA. This provides a period long enough to cover the expected life of the renewable energy system, while allowing customers to more easily attain financing for their projects.
For the first 10 years of the contract, participants in the program sell their excess renewable energy (what the customer does not consume themselves) to TVA—via their electricity distribution company—at 12 cents per kWh above the retail rate for solar PV systems and 3 cents per kWh above retail for all other eligible technologies. In other words, if the retail rate were 10 cents per kWh, participants would receive a credit on their bill of 22 cents per kWh for electricity generated from solar PV and 13 cents per kWh for electricity from other sources. The customer’s electricity distributor may choose to carry over each month’s credit to the next bill and make a lump sum payment for the cumulative credit at the end of 12 months. After the initial 10 years, TVA will pay only the retail rate of electricity (TVA, 2011).
TVA also provides participants with an initial payment of $1,000 to help offset the upfront costs of purchasing and installing the system. Participants therefore benefit from the initial payment, the energy payment from TVA, and the reduction in costs for electricity consumed from the grid. TVA retains rights to ownership of the RECs generated by the system and therefore the revenues generated from the sale of the RECs.
Worldwide, FITs are proving to be the most effective policy tools for driving distributed renewable energy development, as 64% of the world’s wind power and nearly 90% of the world’s solar power development have been attributed to the existence of a FIT (Farrell, 2011d). FITs are discussed in detail in Section 5.
18 It should be noted that the program’s impact in Kentucky is restricted to customers that account for only 25% of the state’s total electricity consumption.

72 | P a g e
4.4.2 Renewable Standard Offer
Since the Green Power Providers program is limited to renewable energy projects with no more than 50 kW of capacity, TVA offers a Renewable Standard Offer program for developers of larger projects. To be eligible, projects must be located in the Tennessee Valley region and have a capacity between 50 kW and 20 MW. Eligible technologies include solar PV, wind, biomass gasification, biomass direct combustion, methane recovery, and biomass co-firing of 50% or more biomass. The project must be interconnected to a TVA power distributor’s or TVA’s electric system. In total, the program is set to allow no more than 100 MW for all projects, with no single fuel type contribution more than 50% of the total (TVA, 2012).
The “standard offer” represents a performance-based electricity tariff. Participants receive a seasonal and time-of-day payment for the electricity their systems generate. As a result, because cost of generation for TVA are higher during periods of peak demand, projects that operate during peak hours such as solar PV receive higher prices during these periods. The guaranteed base price is 3.79 cents per kWh above retail rate (13.79 cents per kWh total), increasing up to 15.96 cents per kWh during peak seasons and hours (25.96 cents per kWh total). The base rate increases 3% per year and contract terms are 20 years. As with the Green Power Providers program, TVA retains ownership of all RECs.
4.4.3 EnergyRight Solutions Heat Pump Plan
TVA also offers an EnergyRight Solutions Heat Pump Plan that provides financing to promote the installation of high efficiency GHPs in homes and small businesses (IREC, 2012b). Installation, performance, and weatherization standards ensure the appropriate sizing of equipment and operation of the system. TVA maintains a contractor network to help customers choose an installer. Through a third-party lender, TVA provides on-bill financing for residential heat pumps with repayment on the customer’s electric bill and a term of up to 10 years. The programs are independently administered by the local power companies served by TVA. The loans are offered at rates of 6-8%, depending on the utility, with the maximum loan of $10,000 for single heat pump units and $12,500 for multiple units (IREC, 2012b)
4.5 Conclusion
Kentucky offers very few incentives for promoting the expansion of distributed renewable energy. While the existing incentives do offer a small degree of support, they are set to expire in 2015 and there is no guarantee that they will be reauthorized. Additionally, the use of tax credits for incentives is problematic in that it eliminates any non-taxable entity from access to the incentive, including municipal or county governments, tribal entities, nonprofit organizations, and cooperatives.
To provide long-term support for distributed renewable energy, and therefore ensure that the economic and environmental benefits will continue to grow, Kentucky should look beyond tax incentives and implement more effective and stable policies while improving the existing policies governing interconnection and net metering.
The most effective programs in the state are currently provided by TVA and have met with great success. However, as described in Section 5.2, even TVA’s Green Power Provider and Renewable Standard Offer programs can be improved upon through the implementation of a statewide FIT. There are additional policy options available to Kentucky—such as a statewide REPS—that can complement a FIT and provide even greater long-term support for distributed renewable energy development.

73 | P a g e
5. POLICY OPTIONS FOR KENTUCKY
There are many policy options available to Kentucky that would bolster the development of distributed renewable energy. This section details some of the more effective policy options available, each of which has been implemented in other states. These policies address specific barriers to distributed renewable energy development. For instance, a RPS addresses economic and political barriers to renewable energy development by requiring a certain level of development from renewable resources over a specified period of time. FITs help overcome barriers related to the valuation of renewable energy generation and the economic feasibility of developing distributed systems. Additional barriers associated with developing larger and more technologically diverse systems are addressed through net metering and interconnection standards. Finally, financial incentives such as tax credits, grants, and rebates help reduce upfront costs.
The recommended policies represent reasonable options for Kentucky. They can be implemented individually. However, each of the described policies was chosen with the aim of offering a suite of complementary policies that, if implemented together, would provide strong and comprehensive support for distributed renewable energy development in Kentucky. Other states in the US have established or are establishing far more aggressive policies than those recommended in this section.
5.1 Renewable energy portfolio standard with distributed generation requirement
RPSs are one of the stronger policy options for supporting the development of renewable energy and have driven large-scale renewable energy development in the US (Wiser et al., 2010). A RPS requires electric utilities to purchase or generate a growing quantity of renewable energy over time. The programs typically include a compliance schedule that sets low short-term targets and increases the target level periodically until achieving an ultimate target by a defined date.
For instance, North Carolina’s RPS, established in 2007, requires that all IOUs selling electricity to in-state customers supply 3% of that electricity from renewable energy sources by 2012, 6% by 2015, 10% by 2018, and finally 12.5% by 2021. Up to 25% of a utility’s requirement may be met with energy efficiency, including CHP powered by non-renewable fuels. Electric cooperatives and municipal utilities are only required to meet an overall target of 10% by 2018, and they may satisfy the requirement using only demand-side management or energy efficiency if they choose.
As of late 2010, 29 states plus the District of Columbia had implemented a RPS with mandatory targets, while another eight states had set voluntary goals (see Figure 14). Some states such as North Carolina combined renewable energy goals with energy efficiency targets, while other states such as West Virginia allow “alternative” energy sources—such as coal-fired power plants retrofitted with carbon capture and storage technology—to be developed in order to meet a portion of the RPS goals. Most RPSs were originally intended to be technology-neutral, promoting competition among various technologies and allowing the lowest-cost technologies to succeed. Because of this market-based approach, large-scale wind power has been developed at a much faster pace than other technologies (Wiser et al., 2010). In response, many states have adopted policies that support a greater diversity in renewable energy development.
Two RPS design options are being used to encourage or require greater renewable resource diversity. These options can be incorporated exclusively or in combination with each other. The first option is to provide credit multipliers that give solar and/or other customer-sited renewable energy systems additional credit toward meeting compliance obligations. For instance, utilities in Washington State that own, purchase, or have contracted the RECs from distributed renewable energy generation receive double compliance credit for every MWh generated. While credit multipliers provide an incentive to pursue distributed energy, evidence suggests they often fail to overcome the higher cost of small-scale technologies, and have therefore been unsuccessful in encouraging distributed energy (Kubert and Sinclair, 2009).
74 | P a g e
The second and most common option is to incorporate a “set-aside” or “carve-out” into the RPS requiring a portion of the renewable energy percentage to come from solar-based technologies or other distributed generation resources. Solar set-asides have been instituted in 14 states, and another four states have set-asides for a combination of distributed renewable energy technologies (see Figure 14). Appalachian examples include: Pennsylvania (0.5% of generation from solar PV by 2021), Ohio (0.5% solar PV by 2024), and Maryland (2% solar PV by 2022).
According to Wiser et al. (2010):
The design of solar and distributed generation set-asides varies widely across states. Design variations reflect the differing objectives of state policymakers, state-specific political exigencies, and electricity market designs and regulatory frameworks. As a result, a patchwork of solar support policies exists, demonstrating both a range of design choices available to policymakers, and how those design choices can impact policy outcomes (p. iii).
Set-asides for solar and other distributed renewable energy generation create domestic, in-state markets for distributed generation that support more local ownership and in-state economic value (Farrell, 2011a). In states with only a solar set-aside, markets are created where SRECs can be bought and sold at the going market rate. Customer-owned solar PV or, in some cases, solar hot water systems generate an SREC for every MWh the system generates. Owners can sell the RECs to earn additional revenue that increases the return on their investment. By purchasing SRECs, electric utilities earn credits toward meeting their RPS obligations.
Due to the combination of solar and distributed generation set-asides, new revenue streams resulting from SREC markets, and the rapid decline in solar PV costs, the US has experienced strong growth in the solar market in recent years:
In each year from 2005-2009, between 65% and 81% of the annual grid-connected PV capacity additions in the US outside of California occurred in states with active or impending solar/[distributed generation] set-aside obligations. In aggregate, from 2000 through 2009, more than 250 MW of [solar] PV capacity is estimated to have been brought on-line to meet state-level solar or [distributed generation] set-asides (Wiser et al., 2010, p. iii).
This growth suggests that set-asides play a key role in supporting the development of distributed energy such as solar PV. The strongest growth associated with set-asides through 2009 has occurred in New Jersey (101 MW), Colorado (46 MW), Arizona (36 MW), New York (22 MW), and Nevada (19 MW) (Wiser et al., 2010). Analysis further suggests that existing RPS set-aside requirements alone would lead to the installation of more than 8 GW of cumulative installed solar capacity by 2025 (Wiser and Barbose, 2008).
Kentucky is one of 13 states without either a mandatory or voluntary RPS. However, HB 167—the CEOA, introduced to the Kentucky Legislature in 2012 but not adopted, would have set mandatory targets for both renewable energy and energy efficiency, while also establishing both a solar carve-out and a low-income residential efficiency target. It would also have established guidelines for a FIT requirement (Kentucky Legislative Research Commission, 2012a). The details of the CEOA and its potential economic impacts are presented in the Spotlight section on the CEOA (which follows Figure 14).

75 | P a g e
Figure 14: Policy design and targets for renewable energy portfolio standards in the US in 2011
Source: IREC (2012c). Notes: Many states have more nuanced programs than suggested by this map. Some require different compliance targets depending on the type of utility. The map presents the maximum required target, which is usually required of IOUs. Some states such as Pennsylvania allow non-renewable energy sources to constitute a certain percentage, and West Virginia allows 100% of compliance targets to be met with non-renewable sources. Additionally, the map only shows total targets and excludes carve-outs for solar and distributed generation. It also excludes information on whether solar water heating qualifies as an eligible technology, or whether states provide multiplier credits for preferred technologies.

76 | P a g e
Spotlight: The Clean Energy Opportunity Act
Bill number: House Bill 167
Sponsors: Representatives Mary Lou Marzian, Rita Smart, and Jim Wayne
Purpose: “To promote energy independence and security by diversifying the portfolio of energy sources used for generating electricity for Kentucky electric customers; stabilize long-term energy prices and encourage economic growth; and create high-quality jobs, training, business, and investment opportunities in the Kentucky energy sector.”
Eligible technologies: Solar PV, concentrated solar thermal, solar hot water, geothermal, wind, low-impact biomass, hydro, anaerobic digestion, CHP from renewable sources, and landfill gas
Applicable utilities: IOUs, RECCs, municipal utilities
Solar carve-out: Supply 0.25% of each utility’s retail electricity sales with eligible solar technologies in 2014, rising to 1% by 2022 with interim compliance targets set for 2017 and 2020.
Requirements: The following table details the annual compliance targets established in the CEOA. The baseline to be used is the average of the total kWh sold to retail electricity customers during the two years prior to the target year.
Year
Renewable energy
(% generated)
Solar carve-out
(% generated)
Energy efficiency
(% savings) Low-income residential efficiency (% savings)
2014 2.25 0.25 0.25 0.01
2015 2.25
0.75 0.03
2016 2.25
1.50 0.06
2017 5.50 0.50 2.50 0.10
2018 5.50
3.75 0.14
2019 5.50
5.00 0.19
2020 9.25 0.75 6.50 0.25
2021 9.25
8.25 0.31
2022 12.50 1.00 10.25 0.39
Source: Kentucky Legislative Research Commission (2012a).
Potential benefits:
A recent analysis of the CEOA estimates the net impacts that would result from its implementation through 2022 as compared to the business-as-usual (BAU) scenario. The study found the net benefits to include a more diverse electricity resource portfolio, significant energy efficiency reductions at a low cost, annual electricity bills that are 8-10% lower than under BAU, and the net addition of 28,000 annual job-years, $1.1 billion in personal income, and $1.5 billion in gross state product by 2022 (Hornby et al., 2012).

77 | P a g e
5.2 Implement a feed-in tariff
A FIT is an energy supply policy that offers a guarantee of payments to renewable energy developers for the electricity they produce. FITs are an advanced form of PBI, where a payment is awarded for the actual electricity produced. The payments are generally provided through long-term contracts set over a period of 15-20 years. FIT rates are typically determined based on the technology, system size, and project location. Rates can be based on: the actual levelized cost of generation from the renewable energy system, which awards payments sufficient to ensure the profitability of the system; the utility’s avoided costs, either in real time or according to projected fossil fuel prices; or offered as a fixed-price incentive that is established arbitrarily and without regard to levelized project costs or avoided costs (Rickerson et al., 2008).
FITs can be implemented to support all renewable technologies and are often aimed more directly at distributed energy systems. Provided the payment levels are differentiated appropriately, FITs can increase development in a number of different technology types over a wide geographic area, while contributing to local job creation and helping to stabilize electricity prices. Other potential benefits include support for community ownership of energy production and revitalizing rural areas (Rickerson et al., 2008).
As a result of the success of FITs in Europe and around the world, a number of US states have considered or implemented FITs, and several utilities such as TVA have launched utility-specific FIT programs. A model example is Vermont’s Standard Offer program. In 2009, Vermont established the first comprehensive FIT program in the US. The program currently provides payments based on the levelized cost of generation after accounting for tax and other financial incentives, while also guaranteeing a return on investment. The aggregate capacity limit is 50 MW, and the project limit is 2.2 MW. In 2011, contracted distributed renewable energy projects generated up to 2,000 MWh and earned up to $300,000 per month (VermontSPEED, 2012).
Well-designed FITs provide a cost-efficient method for fostering rapid development of renewable energy. They offer long-term certainty of payment terms and transparent contracts that help minimize administrative and regulatory barriers, can be fine-tuned to encourage particular technologies or project sizes, and can be adapted to match different electricity market structures (Rickerson et al., 2008). Two good examples of tailoring FITs to achieve separate goals include TVA’s Green Power Provider’s program for smaller-scale distributed renewable energy projects, and its Renewable Standard Offer program for medium-scale projects.
FITs do have a few disadvantages. For instance, they do not directly address the high up-front costs of projects, and their impact on electricity rates is not well understood (Rickerson et al., 2008). However, the following best practices can help to ensure the success, cost efficiency, and overall performance of FITs:
a minimum program duration of five years; long-term contracts of 15-20 years to provide investment security and a lower levelized project cost; payment levels based on the levelized cost of generation to ensure a modest profit for developers; tariff degression (incremental payment decreases) to account for future cost decreases; payment levels differentiated by technology, project size, and resource quality; incorporation of the added costs of the FIT policy into the electricity rate base; and streamlined permitting processes to reduce barriers and transaction costs (Rickerson et al., 2008).
The CEOA (HB 167) would have established a FIT for Kentucky that addresses each key element outlined above.19 The combination of a RPS with a solar carve-out and a FIT would help ensure that Kentucky can meet the renewable energy requirements set by the legislation while supporting local economic development and the diversification of the state’s energy portfolio.
19 The CEOA would have required the PSC to “develop guidelines for a tariff to be filed by each retail electric supplier establishing the interconnection procedures and rate at which an eligible electric generating facility will be compensated for renewable electricity generated and fed into the distribution system or transmission grid of that retail electric supplier” (Kentucky Legislative Research Commission, 2012a).
78 | P a g e
5.3 Strengthen the state net metering law
Net metering is one of the most important laws for distributed renewable energy systems because it enables system owners to recover some of their investment through savings on their electricity bill (Coughlin and Cory, 2009). As described in Section 4.1, compared to many other states, Kentucky’s net metering law is only minimally supportive of distributed energy development because of its low capacity limits and other factors. The effectiveness of the law could be improved by significantly increasing the capacity limit for both individual systems and in the aggregate.
The capacity limits set by other states vary widely. Some states limit individual system capacities to around the same level as Kentucky, while other states have higher limits ranging from 1-20 MW. Arizona, Colorado, and Ohio have not set capacity limits, at least for IOUs. Legislation was introduced in the Kentucky Legislature in 2012 to address this issue, but like the CEOA was not adopted. HB 187, sponsored by Representative Jim Wayne, would have revised Kentucky’s net metering law by expanding the capacity limit for individual distributed energy systems to 2 MW (Kentucky Legislative Research Commission, 2012b). Such a limit would bring Kentucky’s capacity limit in-line with many other states that have set similar limits, while allowing more flexibility in financing and constructing eligible systems. The bill did not address the aggregate capacity limit.
5.4 Upgrade the state’s interconnection standards
As described in Section 4.2, Kentucky’s interconnection standards were found in both a 2008 review by USEPA and a 2011 report by the Network for New Energy Choices to be unfavorable to distributed energy generation, meaning that they include requirements that restrict or limit the connection of distributed energy systems to the grid (USEPA, 2008). A key issue that was not addressed in the 2008 review is the omission of CHP and LFGTE as eligible technologies. This section details model standards that could be implemented in Kentucky and remove barriers to distributed energy.
According to USEPA, utility interconnection can be a critical component of a successful distributed energy project, as it enables a facility to: (1) purchase power from the grid to supply supplemental power as needed; (2) sell excess power to the utility; and (3) maintain grid frequency and voltage stability (USEPA, 2007). USEPA recommends standardized interconnection rules to encourage distributed energy development, reduce uncertainty, and “obtain the benefits that clean distributed generation can provide without compromising grid safety or reliability” (USEPA, 2007, unnumbered). The recommended rules are as follows:
establish clear and uniform processes and technical requirements for connecting distributed generation systems to the electric utility grid;
ensure consistent costs of interconnection throughout a grid or state that are appropriate given the size, nature and scope of a particular distributed energy project;
provide developers a level of certainty about the time and costs involved in the application process and the technical requirements for interconnection; and
ensure that project interconnection meets the safety and reliability needs of both the energy end-user and the utility (USEPA, 2007).
Finally, USEPA outlines a number of best practices, based on standard interconnection rules implemented in various states, which balance the concerns and needs of utilities, developers/owners, and the public (USEPA, 2007). These will not be discussed in this report but are available on USEPA’s website. However, there are A few examples of model interconnection standards that are useful to highlight.
In 1999, New York was one of the first states to issue standard interconnection requirements for distributed generation systems. The initial requirements were limited to systems rated up to 300 kW and connected to radial distribution systems. They were then modified to include interconnection to radial and secondary distribution networks for systems with capacities of up to 2 MW.

79 | P a g e
Additionally, in 2002, Massachusetts created and adopted a Model Interconnection Tariff that simplifies the interconnection approval procedure for systems less than 25 kW, eliminates all fees, and ensures a 15-day turn-around on processing applications. Texas has gone even further by adopting rules that apply to systems smaller than 10 MW. To streamline the interconnection process, systems are pre-screened based on the size of the equipment and the relative size of the system to the load on the feeder line. Other states with model interconnection standards include California, Ohio, and Pennsylvania (USEPA, 2007).
5.5 Provide more effective financial incentives
As described in Section 4.3, compared to other states in the US and Appalachia, Kentucky offers very few incentives for distributed renewable energy, and even the existing incentives have little impact on development. Additionally, non-taxable entities are not eligible for the incentives. Stronger financial incentives for distributed renewable energy, combined with other policy programs such as a FIT, would provide long-term support for distributed renewable energy. This section describes various incentive options that Kentucky could implement and provides a few examples of incentives in other states. It does not recommend specific incentive rates or amounts; however, for any of these programs or incentives to be effective, they must be tailored to the unique circumstances in Kentucky.
5.5.1 Tax credits and exemptions
Options for direct financial incentives include tax credits and exemptions, PBIs, grants, rebates, and low-interest loans. Two predominant tax credits include investment tax credits (ITCs) and production tax credits (PTCs). Each reduces the cost of purchasing and installing distributed energy systems through a credit on the owners’ personal or corporate state income taxes. ITCs help reduce the upfront cost of the system, while PTCs are claimed on an annual basis and based on the energy generated each year (Kubert and Sinclair, 2009). While both incentives are beneficial, the ITC is more effective because it helps address the potential barrier of high up-front capital costs for distributed energy systems. ITCs for residential systems are often capped at relatively low amounts, in the range of thousands of dollars, and may vary according to specific technologies. For instance, North Carolina offers a personal ITC for solar PV systems rated at 35% of the system cost and capped at $10,500, while for other technologies the incentive is $1,400 (IREC, 2012d).
Two other common direct incentives are sales tax and property tax exemptions. Twenty-six states, including Kentucky, offer state sales tax exemptions on the purchase of renewable energy systems. Sales tax exemptions serve the same purpose as ITCs in that they reduce the up-front cost of developing distributed energy systems (Kubert and Sinclair, 2009). Kentucky’s incentive for residential installations is capped at $500, while New York, for comparison, has no cap. A number of states also offer property tax exemptions based on the installed value of renewable energy systems. Nevada and Colorado, among others, provide for a 100% property tax exemption, with eligible sectors differing from state to state.
The issue of non-taxable entities being unable to benefit from renewable incentives is being addressed in at least 20 states, each of which has authorized third-party power purchase agreements (PPAs) between private investors and non-taxable entities. All sectors can use the third-party PPAs, including homeowners, businesses, utilities, and state and local governments. These PPAs are described as follows:
In a third-party ownership PPA model, one party hosts a PV system on his or her property and a solar developer purchases, installs, owns, operates, and maintains the system. In the residential sector, it is the homeowner that hosts and does not purchase or own the PV system, and instead buys the electricity produced by the PV system under a long-term PPA. In exchange for signing the PPA, the homeowner avoids paying for the PV system up front and usually is not responsible for the operation and maintenance of the system. The PPA provider receives the monthly cash flows in the form of power sales and the fully monetized tax benefits (Price and Margolis, 2010).

80 | P a g e
Other solutions exist. For instance, North Carolina’s renewable energy tax credit statute was amended in 2007 to allow taxpayers who donate money to a nonprofit to help fund a renewable energy project to claim a tax credit. The donor is allowed to claim a share of the credit proportional to the project costs that the nonprofit could claim if the organization were subject to tax. A later statute established in 2008 applied this same mechanism to donations made to units of state and local governments (IREC, 2012d).
5.5.2 Performance-based incentives
PBIs are tied to system performance and actual energy generation rather than units of installed capacity or system cost. PBIs are paid over a fixed time period on a per-kWh basis. FITs and PTCs are examples of PBIs. As they are performance-based, PBIs encourage good system siting, the use of certified equipment, quality installations, and ongoing maintenance. PBIs can be tailored to reflect the “grid value” of a technology or system, with systems located in areas of high consumption receiving higher PBI rates due to the benefit of reducing stress on the distribution system during peak load periods (Kubert and Sinclair, 2009).
One model PBI program is the California Solar Initiative (CSI), established in 2006. The CSI is a direct cash incentive program that has committed to provide over $3 billion for solar PV projects and install 3,000 MW of solar PV capacity by 2016. The program provides a PBI as either a lump-sum upfront payment (in the form of a rebate) valued based on expected performance (only available to systems less than 50 kW), or is paid out according to measured generation over the first five years of operation (Go Solar California, 2011).
5.5.3 Grants, rebates, and low-interest loans
In addition to tax incentives, many states offer cash grants, rebates, or low-interest loans for renewable energy installations. Grants are typically provided following an application process. For instance, New York offers grants for CHP systems that cover up to 50% of the project cost, with a maximum grant of $1 million.
Rebates are one of the more common incentives and represent lump-sum payments that cover a portion of a project’s capital cost and are normally paid to the project owner upon installation. They are generally capacity-based subsidies, meaning the rebate amount is tied to the size of the system installed (Kubert and Sinclair, 2009). Both states and electric utilities offer rebates, although utility rebates are most often provided for energy efficiency improvements or equipment. A good model is Pennsylvania’s Sunshine Solar rebate program, which provides rebates to all sectors for the installation of solar PV, battery backup, and solar thermal, and provides a larger incentive for low-income installations. The residential rebate for solar PV is $750 per kW, and is capped at the lesser of $7,500 or 35% of installed costs. The commercial rate is $500-$750 per kW, and is capped at the lesser of $52,500 or 35% of installed costs (DSIRE, 2012e).
Direct loan programs are administered by state governments and are funded by state funds, issuance of a tax-exempt bond, or allocations from established public benefits funds (PBFs). Direct loan programs can take the form of a revolving loan fund, in which principal payments from one loan are used to make subsequent loans. Under a low-interest direct loan program, interest rates are set below interest rates offered by private lenders for similar projects. Because the program’s loan underwriting team have a significant understanding of the economics and risks of investments in renewable energy technologies, a state-supported loan program may be more likely than private lenders to finance renewable energy installations (Kubert and Sinclair, 2009).
While there are numerous low-interest loan programs offered by states, a good model program offering low-interest loans for solar energy systems is provided by MACED. MACED offers low-interest financing and technical support for the installation of solar water heating systems in Eastern Kentucky. MACED also offers loans to businesses to install renewable energy systems and energy efficiency improvements and to support the development of renewable energy businesses (Kentucky Solar, 2006).
81 | P a g e
PBFs, also known as clean energy funds, offer one mechanism for financing grant, rebate, and loan programs. These are special-purpose funds set up to support renewable energy or energy efficiency investments. They are often funded through a small surcharge on utility bills or are funded through a portion of the sales tax paid on renewable energy installations or from other tax sources. The revenues generated by a PBF are then distributed in the form of grants, loans, or rebates to support renewable energy and energy efficiency investments. PBFs support renewable energy and/or energy efficiency projects are in place in 16 states (Kubert and Sinclair, 2009). In total, state PBFs have invested over $2.7 billion in state funds to support renewable energy markets and have leveraged another $9.7 billion in additional federal and private investment, resulting in the development of over 72,000 projects in the US (Muro and Milford, 2012).
Aside from generating funds for supporting clean energy investments, PBFs allow for the use of an equitable funding mechanism without depending upon an annual state budgeting process for continued funding. They also offer significant flexibility in how funds are applied to support renewable energy and energy efficiency, which allows the funds to respond to market opportunities and conditions (Kubert and Sinclair, 2009).
5.6 Implement policies that maximize the sustainability and economic benefits of distributed renewable energy
Finally, Kentucky should establish policies aimed at maximizing the sustainability (minimizing the environmental impact) and/or the economic benefits of distributed renewable energy. The following policies would achieve one or both of these goals and merely serve as a small sample of available policy options:
1. Adopt the Kentucky Division of Forestry’s recommendations for the sustainable harvesting of woody biomass for energy production. Harvesting forests for bioenergy production can have negative impacts on the environment and the health of forests. Recognizing the opportunity to diversify Kentucky’s energy portfolio using forest biomass resources “while protecting water quality, improving air quality, creating jobs, increasing tax revenue, and improving [Kentucky’s] energy independence” (Kentucky Division of Forestry, 2011, p. 1), the Division of Forestry developed a set of recommendations for the sustainable harvesting of woody biomass for energy production. Codifying the Division’s recommendations in state law would help ensure the long-term health of Kentucky’s forests and promote the sustainable use of forest resources for economic development.
2. Mandate that all new hydroelectric generating facilities receive LIHI certification. Hydroelectric plants can create pollution-free energy, but they can also produce significant adverse impacts on fish and wildlife and other resources. LIHI criteria cover eight areas that address key impacts of hydropower development. To minimize social, cultural and environmental impacts of new hydropower development, regardless of size, all new projects should receive LIHI certification.
3. Establish output-based emissions regulations with a thermal credit for CHP. Output-based regulations encourage CHP development by relating emissions to the productive output of the energy-consuming process. Traditional emissions limits do not account for the pollution avoided by increasing process efficiency. By increasing fuel efficiency and producing both electrical and thermal energy, CHP actually reduces the amount of air pollution per unit of energy produced and consumed (USEPA, 2011e). Providing a thermal credit for these reduced emissions allows CHP operators to sell the credits on emissions cap-and-trade markets, thereby providing an incentive for CHP.
4. Create policies supportive of community-owned renewable energy development. Policies could be modeled after the Minnesota’s Community-Based Energy Development (C-BED) and Maine's Community-Based Renewable Energy Act. Kentucky could require utilities to prioritize the purchase of electricity generated by community-owned energy facilities and give consumers the option to purchase power from these sources at a premium. Community-owned systems could be granted fixed-rate long-term PPAs to ensure economic stability and viability. Policies can also include funding or tax incentives specifically for community-owned distributed renewable energy development.

82 | P a g e
6. CONCLUSIONS AND RECOMMENDATIONS FOR OVERCOMING BARRIERS TO DISTRIBUTED GENERATION
This report presents the difference between distributed and centralized energy generation, the economic and environmental benefits of distributed renewable energy generation, the vast renewable energy resources that are available in Kentucky, and the policy tools available to promote the development of these resources with distributed energy technologies.
Governor Beshear’s 2008 energy plan cited the need to “improve the quality of life for all Kentuckians by simultaneously creating efficient energy solutions and strategies, protecting the environment, and creating a base for strong economic growth” (Beshear, 2008, p. ii). While the plan was never implemented, it cited Kentucky’s need to reduce greenhouse gas emissions and diversify the state’s energy portfolio through the development of renewable energy. The plan recognized that Kentucky has sufficient supplies of renewable resources to contribute to a clean energy future; however, it asserted that Kentucky lacks significant utility-scale renewable resources and that the majority of new renewable systems will be widely distributed and relatively small in scale. Kentucky’s ability to develop a substantial amount of renewable energy will therefore require developing distributed forms of renewable energy generation.
Despite the recognition of the potential economic and environmental benefits that could result from distributed renewable energy development, Kentucky continues to rank poorly in terms of support and development of distributed renewable energy. As a result, Kentucky is falling behind other states in the US and Appalachia that are taking advantage of growing renewable energy markets. The reason is a lack of strong policy supports and incentives. However, achieving any future renewable energy goals will require aggressive state investments in renewable energy as well as the establishment of new policies specifically aimed at supporting distributed renewable energy technologies. Further, it will require the recognition and valuation of the economic and environmental benefits that distributed renewable energy can provide.
6.1 The case for distributed renewable energy
This report details a number of reasons why Kentucky should increase support for the development of distributed renewable energy in order to diversify its energy portfolio and shift away from centralized fossil fuel-based energy production. These include rising energy costs, an aging and inefficient electrical grid, the economic potential of distributed energy, and the impacts to public health and the environment associated with coal-fired electricity generation.
One of the more immediate reasons for making the transition is to help stabilize energy prices and lower total energy costs for businesses and residents. Since 2005, as a result of Kentucky’s reliance of coal for electricity generation, electricity prices have increased by an average of 8% annually. This increase has been the direct result of an increase in the price of coal, which has risen by 10% annually. New cost pressures such as regulatory compliance costs and global competition for Appalachian coal are expected to accelerate the rising cost of coal and coal-fired electricity for Kentucky in the coming years. Because most renewable energy systems rely on free fuel, they can help stabilize energy costs.
Stabilizing future energy costs, while significant, is only one of the many benefits that could be provided by a transition to distributed renewable energy. Additional potential benefits for Kentucky include:
the replacement of inefficient and occasionally unreliable centralized energy generation; the addition of a significant amount of baseload power during times of peak load; a reduction in the total value of subsidies required per unit of energy produced; greater security against fossil fuel depletion; reduced costs for new centralized generation, infrastructure, and pollution control;

83 | P a g e
more efficient generation, transmission, and distribution of electricity; increased energy security and grid security; more rapid deployment than centralized generation; diversification of Kentucky’s energy portfolio; growth and diversification of state and local economies; and significant environmental and public health improvements.
The state’s current system of relying on large power plants to provide electricity and heat leaves Kentucky’s residents and businesses—and therefore the state’s economy—vulnerable to continued increases in energy costs. However, Kentucky has the resources to generate a substantial amount of electricity and heat from a wide variety of distributed renewable energy technologies.
6.2 Opportunities for distributed renewable energy development in Kentucky
Distributed renewable energy technologies, as they can harness a broader range of energy resources than centralized generation, can be used to diversify away from a heavy reliance on centralized generation and fossil fuels in Kentucky. The technologies examined in this report include:
solar PV; solar heat and cooling systems; small- and community-owned wind power; forest biomass; CHP; LFGTE; small- and low-power hydroelectric; and geothermal heating.
Our analysis of existing research concludes that there are significant renewable energy resources available within Kentucky and that the development of these resources using existing technologies could provide the equivalent of approximately 34% of Kentucky’s projected electricity generation by 2025. Because these resources are dispersed throughout the state, achieving this level of development will result in few, if any, disruptions to the grid or additional operational costs.
The following table presents the findings for potential capacity and electricity generation in Kentucky that could result from the development of available resources for each of the technologies examined.
Table 18: Summary of existing and potential distributed renewable energy in Kentucky, by technology
Resource/technology Developed
capacity (MWe) Total potential
(MWe)
Generating potential
(million MWh) Percent 2025
generation
Solar photovoltaic 0 5,639 7.4 6%
Solar hot water n/a 1,120 9.8 9%
Small and community wind 0 61 0.1 < 1%
Forest biomass (logging) 5 454 3.4 3%
Combined heat and power 122 3,000 13.3 12%
Landfill gas-to-energy 17 60 0.5 < 1%
Small- and low-power hydro 777 1,050 7.9 7%
Geothermal heating n/a n/a n/a n/a
Total 921 11,384 39.0 34%
Source: Compiled from various studies cited in Section 3 of this report.

84 | P a g e
Our results are supported by previous research, which found that Kentucky could generate more than 25% of its total energy needs from renewable resources by 2025 (Beshear, 2008). Our estimates are also conservative for the reasons detailed in this report. It is notable that additional gains toward transitioning to renewable energy generally can be realized from developing large-scale renewable energy systems.
This information and our estimates show that distributed renewable energy development can play a significant role in achieving future renewable energy goals in Kentucky—far greater than has been recognized by state policymakers.
This report also finds that the cost of energy resulting from developing most of these technologies is on par with the cost of energy currently generated by most of Kentucky’s utilities from coal, or will be in the near future. When policy and financial supports are in place and when the added economic, environmental, and social benefits are considered, distributed energy development can be even more cost-competitive.
6.3 Recommendations
Kentucky offers very few incentives for promoting the expansion of distributed renewable energy, and the incentives that are available have little impact. While the existing incentives do offer a small degree of support, they are all set to expire in 2015 and there is no guarantee that they will be reauthorized. Additionally, the use of tax credits for incentives is problematic in that it eliminates any non-taxable entity from access to the incentive.
Kentucky’s laws and policies regarding net metering and interconnection standards also need to be addressed as they serve as significant barriers to expanding distributed renewable energy. Kentucky’s current net metering law severely limits both the individual and aggregate capacity of distributed energy systems, thereby restricting the development of larger systems as well as the overall growth of distributed renewable energy. Kentucky’s interconnection standards have the same general limiting impact, in that they only allow smaller generating units to interconnect to the grid. The standards also impose high costs in the form of insurance requirements and interconnection study fees. These higher costs may render many smaller distributed energy projects economically unfeasible.
To provide long-term support for distributed renewable energy, and therefore ensure that the economic and environmental benefits will continue to grow, Kentucky should look beyond tax incentives and implement more effective and stable policies while improving the existing policies and laws governing interconnection and net metering.
There are many policy options available to Kentucky that would bolster the development of distributed renewable energy. The policies recommended in this report have proven effective in other states. As such, they represent reasonable options for Kentucky and can be implemented individually or as a complementary policy package. Together, these policies would provide strong and comprehensive support for distributed renewable energy development.
Implement a RPS with a distributed generation “set-aside” requirement. Kentucky is one of only 13 states in the US without either a mandatory or voluntary RPS. However, RPSs are one of the stronger policy options for supporting the development of renewable energy. Kentucky should adopt a RPS with targets that reflect the amount of resources that are available and that incentivize the use of small-scale distributed technologies. To achieve that goal, the state should include a set-aside in the RPS that requires a portion of the energy to be developed using distributed technologies. Set-asides play a key role in supporting the development of distributed energy while creating domestic, in-state markets for distributed generation that support more local ownership and in-state economic value.

85 | P a g e
The CEOA (HB 167) was introduced to the Kentucky Legislature in 2012 by Representative Mary Lou Marzian and seven co-sponsors. The legislation did not pass. However, had it been adopted, the bill would have established a RPS requiring that 12.5% of each utility’s total retail sales of electricity come from renewable energy sources by 2022. The legislation also included a solar set-aside requirement of 1%. Existing research and the findings of this report suggest that the CEOA called for a reasonable, if not conservative, target for Kentucky and it is recommended that the State adopt the legislation in 2013, but with the scope expanded to include a set-aside for all distributed renewable energy technologies.
Implement a FIT. A FIT is an energy supply policy that offers a payment guarantee to renewable energy developers for the electricity they produce. FITs can support all renewable technologies, but are often aimed more directly at supporting distributed energy systems. Well-designed policies offer a cost-effective method for fostering rapid development of renewable energy, thereby benefiting ratepayers, developers, and society. Other benefits include support for community ownership of energy production and revitalizing rural areas.
The CEOA would have established a FIT for Kentucky and required PSC to “develop guidelines for a tariff to be filed by each retail electric supplier establishing the interconnection procedures and rate at which an eligible electric generating facility will be compensated for renewable electricity generated and fed into the distribution system or transmission grid of that retail electric supplier.” In combination with a RPS with a solar or distributed energy set-aside, a FIT would help ensure that Kentucky can meet the renewable energy requirements set by the legislation while supporting local economic development and the diversification of the state’s energy portfolio.
Strengthen the state’s net metering law. Net metering laws are among the most important policy drivers for distributed renewable energy systems because they set individual and aggregate capacity limits and enable system owners to recover some of their investment through savings on their electricity bill. Compared to many other states, Kentucky’s net metering law is only minimally supportive of distributed energy development. The current law caps the capacity of individual systems at 30 kW and the aggregate capacity at 1% of a utility’s peak load. These limits restrict the development of larger distributed energy systems as well as the overall growth of distributed renewable energy. The effectiveness of Kentucky’s net metering law could be improved by significantly increasing both the individual and aggregate capacity limits.
HB 187, also introduced in the Kentucky Legislature in 2012 but not adopted, would have revised the current net metering law by expanding the capacity limit for individual distributed energy systems to 2 MW, bringing Kentucky’s capacity limit in line with that of many other states while allowing more flexibility in financing and constructing eligible systems. The bill did not address the aggregate capacity limit. However, given that the current net metering law severely constrains distributed energy development, it is recommended that the Kentucky Legislature enact the revision in 2013 and consider increasing the aggregate capacity limit.
Upgrade the state’s interconnection standards. Because they include requirements that restrict or limit the connection of distributed energy systems to the grid, Kentucky’s interconnection standards were found by both a 2008 review by USEPA and a 2011 report by the Network for New Energy Choices to be unfavorable to distributed energy generation and among the most restrictive such standards in the US. Utility interconnection can be a critical component of a successful distributed energy project, as it enables a facility to purchase supplemental power from the grid as needed, sell excess power to the utility, and maintain grid frequency and voltage stability. USEPA recommends standardized interconnection rules for encouraging distributed energy development in order to reduce uncertainty and “obtain the benefits that clean distributed generation can provide without compromising grid safety or reliability” (USEPA, 2007, unnumbered).

86 | P a g e
Standardized rules supportive of distributed energy would: establish clear and uniform processes and technical requirements for interconnection; ensure consistent costs of interconnection that are appropriate given the size, nature, and scope of a particular project; provide a level of certainty about the time and costs involved in the application process and the technical requirements for interconnection; and ensure that project interconnection meets the safety and reliability needs of both the energy end-user and the utility.
Given the restrictive nature of Kentucky’s current interconnection standards, PSC—with the goal of reducing a significant barrier to the development of distributed renewable energy systems—should modify the standards based on experiences from other states and the best practices identified by USEPA.
Provide more effective financial incentives. To provide long-term support for distributed renewable energy and guarantee that the economic and environmental benefits will continue to grow, Kentucky should strengthen and expand its financial incentives for distributed renewable energy and combine them with other policy programs such as a RPS and FIT. There are many types of model incentives available, including ITCs and PTCs, sales tax and property tax exemptions, policies that allow for third-party ownership and investment, targeted PBIs, cash grants, rebates, and low-interest loans. A PBF could also be established in order to finance grants, rebates, and loan programs that support renewable energy investments. Each of these incentives would reduce up-front costs associated with distributed renewable energy development or reward the value of the energy produced over time.
Implement policies that maximize the sustainability and economic benefits of distributed renewable energy. Kentucky should establish policies aimed at maximizing the sustainability (minimizing the environmental impact) and/or the economic benefits of distributed renewable energy. The following policy recommendations, representing a small sample of available options, achieve one or both of these goals:
1. Adopt the Kentucky Division of Forestry’s recommendations for the sustainable harvesting of woody biomass for energy production.
2. Mandate that all new hydroelectric generating facilities receive LIHI certification. 3. Establish output-based emissions regulations with a thermal credit for CHP systems. 4. Adopt policies supportive of community-owned renewable energy development.
Kentucky has significant renewable energy resources, many of which are suitable for distributed energy technologies. With the appropriate mix of new policies and incentives, this sector has the potential to expand rapidly and to provide a variety of economic and environmental benefits to the state.

87 | P a g e
REFERENCES
Alanne, K and A Saari (2006) Distributed energy generation and sustainable development. Renewable & Sustainable Energy Reviews, Vol 10(6), pp. 539-558. Oct 6.
American Wind Energy Association (AWEA) (2011) AWEA Small wind turbine global market survey, year ending 2010. Apr. http://www.awea.org/learnabout/smallwind/upload/AWEA_SmallWind_GMS2011Report_Final.pdf
Antares Group, Inc. and Parsons Power (1996) Utility coal-biomass co-firing plant opportunities and conceptual assessments. Prepared for the Northeast Regional Biomass Program and US Department of Energy. Final Report. http://www.nrbp.org/pdfs/pub12.pdf
Antares Group, Inc. (2003) Assessment of Power Production at Rural Utilities Using Forest Thinnings and Commercially Available Biomass Power Technologies. Prepared for the US Department of Agriculture, U. Department of Energy, and National Renewable Energy Laboratory. Sept.
Appalachian Land Ownership Task Force (ALOTF) (1981) Land ownership patterns and their impacts on Appalachian communities: A survey of 80 counties. Prepared for the Appalachian Regional Commission. Feb. Available for download from the Education Resources Information Center. http://www.eric.ed.gov/PDFS/ED325280.pdf
Arnosti, D; Abbas, D; Current, D and M Demchik (2008) Harvesting fuel: Cutting costs and reducing forest fire hazards through biomass harvest. Institute for Agriculture and Trade Policy. Jun. http://www.iatp.org/files/258_2_103077.pdf
Badger, Phillip; Rahmani, Mohammad; Pullammanuppallil, Pratap; Hodges, Alan and Lauren McDonell. (2007) Systems that convert wood into energy. Wood to energy fact sheet. University of Florida, Institute of Food and Agricultural Sciences. Sept. http://www.interfacesouth.org/products/wood-to-energy/biomass-ambassador-guide/fact-sheets/technical-fact-sheets/FS_Convert_W2E.pdf
Barbose, Galen; Darghouth, Naim and Ryan Wiser (2011) Tracking the sun IV: The installed cost of photovoltaics in the US from 1998-2010. Lawrence Berkeley National Laboratory. Sept. Report: http://eetd.lbl.gov/ea/emp/reports/lbnl-5047e.pdf; data file: http://eetd.lbl.gov/EA/EMP/reports/lbnl-5047e-data.xlsx
Berea Municipal Utilities (BMU) (2011) Berea Solar Farm. Online: http://bereautilities.com/?page_id=348 Accessed Nov 29, 2011.
Berg, Jon and Martha Monroe (2007) Wood to energy, case study: Waste-to-energy program. University of Florida, Institute of Agricultural Sciences. Sept. http://edis.ifas.ufl.edu/pdffiles/FR/FR21100.pdf
Campbell, Richard (2010) Small hydro and low-head hydro power technologies and prospects. Congressional Research Service. Mar. http://nepinstitute.org/get/CRS_Reports/CRS_Energy/Renewable_Fuels/Small_hydro_and_Low-head_hydro_power.pdf
Caputo, Jesse (2009) Sustainable forest biomass: Promoting renewable energy and forest stewardship. Policy Paper. Environmental and Energy Study Institute. Jul. http://www.eesi.org/files/eesi_sustforbio_final_070609.pdf
Casten, Thomas and Brennan Downes (2005) Critical Thinking about Energy: The Case for Decentralized Generation of Electricity. Skeptical Inquirer, Vol 29(1), pp. 25-33. Jan/Feb. http://www.recycled-energy.com/_documents/articles/tc_critical_thinking.pdf

88 | P a g e
Cohen, Bennett and Amory Lovins (2010b) Renewables, micropower, and the transforming electricity landscape. Rocky Mountain Institute. Jun. http://www.rmi.org/rmi/RenewablesMicropowerTransformingElectricityLandscape
Colliver, Donald; Bush, James; Davis, Alison; Montross, Mike; Fehr, Robert; gates, Richard; Halich, Greg and Sue Nokes (2008) A white paper on Kentucky resources to meet the energy needs of the 25 x 25’ initiative. University of Kentucky, College of Agriculture, Cooperative Extension Service. http://www.bae.uky.edu/Publications/AEUs/AEU-94.pdf
Conner, Alison and James Francfort (1998) US hydropower resource assessment for Kentucky. Idaho National Engineering and Environmental Laboratory, Renewable Energy Products Department. Jul. http://hydropower.inel.gov/resourceassessment/pdfs/states/ky.pdf
Cross, Jonathan and Jeremiah Freeman (2009) 2008 geothermal technologies market report. US Department of Energy, Office of Energy Efficiency and Renewable Energy. Jul. http://www.nrel.gov/analysis/pdfs/46022.pdf
Daniels, Lisa (2009) A vision for community-owned renewable energy. Presentation to the 2009 American Wind Energy Association “Small and Community Windpower Conference and Exhibition. Detroit, MI.
Doris, Elizabeth; Busche, Sarah and Stephen Hockett (2009) Net metering policy development in Minnesota: Overview of trends in nationwide policy development and implications of increasing the eligible system size cap. National Renewable Energy Laboratory. Dec. http://www.nrel.gov/applying_technologies/state_local_activities/pdfs/46670.pdf
Duffield, Wendell and John Sass (2003) Geothermal energy—Clean power from the earth’s heat. United States Geological Survey. Circular 1249. http://pubs.usgs.gov/circ/2004/c1249/c1249.pdf
East Kentucky Power Cooperative (EKPC) (2007) Application of East Kentucky Power Cooperative, Inc for an order declaring the Maysville-Mason County Landfill Gas to Energy Project to be an ordinary extension of existing systems in the usual course of business. Application before the Public Service Commission of the Commonwealth of Kentucky. Case No. 2007-00509. Received Dec 12. http://psc.ky.gov/pscscf/2007%20cases/2007-00509/east%20kentucky%20power_application_121207.pdf
_ _ (undated) EnviroWatts Fact Sheet. http://www.ekpc.coop/envirowatts/stuff/EnviroWatts%20Info%20KTEC.pdf Accessed Nov 30, 2011.
Eisenhauer, Jack and Richard Scheer (2009) Opportunities to improve the efficiency of existing coal-fired power plants. Workhop report prepared by Energetics for a technical workshop sponsored by the National Energy Technology Laboratory. Rosemont, Ill. Jul 15-16. http://www.netl.doe.gov/energy-analyses/pubs/NETL%20Power%20Plant%20Efficiency%20Workshop%20Report%20Final.pdf
Electric Power Research Institute (EPRI) (2001) California renewable technology markets and benefits assessment. Unpublished. Cited in Wei et al. (2010).
Elliott, R. Neal; Shipley, Anna; Nadel, Steven and Elizabeth Brown (2003) Natural Gas Price Effects of Energy Efficiency and Renewable Energy Practices and Policies. American Council for an Energy Efficient Economy. Dec. http://files.harc.edu/Sites/GulfCoastCHP/Publications/NaturalGasPriceEffects.pdf
Energy and Environmental Analysis, Inc. (2010) Combined heat and power units located in Kentucky. Online: http://www.eea-inc.com/chpdata/States/KY.html Accessed Dec 3, 2011.
Energy Information Administration (EIA) (2011a) Electricity data files: Existing capacity by energy source, by producer, by state back to 1990 (Annual data from the EIA-860). http://www.eia.gov/cneaf/electricity/epa/existing_capacity_state.xls

89 | P a g e
_ _ (2009a) Impacts of a 25-Percent Renewable Electricity Standard as Proposed in the American Clean Energy and Security Act Discussion Draft. Apr. http://www.eia.gov/oiaf/servicerpt/acesa/pdf/sroiaf%282009%2904.pdf
_ _ (2009b) State Energy Profiles: Kentucky. Analysis. http://www.eia.gov/state/state-energy-profiles-analysis.cfm?sid=KY
_ _ (2010a) Electricity data files: Form EIA-861 final data file for 2009. File 2. http://www.eia.gov/cneaf/electricity/page/eia861.html?src=email
_ _ (2010b) Geothermal heat pump manufacturing activities. Table 4.6: Geothermal heat pump shipments by destination, 2008 and 2009. Dec. http://www.eia.gov/renewable/annual/geothermal/pdf/table4_6.pdf
_ _ (2010c) Geothermal heat pump manufacturing activities. Table 4.14: Employment in the geothermal heat pump industry, 2007-2009. Dec. http://www.eia.gov/cneaf/solar.renewables/page/ghpsurvey/table4_14.html
_ _ (2010d) State ranking 7: Total energy consumption per capita, 2009 (million Btu). http://www.eia.gov/state/state-energy-rankings.cfm?keyid=60&orderid=1
_ _ (2011b) Electricity data files, combined forms EIA-906/920/923: Net generation by state by type of producer by energy source, annual back to 1990. http://www.eia.gov/cneaf/electricity/epa/generation_state.xls
_ _ (2011c) Electricity data files: Average retail price of electricity to ultimate customers, by state, by provider, annual back to 1990 (Form EIA-861). http://www.eia.gov/cneaf/electricity/epa/average_price_state.xls
_ _ (2011d) Annual Receipts and Cost of Fossil-Fuels for Electricity Generation. Electric Power Annual. http://www.eia.gov/cneaf/electricity/cq/cqaxlfilees1_a.xls
_ _ (2011e) Electricity date files: Electric sales, revenue and average price. Table 5a: Residential Average Monthly Bill by Census Division, and State, 2010. http://www.eia.gov/electricity/sales_revenue_price/xls/table5_a.xls
_ _ (2011f) Direct federal financial interventions and subsidies in energy in fiscal year 2010. Aug 1. http://www.eia.gov/analysis/requests/subsidy/
_ _ (2011g) Annual disturbance events, by month for 2010. http://www.eia.gov/cneaf/electricity/page/disturb_events_archive.html
_ _ (2011h) Table 2.4: Shipments of solar thermal collectors ranked by origin and destination, 2009. Jan. http://www.eia.gov/cneaf/solar.renewables/page/solarreport/table2_4.html
_ _ (2011i) Table 2.13: Domestic shipments of solar thermal collectors by market sector, end use, and type, 2008 and 2009. Jan. http://www.eia.gov/cneaf/solar.renewables/page/solarreport/table2_13.html
_ _ (2011j) State energy data system. Table C4: Total end-use energy consumption estimates, 2009 (trillion Btu). http://205.254.135.7/state/seds/hf.jsp?incfile=sep_sum/html/sum_use_tx.html
EnerNex Corporation (2011) Eastern wind integration and transmission study (Revised). Prepared for the National Renewable Energy Laboratory. Feb. http://www.nrel.gov/wind/systemsintegration/pdfs/2010/ewits_final_report.pdf
Environmental Law Institute (2009) Estimating US government subsidies to energy sources: 2002-2008. Sept. http://www.elistore.org/Data/products/d19_07.pdf

90 | P a g e
Epstein, Paul; Buonocore, Jonathan J; Eckerle, Kevin; Hendryx, Michael; Stout III, Benjamin M; Heinberg, Richard; Clapp, Richard W; May, Beverly; Reinhart, Nancy L; Ahern, Melissa M; Doshi, Samir K and Leslie Glustrom (2011) Full cost accounting for the life cycle of coal in “Ecological Economics Reviews.” Center for Health and the Global Environment, Harvard Medical School. Annals of the New York Academy of Sciences. Vol 1219, pp. 73-98. http://www.nexteraenergyresources.com/pdf_redesign/Full%20Cost%20of%20Coal.pdf
European Photovoltaic Industry Association (EPIA) (2011) Global market outlook for photovoltaics until 2015. May. http://www.epia.org/publications/photovoltaic-publications-global-market-outlook.html
Farrell, John (2011a) Democratizing the electricity system: A vision for the 21st century grid. New Rules Project, Institute for Local Self Reliance. Jun. http://www.newrules.org/energy/publications/democratizing-electricity-system-vision-21st-century-grid
_ _ (2011b) Poor solar permitting rules increase residential solar prices by up to 20 percent. Energy Self-Reliant States. Feb. http://energyselfreliantstates.org/content/poor-solar-permitting-rules-increase-residential-solar-prices-20-percent
_ _ (2011c) Clean, local power for Kentucky. Energy Self-Reliant States. Presentation conducted for rural utilities and environmental organizations in Kentucky. Aug 31. http://energyselfreliantstates.org/content/clean-local-power-kentucky
_ _ (2011d) What renewable energy policy works best? Feed-in-tariffs. Oct 5. http://energyselfreliantstates.org/content/what-renewable-energy-policy-works-best-feed-tariffs
Farrell, John and David Morris (2008) Rural power: Community-scaled renewable energy and rural economic development. Institute for Local Self Reliance, New Rules Project. Aug. http://www.newrules.org/energy/publications/rural-power-communityscaled-renewable-energy-and-rural-economic-development
Foley, Daniel J (2011) Renewable energy challenge—Intermittency is not the immediate issue. ACCIONA Energy North America. Published by the American Council on Renewable Energy. May 25. http://www.acore.org/renewable-energy-challenge-intermittency-is-not-the-immediate-issue
Foley, Kelly (2011) Grid integration of solar electricity: The sheep in wolf’s clothing of grid planning. Renewable Energy World, online. Feb 15. http://www.renewableenergyworld.com/rea/news/article/2011/02/grid-integration-of-solar-electricity-the-sheep-in-wolfs-clothing-of-grid-planning?cmpid=WNL-Wednesday-February16-2011
Francfort, James (1997) Hydropower’s contribution to carbon dioxide emission reduction. Idaho National Engineering and Environmental Laboratory. Nov. http://hydropower.inel.gov/environmental/pdfs/ornlecon.pdf
Gellings, Clark W and Kurt E Yeager (2004) Transforming the electric infrastructure. Physics Today. Dec. http://physicstoday.org/journals/doc/PHTOAD-ft/vol_57/iss_12/45_1.shtml?bypassSSO=1
Go Solar California (2011) California Solar Initiative Rebates. Online: http://www.gosolarcalifornia.ca.gov/csi/rebates.php Accessed Nov 29.
Governor Steve Beshear (2008) Intelligent energy choices for Kentucky’s future: Kentucky’s 7-poiint strategy for energy independence. Nov. http://energy.ky.gov/Documents/Final_Energy_Strategy.pdf
Grushecky, Shawn; Hassler, Curt and Mary Ann Fajvan (1998) Logging residue yield equations from West Virginia timber harvests. West Virginia University, Division of Forestry.

91 | P a g e
Grushecky, Shawn (2009) Detailing biomass availability in Appalachia – A case study from West Virginia, with estimates for Ohio. Presentation to the 2009 meeting of the Ohio Forestry Association. West Virginia University, Appalachian Hardwood Center. Mar 7-8. http://wvbiomass.org/index.php?option=com_jdownloads&Itemid=0&task=view.download&cid=3
Hall, Douglas; Reeves, Kelly; Brizzee, Julie; Lee, Randy; Carroll, Gregory and Gerald Sommers (2006) Feasibility assessment of the water energy resources of the United States for new low power and small hydro classes of hydroelectric plants. Idaho National Engineering and Environmental Laboratory. Jan. http://hydropower.inel.gov/resourceassessment/pdfs/main_report_appendix_a_final.pdf
Hall, Douglas; Cherry, Shane; Reeves, Kelly; Lee, Randy; Carroll, Gregory; Sommers, Garold and Kristine Verdin (2004) Water energy resources of the United States with emphasis on low head/low power resources. Idaho National Engineering and Environmental Laboratory. Apr. http://hydropower.inel.gov/resourceassessment/pdfs/03-11111.pdf
Han, H; Halbrook, J and F Pan (2008) Economic evaluation of a roll-off trucking system removing forest biomass resulting from shaded fuelbreak treatments. United States Forest Service. Mar. http://ddr.nal.usda.gov/bitstream/10113/43373/1/IND44389150.pdf
Hansen, Lena and Amory B Lovins (2010) Keeping the lights on while transforming electric utilities. eSolutions Journal. Winter 2010: Vol 3(1). Rocky Mountain Institute. http://www.rmi.org/Transforming+Electric+Utilities
Hansen, Evan; Schrencongost, Alyse; Bailey, Brent and Annie Morris (2006) The prospects for landfill gas-to-energy projects in West Virginia. May. http://downstreamstrategies.com/documents/reports_publication/Prospects_for_landfill_gas-to-energy_WV_May2006.pdf
Haugen, Dan (2011) Are renewable standards driving up utility rates? Midwest Energy News. May 17. http://www.midwestenergynews.com/2011/05/17/are-renewable-standards-driving-up-utility-rates/
Heavner, Brad and Susannah Churchill (2002) Renewables work: Job growth from renewable energy development in California. California Public Interest Research Group Charitable Trust. Jun. http://www.environmentcalifornia.org/uploads/Gg/7m/Gg7mP2qpr4ZGj0deZnKIzQ/Renewables_Work.pdf
Hedman, Bruce (2011) CHP: The state of the market. ICF International. Presentation to the USEPA combined heat and power partnership 2011 national meeting. Oct 5. http://www.epa.gov/chp/documents/meeting_100511_hedman.pdf
Hornby, Rick; White, David; Vitolo, Tommy; Comings, Tyler and Kenji Takahashi (2012) Potential impacts of a Renewable and Energy Efficiency Portfolio Standard in Kentucky. Synapse Energy Economics, Inc. Prepared for the Mountain Association for Community Economic Development and the Kentucky Sustainable Energy Alliance. Jan 12. http://www.maced.org/files/Potential_Impacts_of_REPS_in_KY.pdf
Howington, Patrick (2011) Despite rate settlement, LG&E rates still to go up about 18 percent. Courier-Journal: Louisville, KY. Nov 11. Article accessed Nov 14; only available for purchase: http://pqasb.pqarchiver.com/courier_journal/access/2509175511.html?FMT=ABS&date=Nov+11%2C+2011
Hummell, S and DE Calkin (2005) Costs of landscape silviculture for fire and habitat management. Forest Ecology and Management, Vol 207(3), pp 385-404. http://www.treesearch.fs.fed.us/pubs/20454
Interstate Renewable Energy Council (IREC) (2011) Kentucky incentives/policies for renewables and efficiency. Database of State Incentives for Renewables and Efficiency. http://dsireusa.org/incentives/index.cfm?getRE=1?re=undefined&ee=1&spv=0&st=0&srp=1&state=KY Accessed Nov 14.

92 | P a g e
_ _ (2012a) Summary maps: Net metering policies. Database of State Incentives for Renewables and Efficiency. http://dsireusa.org/documents/summarymaps/net_metering_map.ppt Accessed Jan 20.
_ _ (2012b) TVA Partner Utilities: EnergyRight Heat Pump program. Database of State Incentives for Renewables and Efficiency. http://dsireusa.org/incentives/incentive.cfm?Incentive_Code=KY37F&re=1&ee=1
_ _ (2012c) Summary maps: RPS Policies. Database of State Incentives for Renewables and Efficiency. http://dsireusa.org/documents/summarymaps/RPS_map.pptx Accessed Jan 20.
_ _ (2012d) North Carolina incentives/policies for renewables and efficiency. Database of State Incentives for Renewables and Efficiency. http://dsireusa.org/incentives/index.cfm?getRE=1?re=undefined&ee=1&spv=0&st=0&srp=1&state=NC Accessed Mar 9.
_ _ (2012e) Pennsylvania incentives/policies for renewables and efficiency. Database of State Incentives for Renewables and Efficiency. http://dsireusa.org/incentives/index.cfm?getRE=1?re=undefined&ee=1&spv=0&st=0&srp=1&state=PA
Iowa Policy Project (2011) Shining bright: Growing solar jobs in Iowa. Mar. http://votesolar.org/wp-content/uploads/2011/03/Iowa-SolarJobs-Report.pdf
Itron, Inc. (2008) CPUC Self-generation incentive program: Seventh-year impact evaluation. Final report. Prepared for Pacific Gas and Electric and the Self-Generation Incentive Program Working Group. Sept. http://www.cpuc.ca.gov/NR/rdonlyres/13D12230-5974-44C7-A90B-4F7C53CAA543/0/SGIP_7thYearImpactEvaluationFinalReport.pdf
Jennejohn, Dan (2011) Annual geothermal power production and development report: April 2011. Geothermal Energy Association. Apr. http://www.geo-energy.org/pdf/reports/April2011AnnualUSGeothermalPowerProductionandDevelopmentReport.pdf
Jones, Sue (2011) President, Community Energy Partners. Telephone conversation with Laura Hartz, Downstream Strategies. May 19.
Kandt, A; Brown, E; Domonick, J and T Jurotich (2007) Making the economic case for small-scale distributed wind: A screening for distributed wind generation opportunities. National Renewable Energy Laboratory. Jun. http://www.nrel.gov/docs/fy07osti/41897.pdf
Kenley, C; Klingler, R; Plowman, C; Soto, R and R Turk (2004) US Job creation due to nuclear power resurgence in the United States. Idaho National Engineering and Environmental Laboratory and Bechtel Power Corporation. Nov. http://www.ne.doe.gov/pdfFiles/200411_JobCreation_VI.pdf
Kentucky Department for Energy Development and Independence (DEDI) (2010) Kentucky Energy Profile 2010. http://energy.ky.gov/Documents/Kentucky%20Energy%20Profile,%202010.pdf
_ _ (2009) Annual report. Dec. http://energy.ky.gov/Documents/DEDI%202009%20annual%20report%20final.pdf
Kentucky Division of Forestry (2011) Recommendations for the harvesting of woody biomass. Oct. http://forestry.ky.gov/ForestryPublications/Forestry%20Publications/Recommendations%20for%20the%20Harvesting%20of%20Woody%20Biomass.pdf
Kentucky Division of Waste Management (2011) Annual Report: Fiscal year 2011. http://waste.ky.gov/Annual%20Reports/DWM%20Annual%20Report%20for%202011.pdf
Kentucky Legislative Research Commission (2012a) Kentucky Legislature, HB 167. http://www.lrc.ky.gov/record/12RS/HB167.htm

93 | P a g e
_ _ (2012b) Kentucky Legislature, HB 187. http://www.lrc.ky.gov/record/12rs/hb187.htm
Kentucky Public Service Commission (PSC) (2011a) GIS data: Electric service areas. Shapefile downloaded Dec 12. http://psc.ky.gov/Home/Maps
_ _ (2011b) PSC hearing upcoming in KU and LG&E environmental compliance cases. News release. Nov 3. http://psc.ky.gov/agencies/psc/press/112011/1103_r01.PDF
Kentucky Renewable Energy Consortium (KREC) (2008) 25x’25 Roadmap for Kentucky: Charting Kentucky’s Renewable Energy Future. https://louisville.edu/kppc/files/krec/25x25/25x25%20Roadmap%20for%20Kentucky%20final%20for%20web.pdf
Kentucky Solar (2006) Kentucky solar energy guide. Chapter 13: Incentives that support renewable energy and energy efficiency. Oct. http://kysolar.org/ky_solar_energy_guide/chapters/Chapter_13_Incentives.pdf
Kentucky Sustainable Energy Alliance (KYSEA) (2011) Clean energy resources: Solar. Online: http://www.kysea.org/clean-energy-resources/solar Accessed Nov 28.
_ _ (2009) Solar water heating systems fact sheet. Kentucky Solar Partnership. Sept. http://www.kysea.org/clean-energy-resources/solar/SWH%20Fact%20Sheet%20Sept%2009.pdf
Konty, Melissa Fry and Jason Bailey (MACED) (2009) The impact of coal on the Kentucky state budget. Mountain Association for Community Economic Development. Jun 25. http://maced.org/coal/documents/Impact_of_Coal.pdf
Kreutzer, David; Campbell, Karen; Beach, William; Lieberman, Ben and Nicolas Loris (2010) A Renewable Electricity Standard: What it will really cost Americans. The Heritage Foundation. May 5. http://www.heritage.org/research/reports/2010/05/a-renewable-electricity-standard-what-it-will-really-cost-americans
Kubert, Charles and Mark Sinclair (2009) Distributed renewable energy finance and policy toolkit. Clean Energy States Alliance. Dec. http://www.cleanenergystates.org/assets/Uploads/CESA-renewableenergy-FinancePolicy-toolkit2009.pdf
Lacey, Stephen (2011) Why America needs to move beyond coal. Think Progress blog. Jul 12. http://thinkprogress.org/romm/2011/07/12/266867/why-america-needs-to-move-beyond-coal-five-economic-indicators/
Laitner, John; Eldridge, Maggie and R. Neal Elliot (2007) The Economic Benefits of an Energy-Efficiency and Onsite Renewable Energy Strategy to Meet Growing Electricity Needs in Texas. American Council for an Energy Efficient Economy. Sept. http://www.aceee.org/sites/default/files/publications/researchreports/E076.pdf
Lantz, E and S Tegen (2008) Variables affecting economic development of wind energy. National Renewable Energy Laboratory. Jul. http://www.nrel.gov/docs/fy08osti/43506.pdf
Leonard, Todd (2009) Landfill photos, Maysville-Mason County Landfill. Submitted May 15. Approval to use a photo of the landfill provided to author McIlmoil through an email dated Nov 29, 2011. Photo link: http://www.masoncountykentucky.com/image.asp?i={43678B20-EA2F-4D43-86A6-DFDAC6035183}_DSC00834.jpg&s=75&w=250
Li, X; Wang, J; Miller G and J McNeel (2006) Production economics of harvesting small-diameter hardwood stands in Central Appalachia. Forest Products Journal Vol 56(3), pp 81-86. http://www.fs.fed.us/ne/newtown_square/publications/other_publishers/ne_2006_li001p.pdf

94 | P a g e
Louisville Gas and Electric and Kentucky Utilities (LG&E and KU) (2011a) EPA changes force LG&E, KU to retire three coal-fired power plants, company to build natural gas-fired generation at Cane Run, purchase peaking units. Press Release. Sept 15. http://www.lge-ku.com/newsroom/archive2011/news_091511.asp
_ _ (2011b) The 2011 Joint Integrated Resource Plan of Louisville Gas and Electric Company and Kentucky Utilities Company. Submitted to the Kentucky Public Service Commission on April 21. http://www.psc.ky.gov/PSCSCF/2011%20cases/2011-00140/20110421_LG%26E-KU_IRP_Volume%20I.pdf
Low Impact Hydropower Institute (LIHI) (2011a) Online: http://www.lowimpacthydro.org/ Accessed Dec 7.
_ _ (2011b) LIHI Certification #24—Mother Ann Lee Hydroelectric Station, Lock & Dam 7 on the Kentucky River, Kentucky. Online: http://www.lowimpacthydro.org/lihi-certificate-24-mother-ann-lee-hydroelectric-station-lock-dam-7-on-the-kentucky-river-kentucky.html Accessed Dec 7.
Maine Rural Partners (2009) The Community-Based Renewable Energy Act. http://www.mainerural.org/2009/06/12/PL329-packet.pdf
Makower, Joel; Pernick, Ron and Clint Wilder (2007) Clean energy trends 2007. Clean Edge. Mar. http://www.cleanedge.com/reports/clean-energy-trends-2007
Martin, Jeremi (2009) Distributed vs centralized generation: are we witnessing a change of paradigm? An introduction to distributed generation. HEC Paris. May. http://www.vernimmen.com/ftp/An_introduction_to_distributed_generation.pdf
Massachusetts Institute of Technology (2006) The future of geothermal energy: Impact of enhanced geothermal systems on the United States in the 21st century. http://www1.eere.energy.gov/geothermal/pdfs/future_geo_energy.pdf
Maynard, Misty (2011) For EKPC, persistence pays off: Local, state and national officials dedicated power plant. The Ledger Independent. Maysville, KY. Apr 14. http://www.maysville-online.com/news/local/article_ba3e6ebc-4835-11df-973c-001cc4c002e0.html
McIlmoil, Rory; Hansen, Evan and Ted Boettner (2010) The impact of coal on the West Virginia state budget. Downstream Strategies and West Virginia Center on Budget and Policy. Jun 22. http://downstreamstrategies.com/documents/reports_publication/DownstreamStrategies-coalWV.pdf
McIlmoil, Rory; Hartz, Laura; Hereford, Anne; Hansen, Evan and Ted Boettner (2012) The impact of coal on the Virginia state budget. Downstream Strategies and West Virginia Center on Budget and Policy. Unpublished.
Mills, Andrew and Ryan Wiser (2010) Implications of wide-area geographic diversity for short-term variability of solar power. Lawrence Berkeley National Laboratory, Environmental Energy Technologies Division. Sept. http://eetd.lbl.gov/EA/EMP/reports/lbnl-3884e.pdf
Minnesota Department of Commerce (2010) C-BED projects by utility. Office of Energy Security. Dec 31. http://www.state.mn.us/mn/externalDocs/Commerce/CBED_Projects_Report_121107120316_UtilityC-BEDProjects.pdf
Munson, Dick (undated) Comments of Recycled Energy Development. United States of America before the Federal Energy Regulatory Commission: Frequency regulation compensation in the organized wholesale power markets. Docket Nos. RM11-7-000, AD10-11-000. http://www.recycled-energy.com/main/red-submits-comments-to-ferc-on-chp/
Muro, Mark and Lewis Milford (2012) State Clean Energy Funds provide economic development punch. The Brookings Institution. Jan 11. http://www.brookings.edu/opinions/2012/0111_energy_funds_muro_milford.aspx

95 | P a g e
Musgrave, Beth (2011) Utilities in Kentucky warn of 20 percent rate increases. Kentucky Herald-Leader. Jun 3. http://www.kentucky.com/2011/06/03/1761624/kentucky-utility-bills-expected.html Accessed Nov 14.
National Renewable Energy Laboratory (NREL) (2011a) PV Watts Viewer. Query: Nov 28, 2011. http://mapserve3.nrel.gov/PVWatts_Viewer/index.html
_ _ (2008) 20% wind energy by 2030: Increasing wind energy’s contributions to US electricity supply. Jul. http://www.20percentwind.org/20percent_wind_energy_report_revOct08.pdf
_ _ (2009a) Gas-fueled technologies for power generation. Sept 10. Online: http://www.nrel.gov/learning/eds_gas_fueled.html
_ _ (2009b) Grid interconnection. Online: http://www.nrel.gov/learning/eds_grid_interconnection.html Accessed Jan 20.
_ _ (2010) Wind Powering America: 80-Meter Wind Maps and Wind Resource Potential. Estimates of windy land area and wind energy potential by state for areas (greater than or equal to) 30% capacity factor at 80 m. February 4. Excel spreadsheet under heading “Additional 80- and 100-Meter Wind Resource Potential Tables,” Accessed Nov 28, 2011. http://www.windpoweringamerica.gov/wind_maps.asp
_ _ (2011b) The Open PV Project. Online database of solar photovoltaic installations in the US. http://openpv.nrel.gov/index Accessed Nov 16.
_ _ (2011c) Learning about renewable energy: Geothermal heat pumps. Online: http://www.nrel.gov/learning/re_geo_heat_pumps.html Accessed Dec 10.
Network for New Energy Choices (2011) Freeing the grid: Best practices in state net metering policies and interconnection procedures. Oct. http://www.newenergychoices.org/uploads/FreeingTheGrid2011.pdf
Perez, Richard; Zweibel, Ken and Thomas Hoff (2011) Solar power generation in the US: Too expensive, or a bargain? http://www.asrc.cestm.albany.edu/perez/2011/solval.pdf
Peterson, Erica (2011) After years of keeping rates low, coal now detrimental to utility costs. WFPL News. Nov 3. http://www.wfpl.org/2011/11/03/after-years-of-keeping-rates-low-coal-now-detrimental-to-utility-costs/ Accessed Nov 14.
Pfund, Nancy and Ben Healey (2011) What would Jefferson do? The historical role of federal subsidies in shaping America’s energy future. DBL Investors. Sept. http://i.bnet.com/blogs/dbl_energy_subsidies_paper.pdf
Price, Selya and Robert Margolis (2010) 2008 solar technologies market report. US Department of Energy, Office of Energy Efficiency and Renewable Energy. Jan http://www.nrel.gov/analysis/pdfs/46025.pdf
Progress Energy Carolinas (2011) Progress Energy Carolinas rates rise 3.7% Dec. 1 in North Carolina: Changes reflect higher costs of fuel and energy efficiency programs. Press release. Nov 15. https://www.progress-energy.com/company/media-room/news-archive/press-release.page?title=Progress+Energy+Carolinas+rates+rise+3.7%25+Dec.+1+in+North+Carolina&pubdate=11-15-2011
Rickerson, Wilson; Bennhold, Florian and James Bradbury (2008) Feed-in tariffs and renewable energy in the USA: A policy update. May. http://www.wind-works.org/FeedLaws/USA/Feed-in_Tariffs_and_Renewable_Energy_in_the_USA_-_a_Policy_Update.pdf
Schlissel, David; Smith, Allison and Rachel Wilson (2008) Coal-fired power plant construction costs. Synapse Energy Economics, Inc. Jul. http://www.synapse-energy.com/Downloads/SynapsePaper.2008-07.0.Coal-Plant-Construction-Costs.A0021.pdf

96 | P a g e
Sherwood, Larry (2011) US Solar market trends 2010. Interstate Renewable Energy Council. Jun. http://irecusa.org/wp-content/uploads/2011/07/IREC-Solar-Market-Trends-Report-revised070811.pdf
Singh, Virinder and Jeffrey Fehrs (2001) The work that goes into renewable energy. Renewable Energy Policy Project. Research report No.13. Nov. http://www.repp.org/articles/static/1/binaries/LABOR_FINAL_REV.pdf
Smith, Robert (2011) Renewable energy analyst, Energy Information Administration, Washington, DC. Email correspondence with author McIlmoil. Jun 24.
Solar Energy Industries Association (SEIA) (2010) US Solar market insight, 3rd quarter 2010. Executive summary. http://www.seia.org/galleries/default-file/SEIA_Q3_2010_EXEC_SUMMARY.pdf
Southeast CHP Application Center (undated) Clean heat and power: Cox Interior 5.2 MW combustion turbine. http://www.chpcentermw.org/rac_profiles/southeast/CoxInterior.pdf
Southern Alliance for Clean Energy (SACE) (2009) Yes we can: Southern solutions for a National Renewable Energy Standard. Feb 12. http://www.cleanenergy.org/images/files/SERenewables022309rev.pdf
Spath, Pamela and Margaret Mann (2000) Life-cycle assessment of a natural gas combined-cycle power generating system. National Renewable Energy Laboratory. Sept. http://www.nrel.gov/docs/fy00osti/27715.pdf
Sterzinger, George (2006) Jobs and renewable energy project. Final technical report. Renewable Energy Policy Project. Dec. http://www.osti.gov/bridge/servlets/purl/899887-T9Q65H/899887.pdf
Tennessee Valley Authority (TVA, 2011) Generation Partners. Online: http://www.tva.com/greenpowerswitch/partners/index.htm
_ _ (TVA, 2012) Renewable Standard Offer. Online: http://www.tva.com/renewablestandardoffer/index.htm
The National Council on Electricity Policy (2009) Updating the electric grid: An introduction to non-transmission alternatives for policymakers. Sept. http://www.ncouncil.org/Documents/National%20Council%20Non%20Transmission%20Alternatives%20FINAL_web%20version.pdf
The Pew Environment Group (2011) Combined heat and power: Energy efficiency to repower US manufacturing, Kentucky. May. http://www.pewenvironment.org/uploadedFiles/PEG/Publications/Fact_Sheet/CHP_KENTUCKY_HI-RES_5.11.11.pdf
The Solar Foundation (2011) National Solar Jobs Census 2011. Oct. http://thesolarfoundation.org/sites/thesolarfoundation.org/files/TSF_JobsCensus2011_Final_Compressed.pdf
The World Bank Group (2006) Technical and economic assessment of off-grid, mini-grid and grid electrification technologies: Annexes. Energy Unit, Energy, Transport and Water Department. Sept. http://siteresources.worldbank.org/EXTENERGY/Resources/336805-1157034157861/ElectrificationAssessmentRptAnnexesFINAL17May07.pdf
Tracz, Kristin and Jason Bailey (2010) Building clean energy careers in Kentucky. Mountain Association for Community Economic Development. Nov. http://www.maced.org/files/Clean_Energy_Careers.pdf
US Army Corps of Engineers (2011) Wolf Creek Dam seepage rehabilitation project. Online: http://www.lrn.usace.army.mil/wolfcreek/ Accessed Dec 7.

97 | P a g e
US Census Bureau (2012) American Fact Finder. Query: Topics = Housing; Geographic type = State; Geography name = Kentucky. Online: http://factfinder2.census.gov/faces/nav/jsf/pages/index.xhtml Accessed Jan 10.
US Department of Energy (USDOE) (2010) 2009 renewable energy data book. Office of Energy Efficiency and Renewable Energy. Aug. http://www1.eere.energy.gov/maps_data/pdfs/eere_databook.pdf
_ _ (2008) Combined heat and power: Effective energy solutions for a sustainable future. Oak Ridge National Laboratory. Dec 1. http://www1.eere.energy.gov/industry/distributedenergy/pdfs/chp_report_12-08.pdf
_ _ (2009) Combined heat and power: A decade of progress, a vision for the future. Aug. http://www1.eere.energy.gov/industry/distributedenergy/pdfs/chp_accomplishments_booklet.pdf
US Environmental Protection Agency (USEPA) (2011a) Combined Heat and Power, Basic Information. USEPA Combined Heat and Power Partnership. Online: http://www.epa.gov/chp/basic/index.html Accessed Nov 30.
_ _ (2007) Interconnection standards fact sheet. July. Online: http://www.epa.gov/chp/state-policy/interconnection_fs.html Accessed Jan 21.
_ _ (2008) Interconnection standards. Online: http://www.epa.gov/chp/state-policy/interconnection.html
_ _ (2010a) Landfill gas energy project development handbook. Chapter 5: Landfill gas contracts and permitting. Landfill Methane Outreach Program. Sept. http://www.epa.gov/lmop/documents/pdfs/pdh_chapter5.pdf
_ _ (2010b) Landfill gas energy: Fueling the economy and a sustainable energy future while improving the environment. Landfill Methane Outreach Program. Dec. http://www.epa.gov/lmop/documents/pdfs/LMOPGeneral.pdf
_ _ (2010c) Landfill gas energy project development handbook. Chapter 1: Landfill gas energy basics. Landfill Methane Outreach Program. Sept. http://www.epa.gov/lmop/documents/pdfs/pdh_chapter1.pdf
_ _ (2011b) An overview of landfill gas energy in the United States. Landfill Methane Outreach Program (LMOP). Jul. http://epa.gov/lmop/documents/pdfs/overview.pdf
_ _ (2011c) Operational LFG energy projects, sorted by state and landfill name: Electricity. Excel spreadsheet downloaded on Dec 13, 2011. http://epa.gov/lmop/documents/xls/opprjseleclmopdata.xls
_ _ (2011d) Energy projects and candidate landfills: Kentucky. Excel spreadsheet downloaded on Nov 28, 2011. http://epa.gov/lmop/documents/xls/states/lmopdataky.xls
_ _ (2011e) Output-based regulations. Combined heat and power partnership, state policy resources. Online: http://www.epa.gov/chp/state-policy/output.html Accessed Dec 5.
US Forest Service (USFS) (2011) Forest Inventory and Analysis National Program. Forest Inventory Data Online. http://apps.fs.fed.us./fido/ Accessed Oct 6.
US Government Accountability Office (USGAO) (2006) Natural resources: Woody biomass users’ experiences provide insights for ongoing government efforts to promote its use. Testimony before the Subcommittee on Forests and Forest Health, Committee on Resources, US House of Representatives. Apr. http://www.gao.gov/new.items/d06694t.pdf
Vanderberg, Michael (2011) West Virginia University, Appalachian Hardwood Center. Estimates of forest harvest (logging) residue by county for Kentucky. Excel spreadsheet provided to author McIlmoil through email correspondence. Nov 2.

98 | P a g e
VermontSPEED (2012) Standard Offer program. Online: http://vermontspeed.com/standard-offer-program/ Accessed Jan 21.
Wald, Matthew (2011) Batteries at a wind farm help control output. New York Times. Oct 28. Accessed Dec 7. http://www.nytimes.com/2011/10/29/science/earth/batteries-on-a-wind-farm-help-control-power-output.html?_r=2
Wald, Matthew and Tom Zeller (2010) Cost of Green power Makes Projects Tougher Sell. New York Times. Nov 7. http://www.nytimes.com/2010/11/08/science/earth/08fossil.html
Wei, Max; Patadia, Shana and Daniel Kammen (2010) Putting renewables and energy efficiency to work: How many jobs can the clean energy industry generate in the US? University of California, Berkeley. Energy Policy, Vol 38, pp. 919-931. http://rael.berkeley.edu/sites/default/files/WeiPatadiaKammen_CleanEnergyJobs_EPolicy2010.pdf
Wiser, Ryan and Galen Barbose (2008) Renewable Portfolio Standards in the United States: A Status Report with Data through 2007. Lawrence Berkeley National Laboratory. Apr. http://eetd.lbl.gov/ea/emp/reports/lbnl-154e-revised.pdf
Wiser, Ryan and Mark Bolinger (2011) 2010 Wind technologies market report. Prepared for the US Department of Energy, Office of Energy Efficiency and Renewable Energy. Jun. http://eetd.lbl.gov/EA/EMP/reports/lbnl-4820e.pdf
Wiser, Ryan; Barbose, Galen and Edward Holt (2010) Supporting solar power in Renewable Portfolio Standards: Experience from the United States. Ernest Orlando Lawrence Berkeley National Laboratory. Oct. http://eetd.lbl.gov/EA/EMP/reports/lbnl-3984e.pdf
Windustry (2010) Wind energy glossary: Community wind projects. Online: http://windustry.advantagelabs.com/glossary?sort=asc&order=Glossary+Term Accessed Nov 30.