Embed Size (px)
Citation preview
JIME http://jime.open.ac.uk Article under review
1
The Open Learning Initiative:
Measuring the Effectiveness of the OLI Statistics Course in
Accelerating Student Learning
Marsha Lovett, Oded Meyer, Candace Thille
Carnegie Mellon University 5000 Forbes Ave. Pittsburgh
USA www.cmu.edu
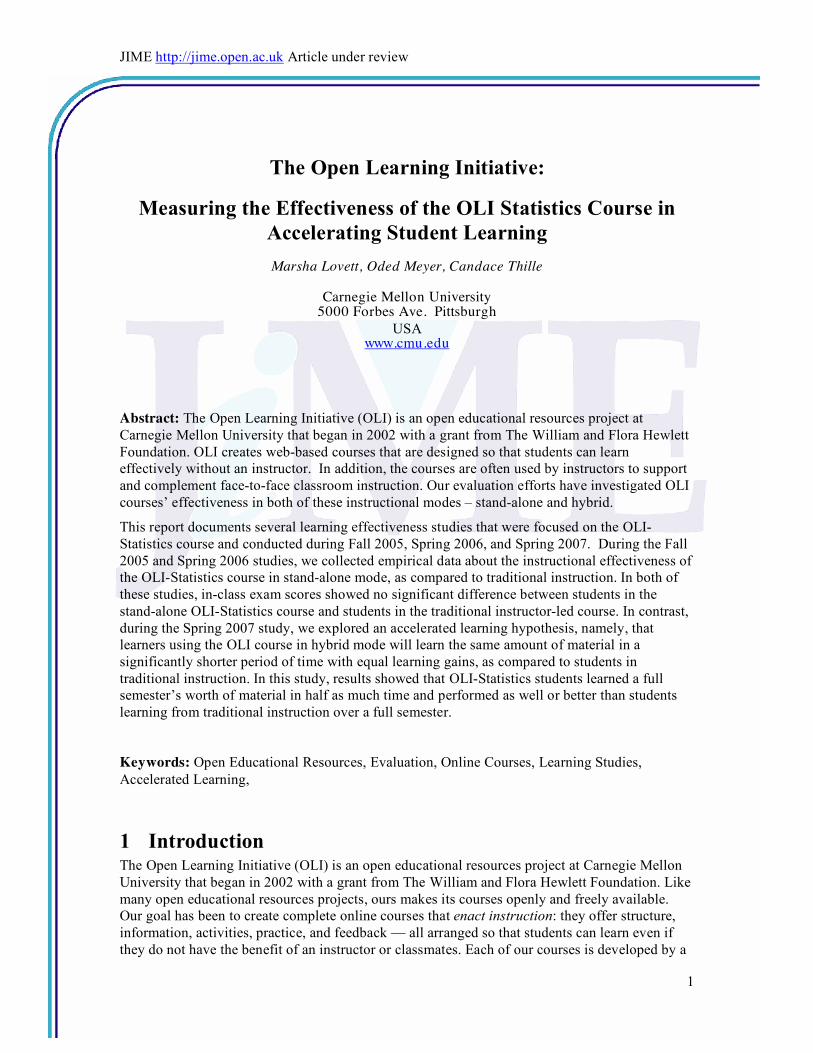
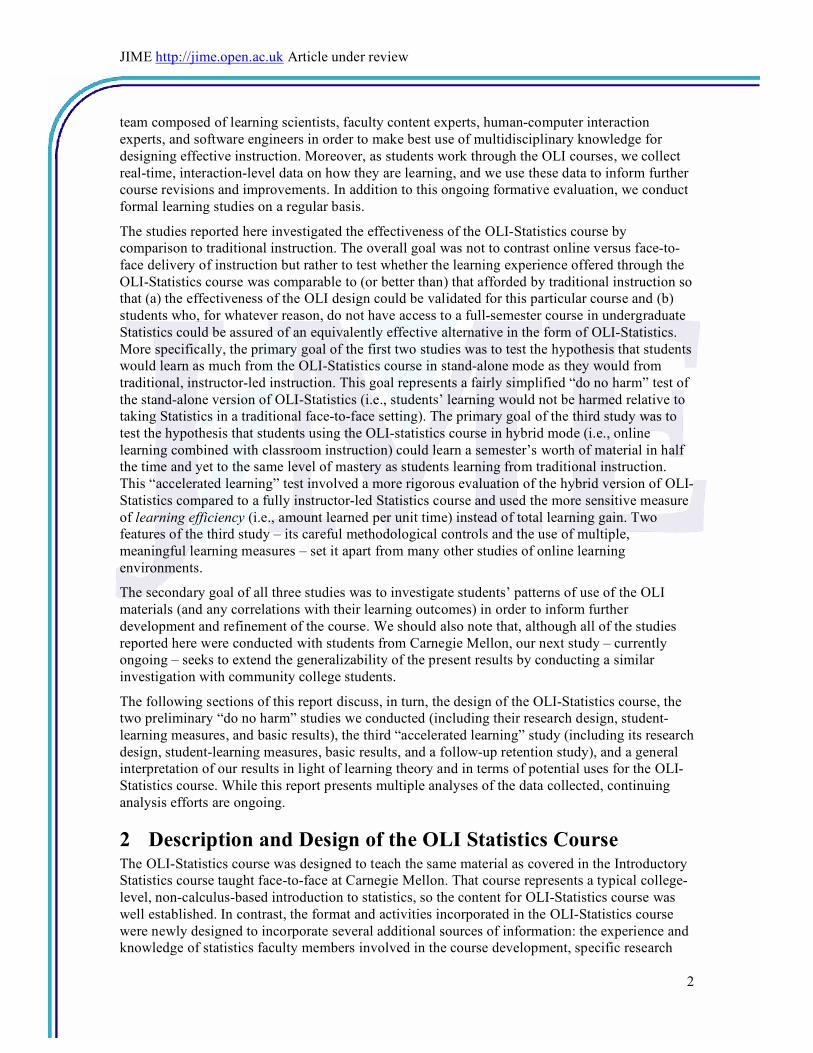
Abstract: The Open Learning Initiative (OLI) is an open educational resources project at
Carnegie Mellon University that began in 2002 with a grant from The William and Flora Hewlett
Foundation. OLI creates web-based courses that are designed so that students can learn
effectively without an instructor. In addition, the courses are often used by instructors to support
and complement face-to-face classroom instruction. Our evaluation efforts have investigated OLI
courses’ effectiveness in both of these instructional modes – stand-alone and hybrid.
This report documents several learning effectiveness studies that were focused on the OLI-
Statistics course and conducted during Fall 2005, Spring 2006, and Spring 2007. During the Fall
2005 and Spring 2006 studies, we collected empirical data about the instructional effectiveness of
the OLI-Statistics course in stand-alone mode, as compared to traditional instruction. In both of
these studies, in-class exam scores showed no significant difference between students in the
stand-alone OLI-Statistics course and students in the traditional instructor-led course. In contrast,
during the Spring 2007 study, we explored an accelerated learning hypothesis, namely, that
learners using the OLI course in hybrid mode will learn the same amount of material in a
significantly shorter period of time with equal learning gains, as compared to students in
traditional instruction. In this study, results showed that OLI-Statistics students learned a full
semester’s worth of material in half as much time and performed as well or better than students
learning from traditional instruction over a full semester.
Keywords: Open Educational Resources, Evaluation, Online Courses, Learning Studies,
Accelerated Learning,
1 Introduction The Open Learning Initiative (OLI) is an open educational resources project at Carnegie Mellon
University that began in 2002 with a grant from The William and Flora Hewlett Foundation. Like
many open educational resources projects, ours makes its courses openly and freely available.
Our goal has been to create complete online courses that enact instruction: they offer structure,
information, activities, practice, and feedback — all arranged so that students can learn even if
they do not have the benefit of an instructor or classmates. Each of our courses is developed by a
JIME http://jime.open.ac.uk Article under review
2
team composed of learning scientists, faculty content experts, human-computer interaction
experts, and software engineers in order to make best use of multidisciplinary knowledge for
designing effective instruction. Moreover, as students work through the OLI courses, we collect
real-time, interaction-level data on how they are learning, and we use these data to inform further
course revisions and improvements. In addition to this ongoing formative evaluation, we conduct
formal learning studies on a regular basis.
The studies reported here investigated the effectiveness of the OLI-Statistics course by
comparison to traditional instruction. The overall goal was not to contrast online versus face-to-
face delivery of instruction but rather to test whether the learning experience offered through the
OLI-Statistics course was comparable to (or better than) that afforded by traditional instruction so
that (a) the effectiveness of the OLI design could be validated for this particular course and (b)
students who, for whatever reason, do not have access to a full-semester course in undergraduate
Statistics could be assured of an equivalently effective alternative in the form of OLI-Statistics.
More specifically, the primary goal of the first two studies was to test the hypothesis that students
would learn as much from the OLI-Statistics course in stand-alone mode as they would from
traditional, instructor-led instruction. This goal represents a fairly simplified “do no harm” test of
the stand-alone version of OLI-Statistics (i.e., students’ learning would not be harmed relative to
taking Statistics in a traditional face-to-face setting). The primary goal of the third study was to
test the hypothesis that students using the OLI-statistics course in hybrid mode (i.e., online
learning combined with classroom instruction) could learn a semester’s worth of material in half
the time and yet to the same level of mastery as students learning from traditional instruction.
This “accelerated learning” test involved a more rigorous evaluation of the hybrid version of OLI-
Statistics compared to a fully instructor-led Statistics course and used the more sensitive measure
of learning efficiency (i.e., amount learned per unit time) instead of total learning gain. Two
features of the third study – its careful methodological controls and the use of multiple,
meaningful learning measures – set it apart from many other studies of online learning
environments.
The secondary goal of all three studies was to investigate students’ patterns of use of the OLI
materials (and any correlations with their learning outcomes) in order to inform further
development and refinement of the course. We should also note that, although all of the studies
reported here were conducted with students from Carnegie Mellon, our next study – currently
ongoing – seeks to extend the generalizability of the present results by conducting a similar
investigation with community college students.
The following sections of this report discuss, in turn, the design of the OLI-Statistics course, the
two preliminary “do no harm” studies we conducted (including their research design, student-
learning measures, and basic results), the third “accelerated learning” study (including its research
design, student-learning measures, basic results, and a follow-up retention study), and a general
interpretation of our results in light of learning theory and in terms of potential uses for the OLI-
Statistics course. While this report presents multiple analyses of the data collected, continuing
analysis efforts are ongoing.
2 Description and Design of the OLI Statistics Course The OLI-Statistics course was designed to teach the same material as covered in the Introductory
Statistics course taught face-to-face at Carnegie Mellon. That course represents a typical college-
level, non-calculus-based introduction to statistics, so the content for OLI-Statistics course was
well established. In contrast, the format and activities incorporated in the OLI-Statistics course
were newly designed to incorporate several additional sources of information: the experience and
knowledge of statistics faculty members involved in the course development, specific research
JIME http://jime.open.ac.uk Article under review
3
findings regarding how students learn statistics, and more general empirical and theoretical
results from research in the learning sciences. The subsections below illustrate several design
features of the course, highlighting differences from the face-to-face course.
2.1 Helping students see (and navigate through) the course’s structure
Although the conceptual structure of knowledge in a given domain is usually obvious to experts,
this is not the case for novices. Introductory courses tend to overwhelm students with what seems
to be a set of isolated facts, lacking in connective structure (Chi, 2005; diSessa, 2004). In the case
of statistics, many students view what they are learning as a "bag of tools and methods" rather
than a systematic approach to making meaningful inferences from data. In a traditional Statistics
course, then, one of the roles of the instructor is to promote coherence by teaching students how
the discrete skills they are learning fit together into a meaningful big picture. Different instructors
may accomplish this in different ways in face-to-face instruction.
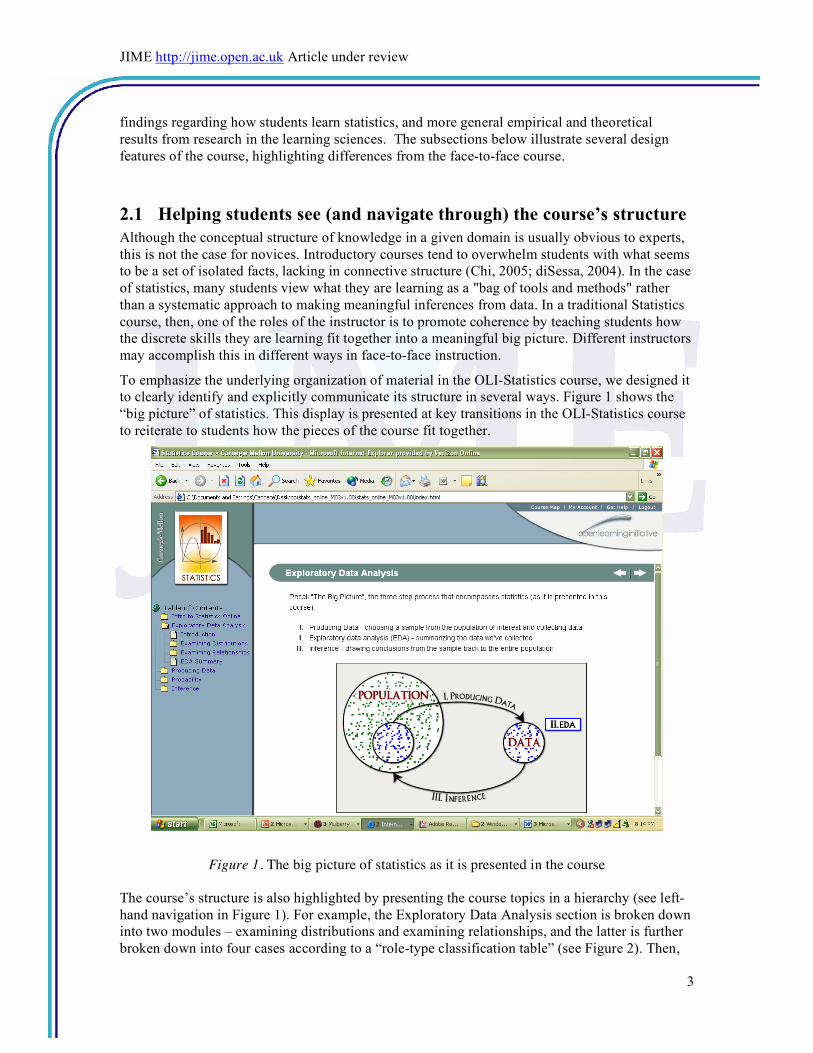
To emphasize the underlying organization of material in the OLI-Statistics course, we designed it
to clearly identify and explicitly communicate its structure in several ways. Figure 1 shows the
“big picture” of statistics. This display is presented at key transitions in the OLI-Statistics course
to reiterate to students how the pieces of the course fit together.
Figure 1. The big picture of statistics as it is presented in the course
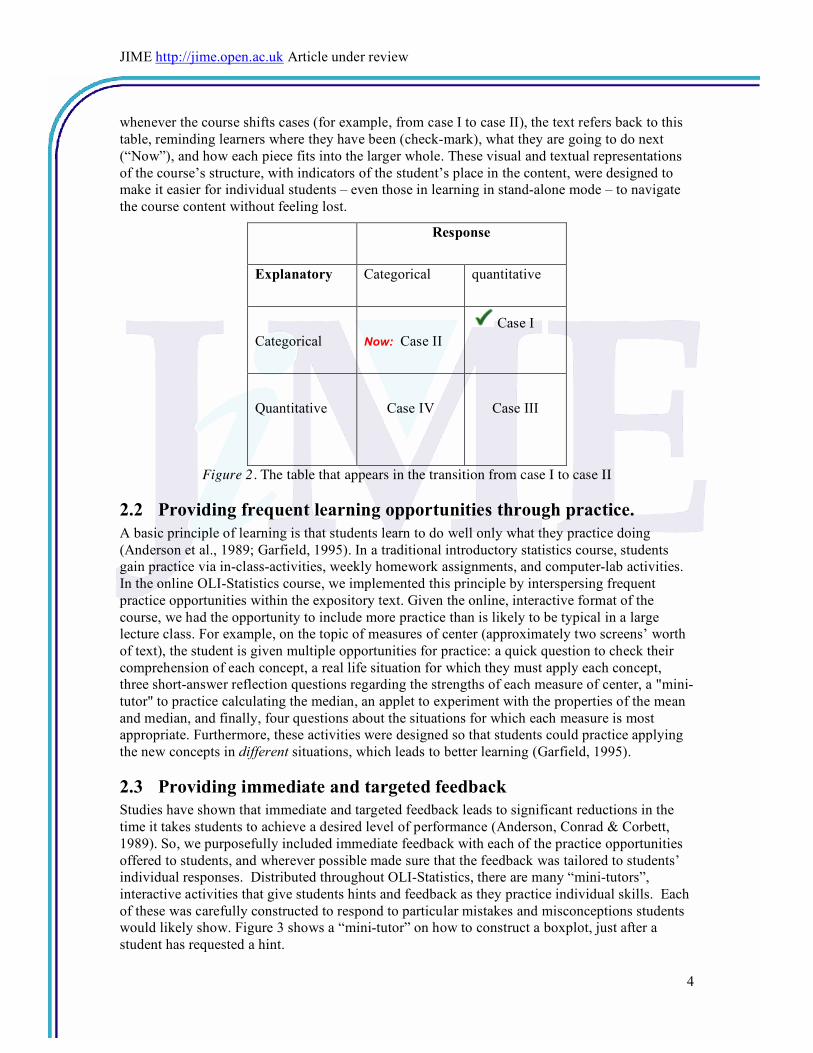
The course’s structure is also highlighted by presenting the course topics in a hierarchy (see left-
hand navigation in Figure 1). For example, the Exploratory Data Analysis section is broken down
into two modules – examining distributions and examining relationships, and the latter is further
broken down into four cases according to a “role-type classification table” (see Figure 2). Then,
JIME http://jime.open.ac.uk Article under review
4
whenever the course shifts cases (for example, from case I to case II), the text refers back to this
table, reminding learners where they have been (check-mark), what they are going to do next
(“Now”), and how each piece fits into the larger whole. These visual and textual representations
of the course’s structure, with indicators of the student’s place in the content, were designed to
make it easier for individual students – even those in learning in stand-alone mode – to navigate
the course content without feeling lost.
Response
Explanatory Categorical quantitative
Categorical
Now: Case II
Case I
Quantitative
Case IV
Case III
Figure 2. The table that appears in the transition from case I to case II
2.2 Providing frequent learning opportunities through practice.
A basic principle of learning is that students learn to do well only what they practice doing
(Anderson et al., 1989; Garfield, 1995). In a traditional introductory statistics course, students
gain practice via in-class-activities, weekly homework assignments, and computer-lab activities.
In the online OLI-Statistics course, we implemented this principle by interspersing frequent
practice opportunities within the expository text. Given the online, interactive format of the
course, we had the opportunity to include more practice than is likely to be typical in a large
lecture class. For example, on the topic of measures of center (approximately two screens’ worth
of text), the student is given multiple opportunities for practice: a quick question to check their
comprehension of each concept, a real life situation for which they must apply each concept,
three short-answer reflection questions regarding the strengths of each measure of center, a "mini-
tutor" to practice calculating the median, an applet to experiment with the properties of the mean
and median, and finally, four questions about the situations for which each measure is most
appropriate. Furthermore, these activities were designed so that students could practice applying
the new concepts in different situations, which leads to better learning (Garfield, 1995).
2.3 Providing immediate and targeted feedback
Studies have shown that immediate and targeted feedback leads to significant reductions in the
time it takes students to achieve a desired level of performance (Anderson, Conrad & Corbett,
1989). So, we purposefully included immediate feedback with each of the practice opportunities
offered to students, and wherever possible made sure that the feedback was tailored to students’
individual responses. Distributed throughout OLI-Statistics, there are many “mini-tutors”,
interactive activities that give students hints and feedback as they practice individual skills. Each
of these was carefully constructed to respond to particular mistakes and misconceptions students
would likely show. Figure 3 shows a “mini-tutor” on how to construct a boxplot, just after a
student has requested a hint.

JIME http://jime.open.ac.uk Article under review
5
Figure 3. A “mini-tutor” about boxplots.
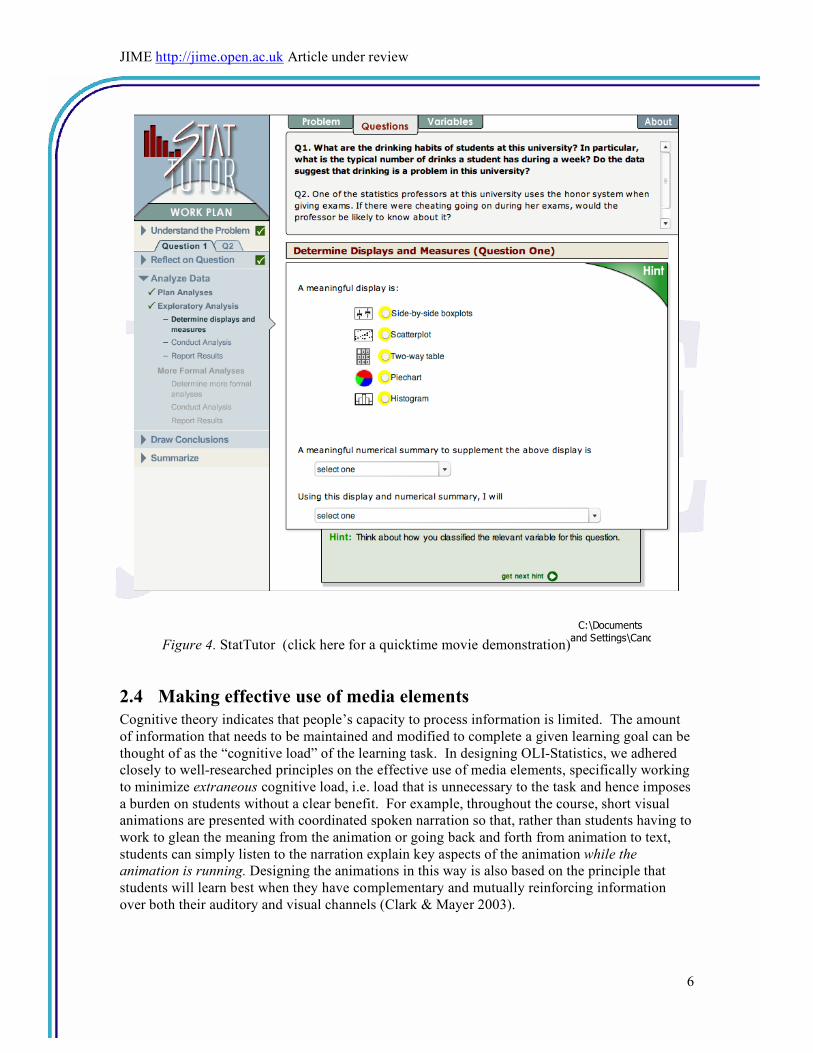
The course also includes StatTutor (Meyer and Lovett, 2002), a computerized learning tool that
presents students with data-analysis problems and guides them to produce solutions, using
instructional scaffolding and a Cognitive Tutor. StatTutor highlights the common steps across
problems, provides support in choosing an appropriate analysis, and offers hints and feedback as
students work. Figure 4 shows StatTutor after a learner has asked for a hint. Click the link below
Figure 4 to watch a quicktime movie of StatTutor.
JIME http://jime.open.ac.uk Article under review
6
Figure 4. StatTutor (click here for a quicktime movie demonstration)
C:\Documents
and Settings\Candace\Desktop\Statutor.png
2.4 Making effective use of media elements
Cognitive theory indicates that people’s capacity to process information is limited. The amount
of information that needs to be maintained and modified to complete a given learning goal can be
thought of as the “cognitive load” of the learning task. In designing OLI-Statistics, we adhered
closely to well-researched principles on the effective use of media elements, specifically working
to minimize extraneous cognitive load, i.e. load that is unnecessary to the task and hence imposes
a burden on students without a clear benefit. For example, throughout the course, short visual
animations are presented with coordinated spoken narration so that, rather than students having to
work to glean the meaning from the animation or going back and forth from animation to text,
students can simply listen to the narration explain key aspects of the animation while the
animation is running. Designing the animations in this way is also based on the principle that
students will learn best when they have complementary and mutually reinforcing information
over both their auditory and visual channels (Clark & Mayer 2003).
JIME http://jime.open.ac.uk Article under review
7
3 “Do No Harm” Studies - Fall 2005 and Spring 2006
3.1 Research Design
During the Fall 2005 and Spring 2006 semesters, we studied the OLI-Statistics course as used by
students in stand-alone mode over an entire fifteen-week semester. In both cases, students who
registered for the traditional course were invited (during the first lecture of the semester) to
participate in our study by completing an online version instead of the traditional course. Of the
students who volunteered to participate and who completed a preliminary demographic survey,
we randomly selected a group of approximately 20-25 students each semester to take the online
course. These students resembled the entire class in terms of gender, race, and prior exposure to
statistics. The remaining students – namely, those who did not volunteer and those who
volunteered for the online section but were not selected for participation – completed the
traditional course and served as controls in our study design.
The students in the online section were then instructed to work through the OLI course according
to a specified schedule and to complete all the course activities. Students in the OLI group did not
attend the traditional course’s lecture (offered three times per week) or lab session (once per
week) or use the traditional course’s statistics textbook, but rather worked in the online course
and met with a statistics faculty member once a week to ask questions and give feedback.
We are aware that the learning experience of the online group in our studies is not a perfect
simulation of the learning experience of an individual learner going through the course on his/her
own; it differs in two significant ways. First, students in the study were not given complete
freedom in their learning pace but rather were given a schedule of weekly sections that they had
to complete. We imposed the pacing on students to ensure that they covered the relevant material
before each exam so that their performance would be as well matched as possible with the
traditional course’s students. It should be noted, however that by setting the pace we created a
good simulation of how a motivated student (the kind who would choose to take this course on
his/her own) might go through the course. Second, students in our study attended a weekly
meeting with the instructor, and even though the instructor did not prepare instruction for these
meetings, students had the opportunity to ask questions. While these meetings did prove useful
for gathering feedback on the course, very few students used the meeting to ask questions or seek
additional instruction.
3.2 Student Learning Measures
For both the Fall 2005 and Spring 2006 semesters, the primary measures of students’ learning
outcomes were their scores on the in-class exams. Students in the online course and in the
traditional course took three midterms and a final exam, all on paper. These tests were matched
for content and difficulty level based on discussions between the two courses’ instructors. While
we realize that in-class exams are far from ideal assessment instruments – e.g., they are not
formally assessed for validity and reliability, and they do not adequately measure learning gain as
a result of the course – we used them in the first two studies as a preliminary basis for comparing
students’ learning outcomes in real world terms.
In the Spring 2006 study we also administered a Statistics knowledge assessment developed by
statistics education researchers (delMas, Ooms, Garfield, & Chance, 2006). This test is named the
Comprehensive Assessment of Outcomes in a first Statistics course (CAOS), and it is designed to
JIME http://jime.open.ac.uk Article under review
8
measure students’ basic statistical reasoning. The 40 multiple-choice items test students’
statistical reasoning in general and target several difficult concepts in statistics. Eighteen experts
who evaluated the CAOS test agreed with the statement: “CAOS measures outcomes for which I
would be disappointed if they were not achieved by students who succeed in my statistics
courses.” The CAOS test not only represents a generally accepted measure of statistical literacy,
it offers a set of national benchmarks for performance that we used to compare with our OLI-
Statistics groups. We administered the CAOS test to the OLI-Statistics students at the beginning
and end of the semester in order to calculate students’ learning gain.1
3.3 Results
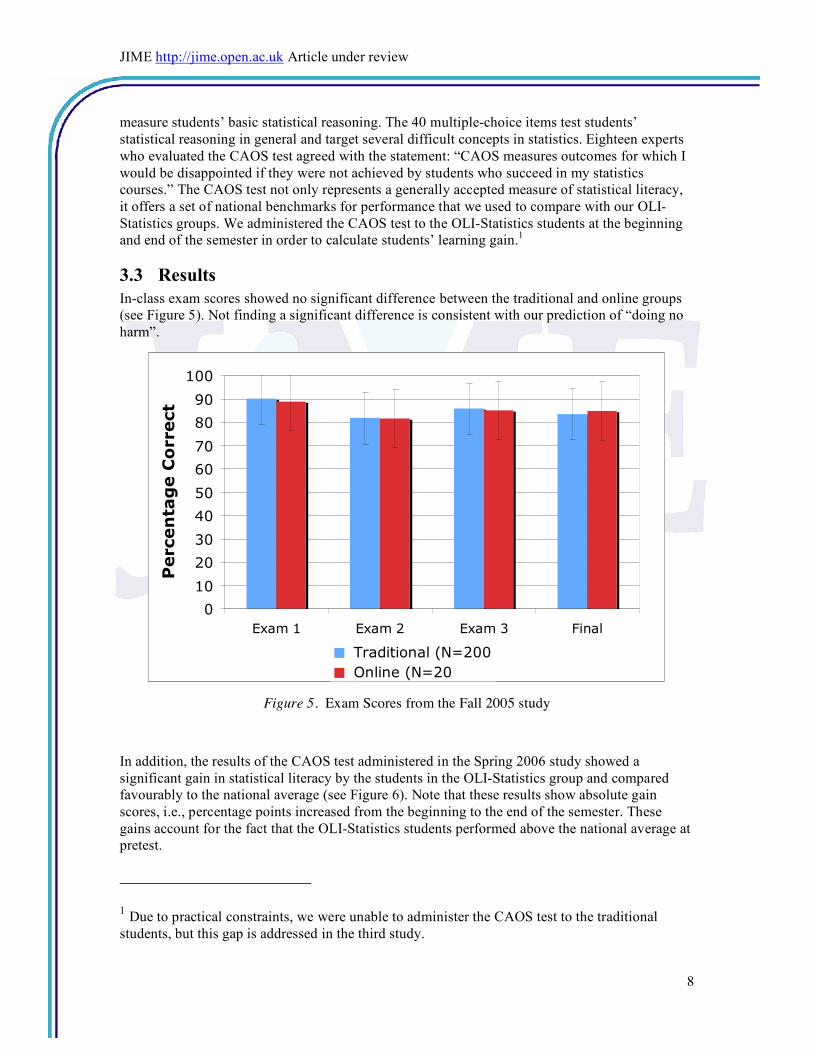
In-class exam scores showed no significant difference between the traditional and online groups
(see Figure 5). Not finding a significant difference is consistent with our prediction of “doing no
harm”.
0
10
20
30
40
50
60
70
80
90
100
Exam 1 Exam 2 Exam 3 Final
Percen
tag
e C
orrect
! Traditional (N=200
! Online (N=20
Figure 5. Exam Scores from the Fall 2005 study
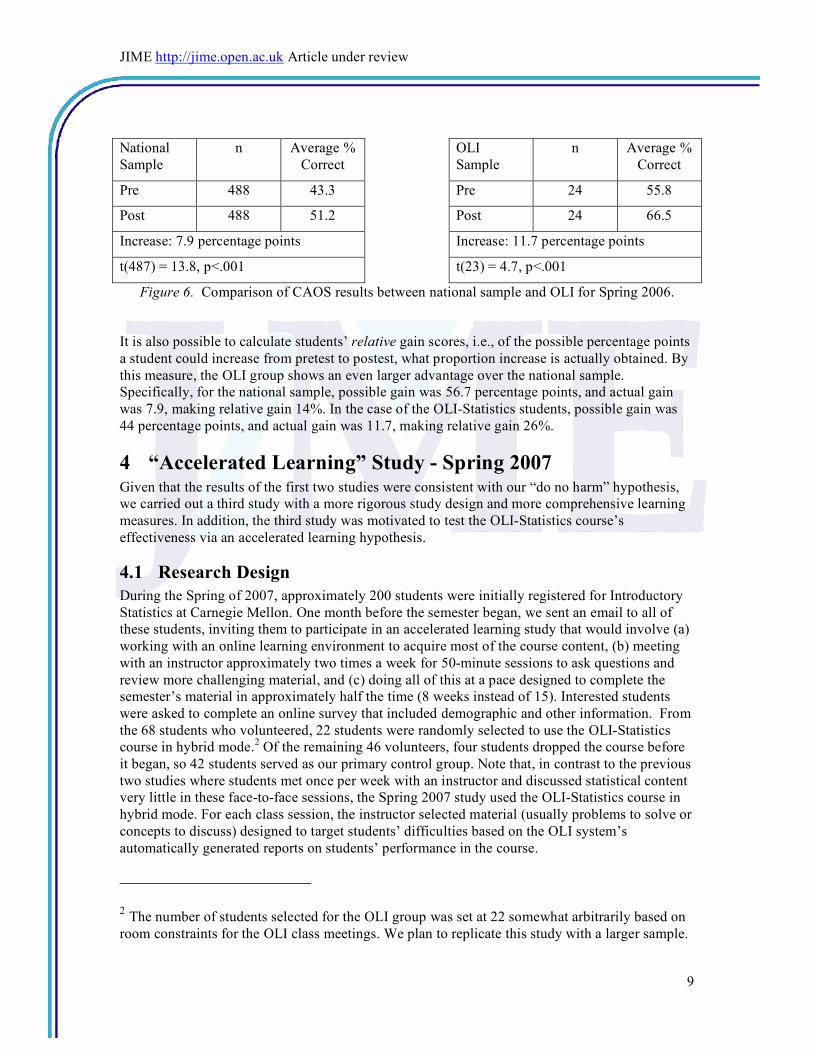
In addition, the results of the CAOS test administered in the Spring 2006 study showed a
significant gain in statistical literacy by the students in the OLI-Statistics group and compared
favourably to the national average (see Figure 6). Note that these results show absolute gain
scores, i.e., percentage points increased from the beginning to the end of the semester. These
gains account for the fact that the OLI-Statistics students performed above the national average at
pretest.
1 Due to practical constraints, we were unable to administer the CAOS test to the traditional
students, but this gap is addressed in the third study.
JIME http://jime.open.ac.uk Article under review
9
National
Sample
n Average %
Correct
OLI
Sample
n Average %
Correct
Pre 488 43.3 Pre 24 55.8
Post 488 51.2 Post 24 66.5
Increase: 7.9 percentage points Increase: 11.7 percentage points
t(487) = 13.8, p<.001 t(23) = 4.7, p<.001
Figure 6. Comparison of CAOS results between national sample and OLI for Spring 2006.
It is also possible to calculate students’ relative gain scores, i.e., of the possible percentage points
a student could increase from pretest to postest, what proportion increase is actually obtained. By
this measure, the OLI group shows an even larger advantage over the national sample.
Specifically, for the national sample, possible gain was 56.7 percentage points, and actual gain
was 7.9, making relative gain 14%. In the case of the OLI-Statistics students, possible gain was
44 percentage points, and actual gain was 11.7, making relative gain 26%.
4 “Accelerated Learning” Study - Spring 2007 Given that the results of the first two studies were consistent with our “do no harm” hypothesis,
we carried out a third study with a more rigorous study design and more comprehensive learning
measures. In addition, the third study was motivated to test the OLI-Statistics course’s
effectiveness via an accelerated learning hypothesis.
4.1 Research Design
During the Spring of 2007, approximately 200 students were initially registered for Introductory
Statistics at Carnegie Mellon. One month before the semester began, we sent an email to all of
these students, inviting them to participate in an accelerated learning study that would involve (a)
working with an online learning environment to acquire most of the course content, (b) meeting
with an instructor approximately two times a week for 50-minute sessions to ask questions and
review more challenging material, and (c) doing all of this at a pace designed to complete the
semester’s material in approximately half the time (8 weeks instead of 15). Interested students
were asked to complete an online survey that included demographic and other information. From
the 68 students who volunteered, 22 students were randomly selected to use the OLI-Statistics
course in hybrid mode.2 Of the remaining 46 volunteers, four students dropped the course before
it began, so 42 students served as our primary control group. Note that, in contrast to the previous
two studies where students met once per week with an instructor and discussed statistical content
very little in these face-to-face sessions, the Spring 2007 study used the OLI-Statistics course in
hybrid mode. For each class session, the instructor selected material (usually problems to solve or
concepts to discuss) designed to target students’ difficulties based on the OLI system’s
automatically generated reports on students’ performance in the course.
2 The number of students selected for the OLI group was set at 22 somewhat arbitrarily based on
room constraints for the OLI class meetings. We plan to replicate this study with a larger sample.
JIME http://jime.open.ac.uk Article under review
10
4.2 Student Learning Measures
As in the “do no harm” studies described above, the preliminary measures of students’ learning
outcomes for the Spring 2007 study were their scores on in-class exams. Students in OLI-
Statistics and in the traditional course took three midterms and a final. All of the tests were
matched for content and level of difficulty as before.
Also, as in the Spring 2006 study, we administered the CAOS test. Note that, in the Spring 2007
study, both the OLI-Statistics students and the traditional course students took the CAOS as a
pretest and posttest.
System-generated data logs: A rich data stream capturing students’ interaction with the OLI-
statistics course offered another source of data for the OLI-Statistics group. From the OLI log
files, we calculated various measures on how students spent their time learning and how much
time they spent in each activity. In particular, we looked at practice on activities meant to teach a
specific topic and at the exam scores corresponding to that topic to see if there was a correlation
between specific practice opportunities and specific learning outcomes.
Student time-use surveys: To test whether the students in the accelerated course were truly
covering the material in half the time of the traditional students (i.e., that the OLI-Statistics
students were not simply cramming a full semester’s worth of study time into half a semester), we
asked a subset of students in both groups to complete time-use surveys. Specifically, for a six-day
period, these students completed daily online surveys regarding how much time they spent
outside of class working on their Statistics course. Note that the 6-day period was chosen to fall at
the same point relative to the end of the course for each group. Also, note that students
completing these surveys from the traditional course were a subset of the students who had
originally volunteered to participate in the accelerated learning study, i.e., our primary control
group. Fifteen students completed these surveys from the OLI-Statistics group, and 18 students
did so from the control group.
4.3 Results
Of the 22 students in the OLI-Statistics course, 21 completed the work and took the final exam.
Of the 42 students in the control condition, 40 took the final exam. These numbers suggest that
the accelerated OLI-Statistics course and the traditional course had similar drop-out rates.
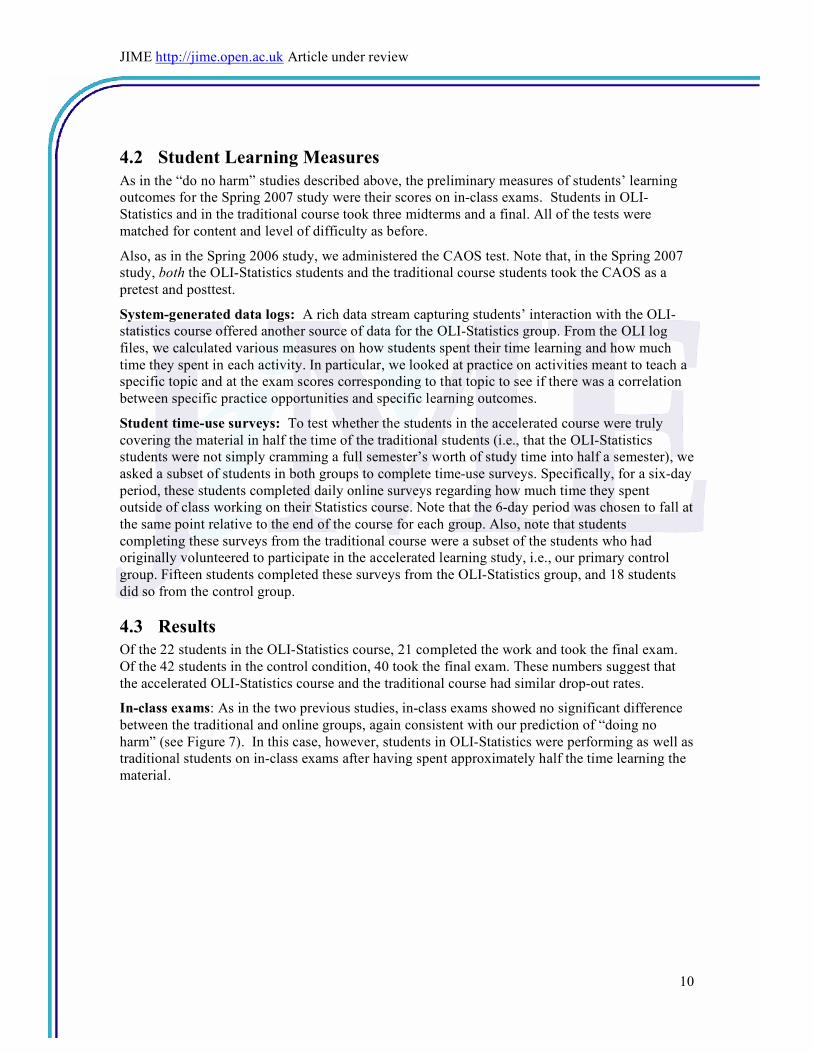
In-class exams: As in the two previous studies, in-class exams showed no significant difference
between the traditional and online groups, again consistent with our prediction of “doing no
harm” (see Figure 7). In this case, however, students in OLI-Statistics were performing as well as
traditional students on in-class exams after having spent approximately half the time learning the
material.
JIME http://jime.open.ac.uk Article under review
11
Final Exam Performance
50
60
70
80
90
100
OLI Accel Trad Control Trad All
Percen
tag
e C
orrect
Figure 7. Final exam performance of accelerated OLI-Statistics compared to traditional.
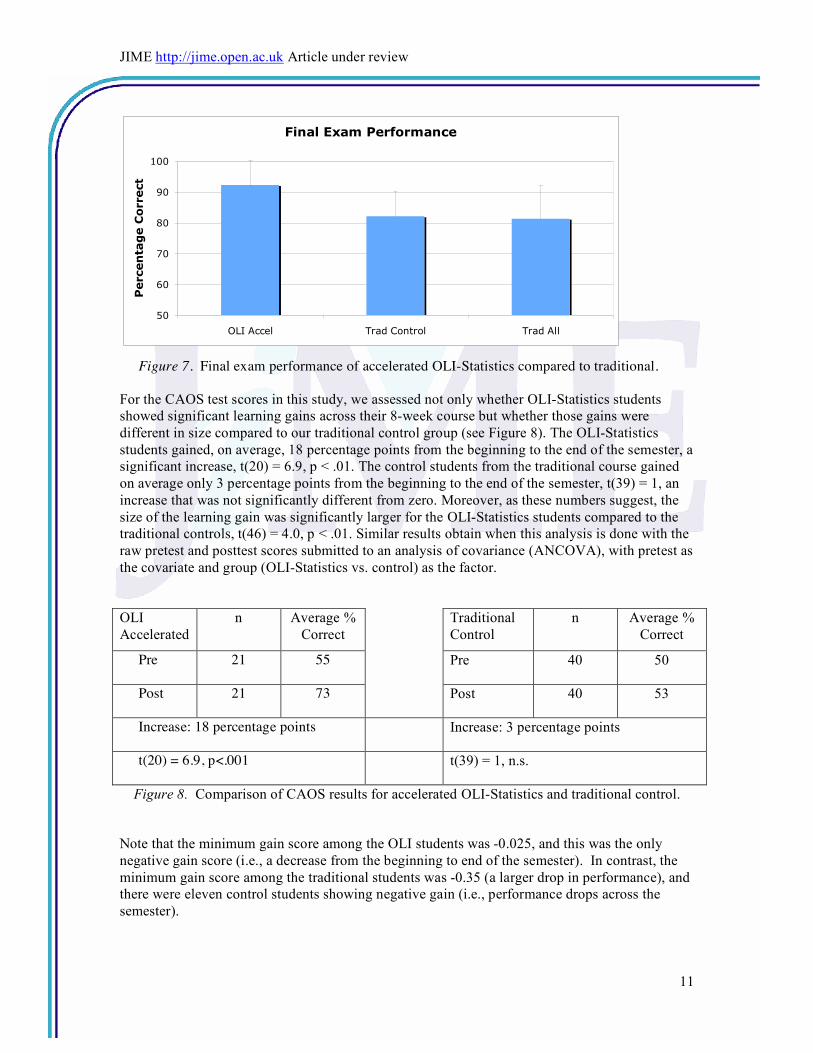
For the CAOS test scores in this study, we assessed not only whether OLI-Statistics students
showed significant learning gains across their 8-week course but whether those gains were
different in size compared to our traditional control group (see Figure 8). The OLI-Statistics
students gained, on average, 18 percentage points from the beginning to the end of the semester, a
significant increase, t(20) = 6.9, p < .01. The control students from the traditional course gained
on average only 3 percentage points from the beginning to the end of the semester, t(39) = 1, an
increase that was not significantly different from zero. Moreover, as these numbers suggest, the
size of the learning gain was significantly larger for the OLI-Statistics students compared to the
traditional controls, t(46) = 4.0, p < .01. Similar results obtain when this analysis is done with the
raw pretest and posttest scores submitted to an analysis of covariance (ANCOVA), with pretest as
the covariate and group (OLI-Statistics vs. control) as the factor.
OLI
Accelerated
n Average %
Correct
Traditional
Control
n Average %
Correct
Pre 21 55 Pre 40 50
Post 21 73 Post 40 53
Increase: 18 percentage points Increase: 3 percentage points
t(20) = 6.9, p<.001 t(39) = 1, n.s.
Figure 8. Comparison of CAOS results for accelerated OLI-Statistics and traditional control.
Note that the minimum gain score among the OLI students was -0.025, and this was the only
negative gain score (i.e., a decrease from the beginning to end of the semester). In contrast, the
minimum gain score among the traditional students was -0.35 (a larger drop in performance), and
there were eleven control students showing negative gain (i.e., performance drops across the
semester).
JIME http://jime.open.ac.uk Article under review
12
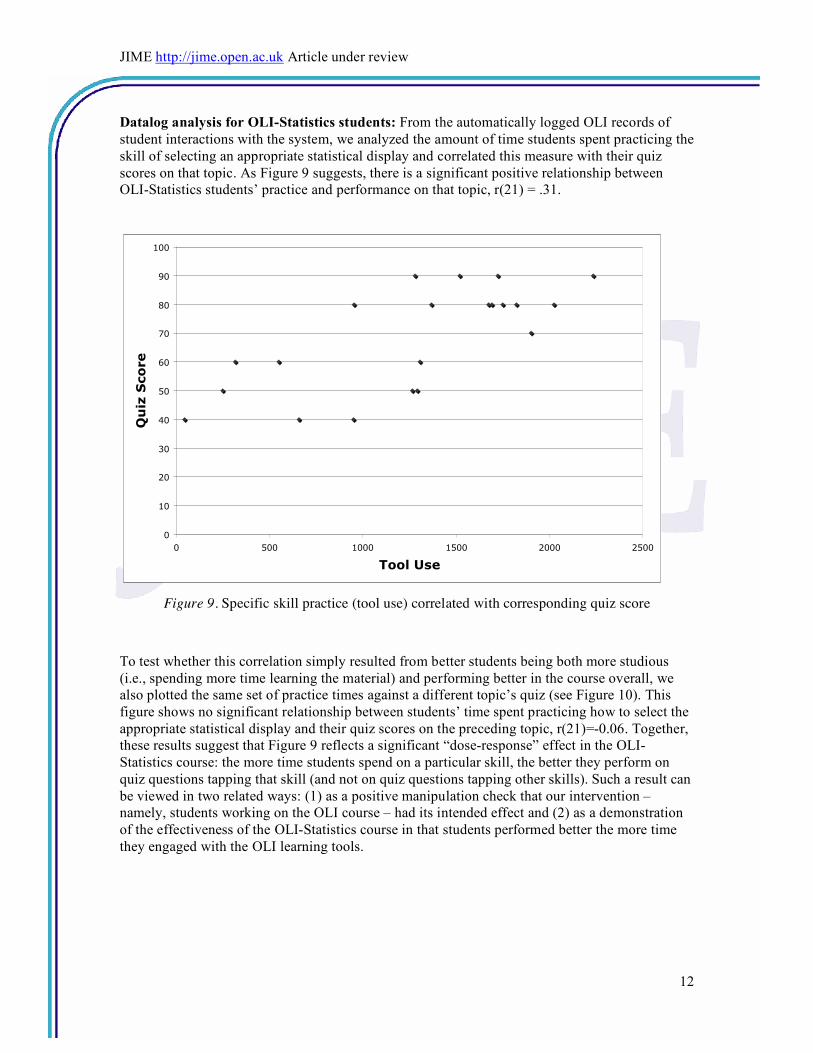
Datalog analysis for OLI-Statistics students: From the automatically logged OLI records of
student interactions with the system, we analyzed the amount of time students spent practicing the
skill of selecting an appropriate statistical display and correlated this measure with their quiz
scores on that topic. As Figure 9 suggests, there is a significant positive relationship between
OLI-Statistics students’ practice and performance on that topic, r(21) = .31.
0
10
20
30
40
50
60
70
80
90
100
0 500 1000 1500 2000 2500
Tool Use
Qu
iz S
co
re
Figure 9. Specific skill practice (tool use) correlated with corresponding quiz score
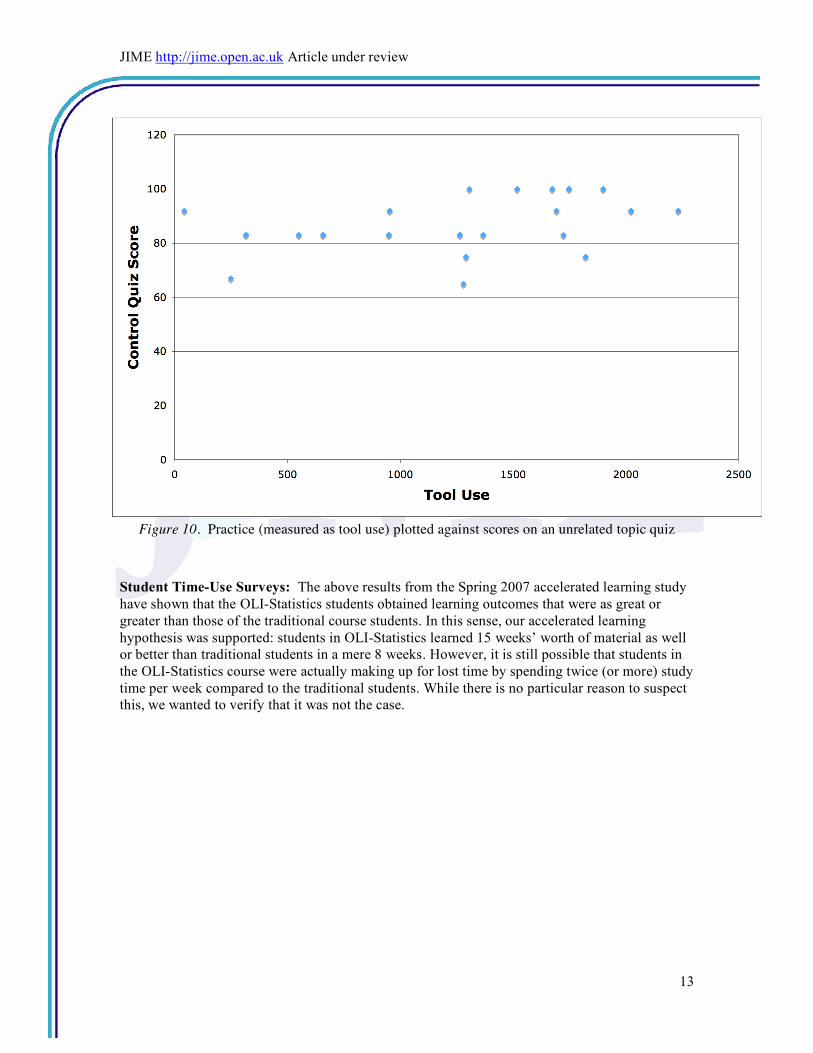
To test whether this correlation simply resulted from better students being both more studious
(i.e., spending more time learning the material) and performing better in the course overall, we
also plotted the same set of practice times against a different topic’s quiz (see Figure 10). This
figure shows no significant relationship between students’ time spent practicing how to select the
appropriate statistical display and their quiz scores on the preceding topic, r(21)=-0.06. Together,
these results suggest that Figure 9 reflects a significant “dose-response” effect in the OLI-
Statistics course: the more time students spend on a particular skill, the better they perform on
quiz questions tapping that skill (and not on quiz questions tapping other skills). Such a result can
be viewed in two related ways: (1) as a positive manipulation check that our intervention –
namely, students working on the OLI course – had its intended effect and (2) as a demonstration
of the effectiveness of the OLI-Statistics course in that students performed better the more time
they engaged with the OLI learning tools.
JIME http://jime.open.ac.uk Article under review
13
Figure 10. Practice (measured as tool use) plotted against scores on an unrelated topic quiz
Student Time-Use Surveys: The above results from the Spring 2007 accelerated learning study
have shown that the OLI-Statistics students obtained learning outcomes that were as great or
greater than those of the traditional course students. In this sense, our accelerated learning
hypothesis was supported: students in OLI-Statistics learned 15 weeks’ worth of material as well
or better than traditional students in a mere 8 weeks. However, it is still possible that students in
the OLI-Statistics course were actually making up for lost time by spending twice (or more) study
time per week compared to the traditional students. While there is no particular reason to suspect
this, we wanted to verify that it was not the case.
JIME http://jime.open.ac.uk Article under review
14
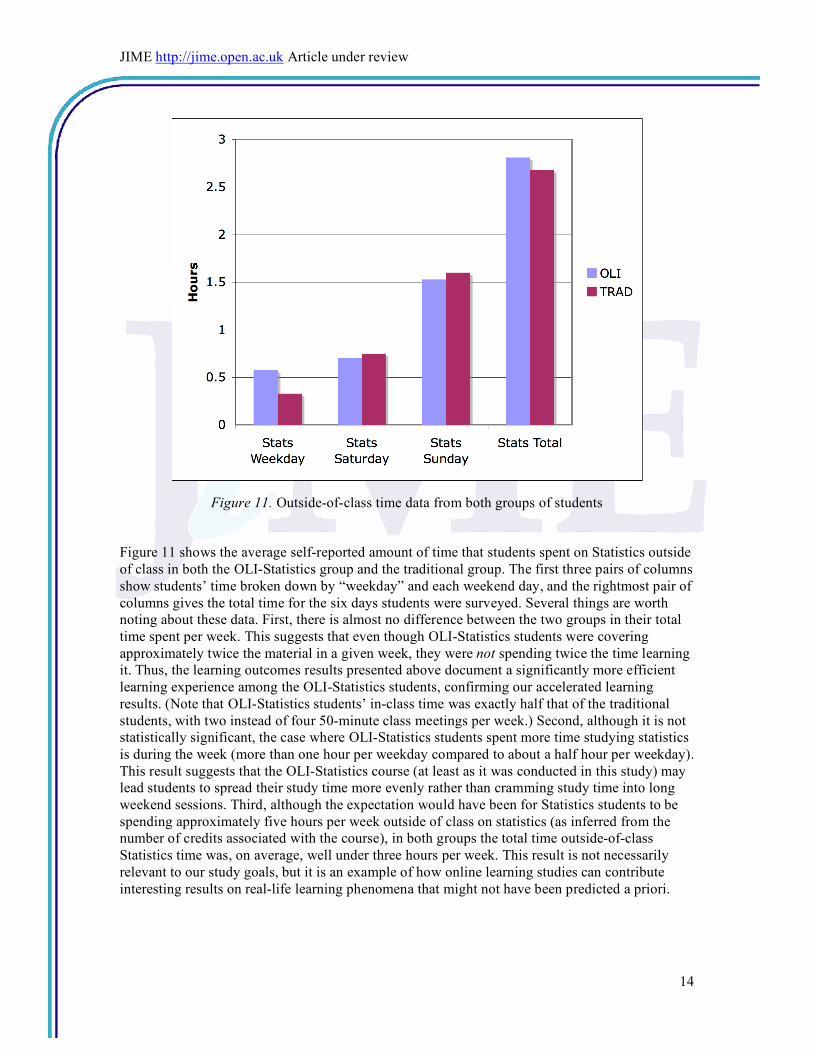
Figure 11. Outside-of-class time data from both groups of students
Figure 11 shows the average self-reported amount of time that students spent on Statistics outside
of class in both the OLI-Statistics group and the traditional group. The first three pairs of columns
show students’ time broken down by “weekday” and each weekend day, and the rightmost pair of
columns gives the total time for the six days students were surveyed. Several things are worth
noting about these data. First, there is almost no difference between the two groups in their total
time spent per week. This suggests that even though OLI-Statistics students were covering
approximately twice the material in a given week, they were not spending twice the time learning
it. Thus, the learning outcomes results presented above document a significantly more efficient
learning experience among the OLI-Statistics students, confirming our accelerated learning
results. (Note that OLI-Statistics students’ in-class time was exactly half that of the traditional
students, with two instead of four 50-minute class meetings per week.) Second, although it is not
statistically significant, the case where OLI-Statistics students spent more time studying statistics
is during the week (more than one hour per weekday compared to about a half hour per weekday).
This result suggests that the OLI-Statistics course (at least as it was conducted in this study) may
lead students to spread their study time more evenly rather than cramming study time into long
weekend sessions. Third, although the expectation would have been for Statistics students to be
spending approximately five hours per week outside of class on statistics (as inferred from the
number of credits associated with the course), in both groups the total time outside-of-class
Statistics time was, on average, well under three hours per week. This result is not necessarily
relevant to our study goals, but it is an example of how online learning studies can contribute
interesting results on real-life learning phenomena that might not have been predicted a priori.
JIME http://jime.open.ac.uk Article under review
15
4.4 Retention Component of the Accelerated Learning Study
4.4.1 Retention Study motivation and method
Because the results of the Spring 2007 study were so encouraging – namely, students in OLI-
Statistics took half the time to learn as much or more than their traditional counterparts – we
sought to extend the study by conducting a retention follow-up study that would test students’
abilities to retain and use what they learned during Spring 2007 at a considerable delay. This
retention study was also designed as an authentic assessment of students’ learning by testing what
they had learned in Spring 2007 at the beginning of the following semester, i.e., precisely when
they would be expected to build on their previous knowledge. So, in the Fall of 2007, we invited
students from both groups (the OLI-Statistics students and the traditional control) to participate in
an additional study for pay. This additional study included three activities: taking the CAOS test
again, solving open-ended problems from introductory statistics, and learning a new topic (and
answering questions about it).
It is worth noting that the OLI-Statistics students, who had finished their statistics course at the
beginning of March 2007, completed the retention study at a 7-month delay whereas the
traditional students, who finished their statistics course in the middle of May 2007, completed the
retention study at a 5-month delay. So, even if students’ memory decay functions were
equivalent during this time period, we might expect somewhat lower performance among the
OLI-Statistics students.
Before presenting the results for the three activities in this retention study, we should note an
important practical challenge we encountered. Out of the 60 students we emailed to invite to
participate in the study, only eleven students responded and completed the retention activities.
Conveniently, they were almost evenly balanced between the two groups, with six OLI-Statistics
students and five traditional students. Nevertheless, we must take the following results as merely
suggestive because of the small sample size. For this reason, we are currently working to track
students’ performance in the follow-on course (currently being taught in Spring 2008).
4.4.2 Retention Study results
For the CAOS test, we found no significant difference between the two groups (Accelerated OLI-
Statistics group averaged 72% correct; traditional controls averaged 67% correct). Even without
finding a difference between groups, it is interesting to note that students’ retention scores tracked
their Spring 2007 posttest scores rather well (70% and 66% for the corresponding students from
the two groups). Such a result is consistent with previous research showing that students who
learn more retain more. It also encourages us to expect that with a larger retention sample, we
might have been able to show a significant difference in CAOS scores between the OLI-Statistics
students and traditional students.
The open-ended problem solving portion of the retention study was scored by a rater who was
trained to use a scoring rubric that gave up to a total of 9 points for (1) the accuracy of the
solution, (2) the appropriateness of statistical tools used, and (3) the clarity and accuracy of the
written interpretation of the statistical results. The rater was blind to participants’ condition. With
such a small sample, it is not surprising that these scores did not reach statistical significance,
t(11) = 1.6, p < .13. Nevertheless, the OLI-Statistics group scored numerically quite a bit higher:
6.3 versus 3.9. Moreover, it is interesting to note that none of the six OLI students made an
JIME http://jime.open.ac.uk Article under review
16
egregious error in their answers, whereas two of the five students in the traditional group made a
serious interpretive error.3
Finally, the third activity in the retention study asked students to read a short passage explaining a
new statistical tool, Analysis of Covariance, and then to answer a few conceptual questions about
this tool. Accuracy scores on these questions were again scored on a scale from 0 to 9. Results
showed no difference between the two groups, with both groups averaging 7 points.
5 General Discussion The use of web-based instruction can take many forms. According to Utts, et. al. (2005), the
options can range from using web-based applications in a traditional course to a full-blown online
course where the contact contact with the instructor is also mediated by online tools. The OLI-
Statistics course adds a new “end point” to this continuum – a complete “stand-alone” or self-
sufficient online course that does not require an instructor for students to learn effectively. This
new endpoint is critical to the OER goal of providing access to high quality educational
experiences to individual learners who do not have the benefit of access to an institution or
instructor.
We were very encouraged to discover that when the OLI statistics course was used in the way it
was designed to be used (as a stand-alone course), the learning gains of students were at least as
good as in a traditional, instructor-led course. Moreover, when the OLI-Statistics course was used
in hybrid form, the results also indicated students experienced a much more effective and efficient
learning experience in that they showed equal or better learning gain in half the time. Finally, the
OLI-Statistics instructor leading the class sessions in the accelerated learning study reported that
this was a much more enriching pedagogical experience than he typically has with traditional
instruction.
These results and this last anecdote from the instructor suggest a possible mechanism to explain
the success of the OLI-Statistics course, especially when it was used in hybrid mode. The core of
this explanation rests on the fact that (1) students in OLI-Statistics were meaningfully engaging
with the material whenever they were using the OLI-Statistics course, and (2) students in the
accelerated OLI-Statistics course were also meaningfully engaging with the material when they
were having face-to-face instruction time. Regarding students’ meaningful engagement with the
OLI material, we return to the learning science principles that motivated the course’s design. For
example, the OLI-Statistics course was designed to make clear the structure of statistical
knowledge, include multiple practice opportunities for each of the skills students needed to learn,
to give students tailored and targeted feedback on their performance, and to effectively manage
the cognitive load students must maintain while learning. All of these principles would be
predicted to foster better, deeper learning, and our results across all three studies support that
prediction. Moreover, our analyses of the log data from Spring 2007 also suggest that the course
was more effective for students the more they used it (cf. dose-response effect).
But perhaps the most striking finding in this set of studies is that students in the accelerated OLI-
Statistics course were able to learn better and in half the time as compared to students with
traditional instruction. Usually, that kind of effectiveness or efficiency effect would be the result
3 For example, one of the traditional students made the opposite interpretation of a
significant p-value, reporting that p < .05 means the null hypothesis is accepted.
JIME http://jime.open.ac.uk Article under review
17
of individualized, human tutored instruction (e.g., Bloom, 1984). And yet, we had more than
twenty students in a class that met for less than two hours per week, showing such results. The
mechanism we posit for this striking result is that the accelerated OLI-Statistics students actually
attended their class meetings in a much better prepared state than students usually do. As opposed
to skimming (or skipping) the reading before a traditional lecture, our accelerated students
prepared for class by actively engaging with the material in numerous ways by completing
comprehension checks of their understanding as they read, applying their new skills to problems
for practice, receiving tailored feedback on their answers, and reflecting on their own
understanding and questions as they proceeded. In this way students came to class ready to make
best use of their time with the instructor. And, the instructor came to class better prepared to
teach. Thanks to OLI’s automatically generated instructor reports, the instructor was able to see
reports on student progress, review summaries of students’ quiz performance, and read students’
reflections and questions about the previous week’s material. With this information in hand, he
was able to select discussion topics and example problems that targeted the topics with which the
students were struggling. Then, class time was spent with students actively engaged on the
material that was most likely to need more supported practice or a novel explanation from the
instructor.
It is this combination of preparedness of both the students and the instructor, facilitated by the
OLI-Statistics course, that we believe is the key to the success of using this course in accelerated
hybrid mode. Ironically, the fact that the OLI statistics course was designed as a stand-alone
course – making knowledge structures explicit, following as many principles of learning as
possible – is likely the reason that it was so successful when used in hybrid form.
Finally, one of the challenges that academic institutions are facing and are hoping to solve by
using online education is how to provide effective instruction under limited resources. The more a
course is web-based and relies less on an instructor, the more resources are saved. In addition,
some colleges do not have statistics experts to teach their introductory statistics courses and
instead rely on mathematicians to teach such courses. In such cases, using online instructional
support such as OLI-Statistics could provide “pedagogical scaffolding” so that the overall quality
of instruction is improved. So, although our main findings involve not just stand-alone online
instruction but document the effectiveness of a pedagogically active instructor working with OLI-
Statistics, there are still a lot of resources saved in comparison to a traditional course (e.g., two
course meetings per week instead of four). In addition, resources could be saved since the course
can be taught in half a semester with no extra time cost to the students and impressive benefits in
the form of solid learning gains and substantial retention of the material.
6 References
Anderson, J. R., Corbett, A. T., and Conrad, F. (1989). Skill acquisition and the LISP tutor.
Cognitive Science, 13, 467-506.
Bloom, B. (1984), ‘The Two Sigma Problem: The Search for Methods of Group Instruction as
Effective as One-to-One Tutoring’, Educational Researcher, July: 4-15.
JIME http://jime.open.ac.uk Article under review
18
Chi, M. T. H. (2005). Common sense conceptions of emergent processes: Why some
misconceptions are robust. Journal of the Learning Sciences, 14, 161-199.
Clark, R. C., & Mayer, R. E. (2003). E-learning and the science of instruction: Proven
guidelines for consumers and designers of multimedia learning . San Francisco, CA: Jossey-Bass.
delMas, R., Ooms, A., Garfield, J., & Chance, B. (2006). Assessing students’ statistical
reasoning. In Proceedings of the Seventh International Conference on the Teaching of Statistics.
Salvador, Brazil.
diSessa, A.A. (2004). Coherence versus fragmentation in the development of the concept of force.
Cognitive Science, 28, 843-900.
Garfield, J. B. (1995). How students learn statistics. International Statistical Review, 63, 25-34.
Meyer, O., & Lovett, M. C. (2002). Implementing a cognitive tutor in a statistical reasoning
course: Getting the big picture. Proceedings of the Seventh International Conference on the
Teaching of Statistics. Salvador, Brazil.
National Research Council (2000). How People Learn: Brain, Mind, Experience, and School.
Washington, DC: National Academy Press.