Embed Size (px)
Citation preview

1Measuring the Cost-effectiveness of Various DRM Measures
KNOWLEDGE NOTE 6-1CLUSTER 6: The economics of disaster risk, risk management, and risk financing
Measuring the Cost-effectiveness of Various DRM Measures

2 KNOWLEDGE NOTE 6-1
Prepared by Masato Toyama and Junko Sagara, CTI Engineering

3Measuring the Cost-effectiveness of Various DRM Measures
Measuring the Cost-effectiveness of Various DRM Measures
The Japanese experience shows that—if done right—preventive investments pay. The Japanese government invested about 7 to 8 percent of the total budget for disaster risk management (DRM) in the 1960s, a move that most probably decreased disaster deaths. Cost-effectiveness analysis (CEA) and cost-benefit analysis (CBA) of DRM projects have been widely implemented both at national and local levels in Japan. Different procedures for such analysis have been followed according to the type of project, the funds, and the governing entity responsible. The Japanese expe-rience shows that CBA is applicable to DRM-related projects and is a useful tool in choosing among different options and understanding the effectiveness of a project.
INTRODUCTION
The Great East Japan Earthquake (GEJE) and other recent disasters remind us of the importance of early actions to implement adequate prevention measures, mitigate risks, and establish sound postdisaster financing mechanisms to reduce human, economic, and financial impacts. Even if documented evidence is still lacking, there is a growing consensus that investing in disaster risk management (DRM) is cost-effective, though measuring cost savings is difficult. Several lessons can be derived from the CBA and CEA conducted in Japan.
FINDINGS
National budget for DRM
Every year many people lose their lives and property in Japan due to natural disasters. Up until the 1950s, numerous large-scale typhoons and earthquakes caused extensive damage and thousands of casualties (figure 1). In the 1960s DRM spending represented 7 to 8 percent of the national budget (figure 2). As mechanisms to cope with disas-ters and mitigate vulnerability to them have progressed (by developing DRM systems, promoting national land conservation, improving weather forecasting technologies, and
KNOWLEDGE NOTE 6-1CLUSTER 6: The economics of disaster risk, risk management, and risk financing

4 KNOWLEDGE NOTE 6-1
Bu
dg
et m
illio
n ¥
01945
500,000
1,000,000
1,500,000
2,000,000
2,500,000
3,000,000
3,500,000
4,000,000
1.0
2.0
3.0
4.0
5.0
6.0
7.0
8.0
9.0
Sh
are in n
atino
al bu
dg
et (%)
1948 1951 1954 1957 1960 1963 1966 1969 1972 1975 1978 1981 1984 1987 1990 1993 1996 1999 2002 2005 2008 2011
DRM budget
Share in national budget
upgrading disaster information communications systems), the number of disaster-related casualties, especially from floods, has been decreasing over the years with the exception of a few outliers.
Comparison of damage with other tsunami disasters
The GEJE is the strongest earthquake to ever hit Japan; the destruction it caused is stag-gering. But it is clear that if Japan were not so well prepared, things could have been much worse.
A longstanding tradition of effective disaster prevention paid off. While almost 20,000 people lost their lives on March 11, the mortality ratio of the GEJE—which hit during the
FIGURE 1: Disaster deaths in Japan, 1945–2011
FIGURE 2: Change in DRM spending in Japan
Mikawa Earthquake (2,306 people) andMakurazaki typohon (3,756 people)
Great Hanshin-AwajiEarthquake (6,437 people)
3,089 missingIsewan Typhoon (5,098 people)
Typhoon Toyamaru (1,761 people)
Nanki Torrential Rain (1,124 people)
Fukui Earthquake (3,769 people)
Kathleen Typhoon (1,930 people)
Dea
d a
nd
mis
sin
g
Great East Japan Earthquake15,854 confirmed dead (as of 28 March 2012)

5Measuring the Cost-effectiveness of Various DRM Measures
FIGURE 3: Comparison of tsunami damage by tsunami disasters
Tsunami (year)Dead and missing a
Damaged houses
Population in affected areas b a/b (%)
GEJE (2011) 19,780 259,415 510,000 4
Meiji Sanriku (1896) 21,920 7,957 51,000 2 43
Indian Ocean (2004) 227,000 1,700,000 1 1,927,000 3 12
Chile (2010) 124 1,500 5,000 4 2
Notes: 1) In population; 2) Number of damaged houses x average number of household members in Iwate (6.38); 3) Dead + population lost houses; 4) Number of damaged houses x average number of household members (3.5).
daytime—was considerably lower compared to the Meiji tsunami of 1896 (nighttime) or the Indian Ocean tsunami of 2004 (which also hit during the day) (figure 3).
Over the years, the Japanese government has invested in structural and nonstructural measures to prevent disasters and reduce their impacts. Around ¥1 trillion was invested in coastal dikes and breakwaters just in the areas affected by the GEJE, and yearly investments in earthquake monitoring and warning systems amounted to about ¥2 billion. Furthermore, a number of nonstructural measures—including community-based disaster risk manage-ment (KN 2-1), DRM education (KN 2-3), and business continuity plan (KN 2-4)—have been further developed over the years.
Measuring cost-effectiveness
It is essential to make sure that limited financial resources are used in a cost-effective way. Effective spending has high rates of return but is difficult in practice. There are varieties of criteria being used for evaluating the cost-effectiveness of projects, such as CBA, CEA, multicriteria analysis (MCA), and so on. CBA is a well-known tool, particularly useful for governments seeking to compare alternatives. CBA is used to organize and present costs and benefits of measures and projects and to evaluate cost efficiency. CBA was originally developed as a rate-of-return assessment and financial appraisal method to assess busi-ness investments. The main purpose was to compare all the costs and benefits of an
GEJE Tsunami2011 (daytime)
19,7804%
510,000 51,000
5,000
1,927,000
21,92043%
227,00012%
1242%
Meiji Sanriku Tsunami1896 (nighttime)
Indian Ocean Tsunami2004 (daytime)
Chile Tsunami2010 (daytime)

6 KNOWLEDGE NOTE 6-1
investment (even if accruing across different sectors, in different locations, and in different time periods) from the perspective of society. But for most DRM projects there is a lack of information, especially regarding benefits and profits, making it difficult to accurately estimate the cost-effectiveness of measures (Mechler 2005).
CBA in Japan
In Japan project appraisals, including CBA, are conducted for public works projects before they are adopted, and every three to five years after adoption to evaluate project efficiency (figure 4). Committees for project appraisal (consisting of academic, business, or legal experts) are established for national and local entities responsible for project implementa-tion, who evaluate the project efficiency of adopted projects. The committees assess the need, cost benefits, progress, possibilities for cost reduction, and the continuity of projects. The appraisal results and associated documents are made open to the public to ensure the transparency of decision making.
FIGURE 4: MLIT public works project evaluation process, based on Government Policy Evaluation Act (2002)
Source: MLIT.
Adoption of a new project
Feed
bac
k to
oth
er p
roje
cts
if n
eces
sary
Stop
Continue
Continue
Continue
Stop
Stop
If the project has notstarted after 3 years
5 years afterthe adoption
5 years afterthe completion
3 years after thereevaluation (every 3 years)
Start ofthe project
Completion ofthe project
Evaluation to adopt a new project
Evaluate necessity and validity of the projectincluding cost/benefit analysis.
Make a decision to continue or not fromthe following 3 viewpoints:1) Necessity of the project: – Change of social and economic situation – Cost effectiveness (cost/benefit analysis) – Progress2) Expected progress in future3) Possibility of cost reduction or alternatives
Reevaluation of the project
Evaluation after the project
Evaluate the effects, environmental impacts, andsocial and economic changes, and examineappropriate measures to improve if necessary.The results will be reflected in future projects.

7Measuring the Cost-effectiveness of Various DRM Measures
A system for evaluating government policies was first introduced in Japan at the prefec-tural government level to reassess or conduct interim evaluations of ongoing projects. The first attempt at such evaluation was done by the Hokkaido prefectural government in 1997.
The central government, recognizing the importance of such a system, established the Government Policy Evaluations Act (GPEA) in 2001, to provide a legal framework for evalu-ating government policies. The GPEA aims to promote accountability; provide efficient, high-quality government services and projects; and ensure that the outcomes of these services and projects meet the needs of the nation.
The GPEA calls for all government policies, programs, and projects to be assessed before their inception, to be evaluated after their completion, and to be reassessed or subjected to interim evaluation when necessary.
CBA for coastal projects
Under the GPEA (2001), the Ministry of Land Infrastructure Transport and Tourism (MLIT) conducts CBA on every project based on the Technical Guidelines of Cost-Benefit Analysis for Public Works Projects (2004). These guidelines set out the overarching principles to be followed by each individual department (such as river, road, or urban development) of the MLIT. Maintenance and management of existing infrastructure and disaster-rehabilitation works are excluded. The Reconstruction Authority has confirmed that post-GEJE rehabilita-tion efforts will not be subject to CBA evaluation.
In 1987 the MLIT and Ministry of Agriculture, Forestry and Fisheries published the “Guide-lines for Cost Benefit Analysis for Coastal Works.” The guidelines were revised in 2004 following the inclusion of disaster prevention, environmental conservation, and sea-coast utilization considerations into the objectives of the Seacoast Act (figure 5). The guidelines recommend that benefits from sea-coast works projects should be quantified into monetary values as much as possible based on probabilities and risks relevant to the following issues:
• Protection of inland properties from flooding by tsunamis and storm surge (expected losses are estimated by multiplying the damage ratio to the value of properties such as buildings, crops, public infrastructure, and so on).
• Prevention or mitigation of damage to land and properties from erosion (the same methodrogy of protection of properties from flooding).
• Prevention or mitigation of damage by blown sands and sea spray on inland proper-ties and crops, and negative effects on daily life such as through additional labor (expected losses are estimated by evaluating the depreciated value of buildings, damaged crops, and labor loads for cleaning).
• Protection of natural environments such as ecosystems and water quality, and the development of better landscape planning (the values of natural landscapes and ecosystems along the sea line are estimated, as are the benefits of implementing projects; the seawater purification function of the beach is also valued).

8 KNOWLEDGE NOTE 6-1
• Utilization of seacoast for activities such as recreation and sea bathing (the values of the expansion of recreation activities, fatigue recovery effects, land development, and so on are estimated)
Specific costs to implement a project—including major initial outlays for the investment effort and maintenance expenses—are estimated. The costs and benefits identified have to be discounted to ensure that current and future effects are comparable. Finally, costs and benefits are compared under the economic efficiency decision criteria, such as net present value (NPV), B/C, or the economic internal rate of return (EIRR).
FIGURE 5: Process of seacoast project from planning to adoption
Source: MLIT.
Necessary to reexamine?
To be adopted?
Eva
luat
ion
Sta
ge
An
alyz
ing
Sta
ge
Pla
nn
ing
Sta
ge
Present situation
Publication of plan and evaluation result
Not adopted
Adoption of the project
Comprehensive and systematic evaluation
– Draft project plan including alternatives– Coordination among stakeholders– Consistency with local development plans– Project adoption criteria
Project planning
– Effectiveness of the project i) Cost/benefit analysis ii) Analysis of non-monetary impacts– Impartiality– Implementation environment
Comprehensive evaluation of the project
No
No
Yes
Yes
Project needs
9Measuring the Cost-effectiveness of Various DRM Measures
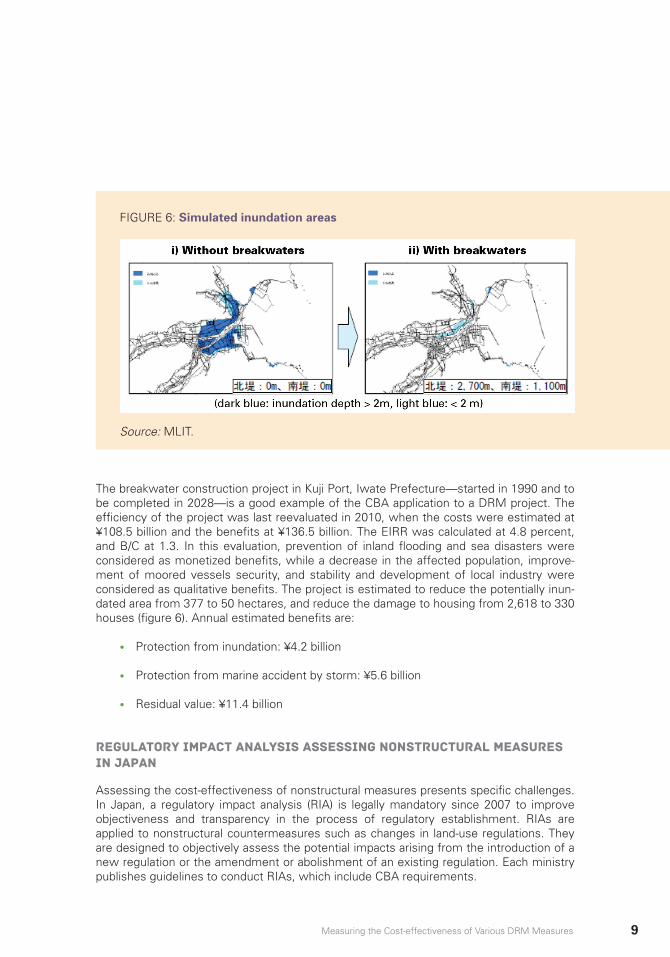
The breakwater construction project in Kuji Port, Iwate Prefecture—started in 1990 and to be completed in 2028—is a good example of the CBA application to a DRM project. The efficiency of the project was last reevaluated in 2010, when the costs were estimated at ¥108.5 billion and the benefits at ¥136.5 billion. The EIRR was calculated at 4.8 percent, and B/C at 1.3. In this evaluation, prevention of inland flooding and sea disasters were considered as monetized benefits, while a decrease in the affected population, improve-ment of moored vessels security, and stability and development of local industry were considered as qualitative benefits. The project is estimated to reduce the potentially inun-dated area from 377 to 50 hectares, and reduce the damage to housing from 2,618 to 330 houses (figure 6). Annual estimated benefits are:
• Protection from inundation: ¥4.2 billion
• Protection from marine accident by storm: ¥5.6 billion
• Residual value: ¥11.4 billion
Regulatory impact analysis assessing nonstructural measures in japan
Assessing the cost-effectiveness of nonstructural measures presents specific challenges. In Japan, a regulatory impact analysis (RIA) is legally mandatory since 2007 to improve objectiveness and transparency in the process of regulatory establishment. RIAs are applied to nonstructural countermeasures such as changes in land-use regulations. They are designed to objectively assess the potential impacts arising from the introduction of a new regulation or the amendment or abolishment of an existing regulation. Each ministry publishes guidelines to conduct RIAs, which include CBA requirements.
FIGURE 6: Simulated inundation areas
Source: MLIT.

10 KNOWLEDGE NOTE 6-1
For example, an RIA was undertaken before the adoption of the Act on Building Commu-nities Resilient to Tsunami in December 2011. The changes in regulations outlined in the act—including new land-use regulations and changes of floor-area-ratios for tsunami-evac-uation buildings in the designated zone—were assessed through the RIA. It was estimated that the benefits from these changes could outweigh the costs of implementation, as they develop more resilient urban areas through increased safety of housing and public facilities in tsunami-exposed areas and construction restrictions for potentially dangerous buildings. For more information on the act, please consult KN 2-7.
The costs considered in the RIA include the costs associated with the approval processes for structures that contribute to tsunami evacuation; the costs of preparing evacuation plans or evacuation drills; and various administrative costs for approval, inspection, or moni-toring of buildings or land use. The benefits, on the other hand, include prevention of inap-propriate development, facilitation of prompt evacuation in case of tsunami disasters, and promotion of adequate maintenance of tsunami-disaster-mitigation facilities—all of which contribute to the protection of lives and the mitigation of damage in tsunami-risk areas. These costs and benefits were considered qualitatively in the RIA.
The MLIT has conducted approximately 50 RIAs since 2007. One was conducted, for example, when the Act on Promotion of Seismic Retrofitting of Buildings was revised in 2005 to add schools, welfare facilities, and buildings for storage or treatment of hazardous objects to those facilities under the guidance of administrative offices, and to establish “retrofitting support centers” nominated by the government.
New approach to evaluating the effectiveness of dual-purpose infrastructure
The Sanriku Expressway being constructed along the sea shore in the tsunami-affected Iwate and Miyagi prefectures contributed to the recovery of this area (KN 1-2-1). But the evaluation of the cost-effectiveness of such redundant infrastructure (that is, a road used as part of a DRM facility) has never been taken into account before in Japan. The Japanese government is now trying to modify its evaluation methodology to include the potential benefits of road projects from the perspective of disaster management and DRM.
Evaluation methodology is used when the MLIT adopts a new road construction project that is expected to be a key route for rescue and relief supplies, materials, and resources for emergency response, and to form a wide range of road networks for DRM. The evalua-tion of the disaster mitigation function involves:
• Necessity evaluation. Clarify why the project is needed based on DRM consider-ations (for example, for transportation of rescue and relief supplies, transportation to emergency medical facilities, and reaching core cities in and around the stricken area).
• Efficiency evaluation. Numerically estimate the level of improvement and eval-uate its priority (for example, improvement of the disaster management function by securing transportation between core cities or within the regional network, like shortening of travel time, dissolution of isolated areas, and so on).

11Measuring the Cost-effectiveness of Various DRM Measures
• Effectiveness evaluation. Compare effectiveness among several alternative plans and similar projects.
LESSONS
CEA and, more in particular, CBA, has several limitations, including the difficulty of accounting for nonmarket values, the lack of accounting for the distribution of benefits and costs, and the issue of choosing the correct discount rate. In addition, CBA of DRM pres-ents additional challenges related to the fact that the planning horizon of DRM measures is typically longer than that of policy makers, and that the occurrence of natural hazards needs to be captured with stochastic methods (Mechler 2005). Conducting probabilistic CBA often proves difficult because of the absence of reliable hazard and vulnerability data. This is perhaps the greatest challenge faced by the DRM community in conducting compre-hensive economic studies of proposed DRM measures in developing countries. Despite limitations, CBA remains the most commonly used tool to analyze the benefits and costs of DRM measures. In a review of the existing literature on CBA of DRM measures in devel-oping countries, a Global Facility for Disaster Reduction and Recovery (GFDRR) study finds a wide variation in methodologies, assumptions, discount rates, and sensitivity analyses, suggesting that DRM analyses are highly context sensitive (GFDRR 2007).
CBA on infrastructure projects has been widely implemented both at national and local levels in Japan. Different procedures have been identified according to the type of project, the funds, and the governing entity responsible. Different type of costs are included in the analysis, such as operational, maintenance, and fiscal costs; also, different types of benefits are accounted for, such as the protection of inland properties and the natural environment or recreational utilization. The Japanese experience shows that CBA is applicable to DRM structural projects and is a useful tool to help choose among different options (higher B/C is one of the variables to be taken into account when making decisions) and to understand the effectiveness of a project/measure. Nonstructural measures, such as land-use regulations and building codes, can be evaluated as well. For example, administration costs and other necessary costs can be compared when deciding among alternative measures.
The use of CBA must be adapted to the type of measure that is being evaluated. Infrastruc-ture and soft measures require different approaches—not only different procedures and calculations, but also different objectives and bottom-line evaluations. It is also important to introduce clear guidelines about how, when, and where to implement CBA. The Japanese experience also proves that sectoral guidelines released by specific ministries are very helpful, as they describe in practical terms each step to be taken when implementing CBA.
While saving lives is the top priority, valuing such lives when assessing the potential bene-fits of different measures is extremely challenging and poses complex ethical and polit-ical questions. But ignoring the value of life implicitly considers people “useless”—and it would be unethical if property is protected but lives are not. For example, background work done for the joint United Nations−World Bank (UN-WB) report Natural Hazards, UnNatural Disasters shows how, if the value of lives saved were ignored, retrofitting buildings in the Turkish district of Atakoy would not be cost-effective, with a B/C lower than 1. Background work done for the report finds that including a value of life of $750,000 in the benefits, however, tips the scale toward retrofitting. And only by including the value of lives saved

12 KNOWLEDGE NOTE 6-1
(at $400,000 each) did earthquake-strengthening measures for apartment buildings and schools in Turkey pass the cost-benefit test (UN-WB 2010). This example shows the limita-tions of CBA. Other techniques such MCA have been explored and could be more accept-able from an ethical perspective. MCAs do not at present offer much help for practical decision making in Japan.
RECOMMENDATIONS FOR DEVELOPING COUNTRIES
Despite its limitations the CBA can be a powerful tool when deciding on and prioritizing DRM measures. It is useful when the issues are complex and there are several competing proposals, and particularly so when comparing alternatives. Nevertheless, considering multiple variables and different objectives at the same time, its use has declined over the years (even at the World Bank).
It is important to set clear rules about when, how, and on what CBA should be performed. Regulatory frameworks, policy procedures, and specific guidelines (possibly at sectoral levels), overseen by specific ministries, can certainly improve the implementation of CBA for DRM.
Connections between decision making and CBA must be clear. CBA can be one informative input, or one of the main variables in decision making. Any decisions should be transparent and reviewed regularly. In the Japanese context, project appraisal committees consisting of external experts and academics evaluate the projects before their adoption, and then reassess their effectiveness to secure transparency and accountability in decision making.
KEY REFERENCES
Cabinet Office, Government of Japan. 2011. “White Paper on Disaster Management 2011 (in Japanese).”
Central Disaster Management Council, Japan. 2011. Report of the Committee for Tech-nical Investigation on Countermeasures for Earthquakes and Tsunamis Based on the Lessons Learned from the “2011 Earthquake off the Pacific Coast of Tohoku.”
Fire and Disaster Management Agency, Japan. 2011. Report of the Study on Fulfillment and Improvement of Earthquake and Tsunami Disaster Reduction in Regional Disaster Prevention Plans (in Japanese) .
GFDRR (Global Facility for Disaster Reduction and Recovery). 2007. “A Reference Paper on Benefit-Cost Studies on Disaster Risk Reduction in Developing Countries.”
Mechler, R. 2005. “Cost-Benefit Analysis of Natural Disaster Risk Management in Devel-oping Countries.” GTZ.
MLIT (Ministry of Land, Infrastructure, Transport, and Tourism, Japan). 2009. “Guidelines for Assessment of MLIT Policy on Regulatory Impact Analysis (in Japanese).”
13Measuring the Cost-effectiveness of Various DRM Measures
MLIT and Ministry of Agriculture, Forestry, and Fisheries, Japan. 2004. “Guidelines for Cost-Benefit Analysis in Seacoast Works (in Japanese).”
Onishi, T. 2012. “What Lessons We Should Learn from the Great East Japan Disaster?” Presentation. The 5th GEOSS Asia Pacific Symposium. April 2. Tokyo, Japan.
UN-WB (United Nations—World Bank). 2010. Natural Hazards, UnNatural Disasters: The Economics of Effective Prevention.
Yamamoto, C., and K. Sato. 2007. “Feasibility Studies under the System for Evaluating Government Policies in Japan.” Presentation. Improving Pubulic Expenditure Manage-ment for Large-Scale Projects: Focusing on a Feasibility Study. May 22–23. Seoul, Korea.

1Earthquake Risk Insurance
KNOWLEDGE NOTE 6-2CLUSTER 6: The economics of disaster risk, risk management, and risk financing
Earthquake Risk Insurance

2 KNOWLEDGE NOTE 6-2
Prepared by Olivier Mahul and Emily White, World Bank
3Earthquake Risk Insurance
Earthquake Risk Insurance
The March 2011 earthquake that hit East Japan was the fourth-largest ever recorded. It was not only a human tragedy but an economic shock with losses estimated in excess of ¥16,900 billion, making it the costliest disaster in history. Despite this, the Japanese insurance industry is expected to emerge without significant financial impairment, thanks to a well-developed residential earthquake risk insurance dual program (with private nonlife insurers and cooperative mutual insurers) based on conservative control of insurers’ liabilities (through insurance policy structures and reinsurance). Meanwhile, more than half of Japanese homeowners are still unin-sured, creating a significant fiscal burden for the government.
FINDINGS
Residential earthquake insurance: A dual program with carefully controlled liabilities
Residential earthquake insurance coverage in Japan relies on two major actors: nonlife private insurers and cooperative mutual insurers. Despite major differences in their finan-cial management of earthquake risk, these two insurance systems demonstrated their efficiency in claims settlements and their financial viability after the Great East Japan Earth-quake (GEJE). Table 1 compares the residential earthquake insurance scheme offered by the private nonlife insurance companies with the scheme offered by the largest cooperative mutual insurer, the National Mutual Insurance Federation of Agricultural Cooperatives (also known as JA Kyosai*). While the perils covered, assets covered, and extent of coverage are similar across the two programs, earthquake coverage is offered on a voluntary basis with risk-based premium rates by private insurers, and on an automatic basis with flat rates by cooperative mutual insurers.
Both programs are based on conservative control of insurers’ liabilities. In both programs, the claims payments are not intended to provide complete coverage: the maximum
KNOWLEDGE NOTE 6-2CLUSTER 6: The economics of disaster risk, risk management, and risk financing
* Also known as Zenkyoren.

4 KNOWLEDGE NOTE 6-2
coverage is limited at 50 percent of the fire insurance amount (subject to upper limits). Like-wise, both programs rely on sophisticated reinsurance strategies. The reinsurance protec-tion of the private insurance scheme relies on a catastrophe insurance pooling mechanism, the Japanese Earthquake Reinsurance Co. (JER), backed by the government of Japan. In contrast, reinsurance protection for cooperative mutual insurers is provided by the inter-national reinsurance and capital markets, with no government intervention. In both cases, the use of reinsurance serves to limit the liability of the private or cooperative risk carriers.
Penetration under the private nonlife insurance program is estimated at about 25 percent of Japanese households, with just under 13 million residential earthquake insurance policies in force: an estimated 48 percent of all fire insurance policies in force include earthquake coverage. Cooperative mutual insurance programs cover about 14 percent of Japanese households, so that total penetration is estimated at 39 percent.† JA Kyosai holds a very large share of the cooperative mutual insurer market, with 5.4 million households holding building endowment policies covering residential earthquake risk (11 percent of total Japa-nese households). The cooperative mutual insurer Zenrosai has an additional 1.7 million
TABLE 1: The dual residential earthquake insurance system in Japan
Private non-life insurersCooperative mutual insurer
JA Kyosai
Perils covered Earthquake, volcanic eruption, tsunami
Earthquake, volcanic eruption, tsunami
Assets covered Residential dwelling and content
Residential dwelling and content
Extent of coverage 30–50 percent of fire insurance amount with limits
Up to 50 percent of fire insurance amount with limits
Coverage purchase Optional endorsement to residential fire insurance policy
Automatically included in building endowment policy
Premium rate Risk-based rates (by risk zone and type of construction)
Flat rates (wooden/nonwooden)
Reinsurance Japan Earthquake Reinsurance Co. (JER) and Japanese government
International reinsurance and capital markets
Loss adjustment 3-step system Proportional system
Penetration of earthquake coverage (percent households)
25% 11%
† The number of households is estimated at about 51 million (Government of Japan, Statistics Bureau). Policy-in-force data from the Japanese Non-Life Insurance Rating Organization (2010), JA Kyosai Business Operations (2011), and Zenrosai Annual Report (2010). Cooperative mutual insurer figures extrapolated based on 85 percent estimate of the JA Kyosai market share.

5Earthquake Risk Insurance
Liability of government
Liability of JER
Liability of insurance companies
¥115billion
¥871billion
¥5,500billion,220-yearreturnperiod ¥4,397.55
billion
¥378billion
¥115.7billion
¥115.75billion
¥305.7billion
¥115 billion
¥72.3 billion
FIGURE 1: Japanese earthquake reinsurance program (as of May 2011)
Source: JER 2011a.
natural disaster policies covering residential earthquake risk, accounting for a further 3 percent of total Japanese households.
Private nonlife insurance companies and the Japanese earthquake reinsurance company
Earthquake insurance offered by private nonlife insurance companies is available as an optional endorsement to fire insurance policies. Earthquake coverage is available at policy limits of 30 percent to 50 percent of the fire insurance limit, with maximum limits of ¥50 million per dwelling and ¥10 million for personal property.
A three-step claims settlement allows for rapid damage assessment and claims settle-ment. Payouts are not proportional to damage, but based on a three-step system: total loss, half loss, and partial loss—which allow for 100 percent, 50 percent, and 5 percent of the earthquake insurance policy limit, respectively.
The premium rates are risk based, and vary according to the prefecture where the dwelling is located (divided into eight risk zones) and type of construction (wooden or nonwooden). For an insured amount of ¥10 million, the annual premium varies between ¥5,000 for a nonwooden structure in Nagazaki Prefecture, and ¥31,300 for a wooden structure in Tokyo. Discount rates of up to 30 percent apply when the building is earthquake resistant, according to the Japanese Housing Performance Designation Standards, including a 10 percent discount for buildings constructed after 1981. The premium rates, calculated by the Non-Life Insurance Rating Organization, consist of the pure premium rate and a loading

6 KNOWLEDGE NOTE 6-2
factor. It should be noted that the rates do not include any loading for profit since the program is not for profit. Despite this rating and because of Japan’s considerable earth-quake exposure, rates are still considered high.
The 1966 Earthquake Insurance Law (enacted after the Niigata earthquake of 1964) estab-lished the JER, to whom private nonlife insurers were obliged to offer earthquake insur-ance and cede 100 percent of the earthquake premium and liabilities. The JER thus acts as the sole earthquake reinsurer for the private insurance market. The JER can be seen as an earthquake reinsurance pool, retaining a portion of the liability and ceding the rest back to private insurers (based on their market share) and to the Japanese government through reinsurance treaties. The reinsurance program is designed such that the liability of private insurers and the JER itself does not exceed the accumulated reserves from earthquake insurance premiums. Figure 1 describes the Japanese earthquake reinsurance program as revised in May 2011 after the GEJE. The total claims-paying capacity of the program is currently ¥5,500 billion, which is estimated to correspond to the scenario of the 1923 Great Kanto earthquake with a return period of 220 years.‡ Should insured earthquake losses exceed this amount, claims would be prorated.
The role of the Japanese government is central to the program. The maximum liability of the government of Japan, JER, and private insurers is 87 percent, 10 percent, and 3 percent, respectively. It should be noted that under the previous reinsurance program (before May 2011), the government’s liability was only 78 percent, and the rest was shared equally between the JER and private insurers. The revision of the reinsurance program, leading to an increase of the government’s liability share, is the direct consequence of a depletion of the earthquake reserves of both the JER and private insurers after the GEJE.
Japanese accounting standards allow the insurers to build up preevent catastrophe reserves (by accumulating the earthquake insurance premiums received, less expenses and any underwriting gains and investment income) over time with separate resources to pay claims, the size of which is based on the probable maximum loss of the insurer’s portfolio. Likewise, the government of Japan has set up a special account to accumulate its reserves. Table 2 shows the amount of reserves at end of fiscal years 2010—that is, before the GEJE. The GEJE wiped out about half of the program’s earthquake reserves.
‡ The total claims-paying capacity of the program will increase to ¥6.2 billion in 2012 (Ministry of Finance 2012).
TABLE 2: Reserves under the earthquake insurance program
Source: JER 2011a.
¥ billion End of fiscal year 2010
Government 1,343
JER 424
Private insurers 489
Total 2,256

7Earthquake Risk Insurance
It is noteworthy that the total reserves supporting the Japanese Earthquake Reinsur-ance Program, even before the GEJE, represent only a fraction of the liability of all stake-holders. The size of this potential gap is largely due to the government’s reserve-to-liability ratio under the program, which appears low. In case of a major earthquake exceeding the reserves available, it would be critical to immediately mobilize additional resources to ensure the financial solvability of the program.
Cooperative mutual insurers
Residential earthquake insurance is also available through cooperative mutual insurers. These insurers conduct insurance operations on behalf of Japan’s cooperative societies. The largest of these cooperatives is JA Kyosai, which holds an estimated 85 percent market share of all the homeowners insurance written through cooperative mutual insurers. Like any cooperative, JA Kyosai operates on a nonprofit basis. Its insurance products are different from those of private insurers. Cooperative mutual insurers offer building endow-ment policies: these policies offer more comprehensive coverage than the policies avail-able through the private insurers and can therefore be seen as a savings mechanism that provides funding for home repairs, whether caused by natural disasters or other adverse events. The five-year (or longer) term policy automatically covers residential dwellings and personal property from damage caused by fire, flood, earthquakes, and other natural disas-ters. If the policy expires and the policyholder has not claimed a total loss, he or she is entitled to a partial refund of the premium. At the start of 2011, JA Kyosai’s client base comprised more than 11 million building endowment policies.
Earthquake insurance is automatically included in the building endowment policies offered by JA Kyosai. The policy limit is 50 percent of the fire insurance limit, up to ¥250 million. The average fire insurance amount is ¥30 million, hence the average earthquake insurance limit is ¥15 million.
Under the building endowment policy available through JA Kyosai, the claims settlement process in case of an earthquake is proportional: a loss assessor estimates the damage percentage of the house, and this rate is applied to the earthquake policy limit.
The premium rate is flat, that is, the same wherever the dwelling is located. It only differs according to whether the building is a wooden or nonwooden structure.
Cooperative mutual insurers are not subject to the Earthquake Insurance Law and do not participate in the JER. They work outside the nonlife insurance regulatory framework and are instead accountable to their respective ministries; for example, JA Kyosai reports to the Ministry of Agriculture, Forestry, and Fisheries. In contrast to private nonlife insurers, cooperative mutual insurers cede a significant portion of their liabilities to the interna-tional reinsurance market. JA Kyosai is known to have one of the largest reinsurance programs in the world, with reinsurance capacity in excess of ¥75 billion. Its large and well-diversified asset base also allows it to retain a significant portion of its liability. In addition to traditional reinsurance, JA Kyosai has issued catastrophe (Cat) bonds to better spread its risk (see box 1).
8 KNOWLEDGE NOTE 6-2
Industrial and commercial earthquake insurance
Traditionally, industrial and commercial earthquake insurance has been issued as a reduced indemnity policy, which provides limited coverage on a proportional basis. The extent of the coverage depends on the location of the asset, for which the country has been divided into 12 risk zones. The indemnity limit varies from 15 percent in Tokyo up to 100 percent in Niigata. Following the enactment of the Insurance Business Law in 1996, which largely deregulated the insurance market in Japan, insurance policies on a first-loss basis were also offered, which generated a significant increase in the sum insured (the maximum amount that could be paid out). Loss of revenue and business interruptions caused by earthquakes have not traditionally been marketed and have low penetration rates.
Other classes include earthquake fire expense insurance. This is a limited amount for fire following an earthquake, which is provided automatically with some insurance policies, such as the storekeepers’ comprehensive policy. The coverage is limited to 5 percent of the fire sum insured, up to certain fixed limits. Other insurance policies that generally include earthquake coverage are cargo insurance, motor insurance, and engineering insurance.
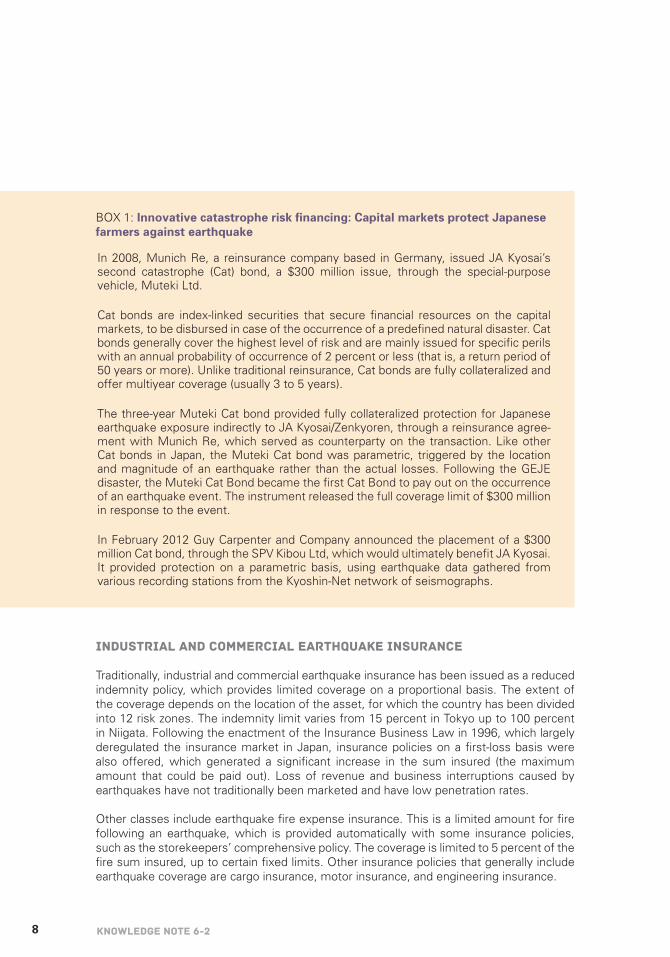
BOX 1: Innovative catastrophe risk financing: Capital markets protect Japanese farmers against earthquake
In 2008, Munich Re, a reinsurance company based in Germany, issued JA Kyosai’s second catastrophe (Cat) bond, a $300 million issue, through the special-purpose vehicle, Muteki Ltd.
Cat bonds are index-linked securities that secure financial resources on the capital markets, to be disbursed in case of the occurrence of a predefined natural disaster. Cat bonds generally cover the highest level of risk and are mainly issued for specific perils with an annual probability of occurrence of 2 percent or less (that is, a return period of 50 years or more). Unlike traditional reinsurance, Cat bonds are fully collateralized and offer multiyear coverage (usually 3 to 5 years).
The three-year Muteki Cat bond provided fully collateralized protection for Japanese earthquake exposure indirectly to JA Kyosai/Zenkyoren, through a reinsurance agree-ment with Munich Re, which served as counterparty on the transaction. Like other Cat bonds in Japan, the Muteki Cat bond was parametric, triggered by the location and magnitude of an earthquake rather than the actual losses. Following the GEJE disaster, the Muteki Cat Bond became the first Cat Bond to pay out on the occurrence of an earthquake event. The instrument released the full coverage limit of $300 million in response to the event.
In February 2012 Guy Carpenter and Company announced the placement of a $300 million Cat bond, through the SPV Kibou Ltd, which would ultimately benefit JA Kyosai. It provided protection on a parametric basis, using earthquake data gathered from various recording stations from the Kyoshin-Net network of seismographs.
9Earthquake Risk Insurance
Economic and insured losses
The GEJE caused major direct economic losses, with current estimates of ¥16,900 billion (KN 6-1). Private (residential, commercial, and industrial) buildings represented 62 percent, and public infrastructure represented 13 percent of the (direct) economic losses (see annex 1). Insured losses were estimated at ¥2,750 billion, or 16 percent of total economic losses. Residential assets represented 78 percent of insured losses. Fifty-six percent of the resi-dential insured losses were covered by private insurers and the JER, and 44 percent were covered by cooperative mutual insurers (see annex 1).
Despite significant differences, both private and mutual residential earthquake insur-ance programs had adequate capacity to meet their claims obligations, thanks to efficient management of exposure to losses through a combination of policy limits and reinsurance protection. The earthquake insurance program managed by the private nonlife insurance companies faced an estimated total loss of ¥1,200 billion, with 42 percent retained by private insurers, 13 percent retained by the JER, and 45 percent retained by the govern-ment. This event, however, severely depleted the earthquake reserves of both the private insurers and JER, leading to an increase in government liability in the revised reinsurance program of 2012. Earthquake losses incurred by JA Kyosai were estimated at ¥830 billion, 90 percent of which were residential losses. It is estimated that about 58 percent of those losses were reinsured.
The three-step earthquake claims settlement system implemented by the private insur-ance companies allowed claims to be settled rapidly. Satellite images were also used to identify total losses on buildings, which helped further speed up claims settlements. In the aftermath of the disaster, the General Insurance Association of Japan designated specific total loss zones, based on satellite imagery (KN 5-2). Any total loss claims filed within these areas did not require additional confirmation of incurred losses, thereby speeding up the payout process. Out of ¥1,200 billion generated by the 741,000 claim payments made after the GEJE, 60 percent were paid within two months and 90 percent within five months.
Comparative analysis of the GEJE with other recent earthquakes
It is interesting to compare the economic and fiscal impact of the GEJE with the impact of other recent earthquakes: the 2010 earthquake in Chile and the 2011 earthquakes in Canter-bury, New Zealand. All three earthquakes were very large in magnitude and caused severe economic losses in their countries. Table 3 summarizes this comparative analysis. While the GEJE caused the largest economic losses in absolute terms, losses as a percentage of gross domestic products (GDP) are lower than those in Chile and New Zealand given the size of the Japanese economy. The government’s portion of direct losses (that is, addi-tional expenditures), expressed as a percentage of total government expenditures, were estimated at 8 percent for the GEJE and 11 percent for the Canterbury earthquake in New Zealand. Finally, the fraction of the insured losses covered by international reinsurance was estimated at 95 percent in Chile, 29 percent in New Zealand (where the Earthquake Commission EQC retained a large fraction of the losses), and 23 percent in Japan. This last figure hides a large difference between the JER, which relies on public reinsurance and cooperative mutual insurers, such JA Kyosai, that purchase most of their reinsurance capacity abroad.

10 KNOWLEDGE NOTE 6-2
LESSONS
Some key lessons can be drawn from the review of Japan’s earthquake insurance programs in the light of the GEJE:
• No one-size-fits-all. The dual earthquake insurance programs in Japan illustrate that there is no one-size-fits-all catastrophe insurance program. Two very different schemes can coexist successfully within a country significantly exposed to earth-quakes, offering earthquake coverage to about four households out of ten in Japan.
• Resilience is critical for earthquake insurance programs. Both programs managed to fulfill their obligations after the GEJE without difficulties, because of the sound management of policy limits and conservative reinsurance coverage. The apparent resilience of the current setup does not mean, however, that there is no room for these schemes to improve without compromising sustainability. For example, the earthquake insurance limit offered by JA Kyosai started at 10 percent and has increased progressively to 50 percent currently.
TABLE 2: Comparative analysis of the Tohoku (GEJE), Canterbury, and Maule earthquakes
Source: Swiss Re 2011; Ain Benfield 2011; Ministry of Finance Japan 2012; New Zealand Treasury 2011; RMS 2011.
Note: Direct economic losses are defined as damage to physical assets (including infrastructure).
Tohoku, JapanCanterbury,
New Zealand Maule, Chile
Year 2011 2011 2010
Magnitude 9.0 6.3 8.8
Estimate direct economic losses ($ billion)
225 15 20
Estimated direct economic losses (% GDP)
4 9 9
Estimated direct losses borne by government (as % of government expenditures)
8 11 n/a
Estimated insured losses (% of direct economic losses)
16 80 40
Estimated insured losses covered by international rein-surance
23 73 95

11Earthquake Risk Insurance
• Rapid claims settlement can be achieved, even after a major disaster. The three-step claims adjustment system implemented by the private insurers allows for rapid damage assessment and claims settlement. It also takes into account that, immediately after a major disaster, large numbers of loss assessors have to be deployed at the same time. The simplicity of the three-step system allows this to happen.
• Insurance penetration in Japan is high, but there is still considerable room for expansion. About 40 percent of Japanese households have earthquake insurance coverage, leaving 60 percent of households without coverage. International experi-ence shows that it is very difficult, if not impossible, to increase the penetration rate beyond a certain level on a voluntary basis. Compulsory earthquake insurance could therefore be considered.
The GEJE also highlighted certain challenges of earthquake insurance programs run by private insurance companies:
• The JER claims-paying capacity is limited in the aggregate. The aggregate limit is currently set at ¥5,500 billion (to be increased to ¥6,200 billion in 2012), which would be sufficient for a major earthquake such as the Great Kanto earthquake in 1923. But this does not take into account the occurrence of consecutive major earthquakes, which could jeopardize the solvency of the program.
• The government’s liability under the JER exceeds its ex-ante financing arrange-ments. The government’s maximum liability is adjusted based on the balance of earthquake reserves of the private insurers and the JER and the maximum defined liability under the program. The government currently holds 87 percent of the total liability of the program. Its current special account would not be sufficient to cover this level of liability and would require an immediate budget appropriation or real-location in case of a major disaster.
• Limited policy coverage may not meet the needs of the insured. The program is designed to provide partial coverage (up to 50 percent of the fire insurance coverage limit) to “stabilize the livelihood of the earthquake victims” (article 1 of the 1966 Earthquake Insurance Law). There seems to be a growing demand for higher coverage, but such an increase in coverage should be carefully evaluated to maintain the financial sustainability of the system.
• The claims settlement process introduces significant basis risk and could be revised. Although the three-step claims adjustment process allows for rapid settle-ment of claims, there is a big gap between payouts for partial loss (5 percent) and half loss (50 percent). This increases the risk that payments will not match the needs of the insured party following the occurrence of damage (basis risk). A fourth intermediate step could be introduced to reduce this risk.
• Catastrophe risk modeling for Japan is sophisticated, but could be improved. State-of-the-art catastrophe risk models have been developed for Japan, but need to be further refined as secondary loss perils such as tsunamis (which caused about 30 percent of the total losses from the GEJE) and liquefaction are not included

12 KNOWLEDGE NOTE 6-2
as standard in all models. These models could also be used to further assess the catastrophe risk exposure of public buildings and infrastructures.
RECOMMENDATIONS FOR DEVELOPING COUNTRIES
Developing viable and affordable catastrophe risk insurance programs
Japanese earthquake insurance programs demonstrated considerable resilience after the GEJE. From this experience, recommendations can be made to disaster-prone developing countries willing to promote catastrophe risk insurance to help them promote viable and affordable programs and clearly define the role of the government in public-private partner-ships (PPPs).
Structure policies to allow for sustainable and affordable programs. Catastrophe risk insurance policies should be designed to enable insurance companies control their liabili-ties and offer affordable coverage. The policy structure can be revised over time to better respond to the needs of the policyholders, while also ensuring the system’s resilience to major disasters. The partial coverage produced by both Japanese earthquake insurance programs and the simplified loss adjustment process of the private insurer system help to keep costs down.
Price insurance premiums based on the underlying risks. Insurance premiums should reflect the underlying risks with respect to the various risk zones and types of construction. Risk-based insurance premiums make policyholders aware of the underlying cost of risk, thereby providing financial incentives to engage in disaster risk mitigation. Even in cases where the full cost of cover is not passed onto the policyholder, it is still possible to signal the underlying cost of risk by making subsidies transparent.
Provide incentives to invest in disaster risk mitigation. Additional financial incentives, such as discounts on premium rates or lower deductibles, can be offered to the policy-holders who invest in risk reduction.
Consider mechanisms for enforcing insurance purchase. Voluntary catastrophe risk insurance does not typically generate high penetration rates, even in highly developed insurance markets. Some type of compulsory mechanism, such as an automatic catas-trophe guarantee in fire insurance policies, may be necessary to ensure that a large propor-tion of the population is insured against natural disasters.
Promote multiple-catastrophe risk insurance delivery channels. Catastrophe risk insurance should leverage existing nonlife insurance delivery channels, such as private insurers or mutual insurers. The Japanese system demonstrates that different segments of the population may be best served by different delivery channels, even for very similar products. Multiple distribution channels for catastrophe risk insurance should therefore be explored.

13Earthquake Risk Insurance
Develop detailed catastrophe risk models. Detailed catastrophe risk models and data-bases are essential for detailed risk assessment, premium rate calculation, and efficient management of catastrophe risk insurance liabilities. In addition to a strong hazard model, such assessments also require detailed exposure databases of at-risk assets (buildings and infrastructure) and detailed vulnerability functions to translate hazard values into dollar losses. These models are typically developed by private risk modeling firms and licensed to the insurance industry. But for some less-developed insurance markets, governments and donors have funded or partially funded the development of such models as public goods to support market development.
Develop catastrophe risk insurance market infrastructure. Catastrophe risk insurance markets require major investments in basic infrastructure, such as catastrophe risk models, exposure databases, product design and pricing, and the like. Governments can play a major role in developing this kind of infrastructure to help the private insurance industry can offer cost-effective and affordable insurance solutions.
Promote enabling legal and regulatory environments. Unlike traditional lines of insur-ance business such as automobile insurance, catastrophe risk insurance can generate large correlated losses for insurers. The legal and regulatory framework should enforce adequate pricing, reserving, and reinsurance buying to ensure that insurers will meet their claims in full in the event of a disaster.
Promote PPPs for catastrophe insurance programs. Governments can play an important role in building an affordable and sustainable earthquake insurance program. As the private insurance sector brings its technical expertise and financial capacity to the table, govern-ments can support the development of public goods and risk-market infrastructure to foster sustainable market-based insurance solutions.
Governments can play a role as the financier of last resort. Governments may want to act as financiers of last resort when private reinsurance capacity is unavailable or too expensive to allow domestic insurers to offer cost-effective insurance solutions. Govern-ments should not compete with the private reinsurance market but rather complement it. When needed, governments should make financial capacity available to domestic insurers through public reinsurance or (contingent) credit.
14 KNOWLEDGE NOTE 6-2
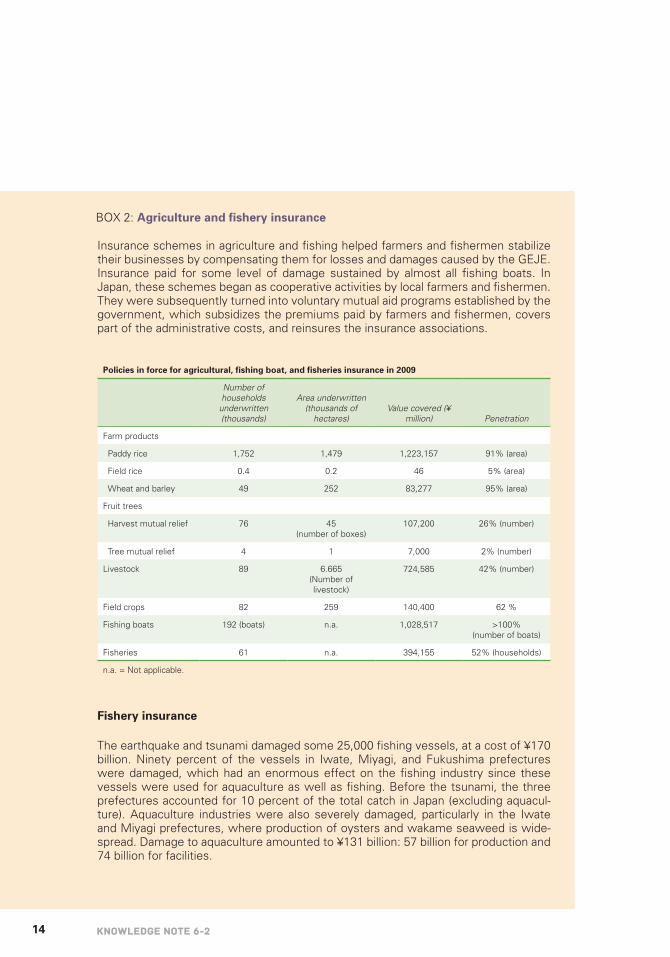
Insurance schemes in agriculture and fishing helped farmers and fishermen stabilize their businesses by compensating them for losses and damages caused by the GEJE. Insurance paid for some level of damage sustained by almost all fishing boats. In Japan, these schemes began as cooperative activities by local farmers and fishermen. They were subsequently turned into voluntary mutual aid programs established by the government, which subsidizes the premiums paid by farmers and fishermen, covers part of the administrative costs, and reinsures the insurance associations.
Fishery insurance
The earthquake and tsunami damaged some 25,000 fishing vessels, at a cost of ¥170 billion. Ninety percent of the vessels in Iwate, Miyagi, and Fukushima prefectures were damaged, which had an enormous effect on the fishing industry since these vessels were used for aquaculture as well as fishing. Before the tsunami, the three prefectures accounted for 10 percent of the total catch in Japan (excluding aquacul-ture). Aquaculture industries were also severely damaged, particularly in the Iwate and Miyagi prefectures, where production of oysters and wakame seaweed is wide-spread. Damage to aquaculture amounted to ¥131 billion: 57 billion for production and 74 billion for facilities.
Policies in force for agricultural, fishing boat, and fisheries insurance in 2009
Number of households
underwritten (thousands)
Area underwritten (thousands of
hectares)Value covered (¥
million) Penetration
Farm products
Paddy rice 1,752 1,479 1,223,157 91% (area)
Field rice 0.4 0.2 46 5% (area)
Wheat and barley 49 252 83,277 95% (area)
Fruit trees
Harvest mutual relief 76 45 (number of boxes)
107,200 26% (number)
Tree mutual relief 4 1 7,000 2% (number)
Livestock 89 6.665 (Number of livestock)
724,585 42% (number)
Field crops 82 259 140,400 62 %
Fishing boats 192 (boats) n.a. 1,028,517 >100% (number of boats)
Fisheries 61 n.a. 394,155 52% (households)
n.a. = Not applicable.
BOX 2: Agriculture and fishery insurance

15Earthquake Risk Insurance
BOX 2 ,CONTINUED
The fisheries insurance system in Japan is well organized, providing essential insur-ance services at a reasonable cost to all fishermen including small-scale producers. The fishing vessel insurance system, which was established in 1952 under the Fishing Vessel Damage Compensation Law, aims at stabilizing fishing businesses by covering the loss of and damages to their fishing vessels. The system includes the following insurances:
• Fishing vessel insurance covering basic damage caused by accidents and disas-ters, and including special insurance for damage caused by war and seizure.
• Protection and indemnity insurance covering compensation for the crew and damages incurred during navigation.
• Owner-operator insurance covering the death of owner-operators.
• Cargo insurance covering the loss of catches or cargo.
• Pleasure boat insurance covering compensation, rescue costs, and damages.
• Transshipped catches insurance.
• Crew salary insurance covering crew salaries if vessels are seized.
The fisheries mutual insurance scheme, which was established in 1964 under the Fish-eries Disaster Compensation Law, aims at stabilizing small- and medium-size fishing and aquaculture operations by covering losses from poor catches caused by natural disasters. The system insures fish harvests, aquaculture, special aquaculture, and fishing gear.
The government subsidizes one-third to one-half of the premium. While fishing vessel insurance enjoyed a surplus of ¥16.5 billion in 2010, the Fisheries Mutual Insurance Scheme suffered a deficit of ¥28.9 billion.
Fishing vessel insurance system
Fisheries mutual insurance scheme Total
Government 72.7 (78%) 21.3 (77%) 94.0 (78%)
Reserve of government special account 11.0 (12%) — 11.0 (9%)
Associations at national level 1.4 (2%) 3.0 (11%) 4.4 (4%)
Associations 7.8 (8%) 3.2 (12%) 11.0 (9%)
Total 92.9 (100%) 27.5 (100%) 120.4 (100%)

16 KNOWLEDGE NOTE 6-2
BOX 2 ,CONTINUED
The Ministry of Agriculture, Fishery, and Forests estimates that total claims would amount to ¥120.4 billion, of which the central government will cover ¥94 billion, or 78 percent for the GEJE. As of March 13, 2012, ¥63.4 billion in claims have been paid out: ¥47.5 billion under the fishing vessel insurance system, and ¥15.9 billion under the fisheries mutual insurance scheme. Sixty percent of vessels were insured under the vessel insurance scheme, of which some 80 percent of boats were over 20 tones. Some 80 percent of the insured vessels were more than 15 years old. Since the schemes cover the residual value of the vessels, the claims paid out may not cover the replacement costs.
Agriculture insurance
Damage to agricultural production and facilities from the GEJE event amounted to ¥63 billion. Rice is an important crop in Japan, but because the GEJE happened before the rice-growing season, insurance almost did not cover rice production losses. Since compensation related to the accident at the Fukushima Nuclear Power Plant has not yet been decided, the total payout on agricultural insurance is uncertain. In Miyagi Prefecture, the agricultural insurance scheme has covered damages to greenhouses in the amount of ¥1billion.
The Farm Losses Compensation Law introduced the agricultural insurance scheme in 1947 to help farmers stabilize their businesses by covering damages caused by natural disasters; the scheme offers insurance coverage for almost all major agricultural prod-ucts. It was started by local farmers as a cooperative initiative to set up a reserve fund

17Earthquake Risk Insurance
BOX 2 ,CONTINUED
to pay for insurance premiums, which evolved into agricultural mutual relief associa-tions. The insurance scheme includes: rice, wheat, and barley insurance (mandatory for paddy fields of more than 20 hectares); livestock insurance; fruit and fruit tree insurance; field crop and horticultural insurance; greenhouse insurance; and houses and properties. The government subsidizes half of farmers’ premiums.
Prepared by Mikio Ishiwatari, World Bank.
REFERENCES
Benfield, Aon. 2011. “Earthquake Insurance Business in Japan.” December 2011.
General Insurance Association of Japan. 2011. Annual Report 2010−2011.
JA Kyosai. 2011. Annual Report 2010, Business Operations.
Japan Credit Rating Agency Ltd. 2011. “JCR Affirmed AAp/Stable on Japan Earthquake Reinsurance.” December 28.
JER (Japan Earthquake Reinsurance Co., Ltd). 2011a. Annual Report 2011.
———. 2011b. “Response to the Great East Japan Earthquake by the General Insurance Industry.” Presentation, World Forum, Jamaica, October 25−26, 2011.
McAllister, S., and E. Cohen. 2011. “Japanese Casualty Insurers Show Resilience.” www.contingencies.org.
Muir-Wood, R. 2011. “Designing Optimal Risk Mitigation and Risk Transfer Mechanisms to Improve the Management of Earthquake Risk in Chile.” OECD Working Papers on Finance, Insurance and Private Pensions No. 12, Organisation for Economic Co-opera-tion and Development, Paris.
Non-Life Insurance Rating Organization of Japan. 2011. www.nliro.or.jp.
SCOR Global P&C. 2011. Technical Newsletters, December and October 2011.
Swiss Re. 2012. “Lessons from Major Earthquakes.” Economic Research and Consulting, January 2012.
Zenrosai. 2011. Annual Report 2010.
18 KNOWLEDGE NOTE 6-2
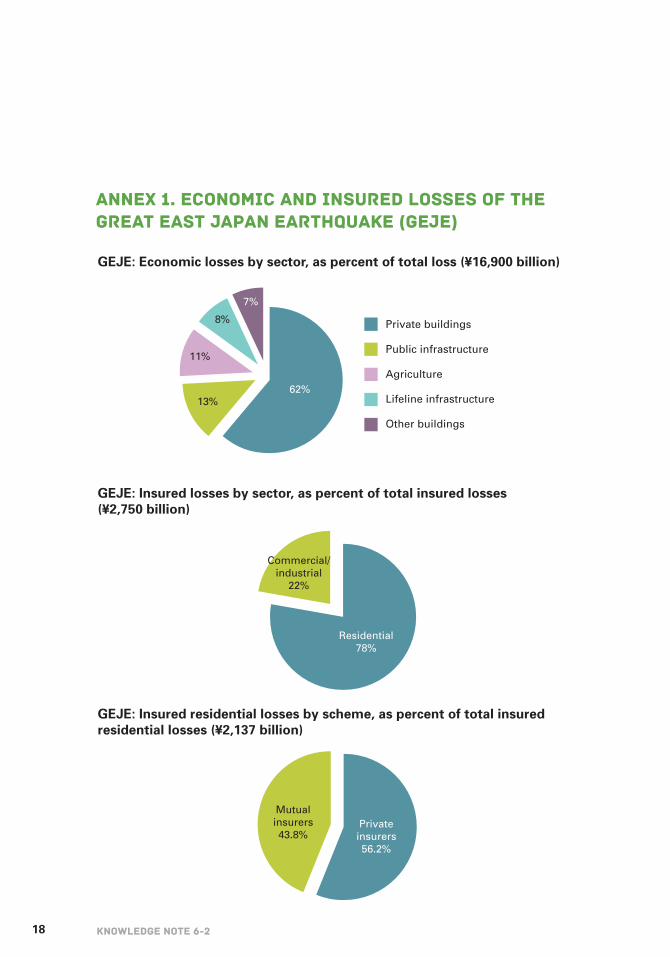
Annex 1. Economic and insured losses of the Great East Japan Earthquake (GEJE)
GEJE: Economic losses by sector, as percent of total loss (¥16,900 billion)
GEJE: Insured losses by sector, as percent of total insured losses(¥2,750 billion)
GEJE: Insured residential losses by scheme, as percent of total insuredresidential losses (¥2,137 billion)
Mutualinsurers43.8%
Privateinsurers56.2%
Commercial/industrial
22%
Residential78%
62%
7%
8%
11%
13%
Private buildings
Public infrastructure
Agriculture
Lifeline infrastructure
Other buildings

19Earthquake Risk Insurance
Annex 2. Estimated GEJE insured residential losses, by earthquake insurance program
GEJE: JER earthquake insurance claims (¥1,200 billion)
GEJE: JA Kyosai earthquake insurance claims (¥830 billion)
Government45.2%
Insurers42.0%
JER12.8%
Retention42%
Reinsurance58%

1Economic Impacts
KNOWLEDGE NOTE 6-3CLUSTER 6: The economics of disaster risk, risk management, and risk financing
Economic Impacts

2 KNOWLEDGE NOTE 6-3
Prepared by Masafumi Fujita, Research Institute of Economy, Trade and Industry; and Hamaguchi Nobuaki, Kobe University (on global supply chain); Financial Service Agency (on the double debt problem); and Junko Sagara, CTI Engineering; with contributions from Bianca Adam, World Bank.
3Economic Impacts
Economic Impacts
Following the Great East Japan Earthquake (GEJE), the government of Japan responded promptly to stabilize markets and ensure a swift recovery. Economic activity has since started picking up, thanks in part to domestic demand driven by the massive reconstruction effort. Uncertainties remain, however, surrounding the restructuring of power supply and both national and global economic prospects. The year 2011 will be remembered for the severe challenges to the global supply chain posed by the GEJE and the Thai flood. As an important part of the networked production system, developing countries must share responsibility in making the supply chain more resilient under international cooperation.
FINDINGS
Following the GEJE, the government of Japan initially estimated the direct damages between ¥16 trillion and ¥25 trillion (see box 1). The Cabinet Office (CAO) later put esti-mated damages at ¥16.9 trillion ($210 billion), or about 4 percent of Japan’s gross domestic product (GDP). Before the disasters, approximately two-thirds of nonfinancial assets were held by the private sector. This is in line with the breakdown of the direct damage figures released by the CAO (table 1).
Most of the damages were concentrated in three prefectures of the Tohoku region: Fuku-shima, Iwate, and Miyagi. The sparsely populated pacific coast of the Tohoku region, where agriculture and fishery are the main activities, accounts for only 2.5 percent of the total Japanese economy in terms of industrial production (figure 1).
Despite the relatively small extent of economic activities in the affected region, the GEJE had severe and widespread economic impacts, partly due to the Accident at Fukushima Daiichi Nuclear Power Station and ensuing energy supply disruptions, and the supply chain disruptions (compounded by widespread flooding in Thailand a few months later).
In the first quarter of 2011, Japan’s GDP contracted by 3.5 percent. According to the Inter-national Monetary Fund (IMF), GDP contracted by 0.7 percent in all of 2011, and the esti-mates for 2012 put GDP growth at 2 percent, stimulated by reconstruction work.
KNOWLEDGE NOTE 6-3CLUSTER 6: The economics of disaster risk, risk management, and risk financing

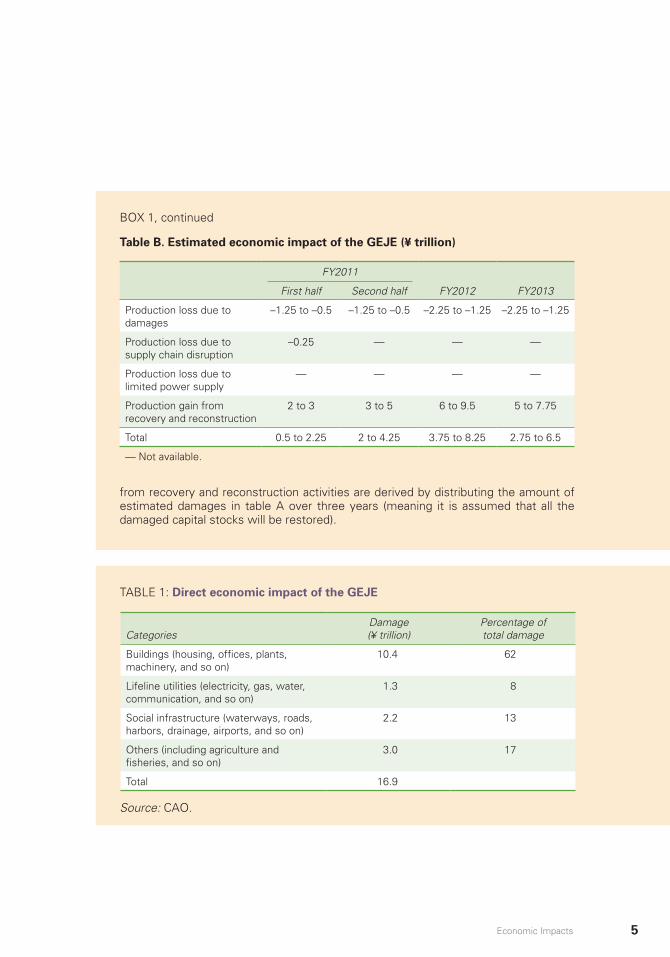
4 KNOWLEDGE NOTE 6-3
The CAO released two different sets of estimated economic damages (damage on capital stocks) of the GEJE (table A).
Table A. Estimated economic damages of the GEJE by the CAO (¥ trillion)
The economic impacts are estimated separately for damages (on capital stocks) and losses (on flow). The estimation results for damages in table A are calculated by multi-plying the existing predisaster capital stock data (based on the CAO’s macroeconomic database), by damage rates twice as high as the ones observed for the Hanshin-Awaji (Kobe) earthquake for Case 1 and by even higher damage rates against buildings and houses for Case 2 to take into account the damages from the tsunami. In this estima-tion the damaged areas include the prefectures of Iwate, Miyagi, and Fukushima (the above-mentioned damage rates are applied to the tsunami-affected areas in these prefectures, while damage rates equivalent to the Kobe earthquake’s are used for the non-tsunami-affected areas) and the surrounding prefectures of Hokkaido, Aomori, Ibaraki, and Chiba, for which damages are calculated by multiplying the capital stock data by damage rates modified based on the seismic intensity of each prefecture (details unknown).
The estimation of the economic impact from the GEJE (not included in table A) covers the same prefectures and is carried out for three fiscal years (table B).
The estimated production losses due to damages (first-order loss) by the GEJE are calculated based on the damages listed in table A using the production function of each sector. The production loss due to supply chain disruption (roughly equivalent to a higher-order loss) is estimated with the calculated production loss (the above first-order loss) and an interregional input-output table (between Tohoku and the rest of Japan). While the production losses due to limited (electric) power supply were considered, they were not estimated due to the uncertainty of effects on production (resiliency, conservation, or use of other adaptive measures). The production gains
Disaster Reduction Section
Economic and Financial Analysis Section
Case 1 Case 2
Buildings and houses 10.4 11 20
Utilities 1.3 1 1
Infrastructure 2.2 2 2
Others 2 2
Agriculture 1.9
Others 1.1
Total 16.9
Note: Case 1 uses damage rates twice as high as the Kobe earthquake, while Case 2 employs the even higher damage rates against buildings and houses for the tsunami-affected areas.
BOX 1: Government of Japan’sestimates of the economic effect of the GEJE
5Economic Impacts
Table B. Estimated economic impact of the GEJE (¥ trillion)
from recovery and reconstruction activities are derived by distributing the amount of estimated damages in table A over three years (meaning it is assumed that all the damaged capital stocks will be restored).
FY2011
FY2012 FY2013First half Second half
Production loss due to damages
–1.25 to –0.5 –1.25 to –0.5 –2.25 to –1.25 –2.25 to –1.25
Production loss due to supply chain disruption
–0.25 — — —
Production loss due to limited power supply
— — — —
Production gain from recovery and reconstruction
2 to 3 3 to 5 6 to 9.5 5 to 7.75
Total 0.5 to 2.25 2 to 4.25 3.75 to 8.25 2.75 to 6.5
— Not available.
BOX 1, continued
TABLE 1: Direct economic impact of the GEJE
Source: CAO.
CategoriesDamage (¥ trillion)
Percentage of total damage
Buildings (housing, offices, plants, machinery, and so on)
10.4 62
Lifeline utilities (electricity, gas, water, communication, and so on)
1.3 8
Social infrastructure (waterways, roads, harbors, drainage, airports, and so on)
2.2 13
Others (including agriculture and fisheries, and so on)
3.0 17
Total 16.9

6 KNOWLEDGE NOTE 6-3
There are approximately 80,000 businesses in the tsunami-affected areas, 740,000 busi-nesses in the earthquake-affected areas, 8,000 businesses in the evacuation zones of the Fukushima nuclear accident, and 1.45 million businesses in the prefectures covered by the Tokyo Electric Power Company (TEPCO).
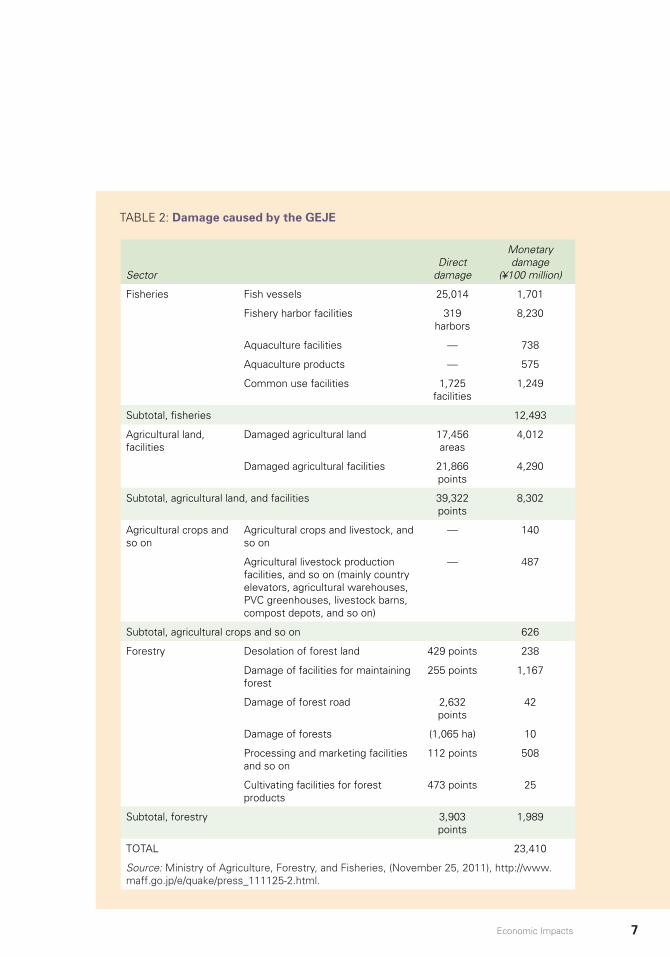
Impacts on agriculture, forestry, and fisheries
The amount of damage to agriculture, forests, and fisheries by the GEJE was estimated as ¥2.34 trillion (table 2).
Around 24,000 hectares of agricultural land (approximately 80 percent of paddy fields and 20 percent of farmland) were flooded by the tsunami. Over 95 percent of the damaged agricultural land is located in the three prefectures most severely affected: Iwate, Miyagi, and Fukushima.
FIGURE 1: The extent of economic activity in the municipalities along the Pacific Ocean coast
Source: Ministry of Economicy, Trade and Industry.
7Economic Impacts
SectorDirect
damage
Monetary damage
(¥100 million)
Fisheries Fish vessels 25,014 1,701
Fishery harbor facilities 319 harbors
8,230
Aquaculture facilities — 738
Aquaculture products — 575
Common use facilities 1,725 facilities
1,249
Subtotal, fisheries 12,493
Agricultural land, facilities
Damaged agricultural land 17,456 areas
4,012
Damaged agricultural facilities 21,866 points
4,290
Subtotal, agricultural land, and facilities 39,322 points
8,302
Agricultural crops and so on
Agricultural crops and livestock, and so on
— 140
Agricultural livestock production facilities, and so on (mainly country elevators, agricultural warehouses, PVC greenhouses, livestock barns, compost depots, and so on)
— 487
Subtotal, agricultural crops and so on 626
Forestry Desolation of forest land 429 points 238
Damage of facilities for maintaining forest
255 points 1,167
Damage of forest road 2,632 points
42
Damage of forests (1,065 ha) 10
Processing and marketing facilities and so on
112 points 508
Cultivating facilities for forest products
473 points 25
Subtotal, forestry 3,903 points
1,989
TOTAL 23,410
Source: Ministry of Agriculture, Forestry, and Fisheries, (November 25, 2011), http://www.maff.go.jp/e/quake/press_111125-2.html.
TABLE 2: Damage caused by the GEJE

8 KNOWLEDGE NOTE 6-3
It is estimated that the area of agricultural land that will be restored and cultivated again by 2012 could be less than 50 percent in Iwate and Miyagi prefectures, and only up to 20 percent in Fukushima Prefecture as a result of the nuclear accident.
Many plywood-processing factories in Iwate and Miyagi, where about one-third of plywood products are produced, were damaged.
The Fukushima nuclear accident further impacted the agriculture, forestry, and fisheries sectors. Based on the provisional regulation on radiation instated on March 17, 2011, ship-ping of food products containing radioactive iodine above a certain threshold has been restricted. In addition to the national regulation, some prefectures and local associations set additional restrictions on the shipping of food products.
The accident also affected trade flows of food products with other countries. Import controls for Japanese food products were intensified in 43 countries, and Japanese exports have declined.
Impacts on the tourism industry
The GEJE have severely affected the tourism industry in Japan, but, according to a report by the World Travel and Tourism Council (WTCC), recovery has been more rapid than previ-ously expected for both domestic and international tourism.
Foreign visitor arrivals in the month immediately following the GEJE were 62 percent lower than the previous year. But recovery was swift and, by the fall of 2011, arrivals were only 15 percent down compared to the previous year. Inbound international travel was more severely affected compared to outbound international travel and domestic travel (figure 2). This trend reflects fears generated by the nuclear power plant accident and loss of competi-tiveness as a result of the appreciation of the yen in the months following the disaster.
The WTCC estimates that the negative impact of the GEJE on the tourism industry amounts to approximately ¥0.7 trillion.
Impacts on financial and currency markets
Financial and currency markets stabilized quickly after the earthquake. Equity markets fell by over 15 percent in the first weeks after the earthquake, but recouped roughly one-third of their losses by mid-June 2011.
Figure 3 shows the Nikkei Index from January 2011 to June 2012. The Nikkei Index is a stock market index for the Tokyo Stock Exchange (TSE). It is a price-weighted average (the unit is yen), which indexes 225 companies in the TSE (components are reviewed once a year).
The figure clearly shows the fall after March 11 and the recovery till summer 2011. High volatility followed, but those values cannot be strictly connected to the recovery process, as the international financial crisis impacted the TSE.

9Economic Impacts
FIGURE 2: Japanese tourism demand, 2011–12
Source: WTCC 2012.
–70
–60
–50
–40
–30
–20
–10
0
10
Jan 2011 Apr
Domestic
Outbound
Inbound
Jul Oct Jan 2012
% a
nn
ual
gro
wth
20
FIGURE 3: Nikkei Index, January 2011–Jun 2012
Source: Nikkei 2012.

10 KNOWLEDGE NOTE 6-3
Individual debtor guidelines for out-of-court workouts
Guidelines for individuals on out-of-court debt restructuring: Individual Debtor Guide-lines for Out-of-Court Workouts were released on July 15, 2011, and took effect on August 22, 2011.
The Guidelines aimed at individual debtors who are unable, or deemed certain to soon become unable, to repay their existing loans—in other words, those who would in principle qualify to initiate bankruptcy or civil rehabilitation procedures. The creditors subject to the Guidelines consist primarily of private sector banks, cooperative finan-cial institutions, government-affiliated financial institutions, money lenders, and leasing companies.
As of March 30, 2012, the accumulated total number of cases consulted was 1,850, of which 538 cases were in the process of restructuring loans. This system is the first of its kind in Japan and is unprecedented even in the worlld.
Clearer application of financial inspection manuals
In the case of a company resuming or continuing its operations while repairing damage sustained from the earthquake and tsunami, there is a risk that its capital has been impaired due to the impact of the disaster. Capital augmentation is therefore urgently needed.
The Financial Services Agency introduced measures to apply its financial inspection manuals in a clearer manner, aiming to promote more active use of capital-eligible debt and thereby enable undercapitalized companies to improve their balance sheets and management.
These measures are expected to yield a number of positive effects, For example, even if a company’s capital has been impaired due to the impact of the disaster, the company is able to exchange its existing loans for new ones that satisfy the require-ments for capital-eligible debt (that is, a debt-debt swap). As a result, its balance sheet will become healthier, which will in turn lead to greater chances of obtaining new loans from financial institutions.
Measures for financial institutions
Some financial institutions located in the disaster-stricken area sustained significant damage; some institutions operational bases were almost entirely destroyed by the disaster. It is imperative to maintain and strengthen the financial functions of banks
BOX 2: Measures to address the double-debt problem for small and medium enterprises; agriculture, forestry, and fishery businesses; and residential mortgages

11Economic Impacts
In the immediate aftermath of the earthquake, the yen appreciated sharply because of speculation around sizeable repatriation flows by insurance companies, corporations, and households. The value of the yen touched a record ¥76.25 per dollar on March 17, before retreating to the 80-yen level. After concerted intervention in coordination with the G-7, the yen/dollar rate has traded in a band of 80 to 84. Approximately a quarter of devel-oping East Asia’s long-term debt is denominated in yen. For China, 8 percent of its external government debt is in yen. The figure for Thailand is about 60 percent, for Vietnam about 35 percent, for the Philippines about 32 percent, and for Indonesia about 30 percent. A 1 percent appreciation in the value of the yen translates into a $250 million increase in annual debt servicing on yen-denominated securities by East Asia’s developing countries.
After the disaster, the Bank of Japan injected liquidity to ensure that there would be no shortage of cash or funds to lend and no spikes in Japan’s interest rates. Massive liquidity injections flattened the Japan Government Bond yield curve, with the 10-year rate moving in a narrow range between 1.1 and 1.2 percent.
and other institutions to revitalize the regional economy. To that end, special provisions concerning the disaster have been added to the Act on Special Measures for Strength-ening Financial Functions. First, special provisions for disaster-affected financial institu-tions in need of the government’s capital injection to strengthen its financial functions have been added. For instance, when such a financial institution draws up a manage-ment enhancement plan, its top executives are not held responsible or required to set profitability and efficiency targets, on the grounds that the impact of the earthquake and tsunami is beyond their control. Furthermore, the costs the financial institution bears for receiving capital injection are substantially lower than the costs needed under normal conditions. In addition, a much longer period is allowed for securing the repay-ment funds. In return for receiving this capital injection under very favorable conditions, the financial institution is expected to play its financial intermediary functions in an even more active way. Second, special provisions have been incorporated for shinkin banks, credit cooperatives, and other cooperative financial institutions to further ease the requirements for capital injection. Under the amended law, the government and the central organization of a financial institution jointly inject capital, and the financial institution is required to conclude a management guidance agreement with the central organization. In the event that the injected capital is highly unlikely to be repaid by the set date, said capital will be liquidated and the financial institution’s business restruc-tured. The Deposit Insurance Corporation’s funds are used as the source of capital injection. The amendments also include a five-year extension to the end of March 2017 of the time limit for applications for the government’s capital injection.
As of March 30, 2012, the government has decided to inject capital (¥191.0 billion in total) into 10 financial institutions—three banks, four shinkin banks, and three credit cooperatives—operating in the disaster-stricken areas in accordance with the Act on Special Measures for Strengthening Financial Functions.
BOX 2, continued

12 KNOWLEDGE NOTE 6-3
One of the critical challenges for the Japanese economy remains overcoming deflation to return to a sustainable growth path with price stability. The Bank of Japan and the govern-ment are working together to prevent the economy from falling into a vicious cycle between yen appreciation and deflation.
Impacts on energy supply
The damage resulting from the earthquake and tsunami is being compounded by the resulting shortages in energy supply. Energy supply disruptions have caused rolling black-outs that have disrupted Japan’s production capacity in its industrial heartland in the Kanto region, which accounts for about 40 percent of national GDP.
The Fukushima nuclear accident has pushed the government to explore alternative energy sources. Ministry of Economy, Trade and Industry (METI) established the Fundamental Issues Subcommittee under the Advisory Committee for Natural Resources and Energy to advise a new long-term energy plan. In the interim report, the committee emphasized the need to reform the demand structure, including energy conservation measures and controls on peak-time electricity demand.
In the short term, the shift toward other energy sources will boost imports from oil- and petroleum-exporting countries in the East Asia region, in particular Indonesia, Malaysia, and Australia.
Impacts on industrial production
The main economic activities in the affected region are agriculture (mainly rice paddy fields) and fisheries, but manufacturing accounts for about a quarter of production in the region, and plants in the most severely damaged areas supply parts and products used in manufac-turing elsewhere in Japan and Asia.
Damage to Japan’s industrial facilities caused a sharp drop in production following the GEJE, but swift reconstruction has minimized the long-term impact on production.
Japan’s METI reported that, as of August 2011, restoration works had been completed for 93 percent of the 91 production bases directly affecting Japan’s major manufacturing industries, including machinery, automotive, and consumer electronics. The automo-tive industry recorded the greatest fall in production, but recovered rapidly as facilities reopened and vital transport networks were repaired. Industrial production rebounded from April onwards with a growth of 6.2 percent in May and 3.8 percent in June. But this is still not sufficient to fully offset the initial 15 percent fall experienced in March. Produc-tion in June remained lower than in 2010 and was 5 percent lower than in February, on a seasonally adjusted basis. Most affected industries have now reached almost predisaster levels of production (figure 4).

13Economic Impacts
Double debt
The “double debt problem” generally refers to the financial difficulties facing individuals and business owners stricken by the GEJE who need to borrow to rebuild their destroyed houses and offices. But as they have existing loans on such premises, borrowing additional money results in two debts on the same property. The Japanese government as a whole worked on policy responses and formulated the Policy for the Double Debt Problem, which was released on June 17, 2011 (as explained in box 2).
GLOBAL SUPPLY CHAINS
It’s a small (networked) world after all
With the rapid progress of information and transport technology together with the promo-tion of free trade, humans have developed an extensive network of production, trade, and investment throughout the world. Moreover, we have intensive agglomeration of produc-tion and consumption in major cities throughout the world, which are mutually connected through a dense supply chain network. Today’s global production system is a complex, networked system that has operated efficiently under normal conditions. Nevertheless, recent megadisasters in Japan and Thailand have revealed the networked world’s vulner-ability to major disasters.
The magnitude of the Japanese economic impact is partially attributable to supply chain network disruptions. The disaster-affected area serves as a major source of supply chain flow of goods (from procurement of parts to the delivery of finished products) for Japan’s
FIGURE 4: Indices of all industry activity (seasonally adjusted)
Source: METI 2012.
Feb
99.1% recovery(all industry)
All industry
80%
85%
90%
95%
100%
105%
AprMar JunMay AugJul
Tertiary industry activityIndustrial production
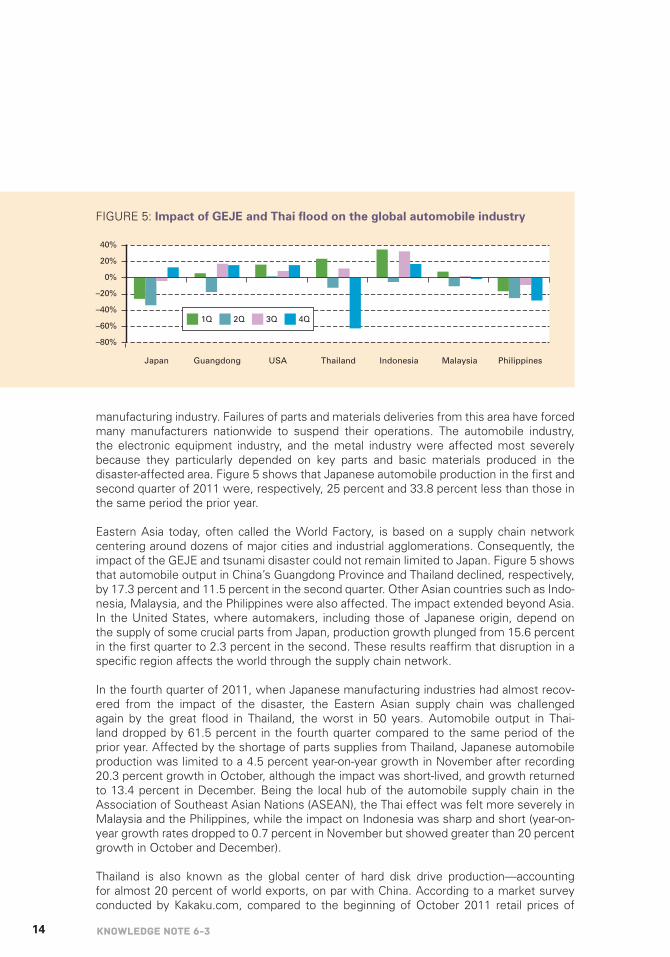
14 KNOWLEDGE NOTE 6-3
manufacturing industry. Failures of parts and materials deliveries from this area have forced many manufacturers nationwide to suspend their operations. The automobile industry, the electronic equipment industry, and the metal industry were affected most severely because they particularly depended on key parts and basic materials produced in the disaster-affected area. Figure 5 shows that Japanese automobile production in the first and second quarter of 2011 were, respectively, 25 percent and 33.8 percent less than those in the same period the prior year.
Eastern Asia today, often called the World Factory, is based on a supply chain network centering around dozens of major cities and industrial agglomerations. Consequently, the impact of the GEJE and tsunami disaster could not remain limited to Japan. Figure 5 shows that automobile output in China’s Guangdong Province and Thailand declined, respectively, by 17.3 percent and 11.5 percent in the second quarter. Other Asian countries such as Indo-nesia, Malaysia, and the Philippines were also affected. The impact extended beyond Asia. In the United States, where automakers, including those of Japanese origin, depend on the supply of some crucial parts from Japan, production growth plunged from 15.6 percent in the first quarter to 2.3 percent in the second. These results reaffirm that disruption in a specific region affects the world through the supply chain network.
In the fourth quarter of 2011, when Japanese manufacturing industries had almost recov-ered from the impact of the disaster, the Eastern Asian supply chain was challenged again by the great flood in Thailand, the worst in 50 years. Automobile output in Thai-land dropped by 61.5 percent in the fourth quarter compared to the same period of the prior year. Affected by the shortage of parts supplies from Thailand, Japanese automobile production was limited to a 4.5 percent year-on-year growth in November after recording 20.3 percent growth in October, although the impact was short-lived, and growth returned to 13.4 percent in December. Being the local hub of the automobile supply chain in the Association of Southeast Asian Nations (ASEAN), the Thai effect was felt more severely in Malaysia and the Philippines, while the impact on Indonesia was sharp and short (year-on-year growth rates dropped to 0.7 percent in November but showed greater than 20 percent growth in October and December).
Thailand is also known as the global center of hard disk drive production—accounting for almost 20 percent of world exports, on par with China. According to a market survey conducted by Kakaku.com, compared to the beginning of October 2011 retail prices of
FIGURE 5: Impact of GEJE and Thai flood on the global automobile industry
Japan
–80%
–60%
–40%
–20%
0%
20%
40%
Guangdong USA Thailand Indonesia Malaysia Philippines
1Q 2Q 3Q 4Q

15Economic Impacts
popular-type hard disk drives (1 terabyte capacity and 7,200 rpm spin speed) in the Japa-nese market shot up 150 percent–200 percent by mid-November before settling down, but remained about two times as high as the preflood level at the beginning of February 2012.
Disaster strikes when you least expect it
Recent experiences remind us of the vulnerability of supply chain networks, which contain some critical nodes wherein production of particular parts and components is concentrated among a few suppliers. Importantly, such concentrations do not result from planning failures. Rather, they are self-organized through market interactions. Because of scale economies, production concentration is preferred by both suppliers and customers. Although a trade-off relation exists between scale economies and transport costs to deliver products to distant customers, lower transport costs make the concentration of production more profitable, as shown in figure 6. Consequently, globalization (decline of broadly defined international transport/transaction costs) tends to enhance the forma-tion of agglomeration within a global supply chain. Because of self-organization, it is not feasible to eliminate potential risks by agglomeration in highly complex supply chains. To complicate matters further, when a disruption occurs, it is impossible to find replace-ments from other suppliers, at least in the short run, because of a high degree of custom-ization. An example from the 2011 disaster was the Renesas Electronics Corporation’s Naka plant, located in Ibaraki Prefecture. It produces a micro control unit (MCU) for high-quality motor vehicles that makes extensive use of electronic control technology. Over the years, Renesas has become a supplier of customized MCUs for major automobile companies throughout the world.
We might find other cases of dispersion forces if concentration increases the potential risk of disruption for the entire supply chain. Dispersions in this case might involve: building sufficient safety stocks (dispersion of products), use of multiple suppliers, and duplication of production facilities. These actions, which are components of so-called business conti-
FIGURE 6: Trilateral trade-offs in global resilience
Scale economies
Risk
Trade-off
Agglomeration/Dispersion
Transport costs

16 KNOWLEDGE NOTE 6-3
nuity plans (BCPs), are aimed at increasing redundancy and resiliency. They garner great attention in the supply chain management literature.
But individual firms are rarely capable of taking sufficient actions to mitigate the potential loss from supply chain disruptions because they are generally reluctant to assume the loss of efficiency derived through scale economies. High impact/low probability events, such as huge earthquakes and tsunamis, make our predictions more diverse and imprecise. Gener-ally, although people’s awareness of risk is tuned to a high level soon after experiencing an important natural disaster, heterogeneity in beliefs will increase with the passage of time. Moreover, uncertainty will be high in the decision-making process because the valuation of risks is difficult. In such a case, the market equilibrium can only reflect the opinion of the more optimistic firms, which avoids the costs of risk management. Agency problems might also be an issue. A risk-conscious buyer might wish to enforce a BCP on its supplier in the business contract, but the supplier’s implementation could be partial if monitoring costs are high.
Actually, the 2011 disaster was not the first supply chain crisis in eastern Asia, even in recent times. A strong earthquake in Taiwan in March 2000 shut down large liquid crystal display factories agglomerated around the Hsinchu Science Park. The outbreak of the SARS epidemic in southern China in 2002–03 sent ripples through the global supply chain. Japan itself also suffered disruptions after the Great Hanshin-Awaji Earthquake of 1995 and the Chuetsu Offshore Earthquake of 2007. Those disasters and their effects notwithstanding, critical nodes still widely persist.
Better to be brisk and slapdash than slow and elaborate
Prompt measures to remove bottlenecks are undoubtedly necessary to avoid prolonged dysfunction of supply chain networks. Agglomeration has a lock-in effect: that is, firms take actions reflexively to restore the agglomeration after it is damaged by temporary shocks. Collaboration among firms and/or government support stimulation of such efforts hasten rehabilitation.
Auto production in Japan recovered nearly to a normal level in August, five months after the shock. We might consider that the rapid recovery showed the high resilience of supply chain networks in the Japanese automobile industry. This was in part due to emergency relief measures taken by the private sector such as sending technical personnel from all rival customer firms collaborating to help rehabilitate damaged suppliers’ factories. The rapid revival of transportation networks (highways, railways, airports, and seaports) was also of fundamental importance.
After the Thai flood, the government implemented some measures to support firms striving for continuing production. These measures included: permission for temporary produc-tion relocation and outsourcing and the exemption of import tariffs on locally unavailable parts, components, and industrial equipment. Additional corporate tax exemption was also given to flood-hit companies. For the automobile industry, imports of assembled cars were allowed free of tax. Entry of foreign experts to engage in rehabilitation of factories was made flexible.
17Economic Impacts
These measures were complemented by international cooperation. The Japanese govern-ment issued temporary work visas for six months to Thai workers employed by flood-hit factories of Japanese affiliates. By the end of 2011 about 3,700 workers had participated in the program. This program benefited Japanese firms who needed quick startup of back-up production in Japan to mitigate the disruption of the supply chain; it benefited Thai workers who might have lost jobs otherwise. The Bank of Thailand and the Bank of Japan launched a cooperative effort to provide Thai baht loans to flood-hit Japanese affiliates backed by Japanese government bonds.
Providing is preventing: Finding opportunity in crisis
There is no time to lose in emergencies. At the same time, it is necessary to consider whether returning to the predisaster situation is truly desirable if potential risks latent in agglomerations become glaringly apparent. We now confront the urgent task of promoting global disaster risk management of highly networked supply chains while our memory of 2011 is still fresh.
Individual firm/industry level
The main issue will be to enhance the resiliency of the supply chain while maintaining its efficiency. To minimize supply disruption, each company can seek the best mix of the following strategies at the individual firm level:
• Elaborate a workable BCP that includes remote backup production provisions. Although this does not mean actual dispersion of production under normal condi-tions, repeated simulation training is necessary.
• Procure key parts and materials from multiple sources routinely, sharing the costs of dispersion between buyers and suppliers.
• Divide production and locate productive facilities in different locations, whether interregionally or internationally, even under normal conditions. Innovative produc-tion technology must be promoted by which higher-scale economies are obtainable with smaller production volumes.
• Coordinate standardization and sharing of parts and materials among companies. Avoiding excessive company-specific customization, such coordination provides sufficient lot size to suppliers by which dividing production facilities becomes economically viable.
These strategies have already been put into practice to some degree. Regarding strategy (1), when the earthquake halted desktop computer production at the Fukushima plant of Fujitsu, the company was able to restart production 12 days later at a factory 740 kilometers away in Shimane Prefecture in western Japan, which usually produced notebook computers, as had been simulated many times. This operation enabled Fujitsu to minimize the disruption period. Regarding strategy (2), Nissan has pursued a strategy of standardizing and sharing parts and materials aggressively through its experience of partnership with Renault. In fact, Nissan was able to recover production from the impact of the Thai flood quickly because it
18 KNOWLEDGE NOTE 6-3
was able to switch to other suppliers of its global procurement network. For strategy (3), high global market-share companies have recognized the importance of risk-averse disper-sion to maintain their market positions. One such company, Nidec-Shimpo Corp., which supplies small motors used in various machine products, boasts an 80 percent share of the global hard disk drive motor market (according to the company’s Web site). When its three plants in Thailand were damaged by the flood, Nidec reacted quickly by increasing produc-tion capacity in China by 50 percent and that in the Philippines by 60 percent to compen-sate for the loss of operations in Thailand. This action avoided the collapse of hard disk drive production. The company announced that the proportion of the production in Thailand would be reduced from its original 60 percent even after the rehabilitation of the factories, thereby reducing the risk of concentration. As an example of strategy (4), companies are usually reluctant because they are concerned that the use of standardized parts would require compromises in product quality, leading to the loss of competitiveness. After the GEJE, however, METI took initiatives to coordinate parts sharing in the Japanese automo-bile industry, and it is expected that more concrete measures will be taken as well.
Local and national government level
As might be expected, local and national governments have roles in areas where private initiatives cannot suffice. Typically, public policies are expected to enhance the resilience of infrastructure of all kinds supporting industrial production and the daily life of people. For example, in Japan, earthquake-resistance standards for public facilities and infrastructure were revised based on analyses of the damage that occurred. Still, the 2011 disaster left us lessons of not mythologizing safety: provisions in land-use planning are necessary where there is a tsunami risk because tide walls can never be sufficiently high. Moreover, society must take a hard look at the benefits and shortcomings of dependence on nuclear power generation. Strengthening local infrastructure for prevention of urban flooding in devel-oping countries should be greatly emphasized. On this aspect, international cooperation is necessary, for example, the Japan International Cooperation Agency (JICA) will aid the Thai government in presenting a new master plan for flood mitigation in the Chao Phraya Delta.
In broader perspectives, national spatial planning must be readdressed to decentralize the over concentrated economic-political functions in capital cities (for example, Tokyo, Bangkok, Manila, and Jakarta), and to develop a more resilient nationwide system of regions.
There is a need for accelerating the integration of the private sector into existing plat-forms and activities. One effective example of partnership and cooperation among national and local governments, volunteers, and the private sector is the Global Compact Network Japan (GCNJ). GCNJ joins the top corporate management of leading Japanese companies in a platform for linking corporate social responsibilities with business activities. GCNJ was established in 2003 and currently has a membership of more than 160 leading compa-nies. GCNJ has been providing a platform for the private sector to address issues such as climate change and water, and create an enabling environment for PPP. After the GEJE, GCNJ organized a collective action program in which companies provided voluntary-based assistance to several disaster-affected cities in Miyagi Prefecture by utilizing and combining the resources and strengths of each company.

19Economic Impacts
International cooperation
As we noted above, firms’ risk aversion functions to some degree as a dispersive force, but this necessarily involves additional transport costs. Because dispersion will be international, we must recognize transport costs in a broad sense including import tariffs and nontariff barriers, customs clearance procedures, communications costs, and even exchange rates. Countries must join forces to mitigate widely various costs related to cross-border transac-tions. Such cooperation will increase connectivity to the global supply chain and thus the chance of attracting investment.
The 2011 earthquake and tsunami disaster came as a further blow to the Japanese manu-facturing sector, which had already been threatened by high factor costs and a strong yen. But when firms were inclined to transfer more production overseas, the Thai flood occurred, compelling firms to revise their risk assessments of excessive concentration of operations overseas. Given the existence of critical parts and material suppliers within Japan, Japanese firms will find it attractive to determine an appropriate mix of production in Japan and overseas. That will seem preferable to accelerating the hollowing out of the business environment for the improvement of taxation and expansion of free trade agree-ment networks.
Recently, the Thai government is proposing to Japanese local governments and industrial groups that small and medium-size firms in local industrial clusters invest as a group and establish sister clusters in Thailand. Sister clusters can operate with vertically linked special-ization at normal times, thereby realizing cost reduction, while they can mutually back up production in cases of large natural disasters. Firms can thereby enjoy the same collec-tive efficiency overseas through familiar face-to-face contacts as they do in Japan. This will promote locational diversification of small firms, for which related costs are unaffordable.
LESSONS
Measuring the full extent of the GEJE’s economic impacts will take time. All industrial sectors as well as services suffered significant direct and indirect impacts. A lot will depend on how the government will address the energy supply issues.
The Bank of Japan’s swift intervention to ensure immediate liquidity was instrumental in mitigating impacts related to yen appreciation and access to financing.
The government played an important role in alleviating the impacts on households and businesses thanks to the subsequent approvals of supplementary budgets and regulations such as the Policy for the Double Debt Problem (KN 6-4).
Unplanned concentration in supply chains is self-organized because of agglomeration econ-omies. The network of agglomerations is efficient in normal times, but the global produc-tion system is thereby vulnerable to natural disasters.
When agglomeration is locked in, firms promptly react to restore the original structure against the damage of disaster. Cooperation among firms and supporting policies can accel-erate the process.

20 KNOWLEDGE NOTE 6-3
Although quick restoration is necessary to avoid exacerbation of a crisis through prolonged dysfunction of supply chains, structural changes must be provided to enhance the resil-iency of a supply chain, without mythologizing the safety of the status quo.
Resilience of supply chains demands a certain degree of geographical dispersion. To miti-gate the loss of efficiency by dispersion, the previously described individual firm strategies (1)–(4), government policies, and international cooperation are in order.
RECOMMENDATIONS FOR DEVELOPING COUNTRIES
In today’s networked world, most countries are involved in the global supply chain, of which developing countries are an important part. A major disaster occurring in one country can have a global impact. Consequently, it is expected that developing countries will share the burden of strengthening the global resilience of supply chains.
Vulnerability is particularly high in many developing countries because political and economic activities are excessively concentrated in capital cities. An urgent need exists for bold measures aimed at decentralization and establishing backup systems for emergencies. Furthermore, recent rapid urbanization during economic growth has led to the destruction of natural systems of disaster prevention such as the water retention capacity of forests, thereby increasing risks of flooding. Moreover, urban sprawl is occurring in marginal areas where the infrastructure is unprepared for severe natural events.
A pressing need exists to remedy such weaknesses under international cooperation. Coor-dination among neighboring countries is also necessary in such areas as cross-border trans-portation systems and water resource management. Policy makers should assess natural disaster risks in a new light—as a mainstream issue that must be addressed by a country to play a major role in global production networks.
It is important that the impacts of a large-scale disaster such as the GEJE are not assessed and addressed in isolation but also by taking into account potential region- and worldwide impacts. Many countries in developing East Asia have strong ties with Japan and would be affected by an appreciation of the yen. In the immediate aftermath of the earthquake, when the yen appreciated sharply because of speculation about sizeable repatriation flows by insurance companies, corporations, and households, the Japanese authorities and the G-7 undertook a concerted effort to stabilize the course of the yen to avoid repercussions for the rest of the world, and East Asia specifically. Coordination among countries is funda-mental in mitigating potential impacts of large-scale disasters.
KEY REFERENCES
Congressional Research Service. 2011. Japan’s 2011 Earthquake and Tsunami: Economic Effects and Implications for the U.S.
Fujita, M., and N. Hamaguchi. 2012. “Japan and Economic Integration in East Asia: Post-Disaster Scenario.” Annals of Regional Science 42(2): 485–500 (forthcoming).

21Economic Impacts
IMF (International Monetary Fund). 2011. Japan—2011 Selected Issues.
———. 2012. World Economic Outlook. April 2012.
Ministry of Economy, Trade and Industry. March 2012. Japan’s Challenges.
Ministry of Economy, Trade, and Industry, Agency for Natural Resources and Energy. May 2012. “Electricity Supply-Demand Outlook & Measures in Summer 2012.”
Schnell, M., E. David, and D. Weinstein. 2012. “Evaluating the Economic Response to Japan’s Earthquake.” Policy Discussion Paper Series 12-P-003, RIETI.
Sheffi, Y., and J. B. Rice Jr. 2005. “A Supply Chain View of the Resilient Enterprises.” MIT Sloan Management Review 47 (1): 41-48.
World Bank. 2011. “The Recent Earthquake and Tsunami in Japan: Implications for East Asia.” East Asia and Pacific Economic Update 2011, World Bank, Washington, DC. http://siteresources.worldbank.org/INTEAPHALFYEARLYUPDATE/Resources/ 550192-1300567391916/EAP_Update_March2011_japan.pdf.
WTTC (World Travel and Tourism Council). 2011. “The Tohoku Pacific Earthquake and Tsunami.” December 2011 Update.
———. 2012. “The Tohoku Pacific Earthquake and Tsunami.” March 2012 Update.
1The Financial and Fiscal Impacts
KNOWLEDGE NOTE 6-4CLUSTER 6: The economics of disaster risk, risk management, and risk financing
The Financial and Fiscal Impacts

2 KNOWLEDGE NOTE 6-4
Prepared by Motohiro Sato, Hitotsubashi University, and Laura Boudreau, World Bank

3The Financial and Fiscal Impacts
The Financial and Fiscal Impacts
The Great East Japan Earthquake (GEJE) occurred against the backdrop of a strug-gling economy and public finance system under stress, implying an exceptional fiscal cost and imposing a fiscal management challenge to the government of Japan (GoJ). In response, the government committed to a full-scale national initiative that has evinced its ability to quickly mobilize short-term liquidity but leaves in question its reliance on debt issuance and taxation measures to finance longer-term reconstruc-tion. This note examines the fiscal costs of the event, the financial measures taken by the GoJ to fund these expenses, and the fiscal implications of these actions. Lessons learned and recommendations for developing countries are distilled from this discus-sion.
The Great East Japan Earthquake (GEJE) inflicted massive physical damage on private and public assets, destroyed livelihoods, and disrupted local and national economies. In the aftermath of the event, the GoJ announced a full-scale national response in which the government would support (i) rebuilding disaster-resilient regions, (ii) restoring the livelihoods of the disaster-affected population, and (iii) reviving the local economy and industry. To finance this approach, the GoJ mobilized a portfolio of fiscal measures that minimized the financial burden on local governments, residents, and industry but significantly increased the financial burden of the central government, and thus, indirectly, of the current and future Japanese population and economy. According to the Cabinet Office, the GEJE was a “crisis in the midst of a crisis” for the Japanese economy and its public finance (Cabinet Office 2011c). The GoJ has had to balance financing and executing an effective postdisaster response against planning how to spread the costs of this response across generations.
FINDINGS
Understanding the GoJ’s postdisaster roles and responsibilities, as stated in Japanese laws and as evidenced by past disasters, helps to explain the GoJ’s expenditures and revenues
KNOWLEDGE NOTE 6-4CLUSTER 6: The economics of disaster risk, risk management, and risk financing

4 KNOWLEDGE NOTE 6-4
Law(s) Relevance to the GoJ’s contingent liability in natural disasters
Disaster Relief Act (1947) • Provides for disaster relief and welfare support (including repair of private housing, cash transfers and/or loans, and so on) to affected populations.
• Establishes subsidization of local governments’ measures by the central government.
• Mandatestheestablishmentofadisasterrelieffundforemergency relief activities by each prefecture.
Disaster Countermeasures Basic Act (1961)
• IsthecornerstoneofJapan’sdisasterriskmanagement(DRM)system.
• Setsoutlocalandcentralgovernments’responsibilitiesatallpointsintheDRMcycle,includinglevelsandformsofthelocal and central governments’ postdisaster responsibilities
• Embedsfinancialmeasuresasoneoftheeightcorecompo-nentsofJapan’sDRMsystem;underthissection,definesdisaster-expense-sharing fiscal mechanisms that can be employed by the government postdisaster (for example, subsidy, tax, and debt measures).
TABLE 1: Direct economic impact of the GEJE
related to the GEJE. Japanese law clearly defines the roles and responsibilities, including financial, of the local and central governments in disaster response. A number of laws lay out a broad scope for the GoJ’s legal contingent liability1 in the event of natural disas-ters, inclusive of responsibilities for disaster response, reconstruction of public and certain private assets, and social and economic restoration. At the center of these laws are the Disaster Relief Act and Disaster Countermeasures Basic Act (table 1).
Other laws, such as the Act on Special Financial Support to Deal with Extremely Severe Disasters (1962) and the Natural Disaster Victims Relief Law (1998) further extend the scope of the government’s financial responsibility. Additionally, a series of laws that provide for government support to provision certain lines of insurance (earthquake, agricultural, fisheries,fishingboat,andforest;seeKNs6-1and6-2),establishacontingentliabilityofthegovernment to pay its portion of reinsurance payouts under these schemes.
Cost of the GEJE to the GoJ
The GoJ estimates that the GEJE caused direct economic damages to private and public capital and infrastructure in the amount of ¥16.9 trillion ($210 billion), 4 percent of Japan’s gross domestic product (GDP). The indirect costs of the event in the short, medium, and long term are difficult to quantify but are likely much greater.2 Although originally forecasted
TABLE 1: Key laws framing the GoJ’s contingent liability in the case of disaster
Law(s) Relevance to the GoJ’s contingent liability in natural disasters
Disaster Relief Act (1947)
D i s a s t e r Countermeasures Basic Act (1961)
1 As defined in World Bank (forthcoming), a contingent liability is a spending obligation arising from past events that will be incurred in the future if uncertain discrete future events occur.2 Indirect losses are losses that result from physical damage, such as business interruption, reduced tourism, reduced tax revenue, and so on.

5The Financial and Fiscal Impacts
Date Fiscal year Financing mechanism Amount (¥ billion)
14Mar11 10 FY10 General Contingency Budget 67.8
19 Apr 11 11 FY11 General Contingency Budget 50.3
2May11 11 1stSupplementaryBudget 4,015.3
25 Jul 11 11 2ndSupplementaryBudget 1,998.8
21Nov11 11 3rdSupplementaryBudget 9,243.8
8 Feb 12 11 4thSupplementaryBudget 6.7
1 Apr 12 12 FY12 Bridge Budget 9.3
6 Apr 12 12 FY12 Budget 3,775.4
TOTAL 19,167.4
TOTAL FY11 15,314.9
TABLE 2: Approved central government spending on the GEJE, FY10–FY12
Source: Authors,withdatafromJapanMinistryofFinance(2012).
to grow during 2011, Japan’s GDP contracted by 3.5 percent during the first quarter and by 0.7percentforthefullyear(IMF2011;WorldBank2012).
While the public sector’s share of the direct and indirect losses from the GEJE is difficult todetermine,itisundoubtedlysignificant.Moreeasilyanalyzedarethefiscalcostsofthegovernment’s relief, recovery, and reconstruction measures after the GEJE. For short- to medium-term costs, government budgetary and cash-flow data (that is, disaster-related expenditures and revenues) can be used. For assessment of longer-term fiscal impacts, projections are more difficult, as they embody a great deal of uncertainty due to possible variances in expected tax revenues, changes in the Japanese bond market, and/or changes in the GoJ’s debt-management capacity. Furthermore, fat-tailed risks, such as the possi-bility of long-term impacts from the nuclear accident in Fukushima, could increase the fiscal costs of the disaster in the long run.
Central government spending for the GEJE
As of mid-2012, total central government funding allocated to the GEJE totals ¥19.17 tril-lion (table 2). This total includes spending from the first contingency funding approved in Japan’s fiscal year (FY) 2010,3 through the most recently approved funding for the FY12. While earlier funding (that is, up to and including the second supplementary budget) was primarily for relief and recovery costs, the later budgets were primarily for reconstruction. Thus, a significant share of the later budgets may be disbursed for reconstruction projects over multiple fiscal years.
Note: TheThirdSupplementaryBudgetincludeda¥2,489.3billionallocationtorepaythefinancing borrowed from FY11 pension funding. This repayment has been considered in this accounting of the GoJ spending on the GEJE.
3Japan’sfiscalyearrunsApril1toMarch31.TheGEJEstruckonMarch11,2011,towardthetailend of FY10.
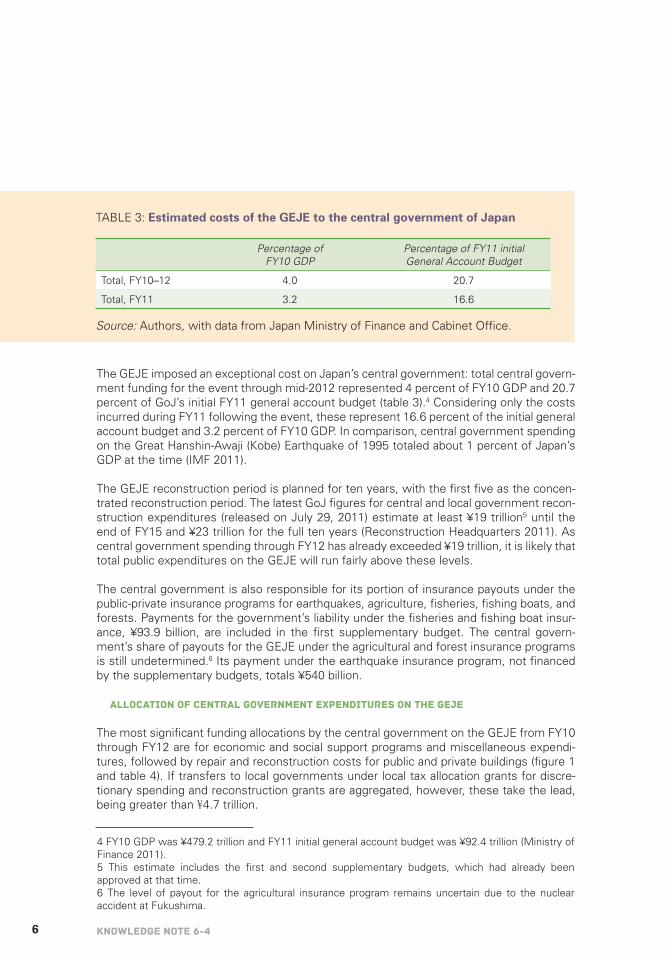
6 KNOWLEDGE NOTE 6-4
The GEJE imposed an exceptional cost on Japan’s central government: total central govern-ment funding for the event through mid-2012 represented 4 percent of FY10 GDP and 20.7 percent of GoJ’s initial FY11 general account budget (table 3).4 Considering only the costs incurred during FY11 following the event, these represent 16.6 percent of the initial general account budget and 3.2 percent of FY10 GDP. In comparison, central government spending ontheGreatHanshin-Awaji(Kobe)Earthquakeof1995totaledabout1percentofJapan’sGDPatthetime(IMF2011).
The GEJE reconstruction period is planned for ten years, with the first five as the concen-trated reconstruction period. The latest GoJ figures for central and local government recon-struction expenditures (released on July 29, 2011) estimate at least ¥19 trillion5 until the end of FY15 and ¥23 trillion for the full ten years (Reconstruction Headquarters 2011). As central government spending through FY12 has already exceeded ¥19 trillion, it is likely that total public expenditures on the GEJE will run fairly above these levels.
The central government is also responsible for its portion of insurance payouts under the public-private insurance programs for earthquakes, agriculture, fisheries, fishing boats, and forests. Payments for the government’s liability under the fisheries and fishing boat insur-ance, ¥93.9 billion, are included in the first supplementary budget. The central govern-ment’s share of payouts for the GEJE under the agricultural and forest insurance programs is still undetermined.6 Its payment under the earthquake insurance program, not financed by the supplementary budgets, totals ¥540 billion.
Allocation of central government expenditures on the GEJE
The most significant funding allocations by the central government on the GEJE from FY10 through FY12 are for economic and social support programs and miscellaneous expendi-tures, followed by repair and reconstruction costs for public and private buildings (figure 1 and table 4). If transfers to local governments under local tax allocation grants for discre-tionary spending and reconstruction grants are aggregated, however, these take the lead, being greater than ¥4.7 trillion.
Percentage of FY10 GDP
Percentage of FY11 initial General Account Budget
Total, FY10–12 4.0 20.7
Total, FY11 3.2 16.6
TABLE 3: Estimated costs of the GEJE to the central government of Japan
Source: Authors,withdatafromJapanMinistryofFinanceandCabinetOffice.
4FY10GDPwas¥479.2trillionandFY11initialgeneralaccountbudgetwas¥92.4trillion(MinistryofFinance 2011).5 This estimate includes the first and second supplementary budgets, which had already been approved at that time.6 The level of payout for the agricultural insurance program remains uncertain due to the nuclear accident at Fukushima.

7The Financial and Fiscal Impacts
FIGURE 1: Central government funding allocation for the GEJE, FY10–FY12
Source: Authors,withdatafromJapanMinistryofFinance.Notes: (i) Due to rounding, the sum of these totals is not exactly equal to total central government expenditure, ¥19,167.4 billion. (ii) This categorization of allocations is based on that used by the GoJ. In some cases, two GoJ categories have been combined when funding is for similar activities.
Whilethesefiguresareinformative,theymustbeinterpretedwithcare.Somecategoriesprovideestimatesofclosetofinalorfinaltotalsforallocationstothecategory;others,suchas repair and reconstruction and interest payments for reconstruction bonds, will continue to grow. In addition, because the local tax allocation grants to local governments represent a discretionary spending category, the governments can allocate these funds across the remaining categories (that is, the total of central and local government spending on disaster reliefmaybegreaterthanwhatiscapturedhere);similarly,thereconstructiongrantsforlocal governments increase the total amount spent on repair and reconstruction of build-ings and infrastructure.
Costs to local governments
The fiscal impact of the GEJE on local governments (prefectural and municipal) is much more difficult to assess, in great part due to the very limited availability of information on disaster-related expenditures and revenues at local levels. The scale of the disaster—primarilyinthethreemost-effectedprefectures,Fukushima,Iwate,andMiyagi—suggeststhat it far exceeded the capacity of local public finance to fund a significant share of recon-struction costs.
From the designation of the GEJE as an “extremely severe disaster” the day after the event, the GoJ’s decisions and policies have aimed to shift as much of the financial burden oftheGEJEtothecentralgovernment.Forexample,undertheNaturalDisasterVictimsRelief Law, which provides subsidies up to ¥3 million to affected households, the central
Economic andsocial and
miscellaneous
0
500
1,000
1,500
2,000
2,500
3,000
3,500
4,000
¥ bi
llion
4,500
Repair andreconstruction
of buildings andinfrastructure(public and
private)
Local taxallocation grants
to localgovernments
Reconstructiongrants for localgovernments
Public financing(loan) programs
Contingencyreserve
Nuclear-relatedcosts
Debrismanagement
Disasterreductionmeasures
Disaster relief Interestpayments forreconstruction
bonds
4050.6
3605.2
2878.0
1848.0
1433.31200.0 1112.3 1082.1 1057.9
773.2
125.3
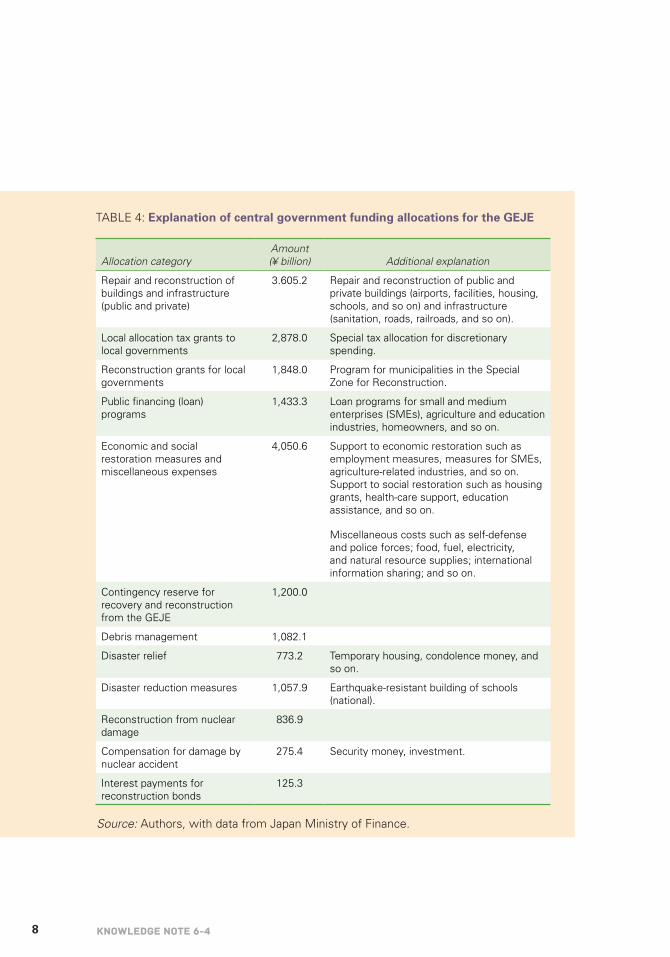
8 KNOWLEDGE NOTE 6-4
Allocation categoryAmount (¥ billion) Additional explanation
Repair and reconstruction of buildings and infrastructure (public and private)
3.605.2 Repair and reconstruction of public and private buildings (airports, facilities, housing, schools, and so on) and infrastructure (sanitation, roads, railroads, and so on).
Local allocation tax grants to local governments
2,878.0 Specialtaxallocationfordiscretionaryspending.
Reconstruction grants for local governments
1,848.0 ProgramformunicipalitiesintheSpecialZone for Reconstruction.
Public financing (loan) programs
1,433.3 Loan programs for small and medium enterprises(SMEs),agricultureandeducationindustries, homeowners, and so on.
Economic and social restoration measures and miscellaneous expenses
4,050.6 Supporttoeconomicrestorationsuchasemploymentmeasures,measuresforSMEs,agriculture-related industries, and so on. Supporttosocialrestorationsuchashousinggrants, health-care support, education assistance, and so on.
Miscellaneouscostssuchasself-defenseandpoliceforces;food,fuel,electricity,andnaturalresourcesupplies;internationalinformationsharing;andsoon.
Contingency reserve for recovery and reconstruction from the GEJE
1,200.0
Debris management 1,082.1
Disaster relief 773.2 Temporary housing, condolence money, and so on.
Disaster reduction measures 1,057.9 Earthquake-resistant building of schools (national).
Reconstruction from nuclear damage
836.9
Compensation for damage by nuclear accident
275.4 Securitymoney,investment.
Interest payments for reconstruction bonds
125.3
TABLE 4: Explanation of central government funding allocations for the GEJE
Source: Authors,withdatafromJapanMinistryofFinance.

9The Financial and Fiscal Impacts
and local governments equally share the liability. Following the GEJE, however, the law was amended with the central government’s share being increased to 80 percent for the GEJE.7 The central government budgeted ¥352 billion between the first and second supplemen-tary budgets to fund its additional liability under the program.
The role of the central government in funding reconstruction is emphasized in the central reconstruction policy, the Basic Guidelines for Reconstruction in Response to the Great East Japan Earthquake. The Basic Guidelines promote a full-scale national response that will “make use of all possible measures to support reconstruction efforts of the disaster-afflictedlocalgovernments,”andestablishaSpecialZoneforReconstructionwithinwhichlocal governments, residents, and industries are eligible for tax reductions and incentives and budget and financial subsidies. One of the most significant supporting subsidies is the reconstruction grant program for local governments. Under this program, after having their reconstruction plans approved, municipalities receive grants worth 50 percent of project costs for infrastructure and asset reconstruction and 80 percent for supporting proj-ects. The remainder of the project costs can be financed by the special local allocation tax provided by the central government, effectively eliminating any additional expenses to the municipal government (Reconstruction Agency 2012).
Through FY12, the central government provided ¥1.6 trillion in GEJE reconstruction grants and about ¥3 trillion in local allocation tax grants to local governments. Restrictions on the use of the special local allocation tax grants have been relaxed for the GEJE reconstruction, allowing for spending at the discretion of local governments.
7 This amendment only applies for the GEJE. Cost sharing remains 50/50 for all other disaster events.
FY10Contingency Budget
0
1,000
2,000
3,000
4,000
5,000
6,000
7,000
8,000
¥ bi
llion
9,000
10,000 60%
50%
40%
30%
20%
10%
0%
FY11Contingency Budget
1stSupplementary
Budget
2ndSupplementary
Budget
3rdSupplementary
Budget
4thSupplementary
Budget
FY12 Bridge andSpecial Account
Budgets
14 Mar11
67.8
0.35%
Amount (billion yen)
% of total GEJE spending through FY12
Apr 11
50.3
0.26%
2 May 11
4015.3
20.95%
25 Jul 11
1998.8
10.43%
21 Nov 11
9243.8
48.23
8 Feb 12
6.7
0.03%
1 Apr 12
3784.6
19.75%
FIGURE 2: The GEJE financial allocations and timing, FY10–12
Source: Authors,withdatafromJapanMinistryofFinance(2012).

10 KNOWLEDGE NOTE 6-4
Reduced tax revenues from special tax measures
The GoJ implemented a series of special tax measures designed to increase the cost sharing of disaster recovery and reconstruction by the Japanese population and private sector (table5).Manytax incentivemeasuresalsoaimedtoattract thedevelopmentofpriority industries in the reconstruction zone. These tax incentives were complemented by financial incentives through subsidies in some cases.
In the longer term, these tax measures would help to widen and deepen the government’s tax base and raise tax revenue. In the short term, however, they reduced the tax revenues of the central and local governments. The central government, therefore, bore the full costs and compensated the local governments for their decrease in revenues (Reconstruction Agency 2012).
Target Goal of measures Measures
Japanese population and private sector
Encourage contributions to recovery and reconstruction efforts
• Increaseofmaximumdeduc-tion from income tax for contributions to the GEJE.
• Incometaxdeductionforinvestments in companies contributing to the regional recovery.
Disaster-affected population and enterprises
Relieve financial and administrative burden
• Individuals:Specialtreat-ments for casualty losses, property damage (housing, household assets, motor vehicles), pension savings, and so on.
• Firms:Specialtreatmentsforinventory and asset losses, withholding taxes, and so on.
Promote investment and growth in reconstruction zones
• Taxincentivestopromotein-vestment, employment, and research and development in selected industries (for example, renewable energy, agriculture, and medical).
TABLE 5: Special tax measures in response to the GEJE
Source: Authors,withinformationfromtheJapanNationalTaxAgency(2011).

11The Financial and Fiscal Impacts
GoJ’s short-, medium-, and long-term disaster financing methods and their fiscal impacts
Short-term financing mechanisms
The GoJ moved with remarkable speed to mobilize emergency relief funding following the GEJE. Within three days, the Cabinet Office was determined to draw down on Japan’s FY10 general contingency budget8 to procure and transport emergency relief supplies to the disaster-affected areas. A total of ¥67.8billionwasmobilizedbeforetheendofMarch;in April, another ¥50.3 billion was drawn down from the FY11 general contingency budget for transitional shelter. This funding was quickly mobilized because, unlike supplementary budgets, prior parliamentary approval was not required.9 Thus, the general contingency budget provided immediate bridge financing till more substantial funding could be mobi-lized (figure 2).
Within two months, the GoJ approved a ¥4,015.3 billion supplementary budget for relief-and-recoverycosts.ForthisFirstSupplementaryBudget,theMinistryofFinancelookedwithin the existing budget for funding sources. The approved budget relied on a combi-nation of budget reallocation (¥660.6 billion), borrowing from the pension fund (¥2,489.7 billion), contribution from public works projects (¥55.1 billion), and liquidation of the full FY11 allocation to the Contingency Reserve for Economic Crisis Response and Regional Revitalization (¥810 billion).
This approach illustrates the GoJ’s resourcefulness, but also demonstrates the limitations of ex post budget adjustments to finance disasters. Budget reallocation was used for the first supplementary budget and again for the third (¥164.8 billion). In sum, though, less than 1 percent of the FY11 general account budget was reallocated to the GEJE recovery efforts, and budget reallocation contributed only 5.4 percent of current total central govern-ment spending on the event. Furthermore, more than half the funding for the first supple-mentary budget was borrowed from the pension fund, which allowed the government time to mobilize additional resources that have to be repaid at a later date. Finally, the government redirected the full FY11 Contingency Reserve for Economic Crisis Response and Regional Revitalization toward the disaster—the intent of this reserve, however, was not for natural disasters but for economic measures required to stabilize Japan’s economic situation during times of financial crisis.10
In late July, the smaller second supplementary budget was passed. The GoJ was able to fund this budget with surplus from FY10, the result of higher-than-expected FY10 tax revenues and unused funds.
8Forthe23yearspreceding2010,Japan’sgeneralcontingencybudgetwasallocated¥350million;in2010 this allocation was lowered to ¥300 billion, representing about 0.3 percent of the central govern-ment’s initial general account budget for 2010. 9 Retroactive parliamentary approval is allowed for expenditures from the general contingency budget. 10 The Contingency Reserve for Economic Crisis Response and Regional Revitalization was intro-duced in the budget in FY10 in response to the worsening economic situation caused by the global financial crisis. The contingency budget had previously been used to support employment programs for college graduates as well as other economic support programs.

12 KNOWLEDGE NOTE 6-4
Medium- to long-term financing mechanisms
The government’s short-term measures funded relief-and-recovery activities while it formu-lated its reconstruction policy. When the Basic Guidelines policy document was released at the end of July, it set a conceptual framework of sharing the costs of GEJE reconstruction within this generation and not passing them on to future generations of Japanese. Financial resources provisioned for use by the Basic Guidelines are listed in figure 3.
OnNovember30,2011,thebillonspecialmeasurestosecurefinancingforGEJErecon-struction was passed. Its approval followed a great deal of debate about what debt and tax measures the government should take for the GEJE. Under the approved plan, issuance of Japanese Government Bonds (JGBs) financed the majority of the estimated reconstruction costs. The bulk of repayment costs for these bonds were secured through tax increases. Personal income tax, in the form of surtax, was raised for 25 years starting in 2013. A 5 percent corporate income tax cut that was initially planned in 2011 was postponed, and a ¥1,000 increase in per capita local tax (currently ¥4,000 per year) was included. Table 6 provides details on the increases and their projected revenue generation.
While the tax measures will be phased starting in FY12, reconstruction bond issuance commenced in early December 2011. In total, slightly more than ¥14.2 trillion of JGBs have been issued or planned thus far: approximately ¥11.6 trillion for the third supplementary budget of 2011 and nearly ¥2.7 trillion for FY12. Interestingly, about 25 to 30 percent of reconstruction bonds are being sold to retail investors with 3-, 5-, and 10-year maturities. A portion of these bonds are reconstruction supporters bonds that facilitate financial support and solidarity from the Japanese public. These bonds offer the lowest possible interest rate for government bonds (0.05 percent) for three years, before converting to standard JGB rates. The GoJ has recruited Japanese celebrities to market the bonds and is offering gold and silver commemorative coins to purchasers (figure 4).
Fiscal impacts of the GoJ’s financial measures
Although the GoJ is endeavoring to minimize debt costs and tax increases, the financial measures it has taken for reconstruction have had significant fiscal impacts. The GEJE was “a crisis in the midst of a crisis,” and the financial burden of the event has placed significant additional strain on public finance.
FIGURE 3: Financial resources identified in the Basic Guidelines
• Reductionofgovernmentexpenditures.
• Sellingofstate-ownedproperties.
• Reviewsofthespecialaccountsandpersonnelsalariesofpublicservants.
• Increasesinnontaxrevenues.
• Temporarytaxationmeasures.

13The Financial and Fiscal Impacts
FIGURE 4: Design of commemorative coin by elementary student
Even before the GEJE, Japan’s public finance under stress, as budget deficits of the central and local governments grew. Credibility of the JGBs and its sovereign debt rating was, and still is, declining—it is now rated at the same level as China by each major rating agency (figure 5). Compared to its accumulated central government debt-to-GDP ratio at thetimeofthe1995Kobeearthquake,whichwaslowerthanone-halfofGDP,theGoJ’scentral government debt was about 140 percent and growing at the start of FY11 (debt ratios of Hyogo prefectural and municipal governments doubled and remain higher than prior to the event).
One of the factors driving the government’s increasing dependence on debt has been Japan’s aging population and decreasing tax revenue. The population share aged 65 and aboveisexpectedtoincreasefrom21.5percentin2007upto40percentin2050.Suchaging is already increasing the fiscal burden on the government, as it needs to spend more on social expenditure. In addition, in recent years, tax revenues have been declining due to the global financial crisis and tax cuts. While Japan still can increase some tax forms, others, such as the corporate income tax, are already high.11
11AccordingtotheIMF(2011),Japan’sconsumptiontax(valueaddedtax,orVAT)isthelowestofadvancedeconomieswithaVAT,anditspersonalincometaxstructureallowsmuchroomfordeduc-tions and provides low marginal rates for the middle class.
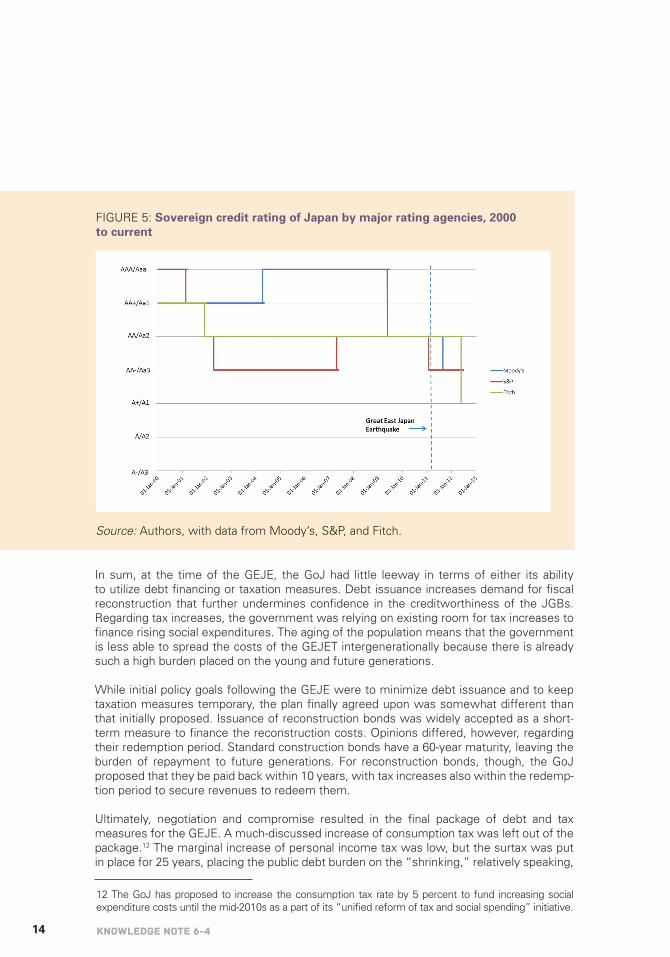
14 KNOWLEDGE NOTE 6-4
In sum, at the time of the GEJE, the GoJ had little leeway in terms of either its ability to utilize debt financing or taxation measures. Debt issuance increases demand for fiscal reconstruction that further undermines confidence in the creditworthiness of the JGBs. Regarding tax increases, the government was relying on existing room for tax increases to finance rising social expenditures. The aging of the population means that the government is less able to spread the costs of the GEJET intergenerationally because there is already such a high burden placed on the young and future generations.
While initial policy goals following the GEJE were to minimize debt issuance and to keep taxation measures temporary, the plan finally agreed upon was somewhat different than that initially proposed. Issuance of reconstruction bonds was widely accepted as a short-term measure to finance the reconstruction costs. Opinions differed, however, regarding theirredemptionperiod.Standardconstructionbondshavea60-yearmaturity,leavingtheburden of repayment to future generations. For reconstruction bonds, though, the GoJ proposed that they be paid back within 10 years, with tax increases also within the redemp-tion period to secure revenues to redeem them.
Ultimately, negotiation and compromise resulted in the final package of debt and tax measures for the GEJE. A much-discussed increase of consumption tax was left out of the package.12 The marginal increase of personal income tax was low, but the surtax was put in place for 25 years, placing the public debt burden on the “shrinking,” relatively speaking,
FIGURE 5: Sovereign credit rating of Japan by major rating agencies, 2000 to current
Source: Authors,withdatafromMoody’s,S&P,andFitch.
12 The GoJ has proposed to increase the consumption tax rate by 5 percent to fund increasing social expenditure costs until the mid-2010s as a part of its “unified reform of tax and social spending” initiative.

15The Financial and Fiscal Impacts
younger generation. Furthermore, there is a risk that reconstruction tax revenues will not match with expenditures for servicing reconstruction debt, which is being aligned with the broader plan for government debt issuance.13 In addition, long-term uncertainty about macroeconomic conditions increases the risk of mismatch between projected and actual tax revenues.
In the context of the government’s gross outstanding debt, the additional reconstruction bonds issued in FY11 and FY12 make small contributions (figure 6). That said, they force a change in the government’s medium-term fiscal policy to reduce debt issuance year on year, as the total amounts issued in FY11 and FY12 are greater than the reduction in nonreconstruction debt issuance. This dynamic poses challenges for the government’s fiscal consolidation target to halve the deficit-to-GDP ratio from FY10 by FY15 (Cabinet Office 2010).
FIGURE 6: Accumulated GoJ bonds outstanding, FY1965–FY2012
Source: JapanMinistryofFinance(2011).
13TheActforSpecialMeasuresforSecuringFinancialResourcesNecessarytoImplementMeasuresfor Reconstruction Following the GEJE does stipulate, though, that reconstruction bonds must be redeemed by 2037, within the term of income tax increase (Article 71).

16 KNOWLEDGE NOTE 6-4
LESSONS
• The GoJ’s broad contingent liability to natural disasters results from its responsibilitiesexplicitlydefinedinJapaneselawsandtheimplicitexpecta-tionsofsociety,whichcanresultinextraordinaryfiscalcosts,asevidencedbythe GEJE. The GoJ is expected not only to reconstruct assets, but to restore social and economic well-being following a major disaster. This role aligns with the Japa-nese values of solidarity and cooperation, but implies that the public finance system is highly exposed to disaster risks. The GEJE raised general account spending by nearly 16.6 percent in FY11—an earthquake striking Tokyo, for example, could stress the system much further. Quantitative analysis of the government’s contin-gent liability to disasters would be an important first step toward management of its financial exposure to this type of event.
• Local governments are at the frontlines of disaster response and reconstruc-tion and thus the most aware of local needs, but local public finance haslimitedcapacitytocopewith large-scaledisasters.The liability of the central government was expanded following the GEJE (for example, under the NaturalDisasterVictims’ReliefLaw),and transferschemesweredesigned toallowthecentral government to fund locally designed reconstruction plans. While the magni-tude of the GEJE exceeded what might be reasonably expected for local public finance to manage, it provides an opportunity to review and strengthen the effec-tiveness of local governments’ disaster-financing mechanisms.
• The GoJ’s contingency budget allows it to quickly mobilize funding for aneffective disaster response.14 The flexibility and immediate availability of the GoJ’s contingency budget allowed it to approve funding within three days of the GEJE to finance immediate emergency relief. Although relief costs represent a very small portion of the overall amount spent on the disaster, they serve an essential function in mitigating additional fatalities and damages linked to a slow response effort.
• Tax measures can be used effectively ex ante to incentivize investment in disaster prevention and ex post to facilitate cost-sharing of reconstruction by the population and private sector. Japan has a series of laws that provide tax incentives for investment in earthquake mitigation. Although difficult to quantify, these incentives promote risk reduction and likely reduced losses from the GEJE in some areas. Following the event, the government immediately enacted tax relief measures for affected populations and industries, and it built tax incentives into its reconstruction policy. It also offered special tax deductions to individuals and corpo-rations that contributed to the reconstruction and recovery effort, thus facilitating solidarity and cost-sharing by the unaffected population and private sector.
• Financial demands placed on the government by major disasters exacerbate the underlying structural problems of the fiscal system. The GEJE forced the government to issue additional debt and pass tax increases in an economic and fiscal environment in which these actions were not only unfavorable, but counter
14 Equally as important, it was able to smoothly execute these funds for reconstruction due to prea-greementswithprivatesectorfirms.SeeKN4-1ofthisseriesforadditionalinformation.
17The Financial and Fiscal Impacts
to fiscal management policy. The experience emphasized the imperative of having a robust fiscal system capable of absorbing large disaster shocks. For Japan to achieve prompt and enduring reconstruction, it should look beyond restoration, which brings the Japanese economy back to the predisaster state, and seek to strengthen the economy and society in a broader sense to prepare for the future.
• A lack of ex ante financial planning for disasters can contribute to disagree-ments and possible delays around securing reconstruction funding. Although Japanese law allows for the government to secure funding for disasters in broad terms, lack of a clear “blue print” for how the government would finance reconstruc-tion opened space for prolonged deliberation on appropriate measures. Alternative plans and road maps for flexibly financing reconstruction under different scenarios, both in terms of the type and scale of disaster and the economic and fiscal environ-ment, could be designed to prevent this from occurring in the future.
RECOMMENDATIONS FOR DEVELOPING COUNTRIES
Japan’s public finance responsively provided financing for an effective relief effort, but was stressed by the extensive burden of recovery and reconstruction funding requirements. In developing countries, where governments’ fiscal options to finance disasters are likely more limited—for example, due to structural weaknesses such as lack of income support, inadequate financial resources, and lack administrative capacity—fiscal impacts of these events can be even more substantial. The following recommendations could mitigate the impacts of disasters on governments’ long-term fiscal balances and increase their financial response capacity in the aftermath of a disaster.
Treat disaster risks as a contingent liability of the government
• Quantitatively assess the government’s contingent liability in the event of natural disasters. Identify the government’s explicit (that is, stated by law) and implicit (that is, socially and politically expected) contingent liabilities for disasters. Historical analysis, complemented with information from probabilistic risk models, can provide a sense of the government’s recurrent financial needs as well as possible major losses from catastrophic events related to these contingent liabili-ties. In addition, where risks cannot be quantitatively assessed, they should be qualitatively identified and discussed. Clear definition of the government’s contin-gent liability helps to protect public finance from an open-ended financial liability to disaster events.
• Develop a disaster-risk-financing strategy as part of the government’s broader fiscal risk management strategy. The disaster risk financing and insur-ance strategy should combine ex post and ex ante measures to optimize the timing, cost-efficiency, and effectiveness of disaster funding. For short-term postdisaster liquidity needs, the strategy should rely on ex ante budgetary and possibly market-based instruments, such as contingency budgets, reserve funds, and contingent credit. For the longer term, major reconstruction costs, a “blue print” for mobiliza-
18 KNOWLEDGE NOTE 6-4
tion of ex post financial resources (for example, debt issuance and tax increase) shouldcomplementtheexantemeasures.Scenarioanalysisshouldbeconductedto ensure the robustness of the strategy for disasters of varying type, magnitude, and location under different macroeconomic and fiscal conditions.
• Understand the roles and financial responsibilities of the central and local governments in this process. Local governments should, to some extent, share financial responsibility for disasters affecting their territories. But local and central governments should agree together ex ante whether and how sharing of these financial responsibilities changes after severe disasters.
Reduce the contingent liability of the government in the long term
• Use fiscal tools such as taxation and subsidization to encourage ex ante DRM. The government could decrease residential and private sector dependence on post-disaster government aid by using tax and/or subsidy tools to encourage ex ante DRM. Although the relative power and ease of use of tax versus subsidy toolsvaries across countries, the government could achieve similar ends through either means by offering tax incentives or subsidies for investment in disaster prevention. It could also promote minimum levels of prevention by imposing tax penalties or fees for underinvestment in risk reduction and/or for risk-increasing actions.
• Promote the development of private catastrophe risk insurance markets. The deepening of private catastrophe risk insurance markets shifts more of the burden of postdisaster recovery to specialized risks carriers. The government can encourage the development of functioning catastrophe risk markets by putting in place and enabling the legal and regulatory framework, developing risk market infra-structure, and facilitating risk-pooling mechanisms.
REFERENCES
Cabinet Office. 2010. Fiscal Management Strategy. Tokyo.
———. 2011a. Disaster Management in Japan. Tokyo.
———. 2011b. Medium-term Fiscal Framework (FY2012-FY2014). Tokyo.
———. 2011c. The Guidelines on Policy Promotion for the Revitalization of Japan. Tokyo.
IMF (International Monetary Fund). 2011. Japan: 2011 Article IV Consultation. Rep. no. 11/181,InternationalMonetaryFund,Washington,D.C.
Ministry of Finance, Financial Bureau. 2011. “Highlights of FY2012 Government DebtManagement.”
MinistryofFinance.2012.“FinancialBudgetforEachFiscalYear.”http://www.mof.go.jp/budget/budger_workflow/budget/index.html.

19The Financial and Fiscal Impacts
NationalTaxAgency.2011.National Tax Agency Report 2011.Tokyo:NationalTaxAgency,
ReconstructionAgency.May2012.“ReconstructionProcessonTrack.”Presentation.
Reconstruction Headquarters in Response to the Great East Japan Earthquake. 2011. Basic Guidelines for Reconstruction in Response to the Great East Japan Earthquake.
WorldBank.Forthcoming.“RiskAssessmentandManagementofNaturalDisastersfromaFiscal Perspective.” Framework Paper, World Bank, Washington, DC.

1Strategies for Managing Low-probability, High-impact Events
KNOWLEDGE NOTE 6-5CLUSTER 6: The economics of disaster risk, risk management, and risk financing
Strategies for Managing Low-probability, High-impact Events

2 KNOWLEDGE NOTE 6-5
Prepared by Kenzo Hiroki, International Centre for Water Hazard and Risk Management, Public Works Research Institute

3Strategies for Managing Low-probability, High-impact Events
Strategies for Managing Low-probability, High-impact Events
Every country should develop strategies for managing low-probability, high-impact extreme events—strategies that reflect their own as well as global experiences with megadisasters. These strategies should integrate structural and nonstruc-tural measures tailored to local conditions. Forecasting and early warnings, land-use planning and regulation, hazard maps, education, and evacuation drills are all vital. Lessons from the Great East Japan Earthquake (GEJE) can help improve these nonstructural practices, which in Japan have been shaped by trial and error after experiences with many natural disasters. The international community should develop knowledge-sharing mechanisms to help countries prepare for low-proba-bility, high-impact extreme events.
FINDINGS
National strategies to address low-probability, high-impact extreme events
The Great East Japan Earthquake (GEJE was the first disaster in Japan’s modern history that exceeded all expectations and predictions. Its dimensions were almost “beyond imagi-nation” (KN 5-1). Its enormous impact prompted the government to seek a paradigm shift in disaster risk management (DRM), moving from structure-focused prevention to a strategy of mitigation by integrating structural and nonstructural measures.
Excessive reliance on structural measures proved to be ineffective, and even detrimental, when the forces of nature exceeded the structures’ design limitations. In some towns, evacuation was delayed because people did not expect a tsunami to overtop an embank-ment as high as 10 meters or more. Some could not escape the tsunami in time because they had moved their homes to the lowlands along the coast to be closer to their source of income. They felt safe because high embankments had been built (KN 2-2-2).
Addressing low-probability, high-impact extreme events requires an integrated DRM strategy, combining structural and nonstructural measures. Disasters should be catego-
KNOWLEDGE NOTE 6-5CLUSTER 6: The economics of disaster risk, risk management, and risk financing

4 KNOWLEDGE NOTE 6-5
rized into two levels: level 1 consists of disaster events that occur with relatively high frequency (with a return period of around 100 years or less) and level 2 consists of events that rarely happen (with a return period of around 1,000 years or more). The GEJE was a level 2 event as illustrated in figure 1. Level 1 events can be addressed mainly by disaster prevention structures, while level 2 events require an integrated DRM strategy.
Strategies for level 2 events should focus on saving lives. Measures to be used in an inte-grated manner to ensure immediate evacuation include installing disaster forecasting and early warning systems; land-use planning; designating and building of evacuation sites, shelters, and other facilities; and installing structures to delay and weaken the force of waves. Education, practice drills, and mutual help mechanisms are extremely important. Urban and land-use planners need to consider mechanisms for speedy emergency evacu-ation and for sustaining social and economic activities. People’s participation is the critical factor in the planning process.
During the GEJE, catastrophic damage was inflicted when structures were overtopped by the tsunami, reached their breaking point, and suddenly collapsed. Structures should be resilient enough to hold up, or succumb gradually, even when the natural forces exceed their structural design limitation. Nonstructural measures such as land-use planning, fore-casting and warning systems, evacuation drills, and public awareness-raising, should be designed with enough redundancy and flexibility to address different disaster scenarios.
FIGURE 1: Magnitude of earthquakes in Japan
Source: Cabinet Office.

5Strategies for Managing Low-probability, High-impact Events
Strategies should take into account the unexpected. In the GEJE, many plans did not specify the actions to be taken in the face of an unexpected event, contributing to cata-strophic damage to facilities, communities, and socioeconomic systems.
Structural measures
Structural measures will continue to play a key role in managing low-probability, high-impact extreme events. Although many disaster prevention structures, such as tsunami defense dikes and gates, collapsed and were washed away in the GEJE, some withstood the waves even after they were overtopped, reducing the force of the tsunami and delaying its pene-tration inland (KN 1-1-1). In a number of cases the dikes were not overtopped, and kept the hinterlands from being inundated. Postdisaster computer simulations for the Kamaishi Port indicated that the wave breakers around the port reduced the peak height of the tsunami by 40 percent: from 13.7 meters to 8 meters.
Damage by the tsunami of 10 meters or higher to structures and buildings was extensive and severe. Almost all buildings and structures made of wood were destroyed. Iron struc-tures were left with only their skeletons. Most reinforced concrete buildings withstood the tsunami, although they suffered internal damage (KN 1-2).
After the Indian Ocean tsunami and Hurricane Katrina, design standards for defensive structures, such as dikes and water gates, have been reevaluated. The conclusion is that using only preventive structures to defend against low-probability extreme events is not an economically, environmentally, or socially viable option. For example, it is not realistic to try to protect hundreds or even thousands of kilometers of seacoast using embankments, even as high as 20 meters.
Tsunamis should be classified into two or more categories. Level 1 tsunamis may occur once in a 100 years; level 2 tsunamis are extreme events that may occur once in a 1,000 years or more. Disaster mitigation structures such as wave breakers and dikes should be designed to prevent inland penetration by level 1 tsunamis, saving lives and properties. Although these structures could be overtopped by a level 2 tsunami, they should be able to withstand complete collapse, thereby reducing the force of the tsunami and delaying its progress. In the case of level 2 tsunamis, the structure is not expected to achieve complete mechanical prevention, but rather to mitigate damage, in combination with other nonstruc-tural measures.
Using infrastructure such as highways and trunk roads as defensive structures is also recommended. In the GEJE, coastal highways and trunk roads functioned not only as evac-uation routes but also as temporary evacuation sites and even as dikes (KN 1-4).
People in Kamaishi city’s Katakishi district fled to the Sanriku-Jukan Expressway which had opened on March 6, 2011, just six days before the earthquake. The expressway, which was on a hill, first served as an evacuation area and then as a main road for delivering relief goods and reconstruction materials. National routes running along the coast served as embankments preventing the tsunami from advancing inland.
6 KNOWLEDGE NOTE 6-5
Nonstructural measures
As Sanriku’s coastal areas have been repeatedly hit by tsunamis, many towns and commu-nities had developed both structural and nonstructural measures which mitigated the impact of the tsunami substantially.
In addition to information dissemination and evacuation measures, the following nonstruc-tural approaches were found to be effective against extreme water disasters:
• Moving residential areas and public buildings to higher ground, while keeping commercial installations and activities based in the lowland coastal areas (KN 2-8).
• Securing evacuation routes (such as roads and stairways) that connect public facili-ties (such as schools) to higher ground (KN 1-4).
• Planting trees densely in coastal areas (KN 2-8).
• Using tall concrete buildings (four to five stories or higher) as evacuation places.
• Using highways and trunk roads as secondary protective embankments.
The government of Japan enacted a new law—the Act on Tsunami Resilient Community—to promote these nonstructural measures in the tsunami-affected municipalities (see KN 2-7). The act requires: restricting the construction of buildings in risk areas; introducing inte-grated tsunami mitigation plans comprising evacuation routes and facilities, hazard mapping, drills, and warning systems; relaxing the floor-space ratio of buildings to encourage the construction of taller buildings; reducing property taxes on designated evacuation sites; and relocating houses to higher ground.
Evacuation
Evacuation is the highest priority in low-probability, extremely high-impact events (KN 2-6). A large number of casualties can be expected not only because of the scale of the event, but also because:
• The lead time is shorter because of the sudden or unexpected occurrence of the event.
• Information networks and tools tend to malfunction when sensors and communica-tion lines are destroyed, constraining people to react without accurate information.
• Evacuation options tend to be limited as the means of evacuation become fewer, for example, roads become impassable, traffic jams occur, and so on.
• People base their actions on past experiences with less-severe disasters, leading them to underestimate the time they have to evacuate and the severity of the consequences.
7Strategies for Managing Low-probability, High-impact Events
Raising awareness, education, and practice drills are the keys to ensuring faster, more complete evacuation in extreme events.
In Kamaishi City, where 1,000 people died out of a population of 40,000, the casualty rate among school children was low. Only 5 out of the 2,900 primary and junior high school students lost their lives. A survival rate of 99.8 percent for these school children is most impressive in a city where 1 in 40 lost their lives: the rate for school children was 20 times higher than for the general public. According to one headmaster, “repetitive drills, school education, and hazard maps” were the reasons for the high survival rate (KN 2-3).
In Kamaishi city, “a touch of disaster” is built into various lessons. In mathematics, for example, students may be asked “If the speed of a tsunami is xx kilometers per hour when it hits land, how long will it take the tsunami to get from the coast to a house that is xxx kilometers inland?” In a field exercise, students produced a tsunami hazard map on their own by visiting hazard and evacuation areas within the school district.
The students were also trained in key concepts, such as:
• “Tsunami tendenko,” that is, “Everybody should immediately evacuate without caring for anything or anybody else at tsunami onslaught.”
• Do not believe in human assumptions of disasters, even one in a hazard map, as nature behaves differently from human assumptions.
• Do your maximum when encountering disasters. Always think and be prepared for the worst.
• Lead evacuation—you are saving others’ lives by showing that you are evacuating for life and death.
• Although more than 90 percent of students were out of school when the earth-quake occurred on March 11 (whether they were walking home, playing outside, or in their homes), almost all of them headed for higher, safer areas on their own initiative and encouraged the others to run with them to safety. Having already discussed it in their homes, children and parents alike knew and trusted that they would all evacuate individually if a tsunami hit Kamaishi.
Keeping individual, community, and institutional memory alive between disasters is critical to successful evacuation. A number of monuments had been built in the coastal towns commemorating past events and citing lessons such as: “Run to a hill if you feel a strong shake or the sea suddenly withdraws.” An nongovernmental organization (NGO) has called for the planting of cherry trees to delineate where the tsunami reached on March 11, so that future generations would remember the extent of the flooding.
The elderly, the disabled, and foreigners or outsiders to the locality needed extra help in evacuating. Sixty-five percent of those who died in the GEJE were more than 60 years old, which raised the issue of how senior citizens can be safely evacuated.
8 KNOWLEDGE NOTE 6-5
Hazard maps
Hazard maps are a useful tool for enhancing the preparedness of local governments, municipalities, and residents, but they can exacerbate the damage if not prepared or used properly. A number of cities and towns had produced and distributed hazard maps. In some of the towns they contributed to faster evacuation, but in others they actually provided misinformation since the tsunami was far larger than the hazard maps assumed. Casualties occurred because some of the designated evacuation sites and buildings where people had fled to were totally submerged. Many people who were living in nonflooding zones, according to the hazard map, had not evacuated when the tsunami hit (KN 5-1).
Both level 1 and 2 events should be accounted for in hazard maps so that people will have enough information to deal with either category. Hazard maps should indicate all evacuation options. Just distributing these maps to citizens is not enough—evacuation practices drills should be conducted using these maps. Preparing hazard maps with people’s participation will also help ensure effective evacuation.
Forecasts and warnings
Accurate forecasting and early warning systems are vital for safe and quick evacuation and disaster response. In the GEJE, hundreds of thousands of people evacuated in response to the warning by the Japan Meteorological Agency (JMA) a few minutes after the earth-quake. The Earthquake Early Warning System also enabled all the high-speed express trains, traveling at over 200 kilometers per hour, to come to a halt before the main tremor, which saved thousands of passengers. The emergency warning system announced the arrival of the main tremor nationwide on TV and other broadcasting systems, providing the public with a little lead time (a few to 10 seconds) to react (KN 2-2-1).
Although the earthquake and tsunami warning system helped save many lives, there was room for improvement and some key lessons emerged. Because of the unprecedented size and complexity of the event, the JMA’s first announcement underestimated the maximum tsunami height at 6 meters, while the actual height was more than 10 meters. Although the forecast was corrected 10 to 20 minutes later, the original estimate may have caused people to delay their evacuation, possibly leading to increased casualties. This occurred even though Japan is equipped with one of the most advanced forecasting and warning systems. The international community should invest not only in the installation of existing disaster forecasting and warning systems, but also in the development of new systems in combination with repetitive drills/practices. Advanced off-the-coast water pressure gauges and global positioning system (GPS)-based wave sensors have been effective in monitoring tsunami heights.
Addressing “chain of events” effects
The disaster unleashed a chain of events that affected people and organizations beyond Tohoku, including national, regional, and global economies. Following are a few examples of the chain of events observed in Japan:
9Strategies for Managing Low-probability, High-impact Events
• Earthquake and tsunami ➞ nuclear accident ➞ power shortage ➞ economic stagna-tion ➞ social unrest.
• Earthquake and tsunami ➞ dramatic increase in telecommunication activity ➞ tele-communication system failures ➞ interruption of social and economic activities (KN 3-2).
• Earthquake and tsunami ➞ damage to specific industries ➞ interruption of parts supply ➞ global slowdown of industrial activities (KN 6-3).
Although it is impossible to foresee every eventuality, DRM strategies should include contin-gency measures for preventing the knock-on effects of low-probability, high-impact events (KN 1-5). Providing for sufficient redundancy in various systems is one way of breaking the chain; business continuity planning is another (see KN 2-1-4). Analyzing past examples of “chain of events” effects, and sharing them with the public, the business sector, and governments can help prevent them from recurring.
LESSONS
Overall strategy
• Use integrated disaster mitigation strategies, rather than structure-focused disaster prevention measures, to address low-probability, high-impact extreme events.
• Categorize tsunamis into level 1 events (fairly frequent disasters) and level 2 events (low-probability, high-impact extreme disasters). Level 1 can be addressed by preventive structures; level 2 requires integrated measures.
• For level 2, prepare strategies that focus on saving lives.
• Use resilient disaster mitigation systems, structural and nonstructural, in strategies to address level 2 events.
• Consider and discuss what should happen if an event exceeds expectations. This is critical in establishing effective, functional strategies.
Structural measures
• Structural measures can mitigate low-probability, high-impact extreme events if they are resilient and resistant to natural forces.
• Structural measures should be included in an integrated disaster mitigation strategy.
• Highways and trunk roads along the coast should be used as secondary protective embankments against tsunamis.

10 KNOWLEDGE NOTE 6-5
Nonstructural measures
In addition to information dissemination and evacuation, the following nonstructural measures have been effective against water-related megadisasters:
• Moving entire residential areas and public buildings to higher ground while keeping commercial enterprises and activities in the coastal areas.
• Securing the evacuation routes (such as roads and stairways) that connect public facilities (such as schools) to higher ground.
• Planting trees in coastal areas.
• Using tall concrete buildings (of four to five stories or higher) as places for evacua-tion.
Evacuation
• Drills, education, and awareness-raising are the keys to ensuring effective, more complete evacuation.
• “Tsunami tendenko,” that is, everybody should evacuate immediately without waiting for anything or anyone else when the tsunami is assumed/feared to approach.
• Prior discussion at home and in communities about evacuation helps ensure its success.
• Blind assumptions should not be made about any disaster, even those reflected in hazard maps, as nature behaves differently from human assumptions.
• Individual and institutional memory about past disasters should be kept alive to facilitate successful evacuation.
Hazard maps
• Hazard maps are a useful tool for enhancing the preparedness of local govern-ments, municipalities, and individuals.
• Hazard maps should address both level 1 and 2 events.
• A hazard map functions well only in combination with awareness-raising, commu-nity education, and evacuation drills.

11Strategies for Managing Low-probability, High-impact Events
Forecasting and warning
• Forecasting and warning systems pay off.
• Tsunami and disaster warning networks should be built and used globally.
• The international community should promote and invest in the use and develop-ment of new technologies to improve the accuracy and timing of forecasts and warnings.
Addressing the “chain-of-events” effect
• The indirect effects of extreme events travel far beyond the disaster-stricken areas, hence, building redundancy into systems helps break these chains of events.
• Probable chain-of-events effects should be considered in business continuity plan-ning.
• Experiences of these effects should be evaluated and shared to help prepare for future events.
RECOMMENDATIONS FOR DEVELOPING COUNTRIES
Every country needs a national integrated DRM strategy. Many of the lessons from the GEJE are relevant for developing countries. Different combinations of structural and nonstructural measures may be used depending on a range of factors, such as socioeco-nomic conditions, budgetary constraints, geography, and the scale of the disasters. In the GEJE, DRM systems relied heavily on structural measures and could not prevent damages from the tsunami (figure 2 [d]). The Japanese government is revising its tsunami DRM policies to better integrate structural and nonstructural measures (figure 2 [e]). Level 1 tsunamis will be prevented by structural measures and level 2 tsunamis will be mitigated by both structural and nonstructural measures.
It is advisable to develop integrated measures for both level 1 and 2 events. For developing countries, greater reliance on nonstructural measures may be the most real-istic approach even for level 1 events. But it is important to build structural measures to prevent loss of human lives and properties from frequent disasters. Disasters, especially high-impact events, tend to discourage people from investing for the future. Governments and communities should keep repeating the message that “prevention pays off,” to avoid creating a vicious cycle between poverty and disasters.
Forecasting and early warning is fundamental. Developing countries can and should develop local networks for forecasting and warning about disasters. Countries can also join forces in building regional and international systems. For example, Sentinel Asia is a regional network for sharing satellite imagery and other observation data free upon requests by member countries.
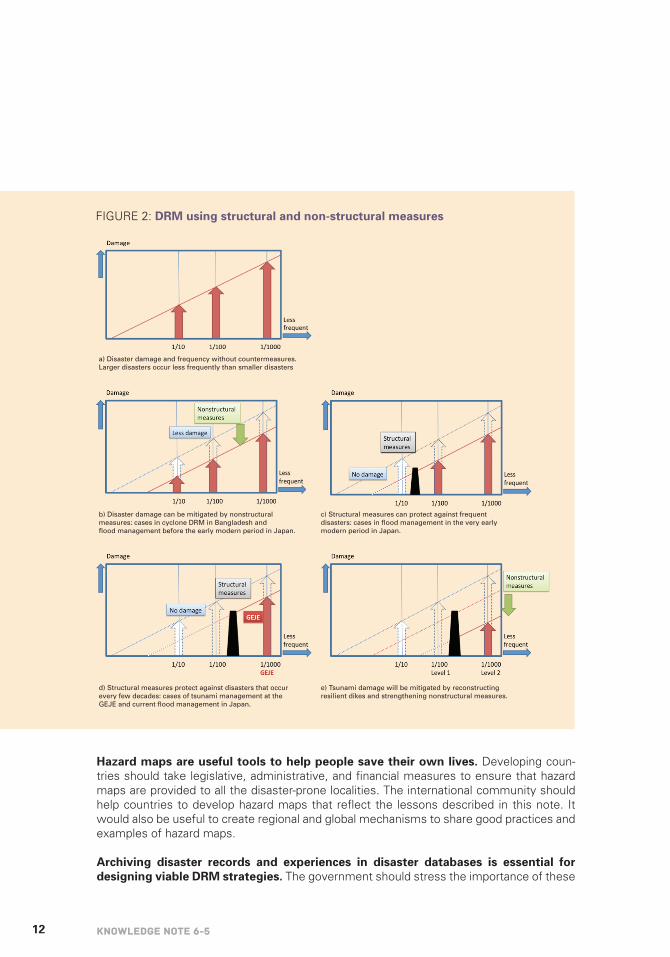
12 KNOWLEDGE NOTE 6-5
a) Disaster damage and frequency without countermeasures.Larger disasters occur less frequently than smaller disasters
b) Disaster damage can be mitigated by nonstructuralmeasures: cases in cyclone DRM in Bangladesh andflood management before the early modern period in Japan.
c) Structural measures can protect against frequentdisasters: cases in flood management in the very earlymodern period in Japan.
d) Structural measures protect against disasters that occurevery few decades: cases of tsunami management at the GEJE and current flood management in Japan.
e) Tsunami damage will be mitigated by reconstructingresilient dikes and strengthening nonstructural measures.
Hazard maps are useful tools to help people save their own lives. Developing coun-tries should take legislative, administrative, and financial measures to ensure that hazard maps are provided to all the disaster-prone localities. The international community should help countries to develop hazard maps that reflect the lessons described in this note. It would also be useful to create regional and global mechanisms to share good practices and examples of hazard maps.
Archiving disaster records and experiences in disaster databases is essential for designing viable DRM strategies. The government should stress the importance of these
FIGURE 2: DRM using structural and non-structural measures
13Strategies for Managing Low-probability, High-impact Events
less visible but critical activities and the people who are engage in them tirelessly. Regional data sharing would also benefit neighboring countries. Countries should put agreements in place to share hydrological, meteorological, geological, and other information.
Education, drills, and awareness-raising are indispensable to avoid high death tolls in low-probability, high-impact extreme events, particularly in countries where physical defenses may be insufficient. The Japanese approaches to education, drills, and aware-ness-raising have been developed over time through trial and error. But simply copying them exactly may not be advisable in other, often more challenging, circumstances. The first step is to evaluate, simulate, and test whether the Japanese measures are congruent with local social and cultural practices and behaviors.
Countries must learn from one another by sharing information and experience, since low-probability, high- impact extreme events happen infrequently in any given country. The international community could facilitate regular dialogues and information-sharing mecha-nisms, for example, through the United Nations. Regional cooperation mechanisms would serve not only to help disaster-affected countries but also to mitigate the negative inter-regional and international effects of megadisasters.