Embed Size (px)
Citation preview

LAEDC INSTITUTE FOR APPLIED ECONOMICS JUNE 2015
CALIFORNIA INDUSTRY SERIES
THE OIL AND GAS INDUSTRY IN
CALIFORNIA
ITS ECONOMIC CONTRIBUTION AND
WORKFORCE IN 2013

THE OIL AND GAS INDUSTRY IN CALIFORNIA
ITS ECONOMIC CONTRIBUTION AND WORKFORCE IN 2013 A CALIFORNIA INDUSTRY STUDY
Christine Cooper, Ph.D. Shannon Sedgwick June 2015
Institute for Applied Economics Los Angeles County Economic Development Corporation 444 S. Flower Street, 37th Floor Los Angeles, CA 90071
This research was commissioned by the Western States Petroleum Association. The LAEDC Institute for Applied Economics specializes in objective and unbiased economic and public policy research in order to foster informed decision-making and guide strategic planning. In addition to commissioned research and analysis, the Institute conducts foundational research to ensure LAEDC’s many programs for economic development are on target. The Institute focuses on economic impact studies, regional industry and cluster analysis and issue studies, particularly in workforce development and labor market analysis. Every reasonable effort has been made to ensure that the data contained herein reflect the most accurate and timely information possible and they are believed to be reliable. The report is provided solely for informational purposes and is not to be construed as providing advice, recommendations, endorsements, representations or warranties of any kind whatsoever. © 2015 Los Angeles County Economic Development Corporation. All rights reserved.

Its Economic Contribution and Workforce California’s Oil and Gas Industry in 2013
LAEDC Institute for Applied Economics i
Executive Summary
he oil and gas industry makes a significant contribution to the Californian economy. Extraction, production, refining and petroleum
products manufacturing result in highly tradable products, producing high revenues, high wage jobs and significant fiscal revenues for all levels of government. In this update to Oil and Gas in California: The Industry and Its Economic Contribution in 2012, the Institute for Applied Economics of the Los Angeles County Economic Development Corporation (LAEDC) conducts an industry contribution analysis of the oil and gas industry in California in 2013 and reviews selected characteristics of its workforce. The findings are as follows.
Total Economic Contribution The total economic contribution of the oil and gas industry in California in 2013, which includes indirect and induced activity, is presented in Exhibit ES-1:
455,940 direct, indirect and induced jobs $38 billion in total labor income $72 billion in value added, accounting for 3.4
percent of state GDP $204 billion in output, accounting for 5.7
percent of total California output. Total Fiscal Contribution The industry brings significant fiscal revenues to local, state and federal governments, as summarized in Exhibit ES-2:
$21.2 billion in state and local tax revenues $12.8 billion in federal taxes $18.9 billion in sales and excise taxes $2.1 billion in corporate income taxes
Exhibit ES-1 Total Economic Contribution of Oil and Gas Industry California 2013 Employment (jobs):
Direct 184,100 TOTAL 455,940 Percent of California Total Employment 2.1% Labor income ($ millions): Direct $ 23,280 TOTAL $ 38,280 Percent of California Total Labor Income 2.9%
Value added ($ millions): Direct $ 47,610 TOTAL $ 71,890 Percent of California Total GDP 3.4%
Output ($ millions): Direct $ 165,500 TOTAL $ 203,790 Percent of California Total Output 5.7%
Source: Estimates by LAEDC
Exhibit ES-2 Fiscal Contribution of Oil and Gas Industry California 2013 State and Local Taxes ($ millions):
Sales and excise taxes $ 14,830 Property taxes 3,630 Personal income taxes 1,170 Corporate income taxes 430 All other taxes 1,180 Total State and Local Taxes $ 21,240 Federal Taxes ($ millions): Excise taxes $ 4,060 Personal income taxes 3,110 Corporate income taxes 1,700 Other taxes 3,900 Total Federal Taxes $ 12,810 TOTAL TAX REVENUES $ 34,040 Source: Estimates by LAEDC
T
17

California’s Oil and Gas Industry in 2013 Its Economic Contribution and Workforce
ii LAEDC Institute for Applied Economics
Characteristics of the Workforce The industry employs individuals with a broad range of characteristics exhibiting some notable trends:
The workforce is ethnically and racially diverse, with 51.5 percent white, 27.1 percent of Hispanic origin and 13.3 percent Asian.
Men in the workforce outnumber women by more than 2 to 1.
More than three-quarters of the industry’s
workforce is in its prime working age—between 22 years and 54 years of age. Still, workers aged 55 years and older still account for 24.1 percent, a significant share of the industry workforce.
A diversity of employment opportunities is
available across the educational attainment spectrum:
o Approximately 30 percent of workers have a bachelor’s degree or higher;
o Almost 30 percent have some college, post-secondary certification or an associate’s degree; and
o One third of all workers have high school credentials or less.
Hispanic 27.1%
White 51.5%
Black 5.6%
Asian 13.3%
All Other 2.5%
Exhibit ES-3 Employment Distribution by Race and Ethnicity California 2013
Source: QWI; Analysis by LAEDC
13.6% 19.4% 28.5% 30.4% 8.0%
Exhibit ES-4 Industry Employment Distribution byEducation California 2013
Less than HS HS Some college or AA BA or higher N/A
Source: QWI; Analysis by LAEDC

Table of Contents
Executive Summary i 1 Introduction 1
Oil and Gas Industry Definition 1 2 The Oil and Gas Industry in California 2
Production Activity 2 Refining Activity 3 Direct Economic Activity 3 Total Economic Contribution 5 Total Fiscal Contribution 6
3 California’s Oil and Gas Industry Workforce 7
Industry Occupations 7 Characteristics of the Industry Workforce 11
4 California’s Oil and Gas Industry by Sub-Region 13
Southern California Sub-Region 14 Central Coast Sub-Region 16 San Francisco Bay Area Sub-Region 17 Central Valley/Northern California Sub-Region 20 Rest of State 22
5 California’s Oil and Gas Industry by County 23 Appendix A-1
Oil and Gas Industries A-1 Contribution Analysis Methodology A-2 Workforce Characteristics Methodology A-3 Description of NAICS Industry Sectors A-4 Study Authors A-5

This page intentionally left blank

Its Economic Contribution and Workforce California’s Oil and Gas Industry in 2013
LAEDC Institute for Applied Economics 1
1 Introduction
he oil and gas industry makes a significant contribution to the U.S economy. Operating in a global market, demand, supply and prices are
influenced by what takes place worldwide, not just nationally. National extraction, production, refining and petroleum products manufacturing result in highly tradable products consumed domestically and exported to satiate global demand. As a result, the oil and gas industry is associated with high revenues and high wage jobs. Finite natural resources, both fossil fuels are heavily regulated as their extraction, production and refining has consequences for the environment and depletion of these resources could be calamitous for the energy needs of future generations. Taxes are levied on the industry in a variety of ways to mitigate these risks, resulting in public revenues that are larger than observed in other industries. In this report, the Institute for Applied Economics of the Los Angeles County Economic Development Corporation (LAEDC) provides an update to its Oil and Gas in California: The Industry and Its Economic Contribution in 2012, outlining the economic and fiscal contribution of the oil and gas industry in California in 2013 and selected characteristics of its workforce. The report is presented as follows. Section 2 provides an economic overview of the oil and gas industry in general and a discussion of the public revenues attributed to the industry and the consumption of its products. The section concludes with an analysis of the industry’s total economic and fiscal contribution to the state of California. In Section 3, several characteristics of the workforce are reviewed. Section 4 provides details at the sub-regional and Section 5 provides county-level contributions for most counties in California. Methodology and detailed industry descriptions as referenced in the text can be found in the Appendix.
Oil and Gas Industry Definition The definition of the oil and gas industry, using the North American Industry Classification System (NAICS) is listed below. These are described in detail in the Appendix.
Exhibit 1-1 Oil and Gas Industry Definition
NAICS
Industry 211 Oil and gas extraction 213111 Drilling oil and gas wells 213112 Support activities for oil and gas operations 2212 Natural gas distribution 23712 Oil and gas pipeline and related structures construction 32411 Petroleum refineries 324191 Petroleum lubricating oil and grease manufacturing 32511 Petrochemical manufacturing 333132 Oil and gas field machinery and equipment manufacturing 4247 Petroleum and petroleum products merchant wholesalers 447 Gasoline stations 45431 Fuel dealers 486 Pipeline transportation
Source: LAEDC
T

California’s Oil and Gas Industry in 2013 Its Economic Contribution and Workforce
2 LAEDC Institute for Applied Economics
2 The Oil and Gas Industry in California
he oil and gas industry makes a significant contribution to the U.S economy. Operating in a global market, demand, supply and prices are
influenced by what takes place worldwide, not just nationally. Extraction, production, refining and related manufacturing result in highly tradable products consumed domestically and exported to satiate global demand. As a result, the oil and gas industry is associated with high revenues and high wage jobs.
Production Activity In 2013, the Division of Oil, Gas and Geothermal Resources of the California Department of Conservation (DOGGR) reports that more than 2,720 new wells were drilled, with just fewer than 3,040 wells completed to production. There are approximately 55,630 wells that are currently active. These are distributed across the state, but the majority of them are located in the Central Valley/ Northern California sub-region. Natural Gas Natural gas production in the U.S. totaled 24.4 trillion cubic feet in 2013. California produced 252.3 billion cubic feet, accounting for one percent of total U.S. production. Out of the 32 natural gas producing states nationwide, California ranks thirteenth (Exhibit 2-1). The Central Valley/Northern California sub-region accounted for over to two-thirds of total California production, followed by Southern California and the Central Coast, producing 15 percent and 13 percent respectively. Crude Oil U.S. oil field production totaled just less than 2.4 billion barrels in 2013. California produced 198.8 million barrels, representing 7.3 percent of total national production, and California still ranks third of the 31 oil producing states nationwide (Exhibit 2-2).
Similar to natural gas production, the Central Valley/ Northern California sub-region accounted for almost two-thirds of total California oil production in 2013.
7,545,401
3,259,042
2,406,834
2,143,999
1,858,207
1,604,860
1,195,431
1,139,654
717,892
470,863
252,310
Texas
Pennsylvania
Louisiana
Oklahoma
Wyoming
Colorado
New Mexico
Arkansas
West Virginia
Utah
California
Exhibit 2-1 Natural Gas Production 2013 (Cubic feet in millions)
California ranks 13th nationally
1.0% of US production
Source: EIA
923,209
313,905
198,754
187,954
114,558
100,862
71,814
65,331
63,373
46,845
Texas
North Dakota
California
Alaska
Oklahoma
New Mexico
Louisiana
Colorado
Wyoming
Kansas
Exhibit 2-2 Crude Oil Production 2013 (Thousands of barrels)
California ranks 3rd nationally
7.3% of US field production
Source: EIA
T

Its Economic Contribution and Workforce California’s Oil and Gas Industry in 2013
LAEDC Institute for Applied Economics 3
Refining Activity At the end of December 2013, annual operable atmospheric crude oil distillation capacity in the U.S. was 17.7 million bpcd. California accounted for approximately 11 percent of this capacity with 1.88 million bpcd. Refineries in California are located largely in Southern California (primarily Los Angeles County) and the San Francisco Bay Area. Refining capacity has been decreasing over the years due to the closure of older and smaller refining operations that found compliance with the state’s strict environmental regulations to be cost prohibitive. This is also limiting the permitting of new facilities, and therefore any potential increase in oil refining capacity in the future in California appears highly unlikely.
5,174,209
3,274,520
1,876,171
936,645
631,700
596,000
530,000
511,300
468,000
440,600
Texas
Louisiana
California
Illinois
Washington
Pennsylvania
Ohio
Oklahoma
New Jersey
Indiana
Exhibit 2-3 Crude Oil Distillation Capacity 2013 Annual Operable Atmoshperic (bpcd)
California ranks 3rd nationally
10.6% of US capacity
Source: EIA

California’s Oil and Gas Industry in 2013 Its Economic Contribution and Workforce
4 LAEDC Institute for Applied Economics
Direct Economic Activity Direct activity associated with the oil and gas industry is the direct contribution to the economy of the industry in terms of employment, labor income and value added. Direct employment in the oil and gas industry includes all workers who are directly employed by industry firms. These are measured on a job-count basis regardless of the number of hours worked and include full-time, part-time, permanent and seasonal employees and the self-employed. The oil and gas industry in California provided 184,100 jobs in 2013, including independent contractors and payroll employees (Exhibit 2-4). Taken together, the industry accounted for just less than 1 percent of all employment in California. Labor income is the value of all earnings received by both payroll employees and the self-employed, including benefits such as health insurance and pension plan contributions. Overall labor income to workers in the industry totaled $23.3 billion in 2013 (Exhibit 2-5), accounting for 1.7 percent of all labor income in California. The industry pays higher wages than other industries (Exhibit 2-6). With the exception of gasoline stations and fuel dealers, wages in each of the component industries exceed the average annual wage paid in California.
Exhibit 2-4 Oil and Gas Industry Employment California 2013
NAICS
Industry 211 Oil and gas extraction 31,580
213111 Drilling oil and gas wells 7,480 213112 Support activities for oil and gas ops 10,160
2212 Natural gas distribution 34,950 23712 Oil and gas pipeline construction 11,950 32411 Petroleum refineries 11,840
324191 Petroleum lubricating oil / grease mfg 760 333132 Oil and gas field machinery mfg 2,660
4247 Petroleum prods wholesalers 7,330 447 Gasoline stations 59,670
45431 Fuel dealers 2,855 486 Pipeline transportation 2,840
Oil and Gas Industry Employment 184,100 Percent of California Total Employment 0.9%
Note: Includes non-employers and independent contractors Source: Estimates by LAEDC
Exhibit 2-5 Oil and Gas Industry Labor Income ($ millions) California 2013
NAICS
Industry 211 Oil and gas extraction $ 4,900
213111 Drilling oil and gas wells 960 213112 Support activities for oil and gas ops 920
2212 Natural gas distribution 5,630 23712 Oil and gas pipeline construction 870 32411 Petroleum refineries 3,240
324191 Petroleum lubricating oil / grease mfg 70 333132 Oil and gas field machinery mfg 220
4247 Petroleum prods wholesalers 590 447 Gasoline stations 4,060
45431 Fuel dealers 80 486 Pipeline transportation 1,740
Oil and Gas Industry Labor Income $ 23,280 Percent of California Total Labor Income 1.7%
Note: Includes non-employers and independent contractors Source: Estimates by LAEDC
Exhibit 2-6 Oil and Gas Industry Average Annual Wages California 2013
NAICS
Industry 211 Oil and gas extraction $ 234,592
213111 Drilling oil and gas wells 91,417 213112 Support activities for oil and gas ops 80,580
2212 Natural gas distribution 115,024 23712 Oil and gas pipeline construction 66,390 32411 Petroleum refineries 181,330
324191 Petroleum lubricating oil / grease mfg 75,781 333132 Oil and gas field machinery mfg 68,489
4247 Petroleum prods wholesalers 71,932 45431 Fuel dealers 49,998
486 Pipeline transportation 102,348
Oil and Gas Industry $ 118,032 All private industries in CA $ 56,590
Note: Excludes non-employers and independent contractors Source: CA EDD; Estimates by LAEDC

Its Economic Contribution and Workforce California’s Oil and Gas Industry in 2013
LAEDC Institute for Applied Economics 5
Total Economic Contribution The total economic contribution of the oil and gas industry in California includes indirect and induced activity in addition to the direct activity already identified (Exhibit 2-7).
Exhibit 2-7 Total Economic Contribution of Oil and Gas Industry California 2013 Employment (jobs): Direct 184,100 Indirect 98,690 Induced 173,150 TOTAL 455,940 Percent of California Total Employment 2.1% Labor income ($ millions): Direct $ 23,280 Indirect 6,350 Induced 8,660 TOTAL $ 38,280 Percent of California Total Labor Income 2.9%
Value added ($ millions): Direct $ 47,610 Indirect 9,670 Induced 14,610 TOTAL $ 71,890 Percent of California Total GDP 3.4%
Output ($ millions): Direct $ 165,500 Indirect 16,820 Induced 24,460 TOTAL $ 203,790 Percent of California Total Output 5.7%
Source: Estimates by LAEDC It is estimated that the activities related to the oil and gas industry in California in 2013 generated value added equaling $71.9 billion in California, approximately 3.4 percent of the state’s GDP of $2.1 trillion. The industry contributed 455,940 jobs, or 2.1 percent of the state total, with labor income of almost $40 billion, about 3 percent of all labor income earned in the state. Clearly, the industry remains a significant contributor to the state’s economic activity.
Industry Distribution The total economic contribution is achieved through activity occurring across a wide range of industry sectors via indirect and induced effects (Exhibit 2-8). Exhibit 2-8 Total Economic Contribution of Oil and Gas Industry By Sector California 2013
Jobs Labor
Income ($ millions)
Value Added
($ millions) Ag, forestry, fish & hunting 1,301 $ 83 $ 125 Mining 49,350 6,791 10,473 Utilities 35,187 5,668 14,855 Construction 22,680 1,636 1,700 Manufacturing 23,425 4,104 14,322 Wholesale trade 26,041 2,092 4,183 Retail trade 91,339 5,197 6,852 Transportation and warehousing 20,530 2,788 3,051 Information 4,654 673 1,502 Finance and insurance 19,793 1,399 1,662 Real estate and rental 15,541 398 4,376 Professional, scientific technical 19,866 1,519 2,006 Management of companies 5,177 644 755 Administrative and waste services 22,571 856 1,095 Educational services 7,116 308 331 Health and social services 33,196 1,884 1,963 Arts, entertainment and recreation 7,107 232 306 Accommodation and food services 27,696 771 1,055 Other services 19,306 857 955 Government 4,059 380 323 Total 2013 455,940 $ 38,280 $ 71,890 Source: Estimates by LAEDC
Of the 455,940 jobs supported, twenty percent were in the retail trade sector (which includes gas stations) and approximately 11 percent in the mining sector (which includes oil and gas extraction). However, virtually all industry sectors receive a positive economic impact from the oil and gas industry, including utilities, health and social services, accommodation and food services, wholesale trade, manufacturing and construction. A description of the industry sectors is provided in the Appendix.

California’s Oil and Gas Industry in 2013 Its Economic Contribution and Workforce
6 LAEDC Institute for Applied Economics
Total Fiscal Contribution The oil and gas industry faces high taxes incurred by both firms operating within the industry and by their consumers. Production, refining, distribution, retail and consumption of oil and gas all face taxes levied by local, state and federal governments, including:
Ad valorem taxes on the market value of proved reserves
Assessment on oil and gas production State and local excise taxes on natural gas and
oil sales Federal excise taxes on fuel purchases State and local sales taxes on fuel purchases Federal and state lease payments for the right to
explore, drill and extract on federally-owned and state-owned land
Federal and state royalties on production from federally-owned and state-owned land
Other taxes and fees, including o IFTA taxes on diesel fuel o Underground storage tank fees o Oil spill prevention and administration
fees o Oil spill response fees
Given this background, the economic activity associated with the oil and gas industry in California in 2013 is estimated to have generated $21.2 billion in state and local taxes (Exhibit 2-9). Federal tax revenues in 2013 are estimated to have been $12.8 billion.
Exhibit 2-9 Fiscal Contribution of Oil and Gas Industry California 2013 State and Local Taxes ($ millions):
Sales and excise taxes $ 14,830 Property taxes 3,630 Personal income taxes 1,170 Corporate income taxes 430 Social insurance 100 Other taxes 800 Fees, fines and permits 280 Total State and Local Taxes $ 21,240 Federal Taxes ($ millions): Excise taxes $ 4,060 Personal income taxes 3,110 Corporate income taxes 1,700 Social insurance 3,580 Other taxes 300 Fees, fines and permits 80 Total Federal Taxes $ 12,810 Source: Estimates by LAEDC
Of state and local government revenues, almost $15 billion was earned from sales and excise taxes (including those paid on the consumption of oil and gas products), $3.6 billion was earned from property taxes paid by households and businesses and $1.6 billion was earned from personal and corporate income taxes. Of federal taxes, $4.1 billion in taxes was earned in excise taxes, $3.1 billion from personal income taxes, $1.7 billion in taxes on corporate income and $3.6 billion in social insurance payments.

Its Economic Contribution and Workforce California’s Oil and Gas Industry in 2013
LAEDC Institute for Applied Economics 7
3 California’s Oil and Gas Industry Workforce
he oil and gas industry employs a large number of people in California, providing myriad employment opportunities for a diverse group of individuals. As
job duties vary, so do the required skills and education levels for job entry. Wages vary with occupations in the industry, with many associated with high wages.
Industry Occupations An occupation is classified according to the set of activities or tasks that an employee is paid to perform. Some occupations are specific to an industry, but others exist in a number of different industries, such as, for example, customer service representatives, salespersons, accounting staff and receptionists. Occupations are classified by the Standard Occupational Classification (SOC) System. Workers fall into one of 840 detailed occupations, which are combined into 23 major groups. Each occupation requires its own skill set and education levels. The distribution of employment by major occupational group specific to the oil and gas industry in California is displayed in Exhibit 3-1.
More than a third (35 percent) of workers in the industry are employed in sales occupations, another 24 percent in office and administrative, business and financial and management occupations combined, and almost 32 percent work in blue collar occupations such as construction and extraction, production, installation and maintenance, and transportation and material moving. It should be noted that this occupational distribution includes individuals employed at gas stations. Gas stations represent the retail side of the oil and gas industry and account for the largest share of industry employment. Activities taking place at retail gas stations are dissimilar to activities taking place in other oil and gas industries, many of which involve production and distribution. Many gas station jobs require lower education and skills levels and are associated with average annual wages significantly lower than found in other oil and gas industries. Including gas stations in an occupational analysis skews average annual wages of occupations in the oil and gas industry and the occupational composition of the oil and gas industry. This is evident in the next two exhibits as the oil and gas industry outside of gas stations is reviewed. (The gas station industry is shown separately in the following section.) Exhibit 3-2 shows the distribution of employment in the California oil and gas industry by major occupational group excluding the gas station industry.
Sales 35.0%
Office / Admin 11.9%
Construction / Extraction
8.8% Production 8.7%
Installation, Maintenance,
Repair 7.1%
Transportation / Material Moving 7.1%
Business / Financial
7.0%
Architecture / Engineering
5.3%
Management 4.6%
All Other 4.5%
Exhibit 3-1 Occupational Distribution of Oil and Gas Industry
Source: OES
T

California’s Oil and Gas Industry in 2013 Its Economic Contribution and Workforce
8 LAEDC Institute for Applied Economics
Excluding the gas station industry, the largest share of the oil and gas workforce is employed in office and administrative occupations, which includes bookkeepers and accounting clerks, utility meter readers, office clerks, stock clerks and order fillers, dispatchers and customer service representatives. Individuals employed in construction and extraction occupations and production (manufacturing) occupations follow, each with employment shares of 14 percent. Business and financial operations occupations and installation, maintenance and repair occupations round out the top five with 11 percent and ten percent of industry employment respectively. The wages of occupations in the oil and gas industry vary widely. Exhibit 3-3 shows the average wages in the oil and gas industry in California for the different major occupational groups shown in Exhibit 3-2.
A wide variety of detailed occupations exist in each major occupational group. The top 20 detailed occupations by employment share in the oil and gas industry in California and their associated wages in 2013 are shown in Exhibit 3-4, followed by the top 20 by average annual wages in Exhibit 3-5. The top twenty detailed occupations account for almost 40 percent of the industry’s workforce. In contrast, the top twenty highest paid occupations account for approximately 8 percent of the workforce.
Sales 2.3%
Office / Admin 16.3%
Construction / Extraction
15.2%
Production 15.0%
Installation, Maintenance,
Repair 10.7%
Transportation / Material Moving 8.2%
Business / Financial
12.0%
Architecture / Engineering
9.1%
Management 6.5%
All Other 4.6%
Exhibit 3-2 Occupational Distribution of Oil and Gas Industry (Excluding gas station industry)
Source: OES
$ 51,316 $ 59,392 $ 59,931
$ 73,323 $ 77,660 $ 81,292 $ 81,903 $ 82,059 $ 84,520 $ 87,270 $ 88,482
$ 93,681 $ 95,559
$ 111,423 $ 125,370
$ 150,545
Transportation / Material Moving Construction / Extraction
Office / Admin Sales
Production All Occupations - Oil and Gas
Healthcare Practitioners Installation, Maintenance, Repair
Arts / Entertainment / Sports Protective Service
Computer / Mathematical Business / Financial
Life, Physical, Social Science Architecture / Engineering
Legal Management
Exhibit 3-3 Average Industry Wages by Major Occupational Group California 2013 (Excluding gas station industry)
Source: OES

Its Economic Contribution and Workforce California’s Oil and Gas Industry in 2013
LAEDC Institute for Applied Economics 9
Exhibit 3-4 Detailed Industry Occupations by Employment Share (excluding Gas Station Industry) California 2013
SOC Detailed Occupation Share
(%) Average
Annual Wage
51-8093 Petroleum Pump System Operators, Refinery Operators, Gaugers 4.9 $ 75,511 53-3032 Heavy and Tractor-Trailer Truck Drivers 3.7 45,404 13-1199 Business Operations Specialists, All Other 3.0 93,558 47-5071 Roustabouts, Oil and Gas 3.0 39,103 47-5013 Service Unit Operators, Oil, Gas, and Mining 3.0 53,931 43-9061 Office Clerks, General 2.6 35,812 43-5041 Meter Readers, Utilities 2.1 49,110 17-2171 Petroleum Engineers 2.0 124,388 49-9041 Industrial Machinery Mechanics 2.0 76,085 51-1011 First-Line Supervisors of Production / Operating Workers 1.8 101,763 51-8092 Gas Plant Operators 1.7 75,614 47-1011 First-Line Supervisors of Construction / Extraction Workers 1.6 91,922 11-1021 General and Operations Managers 1.5 147,249 49-9012 Control and Valve Installers / Repairers, Except Mechanical Door 1.3 72,590 43-1011 First-Line Supervisors of Office and Administrative Workers 1.2 86,864 49-1011 First-Line Supervisors of Mechanics, Installers, Repairers 1.2 102,020 51-4121 Welders, Cutters, Solderers, and Brazers 1.1 65,085 17-2071 Electrical Engineers 1.0 n/a 17-2112 Industrial Engineers 1.0 122,458 43-6014 Secretaries / Admins, Except Legal, Medical, and Executive 1.0 42,122
Other Occupations 59.4
All Occupations in the Oil and Gas Industry 100.0 $ 81,292 Source: OES
Exhibit 3-5 Detailed Industry Occupations by Average Annual Wages (Excluding Gas Station Industry) California 2013
SOC Detailed Occupation Share (%) Average
Annual Wage
11-1011 Chief Executives 0.1 $ 194,031 11-9041 Architectural and Engineering Managers 0.4 180,500 11-9199 Managers, All Other 0.0 172,740 11-3021 Computer and Information Systems Managers 0.3 160,739 11-3051 Industrial Production Managers 0.4 155,669 11-2022 Sales Managers 0.2 155,488 11-3031 Financial Managers 0.2 154,091 17-2151 Mining / Geological Engineers, Including Mining Safety Engineers 0.1 150,150 11-1021 General and Operations Managers 1.5 147,249 19-2042 Geoscientists, Except Hydrologists and Geographers 0.6 145,124 11-9021 Construction Managers 0.2 136,148 11-3011 Administrative Services Managers 0.1 128,062 17-2171 Petroleum Engineers 2.0 124,388 17-2112 Industrial Engineers 1.0 122,458 17-2051 Civil Engineers 0.2 121,150 17-2041 Chemical Engineers 0.1 120,390 11-2031 Public Relations and Fundraising Managers 0.1 119,720 11-3121 Human Resources Managers 0.1 116,260 17-2199 Engineers, All Other n/a 107,020 17-2141 Mechanical Engineers 0.1 106,550
Other Occupations 92.4
All Occupations in the Oil and Gas Industry 100.0 $ 81,292 Source: OES

California’s Oil and Gas Industry in 2013 Its Economic Contribution and Workforce
10 LAEDC Institute for Applied Economics
Gas Station Industry
Gas stations represent the retail side of the oil and gas industry, with products being sold to the end user. The distribution of employment by major occupational group specific to gas stations in California is shown in Exhibit 3-6. The majority of individuals in this industry segment (more than 80 percent) work in sales occupations, just over 80 percent. Most of these workers are cashiers. Workers in office and administrative occupations and transportation and material moving occupations rank second and third, each with employment shares of almost six percent. The fourth largest group in terms of employment is food preparation and serving occupations, with just over three percent of workers. The wages of these occupations also vary substantially. Exhibit 3-7 shows the average wages in the gas station industry in California for the different major occupational groups. As expected, the highest average annual wages are paid to those in management occupations. Sales occupations, which account for more than 80 percent of gas station industry employment, earn on average $22,490 per year. Overall, the industry average is $24,270 annually.
Sales 80.3%
Office / Admin 5.7%
Transportation / Material Moving 5.5%
Food Prep / Serving 3.4%
Installation, Maintenance,
Repair 2.1%
All Other 2.8%
Exhibit 3-6 Occupational Distribution of Gas Station Industry
Source: OES $ 20,590
$ 21,480
$ 22,490
$ 24,160
$ 24,270
$ 25,070
$ 37,670
$ 67,850
$ 91,010
Food Prep / Serving
Building/Grounds Cleaning/Maint
Sales
Transportation / Material Moving
All in Gas Stations
Office / Admin
Installation, Maintenance, Repair
Business / Financial
Management
Exhibit 3-7 Average Annual Wages of Gas Station Industry California 2013
Source: OES

Its Economic Contribution and Workforce California’s Oil and Gas Industry in 2013
LAEDC Institute for Applied Economics 11
Characteristics of the Industry Workforce
The composition of the workforce in the oil and gas industry varies according to sex, age, race and ethnicity and educational attainment. Sex of Workforce Workers in the oil and gas industry are predominantly male. In 2013, males represented 69 percent of the workforce (Exhibit 3-8). Age of Workforce The majority of the workforce is in its prime working age—between 22 years and 54 years of age, with almost half being in the 35 to 54 years of age group (Exhibit 3-9). Still, workers aged 55 years and older still account for 24.1 percent, a significant share of the industry workforce. Race and Ethnicity in the Workforce The workforce in the oil and gas industry is diverse in both race and ethnicity (Exhibit 3-10). Workers reporting their race as white accounted for more than half of the workforce, with those reporting their ethnicity as Hispanic or Latino accounted for 27.1 percent and 13.3 percent were Asian. Educational Attainment of Workers The industry provides a wide range of jobs to individuals with different levels of education (Exhibit 3-11). Approximately 20 percent have a high school diploma, 29 percent of workers have some college education, and 30 percent have earned a bachelor’s degree or higher.
Male 69.0%
Female 31.0%
Exhibit 3-8 Industry Employment Distribution by Sex California 2013
Source; QWI; Analysis by LAEDC
3.3% 26.3% 46.3% 24.1%
Exhibit 3-9 Industry Employment Distribution by Age Group California 2013
< 22 22 to 34 35 to 54 55 +
Source: QWI; Analysis by LAEDC
27.1% 51.5% 5.6%
13.3%
Exhibit 3-10 Industry Employment Distribution by Race /Ethnicity California 2013
Hispanic White Black Asian Other
Source: QWI; Analysis by LAEDC
13.6% 19.4% 28.5% 30.4% 8.0%
Exhibit 3-11 Industry Employment Distribution byEducation California 2013
Less than HS HS Some college or AA BA or higher N/A
Source: QWI; Analysis by LAEDC

This page intentionally left blank

Its Economic Contribution and Workforce California’s Oil and Gas Industry in 2013
LAEDC Institute for Applied Economics 13
4 California’s Oil and Gas Industry by Sub-Region
he oil and gas industry is widespread across the state. In this section, the industry is analyzed in four sub-regional geographies depicted in Exhibit
4-1: Southern California, the Central Coast, the San Francisco Bay Area, and Central Valley/Northern California. These four sub-regions account for 35 counties and more than ninety percent of the direct employment in the industry. The remaining counties are summarized in a Rest of State sub-region. Production activity occurs across the state, but the majority is located in the Central Valley/Northern California sub-region. According to the Division of Oil, Gas and Geothermal Resources of the California Department of Conservation (DOGGR), as of 2013, just fewer than 55,630 wells are currently active. Approximately 78 percent of all active wells are in Kern County, which accounts for almost 71 percent of oil production and more than 67 percent of all gas production in the state. Los Angeles County is a distant second, with less than seven percent of active wells, twelve percent of oil production and six percent of gas production. Employment in oil and gas extraction, well drilling and support activities for oil and gas operations are related to the concentration of well activity and consequently is mostly found in the counties of Kern and Los Angeles. Downstream activity of the industry is concentrated in the Southern California sub-region, where more than half of the refining capacity is located, and in the San Francisco Bay Area, with almost 40 percent of the state’s refining capacity. Large industry segments related to trade, such as natural gas distribution and gasoline stations, depend on delivery to residents and businesses, thus their employment is distributed proportionally to the resident population. As such, the Southern California sub-region has the largest share of employment in these component industries, and its share has grown since 2012. Direct activity and economic and fiscal contributions of each sub-region along with their workforce characteristics are presented in the following pages.
Southern California
50.3%
Central Valley/
Northern CA 22.1%
San Francisco Bay Area
17.6%
Central Coast 5.6%
Rest of State 4.5%
Exhibit 4-2 Oil and Gas Direct Employment By Sub-Region 2013
Sources: Estimates by LAEDC
Direct Industry Employment:
184,100
T Exhibit 4-1 California Sub-Regions
Source: ESRI
Rest of State
Central Valley/ NorCal
SoCal
San Fran Bay Area
Central Coast

California’s Oil and Gas Industry in 2013 Its Economic Contribution and Workforce
14 LAEDC Institute for Applied Economics
Southern California Sub-Region
The Southern California sub-region consists of the six counties of Imperial, Los Angeles, Orange, Riverside, San Bernardino and San Diego.
Exhibit 4-4 Direct Employment of Oil and Gas Industry Southern California Sub-Region 2013
211 Oil and gas extraction 15,491 213111 Drilling oil and gas wells 2,883 213112 Support activities for oil and gas ops 2,433
2212 Natural gas distribution 22,407 23712 Oil and gas pipeline construction 5,946 32411 Petroleum refineries 4,442
324191 Petroleum lubricating oil / grease mfg 615 32511 Petrochemical manufacturing 9
333132 Oil and gas field machinery mfg 1,980 4247 Petroleum prods wholesalers 3,171
447 Gasoline stations 30,651 45431 Fuel dealers 896
486 Pipeline transportation 1,508
TOTAL DIRECT EMPLOYMENT 92,430 Percent of California Industry Employment 49.9%
Exhibit 4-5 Total Economic and Fiscal Contribution of Oil and Gas Industry Southern California Sub-Region 2013
ECONOMIC CONTRIBUTION Employment Labor Income
($ millions) Value Added
($ millions) Output
($ millions) Direct 92,430 $ 11,450 $ 23,550 $ 71,040 Indirect 46,370 2,800 4,350 7,590 Induced 86,220 4,120 7,020 11,740
TOTAL CONTRIBUTION 225,030 $ 18,370 $ 34,920 $ 90,370 Percent of Total CA Contribution 49.4% 48.0% 48.6% 44.3%
FISCAL CONTRIBUTION
State and Local ($ millions)
Federal ($ millions)
Total Taxes ($ millions)
Sales and excise taxes $ 7,610.0 $ 1,985.3 $ 9,595.3 Property taxes 1,899.1 - 1,990.1 Personal income taxes 564.7 1,494.3 2,059.1 Corporate profits taxes 204.8 811.2 1,016.0 Social insurance taxes 42.6 1,720.8 1,763.5 Other taxes 415.7 166.9 582.6 Fees, fines and permits 135.2 42.4 177.7
TOTAL TAX REVENUES $ 10,872.1 $ 6,221.0 $ 17,093.2
Exhibit 4-3 Southern California Sub-Region
Source: ESRI

Its Economic Contribution and Workforce California’s Oil and Gas Industry in 2013
LAEDC Institute for Applied Economics 15
Workforce Demographics
The oil and gas industry workforce in Southern California in 2013 is mostly male (68 percent), with less than a third being female (Exhibit 4-6).
Almost half of the workforce is aged 35 to 54
years (Exhibit 4-7). Almost 24 percent is 55 years of age or older. Very few young people (under the age of 22 years) work in the industry in this sub-region.
The workforce in the oil and gas industry in this
sub-region is diverse in both race and ethnicity (Exhibit 4-8). Workers reporting their race as white accounted for 45 percent of the workforce, with those reporting their ethnicity as Hispanic or Latino accounted for 34.7 percent. More than 12 percent are Asian.
In 2013, approximately 36 percent of the
industry’s workforce in this sub-region had an education level of high school or less, 27.9 percent had some college or an associate’s degree and more than 27 percent had earned a bachelor’s degree or higher (Exhibit 4-9). Educational attainment is not determined for workers younger than 25 years of age, which accounted for 9.1 percent of industry employment.
Male 67.8%
Female 32.2%
Exhibit 4-6 Industry Employment Distribution by Sex Southern California 2013
Source; QWI; Analysis by LAEDC
3.8% 26.2% 46.3% 23.7%
Exhibit 4-7 Industry Employment Distribution by Age Group Southern California 2013
< 22 22 to 34 35 to 54 55 +
Source: QWI; Analysis by LAEDC
34.7% 45.0% 6.2%
12.1%
Exhibit 4-8 Industry Employment Distribution by Race / Ethnicity Southern California 2013
Hispanic White Black Asian Other
Source: QWI; Analysis by LAEDC
16.5% 19.4% 27.9% 27.1% 9.1%
Exhibit 4-9 Industry Employment Distribution by Education Southern California 2013
Less than HS HS Some college or AA BA or higher N/A
Source: QWI; Analysis by LAEDC

California’s Oil and Gas Industry in 2013 Its Economic Contribution and Workforce
16 LAEDC Institute for Applied Economics
Central Coast Sub-Region
The Central Coast sub-region consists of the four counties of Monterey, San Luis Obispo, Santa Barbara and Ventura.
Exhibit 4-11 Direct Employment of Oil and Gas Industry Central Coast Sub-Region 2013
211 Oil and gas extraction 2,252 213111 Drilling oil and gas wells 825 213112 Support activities for oil and gas ops 936
2212 Natural gas distribution 1,454 23712 Oil and gas pipeline construction 416 32411 Petroleum refineries 170
324191 Petroleum lubricating oil / grease mfg - 32511 Petrochemical manufacturing -
333132 Oil and gas field machinery mfg 330 4247 Petroleum prods wholesalers 362
447 Gasoline stations 3,263 45431 Fuel dealers 197
486 Pipeline transportation 40
TOTAL DIRECT EMPLOYMENT 10,250 Percent of California Industry Employment 5.6%
Exhibit 4-12 Total Economic and Fiscal Contribution of Oil and Gas Industry Central Coast Sub-Region 2013
ECONOMIC CONTRIBUTION Employment Labor Income
($ millions) Value Added
($ millions) Output
($ millions) Direct 10,250 $ 1,400 $ 2,310 $ 4,720 Indirect 2,670 130 220 380 Induced 7,610 320 570 930
TOTAL CONTRIBUTION 20,520 $ 1,860 $ 3,100 $ 6,030 Percent of Total CA Contribution 4.5% 4.9% 4.3% 3.0%
FISCAL CONTRIBUTION
State and Local ($ millions)
Federal ($ millions)
Total Taxes ($ millions)
Sales and excise taxes $ 688.0 $ 184.7 $ 872.8 Property taxes 166.4 - 166.4 Personal income taxes 59.6 157.7 217.3 Corporate profits taxes 14.2 56.3 70.5 Social insurance taxes 4.5 163.2 167.7 Other taxes 36.8 13.1 49.9 Fees, fines and permits 13.7 3.3 17.0
TOTAL TAX REVENUES $ 983.1 $ 578.4 $ 1,561.5
Exhibit 4-10 Central Coast Sub-Region
Source: ESRI

Its Economic Contribution and Workforce California’s Oil and Gas Industry in 2013
LAEDC Institute for Applied Economics 17
Workforce Demographics
Almost 74 percent of the oil and gas industry workforce in the Central Coast sub-region is male, with 26.4 percent being female (Exhibit 4-13).
Forty-one percent of the workforce is aged 35 to
54 years (Exhibit 4-14). Very few young people (under the age of 22 years) work in the industry, but almost 24 percent of the workforce is 55 years of age or older.
The workforce in the oil and gas industry in this
sub-region is diverse in both race and ethnicity (Exhibit 4-15). Workers reporting their race as white accounted for 54.8 percent of the workforce, with those reporting their ethnicity as Hispanic or Latino accounted for 33.6 percent.
In 2013, almost 40 percent of the industry’s
workforce in this sub-region had an education level of high school or less, almost 30 percent had some college or an associate’s degree and 20 percent had earned a bachelor’s degree or higher (Exhibit 4-16). Educational attainment is not determined for workers younger than 25 years of age, which accounted for 11.3 percent of industry employment.
Male 73.6%
Female 26.4%
Exhibit 4-13 Industry Employment Distribution by Sex Central Coast 2013
Source; QWI; Analysis by LAEDC
4.7% 30.4% 41.0% 23.9%
Exhibit 4-14 Industry Employment Distribution by Age Group Central Coast 2013
< 22 22 to 34 35 to 54 55 +
Source: QWI; Analysis by LAEDC
33.6% 54.8% 3.1%
7.0%
Exhibit 4-15 Industry Employment Distribution by Race / Ethnicity Central Coast 2013
Hispanic White Black Asian Other
Source: QWI; Analysis by LAEDC
16.4% 22.9% 29.3% 20.0% 11.3%
Exhibit 4-16 Industry Employment Distribution by Education Central Coast 2013
Less than HS HS Some college or AA BA or higher N/A
Source: QWI; Analysis by LAEDC

California’s Oil and Gas Industry in 2013 Its Economic Contribution and Workforce
18 LAEDC Institute for Applied Economics
San Francisco Bay Area Sub-Region
The San Francisco Bay Area sub-region consists of the nine counties of Alameda, Contra Costa, Marin, Napa, San Francisco, San Mateo, Santa Clara, Solano and Sonoma.
Exhibit 4-18 Direct Employment of Oil and Gas Industry San Francisco Bay Area Sub-Region 2013
211 Oil and gas extraction 4,001 213111 Drilling oil and gas wells 903 213112 Support activities for oil and gas ops 509
2212 Natural gas distribution 7,557 23712 Oil and gas pipeline construction 938 32411 Petroleum refineries 6,183
324191 Petroleum lubricating oil / grease mfg 138 32511 Petrochemical manufacturing -
333132 Oil and gas field machinery mfg 33 4247 Petroleum prods wholesalers 1,080
447 Gasoline stations 10,461 45431 Fuel dealers 271
486 Pipeline transportation 296
TOTAL DIRECT EMPLOYMENT 32,370 Percent of California Industry Employment 17.6%
Exhibit 4-19 Total Economic and Fiscal Contribution of Oil and Gas Industry San Francisco Bay Area Sub-Region 2013
ECONOMIC CONTRIBUTION Employment Labor Income
($ millions) Value Added
($ millions) Output
($ millions) Direct 32,370 $ 5,390 $ 13,100 $ 68,380 Indirect 24,770 2,000 2,840 4,680 Induced 30,920 1,790 2,910 4,570
TOTAL CONTRIBUTION 88,060 $ 9,180 $ 18,850 $ 77,630 Percent of Total CA Contribution 19.3% 24.0% 26.2% 38.1%
FISCAL CONTRIBUTION
State and Local ($ millions)
Federal ($ millions)
Total Taxes ($ millions)
Sales and excise taxes $ 2,779.8 $ 655.6 $ 3,435.4 Property taxes 798.7 - 798.7 Personal income taxes 274.0 730.3 1,004.3 Corporate profits taxes 136.1 539.2 675.3 Social insurance taxes 18.1 857.8 875.8 Other taxes 176.8 53.8 230.6 Fees, fines and permits 63.1 13.7 76.8
TOTAL TAX REVENUES $ 4,246.7 $ 2,850.3 $ 7,097.0
Exhibit 4-17 San Francisco Bay Area Sub-Region
Source: ESRI

Its Economic Contribution and Workforce California’s Oil and Gas Industry in 2013
LAEDC Institute for Applied Economics 19
Workforce Demographics
The oil and gas industry workforce in the San Francisco Bay Area sub-region in 2013 is mostly male (68 percent), with 32 percent being female (Exhibit 4-20).
More than 49.1 percent of the workforce is aged
35 to 54 years (Exhibit 4-21). Very few young people (under 22 years of age) work in the industry.
The workforce in the oil and gas industry in this
sub-region is diverse in both race and ethnicity (Exhibit 4-22). Workers reporting their race as white accounted for 53.7 percent of the workforce, with those reporting their race or ethnicity as Asian accounted for 20.7 percent and Hispanic or Latino 16.2 percent.
In 2013, approximately 25 percent of the
industry’s workforce in this sub-region had an education level of high school or less, almost 29 percent had some college or an associate’s degree and 41.5 percent had earned a bachelor’s degree or higher (Exhibit 4-23). Educational attainment is not determined for workers younger than 25 years of age, which accounted for 4.8 percent of industry employment.
Male 68.0%
Female 32.0%
Exhibit 4-20 Industry Employment Distribution by Sex San Francisco Bay Area 2013
Source; QWI; Analysis by LAEDC
1.9% 21.3% 49.1% 16.2%
Exhibit 4-21 Industry Employment Distribution by Age Group San Francisco Bay Area 2013
< 22 22 to 34 35 to 54 55 +
Source: QWI; Analysis by LAEDC
16.2% 53.7% 6.6%
20.7%
Exhibit 4-22 Industry Employment Distribution by Race / Ethnicity San Francisco Bay Area 2013
Hispanic White Black Asian Other
Source: QWI; Analysis by LAEDC
9.1% 16.1% 28.5% 41.5% 4.8%
Exhibit 4-23 Industry Employment Distribution by Education San Francisco Bay Area 2013
Less than HS HS Some college or AA BA or higher N/A
Source: QWI; Analysis by LAEDC

California’s Oil and Gas Industry in 2013 Its Economic Contribution and Workforce
20 LAEDC Institute for Applied Economics
Central Valley/Northern California Sub-Region The Central Valley/Northern California sub-region consists of the sixteen counties of Butte, Colusa, Fresno, Glenn, Kern, Kings, Merced, Sacramento, San Joaquin, Shasta, Stanislaus, Sutter, Tehama, Tulare, Yolo and Yuba.
Exhibit 4-25 Direct Employment of Oil and Gas Industry Central Valley/Northern California Sub-Region 2013
211 Oil and gas extraction 8,339 213111 Drilling oil and gas wells 2,576 213112 Support activities for oil and gas ops 6,202
2212 Natural gas distribution 2,306 23712 Oil and gas pipeline construction 4,615 32411 Petroleum refineries 1,021
324191 Petroleum lubricating oil / grease mfg 8 32511 Petrochemical manufacturing -
333132 Oil and gas field machinery mfg 319 4247 Petroleum prods wholesalers 2,173
447 Gasoline stations 11,475 45431 Fuel dealers 719
486 Pipeline transportation 944
TOTAL DIRECT EMPLOYMENT 40,700 Percent of California Industry Employment 22.1%
Exhibit 4-26 Total Economic and Fiscal Contribution of Oil and Gas Industry Central Valley/Northern California Sub-Region 2013
ECONOMIC CONTRIBUTION Employment Labor Income
($ millions) Value Added
($ millions) Output
($ millions) Direct 40,700 $ 4,350 $ 7,340 $ 19,250 Indirect 12,750 620 1,010 1,810 Induced 24,600 1,010 1,840 3,110
TOTAL CONTRIBUTION 78,040 $ 5,980 $ 10,200 $ 24,160 Percent of Total CA Contribution 17.1% 15.6% 14.2% 11.9%
FISCAL CONTRIBUTION
State and Local ($ millions)
Federal ($ millions)
Total Taxes ($ millions)
Sales and excise taxes $ 2,336.7 $ 665.0 $ 3,001.7 Property taxes 534.8 - 534.8 Personal income taxes 175.8 461.7 637.5 Corporate profits taxes 49.6 196.6 246.2 Social insurance taxes 28.2 547.2 575.4 Other taxes 117.5 46.9 164.4 Fees, fines and permits 41.3 11.9 53.2
TOTAL TAX REVENUES $ 3,283.9 $ 1,929.3 $ 5,213.2
Exhibit 4-24 Central Valley / Northern California Sub-Region
Source: ESRI

Its Economic Contribution and Workforce California’s Oil and Gas Industry in 2013
LAEDC Institute for Applied Economics 21
Workforce Demographics
The oil and gas industry workforce in the Central Valley/Northern California sub-region in 2013 is predominantly male (72 percent), with 28 percent being female (Exhibit 4-27).
Almost 43 percent of the workforce is aged 35
to 54 years (Exhibit 4-28). Approximately 20 percent is 55 years of age or older.
The workforce in the oil and gas industry in this
sub-region is diverse in both race and ethnicity (Exhibit 4-29). Workers reporting their race as white accounted for 55.2 percent of the workforce, while those reporting their race or ethnicity as Hispanic or Latino accounted for 28.4 percent. Approximately ten percent of the workforce is Asian.
In 2013, almost 40 percent of the industry’s
workforce in this sub-region had an education level of high school or less, almost 29 percent had some college or an associate’s degree and 21.0 percent had earned a bachelor’s degree or higher (Exhibit 4-30). Educational attainment is not determined for workers younger than 25 years of age, which accounted for 10.7 percent of industry employment.
Male 72.0%
Female 28.0%
Exhibit 4-27 Industry Employment Distribution by Sex Central Valley/Northern California 2013
Source; QWI; Analysis by LAEDC
4.2% 33.1% 42.7% 19.9%
Exhibit 4-28 Industry Employment Distribution by Age Group Central Valley/Northern California 2013
< 22 22 to 34 35 to 54 55 +
Source: QWI; Analysis by LAEDC
28.4% 55.2% 4.0%
10.2%
Exhibit 4-29 Industry Employment Distribution by Race / Ethnicity Central Valley/Northern California 2013
Hispanic White Black Asian Other
Source: QWI; Analysis by LAEDC
16.0% 23.4% 28.9% 21.0% 10.7%
Exhibit 4-30 Industry Employment Distribution by Education Central Valley/Northern California 2013
Less than HS HS Some college or AA BA or higher N/A
Source: QWI; Analysis by LAEDC

California’s Oil and Gas Industry in 2013 Its Economic Contribution and Workforce
22 LAEDC Institute for Applied Economics
Rest of State
The Rest of State consists of the remaining twenty-three states that have not been included in the four sub-regions above.
Exhibit 4-32 Direct Employment of Oil and Gas Industry Rest of State 2013
211 Oil and gas extraction 1,499 213111 Drilling oil and gas wells 297 213112 Support activities for oil and gas ops 78
2212 Natural gas distribution 1,229 23712 Oil and gas pipeline construction 38 32411 Petroleum refineries 22
324191 Petroleum lubricating oil / grease mfg - 32511 Petrochemical manufacturing -
333132 Oil and gas field machinery mfg - 4247 Petroleum prods wholesalers 542
447 Gasoline stations 3,823 45431 Fuel dealers 771
486 Pipeline transportation 52
TOTAL DIRECT EMPLOYMENT 8,350 Percent of California Industry Employment 4.5%
Exhibit 4-33 Total Economic and Fiscal Contribution of Oil and Gas Industry Rest of State 2013
ECONOMIC CONTRIBUTION Employment Labor
Income ($ millions)
Value Added
($ millions)
Output ($ millions)
Direct 8,350 $ 590 $ 1,210 $ 2,020 Indirect 1,550 60 130 220 Induced 3,020 120 220 370
TOTAL CONTRIBUTION 12,920 $ 770 $ 1,560 $ 2,610 Percent of Total CA Contribution 2.8% 2.0% 2.2% 1.3%
FISCAL CONTRIBUTION
State and Local ($ millions)
Federal ($ millions)
Total Taxes ($ millions)
Sales and excise taxes $ 629.3 $ 174.3 $ 803.7 Property taxes 124.3 - 124.3 Personal income taxes 24.5 64.5 88.9 Corporate profits taxes 7.9 31.3 39.2 Social insurance taxes 2.2 67.3 69.5 Other taxes 26.7 9.0 35.7 Fees, fines and permits 6.6 2.3 8.9
TOTAL TAX REVENUES $ 821.5 $ 348.7 $ 1,170.2
Exhibit 4-31 Rest of State
Source: ESRI

Its Economic Contribution and Workforce California’s Oil and Gas Industry in 2013
LAEDC Institute for Applied Economics 23
5 California’s Oil and Gas Industry by County
alifornia is comprised of 58 individual counties. Oil and gas industry activity varies from county to county. This section identifies the direct activity of
the oil and gas industry in each county and then estimates their economic and fiscal contribution.
Exhibit 5-1 identifies the direct industry employment, the total economic contribution and the total fiscal contribution of each county. Counties asterisked (*) are detailed in the following pages, in alphabetical order.
Exhibit 5-1 Oil and Gas Industry Total Economic and Fiscal Contribution by County California 2013
----------------------------- Total Economic Contribution --------------------------------
($ millions)
Total Fiscal Contribution
County Direct Employment Total Employment Total Labor Income
($ millions) Total Value Added
($ millions)
Alameda County * 4,733 9,088 730.0 1,496.3 982.4 Alpine County 1 1 0.0 0.0 0.0 Amador County 207 288 14.3 29.7 23.7 Butte County * 684 1,151 70.3 139.9 114.4 Calaveras County 287 442 32.6 68.4 33.7 Colusa County * 252 333 21.9 50.0 28.8 Contra Costa County * 10,318 36,068 4,258.1 9,899.8 2,553.7 Del Norte County 135 175 9.0 14.2 10.5 El Dorado County * 861 1,259 69.9 152.8 117.3 Fresno County * 2,167 3,606 199.9 352.5 411.8 Glenn County * 335 440 26.1 53.0 30.7 Humboldt County * 718 1,191 71.8 143.1 94.6 Imperial County * 729 968 48.9 112.4 89.2 Inyo County 269 309 6.3 24.2 25.8 Kern County * 23,857 44,544 3,821.4 6,366.9 2,167.5 Kings County * 492 629 34.0 70.0 70.6 Lake County 341 476 28.9 57.4 37.0 Lassen County 137 164 5.0 15.2 11.6 Los Angeles County * 49,279 116,925 10,493.5 20,442.1 8,756.9 Madera County * 505 748 53.4 100.9 90.7 Marin County * 1,072 1,788 195.3 345.2 199.2 Mariposa County 81 99 3.1 8.2 9.1 Mendocino County * 630 1,067 74.8 154.1 90.2 Merced County 893 1,258 64.4 105.7 137.0 Modoc County 247 280 5.0 18.0 11.6 Mono County 105 133 5.7 11.7 6.3 Monterey County * 1,233 1,941 146.8 226.6 202.2 Napa County * 464 745 61.9 104.2 83.1 Nevada County 587 803 25.9 96.0 67.7 Orange County * 13,543 28,186 2,431.9 3,803.9 2,189.0 Placer County * 1,187 2,146 164.5 258.3 237.9 Plumas County 248 374 29.6 69.7 29.8 Riverside County * 5,562 10,105 709.1 1,310.4 1,195.0 Sacramento County * 3,704 7,255 655.8 960.2 745.6 San Benito County 157 208 11.3 26.7 25.7 San Bernardino County * 8,886 15,461 1,099.3 2,309.5 1,586.5 San Diego County * 14,660 26,806 2,079.3 4,471.7 2,592.3 San Francisco County * 5,776 9,926 1,418.8 2,750.1 958.0
C

California’s Oil and Gas Industry in 2013 Its Economic Contribution and Workforce
24 LAEDC Institute for Applied Economics
Exhibit 5-1 (cont’d)
----------------------------- Total Economic Contribution -----------------------------
County Direct Employment Total Employment Total Labor Income
($ millions) Total Value Added
($ millions) ($ millions)
Total Fiscal Contribution
San Joaquin County * 2,304 3,630 212.4 424.7 716.6 San Luis Obispo County * 1,906 3,704 250.2 518.1 249.0 San Mateo County * 1,990 2,681 184.7 308.8 368.7 Santa Barbara County * 2,756 5,135 506.6 813.3 369.2 Santa Clara County * 3,600 5,048 341.8 560.4 777.9 Santa Cruz County 891 1,360 78.4 167.5 151.0 Shasta County * 989 1,856 132.4 245.0 163.4 Sierra County 10 12 0.2 0.5 0.2 Siskiyou County 356 494 23.7 41.3 43.0 Solano County * 2,842 5,711 476.4 1,179.7 479.6 Sonoma County * 1,576 2,401 121.6 230.8 244.4 Stanislaus County * 1,432 2,233 112.4 232.2 259.2 Sutter County * 300 557 51.3 73.8 55.0 Tehama County * 542 678 25.1 51.1 65.1 Trinity County 84 114 6.6 10.7 4.7 Tulare County * 1,558 2,662 223.8 425.4 268.4 Tuolumne County 310 460 26.4 57.4 34.5 Ventura County * 4,351 8,913 905.3 1,469.7 712.4 Yolo County * 734 1,025 65.3 110.4 120.7 Yuba County * 455 541 18.2 55.4 46.6
TOTAL 2013 184,100 455,940 38,280 71,890 34,040
Source: Estimates by LAEDC
Fiscal contributions may not sum to the aggregate state level fiscal contribution since some tax revenues cannot be estimated at the county level with any accuracy. The estimates provided at the county level are therefore likely to be conservative.
Additionally, county-level economic contributions may not add to sub-regional contributions because estimates are produced at defined geographic levels, which do not account for spill-over impacts between counties. Such spill-over effects are captured in state level impacts and in the sub-regional impacts.

Its Economic Contribution and Workforce California’s Oil and Gas Industry in 2013
LAEDC Institute for Applied Economics 25
Alameda County
Exhibit 5-2 Direct Activity of Oil and Gas Industry Alameda County 2013
Employment Labor Income ($ millions)
211 Oil and gas extraction 514 $ 28.7 213111 Drilling oil and gas wells 63 3.5 213112 Support activities for oil and gas operations 33 0.8
2212 Natural gas distribution 1,541 270.9 23712 Oil and gas pipeline construction 34 3.2 32411 Petroleum refineries 150 40.2
324191 Petroleum lubricating oil and grease mfg 67 3.8 32511 Petrochemical manufacturing - -
333132 Oil and gas field machinery and eqmt mfg - - 4247 Petroleum and petroleum prods wholesalers 117 10.2
447 Gasoline stations 2,195 127.6 45431 Fuel dealers 11 0.3
486 Pipeline transportation 9 1.6
TOTAL DIRECT ACTIVITY 4,733 $ 490.9
Exhibit 5-3 Total Economic and Fiscal Contribution of Oil and Gas Industry Alameda County 2013
ECONOMIC CONTRIBUTION Employment Labor Income
($ millions) Value Added
($ millions) Output
($ millions) Direct 4,733 $ 490.9 $ 1,111.8 $ 2,873.8 Indirect 1,534 99.1 150.4 249.1 Induced 2,821 139.9 234.2 375.7
TOTAL CONTRIBUTION 9,088 $ 730.0. $ 2,204.0 $ 3,498.7
Percent of Total CA Contribution 2.4% 2.2% 2.4% 1.8% Percent of County Total 1.0% 1.1% 1.6% 2.1%
FISCAL CONTRIBUTION
State and Local ($ millions)
Federal ($ millions)
Total Taxes ($ millions)
Sales and excise taxes $ 518.0 $ 129.0 $ 647.0 Property taxes 97.3 - 97.3 Personal income taxes 23.5 62.6 86.1 Corporate profits taxes 9.1 36.1 45.2 Social insurance taxes 1.9 68.7 70.6 Other taxes 21.1 7.3 28.4 Fees, fines and permits 5.9 1.9 7.8
TOTAL TAX REVENUES $ 676.9 $ 305.5 $ 982.4
Source: Estimates by LAEDC

California’s Oil and Gas Industry in 2013 Its Economic Contribution and Workforce
26 LAEDC Institute for Applied Economics
Butte County
Exhibit 5-4 Direct Activity of Oil and Gas Industry Butte County 2013
Employment Labor Income ($ millions)
211 Oil and gas extraction 79 $ 1.0 213111 Drilling oil and gas wells 10 0.1 213112 Support activities for oil and gas operations 1 0.0
2212 Natural gas distribution 138 17.7 23712 Oil and gas pipeline construction - - 32411 Petroleum refineries - -
324191 Petroleum lubricating oil and grease mfg - - 32511 Petrochemical manufacturing - -
333132 Oil and gas field machinery and eqmt mfg - - 4247 Petroleum and petroleum prods wholesalers 42 2.3
447 Gasoline stations 322 28.8 45431 Fuel dealers 73 2.1
486 Pipeline transportation 19 1.4
TOTAL DIRECT ACTIVITY 684 $ 53.5
Exhibit 5-5 Total Economic and Fiscal Contribution of Oil and Gas Industry Butte County 2013
ECONOMIC CONTRIBUTION Employment Labor Income
($ millions) Value Added
($ millions) Output
($ millions) Direct 684 $ 53.5 $ 107.3 $ 159.9 Indirect 150 5.5 11.3 19.1 Induced 317 11.3 21.3 35.4
TOTAL CONTRIBUTION 1,151 $ 70.3 $ 139.9 $ 214.4
Percent of Total CA Contribution 0.3% 0.2% 0.2% 0.1% Percent of County Total 1.1% 1.5% 1.8% 1.5%
FISCAL CONTRIBUTION
State and Local ($ millions)
Federal ($ millions)
Total Taxes ($ millions)
Sales and excise taxes $ 63.3 $ 18.8 $ 82.1 Property taxes 10.4 - 10.4 Personal income taxes 2.0 5.3 7.3 Corporate profits taxes 0.7 2.9 3.6 Social insurance taxes 0.2 6.5 6.8 Other taxes 2.2 1.1 3.4 Fees, fines and permits 0.5 0.3 0.8
TOTAL TAX REVENUES $ 79.5 $ 34.9 $ 114.4
Source: Estimates by LAEDC

Its Economic Contribution and Workforce California’s Oil and Gas Industry in 2013
LAEDC Institute for Applied Economics 27
Colusa County
Exhibit 5-6 Direct Activity of Oil and Gas Industry Colusa County 2013
Employment Labor Income ($ millions)
211 Oil and gas extraction 12 $ 1.0 213111 Drilling oil and gas wells 1 0.1 213112 Support activities for oil and gas operations 11 1.2
2212 Natural gas distribution 60 8.4 23712 Oil and gas pipeline construction 1 0.1 32411 Petroleum refineries - -
324191 Petroleum lubricating oil and grease mfg - - 32511 Petrochemical manufacturing - -
333132 Oil and gas field machinery and eqmt mfg - - 4247 Petroleum and petroleum prods wholesalers 82 6.5
447 Gasoline stations 80 1.6 45431 Fuel dealers 4 0.1
486 Pipeline transportation 0 0.0
TOTAL DIRECT ACTIVITY 252 $ 19.1
Exhibit 5-7 Total Economic and Fiscal Contribution of Oil and Gas Industry Colusa County 2013
ECONOMIC CONTRIBUTION Employment Labor Income
($ millions) Value Added
($ millions) Output
($ millions) Direct 252 $ 19.1 $ 44.2 $ 65.9 Indirect 40 1.3 2.6 4.6 Induced 41 1.5 3.2 5.2
TOTAL CONTRIBUTION 333 $ 21.9 $ 50.0 $ 75.7
Percent of Total CA Contribution 0.1% 0.1% 0.1% 0.04% Percent of County Total 2.8% 3.3% 4.6% 3.0%
FISCAL CONTRIBUTION
State and Local ($ millions)
Federal ($ millions)
Total Taxes ($ millions)
Sales and excise taxes $ 13.1 $ 3.5 $ 16.6 Property taxes 4.4 - 4.4 Personal income taxes 0.7 1.8 2.6 Corporate profits taxes 0.3 1.2 1.5 Social insurance taxes 0.1 2.2 2.3 Other taxes 0.9 0.3 1.3 Fees, fines and permits 0.2 0.1 0.3
TOTAL TAX REVENUES $ 19.8 $ 9.1 $ 28.8
Source: Estimates by LAEDC

California’s Oil and Gas Industry in 2013 Its Economic Contribution and Workforce
28 LAEDC Institute for Applied Economics
Contra Costa County
Exhibit 5-8 Direct Activity of Oil and Gas Industry Contra Costa County 2013
Employment Labor Income ($ millions)
211 Oil and gas extraction 1,275 $ 559.3 213111 Drilling oil and gas wells 348 91.8 213112 Support activities for oil and gas operations 225 31.6
2212 Natural gas distribution 618 202.5 23712 Oil and gas pipeline construction 314 27.6 32411 Petroleum refineries 5,443 1,708.4
324191 Petroleum lubricating oil and grease mfg 71 6.7 32511 Petrochemical manufacturing - -
333132 Oil and gas field machinery and eqmt mfg 17 1.4 4247 Petroleum and petroleum prods wholesalers 324 29.3
447 Gasoline stations 1,428 83.6 45431 Fuel dealers 113 2.2
486 Pipeline transportation 142 15.6
TOTAL DIRECT ACTIVITY 10,318 $ 2,759.9
Exhibit 5-9 Total Economic and Fiscal Contribution of Oil and Gas Industry Contra Costa County 2013
ECONOMIC CONTRIBUTION Employment Labor Income
($ millions) Value Added
($ millions) Output
($ millions) Direct 10,318 $ 2,759.9 $ 7,578.0 $ 54,446.4 Indirect 11,293 794.7 1,093.4 1,909.7 Induced 14,457 703.5 1,228.4 1,935.4
TOTAL CONTRIBUTION 36,068 $ 4,258.1 $ 9,899.8 $ 58,291.5
Percent of Total CA Contribution 9.6% 12.9% 15.6% 30.4% Percent of County Total 7.1% 12.9% 17.7% 43.8%
FISCAL CONTRIBUTION
State and Local ($ millions)
Federal ($ millions)
Total Taxes ($ millions)
Sales and excise taxes $ 611.3 $ 120.3 $ 731.6 Property taxes 281.3 - 281.3 Personal income taxes 145.1 386.3 531.4 Corporate profits taxes 88.4 350.1 438.5 Social insurance taxes 10.2 445.0 455.1 Other taxes 64.3 16.3 80.6 Fees, fines and permits 31.0 4.1 35.1
TOTAL TAX REVENUES $ 1,231.5 $ 1,322.2 $ 2,553.7
Source: Estimates by LAEDC

Its Economic Contribution and Workforce California’s Oil and Gas Industry in 2013
LAEDC Institute for Applied Economics 29
El Dorado County
Exhibit 5-10 Direct Activity of Oil and Gas Industry El Dorado County 2013
Employment Labor Income ($ millions)
211 Oil and gas extraction 166 $ 4.2 213111 Drilling oil and gas wells 53 3.1 213112 Support activities for oil and gas operations 3 0.1
2212 Natural gas distribution 129 14.0 23712 Oil and gas pipeline construction 2 0.1 32411 Petroleum refineries 2 0.7
324191 Petroleum lubricating oil and grease mfg - - 32511 Petrochemical manufacturing - -
333132 Oil and gas field machinery and eqmt mfg - - 4247 Petroleum and petroleum prods wholesalers 15 0.4
447 Gasoline stations 366 31.4 45431 Fuel dealers 125 1.2
486 Pipeline transportation 1 0.1
TOTAL DIRECT ACTIVITY 861 $ 55.4
Exhibit 5-11 Total Economic and Fiscal Contribution of Oil and Gas Industry El Dorado County 2013
ECONOMIC CONTRIBUTION Employment Labor Income
($ millions) Value Added
($ millions) Output
($ millions) Direct 861 $ 55.4 $ 123.2 $ 209.5 Indirect 144 5.5 11.6 20.1 Induced 254 9.0 18.0 30.9
TOTAL CONTRIBUTION 1,259 $ 69.9 $ 152.8 $ 260.4
Percent of Total CA Contribution 0.3% 0.2% 0.2% 0.1% Percent of County Total 1.3% 1.8% 2.1% 2.1%
FISCAL CONTRIBUTION
State and Local ($ millions)
Federal ($ millions)
Total Taxes ($ millions)
Sales and excise taxes $ 63.6 $ 17.2 $ 80.8 Property taxes 12.7 - 12.7 Personal income taxes 2.4 6.2 8.6 Corporate profits taxes 0.9 3.5 4.4 Social insurance taxes 0.2 6.2 6.4 Other taxes 2.7 0.9 3.6 Fees, fines and permits 0.6 0.2 0.9
TOTAL TAX REVENUES $ 83.0 $ 34.3 117.3
Source: Estimates by LAEDC

California’s Oil and Gas Industry in 2013 Its Economic Contribution and Workforce
30 LAEDC Institute for Applied Economics
Fresno County
Exhibit 5-12 Direct Activity of Oil and Gas Industry Fresno County 2013
Employment Labor Income ($ millions)
211 Oil and gas extraction 255 $ 19.5 213111 Drilling oil and gas wells 31 2.4 213112 Support activities for oil and gas operations 124 9.4
2212 Natural gas distribution 23 2.8 23712 Oil and gas pipeline construction 11 0.7 32411 Petroleum refineries 28 12.7
324191 Petroleum lubricating oil and grease mfg - - 32511 Petrochemical manufacturing - -
333132 Oil and gas field machinery and eqmt mfg - - 4247 Petroleum and petroleum prods wholesalers 224 14.6
447 Gasoline stations 1,312 72.3 45431 Fuel dealers 111 1.8
486 Pipeline transportation 46 4.2
TOTAL DIRECT ACTIVITY 2,167 $ 140.5
Exhibit 5-13 Total Economic and Fiscal Contribution of Oil and Gas Industry Fresno County 2013
ECONOMIC CONTRIBUTION Employment Labor Income
($ millions) Value Added
($ millions) Output
($ millions) Direct 2,167 $ 140.5 $ 245.1 $ 596.6 Indirect 580 25.6 46.4 78.9 Induced 859 33.9 61.0 102.6
TOTAL CONTRIBUTION 3,606 $ 199.9 $ 352.5 $ 778.1
Percent of Total CA Contribution 1.0% 0.6% 0.6% 0.4% Percent of County Total 0.8% 0.9% 1.0% 1.2%
FISCAL CONTRIBUTION
State and Local ($ millions)
Federal ($ millions)
Total Taxes ($ millions)
Sales and excise taxes $ 257.3 $ 75.4 $ 332.6 Property taxes 20.8 - 20.8 Personal income taxes 6.3 16.5 22.8 Corporate profits taxes 1.7 6.8 8.5 Social insurance taxes 0.6 17.8 18.4 Other taxes 4.6 2.1 6.7 Fees, fines and permits 1.5 0.5 2.0
TOTAL TAX REVENUES $ 292.7 $ 119.1 $ 411.8
Source: Estimates by LAEDC

Its Economic Contribution and Workforce California’s Oil and Gas Industry in 2013
LAEDC Institute for Applied Economics 31
Glenn County
Exhibit 5-14 Direct Activity of Oil and Gas Industry Glenn County 2013
Employment Labor Income ($ millions)
211 Oil and gas extraction 61 $ 4.9 213111 Drilling oil and gas wells 7 0.6 213112 Support activities for oil and gas operations 97 1.6
2212 Natural gas distribution 41 6.3 23712 Oil and gas pipeline construction 13 0.5 32411 Petroleum refineries - -
324191 Petroleum lubricating oil and grease mfg - - 32511 Petrochemical manufacturing - -
333132 Oil and gas field machinery and eqmt mfg - - 4247 Petroleum and petroleum prods wholesalers 24 1.4
447 Gasoline stations 91 7.7 45431 Fuel dealers - -
486 Pipeline transportation 0 0.0
TOTAL DIRECT ACTIVITY 335 $ 23.0
Exhibit 5-15 Total Economic and Fiscal Contribution of Oil and Gas Industry Glenn County 2013
ECONOMIC CONTRIBUTION Employment Labor Income
($ millions) Value Added
($ millions) Output
($ millions) Direct 335 $ 23.0 $ 46.4 $ 72.5 Indirect 37 1.2 2.3 4.2 Induced 67 1.9 4.3 7.2
TOTAL CONTRIBUTION 440 $ 26.1 $ 53.0 $ 84.0
Percent of Total CA Contribution 0.1% 0.1% 0.1% 0.04% Percent of County Total 3.5% 4.0% 4.8% 4.1%
FISCAL CONTRIBUTION
State and Local ($ millions)
Federal ($ millions)
Total Taxes ($ millions)
Sales and excise taxes $ 14.2 $ 3.8 $ 18.0 Property taxes 4.3 - 4.3 Personal income taxes 0.8 2.2 3.0 Corporate profits taxes 0.3 1.1 1.4 Social insurance taxes 0.1 2.4 2.4 Other taxes 0.3 0.3 1.2 Fees, fines and permits 0.1 0.1 0.3
TOTAL TAX REVENUES $ 20.9 $ 9.8 $ 30.7
Source: Estimates by LAEDC

California’s Oil and Gas Industry in 2013 Its Economic Contribution and Workforce
32 LAEDC Institute for Applied Economics
Humboldt County
Exhibit 5-16 Direct Activity of Oil and Gas Industry Humboldt County 2013
Employment Labor Income ($ millions)
211 Oil and gas extraction 96 $ 0.9 213111 Drilling oil and gas wells 14 0.4 213112 Support activities for oil and gas operations 2 0.0
2212 Natural gas distribution 100 14.6 23712 Oil and gas pipeline construction - - 32411 Petroleum refineries 10 1.3
324191 Petroleum lubricating oil and grease mfg - - 32511 Petrochemical manufacturing - -
333132 Oil and gas field machinery and eqmt mfg - - 4247 Petroleum and petroleum prods wholesalers 35 1.7
447 Gasoline stations 417 35.5 45431 Fuel dealers 36 0.6
486 Pipeline transportation 9 0.7
TOTAL DIRECT ACTIVITY 718 $ 55.7
Exhibit 5-17 Total Economic and Fiscal Contribution of Oil and Gas Industry Humboldt County 2013
ECONOMIC CONTRIBUTION Employment Labor Income
($ millions) Value Added
($ millions) Output
($ millions) Direct 718 $ 55.7 $ 110.9 $ 241.4 Indirect 157 5.6 11.6 20.8 Induced 315 10.5 20.6 34.9
TOTAL CONTRIBUTION 1,191 $ 71.8 $ 143.1 $ 297.2
Percent of Total CA Contribution 0.3% 0.2% 0.2% 0.2% Percent of County Total 1.7% 2.5% 3.0% 3.5%
FISCAL CONTRIBUTION
State and Local ($ millions)
Federal ($ millions)
Total Taxes ($ millions)
Sales and excise taxes $ 49.3 $ 14.1 $ 63.4 Property taxes 9.9 - 9.9 Personal income taxes 2.0 5.3 7.4 Corporate profits taxes 0.7 2.9 3.7 Social insurance taxes 6.2 6.2 6.5 Other taxes 2.1 0.9 3.0 Fees, fines and permits 0.5 0.2 0.8
TOTAL TAX REVENUES $ 64.9 $ 29.6 $ 94.6
Source: Estimates by LAEDC

Its Economic Contribution and Workforce California’s Oil and Gas Industry in 2013
LAEDC Institute for Applied Economics 33
Imperial County
Exhibit 5-18 Direct Activity of Oil and Gas Industry Imperial County 2013
Employment Labor Income ($ millions)
211 Oil and gas extraction 67 $ 0.2 213111 Drilling oil and gas wells 8 0.0 213112 Support activities for oil and gas operations 49 3.5
2212 Natural gas distribution 137 13.3 23712 Oil and gas pipeline construction - - 32411 Petroleum refineries - -
324191 Petroleum lubricating oil and grease mfg - - 32511 Petrochemical manufacturing - -
333132 Oil and gas field machinery and eqmt mfg - - 4247 Petroleum and petroleum prods wholesalers 58 3.6
447 Gasoline stations 398 19.1 45431 Fuel dealers - -
486 Pipeline transportation 10 1.1
TOTAL DIRECT ACTIVITY 729 $ 40.8
Exhibit 5-19 Total Economic and Fiscal Contribution of Oil and Gas Industry Imperial County 2013
ECONOMIC CONTRIBUTION Employment Labor Income
($ millions) Value Added
($ millions) Output
($ millions) Direct 729 $ 40.8 $ 95.7 $ 148.0 Indirect 104 3.9 7.6 13.4 Induced 135 4.1 9.1 15.5
TOTAL CONTRIBUTION 968 $ 48.9 $ 112.4 $ 177.0
Percent of Total CA Contribution 0.3% 0.1% 0.2% 0.1% Percent of County Total 1.3% 1.3% 1.7% 1.5%
FISCAL CONTRIBUTION
State and Local ($ millions)
Federal ($ millions)
Total Taxes ($ millions)
Sales and excise taxes $ 48.8 $ 13.6 $ 62.4 Property taxes 10.0 - 10.0 Personal income taxes 1.4 3.8 5.2 Corporate profits taxes 0.7 2.6 3.2 Social insurance taxes 0.2 4.4 4.4 Other taxes 2.1 0.9 3.0 Fees, fines and permits 0.4 0.2 0.7
TOTAL TAX REVENUES $ 63.7 $ 25.5 $ 89.2
Source: Estimates by LAEDC

California’s Oil and Gas Industry in 2013 Its Economic Contribution and Workforce
34 LAEDC Institute for Applied Economics
Kern County
Exhibit 5-20 Direct Activity of Oil and Gas Industry Kern County 2013
Employment Labor Income ($ millions)
211 Oil and gas extraction 6,339 $ 1,175.7 213111 Drilling oil and gas wells 2,250 290.6 213112 Support activities for oil and gas operations 5,741 554.5
2212 Natural gas distribution 521 103.9 23712 Oil and gas pipeline construction 4,517 328.5 32411 Petroleum refineries 959 209.7
324191 Petroleum lubricating oil and grease mfg 3 0.2 32511 Petrochemical manufacturing - -
333132 Oil and gas field machinery and eqmt mfg 319 32.0 4247 Petroleum and petroleum prods wholesalers 378 30.3
447 Gasoline stations 2,414 189.6 45431 Fuel dealers 76 0.8
486 Pipeline transportation 340 38.6
TOTAL DIRECT ACTIVITY 23,857 $ 2,954.2
Exhibit 5-21 Total Economic and Fiscal Contribution of Oil and Gas Industry Kern County 2013
ECONOMIC CONTRIBUTION Employment Labor Income
($ millions) Value Added
($ millions) Output
($ millions) Direct 23,857 $ 2,954.2 $ 4,891.6 $ 15,152.3 Indirect 7,073 359.1 517.7 955.7 Induced 13,615 508.0 957.6 1,580.8
TOTAL CONTRIBUTION 44,544 $ 3,821.4 $ 6,366.9 $ 17,689.1
Percent of Total CA Contribution 11.8% 11.6% 10.0% 9.2% Percent of County Total 11.0% 17.0% 17.9% 27.0%
FISCAL CONTRIBUTION
State and Local ($ millions)
Federal ($ millions)
Total Taxes ($ millions)
Sales and excise taxes $ 607.6 $ 164.7 $ 772.3 Property taxes 285.6 - 285.6 Personal income taxes 117.2 307.7 424.9 Corporate profits taxes 31.6 125.2 156.8 Social insurance taxes 13.9 387.9 401.8 Other taxes 63.6 28.9 92.5 Fees, fines and permits 26.3 7.3 33.7
TOTAL TAX REVENUES $ 1,145.7 $ 1,021.8 $ 2,167.5
Source: Estimates by LAEDC

Its Economic Contribution and Workforce California’s Oil and Gas Industry in 2013
LAEDC Institute for Applied Economics 35
Kings County
Exhibit 5-22 Direct Activity of Oil and Gas Industry Kings County 2013
Employment Labor Income ($ millions)
211 Oil and gas extraction 160 $ 0.0 213111 Drilling oil and gas wells - - 213112 Support activities for oil and gas operations - -
2212 Natural gas distribution 57 6.1 23712 Oil and gas pipeline construction - - 32411 Petroleum refineries - -
324191 Petroleum lubricating oil and grease mfg - - 32511 Petrochemical manufacturing - -
333132 Oil and gas field machinery and eqmt mfg - - 4247 Petroleum and petroleum prods wholesalers 33 2.2
447 Gasoline stations 230 20.5 45431 Fuel dealers 8 0.1
486 Pipeline transportation 2 0.2
TOTAL DIRECT ACTIVITY 492 $ 29.0
Exhibit 5-23 Total Economic and Fiscal Contribution of Oil and Gas Industry Kings County 2013
ECONOMIC CONTRIBUTION Employment Labor Income
($ millions) Value Added
($ millions) Output
($ millions) Direct 492 $ 29.0 $ 59.7 $ 98.9 Indirect 44 1.7 3.5 5.9 Induced 93 3.3 6.8 11.5
TOTAL CONTRIBUTION 629 $ 34.0 $ 70.0 $ 116.3
Percent of Total CA Contribution 0.2% 0.1% 0.1% 0.1% Percent of County Total 1.1% 1.0% 1.2% 1.0%
FISCAL CONTRIBUTION
State and Local ($ millions)
Federal ($ millions)
Total Taxes ($ millions)
Sales and excise taxes $ 41.0 $ 11.5 $ 52.5 Property taxes 7.7 - 7.7 Personal income taxes 1.0 2.7 3.8 Corporate profits taxes 0.3 1.1 1.4 Social insurance taxes 0.1 2.6 2.7 Other taxes 1.6 0.5 2.1 Fees, fines and permits 0.3 0.1 0.4
TOTAL TAX REVENUES $ 52.1 $ 18.5 $ 70.6
Source: Estimates by LAEDC

California’s Oil and Gas Industry in 2013 Its Economic Contribution and Workforce
36 LAEDC Institute for Applied Economics
Los Angeles County
Exhibit 5-24 Direct Activity of Oil and Gas Industry Los Angeles County 2013
Employment Labor Income ($ millions)
211 Oil and gas extraction 10,910 $ 1,957.2 213111 Drilling oil and gas wells 2,150 338.5 213112 Support activities for oil and gas operations 1,780 158.7
2212 Natural gas distribution 10,476 1,595.6 23712 Oil and gas pipeline construction 3,172 207.1 32411 Petroleum refineries 4,131 935.6
324191 Petroleum lubricating oil and grease mfg 373 32.5 32511 Petrochemical manufacturing 3 0.2
333132 Oil and gas field machinery and eqmt mfg 852 68.3 4247 Petroleum and petroleum prods wholesalers 1,523 111.0
447 Gasoline stations 12,769 870.0 45431 Fuel dealers 313 6.9
486 Pipeline transportation 826 613.5
TOTAL DIRECT ACTIVITY 49,279 $ 6,895.3
Exhibit 5-25 Total Economic and Fiscal Contribution of Oil and Gas Industry Los Angeles County 2013
ECONOMIC CONTRIBUTION Employment Labor Income
($ millions) Value Added
($ millions) Output
($ millions) Direct 49,279 $ 6,895.3 $ 14,630.9 $ 54,943.5 Indirect 25,560 1,576.4 2,404.8 4,141.0 Induced 42,085 2,021.8 3,406,5 5,505.7
TOTAL CONTRIBUTION 116,925 $ 10,493.5 $ 20,442.1 $ 64,590.2
Percent of Total CA Contribution 31.0% 31.9% 32.1% 33.7% Percent of County Total 2.0% 3.0% 3.5% 6.5%
FISCAL CONTRIBUTION
State and Local ($ millions)
Federal ($ millions)
Total Taxes ($ millions)
Sales and excise taxes $ 3,615.5 $ 908.8 $ 4,524.4 Property taxes 1,032.8 - 1,032.8 Personal income taxes 312.1 826.2 1,138.3 Corporate profits taxes 128.3 508.2 636.5 Social insurance taxes 24.1 982.1 1,006.2 Other taxes 226.2 94.1 320.3 Fees, fines and permits 74.5 23.9 98.4
TOTAL TAX REVENUES $ 5,413.5 $ 3,343.4 $ 8,756.9
Source: Estimates by LAEDC

Its Economic Contribution and Workforce California’s Oil and Gas Industry in 2013
LAEDC Institute for Applied Economics 37
Madera County
Exhibit 5-26 Direct Activity of Oil and Gas Industry Madera County 2013
Employment Labor Income ($ millions)
211 Oil and gas extraction 61 $ 0.5 213111 Drilling oil and gas wells 19 0.8 213112 Support activities for oil and gas operations 1 0.0
2212 Natural gas distribution 77 10.5 23712 Oil and gas pipeline construction 1 0.1 32411 Petroleum refineries - -
324191 Petroleum lubricating oil and grease mfg - - 32511 Petrochemical manufacturing - -
333132 Oil and gas field machinery and eqmt mfg - - 4247 Petroleum and petroleum prods wholesalers 63 4.0
447 Gasoline stations 236 27.7 45431 Fuel dealers 47 0.6
486 Pipeline transportation 0 0.1
TOTAL DIRECT ACTIVITY 505 $ 44.2
Exhibit 5-27 Total Economic and Fiscal Contribution of Oil and Gas Industry Madera County 2013
ECONOMIC CONTRIBUTION Employment Labor Income
($ millions) Value Added
($ millions) Output
($ millions) Direct 505 $ 44.2 $ 82.1 $ 118.6 Indirect 78 2.8 6.2 10.7 Induced 166 6.3 12.5 21.2
TOTAL CONTRIBUTION 748 $ 53.4 $ 100.9 $ 150.5
Percent of Total CA Contribution 0.2% 0.2% 0.2% 0.1% Percent of County Total 1.2% 1.6% 1.9% 1.6%
FISCAL CONTRIBUTION
State and Local ($ millions)
Federal ($ millions)
Total Taxes ($ millions)
Sales and excise taxes $ 51.7 $ 16.2 $ 67.9 Property taxes 7.3 - 7.3 Personal income taxes 1.6 4.3 5.9 Corporate profits taxes 0.5 2.0 2.5 Social insurance taxes 0.2 4.3 4.4 Other taxes 1.6 0.5 2.1 Fees, fines and permits 0.4 0.1 0.6
TOTAL TAX REVENUES $ 63.4 $ 27.3 $ 90.7
Source: Estimates by LAEDC

California’s Oil and Gas Industry in 2013 Its Economic Contribution and Workforce
38 LAEDC Institute for Applied Economics
Marin County
Exhibit 5-28 Direct Activity of Oil and Gas Industry Marin County 2013
Employment Labor Income ($ millions)
211 Oil and gas extraction 366 $ 50.0 213111 Drilling oil and gas wells 45 6.1 213112 Support activities for oil and gas operations 24 1.5
2212 Natural gas distribution 310 35.1 23712 Oil and gas pipeline construction 1 0.1 32411 Petroleum refineries - -
324191 Petroleum lubricating oil and grease mfg - - 32511 Petrochemical manufacturing - -
333132 Oil and gas field machinery and eqmt mfg - - 4247 Petroleum and petroleum prods wholesalers 1 0.1
447 Gasoline stations 320 64.8 45431 Fuel dealers 3 0.1
486 Pipeline transportation 2 0.2
TOTAL DIRECT ACTIVITY 1,072 $ 158.0
Exhibit 5-29 Total Economic and Fiscal Contribution of Oil and Gas Industry Marin County 2013
ECONOMIC CONTRIBUTION Employment Labor Income
($ millions) Value Added
($ millions) Output
($ millions) Direct 1,072 $ 158.0 $ 282.2 $ 396.3 Indirect 181 10.9 17.5 28.6 Induced 535 26.4 45.6 71.9
TOTAL CONTRIBUTION 1,788 $ 195.3 $ 345.2 $ 496.8
Percent of Total CA Contribution 0.5% 0.6% 0.5% 0.3% Percent of County Total 0.9% 1.7% 1.9% 1.7%
FISCAL CONTRIBUTION
State and Local ($ millions)
Federal ($ millions)
Total Taxes ($ millions)
Sales and excise taxes $ 99.4 $ 23.1 $ 122.5 Property taxes 24.3 - 24.3 Personal income taxes 6.8 18.3 25.2 Corporate profits taxes 1.0 4.0 5.0 Social insurance taxes 0.2 13.6 13.8 Other taxes 5.3 1.2 6.5 Fees, fines and permits 1.6 0.3 1.9
TOTAL TAX REVENUES $ 138.7 $ 60.5 $ 199.2
Source: Estimates by LAEDC

Its Economic Contribution and Workforce California’s Oil and Gas Industry in 2013
LAEDC Institute for Applied Economics 39
Mendocino County
Exhibit 5-30 Direct Activity of Oil and Gas Industry Mendocino County 2013
Employment Labor Income ($ millions)
211 Oil and gas extraction 66 $ 0.8 213111 Drilling oil and gas wells 8 0.1 213112 Support activities for oil and gas operations 1 0.0
2212 Natural gas distribution 168 25.5 23712 Oil and gas pipeline construction - - 32411 Petroleum refineries - -
324191 Petroleum lubricating oil and grease mfg - - 32511 Petrochemical manufacturing - -
333132 Oil and gas field machinery and eqmt mfg - - 4247 Petroleum and petroleum prods wholesalers 94 4.4
447 Gasoline stations 250 29.6 45431 Fuel dealers 43 0.6
486 Pipeline transportation 1 0.2
TOTAL DIRECT ACTIVITY 630 $ 61.3
Exhibit 5-31 Total Economic and Fiscal Contribution of Oil and Gas Industry Mendocino County 2013
ECONOMIC CONTRIBUTION Employment Labor Income
($ millions) Value Added
($ millions) Output
($ millions) Direct 630 $ 61.3 $ 125.1 $ 179.8 Indirect 136 4.1 9.4 17.0 Induced 300 9.4 19.6 33.4
TOTAL CONTRIBUTION 1,067 $ 74.8 $ 154.1 $ 230.2
Percent of Total CA Contribution 0.3% 0.2% 0.2% 0.1% Percent of County Total 2.2% 3.9% 4.6% 3.9%
FISCAL CONTRIBUTION
State and Local ($ millions)
Federal ($ millions)
Total Taxes ($ millions)
Sales and excise taxes $ 42.8 $ 12.6 $ 55.4 Property taxes 11.1 - 11.1 Personal income taxes 2.2 5.7 7.9 Corporate profits taxes 0.8 3.0 3.8 Social insurance taxes 0.3 7.1 7.4 Other taxes 2.4 1.2 3.6 Fees, fines and permits 0.6 0.3 0.9
TOTAL TAX REVENUES $ 60.2 $ 30.0 $ 90.2
Source: Estimates by LAEDC

California’s Oil and Gas Industry in 2013 Its Economic Contribution and Workforce
40 LAEDC Institute for Applied Economics
Merced County
Exhibit 5-32 Direct Activity of Oil and Gas Industry Merced County 2013
Employment Labor Income ($ millions)
211 Oil and gas extraction 101 $ 0.1 213111 Drilling oil and gas wells 12 0.0 213112 Support activities for oil and gas operations - -
2212 Natural gas distribution 16 2.7 23712 Oil and gas pipeline construction 2 0.1 32411 Petroleum refineries - -
324191 Petroleum lubricating oil and grease mfg - - 32511 Petrochemical manufacturing - -
333132 Oil and gas field machinery and eqmt mfg - - 4247 Petroleum and petroleum prods wholesalers 67 3.7
447 Gasoline stations 652 44.4 45431 Fuel dealers 43 0.5
486 Pipeline transportation - -
TOTAL DIRECT ACTIVITY 893 $ 51.5
Exhibit 5-33 Total Economic and Fiscal Contribution of Oil and Gas Industry Merced County 2013
ECONOMIC CONTRIBUTION Employment Labor Income
($ millions) Value Added
($ millions) Output
($ millions) Direct 893 $ 51.5 $ 78.9 $ 120.2 Indirect 152 5.3 11.6 19.8 Induced 213 7.5 15.2 25.2
TOTAL CONTRIBUTION 1,258 $ 64.4 $ 105.7 $ 165.3
Percent of Total CA Contribution 0.3% 0.2% 0.2% 0.1% Percent of County Total 1.3% 1.2% 1.3% 1.0%
FISCAL CONTRIBUTION
State and Local ($ millions)
Federal ($ millions)
Total Taxes ($ millions)
Sales and excise taxes $ 83.4 $ 28.3 $ 111.7 Property taxes 7.8 - 7.8 Personal income taxes 2.1 5.4 7.5 Corporate profits taxes 0.4 1.5 1.8 Social insurance taxes 0.2 5.0 5.3 Other taxes 1.7 0.5 2.2 Fees, fines and permits 0.5 0.1 0.7
TOTAL TAX REVENUES $ 96.1 $ 40.9 $ 137.0
Source: Estimates by LAEDC

Its Economic Contribution and Workforce California’s Oil and Gas Industry in 2013
LAEDC Institute for Applied Economics 41
Monterey County
Exhibit 5-34 Direct Activity of Oil and Gas Industry Monterey County 2013
Employment Labor Income ($ millions)
211 Oil and gas extraction 190 $ 18.4 213111 Drilling oil and gas wells 23 2.2 213112 Support activities for oil and gas operations 126 9.7
2212 Natural gas distribution 35 4.7 23712 Oil and gas pipeline construction 2 0.1 32411 Petroleum refineries - -
324191 Petroleum lubricating oil and grease mfg - - 32511 Petrochemical manufacturing - -
333132 Oil and gas field machinery and eqmt mfg - - 4247 Petroleum and petroleum prods wholesalers 117 13.0
447 Gasoline stations 721 67.6 45431 Fuel dealers 19 0.3
486 Pipeline transportation 0 0.0
TOTAL DIRECT ACTIVITY 1,233 $ 116.0
Exhibit 5-35 Total Economic and Fiscal Contribution of Oil and Gas Industry Monterey County 2013
ECONOMIC CONTRIBUTION Employment Labor Income
($ millions) Value Added
($ millions) Output
($ millions) Direct 1,233 $ 116.0 $ 169.4 $ 237.3 Indirect 209 9.7 18.8 30.7 Induced 499 21.1 38.4 61.4
TOTAL CONTRIBUTION 1,941 $ 146.8 $ 226.6 $ 329.4
Percent of Total CA Contribution 0.5% 0.4% 0.4% 0.2% Percent of County Total 0.8% 1.1% 1.1% 1.1%
FISCAL CONTRIBUTION
State and Local ($ millions)
Federal ($ millions)
Total Taxes ($ millions)
Sales and excise taxes $ 116.2 $ 35.1 $ 151.3 Property taxes 12.7 - 12.7 Personal income taxes 4.6 12.0 16.6 Corporate profits taxes 0.8 3.2 4.0 Social insurance taxes 0.4 12.0 12.4 Other taxes 2.8 1.0 3.8 Fees, fines and permits 1.0 0.3 1.3
TOTAL TAX REVENUES $ 138.6 $ 63.6 $ 202.2
Source: Estimates by LAEDC

California’s Oil and Gas Industry in 2013 Its Economic Contribution and Workforce
42 LAEDC Institute for Applied Economics
Napa County
Exhibit 5-36 Direct Activity of Oil and Gas Industry Napa County 2013
Employment Labor Income ($ millions)
211 Oil and gas extraction 78 $ 3.9 213111 Drilling oil and gas wells 10 0.5 213112 Support activities for oil and gas operations 1 0.1
2212 Natural gas distribution 77 9.4 23712 Oil and gas pipeline construction 53 3.8 32411 Petroleum refineries - -
324191 Petroleum lubricating oil and grease mfg - - 32511 Petrochemical manufacturing - -
333132 Oil and gas field machinery and eqmt mfg - - 4247 Petroleum and petroleum prods wholesalers 12 1.1
447 Gasoline stations 226 31.1 45431 Fuel dealers 6 0.1
486 Pipeline transportation 0 0.1
TOTAL DIRECT ACTIVITY 464 $ 49.9
Exhibit 5-37 Total Economic and Fiscal Contribution of Oil and Gas Industry Napa County 2013
ECONOMIC CONTRIBUTION Employment Labor Income
($ millions) Value Added
($ millions) Output
($ millions) Direct 464 $ 49.9 $ 82.7 $ 119.3 Indirect 81 3.5 6.4 10.3 Induced 200 8.5 15.2 23.8
TOTAL CONTRIBUTION 745 $ 61.9 $ 104.2 $ 153.5
Percent of Total CA Contribution 0.2% 0.2% 0.2% 0.1% Percent of County Total 0.7% 1.1% 1.2% 1.0%
FISCAL CONTRIBUTION
State and Local ($ millions)
Federal ($ millions)
Total Taxes ($ millions)
Sales and excise taxes $ 46.7 $ 13.5 $ 60.2 Property taxes 6.4 - 6.4 Personal income taxes 2.0 5.2 7.2 Corporate profits taxes 0.4 1.7 2.1 Social insurance taxes 0.1 4.4 4.5 Other taxes 1.4 0.6 2.0 Fees, fines and permits 0.5 0.2 0.6
TOTAL TAX REVENUES $ 57.5 $ 25.6 $ 83.1
Source: Estimates by LAEDC

Its Economic Contribution and Workforce California’s Oil and Gas Industry in 2013
LAEDC Institute for Applied Economics 43
Orange County
Exhibit 5-38 Direct Activity of Oil and Gas Industry Orange County 2013
Employment Labor Income ($ millions)
211 Oil and gas extraction 2,371 $ 240.1 213111 Drilling oil and gas wells 392 34.6 213112 Support activities for oil and gas operations 283 24.5
2212 Natural gas distribution 875 176.0 23712 Oil and gas pipeline construction 2,190 187.7 32411 Petroleum refineries 266 99.0
324191 Petroleum lubricating oil and grease mfg 24 2.5 32511 Petrochemical manufacturing - -
333132 Oil and gas field machinery and eqmt mfg 1,099 83.3 4247 Petroleum and petroleum prods wholesalers 379 35.0
447 Gasoline stations 4,958 333.6 45431 Fuel dealers 407 10.4
486 Pipeline transportation 298 413.9
TOTAL DIRECT ACTIVITY 13,543 $ 1,640.7
Exhibit 5-39 Total Economic and Fiscal Contribution of Oil and Gas Industry Orange County 2013
ECONOMIC CONTRIBUTION Employment Labor Income
($ millions) Value Added
($ millions) Output
($ millions) Direct 13,543 $ 1,640.7 $ 2,523.4 $ 6,186.6 Indirect 4,867 305.3 464.5 759.1 Induced 9,776 485.9 816.0 1,304.5
TOTAL CONTRIBUTION 28,186 $ 2,431.9 $ 3,803.9 $ 8,250.3
Percent of Total CA Contribution 7.5% 7.4% 6.0% 4.3% Percent of County Total 1.4% 2.0% 1.9% 2.5%
FISCAL CONTRIBUTION
State and Local ($ millions)
Federal ($ millions)
Total Taxes ($ millions)
Sales and excise taxes $ 1,075.9 $ 295.8 $ 1,371.6 Property taxes 170.3 - 170.3 Personal income taxes 78.4 208.3 286.7 Corporate profits taxes 16.3 64.7 81.1 Social insurance taxes 3.3 200.9 204.2 Other taxes 38.5 15.5 54.0 Fees, fines and permits 17.1 3.9 21.0
TOTAL TAX REVENUES $ 1,399.8 $ 789.1 $ 2,189.0
Source: Estimates by LAEDC

California’s Oil and Gas Industry in 2013 Its Economic Contribution and Workforce
44 LAEDC Institute for Applied Economics
Placer County
Exhibit 5-40 Direct Activity of Oil and Gas Industry Placer County 2013
Employment Labor Income ($ millions)
211 Oil and gas extraction 182 $ 10.1 213111 Drilling oil and gas wells 22 1.2 213112 Support activities for oil and gas operations 39 2.0
2212 Natural gas distribution 30 4.4 23712 Oil and gas pipeline construction - - 32411 Petroleum refineries 10 1.5
324191 Petroleum lubricating oil and grease mfg - - 32511 Petrochemical manufacturing - -
333132 Oil and gas field machinery and eqmt mfg - - 4247 Petroleum and petroleum prods wholesalers 114 8.9
447 Gasoline stations 696 85.2 45431 Fuel dealers 59 1.7
486 Pipeline transportation 37 4.7
TOTAL DIRECT ACTIVITY 1,187 $ 119.7
Exhibit 5-41 Total Economic and Fiscal Contribution of Oil and Gas Industry Placer County 2013
ECONOMIC CONTRIBUTION Employment Labor Income
($ millions) Value Added
($ millions) Output
($ millions) Direct 1,187 $ 119.7 $ 178.9 $ 326.9 Indirect 269 14.1 24.7 40.9 Induced 689 30.7 54.7 89.1
TOTAL CONTRIBUTION 2,146 $ 164.5 $ 258.3 $ 456.9
Percent of Total CA Contribution 0.6% 0.5% 0.4% 0.2% Percent of County Total 1.1% 1.6% 1.5% 1.6%
FISCAL CONTRIBUTION
State and Local ($ millions)
Federal ($ millions)
Total Taxes ($ millions)
Sales and excise taxes $ 139.7 $ 40.6 $ 180.3 Property taxes 13.9 - 13.9 Personal income taxes 5.4 14.3 19.7 Corporate profits taxes 1.0 4.1 5.1 Social insurance taxes 0.2 13.1 17.4 Other taxes 3.1 1.0 4.1 Fees, fines and permits 1.2 0.3 1.5
TOTAL TAX REVENUES $ 164.6 $ 73.3 $ 237.9
Source: Estimates by LAEDC

Its Economic Contribution and Workforce California’s Oil and Gas Industry in 2013
LAEDC Institute for Applied Economics 45
Riverside County
Exhibit 5-42 Direct Activity of Oil and Gas Industry Riverside County 2013
Employment Labor Income ($ millions)
211 Oil and gas extraction 148 $ 16.4 213111 Drilling oil and gas wells 54 3.9 213112 Support activities for oil and gas operations 71 3.1
2212 Natural gas distribution 1,359 144.4 23712 Oil and gas pipeline construction 24 1.4 32411 Petroleum refineries - -
324191 Petroleum lubricating oil and grease mfg 182 19.4 32511 Petrochemical manufacturing 3 0.2
333132 Oil and gas field machinery and eqmt mfg 5 0.5 4247 Petroleum and petroleum prods wholesalers 281 16.7
447 Gasoline stations 3,314 187.4 45431 Fuel dealers 95 1.4
486 Pipeline transportation 25 154.2
TOTAL DIRECT ACTIVITY 5,562 $ 549.2
Exhibit 5-43 Total Economic and Fiscal Contribution of Oil and Gas Industry Riverside County 2013
ECONOMIC CONTRIBUTION Employment Labor Income
($ millions) Value Added
($ millions) Output
($ millions) Direct 5,562 $ 549.2 $ 998.4 $ 1,611.7 Indirect 1,395 50.7 99.1 172.7 Induced 3,148 109.1 212.9 359.4
TOTAL CONTRIBUTION 10,105 $ 709.1 $ 1,310.4 $ 2,143.8
Percent of Total CA Contribution 2.7% 2.2% 2.1% 1.1% Percent of County Total 1.1% 1.8% 1.9% 1.8%
FISCAL CONTRIBUTION
State and Local ($ millions)
Federal ($ millions)
Total Taxes ($ millions)
Sales and excise taxes $ 704.3 $ 201.4 $ 905.6 Property taxes 85.0 - 85.0 Personal income taxes 21.1 55.5 76.6 Corporate profits taxes 6.7 26.5 33.2 Social insurance taxes 2.1 60.1 62.2 Other taxes 18.4 6.8 25.3 Fees, fines and permits 5.3 1.7 7.0
TOTAL TAX REVENUES $ 842.8 $ 352.2 $ 1,195.0
Source: Estimates by LAEDC

California’s Oil and Gas Industry in 2013 Its Economic Contribution and Workforce
46 LAEDC Institute for Applied Economics
Sacramento County
Exhibit 5-44 Direct Activity of Oil and Gas Industry Sacramento County 2013
Employment Labor Income ($ millions)
211 Oil and gas extraction 334 $ 18.3 213111 Drilling oil and gas wells 114 4.4 213112 Support activities for oil and gas operations 25 1.2
2212 Natural gas distribution 213 36.6 23712 Oil and gas pipeline construction 32 2.2 32411 Petroleum refineries 6 2.3
324191 Petroleum lubricating oil and grease mfg - - 32511 Petrochemical manufacturing - -
333132 Oil and gas field machinery and eqmt mfg - - 4247 Petroleum and petroleum prods wholesalers 364 26.2
447 Gasoline stations 2,098 149.1 45431 Fuel dealers 57 27.4
486 Pipeline transportation 460 221.0
TOTAL DIRECT ACTIVITY 3,704 $ 488.6
Exhibit 5-45 Total Economic and Fiscal Contribution of Oil and Gas Industry Sacramento County 2013
ECONOMIC CONTRIBUTION Employment Labor Income
($ millions) Value Added
($ millions) Output
($ millions) Direct 3,704 $ 488.6 $ 672.6 $ 966.3 Indirect 1,001 52.8 86.1 143.4 Induced 2,550 114.4 201.5 332.0
TOTAL CONTRIBUTION 7,255 $ 655.8 $ 960.2 $ 1,441.7
Percent of Total CA Contribution 1.9% 2.0% 1.5% 0.8% Percent of County Total 0.9% 1.3% 1.3% 1.3%
FISCAL CONTRIBUTION
State and Local ($ millions)
Federal ($ millions)
Total Taxes ($ millions)
Sales and excise taxes $ 424.5 $ 117.8 $ 542.4 Property taxes 49.6 - 49.6 Personal income taxes 19.0 50.0 69.0 Corporate profits taxes 3.1 12.3 15.4 Social insurance taxes 2.9 46.6 49.5 Other taxes 11.0 3.6 14.6 Fees, fines and permits 4.3 0.9 5.2
TOTAL TAX REVENUES $ 514.4 $ 231.2 $ 745.6
Source: Estimates by LAEDC

Its Economic Contribution and Workforce California’s Oil and Gas Industry in 2013
LAEDC Institute for Applied Economics 47
San Bernardino County
Exhibit 5-46 Direct Activity of Oil and Gas Industry San Bernardino County 2013
Employment Labor Income ($ millions)
211 Oil and gas extraction 300 $ 2.8 213111 Drilling oil and gas wells 50 1.3 213112 Support activities for oil and gas operations 59 3.8
2212 Natural gas distribution 3,224 384.7 23712 Oil and gas pipeline construction 531 33.9 32411 Petroleum refineries 33 3.5
324191 Petroleum lubricating oil and grease mfg - - 32511 Petrochemical manufacturing - -
333132 Oil and gas field machinery and eqmt mfg 6 0.5 4247 Petroleum and petroleum prods wholesalers 310 19.1
447 Gasoline stations 4,023 180.5 45431 Fuel dealers 132 2.5
486 Pipeline transportation 218 220.5
TOTAL DIRECT ACTIVITY 8,886 $ 853.2
Exhibit 5-47 Total Economic and Fiscal Contribution of Oil and Gas Industry San Bernardino County 2013
ECONOMIC CONTRIBUTION Employment Labor Income
($ millions) Value Added
($ millions) Output
($ millions) Direct 8,886 $ 853.2 $ 1,856.2 $ 2,968.2 Indirect 1,954 76.0 137.3 229.4 Induced 4,621 170.1 316.0 519.7
TOTAL CONTRIBUTION 15,461 $ 1,099.3 $ 2,309.5 $ 3,717.4
Percent of Total CA Contribution 4.1% 3.3% 3.6% 1.9% Percent of County Total 1.7% 2.6% 3.3% 3.0%
FISCAL CONTRIBUTION
State and Local ($ millions)
Federal ($ millions)
Total Taxes ($ millions)
Sales and excise taxes $ 818.7 $ 235.4 $ 1,054.2 Property taxes 167.8 - 167.8 Personal income taxes 34.3 90.1 124.4 Corporate profits taxes 13.5 53.4 66.8 Social insurance taxes 3.5 104.5 107.9 Other taxes 36.1 16.0 52.1 Fees, fines and permits 9.2 4.1 13.2
TOTAL TAX REVENUES $ 1,083.1 $ 503.4 $ 1,586.5
Source: Estimates by LAEDC

California’s Oil and Gas Industry in 2013 Its Economic Contribution and Workforce
48 LAEDC Institute for Applied Economics
San Diego County
Exhibit 5-48 Direct Activity of Oil and Gas Industry San Diego County 2013
Employment Labor Income ($ millions)
211 Oil and gas extraction 1,695 $ 54.4 213111 Drilling oil and gas wells 229 7.1 213112 Support activities for oil and gas operations 190 7.5
2212 Natural gas distribution 6,335 1,055.4 23712 Oil and gas pipeline construction 29 2.1 32411 Petroleum refineries 12 3.5
324191 Petroleum lubricating oil and grease mfg 35 2.9 32511 Petrochemical manufacturing 3 0.3
333132 Oil and gas field machinery and eqmt mfg 18 1.6 4247 Petroleum and petroleum prods wholesalers 620 50.8
447 Gasoline stations 5,189 289.6 45431 Fuel dealers 174 4.2
486 Pipeline transportation 131 13.6
TOTAL DIRECT ACTIVITY 14,660 $ 1,493.0
Exhibit 5-49 Total Economic and Fiscal Contribution of Oil and Gas Industry San Diego County 2013
ECONOMIC CONTRIBUTION Employment Labor Income
($ millions) Value Added
($ millions) Output
($ millions) Direct 14,660 $ 1,493.0 $ 3,477.5 $ 5,224.6 Indirect 3,777 208.9 337.4 551.8 Induced 8,369 377.4 656.8 1,074.9
TOTAL CONTRIBUTION 26,806 $ 2,079.3 $ 4,471.7 $ 6,851.3
Percent of Total CA Contribution 7.1% 6.3% 7.0% 3.6% Percent of County Total 1.4% 1.7% 2.3% 2.2%
FISCAL CONTRIBUTION
State and Local ($ millions)
Federal ($ millions)
Total Taxes ($ millions)
Sales and excise taxes $ 1,242.1 $ 312.3 $ 1,554.3 Property taxes 344.1 - 344.1 Personal income taxes 61.3 162.2 223.4 Corporate profits taxes 26.5 104.8 131.3 Social insurance taxes 5.3 210.4 215.7 Other taxes 73.7 26.1 99.8 Fees, fines and permits 17.1 6.6 23.7
TOTAL TAX REVENUES $ 1,769.9 $ 822.4 $ 2,592.3
Source: Estimates by LAEDC

Its Economic Contribution and Workforce California’s Oil and Gas Industry in 2013
LAEDC Institute for Applied Economics 49
San Francisco County
Exhibit 5-50 Direct Activity of Oil and Gas Industry San Francisco County 2013
Employment Labor Income ($ millions)
211 Oil and gas extraction 510 $ 50.0 213111 Drilling oil and gas wells 62 6.1 213112 Support activities for oil and gas operations 48 3.0
2212 Natural gas distribution 4,086 908.6 23712 Oil and gas pipeline construction 11 1.1 32411 Petroleum refineries 45 17.5
324191 Petroleum lubricating oil and grease mfg - - 32511 Petrochemical manufacturing - -
333132 Oil and gas field machinery and eqmt mfg - - 4247 Petroleum and petroleum prods wholesalers 53 5.7
447 Gasoline stations 924 92.2 45431 Fuel dealers - -
486 Pipeline transportation 36 6.1
TOTAL DIRECT ACTIVITY 5,776 $ 1,090.4
Exhibit 5-51 Total Economic and Fiscal Contribution of Oil and Gas Industry San Francisco County 2013
ECONOMIC CONTRIBUTION Employment Labor Income
($ millions) Value Added
($ millions) Output
($ millions) Direct 5,776 $ 1,090.4 $ 2,265.8 $ 3,477.1 Indirect 1,407 143.8 194.1 278.6 Induced 2,742 184.5 290.2 428.1
TOTAL CONTRIBUTION 9,926 $ 1,418.8 $ 2,750.1 $ 4,183.7
Percent of Total CA Contribution 2.6% 4.3% 4.3% 2.2% Percent of County Total 1.2% 1.8% 2.6% 2.7%
FISCAL CONTRIBUTION
State and Local ($ millions)
Federal ($ millions)
Total Taxes ($ millions)
Sales and excise taxes $ 320.9 $ 58.4 $ 379.3 Property taxes 187.0 - 187.0 Personal income taxes 32.1 85.7 117.7 Corporate profits taxes 15.1 59.6 74.7 Social insurance taxes 3.9 130.7 134.6 Other taxes 40.1 12.5 52.5 Fees, fines and permits 9.0 3.2 12.2
TOTAL TAX REVENUES $ 608.0 $ 350.0 $ 958.0
Source: Estimates by LAEDC

California’s Oil and Gas Industry in 2013 Its Economic Contribution and Workforce
50 LAEDC Institute for Applied Economics
San Joaquin County
Exhibit 5-52 Direct Activity of Oil and Gas Industry San Joaquin County 2013
Employment Labor Income ($ millions)
211 Oil and gas extraction 166 $ 6.3 213111 Drilling oil and gas wells 27 0.9 213112 Support activities for oil and gas operations 16 0.4
2212 Natural gas distribution 356 42.5 23712 Oil and gas pipeline construction 17 1.1 32411 Petroleum refineries 9 1.0
324191 Petroleum lubricating oil and grease mfg 2 0.1 32511 Petrochemical manufacturing - -
333132 Oil and gas field machinery and eqmt mfg - - 4247 Petroleum and petroleum prods wholesalers 232 15.3
447 Gasoline stations 1,304 84.9 45431 Fuel dealers 115 1.9
486 Pipeline transportation 60 6.7
TOTAL DIRECT ACTIVITY 2,304 $ 161.2
Exhibit 5-53 Total Economic and Fiscal Contribution of Oil and Gas Industry San Joaquin County 2013
ECONOMIC CONTRIBUTION Employment Labor Income
($ millions) Value Added
($ millions) Output
($ millions) Direct 2,304 $ 161.2 $ 325.6 $ 555.4 Indirect 493 19.3 38.1 62.5 Induced 834 31.8 61.0 98.7
TOTAL CONTRIBUTION 3,630 $ 212.4 $ 424.7 $ 716.6
Percent of Total CA Contribution 1.0% 0.6% 0.7% 0.4% Percent of County Total 1.3% 1.5% 1.8% 1.7%
FISCAL CONTRIBUTION
State and Local ($ millions)
Federal ($ millions)
Total Taxes ($ millions)
Sales and excise taxes $ 259.7 $ 80.9 $ 340.6 Property taxes 30.7 - 30.7 Personal income taxes 6.5 17.1 23.6 Corporate profits taxes 2.3 9.1 11.4 Social insurance taxes 0.7 20.0 20.7 Other taxes 6.6 3.0 9.6 Fees, fines and permits 1.7 0.8 2.5
TOTAL TAX REVENUES $ 308.3 $ 130.9 $ 439.2
Source: Estimates by LAEDC

Its Economic Contribution and Workforce California’s Oil and Gas Industry in 2013
LAEDC Institute for Applied Economics 51
San Luis Obispo County
Exhibit 5-54 Direct Activity of Oil and Gas Industry San Luis Obispo County 2013
Employment Labor Income ($ millions)
211 Oil and gas extraction 227 $ 9.8 213111 Drilling oil and gas wells 53 2.5 213112 Support activities for oil and gas operations 35 2.3
2212 Natural gas distribution 260 30.9 23712 Oil and gas pipeline construction 354 21.8 32411 Petroleum refineries 114 48.3
324191 Petroleum lubricating oil and grease mfg - - 32511 Petrochemical manufacturing - -
333132 Oil and gas field machinery and eqmt mfg 126 11.6 4247 Petroleum and petroleum prods wholesalers 86 4.9
447 Gasoline stations 564 44.0 45431 Fuel dealers 65 1.0
486 Pipeline transportation 23 1.7
TOTAL DIRECT ACTIVITY 1,906 $ 178.7
Exhibit 5-55 Total Economic and Fiscal Contribution of Oil and Gas Industry San Luis Obispo County 2013
ECONOMIC CONTRIBUTION Employment Labor Income
($ millions) Value Added
($ millions) Output
($ millions) Direct 1,906 $ 178.7 $ 390.2 $ 1,556.0 Indirect 806 35.3 58.0 105.9 Induced 992 36.3 69.9 113.4
TOTAL CONTRIBUTION 3,704 $ 250.2 $ 518.1 $ 1,775.3
Percent of Total CA Contribution 1.0% 0.8% 0.8% 0.9% Percent of County Total 2.3% 3.3% 3.8% 7.6%
FISCAL CONTRIBUTION
State and Local ($ millions)
Federal ($ millions)
Total Taxes ($ millions)
Sales and excise taxes $ 112.0 $ 32.4 $ 144.4 Property taxes 26.4 - 26.4 Personal income taxes 7.0 18.6 25.6 Corporate profits taxes 3.4 13.7 17.1 Social insurance taxes 1.0 23.3 24.3 Other taxes 5.8 3.0 8.7 Fees, fines and permits 1.7 0.8 2.5
TOTAL TAX REVENUES $ 157.4 $ 91.7 $ 249.0
Source: Estimates by LAEDC

California’s Oil and Gas Industry in 2013 Its Economic Contribution and Workforce
52 LAEDC Institute for Applied Economics
San Mateo County
Exhibit 5-56 Direct Activity of Oil and Gas Industry San Mateo County 2013
Employment Labor Income ($ millions)
211 Oil and gas extraction 437 $ 12.8 213111 Drilling oil and gas wells 53 1.6 213112 Support activities for oil and gas operations 7 0.2
2212 Natural gas distribution 126 19.4 23712 Oil and gas pipeline construction 10 1.0 32411 Petroleum refineries 18 4.6
324191 Petroleum lubricating oil and grease mfg - - 32511 Petrochemical manufacturing - -
333132 Oil and gas field machinery and eqmt mfg - - 4247 Petroleum and petroleum prods wholesalers 28 3.2
447 Gasoline stations 1,288 97.0 45431 Fuel dealers 12 0.5
486 Pipeline transportation 9 1.1
TOTAL DIRECT ACTIVITY 1,990 $ 141.2
Exhibit 5-57 Total Economic and Fiscal Contribution of Oil and Gas Industry San Mateo County 2013
ECONOMIC CONTRIBUTION Employment Labor Income
($ millions) Value Added
($ millions) Output
($ millions) Direct 1,990 $ 141.2 $ 237.5 $ 513.4 Indirect 266 20.3 32.3 48.8 Induced 425 23.1 39.1 59.8
TOTAL CONTRIBUTION 2,681 $ 184.7 $ 308.8 $ 622.0
Percent of Total CA Contribution 0.7% 0.6% 0.5% 0.3% Percent of County Total 0.5% 0.4% 0.4% 0.5%
FISCAL CONTRIBUTION
State and Local ($ millions)
Federal ($ millions)
Total Taxes ($ millions)
Sales and excise taxes $ 235.8 $ 62.1 $ 297.8 Property taxes 23.3 - 23.3 Personal income taxes 5.5 14.8 20.3 Corporate profits taxes 1.1 4.5 5.6 Social insurance taxes 0.1 13.2 13.3 Other taxes 5.1 1.6 6.6 Fees, fines and permits 1.4 0.4 1.8
TOTAL TAX REVENUES $ 272.3 $ 96.4 $ 368.7
Source: Estimates by LAEDC

Its Economic Contribution and Workforce California’s Oil and Gas Industry in 2013
LAEDC Institute for Applied Economics 53
Santa Barbara County
Exhibit 5-58 Direct Activity of Oil and Gas Industry Santa Barbara County 2013
Employment Labor Income ($ millions)
211 Oil and gas extraction 641 $ 170.7 213111 Drilling oil and gas wells 355 50.6 213112 Support activities for oil and gas operations 431 42.8
2212 Natural gas distribution 283 31.6 23712 Oil and gas pipeline construction 4 0.3 32411 Petroleum refineries 56 7.6
324191 Petroleum lubricating oil and grease mfg - - 32511 Petrochemical manufacturing - -
333132 Oil and gas field machinery and eqmt mfg 43 2.4 4247 Petroleum and petroleum prods wholesalers 26 2.0
447 Gasoline stations 868 86.5 45431 Fuel dealers 38 0.6
486 Pipeline transportation 12 1.1
TOTAL DIRECT ACTIVITY 2,756 $ 396.2
Exhibit 5-59 Total Economic and Fiscal Contribution of Oil and Gas Industry Santa Barbara County 2013
ECONOMIC CONTRIBUTION Employment Labor Income
($ millions) Value Added
($ millions) Output
($ millions) Direct 2,756 $ 396.2 $ 627.5 $ 1,333.9 Indirect 582 31.2 49.3 85.4 Induced 1,797 79.2 136.5 220.2
TOTAL CONTRIBUTION 5,135 $ 506.6 $ 813.3 $ 1,639.4
Percent of Total CA Contribution 1.4% 1.5% 1.3% 0.9% Percent of County Total 1.9% 3.4% 3.5% 4.2%
FISCAL CONTRIBUTION
State and Local ($ millions)
Federal ($ millions)
Total Taxes ($ millions)
Sales and excise taxes $ 158.3 $ 39.7 $ 198.0 Property taxes 41.2 - 41.2 Personal income taxes 14.7 38.9 53.6 Corporate profits taxes 3.1 12.3 15.4 Social insurance taxes 1.1 43.9 45.0 Other taxes 9.1 2.8 11.9 Fees, fines and permits 3.4 0.7 4.1
TOTAL TAX REVENUES $ 230.9 $ 138.3 $ 369.2
Source: Estimates by LAEDC
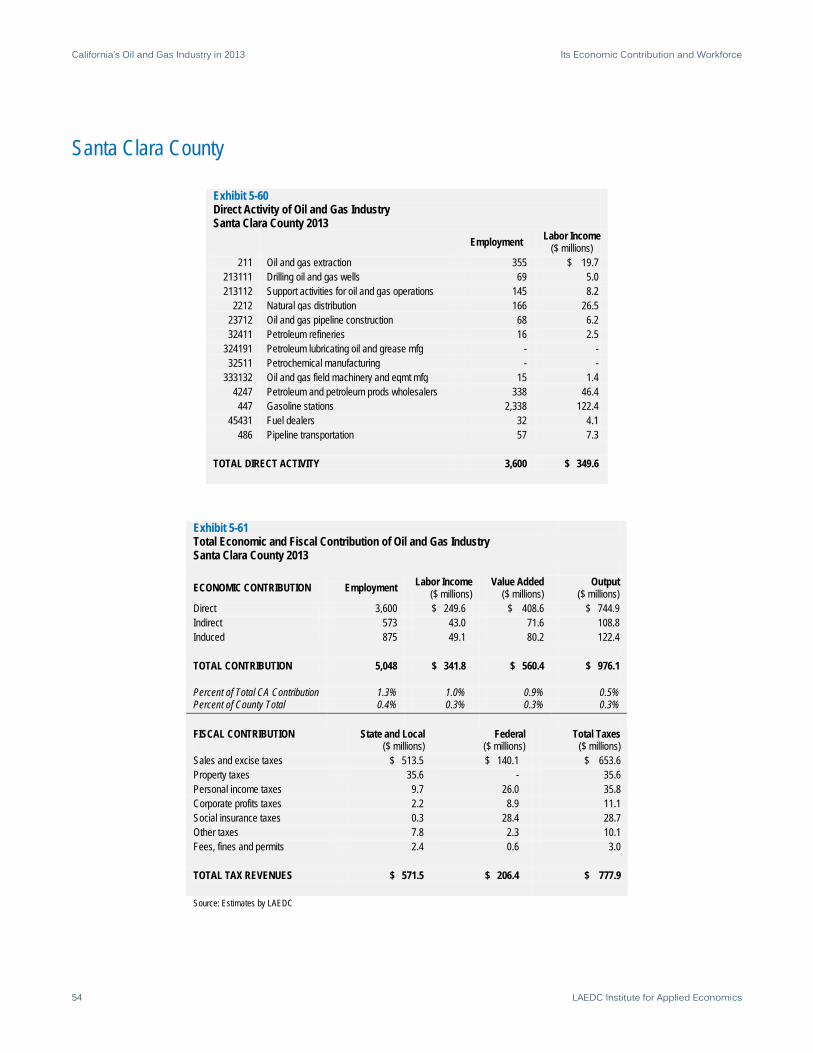
California’s Oil and Gas Industry in 2013 Its Economic Contribution and Workforce
54 LAEDC Institute for Applied Economics
Santa Clara County
Exhibit 5-60 Direct Activity of Oil and Gas Industry Santa Clara County 2013
Employment Labor Income ($ millions)
211 Oil and gas extraction 355 $ 19.7 213111 Drilling oil and gas wells 69 5.0 213112 Support activities for oil and gas operations 145 8.2
2212 Natural gas distribution 166 26.5 23712 Oil and gas pipeline construction 68 6.2 32411 Petroleum refineries 16 2.5
324191 Petroleum lubricating oil and grease mfg - - 32511 Petrochemical manufacturing - -
333132 Oil and gas field machinery and eqmt mfg 15 1.4 4247 Petroleum and petroleum prods wholesalers 338 46.4
447 Gasoline stations 2,338 122.4 45431 Fuel dealers 32 4.1
486 Pipeline transportation 57 7.3
TOTAL DIRECT ACTIVITY 3,600 $ 349.6
Exhibit 5-61 Total Economic and Fiscal Contribution of Oil and Gas Industry Santa Clara County 2013
ECONOMIC CONTRIBUTION Employment Labor Income
($ millions) Value Added
($ millions) Output
($ millions) Direct 3,600 $ 249.6 $ 408.6 $ 744.9 Indirect 573 43.0 71.6 108.8 Induced 875 49.1 80.2 122.4
TOTAL CONTRIBUTION 5,048 $ 341.8 $ 560.4 $ 976.1
Percent of Total CA Contribution 1.3% 1.0% 0.9% 0.5% Percent of County Total 0.4% 0.3% 0.3% 0.3%
FISCAL CONTRIBUTION
State and Local ($ millions)
Federal ($ millions)
Total Taxes ($ millions)
Sales and excise taxes $ 513.5 $ 140.1 $ 653.6 Property taxes 35.6 - 35.6 Personal income taxes 9.7 26.0 35.8 Corporate profits taxes 2.2 8.9 11.1 Social insurance taxes 0.3 28.4 28.7 Other taxes 7.8 2.3 10.1 Fees, fines and permits 2.4 0.6 3.0
TOTAL TAX REVENUES $ 571.5 $ 206.4 $ 777.9
Source: Estimates by LAEDC

Its Economic Contribution and Workforce California’s Oil and Gas Industry in 2013
LAEDC Institute for Applied Economics 55
Shasta County
Exhibit 5-62 Direct Activity of Oil and Gas Industry Shasta County 2013
Employment Labor Income ($ millions)
211 Oil and gas extraction 114 $ 4.7 213111 Drilling oil and gas wells 14 0.6 213112 Support activities for oil and gas operations 2 0.1
2212 Natural gas distribution 239 49.8 23712 Oil and gas pipeline construction - - 32411 Petroleum refineries - -
324191 Petroleum lubricating oil and grease mfg - - 32511 Petrochemical manufacturing - -
333132 Oil and gas field machinery and eqmt mfg - - 4247 Petroleum and petroleum prods wholesalers 77 4.0
447 Gasoline stations 512 41.4 45431 Fuel dealers 29 0.6
486 Pipeline transportation 1 0.3
TOTAL DIRECT ACTIVITY 989 $ 101.5
Exhibit 5-63 Total Economic and Fiscal Contribution of Oil and Gas Industry Shasta County 2013
ECONOMIC CONTRIBUTION Employment Labor Income
($ millions) Value Added
($ millions) Output
($ millions) Direct 989 $ 101.5 $ 186.0 $ 265.0 Indirect 235 7.8 16.1 28.4 Induced 632 23.0 42.9 71.9
TOTAL CONTRIBUTION 1,856 $ 132.4 $ 245.0 $ 365.3
Percent of Total CA Contribution 0.5% 0.4% 0.4% 0.2% Percent of County Total 2.1% 3.5% 4.0% 3.5%
FISCAL CONTRIBUTION
State and Local ($ millions)
Federal ($ millions)
Total Taxes ($ millions)
Sales and excise taxes $ 82.4 $ 23.9 $ 106.3 Property taxes 17.0 - 17.0 Personal income taxes 4.0 10.4 14.4 Corporate profits taxes 1.1 4.5 5.7 Social insurance taxes 0.5 13.1 13.5 Other taxes 3.7 1.5 5.1 Fees, fines and permits 1.0 0.4 1.4
TOTAL TAX REVENUES $ 109.6 $ 53.7 $ 163.4
Source: Estimates by LAEDC

California’s Oil and Gas Industry in 2013 Its Economic Contribution and Workforce
56 LAEDC Institute for Applied Economics
Solano County
Exhibit 5-64 Direct Activity of Oil and Gas Industry Solano County 2013
Employment Labor Income ($ millions)
211 Oil and gas extraction 113 $ 9.3 213111 Drilling oil and gas wells 209 14.1 213112 Support activities for oil and gas operations 18 1.1
2212 Natural gas distribution 567 101.0 23712 Oil and gas pipeline construction 393 35.0 32411 Petroleum refineries 512 132.5
324191 Petroleum lubricating oil and grease mfg - - 32511 Petrochemical manufacturing - -
333132 Oil and gas field machinery and eqmt mfg - - 4247 Petroleum and petroleum prods wholesalers 94 6.9
447 Gasoline stations 884 43.4 45431 Fuel dealers 12 0.2
486 Pipeline transportation 40 3.6
TOTAL DIRECT ACTIVITY 2,842 $ 347.2
Exhibit 5-65 Total Economic and Fiscal Contribution of Oil and Gas Industry Solano County 2013
ECONOMIC CONTRIBUTION Employment Labor Income
($ millions) Value Added
($ millions) Output
($ millions) Direct 2,842 $ 347.2 $ 958.8 $ 5,525.2 Indirect 1,255 66.9 98.7 180.6 Induced 1,615 62.3 122.2 192.9
TOTAL CONTRIBUTION 5,711 $ 476.4 $ 1,179.7 $ 5,898.7
Percent of Total CA Contribution 1.5% 1.4% 1.9% 3.1% Percent of County Total 3.3% 4.6% 6.2% 16.6%
FISCAL CONTRIBUTION
State and Local ($ millions)
Federal ($ millions)
Total Taxes ($ millions)
Sales and excise taxes $ 199.3 $ 51.9 $ 251.2 Property taxes 52.2 - 52.2 Personal income taxes 14.8 39.0 53.8 Corporate profits taxes 10.1 40.2 50.3 Social insurance taxes 1.7 50.4 52.0 Other taxes 11.4 4.0 15.4 Fees, fines and permits 3.6 1.0 4.6
TOTAL TAX REVENUES $ 293.1 $ 186.5 $ 479.6
Source: Estimates by LAEDC

Its Economic Contribution and Workforce California’s Oil and Gas Industry in 2013
LAEDC Institute for Applied Economics 57
Sonoma County
Exhibit 5-66 Direct Activity of Oil and Gas Industry Sonoma County 2013
Employment Labor Income ($ millions)
211 Oil and gas extraction 353 $ 11.8 213111 Drilling oil and gas wells 43 1.4 213112 Support activities for oil and gas operations 6 0.2
2212 Natural gas distribution 64 8.3 23712 Oil and gas pipeline construction 54 3.6 32411 Petroleum refineries - -
324191 Petroleum lubricating oil and grease mfg - - 32511 Petrochemical manufacturing - -
333132 Oil and gas field machinery and eqmt mfg - - 4247 Petroleum and petroleum prods wholesalers 113 8.2
447 Gasoline stations 859 50.9 45431 Fuel dealers 83 2.1
486 Pipeline transportation 0 0.0
TOTAL DIRECT ACTIVITY 1,576 $ 86.6
Exhibit 5-67 Total Economic and Fiscal Contribution of Oil and Gas Industry Sonoma County 2013
ECONOMIC CONTRIBUTION Employment Labor Income
($ millions) Value Added
($ millions) Output
($ millions) Direct 1,576 $ 86.6 $ 166.2 $ 266.4 Indirect 310 14.2 26.6 43.7 Induced 515 20.8 38.0 62.4
TOTAL CONTRIBUTION 2,401 $ 121.6 $ 230.8 $ 372.6
Percent of Total CA Contribution 0.6% 0.4% 0.4% 0.2% Percent of County Total 0.9% 0.9% 1.0% 0.9%
FISCAL CONTRIBUTION
State and Local ($ millions)
Federal ($ millions)
Total Taxes ($ millions)
Sales and excise taxes $ 148.5 $ 41.4 $ 189.8 Property taxes 18.1 - 18.1 Personal income taxes 3.8 9.9 13.7 Corporate profits taxes 1.0 3.9 4.9 Social insurance taxes 0.3 10.9 11.2 Other taxes 3.9 1.5 5.4 Fees, fines and permits 1.0 0.4 1.4
TOTAL TAX REVENUES $ 176.5 $ 68.0 $ 244.4
Source: Estimates by LAEDC

California’s Oil and Gas Industry in 2013 Its Economic Contribution and Workforce
58 LAEDC Institute for Applied Economics
Stanislaus County
Exhibit 5-68 Direct Activity of Oil and Gas Industry Stanislaus County 2013
Employment Labor Income ($ millions)
211 Oil and gas extraction 104 $ 0.8 213111 Drilling oil and gas wells 16 0.1 213112 Support activities for oil and gas operations 2 0.0
2212 Natural gas distribution 125 12.9 23712 Oil and gas pipeline construction 4 0.2 32411 Petroleum refineries 13 3.5
324191 Petroleum lubricating oil and grease mfg - - 32511 Petrochemical manufacturing - -
333132 Oil and gas field machinery and eqmt mfg - - 4247 Petroleum and petroleum prods wholesalers 288 18.3
447 Gasoline stations 823 43.9 45431 Fuel dealers 57 0.7
486 Pipeline transportation 1 0.1
TOTAL DIRECT ACTIVITY 1,432 $ 80.8
Exhibit 5-69 Total Economic and Fiscal Contribution of Oil and Gas Industry Stanislaus County 2013
ECONOMIC CONTRIBUTION Employment Labor Income
($ millions) Value Added
($ millions) Output
($ millions) Direct 1,432 $ 80.8 $ 172.9 $ 367.5 Indirect 345 13.6 26.1 42.8 Induced 455 18.1 33.2 53.1
TOTAL CONTRIBUTION 2,233 $ 112.4 $ 232.2 $ 463.4
Percent of Total CA Contribution 0.6% 0.3% 0.4% 0.2% Percent of County Total 1.0% 1.0% 1.3% 1.3%
FISCAL CONTRIBUTION
State and Local ($ millions)
Federal ($ millions)
Total Taxes ($ millions)
Sales and excise taxes $ 157.7 $ 46.9 $ 204.7 Property taxes 17.3 - 17.3 Personal income taxes 3.6 9.5 13.2 Corporate profits taxes 1.3 5.2 6.5 Social insurance taxes 0.3 10.7 11.0 Other taxes 3.7 1.5 5.2 Fees, fines and permits 1.0 0.4 1.3
TOTAL TAX REVENUES $ 185.1 $ 74.2 $ 259.2
Source: Estimates by LAEDC

Its Economic Contribution and Workforce California’s Oil and Gas Industry in 2013
LAEDC Institute for Applied Economics 59
Sutter County
Exhibit 5-70 Direct Activity of Oil and Gas Industry Sutter County 2013
Employment Labor Income ($ millions)
211 Oil and gas extraction 73 $ 8.8 213111 Drilling oil and gas wells 20 2.1 213112 Support activities for oil and gas operations 47 3.7
2212 Natural gas distribution - - 23712 Oil and gas pipeline construction 1 0.0 32411 Petroleum refineries - -
324191 Petroleum lubricating oil and grease mfg - - 32511 Petrochemical manufacturing - -
333132 Oil and gas field machinery and eqmt mfg - - 4247 Petroleum and petroleum prods wholesalers 4 0.1
447 Gasoline stations 125 28.0 45431 Fuel dealers 30 0.2
486 Pipeline transportation - -
TOTAL DIRECT ACTIVITY 300 $ 43.0
Exhibit 5-71 Total Economic and Fiscal Contribution of Oil and Gas Industry Sutter County 2013
ECONOMIC CONTRIBUTION Employment Labor Income
($ millions) Value Added
($ millions) Output
($ millions) Direct 300 $ 43.0 $ 56.2 $ 74.7 Indirect 47 1.5 3.4 6.0 Induced 210 6.8 14.2 23.8
TOTAL CONTRIBUTION 557 $ 51.3 $ 73.8 $ 104.6
Percent of Total CA Contribution 0.1% 0.2% 0.1% 0.1% Percent of County Total 1.2% 2.7% 2.2% 1.7%
FISCAL CONTRIBUTION
State and Local ($ millions)
Federal ($ millions)
Total Taxes ($ millions)
Sales and excise taxes $ 29.8 $ 9.0 $ 38.8 Property taxes 3.2 - 3.2 Personal income taxes 1.7 4.5 6.2 Corporate profits taxes 0.2 1.0 1.2 Social insurance taxes 0.1 3.9 4.0 Other taxes 0.7 0.4 1.1 Fees, fines and permits 0.4 0.1 0.5
TOTAL TAX REVENUES $ 36.2 $ 18.8 $ 55.0
Source: Estimates by LAEDC

California’s Oil and Gas Industry in 2013 Its Economic Contribution and Workforce
60 LAEDC Institute for Applied Economics
Tehama County
Exhibit 5-72 Direct Activity of Oil and Gas Industry Tehama County 2013
Employment Labor Income ($ millions)
211 Oil and gas extraction 160 $ 0.0 213111 Drilling oil and gas wells - - 213112 Support activities for oil and gas operations - -
2212 Natural gas distribution 14 1.8 23712 Oil and gas pipeline construction 1 0.1 32411 Petroleum refineries - -
324191 Petroleum lubricating oil and grease mfg - - 32511 Petrochemical manufacturing - -
333132 Oil and gas field machinery and eqmt mfg - - 4247 Petroleum and petroleum prods wholesalers 7 0.3
447 Gasoline stations 318 17.7 45431 Fuel dealers 41 0.5
486 Pipeline transportation - -
TOTAL DIRECT ACTIVITY 542 $ 20.4
Exhibit 5-73 Total Economic and Fiscal Contribution of Oil and Gas Industry Tehama County 2013
ECONOMIC CONTRIBUTION Employment Labor Income
($ millions) Value Added
($ millions) Output
($ millions) Direct 542 $ 20.4 $ 40.8 $ 74.0 Indirect 56 2.1 4.7 8.0 Induced 80 2.6 5.6 9.2
TOTAL CONTRIBUTION 678 $ 25.1 $ 51.1 $ 91.0
Percent of Total CA Contribution 0.2% 0.1% 0.1% 0.05% Percent of County Total 2.8% 2.5% 3.0% 2.9%
FISCAL CONTRIBUTION
State and Local ($ millions)
Federal ($ millions)
Total Taxes ($ millions)
Sales and excise taxes $ 37.2 $ 14.0 $ 51.2 Property taxes 5.9 - 5.9 Personal income taxes 0.7 1.9 2.6 Corporate profits taxes 0.2 0.7 0.7 Social insurance taxes 0.1 2.4 2.4 Other taxes 1.2 0.5 1.8 Fees, fines and permits 0.2 0.1 0.4
TOTAL TAX REVENUES $ 45.5 $ 19.6 $ 65.1
Source: Estimates by LAEDC

Its Economic Contribution and Workforce California’s Oil and Gas Industry in 2013
LAEDC Institute for Applied Economics 61
Tulare County
Exhibit 5-74 Direct Activity of Oil and Gas Industry Tulare County 2013
Employment Labor Income ($ millions)
211 Oil and gas extraction 73 $ 3.4 213111 Drilling oil and gas wells 22 0.7 213112 Support activities for oil and gas operations 1 0.1
2212 Natural gas distribution 456 61.8 23712 Oil and gas pipeline construction 17 0.9 32411 Petroleum refineries 5 1.1
324191 Petroleum lubricating oil and grease mfg - - 32511 Petrochemical manufacturing - -
333132 Oil and gas field machinery and eqmt mfg - - 4247 Petroleum and petroleum prods wholesalers 228 15.5
447 Gasoline stations 722 101.1 45431 Fuel dealers 30 0.3
486 Pipeline transportation 3 0.4
TOTAL DIRECT ACTIVITY 1,558 $ 185.2
Exhibit 5-75 Total Economic and Fiscal Contribution of Oil and Gas Industry Tulare County 2013
ECONOMIC CONTRIBUTION Employment Labor Income
($ millions) Value Added
($ millions) Output
($ millions) Direct 1,558 $ 185.2 $ 347.2 $ 524.8 Indirect 347 13.1 25.1 41.9 Induced 757 25.5 53.1 88.0
TOTAL CONTRIBUTION 2,662 $ 223.8 $ 425.4 $ 654.7
Percent of Total CA Contribution 0.7% 0.7% 0.7% 0.3% Percent of County Total 1.4% 2.4% 2.9% 2.4%
FISCAL CONTRIBUTION
State and Local ($ millions)
Federal ($ millions)
Total Taxes ($ millions)
Sales and excise taxes $ 134.8 $ 37.7 $ 172.5 Property taxes 28.7 - 28.7 Personal income taxes 7.2 18.8 25.9 Corporate profits taxes 2.2 8.9 11.1 Social insurance taxes 0.8 18.5 19.3 Other taxes 6.2 2.3 8.5 Fees, fines and permits 1.8 0.6 2.4
TOTAL TAX REVENUES $ 181.8 $ 86.6 $ 268.4
Source: Estimates by LAEDC

California’s Oil and Gas Industry in 2013 Its Economic Contribution and Workforce
62 LAEDC Institute for Applied Economics
Ventura County
Exhibit 5-76 Direct Activity of Oil and Gas Industry Ventura County 2013
Employment Labor Income ($ millions)
211 Oil and gas extraction 1,194 $ 399.8 213111 Drilling oil and gas wells 394 73.4 213112 Support activities for oil and gas operations 344 35.8
2212 Natural gas distribution 877 113.7 23712 Oil and gas pipeline construction 56 3.4 32411 Petroleum refineries - -
324191 Petroleum lubricating oil and grease mfg - - 32511 Petrochemical manufacturing - -
333132 Oil and gas field machinery and eqmt mfg 162 12.7 4247 Petroleum and petroleum prods wholesalers 133 11.5
447 Gasoline stations 1,110 57.6 45431 Fuel dealers 76 1.4
486 Pipeline transportation 5 0.7
TOTAL DIRECT ACTIVITY 4,351 $ 710.0
Exhibit 5-77 Total Economic and Fiscal Contribution of Oil and Gas Industry Ventura County 2013
ECONOMIC CONTRIBUTION Employment Labor Income
($ millions) Value Added
($ millions) Output
($ millions) Direct 4,351 $ 710.0 $ 1,121.3 $ 1,593.8 Indirect 969 48.0 78.2 133.9 Induced 3,594 147.3 270.2 440.5
TOTAL CONTRIBUTION 8,913 $ 905.3 $ 1,469.7 $ 2,168.2
Percent of Total CA Contribution 2.4% 2.7% 2.3% 1.1% Percent of County Total 2.0% 3.8% 3.7% 3.2%
FISCAL CONTRIBUTION
State and Local ($ millions)
Federal ($ millions)
Total Taxes ($ millions)
Sales and excise taxes $ 298.4 $ 77.2 $ 375.6 Property taxes 83.3 - 83.3 Personal income taxes 29.9 79.4 109.3 Corporate profits taxes 6.2 24.4 30.5 Social insurance taxes 1.7 78.9 80.6 Other taxes 18.5 6.2 24.7 Fees, fines and permits 6.8 1.6 8.4
TOTAL TAX REVENUES $ 444.8 $ 267.6 $ 712.4
Source: Estimates by LAEDC

Its Economic Contribution and Workforce California’s Oil and Gas Industry in 2013
LAEDC Institute for Applied Economics 63
Yolo County
Exhibit 5-78 Direct Activity of Oil and Gas Industry Yolo County 2013
Employment Labor Income ($ millions)
211 Oil and gas extraction 115 $ 8.0 213111 Drilling oil and gas wells 28 2.0 213112 Support activities for oil and gas operations 118 7.7
2212 Natural gas distribution 17 2.3 23712 Oil and gas pipeline construction - - 32411 Petroleum refineries - -
324191 Petroleum lubricating oil and grease mfg 3 0.5 32511 Petrochemical manufacturing - -
333132 Oil and gas field machinery and eqmt mfg - - 4247 Petroleum and petroleum prods wholesalers 87 4.2
447 Gasoline stations 348 27.1 45431 Fuel dealers 8 0.1
486 Pipeline transportation 10 1.2
TOTAL DIRECT ACTIVITY 734 $ 53.1
Exhibit 5-79 Total Economic and Fiscal Contribution of Oil and Gas Industry Yolo County 2013
ECONOMIC CONTRIBUTION Employment Labor Income
($ millions) Value Added
($ millions) Output
($ millions) Direct 734 $ 53.1 $ 86.9 $ 133.7 Indirect 116 5.4 10.2 17.2 Induced 175 6.8 13.3 21.5
TOTAL CONTRIBUTION 1,025 $ 65.3 $ 110.4 $ 172.3
Percent of Total CA Contribution 0.3% 0.2% 0.2% 0.1% Percent of County Total 0.8% 0.9% 1.0% 0.9%
FISCAL CONTRIBUTION
State and Local ($ millions)
Federal ($ millions)
Total Taxes ($ millions)
Sales and excise taxes $ 73.0 $ 23.9 $ 96.9 Property taxes 7.3 - 7.3 Personal income taxes 1.7 4.6 6.4 Corporate profits taxes 0.4 1.8 2.2 Social insurance taxes 0.4 4.7 5.0 Other taxes 1.6 0.7 2.3 Fees, fines and permits 0.4 0.2 0.6
TOTAL TAX REVENUES $ 84.8 $ 35.9 $ 120.7
Source: Estimates by LAEDC

California’s Oil and Gas Industry in 2013 Its Economic Contribution and Workforce
64 LAEDC Institute for Applied Economics
Yuba County
Exhibit 5-80 Direct Activity of Oil and Gas Industry Yuba County 2013
Employment Labor Income ($ millions)
211 Oil and gas extraction 193 $ 0.3 213111 Drilling oil and gas wells 24 0.0 213112 Support activities for oil and gas operations 15 0.4
2212 Natural gas distribution 29 2.9 23712 Oil and gas pipeline construction - - 32411 Petroleum refineries - -
324191 Petroleum lubricating oil and grease mfg - - 32511 Petrochemical manufacturing - -
333132 Oil and gas field machinery and eqmt mfg - - 4247 Petroleum and petroleum prods wholesalers 36 1.1
447 Gasoline stations 122 9.4 45431 Fuel dealers 36 0.6
486 Pipeline transportation 0 0.0
TOTAL DIRECT ACTIVITY 455 $ 14.7
Exhibit 5-81 Total Economic and Fiscal Contribution of Oil and Gas Industry Yuba County 2013
ECONOMIC CONTRIBUTION Employment Labor Income
($ millions) Value Added
($ millions) Output
($ millions) Direct 455 $ 14.7 $ 48.7 $ 88.3 Indirect 44 1.9 3.5 6.2 Induced 42 1.5 3.2 5.5
TOTAL CONTRIBUTION 541 $ 18.2 $ 55.4 $ 99.9
Percent of Total CA Contribution 0.1% 0.1% 0.1% 0.1% Percent of County Total 1.8% 1.0% 1.8% 2.2%
FISCAL CONTRIBUTION
State and Local ($ millions)
Federal ($ millions)
Total Taxes ($ millions)
Sales and excise taxes $ 25.8 $ 6.7 $ 32.4 Property taxes 7.1 - 7.1 Personal income taxes 0.5 1.3 1.8 Corporate profits taxes 0.3 1.3 1.6 Social insurance taxes 0.1 1.2 1.3 Other taxes 1.5 0.5 2.0 Fees, fines and permits 0.2 0.1 0.3
TOTAL TAX REVENUES $ 35.5 $ 11.1 $ 46.6
Source: Estimates by LAEDC

Its Economic Contribution and Workforce California’s Oil and Gas Industry in 2013
LAEDC Institute for Applied Economics A-1
Appendix Oil and Gas Industries NAICS 211111: Crude petroleum and natural gas extraction Establishments in this U.S. industry are primarily engaged in (1) the exploration, development and/or production of petroleum or natural gas from wells in which the hydrocarbons will initially flow or can be produced using normal pumping techniques or (2) the production of crude petroleum from surface shales or tar sands or from reservoirs in which the hydrocarbons are semisolids. Establishments in this industry operate oil and gas wells on their own account or for others on a contract or fee basis. NAICS 211112: Natural gas liquid extraction Establishments in this U.S. industry are primarily engaged in the recovery of liquid hydrocarbons from oil and gas field gases. Establishments primarily engaged in sulfur recovery from natural gas are also included. NAICS 213111: Drilling oil and gas wells Establishments in this U.S. industry are primarily engaged in drilling oil and gas wells for others on a contract or fee basis. This industry includes contractors that specialize in spudding in, drilling in, redrilling, and directional drilling. NAICS 213112: Support activities for oil and gas operations Establishments in this U.S. industry are primarily engaged in performing support activities on a contract or fee basis for oil and gas operations (except site preparation and related construction activities). Services included are exploration (except geophysical surveying and mapping); excavating slush pits and cellars, well surveying; running, cutting, and pulling casings, tubes, and rods; cementing wells, shooting wells; perforating well casings; acidizing and chemically treating wells; and cleaning out, bailing, and swabbing wells. NAICS 2212: Natural gas distribution Establishments in this industry are: primarily engaged in: operating gas distribution systems (e.g., mains, meters); known as gas marketers that buy gas from the well and sell it to a distribution system; known as gas brokers or agents that arrange the sale of gas over gas
distribution systems operated by others; and those primarily engaged in transmitting and distributing gas to final consumers. Only privately owned establishments are included in this report. NAICS 23712: Oil and gas pipeline and related structures construction Establishments in this industry include those primarily engaged in the construction of oil and gas lines, mains, refineries, and storage tanks. The work performed may include new work, reconstruction, rehabilitation, and repairs. Specialty trade contractors are included if they are engaged in activities primarily related to oil and gas pipeline and related structures construction. All structures (including buildings) that are integral parts of oil and gas networks (e.g., storage tanks, pumping stations, and refineries) are included in this industry. NAICS 32411: Petroleum refineries Establishments in this industry are primarily engaged in refining crude petroleum into refined petroleum. Petroleum refining involves one or more of the following activities: (1) fractionation; (2) straight distillation of crude oil; and (3) cracking. NAICS 324191: Petroleum lubricating oil and grease manufacturing Establishments in this U.S. industry are primarily engaged in blending or compounding refined petroleum to make lubricating oils and greases and/or re-refining used petroleum lubricating oils. NAICS 32511: Petrochemical manufacturing Establishments in this industry are primarily engaged in manufacturing acyclic (i.e., aliphatic) hydrocarbons such
California’s Oil and Gas Industry in 2013 Its Economic Contribution and Workforce
A-2 LAEDC Institute for Applied Economics
as ethylene, propylene, and butylenes made from refined petroleum or liquid hydrocarbons and/or manufacturing cyclic aromatic hydrocarbons such as benzene, toluene, styrene, xylene, ethyl benzene, and cumene made from refined petroleum or liquid hydrocarbons. NAICS 333132: Oil and gas field machinery and equipment manufacturing This U.S. industry is comprised of establishments primarily engaged in (1) manufacturing oil and gas field machinery and equipment, such as oil and gas field drilling machinery and equipment; oil and gas field production machinery and equipment; and oil and gas field derricks and (2) manufacturing water well drilling machinery. NAICS 4247: Petroleum and petroleum products merchant wholesalers Establishments in this industry group are primarily engaged in the Petroleum Bulk Stations and Terminals industry, with bulk liquid storage facilities primarily engaged in the merchant wholesale distribution of crude, petroleum and petroleum products, including liquefied petroleum gas, or the Petroleum and Petroleum Products Merchant Wholesalers industry, the merchant wholesale distribution of petroleum and petroleum products (except from bulk liquid storage facilities). NAICS 447: Gasoline stations Establishments in this subsector retail automotive fuels (e.g., gasoline, diesel fuel, gasohol, alternative fuels) and automotive oils or retail these products in combination with convenience store items. These establishments have specialized equipment for the storage and dispensing of automotive fuels. NAICS 45431: Fuel dealers Establishments in this industry are primarily engaged in retailing heating oil, liquefied petroleum (LP) gas, and other fuels via direct selling. NAICS 486: Pipeline transportation Industries in this subsector use transmission pipelines to transport products, such as crude oil, natural gas, refined petroleum products, and slurry. Industries are identified based on the products transported (i.e., pipeline transportation of crude oil, natural gas, refined petroleum products, and other products). The Pipeline Transportation of Natural Gas industry includes the storage of natural gas because the storage is usually done by the pipeline establishment and because a pipeline is inherently a network in which all the nodes are interdependent.
Contribution Analysis Methodology Economic contribution analysis is used to describe that portion of a region’s economy that can be attributed to an existing industry. The primary economic contribution to California’s economy of the oil and gas industry is the expenditure of hundreds of millions of dollars towards goods and services from regional vendors. This injection of funds circulates from the initial recipients to the owners and employees of establishments that help supply the goods and services that the industry purchases. The industry also spends billions of dollars every year for the wages and benefits of its employees and contract workers. These workers, as well as the employees of all the industry’s suppliers, spend a portion of their incomes on groceries, rent, vehicle expenses, healthcare, entertainment, and so on. The recirculation of the original expenditures multiplies the initial spending through these indirect and induced effects. The extent to which the initial expenditures multiply is estimated using economic models that depict the relationships between industries (such as oil production and its suppliers) and among different economic agents (such as industries and their employees). These models are built upon actual data of expenditure patterns that are reported to the U.S. Bureau of Labor Statistics, the U.S. Census Bureau and the Bureau of Economic Analysis of the U.S. Department of Commerce. Data is regionalized so that it reflects and incorporates local conditions such as prevailing wages rates, expenditure patterns, and resource availability and costs. The magnitude of the multiplying effect differs from one region to another depending on the extent to which the local region can fill the demand for all rounds of supplying needs. For example, the automobile manufacturing industry has high multipliers in Detroit and Indiana since these regions have deep and wide supplier networks, while the same industry multiplier in Phoenix is quite small. In another example, the jobs multiplier for the construction industry is higher in, say, Arkansas, than in California because the same amount of spending will purchase fewer workers in Los Angeles than in Little Rock. Multipliers can also differ from year to year as relative material and labor costs change and as the production “recipe” of industries change. For example, the IT

Its Economic Contribution and Workforce California’s Oil and Gas Industry in 2013
LAEDC Institute for Applied Economics A-3
revolution significantly reduced the job multiplier of many industries (such as manufacturing, accounting, architecture and publishing) as computers replaced administrative and production workers. The metrics used to determine the value of the economic contribution are employment, labor income, value-added and the value of output. Employment includes full-time, part-time, permanent and seasonal employees and the self-employed, and is measured on a job-count basis regardless of the number of hours worked. Labor income includes all income received by both payroll employees and the self-employed, including wages and benefits such as health insurance and pension plan contributions. Value-added is the measure of the contribution to GDP made by the industry, and consists of compensation of employees, taxes on production and gross operating surplus. Output is the value of production. For most industries, this is simply the revenues generated through sales; for others, in particular retail industries, output is the value of the services supplied. Estimates are developed using software and data from IMPLAN Group, LLC which traces inter-industry transactions resulting from an increase in demand in a given region. The economic region of interest is the state of California, and the activity is reported for 2013, the most recent year for which a complete set of data is available. Estimates for labor income and output are expressed in 2013 dollars to maintain consistency with the reported industry activity. The total estimated economic contribution includes direct, indirect and induced effects. Direct activity includes the materials purchased and the employees hired by the industry itself. Indirect effects are those which stem from the employment and business revenues motivated by the purchases made by the industry and any of its suppliers. Induced effects are those generated by the spending of employees whose wages are sustained by both direct and indirect spending. Contribution analysis differs from economic impact analysis in that linkages between the component industries are removed so that indirect activity is not double-counted as also part of direct activity. The correspondence between the identified NAICS and sectors used in IMPLAN are straightforward, with a few exceptions. Several IMPLAN sectors (50, 58, 395, and 407) include activities of NAICS unrelated to the oil and gas industry. Direct activity related to the oil and gas industry for these sectors was based on specific isolated employment estimates.
Workforce Characteristics Methodology Data for worker characteristics according to industry is not available at the same detailed level as it is for employment. As such, some modifications were made to the industry definition in reporting workers characteristics. Specifically, the following industries from Exhibit 1-1 were excluded from the workforce analysis: 23712, 32511, 333132 and 45431. The Center for Economic Studies at the U.S. Census Bureau provides several public-use data products derived from existing census, survey, and administrative data. One of these products is the Quarterly Workforce Indicators (QWI), which provides workforce statistics by demography, geography and industry at the sector, subsector and 4-digit industry level. The QWI is unique in that it reports data at the job-level, obtained from linked employer-employee microdata in the Longitudinal Employer-Household Dynamics (LEHD), a database covering more than 95 percent of U.S. private sector jobs. Additional sources include administrative records on employment by states, Social Security data, Federal tax records and other census and survey data. Data available through the QWI allows for the analysis of the demographics of a particular labor market or specific industry, as is done in this report for the oil and gas industry. Estimates used to determine employment distributions of worker characteristics are stable full-quarter employment counts, the number of jobs held on both the first and last day of the quarter with the same employer. Quarterly data has been annualized. County level data was aggregated for each sub-region.

California’s Oil and Gas Industry in 2013 Its Economic Contribution and Workforce
A-4 LAEDC Institute for Applied Economics
Description of NAICS Industry Sectors The industry sectors used in this report are established by the North American Industry Classification System (NAICS). NAICS divides the economy into twenty sectors, and groups industries within these sectors according to production criteria. Listed below is a short description of each sector as taken from the sourcebook, North American Industry Classification System, published by the U.S. Office of Management and Budget (2013). Agriculture, Forestry, Fishing and Hunting: Activities of this sector are growing crops, raising animals, harvesting timber, and harvesting fish and other animals from farms, ranches, or the animals’ natural habitats.
Mining: Activities of this sector are extracting naturally-occurring mineral solids, such as coal and ore; liquid minerals, such as crude petroleum; and gases, such as natural gas; and beneficiating (e.g., crushing, screening, washing and flotation) and other preparation at the mine site, or as part of mining activity.
Utilities: Activities of this sector are generating, transmitting, and/or distributing electricity, gas, steam, and water and removing sewage through a permanent infrastructure of lines, mains, and pipes.
Construction: Activities of this sector are erecting buildings and other structures (including additions); heavy construction other than buildings; and alterations, reconstruction, installation, and maintenance and repairs.
Manufacturing: Activities of this sector are the mechanical, physical, or chemical transformation of material, substances, or components into new products.
Wholesale Trade: Activities of this sector are selling or arranging for the purchase or sale of goods for resale; capital or durable non-consumer goods; and raw and intermediate materials and supplies used in production, and providing services incidental to the sale of the merchandise.
Retail Trade: Activities of this sector are retailing merchandise generally in small quantities to the general public and providing services incidental to the sale of the merchandise.
Transportation and Warehousing: Activities of this sector are providing transportation of passengers and cargo,
warehousing and storing goods, scenic and sightseeing transportation, and supporting these activities.
Information: Activities of this sector are distributing information and cultural products, providing the means to transmit or distribute these products as data or communications, and processing data.
Finance and Insurance: Activities of this sector involve the creation, liquidation, or change of ownership of financial assets (financial transactions) and/or facilitating financial transactions.
Real Estate and Rental and Leasing: Activities of this sector are renting, leasing, or otherwise allowing the use of tangible or intangible assets (except copyrighted works), and providing related services.
Professional, Scientific, and Technical Services: Activities of this sector are performing professional, scientific, and technical services for the operations of other organizations.
Management of Companies and Enterprises: Activities of this sector are the holding of securities of companies and enterprises, for the purpose of owning controlling interest or influencing their management decision, or administering, overseeing, and managing other establishments of the same company or enterprise and normally undertaking the strategic or organizational planning and decision-making of the company or enterprise.
Administrative and Support and Waste Management and Remediation Services: Activities of this sector are performing routine support activities for the day-to-day operations of other organizations, such as: office administration, hiring and placing of personnel, document preparation and similar clerical services, solicitation, collection, security and surveillance services, cleaning, and waste disposal services.
Educational Services: Activities of this sector are providing instruction and training in a wide variety of subjects. Educational services are usually delivered by teachers or instructors that explain, tell, demonstrate, supervise, and direct learning. Instruction is imparted in diverse settings, such as educational institutions, the workplace, or the home through correspondence, television, or other means.
Health Care and Social Assistance: Activities of this sector are operating or providing health care and social assistance for individuals.

Its Economic Contribution and Workforce California’s Oil and Gas Industry in 2013
LAEDC Institute for Applied Economics A-5
Arts, Entertainment and Recreation: Activities of this sector are operating facilities or providing services to meet varied cultural, entertainment, and recreational interests of their patrons, such as: (1) producing, promoting, or participating in live performances, events, or exhibits intended for public viewing; (2) preserving and exhibiting objects and sites of historical, cultural, or educational interest; and (3) operating facilities or providing services that enable patrons to participate in recreational activities or pursue amusement, hobby, and leisure-time interests.
Accommodation and Food Services: Activities of this sector are providing customers with lodging and/or preparing meals, snacks, and beverages for immediate consumption.
Other Services (except Public Administration): Activities of this sector are providing services not specifically provided for elsewhere in the classification system. Establishments in this sector are primarily engaged in activities, such as equipment and machinery repairing, promoting or administering religious activities, grant-making, advocacy, and providing dry-cleaning and laundry services, personal care services, death care services, pet care services, photofinishing services, temporary parking services, and dating services.
Study Authors Christine Cooper, Ph.D. Vice President, Economic and Policy Analysis Dr. Cooper leads the Institute for Applied Economics whose work involves research in regional issues such as economic impact studies, regional industry analysis and forecasts, workforce development analysis, and issue studies related to the L.A. County Strategic Plan for Economic Development. Her fields of expertise include development economics, environmental economics, regional analysis and urban sustainability. Prior to joining the LAEDC, Dr. Cooper was a co-founder of a start-up company in Hong Kong concentrating on equity transactions software and computer accessories manufacturing, which expanded production into the special economic zone of Shenzhen, China and distributed products throughout the United States and Asia. With her business partner, she also established the first authorized Apple Computer retailer in China. She has been a lecturer at California State University, Long
Beach and at the Pepperdine Graziadio School of Business and Management. Dr. Cooper is a citizen of the United States and Canada. She earned a Bachelor of Arts in Economics from Carleton University in Ottawa, Canada, and a Ph.D. in Economics from the University of Southern California. With funding from the National Science Foundation, she earned a Graduate Certificate in Environmental Sciences, Policy and Engineering. Her current research includes industry cluster determination and performance in the regional economy, commuting and job allocation patterns, and workforce development issues. Shannon M. Sedgwick Economist In her current capacity as Associate Economist at the LAEDC, Ms. Sedgwick develops subject-specific information for economic impact, demographic, transportation, industry and issue studies. She performs research, data collection and organization, analysis and report preparation. Her work focuses on demographics, industry clusters and occupational analysis. Ms. Sedgwick joined the LAEDC team in June of 2008 as an Economic Research Assistant for the Kyser Center for Economic Research. In that role she assisted both Economic Research and the Consulting Practice of the LAEDC with data collection and research, managing multiple data sets covering the State of California, Southern California, its counties and their sub-regions. In addition to writing sections of LAEDC’s Economic Forecasts, she was responsible for the Business Scan containing a collection of Los Angeles County economic indicators; the annual L.A. Stats, containing the most frequently requested statistics for Los Angeles and its surrounding counties; and was a regular contributor to the weekly economic newsletter, e-Edge. Before joining the LAEDC, Ms. Sedgwick managed an industrial and steel supply company located in the Inland Empire. There she identified and targeted a diverse customer base, and analyzed product and customer patterns in the local industrial market to successfully increase revenues. A Southern California native, Ms. Sedgwick received her Bachelor of Arts in Economics from the University of Southern California (USC) with a minor in Architecture. She has been a member of the national and the Los Angeles Chapter of the National Association for Business Economics (NABE) since 2008.

I
INSTITUTE FOR APPLIED ECONOMICS Los Angeles County Economic Development Corporation 444 S. Flower Street, 37 Floor Los Angeles, CA 90071