Embed Size (px)
Citation preview

1
Jean Laherrere 10 June 2016 California: oil production & reserves On the map of US oil and gas wells California represents a remote and small oil producing area, compared to Texas, but California was in 1910 the first oil producer state.
Native Americans were using la Brea tar pits (Los Angeles) as lubricant and to waterproof their canoes. When Spanish explorers arrived in California in the 1500s, they also used oil to seal cracks in their ships and the roofs of their homes. The presence of natural petroleum seeps in the Santa Barbara area (largest in the western hemisphere) was first recorded in 1775. This recent USGS picture shows natural oil seeps on Santa Barbara cliff http://walrus.wr.usgs.gov/seeps/environment.html

2
In 1792 Captain Cook’s navigator Vancouver passing the Santa Barbara Channel found tar on the sea and commercial exploitation of the petroleum began around 1857 with distillation of the tar. Drilling for oil commenced onshore in 1866 in the Ventura basin and extended offshore in 1896 (Summerland). Presently 20 to 25 tons of oil are emitted every day in the oil seeps of Santa Barbara (Woods Hole Oceanographic Institution 2014) API reports US oil production by state where California production started in 1875 Who can tell which State was the largest annual oil producer on the period 1859-1910? The answer is California (1910), followed by Oklahoma (1910), Illinois (1910), Pennsylvania (1891), Texas (1905), Ohio (1896), Kansas (1906), West Virginia (1900) and Indiana (1904) for an annual oil production over 10 Mb.
0!
10!
20!
30!
40!
50!
60!
70!
80!
1850! 1860! 1870! 1880! 1890! 1900! 1910!
annu
al o
il pr
oduc
tion
Mb!
year!
US annual oil production for main producers (>10 Mb) 1859-1910!
California!Oklahoma!Illinois!Pennsylvania!Texas!Ohio!Kansas!West Virginia!Indiana!
Jean Laherrere May 2016!

3
On the cumulative oil production for the period 1859-1910 the first State is Pennsylvania (695 Mb), Ohio (396 Mb), California (375 Mb), West Virginia (220 Mb), Oklahoma (191 Mb) and Texas (147 Mb)
On the 1999 OGJ list of 50 US oil giant (>500 Mb) fields at end 1988 cumulative production plus remaining reserves (close to ultimate), the first giant is Prudhoe Bay 13 Gb, second East Texas (5,4 Gb), the third Wilmington (2.8 Gb) and the fourth Midway-Sunset (2.7 Gb). The list reports 5 giants in Alaska (17.4 Gb: average size = 3.5 Gb), 13 giants in California (16.7 Gb: average size = 1.3 Gb) and 20 giants (23.4 Gb: average size 1.2 Gb)) in Texas. California is historically as important as Texas as oil is concerned, but California is often forgotten One of the main reasons is the lack of historical oil data on California, but also the lack of exploration after the 1969 pollution by an oil spill. California department of conservation (division of oil, gas & geothermal resources = DOGGR) reports annual statistics since 1915 ftp://ftp.consrv.ca.gov/pub/oil/Summary_of_Operations There are many reports with very long details on operations and operators, but with no synthesis on the full production period 1875-2015. It is amazing to see the lack of synthesis on California oil production coming from the California Department of conservation or from the EIA or from the USGS, in comparison to the huge amount of detailed local reports or from BOEM for the federal waters in comparison to the GOM DOGGR displays oil production only since 1960 in their PR03-preannual reports, plotting only OCS for offshore in 2015 (missing tidelands), when in 2014 plotting only tidelands (missing OCS, but in 2009 the OCS and tidelands! They show that they are unable to properly report California oil production! They seem to ignore what was done before and to not care about historical data! PR03-2015 reporting only OCS as offshore ignoring tidelands
0!
100!
200!
300!
400!
500!
600!
700!
1850! 1860! 1870! 1880! 1890! 1900! 1910!
cum
ulat
ive
oil p
rodu
ctio
n M
b!
year!
US cumulative oil production for main producers 1859-1910!
Pennsylvania!Ohio!California!West Virginia!Oklahoma!Texas!Illinois!Indiana!Kansas!
Jean Laherrere May 2016!

4
PR03-2014 displays an onshore total (peak 350 Mb in 1985) different from the one in 2015 (390 Mb in 1985) and State tidelands, ignoring OCS
PR03-2009 is correctly reporting OCS, ti0elands and onshore oil production.

5
Those PR03 graphs display different onshore total values with the same title: it is a pity! CA DOGGR is unable to report since 1960 correctly the offshore production data (state and OCS values), and also the onshore production value. CA DOGGR does not display a graph of CA oil production from 1875 to 2015 Gathering all the data from many reports from many sources, California global crude oil production is displayed from 1875 to 2015 on the following graph, broken down into onshore and offshore (state and federal waters = OCS) If full annual oil production cannot be found on DOGGR, API provides California oil production since the beginning, showing a sharp increase in 1922 and a sharp decline in 1930. Oil production peaked in 1985, when total offshore peaked in 1970.

6
EIA http://www.eia.gov/dnav/pet/pet_crd_cplc_dcu_NUS_a.htm reports OCS separately from California oil production EIA reports for California no lease condensate production for onshore or offshore on the site https://www.eia.gov/dnav/ng/ng_prod_lc_s1_a.htm In the US condensate is often measured with crude oil and it is difficult to distinguish condensate and crude oil. EIA does not report any California lease condensate production up to 2009, in contrary with Texas or Oklahoma or GOM, but since 2010 EIA reports tiny lease condensate production (1.3 Mb in 2014) and reserves (20 Mb in 2014). There is no official definition of condensate related to its density (50 °API for API, 45 °API for the industry), only about the way it is produced (in fact about condensation of something being gas in the reservoir becoming liquid in surface at the well head) EIA glossary: Condensate (lease condensate): Light liquid hydrocarbons recovered from lease separators or field facilities at associated and non-associated natural gas wells. Mostly pentanes and heavier hydrocarbons. Normally enters the crude oil stream after production. Lease condensate exports are prohibited when plant condensate exports are perfectly legal! Lease condensate is considered as crude, when natural gas plant liquids are considered as refined products. IEA condensate is reported either as crude when sold with crude or as NGL when sold with NGL (Norway NDP definition): it means that only IEA world crude +NGL is correct, when IEA crude oil is incorrect. The California crude oil production (including state and federal) is linearly extrapolated (Hubbert linearization = HL) for the period 1985-2015 towards 35 Gb
0!
50!
100!
150!
200!
250!
300!
350!
400!
450!
1870! 1880! 1890! 1900! 1910! 1920! 1930! 1940! 1950! 1960! 1970! 1980! 1990! 2000! 2010! 2020!
annu
al c
rude
oil
prod
uctio
n M
b!
year!
California crude oil production!
all Cal!Cal exc fed!onshore!offshore!state waters!OCS fed !
Jean Laherrere May 2016!
oil production started in 1900 for state waters (no data before 1958) & 1968 for OCS!

7
But the plot of annual oil production versus cumulative production (period 1995-2015) is extrapolated towards 36 Gb, this plot is more reliable than the HL
The cumulative crude oil production is compared for all California with those for offshore broken down into OCS and State waters and modeled for ultimates of 36 Gb, 32 Gb, 4.4 Gb, 2.8 Gb and 1.6 Gb (see later the way ultimates are estimated) CA cumulative oil production at end 2015 represents 29.7 Gb = 83 % of the ultimate
0,0!
1,0!
2,0!
3,0!
4,0!
5,0!
0! 5! 10! 15! 20! 25! 30! 35! 40!
aP/C
P%!
cumulative production Gb!
California HL of crude oil production!
aP/CP% 1975-2015!
1990-2015!
Jean Laherrere May 2016!
0!
50!
100!
150!
200!
250!
300!
350!
400!
450!
0! 5! 10! 15! 20! 25! 30! 35! 40!
annu
al c
rude
oil
prod
uctio
n M
b!
cumulative production Gb!
California annual crude oil decline!
crude oil prod!1995-2015!
Jean Laherrere May 2016!

8
CA is a mature & 83% depleted oil area.
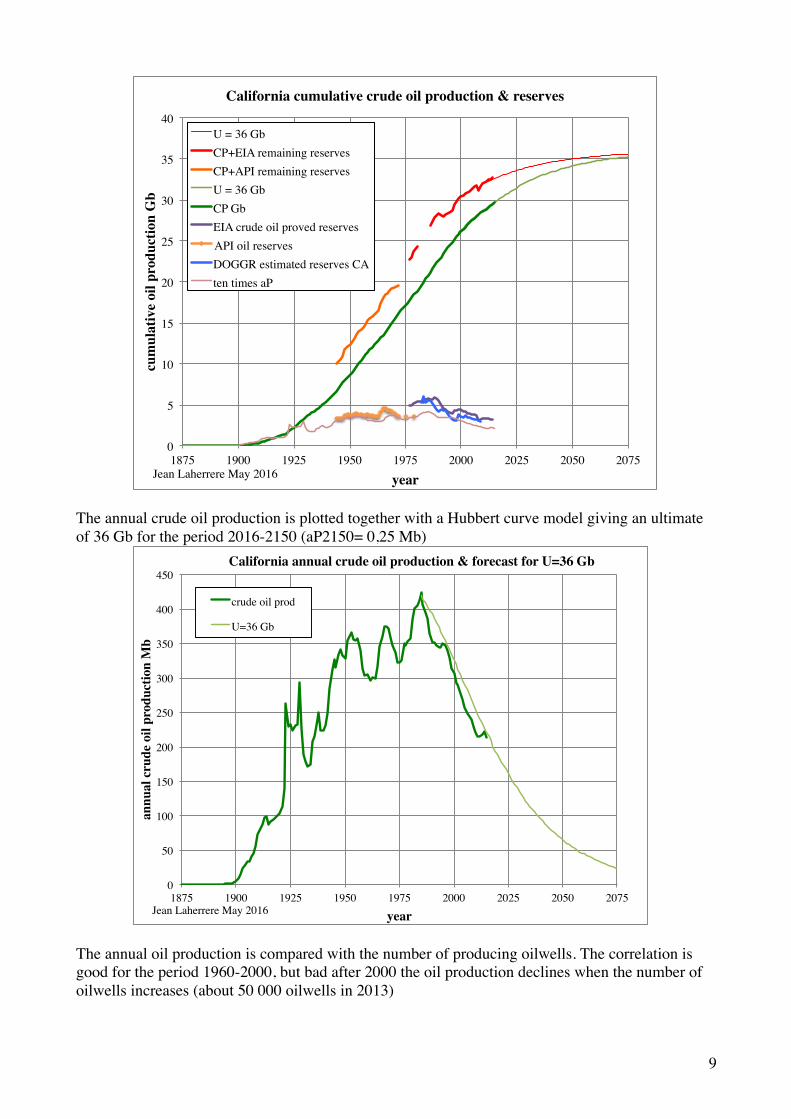
The all California cumulative crude oil production is plotted as the EIA & API oil proved reserves (current remaining reserves). Cumulative production plus remaining reserves are extrapolated towards the ultimate of 36 Gb. Remaining current proved reserves is as always too conservative, because the aggregation of proved field reserves is incorrect, underestimating the real value: only mean field values aggregation is correct: we will see that with OCS backdated reserves. API CA proved reserves is close to ten times the annual production, but EIA reserves curve is parallel being a little higher! DOGGR reserves are slightly lower than EIA. US practice was to estimate proved reserves by multiplying the annual production by ten: in fact the US R/P oscillated for the last 90 years around 10 years!
0!
3!
6!
9!
12!
15!
18!
21!
24!
27!
30!
33!
36!
1875! 1900! 1925! 1950! 1975! 2000! 2025! 2050! 2075! 2100!
cum
ulat
ive
oil p
rodu
ctio
n G
b!
year!
California cumulative crude oil production & forecasts!
U = 36 Gb!CP all !U = 32 Gb!CP onshore!U = 4.4 Gb!CP offshore!U= 2.8 Gb !CP state offshore Gb!U = 1.6 Gb!CP OCS Gb!
Jean Laherrere May 2016!
oil production started in 1900 for state waters (no data before 1958) & 1968 for OCS!
9
The annual crude oil production is plotted together with a Hubbert curve model giving an ultimate of 36 Gb for the period 2016-2150 (aP2150= 0,25 Mb)
The annual oil production is compared with the number of producing oilwells. The correlation is good for the period 1960-2000, but bad after 2000 the oil production declines when the number of oilwells increases (about 50 000 oilwells in 2013)
0!
5!
10!
15!
20!
25!
30!
35!
40!
1875! 1900! 1925! 1950! 1975! 2000! 2025! 2050! 2075!
cum
ulat
ive
oil p
rodu
ctio
n G
b!
year!
California cumulative crude oil production & reserves!
U = 36 Gb!CP+EIA remaining reserves!CP+API remaining reserves!U = 36 Gb!CP Gb!EIA crude oil proved reserves!API oil reserves!DOGGR estimated reserves CA!ten times aP!
Jean Laherrere May 2016!
0!
50!
100!
150!
200!
250!
300!
350!
400!
450!
1875! 1900! 1925! 1950! 1975! 2000! 2025! 2050! 2075!
annu
al c
rude
oil
prod
uctio
n M
b!
year!
California annual crude oil production & forecast for U=36 Gb!
crude oil prod!
U=36 Gb!
Jean Laherrere May 2016!

10
The annual crude oil production is compared with the annual number of wells drilled: the correlation is fair from 1920 to 1995, and bad beyond.: oil production drops when drilling stays almost flat
-onshore production There was tidelands production from 1896 to 1902 with many wells (see below), but with a very weak production per well about 1 b/d/w and the data is hard to get and appears to be negligible compared to the onshore production: offshore production (unreliable) data starts from 1928
0!
6 000!
12 000!
18 000!
24 000!
30 000!
36 000!
42 000!
48 000!
54 000!
0!
50!
100!
150!
200!
250!
300!
350!
400!
450!
1880! 1900! 1920! 1940! 1960! 1980! 2000! 2020!
num
ber
of p
rodu
cing
oilw
ells!
annu
al p
rtod
uctio
n M
b!
year!
California crude oil production & producing oilwells!
crude oil +condensat!crude oil EIA!prod oillwells!
Jean Laherrere May 2016!
0!
500!
1 000!
1 500!
2 000!
2 500!
3 000!
3 500!
4 000!
0!
50!
100!
150!
200!
250!
300!
350!
400!
450!
500!
550!
1880! 1900! 1920! 1940! 1960! 1980! 2000! 2020!
annu
al n
umbe
r of
dri
lled
wel
ls!
annu
al p
rtod
uctio
n M
b!
year!
California crude oil production & drilled wells!
crude oil +condensat!wells drilled!
Jean Laherrere May 2016!

11
The California crude oil production was reconstructed with reliable data to display offshore and onshore data.
The Hubbert linearization of the onshore oil production is crooked, around an ultimate of 30 Gb for the period 1985 to 2014 or 1992-2014.
0!
50!
100!
150!
200!
250!
300!
350!
400!
450!
1870!1880!1890!1900!1910!1920!1930!1940!1950!1960!1970!1980!1990!2000!2010!2020!
annu
al c
rude
oil
prod
uctio
n M
b!
year!
California crude oil production!
crude oil prod!Cal exc fed!onshore!offshore!state waters!OCS fed !
Jean Laherrere May 2016!
oil production started in 1900 for state waters (no data before 1958) & 1968 for OCS!
0!
1!
2!
3!
4!
5!
0! 5! 10! 15! 20! 25! 30! 35!
aP/C
P%!
cumulative oil production Gb!
California onshore HL of oil production!
1875-1984!1985-2014!1992-2014!
Jean Laherrere May 2016!

12
The California onshore oil decline extrapolation is more reliable trending for the period 1985 to 2014 towards 33 Gb
The annual oil onshore production is forecasted for an ultimate of 32 Gb with several peaks 1923, 1929, 1953 and the largest 1985. It appears that the decline since 1985 will continue until the end with an annual ratio of 2.6%/a
The California onshore cumulative production is modeled with an ultimate of 32 Gb.
0!
50!
100!
150!
200!
250!
300!
350!
400!
0! 5! 10! 15! 20! 25! 30! 35!
annu
al o
il pr
oduc
tion
Mb!
cumulative oil production Gb!
California onshore oil production decline!
aP Mb!1985-2014!
Jean Laherrere May 2016!
0!
50!
100!
150!
200!
250!
300!
350!
400!
1875! 1900! 1925! 1950! 1975! 2000! 2025! 2050! 2075!
annu
al o
il pr
oduc
tion
Mb!
year!
California onshore annual oil production & forecast U = 32 Gb!
decline 2.6%!U = 32 Gb!aP Mb!
Jean Laherrere May 2016!

13
The cumulative production plus remaining DOGGR estimated reserves is far to indicate the ultimate. DOGGR estimated reserves are poor, as any proved reserves following SEC rules, written to please the bankers.
Midway-Sunset is the CA largest onshore field, second after after Wilmington. It was discovered in 1894 and reached only its peak in 1991, almost one hundred years later because being heavy oil its production grew with the number of producing wells which reached its peak in 2008
Waterflood was started only in 1954, fireflood in 1960 and steamflood in 1963. Watercut has reached 90% only in 2015
0!
5!
10!
15!
20!
25!
30!
35!
1875! 1900! 1925! 1950! 1975! 2000! 2025! 2050! 2075!
cum
ulat
ive
oil p
rodu
ctio
n G
b!
year!
California onshore cumulative oil production & reserves!
CP Gb!DOGGR RR Gb!CP+RR!U = 32 Gb!
Jean Laherrere May 2016!
0!
1700!
3400!
5100!
6800!
8500!
10200!
11900!
0!
10!
20!
30!
40!
50!
60!
70!
1900! 1910! 1920! 1930! 1940! 1950! 1960! 1970! 1980! 1990! 2000! 2010! 2020!
num
ber
of p
rodu
cing
wel
ls!
annu
al p
rodu
ctio
n M
b/a!
year!
Midway-Sunset (1894) oil production!
aP Mb!
number of wells!
Jean Laherrere May 2016!
waterflood 1954!fireflood 1960!steamflood1963!

14
Midway-Sunset oil decline can be extrapolated on the period 2000-2015 towards an ultimate of 3600 Mb, when DOGGR ultimate is 3500 Mb
-State waters = tidelands Oil production from tidelands comes from the extension of field onshore, but DOGGR field data are given for the beginning for the whole field, the breakdown for offshore and onshore started only after 1958. First offshore production started in 1898 at Summerland (Santa Barbara) close to oil seeps: >400 wells between 1898 and 1902 on piers extending to 375 m (quick decline) A Case Study of California Offshore Petroleum Production, Well Stimulation, and Associated Environmental Impacts James Houseworth, William Stringfellow Lawrence Berkeley National Laboratory, Berkeley, CA https://ccst.us/publications/2015/vol-III-chapter-2.pdf
30!
40!
50!
60!
70!
80!
90!
100!
0!
10!
20!
30!
40!
50!
60!
70!
0! 500! 1000! 1500! 2000! 2500! 3000! 3500! 4000!
wat
ercu
t %!
annu
al p
rodu
ctio
n M
b/a!
cumulative production Mb!
Midway-Sunset (1894) oil decline 1900-2015!
1900-1998!2000-2015!U ca.gov 2009!watercut %!
Jean Laherrere May 2016!
waterflood 1954!fireflood 1960!steamflood1963!

15
The first offshore platform was Hazel in 1958 in the Summerland offshore oil field. The oil spill in 1969 (80 000 b) due to a blow out from a platform in Santa Barbara was a great shock to California: new leasing was stopped in 1969 for the State and in 1984 for federal waters!
The beach of Summerland field is completely clean in 2009 compared to the same view of 1896 http://aoghs.org/offshore-history/california-oil-seeps/

16
On Internet many pictures of offshore wells around 1900 as above, but no data on oil production except that the production per day per well was about 1 b/d/w. In the USGS 1969 paper 679 the article by Yerkes et al “Petroleum development in the Santa Barbara channel region” gives many details but no historical series. CA DOGGR provides monthly reports and annual reports since 1915 with many papers on oil fields including offshore fields but no global production data before 1958. We have reconstructed tidelands annual oil production from the main fields, mainly Huntington and Wilmington since 1927. Before the data is unreliable and incomplete but it seems negligible.
The Hubbert linearization of the state offshore oil production is chaotic, but being linear for 1989 to 2015 trending towards 2.8 Gb
0!
10!
20!
30!
40!
50!
60!
70!
80!
90!
1900! 1925! 1950! 1975! 2000! 2025! 2050! 2075!
annu
al p
rodu
ctio
n M
b!
year!
California state waters (tidelands) annual crude oil production!
U= 2.8 Gb!aP Mb!Huntington tidelands !Wilmington tidelands!
Jean Laherrere May 2016!
oil production started in 1900 for state waters (no global data before 1958) !

17
The oil decline is extrapolated for the period 1977-2015 towards 2.8 Gb
The cumulative state waters oil production is plotted with reserves from DOGGR, but EIA oil reserves (http://www.eia.gov/dnav/pet/hist/LeafHandler.ashx?n=PET&s=RCRR01RCASF_1&f=A) are different from DOGGR since 2001 and in disagreement with the extrapolation of cumulative production.
0!
1!
2!
3!
4!
5!
6!
7!
8!
0,0! 0,2! 0,4! 0,6! 0,8! 1,0! 1,2! 1,4! 1,6! 1,8! 2,0! 2,2! 2,4! 2,6! 2,8! 3,0!
aP/C
P%!
cumulative oil production Gb!
California state waters (tidelands) HL of oil production !
1927-1989!
1989-2015!
Jean Laherrere May 2016!
oil production started in 1900 for state waters (no global data before 1958) !
0!
10!
20!
30!
40!
50!
60!
70!
80!
90!
0! 0,5! 1! 1,5! 2! 2,5! 3!
annu
al p
rodu
ctio
n M
b!
cumulative oil production Gb!
California state waters (tidelands) crude oil decline!
aP Mb!
1977-2015!
Jean Laherrere May 2016!

18
It is obvious that EIA proved reserves were badly estimated and did not care to check with the State values! It is interesting to look at the main producing fields covering the State waters tidelands fields -Huntington Beach -Huntington Beach field (discovered in 1920) covers onshore and offshore (tidelands). Offshore oil was produced from wells on piers since 1932 and the first platform was installed in 1961 Debbie Cook reported oil production and number of wells for the period 1920-2008
0,0!
0,5!
1,0!
1,5!
2,0!
2,5!
3,0!
1900! 1925! 1950! 1975! 2000! 2025! 2050! 2075!
cum
ulat
ive
prod
uctio
n &
res
erve
s Gb!
year!
California state waters cumulative crude oil production!
CP+DOGGR RR!U = 2.8 Gb!CP!RR DOGGR state waters!RR EIA state off!
Jean Laherrere May 2016!
oil production started in 1900 for state waters (no data before 1958) !

19
Offshore area of Huntington Beach is small compared to the onshore part but at end 2015 the cumulative oil production for offshore is 600 Mb when it is 550 Mb from onshore. The offshore part in the cumulative production is much larger than the onshore part compared to the surface area: it seems strange! Is it due to a better recovery because offshore technology is better than the onshore technology? Or is it due to poor break down between onshore or offshore? The annual oil production is displayed with all field and the breakdown between onshore and offshore = tidelands. Onshore production was earlier than offshore and with strong decline (bad practice)
The cumulative production is plotted with the remaining proved reserves (as usual poor estimates because forgetting the probable)
0!
5!
10!
15!
20!
25!
30!
35!
1920! 1930! 1940! 1950! 1960! 1970! 1980! 1990! 2000! 2010! 2020!
annu
al p
rodu
ctio
n M
b!
year!
Huntington Beach (1920) annual oil production !
all field!tidelands production!onshore!
Jean Laherrere May 2016!Jean Laherrere May 2016!
sources: Cook, OGJ & consrv.ca.gov !

20
The all field is close to depletion complete despite a small increase in offshore in the recent years. The Hubbert linearization of the field oil production trends for the period 1947-2015 towards 1175 Mb
The oil decline gives a similar 1175 Mb for the period 1975-2015
0!
100!
200!
300!
400!
500!
600!
700!
800!
900!
1000!
1100!
1200!
1920! 1930! 1940! 1950! 1960! 1970! 1980! 1990! 2000! 2010! 2020!
annu
al p
rodu
ctio
n M
b!
year!
Huntington Beach cumulative oil production & reserves !
CP+RR!CP all!CP offshore!CP onshore!RR !
Jean Laherrere May 2016!
consrv.ca.gov reported reserves only for the period 1977 to 2009!
sources: Cook, OGJ & consrv.ca.gov !
0!
1!
2!
3!
4!
5!
6!
7!
8!
0! 100! 200! 300! 400! 500! 600! 700! 800! 900! 1000! 1100! 1200!
aP/C
P%!
cumulative production Mb!
Huntington Beach HL of oil production!
aP/CP%!1947-2015!
Jean Laherrere May 2016!

21
USGS 2012-3120 report estimates Huntington oil in place at 3500 Mb with an oil recovery of 40%, giving an ultimate at 3500*0.4 = 1400 Mb: it looks very optimistic! The offshore part of Huntington field production starts to decline sharply after a peak in 1972 when the watercut increase sharply. The watercut is over 97% in 2015 meaning close to exhaustion.
The plot of the annual offshore production versus the cumulative production displays a sharp decline since the peak of 1972, trending towards an ultimate of 625 Mb (cumulative production at end 2015 = 600 Mb
0!
5!
10!
15!
20!
25!
30!
35!
0! 100! 200! 300! 400! 500! 600! 700! 800! 900! 1000! 1100! 1200!
annu
al p
rodu
ctio
n M
b!
cumulative oil production Mb!
Huntington Beach oil decline!
all field!1978-2015!
Jean Laherrere May 2016!
10!
20!
30!
40!
50!
60!
70!
80!
90!
100!
0!
2!
4!
6!
8!
10!
12!
14!
16!
18!
1930! 1940! 1950! 1960! 1970! 1980! 1990! 2000! 2010! 2020!
wat
ercu
t %!
annu
al p
rodu
ctio
n M
b!
year!
Huntington Beach offshore annual oil production !
tidelands production!watercut!
Jean Laherrere May 2016!

22
The cumulative offshore oil production plus remaining reserves trend towards 625 Mb
-Wilmington CA department of conservation DOGGR reports in their annual reports Wilmington oil production since 1936, but starts only in 1967 to report separately onshore and offshore.
10!
20!
30!
40!
50!
60!
70!
80!
90!
100!
0!
2!
4!
6!
8!
10!
12!
14!
16!
18!
0! 50! 100! 150! 200! 250! 300! 350! 400! 450! 500! 550! 600! 650!
wat
ercu
t %!
annu
al p
rodu
ctio
n M
b!
cumulative production Mb!
Huntington Beach offshore oil decline 1932-2015!
tidelands production!
watercut!
Jean Laherrere May 2016!
ultimate 625 Mb?!
sources: Cook, OGJ & consrv.ca.gov !
50!
60!
70!
80!
90!
100!
110!
0!
50!
100!
150!
200!
250!
300!
350!
400!
450!
500!
550!
600!
650!
1930! 1940! 1950! 1960! 1970! 1980! 1990! 2000! 2010! 2020! 2030! 2040!
wat
ercu
t %!
cum
ulat
ive
pro
duct
ion
Mb!
year!
Huntington Beach offshore cumulative oil production & reserves !
CP+RR!U=630 Mb!CP!watercut!
Jean Laherrere May 2016!

23
SL Montgomery 1998 AAPG bulletin V82 N°3 displays the structure of the field.
It is obvious that the Belmont offshore field is part of Wilmington oil field but was separated only because outside the Los Angeles county belonging to the Orange county The structural trend of Huntington is the continuation of the Torrance field. The delineation of fields in California is not geological or structural, but more geographic! The Wilmington oil production had a first peak in 1951 and a second largest in 1968 after the water flooding of 1960 The peak in numbers of wells was in 1959. Watercut passed over 80% in 1971 and is presently at 97.5%, close to exhaustion! The introduction of horizontal wells in 1995 did not change much the decline

24
The annual oil production versus the cumulative production displays a steep decline, despite the steamflood (few years of release) and horizontal wells
The extrapolation of the oil production trends towards 3000 Mb. The HL of Wilmington oil production trends towards 3000 Mb with two poor linear periods 1981-2015 and 1992-2015
0!
300!
600!
900!
1200!
1500!
1800!
2100!
2400!
2700!
3000!
3300!
0!
10!
20!
30!
40!
50!
60!
70!
80!
90!
100!
1930! 1940! 1950! 1960! 1970! 1980! 1990! 2000! 2010! 2020!
num
bers
of w
ells!
annu
al p
rodu
ctio
n M
b, w
ater
cut %
!
year!
Wilmington oil production !
oil Mb!
watercut %!
nb wells!
horizontal wells!
1960 unitization!waterflooding!
1950 subsidence 0.7 m/a!
steamflood!
Jean Laherrere May 2016!sources: OGJ & consrv.ca.gov !
0!
300!
600!
900!
1200!
1500!
1800!
2100!
2400!
2700!
3000!
0!
10!
20!
30!
40!
50!
60!
70!
80!
90!
100!
0! 500! 1000! 1500! 2000! 2500! 3000! 3500!
num
bers
of p
frod
ucin
g w
ells!
annu
al p
rodu
ctio
n M
b/a,
wat
ercu
t %!
cumulative production Mb!
Wilmington oilfield decline 1942-2015 !
oil Mb!
watercut %!
nb wells!
horizontal wells!
1960 unitization!waterflooding!
1950 subsidence 0.7 m/a!
steamflood!
Jean Laherrere May 2016!

25
The cumulative oil production and remaining proved reserves shows a huge change in 1962 following the introduction of waterflooding. The cumulative oil production plus remaining proved reserves has increased sharply after the introduction of waterflooding to compensate with the large subsidence The cumulative oil production is extrapolated for an ultimate of 3000 Mb
0!
1!
2!
3!
4!
5!
6!
7!
0! 500! 1000! 1500! 2000! 2500! 3000! 3500!
aP/C
P% !
cumulative oil production Mb!
Wilmington HL of oil production!
aP/CP%!1981-2015!1992-2015!
Jean Laherrere May 2016!
0!
500!
1000!
1500!
2000!
2500!
3000!
1930! 1950! 1970! 1990! 2010! 2030! 2050!
cum
ulat
ive
prod
uctio
n &
rep
orte
d ul
timat
es M
b!
year!
Wilmington cumulative oil production 1936-2015 &!reserves evolution 1940-2009 !
CP+RR !
U=3000 Mb!
CP on+offshore!
Jean Laherrere May 2016!
sources: OGJ & DOGGR!

26
USGS 2005 paper “Growth history of oil reserves in major California oil fields during the twentieth century” http://pubs.usgs.gov/bul/b2172-h/b2172h508.pdf displays the evolution of ultimates for many C fields but Wilmington shows the largest increase
Wilmington displays also the largest surface subsidence, because a large oil production without replacing the oil by water, making waterflood a must. The subsidence from 1928 to 1964 is huge with a maxi of 28 ft, close to shore
Subsidence follows the oil production (Mayuga & Allen)

27
Wilmington oil production increased sharply in 1965 with the water injection sharp increase.
Water injection started slowly in 1954, greatly in 1959 and sharply in 1965. From 1954 to 1964 1000 Mb of water was injected, amount equivalent to the cumulative production of oil produced from 1936 to 1964. -offshore Wilmington DOGGR reports annual & cumulative oil production for Wilmington globally from the starts in their annual reports but only since 1967 with the breakdown between onshore and offshore It is impossible to find the previous offshore Wilmington annual production in a historical series but DOGGR reports the cumulative offshore production, meaning that they knew the historical annual production From the data from other offshore fields I was able to guess the Wilmington offshore annual production before 1967

28
The offshore annual Wilmington oil production had a peak in 1951 (from piers wells and deviated wells) and 1969 (after the installation of 4 platforms on artificial islands = Grisson, Freeman, While & Chaffee in 1965 by THUMS = Texaco, Humble, Union, Mobil & Shell, THUMS was bought later by Oxy) The Wilmington oil production is plotted as annual & cumulative for onshore and offshore, being a guess before 1967. Annual offshore oil production ‘in green) peaked in 1961 and 1969 The watercut of offshore oil production climbed sharply after the 1969 peak and it now about 98%
0!
10!
20!
30!
40!
50!
60!
70!
80!
90!
100!
110!
1920! 1930! 1940! 1950! 1960! 1970! 1980! 1990! 2000! 2010! 2020!
annu
al o
il pr
oduc
tion
Mb!
year!
California offshore annual oil production!Cal offshore!state offshore!fed OCS!six fields!Wilmington from others!Wilmington offshore!Huntington offshore!Belmont offshore!Carpentaria state off!Conception offshore!Summerland offshore!
Jean Laherrere May 2016!
0!
500!
1000!
1500!
2000!
2500!
3000!
0!
10!
20!
30!
40!
50!
60!
70!
80!
90!
100!
1930! 1940! 1950! 1960! 1970! 1980! 1990! 2000! 2010! 2020!
cum
ulat
ive
prod
uctio
n M
b!
annu
al p
rodu
ctio
n M
b, w
ater
cut %
!
year!
Wilmington onshore & offshore oil production!
watercut % offshore!guess offshore!annual oil offshore!annual oil onshore!guess onshore!CP on+offshore!CP offshore!CP onshore!
Jean Laherrere May 2016!

29
The artificial island Grisson close to shore, in the harbor of Long Beach
The deviated wells from shore or the four artificial islands are displayed in this graph from Occidental
-Belmont offshore oil field Belmont offshore oil field belongs to the Wilmington field but was separated because outside the Los Angeles County USGS in their report 2012-3120 “Remaining recoverable petroleum in ten giants oil fields of the Los Angeles basin, Southern California” reports Belmont with Wilmington with a joint mean ultimate of 3600 Mb (9000 Mb in place with 40% recovery) My estimate of the ultimate of Wilmington –Belmont is about 3100 Mb (3000 + 85 ) 500 Mb less than USGS

30
Belmont oil production peaked in 1967
The cumulative oil production follows the watercut. The remaining proved reserves (from OGJ & later by DOGGR) peaked as the annual oil production in 1967 (usually proved reserves is taken as ten times the annual production, because in the US R/P is about 10 years for the last 80 years.) Last reported Belmont remaining reserves were too low.
0!
10!
20!
30!
40!
50!
60!
70!
80!
90!
100!
0,0!
0,5!
1,0!
1,5!
2,0!
2,5!
3,0!
3,5!
4,0!
4,5!
5,0!
1950! 1960! 1970! 1980! 1990! 2000! 2010! 2020!
wat
ercu
t %!
annu
al o
il pr
oduc
tion
Mb!
year!
Belmont offshore annual oil production !
aP oil !watercut %!
Jean Laherrere May 2016!

31
The Belmont oil ultimate is about 85 Mb from the oil decline
-California OCS The Pacific OCS in POCS1999 displays the different provinces. Only oil was found in Santa Maria basin, Santa Barbara basin & Los Angeles basin.
0!
20!
40!
60!
80!
100!
120!
0!
10!
20!
30!
40!
50!
60!
70!
80!
90!
100!
1950! 1960! 1970! 1980! 1990! 2000! 2010! 2020!
wat
ercu
t %!
cum
ulat
ive
oil p
rodu
ctio
n M
b!
year!
Belmont offshore cumulative oil production !
CP+RR!CP oil!watercut %!
Jean Laherrere May 2016!
0!
10!
20!
30!
40!
50!
60!
70!
80!
90!
100!
0,0!
0,5!
1,0!
1,5!
2,0!
2,5!
3,0!
3,5!
4,0!
4,5!
5,0!
0! 10! 20! 30! 40! 50! 60! 70! 80! 90!
wat
ercu
t %!
annu
al o
il pr
oduc
tion
Mb!
cumulative oil production Mb!
Belmont offshore annual oil decline!
aP oil !watercut %!
Jean Laherrere May 2016!

32
The POCS exploration and development activity has been cyclic as shown in this footage drilled. Exploration stopped in 1989 because banned!

33
There are 38 discoveries in the Pacific OCS but only 13 fields (12 oilfields) are in production BOEM 2014 provides a map showing OCS producing and undeveloped fields
The annual oil, NG & water productions are shown by BOEM with a sharp increase in water since 2001

34
BOEM reports annually reserves and production giving the breakdowns by field with annual & cumulative production as original and remaining reserves, but no updated synthesis and no data for 2004 to 2007 I found only this synthesis in the 2003 report where BOEM reports the OCS crude oil cumulative production, and also the proved reserves and the unproved reserves (now called contingent resources). “Recoverable reserves” is a pleonasm because reserves are what will be recovered in the future.
But BOEM field reserve estimate are reported from 1976 to 2003 as “estimated oil and gas reports“ and from 2007 to 2014 as “field reserves estimate summary reports. Nothing from 2004 to 2006! Out of the 38 discoveries (1965-1997) only 12 are producing oilfields discovered from 1966 to 1983. After the oil spill of 1969, there is a ban on new leasing in 1969 for State and in 1984 for federal waters. BOEM 2014 estimates the original proved reserves at 1606 Mb and the contingent resources (unproved) at 1307 Mb. But these unproved resources (now called contingent resource, meaning that there are not anymore reserves) have been there for decades and it appears that no one was ready to develop them, when oil price was high, because of the ban and because if no ban, people will object. California was shocked by the 1969 oil spill and again in May 2015 by an oil spill from a severely corroded pipeline (bad maintenance). However this 2015 Refugio oil spill represents less than few

35
days of Santa Barbara natural oil seeps (two thirds of the total load of petroleum hydrocarbons discharged into the sea come from natural seeps Kvenvolden 2002) The NIMBY (not in my back yard) behavior is the main reason for the rejection of the shale plays in many countries. It will work if offshore development is resumed. I doubt that these 1.3 Gb OCS contingent resources (being only 0.45 Gb in 1995) will be developed in California (preferring to buy oil from outside California) and my ultimate does not take them into account. Furthermore these 1.3 Gb resources are small in front of the CA oil remaining reserves at end 2015 (6 Gb) and are estimated by IHS being less than half. The undeveloped fields display a large increase in BOEM reserves in 1997, but not in IHS reserves. The B field is reported with 696 Mb by BOEM 2008 and 275 Mb by IHS 2010
Because a new oil spill (3400 b) near Refugio State Beach on May 2015 from the Plains All American Pipeline, the Venoco platform Holly (South Elwood field) was closed, followed by 3 Exxon platforms. The OCS well monthly production by EIA displays a sharp decrease by half on June 2015 staying low on the last ten months (March 2016).
0!
100!
200!
300!
400!
500!
600!
700!
800!
900!
1000!
1100!
1200!
1300!
1400!
1965! 1970! 1975! 1980! 1985! 1990! 1995! 2000! 2005! 2010! 2015!
Mb!
year!
California OCS proved & unproved reserves!unproved reserves or contingent resources BOEM!undevelopped reserves IHS!current proved remaining reserves BOEM!cumulative production !
Jean Laherrere May 2016!
B field disc 1965!original reserves !BOEM 2008 !696 Mb!IHS 2010 !275 Mb!

36
The sharp decrease in production after the oil spill is confirmed by BOEM data https://www.data.boem.gov/homepg/data_center/production/ocsprod.asp, but EIA sees a recovery in March 2016, when BOEM does not see anyone. Who is right?
Ban on oil exploration is there for decades. A bill was proposed to protect Pacific Coast from offshore drilling in 2015. Offshore fracking moratorium off CA coast was given by a court. A recent BOEM-BSEE 2016 study on 23 offshore platforms of POCS found no significant impact for the environment for the use of well stimulation treatments (WST). Obama administration in June 2016 approves fracking off the coast of California.
0!
1!
2!
3!
4!
5!
6!
7!
1980! 1985! 1990! 1995! 2000! 2005! 2010! 2015! 2020!
mon
thly
pro
duct
ion
Mb!
year!
Pacific OCS crude oil monthly production from EIA!
Jean Laherrere May 2016!
0,0!
0,5!
1,0!
1,5!
2015! 2016! 2017!
mon
thly
oil
prod
uctio
n!
year!
California OCS monthly production BOEM-EIA!
Mb/m BOEM!Mb/m EIA!
Jean Laherrere June2016!

37
Hubbert linearization of OCS annual crude oil production displays several linear trends with three ultimates being 750 Mb (1982-1990), 1100 Mb (1995-2001) and last trend towards less than 1600 Mb for 2005-2014, not far from the BOEM 2014 original proved reserves of 1606 Mb.
The OCS crude oil decline (annual versus cumulative production can be also extrapolated for the period 1995-2001 towards 1200 Mb and for the period 2002-2014 towards 1600 Mb.
0!
1!
2!
3!
4!
5!
6!
7!
8!
9!
10!
11!
12!
0! 200! 400! 600! 800! 1000! 1200! 1400! 1600! 1800!
aP/C
P%!
cumulative production Mb!
California OCS HL of crude oil production 1968-2015 !
aP/CP%!
1982-1990!
1995-2001!
2005-2015!
OR 2014 Mb!
Jean Laherrere May 2016!y 2016!
original proved reserves BOEM 2014 = 1606 Mb!
0!
10!
20!
30!
40!
50!
60!
70!
80!
0! 200! 400! 600! 800! 1000! 1200! 1400! 1600! 1800!
annu
al p
rodu
ctio
n M
b!
cumulative crude oil production Mb!
California OCS fed crude oil decline!
aP Mb!2002-2015!1995-2001!
Jean Laherrere May 2016!

38
After the sharp decline in 2015 because the oil spill, the annual OCS oil production is forecasted for an ultimate of 1600 Mb, assuming that oil production will return to normal mid 2016 (Venoco in bankruptcy reports 5 years!).
The OCS cumulative oil production is extrapolated for an ultimate of 1.6 Gb, in line with the original proved reserves and our
But out of the 38 discoveries found in the California OCS, only 13 are produced with proved reserves. The undeveloped fields are titled “unproved reserves” up to 2008 and since 2009 “contingent resources”. Since there is no production for these undeveloped fields, the original reserves are also the remaining reserves. I guess that these contingent resources will stay as
0!
10!
20!
30!
40!
50!
60!
70!
80!
1960! 1970! 1980! 1990! 2000! 2010! 2020! 2030! 2040! 2050!
annu
al p
rodu
ctio
n M
b!
year!
California OCS fed crude oil production & forecast ultimate = 1.6 Gb!
aP Mb!
U= 1600 Mb!
Jean Laherrere May 2016!
oil spills: -1969!-2015!
0!
200!
400!
600!
800!
1000!
1200!
1400!
1600!
1800!
2000!
2200!
2400!
2600!
2800!
3000!
1965! 1970! 1975! 1980! 1985! 1990! 1995! 2000! 2005! 2010! 2015! 2020! 2025! 2030! 2035! 2040! 2045!
cum
ulat
ive
prod
uctio
n &
er r
eser
ves M
b!
year!
California OCS cumulative oil production & original reserves!
original reserves 1998!original reserves = proved+unproved 2003!original proved reserves!cumulative production!U = 1.6 Gb!
Jean Laherrere May 2016!

39
resources for ever, being never developed because of CA NIMBY after the two oil spills due to bad practices. The most interesting graph and goal of this paper compares the backdated remaining proved reserves (at end 2014) with the current reserves, comparing BOEM, EIA, IHS and DOGGR data
EIA reserves data start in 1977 but does not report estimates from 1981 to 1984 and BOEM reserves data start in 1976 but miss from 2004 to 2006. It is amazing that it is not possible to find full data since the start of production in 1968 EIA did increase reserves in 1999 contrary to BOEM and BOEM did increase reserves in 2007 in contrary to EIA. Backdated (2014) remaining reserves did peak in 1982, when current EIA in 1987 and BOEM in 1989! It is a pity that BOEM does not (like for the Gulf of Mexico) include in their annual estimate of the Pacific federal oil and gas reserves the historical data. Their annual report is not the same as in the past. BOEM, which is not obliged to follow the financial rules of the SEC, has since 2009 changed reporting 2P (proved + probable) reserves as it id defined in SPE: this change should be applied for the past: it is not correct that BOEM does not report reserves for the years 2005 and 2006! DOGGR gave up reporting reserves in 2009, being since 1998 lower than EIA & BOEM But if current proved reserves diverge largely between BOEM, EIA and DOGGR (it is hard to understand why?), the closest data with the backdated BOEM is EIA since 2000 My 2011 paper in ASPO 9 Brussels «Backdating is the key » http://www.aspo9.be/assets/ASPO9_Wed_27_April_Laherrere.pdf http://aspofrance.viabloga.com/files/JL_ASPO2011.pdf shows the huge divergence between oil (confusion between crude oil and oil, with bitumen is not crude oil) current proved reserves and backdated reserves, in particular for Canada with for both items the same source being CAPP (Canadian Association of Petroleum Producers):
0!
100!
200!
300!
400!
500!
600!
700!
800!
900!
1000!
1100!
1200!
1300!
1400!
1965! 1970! 1975! 1980! 1985! 1990! 1995! 2000! 2005! 2010! 2015!
rem
aini
ng o
il re
serv
es M
b!
year!
California OCS oil current & backdated proved remaining reserves!
backdated BOEM 2014!backdated IHS 2010!current proved BOEM!current proved EIA!estimated res DOGGR!
Jean Laherrere May 2016!
out of 38 discoveries (1965-1997), 12 producing oilfields discovered from 1966 to 1983!
no proved reserves data from BOEM for 2005 to 2006!jump in 2007 = 2P?!

40
when my first graph on the same subject for the world conventional oil in 1998 Scientific American “ The end of cheap oil” was from heterogeneous sources needing many corrections.
being updated in 2016:
0,0!
1,3!
2,5!
3,8!
5,0!
6,3!
7,5!
8,8!
10,1!
11,3!
12,6!
13,8!
0,0!
0,2!
0,4!
0,6!
0,8!
1,0!
1,2!
1,4!
1,6!
1,8!
2,0!
2,2!
2,4!
1945! 1950! 1955! 1960! 1965! 1970! 1975! 1980! 1985! 1990! 1995! 2000! 2005! 2010!
Gb!
rem
mai
ning
res
erve
s G.m
3!
year!
Canada remaining crude oil reserves:! backdated 2009 or current at year end!
backdated 2009 established crude oil CAPP!current established crude oil CAPP!current proved oil OGJ/EIA!current proven oil WO!current proven oil BP!
Jean Laherrere Feb 2011!
OGJ 2009 175 Gb!BP 2009 33 Gb!WO 2008 27 Gb !
http://www.capp.ca/library/statistics/handbook/Pages/statisticalTables.aspx !

41
The divergence between the economists relying on official proved remaining reserves (in brown), which increase since 1950 and the technicians who know that the confidential backdated crude oil (excluding extra-heavy) reserves (in green) have peaked in 1980. My 2016 paper “US oil production at end 2015” http://aspofrance.org/files/JL_2016USoilultimate.pdf displays the GOM backdated 2P and current 1P remaining reserves from BOEM papers, reporting 1P reserves on updated reserves published every year since 1994, but since 2010 2P reserves. The problem of the GOM is that be cause confidentiality many fields are missing (10% art end 1998 from 1998 edition (984 fields) compared to 2014 edition (1088 fields)): it is not the case for California because the small number of fields (38) and the end of offshore leasing in 1984.
0!
200!
400!
600!
800!
1000!
1200!
1400!
1600!
1800!
1920! 1930! 1940! 1950! 1960! 1970! 1980! 1990! 2000! 2010! 2020!
rem
aini
ng r
eser
ves G
b!
year!
World remaining oil reserves !from political/financial and technical sources!
technical = backdated 2P excl XH!technical 2P SciAm 1998! current 1P reserves EIA/OGJ!
Jean Laherrere Feb 2016! Sources: IHS, USDOE, CAPP, API, OGJ !
-omission of probable!-incorrect aggregation!
Ghawar!
including tarsands!+200 Gb Venezuela!+175 Gb Canada!
OPEC fight for quotas!+300 Gb = speculative resources al-Husseini!
excluding 215 Gb Orinoco from 1936 to 1939!
first production Orinoco 1979!Athabasca 1967!!
WEO 2015 t3.4 remaining!conventional recoverable resources 2228 Gb?!proved 1706 Gb!
OGJ proved at end 2015 on 7 Dec 2015 issue! 1656 Gb!
1700 fields missing compared to 2011!
0!
1!
2!
3!
4!
5!
6!
7!
8!
9!
10!
1945!1950!1955!1960!1965!1970!1975!1980!1985!1990!1995!2000!2005!2010!2015!2020!
Gb!
year!
US GOM remaining crude oil reserves!
remaining 2P BOEM2014 reserves!EIA current proved crude oil!EIA crude + lease condensate!
Jean Laherrere April 2016!

42
-OCS fields -Beta field
The main OCS fields are plotted with Beta field (discovery 1976) with an ultimate close to 115 Mb
The oil decline is extrapolated since its peak of 1987 towards 115 Mb, despite a crooked display since 1998!
-Carpentaria field The Carpentaria oil field covers State and OCS waters, and its production peaked in 1969 but its decline is erratic
0!
30!
60!
90!
120!
150!
180!
210!
240!
0!
1!
2!
3!
4!
5!
6!
7!
8!
1980! 1990! 2000! 2010! 2020! 2030!
cum
ulat
ive
prod
uctio
n &
rese
rves
Mb!
annu
al p
rodu
ctio
n M
b!
year!
California OCS Beta 1976 field oil production!
annual prod!
cum prod!
BOEM original reserves!
OGJ original reserves!
Jean Laherrere May 2016!
0!
1!
2!
3!
4!
5!
6!
7!
8!
0! 10! 20! 30! 40! 50! 60! 70! 80! 90! 100! 110! 120!
annu
al p
rodu
ctio
n M
b!
cumulative production Mb!
California OCS Beta 1976 field oil decline!
aP 1981-2014!
ultimate!
Jean Laherrere May 2016!

43
-Dos Cuadras field The Dos Cuadras oil field displays decline after its peak at 1971 towards an ultimate of 280 Mb
0!
11!
22!
33!
44!
55!
66!
77!
88!
99!
110!
121!
0!
1!
2!
3!
4!
5!
6!
7!
8!
9!
10!
11!
1960! 1970! 1980! 1990! 2000! 2010! 2020!
cum
ulat
ive
prod
uctio
n &
rese
rves
Mb!
annu
al p
rodu
ctio
n M
b!
year!
California Carpentiera field 1966 (OCS+State water) oil production!
annual prod inc state waters OGJ!aP OCS BOEM!original oil reserves inc State w!cum prod inc state w OGJ!original reserves OCS BOEM!CP OCS BOEM!
Jean Laherrere May 2016!
0!
30!
60!
90!
120!
150!
180!
210!
240!
270!
300!
0!
3!
6!
9!
12!
15!
18!
21!
24!
27!
30!
1965! 1970! 1975! 1980! 1985! 1990! 1995! 2000! 2005! 2010! 2015! 2020!
cum
ulat
ive
prod
uctio
n &
rese
rves
Mb!
annu
al p
rodu
ctio
n M
b!
year!
California OCS Dos Cuadras 1969 field oil production!
annual prod!original reserves OGJ!original reserves BOEM!cum prod!
Jean Laherrere May 2016!

44
Again the backdated (BOEM 2014) Dos Cuadras remaining oil reserves are far from the current reserves from 1970 to 1982
-Hondo field The Hondo oil field found in 1969 started production in 1981 and displays two peaks in 1982 and in 1996. Original oil reserves were too low by OGJ and increased with the second peak.
0!
3!
6!
9!
12!
15!
18!
21!
24!
27!
30!
0! 50! 100! 150! 200! 250! 300!
annu
al p
rodu
ctio
n M
b!
cumulative production Mb!
California OCS Dos Cuadras 1969 field oil decline!
aP 1969-2014!
original reserves BOEM2014!
Jean Laherrere May 2016!
0!
30!
60!
90!
120!
150!
180!
210!
240!
270!
300!
1965! 1970! 1975! 1980! 1985! 1990! 1995! 2000! 2005! 2010! 2015! 2020!
annu
al p
rodu
ctio
n M
b!
year!
California OCS Dos Cuadras current reserves and backdated (2014) reserves!
RR curent proved!RR backdated 2014!
Jean Laherrere May 2016!

45
The Hondo oil decline trends towards the original reserves at 393 Mb, but it is not obvious for the last years
-Point Arguello field Point Arguello found in 1981 has a peak in 1991 and a steep decline followed by a smooth one. The current original reserves just after the peak was too optimistic and decreased sharply in 1997
0!
40!
80!
120!
160!
200!
240!
280!
320!
360!
400!
0!
2!
4!
6!
8!
10!
12!
14!
16!
18!
20!
1980! 1985! 1990! 1995! 2000! 2005! 2010! 2015! 2020! 2025! 2030!
cum
ulat
ive
prod
uctio
n &
rese
rves
Mb!
annu
al p
rodu
ctio
n M
b!
year!
California OCS Hondo 1969 field oil production!
annual prod!original reserves OGJ!original reserves BOEM!cum prod!
Jean Laherrere May 2016!
0!
2!
4!
6!
8!
10!
12!
14!
16!
18!
0! 50! 100! 150! 200! 250! 300! 350! 400!
annu
al p
rodu
ctio
n M
b!
cumulative production Mb!
California OCS Hondo oil decline!
aP1981-2014!
original reserves BOEM2014!
Jean Laherrere May 2016!

46
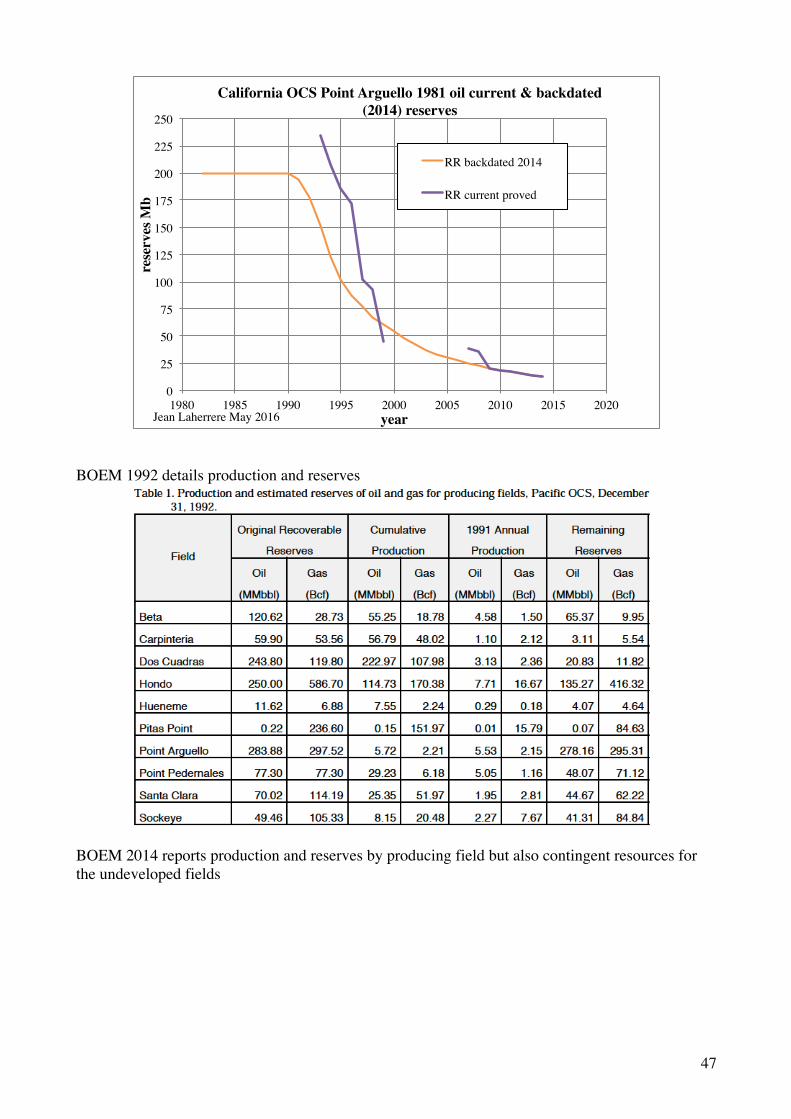
Point Arguello is close to exhaustion with an ultimate of 200 Mb
Backdated (2014) oil reserves declined sharply from 1990 to 2000, but less than the current ones.
0!
33!
66!
99!
132!
165!
198!
231!
264!
297!
330!
0!
3!
6!
9!
12!
15!
18!
21!
24!
27!
30!
1980! 1985! 1990! 1995! 2000! 2005! 2010! 2015! 2020!
cum
ulat
ive
prod
uctio
n &
rese
rves
Mb!
annu
al p
rodu
ctio
n M
b!
year!
California OCS Point Arguello 1981 field oil production!
annual prod!original reserves OGJ!original reserves BOEM!cum prod!
Jean Laherrere May 2016!
0!
3!
6!
9!
12!
15!
18!
21!
24!
27!
30!
0! 20! 40! 60! 80! 100! 120! 140! 160! 180! 200!
annu
al p
rodu
ctio
n M
b!
cumulative production Mb!
California OCS Point Arguello oil decline!
aP1981-2014!
original reserves BOEM 2014!
Jean Laherrere May 2016!
47
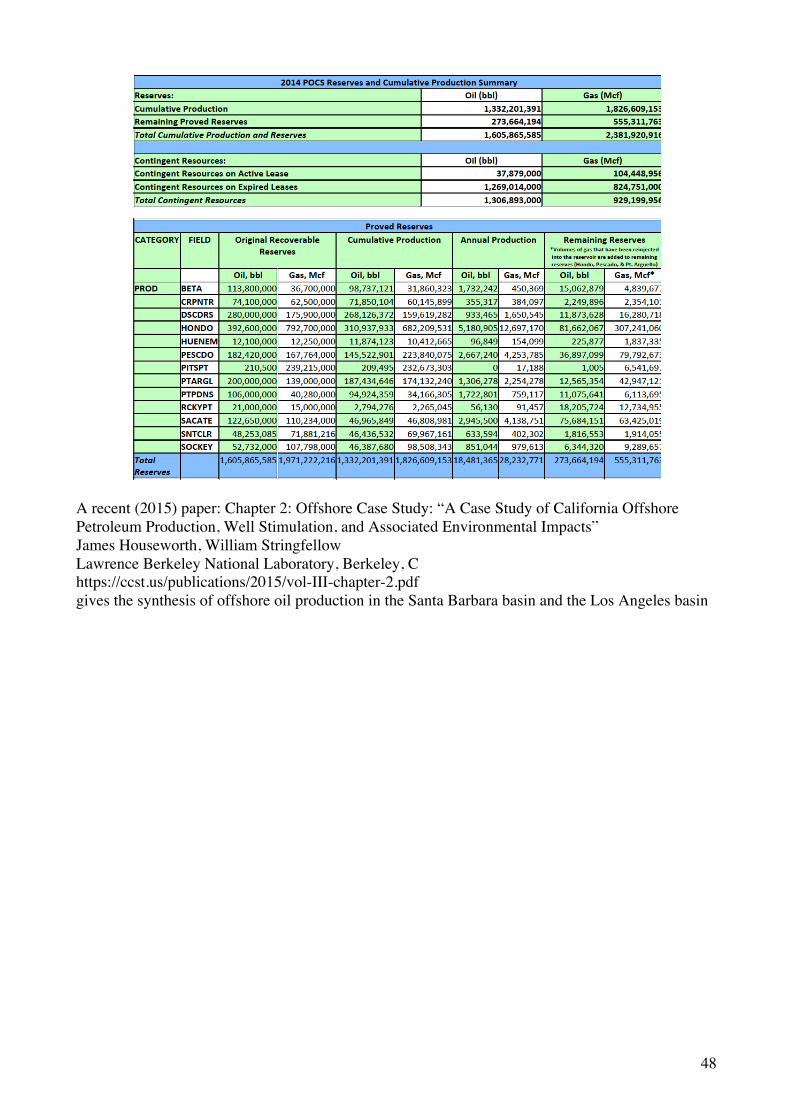
BOEM 1992 details production and reserves
BOEM 2014 reports production and reserves by producing field but also contingent resources for the undeveloped fields
0!
25!
50!
75!
100!
125!
150!
175!
200!
225!
250!
1980! 1985! 1990! 1995! 2000! 2005! 2010! 2015! 2020!
rese
rves
Mb!
year!
California OCS Point Arguello 1981 oil current & backdated (2014) reserves !
RR backdated 2014!
RR current proved!
Jean Laherrere May 2016!
48
A recent (2015) paper: Chapter 2: Offshore Case Study: “A Case Study of California Offshore Petroleum Production, Well Stimulation, and Associated Environmental Impacts” James Houseworth, William Stringfellow Lawrence Berkeley National Laboratory, Berkeley, C https://ccst.us/publications/2015/vol-III-chapter-2.pdf gives the synthesis of offshore oil production in the Santa Barbara basin and the Los Angeles basin

49
But it is amazing to find huge discrepancies with DOGGR data for cumulative production at end 2013 Houseworth reports 0,06 Mb for Rincon offshore cumulative oil production (quoting DOGGR!) when DOGGR reports 38 Mb and 157 Mb for Wilmington offshore when DOGGR reports 1534 Mb: it is huge discrepancies! DOGGR reports at end 2009 cumulative production and reserves when further annual reports provides only annual production: why to stop reporting reserves since 2010? The answer should be because DGOOR has realized that these reserves were very poor!

50
-Conclusions To forecast the future world oil production, it is necessary to study with great detail the historical oil productions and reserves of mature basins, with detail by fields. California oil production started in 1875 and CA DOGGR since 1915 provides annual and monthly reports with many details on oil and gas production. Unfortunately DOGGR does not report historical series and does not care about synthesis or to correct mistakes (some obvious ones). And it is the same with BOEM, USGS and EIA This paper has tried to reconstruct historical series of California offshore fields in order to obtain a graph of backdated and current remaining reserves. This study confirms that the remaining current oil proved reserves, which follow the SEC are financial estimates to protect bankers and shareholders, but are useless to forecast future production; Few people know that the aggregation of field proved reserves to get the proved reserves of the basin or of the country is incorrect, leading to a strong underestimating of the reality. The proved reserve growth, which pleases so many people, is due to this poor practice (imposed by the SEC).

51
The goal of this paper was to show that current proved oil remaining reserves are useless, DOGGR must be convinced of that, because since 2010 they do not report anymore oil reserves.