Embed Size (px)
Citation preview


Study Guide for
the New tradiNG for a LiviNG
The Wiley Trading series features books by traders who have survived the
market’s ever-changing environment and have prospered—some by reinvent-
ing systems, others by getting back to basics. Whether you are a novice trader,
professional or someone in-between, these books will deliver the advice and
strategies you need to prosper today and in the future. For more on this series,
visit our website at www.WileyTrading.com.
Founded in 1807, John Wiley & Sons is the oldest independent publishing
company in the United States. With offices in North America, Europe, Australia
and Asia, Wiley is globally committed to developing and marketing print and
electronic products and services for our customers’ professional and personal
knowledge and understanding.
Study Guide for
the New tradiNG for a
LiviNGPsychology • Discipline
Trading Tools and Systems Risk Control • Trade Management
Dr. Alexander Elder
www.elder.com www.spiketrade.com

Cover design: Paul DiNovo
Copyright © 2014 by by Dr. Alexander Elder. All rights reserved.
Published by John Wiley & Sons, Inc., Hoboken, New Jersey.
Published simultaneously in Canada.
No part of this publication may be reproduced, stored in a retrieval system, or transmitted in any form or by any means, electronic, mechanical, photocopying, recording, scanning, or otherwise, except as permitted under Section 107 or 108 of the 1976 United States Copyright Act, without either the prior written permis-sion of the Publisher, or authorization through payment of the appropriate per-copy fee to the Copyright Clearance Center, Inc., 222 Rosewood Drive, Danvers, MA 01923, (978) 750-8400, fax (978) 646-8600, or on the Web at www.copyright.com. Requests to the Publisher for permission should be addressed to the Permissions Department, John Wiley & Sons, Inc., 111 River Street, Hoboken, NJ 07030, (201) 748-6011, fax (201) 748-6008, or online at http://www.wiley.com/go/permissions.
Limit of Liability/Disclaimer of Warranty: While the publisher and author have used their best efforts in preparing this book, they make no representations or warranties with respect to the accuracy or completeness of the contents of this book and specifically disclaim any implied warranties of merchantability or fitness for a particular purpose. No warranty may be created or extended by sales representatives or written sales materi-als. The advice and strategies contained herein may not be suitable for your situation. You should consult with a professional where appropriate. Neither the publisher nor author shall be liable for any loss of profit or any other commercial damages, including but not limited to special, incidental, consequential, or other damages.
For general information on our other products and services or for technical support, please contact our Customer Care Department within the United States at (800) 762-2974, outside the United States at (317) 572-3993 or fax (317) 572-4002.
Wiley publishes in a variety of print and electronic formats and by print-on-demand. Some material included with standard print versions of this book may not be included in e-books or in print-on-demand. If this book refers to media such as a CD or DVD that is not included in the version you purchased, you may download this material at http://booksupport.wiley.com. For more information about Wiley products, visit www.wiley.com.
Library of Congress Cataloging-in-Publication Data:ISBN 978-1-118-46745-9 (Paperback)ISBN 978-1-118-98470-3 (ebk)ISBN 978-1-118-98471-0 (ebk)
Printed in the United States of America
10 9 8 7 6 5 4 3 2 1
C O N T E N T S
v
C O N T E N T S
About This Study Guide ix
PART I QueStioNS aNd ratiNG ScaLeS 1
Introduction 3
ONE Individual Psychology 7
TWO Mass Psychology 13
THREE Classical Chart Analysis 19
FOUR Computerized Technical Analysis 27
FIVE Volume and Time 37
SIX General Market Indicators 49
SEVEN Trading Systems 57
EIGHT Trading Vehicles 65
NINE Risk Management 71
TEN Practical Details 79
ELEVEN Good Record-Keeping 85
vi Contents
PART II aNSwerS aNd commeNtS 89
Introduction 91
ONE Individual Psychology 95
TWO Mass Psychology 99
THREE Classical Chart Analysis 103
FOUR Computerized Technical Analysis 107
FIVE Volume and Time 113
SIX General Market Indicators 119
SEVEN Trading Systems 123
EIGHT Trading Vehicles 129
NINE Risk Management 133
TEN Practical Details 137
ELEVEN Good Record-Keeping 141
Afterword 145Sources 147About the Author 149
A B O U T T H I S S T U D Y G U I D E
vii
Experienced traders seem to glide through the markets, swinging into and out of trades. Their trading appears effortless, like downhill skiing on TV. The
illusion of ease vanishes when you clamp on a pair of skis and discover the bumps on the slope. If you want to improve your trading skills, you have to work, study, and do your homework.
I created this Study Guide to help you grow and succeed as a trader. It is based on my years of experience as a trader and teacher of traders. The more you study the markets and your reactions to them, the more likely you are to succeed. You need to learn more about yourself as well as the markets—good traders always learn.
Each question in this Guide is linked to a specific chapter in The New Trading for a Living—psychology, risk management, indicators, and so on. Write down your answers and compare them with those in the book. When answering chart-related questions, cover each chart with a sheet of paper and move it slowly from left to right to imitate the unfolding of market action. Practice dealing with the uncertainty of the markets while working with this Guide.
This Guide asks questions and provides answers—but reasonable people may dis-agree with some of them. Trading is partly a science and partly an art—partly objec-tive and partly subjective. Let this Guide challenge you to think deeper about the markets and your reactions to them.
I am grateful to Henry Abelman and Jeff Parker, both repeat winners of SpikeTrade’s Eagle Eye award, for reviewing all questions and answers. Carol Keegan Kayne did the final check for clarity and precision.

viii ABOUT THIS STUDY GUIDE
Thanks to my former professors and students at the universities in Estonia and the United States for providing many opportunities to teach and develop my educational style. Thanks to the members of SpikeTrade.com, who keep sending me trading-related questions. Posting answers to them week after week keeps me on my toes.
I hope this Guide helps you to sharpen your skills and to become a better, more confident trader.
Dr. Alexander ElderNew York–Vermont, 2014

Study Guide for
the New tradiNG for a LiviNG


Questions and
Rating Scales
PA R T 1


3
Introduction
To win in trading, you must outperform masses of competitors. The majority must lose in order to pay those who win. To become a successful trader, you
must beat the odds against you. You must learn to think and act differently from the market crowd.
The New Trading for a Living contains several unorthodox trading ideas. The aim of this Introduction is to pause at the beginning of the journey and to see whether you are in tune with some of the unconventional thinking about trading.
Questions Trial 1 Trial 2 Trial 3 Trial 4 Trial 5
1
2
3
4
5
6
7
8
9
Correct answers
4 QUESTIONS
Question 0-1
Which of the following methods of making trading decisions can serve traders well in the long run?
I. Fundamental analysis II. Inside information III. Hunches and tips IV. Technical analysis
A. I and IIB. II and IIIC. I and IVD. III and IV
Question 0-2
Which of the following isn’t needed for trading success?
A. Trading psychologyB. Analytic methodC. Connections with market insidersD. Money management method
Question 0-3
The best approach to reading a book on trading is to
A. test all the ideas that interest you on your own market data.B. incorporate all the ideas in your work.C. not trust what you read—why would anyone share good trading ideas?D. ask other traders whether the ideas in the book worked for them.
Question 0-4
Which of the following is not a major cause of trading losses?
A. SlippageB. CommissionsC. Emotional tradingD. Theft
Question 0-5
Trader Jim and Trader John take the opposite sides of a trade. Both pay commis-sions, and both get hit with slippage. Trader Jim, the winner, collects $920, while Trader John, the loser, is out $1080. The result of this trade illustrates the fact that trading is a:
INTRODUCTION 5
A. Zero-sum gameB. Positive expectations gameC. Random WalkD. Minus-sum game
Question 0-6
You find a stock trading at $20 and plan to buy 100 shares. Your broker will charge a commission of $10. Which of the following statements is incorrect?
A. When dealing with thousands of dollars, don’t quibble about $10.B. You need to make 1% profit to avoid losing money on this trade.C. Using 50% margin, you need to make more than 2% profit to avoid losing money
on this trade.
Question 0-7
You place a market order to buy 100 shares of a rising stock that currently trades at $20. Your order gets filled at $20.08. Your slippage on the trade is
A. 80 centsB. $8C. $16D. $80
Question 0-8
The stock you bought in Question 7 rallied to $22. You expect the rally to continue but raise your stop to $21 to protect half of your paper profit. The stock sinks and hits your stop—you get filled at $20.88. Your slippage on this trade represents what percentage of your gross profit?
A. 5 percentB. 10 percentC. 25 percentD. 50 percent
Question 0-9
In the trade described in Questions 7 and 8, the trading industry took what percent-age of your gross gain?
A. 25 percentB. 50 percentC. 75 percentD. 100 percent

7
Your greatest danger in trading comes from the person holding this book—you. Our emotions often tip the scale between winning and losing. If you can stay
cool and make rational decisions, trading profits will follow.A professional trader is calm and collected. He knows what he’ll do if the market
goes up, down, or sideways. On days when he is not sure, he stays out, patiently monitoring the market from the sidelines. A pro feels in control.
If you feel giddy with joy when the market goes your way but freeze in fear when it swings against you, your actions will be emotional and your account will suffer. When the mind becomes clouded by greed or fear, even the best trading systems fly out the window. The questions that follow are designed to help you focus on trading psychology.
Individual Psychology
O N E
7
8 QUESTIONS
Questions Trial 1 Trial 2 Trial 3 Trial 4 Trial 5
1
2
3
4
5
6
7
8
9
10
11
12
13
14
15
16
Correct answers
INDIVIDUAL PSYCHOLOGY 9
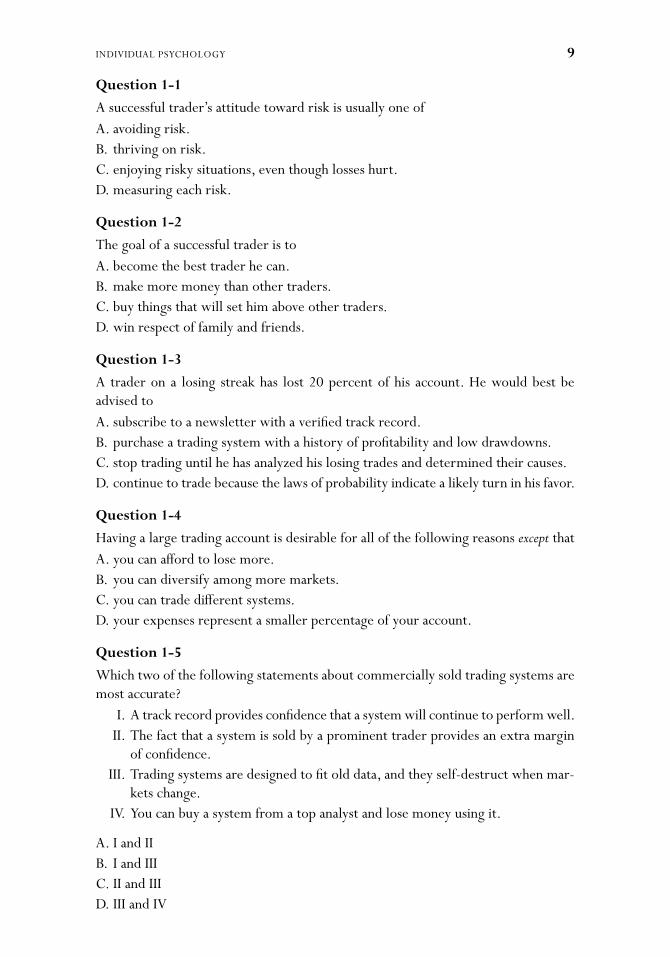
Question 1-1
A successful trader’s attitude toward risk is usually one ofA. avoiding risk.B. thriving on risk.C. enjoying risky situations, even though losses hurt.D. measuring each risk.
Question 1-2
The goal of a successful trader is toA. become the best trader he can.B. make more money than other traders.C. buy things that will set him above other traders.D. win respect of family and friends.
Question 1-3
A trader on a losing streak has lost 20 percent of his account. He would best be advised toA. subscribe to a newsletter with a verified track record.B. purchase a trading system with a history of profitability and low drawdowns.C. stop trading until he has analyzed his losing trades and determined their causes.D. continue to trade because the laws of probability indicate a likely turn in his favor.
Question 1-4
Having a large trading account is desirable for all of the following reasons except thatA. you can afford to lose more.B. you can diversify among more markets.C. you can trade different systems.D. your expenses represent a smaller percentage of your account.
Question 1-5
Which two of the following statements about commercially sold trading systems are most accurate? I. A track record provides confidence that a system will continue to perform well. II. The fact that a system is sold by a prominent trader provides an extra margin
of confidence. III. Trading systems are designed to fit old data, and they self-destruct when mar-
kets change. IV. You can buy a system from a top analyst and lose money using it.
A. I and IIB. I and IIIC. II and IIID. III and IV
10 QUESTIONS
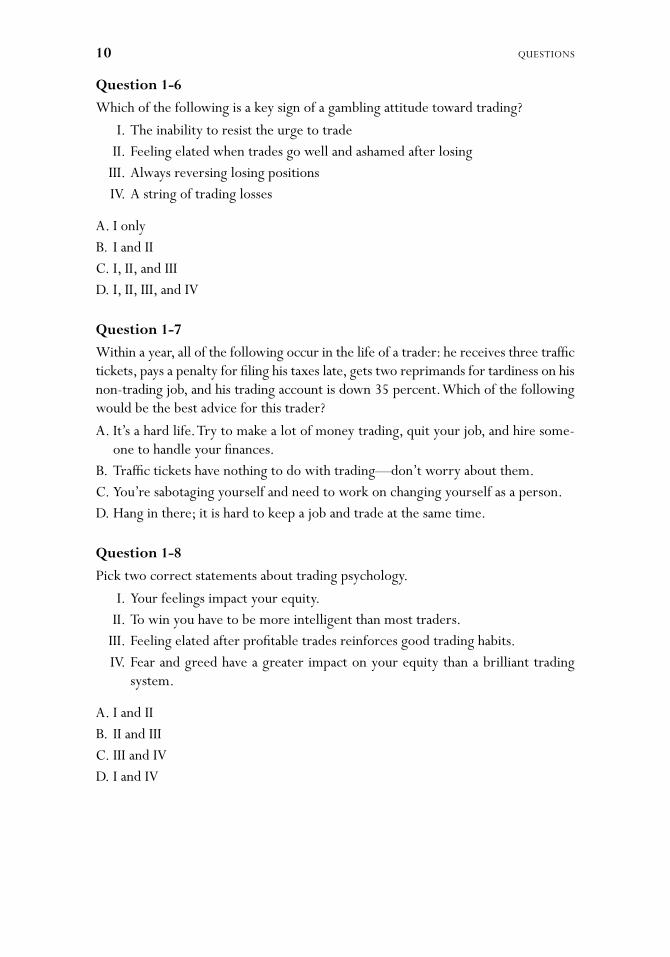
Question 1-6
Which of the following is a key sign of a gambling attitude toward trading?
I. The inability to resist the urge to trade II. Feeling elated when trades go well and ashamed after losing III. Always reversing losing positions IV. A string of trading losses
A. I onlyB. I and IIC. I, II, and IIID. I, II, III, and IV
Question 1-7
Within a year, all of the following occur in the life of a trader: he receives three traffic tickets, pays a penalty for filing his taxes late, gets two reprimands for tardiness on his non-trading job, and his trading account is down 35 percent. Which of the following would be the best advice for this trader?
A. It’s a hard life. Try to make a lot of money trading, quit your job, and hire some-one to handle your finances.
B. Traffic tickets have nothing to do with trading—don’t worry about them.C. You’re sabotaging yourself and need to work on changing yourself as a person.D. Hang in there; it is hard to keep a job and trade at the same time.
Question 1-8
Pick two correct statements about trading psychology.
I. Your feelings impact your equity. II. To win you have to be more intelligent than most traders. III. Feeling elated after profitable trades reinforces good trading habits. IV. Fear and greed have a greater impact on your equity than a brilliant trading
system.
A. I and IIB. II and IIIC. III and IVD. I and IV
INDIVIDUAL PSYCHOLOGY 11
Question 1-9
You’ve made a series of successful trades in recent months. Now is the time to
I. congratulate yourself and increase the size of your positions. II. use fewer stops. III. take a vacation. IV. realize that you have become a competent trader and can spend less time
studying the markets.
A. I and IIB. II and IVC. I and IIID. III and IV
Question 1-10
The main similarity between a losing trader and an alcoholic is:
A. Losers are addicted to the excitement of trading the way alcoholics are addicted to alcohol.
B. Losers hide the extent of their losses from themselves and others, just as alcoholics hide how much they drink.
C. Losers try to trade their way out of a hole, just as alcoholics try to switch from liquor to wine.
D. All of the above
Question 1-11
The psychology of losers involves all of the following except that
A. Losers find trading very exciting, even when it leads to losses.B. Few losers recover after they destroy their accounts.C. Losers know that they have a personal problem with trading.D. Losers usually shoot for a “big win.”
Question 1-12
The first step in a losing trader’s recovery is to say,
A. “I need a better trading system.”B. “I must find a bull market.”C. “I need to learn a new trading method.”D. “I am a loser.”
12 QUESTIONS
Question 1-13
When a trader says, “My name is so-and-so and I am a loser” the result is
I. a fearful attitude toward trading. II. cutting losses short. III. avoidance of overtrading. IV. lower commissions and slippage.
A. I and IIB. II and IIIC. III and IVD. I and IV
Question 1-14
The most important factor in becoming a successful trader is
A. starting with a good-sized trading account.B. being able to learn from other successful traders.C. using written trading plans and avoiding emotional decisions.D. relying on useful skills in your business or professional background.
Question 1-15
If, after a year of trading, the markets seem mysterious to you, it is because
A. your trading behavior is impulsive.B. you lack good fundamental or technical information.C. your account is too small.D. the markets are chaotic (Random Walk).
Question 1-16
A trade begins when
A. the market appears overbought or oversold.B. an indicator gives you an entry signal.C. you decide to place a buy or sell order.D. a newsletter makes an attractive recommendation.

13
Mass Psychology
Whenever you buy or sell, you’re surrounded by a huge crowd of other buyers and sellers, many of whom are driven by greed and fear. The sum of their
orders creates huge waves of mass optimism and pessimism. Waves become tides that sweep the markets, causing prices to rise or fall. Crowds are extremely powerful—it makes no sense to fight them. Crowds are strong but primitive. Recognizing this will help you trade in the direction in which the crowd is running but hop off when a trend is about to end.
It is hard to remain objective when analyzing markets because crowds suck us in. Anyone who has attended a political rally or a big concert has felt the pull of the crowd.
Some questions in this chapter test your knowledge of the basic laws of crowd psychology. Others help you become aware of the impact of the trading crowd on your own feelings and judgment. Now is a good time to reflect on your reactions, rational or irrational, when you trade. Aim to relate your answers to the following questions to your trading experiences.
T W O

14 QUESTIONS
Questions Trial 1 Trial 2 Trial 3 Trial 4 Trial 5
1
2
3
4
5
6
7
8
9
10
11
12
13
Correct answers
MASS PSYCHOLOGY 15
Question 2-1
Price is
A. the intersection of supply and demand curves.B. the value of a trading vehicle.C. a reflection of company assets in the stock market or a demand for a commodity.D. the consensus of value of all market participants at the moment of the trade.
Question 2-2
Which of the following statements is incorrect?
A. Bulls bet that prices will rise; they try to buy as low as possible.B. Uncommitted traders put pressure on bulls and bears by their presence.C. The goal of a technical analyst is to forecast whether bulls or bears will win.D. Bears bet that prices will fall; they want to sell as high as possible.
Question 2-3
When you are unsure whether to buy or sell, it pays to
A. surf the net to find out what others are doing.B. trade a smaller size than usual.C. stay out of the market.D. seek advice from a currently “hot” guru.
Question 2-4
Any profits you make in trading come from
A. the brokers.B. the traders.C. the economy.D. the exchanges.
Question 2-5
When a person joins a crowd, he
I. becomes more impulsive and emotional. II. benefits from the strengths of others. III. trusts crowd leaders more than himself. IV. can leave the crowd when he wants to.
A. I and IIB. I and IIIC. II and IIID. II and IV
16 QUESTIONS
Question 2-6
People join crowds out of a
I. fear of uncertainty. II. lifelong habit. III. desire to be led by strong leaders. IV. search for comfort.
A. IB. I and IIC. I, II, and IIID. I, II, III, and IV
Question 2-7
Which of the following is correct?
I. Crowds are primitive; it is OK to use simple trading strategies. II. Being smarter than the crowd assures you of winning. III. A good trader feels elated when the market goes in his direction and depressed
when it goes against him. IV. Market crowds are almost always wrong.
A. IB. I and IIC. I, II, and IIID. I, II, III, and IV
Question 2-8
Identify the main leader of market trends.
A. Powerful financial interestsB. Prominent gurusC. Price itselfD. Fundamental changes in the economy
Question 2-9
Markets rise when
I. there are more buyers than sellers. II. buyers are more aggressive than sellers. III. sellers are afraid and demand a premium. IV. more shares or contracts are bought than sold.
MASS PSYCHOLOGY 17
A. I and IIB. II and IIIC. II and IVD. III and IV
Question 2-10
When the trend is down,
I. short sellers tend to increase their positions. II. longs tend to quit in disgust. III. longs agree to buy only at a steep discount. IV. short sellers are willing to sell at a lower price.
A. IB. I and IIC. I, II, and IIID. I, II, III, and IV
Question 2-11
A price shock during an uptrend
I. is a sudden jump in price. II. is a sudden drop in price. III. makes bulls feel vulnerable. IV. frightens the bears.
A. I and IIIB. II and IIIC. II and IVD. I and IV
Question 2-12
A price shock interrupts a rally, but prices recover. When they rise to a new peak, several indicators reach a lower peak. This pattern is called a
A. bullish divergence.B. sudden drop in price.C. bearish divergence.D. sudden rise in price.

18 QUESTIONS
Question 2-13
The main goals of a trader are to
I. identify the current trend. II. forecast prices in the near future. III. forecast long-term prices. IV. stay objective and unemotional.
A. I and IIB. I and IVC. II and IIID. III and IV
19
Classical Chart Analysis
The original chartists had a revolutionary idea—to use price and volume data rather than fundamental factors for deciding what and when to buy and sell.
Each fundamental analyst has to specialize in a fairly narrow field. Technical analy-sis, on the contrary, is universal. Once you understand the principles of charting, you can apply them to stocks, bonds, currencies, futures, or any other market. As the number of trading vehicles around the globe increases, technical analysis is becoming more popular.
As long as you have the data on high, low, opening, and closing prices, along with that on volume and open interest, you can make intelligent judgments about the balance of power between bulls and bears in any market. Then you can trade in the direction of the dominant market group.
In this chapter you’ll be asked to make trading decisions using charts. It’s relatively easy to recognize patterns in the middle of a chart, but good trading signals are much harder to identify near the right edge. That’s where you’ll have to make your trading decisions—amid the uncertainty, noise, and tension of the markets.
T H R E E
20 QUESTIONS
Questions Trial 1 Trial 2 Trial 3 Trial 4 Trial 5
1
2
3
4
5
6
7
8
9
10
11
12
13
Correct answers
CLASSICAL CHART ANALYSIS 21
Question 3-1
Match the following two sets of statements regarding prices.
I. The high of the day II. The low of the day III. The closing price IV. The opening price
A. Amateurs’ opinionB. Professionals’ opinionC. Maximum power of bullsD. Maximum power of bears
Question 3-2
Three analysts look at the same chart. One argues that the trend is up, the other that the trend is down, and the third that the trend is sideways. In all probability,
I. one or two of them may be guilty of wishful thinking. II. they may not have agreed on the basic definition of a trend. III. they may be looking at different timeframes. IV. if each did a better job, all three would agree.
A. IB. I and IIC. I, II, and IIID. I, II, III, and IV
Question 3-3
When trying to enter a liquid market on a quiet day, you are likely to encounter
A. higher slippage.B. higher commissions.C. lower slippage.D. lower commissions.
22 QUESTIONS
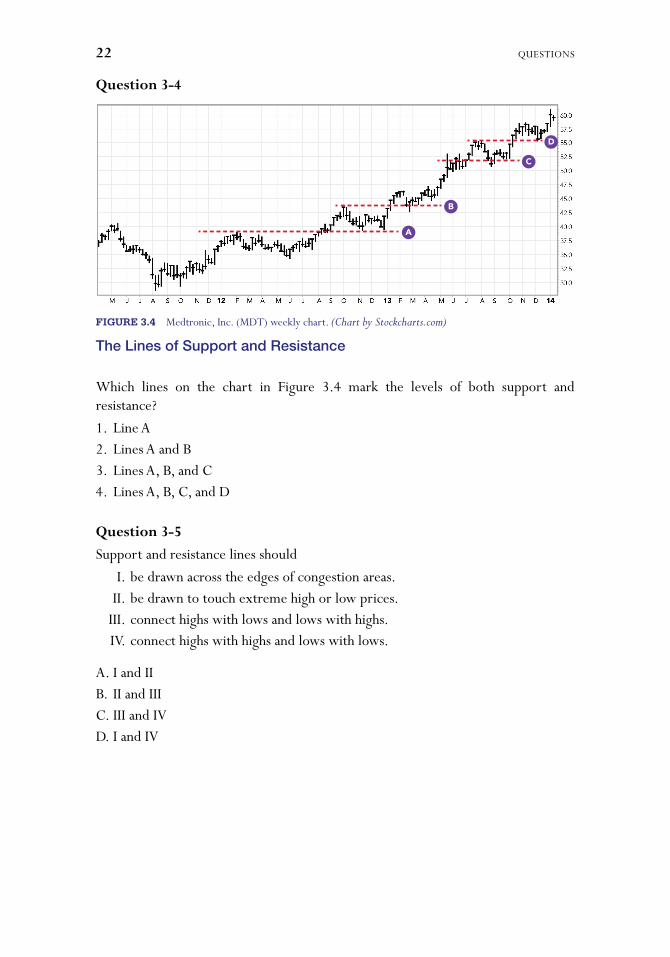
Question 3-4
Which lines on the chart in Figure 3.4 mark the levels of both support and resistance?
1. Line A2. Lines A and B3. Lines A, B, and C4. Lines A, B, C, and D
Question 3-5
Support and resistance lines should
I. be drawn across the edges of congestion areas. II. be drawn to touch extreme high or low prices. III. connect highs with lows and lows with highs. IV. connect highs with highs and lows with lows.
A. I and IIB. II and IIIC. III and IVD. I and IV
A
B
C
D
FIGURE 3.4 Medtronic, Inc. (MDT) weekly chart. (Chart by Stockcharts.com)
The Lines of Support and Resistance
CLASSICAL CHART ANALYSIS 23
Question 3-6
The strength of support and resistance depends on
I. the number of times prices hit that area. II. the volume of trading in that area. III. the height of that area. IV. the length of time prices spent in that area.
A. IB. I and IIC. I, II, and IIID. I, II, III, and IV
Question 3-7
Prices spend several weeks in a congestion area and then drop below support. Which of the following trading choices should be considered on the following day?
I. Sell short if prices fall to a new low, with a stop above yesterday’s high II. Go long if prices rally back into the congestion area, with a stop below yester-
day’s low III. Sell short at the opening IV. Go long at the opening
A. IB. I and IIC. I, II, and IIID. I, II, III, and IV
24 QUESTIONS
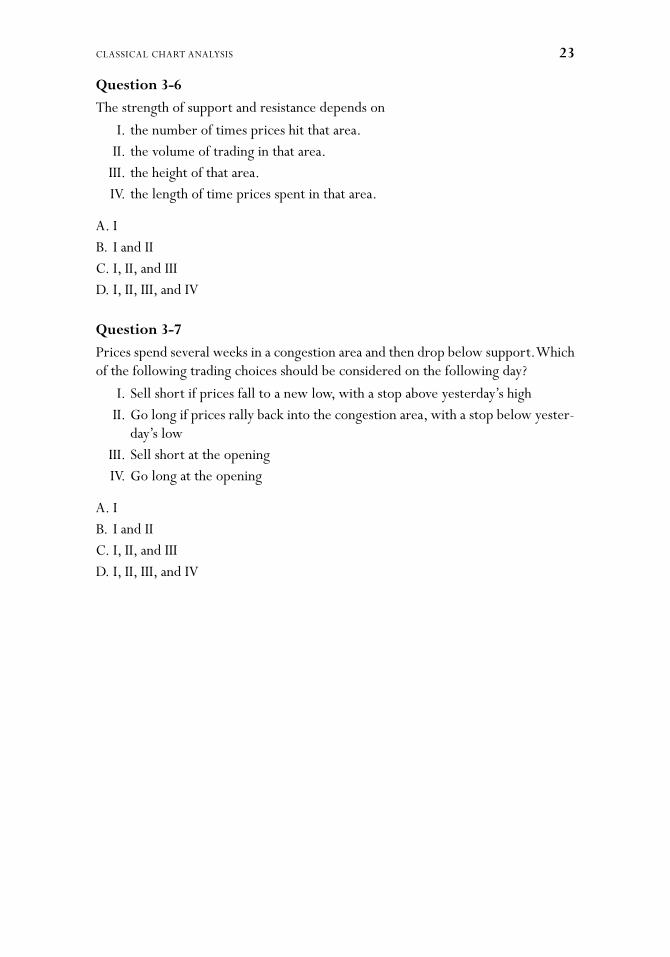
Question 3-8
Match the letters underneath the last four bars in the chart in Figure 3.8 to the fol-lowing statements.
I. A lower low and a lower close—monitor the downmove. II. Start moving up your stop. III. A false downside breakout—go long. IV. A breakout to a new low—monitor whether the downmove will continue.
Question 3-9
Mark the statements below with a T if they apply to trends and with an R if they apply to trading ranges:
A. Each rally reaches a higher high.B. Each decline stops at approximately the same level.C. Keep adding to your positions.D. Run at the first sign of a reversal.
A B C D
FIGURE 3.8 Walter Energy Inc. (WLT) daily. (Chart by Stockcharts.com)
A Congestion Zone
A B F
C DE
G
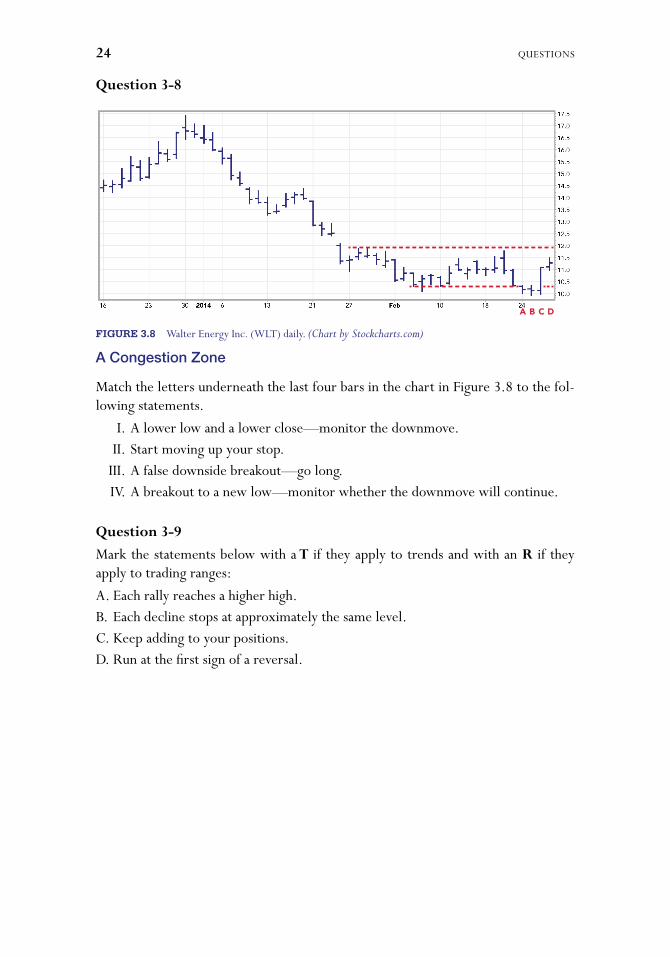
FIGURE 3.10 JetBlue Airways Corp. (JBLU) daily. (Chart by Stockcharts.com)
Decisions at Support and Resistance
CLASSICAL CHART ANALYSIS 25
Question 3-10
Match the areas marked by letters in the chart in Figure 3.10 to the following statements.
I. Inability to reach resistance indicates weakness—consider shorting. II. Inability to reach support indicates strength—consider buying. III. Hitting resistance—sell. IV. False upside breakout—go short.
Question 3-11
Which of the following tactics work well in uptrends?
I. Buy breakouts to new highs. II. Buy pullbacks into support. III. Buy when profits on your previous long position are protected by a stop. IV. Buy when prices take out the previous low.
A. IB. I and IIC. I, II, and IIID. I, II, III, and IV
26 QUESTIONS
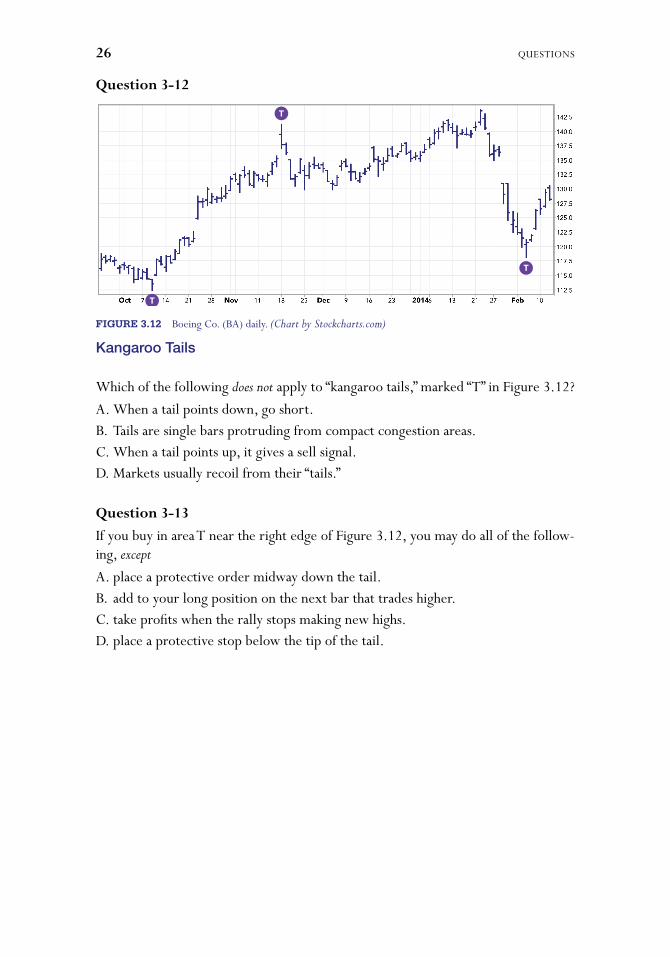
Question 3-12
Which of the following does not apply to “kangaroo tails,” marked “T” in Figure 3.12?
A. When a tail points down, go short.B. Tails are single bars protruding from compact congestion areas.C. When a tail points up, it gives a sell signal.D. Markets usually recoil from their “tails.”
Question 3-13
If you buy in area T near the right edge of Figure 3.12, you may do all of the follow-ing, except
A. place a protective order midway down the tail.B. add to your long position on the next bar that trades higher.C. take profits when the rally stops making new highs.D. place a protective stop below the tip of the tail.
T
T
T
FIGURE 3.12 Boeing Co. (BA) daily. (Chart by Stockcharts.com)
Kangaroo Tails

27
Today it would be unusual to see an analyst or a trader who doesn’t use a com-puter. The dropping cost of equipment, software, and data has evened out the
playing field between individuals and institutions.A computer can help you process the torrent of market information and make
your analysis more objective, but it is only a tool. Buying the best car will not auto-matically turn a beginning driver into an expert. In this section, you’ll test yourself to see how well you’ve mastered the lessons on computerized market analysis. If you own technical analysis software, please feel free to use it while answering questions in this chapter.
Computerized Technical Analysis
F O U R
28 QUESTIONS
Questions Trial 1 Trial 2 Trial 3 Trial 4 Trial 5
1
2
3
4
5
6
7
8
9
10
11
12
13
14
15
16
17
18
19
20
21
22
Correct answers
COMPUTERIZED TECHNICAL ANALYSIS 29
Question 4-1
Computerized technical analysis
I. is more objective than classical charting. II. allows traders to forecast the future. III. removes emotions from trading. IV. assures success in trading.
A. IB. I and IIC. I, II, and IIID. I, II, III, and IV
Question 4-2
Match the following three types of software with their descriptions:
I. Gray box II. Toolbox III. Black box
A. You feed this program current market data and receive specific buy and sell signals.B. Same as above, but you can choose indicator settings.C. A collection of charting tools and indicators.
Question 4-3
Match the following three main groups of technical indicators with their descriptions:
I. Oscillators II. Trend-following indicators III. Miscellaneous indicators
A. Provide insights into mass psychology of the markets.B. Catch turning points in flat markets but give premature and dangerous signals
when the markets begin to trend.C. Work best when markets are moving but give bad signals when the markets
are flat.
Question 4-4
A stock has closed at 23, 22, 21, 20, 23, and 24 during the past 6 days. What is its 5-day simple moving average on the last day?
A. 21B. 22C. 23D. None of the above
30 QUESTIONS
Question 4-5
Exponential moving averages work better than simple MAs for all of the following reasons, except that EMAs
A. are easier to calculate by hand.B. respond to changes in prices faster.C. do not jump in response to old data.D. track the mass mood of the crowd more closely.
Question 4-6
The most important message of an exponential moving average is
A. the width of its time window.B. its ability to rise to a new peak.C. its ability to fall to a new low.D. the direction of its slope.
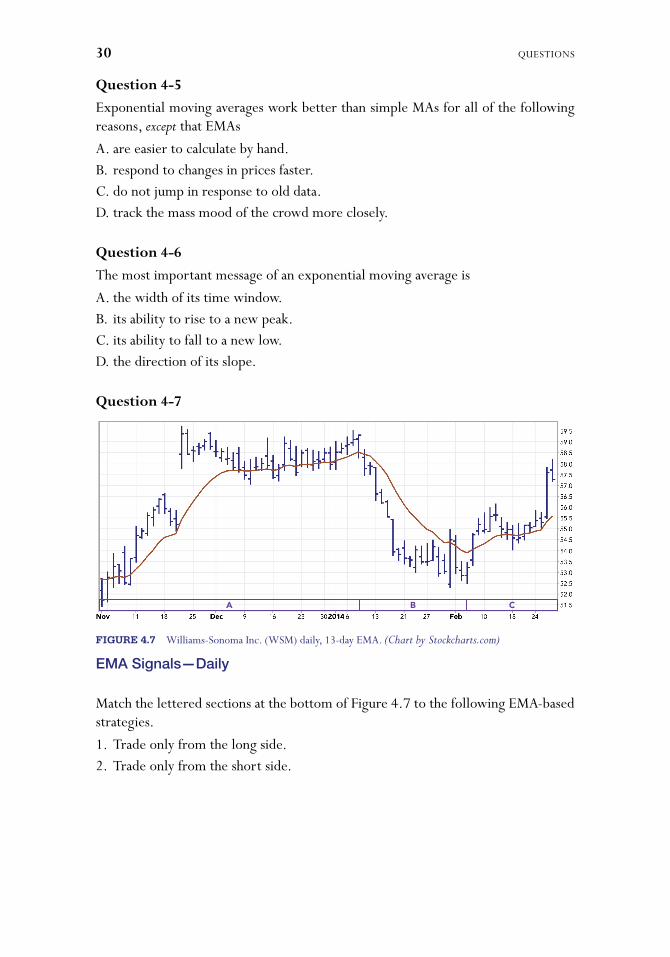
Question 4-7
Match the lettered sections at the bottom of Figure 4.7 to the following EMA-based strategies.
1. Trade only from the long side.2. Trade only from the short side.
A B C
FIGURE 4.7 Williams-Sonoma Inc. (WSM) daily, 13-day EMA. (Chart by Stockcharts.com)
EMA Signals—Daily
COMPUTERIZED TECHNICAL ANALYSIS 31
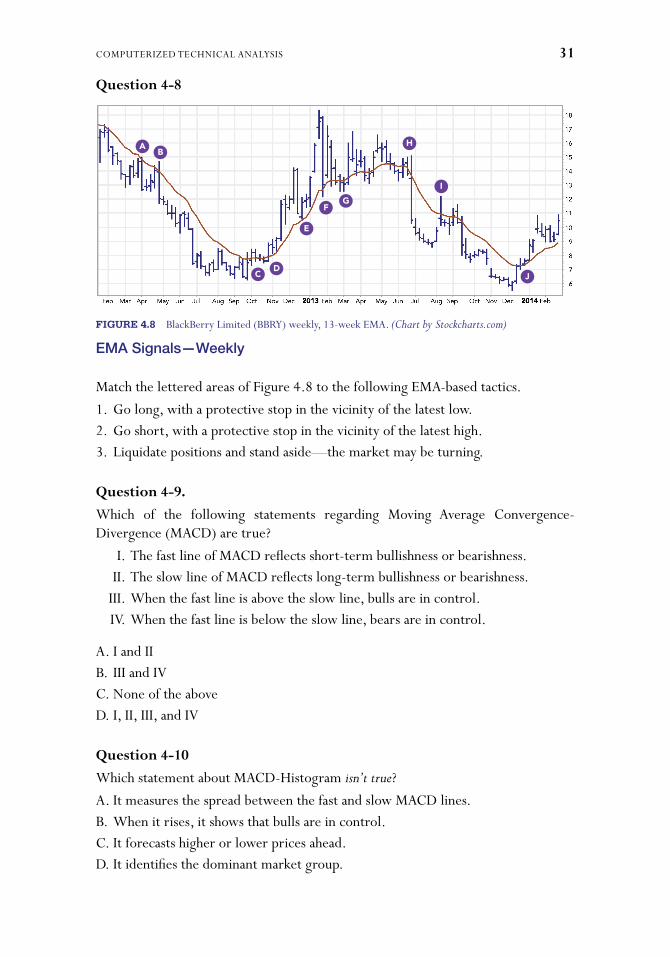
Question 4-8
Match the lettered areas of Figure 4.8 to the following EMA-based tactics.
1. Go long, with a protective stop in the vicinity of the latest low.2. Go short, with a protective stop in the vicinity of the latest high.3. Liquidate positions and stand aside—the market may be turning.
Question 4-9.
Which of the following statements regarding Moving Average Convergence- Divergence (MACD) are true?
I. The fast line of MACD reflects short-term bullishness or bearishness. II. The slow line of MACD reflects long-term bullishness or bearishness. III. When the fast line is above the slow line, bulls are in control. IV. When the fast line is below the slow line, bears are in control.
A. I and IIB. III and IVC. None of the aboveD. I, II, III, and IV
Question 4-10
Which statement about MACD-Histogram isn’t true?
A. It measures the spread between the fast and slow MACD lines.B. When it rises, it shows that bulls are in control.C. It forecasts higher or lower prices ahead.D. It identifies the dominant market group.
AB
CD
E
FG
H
I
J
FIGURE 4.8 BlackBerry Limited (BBRY) weekly, 13-week EMA. (Chart by Stockcharts.com)
EMA Signals—Weekly
32 QUESTIONS
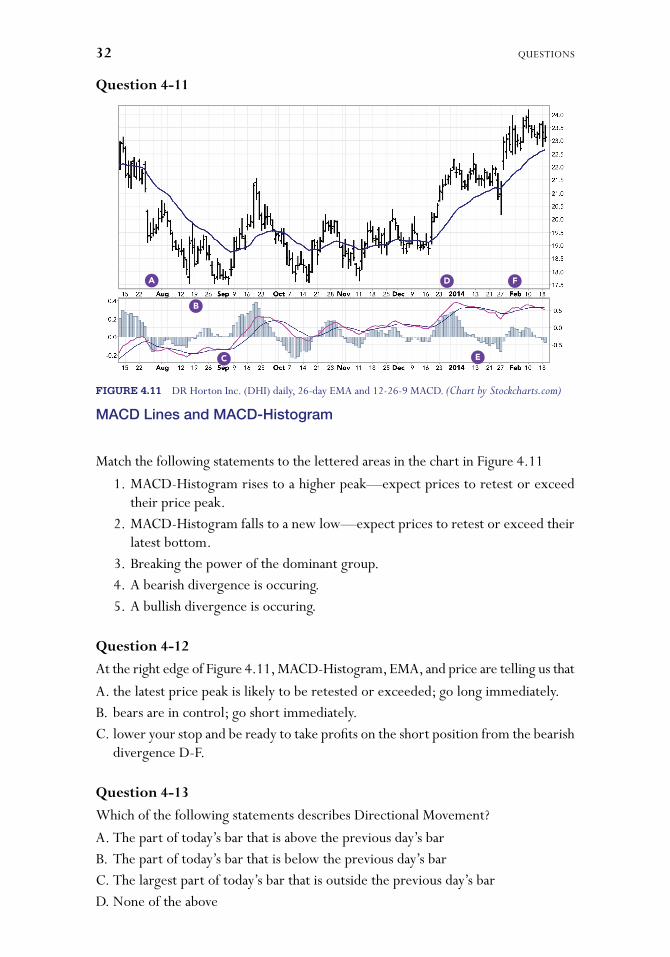
Question 4-11
Match the following statements to the lettered areas in the chart in Figure 4.11
1. MACD-Histogram rises to a higher peak—expect prices to retest or exceed their price peak.
2. MACD-Histogram falls to a new low—expect prices to retest or exceed their latest bottom.
3. Breaking the power of the dominant group. 4. A bearish divergence is occuring. 5. A bullish divergence is occuring.
Question 4-12
At the right edge of Figure 4.11, MACD-Histogram, EMA, and price are telling us that
A. the latest price peak is likely to be retested or exceeded; go long immediately.B. bears are in control; go short immediately.C. lower your stop and be ready to take profits on the short position from the bearish
divergence D-F.
Question 4-13
Which of the following statements describes Directional Movement?
A. The part of today’s bar that is above the previous day’s barB. The part of today’s bar that is below the previous day’s barC. The largest part of today’s bar that is outside the previous day’s barD. None of the above
A
B
C
D F
E
FIGURE 4.11 DR Horton Inc. (DHI) daily, 26-day EMA and 12-26-9 MACD. (Chart by Stockcharts.com)
MACD Lines and MACD-Histogram
COMPUTERIZED TECHNICAL ANALYSIS 33
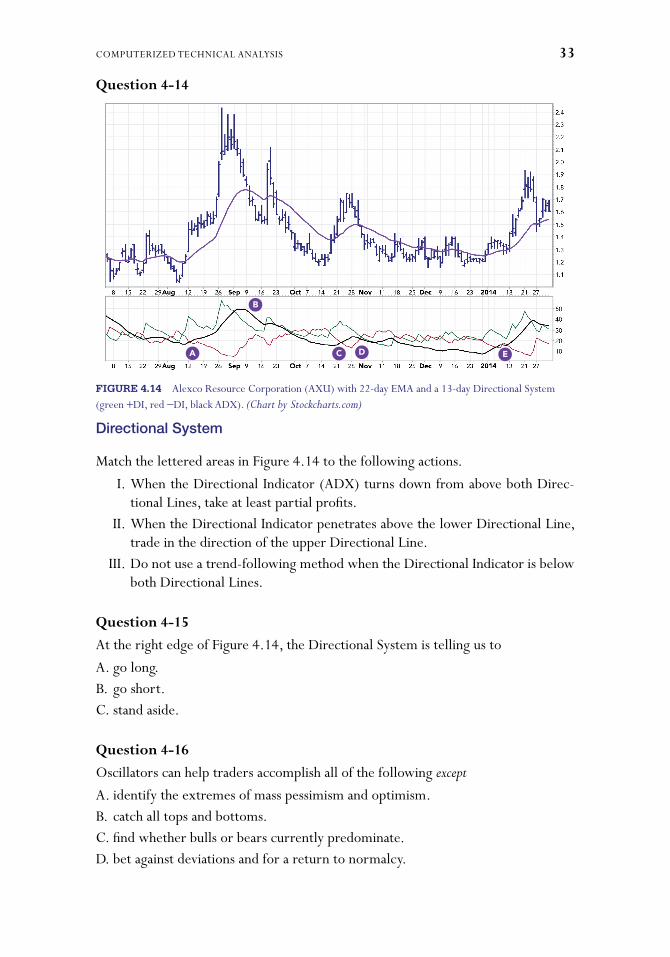
Question 4-14
Match the lettered areas in Figure 4.14 to the following actions.
I. When the Directional Indicator (ADX) turns down from above both Direc-tional Lines, take at least partial profits.
II. When the Directional Indicator penetrates above the lower Directional Line, trade in the direction of the upper Directional Line.
III. Do not use a trend-following method when the Directional Indicator is below both Directional Lines.
Question 4-15
At the right edge of Figure 4.14, the Directional System is telling us to
A. go long.B. go short.C. stand aside.
Question 4-16
Oscillators can help traders accomplish all of the following except
A. identify the extremes of mass pessimism and optimism.B. catch all tops and bottoms.C. find whether bulls or bears currently predominate.D. bet against deviations and for a return to normalcy.
A
B
C D E
FIGURE 4.14 Alexco Resource Corporation (AXU) with 22-day EMA and a 13-day Directional System (green +DI, red −DI, black ADX). (Chart by Stockcharts.com)
Directional System

34 QUESTIONS
Question 4-17
When an oscillator reaches its highest peak in several months, which of the following is least likely?
A. The rally is likely to pause.B. Prices are likely to rise to a higher high.C. Long positions can be held.D. Prices are likely to drop.
Question 4-18
Match the letters in Figure 4.18 to the following formations of Stochastic:
1. Overbought 2. Oversold 3. Bullish divergence 4. Bearish divergence 5. Failure swing
Question 4-19
At the right edge of Figure 4.18, the trading message of Stochastic is:
A. Stochastic is overbought; go short.B. Stochastic is rising; go long.C. The downtrend is still in force; go short.D. Stochastic is neutral; stand aside.
A
B
C D
E FH
IG J
FIGURE 4.18 Leapfrog Enterprises Inc. (LF) with 26-day EMA and 7/3 Slow Stochastic. (Chart by Stockcharts.com)
Stochastic
COMPUTERIZED TECHNICAL ANALYSIS 35
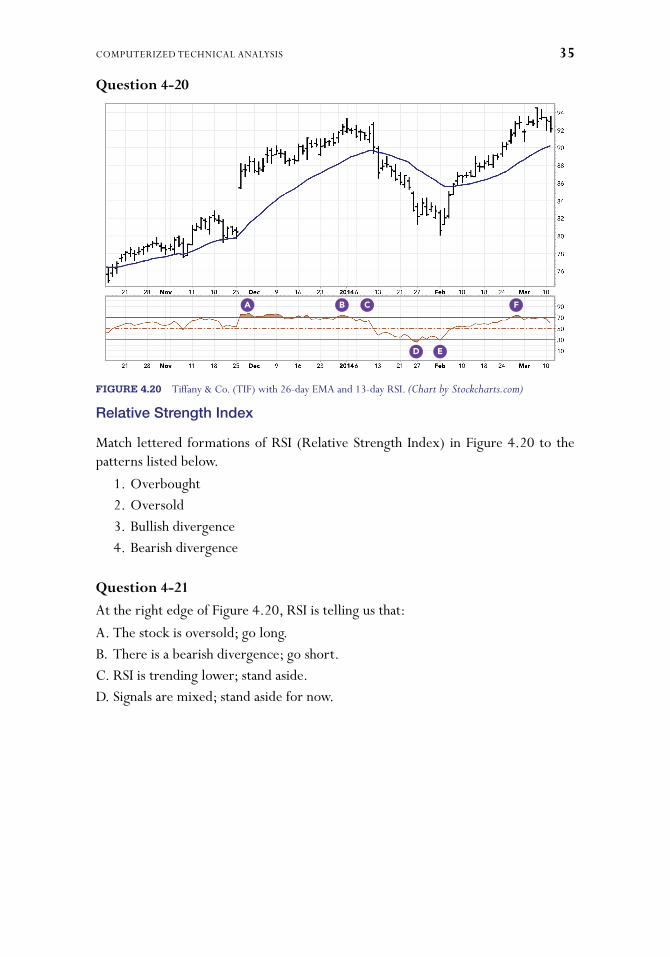
Question 4-20
Match lettered formations of RSI (Relative Strength Index) in Figure 4.20 to the patterns listed below.
1. Overbought 2. Oversold 3. Bullish divergence 4. Bearish divergence
Question 4-21
At the right edge of Figure 4.20, RSI is telling us that:
A. The stock is oversold; go long.B. There is a bearish divergence; go short.C. RSI is trending lower; stand aside.D. Signals are mixed; stand aside for now.
A B C F
D E
FIGURE 4.20 Tiffany & Co. (TIF) with 26-day EMA and 13-day RSI. (Chart by Stockcharts.com)
Relative Strength Index
36 QUESTIONS
Question 4-22
With the market in a downtrend, an oscillator, such as Stochastic or RSI, identifies
I. shorting opportunities. II. selling areas. III. buying opportunities. IV. short-covering areas.
A. I and IIB. III and IVC. I, II, III, and IVD. None of the above
37
Beginners watch only prices. It's easy to become hypnotized by stocks moving up and down.
Experienced analysts gain a much deeper understanding of the markets by in-cluding volume in their analysis. In addition, price changes need to be linked to the length of time it took for them to occur. All trading decisions have to be made by analyzing more than one timeframe.
This chapter also reviews open interest, a measure relevant only for the deriva-tives markets, such as futures or options. If you don’t trade derivatives and don’t wish to study open interest, skip questions 5–7, 5–8, and 5–9 and add three points to your score.
Volume and Time
F I V E
38 QUESTIONS
Questions Trial 1 Trial 2 Trial 3 Trial 4 Trial 5
1
2
3
4
5
6
7
8
9
10
11
12
13
14
15
16
17
18
19
Correct answers
VOLUME AND TIME 39
Question 5-1
Volume reflects all of the following except:
A. How market participants will react to future price changesB. How many winners and losers are active in the marketC. Whether masses of losers are staying put or runningD. The degree of emotional involvement among traders
Question 5-2
The market has been rising for several months in an orderly pattern of rallies and shallow declines; a new rally is in progress. Match the following pairs of statements concerning this rally’s volume:
1. Volume is slightly higher than during the previous rally. 2. Volume is double what it was during the previous rally. 3. Volume is half of what it was during the previous rally. 4. Volume is approximately the same as it was during the previous rally.
A. Bears are panicking; take at least partial profits on long positions.B. The uptrend is healthy; hold longs or add to them.C. The uptrend is running out of steam; take at least partial profits on long positions.D. The uptrend is healthy; hold longs.
40 QUESTIONS
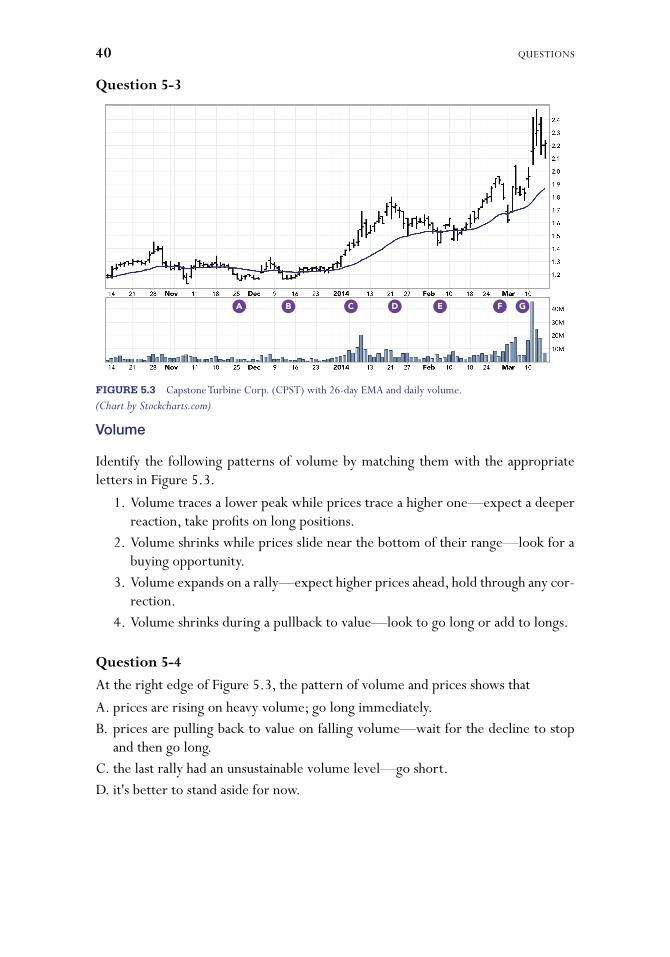
Question 5-3
Identify the following patterns of volume by matching them with the appropriate letters in Figure 5.3.
1. Volume traces a lower peak while prices trace a higher one—expect a deeper reaction, take profits on long positions.
2. Volume shrinks while prices slide near the bottom of their range—look for a buying opportunity.
3. Volume expands on a rally—expect higher prices ahead, hold through any cor-rection.
4. Volume shrinks during a pullback to value—look to go long or add to longs.
Question 5-4
At the right edge of Figure 5.3, the pattern of volume and prices shows that
A. prices are rising on heavy volume; go long immediately.B. prices are pulling back to value on falling volume—wait for the decline to stop
and then go long.C. the last rally had an unsustainable volume level—go short.D. it's better to stand aside for now.
A B C D E F G
FIGURE 5.3 Capstone Turbine Corp. (CPST) with 26-day EMA and daily volume. (Chart by Stockcharts.com)
Volume
VOLUME AND TIME 41
Question 5-5
Which one of the following statements is correct? On-Balance Volume (OBV)
I. confirms bear moves when it falls to a new low. II. tracks the running total of traders’ emotional commitments. III. often reaches a new peak before a new peak in price. IV. rises whenever the market closes lower.
A. IB. I and IIC. I, II, and IIID. I, II, III, and IV
Question 5-6
Match statements about Accumulation/Distribution from the following two sets.
1. Prices open below the previous day’s close and close lower. 2. Prices open above the previous day’s open and close higher. 3. Prices open above the previous day’s close, but close at the lows. 4. Prices open below the previous day’s close, but close at the highs.
A. Amateurs relatively bearish, professionals relatively bullishB. Amateurs relatively bullish, professionals relatively bearishC. Amateurs and professionals bullishD. Amateurs and professionals bearish
Question 5-7
The Chicago Board of Trade reports that open interest in soybeans stands at 300,000 contracts. This means that
A. 150,000 contracts are held by the longs and 150,000 owed by the shorts.B. 300,000 contracts are held by the longs and 300,000 owed by the shorts.C. 600,000 contracts are held by the longs and 600,000 owed by the shorts.D. there isn’t enough information to tell who holds how many contracts.
42 QUESTIONS
Question 5-8
Match the following actions with their impact on open interest.
1. A trader who is long sells to another who is short. 2. A new bear enters the market and sells short to an earlier bear who buys to
cover his shorts. 3. A new bull enters the market and buys from an earlier bull who sells his
position. 4. A new buyer and a new seller trade with each other.
A. Open interest increases.B. Open interest decreases.C. Open interest stays unchanged.
Question 5-9
Rising open interest shows that
1. bulls are confident and aggressive. 2. the supply of losers is growing. 3. the trend is likely to continue. 4. bears are confident and aggressive.
A. 1B. 1 and 2C. 1, 2, and 3D. 1, 2, 3, and 4
Question 5-10
As prices change, which factors reflect the force of their move?
1. The amount of price change 2. Volume of trading during that move 3. Direction of the move 4. Related markets
A. 1B. 1 and 2C. 1, 2, and 3D. 1, 2, 3, and 4
VOLUME AND TIME 43
Question 5-11
The Force Index formula is
A. Closetoday
• (Volumetoday
− Volumeyesterday
)B. Close
today • (Volume
today + Volume
yesterday)
C. Volumetoday
• (Closetoday
+ Closeyesterday
)D. Volume
today • (Close
today − Close
yesterday)
Question 5-12
Why smooth Force Index with a moving average?
I. The histogram of the daily Force Index is too jagged. II. A 2-day EMA of Force Index helps find entry points into trades. III. A 13-day EMA of Force Index helps find major shifts in the force of bulls and
bears. IV. Divergences between the smoothed Force Index and prices help to identify
turning points in the markets.
A. IB. I and IIC. I, II, and IIID. I, II, III, and IV
44 QUESTIONS
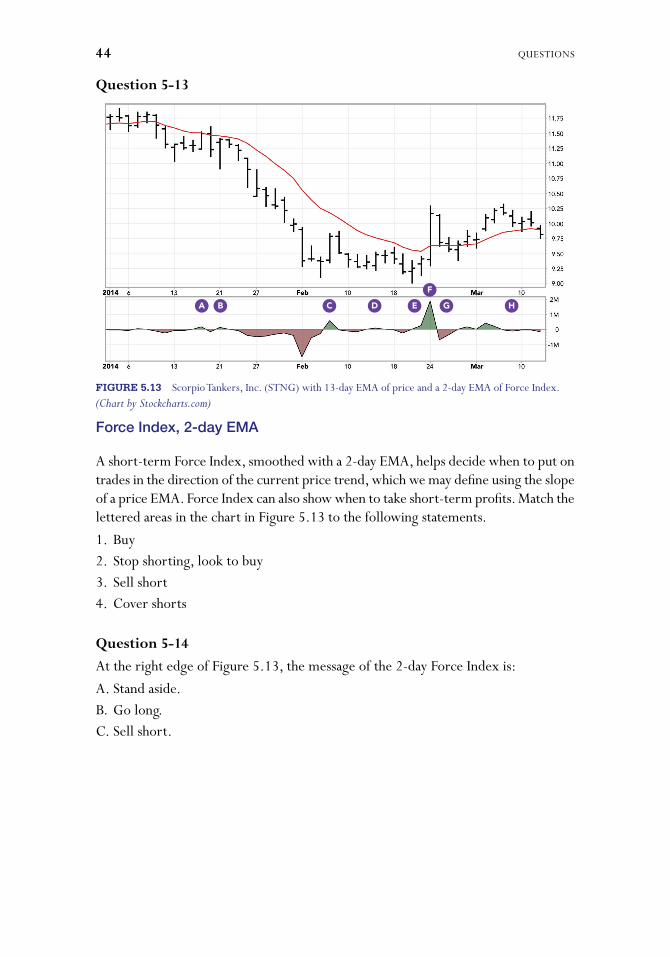
Question 5-13
A short-term Force Index, smoothed with a 2-day EMA, helps decide when to put on trades in the direction of the current price trend, which we may define using the slope of a price EMA. Force Index can also show when to take short-term profits. Match the lettered areas in the chart in Figure 5.13 to the following statements.
1. Buy2. Stop shorting, look to buy3. Sell short4. Cover shorts
Question 5-14
At the right edge of Figure 5.13, the message of the 2-day Force Index is:
A. Stand aside.B. Go long.C. Sell short.
A B C D E G H
F
FIGURE 5.13 Scorpio Tankers, Inc. (STNG) with 13-day EMA of price and a 2-day EMA of Force Index. (Chart by Stockcharts.com)
Force Index, 2-day EMA
VOLUME AND TIME 45
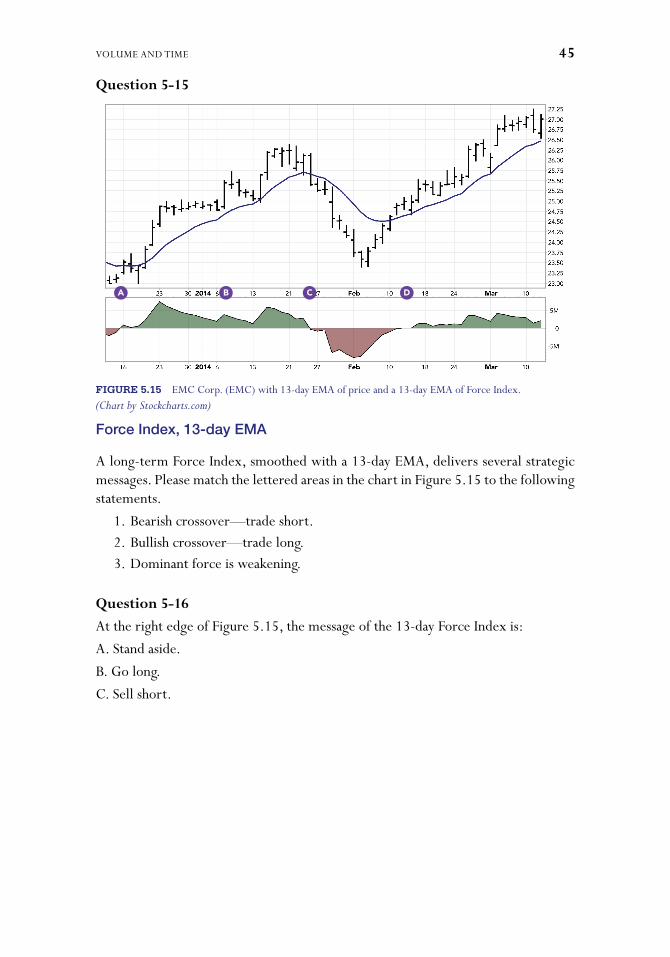
Question 5-15
A long-term Force Index, smoothed with a 13-day EMA, delivers several strategic messages. Please match the lettered areas in the chart in Figure 5.15 to the following statements.
1. Bearish crossover—trade short. 2. Bullish crossover—trade long. 3. Dominant force is weakening.
Question 5-16
At the right edge of Figure 5.15, the message of the 13-day Force Index is:
A. Stand aside.
B. Go long.
C. Sell short.
A B C D
FIGURE 5.15 EMC Corp. (EMC) with 13-day EMA of price and a 13-day EMA of Force Index. (Chart by Stockcharts.com)
Force Index, 13-day EMA
46 QUESTIONS
Question 5-17
The presence of cycles in market data depends on
1. changes in the economic fundamentals. 2. greed in good times and fear in bad times among producers and consumers. 3. swings between pessimism and optimism among traders. 4. planetary influences.
A. 1B. 1 and 2C. 1, 2, and 3D. 1, 2, 3, and 4
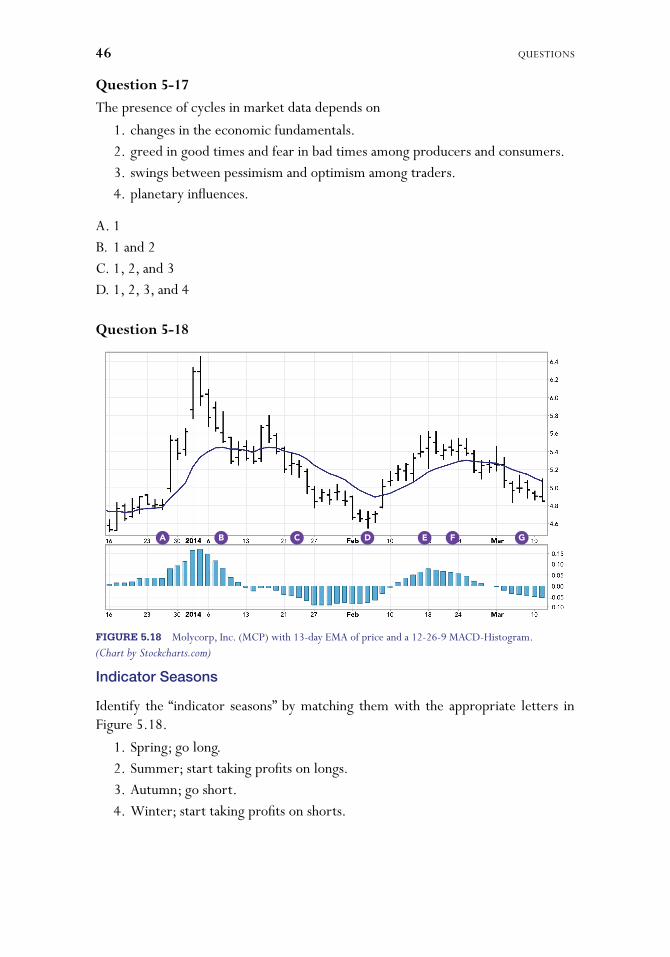
Question 5-18
Identify the “indicator seasons” by matching them with the appropriate letters in Figure 5.18.
1. Spring; go long. 2. Summer; start taking profits on longs. 3. Autumn; go short. 4. Winter; start taking profits on shorts.
A B C D E F G
FIGURE 5.18 Molycorp, Inc. (MCP) with 13-day EMA of price and a 12-26-9 MACD-Histogram. (Chart by Stockcharts.com)
Indicator Seasons

VOLUME AND TIME 47
Question 5-19
Traders can analyze markets in greater depth by looking at them in two timeframes. Which of the following combinations makes the most sense?
A. Weekly and dailyB. Monthly and dailyC. Yearly and dailyD. Yearly and weekly

49
Markets consist of huge crowds of traders whose buying and selling create waves of mass optimism and pessimism. The resulting price trends lure in bystand-
ers, and their buying and selling reinforces those trends, driving them to unsustain-able extremes. Fundamental economic factors may rule the markets in the long run, but mass psychology determines intermediate- and short-term trends.
Several indicators take the pulse of the market crowd in stocks and futures. The indicators that analyze the stock market as a whole are especially useful for trad-ing stock index futures and options. Since the broad market trends influence most stocks, those signals also help stock traders.
General market indicators are especially important to those who trade in the United States, where several advisory services track them. Overseas traders could profit from developing similar tools in their own countries.
S I X
General Market Indicators

50 QUESTIONS
Questions Trial 1 Trial 2 Trial 3 Trial 4 Trial 5
1
2
3
4
5
6
7
8
9
10
11
12
Correct answers
GENERAL MARKET INDICATORS 51
Question 6-1
The New High–New Low Index (NH-NL)
1. measures the number of new highs on any given day. 2. tracks the number of the weakest stocks on the exchange. 3. measures the number of new lows on any given day. 4. tracks the number of the strongest stocks on the exchange.
A. 1 and 3B. 2 and 4C. 1, 2, 3, and 4D. None of the above
Question 6-2
Match the following NH-NL patterns with their market messages.
1. NH-NL is positive; rises to a new high for the move. 2. Stock market falls to a new low; NH-NL traces a higher bottom. 3. NH-NL is negative; declines to a new low for the move. 4. Stock market reaches a new peak; NH-NL traces a lower peak.
A. Bearish leadership is strong; trade from the short side.B. Bearish divergence shows that bulls are becoming weak; start taking profits on
long positions and look to go short.C. Bullish divergence shows that bears are becoming weak; start taking profits on
short positions and look to go long.D. Bullish leadership is strong; trade from the long side.
52 QUESTIONS
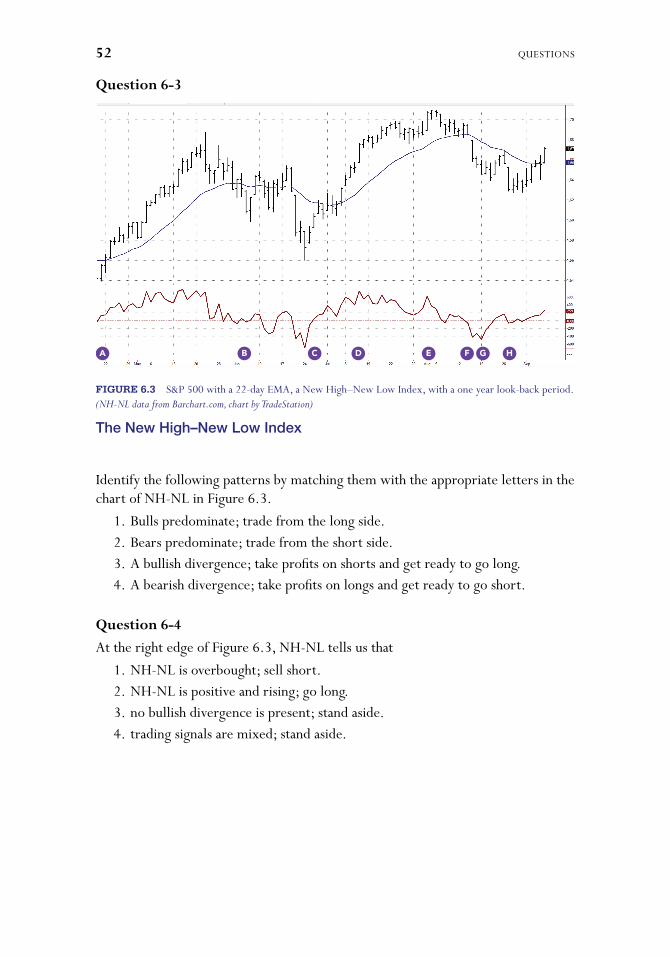
Question 6-3
Identify the following patterns by matching them with the appropriate letters in the chart of NH-NL in Figure 6.3.
1. Bulls predominate; trade from the long side. 2. Bears predominate; trade from the short side. 3. A bullish divergence; take profits on shorts and get ready to go long. 4. A bearish divergence; take profits on longs and get ready to go short.
Question 6-4
At the right edge of Figure 6.3, NH-NL tells us that
1. NH-NL is overbought; sell short. 2. NH-NL is positive and rising; go long. 3. no bullish divergence is present; stand aside. 4. trading signals are mixed; stand aside.
A B C D E F G H
FIGURE 6.3 S&P 500 with a 22-day EMA, a New High–New Low Index, with a one year look-back period. (NH-NL data from Barchart.com, chart by TradeStation)
The New High–New Low Index
Question 6-5
Which of the following statements apply to the Advance/Decline line?
1. It tracks the numbers of rising and falling stocks. 2. It indicates strength when it rises to a new high and weakness when it falls to a
new low. 3. The pattern of A/D peaks and valleys is more important than its level. 4. It shows when volume confirms price moves.
A. 1B. 1 and 2C. 1, 2, and 3D. 1, 2, 3, and 4
Question 6-6
When bullish consensus in the stock market rises to a record high, it shows that
1. the market is near a top; start selling and look for potential shorts. 2. the uptrend is strong; go long. 3. there aren’t enough new buyers to support the market. 4. you should double up on long positions.
A. 1B. 1 and 3C. 2D. 2 and 4
Question 6-7
During a powerful uptrend in copper futures, bullish consensus rises to 75 percent. This means that
A. an average bear has invested three times more money than an average bull.B. an average bear has invested approximately as much money as an average bull.C. an average bull has invested three times more money than an average bear.D. there is not enough information to decide who has invested more money.
Question 6-8
A rich corn harvest increases the supply and sends corn futures into a bear market. As prices grind their way down, bullish consensus falls to 20 percent. This means that
A. an average bull has invested five times more money than an average bear.B. an average bull has invested approximately as much money as an average bear.C. an average bear has invested four times more money than an average bull.D. an average bull has invested four times more money than an average bear.
GENERAL MARKET INDICATORS 53

54 QUESTIONS
Question 6-9
Your newspaper reports that coffee prices are at their highest level in six years; a TV news show features snow in coffee-growing Brazil; and your mother-in-law tells you she bought 10 lbs of instant coffee before prices rise any higher. Your response as a trader is to plan to
A. go long coffee futures or long calls.B. go short coffee futures or long puts.C. go long cocoa futures, as a play on a catch-up move with coffee.D. buy gold because the rise in coffee is a sign of inflation.
Question 6-10
Match the following statements about traders’ positions.
1. Position limits 2. Reporting requirements 3. Insider trading 4. Hedging
A. The level at which your trade gets reported to a government agencyB. Entering a futures trade in order to offset a position in an actual commodityC. Can be exceeded by commercialsD. Legal in the futures markets
Question 6-11
Match the following statements about different groups of market participants.
1. Small speculators 2. Large speculators 3. Commercials 4. Company insiders
A. Hold contracts in excess of reporting levelsB. Hedge business risksC. Officers and large stockholdersD. The group most likely to lose in the market

GENERAL MARKET INDICATORS 55
Question 6-12
A bear market is 11 months old; the company whose stock you follow reports lower quarterly earnings; its two vice presidents and a major shareholder buy its stock; the stock is $1 above its low for the year. As an investor, you
A. go short immediately (the bear market is in force).B. go long immediately (insider buying).C. stay away from the market until the next bull market starts.D. start building a long position.


A trading system provides a decision-making tree for setting entries, targets, and stops. It is a useful instrument but not a magic device that can be fine-tuned on
old data and then put on automatic for effortlessly pulling profits out of the markets.You develop a trading system in the quiet of your office, when the noise of the
markets has quieted down. A carefully crafted system becomes your island of stabil-ity and intelligence in the stormy environment of the market. A trusted system will help you maintain control at a time when the tide of mass emotion sweeps people off their feet.
This chapter will test your knowledge of several trading systems that have stood the test of time. While answering questions, consider whether to start trading with one of these systems or use them as a starting point for developing your own.
57
Trading Systems
S E V E N

58 QUESTIONS
Questions Trial 1 Trial 2 Trial 3 Trial 4 Trial 5
1
2
3
4
5
6
7
8
9
10
11
12
13
14
15
16
Correct answers
TRADING SYSTEMS 59
Question 7-1
Which of the following statements can be true at the same time in any given market?
I. The trend is up. II. The trend is down. III. An indicator gives a buy signal. IV. An indicator gives a sell signal.
A. I and IIIB. II and IVC. I, II, III, and IVD. None of the above
Question 7-2
When trying to find a trade on a daily chart,
A. focus all your attention on that chart.B. identify the trend of the weekly chart and use the daily chart to look only for
trades in the direction of the weekly trend.C. find a trade on the daily chart and check whether the weekly chart points in the
same direction.D. identify the trend of the monthly chart and use the daily chart to look only for
trades in that direction.
Question 7-3
When exploring a potential trading system, all of the following steps are essential, except
A. one-bar-at-a-time backtesting.B. forward-testing with small amounts of money.C. looking for feedback from other system users.D. keeping records of every trade.
Question 7-4
The essential numbers to write down before entering any trade include all of the following, except
A. the price or a range for your entry.B. the potential profit in dollars.C. the target for your trade.D. the protective stop.
60 QUESTIONS
Question 7-5
If you use the slope of the weekly MACD-Histogram as the first screen of the Triple Screen trading system and that slope is down, you may
I. Go long. II. Go short. III. Stand aside. IV. All of the above
A. I and IIIB. II and IIIC. IIID. IV
Question 7-6
The first screen of the Triple Screen trading system points up. If you use a 5-day Stochastic as your second screen and it rises to 85, you may
A. go long immediately.B. go short immediately.C. wait for Stochastic to decline below 40 and then go long.D. wait for Stochastic to decline below 40 and then go short.
Question 7-7
The weekly trend is up, but the decline of the past few days has pushed the 2-day EMA of Force Index, which you use as the second screen, below zero. Your next step is to
A. wait until both screens get in gear.B. place an order to buy above the previous day’s high.C. place an order to sell short below the previous day’s low.D. close out any open positions.
TRADING SYSTEMS 61
Question 7-8
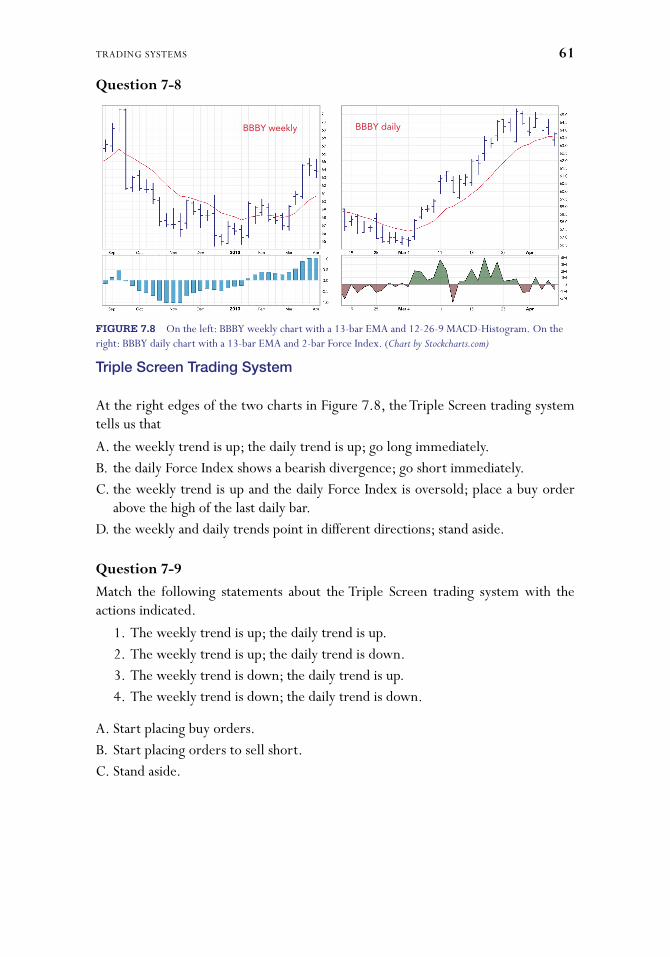
At the right edges of the two charts in Figure 7.8, the Triple Screen trading system tells us that
A. the weekly trend is up; the daily trend is up; go long immediately.B. the daily Force Index shows a bearish divergence; go short immediately.C. the weekly trend is up and the daily Force Index is oversold; place a buy order
above the high of the last daily bar.D. the weekly and daily trends point in different directions; stand aside.
Question 7-9
Match the following statements about the Triple Screen trading system with the actions indicated.
1. The weekly trend is up; the daily trend is up. 2. The weekly trend is up; the daily trend is down. 3. The weekly trend is down; the daily trend is up. 4. The weekly trend is down; the daily trend is down.
A. Start placing buy orders.B. Start placing orders to sell short.C. Stand aside.
BBBY weekly
FIGURE 7.8 On the left: BBBY weekly chart with a 13-bar EMA and 12-26-9 MACD-Histogram. On the right: BBBY daily chart with a 13-bar EMA and 2-bar Force Index. (Chart by Stockcharts.com)
Triple Screen Trading System
BBBY daily
62 QUESTIONS
Question 7-10
Which of the following statements regarding the Impulse system is incorrect?
A. The Impulse system tells traders when to buy or sell.B. The slope of a fast moving average reflects the direction of market inertia.C. The slope of the last two bars of MACD-Histogram reflects the direction of mar-
ket power.D. The Impulse system removes a prohibition of buying or shorting by changing its
color.
Question 7-11
Match the following indicator readings with the messages of the Impulse system.
1. EMA is rising, MACD-Histogram rising. 2. EMA is rising, MACD-Histogram falling. 3. EMA is falling, MACD-Histogram falling. 4. EMA is falling, MACD-Histogram rising.
A. Impulse system green (bullish)B. Impulse system red (bearish)C. Impulse system blue (neutral)
Question 7-12
A
B
C
D
E
F
G
H
I
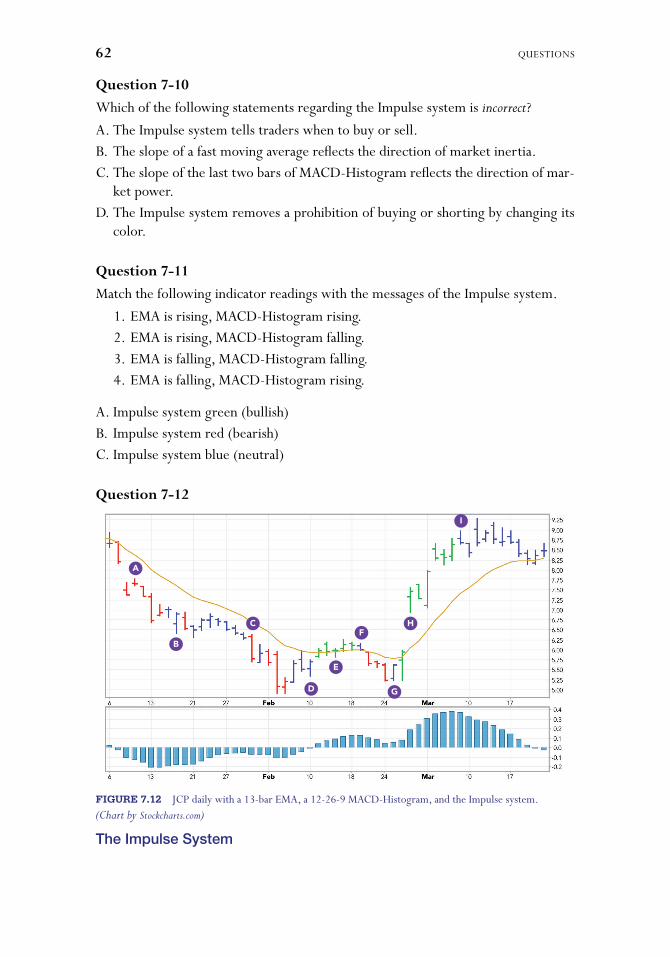
FIGURE 7.12 JCP daily with a 13-bar EMA, a 12-26-9 MACD-Histogram, and the Impulse system. (Chart by Stockcharts.com)
The Impulse System
TRADING SYSTEMS 63
Match the lettered bars in the chart in Figure 7.12 with the following statements.
1. Buying or standing aside permitted; shorting forbidden. 2. Shorting or standing aside permitted; buying forbidden. 3. Buying, shorting, or standing aside is permitted.
Question 7-13
Looking at the weekly chart of BBBY in Figure 7.8, what would be the color of its rightmost bar if we applied the Impulse system?
A. GreenB. RedC. BlueD. Not enough information to decide
Question 7-14
The correct width of a channel around a moving average
A. is a closely guarded secret of professional traders.B. contains all prices for the past 50 to 100 bars.C. contains about 90 percent of the prices for the past 50 to 100 bars.D. contains about half of the prices for the past 50 to 100 bars.
Question 7-15
Match statements regarding moving average channels from the following two sets.
1. The market is undervalued. 2. The market is overvalued. 3. Depends on volatility. 4. The market is fairly valued.
A. The upper channel lineB. The moving averageC. The lower channel lineD. Channel coefficient
64 QUESTIONS
Question 7-16
Which statement about channels is incorrect?
A. Going long or short in the middle of a channel always offers attractive trades be-cause you buy or sell at the consensus of value.
B. When a channel rises sharply, an upside penetration of the upper channel line indicates that the market is strong and should be bought when it returns to its moving average.
C. When a channel is relatively flat, the market is almost always a good buy near the bottom of its trading channel and a good sell near the top.
D. A breakout below the lower line of a sharply falling channel indicates that the mar-ket is weak and a pullback to the moving average will offer a shorting opportunity.

65
Some professionals say—“I don’t trade stocks, futures, or options; I trade money in my account.” They focus on system design and risk management, while what
they trade are just vehicles in which their money goes for a ride, hopefully in the right direction.1
You have an enormous choice of trading vehicles. Before you focus on a single class or even a smaller group within that class, it pays to know what other instru-ments are available to you.
This chapter will test your knowledge of several major classes of trading instru-ments. While answering questions, think about what you’re currently trading. You may even decide to broaden your attention and trade another type of instrument, and of course, you can always trade more than one type.
Trading Vehicles
1Several years ago, a Bedouin guide in Jordan asked me about my profession, and I told him I traded on Wall Street. He drove by the local market where his buddies traded goats, which, at about $300 apiece, were a major store of value in the desert. He asked whether I’d like to trade, but I laughed and said that if we brought his desert traders to Wall Street and showed them how to use comput-ers, they would out-trade many local guys.
E I G H T
66 QUESTIONS
Questions Trial 1 Trial 2 Trial 3 Trial 4 Trial 5
1
2
3
4
5
6
7
8
9
10
11
12
Correct answers
TRADING VEHICLES 67
Question 8-1
In selecting a trading instrument, which of the following is not a key consideration?
A. LiquidityB. VolatilityC. PopularityD. Time zones
Question 8-2
When buying a stock, you
A. make a loan to the company.B. become an insider.C. will profit if the company makes money.D. become a part owner of the company.
Question 8-3
How does Warren Buffett suggest dealing with “Mr. Market”?
I. Buy when Mr. Market is happy. II. Sell when Mr. Market is happy. III. Sell when Mr. Market is depressed. IV. Buy when Mr. Market is depressed.
A. IB. IIC. I and IIID. II and IV
Question 8-4
An exchange-traded fund (ETF) is an asset-holding vehicle, designed to trade like a stock. Which one of the following statements about ETFs is incorrect?
A. ETFs offer a narrow choice of assets.B. ETFs loosely track underlying securities.C. Administrative expenses of ETFs take ‘haircuts’ from profits.D. ETFs allow you to purchase an asset class or a stock group.

68 QUESTIONS
Question 8-5
Match the following sets of statements regarding stock options.
I. A bet that a stock will drop II. A bet that a stock will rise III. A call whose underlying stock is below the exercise price IV. A call whose underlying stock is above the exercise price
A. Out-of-the-money
B. Put
C. In-the-money
D. Call
Question 8-6
Option prices depend on all of the following, except
A. the closeness to the option expiration date.B. the closeness to the option exercise price.C. how closely the underlying stocks follows their industry group.D. the volatility of the underlying stocks.
Question 8-7
Match the following statements on calls and puts.
I. The price of the underlying stock rises. II. The price of the underlying stock falls. III. The price of the underlying stock remains flat.
A. Profitable for a call buyerB. Profitable for a put buyerC. Profitable for a call writerD. Profitable for a put writer
Question 8-8
Which of the following safety-oriented steps is best to avoid when writing options?
A. Aim to write options outside price levels you expect the underlying security to reach.
B. Place a stop to exit your option position if it moves against you by a certain amount.
C. Aim to write options with low Deltas.D. Open an insurance account.
TRADING VEHICLES 69
Question 8-9
What’s the greatest difference between buying futures and options?
A. The number of long and short positions.B. Futures are less correlated with each other than stock options.C. There are thousands of optionable stocks but only dozens of futures.D. The most an option buyer can lose is the initial premium, but a futures buyer can
lose a lot more.
Question 8-10
The main danger of futures markets is
A. the relatively short life of their contracts, compared to stocks.B. trading with small margin deposits.C. the existence of the daily price limits.D. insider trading by hedgers.
Question 8-11
Match the following statements regarding futures.
I. A contract for the next month’s delivery of a commodity is priced higher than for more distant deliveries.
II. A trader opens a futures position opposite to his position in the actual com-modity.
III. A major weather disturbance threatens cotton harvest. IV. A cold spell drives up the price of heating oil; a trader shorts heating oil and
goes long crude oil.
A. Supply-driven marketB. Spread tradingC. Inverted marketD. Hedging

70 QUESTIONS
Question 8-12
Which statements regarding the forex market are correct?
I. The forex market has no central location; institutional traders deal directly with each other.
II. Forex houses tend to accept customer orders without executing any trades. III. Margins of 1:30 and higher help traders profit. IV. A retail forex brokerage house earns its income from commissions.
A. IB. I and IIC. I, II, and IIID. I, II, III, and IV
Even a brilliant system will not guarantee winning in every trade. This is why every system must include risk management rules. Many creators of promising trading
systems keep losing money because of poor or absent risk control.Each and every system has its drawdown periods. That’s when risk management
means the difference between life and death. No system will do you any good if you don’t manage risk.
Professionals spend much of their time calculating how much money to risk on any given trade and how to vary trade size, depending on market conditions and account equity. Risk management is essential for your survival and success.
You owe it to yourself to earn an excellent rating in this section of the Study Guide—nothing less will do! As traders, we sail on a stormy ocean. Risk manage-ment rules are our lifeboats and life preservers. Make sure that your safety gear is in good order.
71
N I N E
Risk Management
72 QUESTIONS
Questions Trial 1 Trial 2 Trial 3 Trial 4 Trial 5
1
2
3
4
5
6
7
8
9
10
11
12
13
14
15
16
17
Correct answers
RISK MANAGEMENT 73
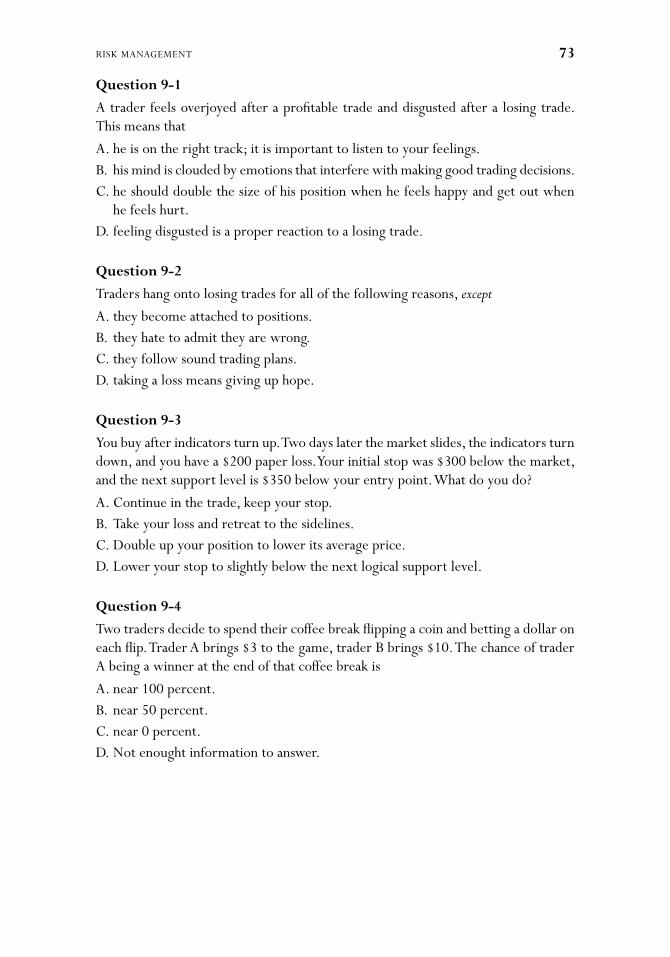
Question 9-1
A trader feels overjoyed after a profitable trade and disgusted after a losing trade. This means that
A. he is on the right track; it is important to listen to your feelings.B. his mind is clouded by emotions that interfere with making good trading decisions. C. he should double the size of his position when he feels happy and get out when
he feels hurt.D. feeling disgusted is a proper reaction to a losing trade.
Question 9-2
Traders hang onto losing trades for all of the following reasons, except
A. they become attached to positions.B. they hate to admit they are wrong.C. they follow sound trading plans.D. taking a loss means giving up hope.
Question 9-3
You buy after indicators turn up. Two days later the market slides, the indicators turn down, and you have a $200 paper loss. Your initial stop was $300 below the market, and the next support level is $350 below your entry point. What do you do?
A. Continue in the trade, keep your stop.B. Take your loss and retreat to the sidelines.C. Double up your position to lower its average price.D. Lower your stop to slightly below the next logical support level.
Question 9-4
Two traders decide to spend their coffee break flipping a coin and betting a dollar on each flip. Trader A brings $3 to the game, trader B brings $10. The chance of trader A being a winner at the end of that coffee break is
A. near 100 percent.B. near 50 percent.C. near 0 percent.D. Not enought information to answer.

74 QUESTIONS
Question 9-5
Choose the order of importance of the following three money management goals.
I. Earn high profits II. Ensure survival III. Earn a steady rate of return
A. I, II, IIIB. II, III, IC. III, II, I
Question 9-6
The usefulness of which of the following rules has been proven by experience?
I. Never meet a margin call. II. Never average down. III. The first mistake is the cheapest. IV. If you must lighten up, liquidate your worst position.
A. IB. l and IIC. I, II, and IIID. I, II, III, and IV
Question 9-7
When you find yourself counting money in a trade, you should
I. stop—and if you can’t, close out that trade. II. Count money to calculate your stops. III. Count money to calculate your profit targets. IV. plot a chart of your paper profits.
A. IB. I and IIC. I, II, and IIID. I, II, III, and IV
RISK MANAGEMENT 75
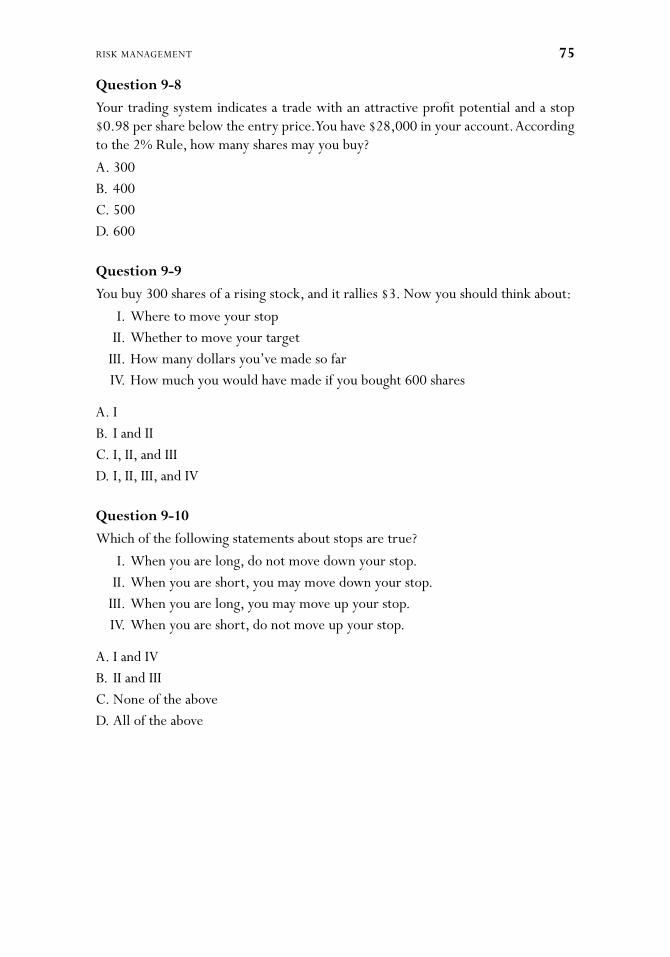
Question 9-8
Your trading system indicates a trade with an attractive profit potential and a stop $0.98 per share below the entry price. You have $28,000 in your account. According to the 2% Rule, how many shares may you buy?
A. 300B. 400C. 500D. 600
Question 9-9
You buy 300 shares of a rising stock, and it rallies $3. Now you should think about:
I. Where to move your stop II. Whether to move your target III. How many dollars you’ve made so far IV. How much you would have made if you bought 600 shares
A. IB. I and IIC. I, II, and IIID. I, II, III, and IV
Question 9-10
Which of the following statements about stops are true?
I. When you are long, do not move down your stop. II. When you are short, you may move down your stop. III. When you are long, you may move up your stop. IV. When you are short, do not move up your stop.
A. I and IVB. II and IIIC. None of the aboveD. All of the above
76 QUESTIONS
Question 9-11
A stop-loss order
I. limits your loss on a bad trade. II. reduces your stress level. III. limits the damage from a bad trading system. IV. guarantees that your loss will not exceed a certain amount.
A. IB. I and IIC. I, II, and IIID. I, II, III, and IV
Question 9-12
Which of the following traders are in compliance with the 2% Rule?
I. Trader A: $18,000 in the account, bought 200 shares at $20, stop at $18 II. Trader B: $50,000 in the account, bought 400 shares at $20, stop at $18 III. Trader C: $25,000 in the account, bought 400 shares at $20, stop at $19 IV. Trader D: $60,000 in the account, bought 1,500 shares at $20, stop at $19
A. I and IIB. II and IIIC. III and IVD. I, II, III, and IV
Question 9-13
Which two mistakes on this list are most deadly for traders?
I. Trading on rumors and hearsay II. Trading without stops III. Forgetting to monitor open trades IV. Putting on trades whose size is too large for the account
A. I and IIB. II and IIIC. I and IVD. II and IV
RISK MANAGEMENT 77
Question 9-14
The Iron Triangle of risk control tells you how many shares you may buy or sell short by performing which calculation?
A. Subtract your entry from your target priceB. Divide your target price by your stopC. Add your stop to your target priceD. Divide your total dollar risk by the risk per share
Question 9-15
Which of the following statements regarding the 6% Rule is correct?
A. You may not risk more than 6% of your account equity on any single trade.B. If you risk 2% per trade and had three losing trades in a month, you have to
reduce your risk on the next three trades.C. If you risk 2% per trade and take three losses in a row, you may not trade for the
rest of this month.D. Paper losses on open trades don’t count against the 6% Rule limit.
Question 9-16
In calculating your "available risk," the 6% Rule takes into account all of the fol-lowing, except:
A. Your paper profits for the monthB. Your total losses for the monthC. Your amounts at risk in open tradesD. What would happen if all your open trades turned negative
Question 9-17
All of the following statements apply to coming back to trading after a severe draw-down, except:
A. Begin by trading a tiny size and increase it in steps after meeting performance goals.
B. Jump into trading full size—deal with your fears by facing them.C. Become your own trading manager by focusing on risk management.D. Lower the 2% Rule to a smaller number.


79
I was in a room where a world-famous technical analyst lectured about gold. He projected his charts on a screen and pointed out trends and potential reversals. A
trader in the audience raised his hand: “So, at the right edge, would you buy or sell?” The great expert pondered the screen and uttered: “Well, I’m sure that in two to three weeks, the answer to that will be very clear.” The trader stared at him incom-prehensibly.
In trading, you don’t have the luxury of waiting for a couple of weeks for an an-swer. You need to decide now, today, what you’ll do at the right edge of the chart: buy, sell, or stand aside. Standing aside, by the way, is a legitimate choice. If you de-cide to trade, you need to choose where to enter, set targets, and place stops.
Traders use a wide variety of methods to accomplish these tasks. In this chapter, we’ll review the methods that are described in The New Trading for a Living.
Practical Details
T E N

80 QUESTIONS
Questions Trial 1 Trial 2 Trial 3 Trial 4 Trial 5
1
2
3
4
5
6
7
8
9
10
11
12
Correct answers
PRACTICAL DETAILS 81
Question 10-1
The least advisable method of entering a long position is to buy
A. a breakout above yesterday’s high.B. a breakout above the channel.C. a pullback to the value zone.D. a penetration of the value zone.
Question 10-2
Gold is in an uptrend, confirmed by a rising moving average. Every few weeks there is a brief panic, as prices stab below their moving average before resuming their up-trend. Three months ago, prices stabbed $2.50 below their EMA, two months ago $1.50, and last month $4. How deep below the EMA would you consider placing a buy order?
A. Immediately below the EMAB. $1 belowC. $3 belowD. $5 below
Question 10-3
When buying in the vicinity of a rising moving average, a reasonable profit target would be
A. the upper channel line.B. the lower channel line.C. the same distance above the EMA as the latest penetration was below.D. when the moving average turns down.
Question 10-4
Setting profit targets for long-term trades is best done on the basis of
A. moving averages.B. channels.C. divergences.D. support and resistance.
Question 10-5
Which of the following statements about stops is incorrect?
A. They lead to whipsaws.B. They allow you to calculate reward/risk ratios.C. They limit the maximum amount of loss.D. They give you an idea of a maximum loss in a trade.
82 QUESTIONS
Question 10-6
Which of the following methods of placing stops helps avoid getting hit by “market noise” ?
I. Stops outside of the price channel II. SafeZone stops III. ATR stops IV. Stops based on support or resistance
A. IB. I and IIC. I, II, and IIID. I, II, III, and IV
Question 10-7
Which of the following rules apply to placing stops?
I. Don’t place stops at obvious levels. II. Don’t place stops at round numbers. III. Move your stops to protect winning trades from turning into losing ones. IV. Move your stop only in the direction of your trade.
A. IB. I and IIC. I, II, and IIID. I, II, III, and IV
Question 10-8
The high of the daily bar is $23 and the low $21. You buy at $21.50. What is your buy grade?
A. 25%B. 50%C. 75%D. None of the above
Question 10-9
The high of the daily bar is $29 and the low $26. You sell at $27. What is your sell grade?
A. 33%B. 50%C. 66%D. 75%
PRACTICAL DETAILS 83
Question 10-10
The trend, defined by the EMA slope, is rising. On the day you buy, the upper chan-nel line is at $32.50 and the lower channel line is at $26.50. You go long at $29 and sell several days later at $31. What is your trade grade?
A. 25%B. 33%C. 50%D. 66%
Question 10-11
Which of the following statements about scanning is incorrect?
A. A scan may cover a thousand stocks.B. A scan finds stocks that fit a pattern defined by you.C. A well-designed scan finds profitable trades.D. One can scan stock industry groups as well as individual stocks.
Question 10-12
Negative rules for scanning may filter out stocks on the basis of all of the following criteria, except:
A. UnprofitableB. Trending downC. Insufficient volume levelsD. Too cheap or too expensive

Keeping good records helps you identify past mistakes and stop repeating them. Good records make clear what steps brought you profits, so that you can repeat
them going forward.Good record-keeping ties together psychology, market analysis, and risk manage-
ment. It is the best tool for developing and maintaining discipline.To improve your performance, you must learn from your experiences, which is
what good record-keeping allows you to do. It is the most important skill for your growth as a trader.
85
Good Record-Keeping
Questions Trial 1 Trial 2 Trial 3 Trial 4 Trial 5
1
2
3
4
5
6
7
8
9
Correct answers
E L E V E N
86 QUESTIONS
Question 11-1
Good record-keeping helps accomplish all of the following, except:
A. Greater disciplineB. Less impulsive tradingC. Stop making mistakesD. Become your own teacher
Question 11-2
Performing routine morning homework is especially important for what reason?
A. It helps you wake up.B. It allows you to review news and reports relevant to trading during the day.C. It allows you to review yesterday’s performance.D. It allows you to adjust stops.
Question 11-3
What’s the main purpose of taking a daily psychological self-test before the market opens?
I. To evaluate your mood II. To evaluate your readiness to trade III. To see on what days you shouldn’t be trading IV. To be ready to trade a greater size on the days with a perfect score
A. I and IIB. II and IIIC. III and IVD. I and IV
Question 11-4
A trade plan must include all of the following, except:
A. The strategy you’ll useB. Your entry, exit, and stopC. The amount of money you’ll riskD. The amount of money you plan to make
GOOD RECORD-KEEPING 87
Question 11-5
Which statements about using a Trade Apgar are correct?
I. The more questions you ask about your plan, the better you’ll be prepared to trade.
II. Keep the number of questions about a trade plan down to five. III. Write down detailed responses to questions and weigh them carefully. IV. Use only one of three responses: yes, no, and in-between.
A. I and IIIB. II and IVC. I and IVD. II and III
Question 11-6
Completing a Tradebill prior to entering a trade makes you focus on which of the following?
I. Entry, exit, and stop II. Earnings reports and ex-dividend dates III. The strategy you’ll trade IV. Amount of risk and position size
A. IB. I and IIC. I, II, and IIID. I, II, III, and IV
Question 11-7
After you enter a trade, your Tradebill should document which of the following?
I. Stop placement, both soft and hard if you use both II. The level at which you’ll move your stop to breakeven III. The fact of having made an entry in the trade diary IV. The amount of targeted profit
A. IB. I and IIC. I, II, and IIID. I, II, III, and IV

88 QUESTIONS
Question 11-8
Which statement about reviewing closed trades is correct?
A. Give your full attention to current trades, don’t dwell in the past.B. Losses hurt too much at the time you took them, and there is no point revisiting
them.C. Spend your time planning for the future, not thinking about the past.D. Learn from past mistakes, so you don’t repeat them.
Question 11-9
The most educational part of a Trade Journal is
A. documenting your strategy.B. adding entry and exit charts.C. posting a follow-up chart weeks or months after a trade.D. documenting entry, exit, and trade grades.

Answers and
Comments
PA R T T W O


91
Introduction
Answer 0-1: C (I and IV)
Fundamental analysts study economic conditions; technical analysts focus on market behavior. Both can help you spot good trading opportunities.
Tips are tricky—they almost always come late; plus, the tipper who tells you to buy will almost never tell you when to sell. Tips can be used only if you run them through your decision-making system. Using inside information is a criminal offense in most developed countries.
Answer 0-2: C
The three pillars of successful trading are sound psychology, a good analytic method, and careful money management. A good trader with a sound analytic method is his own insider.
Answer 0-3: A
The attitude of benign skepticism is the best. Borrow the ideas that seem to make sense and then test them in the crucible of your own experience. Begin trading a small size and gradually increase it as you gain confidence.
Answer 0-4: D
Slippage and commissions slant the “playing field” against most traders; emotional trading finishes them off. Theft is only a minor factor in well-policed markets.
92 ANSWERS
Answer 0-5: D
When the winner receives less than the loser lost, that transaction is called a “minus-sum game.” Commissions and slippage make trading a prime example of such a game. Many providers of financial services try to hide this fact.
Answer 0-6: A
You pay commissions on stock trades when you buy and again when you sell. 100 shares of a $20 stock will cost $2,000. You’ll pay a $10 commission (0.5%) when you buy and again when you sell, for a total of $20 or 1%. If you do this trade on margin, paying only $1,000 for your shares and borrowing the rest, that commis-sion will be 2% of your capital—and then you’ll have to pay interest on margin debt.
That seemingly small commission multiplied by the number of trades that you make in a year, can take a serious bite out of your account. This problem is especially acute for small accounts, and of course, using margin makes it even worse. Lesson: be very selective in what you trade, weigh each trade plan carefully.
Answer 0-7: B
Your slippage entering this trade was 8 cents for each of the 100 shares you bought, for a total of $8. It was almost as big as your commission. While trading larger posi-tions reduces the relative cost of commissions per share, there is no such break with slippage—if you traded 1,000 shares, your slippage would have been $80 or worse. The remedy is straightforward: use limit orders for entering trades.
Answer 0-8: C
You bought 100 shares at $20.08 and sold at $20.88 for a gross profit of 80 cents per share or $80 for 100 shares. Your slippage was 8 cents when you bought and 12 cents when you sold, for a total of 20 cents per share, $20 total. The $20 total slippage is 25% of your $80 profit for the trade.
When it comes to stops, limit orders won’t do. Use “market if touched” orders—when it’s time to escape, hit the eject button. Some slippage is inevitable, but the goal is to keep it as low as possible.
Answer 0-9: B
You’ve bought your shares at $20.08 and sold at $20.88 for 80 cents profit per share or a total gross profit of $80. Your commissions ate up $10 entering and another $10 exiting. There was also that slippage of $8 on the entry and another $12 during the exit. The total bite came to $40 or 50% of your gross profit—and now Uncle Sam is licking his lips, waiting to tax you.
You need to focus on reducing the expenses of trading: ask your broker to lower his commission rate or shop for a more competitive broker, be selective about your trades, and whenever possible use limit rather than market orders.
INTRODUCTION 93
■■ Rating Yourself
0–3 correct: poor.Take heart—the questions that you failed to answer are seldom asked. Many in the financial services industry try to muddle up the facts. Take your time, reread the In-troduction in The New Trading for a Living, and retake this test.
4–6 correct: fairly good.You have grasped the basic ideas. Look up the answers to the questions you’ve missed. Think about them and retake this test a few days later.
7–9 correct: excellent.You understand these neglected but very important concepts. You’ll enjoy the chap-ters on psychology and risk management.


95
Answer 1-1: D
Trading is inherently risky because we deal with the uncertainty of the future. If there were no risk of loss, there could be no reward. Amateurs have emotional reac-tions—fear, elation, anger. A professional trader measures each risk in advance and trades only when the odds are clearly in his favor.
Answer 1-2: A
You must strive to achieve your personal best, to become the best trader you can. Focusing on money, buying toys, or trying to impress others will only divert your attention from the top goal—reaching your personal best. A good surgeon doesn’t count money at the operating table—and neither does an intelligent trader while he is in a trade.
Answer 1-3: C
Treat your mistakes as learning opportunities: find the causes of your losses, and cor-rect those mistakes going forward. This is an emotionally hard task, but it needs to be done in order to win. Without such analysis, trying to trade your way out of a hole, even with a new guru, is doomed to failure. You need to figure out exactly what got you into a hole in the first place. We’ll return to this topic in the chapter on keeping a trading diary.
O N E
Individual Psychology
96 ANSWERS
Answer 1-4: A
A large account allows you to diversify, trade multiple positions, and spend pro-portionately less on services. Beginners often discard these advantages by blowing money simply because it exists in their accounts. We’ll return to the rules on manag-ing trade size in the chapter on money management.
Answer 1-5: D (III and IV)
Commercial trading systems are built and optimized using old data; they self-destruct when markets change. An intelligent trader who develops his own system can make needed adjustments; a trader who purchases a system sinks with it. Even systems with built-in optimization eventually self-destruct because we do not know what kinds of optimization will work in the future. Following trading signals from any system requires discipline and evokes essentially the same emotions as independent trading. There is no substitute for mature judgment.
Answer 1-6: C (I, II, and III)
One of the key signs of a gambling attitude is the inability to stop trading, stay on the sidelines, and reflect on one’s behavior. Traders who gamble tend to reverse their positions and feel depressed or elated depending on the outcome of their latest trade. A losing streak is a common experience; when you hit one, stop trading until you’ve spent time reevaluating your method. Serious traders learn from their losses, while gamblers continue with their compulsive trading.
Answer 1-7: C
We trade the way we live. Personal discipline is essential for success. Look for com-mon problems in your trading and everyday life. This trader seems to have serious issues with responsibility. He needs to face it and get himself organized in everyday life as well as in trading.
Answer 1-8: D (I and IV)
To win, you don’t have to be more intelligent or knowledgeable than other traders, but you must be better disciplined. Your feelings influence your trades, including entries, exits, and risk management. If your mind is clouded by fear or greed, no system will help. Getting high from trading leads to gambling, accepting bad odds, and losing.
Answer 1-9: C (I and III)
You may increase your trading size as long as you don’t risk a greater percentage of your equity—we’ll return to this in the chapter on risk management. A vacation from trading may not be a bad idea—spend some of the time analyzing what you did right. On the other hand, becoming sloppy with stops and lazy in research are typical behaviors of a loser on a lucky streak.

INDIVIDUAL PSYCHOLOGY 97
Answer 1-10: D
Losers are addicted to the thrill of the game and hope for a big win. They keep poor records, just like alcoholics don’t count their drinks. They switch between trading systems and methods, just like alcoholics switch from drinking in bars to drinking at home.
Answer 1-11: C
Losers are hooked on the excitement of trading and keep hoping for a big win. They blame others for their losses and avoid accepting personal responsibility.
Answer 1-12: D
Accepting responsibility for your losses blows away the smoke of illusions and puts your trading on a new, realistic footing. A better trading system, new trading meth-ods, and a major bull market can help, but personal responsibility comes first.
Answer 1-13: B (II and III)
A trader who has the courage to face his own role in losing can turn around; going forward, he is likely to cut losses short and avoid overtrading. His discipline will free him from fear, but it will not lower his rates of commissions and slippage—for that he needs to carefully shop for a broker and avoid market orders.
Answer 1-14: C
Being calm and disciplined is the cornerstone of successful trading. Writing down your trade plans and implementing them will put you on the road to success—we’ll return to this topic in the chapter on trade plans. Bigger capital, knowledgeable friends, and a history of success in other endeavors are all desirable—but none equals the importance of disciplined planning. Emotional trading is the enemy of success. If trading makes you feel giddy or fearful, those feelings will cloud your judgment. Exit your trades when you feel the grip of emotions.
Answer 1-15: A
A trader’s own impulsivity makes the market appear confusing and illogical. Other problems, such as a shortage of good information, small capital, or even the market’s periods of randomness, contribute less to confusion than emotional trading.
Answer 1-16: C
A trade begins when you decide to enter the market, and it ends when you decide to exit. Those decisions are like the bookends of every trade, and they are yours alone. You may use technical indicators, fundamental analysis, or even pay attention to trusted advisors—but only you can decide when a trade begins and when it ends.
98 ANSWERS
■■ Rating Yourself
0–4 correct: poor.
The red light is flashing—your low level of self-awareness puts you in danger. You need to learn more about trading psychology in order to have a chance of success. Many psychological tricks that help us in our daily lives destroy trading accounts. Many educational systems promote dependence and follow-the-leader mentality. Successful traders are independent, creative, and realistic. Please reread the relevant chapter and retake this test before proceeding to the rest of this Study Guide.
5–8 correct: below average.
Getting half the answers right means being in the bottom half and that’s not good enough for winning. You need to learn more about the individual psychology of trad-ing. Please reread the relevant materials and retake this test.
9–12 correct: fairly good.
You have a working grasp of the essential concepts of trading psychology but need to fill in the gaps. Study the recommended materials and retake this test in a few days. Sound psychology and discipline are essential for your success in the markets.
13–16 correct: excellent.
You have mastered the topics in this chapter. Please review those questions where your answers differed from those provided in this book. Successful traders are very independent. See whether the discrepancies were due to errors—or to your own, individual way of thinking.
■■ Recommended Reading
Douglas, Mark, The Disciplined Trader (New York: New York Institute of Finance, 1990).
Lefevre, Edwin, Reminiscences of a Stock Operator (1923) (Greenville, SC: Traders Press, 1985).

99
Answer 2-1: D
Prices are set by crowd members who place orders to buy or sell, or else stand aside. Each price tick reflects the latest consensus of value, hammered out by those orders or the withholding of orders. Ticks coalesce into patterns—the footprints of bulls and bears on our charts. “Supply and demand curves” are far removed from this sweaty reality of the market. Prices are connected to fundamental values in the long run but are governed by crowd psychology from day to day.
Answer 2-2: C
Bulls try to buy as low as possible, and bears try to sell as high as possible. Both know that they have to hurry before some uncommitted trader steps in and snatches away their bargain. Professionals aim to identify the dominant group and trade with it. The goal of a good technical analyst is to discover the balance of power between bulls and bears—in order to trade in the same direction as the winning group. The danger of forecasting is that it locks us into a specific mind-set instead of focusing on the cur-rent reality of the market.
Answer 2-3: C
Reading newspapers, watching TV, and surfing the net often lead to poorly planned and impulsive trades. Why trade, whether a large or a small size, when you aren’t sure what to do at the moment? “When in doubt, stay out” is a sensible rule.
T W O
Mass Psychology
100 ANSWERS
Answer 2-4: B
The profits you’re trying to make can come from only one source—from other traders’ accounts. The mirror image of that is that any losses you take will give your money to other traders. Trade defensively because other traders will try to pick your pockets before you can pick theirs. Brokers and exchanges will also take their cut, whether you win, lose, or draw.
Answer 2-5: B (I and III)
When we join crowds, our independence dissolves, and the capacity for critical thinking goes out the window. Crowds are impulsive, adding to volatility. Crowd members blindly follow trends, and their psychological dependence makes them unlikely to leave the crowd, until shaken by a severe loss.
Answer 2-6: D (I, II, III, and IV)
The greater the uncertainty, the more likely we are to turn to others for reassurance and comfort. This behavior is deeply ingrained in human nature. Groups are held together by their loyalty to the leader.
Answer 2-7: A (I)
Crowds are bigger and stronger than any of us; don’t argue with the market. Crowds are strong but primitive, and you can exploit their repetitive behavior—but only if you can stand apart from them. Market crowds are right during trends but wrong at turning points. When you let the market make you feel elated or depressed, you give it power over yourself; professional traders train themselves not to react emotionally to gains or losses.
Answer 2-8: C
All eyes in the market are glued to prices. The longer a rally lasts, the more people turn bullish, pushing prices higher and attracting even more bulls. A persistent de-cline makes more people feel bearish, and their selling helps push the marker even lower. Price is the trend’s leader. Few financial firms are big enough to dominate a market for days or even hours. Gurus are to the market like a tail is to a dog, and few dogs chase their tails for very long. Fundamental changes in the economy set conditions for bull and bear markets, but only traders can buy and sell, creating self-reinforcing price trends.
Answer 2-9: B (II and III)
Prices are hammered out in the battles between bulls and bears. Prices rally when confident bulls are paying up, while sellers demand a premium for participating in the game that’s going against them. There is a buyer and a seller behind every transac-tion. The number of stocks or futures bought and sold is equal by definition.

MASS PSYCHOLOGY 101
Answer 2-10: D (I, II, III, and IV)
In a downtrend, the shorts are making money, and many become willing to sell at a lower price to increase their positions. At the same time, bulls are losing, and many want to get out. Those that agree to buy do it only at a discount. They place their bids below the market, forcing bears to sell cheaper. This process is reversed during uptrends.
Answer 2-11: B (II and III)
A price shock is a sudden move against the trend. It frightens the dominant group and makes the opposition bolder. A sudden price break in an uptrend provides a price shock that frightens the bulls. Even if they manage to take prices to a new high, their confidence is shaken, and the uptrend may well be ready to reverse.
Answer 2-12: C
A bearish divergence occurs when prices rally to a new high, while an indicator rises to a lower peak. In a bullish divergence, prices fall to a new low, while an indicator falls to a more shallow low. Bearish divergences help identify uptrend tops. Bullish divergences help identify downtrend bottoms. They are among the most useful pat-terns in technical analysis.
Answer 2-13: B (I and IV)
A trader must stay calm, focus on the reality of the market, identify the current trend, and get in gear with it. When traders try to forecast exactly what the market will do, their egos become wedded to their predictions, and it becomes hard for them to change their trading stance. When the market refuses to follow forecasts, traders who stick to them get financially hurt.
102 ANSWERS
■■ Rating Yourself
0–4 correct: poor.
You have a very limited understanding of mass psychology of the markets. If you don’t understand how market crowds influence your behavior, you’ll be swept away by them and lose money. Please reread the relevant section of the book, and retake this test in a few days, before proceeding any further.
5–9 correct: fairly good.
You have a working grasp of the essential concepts of mass psychology, but need to learn more about the balance between bulls and bears, the impact of the trading crowds on you, and the difference between managing trades and forecasting prices. Please review the relevant section of the book and retake this test in a few days.
10–13 correct: excellent.
You have mastered the essential concepts of mass psychology. Now review some of your recent trades in light of these principles. Continue to monitor how the market impacts you. As you proceed to the chapters on market analysis, keep in mind that technical analysis is applied social psychology.
■■ Recommended Reading
Mackay, Charles, Extraordinary Popular Delusions and the Madness of Crowds (1841) (New York: Crown Publishers, 1980).
103
Answer 3-1: I = C; II = D; III = B; IV = A
Amateurs tend to get their information after work and trade in the morning. Pro-fessionals respond to changing conditions throughout the day and tend to dominate the market near closing time. Buying pushes prices up, and the highest price of the day marks the maximum power of bulls. Selling pushes prices down, and the low-est price of the day marks the maximum power of bears. This reasoning also applies to weekly and intra-day charts.
Answer 3-2: C (I, II, and III)
Wishful thinking is rampant among analysts, especially those who don’t trade. Keep-ing basic definitions fuzzy contributes to the confusion. It is quite common for the markets to be trending higher and lower at the same time in different timeframes. Good analysts who focus on different timeframes may come to different conclusions, and all can make profitable trades.
Answer 3-3: C
Slippage tends to be lower on quiet, narrow-range days. That’s when you can get a better entry, but it doesn’t change your commissions.
Classical Chart Analysis
T H R E E
104 ANSWERS
Answer 3-4: 4 (A, B, C, and D)
MDT is tracing a pattern of rallies and declines. As soon as prices begin to decline from the latest peak, draw a horizontal line across that peak, marking a resistance level. As prices rally again, they sometimes slow down at the resistance level. After they penetrate it, they usually pull back—what used to be resistance becomes a sup-port level.
Answer 3-5: D (I and IV)
Support lines are drawn across the lows, and resistance lines across the highs. They can change roles with the passage of time, as the market moves away from those levels. The edges of congestion zones show where masses of traders have traded and reversed their positions. Extreme prices show only the levels of panic among the weakest market participants.
Answer 3-6: D (I, II, III, and IV)
Support and resistance exist because traders have memories. The more intense their memories, the more actively they buy and sell, strengthening support and re-sistance. High volume reflects a greater degree of financial and emotional commit-ment, while the greater height of the support and resistance zones shows a higher level of activity, and consequently, stronger memories. The greater the duration of a congestion area and the more times it’s been hit, the more traders expect a new reversal to occur, reinforcing support and resistance.
Answer 3-7: C (I, II, and III)
Waiting for a new low before shorting helps ensure you’re dealing with a downside breakout. False breakouts are the bane of amateurs, but professional traders love them. They often wait until a downside breakout stops making new lows and then trade against it: buy and place a protective stop near the latest low. Since prices made a new low yesterday, shorting at the opening would mean following the trend, but buying would be a poor option.
Answer 3-8: A = IV; B = I; C = III; D = II
The lower dashed line, drawn across the edge of a congestion area, marks the level of support. When prices break out to a new low during bar A, and even slightly lower during bar B, there is a possibility that the downtrend will resume. Still, the short-ness of those bars indicates that the downmove is facing a stiff resistance. As bar C moves up into the congestion area, it leaves behind a false downside breakout. You may start buying when it crosses above the previously broken support line, with a stop near the recent lows. The shortness of the last bar indicates that the rally is slowing down—tighten your stop and consider moving it up to the breakeven level.
CLASSICAL CHART ANALYSIS 105
Answer 3-9. Trends = A and C; Trading ranges = B and D
When prices trend, they keep rising or falling over time, reaching higher highs or lower lows. In trading ranges, most rallies peter out at approximately the same highs, and declines stop at approximately the same lows. As a trader, when you recognize a trend, follow it and hang onto positions. If you trade the swings within a trading range, be extra careful not to overstay your positions.
Answer 3-10. I = G; II = A, B, and F; III = C and D; IV = E
The actions of any trading vehicle as it nears support or resistance provide informa-tion about its strength or weakness. When a stock cannot rise up to touch resistance, it shows weakness. Holding above support indicates strength. False breakouts pro-vide some of the best signals in technical analysis.
Answer 3-11: C (I, II, and III)
The trend is your friend. As long as you see the pattern of higher highs and higher lows, trade that market from the long side. Make sure to protect your positions with stops and move them up as the trend progresses. Add to your positions only after your paper profits have been protected. If the market takes out its previous low, it throws the uptrend in doubt.
Answer 3-12: A does not apply
Tails show that either a high or a low price level has been rejected by the mass of mar-ket participants. Since markets tend to move away from rejected price levels, it pays to trade in the direction opposite a tail. Some trading vehicles are more likely to have tails than others—you see three of them on this chart of BA, followed by reversals.
Answer 3-13: D is not permitted
Paying close attention to market action after a kangaroo tail, you may increase your position size or take profits when the move appears to stall. What you shouldn’t do is place your stop below the tip of the tail because it would expose a trade to too much risk.
106 ANSWERS
■■ Rating Yourself
0–4 correct: poor.
Charts tell an important story—and if you can’t read it, you’ll miss the market’s message. You‘ll run a serious risk of buying at the tops and selling at the bottoms. Please reread the relevant section of the book, review your mistakes, and then retake this test. Do not proceed to the next chapter until then—these materials are too important to skip.
5–9 correct: fairly good.
You have a working knowledge of the key concepts of charting. Now you have to decide whether “fairly good” is good enough for you. It may be enough if you plan to focus on computerized technical analysis, but not enough if you plan to work with charts. All serious investors and traders need to grasp such essential concepts as trends and trading ranges, support and resistance, continuation and reversal. It would be a good idea to return to the relevant section, review it, and then retake this test.
10–13 correct: excellent.
You’ve mastered the essential concepts of charting. They can help you discover the shifts of power between bulls and bears. Now proceed to the chapters on computer-ized technical analysis.
■■ Recommended Reading
Edwards, Robert D., and John Magee, Technical Analysis of Stock Trends (1948). (New York: New York Institute of Finance, 1992).
Pring, Martin J., Technical Analysis Explained, 5th edition (New York: McGraw-Hill, 2013).
107
Answer 4-1: A = (I)
Computerized technical analysis is more objective than classical charting. You may argue whether support or resistance is present, but there can be no argument about the direction of an indicator—it’s either up, down, or flat. A good technician aims to discover the balance of power between bulls and bears and bet on the winning group—not to forecast the future. A computer doesn’t remove emotions from trad-ing because we still have to place our orders. Anyone who tries to sell you “a sure thing” should be viewed with utter suspicion.
Answer 4-2: I = B; II = C; III = AA toolbox is a collection of analytic and charting tools. Black boxes for automat-ic trading come with excellent historical records but self-destruct when markets change; gray boxes straddle the boundary between those two groups.
Answer 4-3: I = B; II = C: III = A
It pays to combine indicators from different groups so that their negative features cancel each other out while their positive features remain undisturbed. We’ll return to this theme in the chapter on the Triple Screen trading system.
Answer 4-4: B
To calculate a simple moving average, add the closing prices in its time window and divide their sum by the number of days in that window. Adding prices for the past 5 days produces 110, and dividing 110 by 5 is 22.
Computerized Technical Analysis
F O U R
108 ANSWERS
Answer 4-5: A
Exponential moving averages are harder to calculate by hand than simple MAs. If you use a computer, both are equally easy.
Answer 4-6: D
A rising EMA confirms that bulls are in control—it’s time to go long. When EMA declines, it shows that bears are in control—it’s time to go short. The ability of an EMA to reach a new high shows that bulls are stronger than before, while declining to a new low shows that bears are stronger than before. These are important signals, but less frequent or important than the direction of the EMA slope. The width of the EMA’s time window is set by the trader.
Answer 4-7: 1 = A & C; 2 = B
When the EMA rises, trade the stock only from the long side—place your buy or-ders slightly below the EMA. When the EMA turns down, trade the stock from the short side by placing sell orders slightly above the falling EMA. You’re free to stand aside whenever you’d like.
Answer 4-8: 1 = D, E, F, and G; 2 = A, B, and I; 3 = C, H, and J
When the EMA points up, pullbacks mark buying opportunities. When the EMA points down, prices are usually below it, and rallies to the EMA mark shorting op-portunities. The transitional zones between uptrends and downtrends are the hardest to trade. When in doubt, stand aside until a clear trend emerges.
Answer 4-9: D (I, II, III, and IV)
Each price is a momentary consensus of value, while a moving average reflects the average consensus of value. A shorter-term MA tracks short-term consensus, and a longer-term MA tracks longer-term consensus. MACD lines consist of moving averages, and when the fast line of MACD is above or below the slow line, it shows whether bulls or bears currently dominate the market.
Answer 4-10: C isn’t true
MACD-Histogram tracks the spread between the fast and slow MACD Lines. Its slope is defined by the relationship between the last two bars of MACD-Histogram. When the slope rises, it shows that bulls are in control, and when it declines, it shows that bears are in control. It pays to trade in the direction of the dominant market group. This is not forecasting—it’s reading the market and betting that the inertia of the market crowd will continue.
COMPUTERIZED TECHNICAL ANALYSIS 109
Answer 4-11: 1 = D; 2 = A; 3 = B and E; 4 = F; 5 = C
When MACD-Histogram reaches a new high, it tells you that bulls are strong and prices are likely to retest or exceed their latest peak. When it falls to a new low, it shows that bears are strong and prices are likely to retest or exceed the latest low. Afterwards, when MACD-Histogram crosses its zero line, it signals that the power of the dominant group has been broken.
A bullish divergence gives a strong buy signal; it occurs when prices fall to a new low, but MACD-Histogram traces a shallower bottom. A bearish divergence gives a strong sell signal; it occurs when prices rise to a new high, but MACD-Histogram traces a lower high.
Answer 4-12: C
The bearish divergence has sent prices lower, but they refused to break below their EMA. At the same time, MACD-Histogram has dropped below zero, showing that bears are nearing their maximum effort level. With bears having delivered about as much power as they could and prices holding up, it’s better to take profits and move to the sidelines.
Answer 4-13: C
The part of today’s bar that protrudes above or below yesterday’s bar represents today’s directional movement. If today’s bar extends both above and below yester-day’s bar, then only the longer part represents directional movement. If today’s bar is inside of yesterday’s bar, or if it extends above and below by equal amounts, direc-tional movement is zero.
Answer 4-14: I = B; II = A, C, E; III = D
Trade in the direction of the upper Directional Line as long as ADX rises above the lower Directional Line. Exit when ADX rises above both Directional Lines and then ticks down. Another exit signal occurs when ADX sinks below both Directional Lines. As long as ADX stays below both +DI and –DI, avoid using a trend-following method.
Answer 4-15: C
When ADX rises above both Directional Lines and then ticks down, it signals the end of a strongly directional move and suggests the onset of greater volatility. You can still trade this market, but only using shorter-term indicators rather than the Directional system.
Answer 4-16: B
Oscillators show whether bulls or bears are currently in control. Their peaks and bottoms mark the extremes of mass optimism and pessimism. Overbought readings of oscillators help identify market tops, and oversold readings help catch market bot-toms. These signals tend to work well during trading ranges but are less useful during trends. No indicator can catch all tops and bottoms.
110 ANSWERS
Answer 4-17: D
When an oscillator reaches a new record high, it reflects strength and tells traders that the rally is likely to continue, even if there is a temporary pause. You may add to long positions or take partial profits, but it’s better to ignore shorting signals because under those conditions, prices aren’t likely to drop by a meaningful amount.
Answer 4-18: 1 = A, C, I; 2 = B, E, F; 3 = E–F; 4 = C–D and I–J; 5 = D, G, H, and J
Stochastic becomes overbought when it rises to or above its upper reference line. There it gives a signal to sell or at least avoid buying. Stochastic becomes oversold when it falls to or below its lower reference line. There it gives a signal to buy or at least avoid shorting.
A failure swing occurs when Stochastic fails to reach its reference line during a market move. When Stochastic could not reach its upper reference line during the rally G, it showed that bulls were weak and gave a sell signal. Failure swings D and J became parts of bearish divergences. In the bullish divergence E–F, the second bot-tom was shallower than the first, but not a failure swing because it was below the lower reference line.
Answer 4-19: C
Stochastic is near its neutral midpoint—but it’s falling from a powerful bearish pat-tern. It has just traced a failure swing and a bearish divergence. In addition, you can see an upward-pointing kangaroo tail on the price chart, reinforcing Stochastic’s bearish message.
Answer 4-20: 1 = A, B, F; 2 = D; 3 = D–E; 4 = B–C
RSI becomes overbought when it rises above its upper reference line. There it gives sell signals, which help traders sell short in downtrends or in flat markets, but are of-ten premature during uptrends. RSI becomes oversold when it falls below its lower reference line. There it gives buy signals, which help traders go long in uptrends or flat markets but are often premature during downtrends. Bullish and bearish diver-gences give the strongest buy and sell signals. All divergences you see on this chart preceded substantial market moves.
Answer 4-21: B
RSI has just traced a clear bearish divergence, with its first top above and the second below the upper reference line. This bearish message is reinforced by the fact that the slight price decline of the past few days took TIF below the top it reached several months earlier. A false upside breakout is now in place and that, reinforced by the RSI divergence, gives a signal to sell short.

COMPUTERIZED TECHNICAL ANALYSIS 111
Answer 4-22: A (I and II)
When the market trend is down and an oscillator rises above its upper reference line, it identifies a short-term splash of bullishness—a shorting opportunity. Afterward, you may want to cover shorts when an oscillator falls below its lower reference line, or you may want to hold shorts. In any case, do not use oscillators to go long in a well-established downtrend. As Peter Lynch, a noted money manager, once wrote: “Trying to catch a bottom is like trying to catch a falling knife—you invariably grab it in the wrong spot.”
112 ANSWERS
■■ Rating Yourself
0–8 correct: poor.
You have a very limited understanding of modern technical analysis. You owe it to yourself to learn the essential concepts of using indicators. Please reread the relevant chapter and retake this test before proceeding to the rest of this book.
9–15 correct: fairly good.
It is important to understand the messages of trend-following indicators and oscil-lators. They offer insights into the balance of power between bulls and bears. You have a decent grasp of the essential concepts of computerized technical analysis. Now review your answers to find out your areas of strength and weakness. Are you more comfortable with trend-following indicators or oscillators? Are you better at finding signals that identify trends or reversals? Please review the recommended literature, and retake this test several days later. Think about what these tests reveal about your preferences. Most successful traders concentrate on just a few types of trades. Some prefer to follow trends, while others are better off at catching reversals. Trader, know thyself.
16–22 correct: excellent.
You have a good command of computerized technical analysis. These indicators are the building blocks of several proven trading systems (see Part 7). Before we work on a system, let’s review other types of indicators available to market analysts (Parts 5 and 6).
■■ Recommended Reading
Murphy, John J., Technical Analysis of the Financial Markets (New York: New York Institute of Finance, 1999).
113
Answer 5-1: A
Each trade reflects a financial and emotional commitment by two traders: a buyer and a seller. Since one of them is bound to be right and the other wrong, volume represents the activity of winners and losers. It surges when losers panic. It mirrors current activity but doesn’t forecast the future.
Answer 5-2: 1 = B; 2 = A; 3 = C; 4 = D
Trends tend to persist when the volume is steady or rises in an orderly manner. They usually expire with either a bang or a whimper—a burst of volume or its drastic shrinkage. The trend cannot continue after masses of losers start leaving.
Answer 5-3: 1 = D; 2 = A and B; 3 = C and F; 4 = E and G
Rising or steady volume confirms trends. When prices rise to a new high or fall to a new low while volume shrinks, it tells us that the price trend is likely to reverse or at least to pause.
Answer 5-4: B
There is a powerful rally going on, with a steady pattern of higher highs and lows. CPST is slowly declining from its latest high, while volume is shrinking. Wait for a bar or a few bars that fail to reach a new low for this minor downmove—and then go long.
Volume and Time
F I V E
114 ANSWERS
Answer 5-5: C (I, II, and III)
OBV is created by adding each day’s volume to a running total when a trading vehicle rises and subtracting it on the days when that vehicle falls. OBV confirms bull moves when it rises to a higher high than at the previous peak; it confirms declines when it falls to a lower low than at the previous bottom. Prices represent the consensus of value, while volume, measured by OBV, tracks traders’ emotions.
Answer 5-6: 1 = D; 2 = C; 3 = B; 4 = A
Opening and closing prices are among the most important prices of the day. Open-ings tend to be dominated by amateurs whose orders flood the markets in the mornings. Closings tend to be dominated by professionals who monitor the condi-tions all day. Accumulation/Distribution ties daily volume to the relationship be-tween opening and closing prices.
Answer 5-7: B
The number of long and short positions in the derivatives markets is always equal. While stocks represent current ownership, derivatives are contracts for future de-livery. Each contract has two sides: a seller and a buyer. This is why open interest reflects the number of contracts held by longs or owed by shorts in any given market on any given day. It equals the total long or the total short position.
Answer 5-8: 1 = B; 2 = C; 3 = C; 4 = A
Open interest rises only when a new buyer and a new seller enter the market be-cause their trade creates a new contract. Open interest falls when a bull who is long sells his contract to a bear who buys it to cover his short trade, and both close out their positions. If a new bull buys from an old bull who’s getting out, open interest remains unchanged. Nor does it change when a new bear sells to an old bear who buys to get out of his short position.
Answer 5-9: D (1, 2, 3, and 4)
When open interest rises, it shows that a crowd of confident bulls is facing down a crowd of equally confident bears. One group is sure to lose, but as long as potential losers keep pouring in, the trend is likely to continue.
Answer 5-10: C (1, 2, and 3)
The direction of the move shows whether the dominant force was up or down. The distance between today’s and yesterday’s closing prices reflects the margin of victory by bulls or bears. High-volume rallies and declines are more forceful and more likely to persist. While related markets are important, they don’t reflect the force of moves elsewhere.
VOLUME AND TIME 115
Answer 5-11: D
Force Index links three essential factors: the direction of price change, its extent, and the volume on which it occurred. To calculate the daily Force Index, subtract yester-day’s closing price from today’s and multiply the result, whether positive or negative, by today’s volume.
Answer 5-12: D (I, II, III, and IV)
Smoothing the raw Force Index with a moving average helps recognize its trend—a short-term trend using a short EMA or an intermediate trend using a longer EMA. When the 2-day EMA of Force Index dips below zero during market rallies, it iden-tifies buying opportunities, and when it rallies above zero during market drops, it marks shorting opportunities. The 13-day EMA of Force Index helps identify bullish and bearish zones by its position above or below its zero line. Divergences between Force Index and price tend to mark approaching trend reversals.
Answer 5-13: 1 = G and H; 2 = F; 3 = A, B, C, and D; 4 = E
In the left half of the chart, prices are in a downtrend, confirmed by a falling EMA. Whenever the 2-day EMA of Force Index rises above zero, it shows a brief recovery by the bulls—a shorting opportunity. In area E, prices fall to a new low but recoil from it, leaving behind a false downside breakout, while Force Index traces a bullish divergence, with a much more shallow low. This is a good time to cover shorts. In area F, the EMA of prices turns up—it signals to stop shorting and look for buying opportunities. Afterwards, Force Index declines below zero in areas G and H, giving buy signals.
Answer 5-14: B
At the right edge of the screen, a moving average of price is trending higher, indi-cating an uptrend. The 2-day Force Index has dipped below zero, signaling that the stock is short-term oversold and giving a buy signal. You have two main ways to act on this signal. You may place a buy order at the high of the current bar, aiming to catch an upside breakout. Alternatively, you may measure the extent of an average downside penetration of the EMA and place your buy order at a similar distance below the current EMA.
Answer 5-15: 1 = C; 2 = A and D; 3 = B
The longer-term Force Index, smoothed with a 13-bar EMA, helps identify trend re-versals: bullish when it crosses above the zero line and bearish when it crosses below that line. It is also possible to draw horizontal bullish and bearish lines slightly above and below the zero line. Waiting for their crossovers, rather than those of the zero line, will reduce whipsaws—but it will also slow down the good signals. What you’d gain in one trade, you’ll lose in another. A lower peak of Force Index in area B shows that the bullish force is weakening and prepares you for a coming trend reversal.
116 ANSWERS
Answer 5-16: B
The Force Index is positive—bullish, while the trend is up, confirmed by a rising EMA. This combination suggests going long, using pullbacks to the EMA for buying.
Answer 5-17: C (1, 2, and 3)
Price cycles owe their existence to fundamental production factors, such as weather and seasonal shifts in supply and demand, as well as waves of greed and fear among traders.
Answer 5-18: 1 = D; 2 = A and E; 3 = B and F; 4 = C and G
The season of an indicator is defined by its slope and its position above or below the centerline. When an indicator turns up but is below its centerline, it is spring; when it rises above its centerline, it is summer; when it declines but is above its centerline, it is autumn; and when it falls below its centerline, it is winter. Spring is the best season for going long, and autumn is the best season for selling short. Seasons are not rigid—not in nature and not in the markets. Notice a brief warm spell in winter in the area between letters B and C.
Answer 5-19: A
Each timeframe relates to its next greater and lesser timeframes by a factor of 5. When you analyze a market in two timeframes, the shorter of them has to be about five times shorter than the longer one. If your favorite timeframe is daily, you must first examine weekly charts.
VOLUME AND TIME 117
■■ Rating Yourself
0–7 correct: poor.
You need to learn more about volume and time. These essential aspects of market analysis will give you an edge over most traders. Please reread the relevant chapter and retake this test before proceeding to the rest of this book.
8–14 correct: fairly good.
You have a working grasp of the essential concepts of volume and time, which most traders neglect at their peril. Please review your answers to see whether your score was lowered by a weak knowledge of a certain area, such as time, volume, or open interest. Review the appropriate chapters and retake this test a few days later.
15–19 correct: excellent.
You understand the concepts most traders miss. Time, volume, and open interest provide an extra dimension of analysis and deepen your understanding of market dynamics.
■■ Recommended Reading
Belveal, L. Dee. Charting Commodity Market Price Behavior (1969) (Homewood, IL: Business One Irwin, 1985).

Answer 6-1: C (1, 2, 3, and 4)
New Highs are the stocks that have risen to the highest level in a year, while New Lows are the stocks that have fallen to the lowest level in a year on any given day. New Highs are the leaders in strength and New Lows are the leaders in weakness. The New High–New Low Index (NH-NL) works by measuring the difference be-tween the strongest and the weakest stocks on any given day. It is a leading indicator of the stock market.
Answer 6-2: 1 = D; 2 = C; 3 = A; 4 = B
When the market rallies and NH-NL rises to a new high, it shows a growing bullish leadership. It pays to follow the leaders and go long. When the market declines and NH-NL drops to a new low, it shows that bearish leadership is becoming stronger. This bearish divergence indicates that it pays to go short. If the broad market rallies but NH-NL traces a lower peak, it shows that the uptrend is losing its leaders and may be in trouble. If the market falls to a new low but NH-NL traces a higher bot-tom, it shows that the downtrend is losing its leaders and nearing a bottom.
General Market Indicators
S I X
119
120 ANSWERS
Answer 6-3: 1 = A and D; 2 = B and F; 3 = G–H; 4 = D–E
NH-NL tracks the numbers of the market leaders, making it a leading indicator of the stock market. Its bullish zone is above the zero line or, if you want to make it less prone to whipsaws, above the plus 100 level. Its bearish zone is below the zero line or, if you want to make it less prone to whipsaws, below the minus 100 level.
Divergences show that the leadership of the current trend is becoming weaker. Both the S&P 500 and the NH-NL rallied to new highs in area D, but in area E, only the S&P reached a new high— this bearish divergence of NH-NL gave a sell signal. Both the S&P 500 and the NH-NL fell to new lows in area G, but in area H, only the S&P fell to a lower low; NH-NL bottomed out at a higher level, and its bullish divergence flashed a buy signal.
Answer 6-4: 2
The EMA is rising and the NH-NL Index is positive, showing that the bulls are in charge. The New High–New Low Index has just rallied to a new high for the current move, showing that the bullish leadership is becoming stronger. Prices are already above value, but still close enough to it to make going long a realistic choice.
Answer 6-5: C (1, 2, and 3)
The A/D line measures mass participation in rallies and declines. A stock market rally is likely to persist when the A/D line rises to a new high, while a decline is likely to continue when the A/D line falls to a new low. Traders need to monitor the pattern of A/D peaks and valleys because its absolute level depends mainly on its starting date. The A/D line tracks only price changes, not volume.
Answer 6-6: B (1 and 3)
Uptrends attract traders, and poorly capitalized newcomers enter the market in droves near major peaks. Many of them double up at the worst possible time. As Humphrey Neill put it, “When everyone thinks alike, everyone is likely to be wrong.” When bullish consensus reaches a record peak, a savvy trader starts taking profits on long positions and looking for shorting opportunities. He knows that the record high bullish consensus means that bulls are already loaded with stocks and can hardly buy more to support the uptrend.
Answer 6-7: A
The structure of the derivatives markets, including futures, ensures that the number of long and short contracts is always equal. If 75 percent of market participants are bullish, then there are three times more bulls than bears. In that case, an average bear is short three times as many contracts as an average bull is long. It shows that the big money is on the bearish side. Big money did not grow big by being stupid; it pays to bet on the wealthy minority. When bullish consensus rises to 75 percent, start selling and look for shorting opportunities.
GENERAL MARKET INDICATORS 121
Answer 6-8: D
The number of short and long contracts is always equal in the futures markets. If the majority of participants are bearish, then the bullish minority must hold more con-tracts per trader. A 20 percent bullish consensus means that there are four bears for each bull—an average bull holds four times as many contracts as an average bear is short. With big money on the long side of the market, be prepared for a sharp rally.
Answer 6-9: B
A bull market that has caught the attention of the general public is probably very old and getting ready to reverse. Markets are often very volatile at tops; scaling into a put position may be the safest trading strategy. Trying to buy coffee now means betting on a greater fool theory. Other markets should be traded based on their own merits.
Answer 6-10: 1 = C; 2 = A; 3 = D; 4 = B
Traders’ positions get reported to the government after their sizes reach reporting levels. Those levels differ from market to market. Position limits indicate the maxi-mum number of contracts that a speculator is allowed to hold in any given market. Hedgers are exempt from position limits. Many traders are shocked to learn that trading on many kinds of inside information is perfectly legal in the futures markets.
Answer 6-11: 1 = D; 2 = A; 3 = B; 4 = C
Commercials deal in commodities in the normal course of their business and use futures to hedge inventory risks. Large speculators are those whose positions reach or exceed reporting levels. If you subtract the holdings of those two groups from open interest, you’ll find out how many contracts are held by small traders who often wind up on the wrong side of market trends. Corporate insiders are officers of publicly traded firms and those who hold 5 percent or more of company shares.
Answer 6-12: D
Buying by corporate insiders is a strong bullish sign, but you need to see a bullish confirmation from price action. At 11 months, the bear market is old. Nobody will ring a bell to advertise the start of a bull market. As an investor, it’s time to start slowly accumulating the stock you’ve selected.
122 ANSWERS
■■ Rating Yourself
0–4 correct: poor.
If you don’t trade stocks, you may skip NH-NL, but if you plan to trade stocks or stock index futures or options, you owe it to yourself to learn how to use the best leading indicator of the stock market. Indicators of mass psychology provide unique insights into the forces that move markets, and it’s important to understand how they work.
5–8 correct: fairly good.
You have a decent grasp of the indicators that measure mass market behavior. This may be enough if you only want a general understanding of the concept. If you plan to use them in trading, reread the appropriate chapter, look up the answers to the questions you missed, and retake this test several days later.
9–12 correct: excellent.
You understand the essential stock market indicators. They help you recognize when the market is in a top or a bottom area. Armed with this knowledge, you can use computerized indicators (see Part 4) to fine-tune your entries and exits.
■■ Recommended Reading
Elder, Alexander & Kerry Lovvorn. The New High–New Low Index (Alabama: SpikeTrade, 2012).
Neill, Humphrey B., The Art of Contrary Thinking (1954) (Caldwell, ID: Caxton Printers, 1985).
Answer 7-1: C (I, II, III, and IV)
Trends may point in different directions at the same time in different timeframes: for example, up on the daily chart but down on the weekly, or vice versa. A trend-following indicator may be giving a buy signal, while an oscillator is giving a sell signal, or vice versa. The Triple Screen trading system is designed to manage those contradictory signals.
Answer 7-2: B
The Triple Screen trading system begins by identifying the trend on a chart one order of magnitude greater than the one you are planning to trade. Find the trend on the weekly chart and then look for entry points in that direction on the dailies. If you begin by analyzing the daily chart and only check the weekly chart later, your eyes will be prejudiced by what you saw on the daily chart. A monthly chart is too far removed from the daily—the timeframes of two charts should relate to one another by a factor of five. A weekly bar contains the data from 5 daily bars.
Trading Systems
S E V E N
123
124 ANSWERS
Answer 7-3: C
Keeping good records is essential for testing a system. Start at the beginning of your data file and move forward one day at a time, recording each signal and planned actions. Watching signals emerge and gradually deliver paper profits and losses is the closest you can get to real trading without risking money. If you like what you see and start trading that system in your account, keep your positions small. Concen-trate on learning how the system works in the real world before gradually increasing position size. Since you cannot know exactly how others may use this system, their feedback is not nearly as meaningful as your own results.
Answer 7-4: B
The entry, the target, and the stop are the three essential numbers for every trade—you must write them down before you enter. They provide the structure for every trade, allowing you to compare risk and reward and decide what size to trade. A trade without these numbers is not a trade but a gamble. Counting profits in an open trade will only distract you from managing that trade.
Answer 7-5: B
A directional trader has three choices: buy, sell, or stand aside. The first screen of Triple Screen acts as a censor that takes away one of those choices. You may look for trades only in the direction of the long-term timeframe or stand aside.
Answer 7-6: C
When the first screen of the Triple Screen trading system points up, use declines of a short-term oscillator to find buying opportunities. When the first screen points down, use rallies of a short-term oscillator to identify shorting opportunities. This rule helps avoid chasing uptrends and downtrends. In this example, the short-term oscillator is already overbought; wait for it to decline before going long.
Answer 7-7: B
When the weekly trend is up but the daily trend is down, Triple Screen points to a buying opportunity. One of the options is to place a buy-stop above the last day’s high to catch a short-term upside breakout.
Answer 7-8: C
The uptrend of Bed, Bath & Beyond Inc. (BBBY) on the weekly chart is confirmed by its rising EMA as well as the uptrend of MACD-Histogram. The weekly uptrend leads to a strategic decision to look only for buying opportunities on the daily chart. There we see a pullback to the EMA, while the Force Index below zero indicates an oversold condition. According to Triple Screen, pullbacks on the daily charts during weekly uptrends signal buying opportunities. Place a buy order above the latest daily high. The fact that the weekly and daily trends are in conflict is a normal occurrence in the markets—it is the purpose of the Triple Screen to resolve such conflicts to your benefit.
TRADING SYSTEMS 125
Answer 7-9: 1 = C; 2 = A; 3 = B; 4 = C
When the weekly trend is up and the daily trend is down, use those declines to catch buying opportunities. When the weekly trend is down and the daily trend is up, use those rallies for entering shorts. Trying to enter a trade when both weekly and daily trends are moving in the same direction is like hopping aboard a moving train. It can be done, but it’s safer to wait for a pullback.
Answer 7-10: A
The slope of the fast EMA tracks the market’s inertia, while the slope of the MACD-Histogram reflects the direction of market power. The primary role of the Impulse system is not to tell traders when to buy or sell. Rather, it shows them when they’re prohibited from buying or shorting. It is a censorship system, and when the Impulse system is red, it prohibits buying. It removes that prohibition when its color changes from the bearish red to a neutral blue or a bullish green.
Answer 7-11: 1 = A; 2 = C; 3 = B; 4 = C
The color of the Impulse system depends on its two components—an EMA and MACD-Histogram. When both are rising, the Impulse turns green—bullish, pro-hibiting short trades. When both decline, the Impulse turns red—bearish, forbid-ding buying. When these two components contradict one another, the Impulse turns blue—neutral.
Answer 7-12: 1 = E and H; 2 = A and C; 3 = B, D, F, G and I
The Impulse system is a censorship system. When both the EMA and MACD-Histo-gram turn down, coloring the bar red, it prohibits buying. When both indicators turn up, coloring the bar green, shorting is not allowed.
The Impulse system shouldn’t be used as an automatic trading method: while it catches every trend, it would subject an automatic trader to multiple whipsaws, for example, in the area between the letters C and G. Its best signals emerge when red or green colors disappear. For example, the disappearance of red at the bar G showed that the double bottom was being completed and suggested buying. The disappear-ance of green at the bar I signaled the approaching end of a powerful upswing and suggested taking profits.
Answer 7-13: A
At the right edge of the chart, both the EMA and MACD-Histogram are rising—the Impulse system would color that bar green. Had both indicators been declining, the bar would be red; had they pointed in opposite directions, the bar would be blue. This is important to keep in mind if you want to find the Impulse color at the right edge of a chart using software that doesn’t let you actually color the bars.
126 ANSWERS
Answer 7-14: C
There is no mystery in constructing a channel. Keep adjusting its width until it con-tains the bulk of prices, leaving out only the most extreme highs and lows for the past 50 to 100 bars. Prices moving outside of a well-drawn channel identify zones of unsustainable optimism or pessimism, where the market is likely to reverse. Keep in mind that on rare occasions the market may stay outside of its channel for a longer time—but that’s an exception that confirms the rule.
Answer 7-15: 1 = C; 2 = A; 3 = D; 4 = B
A moving average reflects the average consensus of value. A channel tracks the boundaries between normal and abnormal price action. The market is undervalued when it falls below its lower channel line and overvalued when it rises above its up-per channel line. The channel coefficient needs to be adjusted until a channel con-tains 90 percent to 95 percent of the price action for the past 50 to 100 bars.
Answer 7-16: A
The slope of a channel provides important information. When it rises, it shows that the market is bullish. When it falls, the market is bearish. When it is flat, the mar-ket is neutral. A breakout in the direction of the channel slope indicates a powerful trend; a return to the moving average almost always offers a good opportunity to trade in the direction of the trend. Swings between the walls of a flat channel also provide good trading opportunities. Buying and selling at the moving average isn’t always a good idea. It tends to work when a channel is slanted but not when it is flat.
TRADING SYSTEMS 127
■■ Rating Yourself
0–6 correct: poor.
Not understanding trading systems is dangerous—trading without a system is like sailing without a rudder. Please take the next few days to reread the relevant section of the book, and retake this test before proceeding any further.
7–11 correct: fairly good.
You have a working grasp of the essential concepts of trading systems. This level of knowledge may suffice elsewhere but not in dealing with trading systems. You must know them inside out—they help you survive and prosper in the markets. Please review your answers and look for your weak spots. Then reread the relevant section and retake this test.
12–16 correct: excellent.
You have mastered the essentials of trading systems. Please review those questions for which your answers differed from those given in this book. See whether the dis-crepancies were due to errors or to your own trading style. Successful traders are creative and can have differences of opinion. Then proceed to the next highly impor-tant topic—selecting the markets you’ll trade.
■■ Recommended Reading
Kaufman, Perry, Trading Systems and Methods (Hoboken, NJ: John Wiley & Sons, 2013).

129
Answer 8-1: C
Trading liquid high-volume vehicles helps reduce slippage. Volatile fast-moving in-struments offer more opportunities. It pays to focus on the markets whose main trading hours are close to your own time zone, so that you’re awake while the action is taking place. Popularity isn’t a key factor: some of the best opportunities occur in the markets that aren’t popular but are fine to trade, as long as they have good liquid-ity and volatility.
Answer 8-2: D
Bonds represent loans, while shares represent company ownership. You’d have to buy a great number of them to become an insider. In the United States, for manda-tory reporting purposes, corporate insiders are defined as a company’s officers and directors and the owners of more than 10% of its equity securities. It’s a dangerous misconception to expect the price of a stock to rise if the company makes money. If a company was expected to report a $100 million profit in a quarter but announced a $70 million profit, its shares are likely to take a hit from disappointed holders when earnings are reported.
Trading Vehicles
E I G H T
130 ANSWERS
Answer 8-3: D
Warren Buffett says that when you buy a stock you become a partner of a manic-depressive fellow he calls Mr. Market. Each day he wants to buy your shares or sell his shares to you. Occasionally, Mr. Market becomes so depressed that he offers you his shares on the cheap—and that’s when you should buy. At other times he becomes so manic that he offers a crazy price for your shares—and that’s when you should sell. This is, in a nutshell, a reminder to buy low and sell high.
Answer 8-4: A
Each ETF holds a selection of various assets, such as stocks from specific industry groups or countries, commodities, or bonds. With a huge number of ETFs available to traders, the choices are vast, but ETF performance lags due to administrative expenses, always one of the key factors for long-term results. Prices of many ETFs grossly diverge from prices of asset groups they are supposed to track.
Answer 8-5: I = B; II = D; III = A; IV = C
A call is a bet that a stock will rise, while a put is a bet that it’ll decline. Buying a $40 call when the underlying stock is trading at $38 makes that call out-of-the-money: its entire price represents hope that the stock will rise above $40. If and when it does, that call will be in-the-money.
Answer 8-6: C
Options lose value as they near their expiration date; they gain value as the stock approaches the option exercise price. Options for volatile stocks tend to be more expensive because their prices can swing more than those of less volatile stocks. How closely a stock tracks its industry group is not a factor in its option pricing.
Answer 8-7: I = A and D; II = B and C; III = C and D
The person who buys a call can profit only if the underlying stock rises; if it falls or even stays flat, the winner will be the trader who wrote that call. A put buyer will profit only if the underlying stock falls; if it rises or even stays flat, the option writer will profit. There are three possible scenarios for any stock: up, down, or sideways. Only one out of three works for the option buyer, but two work for the option writer.
Answer 8-8: B
Begin by analyzing the underlying security, decide what level it’s unlikely to reach, and then sell an option beyond that level. Going online to look up a stock’s Delta will help you identify that level. You also need to decide at what level the underly-ing security would prove you wrong and prompt you to exit. Placing an actual stop for an option would expose you to the running of open orders, which is a common problem in options. Better write down your stop and place an order to exit after the underlying security gets there. Consider banking a small percentage of your profits in an insurance account for the day when an option you wrote jumps sharply against you.
TRADING VEHICLES 131
Answer 8-9: D
The number of long and short contracts for every option and future is always equal by definition. A huge difference between options and futures is that if you buy an op-tion and its price moves against you, you can abandon it and walk away, losing only what you paid for it. There is no walking away from futures—you must either take a loss or send in additional margin to support a deepening loss. All other differences are minor in comparison with this one.
Answer 8-10: B
Daily price limits, contract expirations, and legal insider trading are challeng-ing enough, but the riskiest factor in futures is that people can trade them on very small margins, as low as 5% of contract value. When your $5,000 deposit controls $100,000 worth of a commodity that moves 5% in your favor, you’ll double your money. Trouble is that if it moves against you by a few percentage points, it’ll wipe out your margin. You must be absolutely disciplined and have excellent money man-agement skills to profit from futures.
Answer 8-11: I = C; II = D; III = A; IV = B
Demand for any commodity changes slowly, but the market can react violently when supply becomes threatened. Spread traders bet on a resumption of normal market relationships; when two related markets go out of sync, they buy the underpriced one and short the overpriced one, waiting for their relationship to return to normal. Remote delivery months are normally more expensive due to the “cost of carry,” such as storage and insurance, but in bull markets, when demand is red-hot, futures can become inverted, with a premium for early delivery. Hedging is the economic foundation of the futures markets: a farmer can sell wheat futures long before har-vesting his grain while an airline can buy gasoline contracts months or even years before it needs airplane fuel.
Question 8-12: B (I and II)
The forex market is completely decentralized; institutional traders deal directly with each other, using online platforms. Retail customers come to grief when forex houses take the opposite sides of their orders instead of transmitting them to the market—for you to win, the forex house must lose. Wild margins in the hands of un-sophisticated traders turn into a “get-poor-quick” tool. Forex houses seldom charge commissions, but many profit from positioning themselves against their customers.

132 ANSWERS
■■ Rating Yourself
0–4 correct: poor.
Whatever you trade, you need to understand the key factors about that market. Lacking that knowledge, you’ll become an easy mark for sharp operators and end up losing. Please take the next few days to reread the relevant section of the main book, and retake this test before proceeding any further.
5–8 correct: fairly good.
You have a working grasp of at least some classes of trading vehicles. If all your an-swers about stocks or options were correct and those are the only markets you ever trade, that might be sufficient. To obtain a deeper knowledge of all classes of trading vehicles available to you, please reread the relevant section, and retake this test.
9–12 correct: excellent.
Your knowledge of trading vehicles is very good. Please review the questions whose answers you missed and look up the relevant pages in the book. Then proceed to the next highly important topic—risk management.
133
Answer 9-1: B
Emotional trading is the enemy of success. Nobody can get high and consistently make money. A trader can get away with emotional trading for a short while, but unchecked greed and fear will destroy any account. Your goal must be to make the most intelligent trades, calmly weighing potential gains and limiting risks.
Answer 9-2: C
We all like to think we’re smart—taking losses hurts our egos. Taking a loss means giving up hope that a trade will work out—and nobody likes to live without hope. Good traders are realists; hanging onto a losing trade is not a sound tactic.
Answer 9-3: B
A reluctance to take a loss is a sign of emotional trading. Adding to a losing trade shows that the trader is hanging on to a fantasy of winning rather than facing the real-ity of a loss. For a loser, a dream is alive as long as he holds his position. In fact, if you entered a trade on a set of indicator signals and those indicators reversed, what’s the rationale for staying in that trade? It is not working out—get out to preserve your capital and look for a better trade.
Risk Management
N I N E
134 ANSWERS
Answer 9-4: C
A series of three losses can wipe out trader A, but trader B can survive a streak of 9 losses. Trader A is only three throws away from going bust, while trader B has enough capital to sustain him through 9 unlucky throws. All other factors being equal, the poorer of the two traders will go broke first.
Answer 9-5: B (II, III, I)
The first goal of money management is to ensure survival. The second is to earn a steady rate of return, and the third is to earn high returns—but survival comes first. That’s how professionals trade; many beginners have their priorities backwards.
Answer 9-6: D (I, II, III, and IV)
All of these money management rules have stood the test of time. Follow them—let your competitors violate them.
Answer 9-7: A (I)
Counting money in an open trade flashes a red light—a warning that your emotions are kicking in and you’re about to lose because they will override your intellect. If you cannot get money off your mind, get out of a trade. The time to set profit targets and stop levels is before the trade. The time to track your equity is after the trade has been closed.
Answer 9-8: C
The 2% Rule dictates your maximum dollar risk per trade. Two percent of a $28,000 account is $560, which must cover not only your risk but also slippage and commis-sions. With a stop 98 cents away, if you buy 500 shares, you will have enough left to pay commissions and cover any possible slippage. Trading a bigger size would be reckless.
Answer 9-9: B (I and II)
It’s dangerous to count money in open trades because it leads to thinking about what your paper profits will buy. That’s how people start dreaming, instead of managing trades, and lose money. Moving a target or raising a stop is permitted.
Answer 9-10: D (I, II, III, and IV)
Serious traders place a stop the moment they enter a trade and adjust it only one way—in the direction of that trade. When you go long, you may keep your stop in place or raise it but never lower it. When you go short, you may keep your stop in place or lower it but never raise it.
Answer 9-11: C (I, II, and III)
A stop-loss order limits your risk, but it doesn’t always work as expected. Prices may gap across a stop. A stop isn’t a perfect tool, but it’s the best defensive tool that we have.
RISK MANAGEMENT 135
Answer 9-12: B (II and III)
Trader A is risking $400, while the 2% Rule allows him to risk no more than $360. Trader B is risking $800, while the 2% Rule permits him to risk up to $1,000. Trader C is risking $400, while the 2% Rule permits him to risk up to $800. Trader D is risking $1,500, while the 2% Rule allows him to risk up to $1,200. Traders B and C accept businessman’s risks, while traders A and D are risking real losses. The 2% Rule sets a clear limit on your risk per trade—it’s an easy rule to follow, unless greed raises its ugly head.
Answer 9-13: D (II and IV)
The two deadly errors in trading are not using stops and putting on trades that risk more than your account can afford. Other mistakes are bad enough, but if you use stops and trade a reasonable size, at least they won’t kill your account.
Answer 9-14: D
The Iron Triangle asks three simple questions: what is your maximum acceptable dollar risk for this trade? Where will you enter this trade? Where will you place your stop? The distance from your entry to your stop is your risk per share. Dividing your total acceptable risk by your risk per share will give you the maximum number of shares you may buy or sell short in this trade.
Answer 9-15: C
A series of even relatively small losses can add up to a serious drawdown. The 6% Rule protects you by making you stop trading early in a drawdown. It creates a cooling off period: review your system, study the markets, and return to them the following month.
Answer 9-16: A
The 6% Rule doesn’t concern itself with profits. Its job is to manage risk and limit drawdowns. You will count profits at the end of the month. If your equity has in-creased, both the 2% and the 6% Rules will give you more available risk the follow-ing month.
Answer 9-17: B
Losses traumatize traders. Returning to the market after a break you need to be gentle to yourself. Reduce the amount of risk you accept on each trade. Set realistic performance targets, and gradually increase your trading size.
136 ANSWERS
■■ Rating Yourself
0–6 correct: poor.
The red light is on—you do not understand money management. Before you make another trade with real money, study the relevant chapters and retake this test.
7–12 correct: so-so.
There are gaps in your understanding of risk management. This topic is too impor-tant to settle for anything but the top score on this test. Please review your answers to the questions that you missed, review the relevant chapters, and retake this test a few days later.
13–17 correct: excellent.
You have a working command of the essential money management rules. Review the questions where your answers differed from those in this book. Money manage-ment sets a protective wall around your account. Look for every gap in that wall and plug it up.
■■ Recommended Reading
Vince, Ralph. Portfolio Management Formulas (Hoboken, NJ: John Wiley & Sons, 1990).

137
Answer 10-1: B
Depending on how bullish you feel, you may buy a breakout above yesterday’s high, a pullback to value, or a penetration of the value zone to the depth at which previous pullbacks bottomed out. It is generally not a good idea to go long above the channel. The upper channel line marks the zone where bullishness becomes manic, and even though it may continue, it is more likely to reverse.
Answer 10-2: B
When the trend is up, it makes sense to buy pullbacks below value. The average of the previous three months’ penetrations was less than $3. There is no point in being greedy and trying to nail the very bottom of a pullback—catching a $1 penetration would be more reliable than a $3 one.
Answer 10-3: A
A well-designed channel contains the majority of market swings, making its upper boundary a good target for rallies. A trade that captures 30% of the channel height earns an A. In an uptrend, we should expect prices to rise by a greater amount above the EMA than they dipped below it on a pullback. By the time the moving average turns down, a paper profit may turn into a loss.
Practical Details
T E N
138 ANSWERS
Answer 10-4: D
With long-term position trades, one has to be leery of using such profit-taking tools as moving averages, envelopes, and indicator divergences. If you plan to hold for sev-eral months, those sensitive tools would get you out of the trade too soon. It’s better to set profit targets using support and resistance zones.
Answer 10-5: C
Setting stops and profit targets allows us to calculate reward/risk ratios. To the an-noyance of most traders, whipsaws happen, as markets reverse in their favor right after they got stopped out. Stops provide generally reliable means of protecting your account, but unfortunately, don’t guarantee limiting your maximum risk because prices can gap across stop levels.
Answer 10-6: C (I, II, and III)
Placing stops outside of the zone of market noise helps reduce whipsaws. Channels, SafeZone, and ATRs draw the line between normal and abnormal swings, each in its own way. Not so support and resistance: buying very close to support still exposes us to market noise.
Answer 10-7: D (I, II, III, and IV)
Stay away from the crowd: a highly visible price extreme attracts too many stops. So do round numbers. Place your stops slightly away from both. A stop is a risk manage-ment tool, and as a trade moves in your favor, you can relocate your stop to protect a share of your profit. Never move your stop to give more room to a losing trade.
Answer 10-8: C
When going long, you want to buy as close to the low of the bar and as far from the high of the bar as possible. The range of the day was $2 ($23 minus $21). You bought $1.50 away from the high. Dividing $1.50 by $2 shows that your grade was 75%—excellent! Any buy grade above 50% is good because it shows that you bought in the bottom half of the bar.
Answer 10-9: A
You want to sell as close to the top of the bar and as far from the low of the bar as possible. The range of the day was $3 ($29 minus $26). You sold $1 away from the low. Dividing $1 by $3 shows that your grade was 33%—so-so. A good sell grade would be above 50%, meaning you sold in the top half of the bar.
Answer 10-10: B
Of the three grades for every trade—buy, sell, and overall trade grade—the trade grade is the most important. Since channels are drawn to contain 90 to 95% of re-cent prices, the height of the channel on the day you enter reflects a realistic maxi-mum available gain. Taking one third or more of a channel earns an A grade for the trade. In this example, you took $2 out of a $6 channel—very good!
PRACTICAL DETAILS 139
Answer 10-11: C
A good scan can find a group of candidates on which to focus your attention, but it doesn’t guarantee profitable trades. Begin by defining the pattern to look for, and then cast your scanning net as wide or as narrow as you like. Start out scanning a small group, and you can expand later.
Answer 10-12: A
You have unlimited choices in setting up scan parameters. You may program it to exclude stocks whose volume is too low, whose prices are outside of your preferred range, or whose trend clashes with your current market view. What you can’t do is filter out unprofitable stocks—this is something you take your best shot at during the final review process, when you analyze the list of candidates delivered by your scan.
140 ANSWERS
■■ Rating Yourself
0–4 correct: poor.
This score is way too low for a trader. This may not matter for a theoretical analyst, but a trader should reread the relevant chapters and retake the test before going any further.
5–8 correct: fairly good.
There are gaps in your understanding of practical concepts. It is important to know how to set entries, targets, and stops, and how to measure your performance in every trade. Please review your answers to the questions that you missed, reread the rel-evant chapters, and retake this test a few days later.
9–12 correct: excellent.
You have a working knowledge of setting up entries, targets, and stops, and mea-suring your performance. Different traders use different tactics—please review the questions for which your answers differed from those in this book to see whether you’ve made a mistake or it was an honest difference of opinion.

141
Answer 11-1: C
Keeping good records will help you learn from your experiences, improve disci-pline, and reduce impulsivity. It will not prevent you from making mistakes, but it’ll help you learn from them and stop repeating them.
Answer 11-2: B
Reviewing yesterday’s performance and adjusting stops are important, but the pur-pose of morning homework is to focus on factors likely to be relevant for today’s trading. They may include the behavior of the overnight markets, review of funda-mental reports scheduled for release today, and all other factors meaningful to your decision making.
Answer 11-3: B (II and III)
There are days when your health, mood, and homework make you well-prepared for trading. There are also days when your health bothers you, your mood is gloomy, and you’ve done little if any homework—on those days you shouldn’t trade. A quick self-test, tailored to your personality, can give you an objective measure of your readiness for trading. Don’t increase trade size when everything is perfect because on such days any change can only be for the worse.
Good Record-Keeping
E L E V E N
142 ANSWERS
Answer 11-4: D
You need to define the strategy you’ll use for a trade and set up your entry, target, and stop. Allocating a set amount of risk to a trade will allow you to use the Iron Triangle of risk control to decide how many shares or contracts you’ll trade. It is better not to count profits until a trade is closed—concentrate on quality, and the money will follow.
Answer 11-5: B (II and IV)
The structure of a trade Apgar is simple: no more than five questions, with no more than three possible answers to each of them. A trade Apgar leads you on a quick re-view of whether a stock deserves a trade plan. If not, move on to the next candidate, but if yes, then work up a detailed trade plan.
Answer 11-6: D (I, II, III, and IV)
A Tradebill is a key planning and tracking document for a trade. You need to identify the strategy you’ll trade; set the entry, target, and stop; allocate risk; and calculate the trade size. It also needs to include written reminders of the essential factors, such as the dates of earnings reports.
Answer 11-7: C (I, II, and III)
It’s essential to document your stops as well as the levels at which you’ll move them to breakeven. Such decisions are best made very early in a trade. Same with the diary—document your entry while the memory is still fresh. It is better not to count profits while a trade is open—concentrate on trade management and count profits after you exit a trade.
Answer 11-8: D
Most private traders work in isolation and receive no feedback. This makes review-ing your past trades an especially valuable learning device. There is a Russian saying: “Don’t step on the same rake twice.” When you step on a rake lying in the grass, it stands up and hits you on the forehead. It can happen to anyone, but don’t step on it again. Reviewing past trades helps you remember where those rakes are.
Answer 11-9: C
All of the actions listed in this question are important, but the most educational one is returning to each trade several weeks or even months after you exited it and re-viewing an updated chart. By then, trends and reversals are clear, you can see exactly what you did right or wrong—and use those lessons going forward.

GOOD RECORD-KEEPING 143
■■ Rating Yourself
0–3 correct: poor.
Good record-keeping is at the heart of trading success. Please reread the relevant chapters, and retake the test before going any further.
4–6 correct: fairly good.
Good record-keeping is directly linked to better trading. It is a fairly simple but es-sential skill—don’t settle for a “fairly good” rating. Review your answers to the ques-tions you missed, reread the relevant chapters, and retake this test a few days later.
7–9 correct: excellent.
You have a working knowledge of record-keeping. Please be sure to implement it—start keeping a trading diary. It’ll repay your efforts and serve you well for years ahead.


Afterword
145
Now that you have tested your knowledge of trading by using this book, you’re better prepared for the biggest test of all—trading in the markets. Financial
trading is a never-ending test of your ability to think straight under stress, make in-telligent and unemotional decisions, and stay in control of the money in your account.
This book has given you several rating scales for measuring your skills; it has provided a reading list and has allowed you to retake the tests that you failed at first. The main rating scale of your market performance will be the slope of your equity curve. The best curves show a steady growth of an account, with small drawdowns. You need to keep track of your equity and stop trading for the rest of the month if it drops more than 6 percent from the end-point of the preceding month.
Be sure to keep a diary of your trades, including not only dates, tickers, and sizes but also charts and your personal comments. This will help you learn from your ex-periences and improve your performance.
I keep all my records in a Trade Journal at SpikeTrade.com, whose format has been sharpened and polished over the years. Even if you want to design your own record-keeping system, take a good look at the Trade Journal to see how a good sys-tem should look and work.
Keep quiet about your trades while they are open. Talking about open positions is dangerous because it puts your ego on the line. Once a trade is closed out, you can benefit from the opinions of friends you respect.

146 AFTERWORD
The fact that you invested the time and energy in studying and taking the tests in this book shows that you are serious about trading. Continue to study the markets, keep your cool, and focus on growing your account equity with minimal drawdowns. I wish you success in fulfilling your dream—trading for a living.
Dr. Alexander ElderNew York–Vermont, 2014.
This Study Guide is based on the author’s book The New Trading for a Living (Hobo-ken, NJ: John Wiley & Sons, 2014). In addition, the following books contain
useful information for a deeper understanding of these questions and answers:
Belveal, L. Dee, Charting Commodity Market Price Behavior (1969) (Homewood, IL: Business One Irwin, 1985).
Douglas, Mark, The Disciplined Trader (New York: New York Institute of Finance, 1990).
Edwards, Robert D., and John Magee, Technical Analysis of Stock Trends (1948) (New York: New York Institute of Finance, 1992).
Elder, Alexander & Kerry Lovvorn, The New High–New Low Index (Alabama: SpikeTrade, 2012).
Kaufman, Perry, Trading Systems and Methods (Hoboken, NJ: John Wiley & Sons, 2013).
LeBon, Gustave, The Crowd (1897) (Atlanta, GA: Cherokee Publishing, 1982).
Lefevre, Edwin, Reminiscences of a Stock Operator (1923) (Greenville, SC: Traders Press, 1985).
Mackay, Charles, Extraordinary Popular Delusions and the Madness of Crowds (1841) (New York: Crown Publishers, 1980).
Murphy, John J., Technical Analysis of the Financial Markets (New York: New York Institute of Finance, 1999).
Sources
147

148 SOURCES
Neill, Humphrey B., The Art of Contrary Thinking (1954) (Caldwell, ID: Caxton Printers, 1985).
Pring, Martin J., Technical Analysis Explained, 5th edition (New York: McGraw-Hill, 2013).
Vince, Ralph, Portfolio Management Formulas (Hoboken, NJ: John Wiley & Sons, 1990).

Alexander Elder, MD, is a professional trader and teacher of traders. He is the author of several best-sellers, considered modern classics among traders. He
has also written books about Russia and New Zealand.Dr. Elder was born in Leningrad and grew up in Estonia, where he entered medi-
cal school at the age of 16. At 23, while working as a ship’s doctor, he jumped a Soviet ship in Africa and received political asylum in the United States. He worked as a psychiatrist in New York City and taught at Columbia University. His experience as a psychiatrist provided him with unique insight into the psychology of trading.
Dr. Elder is an active trader, but he continues to teach and is a sought-after speak-er at conferences in the United States and abroad. Dr. Elder is the originator of Trad-ers’ Camps—week-long classes for traders. He is the founder of SpikeTrade group, a community of traders whose members share their best stock picks each week in competition for prizes.
Dr. Elder’s websites are www.elder.com and www.spiketrade.com.
About the Author
149

WILEY END USER LICENSEAGREEMENT
Go to www.wiley.com/go/eula to access Wiley’s ebookEULA.