Embed Size (px)
Citation preview
1
The neurophysiology of decision-making as awindow on cognition
Michael N. Shadlen1 and Joshua I. Gold2
1 Howard Hughes Medical Institute, Department of Physiology& Biophysics and National Primate Research Center,University of Washington Medical School, Box 372790,
Seattle, WA 98195-7290
2 Department of Neuroscience, University of Pennsylvania,Philadelphia, PA 19104-6074
“Would any one trust in the convictions of a monkey’s mind,if there are any convictions in such a mind?”
Charles Darwin (1881, letter to W. Graham)
Nervous systems extract sensory information from the
environment to guide behavior. The underlying neural
mechanisms have been studied extensively, in part by
identifying neurons with responses linked deterministically
to sensory and motor events. Higher nervous systems are
also capable of widespread cognitive abilities, including
interpretation, decision-making, valuation, intention,
language, and learning. The mechanisms underlying these
abilities is less clear, in part because they seem beyond
2
the scope of the machine-like behavior of sensory and motor
neurons. This chapter examines this conundrum: How do
properties of neurons and neural circuits give rise not
just to reflexive sensory and motor abilities, but to
cognition, as well? We suggest that an answer can be found
in circuits that link sensory input to motor output. Here,
transformations of sensory and motor signals reflect the
kinds of nuance and flexibility that are hallmarks of
cognition.
Several lines of evidence show that sensory-motor and
cognitive mechanisms interact in the brain. Psychophysical
measurements illustrate the many ways in which mechanisms
that link sensation and action are not reflexive: they take
a variable amount of time that can depend on the subject’s
strategy and other factors (Luce, 1986); they can involve
flexible associations between different sensory stimuli and
different actions (Murray et al., 2000; Wise and Murray,
2000); and they can be influenced by psychological factors
like bias, attention, and expected costs and benefits
(Carpenter and Williams, 1995; Reddi and Carpenter, 2000).
Clinical observations of patients with damage to
“association” areas of cortex, particularly in the parietal
and frontal lobes, have shown deficits in both sensory-
3
guided behavior and cognitive functions (Mesulam, 1985;
Feinberg and Farah, 1997). Neuroimaging studies have also
shown co-localization of function, with similar patterns of
activation in these association areas during certain
sensory-motor and cognitive tasks (Corbetta et al., 1998;
Acuna et al., 2002; Simon et al., 2002; Astafiev et al.,
2003).
Combined electrophysiology and psychophysics in monkeys
provides an opportunity to study how properties of neurons
and circuits of neurons provide these sensory-motor and
cognitive abilities. Here we describe advances in
understanding the neural mechanisms responsible for making
a decision about visual motion (Fig. 1). In part I, we
quantify decision formation in terms of a trade-off between
speed and accuracy. In part II, we show that the underlying
mechanisms involve neural activity that tends to persist
beyond sensory and motor events, accumulates over time a
“weight of evidence” that supports or opposes the
alternative decisions, and is related to motor intention.
In part III, we discuss the broader implications of these
findings. The mechanisms of decision formation appear well
suited for a variety of roles, from sensory-motor
processing to more complex aspects of cognition.
4
I. Psychophysics of decision-making
Decisions about noisy sensory signals involve an inherent
trade-off between speed and accuracy. Deciding quickly can
mean missing important signals. Taking more time can
provide more or better signals, but that time might be
wasted. We use the motion task to study the mechanisms
responsible for this trade-off. The random-dot stimulus
supplies a continuous source of noisy signals that can take
hundreds of msec for the brain to accumulate and interpret.
Thus, we can study the underlying mechanisms on a time
scale that is relatively long for neurons. Here we analyze
performance and show that information from the motion
stimulus appears to be accumulated over time until
sufficient evidence has been gathered to render a decision.
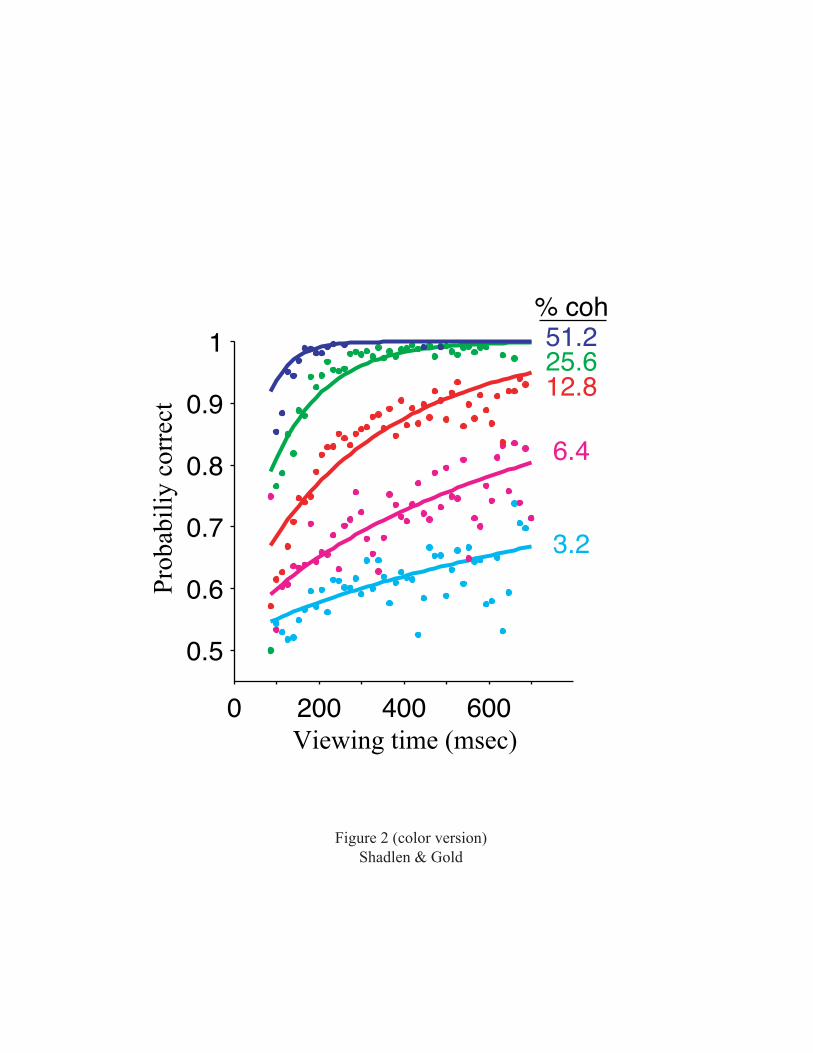
The most direct evidence for a temporal accumulation
of motion information comes from experiments in which the
time given to view the stimulus was varied randomly from
trial to trial (Fig. 1A). The percentage of coherently
moving dots was also varied. Performance accuracy was
affected by both variables (Fig. 2). At high motion
coherence (top curve), performance was perfect (no errors)

5
with greater than ~200 msec of motion viewing. At lower
motion coherences, performance improved with increased
viewing time, measured out to 700 msec, but never reached
perfect accuracy. The smooth curves fit to the data allow
us to infer properties of the signals in the brain that are
used to make the decision (Gold and Shadlen, 2000; Gold and
Shadlen, 2003). Information from the stimulus appears to be
accumulated throughout motion viewing without loss, as long
as it is needed to improve performance. Information gained
in the first 100 msec is simply added to information gained
in the next 100 msec, and so forth. This perfect
accumulation persists over a time scale that is at least an
order of magnitude longer than the time scale of neural
computations in the sensory cortex, which must keep up with
changes in the environment.
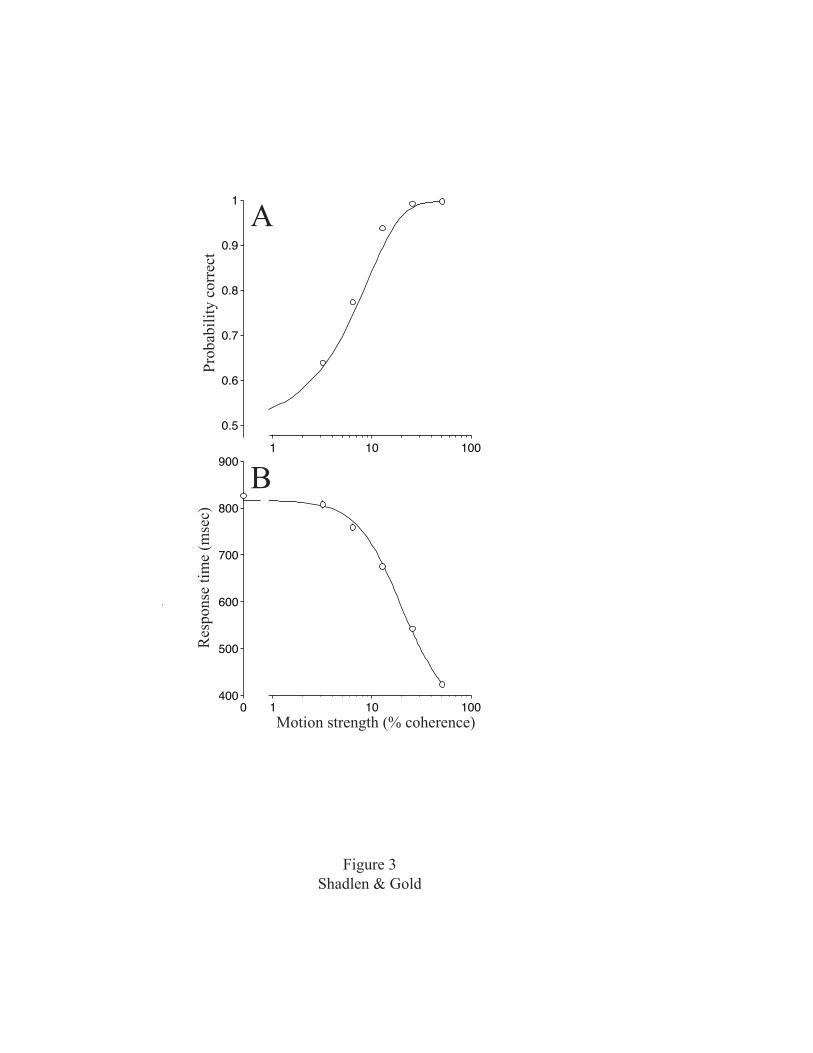
In a second set of experiments, the monkey, rather
than the experimenter, controlled the period of motion
viewing (Fig. 1B). The results from this type of experiment
are shown in Figure 3. In addition to a psychometric
function describing accuracy (Fig. 3A), we also obtain a
chronometric function of behavioral response time (RT)
versus motion strength (Fig. 3B). The RT was measured from
the time the random dots first appear to the time that the
6
monkey initiates an eye movement to indicate its choice of
direction. For high coherences, the task was easy and the
monkey took a short time to reach a decision. For
progressively lower coherences, the task was more difficult
and the monkey took progressively longer to reach a
decision.
Performance on the RT task is also consistent with a
decision process that accumulates noisy motion evidence
over time. In this case, the decision process terminates
and monkey issues a response when the amount of evidence in
favor of one of the alternatives reaches a criterion level.
The analysis of this kind of process has roots in
sequential analysis (a branch of statistical hypothesis
testing) and psychology (Wald, 1947; Stone, 1960; Laming,
1968; Link, 1992; Ratcliff and Rouder, 1998; Gold and
Shadlen, 2002; Usher et al., 2002). Here we emphasize an
analogy to the diffusion of a particle toward absorbing
barriers that lie on either side of its starting point
(Fig. 4).
Random-dot motion causes the brain to generate signals
that depend on the direction and strength of the motion
stimulus but are highly variable from moment-to-moment
7
(Shadlen and Newsome, 1994, 1998). We assume that the
accumulation of these signals will tend to drift in one
direction or the other, depending on the stimulus, but
because of the variability will meander like a particle in
Brownian motion. The process stops when the accumulation
reaches one of two barriers at ±B (Fig. 4; here the
barriers are stationary as a function of time, but, in
principle, that does not need to be the case). If the
accumulation reaches +B, a decision is rendered in favor of
one direction; if the accumulation reaches –B, the brain
renders the opposite decision. The value of B controls the
trade-off between speed and accuracy: larger values imply
more time to reach the barrier and thus more time to
accumulate signals, resulting in fewer errors (i.e.,
crossing the wrong barrier). The variability in the signals
being accumulated ensures that one of the barriers will be
reached, even when the evidence favors neither alternative
on average (i.e., 0% coherence), and accounts for both
errors and trial-by-trial differences in RT.
The smooth curves in Fig. 3 illustrate how well the
diffusion-to-barrier model can account for performance on
the RT task. The sigmoid curve fit to the RT data (Fig. 3B)
describes the hitting time of a particle in 1-dimensional
8
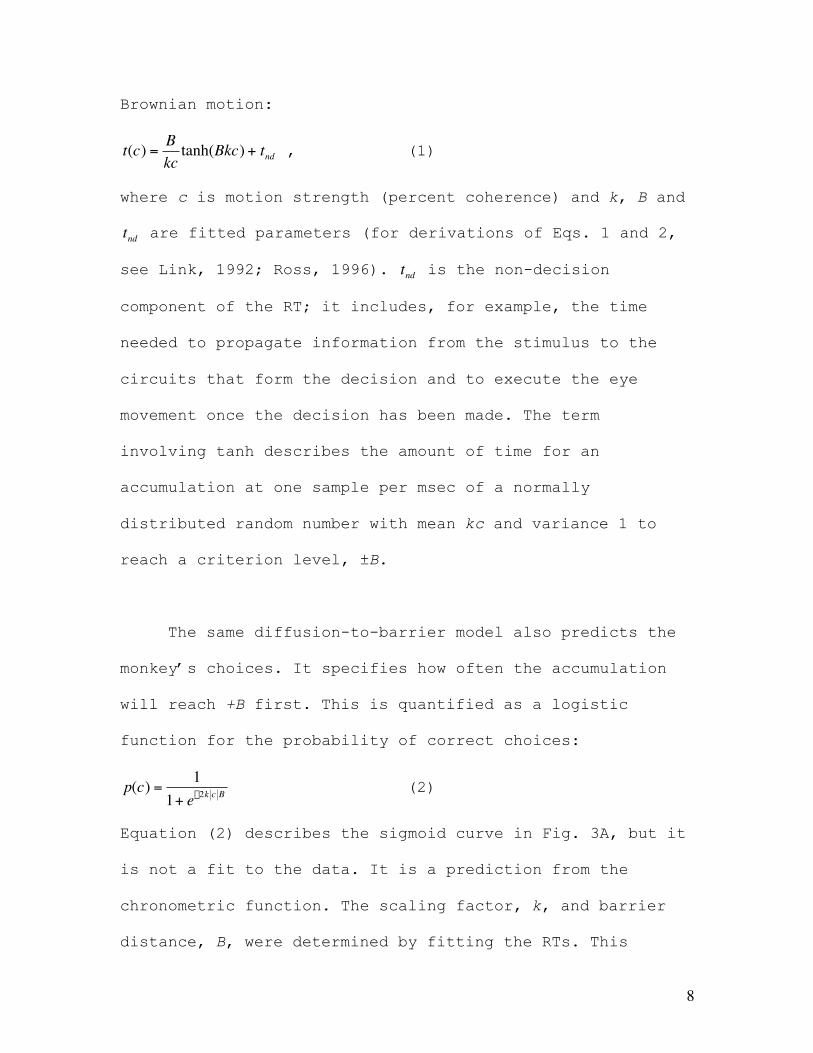
Brownian motion:
†
t(c) =Bkc
tanh(Bkc) + tnd , (1)
where c is motion strength (percent coherence) and k, B and
†
tnd are fitted parameters (for derivations of Eqs. 1 and 2,
see Link, 1992; Ross, 1996).
†
tnd is the non-decision
component of the RT; it includes, for example, the time
needed to propagate information from the stimulus to the
circuits that form the decision and to execute the eye
movement once the decision has been made. The term
involving tanh describes the amount of time for an
accumulation at one sample per msec of a normally
distributed random number with mean kc and variance 1 to
reach a criterion level, ±B.
The same diffusion-to-barrier model also predicts the
monkey’s choices. It specifies how often the accumulation
will reach +B first. This is quantified as a logistic
function for the probability of correct choices:
†
p(c) =1
1+ e-2k c B (2)
Equation (2) describes the sigmoid curve in Fig. 3A, but it
is not a fit to the data. It is a prediction from the
chronometric function. The scaling factor, k, and barrier
distance, B, were determined by fitting the RTs. This

9
leaves no free parameters to fit the psychometric function,
which nonetheless lies close to the data points. This close
match is emblematic of the success this kind of model has
had in explaining psychophysical data, including percent
correct, mean RT, and distributions of RT, on a wide range
of perceptual tasks (Link, 1992; Ratcliff and Rouder,
1998).
Both the variable-duration and RT experiments suggest
that there is a gradual evolution of a quantity, termed a
decision variable, that determines the monkey’s decision.
The decision variable grows, on average, in proportion to
the motion strength and viewing time. It represents the
accumulated evidence in favor of one proposition and
against another. As described in the next section, such a
decision variable has been identified in the brain of the
monkey.
II. Neurophysiology of decision-making
Early brain mapping studies using electrical
microstimulation in awake patients undergoing brain surgery
exposed extensive “silent” regions of neocortex that did
not seem tied to particular sensations or motor outputs
10
(Penfield and Roberts, 1974). These regions, found in the
parietal, temporal, and frontal lobes, were eventually
assumed to subserve higher “associative” functions.
Electrophysiological measurements in alert monkeys have
shown that neurons in these areas have complicated response
properties that are not simply locked to sensory or motor
events. Instead, the neural activity tends to persist
throughout delay periods. Such persistent activity is
likely to be a hallmark of the capacity for temporal
integration – holding a level of response until perturbed
to a new value – that underlies the computation of decision
variables. Here we describe neural signals that appear to
integrate over time a “weight of evidence” that supports or
opposes the alternative direction interpretations on the
motion task, thereby linking the interpretation of sensory
input to a motor output (in this case, the eye-movement
response).
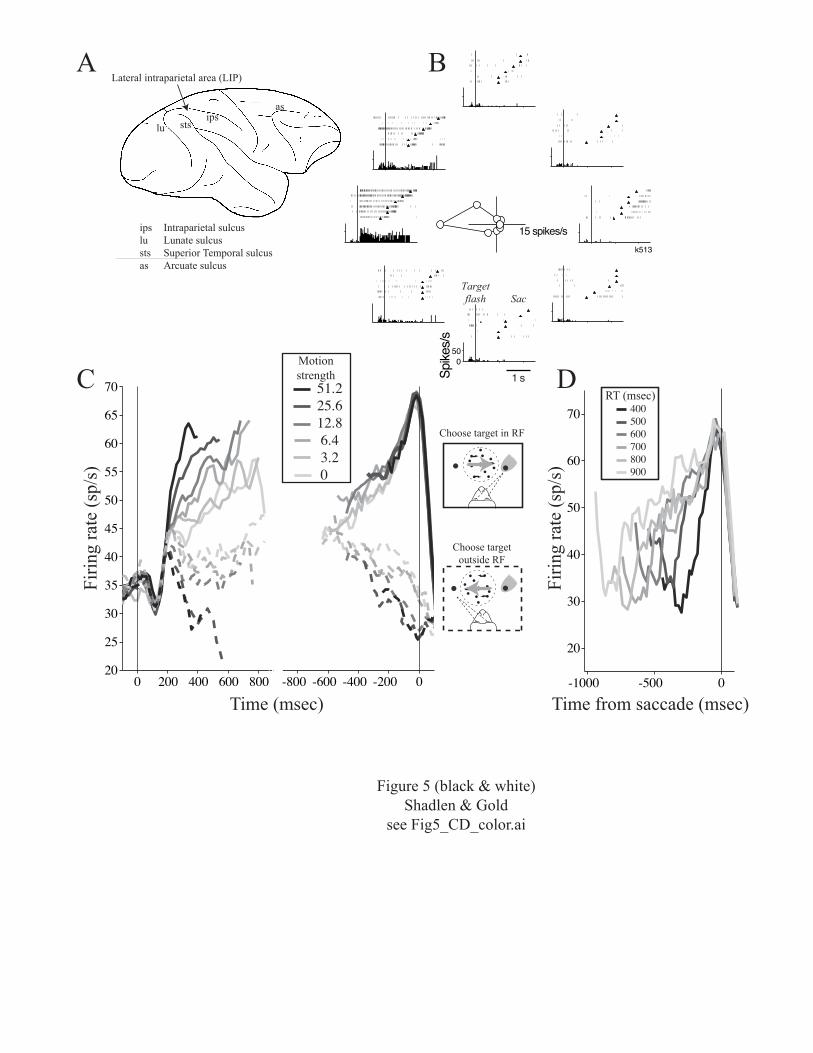
In one set of experiments, we recorded from neurons in
the lateral intraparietal area (LIP; Fig. 5A) (for reviews,
see Colby and Goldberg, 1999; Andersen and Buneo, 2002).
Using a saccade-to-target task, we selected neurons with
activity that persisted in a delay period between flashing
the target in the periphery and instructing the monkey to
11
initiate an eye movement to the target (Figure 5B). These
neurons are not purely sensory because they respond when
there is nothing present in the visual scene (after the
target has been turned off). They are also not purely
motor, because their discharge does not obligate an
immediate action. In our experiments, the persistent
activity corresponded to particular target locations,
termed the neuron’s response field (RF). This term is a
descriptive hybrid of “receptive field”, which implies
visual processing of the target, and “motor field”, which
implies processing the metrics of the impending eye
movement.
We used the motion task to test whether this
persistent activity represented a decision variable.
Instead of a flashed target, the direction of random-dot
motion indicated which eye movement to make. Not
surprisingly, the LIP neuron predicted whether or not the
monkey made an eye movement into the RF; that is, it
reflected the outcome of the process that formed the
direction decision. What is perhaps more surprising is that
the LIP responses also reflected the computations
underlying the decision process itself.
12
This result is best appreciated in the RT version of
the motion task (Roitman and Shadlen, 2002). The advantage
of this task is that the monkey indicates the end of the
decision process on every trial. Thus, we can study LIP
activity in the time epoch in which the monkey is forming a
decision but has not yet committed to an answer. The
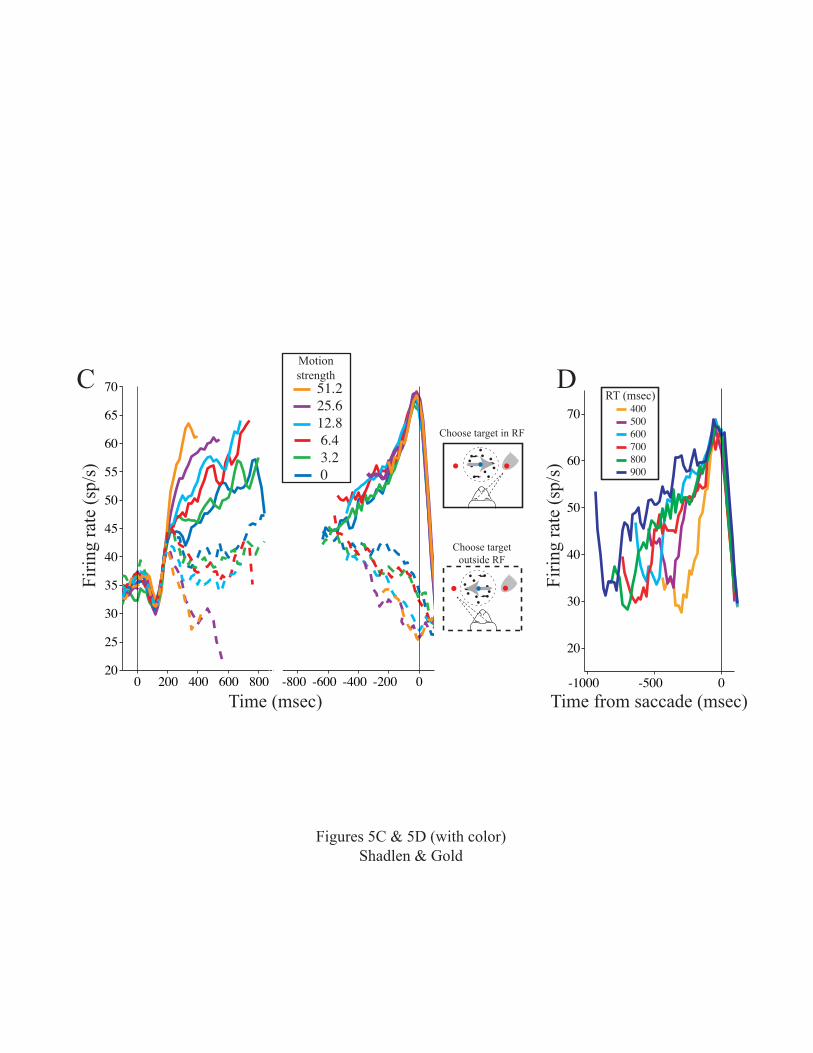
results are summarized in Fig. 5C. Following onset of the
targets (not shown), activity is robust (~35 spikes/sec on
average) until ~100 msec following onset of the motion
stimulus. The activity then undergoes a stereotyped dip and
recovery that does not reflect the motion stimulus or the
eye-movement response. We think this activity might
represent a reset of an integration process that appears to
begin ~200 msec after motion onset and continues until the
decision is formed.
The integration process is evident as ramp-like
changes in LIP activity. The ramps represent accumulations
of motion evidence that, on average, correspond to the
monkey’s decisions. For the decision associated with the
target in the neuron’s RF, the activity ramps upward (solid
curves). For the alternative decision, the activity ramps
downward (dashed curves). Higher coherence provides more
evidence, corresponding to steeper ramps. Lower coherence

13
provides less evidence, corresponding to shallower ramps.
Even zero coherence, which provides no net motion
information but still must be interpreted by the monkey to
reach a decision, is treated as noisy evidence that ramps
gradually towards the monkey’s choice. Note that the
responses in Fig. 5C are averages from many individual
trials. For any one trial, LIP activity is probably more
like the meandering path of a particle in Brownian motion.
The upward and downward ramps, apparent for individual
neurons, suggest that the motion evidence being accumulated
is a difference in activity favoring the two directions.
For example, an LIP neuron with a rightward RF would
accumulate the difference between rightward and leftward
direction signals. Rightward motion would tend to cause a
positive (upward) accumulation, whereas leftward motion
would tend to cause a negative (downward) accumulation. A
recent study provided direct experimental support for this
difference operation (Ditterich et al., 2003). Such a
difference approximates the logarithm of the likelihood
ratio—or “weight of evidence”—in favor of one or the other
alternative (Gold and Shadlen, 2001). Thus, accumulating
this difference to a criterion value approximates a
statistical process known as the sequential probability
14
ratio test (Wald, 1947; Stone, 1960; Laming, 1968; Link,
1992).
Consistent with the sequential probability ratio test
and the “diffusion-to-barrier” model (see Fig 4), the LIP
activity appears to reach a criterion value that indicates
the end of the decision process. On the right side of
figure 5C, the same responses are shown aligned to the
beginning of the eye movement response. In contrast to the
ramps on the left, the rising responses are stereotyped.
They seem to reach a common value ~100 msec before the eye
movement response, regardless of their trajectory to this
point. This is more apparent when the data are sorted by RT
instead of motion strength (Fig. 5D): the responses reach
an apparent decision threshold rapidly for fast decisions
but take a more meandering approach to the same threshold
when the decision takes longer. In contrast, there is no
common end point for the declining responses associated
with the opposite decision (Fig. 5C, dashed curves).
Presumably, a second set of neurons accumulates evidence in
the opposite direction. When their activity reaches the
criterion value, a movement into their RF is triggered and
all decision processes are terminated.
15
LIP is just one of several brain structures with
neurons that show this kind of activity on the motion task.
Similar activity has been found in other cortical
association areas, including the frontal eye field (FEF)
and dorsolateral prefrontal cortex, and in subcortical
structures including the superior colliculus (Kim and
Shadlen, 1999; Horwitz and Newsome, 2001). The relative
contributions these different structures make to the
decision process are not known. For example, it is not
clear whether they all help to compute the decision
variable or some simply reflect computations performed
elsewhere. Nevertheless, one common feature of these
structures is evident: they are all involved in preparing
the eye-movement response (Funahashi et al., 1991; Schall,
1997; Sparks, 2002).
Thus, a decision that links sensation to action
appears to be formed by structures involved in motor
preparation. From one perspective, this seems odd. The
direction decision clearly depends on the sensory input but
seems unrelated to how the answer will be communicated.
Indeed, one might predict that the motor systems that
control the behavioral response should be engaged only
after the decision is reached. These motor systems should
16
not be concerned with the evolving sensory evidence. This
prediction turns out to be incorrect.
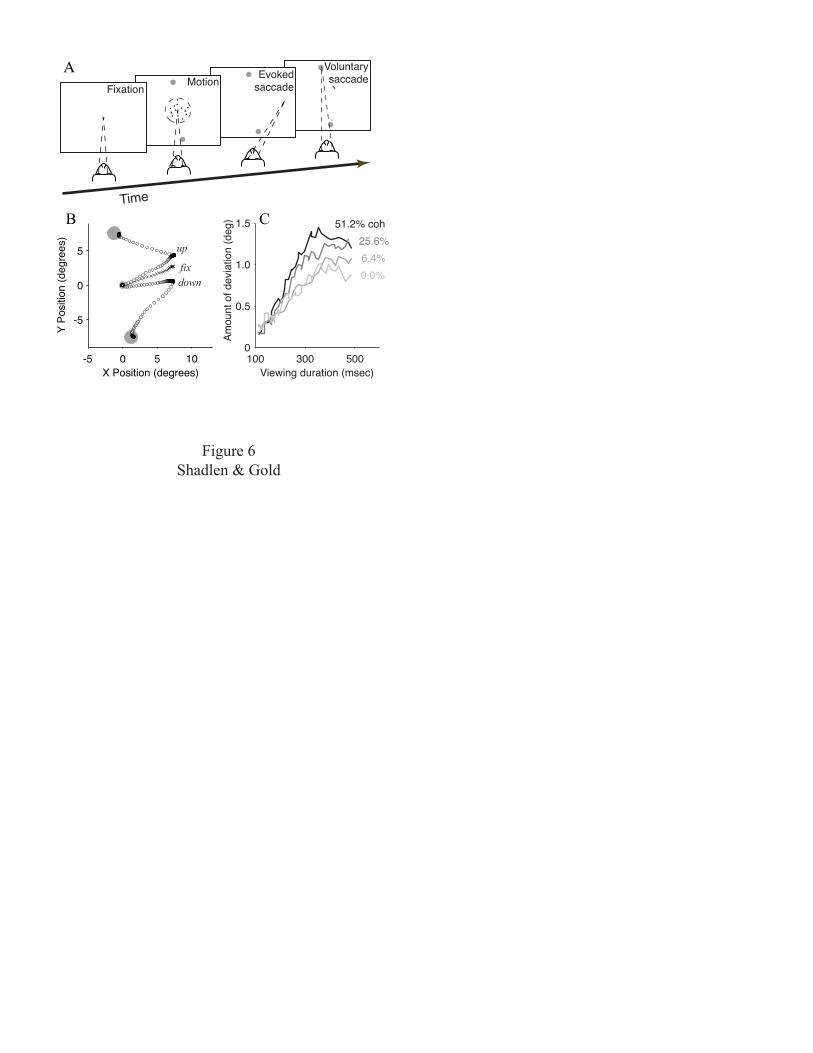
We examined how much of the decision process is
communicated to the oculomotor system while the monkey
performs the motion task (Fig. 6A). In effect, we perturbed
the oculomotor system to find evidence of the decision
variable. As in some of the behavioral experiments, the
monkey was given a variable amount of time to view the
motion stimulus. At the exact time that the motion was
turned off, a brief train of microstimulation pulses was
applied to the FEF. These pulses evoked a short-latency
saccadic eye movement. After another ~100 msec, the monkey,
having recognized the offset of random-dot motion and thus
the end of the trial, made a second, voluntary eye movement
to one of the choice targets to indicate its direction
decision.
The trajectory of the evoked saccade was influenced by
an evolving decision variable. The trajectory was similar
to those measured on control trials when the monkey simply
fixated a central spot (Fig. 6B, fix). However, on
discrimination trials, the trajectory tended to deviate in
the direction of the subsequent voluntary eye movement

17
(Fig. 6B, up and down). This deviation appeared to reflect
an ongoing plan to make this movement while viewing the
motion stimulus. Importantly, this deviation was not an all
or none phenomenon but instead, like the decision variable,
depended on the strength and duration of motion (Fig. 6C).
Thus, the accumulated weight of evidence in favor of one
direction versus the other is represented in the commands
related to the behavioral response.
III. A window on cognition: perspectives and future
directions
Several principles appear to govern the formation of
decisions about motion. Sensory input is converted into a
weight of evidence to support or oppose the alternative
direction decisions. The weight of evidence is accumulated
over time. The accumulation stops when a criterion value is
reached. This process is represented in structures that
prepare the behavioral response. Here we discuss the
broader implications of these principles for sensory-motor
processing and cognition.
Sensory information as weight of evidence. The monkey’s
direction decisions appear to be based on the difference in
18
activity between pools of motion-sensitive neurons with
preferences for the two alternative directions. This
difference provides a weight of evidence that quantifies
the relative likelihoods of the alternatives given the
sensory activity. Thus, the decision is not simply a reflex
that associates a pattern of sensory activity with an
appropriate behavioral response (an eye movement). Instead,
the decision is a process of interpretation that uses the
weight of evidence to make sense of noisy, distributed
sensory information to reach a categorical judgment.
The usefulness of the weight of evidence is not
limited to decisions about motion. In general, it can be
used to maximize the probability of deciding correctly
between two alternatives (Good, 1979; Gold and Shadlen,
2001; Gold and Shadlen, 2002). The basic principles can
even be extended to decisions with many alternatives
(Laming, 1968; Usher et al., 2002), although it is unknown
whether the brain uses this method for such complicated
problems.
The weight of evidence is also easy to compute. Motion
direction is represented systematically in the middle
temporal area (MT or V5) of extrastriate visual cortex
19
(Zeki, 1974; Albright et al., 1984). Other sensory
parameters, including location, orientation, and disparity,
are similarly mapped in sensory cortex. A simple difference
in activity within any of these maps represents a weight of
evidence that can distinguish between different values of
the mapped parameter. In principle, differences computed
from other representations can also be used as a weight of
evidence; for example, the difference between sensory
activity and memory activity could help to distinguish
between sequentially presented stimuli.
Finally, the weight of evidence constitutes a currency
that allows signals with dissimilar origins to be compared
and combined. By analogy, monetary currency can define the
relative values of seemingly unrelated quantities, like an
hour’s labor versus a new car. Similarly, the weight of
evidence can, in principle, be used to compare the
information provided by different sources, sensory or
otherwise, to make decisions. For example, the evidence
provided by a sensory stimulus can be weighed against other
factors like bias, reward expectation, and utility (Gold
and Shadlen, 2001; Gold and Shadlen, 2002; Montague and
Berns, 2002; Glimcher, 2003). Indeed, such a confluence of
factors is evident in the activity of neurons in
20
association areas of cortex (Leon and Shadlen, 1999; Platt
and Glimcher, 1999; Amador et al., 2000; Hikosaka and
Watanabe, 2000; Tremblay and Schultz, 2000).
Accumulation of evidence over time. Time is needed to form
the direction decision. At any given moment, the weight of
evidence provided by the stochastic motion stimulus is too
vague to reach a decision. However, the motion signals are
presented continuously over time. Appropriately, the
decision appears to be formed by accumulating over time the
moment-by-moment weight of evidence. Thus, less time
implies less accumulated evidence and lower accuracy. More
time implies more evidence and higher accuracy.
Accumulation is undoubtedly just one of many
strategies that the brain uses to interpret incoming
sensory information. For the motion task, a continuous
accumulation is appropriate for a continuously arriving
signal. For other tasks, different temporal functions might
be more appropriate if, for example, information arrives at
separate, predictable intervals. The point is that
decisions about stochastic stimuli like the dots are not
simply processes that take time. Rather, they are processes
that can use strategies like accumulation to interpret
21
information that arrives at different times. This capacity
is central to organizing behavior that is not tied to the
immediacy of a particular sensory input or motor output
(Fuster, 1985).
In general, mechanisms that establish a logical
relationship between sensory input and motor output but are
not invariably tied to either exemplify the close
relationship between sensory-motor and cognitive function
in the brain. For example, in the association cortex,
activity that persists between sensory and motor events has
been implicated in short term (working) memory (Fuster and
Alexander, 1971; Miyashita and Chang, 1988; Goldman-Rakic
et al., 1990; Quintana and Fuster, 1992; Miller et al.,
1996l; Graziano et al., 1997; Romo et al., 1999),
allocation of attention (Colby and Goldberg, 1999), motor
planning (Crammond and Kalaska, 1989; Andersen and Buneo,
2002), motor sequencing (Shima and Tanji, 2000), the
representation of motor set or rules (Evarts and Tanji,
1974; di Pellegrino and Wise, 1993; Hoshi et al., 2000;
Tanji and Hoshi, 2001; Wallis et al., 2001), and, as we
have discussed, the formation of decisions (Schall, 2001;
Glimcher, 2003; Romo and Salinas, 2003). It is intriguing
to think that these higher functions have co-opted
22
mechanisms that evolved to solve more mundane problems in
sensory-motor processing. For example, persistent activity
in certain brainstem nuclei holds the gaze in a fixed
position. This activity arises through a process resembling
integration with respect to time: eye position is the
integral of a pulse-like motor command signal, which
controls eye velocity (Robinson, 1989). By analogy, neurons
in association areas might integrate over time the “pulses”
of evidence that bear on decisions.
Thus, cognition appears to rest, in part, on
mechanisms that liberate the brain from time constraints
imposed by the environment and the body. However, this
freedom poses new problems. How does the brain organize in
time computations that are not linked to immediate sensory
or motor events? When do the computations begin and end?
How can they take into account sensory input from the past?
Or affect future behavior? To solve these problems, time
itself is likely to be represented explicitly in brain
structures with persistent activity. Indeed, recent
experiments suggest that elapsed time is represented in the
parietal cortex (Leon and Shadlen, 2003). The
representation of this and other time parameters will
23
likely emerge as an important future direction in the
pursuit of the neural mechanisms of higher brain function.
Commitment to one alternative when a criterion level of
evidence is reached. To form the direction decision, the
weight of evidence appears to be accumulated until a
criterion level or “barrier height” is reached. Setting the
barrier height controls the trade-off between speed and
accuracy. A low barrier provides fast-but-uncertain
decisions. A high barrier provides slow-but-certain
decisions. This process—accumulating a difference to a
barrier—can explain not just decisions about motion, but
also a wide variety of laws of sensation and perception.
These include Weber’s Law, which governs the appreciation
of increments, and both Fechner’s and Stevens’ Laws, which
explain estimates of subjective magnitude of sensory
experience (Link, 1992).
The barrier crossing also represents a form of
temporal control. For the RT task, it determines the end-
point of decision processing and the beginning of motor
execution. In principle, a barrier crossing could help
control how cognitive processing is organized in time, as
well. It could determine the end-point of decision
24
processing and a commitment to a more abstract proposition
than an immediate behavior, like more computations. In this
sense, accumulations to barriers seem intimately related to
internal representations of time. This mechanism could help
control the brain’s ability to process sequences of sensory
inputs, plan sequences of behavior, and in general cascade
sequences of operations on a flexible time scale.
Representation of the decision variable in brain structures
that control the motor response. In monkeys trained to
indicate their direction decision with an eye movement to a
predictable location in the same direction, formation of
the decision and formation of the eye-movement response
seem to be closely linked in the brain. Neurons in several
structures involved in oculomotor preparation, including
area LIP, the FEF, the dorsolateral prefrontal cortex, and
the superior colliculus, represent both the impending eye-
movement response and the accumulation of motion evidence
used to select that response. Indeed, the decision variable
appears to be represented in the very motor commands that
ultimately generate the eye-movement response.
These results certainly reflect the design of the
task. If the monkeys were trained to indicate their
25
decision with an arm movement, not an eye movement, we
would expect the decision variable to be represented in
neurons that prepare arm movements. It seems to be, in
part, a matter of efficiency. When the decision is
associated with a particular, predictable, and impending
motor response, there is a continuous flow of up-to-date
information about the decision – both sensory and
psychological – in the circuits that prepare the response
(Bichot et al., 2001).
The same principles can be extended to include
decisions not linked to specific movements. This is
illustrated with a new version of the motion task. This
task requires the monkey to indicate its direction decision
with an eye movement to a target not at a particular
location but of a particular color: red for rightward
motion, green for leftward motion. Critically, the
locations of the targets are not known until after the
decision is formed. FEF microstimulation confirms that, for
this task, the decision variable is not represented in
commands to generate a specific eye movement (Gold and
Shadlen, 2003). Instead, the brain might construe incoming
motion information as evidence for implementing a
particular behavioral rule. The possible rules are “When
26
two targets appear, look at the red one” or “look at the
green one.” Thus, the decision can still be formed in an
intention-oriented framework, but the intention – a
behavioral rule – is more abstract than a specific
movement.
An obvious question is whether intention-related
structures form the decisions or simply reflect
computations performed elsewhere. As a practical issue of
determining what those computations are, the answer might
not matter: studying the computations themselves or their
faithful reflections will yield similar insights. To
understand the flow of information in the brain, however,
the answer certainly does matter. Is information that
arrives in intention-related structures already processed
thoroughly, having been sent there by higher-order circuits
that do the hard work of cognition? If so, where are those
circuits? If not, what are the implications of high-order
brain function being processed in an intention-oriented
framework?
We do not know the answers to these questions.
However, there is reason to speculate that intention-
related structures indeed play pivotal roles in forming
27
decisions. In our view, the most compelling reason is that
decision-making implies a goal. The most obvious goals are
behaviors and consequences of behaviors: to get from here
to there, to avoid bad things, to get good things. Thus,
brain structures involved in achieving these goals – that
is, structures that determine what to do and how and when
to do it – seem likely to make decisions. With flexible
representations of behaviors and behavioral goals, along
with a flexible currency like the weight of evidence, it
seems unnecessary to posit other structures to do the hard
work.
The generalization of this principle shifts the
emphasis of brain function from the descriptive analysis of
sensory data to the informed control of behavior.
Intention-related mechanisms provide goals. These goals
establish the utility and meaning of sensory and
psychological signals, which are used as evidence to help
decide among alternatives and achieve these goals. Thus,
intention-related structures provide the framework for both
sensory-motor processing and the rudiments of higher
cognitive function. These ideas on the centrality of
intention to perception and higher brain function have a
long tradition. For example, Helmholtz suggested that the
28
perception of space, including the interpretation of
curvature and straightness, could be understood in terms of
the way our motor systems are organized to rotate our eyes
along great circles (Helmhotz, 1925). These ideas also
emerge under various guises in philosophy, notably in the
writings of Merleau-Ponty and other descendants of
Heidegger, who recognized that the properties of things are
related in a profound sense to their utility (Heidegger,
1962; Merleau-Ponty, 1962; Clark, 1997; O'Regan and Noë,
2001).
An intention-based framework for information processing
might also point the way towards understanding one of the
deepest mysteries of neuroscience: consciousness. Our
understanding of consciousness seems stymied by the same
conundrum posed at the beginning of this article.
Consciousness, like cognition, seems unrelated to the
operations that neurons perform. For example, there seem to
be too few constraints to explain the leap from raw sensory
information to the coherence and salience of conscious
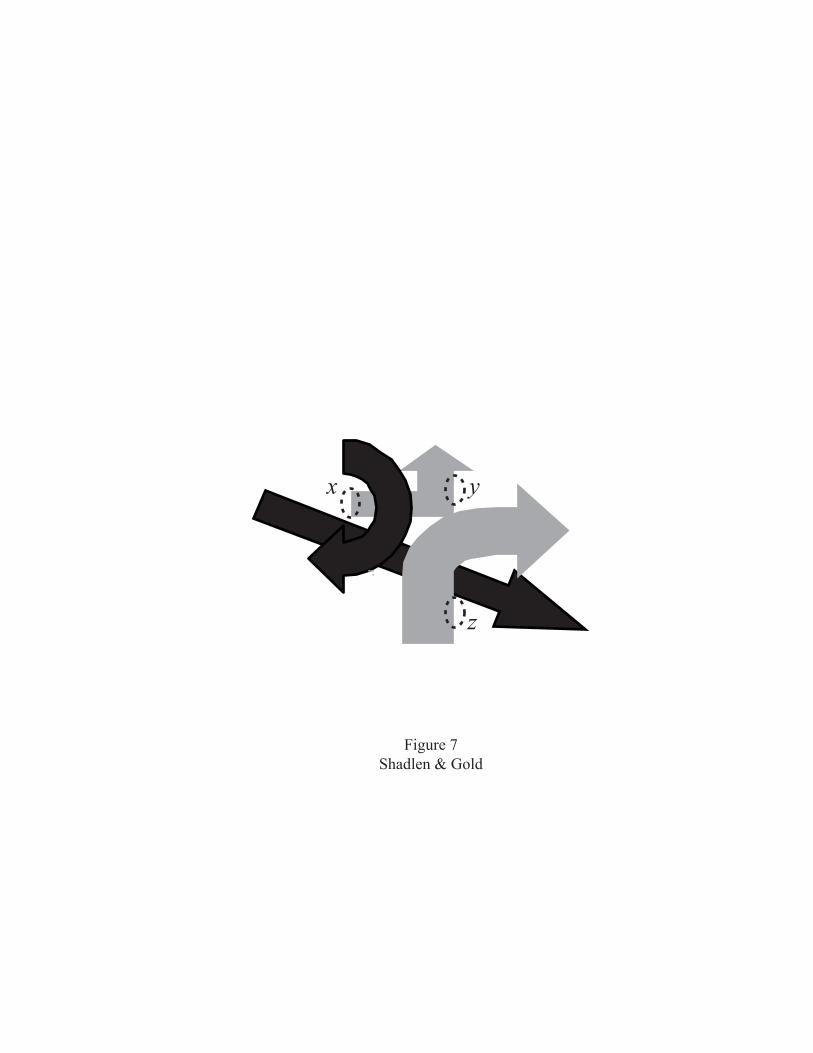
perception. How can we group the elements of visual scenes
into meaningful wholes and background, despite the
combinatorial complexity posed by the raw data of light,
edges, and color (see Figure 7)? To solve this kind of
29
problem, many theories of consciousness posit a central
interpreter, or homunculus. The intention-based framework
provides an alternative view. According to this view, our
conscious experience is indeed constrained. Conscious
perception derives from, in effect, questions related to
behavior (e.g., is that something I can grab? Can I walk
there?). Sensory and memory signals are interrogated for
evidence that can be used to provide answers. Thus, our
conscious experiences – and the underlying neural
computations – are constrained to what is being asked and
what is answered. Because the questions are determined from
the repertoire of possible behaviors, the underlying
mechanisms of consciousness are intimately tied to the fact
that the brain controls a body.
This intention-based architecture seems to take the hard
work of consciousness away from the homunculus. However,
another, equally mysterious mechanism seems to be required.
If sensory information flows to circuits where it can exert
leverage on intentions, plans, and rules, what controls the
flow? Which intentions, plans, and rules are under
consideration at any moment? The need for a homunculus has
apparently been replaced by the need for a traffic cop.
30
We speculate that, unlike for the homunculus, we
already have insights into the brain mechanisms that serve
as traffic cop. These are the same mechanisms that allow an
animal to explore its environment; that is, to forage.
Foraging is about connecting data in the environment to a
prediction of reward through complex behavior (Gallistel,
2000). However, in principle, the mechanisms of foraging,
like the mechanisms of decision-making, do not need to be
tied to overt behaviors. The same principles that apply to
visits to flowers could direct the parietal lobe to query
the visual cortex for evidence needed to answer a question
about motion. More generally, foraging might be related to
the leaps our brains make to replace one percept with
another (e.g., binocular rivalry), to escape one behavioral
context for another, or to explore new ideas. For cognitive
neuroscientists, these ideas inspire research on how reward
expectation influences sensory-motor and higher processing
in association areas of the brain. For the philosopher of
mind, these ideas provide an inkling of how properties of
the brain give rise to agency and, perhaps, free will.
Conclusions

31
When designing an experiment to study decision-making and
other cognitive functions, among the critical questions we
ask is, where should we put our electrodes? That is, where
in the brain will we find neurons that contribute to these
higher functions? We and others are finding success by
recording from neurons at the nexus of sensory-motor
processing. By studying how sensory information is
converted into a categorical decision that guides behavior,
we gain insight into flexible and efficient mechanisms that
could subserve cognitive functions, as well. These
mechanisms provide a common currency for integrating
information from a variety of sources, sensory or
otherwise; they disengage information processing from the
immediacy of sensory and motor events; and they establish
rules for committing to a proposition. The mechanisms we
study also hint at a broad principle of brain organization:
behavior and behavioral goals are the hubs around which
other information is organized. These hubs define, for
example, how utility and meaning should be ascribed to
sensory signals. This organization lights the path to
future research in cognition and perhaps even
consciousness.

32
Bibliography
Acuna BD, Eliassen JC, Donoghue JP, Sanes JN (2002) Frontal
and parietal lobe activation during transitive
inference in humans. Cereb Cortex 12:1312-1321.
Albright TD, Desimone R, Gross CG (1984) Columnar
organization of directionally selective cells in
visual area MT of macaques. J Neurophysiol 51:16-31.
Amador N, Schlag-Rey M, Schlag J (2000) Reward-predicting
and reward-detecting neuronal activity in the primate
supplementary eye field. J Neurophysiol 84:2166-2170.
Andersen RA, Buneo CA (2002) Intentional maps in posterior
parietal cortex. Annu Rev Neurosi 25:189-220.
Astafiev SV, Shulman GL, Stanley CM, Snyder AZ, Van Essen
DC, Corbetta M (2003) Functional organization of human
intraparietal and frontal cortex for attending,
looking, and pointing. J Neurosci 23:4689-4699.
Bichot NP, Chenchal Rao S, Schall JD (2001) Continuous
processing in macaque frontal cortex during visual
search. Neuropsychologia 39:972-982.
Carpenter R, Williams M (1995) Neural computation of log
likelihood in control of saccadic eye movements.
Nature 377:59-62.
33
Clark A (1997) Being There: Putting brain, body, and world
together again. Cambridge, MA: MIT Press.
Colby CL, Goldberg ME (1999) Space and attention in
parietal cortex. Annu Rev Neurosci 22:319-349.
Corbetta M, Akbudak E, Conturo TE, Snyder AZ, Ollinger JM,
Drury HA, Linenweber MR, Petersen SE, Raichle ME, Van
Essen DC, Shulman GL (1998) A common network of
functional areas for attention and eye movements.
Neuron 21:761-773.
Crammond DJ, Kalaska JF (1989) Neuronal activity in primate
parietal cortex area 5 varies with intended movement
direction during an instructed-delay period. Exp Brain
Res 76:458-462.
di Pellegrino G, Wise S (1993) Visuospatial versus
visuomotor activity in the premotor and prefrontal
cortex of a primate. J Neurosci 13:1227-1243.
Ditterich J, Mazurek M, Shadlen MN (2003) Microstimulation
of visual cortex affects the speed of perceptual
decisions. Nat Neurosci 6:in press.
Evarts EV, Tanji J (1974) Gating of motor cortex reflexes
by prior instruction. Brain Res 71:479-494.
Feinberg TE, Farah MJ, eds (1997) Behavioral neurology and
neuropsychology. New York: McGraw-Hill.
34
Funahashi S, Bruce C, Goldman-Rakic P (1991) Neuronal
activity related to saccadic eye movements in the
monkey's dorsolateral prefrontal cortex. J
Neurophysiol 65:1464-1483.
Fuster J (1985) The prefrontal cortex and temporal
integration. In: Cerebral Cortex (Peters A, Jones E,
eds), pp 151-177. New York: Plenum.
Fuster JM, Alexander GE (1971) Neuron activity related to
short-term memory. Science 173:652-654.
Gallistel CR (2000) Time, Rate, and Conditioning.
Psychological Review 107:289-344.
Glimcher P (2003) The neurobiology of visual-saccadic
decision making. Annu Rev Neurosci 26:133-179.
Gold JI, Shadlen MN (2000) Representation of a perceptual
decision in developing oculomotor commands. Nature
404:390-394.
Gold JI, Shadlen MN (2001) Neural computations that
underlie decisions about sensory stimuli. Trends Cogn
Sci 5:10-16.
Gold JI, Shadlen MN (2002) Banburismus and the brain:
decoding the relationship between sensory stimuli,
decisions, and reward. Neuron 36:299-308.
Gold JI, Shadlen MN (2003) The influence of behavioral
context on the representation of a perceptual decision
35
in developing oculomotor commands. J Neurosci 23:in
press.
Goldman-Rakic PS, Funahashi S, Bruce CJ (1990) Neocortical
memory circuits. Cold Spring Harb Symp Quant Biol
55:1025-1038.
Good IJ (1979) Studies in the history of probability and
statistics. XXXVII A.M. Turing's statistical work in
World War II. Biometrika 66:393-396.
Graziano MSA, Hu XT, Gross CG (1997) Visuospatial
properties of ventral premotor cortex. J Neurophysiol
77:2268-2292.
Heidegger M (1962) Being and Time. New York: Harper and
Row.
Helmhotz Hv (1925) Chapter 28. The monocular field of
vision. In: Helmholtz's Treatise on Physiological
Optics (Southall JPC, ed). Menasha, Wisconsin: The
Optical Society of America and George Banta Publishing
Company.
Hikosaka K, Watanabe M (2000) Delay activity of orbital and
lateral prefrontal neurons of the monkey varying with
different rewards. Cereb Cortex 10:263-271.
Horwitz GD, Newsome WT (2001) Target selection for saccadic
eye movements: prelude activity in the superior
36
colliculus during a direction-discrimination task. J
Neurophysiol 86:2543-2558.
Hoshi E, Shima K, Tanji J (2000) Neuronal activity in the
primate prefrontal cortex in the process of motor
selection based on two behavioral rules. J
Neurophysiol 83:2355-2373.
Kim J-N, Shadlen MN (1999) Neural correlates of a decision
in the dorsolateral prefrontal cortex of the macaque.
Nat Neurosci 2:176-185.
Laming DRJ (1968) Information theory of choice-reaction
times. London: Academic Press.
Leon MI, Shadlen MN (1999) Effect of expected reward
magnitude on the response of neurons in the
dorsolateral prefrontal cortex of the macaque. Neuron
24:415-425.
Leon MI, Shadlen MN (2003) Representation of time by
neurons in the posterior parietal cortex of the
macaque. Neuron 38:317-327.
Link SW (1992) The wave theory of difference and
similarity. Hillsdale, NJ: Lawrence Erlbaum
Associates.
Luce RD (1986) Response times: their role in inferring
elementary mental organization. New York: Oxford
University Press.
37
Merleau-Ponty M (1962) Phenomenology of Perception. London:
Routledge & Kegan Paul Ltd.
Mesulam M-M (1985) Principles of behavioral neurology.
Philadelphia: F.A. Davis.
Miller EK, Erickson CA, Desimone R (1996) Neural mechanisms
of visual working memory in prefrontal cortex of the
macaque. J Neurosci 16:5154-5167.
Miyashita Y, Chang H (1988) Neuronal correlate of pictorial
short-term memory in the primate temporal cortex.
Nature 331:68-70.
Montague PR, Berns GS (2002) Neural economics and the
biological substrates of valuation. Neuron 36:265-284.
Murray EA, Bussey TJ, Wise SP (2000) Role of prefrontal
cortex in a network for arbitrary visuomotor mapping.
Exp Brain Res 133:114-129.
O'Regan JK, Noë A (2001) A sensorimotor account of vision
and visual consciousness. Behav Brain Sci 24:in press.
Penfield W, Roberts L (1974) Speech and brain-mechanisms.
Atheneum, New York: Princeton University Press.
Platt ML, Glimcher PW (1999) Neural correlates of decision
variables in parietal cortex. Nature 400:233-238.
Quintana J, Fuster J (1992) Mnemonic and predictive
functions of cortical neurons in a memory task.
Neuroreport 3:721-724.
38
Ratcliff R, Rouder JN (1998) Modeling response times for
two-choice decisions. Psychological Science 9:347-356.
Reddi BA, Carpenter RH (2000) The influence of urgency on
decision time. Nat Neurosci 3:827-830.
Robinson DA (1989) Integrating with neurons. Annu Rev
Neurosci 12:33-45.
Roitman JD, Shadlen MN (2002) Response of neurons in the
lateral intraparietal area during a combined visual
discrimination reaction time task. J Neurosci 22:9475-
9489.
Romo R, Salinas E (2003) Flutter discrimination: neural
codes, perception, memory and decision making. Nat Rev
Neurosci 4:203-218.
Romo R, Brody C, Hernandez A, Lemus L (1999) Neuronal
correlates of parametric working memory in the
prefrontal cortex. Nature 399:470-473.
Ross S (1996) Stochastic Processes, Second Edition Edition.
New York City, NY: John Wiley & Sons.
Schall JD (1997) Visuomotor areas of the frontal lobe. In:
Cerebral Cortex (al Re, ed), pp 527-638. New York:
Plenum.
Schall JD (2001) Neural basis of deciding, choosing and
acting. Nat Rev Neurosci 2:33-42.
39
Shadlen MN, Newsome WT (1994) Noise, neural codes and
cortical organization. Curr Opin Neurobiol 4:569-579.
Shadlen MN, Newsome WT (1998) The variable discharge of
cortical neurons: implications for connectivity,
computation and information coding. J Neurosci
18:3870-3896.
Shadlen MN, Movshon JA (1999) Synchrony unbound: a critical
evaluation of the temporal binding hypothesis. Neuron
24:67-77.
Shima K, Tanji J (2000) Neuronal activity in the
supplementary and presupplementary motor areas for
temporal organization of multiple movements. J
Neurophysiol 84:2148-2160.
Simon SR, Meunier M, Piettre L, Berardi AM, Segebarth CM,
Boussaoud D (2002) Spatial attention and memory versus
motor preparation: premotor cortex involvement as
revealed by fMRI. J Neurophysiol 88:2047-2057.
Sparks DL (2002) The brainstem control of saccadic eye
movements. Nat Rev Neurosci 3:952-964.
Stone M (1960) Models for choice-reaction time.
Psychometrika 25:251-260.
Tanji J, Hoshi E (2001) Behavioral planning in the
prefrontal cortex. Curr Opin Neurobiol 11:164-170.
40
Tremblay L, Schultz W (2000) Reward-related neuronal
activity during Go-nogo task performance in primate
orbitofrontal cortex. J Neurophysiol 83:1864-1876.
Usher M, Olami Z, McClelland JL (2002) Hick's law in a
stochastic race model with speed-accuracy tradeoff. J
Math Psych 46:704-715.
Wald A (1947) Sequential Analysis. New York: Wiley.
Wallis JD, Anderson KC, Miller EK (2001) Single neurons in
prefrontal cortex encode abstract rules. Nature
411:953-956.
Wise SP, Murray EA (2000) Arbitrary associations between
antecedents and actions. Trends Neurosci 23:271-276.
Zeki SM (1974) Functional organization of a visual area in
the posterior bank of the superior temporal sulcus of
the rhesus monkey. J Physiol 236:549-573.
Acknowledgments. We thank Jochen Ditterich and Alex Huk for
helpful comments on the manuscript. This research was
supported by the Howard Hughes Medical Institute, the
National Eye Institute (EY11378), the National Center for
Research Resources (RR00166), the McKnight Foundation, and
the Burroughs-Wellcome Fund.

41
Figure Legends
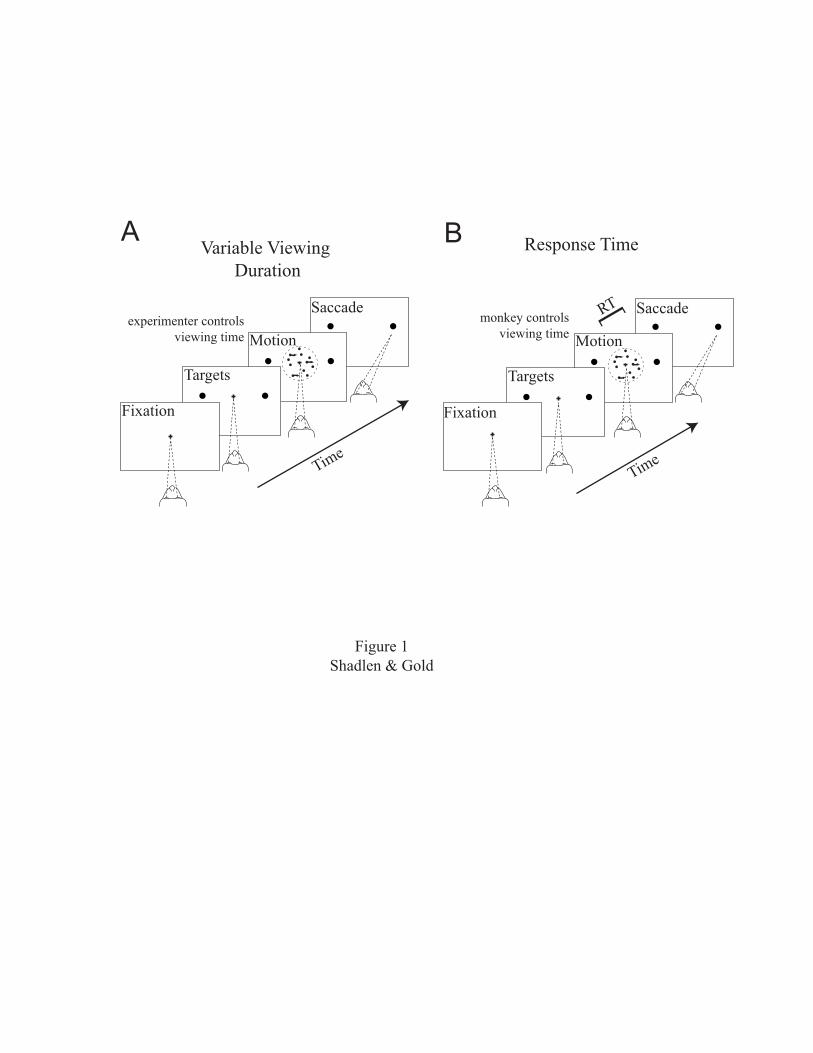
Figure 1. Two versions of the motion task used to study
decision-making in monkeys. This task was formerly used to
study the relationship between the properties of neurons in
the visual cortex and the limits of perception (see Parker
and Newsome, 1998). The monkey decides whether the net
direction of random-dot motion is in one of two directions,
here right or left. The ease and difficulty of the task can
be controlled by varying the percentage of dots that are
moving coherently in one of the two directions. The
remaining dots merely appear and disappear at random
locations. The monkey does not know beforehand what
percentage of dots will be moving coherently or in which
direction they will be moving. Even the moving dots are not
shown for more than ~40 msec before being replotted
elsewhere. Thus, the decision depends on assessing the net
motion across all the dots and across time. The monkey is
trained to look at a target to the right for rightward
motion, to the left for leftward motion, etc. The monkey is
also trained to handle stimuli with different directions,
speeds, and locations in the visual field. To study sensory
processing, the random-dot stimulus is placed in the
receptive field of a direction-selective neuron. To study
decision-making, one of the targets that signals the

42
monkey’s commitment to a particular choice is placed in a
neuron’s response field. A, In the variable-duration
version of the task, the viewing time is a random value
drawn from an exponential distribution with minimum and
maximum times shown. The experimenter controls the duration
of motion viewing. The monkey indicates his choice when the
fixation point is extinguished. B, In the response-time
(RT) version of the task, the monkey controls the viewing
duration. Whenever ready, he makes an eye movement to one
of the choice targets. The RT is the time from the onset of
random-dot motion to the beginning of the eye movement.
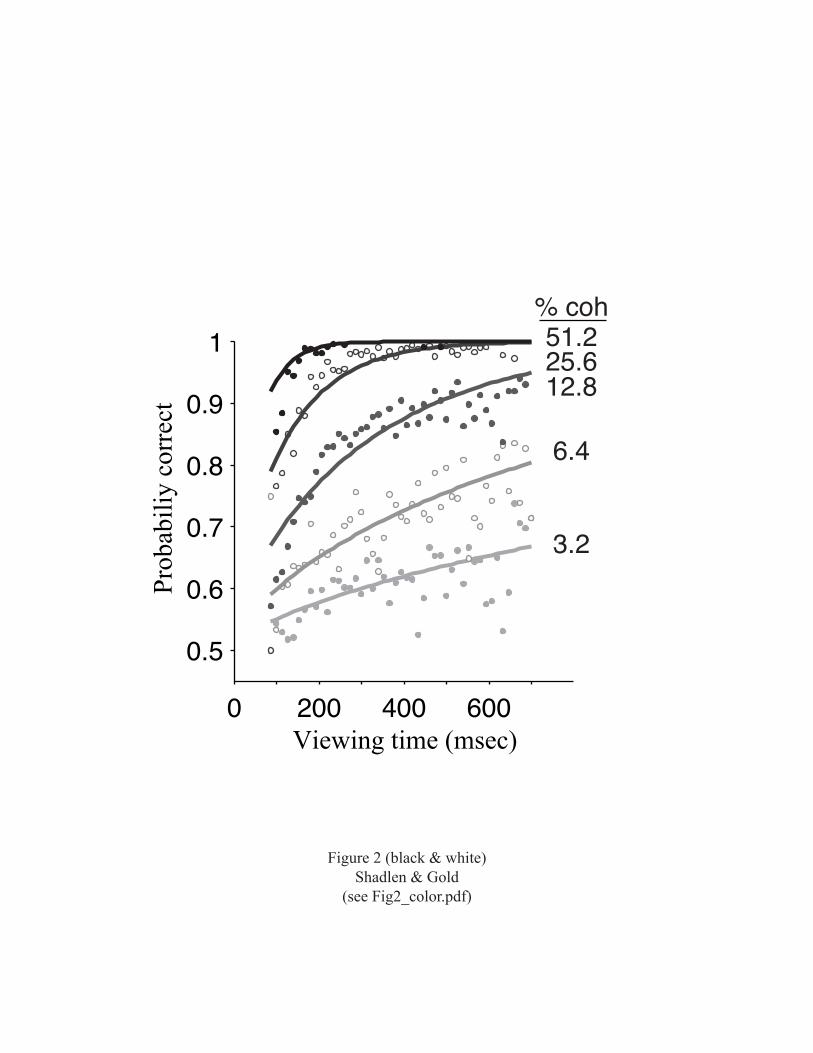
Figure 2. Performance on the variable-duration version of
the discrimination task depends on motion coherence and
viewing time. Solid lines are best-fitting functions based
on a model for the decision using signal detection theory.
The best fits suggest that the internal signals are
proportional to motion strength and viewing time. N=45,511
trials from 32 experiments using two monkeys. Reprinted
with permission from Gold and Shadlen, 2003.
Figure 3. Accuracy and speed of decisions in the response-
time version of the motion task. Data points are from two
monkeys. A, Psychometric function depicting accuracy as a

43
function of motion strength. B, Chronometric function
depicting response time as a function of motion strength.
The solid curve in B is the fit of Equation 1 to the data.
It describes the amount of time it would take accumulating
evidence to reach a criterion level were it to diffuse like
a particle in Brownian motion with average drift
proportional to motion coherence (see Fig. 4). The sigmoid
curve in A is the predicted psychometric function based on
the model fit to the response-time data.
Figure 4. Diffusion-to-barrier as a model for decision-
making. In 1-dimensional Brownian motion of a particle,
random displacements are accumulated in a trajectory that
stops at ±B. The displacements at each moment are drawn
from a normal distribution (insert). Decisions about
direction are based on an accumulation of evidence, which
is the difference in spike rates from ensembles of
direction selective neurons in the visual cortex.
Figure 5. A neural correlate of a decision process in the
parietal cortex. A, The right hemisphere of the macaque
brain. Experiments focus on neurons in the lateral
intraparietal area (LIP), which lies on the lateral bank of
the intraparietal sulcus. It receives input from direction-
44
selective neurons in area MT, along the superior temporal
sulcus, and projects to structures involved in eye-movement
control. B, Persistent activity from an LIP neuron recorded
during memory-guided saccadic eye movements. Targets
appeared in one of 8 locations arranged around a circle.
The responses are aligned to the onset of the target that
was flashed on and immediately off. The monkey made an eye
movement to the remembered location of the target when the
fixation point was extinguished (triangles). Rasters and
peristimulus time histograms are arranged to illustrate the
position of the target. The response histograms do not
include activity after the initiation of the saccadic eye
movement. The polar graph at the center of the figure shows
the memory-period response as a function of target
location. This neuron exhibited activity in the delay
period before saccadic eye movements to the left. Adapted
from Shadlen and Newsome, 2001. C, Time course of LIP
activity in the RT version of the motion task. Traces are
averaged responses from 54 LIP neurons. Responses are
grouped by motion strength and choice as indicated by color
and line type, respectively. The task is arranged so that
one of the choice targets is in the neuron’s RF. The other
target and the random dots are outside the RF, as indicated
by the icons. On the left, responses are aligned to the
45
onset of stimulus motion. Response averages in this portion
of the graph show only activity accompanying motion
viewing. They stop at the median RT for each motion
strength and exclude any activity within 100 msec of eye
movement initiation. On the right, responses are aligned to
initiation of the eye-movement response. Response averages
in this portion of the graph show the build up and decline
in activity at the end of the decision process. They
exclude any activity within 200 msec of motion onset. The
average firing rate was smoothed using a 60 msec running
mean. D, Time course of activity on trials with similar RT.
Curves are population average responses for trials that end
with an eye movement to the choice target in the RF. The
responses are aligned to saccade initiation. Color
designates the RT of the trials included in the average,
which fall within 25 msec of the time indicated (e.g., 400-
425 msec). All spikes are included in these averages (N=54
neurons). Average firing rate was smoothed using a 60 msec
running mean. Panels C and D adapted from Roitman and
Shadlen, 2002.
Figure 6. An evolving decision variable is represented in
brain structures that prepare the motor response.
Microstimulation of the frontal eye field (FEF, which is
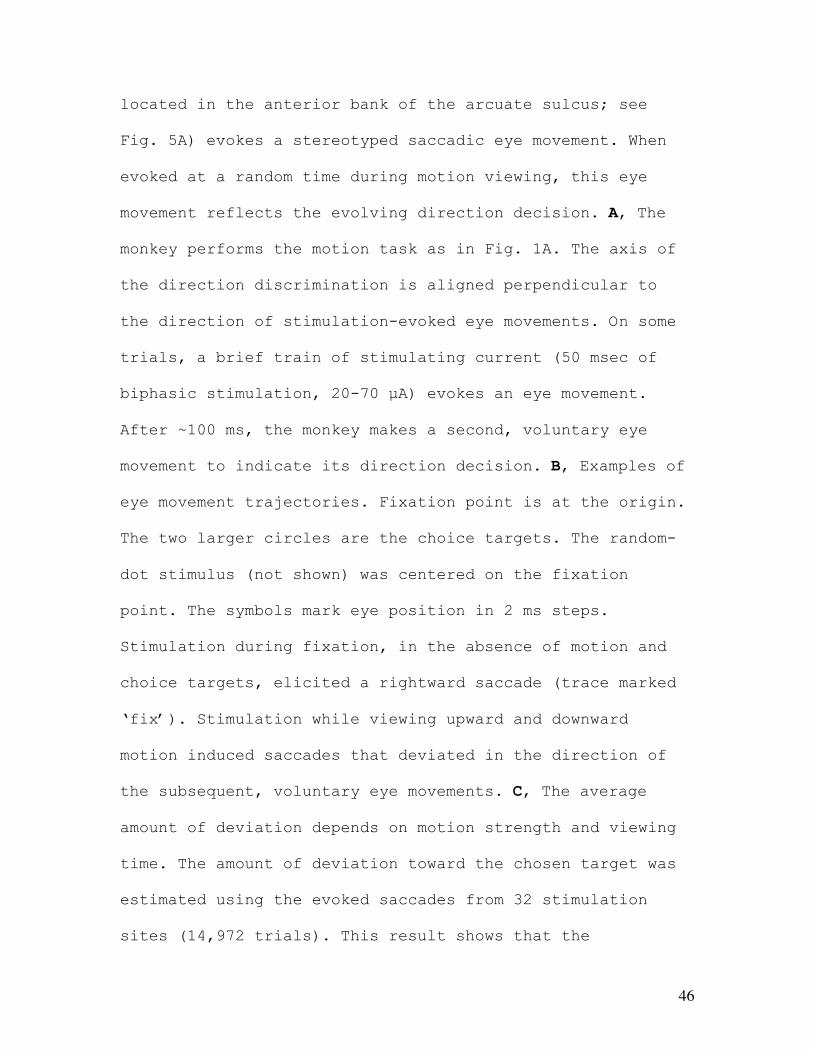
46
located in the anterior bank of the arcuate sulcus; see
Fig. 5A) evokes a stereotyped saccadic eye movement. When
evoked at a random time during motion viewing, this eye
movement reflects the evolving direction decision. A, The
monkey performs the motion task as in Fig. 1A. The axis of
the direction discrimination is aligned perpendicular to
the direction of stimulation-evoked eye movements. On some
trials, a brief train of stimulating current (50 msec of
biphasic stimulation, 20-70 µA) evokes an eye movement.
After ~100 ms, the monkey makes a second, voluntary eye
movement to indicate its direction decision. B, Examples of
eye movement trajectories. Fixation point is at the origin.
The two larger circles are the choice targets. The random-
dot stimulus (not shown) was centered on the fixation
point. The symbols mark eye position in 2 ms steps.
Stimulation during fixation, in the absence of motion and
choice targets, elicited a rightward saccade (trace marked
‘fix’). Stimulation while viewing upward and downward
motion induced saccades that deviated in the direction of
the subsequent, voluntary eye movements. C, The average
amount of deviation depends on motion strength and viewing
time. The amount of deviation toward the chosen target was
estimated using the evoked saccades from 32 stimulation
sites (14,972 trials). This result shows that the
47
oculomotor system is privy to information about the
evolving decision, not just the final outcome of the
decision process. Adapted from Gold and Shadlen, 2001.
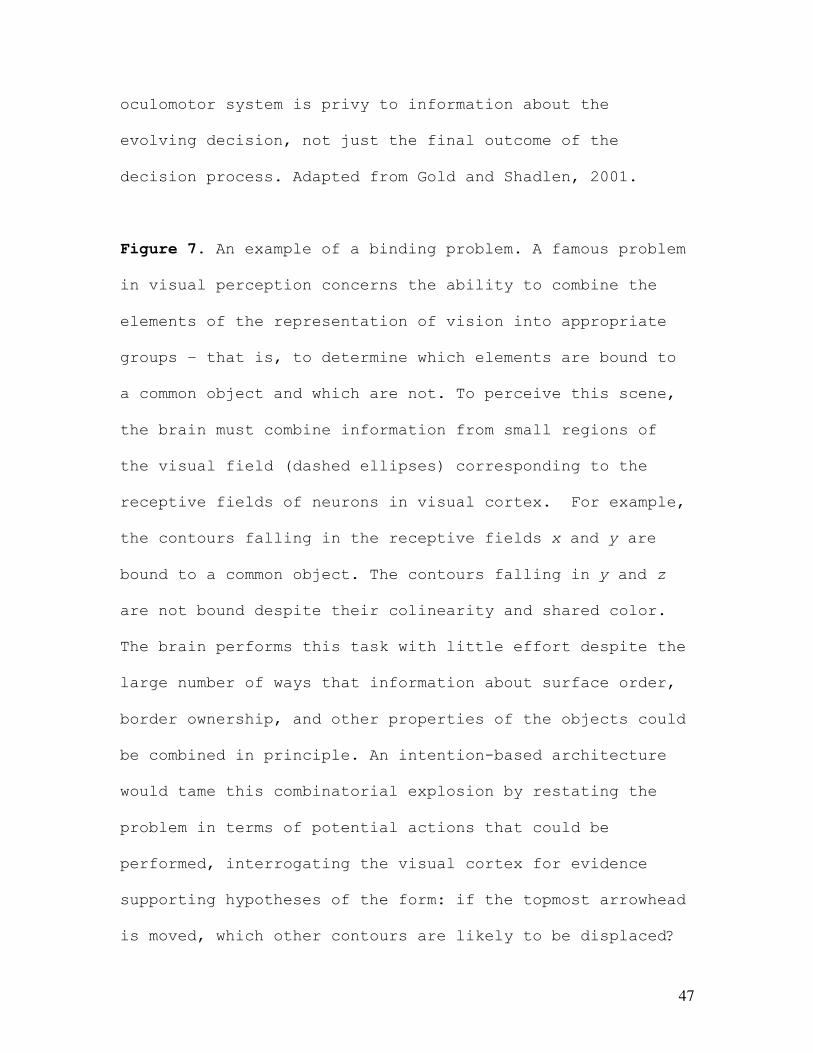
Figure 7. An example of a binding problem. A famous problem
in visual perception concerns the ability to combine the
elements of the representation of vision into appropriate
groups – that is, to determine which elements are bound to
a common object and which are not. To perceive this scene,
the brain must combine information from small regions of
the visual field (dashed ellipses) corresponding to the
receptive fields of neurons in visual cortex. For example,
the contours falling in the receptive fields x and y are
bound to a common object. The contours falling in y and z
are not bound despite their colinearity and shared color.
The brain performs this task with little effort despite the
large number of ways that information about surface order,
border ownership, and other properties of the objects could
be combined in principle. An intention-based architecture
would tame this combinatorial explosion by restating the
problem in terms of potential actions that could be
performed, interrogating the visual cortex for evidence
supporting hypotheses of the form: if the topmost arrowhead
is moved, which other contours are likely to be displaced?

48
The answer is presumably based on the way the contours
trace paths that support or oppose a hypothesis of
continuity. The underlying mechanisms seem likely to be
related to those that form the motion decision, because in
both cases sensory evidence is assembled across space and
time to support a particular action. Adapted from Shadlen
and Movshon, 1999.
A B
Saccade
Motion
Targets
Fixation
Time
Variable Viewing Duration
experimenter controlsviewing time
Saccade
Motion
Targets
Fixation
Time
]RT
Response Time
monkey controlsviewing time
Figure 1Shadlen & Gold
0 200 400 600
0.5
0.6
0.7
0.8
0.9
1
Viewing time (msec)
Prob
abili
y co
rrec
t
% coh51.225.612.8
6.4
3.2
Figure 2 (black & white)Shadlen & Gold
(see Fig2_color.pdf)
0 200 400 600
0.5
0.6
0.7
0.8
0.9
1
Viewing time (msec)
Prob
abili
y co
rrec
t
% coh51.225.612.8
6.4
3.2
Figure 2 (color version)Shadlen & Gold
1 10 100
0.5
0.6
0.7
0.8
0.9
1
1 10 1000400
500
600
700
800
900
Prob
abili
ty c
orre
ctR
espo
nse
time
(mse
c)
Motion strength (% coherence)
A
B
Figure 3Shadlen & Gold

+B
–B
0
Position of particleor
Evidence in favorof proposition 1 andagainst propostion 2
Postive barrier or Criterion to answer, "1"
Negative barrier or Criterion to answer,"2"
Time
Momentary displacementor
Change in evidenceor
Difference in spike rates
+
–
0
Probability density
Figure 4Shadlen & Gold
stslu
ips Intraparietal sulcuslu Lunate sulcussts Superior Temporal sulcusas Arcuate sulcus
ips
Lateral intraparietal area (LIP)Fi
ring
rat
e (s
p/s)
RT (msec)
050
15 spikes/s
Spike
s/s
Targetflash Sac
1 s
k513
Motionstrength
A B
C D
as
Choose target in RF
Choose targetoutside RF
Figure 5 (black & white)Shadlen & Gold
see Fig5_CD_color.ai
Time (msec)
Firi
ng r
ate
(sp/
s)
Time from saccade (msec)
RT (msec)
MotionstrengthC D
Choose target in RF
Choose targetoutside RF
Firi
ng r
ate
(sp/
s)
Time (msec)
Firi
ng r
ate
(sp/
s)
Time from saccade (msec)
Figures 5C & 5D (with color)Shadlen & Gold
-5 0 5 10
-5
0
5
X Position (degrees)
Y Po
sitio
n (d
egre
es)
A VoluntarysaccadeMotionFixation
Evokedsaccade
Time
100 300 5000
0.5
1.0
1.5
Viewing duration (msec)
51.2% coh25.6%6.4%0.0%
B CAm
ount
of d
evia
tion
(deg
)
fix
up
down
Figure 6Shadlen & Gold
x y
z
Figure 7Shadlen & Gold


![NEURurofisiologia - neurophysiology[1]](https://img.dokumen.tips/doc/110x75/5571f1d449795947648bb940/neururofisiologia-neurophysiology1.jpg)


