Embed Size (px)
Citation preview

i
The Mutant-Prevention Concentration (MPC):
Ideas for restricting the development of
fluoroquinolone resistance
A Thesis Submitted to the College of Graduate Studies and Research in partial fulfillment of the requirements for the Doctoral Degree of Science in the Department of Microbiology and Immunology University of Saskatchewan Saskatoon By
Glen T. Hansen
Keywords: Antimicrobial resistance, Fluoroquinolone, Mutant-prevention
concentration, Pseudomonas aeruginosa, Streptococus pneumoniae,
© Copyright Glen Hansen, March, 2005. All rights reserved

ii
PERMISSION TO USE
In presenting this thesis in partial fulfillment of the requirements for a
postgraduate degree from the University of Saskatchewan, I agree that the Libraries of
the University may make it freely available for inspection. I further agree that
permission to copy this thesis in any way, in whole or in part, for scholarly purposes
only may be granted by the professor or professors who supervised my thesis work or,
in their absence, by the Head of the Department of Microbiology and Immunology or
the Dean of the College of Graduate Studies and Research. It is understood that any
copying or publication or use of this thesis or parts thereof for financial gain shall not be
allowed without written permission. It is a also understood that due recognition shall be
given to me and to the University of Saskatchewan in any scholarly use which may be
made of any materials in my thesis.
All requests for permission to copy or to make other use of material in this thesis
in whole or part should be addressed to:
Head of the Department of Microbiology and Immunology
University of Saskatchewan
Saskatoon, Saskatchewan
S7N 5E5

iii
ABSTRACT
The mutant-prevention concentration (MPC) is a novel susceptibility
measurement defined by a concentration threshold that would require cells to contain
two concurrent resistance mutations for growth. Pneuococcal pneumonia, infections
caused by Pseudomonas aeruginosa, and urinary tract infections caused by Gram-
negative bacilli represent three distinct clinical situations for which fluoroquinolone-
resistance occurs. MPC results were defined and measured for fluoroquinolones against
clinical isolates of Citrobacter freundii, Enterobacter cloacae, Escherichia. coli,
Klebsiella pneumoniae, P. aeruginosa, and Streptococus pneumoniae. Against clinical
isolates of S. pneumoniae, MPC results for six fluoroquinolones were measured. Based
on their potential for restricting the selection of resistant mutants, the six
fluoroquinolones, in descending order, were found to be gemifloxacin > moxifloxacin
> trovafloxacin > gatifloxacin > grepafloxacin > levofloxacin. For several
compounds, 90% of clinical isolates that lacked a known resistance mutation had a MPC
value that was close to or below the serum levels that could be attained with a dosing
regimen recommended by the manufacturers. These data identify gemifloxacin,
moxifloxacin and gatifloxacin as good candidates for determining whether MPC can be
used as a guide for choosing and eventually administering fluoroquinolones to
significantly reduce the development of fluoroquinolone –resistant S. pneumoniae.
MPC90 results for 155 clinical isolates of P. aeruginosa against ciprofloxacin and
levofloxacin were 4 and 16 μg/ml, respectively. Serum drug concentrations reported

iv
previously for standard doses were above MPC90 for 5.5 hr for ciprofloxacin and 0 hr
for levofloxacin. These data suggest that superior clinical performance of
ciprofloxacin correlates with activity against resistant mutant subpopulations measured
in vitro. MPC results were compared with minimum inhibitory concentrations (MIC)
measurements preformed by agar dilution, and microbroth dilution and minimal
inhibitory concentrations (MBC) for 100 clinical isolates of C. freundii (n=20), E.
cloacae (n=20), E. coli (n=20), K. pneumoniae (n=20), and P. aeruginosa (n=20) for
ciprofloxacin, levofloxacin and garenoxacin. MPC results were 2-to-8 fold higher than
MIC or MBC results. Ciprofloxacin MPC results for E.coli, C. freundii, E. cloacae, K.
pneumoniae, and P. aeruginosa were 0.5, 2, 1, 1, and 4 μg/ml, respectively.
Levofloxacin, MPC results were were 1, 2, 4, 1, and 16 μg/ml, respectively.
Garenoxacin, MPC were 1, 8, >8, 4, and >32 μg/ml, respectively. Garenoxacin had the
highest MIC and MPC results and was the least active compound tested against isolates
of C. freundii, E. cloacae, and P. aeruginosa. These data support the rational use of
quinolones in the treatments of urinary tract infections and suppression of resistance.
Incorporation of the MPC measurement into dosing strategies may preserve the
longevity of antimicrobial compounds for future infectious diseases.

v
ACKNOWLEDGEMENTS
As with any major undertaking there are many individuals and organizations that
have contributed to my thesis, to my education, and to my life, and it is now my great
pleasure to take this opportunity to thank them.
To be given an opportunity to answer a question and then to be entrusted with the
confidence and support to find the answer is truly all that can be asked for by a graduate
student of a supervisor. I am at a loss to express my gratitude to Dr. Joe Blondeau for
the support, kindness, and education that I received under your leadership and realize
that this help came during a very busy time in your career. I feel fortunate to have had a
supervisor with the ability, willingness, and insight to help me reach my goals. I have
been presented with unique opportunities during my graduate carrer which I will always
be indebted to you for, I (and Conrad Hilton) appreciate the faith you showed in me,
thank you! Finally I am grateful to you for your understanding and support in allowing
me to leave the University during the final stages of my program to purse a clinical
post-doctoral fellowship opportunity. I’m confident that your kindness will not go
unrewarded.
I would like to thank Drs. Deneer, Potter, Sanche, and Ziola for their assistance
and advice. Committee members have suffered along with me during the writing stage
of my thesis and their help was gratefully appreciated, the text itself has been
significantly improved by their reviews. There is little doubt that I have “leaned” hard
on my supervisor and committee members during this process and I would like to thank
vi
those members who demonstrated understanding and patience along the way, I could
not have realized my own objectives without the assistance of this group. I wish to
thank Dr. Harry Deneer, and Dr Steve Sanche who also served as referees for me.
My appreciation is also extended to Karl Drlica, Xilin Zhao and members of
PHRI. Conversations, time and friendship extended to me throughout my program
including time spent in New York were extremely helpful to me and influenced my
research experience.
I am grateful to Bayer, Bristol-Myers Squibb, Glaxco-SmithKline, and the
College of Medicine at the University of Saskatchewan for provided financial support
for research and travel to international meetings. I am especially grateful to Glenn
Tillotson, Allan Westwood and Kathlene Gravelle for their help and support.
Thanks also to the many students I have seen excel through the ranks, especially
Leslie and Landon, for their “scientific input”, comic relief, and fun times. Thanks to
my lab mates Shantelle, Deb, Marnie, Peter, Kelli as well as Mary Woodsworth and
Karen Mochoruk. A special thanks is extended to Brad Cookson, Feric Fang, and Ajit
Limaye at the University of Washington for “putting up with me” and for their
understanding during this time.
Finally I wish to thank my family especially my parents, for their unconditional
support and absolute confidence in me and to Bina who was a constant friend. Their
support of me made it possible for me to achieve success and for that I will be forever
grateful.

vii
TABLE OF CONTENTS Page ii Permission to Use iii Abstract v Acknowledgements vii Table of Contents xiii List of Tables xv List of Figures xviii Abbreviations Used 1 1.0 Introduction 1 1.1 Quinolone Antibiotics 2 1.2 History and Development of Quinolone Agents: Structure-Activity
Relationships
11 1.3 Intracellular Quinolone Targets and Quinolone Action 13 1.4 Mechanisms of Quinolone Action 14 1.5 Mechanisms of Quinolone Resistance 17 1.6 Reduced Intracellular Concentration 18 1.7 Key Pharmacokinetic and Pharmacodynamic Factors for
Fluorouinolone Antibioitcs 25 1.8 The Mutant-Prevention Concentraton (MPC): In vitro Measurement of
the MPC and Experimental Determination of the Mutant-Selection Window
37 2.0 Materials and Methods

viii
37 2.1 Standard Laboratory Methods 37 2.1.1 Isolate Collection and Identification
38 2.1.2 Storage of the Bacterial Isolates
39 2.2 Susceptibility Testing
39 2.2.1 Broth Microdilution
40 2.2.2 Broth Microdilution using CCCP
41 2.2.3 MBC Testing
41 2.2.4 E-Test
42 2.2.5 Vitek Results
43 2.2.6 Agar Dilution
43 2.3 Mutant-Prevention Concentration (MPC)
43 2.3.1 Inoculum Preparation and MPC Testing Procedure
47 2.3.2 Mutant Selection Curves
47 2.3.3 Viable Counts
48 2.4 Characterization of First-step Mutants
48 2.4.1 DNA Isolation, Amplification and Nucleotide Sequence Determination for S. pneumoniae
50 2.4.2 DNA Isolation, Amplification and Nucleotide Sequence Determination for Recovered Mutants of P. aeruginosa
51 2.4.3 Primer Preparation and Storage 51 2.4.4 Analysis of PCR Products 51 2.5 Pulsed-Field Gel Electrophoresis (PFGE) for Clinical Isolates of P. aeruginosa

ix
51 2.5.1 DNA Extraction 51 2.5.2 Cell Disruption 52 2.5.3 Proteinase K Treatment
52 2.5.4 Inactivation of Proteinase K
52 2.5.5 Storage of Plugs 53 2.5.6 Restriction Endonuclease Digestion
53 2.5.7 Preparation of the Gels
53 2.5.8 Staining Procedure 54 2.6 Killing of S. pneumoniae by Fluoroquinolones Assessed with Conventional Kill Curves 55 2.7 Killing of P. aeruginosa by Ciprofloxacin and Levofloxacin Assessed with MPC-based Kill Curve Experiments
56 2.8 Ciprofloxacin and Levofloxacin Efficacy in a Rat Abscess Model of P. aeruginosa Infection
57 2.8.1 Animal Model of Infection
58 2.8.2 Administration of Fluoroquinolones
58 2.8.3 Recovery of Blood Samples
58 2.8.4 Recovery of Infected Tissue and Blood Samples 60 3.0 Mutant-Prevention Concentrations of Fluoroquinolones for Clinical Isolates of S. pneumoniae
60 3.1 Abstract 62 3.2 Introduction 67 3.3 Results

x
67 3.3.1 MPC Distributions for Clinical Isolates of S. pneumoniae
74 3.3.2 Relationship of MPC Results to Fluoroquinolone PK/PD Properties 78 3.3.3 Killing of S. pneumoniae by Fluoroquinolones at the MIC, MPC and Cmax Drug Concentrations 84 3.4 Discussion 95 4.0 Enrichment of Fluoroquinolone-Resistant Mutant Subpopulations of P. aeruginosa 95 4.1 Abstract 97 4.2 Introduction 102 4.3 Results 102 4.3.1 Effect of Fluoroquinolone Concentration on Mutant Recovery for Fluoroquinolone-Susceptible Clinical Isolates of P. aeruginosa 106 4.3.2 Effect of Fluoroquinolone Concentration on Mutant Recovery for a Clinical Isolate of P. aeruginosa 109 4.3.3 Distribution of MIC and MPC Results for 155 Clinical Isolates of P. aeruginosa 113 4.3.4 Effect of Individual MIC Results on Ciprofloxacin and Levofloxacin MPC Distributions
115 4.3.5 Relationship Between MPC Results and Susceptibility Breakpoints 117 4.3.6 Characterization of First-Step Mutants 117 4.3.6.1 Phenotypic Demonstration of Resistance in Recovered Mutants 120 4.3.6.2 DNA Sequence Analysis of gyrA and parC Targets in Recovered Mutants of P. aeruginosa 125 4.3.6.3 PFGE Analysis of Recovered Mutants of P. aeruginosa

xi
127 4.3.7 Enrichment of Mutant Subpopulations from nalB, nfxB, nfxC, and oprD Mutants of P. aeruginosa
133 4.3.8 Bacterial Killing and MPCs for Clinical Isolates of P. aeruginosa
141 4.3.9 Ceftazidime plus Ciprofloxacin/Levofloxacin Combination MPC Results for Clinical Isolates of P. aeruginosa
147 4.3.10 Recovery of Resistant Mutants in a Rat Abscess Model of Infection with P. aeruginosa
152 4.4 Discussion 184 5.0 Comparison of the MIC, MBC, and MPC Measurements for Ciprofloxacin, Levofloxacin and Garenoxacin Against Enteric Gram- negative UTI Pathogens 184 5.1 Abstract 186 5.2 Introduction 189 5.3 Results 196 5.4 Discussion 201 6.0 Concluding Remarks 212 7.0 REFERENCES 257 8.0 APPENDIX A 257 8.1 Solutions and Buffers 260 8.2 APPENDIX B
260 8.2 Suppliers 260 8.2.1 Media 260 8.2.2 Antimicrobial Agents
260 8.2.3 Reagents, Chemicals and Enzymes

xii
262 8.2.4 Disposable Labware
262 8.2.5 Equipment
263 8.2.6 Rats

xiii
LIST OF TABLES
Page
69 Table 3.3.1 Fluoroquinolone Potency Based on MPCpr Results 72 Table 3.3.2 Distribution of MPC Results and the Relationship
Between MIC and MPC for Clinical Isolates of S. pneumoniae and Fluoroquinolones
75 Table 3.3.3 Fluoroquinolone Potency Based on MIC and MPC
Results for Clinical Isolates of S. pneumoniae
77 Table 3.3.4 Fluoroquinolone-Resistance Alleles Associated With High MPC Values
79 Table 3.3.5 MIC and MPC Results for Moxifloxacin, Gemifloxacin, and Levofloxacin Against 4 Isolates of S. pneumoniae
81 Table 3.3.6 Killing of S. pneumoniae (n=4) at Varying Concentrations and Inocula for Clinical Isolates of S. pneumoniae
91 Table 3.4.1 PK/PD Properties for Fluoroquinolones 104 Table 4.3.1 MIC and MPC Results for Clinical Isolates of P.
aeruginosa Used in Mutant Selection Curves 118 Table 4.3.2 MIC and MICrecovered Results for Selected Mutants and
Parental Strains of P. aeruginosa 121 Table 4.3.3 Sequence Analysis of GyraseA and TopoisomeraseIV
Target Genes of Recovered Mutants of P. aeruginosa 130 Table 4.3.4 MIC and MPC Results for nalB, nfxB, nfxC and oprD
Efflux Mutants of P. aeruginosa 136 Table 4.3.5 Killing of P. aeruginosa CBRH 25138 by Ciprofloxacin
and Levofloxacin at the MIC and MPC 137 Table 4.3.6. Killing of P. aeruginosa PA-25 by Ciprofloxacin and
Levofloxacin at the MIC and MPC

xiv
142 Table 4.3.7 MPC Results for Antimicrobials Against Clinical Isolates P. aeruginosa
144 Table 4.3.8 Fluoroquinolone Ceftazidime Combination MPC Results
for Clinical Isolates of P. aeruginosa 145 Table 4.3.9 NCCLS Breakpoints for Antimicrobials Against P.
aeruginosa 149 Table 4.3.10 Recovery of P. aeruginosa from a Rat Abscess Model of
Infection 190 Table 5.3.1 MIC, MBC, and MPC Distributions for UTI Isolates
Against Ciprofloxacin, Levofloxacin, and Garenoxacin
xv
LIST OF FIGURES
Page 4 Figure 1.1 Chemical Structure of the Quinolone Nucleus 10 Figure 1.2 Evolution of Quinolone Development 22 Figure 1.3 The Area Under the Concentration Time Curve (AUC) 27 Figure 1.4 MPC Dynamics 30 Figure 1.5 Selective Amplification of Resistant Mutants 31 Figure 1.6 The Mutant-Selection Window 34 Figure 1.7 The Relationship Between the MPC and Killing by
Fluoroquinolones 68 Figure 3.3.1 Distribution of MPCpr Results for 5 Fluoroquinolones
Against 100 Clinical Isolates of S. pneumoniae
71 Figure 3.3.2 Distribution of MPC Results for Moxifloxacin, Levofloxacin, Gatifloxacin, and Gemifloxacin Against 220 Clinical Isolates of S. pneumoniae
80 Figure 3.3.3 Killing of S. pneumoniae (n=4) by Gemifloxacin, Moxifloxacin, and Levofloxacin at the MIC, MPC and Cmax Drug Concentrations
103 Figure 4.3.1 Effect of Fluoroquinolone Concentration on Recovery of P. aeruginosa Colonies from Six Fluoroquinolone- Susceptible Isolates
107 Figure 4.3.2 Effect of Fluoroquinolone Concentration on Mutant
Recovery for Clinical Isolates of P. aeruginosa 110 Figure 4.3.3. MIC and MPC Distributions for 155 Clinical Isolates of P. aeruginosa Tested Against Ciprofloxacin and Levofloxacin

xvi
111 Figure 4.3.4 MPC results for 155 Clinical Isolates of P. aeruginosa Against Ciprofloxacin and Levofloxacin
114 Figure 4.3.5 Initial MIC Results and MPC Distributions for
Ciprofloxacin and Levofloxacin for 155 Clinical Isolates of P. aeruginosa
116 Figure 4.3.6 Relationship of MIC and MPC Results to NCCLS
Susceptibility Breakpoints with P. aeruginosa 126 Figure 4.3.7 PFGE Analysis of Recovered Mutants of P. aeruginosa 128 Figure 4.3.8 Effect of Fluoroquinolone Drug Concentration on Colony
Recovery from nalB, nfxB, nfxC, and oprD efflux Mutants of P. aeruginosa
134 Figure 4.3.9 Killing of P. aeruginosa CBRH 25138 by Ciprofloxacin
and Levofloxacin at the MIC and MPC 135 Figure 4.3.10 Killing of P. aeruginosa PA-25 by Ciprofloxacin and
Levofloxacin at the MIC and MPC 148 Figure 4.3.11 Administration of Fluoroquinolones and Collection of
Clinical Samples in a Rat Abscess Model of P. aeruginosa Infection
156 Figure 4.4.1 Relationship of MPC Results to Ciprofloxacin and
Levofloxacin Dose Response Profiles 159 Figure 4.4.2 Stratification of the Mutant Selection Window Based on
Ciprofloxacin and Levofloxacin MPC Distributions for 155 Clinical Isolates of P. aeruginosa
162 Figure 4.4.3 Relationship Between Selection of Resistant Mutants and
Initial Degree of Susceptibility 166 Figure 4.4.4 The Relationship Between Bacterial Killing and the MPC
for Fluoroquinolones

xvii
193 Figure 5.3.1 MIC, MBC and MPC Results for 100 Gram-negative Urinary Isolates of C. freundii, E. cloacae, E. coli, K. pneumoniae and P. aeruginosa for Ciprofloxacin, Garenoxacin, and Levofloxacin

xviii
ABBREVIATIONS USED
ATTC American Type Culture Collection AUC Area under the concentration time curve AUIC Area under the inhibitory concentration time curve
AUIC = AUC/MIC AUC24 Area under the concentration time curve during a 24 hr dosing
interval AUIC24 Area under the inhibitory concentration time curve during a 24 hr
dosing interval BHI brain heart infusion CCCP Carbonyl yanide m-chlorophenylhydrazone CFU Colony forming units Cmax Maximum serum/tissue concentration CHEF Contoured clamped homogeneous electric field CSB Cell suspension buffer EDTA etheylenediaminetetracetic acid EtBr Ethidium bromide FDA Food and Drug Administration GABA Gamma amino buteric acid I.P. Intraperitoneal I.V. Intravenous Kb Kilobases LMP Low melting point MDR Multi-drug resistance MHB Mueller Hinton Broth MBC Minimum bactericidal concentration MIC Minimum inhibitory concentration MPC Mutant-prevention concentration MPCpr Provisional Mutant-prevention concentration MSW Mutant-selection Window n Sample number NCBI National Center for Biotechnology OMP Outer membrane protein PBR Penicillin binding protein PCR Polymerase chain reaction PFGE Pulsed field gel electrophoresis PK/PD Pharmacokinetic/pharmacodynamic PMSF Phenylmethyl-sulfonyl fluoride
xix
qh8 Administration of an antimicrobial every 8 hours within a defined 24 hour interval
qh4 Administration of an antimicrobial every 4 hours within a defined 24 hour interval
QRDR Quinolone Resistance Determining Region R resistant level of drug susceptibility S susceptible level of drug susceptibility t Time TBE Tris-HCl boric acid EDTA buffer TE Tris-HCl EDTA buffer Temp Temperature THB Todd-Hewitt Broth T.I.D. Three time daily dosing TMP-SXT Trimethoprim/sulfamethoxazole TSA Trypic soy agar U Units UTI Urinary tract infection

1
1.0 INTRODUCTION 1.1 Quinolone Antibiotics The fluoroquinolones represent a relatively new class of broad-spectrum,
systemically active antibacterial agents. Since the introduction of nalidixic acid in 1967
(304), fluoroquinolone usage has expanded far beyond an early role in the treatment of
urinary tract infections (UTIs) and fluoroquinolones are now used in front-line therapies
for the treatment of a number of different bacterial infections present at different
anatomical sites. Collectively, the fluoroquinolone spectrum of activity now includes
Gram-negative, Gram-positive, atypical and anaerobic pathogens (28, 33, 69), as well as
multi-drug resistant organisms (MDR) (17, 164, 165, 246, 282), since the mechanism of
quinolone action is distinct from existing classes of antimicrobials (165). Examination
of many new derivatives has improved our understanding of quinolone activity and has
led to structural changes in quinolone chemistry that in turn have produced compounds
with longer elimination half lives, better dosing profiles, more extensive bacterial
coverage, greater potency and acceptable safety profiles (30, 68, 96, 113, 132). Overall,
the introduction of fluoroquinolones into clinical practice, particularly as orally
administered antibiotics, has revolutionized the management of a number of infections
that were previously treatable only with parenteral antimicrobial agents. Thus,
preserving the current and future clinical utility of fluoroquinolones is of paramount
importance. The following chapter discusses quinolone history, structure/activity
relationships, and development of resistance and introduces a novel susceptibility

2
parameter, termed, mutant-prevention concentration (MPC) which is designed to
minimize fluoroquinolone resistance while maximizing therapeutic outcome.
1.2 History and Development of Quinolone Agents: Structure - Activity Relationships
The discovery of quinolone antibiotics began by chance during the early 1960s
when a by-product of the commercial preparation of the antimalarial drug chloroquine
was found to have antibacterial properties (201). The compound 7-chloro-1-ethyl-1, 4-
dihydro-7 methyl-4-oxo-1, 8-napthyrlidin-3-carboxylic acid was subsequently modified
with the additions of N-1 ethyl and C-1 methyl groups which resulted in nalidixic acid,
the first quinolone antibiotic. Nalidixic acid was introduced for the treatment of
uncomplicated UTIs in 1964 (132, 201, 304) and marked the beginning of four decades
of quinolone use and development.
In addition to nalidixic acid, there are nine quinolone agents currently approved
for use in Canada and in the United states, including ciprofloxacin, enoxacin,
gatifloxacin, gemifloxacin, levofloxacin, lomefloxacin, moxifloxacin, norfloxacin, and
ofloxacin (15, 16, 262). Additional members of the class, such as perfloxacin,
fleroxacin and tosufloxacin, are in use outside North America (54, 187, 191).
Gemifloxacin was recently approved for use in North America (2004) and is now in
clinical practice in the U.S.A. and expected to be approved for use in Canada.
Classification of the quinolones has not been officially formalized and various criteria,
including spectrum of activity, chemical structure, clinical utility and decade of
development have all been proposed as a means for grouping members of the

3
fluoroquinolone class of antimicrobials (12, 28, 132, 253, 272). For example, Ball (12)
has proposed that first generation compounds, such as nalidixic acid and flemequin,
provide coverage primarily for the Enterobacteriaceae. Second-generation compounds,
such as ciprofloxacin, levofloxacin and sparfloxacin are further divided into those with
enhanced, predominant Gram-negative coverage with balanced broad-spectrum activity
including some Gram-positive bacteria. Third-generation agents, such as moxifloxacin
and gatifloxacin, display enhanced Gram-positive activity, particularly against
Streptococcus pneumoniae (12, 30). Gootz et al (132) proposed a classification of
quinolones based on incorporating key modifications in the chemical structure that
correlate with the decade of development. Despite these distinctions, quinolone
chemistry and activity are inextricably linked and quinolones generally fall into one of
three distinct groups consisting of first, second, or third-generation agents (9, 28, 30, 81,
132). All currently approved quinolones share a common core structure with that of the
original quinolone, nalidixic acid, consisting of two fused 6-member heterocyclic nuclei
containing one to four nitrogen atoms (12, 81, 132) (Figure 1.1.).

4
X 8
C OH
O
3
R2
7
6
54
2
N 1
R1
OR5
F
R7
Side chains present at positions N-1 and R-1 have been shown to control theophylline interactions and genetic toxicity. An R-5 moiety influences phototoxicity and genetic toxicity. A fluorine atom at the C-6 carbon position has been associated with increased potency; all currently available “fluoroquinolones” retain a 6-fluorine atom. Side chains at the C-7 postion has been associated with gamma amino buteric acid (GABA) binding and theophylline interactions. C-8 rings have been associated with enhanced killing and increased activity against S. pneumoniae.
Figure 1.1 Chemical Structure of the Quinolone Nucleus

5
Nalidixic acid was the first clinically useful quinolone that possessed excellent
in vitro activity against a variety of different Gram-negative species from the
Enterobacteriaceae (304, 329). However, it proved ineffective against various genera
and species of Gram-positive bacteria, Pseudomonas aeruginosa and Serratia
marcescens (10, 73, 107, 233), and never became a useful agent in the treatment of
systemic infections because it possessed poor pharmacological properties. Other early
compounds such as rosoxacin, oxolinic acid and cinoxacin followed, however, none of
these compounds significantly improved upon the activity or clinical utility of earlier
generation agents and, as a result, did not obtain secure status within the quinolone class
(227). Overall, first generation agents are characterized by their Gram-negative
coverage (excluding P. aeruginosa). However, resistance among Gram-negative
bacteria was quick to develop and first generation agents possessed low adsorption and
tissue penetration (< 0.5 mg/ml peak serum concentrations) which relegated their use to
infections of the urinary tract (173, 304).
Development in the 1970s focused on producing more potent second-generation
agents and two significant breakthroughs in the evolution of the quinolone class
occurred with the additions of a piprazynl ring, or piperazine derivative, at the C-7
position and a fluorine atom on the C-6 carbon. Addition of a 7-piperazine ring created
pipemidic acid, a quinolone with enhanced penetration of the bacterial cell wall which
improved activity against Gram-negative bacteria and some Gram-positive bacteria (12,
326). The incorporation of a fluorine atom at position C-6 resulted in flemequine. The

6
C-6 fluorine was shown to enhance both gyrase inhibition and bacterial cell penetration
(82), improving activity against Gram-negative and Gram-positive organisms. The high
degree of intrinsic activity associated with compounds possessing a C-6 fluorine has led
to acceptance of the fluorine atom in overall “fluoroquinolone” chemistry (103, 273).
Subsequently, all currently approved quinolones retain a fluorine atom at position C-6.
In 1980, Koga et al (188) discovered that inclusion of a C-7-piperazinyl ring in
the quinolone nucluess further increased the spectrum of activity of the quinolones
(185). The exchange of a carbon molecule for nitrogen at position 8, coupled with the
C-6 fluorine atom and a C-7 ring, resulted in norfloxacin-the first of the modern day
fluoroquinolones. Norfloxacin was approved for clinical use in 1984 (103, 268) and
was characterized as having high activity (and improved activity) against various genus
and species of Aeromonas hydrophila, Haemophilus influenzae, P. aeruginosa,
Pasteurella multocida, Neisseria spp. and (228). The introduction of norfloxacin
signified the beginning of a period of rapid development of other oral second generation
quinolones such as ciprofloxacin, enoxacin, fleroxacin, ofloxacin, and perfloxacin. Of
these, only ciprofloxacin and ofloxacin became widely established for the treatment of
infections involving sites other than the urinary tract (12).
Ciprofloxacin, released in 1987, incorporated the addition of an N-1 cyclopropyl
group and was characterized as having improved activity against Gram-positive
organisms such as Enterococcus faecalis, Staphylococcus aureus, S. pneumoniae, and
against Gram-negative organisms such as Escherichia coli, H. influenzae, K.

7
pneumoniae and Neisseria gonorrhoeae. Ciprofloxacin was also active against atypical
organisms such as Chlamydia spp., Legionella spp., and Mycoplasma pneumoniae,
showed good oral bioavailability (20, 163, 311, 356). Ciprofloxacin marked two
important milestones in the development of fluoroquinolones. It was the first available
intravenous (I.V.) agent allowing for sequential or step down from intravenous to oral
therapy in hospitalized patients with serious systemic infections. This proved to be a
significant cost containment benefit (311). It was also first the first orally available
antimicrobial agent with reliable activity against P. aeruginosa at sites other than the
urinary tract (36, 39, 51, 72, 167). Ofloxacin, a chiral fluorinated 1,8-cylco compound
developed in the mid 1980s, also had broad spectrum applications and was approved for
use in 1990 (338). In comparison with ciprofloxacin, ofloxacin is rapidly absorbed
from the gastrointestinal tract, achieves higher serum concentrations and has a longer
elimination half-life (28, 202, 312, 313). Enterobacteriaceae, enteropathogens
(bacterial) and fastidious Gram-negative bacteria are highly susceptible to ofloxacin
which display minimal inhibitory concentrations (MICs) of < 2 μg/ml. Ofloxacin MICs
against P. aeruginosa are generally 2-to-8 fold higher than those observed for
ciprofloxacin (341). Levofloxacin, a racemic mixture of the active component of
ofloxacin present in the L-isomer form was released shortly after ofloxacin and
approved for use in United States in 1999 (269).
Levofloxacin expanded upon the Gram-negative coverage of ofloxacin and is
generally considered to be 2-fold more potent than ofloxacin based on lower MICs (72,

8
170). Levofloxacin possesses Gram-positive coverage against S. aureus, borderline
(near-breakpoint) activity against S. pneumoniae and became the first quinolone
approved for once daily therapy of community-acquired pneumoniae in North America.
Molecular substitutions based on the 6-fluorine, 7-piperazinyl molecule yielded
additional second-generation agents such as sparfloxacin and clinafloxacin which
demonstrated increased activity against S. aureus and S. pneumoniae relative to earlier
generation agents, but which for a variety of reasons did not reach wide-spread clinical
use. For example, the pharmacokinetics of clinafloxacin were such that it necessitated
twice or three times daily dosing (132, 297, 298). Collectively, norfloxacin,
ciprofloxacin, ofloxacin/levofloxacin, sparfloxacin and clinafloxacn represent second-
generation agents or extended spectrum quinolones, which were introduced into clinical
practice in the late 1980s and 1990s. The primary advantage of second-generation
agents is an improved spectrum that includes H. influenzae, Moraxella catarrhalis,
Neisseria spp., P. aeruginosa, and, Staphylococcus spp. and atypical pathogens such as
Chlamydia spp., Legionella spp., and Mycoplasma spp.
The search for broader-spectrum fluoroquinolones with greater potency against
Gram-positive and anaerobic bacteria fuelled the development of quinolones in the mid
to late 1990s. A large number of the investigational compounds possessed excellent
activity against gram-positive organisms, but frequently lost potency against Gram-
negative organisms. However, a small number of derivatives were discovered that had
improved activity against Gram-positive bacteria and also retained good anti-Gram-

9
negative properties. These newer derivatives represent third-generation quinolones, or
“respiratory quinolones”. Third-generation agents contain variations of C-7 rings (7-3-
methyl-piperazinyl in the case of gatifloxacin and a 7-azabicyclo ring in the case of
moxifloxacin) and improved activity against S. pneumoniae and anaerobic bacteria.
Currently, all approved third generation agents also posses C-8 methoxy residues which
are associated with increased bacterial killing (221, 368). Trovafloxacin, grepafloxacin
and garenoxacin are no longer considered clinical alternatives, but are noteworthy in the
overall development of third-generation agents because structural modifications to C-3,
C-5 and C-7 carbon atoms have led to increased understanding of the structure-activity
relationship of fluoroquinolones (35, 59-62, 171). Garenoxacin can be further
distinguished from other fluoroquinolones because it was the first quinolone lacking a
fluorine atom at the C-6 position to advance to stage III clinical trials (120). Figure 1.2
outlines the development of selected fluoroquinolones.

10
1,8-napthyridine 1960
Nalidixic Acid 1962
Pipemidic Acid 1975
Flemequin
Enterobacteriaceae 1st GENERATION
Ciprofloxacin 1986
Ofloxacin 1985
Clinafloxacin
Sparfloxacin 1993
Levofloxacin 1993
Gatifloxacin 1999
Moxifloxacin 1999
-Grepafloxacin -Trovafloxacin -Gemifloxacin
-BMS 284756/Genrenoxacin
Enterobacteriaceae + P.aeruginosa + S. aureus + M. catarrhalis + N. gonorrhoeae + S. pneumonaie
2nd GENERATION 3rd GENERATION
S. pneumoniae + S. aureus + anaerobes
Selected quinolone agents highlight developments in quinolone antimicrobial agents. Quinolones are grouped by first, second, or third-generation based on the combination of decade of development and spectrum of activity.
Figure 1.2 Evolution of Quinolone Development

11
1.3 Intracellular Quinolone Targets and Quinolone Action
Quinolones interact with two related, but distinct bacterial topoisomerase
enzymes. Bacterial topoisomerases are a class of enzymes essential in maintaining a
chemically stable and biologically active form of cellular DNA (169). There are four
bacterial topoisomerases, classified as either type I or type II enzymes. Type I
topoisomerases are active during the replication of single-strand DNA, whereas type II
topoisomerases are required for double-stranded DNA replication (204, 324).
Quinolone antibiotics are strong inhibitors of the type II enzymes, which include DNA
gyrase (topoisomerase type II) and topoisomerase type IV. Type I enzymes are not
sensitive to the inhibitory activity of quinolones (244). DNA gyrase and
Topoisomerase IV exist as a tetrameric protein, each consisting of two subunit dimers.
GyrA and gyrB comprise DNA gyrase and are encoded by the gyrA and gyrB genes,
while ParC (GrlA in S. aureus) and ParE (GrlB in S. aureus) are encoded by the parC
and parE genes, and comprise topoisomerase IV. DNA gyrase and topoisomerase IV
facilitate bacterial replication by breaking both strands of duplex DNA, passing another
strand of DNA through the break and resealing initial broken strands (122, 165, 350).
The activity of gyrA and parC subunits are responsible for cutting double stranded
DNA utilizing the free energy of ATP hydrolysed by the gyrB or parE subunits (18).
Once the DNA is cut, another strand of DNA is passed through the gap and the DNA is

12
re-ligated. DNA gyrase differs from topoisomerase IV in that it can wrap DNA around
itself and cause strand passage of the molecule of DNA that it has cut. In the case of
topoisomerase IV, strand passage occurs during a process which utilizes two different
DNA molecules. This process occurs in such a way that after each catalytic event, the
linear DNA double helix becomes twisted, resulting in a superhelix structure. This
superhelical twisting is referred to as negative supercoiling and occurs in the opposite
direction to the right-handed coiling of the internal helix of the DNA strand. Negative
supercoiling, induced by the actions of DNA gyrase, allows chromosomal DNA to
become tightly packaged within the bacterial cell and ensures the correct conformation
for the initiation of DNA replication (88, 166). DNA gyrase also allows the
continuation of DNA replication by producing negative supercoils in front of the DNA
replication fork, thereby counteracting the positive supercoiling introduced by the
action of DNA replication (223, 349). The bi-directional nature of the DNA replication
process is such that daughter molecules are interlinked, or catenated, after replication.
Topoisomerase IV is the principal enzyme that decatenates or removes the interlinking
of daughter chromosomes at the completion of each round of DNA replication, thus
allowing their segregation into daughter cells (361).
13
1.4 Mechanisms of Quinolone Action During replication, bacterial DNA interacts with type II topoisomerase enzymes,
resulting in a DNA-enzyme cleavage complex, which becomes the substrate for
quinolone binding (153). Interaction of quinolones with DNA-enzyme complexes
(DNA with DNA gyrase or topoisomerase IV) results in conformational changes to both
enzyme and enzyme-bound DNA (180, 193, 228, 229). Topoisomerase enzymes break
DNA strands and the interaction of the quinolone-enzyme-DNA complex prevents re-
ligation of the broken DNA strands (123, 151, 331). Although not completely
understood, quinolone action involves a two-step process beginning with the
stabilization of quinolone-enzyme-DNA complexes leading to trapping of double-
stranded DNA breaks and the subsequent release of double-stranded DNA breaks (88).
Although quinolone-enzyme-DNA complex formation and cell death are clearly related,
the bacteriostatic and bactericidal actions of quinolones action appear to represent
distinct events. For example, the formation of quinolone-enzyme-DNA complexes
cannot result in cell death because complex formation, as monitored by inhibition of
DNA synthesis, is reversible (134, 155). Analysis of closely related fluoroquinolones
has demonstrated that a compound can be more effective at preventing colony
formation, but less effective at killing cells (131, 245, 369). A generalized model of the
bactericidal action of quinolone antibiotics proposes that drug-enzyme-DNA complexes
are sufficient in blocking cell growth, while the release of DNA breaks from drug-
enzyme-DNA complexes is the lethal event. This assumption correlates well with in

14
vitro findings demonstrating that quinolone concentrations required to release double-
stranded breaks from chromosomal drug-enzyme-DNA complexes correlate better with
cell death than with inhibition of growth (52, 90). Therefore, quinolones that trap pairs
of single-stranded breaks, or more readily cause release of pairs of single-stranded
breaks, are expected to be more lethal.
1.5 Mechanisms of Quinolone Resistance
The most common mechanisms of quinolone resistance occur via mutations
within the target genes gyrA/gyrB and parC/parE. Resistance to fluoroquinolones
develops in a step-wise fashion, with incremental rises in quinolone MICs at each stage
(281). Reductions in susceptibilities are associated with initial, first-step mutations that
occur at specific sites within gyrA and parC genes, known as quinolone-resistance-
determining regions (QRDR) (28, 88, 165, 166). Subsequent second-step mutations can
occur in QRDR of the gyrB and parE genes which lead to high-level resistance. A
common model of quinolone target modifications proposes that amino acid changes in
the QRDR of DNA gyrase and topoisomerase IV alter the structure of the quinolone
binding site near the interface of the enzyme and DNA; subsequent resistance is then an
effect of reduced drug affinity for the modified enzyme-DNA complex (166).
However, direct structural information on the site of quinolone-binding within the
complex is not yet available.
The affinity of a quinolone against any bacterial pathogen appears to result from
the relative sensitivities of DNA gyrase and topoisomerase IV. The more sensitive

15
enzyme generally determines the primary quinolone target for a given organism,
independent of the sensitivity of the secondary target. For Gram-negative bacteria,
purified DNA gyrase is more sensitive to quinolones than purified topoisomerase IV,
leading to the hypothesis that DNA gyrase is the primary quinolone target among
Gram-negative bacteria. Initial genetic studies with nalidixic acid-resistant mutants of
E. coli demonstrated that first-step mutations occurred in a region of the GyrA, between
amino acid sites 67-106 (123, 140, 255, 360). Resistance mutations in gyrB of Gram-
negative bacteria develop as secondary mutations to those of gyrA and are associated
with highly resistant organisms (166). Conversely, in S. aureus purified topoisomerase
IV is more sensitive to quinolone action than DNA gyrase (24, 165). Proof that
topoisomerase IV is a primary quinolone target among Gram-positive bacteria came
from studies in which first-step quinolone resistance mutations were found in regions of
the parC (grlA) genes for clinical isolates of S. aureus and S. pneumoniae (104, 105,
260). Thus, primary target affinity for Gram-negative organisms appears to be DNA
gyrase while topoisomerase IV is the primary target in Gram-positive bacteria.
However, this simplified stratification of quinolone target affinity is incomplete
when examining newer third-generation agents such as moxifloxacin and gemifloxacin
which have been shown to target DNA gyrase in Gram-positive organisms while
retaining affinity for topoisomerase IV. For example, in S. pneumoniae, sparfloxacin
and gatifloxacin selected first step gyrA mutants (117, 278), and purified S. pneumoniae
DNA gyrase was found to be less sensitive to sparfloxacin and clinafloxacin than

16
purified topoisomerase IV (246, 277). The explanation for the apparently anomalous
behaviour of sparfloxacin, gatifloxacin and clinafloxacin is yet unclear, but has
prompted the argument that quinolone chemistry may determine target affinity (81, 88).
As such, compounds may become classified into one of three archetypal mechanistic
classes (32, 152, 276, 278): (1) compounds which select gyrase mutations before
topoisomerase IV mutations and likely act through DNA gyrase in vivo, (2) compounds
that select for QRDR mutations in the genes encoding topoisomerase IV first before
those in DNA gyrase, thereby suggesting that the drugs act preferentially through
topoisomerase IV in vivo and (3) compounds which posses dual target activity and act
through both DNA gyrase and topoisomerase IV. Fluoroquinolones with comparable
target affinity (i.e., both DNA gyrase and topoisomerase IV) have changed the
perception of how resistance mutations are thought to accumulate in target genes. For
resistance mutations in the primary target enzyme, the level of sensitivity of the
unmutated secondary target enzyme, which becomes the more sensitive enzyme when
the primary target is resistant, may determine the degree of resistance. This hypothesis
implies that for different quinolones, the level of resistance conferred by a mutation in
the primary target enzyme would decrease as the level of drug sensitivity of the
secondary target approaches that of the primary target. Furthermore, it implies that
concurrent mutations in both target enzymes would be required for resistance due to
target alterations for any quinolone that had equal potency against DNA gyrase and
topoisomerase IV. This suggestion appears to be the case with S. pneumoniae and

17
clinafloxacin (277). Mutants of S. pneumoniae selected with clinafloxacin occur at a
low frequency and gyrA mutations selected in first-step experiments had a minimal
impact on clinafloxacin resistance. Second and third-step mutants of gyrA and parC,
however, exhibit substantial resistance (165, 276, 278).
1.6 Reduced Intracellular Concentration
In order to reach their targets in the cell cytoplasm, fluoroquinolones must cross
the cytoplasmic membrane and, in Gram-negative bacteria, the outer membrane as well.
Thus, alterations in drug permeation contribute to overall decreases in quinolone
susceptibility. In addition to passive membrane diffusion, the relative size and charge
of fluoroquinolones facilitate active transport across the outer membrane through porin
proteins which form general diffusion channels allowing access to the cell (132, 164,
266). Quinolone-resistant clinical isolates of Gram-negative bacteria have been found
to posses reduced numbers of outer membrane porins. For example, deficiencies in the
outer membrane proteins (OMP) OmpF and D2 of E.coli and P. aeruginosa have been
associated with resistance to a fluoroquinolones (237, 242). Reductions in the relative
amount of OMPs result in decreased diffusion of quinolones across outer membranes
(157, 158, 288), however, examination of diffusion rates suggest that porin reductions
alone are generally not sufficient to account for high-level resistance (266).
Recently, resistance caused by reduced accumulation has been shown to result
from enhanced expression of efflux systems that actively pump drug from the
cytoplasm. In Gram-negative bacteria, these systems typically have three components:

18
the efflux pump located in the cytoplasmic membrane, an OMP and a membrane fusion
(or linker) protein (164, 291). Efflux systems actively extrude drug from the cytoplasm
or cytoplasmic membrane across the periplasm and outer membrane to the cell exterior.
The energy for this process is derived from the proton gradient across the membranes.
Efflux expression is regulated and resistance occurs by chromosomal mutations that
causes coordinated increased expression of pump components (164). The conditions
that contribute to increased expression of efflux system components remain largely
unknown. Efflux mechanisms that contribute to MDR, including resistance to
fluoroquinolones, have been identified in many clinical isolates. These include:
Bacillus subtilis, Citrobacter spp., E. coli, Enterobacter spp., H. influenzae, K.
pneumoniae, Mycobacterium spp., N. gonorrhoeae, P. aeruginosa, Salmonella
typhimurium, S. aureus, and S. pneumoniae (263, 308). Chemical structures of various
fluoroquinolone may determine the extent to which efflux systems operate in specific
bacterial species. The correlation between chemical structure and efflux activity have
not been fully defined, but appear to correlate with the relative degree of hydrophilicity
for various compounds (63, 354, 360).
1.7 Key Pharmacokinetic and Pharmacodynamic Factors for Fluoroquinolone Antibioitcs
Many methods have been used to evaluate in vitro activities of antibacterial
agents. Most commonly, MIC and minimal bactericidal concentrations (MBC)
measurements are used to assess antibacterial potency as assessed by inhibition or
killing of a pathogen at an endpoint of 18-24 hr. Determination of MIC/MBC endpoints

19
following the incubation of an organism in the presence of a constant antibiotic
concentration reflects a static measurement of the antibiotic’s bacteriostatic/bactericidal
activity (68). As a result, MIC/MBC measurements do not provide data on the time-
course of antimicrobial action, including the duration of drug exposure required for
bacterial eradication, the rate of bactericidal activity or persistent effects of the
antimicrobial agents (65, 68, 364). Thus, the selection of optimal fluoroquinolone
dosing regimens requires careful consideration of microbiological responses to an
infecting organism (pharmacokinetics (PK)) and patient-specific factors related to drug
exposure, most notably toxicity (pharmacodynamics (PD) (65). Understanding the
PK/PD relationship of fluoroquinolone antibiotics can facilitate selection of optimal
dosing regimes which serve to hasten the antimicrobial response to an invading
pathogen, prevent treatment failures, minimize the development of resistance and
maintain the therapeutic lifespan of the antimicrobial agent. Therefore, experimental
models that reflect PK/PD dynamics for specific quinolones against specific pathogens
present at specific anatomical sites should provide additional clinically meaningful
information about the potential of an antibiotic.
Generally, antibacterial effects correlate with one of three pharmacokinetic
parameters:
1. The ratio of peak drug concentration (Cmax) of an agent to its MIC for the bacterium
(Cmax/MIC), termed concentration dependent.

20
2. Time (T) of exposure of a bacterium to serum drug concentrations exceeding the
MIC (T>MIC), termed time dependent.
3. The ratio of the area under the drug concentration versus-time curve (AUC).
On the basis of the PK principle dictating their action, antibiotics are typically
characterized as either concentration-dependent or time-dependent agents (68, 318).
For example, the time above the MIC is an important parameter used with β-lactam
compounds because bacterial inhibition and kill rates at high concentrations are
virtually identical to rates at concentrations near the middle of a concentration time
curve, or even at the MIC drug concentration (92). Thus, for β-lactams, the most
important principle in bacterial eradication is not increasing concentration, but the
length of time achieved above a defined drug concentration, usually the MIC. By
comparison, for concentration-dependent antimicrobial agents, the kill rate at
concentrations near the peak is greater than that at concentrations near the middle of the
curve (91). Fluoroquinolones exhibit concentration-dependent responses which
traditionally have been described by measuring (Cmax) in relation to the MIC
(Cmax/MIC) (93, 94, 321). Cmax/MIC ratios of 8-to-10 correlate with increased clinical
success and reduced likelihood of selecting resistant strains (318).
The AUC represents the newest pharmacological measure which is used to
predict the therapeutic response of microorganisms to antimicrobials. The AUC
correlates drug exposure with a defined dosing interval which is then reported as the
area under the plasma drug concentration time curve (320, 321). The AUC is an

21
empirically derived formula based on the MIC measure of drug potency. For example,
upon introduction of an antibiotic into tissue/serum, the drug accumulates and achieves
(Cmax), which is dictated by both the properties of the antibiotic and the infected
anatomical site. As the concentration declines over time, it intersects with of the MIC
of a particular pathogen. The area created between the Cmax and MIC as drug levels
decline is represented by a numerical value defined as the AUC. The AUC is normally
calculated over 24 hr and is designated as the AUC24. The ratio of the AUC/MIC
defines the area under the inhibitory concentration time curve (AUIC) (Figure 1.3). A
landmark study by Forrest et al (115) reported that an optimal AUC24/MIC (AUIC24)
for ciprofloxacin of >125 was associated with bacterial eradication in critically ill
patients with lower respiratory tract infections caused by Gram-negative bacilli.
Reduced drug exposure and low AUIC ratios correlate directly with emergence of
resistance and ratios below 100 have correlated with a 50-83% probability that
resistance will develop (133, 318, 336). Therefore, for fluoroquinolones, an AUIC of at
least 125 (serum inhibitory titre-1) should be targeted, because values <100 have been
associated with the development of resistance (115, 133, 317).

22
Figure 1.3 The Area Under the Concentration Time Curve (AUC)
A minimum AUIC of 30 to 55 for the quinolones against S. pneumoniae has
AUC Time above MIC
Cmax (peak)
Safe tolerable dose
Half-life
AUIC = AUC/MIC
Ant
ibio
tic S
erum
Con
cent
ratio
n
Time (hr)
MIC
The AUC is an empirically derived formula used to predict clinical success and development of resistance for fluoroquinolones based on the relationship between clinical pharmacokinetics and the MIC of a particular pathogen. Upon administration of an antimicrobial, the antibiotic concentrates and eventually reaches the Cmax drug concentration which typically falls within a safe and tolerable dose for the patient. As the concentration declines over time, it eventually intersects with the MIC of the pathogen. The half-life of the antimicrobial agent represents the time it takes for drug concentrations to achieve half the Cmax for a given dose. The Area created between the Cmax and the MIC for a given drug-organism combination defines the AUC. AUC values > 125 and Cmax /MIC ratios of 8-to-10 correlate with in vivo success for fluoroquinolones against Gram-positive and Gram-negative organisms.

23
been found to be associated with clinical efficacy (11, 198, 213, 214, 224) and has
prompted the question of whether AUIC values >125 need to be achieved against
Gram-positive pathogens (91, 249). In a clinical study with levofloxacin and S.
pneumoniae, clinical success was observed in patients where AUIC values < 50 were
documented (295) and acceptance of lower AUIC values of 30-to-50 was proposed on
the premise that successful clinical outcomes would occur even with low AUIC values
(<125). However, 85% of patients had mean AUIC values >100 and it is likely that few
patients enrolled in the study had AUIC values in the 30-to-50 range because organisms
with MIC values of 2 µg/ml to levofloxacin were uncommon during the early 1990s.
Currently, organisms with MICs of 1-2 μg/ml to levofloxacin are now being identified
(31, 159) and these organisms would confer levofloxacin AUIC values of
approximately 25.7 (318), thereby re-raising the argument that AUIC values of >100
should be targeted for Gram-positive organisms. Recently, an in vitro
pharmacodynamic model, specifically designed to incorporate MPC measurements
demonstrated that AUIC values of <100 were associated with decreases in S. aureus
susceptibility to fluoroquinolones, while values >100 did not result in changes in MICs
(371)
The question as to which ratio (i.e., Cmax/MIC or AUC/MIC) is a better predictor
of antimicrobial efficacy remains unresolved. Some studies have shown that
AUC24/MIC is the best predictor for success with quinolones (43, 224-226), while
others have suggested that the Cmax/MIC is a better predictor of bacterial eradication

24
(25). Ultimately, the activity of an antimicrobial compound and the subsequent clinical
success is dependent on the combination of specific binding to intracellular targets in
the pathogen and occupation of the critical binding sites for a minimum period of time.
Therefore, neither the Cmax /MIC ratio nor the AUIC alone will predict a compound’s
antibacterial effect. Recently, it has been suggested that if a Cmax/MIC ratio greater than
10 is achieved, Cmax/MIC will be the most important parameter in determining
outcomes (295), whereas at Cmax/MIC ratios of <10, the AUC24/MIC ratio is a better
predictor of clinical outcome and decreased incidence of resistance (43, 226, 295, 318).
Scaglione et al (314) rationalized these distinctions by examining the effect of protein
binding on the relative contributions of AUC/MIC and Cmax/MIC ratios to the overall
fluoroquinolone effect. Based on their findings, the authors concluded that a larger
fraction of free drug exists at peak concentrations than at lower concentrations and a
larger fraction of free drug may have a greater effect because even with the same AUC,
a higher peak concentration will result in a larger fraction of free drug. Thus, it is not the
peak concentration itself that leads to a better outcome, but the fact that the AUC of the
free fraction is larger if the peak concentration is higher (314).

25
1.8 The Mutant-Prevention Concentraton (MPC): In vitro Masurement of the MPC and Experimental Determination of the Mutant-Selection Window
Fluoroquinolone antibiotics are important antimicrobial compounds used to
treat infections caused by Gram-negative and Gram-positive bacteria at a number of
different anatomical sites. The use of newer more potent agents for front line therapy
is advocated as the most prudent use of antibiotics (78). Today’s modern-generation
fluoroquinolones are highly active against Gram-positive organisms such as S. aureus
and S. pneumoniae, but reports of treatment failures and documented in vitro resistance
has raised concerns that resistance may develop to these new agents (7, 41, 53, 70, 89,
315, 371). The development of antibiotic resistance correlates with increased use. For
example, since the late 1980s and early 1990s, ceftazadime, a third-generation
cephalosporin, has been widely used against Gram-negative pathogens, Citrobacter
spp., E. coli, Enterobacter spp., K. pneumoniae, and P. aeruginosa. The subsequent
emergence of broad spectrum β-lactamase-producing Gram-negative bacteria has been
attributed to indiscriminate use of third-generation cephalosporins (58, 236, 301, 302,
315). However, increases in consumption cannot fully account for changes in
resistance patterns. Eliminating the misuse and overuse involved in antibiotic
utilization will fail to correct resistance problems because traditional dosing strategies
are only one mutational step ahead of the pathogen, a factor which will ultimately
erode new agents, if and when they become available. Therefore, strategies
specifically designed to minimize the development of resistance must accompany the
development and use of antimicrobial agents.

26
It has been suggested that if bacterial cells must attain two concurrent
resistance mutations for growth in the presence of a quinolone, then few mutants would
be selectively amplified because double mutations should rarely occur (32, 41, 87, 142,
367, 369). Bacterial populations may reach 1010 cells in human infections, but at a
mutation frequency of 10 7, more than 1014 bacteria (107 × 107) would be required to
detect two concurrent fluoroquinolone-resistant mutations. Current susceptibility
practices rely on standardized inoculums, based on the application of 105- 106 colony
forming units (CFU), which is too low to account for the presence of first-step resistant
subpopulations that are present at the sites of infections. Figure 1.4 illustrates the
factors involved in the MPC measurement. When we examined the effect of
fluoroquinolone concentration on the selection of resistant mutants of Citrobacter
freundii, Enterobacter cloacae, E. coli, K. pneumoniae, P. aeruginosa, and S.
pneumoniae, we found a concentration with each organism at which no mutant was
recovered when 109 to 1010 cells were applied to agar plates (41, 143, 145, 148, 149).
This drug concentration, which we designated as the MPC, would require a bacterial
cell to develop more than one resistance mutation for growth. Thus at concentrations
above the MPC, a bacterial population greater than that normally present during
infection would be necessary to observe outgrowth of a resistant mutant. Since
fluoroquinolone structure affects the value of the MPC (83), it appears that the MPC
might serve as a simple measure of antibiotic potency that incorporates the ability of a
compound to restrict selection of resistant mutants (41, 89, 149, 367).

27
Figure 1.4 MPC Dynamics
105
107
106
108
109
1010
[drug] required for inhibition
(μg/ml)MIC concentration
Selection of resistant mutants
( )Increasing Inoculum(cfu/ml)
MPC concentration
As the bacterial populations exceed the fluoroquinolone mutational frequency of 10-7 (107 CFU/ml), mutant subpopulations (denoted by stars) arise. At concentrations >109 CFU/ml, mutant populations which confer reduced susceptibilities are readily recovered. Infections containing >109 cells will have many resistant mutants that are not inhibited the MIC. Current susceptibility tests utilize a dilution of the 0.5 McFarland standard which results in the application of 105-106 CFU/ml during the testing process. This inoculm is too low to account for the presence of first-step resistant mutants present in large bacterial populations. The MPC reflects the antimicrobial concentration required to inhibit first-step resistant mutants when >109 CFU/ml are tested (33, 144).

28
Experimentally, the MPC measurement can be measured as a characteristic
two-stage decline in CFUs when large (>1010 CFU/ml) susceptible cultures are
exposed to varying quinolone concentrations (83, 143). Increasing drug concentrations
results in an initial sharp decline in colony recovery that occurs at concentrations at (or
near) the MIC for wild-type susceptible populaton of cells. This first stage of colony
decline occurs across a bacterial population of approximately 105-to-106 CFU/ml. At
concentrations above the MIC of the wild-type strain, a plateau in colony recover
occurs which corresponds to the outgrowth of mutant sub-populations. Mutant
colonies require concentrations above the MIC of the wild-type strain in order to
prevent their growth and a second sharp decline in colony recovery occurs when drug
concentrations are reached which block the growth of all single-step mutants (41, 84,
149, 327). This later concentration defines the MPC. Thus, the MPC is a measure of
the minimal antibiotic concentration required to prevent mutant growth recovered
when large (> 109 CFU) numbers of cells are applied to antibiotic containing agar
plates (83). In principle, the MPC represents a dosing threshold above which mutants
should rarely arise; use of MPC would add consideration of the development of
resistance to the traditional goal of clearing infection.
Conventional dosing strategies, based on the MIC as a measure of drug potency, allow
concentrations to fluctuate within a range that enrich mutant fractions of heterogeneous
pathogen populations. Thus, concentrations perceived to inhibit the majority of
susceptible cells in cultures are the very concentrations that selectively enrich mutant
subpopulations. If host defences fail to remove resistant mutants faster than they are

29
enriched, the mutant fraction will gradually increase (Figure 1.5). The concentration
spectrum within which mutants are selectively enriched is termed the Mutant-Selection
Window (MSW) and is defined by an upper and lower boundary based on the MPC
and MIC, respectively (Figure 1.6) The MSW emerged from suggestions of Baquero et
al (14) who indicated that a dangerous concentration range exists in which mutants are
most frequently selected. The boundaries of the concentration range were later defined
when the MPC measurements were determined for fluoroquinolones (41, 84, 142, 144,
149, 327, 367). When fluoroquinolone concentrations are below the MIC, neither
susceptible cells nor first-step resistant mutants will be inhibited as the drug
concentration is too low and the selective amplification of resistant subpopulations will
not occur. When drug concentrations are in excess of the MPC, both susceptible and
first-step resistant cells are inhibited and selective amplification of resistant cells does
not occur. However, when drug concentrations fall within the MSW, the number of
susceptible cells decline, thereby, creating conditions which result in the selective
amplification of resistant populations. Selection of fluoroquinolone-resistant
subpopulations will ultimately affect the entire fluoroquinolone class of antimicrobials
because all agents share the small intramolecular targets. Thus, mutants selected by
one compound will ultimalty affect the entire class. Continued use of antimicrobial
agents against bacterial populations that have already been enriched for first-step
mutants facilitates the selection of second- and third-step mutants (17, 85, 221), which
confer even higher levels of resistance (41, 149, 370).

30
Figure 1.5 Selective Amplification of Resistant Mutants
Bacterial populations may contain resistant cells which may become selectively enriched during antibiotic therapies if MPCs are not targeted during dosing. First-step resistant mutants (dark colored stars) are present in bacterial cultures containing between 107-to-109 CFU/ml. Increasing levels of resistance, concurrent/acute infections, and immunocompromised hosts place heavy reliance on the antimicrobial to control bacterial growth. Under these conditions resistant cells are selectively enriched during successive rounds of dosing. Eventually, the number of mutant cells may become high enough that mutant subpopulations become a dominant fraction of the bacterial population. If the infection has progressed to the point where the antimicrobial is incapable of directly controlling the bacterial growth then clinical failures and potential spread of resistant organism may occur.
2 in 1 b i l l io n
M IC
2 0 0 in 1 b i l l io n
2 0 0 0 0 in 1 b i l l io n
Im m u n o c o m p r o m is e ds t a t e
P r io r I n f e c t io n
P r io r a n t ib io t ic e x p o s u r e
I m m u n e T h r e s h o l d B r e a c h e d
P o t e n t ia l
C l e a r a n c e
H e a l t h y i m m u n e s y s t e m
A c u t e in f e c t io n s /f a i l e d t h e r a p y
T im e

31
(A) The concentration spectrum extending from the MIC of the susceptible population to the MPC of the most-resistant, first-step resistant mutant present in culture represents the MSW. During dosing, concentrations which fluctuate within the window are expected to selectively enrich mutant populations. Concentrations above the MPC and below the MIC will not selectively enrich mutant populations because they offer no selective advantage. (B) A MSW will be created for every antimicrobial as concentrations rise and decline over a dosing period. Minimizing the length of time concentrations remain within the window will minimize the potential that resistant mutants will be selectively enriched.
Figure 1.6 The Mutant-Selection Window
A
B
Antimicrobial concentration and time within the Mutant-Selection Window (MSW)

32
Experimental evaluation of the MSW has recently been examined in an in vitro
PD model (109). Firsov et al adjusted fluoroquinolone concentrations to mimic dosing
regimes, which placed concentrations in one of three experimental categories:
concentrations above the MSW, concentrations within the MSW and concentrations
below the MSW. Dosing, which placed concentrations within the window for longer
periods of time, resulted in the amplification of resistant mutants and decreases in
susceptibility as assessed by elevated MICs (109). Despite suggestion to the contrary
(328), the MPC and the MSW are not mutually exclusive, rather the MPC represents the
upper boundary of the MSW. The relative size of the MSW for any fluoroquinolone-
pathogen relationship is dictated by an upper and lower boundary, defined by the MIC
of the susceptible population and the MPC for the most resistant, first-step resistant
population. A large selection window suggests that mutant enrichment occurs over a
wide drug concentration range and a larger fraction of the dosing interval. Compounds
which exceed the MPC for the majority of the dosing interval and whose MIC and MPC
closely correlate are expected to posses narrow selection windows and a reduced
likelihood for selecting resistant cells (41, 85, 367). Ideally, dosing should be adjusted
such that MPC concentrations are maintained throughout the dosing interval. However,
it is important to understand that as antibiotic concentrations rise and decline upon
administration and elimination of the antimicrobial, a MSWwill be created for any
given “bug-drug” combination. Minimizing the time antibiotic concentrations fall
within the MSW will be a key factor involved in minimizing the selection of resistant

33
cells. Determinations of the overall time each compound falls within the MSW may not
be as straightforward as initially perceived because the size of the window will be
influenced by the PK profile of the drug, the relationship of the MPC to the MIC and
the rate of bacterial killing for a given antimicrobial agent. Thus, compounds with low
MPCs may not necessarily be superior at preventing the selection of resistant mutants if
MPC values do not fall within a clinically achievable range and for a long enough
duration of the dosing period. As we learn more about the PK/PD properties of
quinolones, such as implications of protein binding and site-specific drug accumulation,
we will be able to refine the MWS concept.
The time that fluoroquinolone concentrations are required to exceed the MPC
is a factor that is currently unknown. The answer to this question will ultimately lie in
the rate at which fluoroquinolones are able to kill first-step mutants. For example,
maintaining the MPC for half of a 12 hr dosing interval may be sufficient at preventing
the selection of resistant mutants if all resistant mutants can be eliminated within the
six-hr window (Figure 1.7). Bactericidal activity of different fluoroquinolones against
selected first-step mutants will be an important discovery in the development of the
MPC measurement and its potential clinical application. One recent study (66) has
provided insight into how long the drug concentration needs to remain in excess of the
MSW. Croisier et al (66) examined the in vitro pharmacodynamic efficacy of
gatifloxacin against S. pneumoniae in an experimental model of pneumonia, specifically
investigating the impact of low levels of fluoroquinolone resistance on the enrichment

34
pneumoniae in an experimental model of pneumonia specifically investigating
the impact
Figure 1.7 The Relationship Between the MPC and Killing by Fluoroquinolones
The relationship between the MPC measurement and bacterial killing is illustrated. Bacterial cultures are represented by triangles. Susceptible and first-step mutant populations are represented by shaded and brick portions. Complete bacterial eradication of susceptible and mutant populations are shown as black filled portions. Cultures are treated with one of three hypothetical fluoroquinolones represented in A, B and C. In this example, all agents have comparable activity as depicted by identical MIC values (dashed lines). The MPC for each hypothetical fluoroquinolone are comparable. The rate, at which susceptible and first-step mutants are killed, differs with each fluoroquinolone (vertical arrows). The length of time the dose is required to exceed the MPC is dependent on the rate at which first-step resistant mutants are killed. The rate to bacterial eradication divided by the total time each agent is expected to exceed to the MPC should produce a value of < 1 (T>MPC = <1). Values >1 could result in selective amplification of resistant sub-populations during therapy and may require higher, or more frequent dosing to control mutant populations.
Time (hr)0 24
MPCA
MICA
Ant
ibio
tic c
once
ntra
tion
(μg/
ml)
% K
ill (L
og r
e duc
tion
o f v
iabl
eco
unts
)
Hansen et al ICAAC 2003
MPCB
MPCC
MICB
MICC
A
B
C
35
of resistant mutants. They reported that when the time the drug concentration was
within the MSW was >45%, the risk of selecting a mutant was 100%. Experimental
evidence regarding the concept of MPC and killing will be discussed further in chapters
3 and 4.
The MPC is a new method for evaluating quinolone potency based on
concentrations that restrict the selection of resistant sub-populations (32, 83, 85, 87,
144). I was interested in testing whether MPC measurements could be used to identify
intrinsic differences between various fluoroquinolone antimicrobials which could be
used to determine microbiological and clinical differences between the agents tested. In
chapters 3-to-5, evidence is provided for the rationale approach for restricting the
selection of resistant mutants based on the MPC principle using clinical isolates of S.
pneumonaiae, P. aeruginosa, and Gram-negative enteric urinary pathogens. MPC
measurements and the MSW hypothesis will be examined to identify differences in the
anti-pneumococcal activities of newer generation fluoroquinolones based on their
propensities for restricting the selection of resistant mutants. Many of these
antimicrobial agents, such as levofloxacin, moxifloxacin and gatifloxacin have been
deemed equivalent based on current perceptions of resistance and susceptibility testing.
MPC results for clinical isolates of P. aeruginosa will be measured to see if the MPC
and the MSW can provide insight into a number of unresolved issues relating to clinical
differences among ciprofloxacin and levofloxacin in the treatment of P. aeruginosa.

36
Finally, MPC, MIC and MBC measurements for Gram-negative urinary tract pathogens
will be described and discussed in relation to current measurements of susceptibility.
MPC results for members of the Enterobacteriace will be further examined to see
demonstrate if the ideas involved in the MPC measurement can be practically applied to
fluoroquinolone therapies used in the treatment of UTIs.

37
2.0 MATERIALS AND METHODS
2.1 Standard Laboratory Methods
2.1.1 Isolate Collection and Identification
Most of the clinical isolates of P. aeruginosa used in this study were initially
collected from 55 medical centers throughout Canada as part of a national surveillance
study of P. aeruginosa (36-38) . The remaining strains were collected from February
(2002) to September (2003) from the Clinical Microbiology Laboratory at Royal
University Hospital, Saskatoon, SK. Oxidase-positive Gram-negative rods suspected to
be P. aeruginosa were identified by accepted methods including API20 or Vitek
(BioMerieux, St. Laurent, QC) systems. Three strains of P. aeruginosa (OCR1, MR27,
MR2) overexpressing the MexAB-OprM (nalB) and MexEF-OprJ (nfxC) MDR efflux
pumps, one strain possessing an altered outer porin profile (OprD), as well as the
respective isogenic strain (PAO1), were kindly provided by Dr Xian-Zhi Li (Queen’s
University, Kingston, ON) and Dr. Satoshi Ohya (Sankyo, Co., Ltd., Tokyo, Japan)
(232). A MexCD-OprN (nfxB) efflux mutant (K385) along with the isogenic strain,
(K372) were obtained from the laboratory of Dr. Keith Poole (Queen’s University,
Kingston, ON). The antibiotic susceptibility patterns of efflux mutants of P. aeruginosa
are reported in chapter 5 and elsewhere (232, 293).
Isolates of S. pneumoniae were collected from the Clinical Microbiology
Laboratory, Royal University Hospital, Saskatoon, SK from 1998 to 2003 (41). No
preselection criterion was used that would favour inclusion or exclusion of resistant

38
isolates and care was taken to avoid obtaining more than one isolate from a given
patient. Identification of S. pneumoniae was preformed using traditional methods,
including catalase testing, bile solubility and optochin sensitivity (250). A novel
method called the Slidex Pneumo-Kit (BioMerieux), used in accordance with the
manufacturer’s instructions, was used to identify clinical isolates of S. pneumoniae.
Clinical strains of C. freundii, E. cloacae, E. coli and K. pneumoniae used in
this study were part of an earlier study of Gram-negative urinary isolates (39) and were
collected from medical centers throughout Canada. Identification of organisms was
preformed in each participating hospital based on the reference method of the
American Society for Microbiology and the NCCLS standards for identification of
Enterobacteriaceae spp.
American Type Culture Collection (ATCC) strains for P. aeruginosa (ATCC
27853) and S. pneumoniae (ATCC 49609) were obtained from the American Type
Cultures Collection (Rockville, MD).
2.1.2 Storage of the Bacterial Isolates
The isolates were obtained from Tryptic Soy Agar (TSA) slants (in house),
TSA plates containing 5% sheep blood. Organisms identified as S. pneumoniae were
streaked for isolated colonies on a TSA plate containing 5% sheep blood and incubated
in 5% CO2 at 35-to-37˚C for approximately 24 hr. One or two isolated colonies were
selected from the TSA plate with a sterile wooden applicator stick and inoculated into
1.2 ml Corning cryovials containing 0.5 ml of skim milk. The vials were stored at -
70˚C.

39
2.2 Susceptibility Testing
Antimicrobials used for in vitro experiments were obtained in powdered form
and diluted in accordance with the manufacturers’ recommendations. Sources of
antimicrobials were as follows:
Moxifloxacin, ciprofloxacin – Bayer Pharmaceutical, West Haven CT; Levofloxacin – The R. W. Johnson Pharmaceutical Research Institute, Raritan, NJ; Gatifloxacin – Bristol Myers Squibb, Montreal, QC; Grepafloxacin – Glaxo Smith Kline Pharmaceuticals, Collegeville, PA; Trovafloxacin – Pfizer Canada, Kirkland, QC; Garenoxacin – Bristol Myers Squibb, Montreal, QC; Gemifloxacin – Glaxo Smith Kline Pharmaceuticals, Collegeville, PA; Ceftazadime – Glaxo Smith Kline Pharmaceuticals, Collegeville, PA; Gentamicin – Sigma-Aldrich Co., St. Louis, MO; and Tobramycin - Sigma-Aldrich Co., St. Louis, MO.
2.2.1 Broth Microdilution
MIC values were determined by the broth microdilution test for C. freundii,
E.coli, E. cloacae, K. pneumoniae, P. aeruginosa, and S. pneumonaie in accordance
with the Natinal Committee for Clinical Laboratory Standards (NCCLS) guidelines.
Ninety-six well flat bottom microtitre plates were filled with 100 µl of Mueller Hinton
Broth (MHB) in each well of columns 2-to-12. Antimicrobial agent was serially
diluted down the plate with column 1 containing the highest drug concentration and
column 12 receiving no drug (growth control). Each isolate was standardized to a 0.5
McFarland suspension (~1.0 X 10⁸ CFU/ml) using a colorimeter. The bacterial
suspension was then diluted 1/100 with MHB (~1.0 X 10⁵ to 106 CFU/ml). One

40
hundred µl of diluted cells were added to each well on the plate, resulting in a final
volume of 200 µl. Purity of the bacterial suspension was confirmed by plating each
sample onto a fresh TSA plate containing 5% sheep blood. The plates (both microtitre
and blood agar) were incubated in ambient air at 35-to-37˚C for 16-to-20 hr. The
growth control wells (column 12) were examined prior to MIC determination to ensure
organism viability. The ATTC strain 27853 was used as a control to confirm accuracy
of each MIC test. The MIC value was recorded as the lowest drug concentration at
which there was no visible growth of the organism.
Broth microdilution for S. pneumoniae isolates was done similar to that
described for Gram-negative organisms, except Todd Hewitt Broth (THB) was used as
was the S. pneumoniae ATCC control strain, 49619. Microtitre trays were incubated at
35-to-37°C in 5% CO2 for 16-to-20 hr. Susceptible, intermediate, or resistant
phenotypes were recorded based on current NCCLS breakpoints.
2.2.2 Broth Microdilution using CCCP
Carbonyl cyanide m-chlorophenylhydrazone (CCCP) has been reported to
increase the intracellular accumulation of antibiotics, including quinolones, in bacterial
cells (172, 230, 287, 300, 365). Early investigators (64, 192) theorized that CCCP
blocks an energy-dependent efflux system for quinolones with a consequent increase in
quinolone concentration. The CCCP effect has also been interpreted to be the result of
a perturbation of the outer and the cytoplasmic membranes resulting in the influx of
quinolones into bacteria (77, 287). This was proposed to result from a collapse in the
pH gradient of the cytoplasmic membrane by CCCP (265). A 2-to-4 fold decrease in

41
the MIC in the presence of CCCP has been interpreted to indicate that an active efflux
mechanism is inhibited (209). Stock solutions (50 mM) of CCCP were dissolved in
methanol and stored at −20°C. A 200 µM solution of CCCP was added to the wells of
the microtitre panels used in the microbroth dilution method for susceptibility testing.
Panels containing organism, drug, and CCCP were incubated at 35-to-37oC in ambient
air for 16-to-20 hr. A 2-to-4 fold decrease in the MIC upon the addition CCCP was
taken as a marker for a possible efflux mechanism.
2.2.3 MBC Testing
The MBC defines the lowest antimicrobial concentration that kills 99.9% of a
standardized 105 to 106 CFU/ml bacterial culture. The MBC is performed using the
microbroth method for susceptibility testing. At an 18-to-24 hr endpoint, a 50 μl
aliquot of each well (containing a specified antimicrobial concentration) for each
isolate tested was applied to a TSA plate containing 5% sheep blood and incubated at
35-37oC in ambient air for 18-24 hr. Resulting growth (or lack of growth) was
examined after 18-to-24 hr and the lowest concentration that inhibits 99.9% of the
original culture was calculated and taken as the MBC.
2.2.4 E-Test
E-tests were used to determine whether MPC testing (see section 2.2) could be
applied to conventional susceptibility tests. Three TSA plates containing 5% sheep
blood were inoculated with P. aeruginosa to produce confluent lawns of bacterial
growth and incubated at 35-to-37oC in ambient air for 18-to-24 hr. After 24 hr, the
contents of the plates were inoculated into 150 ml of fresh MHB, followed by

42
incubation for 16-to-20 hr at at 35-to-37oC in ambient air. Cells were collected via
centrifugation at 6000 rpm for 20 mins at 4°C. The contents of the culture were
suspended in 4 ml of fresh MHB and viable counts were performed to determine the
number of cells per ml. A sterile cotton swab was inoculated into the bacterial
suspension and applied to TSA plates containing 5% sheep red blood cells. Three E-
test strips for ciprofloxacin, containing a gradient of antimicrobial concentrations, were
applied in an overlapping fashion across the plate. The corresponding concentration
that inhibited bacterial growth was taken as the MIC.
2.2.5 Vitek Results
A semi-automated clinical laboratory organism identification/susceptibility
system known as Vitek (BioMeriux) is often utilized in clinical laboratories for
identification and susceptibility testing of bacteria. Identification cards contain various
carbohydrate and biochemical substrates and when inoculated with organisms, positive
and negative reactions are interpreted by the instrument (following incubation) and
identification is reached by comparison of a computerized database of profiles. For
susceptibility cards, organism is inoculated to various drug concentrations and
following incubation, growth or inhibition in reference to the drug concentrations is
examined and compared to standardized curves whereby susceptibility or resistance is
determined. Cultures of P. aeruginosa were grown in MHB to cellular concentrations
of > 1010 CFU/ml. Cells were collected via centrifugation at 6000 rpm for 20 min at
4°C and resuspended in 4 ml of fresh MHB. One hundred μl of culture were
transferred to the wells of the Vitek card (GNS-618 V4423) which was placed into the

43
Vitek system. A printout of the respective susceptibilities against 16 different
antimicrobials was recorded after an elapsed time of 7 hr. The same procedure was
repeated using a 0.5 McFarland standard.
2.2.6 Agar Dilution
Agar dilution was performed in accordance with NCCLS guidelines for
susceptibility testing (258). Each isolate was standardized to a 0.5 McFarland
suspension (~1.0 X 10⁸ CFU/ml) using a Colorimeter. The bacterial suspension was
then diluted 1/100 with MHB (~1.0 X 10⁵ to 106 CFU/ml). One hundred µl of diluted
cells were added to a series of TSA plate containing 5% sheep blood seeded with two
fold increments of antimicrobial agent. Purity of the bacterial suspension was
confirmed by plating each sample onto a fresh TSA plate containing 5% sheep blood.
Plates were incubated in ambient air at 35-to-37˚C for 16-to-20 hr. The MIC was
recorded as the lowest antimicrobial concentration that inhibited growth.
2.3 Mutant-Prevention Concentration (MPC)
The MPC measurements for clinical isolates of C. freundi, E. cloacae, E. coli,
K. pneumoniae, P. aeruginosa and S. pneumoniae (41, 144, 145, 149) were developed
in the laboratory of Dr. J. Blondeau, Royal Univerisity Hospital, Saskatoon, SK.
2.3.1 Inoculum Preparation and MPC Testing Procedure
Strains of C. freundii, E.coli, E. cloacae, K. pneumoniae, and P. aeruginosa,
were subcultured from thawed skim milk onto TSA plates containing 5% sheep blood
using a sterile wooden applicator stick and incubated in ambient air at 35-to-37˚C for
approximately 24 hr. After overnight incubation, a sterile swab was used to create

44
heavy lawns of bacterial growth on three TSA plates (containing 5% sheep blood) for
each isolate. Plates were incubated in ambient air at 35-to-37˚C for approximately 24
hr. An initial absorbance reading of > 1.00 at a wavelength of 600 nm was used to
estimate a cellular density >1010 cells. Cells were collected via centrifugation in an
Avanti J-E centrifuge (Beckman Coulter, Fullerton, CA, USA) at 5000 x g for 30 min
at 4oC and resuspended in a total of 4 ml of cold, fresh MHB broth. Viable counts
were performed on the high-density bacterial cultures to confirm the presence of > 1010
CFU/ml. Three 100 μl aliquots of >1010 CFU/ml cultures were applied to TSA plates
containing 5% sheep red blood cells. For each experiment, agar dilution plates were
prepared by incorporating fluoroquinolones at seven concentrations into the TSA agar-
sheep red blood cell plates (plates were stored at 4°C and used within 7 days of
preparation). Each experiment included the fully susceptible control strain S.
pneumoniae ATCC 27853 grown to a standardized inoculum of 1.1 x10¹⁰ CFU/0.1 ml.
Inoculated plates were incubated for 24 hr at 35-to-37°C in ambient air (or 5% CO2 for
S. pneumoniae) and then screened for growth. All plates were reincubated for an
additional 24 hr and re-examined. The MPC was recorded as the lowest antibiotic
concentration that allowed no growth.
For S. pneumoniae, starter cultures were spread on blood agar plates (six plates
per isolate) (PML, Richmond, ON) and incubated overnight (18-to-24 hr) at 35-to-
37°C in 5% CO2. Bacterial cells were then transferred from the plates to 500 ml of
THB (Difco Laboratories, Detroit, MI) followed by overnight incubation at 35-to-37°C
in 5% CO2. After incubation, cultures were estimated to have concentrations of 3 × 10⁸

45
CFU/ml by absorbency ( >0.4 at 600 nm). Cultures were concentrated by
centrifugation at 5,000 × g for 30 min at 4°C and re-suspended in 3 ml of THB.
Aliquots of 200 µl, containing >109 CFU, were applied to TSA plates containing 5%
sheep red blood cells. For each experiment, agar dilution plates were prepared by
incorporating fluoroquinolones at seven concentrations into the TSA plates containing
5% sheep red blood cells and plates were stored at 4°C and used within 7 days of
preparation. Each experiment included the fully susceptible control strain S.
pneumoniae ATCC 49619 grown to a standardized inoculum of 5x10⁹. Inoculated
plates were incubated for 24 h at 35-to- 37°C in 5% CO2 and then screened for growth.
All plates were re-incubated for an additional 24 hr and re-examined. The MPC was
recorded as the lowest antibiotic concentration that allowed no growth.
Gram-negative organisms readily achieve high bacterial titres, in excess of 1010
CFU/ml, which allows MPC measurements to be preformed using small (between 100-
to-300 μl) inoculums and relatively few MPC plates. For fastidious organisms, such as
S. pneumoniae and organisms which do not easily achieve high bacterial
concentrations, higher volumes of organism (300-to-400 μl) or additional plates for
each concentration tested were required to ensure that 109-to-1010 cells were tested.
Mutant selection curves should be performed to ensure that a high enough number of
cells are tested in order to capture representative first-step mutants which can be
visualized by a characteristic two-stage decline in CFU that occurs in cultures
containing in excess of 107-to-108 cells.

46
In some instances, a lack of visible growth could not be accurately ascertained
after 48 hr and a faint haze caused by the inoculum may obscure growth. A sterile
cotton swab was used to collect potential bacterial growth and was inoculated into a
test tube containing 200 μl of fresh THB. The tube was briefly vortexed and the entire
concents of the tube were applied to TSA plates containing 5% sheep red blood cells
and the fluoroquinolone concentration in question. Plates were incubated under
appropriate conditions for an additional 18-to-24 hr period to confirm the absence of
growth. For most strains tested, a lack of visual growth after 48 hr correlates with a
confirmed lack of growth after the additional 24 hr incubation. The concentrations
tested in the MPC method include one doubling dilution below the MIC of the isolate
and a minimum of five doubling dilutions above the MIC. Upon repeat testing, the
range of drug concentrations varied depending on the behavior of the organism (if the
organism did not grow on any antimicrobial plates, the MIC was repeated and the
MPC range was lowered; if the organism grew at the highest drug concentration plate,
the MPC range was extended and the experiment was repeated at a higher drug
concentration range). For instances in which absolute growth could not be accurately
determined by 48 hr, a swab of the plate was transferred to a 1-to-2 ml test tube
containing fresh media and the contents of the tube were applied to fresh agar seeded
with the corresponding drug concentration from which the swab was taken. The plate
was incubated for an additional 18-to-24 hr (72 hr total) and the lowest concentration
producing a lack of visible growth was recorded as the MPC.

47
2.3.2 Mutant Selection Curves
Overnight cultures of bacteria (typically 3-to-6 plates/isolate), grown under
appropriate conditions for the organism, were inoculated in liquid media and incubated
for an 18-to-24 hr period. After incubation, cells were collected via centrifugation at
5,000 × g and 4oC for 30 min and then re-suspended in 6 ml (or calculated volume
required) of fresh MHB/culture. The contents of the two high-density cultures were
pooled and a viable count of the culture was performed to ensure the presence of >1010
CFU/ml. Dilution sets consisting of 1/10 to 1/108 were created and 100 μl aliquots of
various dilutions and pure culture were applied in triplicate to TSA plates seeded with
fluoroquinolone concentrations spanning small concentration intervals (i.e., <1
doubling dilution). The decline in colony recovery was measured at each
concentration and used to create the overall mutant selection curve(s). For fastidious
organisms such as S. pneumoniae, a total of 1 ml was sampled in 200 μl aliquots,
containing approximately 1010 cells) over 5 different plates to ensure that 1010 cells
were tested. The concentration intervals tested should be designed to illustrate a
distinct plateau region, followed by a second decline in colony recovery. Thus,
concentrations tested varied from organism to organism and strain-to-strain depending
on the MPC of the strain tested.
2.3.3 Viable Counts
Viable counts were performed on selected organisms for each round of MPC
testing. Dilutions of 10-7, 10-8 and 10-9 were made from the bacterial suspension and
100 µl of each dilution were plated onto triplicate TSA plates containing 5% sheep

48
blood. The plates were incubated for 24 hr at 35-to-37°C in ambient air. Colony
counts were performed on each plate. Calculations were then performed to determine
CFU/ml.
2.4 Characterization of First-step Mutants
2.4.1 DNA Isolation, Amplification and Nucleotide Sequence Determination for S. pneumoniae
Selected isolates of S. pneumoniae were grown on brain heart infusion (BHI) agar
(Difco) containing 10% defibrinated sheep blood (Hemostat Laboratories, Dixon, CA.)
following high-density inoculation. Incubation was overnight at 35-to-37°C in 5% CO2.
Bacteria grown as confluent lawns were recovered from agar plates by washing with 2
ml of THB per plate. Cells were concentrated by centrifugation (as previously
described), washed once with lysis buffer (50 mM Tris-HCl [pH 8.0] and 5 mM EDTA)
and resuspended in 400 µl of lysis buffer per plate. Then, 50 µl of 10% sodium dodecyl
sulfate and 20 µl of proteinase K (10 mg/ml) were added and the mixture was incubated,
first at 55°C for 30 min and then at 37°C for 1.5 hr. Cell lysates were extracted with
phenol. An equal volume of TE-saturated phenol (10 mM Tris-HCl [pH 8.0] and 1 mM
EDTA) was added to 100 to 200 μl of DNA sample contained in a 1.5 ml
microcentrifuge tube and vortexed for 15-to-30 sec. The sample was centrifuged at
10,000 rpm for for 5 min at room temperature to separate the phases. The upper
aqueous layer was aspirated, and placed in a clean tube, and was extracted a second
time. DNA was precipitated with ethanol and recovered by centrifugation. DNA was
then dissolved in TE buffer and treated with a final concentration of 100 µg of RNase A
per ml for 1 hr at 37°C. DNA was reprecipitated with 2 volumes of ethanol and

49
dissolved in TE buffer.
The nucleotide sequences of the quinolone-resistance-determining regions of parC
and gyrA were determined with an automated DNA sequencer (Applied Biosystems,
Foster City, CA) using primer SP-parC sequence (5' TCA GCG CCG TAT TCT TTA
TTC TAT G 3') and primer SP-gyrA sequence (5' TCG AGA TGG CTT AAA ACC
TGT TCA C 3') after PCR amplification of DNA fragments using primers SP-parCfwd
(5' GTC TAA CAT TCA AAA CAT GTC CCT G 3'), SP-parCrev (5' TCT TTC TCC
GTA TCG TCA AAG TTC 3') for parC and SP-gyrAfwd (5' TGT CAA TCT GAC AAA
GGA GAT GAA G 3') and SP-gyrArev (5' CCA GTT GCT CCA TTA ACC AAA AG
3') for gyrA.
PCR reactions were performed in 100 μl volumes containing 0.1 μM of each
nucleotide primer, 0.2 μM each 2’-deoxynucleoside 5’-triphosphate (Pharmacia,
Montreal, QC), 10 μl of reaction buffer (Sigma-Aldrich), 4 μl of template DNA sample
and 1U of platinum Pfx polymerase (Gibco BRL, St. Louis, MO). All reactions were
performed in a DNA thermocycler (MJ research, Waltham, MA) and cycled 25 times
following a 6-min denaturation step at 94oC. Each cycle consisted of a 30 sec
denaturation step at 94oC, a 30 sec annealing step at 55oC and 2 min at 72oC for primer
extension. PCR products were purified using a QIAquick PCR purification kit (Qiagen
Inc., Mississauga, ON) according to the manufacturers’ recommendations. DNA
sequencing was performed using an automated gene sequencer (Natural Research
Council, Saskatoon, SK).

50
2.4.2 DNA Isolation, Amplification and Nucleotide Sequence Determination for Recovered Mutants of P. aeruginosa Selected mutants of P. aeruginosa were recovered from MPC plates seeded
with ciprofloxacin and levofloxacin. Two colonies were selected and suspended in
100 μl of insta-gene matrix (Sigma-Aldrich). Cells were centrifuged for 15 sec and
boiled for 10 min. Following a second centrifugation step, 4 μl of the supernatant was
used for PCR reactions.
Two primers GYRA1 (5’ CCAAAGAAATTCTCCGGTCA 3’) and GYRA2
(5’ GGTTGGGAATCTTGGTCGGCA 3’) were constructed based on the nucleotide
sequence of P. aeruginosa gyrA subunit reported by Kureishi et al (196). Primers for
DNA gyrA were designed to amplify a 484 base pair region spanning nucleotides 256-
740. This region includes the QRDR encompassing codons 67-to-106. One 22-mer
primer and one 21-mer primer (PARC1 5' ATGAGCGCCTCCCTCGATCTGA 3’and
PARC2 5’ GCCGRCGAAGRRCGGRACCCA 3’) were constructed based on the
sequence of the P. aeruginosa Topoisomerase IV gene reported by Akaska et al (2).
The PCR reaction amplified a 424 base pair region including the QRDR associated
with Topoisomerase IV.
PCR reactions were perfomed as previously described for S. pneumoniae. PCR
reactions cycled 36-to-41 times following a 6-minute denaturation step at 95oC. Each
cycle consisted of a 35 second denaturation step at 94oC, a 40 second annealing step at
57o C and a 35 second polymerization at 72oC. PCR products were purified and
sequenced as previously described for S. pneumoniae.

51
2.4.3 Primer Preparation and Storage
Each primer set was made at a stock 100 mmolar concentration using TE
buffer. Primers were stored in aliquots at –20oC.
2.4.4 Analysis of PCR Products
PCR products were analyzed on 1% agarose gels prepared as described in
Appendix A. Six µl of tracking dye were added to each PCR reaction tube. For the
marker, 2 µl of a 123 bp ladder (Sigma, St. Louis, MO.) were added to 12 µl of sterile
distilled water and 4 µl of tracking dye. Each tube was gently mixed. A sample
volume of 20 µl was loaded into designated lanes and a current of 117 volts was
applied to the gel for approximately 20-to-30 min. Gels were analyzed under
ultraviolet light.
2.5 Pulsed-Field Gel Electrophoresis (PFGE) for Clinical Isolates of P. aeruginosa 2.5.1 DNA Extraction
P. aeruginosa isolates were thawed and plated out on TSA supplemented with
5% sheep red blood cells. Plates were incubated at 35-to-37oC for 18-to-24 hr in
ambient air.
2.5.2 Cell Disruption
An overnight culture was used to create a bacterial suspension in TE buffer. An
inoculum equal to a 5.0 McFarland standard (~15 x108 CFU/ml) was created. A 1.5 ml
aliquot of the bacterial suspension was then mixed with an equal volume of a 1.2% low
melting point agrose solution. The mixture was vortexed for 20 sec and aspirated into
a 3cc monoject Luer lock syringe with a 1.5 gauge needle (Fisher Scientific, Napean,

52
ON). The syringes were incubated at 4oC for 30 min. The solid agarose cylinder was
removed from the syringe and placed in a sterile plastic petri dish. Using a sterile
scalpel blade, the cylinder was cut into 10-to-15 (approximately 3 mm in thickness)
agarose plugs. The plugs were added to sterile test tubes containing 4 ml of proteinase
K lysis buffer and incubated at 50oC with constant agitation.
2.5.3 Proteinase K Treatment
Most standard protocols for DNA extractions from Gram-negative bacteria for
PFGE require 4-to-6 hr Proteinase K incubation. However, for P. aeruginosa, an
incubation of this length is often insufficient to obtain the required cell lysis.
Increasing the amount of time the Proteinase K was able to react from 6 hr to overnight
(16-to-18 hr) increased lysis efficiency (Hansen and Blondeau-unpublished
observations). The Proteinase K lysis buffer was removed and replaced with 4 ml of
lysis buffer and incubated for a further 24 hr at 50oC
2.5.4 Inactivation of Proteinase K
Lysis buffer was removed and replaced with 4 ml of phenylmethyl-sulfonyl
fluoride (PMSF) rinse solution. This rinse step was performed at least twice with
continuous agitation at room temperature for 1 hr each time. The PMSF rinse solution
was replaced with 4 ml of TE buffer and agitated for 30 min at room temperature. This
rinse step was repeated three times.
2.5.5 Storage of Plugs
The TE buffer rinse solution was removed from the plugs and the plugs were
stored in 3 ml of fresh TE buffer in tissue culture plates (Fisher Scientific Nepean, ON)

53
at 4oC. The level of TE buffer was monitored and replenished frequently to prevent
the plugs from drying.
2.5.6 Restriction Endonuclease Digestion
Plugs were removed from storage plates using a sterilized spatula and placed in
a sterile plastic petri dish. Individual plugs were cut into quarters, with one quarter
being transferred to a sterile 1.5 ml microcentrifuge tube. A 1 ml mixture of the
manufacture’s 1x restriction endonuclease buffer, bovine serum albumin and 14 μl
(between 30 and 270 units) of the enzyme SpeI was added.
2.5.7 Preparation of the Gels
A 1% pulsed-field certified agarose gel was prepared in a 250 ml flask. The
molten agarose was cooled to 50-to-55oC and the gel was cast in a BioRad
Laboratories pulsed-field gel casting apparatus. The agarose was allowed to set for 30
min after which the molten plugs were transferred to the wells in the gel. The last well
was reserved for the λ ladder molecular weight marker. The gel was submerged in
PFGE running buffer (Appendix A) in the electrophoresis cell of a BioRad CHEF DR
III system. The gel was subjected to pulsed orthoganol fields ramping from 2-to-15
sec, opposing each other by 120o at a field strength of 6 V/cm. The buffer was held at
a constant temperature of 14oC by a cooling unit. The electrophoresis was carried out
over 18 hr.
2.5.8 Staining Procedure
A 1 mg/ml solution of ethidium bromide solution was placed in a plastic
tupperware container containing distilled water, the gel was then removed from the

54
electrophoresis cell and placed in solution. The gel was protected from direct light and
agitated for 30 min. The stain solution was decanted and the gel destained for 30 min
in sterile distilled water with agitation. The gel was analyzed on the Gel Doc 1000
Illuminator (BioRad Laboratories, Mississauga, ON). A difference of three or more
bands is typically used to distinguish between different clones (137, 138) and was used
as the criteria for distinguishing between different strains.
2.6 Killing of S. pneumoniae by Fluoroquinolones Assessed with Conventional Kill Curves
Powdered forms of each fluoroquinolone were dissolved according to the
manufacturer’s instructions. Stock solutions were prepared from fresh preparations or
samples stored at –70oC. Clinical isolates of S. pneumoniae used in kill curve
experiments were grown overnight on blood agar plates. The following day, an
inoculum was transferred to THB and incubated for 2 hr at 35-to-37oC in 5% CO2.
After incubation, spectrophotometer readings of > 1.5 (at 600 nm) were used to verify
cell densities of > 109 cells/ml as previously determined. To achieve cell densities
ranging from 106 to 109 cells/ml, further dilutions in THB were taken. The
antimicrobial agent was then added. Drug concentrations used for kill experiments
were based on the MIC, MPC and Cmax drug concentrations. The measurement of kill
(log reduction in viable cells) was recorded at 0, 0.16, 0.5, 1, 2, 3, 4, and 24 hr after the
addition of the drug. Three 100 μl aliquots were taken at each time interval and
cultured on drug-free agar plates that were subsequently incubated overnight at 35-to-
37oC in 5% CO2. The three results obtained at each time interval were averaged and
the log10 reductions and percent killing of viable cells were calculated and recorded.

55
Significant bactericidal activity was recorded as > –3 log reduction in viable cells, as
previously established in the literature (34, 245).
2.7 Killing of P. aeruginosa by Ciprofloxacin and Levofloxacin Assessed with MPC-based Kill Curve Experiments
Kill curve experiments designed to compare the effects of MPC and MIC
based-killing were performed with clinical isolates of P. aeruginosa. MIC and MPC
measurements were preformed as previously described (Section 2.3). Preparation of
high-density P. aeruginosa cultures were prepared as outlined in MPC testing (see
Section 2.2). Viable counts were performed on the high-density culture to determine
the number of cells present per ml of culture. Cultures were re-suspended in 4 ml of
fresh cold MHB and divided equally into four flasks containing 500 ml each of fresh
MHB broth. For ciprofloxacin and levofloxacin, two separate flaskes containing the
contents of the initial 1010 CFU/ml were used for each agent and tested for killing at
either the MIC of MPC, respectively. This procedure distributed the contents of the
>1010 CFU/ml culture into 4 cultures, each containing approximately 107 cells. Two
flasks (culture 1 and culture 2) were dedicated for use with either ciprofloxacin or
levofloxacin at the measured MIC or MPC drug concentration. Three aliquots
containing 300 μl were sampled from each flask at 0, 2, 4, 6, 8, 10, 12, 14, 16, 18, 20
and 24 hr and applied to TSA supplemented with 5% sheep red blood cells and
incubated for 24 hr while shaking at 35o C in ambient air. A dilution series was
created for each flask at each time interval sampled to ensure that individual colonies
could be counted. An additional 300 μl sample was taken from each flask and applied
56
to TSA supplemented with 5% sheep red blood cells and seeded with ciprofloxacin or
levofloxacin at concentrations one dilution below the MPC value of the strain tested.
Bacterial growth at each time interval for each flask was recorded and the log
growth was subtracted from the initial cell density of starting culture before the
addition of drug. Mutant growth, as assessed by growth on plates seeded with
fluoroquinolone concentrations 2-fold below the measured MPC, was recorded. After
24 hr, cells were collected from each culture via centrifugation at 5000 x g for 30 min
at 4°C and re-suspended in a volume of 5 ml of fresh MHB. The contents of the entire
cultures were sampled in 0.3 ml aliquots on TSA plates supplemented with 5% sheep
red blood cells and seeded with the fluoroquinolone concentration that corresponded to
one dilution below the MPC value of the strain. This final process was used to
determine the viability of mutant cultures.
2.8 Ciprofloxacin and Levofloxacin Efficacy in a Rat Abscess Model of P. aeruginosa Infection
Individual strains of P. aeruginosa were plated on three TSA plates
supplemented with 5% sheep red blood cells and grown overnight (18-to-24 hr) at 35-
to-37oC in ambient air. After 24 hr, cells were collected via centrifugation at 5000 x g
at 4oC for 30 min and re-suspended in a total of 4 ml of cold, fresh MHB broth. Viable
counts were preformed on the high-density bacterial cultures to confirm the presence
of > 1010 CFU/ml. Three sterile sections of open-ended dialysis tubing (~1.5 cm in
length) were inoculated with 50-125 μl of concentrated P. aeruginosa culture using a
sterile pipette. Each implant contained between 5 x10⁹ to 4.3 x10¹⁰ CFU/ml as
determined by viable counts.

57
2.8.1 Animal Model of Infection
Male Sprague Dawley white rats (Charles River, Wilmington, MA) weighing
between 300 and 350 g were used. Sixteen rats were used per experiment set, which
included 4 control animals (2 animals did not receive drug, 2 animals were implanted
with saline- filled implants), 6 ciprofloxacin-treated animals and 6 levofloxacin-treated
animals. Rats were weighed and anaesthetized with an intra-peritoneal (I.P.) injection
using a 1cc syringe with a 25 GA needle containing a 90 mg/kg:5 mg/kg
ketamine:zylazine dose (Warner-Lambert and Co., Bellevelle, ON) (Bayer, Toronto,
ON). Animals were placed on a warm protected surface for approximately 5-10 min.
A drop of eyelube (Sabex, Boucherville, QC) was administered to each eye. A 5 cm x
5 cm long section of the dorsal flank of each rat was shaved, scrubbed with hibitane
(Fisher scientific, Nepean, ON) and washed with 95% alcohol. Under anaesthetic, an
elastic band was tied around the base of the tail and a rat tail vein catheter (22 GA x
2.5 cm I.V. catheter, Becton Dickinson Infusion Therapy System Inc., Sandy, UT,) was
inserted. A protective gauze wrap was inserted over the catheter to prevent the rat
from removing it. In each rat, three 1.5 cm long incisions were made in a triangular
fashion (beneath each scapula and on the midline of the lower back) using a size 10
sterile disposable scalpel (Fisher Scientific, Nepean, ON). The skin was separated
from the fascia by blunt dissection using sterilized forceps (Fisher scientific, Nepean,
ON). The implants were positioned in a triangular pattern behind the shoulders. The
overlying incision was sealed with a combination of individual 00 Vicryl silk sutures
(Ethicon, Sommerville, NJ) and/or Vetbond tissue adhesive (3M Animal Care

58
Products, St. Paul, MN). A 0.05mg/kg injection of buprenorphine (Reckitt and Colman
Pharmaceuticals Inc. Richmond, VG) was given by (I.P.) injection for pain control.
Animals recovered on a clean, soft surface under a heat lamp for 15-to-30 min.
2.8.2 Administration of Fluoroquinolones
Antimicrobials were administered I.V. in 1 cc syringes with a 25 GA needle via
the tail vein catheter as 400 mg ciprofloxacin (q24h and qh8) and 750 mg levofloxacin
(q24h, q8h) doses. Doses were started 3-to-4 hr after the implantation of implants.
2.8.3 Recovery of Blood Samples
Blood samples were collected in 10-to-15 μl amounts, taken every 18-to-24 hr
from a tail vien catheter and were followed by a 100-to-150 μl infusion of sterile saline
solution to replenish fluid volume and flush residual antimicrobial from the site.
2.8.4 Recovery of Infected Tissue and Blood Samples
In an attempt to ensure that the majority of an animal’s blood volume was
recovered, a 20 cc syringe with a 20 GA needle filled with saline was introduced into
the inferior section of the heart, inserted into the aorta and clamped with a 15.9 cm
hemostat (Fisher Scientific, Neapon ON). The right ventricle was cut and sterile saline
was infused throughout the circulatory system and collected in a tube attached beneath
the left ventricle. Blood samples were injected into pediatric Bactec resin bottles
(Becton Dickson, Sparks, MD) (which coagulates any remaining antibiotic) using a 20
GA syringe and incubated for 12t-to-24 hr at 35-to-37oC in ambient air. Inoculated
bottles were incubated in the Bactec 9000 blood culture system (Becton Dickson,
Sparks, MD) and incubated with agitation for 5 days. Bottles flagging positive were

59
removed from the instrument and an aliquot of the contents were removed with a
sterile needle and inoculated to agar plates and incubated for 18-to-24 hr at 35-to-37oC
in ambient air. The next day, culture plates were inspected for growth and recovered
organisms were identified by the Vitek system. Culture-positive blood samples were
streaked onto MaConkey and blood agar plates and incubated for 18-to-24 hr at 35-to-
37oC in ambient air. Bacterial growth was identified as P. aeruginosa on the based on
colonial morphology, Gram stain, and a positive oxidase test. Infected tissues were
recovered and homogenized with the use of a high-speed homogenizer (Labcor,
Concord, ON). The resulting suspension was streaked for growth and any growth was
identified as P. aeruginosa by Gram stain and a positive oxidase test. Recovered
organisms were stocked, and frozen at –70o C in sterile cryovials as previously
described.
60
3.0 MUTANT-PREVENTION CONCENTRATIONS OF FLUOROQUINOLONES FOR CLINICAL ISOLATES OF S. PNEUMONIAE
3.1 Abstract
Antibiotic resistance among human pathogens now occurs in almost every
bacterial species for which antibiotic therapies exist. In the case of S. pneumoniae,
resistance to penicillin and macrolides (i.e., azithromycin, clarithromycin,
erythromycin) has become so widespread that clinicians have started to use the
fluoroquinolones for the treatment of community-acquired respiratory tract infections.
Fluoroquinolones with increased anti-pneumococal activities are becoming available,
but new treatment strategies must accompany use of these agents in order to halt the
selection of resistant mutants. The MPC represents a concentration threshold above
which the selective proliferation of resistant mutants is expected to rarely occur. MPCs
were defined and measured for six fluoroquinolones with clinical isolates of S.
pneumoniae. Based on their potential for restricting the selection of resistant mutants,
the six fluoroquinolones, in descending order of potency, were found to be:
gemifloxacin > moxifloxacin > trovafloxacin > gatifloxacin > grepafloxacin
> levofloxacin. For several compounds, clinical isolates that lacked a known resistance
mutation had an MPC value that was close to or below the serum levels that could be
attained using current dosing strategies. These data identify moxifloxacin, gatifloxacin
and gemifloxacin as good candidates for determining whether MPC can be used as a
guide for choosing and eventually administering fluoroquinolones in a way that would
significantly reduce the development of resistance. High MPC results for levofloxacin

61
suggest that more than once daily dosing may be required in order to ensure that drug
concentrations remain in excess of the MPC for a sufficient amount of the 24 hr dosing
period. Killing experiments based on the MPC and performed using conventional kill
curve methodology require further examination but suggest that killing based on the
MPC may be essential for rapid bacterial eradication and shorter durations of therapy.
62
3.2 Introduction
S. pneumoniae is the most common bacterial pathogen associated with (lower)
respiratory tract infections and accounts for approximately 50% of all cases of
community-acquired pneumonia, 35% of cases of acute sinusitis and acute otitis media
and 20% of acute exacerbations of chronic bronchitis in patients with chronic lung
disease (113, 199). Of growing concern is the increasing level of resistance to S.
pneumoniae among commonly used antimicrobials, namely, the penicillins and other ß-
lactams as well as the macrolides. Although geographically dependent, the frequencies
of penicillin and macrolide resistance among strains of S. pneumoniae are estimated to
be 40 and 30%, respectively (79, 348). Of perhaps greater concern is the rapid rate at
which resistance has developed within clinical strains of S. pneumoniae (353). The
incidence of penicillin-resistant S. pneumoniae increased from between 3-to-6% before
1991 to 39-to-46 % by 2000 and 2001 (31, 35, 79, 102, 348). In several studies, isolates
with high-level resistance represented 13-to-20% of all strains and isolates with
intermediate-level resistance represented 23-to-28% (79, 80). More recent data suggest
that >70% of high-level penicillin-resistant pneumococci demonstrate cross-resistance
to the macrolide class of antimicrobials (32, 79, 80).
The relatively low incidence of fluoroquinolone resistance among clinical
strains of S. pneumoniae (< 2% overall in Canada and the US) (337, 348, 363) has led to
the use of fluoroquinolones as first-line agents for the treatment of pneumonia and
lower respiratory infections both in inpatient and the outpatient settings, and particularly
when antimicrobial resistance is suspected (15, 16, 154). However, fluoroquinolone-

63
resistance associated with clinical failures is now being reported, raising concerns over
the continued use of quinolones with border-line (near breakpoint) activity against S.
pneumoniae (32, 89, 315, 318). In Canada, Chen et al (53) found that the prevalence of
ciprofloxacin-resistant pneumococci increased from 0% in 1993 to 1.7% in 1997-1998
(p=0.01). In adults, the prevalence increased from 0% in 1993 to 3.7% in 1998. In
addition to the increase in prevalence, increases in the overall degree of fluoroquinolone
resistance were also noted (53). Similar results have also been reported in Spain (211),
Japan (159), Eastern Europe (254) and the United States (80). The rapid global
dissemination of penicillin-resistant strains of S. pneumoniae (220) demonstrates the
threat that antimicrobial resistance poses in the clinical setting. For the fluoroquinolone
class of antimicrobials, rates of resistance to S. pneumoniae remain relatively low
(<2%) (46), and clinicians, laboratorians, and the scientific community are faced with
the daunting task of minimizing resistance while maintaining the clinical lifespan of the
fluoroquinolone class of antimicrobials. This task requires a proactive approach to
dealing with resistance. Unfortunately, fluoroquinolone-resistant S. pneumoniae are
emerging (53) and, since 1999, there have been over 30 case reports of levofloxacin
treatment failures in the United States and Canada (7, 70, 75, 97, 114, 186, 194, 305,
340, 351, 358).
Among the most well known and well characterized cases were those reported
by Davidson et al (70) who documented the development of resistance mutations in
strains of S. pneumoniae for patients receiving quinolone therapies. A report by Davies
et al (71) involving a subset of levofloxacin-susceptible pneumococcal isolates from

64
the 1999-2000 respiratory season, evaluated as part of the TRUST (Tracking Resistance
in the United States) study, indicated that 6.6 and 7.1% of the S. pneumoniae isolates for
which the levofloxacin MICs are 1.0 and 2.0 µg/ml, respectively, contain a first-step
parC mutation. Recent experiments conducted on clinical strains of S. pneumoniae
demonstrated that of 164 unique patient isolates of S. pneumoniae, 29.9% harboured a
mutation in either the parC or the gyrA gene, with the majority of isolates (67.3%)
having a mutation in the parC locus only (46). An additional Canadian study which
examined clinical isolates between 1993-to-1998 revealed that 59% of the isolates with
a levofloxacin MIC of 2 μg/ml, a level considered susceptible by NCCLS criteria, had a
first-step parC mutation (210). Thus, the state of fluoroquinolone efficacy for the
current and future treatment of S. pneumoniae is clear. In order to preserve this
important group of antimicrobial agents and prevent the rapid emergence of resistance,
inappropriate use needs to be controlled and it is paramount that we learn which
fluoroquinolones and which dosing regimes will help to minimize selection of resistant
bacteria (32, 53, 164).
The MPC describes the minimal antibiotic concentration required to inhibit the
most resistant first-step mutant present in large (>109 CFU/ml) susceptible cultures (41,
87, 149, 367). For example, bacterial populations may reach 1010 cells in human
infections (100, 116, 220, 241), but at a mutation frequency of 10 7, more than 1014
bacteria (107 × 107) would be required to detect two concurrent fluoroquinolone-
resistant mutations (41, 367). When we examined the effect of fluoroquinolone
concentration on the selection of resistant mutants of S. pneumoniae, we found drug

65
concentrations that prevented the growth of mutant colonies when 109-to-1010 cells
were applied to agar plates containing antibiotic. This drug concentration, designated
the MPC, would require a bacterial cell to develop more than one resistance mutation
for growth in the presence of the antibiotic. Thus, at concentrations above the MPC, a
bacterial population size greater than that normally present during infection would be
necessary for mutant growth. Since fluoroquinolone structure affects the value of the
MPC (83), we hypothesized that the MPC might serve as a simple measure of antibiotic
potency that incorporates the ability of a compound to restrict selection of resistant
mutants. The application of the MPC in current dosing regimes would add
consideration of the development of resistance to the traditional goal of clearing
infection.
Examination of large numbers of clinical isolates generally involves
measurement of antibiotic potency that is typically defined by the MIC. With the agar
dilution method, approximately 105 CFU/ml are applied to a series of agar or microtiter
plates containing various antibiotic concentrations (258) and the concentration that
prevents colony formation is recorded as the MIC. Measurement of MPC is carried out
using the same strategy, except that more cells (approximately 1010 cells) are applied to
agar plates containing varying drug concentrations. Consequently, it should be possible
to define MPC measurements for large numbers of clinical isolates against a panel of
different fluoroqouinolone agents. In the following work, I define MPC values for
clinical isolates of S. pneumoniae against gatifloxacin, gemifloxacin, grepafloxacin,
levofloxacin, moxiflxoaicn, and trovafloxacin. MPC measurements were compared

66
with published PK/PD parameters and bacterial killing studies were conducted to
determine if, and for how long, serum/tissue drug concentrations were expected to
remain in excess of the MPC for a given drug. The relationship between
fluoroquinolone PK/PD and the MIC90/ MPC90 measurements were used to empirically
define the potential for a given fluoroquinolone to select for resistance.

67
3.3 RESULTS
3.3.1 MPC Distributions for Clinical Isolates of S. pneumoniae
When 109-to-1010 cells of S. pneumoniae were applied per plate, a sharp drop in
growth was seen over a range of one-four dilutions above the MIC. When the minimal
concentration which prevented the growth of mutant colonies (MPCpr) was plotted
against the number of isolates, distinct peaks were seen in the distribution (Figure
4.3.1). The MPCpr represents a provisional value because the initial 72 hr screening
process, preformed on non-drug containing media, overestimates the MPC90 result by
2-fold (see Materials and Methods). When the average of MPCpr results for
approximately 100 clinical isolates of S. pneumoniae were determined, the five
fluoroquinolones could be ranked in terms of potency, in descending order, with
moxifloxacin, > gatifloxacin = trovafloxacin >grepafloxacin > levofloxacin (Table
3.3.1). Since working with large numbers of S. pneumoniae isolates is cumbersome, I
determined an empirical relationship between MPC and the MIC so that the MPC of a
drug can be calculated from the MIC of the drug. When the MIC of a drug was
measured by the agar dilution method, most of the isolates exhibited a two- to four-fold
difference between the MIC and MPCpr (one to three dilutions). The ratio was slightly
higher for trovafloxacin and grepafloxacin. The ratio of the MPC to the MIC of a drug
was calculated using values that exceeded those for 90% of the isolates (MPC90 and
MIC90). The ratio was found to be 8 for moxifloxacin, levofloxacin, and gatifloxacin,
and 16 for trovafloxacin and grepafloxacin. Similar ratios were obtained for the MPC
and the MIC of these drugs with the laboratory strain ATCC 49619.

68
0
1 0
2 0
3 0
4 0
5 0
0
1 0
2 0
3 0
4 0
5 0
0
1 0
2 0
3 0
4 0
5 0
0
1 0
2 0
3 0
4 0
5 0
0
1 0
2 0
3 0
4 0
5 0
<0.06
0.125
0.25
0.5
1 2 4 8 16 32 64 128
256
512
A
B
C
D
E
Num
ber o
f is o
l ate
s
White bars represent isolates containing parC mutations known to confer resistance; shaded regions represent isolates containing parC mutations that have not been demonstrated by genetic tests to confer quinolone resistance; solid regions represent unsequenced isolates.
MPCpr (μg/ml)
Figure 3.3.1 Distribution of MPCpr Results for 5 Fluoroquinolones Against 100 Clinical Isolates of S. pneumoniae
moxifloxacin
gatifloxacin
trovafloxacin
grepafloxacin
levofloxacin

69
Table 3.3.1 Fluoroquinolone Potency Based on MPCpr Resultsa
a From data presented in Figure 3.3.1
Fluoroquinolone MPCpr50
(μg/ml) MPCpr90 (μg/ml)
MIC90 (μg/ml) MPCpr90 / MIC90
Moxifloxacin 0.5 2 0.25 8 Trovafloxacin 1 4 0.25 16 Gatifloxacin 1 4 0. 5 8 Grepafloxacin 2 8 0.5 16 Levofloxacin 4 8 1 8

70
Figure 3.3.2 depicts MPC results obtained using drug-containing plates for the
72 hr screening process (described in Materials and Methods). Development of
trovafloxacin and grepafloxacin has stopped since our initial publication on MPC (41);
thus, Figure 3.3.2 illustrates MPC results for 220 clinical isolates against the currently
available fluoroquinolones, (moxifloxacin, gatifloxacin, gemifloxacin, and
levofloxacin) used in the treatment of infections caused by S. pneumoniae.
Fluoroquinolone-resistant isolates, based on a moxifloxacin MIC > 2 μg/ml, were
excluded from MPC testing. Gemifloxacin had the lowest modal MPC (0.125 µg/ml),
followed by moxifloxacin (0.5 µg/ml), gatifloxacin (1 µg/ml) and levofloxacin (2
µg/ml). The same rank order was observed when MPC was determined for 90% of the
isolates. These data are consistent with gemifloxacin having greater in vitro activity than
the other fluoroquinolones against resistant mutants (149, 254). When the MIC at
which 90% of the susceptible isolates were inhibited (MIC90) was determined,
gemifloxacin was also more active than moxifloxacin, gatifloxacin and levofloxacin in
these comparisons by 2, 3 and 4 doubling dilutions, respectively. Detailed descriptions
of MPC results for the 220 clinical isolates are illustrated in Table 3.3.2. For
moxifloxacin, 52.3% (115/220) of the isolates tested had MPC results of < 0.5 μg/ml
compared to 7.7% for gatifloxacin and 0% for levofloxacin. For gemifloxacin, 97% had
a MPC of < 0.5 μg/ml and only 1 isolate tested had a MPC result of > 2 μg/ml. For
moxifloxacin, gatifloxacin, and levofloxacin, 9%, 25.5 %, and 93% of the isolates tested

71
Figure 3.3.2 Distribution of MPC Results for Moxifloxacin, Levofloxacin, Gatifloxacin, and Gemifloxacin Against 220 Clinical Isolates of S. pneumoniae .
MPC (μg/ml)
moxifloxacin
0
4 0
8 0
1 2 0
1 6 0
0
4 0
8 0
1 2 0
1 6 0
0
4 0
8 0
1 2 0
1 6 0
0
40
80
120
160
0.0
31
0.0
6
0.1
25
0.2
5
0.5
1 2 4 8 16
32
Num
ber o
f Is o
late
s
D
C
B
A
gemifloxacin
levofloxacin
gatifloxacin
moxifloxacin

72
Table 3.3.2 Distribution of MPC Results and the Relationship Between MIC and MPC for Clinical Isolates of S. pneumoniae and Fluoroquinolones
No. of isolates at various MPC drug concentrations Fluoroquinolone <0.031 0.06 0.125 0.25 0.5 1 2 4 8 16 32 64
Trovafloxacina (n=100)
5 28 36 14 7 6 4
Grepafloxacinb (n=98)
2 23 37 25 9 2
Moxifloxacin (n=220)
1 11 103 85 18 2
Gatifloxacin (n=220)
17 145 51 3 1 1
Levofloxacin (n=220)
15 151 46 7 1
Gemifloxacin (n=220)
3 34 86 70 14 5 1
No. of isolates having ratios of MPC/MICc Fluoroquinolone 0.06 0.13 0.25 0.5 1 2 4 8 16 32 64 128 256 512
Trovafloxacina (n=100)
1 1 28 33 22 9 4 2
Grepafloxacinb (n=100)
5 18 27 31 15 3 1
Moxifloxacin (n=220)
5 17 101 62 34 1
Gatifloxacin (n=220)
4 68 116 29 3 4
Levofloxacin (n=220)
118 72 8 1 1
Gemifloxacin (n=220)
16 49 77 54 17 6 1
a ,b Trovafloxacin and grepafloxacin have been withdrawn from the market. Trovafloxacin and grepafloxacin results represent provisional (MPCpr) values, which overestimate the actual MPC result 2-fold. c Ratio of MPC/MIC was determined for each isolate and the number of isolates having the indicated values of the ratio were tabulated. This data set includes strains that have a known resistance mutation(s). MPC and MIC values were determined by either plating >109 (MPC) or 105 (MIC) respectively on agar containing two-fold dilutions of fluoroquinolones.
73
had a MPC of > 2 μg/ml. On average, MPC results for the six fluoroquinolones
tested were 4-fold higher than MIC measurements.

74
3.3.2 Relationship of MPC Results to Fluoroquinolone PK/PD Properties
Since the effectiveness of an antibacterial agent is likely to be a function of both
activity (MPC) and pathogen exposure, I was interested in examining the relationship
between MPC results and the recommended fluoroquinolone doses and drug PK/PD
parameters (Table 3.3.3) to see if compounds could be differentiated based on their
potential to select for resistance during therapy. Gemifloxacin, the most potent of the
compounds tested, has a Cmax of 1.6 μg/ml with a half-life of 7-to-8 hrs. Concentrations
of gemifloxacin are expected to exceed the MPC for approximately 12 hr of the dosing
interval. Moxifloxacin has a maximum serum drug concentration of 4.5 µg/ml and the
half-life is 12 hr. Therefore, once daily dosing should keep concentrations of
moxifloxacin in serum above the MPC90 for the entire length of the dosing interval (i.e.,
24 hr). Gatifloxacin is expected to maintain serum concentrations above the MPC90 for
six hours and may require twice-daily dosing. Levofloxacin concentrations are expected
to exceed to the MPC90 for 3 hr, thus, restricting the selection of resistant mutants with
levofloxacin may require higher or more frequent doses.
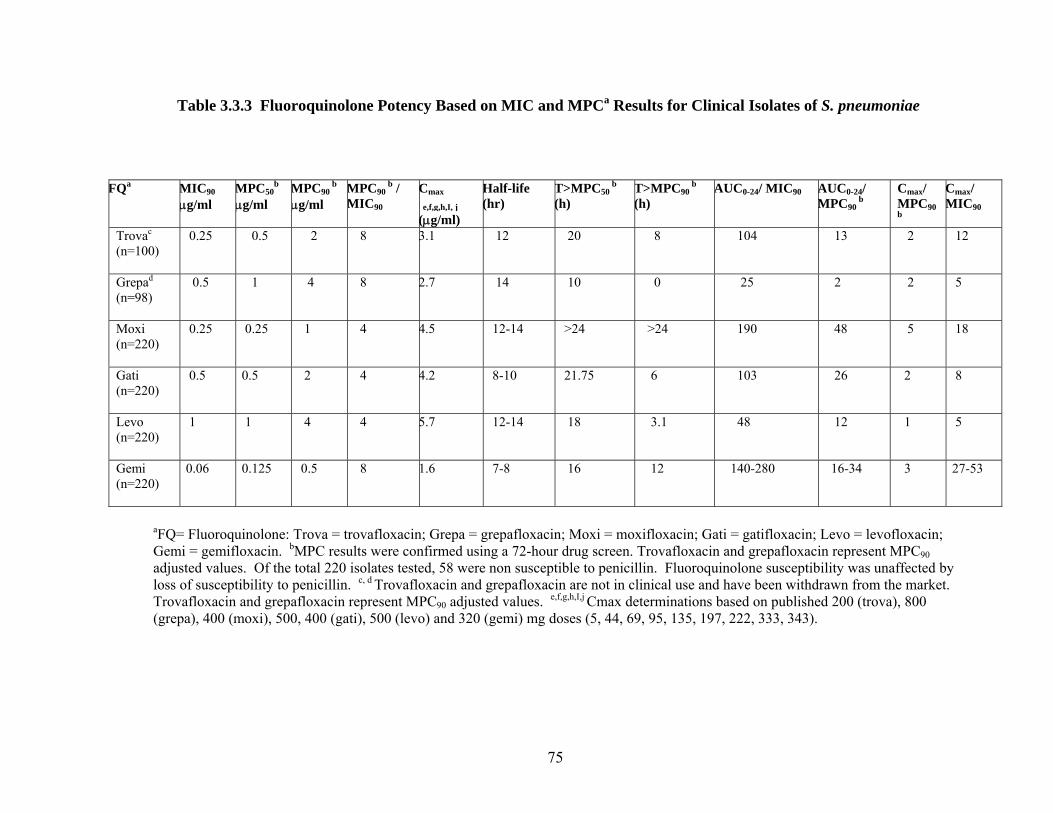
75
Table 3.3.3 Fluoroquinolone Potency Based on MIC and MPCa Results for Clinical Isolates of S. pneumoniae
aFQ= Fluoroquinolone: Trova = trovafloxacin; Grepa = grepafloxacin; Moxi = moxifloxacin; Gati = gatifloxacin; Levo = levofloxacin; Gemi = gemifloxacin. bMPC results were confirmed using a 72-hour drug screen. Trovafloxacin and grepafloxacin represent MPC90 adjusted values. Of the total 220 isolates tested, 58 were non susceptible to penicillin. Fluoroquinolone susceptibility was unaffected by loss of susceptibility to penicillin. c, d Trovafloxacin and grepafloxacin are not in clinical use and have been withdrawn from the market. Trovafloxacin and grepafloxacin represent MPC90 adjusted values. e,f,g,h,I,j Cmax determinations based on published 200 (trova), 800 (grepa), 400 (moxi), 500, 400 (gati), 500 (levo) and 320 (gemi) mg doses (5, 44, 69, 95, 135, 197, 222, 333, 343).
FQa MIC90 μg/ml
MPC50b
μg/ml MPC90
b μg/ml
MPC90b /
MIC90 Cmax
e,f,g,h,I, j (μg/ml)
Half-life (hr)
T>MPC50 b
(h) T>MPC90
b (h)
AUC0-24/ MIC90 AUC0-24/ MPC90
b Cmax/ MPC90
b
Cmax/ MIC90
Trovac (n=100)
0.25 0.5 2 8 3.1 12 20 8 104 13 2 12
Grepad (n=98)
0.5 1 4 8 2.7 14 10 0 25 2 2 5
Moxi (n=220)
0.25 0.25 1 4 4.5 12-14 >24 >24 190 48 5 18
Gati (n=220)
0.5 0.5 2 4 4.2 8-10 21.75 6 103 26 2 8
Levo (n=220)
1 1 4 4 5.7 12-14 18 3.1 48 12 1 5
Gemi (n=220)
0.06 0.125 0.5 8 1.6 7-8 16 12 140-280 16-34 3 27-53

76
Some of the isolates examined at high inoculum concentrations required
exceptionally high concentrations of fluoroquinolone to prevent colony formation
(shaded bars Figure 3.3.1). Since ciprofloxacin and levofloxacin have been used
extensively in Canada as therapy for respiratory tract infections including those caused
by S. pneumoniae and since many fluoroquinolone-resistant isolates have emerged, I
suspected that at least some of the isolates in the present study contained mutations in
the target genes, parC (topoisomerase IV) and/or gyrA (gyrase). To test this idea, DNA
was obtained from 22 isolates and the nucleotide sequences of the QRDRs of the two
genes were determined. As shown in Table 3.3.4, 17 isolates were parC mutants, 7 of
which also contained a gyrA mutation. Six of the parC mutants (isolate numbers
10, 12, 13, 15, 16 and 18) contained alleles known from genetic studies (117) to confer
resistance (predicted amino acid changes of Ser-79 to Phe and Asp-83 to Asn). Of
these, three also contained a GyrA alteration (Ser-81 changed to Phe or Tyr) known to
confer resistance. Since MPC is based on the recovery of colonies grown from wild-
type populations, the six resistant mutants (white portions of bars in Figure 3.3.1) were
excluded from determination of MPC90 results. For 11 other isolates, the nucleotide
sequence predicted changes of Ser-52 to Gly, Asn-91 to Asp, or Lys-137 to Asn in the
ParC protein (shaded portion of bars in Figure 3.3.1). To my knowledge, genetic
studies have not been performed that attribute resistance to these alleles. Consequently,
I did not exclude these strains or those lacking a parC or gyrA mutation from the
determination of the MPC90.

77
Table 3.3.4 Fluoroquinolone-Resistance Alleles Associated With High MPC Values
MPC (μg/ml)a
Changes in QRDRc Isolate no.
Gati Grepab Levo Moxi Trovab Gemi parC gyrA wtd 2 4 4 1 1 10 8 256 16 4 16 D83N (GAT to AAT) S81F (TCC to TTC) 12 4 >256 32 4 16 2 S79F (TCT to TTT) S81Y (TCC to TAC) 13 16 64 64 8 4 S79F (TCT to TTT)
S52G (AGC to GGA) N91D (AAC to GAC)
S114G (AGT to GGT)
15 16 8 32 8 1 1 S79F (TCT to TTT) None 16 256 16 S79F (TCT to TTT) S81F (TCC to TTC) 18 >256 8 S79F (TCT to TTT) None 27 8 >256 8 2 4 1 S52G (AGC to GGC)
N91D (AAC to GAC) S114G (AGT to GGT)
33 1 1 4 0.25 2 0.125 K137N (AAG to AAT)
None
35 2 4 8 0.5 4 0.5 K137N (AAG to AAT)
None
36 1 1 2 0.5 1 0.06 K137N (AAG to AAT)
None
37 1 2 2 0.5 1 0.125 K137N (AAG to AAT)
None
42 1 4 4 0.5 >16 0.125 K137N (AAG to AAT)
None
43 0.5 1 8 8 0.5 None None 48 1 2 2 0.5 1 0.125 K137N (AAG to
AAT) None
51 0.5 2 2 1 0.06 K137N (AAG to AAT)
None
64 4 4 4 1 1 1 None None
74 1 16 4 0.5 >8 0.25 S52G (AGC to GGC) None
78 1 1 2 0.5 1 0.125 None None
87 2 1 2 0.5 0.125 None None
89 4 8 4 1 1 0.5 S52G (AGC to GGC) S114G (AGT to GGT)
91 0.5 2 4 0.5 0.5 S52G (AGC to GGC) N91D (AAC to GAC)
S114G (AGT to GGT)
103 0.5 4 1 0.5 2 1 None None
Gati = gatifloxacin; Grepa = grepafloxacin; Levo = levofloxacin; Moxi = moxifloxacin; Trova = trovafloxacin; and Gemi = gemifloxacin. a All MPC values were determined using a 72h screening process on drug containing plates, b MPC results obtained for grepafloxacin and trovafloxacin represent provisional values which are a two-fold overestimation of the actual MPC value. c QRDR, quinolone resistance determining region. Amino acid in wild-type protein is indicated before its number in the protein, followed by the amino acid change. D = aspartic acid; F = phenylalanine; G= glycine; K = Lysine; S = serine; Y = tyrosine. d wild type strain ATTC 49619.

78
3.3.3 Killing of S. pneumoniae by Fluoroquinolones at the MIC, MPC and Cmax Drug Concentrations
Like traditional measures of drug susceptibility, the MPC measurement is not
reflective of bacterial killing. I was interested in examining the killing of S.
pneumoniae by gemifloxacin, levofloxacin and moxifloxacin (by conventional kill
curve methods) for four clinical strains of S. pneumoniae (SP-9, SP-26, SP-69, SP-73).
All isolates tested were fluoroquinolone susceptible and were tested using inocula of
105 and 108 CFU/ml against the MIC, MPC, and Cmax drug concentrations. Table
3.3.5 summarizes the MICs and MPCs of the pneumococcal isolates tested in the killing
experiments. Panel A in Figure 3.3.3 represents the killing of four strains exposed to
MIC drug concentration for gemifloxacin, moxifloxacin, and levofloxacin using
inoculums of 105 CFU/ml cultures. Re-growth was observed with all fluoroquinolones
tested during the initial 10 min of exposure and up two one hr following exposure to
levofloxacin and moxifloxacin. By 4 hr, –1.37, and - 1.0 log reductions in viable counts
were measured for gemifloxacin and moxifloxacin, and a - 0.06 log reduction in viable
counts was measured for levofloxacin (table 3.3.6). After 24 hr, - 5.13, - 2.87, and -
0.58 log reductions in viable counts were measured for gemifloxacin, moxifloxacin, and
levofloxacin respectively. A 73% reduction in viable cells was calculated for
levofloxacin after 24 hr compared to > 99% for gemifloxacin and moxifloxacin. When
108 CFU/ml cultures were tested against the MIC drug concentrations, the log
reductions in viable counts for gemifloxacin, moxifloxacin and levofloxacin over 4 hr
were - 0.34, - 0.48, and - 3.62.

79
Table 3.3.5 MIC and MPC Results for Moxifloxacin, Gemifloxacin, and Levofloxacin Against 4 Isolates of S. pneumoniae
Susceptibility Test
Moxifloxacin Gemifloxacin Levofloxacin
Isolate ID
MIC (μg/ml) MPC (μg/ml) MIC (μg/ml) MPC (μg/ml) MIC (μg/ml) MPC (μg/ml)
Sp9 0.125 0.5 0.03 0.125 0.5 2
Sp26 0.125 0.5 0.06 0.25 1 4
Sp69 0.125 0.5 0.03 0.125 1 2
Sp73 0.125 1 0.03 0.25 0.5 2

80
Figure 3.3.3 Killing of S. pneumoniae (n=4) by Gemifloxacin, Moxifloxacin, and Levofloxacin at the MIC, MPC and Cmax Drug Concentrations
0123456789
0123456789
0123456789
0
2
4
6
8
10
0 0.1 0.5 1 2 3 4 240
2
4
6
8
10
0 0.1 0.5 1 2 3 4 240
2
4
6
8
10
0 0.1 0.5 1 2 3 4 24
T im e ( h r )
Log
grow
th/re
duct
ion
(CFU
)
Four strains of S. pneumoniae were tested by gemifloxacin (triangles), moxifloxacin (circles) and levofloxacin (squares). The S. pneumoniae ATTC 46919 growth control (incubated in the absence of drug) is represented by a blank line. Graphs depict the average inocula tested and the average killing for the four strains tested. Panels A, C, and E represent killing of 105 CFU/ml cultures. Panels B, D, and F depict killing of 108 CFU/ml cultures.
D
CBA
FE
MIC MIC CmaxMIC MPC Cmax
Time (hr)

81
Table 3.3.6 Killing of S. pneumoniae (n=4) at Varying Concentrations and Inocula for Clinical Isolates of S. pneumoniae
Drug Concentration Tested in Kill Experiments (inoculums tested (CFU/ml)
Time (hr)
Measurement
MIC MPC Cmax Gemi
(3.89x10⁵) Levo (7.81x10⁵)
Moxi (6.17x10⁵)
Gemi (3.89x10⁵)
Levo (7.81x10⁵)
Moxi (6.17x10⁵)
Gemi (3.89x10⁵)
Levo (7.81x10⁵)
Moxi (6.17x10⁵)
1 -30.80 +26.60 +2.30 -56.60 -12.90 -58.30 -85.10 -76.40 -90.20 3 -95.70 -12.90 -80.40 -98.30 -95.60 -96.70 -99.90 -99.64 -99.60 4 -95.70 -36.90 -90.20 -99.35 -98.64 -99.44 -99.94 -99.82 -99.61 24
% reduction/re-growth in viable cells
>-99.99 -73.89 -99.80 >-99.99 -100 -100 -100 >-99.99 -100 1 -0.16 +0.10 +0.14 0.00 -0.06 -0.43 -0.86 -0.63 -1.01 3 -0.76 -0.13 -0.38 -1.77 -1.36 -1.80 -3.19 -2.38 -2.41 4 -1.37 -0.06 -1.01 -2.19 -1.87 -2.25 -3.68 -2.75 -3.30 24
Log reduction/re-growth
-5.13 -0.58 -2.87 -5.24 -5.65 -5.49 -5.59 -5.50 -5.78 MIC MPC Cmax Time
(hr)
Measurement Gemi
(2.51x10⁸) Levo
(8.81x10⁸ Moxi
(6.57x10⁸) Gemi
(2.51x10⁸) Levo
(8.81x10⁸) Moxi
(6.57x10⁸) Gemi (2.51x10⁸)
Levo (8.81x10⁸)
Moxi (6.57x10⁸)
1 -20.1 -17.8 -50.7 +2.9 -32.4 -84.5 -41.49 -52.29 -84.59 3 -63.5 -13.9 -66.8 -67.4 -48.7 -81.9 -62.89 -70.19 -81.99 4 -59.50 -99.97 -76.01 -78.62 97.31 -49.30 -92.76 -75.59 -93.65 24
% reduction/re-growth in viable cells
>-99.99 -99.89 >-99.99 >-99.99 >-99.99 >-99.99 -99.77 -99.99 >-99.99 1 +0.01 -0.09 -0.82 -0.01 -0.17 0.00 -0.76 -0.33 -0.81 3 -0.24 -3.55 -0.61 -0.49 -0.35 -0.18 -1.08 -0.53 -0.74 4 -0.34 -3.62 -0.48 -0.67 -1.57 -0.30 -1.14 -0.63 -1.20 24
Log reduction/re-growth
-4.34 -4.00 -6.03 -2.81 -8.25 -6.92 -2.97 -3.73 -5.03 aMIC=minimum inhibitory concentration; MPC=mutant prevention concentration; Cmax=maximum serum concentration; Gemi-gemifloxacin; levo=levofloxacin; moxi=moxifloxacin.

82
respectively. By 24 hr, - 4.34, - 6.03, and - 4.00 log reductions in viable counts were
measured for gemifloxacin, moxifloxacin, and levofloxacin, respectively, which
represented > 99% killing for all three fluoroquinolones tested. At the MPC drug
concentrations (panel C), - 2.19, - 2.25, and - 1.87 log reductions in viable counts were
measured after 4 hrs and killing of > 98% was observed for all three fluoroquinolones
tested. After 24 hr, > - 5 log reductions in viable counts were measured for all three
fluoroquinolones tested. When 108 CFU/ml cultures were exposed to the MPC drug
concentrations (panel D) log reductions in viable cells were measured at - 0.67, - 0.30,
and - 1.57 for gemifloxacin, moxifloxacin, and levofloxacin, respectively. These values
increased to - 2.9, - 6.9 and - 8.25 respectively after 24 hr and resulted in > 99.99%
killing for all three fluoroquinolones.
When 105 CFU/ml cultures were exposed to the Cmax drug concentration, a >-3
.0 log reduction was observed after 4 hr for gemifloxacin, levofloxacin and
moxifloxacin. After 24 hrs of exposure, - 5.6, - 5.5 and – 5.6 log reductions in viable
counts were observed for gemifloxacin, levofloxacin and moxifloxacin, respectively.
No growth was observed for gemifloxacin and moxifloxacin when 105 CFU/ml cultures
of S. pneumoniae were exposed to the Cmax. The killing of 108 cultures at the Cmax was
less than that observed with 106 CFU/ml cultures. After 4 hours, - 1.1, - 0.6 and - 1.1
log reductions in growth were seen for gemifloxacin, levofloxacin and moxifloxacin,
respectively. By 24 hr, killing of > 2.0 log was observed for all agents tested; - 2.0, -
3.1 and - 3.8 log reductions in viable counts were observed for gemifloxacin,

83
levofloxacin and moxifloxacin, respectively, which resulted in > 99.78% killing for all
three fluoroquinolones.

84
3.4 DISCUSSION
Preliminary MPC work with S. pneumoniae (40) revealed a narrow drug
concentration range for mutant selection and led me to expect that agar plates used in a
standard two-fold dilution analysis with clinical isolates would exhibit either confluent
growth or no colonies, at least for the C-8-methoxy compounds. When 109-to-1010 cells
were applied per plate, a sharp drop in growth was seen over a concentration range of
one to four dilutions above the MIC. When the minimal concentration at which no
colonies were recovered (MPCpr) was plotted against the number of isolates, distinct
peaks were seen in the distribution (Figure 3.3.1). The peak for moxifloxacin appeared
at the lowest drug concentration; therefore, moxifloxacin was the most potent
fluoroquinolone by this assay. I consider the values of MPCpr shown in Figure 3.3.1 to
be provisional because initial 72 hr screens used to confirm the absence of growth, were
preformed on non-drug containing plates. When plates with antibiotic concentrations at
the MPC were used to confirm the absence of growth, it was determined that MPCpr
results were a 2-fold overestimation of the MPC. The observed difference between
MPCpr and the actual MPC results appear to be due to differences in bacteriostatic
versus bactericidal activity. A heavy bacterial suspension containing a mixture of cells
and capsular polysaccharides may have resulted in a thin “film” on some of the plates
which in turn may have provided a “protective effect” when the contents of the plate
were transferred to non-drug containing media and re-incubated for an additional 24 hr.
These data also argue against complications due to autolysis occurring at high cell

85
density, since that would have made MPCpr an underestimation of MPC. In a separate
experiment using a laboratory isolate of S. pneumoniae (ATCC 49619), various
fluoroquinolone concentrations were tested with dilute bacterial cultures and many agar
plates so that mutants were recovered as single colonies (41). The MPC for the ATTC
49619 strain was 0.5 µg/ml for moxifloxacin and 2.6 µg/ml for levofloxacin. The
MPCpr was 1 µg/ml for moxifloxacin and 4 µg/ml for levofloxacin using the 2-fold agar
dilution assay described in Materials and Methods. Consequently, MPCpr overestimates
MPC by an average of 2- fold for both the most active and the least active compounds in
the present study.
When the average of MPCpr results for approximately 100 clinical isolates of S.
pneumoniae were determined, the five fluoroquinolones could be ranked in terms of
potency, in descending order, with moxifloxacin, > gatifloxacin = trovafloxacin
>grepafloxacin > levofloxacin (Table 3.3.1). Based on MPC results, intrinsic
differences in the anti-pneumococcal activity for the agents tested were observed and in
many cases, these differences were not reflected in the MIC measurements of
susceptibility. When the MICs and MPCs were determined using the same set of
isolates for each compound, I found that gemifloxacin had the lowest modal MPC
(0.125 µg/ml), followed by moxifloxacin (0.5 µg/ml), gatifloxacin (1 µg/ml) and
levofloxacin (2 µg/ml). The same rank order was observed when MPCs were
determined for 90% of the isolates. These data are consistent with gemifloxacin having
superior in vitro activity when compared to other quinolones (254, 340). When the

86
MIC at which 90% of the susceptible isolates are inhibited (MIC90) was determined,
gemifloxacin was also more active than moxifloxacin, gatifloxacin and levofloxacin in
these comparisons by 2, 3 and 4 doubling dilutions, respectively.
Since working with large numbers of S. pneumoniae isolates is cumbersome, I
determined an empirical relationship between MPC and MIC so that the MPC of a drug
can be calculated from the MIC of the drug. When the MIC of a drug was measured by
the agar dilution method, most of the isolates exhibited a 2- to 4-fold difference
between the MIC and MPCpr for five fluoroquinolones tested. The ratio was slightly
higher for trovafloxacin and grepafloxacin. The ratio of the MPC to the MIC of a drug
was calculated using values that exceeded those for 90% of the isolates (MPC90 and
MIC90); this ratio was 8 for three of the compounds and 16 for trovafloxacin and
grepafloxacin. Similar ratios were obtained for the MPC and the MIC of these drugs
with the laboratory strain ATCC 49619. Large numbers of isolates tested against six
different quinolone agents provides support for the extrapolation of MPC value from the
MIC for strains of S. pneumoniae, provided few strains with MICs > 2 μg/ml to
moxifloxacin are present in the population. Ideally, a small MPC/MIC ratio should be
targeted and would correlate with a narrow mutant selection window, since the time
drug concentrations are in above the MIC and below the MPC is expected to be small.
Increased incidence of fluoroquinolone-resistant S. pneumoniae have been associated
with treatment of penicillin-resistant cases of pneumonia (53). However, for the newer
fluoroquinolones (such as moxifloxacin and gemifloxacin), the value of MIC90 is
87
unaffected by pneumococcal resistance to penicillin and/or other agents (27, 31, 33).
Likewise, no increase in MPC was associated with the presence of penicillin resistance
in the present data set. Thus, potential cross-resistance between the two classes of
compounds does not appear to be factor in quinolone-resistance.
Sequence analysis of the QRDR of S. pneumoniae isolates with high MPCs
revealed the presence of first-step parC mutations and double parC + gyrA mutations.
While susceptible isolates that harbour a parC mutation lead to higher MPC results, the
significance of these isolates in the general population remains unknown, in part
because we are currently unable to detect them. Apart from DNA sequencing, no
accurate test can reliably identify isolates with first-step mutations (210). In the context
of isolates with pre-existing parC mutations, the value of the MPC measurement will
become important, because it will be able to identify isolates which are difficult to treat
isolates. Recent fluoroquinolone-treatment failures in S. pneumoniae have been
associated with strains that harboured first-step parC mutations prior to receiving
treatment (7, 70). In vitro studies have shown that upon acquisition of a first-step
mutation, the likelihood of developing a subsequent mutation is enhanced in
comparison to the development of the first-step mutation itself (128, 207, 282). Studies
preformed with E. coli have shown that a parC resistance allele, which has no effect on
the MIC of the drugs, can increase by orders of magnitude the frequency at which
resistant mutants are selected by C-8-methoxy fluoroquinolones (369). Therefore,
minimizing the number of strains in the population which contain first-step mutations
88
and restricting their growth are key factors in helping to minimize fluoroquinolone
resistance.
A central question surrounding fluoroquinolone resistance is whether the choice
of fluoroquinolone will influence the selection of first-step mutations and the
development of resistance. Less active compounds based on higher MPCs are more
likely to select for resistant mutants during therapy if MPC concentrations are not
maintained throughout dosing. Thus, I expect continued use of ciprofloxacin and
levofloxacin to seriously shorten the useful lifespan of moxifloxacin, gatifloxacin, and
gemifloxacin. Although the latter two compounds may be potent enough to treat
infection caused by parC mutants (selected by ciprofloxacin and levofloxacin), parC
gyrA double mutants would be readily selected by newer generation fluoroquinolones if
the pathogens already contain a parC resistance allele. Thus, slowing the development
of resistance may necessitate careful management of compounds within the same
general class (41).
The endpoint of antibiotic dosing strategies, such as those based on area under
the inhibitory concentration curve, has often employed clearance of infection measured
either as survival in animal models or loss of symptoms in humans. Widespread
development of resistance suggests that consideration should also be given to restricting
the selection of resistant mutants. One approach has utilized the ratio of maximum
concentration of drug in serum to the MIC of the drugs andsubsequent values have been
found that restrict mutant outgrowth in vitro (25) and correlate with animal survival

89
(93). However, this ratio does not take into account the time for which drug
concentrations remain high and which may be important for preventing development of
resistance. Consequently, I have examined the relationship of the MPC to
fluoroquinolone pharmacokinetic properties.
Compounds and dosing protocols can readily be compared for the time that drug
concentrations in tissue/serum exceed the MPC. I have previously suggested that for
the MPC to be a therapeutically useful parameter, its value must be below serum and
tissue drug concentrations attained following administration of drug doses that are safe
for patients (41, 149). Gemifloxacin, the most potent of the compounds tested, has a
Cmax of 1.6 μg/ml with a half-life of 7-to-8 hr. Concentrations of gemifloxacin are
expected to exceed the MPC for approximately 12 hr of the dosing interval.
Moxifloxacin has a maximum serum drug concentration of 4.5 µg/ml and the half-life is
12 hr. As such, once daily dosing should keep concentrations of moxifloxacin in serum
above the MPC90 for the entire length of the dosing interval (i.e., 24 hr) and minimize
the potential that resistant mutant will be selected during therapy. Gatifloxacin may
also restrict the selection of resistant mutants, especially if administered twice daily.
Levofloxacin may require higher doses, perhaps administered two to three times daily,
to attain the same potency with respect to restricting selection of resistant mutants.
Examination of the concentrations present at sites of infection and in infected
tissues will help to further define drug concentrations which inhibit first-step mutants
and since quinolone concentrations in relevant tissue may be higher than in serum (23,

90
162), dosing based on the MPC may serve as a realistic approach for minimizing
resistance and maximizing therapeutic outcome. Animal experiments and clinical trials
are now required to test these hypotheses. The serum drug concentrations listed in
Table 3.4.1 represent total concentrations. Fluoroquinolones bind to serum proteins, so
additional corrections may be necessary when particular compounds are compared.
Protein binding varies among the compounds, but in general less than half of the total
drug that is present is bound and consequently, protein binding probably has little effect
on the conclusions reached above. The time serum/tissue concentrations exceed the
MPC (T > MPC) will directly correlate with reduced likelihood of selecting resistant
mutants because concentrations required to inhibit their growth (and possibly kill) will
be maintained throughout dosing. For fluoroquinolones, the Cmax/MIC (or
Cmax/MPC) ratio has been suggested as the most important PK property associated
with bacterial eradication (94). Thus, it could be perceived that that time above the
MIC/MPC is not the most useful PK parameter used to assess fluoroquinolone potency.
Recently, Shenteg et al (316, 319) summarized PK/PD data relating to clinical trials,
animal studies, and in vitro models with fluoroquinolones and concluded that AUIC
values of >100 are predictive of clinical and microbiologic outcomes and reduced
incidence of resistance for fluoroquinolones. Like the T > MPC relationship, the AUIC
takes into account the length of time a pathogen is exposed to inhibitory concentrations
throughout a pharmacokinetic profile. Therefore, like the AUC, the T > MPC

91
Table 3.4.1 PK/PD Properties for Fluoroquinolones
Agent Dose (mg)
Cmax (μg/ml)
Tmax (hr)
t1/2 (hr)
AUC (mg x hr/l)
Cmax/MPC % Protein
binding
Ref
500 5.2-6.2 47.7 1.3-1.55
750 7.13-11 82 1.8-2.8
500 (I.V) 6.4 48.3 1.6
Levofloxacin
750 (I.V) 12.1
1.7 6.3-7.4
110 3
26-31 (8, 55-57, 68,
111, 135, 364)
200 1.71 0.9 Gatifloxacin 400 3.4-4.2
1.5 8.4 31.7-33 1.7-2.1
20
(28, 91, 257,
355, 364)
Gemifloxacin 320 1.19-1.5 1-2 8 9.3 2.38-3 58 (5, 364)
Moxifloxacin 400 4.5 0.8-2 12 48-200 4.5 37 (33, 68, 333, 364)

92
relationship does not contradict concentration dependent killing by fluoroquinolones,
but may in fact complement it (32). Fluoroquinolones (such as moxifloxacin) that
maintain serum/tissue concentrations in excess of the MPC throughout the dosing
interval are expected to restrict the selection of resistant mutants.
Direct comparisons of fluoroquinolones based on the MPC requires examination
of the MPC result in relation to resistance breakpoints, drug PK, the type(s) of mutants
selected, and the clinical history. For example, comparison of moxifloxacin and
levofloxacin revealed that 9% of the isolates tested with moxifloxacin had a MPC value
at or above an intermediate breakpoint (i.e., > 2 μg/ml), compared to 25% of the isolates
tested against levofloxacin, which had MPC values at or above an intermediate
breakpoint (> 4 μg/ml) for resistance. Thus despite the fact that a larger fraction of
isolates tested against levofloxacin had a lower MPC/MIC ratio than was seen for
moxifloxacin, a larger number of isolates tested against levofloxacin had a MPC value
that would be considered intermediate or above by conventional susceptibility
guidelines. The resistance breakpoints established by the NCCLS serve as a surrogate
marker of whether therapy is likely to be successful, and strains displaying intermediate
and/or resistant phenotypes have typically been associated with clinical failures and the
development of resistance (7, 70, 75, 351). The larger numbers of levofloxacin MPCs
that fell within an intermediate breakpoint are of particular concern in light of recent
evidence demonstrating that over half of the S. pneumoniae population with a
levofloxacin MIC of 2 µg/ml, may contain a first-step mutation in parC. The
93
requirement of first-step mutations in the subsequent development of high-level
fluoroquinolone resistance has been well documented (164, 207, 210, 275, 370) and
supports the hypothesis that inhibiting first-step resistant mutants with MPC drug
concentrations will severely restrict the selection of fluoroquinolone resistant strains.
Thus, the significance of the MPC results should be interpreted in relation to: 1.) The
pharmacokinetics dose-response profile of the drug. 2.) The relationship between the
MPC and the susceptibility breakpoint for resistance. 3.) The types of mutants selected,
and, 4.) the overall potency of the agent. These factors are likely to differ among agents
within the fluoroquinolone class of antimicrobials.
Overall, the MPC measurement is a useful tool in determining appropriate
quinolone therapy for the treatment of infections caused by S. pneumoniae. First-step
resistant mutants of S. pneumoniae were selected from susceptible cultures when > 109
cells were applied to agar-containing plates seeded with increasing concentrations of
quinolones. In all cases, the MPC measurement was in excess of the MICs of the wild-
type cultures. Fluoroquinolones that possess low MPC values, maintain serum/tissue
concentrations above the MPC90 for the entire length of a dosing interval, maintain a
narrow MPC/MIC relationship and possess bactericidal activity against first-step
resistant mutants are good candidates for restricting the selection of fluoroquinolone-
resistant S. pneumoniae. Based on this criterion, moxifloxacin and gemifloxacin are
likely to severely restrict the development of resistant mutants if the principles of MPC
are applied during dosing. Gatifloxacin may require twice daily dosing in order to

94
restrict the development of resistant mutants. Levofloxacin had the highest MPCs of all
the fluoroquinolones tested, and may require additional and/or higher doses to restrict
the selection of resistant mutants of S. pneumoniae.

95
4.0 ENRICHMENT OF FLUOROQUINOLONE-RESISTANT MUTANT SUBPOPULATIONS OF P. AERUGINOSA
4.1 Abstract
Ciprofloxacin and levofloxacin are potent first-line fluoroquinolones which are
often used in combination with anti-pseudomonal cephalosporins and/or
aminoglycosides, for the treatment of infections caused by P. aeruginosa. However,
microbiological factors (MIC, MBC, killing) and PK considerations such as the
Cmax/MIC and AUC, have not always correlated with the clinical outcome and
development of resistance in cases of infections caused by P. aeruginosa. In an attempt
to examine unresolved issues related to selection of resistant mutants of P. aeruginosa,
I measured MPC values for 155 clinical isolates of P. aeruginosa for ciprofloxacin and
levofloxacin. The MPC90 values for ciprofloxacin and levofloxacin were 4 and 16
μg/ml, respectively, suggesting that neither ciprofloxacin nor levofloxacin is suitable as
monotherapy. Based on currently administered I.V. doses, ciprofloxacin is projected to
remain in excess of the MPC90 for 5.5 hr while no currently recommended dose of
levofloxacin is expected to exceed the MPC90 value. Levofloxacin was > 2-fold less
active against first-step resistant mutants of P. aeruginosa compared to ciprofloxacin,
and for strains over expressing four different efflux mechanisms, levofloxacin was an
average of 3 times less active than ciprofloxacin. When mutant selection was examined
for six susceptible strains of P. aeruginosa, a larger proportion of the mutant population
was recovered when tested against levofloxacin. DNA sequence analysis of selected

96
mutants revealed alterations in the gyrA and parC genes. Killing experiments
preformed at the MPC and MIC drug concentrations for 106 and 1010 CFU/ml cultures
demonstrated that maintaining MPC drug concentrations severely restricts the selection
of resistant mutants. Preliminary results from a rat abscess model of infection revealed
that resistant mutants are readily selected when ciprofloxacin and levofloxacin were
dosed once a day. Collectively, MPC experiments conducted with ciprofloxaicn and
levofloxacin against clinical isolates of P. aeruginosa provide a microbiological basis
for observed clinical differences between ciprofloxacin and levofloxacin against P.
aeruginosa and support the hypothesis that superior clinical performance of
ciprofloxacin correlates with activity against resistant mutant subpopulations measured
in vitro.

97
4.2 INTRODUCTION
Opportunistic infections caused by P. aeruginosa are a major cause of
morbidity and mortality in nosocomial settings as well as in patients with significant
underlying disease (150). Such infections may occur at any anatomical site, but
frequently they are located in the respiratory and urinary tracts (125). The frequency
with which P. aeruginosa causes disease is reliably estimated from annual surveillance
data. P. aeruginosa was the second most common cause of nosocomial pneumonia
(14% of cases), the third most common cause of urinary tract infection (7%), the fourth
most common cause of surgical site infection (8%), the seventh most frequently isolated
pathogen from the bloodstream (2%) and the fifth most common isolate (9%) overall
from all sites (1, 50, 174, 178). Intrinsic resistance of P. aeruginosa to a wide variety of
antibiotics has made treatment of these infections difficult, often requiring combination
therapies and only a limited number of antibiotic agents retain reliable activity against
this patahogen, including aminoglycosides, anti-pseudomonal penicillins, carbapenems,
cephalosporins, and fluoroquinolones (124, 125, 127). Fluoroquinolones are among the
more useful agents because they possess good antibacterial activity, oral bioavailabity,
tissue penetration and sustainable drug concentrations (9, 28, 132, 364). However, in
some instances, clinical success has sometimes been only modest and failure is often
associated with the presence of resistant organisms (108, 228, 238, 280) .
Recent reports have documented declining susceptibility of ciprofloxacin and
other contemporary fluoroquinolones when tested by commercial or reference methods

98
against clinical isolates of P. aeruginosa (183). For example, among 404 P.
aeruginosa strains isolated in 2000, resistance rates were 20.5, 20.3 and 23.0% for
ciprofloxacin, levofloxacin and gatifloxacin, respectively, (183) and were higher than
those observed for ceftazidime, gentamicin, imipenem and piperacillin/tazobactam
(susceptibility range, 82.9-to-89.9%). Sahm et al (310) reported 21.6-to-24.9%
resistance to ciprofloxacin and levofloxacin, respectively, against isolates of P.
aeruginosa collected by two surveillance networks during 1999-to-2000. An
additional study reported a 10% decrease in fluoroquinolone susceptibility among
isolates of P. aeruginosa from 1994-to-2000 (259). Globally, fluoroquinolone
resistance rates to P. aeruginosa range from 12-to-75% (76, 339, 344), however,
because of a lack of effective alternative agents, fluoroquinolones remain first-line
agents for the treatment of severe pseudomonal infections (106, 124-127, 178, 262).
Therefore, retaining and protecting fluoroquinolone activity against P. aeruginosa
remains important.
Fluoroquinolone treatment of infection caused by P. aeruginosa may represent a
situation in which clinical resistance reflects activity mutant sub-populations. Two
commonly used compounds, ciprofloxacin and levofloxacin, are not readily
distinguished by traditional measures: ciprofloxacin has greater intrinsic activity and is
better able to block pathogen growth as indicated by a 2-fold lower MIC, while
levofloxacin is more lethal at equivalent concentrations and achieves higher
serum/tissue concentrations (225, 323). The debate over fluoroquinolone potency

99
against P. aeruginosa is exemplified in a recent report by Jones et al (177) who
documented the contemporary equality in fluoroquinolone activity against P.
aeruginosa based on overall rates of fluoroquinolone resistance (177). Conventional
wisdom suggests that differences in intrinsic activities, bacterial killing, and drug PK,
serve to normalize anti-pseudomonal activities of ciprofloxacin and levofloxacin,
however, several clinical observations suggest that preferential use of specific agents
may escalate the rate of quinolone-resistant P. aeruginosa (22, 283, 303).
Historically, ciprofloxacin has been the fluoroquinolone of choice for treating
pseudomonal infections because it has the highest intrinsic activity (36), but pricing
differences between ciprofloxacin and ofloxacin/levofloxacin prompted some hospital
centres to switch to ofloxacin and, subsequently levofloxacin for the treatment of
infections caused by P. aeruginosa. Peterson et al (283) discovered that a change from
ciprofloxacin to ofloxacin use correlated with a 20% increase in fluoroquinolone
resistance that was partially reversed when ciprofloxacin use was reinstated. Rifenberg
et al (303) investigated the influence of fluoroquinolone purchasing patterns on
antimicrobial expenditures and P. aeruginosa susceptibility. As part of this study, 109
hospitals were followed over a 4-year period. P. aeruginosa susceptibilities were
compared between hospitals that had ciprofloxacin or ofloxacin on their formularies and
did not change to another quinolone as compared to those institutions that switched
from ciprofloxacin to ofloxacin. A 5.4% decrease in overall fluoroquinolone
susceptibility correlated with a $300.00 (US dollars) increase in ofloxacin expenditure

100
per occupied bed. No associations were found between increased ciprofloxacin
expenditures and subsequent changes in P. aeruginosa susceptibility to quinolones
(303). A subsequent follow up study, which included data collected for levofloxacin,
confirmed a 5% increase in quinolone resistance which occurred for every $300 (US
dollars) increase in levofloxacin expenditure per occupied bed which was not observed
for ciprofloxacin (22). The question of whether a change in quinolone use could
influence class resistance was again raised by Pangrazzi et al (279) who observed
decreased activity of fluoroquinolones to P. aeruginosa (78% to70%) in one hospital
following an eight month conversion from ciprofloxacin to levofloxacin. While this
data suggests the switch to levofloxacin may have impacted P. aeruginosa susceptibility
to fluoroquinolones, this study is limited by the fact that observations occurred over a
relatively short time frame (8 months) and no statistical significance was identified.
Polk et al (289, 290) reported on trends in fluoroquinolone prescribing from 35 US
hospitals in relation to fluoroquinolone resistance in P. aeruginosa. Total
fluoroquinolone use remained stable over two years, however, levofloxacin use
increased significantly while ciprofloxacin use decreased slightly. Resistance of P.
aeruginosa to quinolones increased in 22 of the 35 hospitals and a significant positive
relationship between total fluoroquinolone use and resistance to P. aeruginosa was seen
(r=0.54, p=0.01). Mohr et al (243) studied the impact of antimicrobial usage on
susceptibility of P. aeruginosa over an eight year period at a community-based 700 bed
teaching hospital. The study period ranged from 1995-to-2002 and a statistically

101
significant correlation was seen between 4th generation cephalosporin (r2=0.782,
p=0.004) or levofloxacin use (r2=0.726, p=0.007) and the development of quinolone-
resistant P. aeruginosa. No such relationship existed for other antimicrobial agents
investigated which included ciprofloxacin, suggesting that the development of
fluoroquinolone resistance is associated with the use of individual agents rather than
overall antibiotic consumption.
These findings raise the question of whether differences in fluoroquinolone
resistance could be attributed to undefined microbiological properties of ciprofloxacin
and levofloxacin. The MPC is a measure of the selection potential for resistance for any
given fluoroquinolone-pathogen combination and is defined by the lowest antimicrobial
concentration required to inhibit the most resistant first-step resistant mutant present in
large, overall susceptible bacterial populations. Threshold conditions for restricting
mutant growth have been defined in vitro (86) and in mice (179), however, few clear
relationships have been established between clinical performance and in vitro, anti-
mutant activity. MPC results for ciprofloxacin and levofloxacin for clinical isolates of
P. aeruginosa were examined and compared in an attempt to identify possible
differences between the ability of the antimicrobial agents to prevent emergence of
antimicrobial resistance.

102
4.3 RESULTS 4.3.1 Effect of Fluoroquinolone Concentration on Mutant Recovery for Fluoroquinolone-Susceptible Clinical Isolates of P. aeruginosa. The recovery of colonies from 1010 CFU/ml cultures of fluoroquinolone-
susceptible clinical isolates of P. aeruginosa (n=6) tested against increasing
concentrations of ciprofloxacin or levofloxacin resulted in a two-stage decline in CFUs
(Figure 4.3.1). Low to moderate fluoroquinolone concentrations (< 0.5 μg/ml) produced
a gradual decline in CFUs of P. aeruginosa when tested against ciprofloxacin and
levofloxacin, respectively. The MPC measurement can be characterized as a
characteristic two-stage decline in CFUs when 1010 cells/ml were applied to agar plates
containing increasing concentrations of fluoroquinolones. The initial MIC, MPC, and
numbers of cells tested in each experiment are listed in Table 4.3.1. The first stage in
colony decline results from the decline of susceptible cells and occurred at
fluoroquinolone concentrations that approximated the MIC of the wild-type strains
(ciprofloxacin MIC = 0.21 μg/ml, levofloxacin MIC = 0.7 μg/ml). At fluoroquinolone
concentrations above the MIC of the wild-type strains, mutant growth could be
measured via a generalized plateau region in colony recovery. Increasing
fluoroquinolone concentrations resulted in a second decline in CFUs until a
concentration of ciprofloxacin and levofloxacin was reached which prevented the
growth of the most-resistant cell present in 1010 CFU/ml cultures. This concentration
defined the MPC for each fluoroquinolone and occurred at 3 and 9 μg/ml for
ciprofloxacin and levofloxacin, respectively. Comparison of the anti-mutant

103
Figure 4.3.1 Effect of Fluoroquinolone Concentration on Recovery of P. aeruginosa Colonies from Six Fluoroquinolone-Susceptible Isolates
Figure 5.3.1. Effect of fluoroquinolone concentration on recovery of P. aeruginosa colonies. Clinical isolates were applied to tTSA plates containing the indicated concentrations of ciprofloxacin (filled circle) or levofloxacin (open triangle). The
0 .5 3 .5 6 .5 9 .5
1 0 - 1 0
1 0 - 6
1 0 - 8
0 .0 1 0 .1 1 1 0 1 0 0
1 0 -6
1 0 -2
1 0 -4
1 0 -8
1 0 -1 0
1
Frac
tion
of in
put c
ells
reco
vere
d as
CFU
A
B
[Fluoroquinolone] mg/ml
Clinical isolates were applied to TSA plates containing the indicated concentrations of ciprofloxacin (filled circle) or levofloxacin (open triangle). The fraction of input cells recovered as mutants was determined after re-growth of colonies on drug-free agar followed by regrowth on agar containing the fluoroquinolone at the initial drug selection concentration. Each data point reflects the average decline in CFUs from six susceptible isolates of P. aeruginosa when 1010 cells/ml were tested aginst defined ciprofloxacin and levofloxacin concentrations. Panel A. Average values for seven susceptible clinical isolates (ciprofloxacin MIC = 0.21 μg/ml; levofloxacin MIC = 0.7 μg/ml). Panel B represents the recovery of resistant mutants as a linear function of fluoroquinolone concentration. Differences in mutant recovery between ciprofloxacin and levofloxacin were determined based on the area for which mutant selection occurred which is expressed in a ciprofloxacin:levofloxacin ratio of 1:1500. Error bars represent the standard deviation in the measurements for the six strains testd

104
Table 4.3.1 MIC and MPC Results for Clinical Isolates of P. aeruginosa Used in Mutant Selection Curves
a MIC results obtained using microbroth dilution method. bSusceptibility based on NCCLS guidelines for susceptible (S), intermediate (I), resistant (R) (258). Ciprofloxacin S, I, R = < 1, 2, > 4 μg/ml. Levofloxacin S, I, R = < 2, 4, > 8 μg/ml.
MICa measurement MPC measurement Ciprofloxacin Levofloxacin Ciprofloxacin Levofloxacin
Isolate Source
# of cells Tested (CFU)
MIC (μg/ml)
# of cells tested
MIC (μg/ml)
Susceptibility Resultb # of cells
Tested (CFU/0.3ml)
MPC (μg/ml)
# of cells tested
MPC (μg/ml)
PA – 25 Skin and Soft tissue
2.1 x10⁶ <0.125 2.1 x10⁶ 0.5 Susceptible 5.0 x 10¹⁰ 1.75 5.0 x 10¹⁰ 9
RV – 85431 Sputum 5.8 x 10⁵ 0.25 5.8 x 10⁵
1 Susceptible 4.4 x 10¹⁰ 3.25 4.4 x 10¹⁰ 12
RV – 77900 Abdominal fluid
8.0 x 10⁵ <0.125 8.0 x 10⁵ 0.5 Susceptible 4.8 x 10¹⁰ 2 4.8 x 10¹⁰ 8
Mt.S – 7 Urine 8.7 x10⁵ <0.125 8.7 x10⁵
0.5 Susceptible 4.6 x 10¹⁰ 2.5 4.6 x 10¹⁰ 8
OGH – 4 Skin and Soft tissue
1.1 x10⁶ <0.125 1.1 x10⁶ 0.5 Susceptible 4.1 x 10¹⁰ 1.125 4.1 x 10¹⁰ 4
St.C – 14344 Sputum 3.2 x 10⁵ 0.5 3.2 x 10⁵
1 Susceptible 2.1 x 10¹⁰ 2.5 2.1 x 10¹⁰ 11
Ave of 6 Susceptible Isolates
9.6 x 10⁵ 0.21 9.6 x 10⁵ 0.7 Susceptible 4.2 x 10¹⁰ 2.2 4.2 x 10¹⁰ 8.7
CBRH – 25138 Urine
1.0 x 10⁶ 2 1.0 x 10⁶
4 Intermediate 5.7 x 10¹⁰ 8 5.7 x 10¹⁰ 16

105
activities for ciprofloxacin and levofloxacin could be quantitatively assessed by
examining the numbers of mutants selected with respective ciprofloxacin and
levofloxacin MSWs. Thus, the frequency with which mutants are selected by each drug
could be quantitatively described in the relative area created during mutant selection.
Levofloxacin was 1500 times (a > 3 log difference in CFU) more efficient at selecting
mutant colonies of P. aeruginosa at comparable concentrations.

106
4.3.2 Effect of Fluoroquinolone Concentration on Mutant Recovery for a Clinical Isolate of P. aeruginosa
The effect of fluoroquinolone concentration of mutant recovery from a clinical
isolate (CBRH 25138) with intermediate susceptibility to ciprofloxacin (MIC=2 μg/ml)
and levofloxacin (MIC=4 μg/ml) was examined in reference to susceptible strains
(Figure 4.3.2). As expected, the recovery of CFU that occurred for a strain with
intermediate susceptibility resulted in a shift in the mutant selection curve toward higher
concentrations (ciprofloxacin MPC= 8 μg/ml, levofloxacin MPC =16 μg/ml). At
fluoroquinolone concentrations which approximated the MIC for ciprofloxacin (MIC= 2
μg/ml) and levofloxacin (MIC= 4 μg/ml), a sharp decline in colony recovery was seen
which occurred for approximately half of the cells present in the inoculums tested (i.e.,
105 CFU). In comparison with mutants recovered from susceptible strains, the plateau
in mutant recovery for a strain with intermediate fluoroquinolone susceptible occurred
over a broad concentration range for ciprofloxacin and levofloxacin, respectively.
Mutant growth was observed at ciprofloxacin concentrations encompassing 2-to-7
μg/ml. Thus, the plateau in colony recovery seen with ciprofloxacin concentrations was
shifted an average of 4-fold, in the direction of higher ciprofloxacin concentrations
when compared to colony recovery in susceptible strains. For levofloxacin, mutant
growth occurred over drug concentrations ranging from 3-to-15 μg/ml, which shifted
the mutant selection curve by an average of 3-fold in the direction of higher
levofloxacin concentrations. The MPC for ciprofloxacin and levofloxacin were

107
Figure 4.3.2 Effect of Fluoroquinolone Concentration on Mutant Recovery for Clinical Isolates of P. aeruginosa
Clinical isolates were applied to tTSA plates containing the indicated concentrations of ciprofloxacin (filled circle) or levofloxacin (open triangle). The fraction of input cells recovered as mutants were determined after re-growth of colonies on drug-free agar followed by regrowth on agar containing the fluoroquinolone at the initial drug selection concentration. Each data point reflects the average decline in CFUs from six susceptible isolates of P. aeruginosa when 1010 CFU/ml inoculums when tested against a defined ciprofloxacin or levofloxacin concentration Panel A. represents the recovery of colonies P. aeruginosa colonies from six fluoroquinolone susceptible isolates of P. aeruginosa. Panel B. represents colony recovery from a 1010 CFU/ml culture of P. aeruginosa (isolate CBRH 25138) with intermediate susceptibility, ciprofloxacin MIC=2 μg/ml; levofloxacin MIC=4 μg/ml). Arrows indicate drug concentrations from which colonies were examined for gyrA and parC QRDR resistance mutations. A gyrA mutation was observed only at the point indicated.
1 0 -6
1 0 -2
1 0 -4
1 0 -8
1 0 -1 0
1
0 . 0 1 0 .1 1 1 0 1 0 0
1 0 - 1 0
1 0 - 8
1 0 - 6
1 0 - 4
1 0 - 2
1
Frac
tion
of in
put c
ells
reco
vere
d as
cfu
A
B
g y rA T 8 3I
[Fluoroquinolone] μg/ml

108
measured at 3 and 8.5 μg/ml, respectively. Thus, the preferential ability of
ciprofloxacin to restrict mutant growth was also evident with an isolate having
intermediate susceptibility. Sequence analysis of 14 mutants (see arrows figure 4.3.2B)
revealed that QRDR mutants (dashed arrow gyrA T83I) were selected at a levofloxacin
concentration of 14 μg/ml (n=3 mutants). No QRDR mutants were recovered from
selected mutants (n=6) recovered from agar plates containing ciprofloxacin
concentrations.

109
4.3.3 Distribution of MIC and MPC Results for 155 Clinical Isolates of P. aeruginosa
To obtain a more general view of fluoroquinolone susceptibility, I measured
MIC and MPC values with 155 clinical isolates of P. aeruginosa using conventional
2-fold dilutional increments of ciprofloxacin and levofloxacin concentrations in agar
plates (Figure 4.3.3). By traditional susceptibility measures the compounds were
similar. MICs for ciprofloxacin ranged from 0.06-4 μg/ml, MIC50 and MIC90 values
were <0.125 and 1μg/ml, respectively. Based on NCCLS breakpoints (258), 95%, 3%
and 2% of the isolates, respectively, were susceptible, intermediate and resistant, to
ciprofloxacin. MICs for levofloxacin ranged from 0.125-8 μg/ml, MIC50 and MIC90
values were 0.5 and μg/ml, with 96%, 1% and 3% considered susceptible, intermediate
and resistant, respectively. MPC results for ciprofloxacin and levofloxacin were 4- to
32-fold higher than MIC results. As expected from data in Figure 4.3.1, the MPC for
ciprofloxacin was lower than for levofloxacin (Figure 4.3.3; modal values were 2 and 8
μg/ml, respectively; values of MPC90 were 4 μg/ml and 16 μg/ml, respectively). Thus,
the upper boundary of the mutant selection window (i.e., the MPC) was 4 times higher
for levofloxacin. Ciprofloxacin was 2- to 8-fold more active than levofloxacin as
determined by comparison of MPC results. The relative distributions of MPC results
were affected only slightly by restricting the analysis to highly susceptible isolates
(Figure 4.3.4) or in most cases by considering the anatomical site from which the
isolates were obtained (Figures 4.3.4C-E). Urinary tract isolates displayed a shift in the

110
Figure 4.3.3 MIC and MPC Distributions for 155 Clinical Isolates of P. aeruginosa Against Ciprofloxacin and Levofloxacin
Panel A. depicts MIC (shaded bars) and MPC results (open bars) for 155 clinical isolates of P. aeruginosa against ciprofloxacin. Modal MIC and MPC values for ciprofloxacin were 0.125 and 0.5 μg/ml, respectively. Ciprofloxacin MIC90 and MPC90 values were 0.5 and 2 μg/ml, respectively. Panel B. depicts MIC (open bars) and MPC results (filled bars) for 155 clinical isolates of P. aeruginosa against levofloxacin. Modal MIC and MPC values were 0.5 and 8 μg/ml, respectively, and MIC90 and MPC90 were 1 and 16 μg/ml, respectively.
0
20
40
60
80
100
120
<0.125 0.25 0.5 1 2 4 8 16 32 >64
0
10
20
30
40
50
60
70
80
90
100
<0.125 0.25 0.5 1 2 4 8 16 32 >64
Ciprofloxaicn
Levoflxoacin
A
B
MIC/MPC results (μg/ml)
Number of isolates tested

111
Figure 4.3.4 MPC results for 155 Clinical Isolates of P. aeruginosa Against Ciprofloxacin and Levofloxacin
0
2 0
4 0
6 0
8 00
20406080
100
0
1 0
2 0
3 0
4 0
0
4
8
1 2
1 6
2 0
0
1 0
2 0
3 0
4 0
0 .5 1 2 4 8 1 6 3 2 6 4
A
B
E
D
C
Num
ber o
f Iso
late
s
Distribution of MPC for clinical isolates of P. aeruginosa. Panel A. All isolates tested (n = 155). Panel B. Isolates having low values of MIC (≤ 0.5 μg/ml) to both ciprofloxacin and levofloxacin (n = 105). Panel C. Respiratory isolates (n = 55). Panel D. Skin and soft tissue isolates (n = 24), Panel E. Urinary tract isolates (n = 72). Four blood isolates are not shown. Similar results were obtained in a replicate experiment; solid bars indicate MPC for ciprofloxacin, open bars indicate levofloxacin. The modal MPC and MPC90 results for ciprofloxacin against respiratory, skin and soft tissue and urinary tract isolates of P. aeruginosa were 2 and 4 μg/ml, respectively; for levofloxacin these values were 8 and 16 μg/ml. The MPC distributions were largely unaffected by the source of isolation although a noticeable shift in the MPC distributions for urinary tract isolates was observed which is consistent with a history of ciprofloxacin use in UTIs.
MPC (μg/ml)

112
distribution to higher drug concentrations; however, the shift in MPC
distributions observed in the urinary subset of isolates did not change the overall
MPC90 distribution.

113
4.3.4 Effect of Individual MIC Results on Ciprofloxacin and Levofloxacin MPC Distributions
Analysis of highly susceptible isolates of P. aeruginosa (MIC = < 0.5 μg/ml)
had little effect on the distribution of MPC results relative to the total population tested.
I was interested in examining the effect of the initial degree of susceptibility (as
assessed by the MIC) on the MPC distributions for ciprofloxacin and levofloxacin
against clinical isolates of P. aeruginosa. Figure 4.3.5 shows the MPC distributions as
they related to initial MIC results. As expected, isolates with low MIC tended to
correlate with low MPC results. However, MIC results could not directly predict MPC
results in some isolates and different MPC results were observed with isolates with
identical MIC values. For example, 92/155 isolates of P. aeruginosa had a
ciprofloxacin MPC of 2 μg/ml. Of the 92 isolates, 71% (65/92), 14% (13/92), 12%
(11/92), and 3% (1/92), had ciprofloxacin MICs of < 0.125, 0.25, 0.5, and 1, μg/ml,
respectively.

114
Figure 4.3.5 Initial MIC Results and MPC Distributions for Ciprofloxacin and Levofloxacin for 155 Clinical Isolates of P. aeruginosa
0
10
20
30
40
50
60
70
<0.125 0.25 0.5 1 2 4 8 16 32
0
10
20
30
40
50
60
70
<0.125 0.25 0.5 1 2 4 8 16 32
Fluoroquinolone MIC (≅g/ml)<0.5 1 2 4 8 16 32 >64 = MPC result
Num
ber o
f Iso
late
s
The number of isolates with corresponding MIC results to ciprofloxacin (panel A.) and levofloxacin (panel B.) are shown. The effect of MIC results on fluoroquinolone MPC distributions are depicted in shaded bars (see legend)
A
B
Fluoroquinolone MIC (μg/ml)

115
4.3.5 Relationship Between MPC Results and Susceptibility Breakpoints
MPC values can also be related to susceptibility breakpoints, which serve as
empirical thresholds below which clinical success is expected to occur. NCCLS
breakpoints for ciprofloxacin and levofloxacin were applied to MPC results for the 155
clinical isolates of P. aeruginosa (Figure 4.3.6). Breakpoints were determined based on
NCCLS guidelines for ciprofloxacin and levofloxacin against P. aeruginosa (258).
Briefly, results are reported as susceptible (S), intermediate (I), or resistant (R)
(ciprofloxacin S, I, R = < 1, 2, > 4μg/ml and levofloxacin S, I, R = < 2, 4, > 8 μg/ml).
Based on MIC results, both ciprofloxacin and levofloxacin had comparable
susceptibility against clinical isolates of P. aeruginosa. For ciprofloxacin, the
percentage of isolates conferring an S, I and R phenotype were 95%, 3% and 2%,
respectively. For levofloxacin 96%, 1% and 3% of the isolates were classified as S, R,
or I based on MIC results. Comparison of MPC results to NCCLS breakpoints for
resistance revealed that 36% and 67% of the isolates tested against ciprofloxacin and
levofloxacin would now be considered resistant. This finding suggests that neither
antimicrobial agent would be appropriate for use as monotherapy in the treatment of P.
aeruginosa. Based on MPC results, the percentage of isolates with an S, I, or R
phenotype were 5%, 59% and 36% for ciprofloxacin and 3%, 30% and 67% for
levofloxacin.

116
Figure 4.3.6 Relationship of MIC and MPC Results to NCCLS Susceptibility Breakpoints with P. aeruginosa
95
3 2
96
1 3
5
59
36
3
30
67
A
B
C
D
MPC Results
NCCLS breakpoints for resistance were applied to 155 clinical isolates of P. aeruingosa based on MIC and MPC results. Results are reported in percentage of total isolates. Susceptible (open areas), intermediate (shaded areas) or resistant (filled areas). Figures A and B illustrate MIC distributions for ciprofloxacin and levofloxacin, respectively. C and D illustrate MPC results for ciprofloxacin and levofloxacin, respectively.
MIC Results
Ciprofloxaicn
Levofloxacin Levofloxacin
Ciprofloxaicn

117
4.3.6 Characterization of First-Step Mutants
4.3.6.1 Phenotypic Demonstration of Resistance in Recovered Mutants I screened 204 mutants recovered from ciprofloxacin and levofloxacin
containing plates using standardized microbroth dilution methods in order to examine
the stability and susceptibility of recovered mutant colonies. The MICs of selected
mutants were recorded as “MICrecovered “ values and compared to the MIC of the parental
strains (Table 4.3.2). For ciprofloxacin, the modal MIC of the original susceptible
population was < 0.125 μg/ml, and the MIC90 was 0.5 μg/ml. Of the original parental
population, 90% (139/155) were inhibited by ciprofloxacin concentrations of < 0.5
μg/ml. The modal MICrecovered and MIC90 recovered results for ciprofloxacin were 2 and 4
μg/ml, respectively, which represented an 8-fold decrease in ciprofloxacin susceptibility
relative to parental isolates. Of the recovered mutant population, only 3% (5/204) were
inhibited by ciprofloxacin concentrations < 0.5 μg/ml, compared to the MIC for 90% of
the parental isolates. The levofloxacin modal MIC and MIC90 values for parental
isolates of P. aeruginosa were 0.5 and 1 μg/ml, respectively, and 92% (142/155) of the
parental isolates were inhibited by levofloxacin concentrations of < 1 μg/ml. In
comparison, the modal levofloxacin MICrecovered and MIC90 recovered values for recovered
mutant colonies were 4 and 16 μg/ml, and 3% (5/155) of the recovered mutants were
inhibited by a levofloxacin concentration of < 1 μg/ml. MIC90 recovered results for mutant
colonies possessed stable phenotypes, which were in 90% agreement with the MPC of
the parental isolates. Overall, 81% (165/204) of the recovered mutants demonstrated a

118
Table 4.3.2 MIC and MICrecovered Results for Selected Mutants and Parental Strains of P. aeruginosa
FQ Fluoroquinolone Susceptibility (μg/ml) summarized by MIC or MPC distributions Susceptibility Result (μg/ml) <0.125 0.25 0.5 1 2 4 8 16 32 >64
MIC50 (μg/ml)
MIC90 (μg/ml)
MPC50 (μg/ml)
MPC90 (μg/ml)
MIC (parental strains)(n=155)
95 (61%)
20 (74%)
23 (90%)
9 (95%)
4 (98%)
3 (100%)
<0.125 0.5 --- ---
MIC (Recovered) (n=204)
1 (0.5%)
5 (3%)
18 (12%)
89 (55%)
72 (91%)
6 (94%)
5 (96%)
5 (99%)
3 (100%)
2 4 ---- ----
MIC –CCCP (n=65)
2 (3%)
4 (9%)
25 (23%)
20 (75%)
13 (95%)
1 (97%)
1 (99%)
1 (100%)
4 8 ---- ----
MIC +CCCP (n=65)
2 (3%)
7 (14%)
30 (60%)
16 (85%)
8 (97%)
1 (99%)
0 1 (100%)
2 8 ---- ----
Cipro
MPC (n=155)
3 (3%)
5 (5%)
92 (65%)
43 (92%)
6 (96%)
2 (97%)
4 (100%)
2 4
MIC (parental strain) (n=155)
7 (5%)
24 (20%)
91 (79%)
20 (92%)
6 (96%)
2 (97%)
2 (99%)
3 (100%)
0.5 1 8 16
MIC (Recovered) (n=204)
1 (0.5%)
4 (3%)
9 (7%)
63 (38%)
106 (90%)
6 (93%)
9 (97%)
6 (100%)
8 16 ---- ----
MIC –CCCP (n= 64)
1 (0.5%)
3 (6%)
4 (13%)
33 (64%)
20 (95%)
2 (99%)
1 (100%)
8 16 ---- ----
MIC +CCCP (n= 64)
1 (0.5%)
3 (6%)
10 (22%)
30 (69%)
19 (98%)
0 1 (100%)
8 16 ---- ----
Levo
MPC (n=155)
5 (3%)
47 (34%)
84 (88%)
13 (96%)
4 (97%)
1 (100%)
8 16
FQ= fluoroquinolone; Cipro = ciprofloxacin, Levo = levofloxacin. MIC results for the paretnal populations and recovered mutants were analyzed. Recovered mutants demonstrated elevated MIC results with respect to the parental organisms when re-tested by conventional microbroth dilution. MICrecovered results were in 90% agreement with previously measeured MPC results. A 50 mM amount of CCCP was added to the wells of microtitre tray containing increasing concentrations of ciprofloxacin and levofloxacin. The distributions of MIC results are shown.
119
> 2-fold change in the MIC to either ciprofloxacin or levofloxacin when tested by the
conventional microbroth dilution.
The addition of a 50 mM solution of CCCP, to the wells of the susceptibility panels
has been documented as a method for implicating possible efflux mechanisms which
contribute to fluoroquinolone resistance by inhibting proton motive force (287, 365).
Generally, a > 2-fold change in the MIC upon the addition of CCCP to the wells of the
microtitre tray is required to implicate the possible involvement of efflux as contributing of
fluoroquinolone resistance (365). By this system, active efflux dose not appear to be a
major mechanism of fluoroquinolone resistance in recovered mutants (Table 4.3.2). For
ciprofloxacin, 9% (6/65) of the recovered mutants demonstrated a > 2-fold change in the
MIC when CCCP was added. For levofloxacin, 11% (7/64) of the recovered mutant
population demonstrated a > 2-fold change in the MIC when CCCP was added to wells
containing levofloxacin drug concentrations. Recovered mutants were tested for altered
susceptibility patterns relative to parental organism by a semi-automated laboratory
identification system know as Vitek. No differences between the ciprofloxacin and
levofloxacin susceptibilities for parental organisms and recovered colonies were seen (data
not shown).
120
4.3.6.2 DNA Sequence Analysis of gyrA and parC Targets in Recovered Mutants of P. aeruginosa Some of the isolates required high fluoroquinolone concentrations (> 8 μg/ml) to
prevent colony formation. Analysis of the MIC results for the recovered mutants
confirmed elevated susceptibility patterns with respect to parental organism in the
presence of fluoroquinolones and CCCP. Thus, I suspected that these some of these
organisms contained mutations in the target genes, gyrA (DNA gyrase) and/or parC
(topoisomerase IV). To test this idea, I sequenced a 484 base-pair region of the gyrA
gene and a 424 base-pair region of the parC which included the QRDR of each gene (see
Materials and Methods). Twenty-five different mutants, from 11 different isolates were
analyzed along with the original parental colony and mutations were reported in reference
to target sequences in the parental isolate (Table 4.3.3). Low concentrations of
fluoroquinolones selected only non-GyrA mutants; at slightly higher concentrations,
distinct gyrA and parC variants were obtained. A number of mutations which have not
been associated with quinolone resistance (non-characterized mutations) were identified
in mutant colonies. To my knowledge, genetic studies have not been preformed that
attribute resistance to these alleles, but they represent mutations which are not seen in
parental organisms, consequently, I did not exclude these mutations from my analysis.
Five mutants (isolate numbers 13, 27, 77, 105, and 126) contained a gyrA mutation
(T83I) known from genetic studies to confer resistance (4). A number of
uncharacterized silent mutations were identified which were not present in the sequences

121
Table 4.3.3 Sequence Analysis of GyraseA and TopoisomeraseIV Target Genes of Recovered Mutants of P. aeruginosa
Wild type MIC (μg/ml)
MPC (μg/ml)
QRDR Amino Acid Sequence Isolate (source)
Cipro Levo Cipro Levo gyrA parC 13 (LEVO-8μg/ml)
0.5 2 2 16 T83I ACC to ATC) H132H (CAC to CAT)
N27N (AAT to AAC) A115A (GCT to GCG)
27 (LEVO-4μg/ml)
1 2 8 16 Wild type Wild type
27 (LEVO-5μg/ml)
1 2 8 16 Wild type Wild type
27 (LEVO-7μg/ml)
1 2 8 16 Wild type Wild type
27 (LEVO-10-a μg/ml)
1 2 8 16 Wild type Wild type
27 (LEVO-10-b μg/ml)
1 2 8 16 T83I ACC to ATC) A84A (GCG to GCA)
Wild type
27 (LEVO-12 μg/ml)
1 2 8 16 T83I ACC to ATC) A84A (GCG to GCA)
Wild type
27 (LEVO-16 μg/ml)
1 2 8 16 T83I ACC to ATC) A84A (GCG to GCA)
Wild type
27 (CIPRO -2 μg/ml)
1 2 8 16 Wild type Wild type
27 (CIPRO –3.μg/ml)
1 2 8 16 Wild type Wild type
27 (CIPRO –3.5 μg/ml)
1 2 8 16 Wild type Wild type
40 (LEVO-16μg/ml <0.125 1 8 32 H132H (CAC to CAT) N27N (AAT to AAC)
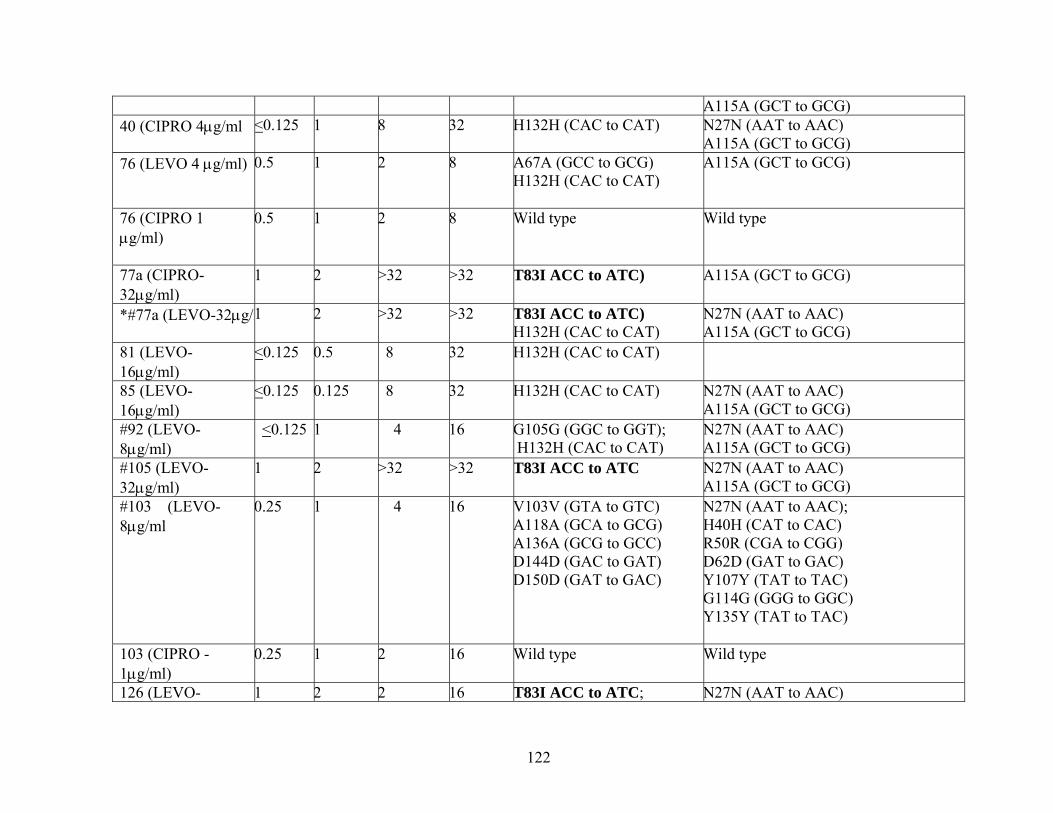
122
A115A (GCT to GCG) 40 (CIPRO 4μg/ml <0.125 1 8 32 H132H (CAC to CAT) N27N (AAT to AAC)
A115A (GCT to GCG) 76 (LEVO 4 μg/ml)
0.5 1 2 8 A67A (GCC to GCG) H132H (CAC to CAT)
A115A (GCT to GCG)
76 (CIPRO 1 μg/ml)
0.5 1 2 8 Wild type Wild type
77a (CIPRO-32μg/ml)
1 2 >32 >32 T83I ACC to ATC) A115A (GCT to GCG)
*#77a (LEVO-32μg/m
1 2 >32 >32 T83I ACC to ATC) H132H (CAC to CAT)
N27N (AAT to AAC) A115A (GCT to GCG)
81 (LEVO-16μg/ml)
<0.125 0.5 8 32 H132H (CAC to CAT)
85 (LEVO-16μg/ml)
<0.125 0.125 8 32 H132H (CAC to CAT) N27N (AAT to AAC) A115A (GCT to GCG)
#92 (LEVO-8μg/ml)
<0.125 1 4 16 G105G (GGC to GGT); H132H (CAC to CAT)
N27N (AAT to AAC) A115A (GCT to GCG)
#105 (LEVO-32μg/ml)
1 2 >32 >32 T83I ACC to ATC N27N (AAT to AAC) A115A (GCT to GCG)
#103 (LEVO-8μg/ml
0.25 1 4 16 V103V (GTA to GTC) A118A (GCA to GCG) A136A (GCG to GCC) D144D (GAC to GAT) D150D (GAT to GAC)
N27N (AAT to AAC); H40H (CAT to CAC) R50R (CGA to CGG) D62D (GAT to GAC) Y107Y (TAT to TAC) G114G (GGG to GGC) Y135Y (TAT to TAC)
103 (CIPRO - 1μg/ml)
0.25 1 2 16 Wild type Wild type
126 (LEVO- 1 2 2 16 T83I ACC to ATC; N27N (AAT to AAC)

123
8μg/ml)
A115A (GCT to GCG)
126 (CIPRO-1μg/ml)
1 2 2 16 H132H (CAC to CAT) N27N (AAT to AAC) A115A (GCT to GCG)
Nucleotide sequences were determined for the QRDRs of P. aeruginosa gyrA and parC genes (3, 195) using PCR and automated DNA sequencing. a Cipro = ciprofloxacin; Levo =levofloxacin. b QRDR, quinolone-resistance-determining region. Amino acid in wild-type protein is indicated before its number in the protein, followed by the amino acid change. A, alanine; D, aspartic acid; H, histadine; G, glycine; I, Isoleucine; N, asparagine; R, arginine; T, threonine Y, tyrosine; V, valine. All mutations are reported in reference to changes from the orginal parental sequence.
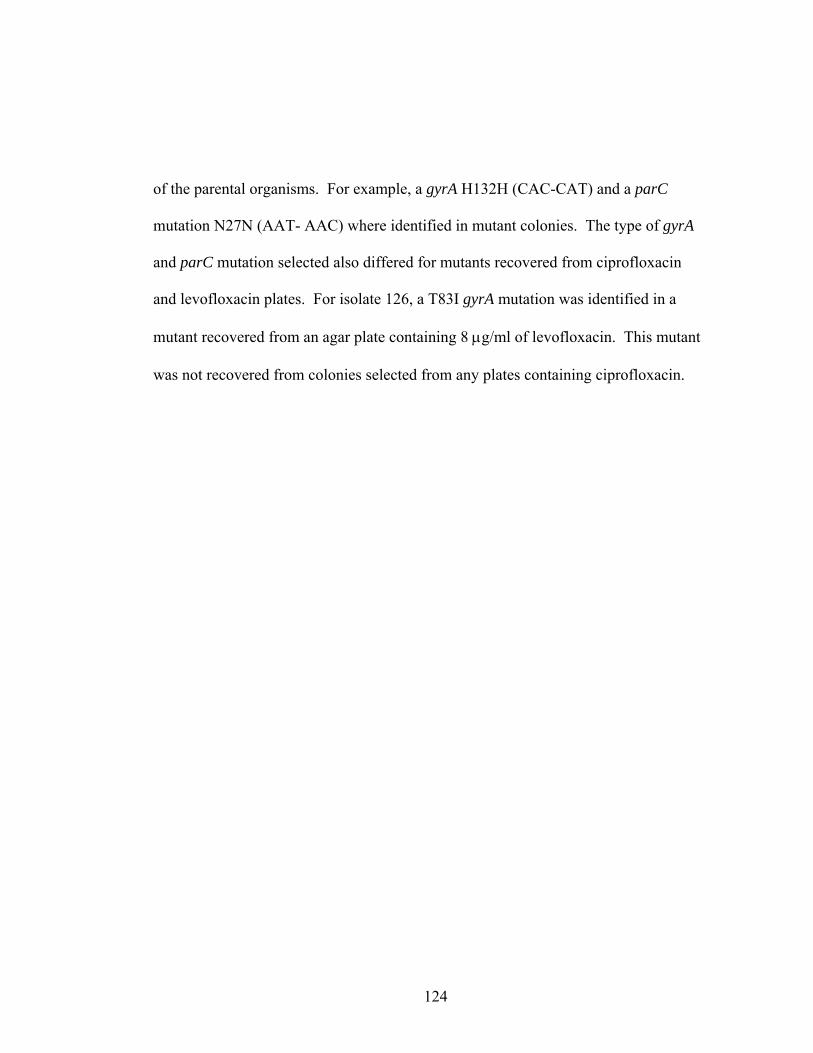
124
of the parental organisms. For example, a gyrA H132H (CAC-CAT) and a parC
mutation N27N (AAT- AAC) where identified in mutant colonies. The type of gyrA
and parC mutation selected also differed for mutants recovered from ciprofloxacin
and levofloxacin plates. For isolate 126, a T83I gyrA mutation was identified in a
mutant recovered from an agar plate containing 8 μg/ml of levofloxacin. This mutant
was not recovered from colonies selected from any plates containing ciprofloxacin.

125
4.3.6.3 PFGE Analysis of Recovered Mutants of P. aeruginosa MIC testing confirmed the presence of stable phenotypes in mutant colonies
and DNA sequence analysis of the QRDR for the gyrA and parC genes revealed target
mutations. I used PFGE to test the hypothesis that mutant colonies represented
different clones of P. aeruginosa compared to parental isolates. PFGE DNA banding
patterns for 4 mutants recovered from agar plates containing levofloxacin
concentrations were examined and compared to the PFGE fingerprint of the parental
isolates. For all mutants tested, no differences in the PFGE pattern were observed
between mutant and parental colonies selected from 1010 CFU/ml cultures of P.
aeruginosa (Figure 4.3.7).

126
Figure 4.3.7 PFGE Analysis of Recovered Mutants of P. aeruginosa
MWM 1 2 3 4 MWM 5 6 7 8
Lane # Recovered mutant MIC (μg/ml) MPC (μg/ml ) Cpx Lfx Cpx Lfx (MWM) = 123 base pair molecular weight marker 1 = PA- CMH 32 (parental strain) levo-4 μg/ml 1 2 4 8 2 = PA- CMH 32 (recovered mutant) 3 = PA-OGH 22 (parental strain) levo-16 μg/ml 4 8 32 >32 4= PA- OGH 22 (recovered mutant) 5= PA- HMR 24 (parental strain) levo-4 μg/ml 1 4 2 8 6= PA- HMR 22 (recovered mutant) 7= PA –OGH 17 (parental strain) levo-16 μg/ml 2 4 8 32 8= PA- OGH 17 (recovered mutant)
PFGE was preformed on four clinical strains of P. aeruginosa. Cpx = ciprofloxacin. Lfx = levofloxacin.

127
4.3.7 Enrichment of Mutant Subpopulations from nalB, nfxB, nfxC, and oprD Mutants of P. aeruginosa
Some of the recovered mutants demonstrated elevated susceptibility in the
absence of alterations in sequenced regions of the gyrA and parC genes. Phenotypic
analysis of mutants recoved at low and moderate fluoroquinolone concentrations using
mutant selection curves suggest that the nature of the low-concentration mutant slection
may be efflux mediated. Why the non-gyrase mutants were so abundant has not been
established. I examined the possibility that differences in mutant selection between
ciprofloxacin and levofloxacin may be partially attributed to the ability to inhibit cells
containing efflux mechanisms. Mutant selection curves were performed on nalB, nfxB,
nfxC, and oprD efflux mutants of P. aeruginosa (Figure 4.3.8). For each strain tested, a
two-stage decline in growth was observed. The first stage in colony decline occurred at
fluoroquinolone concentrations that approximated the ciprofloxacin and levofloxacin
MIC, and resulted in the inhibition of growth of approximately 105 cells (see arrows,
Figure 4.3.8). At concentrations above the ciprofloxacin and levofloxacin MIC of the
strain tested, growth of mutants occurred. Eventually, a concentration which inhibited
the most-resistant mutant present in 1010 CFU/ml populations was obtained, defining the
MPC for the fluoroquinolones tested. For the nalB mutant (MexAB-OprM), the MPC
for ciprofloxacin and levofloxacin was 1.125 and 3.5 μg/ml,

128
Figure 4.3.8 Effect of Fluoroquinolone Drug Concentration on Colony Recovery from nalB, nfxB ,nfxC, and oprD efflux Mutants of P. aeruginosa
1 0 - 1 0
1 0 - 8
1 0 - 6
1 0 - 4
1 0 - 2
1
1 0 - 2
1 0 - 4
1 0 - 6
1 0 - 8
1 0 - 1 0
1
1 0 - 2
1 0 - 4
1 0 - 6
1 0 - 8
1 0 - 1 0
1
1 0 - 2
1 0 - 4
1 0 - 6
1 0 - 8
1 0 - 1 0
1
1 0 - 2
1 0 - 4
1 0 - 6
1 0 - 8
1 0 - 1 0
1
0 . 0 1 0 . 1 1 1 0 1 0 0
1 0 - 1 0
1 0 - 8
1 0 - 6
1 0 - 4
1 0 - 2
1Frac
tion
of in
put c
ells
reco
vere
d (C
FU)
[Fluoroquinolone] μg/ml
PAO1
K372
nalB
nfxB
nfxC
oprD
P. aeruginosa cultures containing 1010 CFU/ml were applied to agar plates containing increasing concentrations of fluoroquinolones. PAO1 isogenic strain for the nalB, nfxB and oprD efflux mutants. K372 isogenic strain for the nfxC mutant. NalB (MexAB-OprM) efflux mutant. NfxB (MexCD-OprN) efflux mutant. NfxC (MexEF-OprJ) efflux mutant. OprD efflux mutant. Ciprofloxacin is represented by filled circles; levofloxacin is represented by open triangles. Arrows represent the MIC for each strain tested.
F
E
C
D
B
A

129
respectively, which represents a 2- to 3-fold decrease in susceptibility relative to the
MIC of the wild type strain (ciprofloxacin MIC= 0.25 μg/ml, levofloxacin MIC = 0.75
μg/ml) (Table 4.3.4). Based on the MPC result, ciprofloxacin was 3.1-fold more active
against mutants selected from 1010 CFU/ml cultures of a nalB mutant of P. aeruginosa.
Differences between the numbers of mutants selected by ciprofloxacin and levofloxacin,
above the MIC of the wild-type strain, were not remarkable. However, the
concentrations of levofloxacin required to inhibit mutant colonies were 2-to 4.5-fold
higher than for ciprofloxacin, resulting in a higher levofloxacin MPC, and a lower
AUC/MPC ratio (levofloxacin AUC/MPC = 23, ciprofloxacin AUC/MPC = 35)
The highest fluoroquinolone MPCs were measured against the nfxB mutant
(MexCD-OprJ) which corresponded to ciprofloxacin and levofloxacin MPCs of 2.5 and
9 μg/ml, respectively, and represented a 5- to 4-fold decrease in susceptibility to
ciprofloxacin and levofloxacin relative to the MIC of the parental strain (ciprofloxacin
MIC = 0.5 μg/ml, levofloxacin MIC = 2.25 μg/ml) (Table 4.3.4). AUC/MPC values of
ciprofloxacin and levofloxacin for an nfxB mutant were the lowest among all the efflux
mutants tested and corresponded to a ciprofloxacin value of 18 and levofloxacin value
of 9. Analysis of mutant selection, based on the MSW, for ciprofloxacin and
levofloxacin revealed that levofloxacin selected 12.6 times the number of mutant

130
Table 4.3.4 MIC and MPC Results for nalB, nfxB, nfxC and oprD Efflux Mutants of P. aeruginosa
Strain Fluoroquinolone MIC
(μg/ml)
MPC
(μg/ml)
Change in Susceptibility (fold increase)
AUC/MPC
Ciprofloxacin 0.25 1.125 4.5 35
nalB Levofloxacin 0.75 3.5 4.6 23
Ciprofloxacin 0.5 2.5 5 18
nfxB Levofloxacin 2.25 9 4 9
Ciprofloxacin 0.4 2 5 22
nfxC Levofloxacin 1.75 6 3.4 14
Ciprofloxacin 0.5 1.125 2.25 35
oprD Levofloxacin 1.25 2.5 2 47
Ciprofloxacin 0.125 0.75 6 59 PAO1a
Levofloxacin 0.75 3.125 4.2 26
Ciprofloxacin 0.175 1 5.7 44 K372b
Levofloxacin 0.75 3 4 27
aPAO1 is the isogenic strain for the nalB, nfxB, and oprD mutants bK372 is the isogenic strain for the nfxC mutant

131
colonies when compared to selction of mutants with ciprofloxacin drug concentrations.
Fluoroquinolone concentrations at which mutant selection occurred were 3.6- to 5-fold
higher for levofloxacin. Thus, levofloxacin continued to select mutants over a resistant
breakpoint for the drug. In contrast, mutants selected by ciprofloxacin concentrations
were below the breakpoint for resistance. Comparisons between the nfxB mutant and
the isogenic strain (PAO1), revealed no differences in the frequency of mutant selection.
Comparison of MPC results revealed a 3-fold increase between the nfxB mutant and the
respective isogenic strain. Ciprofloxacin and levofloxacin MPC results for the nfxC
mutant (MexEF-OprN), were 2 and 6 μg/ml, respectively. MexEF-OprN efflux
expression caused a 5- and 3.4-fold decrease in the susceptibility to ciprofloxacin and
levofloxacin. A fourth efflux mutant, oprD, which confers resistance to carbapenem
antibiotics via reductions in porin channels, resulted in small changes to fluoroquinolone
susceptibility when MIC and MPC results were compared (2.2-fold difference for
ciprofloxacin, 1.8-fold difference for levofloxacin). The MPC results for ciprofloxacin
and levofloxacin were 1.25 and 3.125 μg/ml, respectively (Table 4.3.4).
Selection of first-step resistant mutants from isolates of P. aeruginosa
expressing efflux mechanisms resulted in higher ciprofloxacin and levofloxacin MPC
results when compared to the MPC of the respective isogenic strains. Two mutants
which overexpressed the MexCD-OprJ (nfxB) and MexEF-OprN (nfxC) operons
resulted in high MPC values which were above the breakpoints for resistance for
132
ciprofloxacin and levofloxacin, respectively. Sequence analysis for regions of the gyrA
and parC genes in selected mutants have not been performed, but selection of resistant
mutants which co-express efflux plus target mutations are likely to have high MPCs.
Ciprofloxaicn had lower MPCs than levofloxacin against strains of P. aeruginosa which
express drug efflux systems, suggesting that the ability to restrict the selection of
fluoroquinolone-resistant mutants may be linked to the ability to inhibit efflux
expression in clinical isolates of P. aeruginosa.
133
4.3.8 Bacterial Killing and MPCs for Clinical Isolates of P. aeruginosa Like other susceptibility measurements, the MPC is not reflective of bacterial
killing and the time that fluoroquinolones are required to exceed the MPC during dosing
is a factor which is currently unknown. It is expected that first-step mutants selected at
sub-MPC drug concentrations may be selectively amplified under dosing which allows
drug concentrations to fluctuate within the MSW. I examined the effect of the MPC
drug concentration on the killing of 1010 CFU/ml cultures of P. aeruginosa and the
killing/enrichment of mutant populations. Killing experiments for P. aeruginosa were
preformed as outline in Materials and Methods. Briefly, the contents of 1010 CFU/ml
cultures were evenly divided among two 500 ml flasks containing the specified MPC or
MIC drug concentrations. Mutant growth was assessed via growth on agar plates
containing concentrations of ciprofloxacin and levofloxacin that were an average of 4-
fold above the MICs of the wild-type strains. Experiments were preformed in duplicate
and conducted over 24 hr. The rates of killing at the MIC and MPC drug concentrations
for two strains of P. aeruginosa (CBRH- 25138 and PA-25) are shown in Figures 4.3.9
and 4.3.10. For each experiment the detection limit was +1.00 log growth. The MPC
for ciprofloxacin and levofloxacin against P. aeruginosa isolates CBRH 25138 and PA-
25 were 4 and 16, and 2 and 4 μg/ml, respectively. Figure 4.3.9 and Table 4.3.5 depict
results obtained for the P. aeruginosa strain CBRH-25138. At the MIC, -1.32 and -1.33

134
Figure 4.3.9 Killing of P. aeruginosa CBRH 25138 by Ciprofloxacin and Levofloxacin at the MIC and MPC
1 0 - 6
1 0 - 4
1 0 - 2
1
1 0 - 8
1 0 - 8
1 0 - 6
1 0 - 4
1 0 - 2
1
0 2 4 6 8 1 0 1 2 1 4 1 6 1 8 2 0 2 2 2 4
1 0 - 8
1 0 - 6
1 0 - 4
1 0 - 2
1
Log
grow
th/re
duct
ion
(CFU
/ml)
A
B
C
D
1 0 - 8
1 0 - 6
1 0 - 4
1 0 - 2
1
Time (h) The killing of P. aeruginosa CBRH-25138 at the MIC and MPC are represented in panels A and B. The killing of mutants at the MIC and MPC drug concentrations are represented in panels C and D. Open triangles represent the growth/reduction in viablility for levofloxacin-treated cultures. Filled circles represent the growth/reduction in viablility for ciprofloxacn-treated cultures.

135
Figure 4.3.10 Killing of P. aeruginosa PA-25 by Ciprofloxacin and Levofloxacin at the MIC and MPC
The killing of P. aeruginosa PA-25 at the MIC and MPC are represented in panels A and B. The killing of mutants at the MIC and MPC are represented in panels C and D. Open triangles represent the growth/reduction in viablility for levofloxacin-treated cultures. Filled circles represent the growth/reduction in viablility for ciprofloxacin-treated cultures.
1 0 - 8
1 0 - 6
1 0 - 4
1 0 - 2
1
Log
grow
th/re
duct
ion
(CFU
/ml)
A
B
C
D
0 2 4 6 8 1 0 1 2 1 4 1 6 1 8 2 0 2 2 2 4
1 0 - 2
1 0 - 4
1 0 - 6
1 0 - 8
1
1 0 - 8
1 0 - 6
1 0 - 4
1 0 - 2
1
1 0 - 2
1 0 - 4
1 0 - 6
1 0 - 8
1
Time (h)

136
Table 4.3.5 Killing of P. aeruginosa CBRH 25138 by Ciprofloxacin and Levofloxacin at the MIC and MPC
Original Strain
Killing at the MIC (μg/ml)
Fluoroquinolone Time (h) Original broth concentration (CFU/ml)
Log Reduction/growth of entire culture (CFU/ml)
Log Reduction/ growth of mutant growth (CFU/ml)
CBRH 25138 MPCcipro =2 MPClevo =4
Ciprofloxacin Levofloxacin
0 3.06 x10⁷
1.53 x10⁷ ------- a
----------- b +1.01 c
+1.58 d
Ciprofloxacin Levofloxacin
4 1.45 x10⁶
7.23 x10⁵ -1.32 -1.33
+1.18 +1.15
Ciprofloxacin Levofloxacin
8 3.56 x10⁵
1.78 x10⁵ -1.93 -1.93
+2.29 +2.93
Ciprofloxacin Levofloxacin
12 4.2 x10⁵
2.1 x10⁵ -1.86 -1.87
+3.75 +4.22
Ciprofloxacin Levofloxacin
18 4.44 x10⁵
2.22 x10⁶ -1.84 -1.83
+>6.00 +>6.00
Ciprofloxacin Levofloxacin
24 4.58 x10⁶
2.29 x10⁶ -0.82 -0.83
+>6.00 +>6.00
Original Strain
Killing at the MPC (μg/ml)
Fluoroquinolone Time (h) Original broth concentration (CFU/ml)
Log Reduction/growth of entire culture (CFU/ml)
Log Reduction/ growth of mutant growth (CFU/ml)
CBRH 25138 MPCcipro =8 MPClevo =16
Ciprofloxacin Levofloxacin
0 3.41 x10⁷
3.41 x10⁷ ------- e
----------- f +1.00 c
+1.40 d
Ciprofloxacin Levofloxacin
4 1.76 x10⁵
1.37 x10⁵ -2.28 -2.40
+1.00 +1.00
Ciprofloxacin Levofloxacin
8 2.71 x10⁴
4.12 x10³ -3.10 -3.92
+1.00 +1.00
Ciprofloxacin Levofloxacin
12 1.68 x10⁴
9.25x10² -3.31 -4.57
+1.00 +1.00
Ciprofloxacin Levofloxacin
18 1.20 x10³
1.58 x10² -4.45 -5.33
+1.00 +1.00
Ciprofloxacin Levofloxacin
24 3.02 x10²
4.00 x101 -5.05 -5.93
+1.00 +1.00
Maximum log reduction; a-7.49, b- 7.18. e-7.53, f-7.53. Maximum log growth; c+ >6.0, d+ >6.0.

137
log reductions in growth were measured for the strain CBRH 25138 for ciprofloxacin
and levofloxacin by 4 hr. Maximum killing for both ciprofloxacin and levofloxacin
occurred by 8 hr. Neither ciprofloxacin nor levofloxacin treated cultures achieved >3
log reductions in viable cells at any time tested at the MIC drug concentration. By 24
hr, a -0.82 and -0.83 log reduction in viable counts were observed for ciprofloxacn and
levofloxacin, respectively. As expected, an increase in killing occurred when the MPC
drug concentration was tested. By 4 hr, a -2.28 and -2.4 log reduction in growth was
observed for ciprofloxacin and levofloxacin. Significant killing, as assessed by > -3.0-
log reduction, was measured at 8 hr and corresponded to -3.10 and -3.90 log reductions
in growth for ciprofloxacin and levofloxacin, respectively. Maximal killing was
observed by 24 hr which resulted in -5.05 and -5.93 log reduction in viable cells when
ciprofloxacn and levofloxacin were tested.
For the P. aeruginosa strain CBRH-25138, mutant growth was determined via
conoly formation on agar plates containing 4 and 8 μg/ml of ciprofloxaicn and
levofloxacin, respectively. At time 0 hr, mutatnt colonies were detected in three of four
cultures tested and demonstrated that mutant growth was present prior to introduction of
a fluoroquinolone. Mutant colonies were recovered from both ciprofloxaicn and
levofloxacin-treated cultures at every time interval tested. By 8 hr, a 2.29 and 2.93 log
increase in mutant growth was observed, and by 18 hr, mutant growth reached the
detection limit (> +6.00 log) of the assay. At the MPC drug concentration, mutant

138
growth was initially detected at time 0 hr in 3 of 4 culutres. However, no mutants were
recovered at time points beyond 2 hr for either ciprofoxaicn or levofloxacin treated
cultures (Figure 4.3.9).
For the P. aeruginosa strain PA-25 (Figure 4.3.10), killing by 24 hr at the MIC
drug concentration for ciprofloxacin and levofloxacin was -1.25 and -1.83 log,
respectively (Table 4.3.6). A > -3 log reduction in growth for ciprofloxaicn or
levofloxacin was not obtained at any point sampled during 24 hr and relativly small
differences in killing were observed for both ciprofloxaicn and levofloxacin from 8-to-
24 hr. At the MPC, a -3.00 and -3.31 log killing occurred by 4 hr for ciprofloxaicn and
levofloxacin, respectively. Significant killing, represented by > -3.00 log reductions in
viability, was measured from 2-to-24 hr for both ciprofloxaicn and levofloxacin.
Mutant growth for the P. aeruigonsa strain PA-25 was defined by growth on
agar plates containing 1 and 8 μg/ml of ciprofloxaicn and levofloxacin, respectively. At
the MIC and MPC drug concentrations, mutant growth was detected in all culutres
tested at time 0 hr. At the MIC drug concentration, mutant growth increased over 24 hr,
accounting for the majority of cells present in culture, and reached the detection limit (>
+ 6.00 log) of the assay by 10 and 16 hr for ciprofloxaicn and levofloxacin, respectively
(Table 4.3.6). Increased killing of mutant colonies was observed for cultures treated

139
Table 4.3.6. Killing of P. aeruginosa Strain PA-25 by Ciprofloxacin and Levofloxacin at the MIC and MPC
Original Strain
Killing at the MIC (μg/ml)
Fluoroquinolone Time (h) Original broth concentration (CFU/ml)
Log Reduction/growth of entire culture (CFU/ml)
Log Reduction/ growth of mutant growth (CFU/ml)
PA-25 MICcipro = 0.125 MIClevo = 0.5
Ciprofloxacin Levofloxacin
0 1.22 x10⁸
3.92 x10⁷ --------a -------- b
+1.23c +2.8d
Ciprofloxacin Levofloxacin
4 1.2 x10⁸
1.94 x10⁷ -0.007 -0.31
+1.23 +2.8
Ciprofloxacin Levofloxacin
8 3.1 x10⁶
6.8 x10⁵ -1.59 -1.16
+2.28 +3.00
Ciprofloxacin Levofloxacin
12 1.64 x10⁶
8.87 x10⁵ -1.87 -1.65
+2.73 +>6.00
Ciprofloxacin Levofloxacin
18 6.58 x10⁶
5.53x10⁵ -1.27 -1.85
+>6.00 +>6.00
Ciprofloxacin Levofloxacin
24 6.94 x10⁶
5.79 x10⁵ -1.25 -1.83
+>6.00 +>6.00
Killing at the MPC (μg/ml)
Fluoroquinolone Time (h) Original broth concentration (CFU/ml)
Log Reduction/growth of entire culture (CFU/ml)
Log Reduction/ growth of mutant growth (CFU/ml)
PA-25 MICcipro = 2 MIClevo = 16
Ciprofloxacin Levofloxacin
0 3.41 x10⁷
4.23 x10⁷ ------- c
------------ d +1.07c +1.21d
Ciprofloxacin Levofloxacin
4 3.38 x10⁴
2.06 x10⁴ -3.00 -3.31
+1.10 +1.29
Ciprofloxacin Levofloxacin
8 2.38 x10⁴
1.7 x10⁴ -3.16 -3.39
+1.00 +1.32
Ciprofloxacin Levofloxacin
12 7.65 x10⁴
1.03 x10⁴ -3.65 -4.61
+1.00 +1.00
Ciprofloxacin Levofloxacin
18 6.2 x10³
1.84 x10² -3.74 -5.36
+1.00 +1.00
Ciprofloxacin Levofloxacin
24 2.85 x10²
3.44 x101 -5.07 -6.08
+1.00 +1.00
Maximum log reduction; a-8.08, b- 7.52. e-7.53, f-7.63. Maximum log growth; c+ >6.0, d+ >6.0.

140
with the MPC drug concentrations at every time point sampled. For ciprofloxaicn
treated cultures, mutant colonies were recovered at 0, 2, and 4 hr (+ 1.1, 1.08, and 1.1
log growth), however, no mutants could be recoverd beyond 4 hr. For levofloxacin,
mutants were recovered from 0-to-20 hr (+ 1.00 to 1.49 log growth). By 24 hr, no
mutants were recoverd from ciprofloxacin- or levofloxacin-treated cultures, which
represented a 5 log difference in mutant recovery when mutant growth at the MIC drug
concentration was compared.

141
4.3.9 Ceftazidime plus Ciprofloxacin/Levofloxacin Combination MPC Results for Clinical Isolates of P. aeruginosa
Many of the clinical isolates tested had a levofloxacin and/or ciprofloxacin MPC
value above a breakpoint for resistance, and in some cases, above a clinically achievable
concentration (based on recommended doses). Synergistic activity between
antimicrobial combinations, including fluoroquinolones and cephalosporins against
strains of P. aeruginosa, have been documented in vitro and in vivo (110, 309). Fish et
al (110) documented the successful clinical utility of fluoroquinolones used in
combination with anti-pseudomonal cephalosporins for treatment of P. aeruginosa that
demonstrated high MICs to the antimicrobial agents when tested as a single agent. I
suspected that combination MPC testing could be used to restrict the selection of
resistant mutants in isolates that had high fluoroquinolone MPCs. In an effort to
identify antimicrobials that could be used in combination testing, I measured individual
MPC results for four different classes of antimicrobials used to treat P. aeruginosa
(Table 4.3.7). With the exception of ciprofloxacin (400 mg I.V. q8h) and possibly
ceftazidime (2 g I.V.), the MPC results for all isolates tested (n=7) exceeded the peak
serum concentrations for all antimicrobials tested. The MPC90 for clinical isolates of P.
aeruginosa against imipenem (n=10) and ceftazidime (n=14) were > 64 μg/ml, in both
cases. For the aminoglycosides gentamicin, and tobramycin, the MPC90 results (n=25)
were 64 and > 64 μg/ml, respectively. MPC90 results for ciprofloxacin (n=155),
levofloxacin (n=155) and ofloxacin (n=10) were 4, 16, and > 64 μg/ml, respectively.
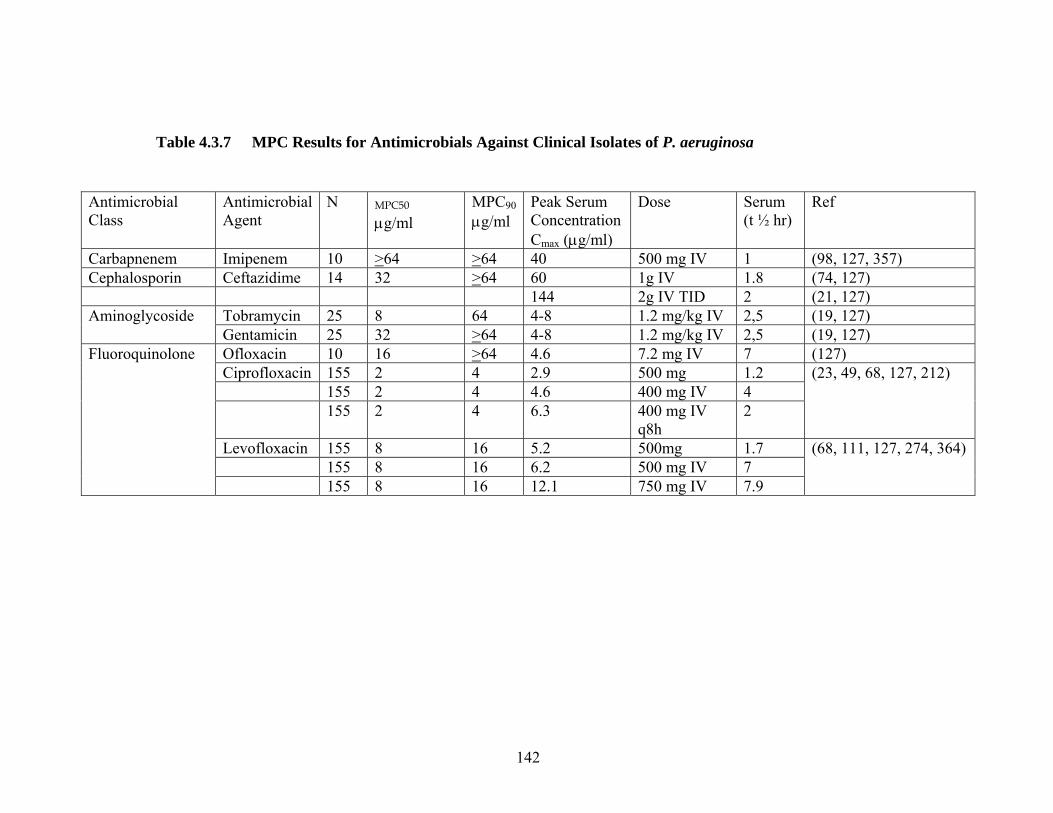
142
Table 4.3.7 MPC Results for Antimicrobials Against Clinical Isolates of P. aeruginosa
Antimicrobial Class
Antimicrobial Agent
N MPC50 μg/ml
MPC90
μg/ml Peak Serum Concentration Cmax (μg/ml)
Dose Serum (t ½ hr)
Ref
Carbapnenem Imipenem 10 >64 >64 40 500 mg IV 1 (98, 127, 357) Cephalosporin Ceftazidime 14 32 >64 60 1g IV 1.8 (74, 127) 144 2g IV TID 2 (21, 127)
Tobramycin 25 8 64 4-8 1.2 mg/kg IV 2,5 (19, 127) Aminoglycoside Gentamicin 25 32 >64 4-8 1.2 mg/kg IV 2,5 (19, 127) Ofloxacin 10 16 >64 4.6 7.2 mg IV 7 (127) Ciprofloxacin 155 2 4 2.9 500 mg 1.2 155 2 4 4.6 400 mg IV 4 155 2 4 6.3 400 mg IV
q8h 2
(23, 49, 68, 127, 212)
Levofloxacin 155 8 16 5.2 500mg 1.7 155 8 16 6.2 500 mg IV 7
Fluoroquinolone
155 8 16 12.1 750 mg IV 7.9
(68, 111, 127, 274, 364)

143
The activities of ciprofloxacin, levofloxacin, and ceftazidime against six
isolates of P. aeruginosa are summarized in Table 4.3.8. Ciprofloxacin and
levofloxacin had generally comparable MICs against the 6 isolates of P. aeruginosa
(ciprofloxacin MIC90 = 0.5 μg/ml, levofloxacin MIC90 = 1 μg/ml) and all were
considered susceptible by NCCLS criteria (Table 4.3.9). Two isolates were resistant
to ceftazidime by MIC testing (isolate numbers PA-96 MIC > 8 mg/L and PA-94 MIC
> 16 mg/l). Ceftazidime plus fluoroquinolone combinations yielded a reduction in the
fluoroquinolone plus ceftazidme MPC in 75% (9/12) of the isolates tested and 83%
(10/12) of the isolates demonstrated a reduction in the MPC value for one of the
antimicrobials.
In combination with ceftazidime, an average 1.4-fold (range 2- to 4-fold)
reduction in the ciprofloxacin MPC was seen in 5/6 strains tested. The average
reduction in the levofloxacin MPC values upon combination of ceftazidime
concentrations was one doubling dilution (range 2- to 4-fold). For ciprofloxacin
tested in combination with ceftazidime, a decrease in the ciprofloxacin MPC was seen
in four strains and corresponded to an average increase in ciprofloxacin susceptibility
of 1.3-fold. One isolate (PA-90) did not show any decrease in the fluoroquinolone
MPC when tested in combination with ceftazidime. Isolate number 96 showed a 2-
fold decrease in the ciprofloxacin MPC when tested in combination with a
ceftazidime concentration of 16 μg/ml. No decrease in the levofloxacin or
ceftazadime MPC was observed in this strain.

144
Table 4.3.8 Fluoroquinolone Ceftazidime Combination MPC Results for Clinical Isolates of P. aeruginosa
Isolate MIC μg/ml MPC μg/ml Combination MPC μg/ml
T>MPC /24h dosing interval (h)
T>MPCcomboination /24ha,b, ,c
Cipro Levo Cftz Cipro Levo Cftz Cipro/ Cftz
Levo/ Cftz
T>cipro a T>levo,b T> Cftz ,c Cipro/ Cftz Levo/ Cftz
PA-101
0.125 0.5 4 2 4 8 0.5/2
2/ 2 8.5 9.4 19.1 23.25 (ceftaz=24)
18.1 (ceftaz=24)
PA-96
0.5 1 8 4 8 32 2/ 16
8/ 32
5.5 2.3 5.8 8.5 (ceftaz=12)
2.3 (ceftaz=8)
PA-98
0.125 1 4 2 4 8 1/ 2
2/2 8.5 9.4 19.1 17.5 (ceftaz=24)
18.1 (ceftaz=24)
PA-90 0.125 0.5 4 2 4 32 2/ 16
4/ 16 8.5 9.4 5.8 8.5 (ceftaz=12)
9.4 (ceftaz=12)
PA-94 0.125 0.5 16 2 4 >64 1/ 16
4/ >64 8.5 9.4 0.5 12 (cipro=17.5)
0.5 (ceftaz=<6)
ATTC 27853
0.5 1 2 2 4 16 1/ 2
2/ 2 8.5 9.4 12 17.5 (ceftaz=24)
18.1 (ceftaz=24)
Cipro=ciprofloxacin, levo=levofloxacin, cftz=ceftazadime. Estimated T>MPC based on a400 mg ciprofloxacin IV T.I.D (212) , b750 mg levofloxacin IV (203) and b1000mg ceftazadime IV q8h (74).
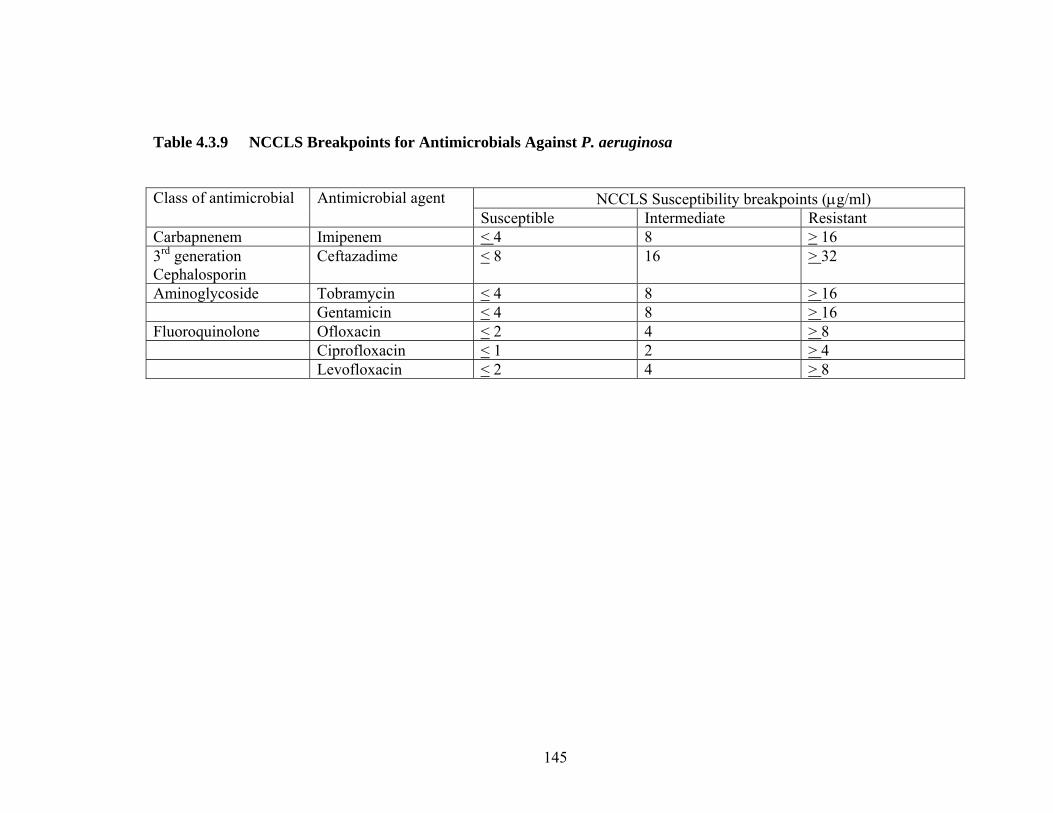
145
Table 4.3.9 NCCLS Breakpoints for Antimicrobials Against P. aeruginosa
NCCLS Susceptibility breakpoints (μg/ml) Class of antimicrobial Antimicrobial agent Susceptible Intermediate Resistant
Carbapnenem Imipenem < 4 8 > 16 3rd generation Cephalosporin
Ceftazadime < 8 16 > 32
Aminoglycoside Tobramycin < 4 8 > 16 Gentamicin < 4 8 > 16 Fluoroquinolone Ofloxacin < 2 4 > 8 Ciprofloxacin < 1 2 > 4 Levofloxacin < 2 4 > 8

146
Ceftazidime plus fluoroquinolone combinations resulted in a reduction in the MPC, to at
least one of the agents used in combination, for 6/6 strains tested by ceftazidime plus
ciprofloxacin and 4/6 strains tested against ceftazidime plus levofloxacin concentrations.
Susceptibility, as determined by a susceptible NCCLS breakpoints was restored in 4/6
strains tested by ceftazidime plus ciprofloxacin. Similarly, ceftazidime plus
levofloxacin restored susceptibility in the same 3/6 strains tested. Combination MPC
results increased the length of time ceftazidime and ciprofloxacin combinations are
projected to exceed the combination MPC result by 6.5 and 7.5 hr (based on 400 mg
T.I.D. ciprofloxacin, 1 g ceftazidime). Levofloxacin and ceftazidime combinations
resulted in an average increase of 1.45 hr for levofloxacin and 3.48 hr for ceftazidime in
the time MPC concentrations are expected to be maintained during dosing (based on 400
mg T.I.D. ciprofloxacin, 1g ceftazidime). Additionally, at least one of the antimicrobial
agents tested was in excess of the MPC for 6 hr of a potential 24 hr dosing period (Table
4.3.9). Thus, combination MPC testing with a fluoroquinolone and Ceftazidime
resulted in a lower fluoroquinolone MPC (when compared to initial MPC result) in at
least half of the strains tested, and demonstrated that combination MPC testing can be
used to minimize the potential for selecting resistant organisms with antimicrobials that
have high individual fluoroquinolone MPCs.
147
4.3.10 Recovery of Resistant Mutants in a Rat Abscess Model of Infection with P. aeruginosa The majority of data pertaining to the MPC measurement has been obtained
using in vitro studies, and animal models are now required to examine the clinical utility
of the MPC measurement and the concept of the MSW. I used an absess rat model to
create infections using 4.5x10⁹ to 3.8x10¹⁰ CFU/ml cultures of P. aeruginosa (Figure
4.3.11). The ciprofloxacin and levofloxacin MIC for isolate CBRH 25138 used to
create infection were 1 and 2 μg/ml, respectively. The ciprofloxacin and levofloxacin
MPC were 4 and 16 μg/ml. Four experimental groups consisted of rats given, 400 mg
I.V. once daily dose of ciprofloxacin (400 mg I.V. (n=2) and 400 mg I.V. qh8 (n=2) and
750 mg I.V. once daily dose of levofloxacin (750 mg I.V. once daily (n=3) and 750 mg
I.V. qh8 (n=2), results are summarized in Table 4.3.10. P. aeruginosa was recovered
from infected tissues and blood samples which were were analysed for changes in
susceptibility based on the MIC. Resistant mutants were defined by a > 2-fold change
in the ciprofloxacin and levofloxacin MIC relative to the MIC of the wild-type strain.
Resistant organisms were recovered in 33% (3/9) of the rats tested. Of the 23 cultures
recovered (total swabs plus tissues plus blood cultures), 22% (5/23) demonstrated
elevated susceptibilities to both ciprofloxacin and levofloxacin. Swabs of infected
tissues and homogenized tissue samples collected from a rat given a 400 mg I.V. once
daily ciprofloxacin (rat number 48), grew P. aeruginosa with a ciprofloxacin MIC of 8
μg/ml and a levofloxacin MIC of 16 μg/ml. Swabs of infected tissues taken from rat
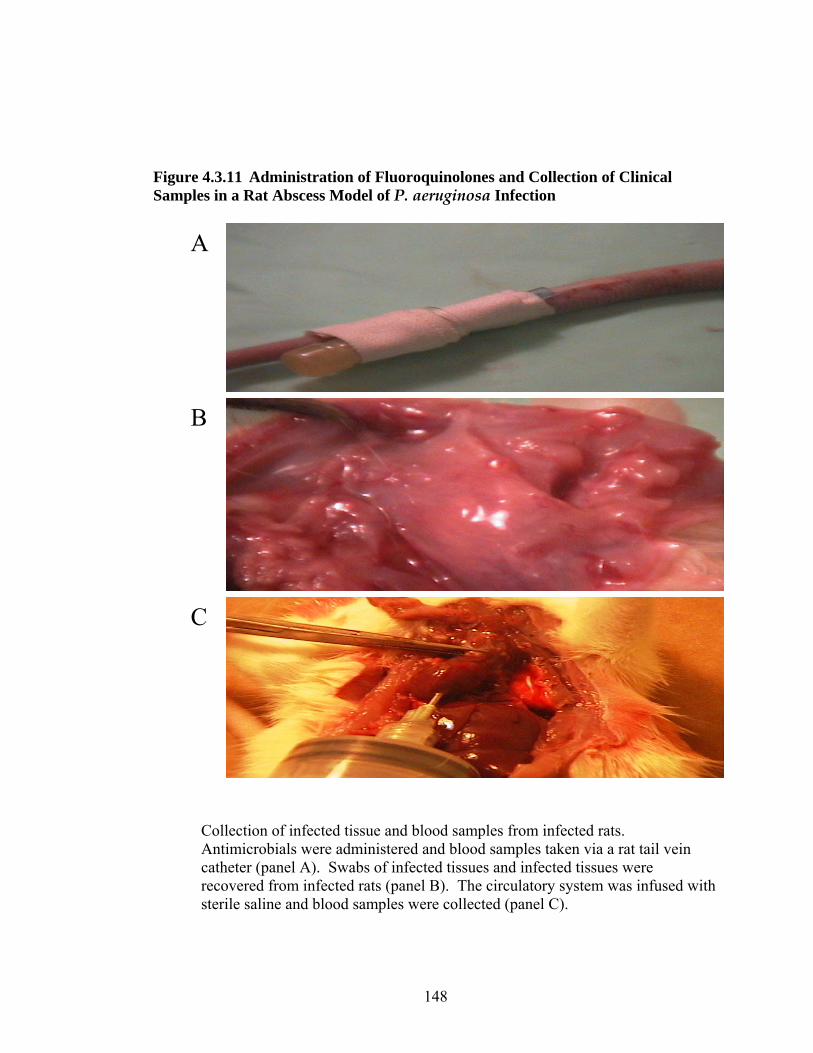
148
Figure 4.3.11 Administration of Fluoroquinolones and Collection of Clinical Samples in a Rat Abscess Model of P. aeruginosa Infection
A
B
C
Collection of infected tissue and blood samples from infected rats. Antimicrobials were administered and blood samples taken via a rat tail vein catheter (panel A). Swabs of infected tissues and infected tissues were recovered from infected rats (panel B). The circulatory system was infused with sterile saline and blood samples were collected (panel C).

149
Table 4.3.10 Recovery of P. aeruginosa from a Rat Abscess Model of Infection
Fluoroquinolone dose I.V (mg)
MICrecovered
(μg/ml) MICparent
(μg/ml MPCparent
(μg//ml) Culture ID
Rat ID
Cipro 400
Cipro 400 T.I.D
Levo 750
Levo 750 T.I.D
Infectious dose (CFU/.45ml)
Source of isolation
Cipro levo Cipro Levo Cipro Levo
1 47 + tissue 2 4 2 4
4
16
2 + swab 2 4
3 + swab 2 4
4 + blood 2 4
5 + blood 2 4
6 + tissue 2 4
7 48 + tissue 8 16
8 + swab 8 16
9 + swab 8 16
10 + blood 2 4
11 + blood 2 4
12 + tissue 2 4
13 49 +
3.9 x10¹⁰
Tissue 2 4

150
Nine rats, divided into 4 experimental groups; 1.) ciprofloxacin dosed 400 mg I.V, 2.) Ciprofloxacin dosed 400 mg I.V T.I.D., 3.) Levofloxacin dosed 750 mg I.V, and 4.) Levofloxacin dosed 750 mg I.V. T.I.D were tested. Plus signs indicate s the recoverey of P. aeruginosa from treated animals
Culture ID
Rat ID
Fluoroquinolone dose I.V (mg) Infectious dose (CFU/.45ml)
Source of isolation
MICrecovered
(μg/ml) MICparent
(μg/ml MPCparent
(μg//ml)
Cipro 400
Cipro 400 T.I.D
Levo 750
Levo 750 T.I.D
tissue Cipro levo Cipro Levo Cipro Levo
14 49 + 3.9 x10¹⁰ swab 2 4 2 4 4 16
15 56 + 4.5 x10⁹ swab 2 4
16 50 + swab 2 4
17 + swab 2 4
18 + blood 8 32
19 + blood 2 4
20 +
3.9 x10¹⁰
tissue 2 4
21 + swab 8 16
22
51
+
4.5 x10⁹
blood 2 4
23 59 Control (no drug) 3.9 x10¹⁰ swab 2 4
24 60 Control (no drug) swab 2 4
25 53 + swab 2 4
26 55 + swab 2 4
27 58 +
4.5 x10⁹
swab 2 4
151
number 51 (culture 21) which had been given a 750 mg I.V. once daily levofloxacin
dose grew resistant P. aeruginosa with a ciprofloxacin and levofloxacin MIC of 8 and
16 μg/ml, respectively, which correlated with the MPC of the original parental strain.
Blood samples taken from a second rat (rat number 50, culture number 18) which had
been given a 400 mg I.V once daily dose of ciprofloxacin grew resistant P.aeruginosa
with a ciprofloxacin and levofloxacin MIC of 8 and 32 μg/ml, respectively. The MIC of
the recovered culture (culture # 18) showed a 4- and 6-fold increase in the MICs to
ciprofloxacin and levofloxacin. No mutants were recovered in rats, which had been
given a three times daily dose. Overall, mutants demonstrated a 4-fold decrease in
fluoqouinolone susceptibility in 33% (3/9) of the rats tested which demonstrated that
fluoroquinolone-resistant mutants could be readily selected and enriched under
fluoroquinolone concentrations which fail to inhibit the most resistant mutant present in
1010 CFU/ml cultures of P. aeruginosa.

152
4.4 DISCUSSION
Fluoroquinolone development has resulted in more potent agents such as
moxifloxacin, gatifloxacin and gemifloxacin, however, these agents do not exhibit
enhanced activity against P. aeruginosa. Consequently, maintaining the efficacy of
existing fluoroquinolone agents with activity against P. aeruginosa, such as
ciprofloxacin and levofloxacin, is of paramount importance. Conventional
susceptibility considerations are inadequate for choosing between ciprofloxacin and
levofloxacin for treatment of infections caused by P. aeruginosa: resistance develops
frequently to both and neither compound demonstrates a clear advantage when
surveillance data, in vitro activities, and drug PK are considered collectively (212, 225,
323). Nevertheless, clinical surveys indicate that increased prevalence of resistance is
associated with a switch from ciprofloxacin to ofloxacin/levofloxacin (22, 283, 303).
When ciprofloxacin and levofloxacin were compared for activities against cultures
containing subpopulations of resistant mutants, ciprofloxacin was more active by two
criteria. First, MPC, a value that approximates the MIC of the least susceptible mutant,
was three to four times higher for levofloxacin, both by population analysis (Figure
4.3.1) and by survey of more than 150 clinical isolates (Figure 4.3.4). Second, larger
numbers of moderately susceptible and high level resistant mutants were more likely to
be recovered following exposure to levofloxacin than ciprofloxacin (Figure 4.3.1),
particularly with clinical isolates having intermediate fluoroquinolone susceptibility
(Figure 4.3.2).

153
When fluoroquinolone-susceptible clinical isolates of P. aeruginosa (n=6) were
applied to agar plates containing various concentrations of ciprofloxacin or
levofloxacin, recovery of colonies decreased as the fluoroquinolone concentration
approximated the MIC (Figure 4.3.1). In these experiments, each data point represented
a 1010 CFU/ml culture exposed to defined ciprofloxacin or levofloxacin drug
concentrations. At higher concentration, both compounds exhibited a pronounced
inflection in mutant recovery, visualized as a generalized plateau regions at
concentrations above the MIC. As fluoroquinolone concentrations increased, a second
decline in CFU corresponding to the inhibition of first-step mutants was seen for both
ciprofloxacin and levofloxacin, and eventually a concentration of ciprofloxacin and
levofloxacin was reached which prevented the growth of the most-resistant first-step
mutant present in a population of > 109 cells. For ciprofloxacin and levofloxacin, MPC
drug concentrations were measured at 3 and 9.5 μg/ml, respectively. Comparison of the
MSWs for ciprofloxacin and levofloxacin indicated that levofloxacin was 1500 times
more efficient at selecting resistant mutants. The quantitative differences in mutants
selected by ciprofloxacin and levofloxacin extend beyond the conventional
understanding of fluoroquinolone activity for P. aeruginosa. For example, differences
in the anti-pseudomonal activities between ciprofloxacin and levofloxacin manifest in
an approximate 2-fold difference in the MIC. If differences in mutant selection
between ciprofloxacin and levofloxacin parallel activity described by MIC
measurements, then one should expect parallel activity against first-step resistant

154
mutants, albeit shifted by a factor of 2-fold toward higher levofloxacin drug
concentrations. As expected, this relationship holds true for 105 to 106 cells present in
1010 CFU/ml cultures, however, parallel fluoroquinolone activity was not seen when
mutant recovery at concentrations above the MIC were examined. Quantitative
differences in mutant selection were determined by analyzing the area created under
respective ciprofloxacin and levofloxacin MSWs. Levofloxacin selected more mutants,
at higher concentrations, and over wider concentration ranges when compared to
ciprofloxacin which could be expressed in a ciprofloxacin: levofloxacin ratio of 1:1500
(> 3 log difference in CFUs). I also examined an isolate of P. aeruginosa that exhibited
intermediate fluoroquinolone susceptibility (MIC = 2 and 4 μg/ml for ciprofloxacin and
levofloxacin, respectively). At moderate drug concentrations (0.5-to-8 μg/ml), resistant
mutants were more frequently recovered from agar containing concentrations of
levofloxacin (Figure 4.3.1) Thus, the preferential ability of ciprofloxacin to restrict
mutant growth is also evident with isolates having intermediate susceptibility.
Adapting MPC testing to incorporate conventional 2-fold dilution agar testing
resulted in modal MPC values of 2 and 8 μg/ml for ciprofloxacin and levofloxacin and
MPC90 of 4 μg/ml and 16 μg/ml, respectively, when 155 clinical isolates of P.
aeruginosa were tested. Thus, the upper boundary of the mutant selection window (i.e.,
the MPC) was about 4 times higher for levofloxacin. The significance of this finding
can be reflected by examining the percentage of isolates whose MPC value fell at or
above a fluoroquinolone resistant breakpoint. When the MPC results for ciprofloxacin

155
and levofloxacin were analysed in relation to NCCLS described breakpoints for
resistance, the number of isolates that showed resistance to levofloxacin (67%) were
nearly twice the number that demonstrated resistance to ciprofloxacin (36%) (Figure
4.3.6). High-level resistance assessed by MPC values of >16 μg/ml, correlate with poor
clinical success (124) and were selected by levofloxacin in 13% of the isolates
compared to 5% for ciprofloxacin.
The significance between ciprofloxacin and levofloxacin MPC results remains
an area of intense investigation. A proposed model of infection suggests that higher
numbers of mutants selected under levofloxacin dosing places the patient at increased
risk for enriching mutant populations. Comparison of the MSW for ciprofloxacin and
levofloxacin revealed that the levofloxacin MSW was twice as large as the MSW for
ciprofloxacin. This difference is not reflected in current MIC testing for susceptibility.
Comparisons between compounds, based on the MPC, require consideration of
drug PK. I have suggested comparisons based on the time relevant drug concentrations
are above the MPC (41, 149), since during this time mutant growth will be restricted.
Levofloxacin concentrations failed to exceed the MPC90 value for any portion of the
dosing interval (based on 750 mg I.V. once daily), while concentrations of ciprofloxacin
are projected to remain in excess of the MPC90 for approximately 5.5 of a 24 hr dosing
interval (based on 400 mg T.I.D., I.V.) (57, 212, 274) (Figure 4.4.1). For some
antibiotic dosages, the drug-susceptible population may completely replaced with
resistant mutants over time if the MPC is not targeted throughout dosing, or achieved

156
Figure 4.4.1 Relationship of MPC Results to Ciprofloxacin and Levofloxacin Dose Response Profiles
A
The relationship between MPC90 and MPC50 results for 155 clinical isolates of P. aeruginosa and the ciprofloxacin (400 mg I.V. T.I.D) dose response curve is shown in A. The ciprofloxacin dose-response curves were adapted from Lipman et al (212). B shows the relationship between MPC90 and MPC50 results for 155 clinical isolates of P. aeruginosa and the levofloxacin (750 mg I.V.) dose response curve. Data for levofloxacin was adapted from product insert (274) ciprofloxacin (400 mg I.V. T.I.D) levaquin package insert (274).
0
1
2
3
4
5
6
7
0 2 4 6 8 10 12 14 16 18 20 22 24
Time (h)
Seru
m c
once
ntra
tion.
Mg/
L
MPC90
MPC50
0
4
8
12
16
0 2 4 6 8 10 12 14 16 18 20 22 24
MPC50
MPC90
MPC50
B
A
Time (hr)
157
for sufficient time to inhibit mutant growth. Clinically, this may manifest in failure of an
infection to respond to therapy or a relapse of infection with drug-resistant mutants shortly
after a prescribed course of antibiotic therapy is completed. Another approach is to
consider the time that the two compounds are inside the mutant selection window, since
longer times are expected to facilitate mutant enrichment (14, 86, 109). Here the difference
is not striking: 100% for levofloxacin and 80% for ciprofloxacin (Figure 4.4.1). However,
these numbers fail to consider differences in selection of low and moderately resistant
mutants. For ciprofloxacin, 65% of the isolates tested were inhibited at concentrations <2
μg/ml compared to 30% which were inhibited at levofloxacin concentrations <4 μg/ml.
Thus, for low-level resistant mutants, ciprofloxacin concentrations would remain in the
window for 44% of each 24 hr-period (based on a T.I.D. dose), while levofloxacin
concentrations would be in the window for 80% of the 24 hr period (based on once daily
dosing).
Fluoroquinolone resistance in P. aeruginosa has been described for strains
demonstrating MICs of >8 μg/ml to both ciprofloxacin and levofloxacin and these
strains frequently contain gyrA mutations at sites 83 and 87 (4). Comparison of MPC
values demonstrated that 8% of the mutants selected by ciproflxoaicn concentrations
had a MPC value >8 μg/ml compared to 67% of the strains tested which had a
levofloxacin MPC value of > 8 μg/ml (Figure 4.4.2). In vitro studies have shown that
acquisition of gyrA mutations in Gram-negative bacteria facilitate the step-wise
selection of additional target mutations which confer higher degrees of fluoroquinolone

158
resistance (256, 267, 307, 342). The selection of a first-step quinolone target mutation
also increases the frequency with which additional mutations are selected relative to
strains that do not harbour gyrase or topoisomerase mutations (207). Sequence analysis
of >400 base pair regions of the gyrA and parC genes demonstrated that selected
mutants of P. aeruiginosa contain QRDR and as well as target mutations which map
outside of the characterized QRDR regions of gyrA and parC. Mutants selected from 11
different strains of P. aeruiginosa were analyzed and five mutants contained a gyrA
T83I mutation which has been proven to contribute to fluoroqouinolone resistance based
on genetics studies (2). Additional mutants contained uncharacterized mutations in
regions of the gyrA and parC genes that were not present in the parental strains,
suggesting a possible association between target mutations and phenotypic resistance.
Examination of mutants recovered from mutant selection curves revealed that low
concentrations of fluoroquinolone selected only non-gyrA mutants; at slightly higher
concentrations, gyrA and parC variants were detected. Failure to detect target mutants
at low concentrations is likely due to the overwhelming numbers of susceptible cells
relative to target mutants, or may be attributed to the presence of efflux mechanisms
which are known to operate in clinical isolates of P. aeruginosa (176, 205, 219).
However, overexpressions of different efflux proteins in the selected mutants were not
analyzed in this study. High fluoroquinolone concentrations selected T83I gyrA
mutants, which were readily detected in isolates with intermediate fluoroquinolone

159
Figure 4.4.2. Stratification of the Mutant Selection Window Based on Ciprofloxacin and Levofloxacin MPC Distributions for 155 Clinical Isolates of P. aeruginosa
High fluoroquinolone concentrations selected T83I gyrA mutants, which were readily
0
1
2
3
4
5
6
7
8
0 2 4 6 8 10 12 14 16 18 20 22 24
Time (h)
Seru
m c
once
ntra
tion.
mg/
L
02468
10121416
0 2 4 6 8 10 12 14 16 18 20 22 24
8%
92%
65%
3%
30%
67%
13%
>
>
5%
Figure A shows the percentage of isolates with ciprofloxacin MPC values of < 1, < 2, < 4, and > 4 μg/ml and the projected time ciprofloxacin concentrations are expected be within the MSW for each group of isolates. Figure B shows the percentage of isolates with ciprofloxacin MPC values of < 2, < 4, < 8 and > 8 μg/ml and the projected time levofloxaicn concentrations are expected be within the MSW for each sub-group of isolates. Ciprofloxaicn concentratins based on a 400 mg I.V. T.I.D. dose (212). PK profile for levofloxacin based on published reports and product information (274).
A
B
Time (hr)
160
susceptibilities, suggesting that isolates with intermediate phenotypes appear to select
the T83I mutation as the “next-step” mutant in the progression of fluoroquinolone
resistance. This suggestion implies that the T83I mutant(s) should be present in >1010
CFU/ml cultures of P. aeruginosa with intermediate susceptibility to both ciprofloxacin
and levofloxacin, and should be selected by both ciprofloxacin and levofloxacin drug
concentrations. For some strains, no target mutants (i.e., gyrA/parC) could be detected
in colonies selected from ciprofloxacin plates. Two related factors may contribute to
this finding. 1.) Sequence analysis was preformed on a limited number of mutants, thus,
target mutants present in low numbers, may not have been detected in the limited
numbers of colonies sampled. 2.) Differences in mutant recovery may reflect
differences in bactericidal activity which are not reflected in the MPC measurement.
Thus, enhanced killing of mutant cells at low and moderate concentrations of
ciprofloxacin may reduce, or eliminate the T83I mutant population, making it difficult
to detect target mutants relative to levofloxacin.
Step-wise acquisition of resistance may explain why some of the mutations
identified in recovered mutants of P. aeruginosa have yet to be reported in the literature,
because first-step mutants selected from susceptible strains produce small changes in
susceptibility that are not detected as a 2-fold change in susceptibility (i.e., the MIC).
Additionally, resistance is not an absolute term and many levels of resistance can be
attained through acquisition of target mutations. For example, over 30 different
resistance alleles have been obtained with fluoroquinolones and M. tuberculosis (332,

161
334). Analysis of P. aeruginosa mutants identified 10 different gyrA, and 8 parC
mutations. However, “resistance” is typically detected and acknowledged in a 2-fold
change in the MIC and would not account for target mutations that may lead to the
selection of mutants with higher degrees of resistance. In this respect, the definition of
the MPC should include the concentration which prevents the growth of the most
resistant phenotype selected from within a given susceptible population. This
hypothesis may also help to explain detection of multiple target mutations in some of
the recovered mutants. Figure 4.4.3 represents a potential dose response curve and
mutant selection window for a hypothetical fluoroquinolone antimicrobial. For any
given pathogen, different susceptible phenotypes are likely to exist, each conferring a
relative degree of “resistance” which manifest through differences in susceptible MICs.
Thus, a number of different susceptible strains can exist within a population of cells
classified as susceptible. Allelic diversity within the regions of the gyrA and parC
genes coupled with efflux pump expression may influence the specific resistance
determinant selected. A given compound may only be able to inhibit the selection of a
defined number of mutants.
Therefore, once a certain degree of “resistance” is achieved in a parental strain,
the “next-step” mutant select may not be inhibited (or killed) by clinically relevant
concentrations. Differences between an agent’s propensity to select for resistance, as
determined by the MPC, may reflect targeted activities against a defined number an/or
variants of first-step resistant mutants selected from within genetically distinct

162
Figure 4.4.3 Relationship Between Selection of Resistant Mutants and Initial Degree of Susceptibility
Time post-administration
MIC
MPC
Seru
m o
r tis
sue
drug
con
cent
ratio
n
MSW
Cmax
Breakpoint for resistance
A proposed model for mutant selection suggests that differences in allelic variants selected in 1010 CFU/ml cultures is dependent on the degree of susceptibility in initial susceptible populations. Different susceptible isolates are represented as rectangles, all of which confer a different degree of susceptibility as determined by variance in susceptible MIC values. Mutants selected from 1010 CFU/ml cultures of susceptible isolates are illustrated by stars. For any given fluoroquinolone agent, the growth of a finite number of mutants can be inhibited at concentrations below a breakpoint for resistance for the drug. Thus, differences in the MPC results between antimicrobials of the same class may relate to the preferential ability of an agent to inhibit a larger proportion of the mutants selected from within susceptible populations.

163
susceptible populations. Therefore, differences between ciprofloxacin and levofloxacin
MPC results may be due to the preferential ability of ciprofloxacin to inhibit the growth
of a larger number of first-step mutant populations that are selected from within a larger
array of susceptible isolates. The gyrB and parE subunits of DNA gyrase and
topoisomerase IV are secondary quinolone targets and resistance and gyrB and parE
mutations have been found in strains of P. aeruginosa which already contain gyrA or
gyrA + parC mutations (156, 200, 248).
Mutations in gyrB and parC regions were not examined in my analysis as it is
well known that gyrA mutations are the first target mutations to be obtained in Gram-
negative bacteria and those parC mutations are secondary. Since my study looked at
first-step mutations, it was not necessary to look at parE and gyrB mutations because
they are unlikely to be present, but I cannot exclude the possibility that mutations in
regions of the parE and gyrB gene may have contributed to resistance in some of the
recovered mutants. The effect of target mutations on the subsequent development of
resistance is still under investigation. MPC measurements preformed on recovered
mutants will help to identify if selected mutants increase the acquisition or frequency of
additional resistance alleles relative to parental colonies. MPC results for isolates with
intermediate susceptibilities to ciprofloxacin and levofloxacin reproducibly selected
T83I gyrA mutations (Table 4.3.3) suggesting that the “next-step” mutant selected from
strains with intermediate susceptibility is one which confers a level of resistance that is
associated with poor clinical success (4, 124).

164
MICs for recovered mutants (MICrecovered) were 6- to 10-fold higher when
compared to parental MICs (Table 5.3.2). Overall, 81% (165/204) of the recovered
mutants demonstrated elevated MICs to ciprofloxacin and levofloxacin when compared
to the MIC of the parental isolates and 69% (140/204) of the mutants tested had a
resistant phenotype. One hundred and eight mutant colonies were recovered from
ciprofloxacin concentrations above the MPC during MPC testing and 91% (98/108) of
the recovered mutants were within one doubling dilution of the MPC results when re-
tested by conventional MIC testing. For levofloxacin, 94% (91/96) of mutants
recovered from levofloxacin plates were with one doubling dilution of the MPC
measurement. Thus, mutant colonies represent stable phenotypes with decreased
fluoroquinolone susceptibilities. A 50 mM solution of CCCP was added to
susceptibility panels to examine whether efflux mechanisms contribute to
fluoroquinolone resistance in recovered mutants (287, 365). For ciprofloxacin, 23% of
the strains tested showed at least a 2-fold decrease in the MICrecovered in the presence of a
50 mM solution of CCCP. For levofloxacin, 16% of the strains demonstrated a >2-fold
decrease in susceptibility upon the addition of CCCP. Generally, a >2- fold change in
the MIC with the addition of CCCP is required to identify active efflux as a mechanism
of fluoroquinolone resistance in isolates of P. aeruginosa (365). Thus, by this system,
efflux mechanisms could not be identified as primary mechanisms of fluoroqouinolone
resistance in recovered mutants of P. aeruignsoa, however, a lack of clear correlation
between CCCP-promoted increases in fluoroquinolone accumulation and resulting

165
decreases in the MIC is known to exist in strains where efflux has been shown (119,
266). In addition, these studies did not account for cumulative differences in efflux
expression between 105 and 1010 CFU/ml. As such, demonstration of CCCP-enhanced
MIC results cannot be the sole determinant used to support (or disprove) the role of
efflux mechanisms in fluoroquinolone resistance. PFGE of recovered mutants and
parental isolates showed no differences in the DNA banding profiles (Figure 4.3.7) and
indicated that recovered mutants did not represent distinct clones relative to parental
organisms but rather were selected from within parental populations.
Concentration-dependent killing by fluoroquinolones suggests that targeting
MPC in antibiotic dosing strategies may have a profound impact on minimizing
resistance and the speed to clinical resolution (34, 146). Thus, agents whose
serum/tissue concentrations do not exceed the MPC for the entire length of the dosing
interval may still be effective at minimizing the selection of resistant mutants if mutant
killing occurs within a time interval during which fluoroquinolone concentrations
exceeds the MPC (Figure 4.4.4). Conventional kill-curves performed with
fluoroquinolones do not reflect the killing of first-step resistant mutants because the
inoculums used are too low to account for their presence. Killing at the MIC drug
concentrations resulted in < -2 log reductions in overall viability for both isolates tested.
Mutant outgrowth was observed in both ciprofloxacin and levofloxacin treated cultures
which accounted for the majority of the cells present in cultures by 12-24 hr. Killing at
the MPC drug concentration resulted in > -3 log killing between 4 and 8 hr and mutant

166
Figure 4.4.4 The Relationship Between Bacterial Killing and the MPC for Fluoroquinolones
Mutant subpopulations are likely to exist in large inocula that require MPC concentration to inhibit their growth. The width of the killing triangle is determined by the time required to inhibit both susceptible and first-step resistant cells, represented in hrs. Fluoroquinolone activity and killing do not always parallel, therefore, a narrow killing triangle may represent an antimicrobial agent that possess lower intrinsic activity (as assessed by a high MIC) against a specific pathogen, but may display increased killing against first-step resistant mutants.
Cmax
MPC
MIC
tissue
serum
Ant
ibio
tic c
once
ntra
tion
Time (hr)
% K
ill
0%
100%Resistant mutants present in wild-type susceptible bacterial populations
Intermediate susceptible + highly susceptible cells
Highly susceptible cells in wild-type population
Hansen & Blondeau 2001

167
growth was restricted. Thus, killing at the MPC drug concentration resulted in > 5 log
difference in mutant killing compared to killing at the MIC drug concentration when the
contents of 1010 CFU/ml cultures of P. aeruginosa were tested against ciprofloxacin and
levofloxacin. A difference of ~4 logs growth was observed between cultures treated
with MIC and MPC fluoroquinolone concentrations indicating that killing at the MPC
drug concentration resulted in rapid reductions in both susceptible and mutant cells
which is hypothesized to decrease the potential for selecting resistant mutants and
positively impact on clinical outcome since clinical performance is dependent on
antibiotic-mediated bacterial eradication in a number of infections (67).
Recently, Firsov et al (109) demonstrated that fluoroquinolone concentrations
which fluctuated within the MSW were associated with a decrease in the susceptibility
of S. aureus to fluoroquinolones. Killing experiments based on the MIC drug
concentration failed to achieve significant bacterial killing and the outgrowth of mutant
subpopulations paralled the decline in growth of the susceptible population.
Killing experiments conducted at the MPC drug concentration using 1010 CFU/ml
cultures provide preliminary insight into the relationship between drug PK and time
required for mutant killing. For ciprofloxacin, the projected time serum drug
concentrations are expected to in excess of the MPC90 for P. aeruignsoa is estimated to
be 5.5 hr for 90% of strains and 13 hr for organisms with ciprofloxaicn MPCs of <2
µg/ml. For levofloxacin, the MPC90 was 16 µg/ml and the modal MPC value was 8
µg/ml. As such, no current recommended dosage of levofloxacin would exceed 16

168
µg/ml and for organisms with MPCs of 8 µg/ml, serum drug concentrations would
exceed this value for approximately 2 hr (144, 146, 148). Serum drug concentrations
for levofloxacin fall within the experimentally defined MSW for a greater time and
correlate with decreased time above the MPC required to prevent the selection and
enrichment of resistant subpopulations. Using an in vitro PK/PD model to simulate
fluoroquinolone doses that fluctuated within the MSW for S. aeurus, Firsov et al (109)
demonstrated that drug concentrations which remain within the MSW for >45% of the
dosing interval could readily select for resistant organisms. It can be further argued that
the practical role of bacterial killing on enrichment of resistant mutants within the MSW
serves to minimize the rounds of replication for mutant cells. To date, the anti-infective
community relates the concentrations of antimicrobial agents in plasma to the MICs for
relevant pathogens and thereby makes recommendations on antibiotic dosages and
dosing intervals. Thus, it may be argued that the relevant concentration used in in vitro
kill kinetic experiments should include the relevant serum/tissue Cmax. This argument
has been the basis for debate in the literature regarding the bactericidal action of
ciprofloxacin and levofloxacin against P. aeruginosa (323). Levofloxacin is dosed
based on tolerability and, as such, accumulates in the serum and infected tissues to a
much greater degree than can be obtained for ciprofloxacin. This allows levofloxacin to
be dosed at much higher levels, thereby achieving a larger AUC/MIC for a single dose
which may result in higher rates of bacterial killing, as the action of fluoroquinolones is
concentration dependent. Thus, recent reports citing superior killing by levofloxacin
169
against P. aeruginosa have fuelled the debate over appropriate quinolone use in
infection caused by this agent (130, 225, 322, 323).
Gillespie et al (130) examined the mutation rate for ciproflxoaicn and
levofloxacin against strains of P. aeruignsoa, using large inocula. In the 11 examples
where the mutation rates could be directly compared, levofloxacin was less likely to
select resistant mutants in five instances. Mutants recovered from six strains were
tested for killing by ciprofloxacin and levofloxacin at the expected pulmonary epithelial
lining fluid drug concentration and no consistently significant differences in killing
between the two agents was observed, despite the fact that levofloxacin concentrations
represent a 2-fold higher epithelial lining fluid drug concentration than for
ciprofloxacin. In the context of my kill experiments, some notable observations in the
Gillespie study require further explanation. The inoculums used to select mutants
ranged from 6.6x10⁶ to 3 x10⁹ CFU/ml For levofloxacin, 1/7 stains tested utilized a test
inoculum > 109 CFU/ml and only 2 of the strains tested were exposed to inoculums
>108 CFU/ml. Previous experiments have demonstrated that a minimum of 109 CFU/ml
is required to consistently detect sub-populations of first step resistant cells (146), thus
the absence of mutants selected by levofloxacin may be a result of using inoculums that
do not contain mutants (or high enough numbers of mutants) to be detected. In some
cases, the authors failed to acknowledge that direct comparisons between the mutant
selection potential for ciprofloxacin and levofloxacin were made using inocula that
differed up to 1000-fold. In addition, many of the strains used in the study represented

170
intermediate phenotypes. For fluoroquinolones and P. aeruginosa, application of MPC
may only be significant in the context of fully susceptible strains. Therefore, their
conclusion that levofloxacin is less likely than ciprofloxacin to select resistant mutants
may not hold true when susceptible strains are used and when inocula of >109 CFU/ml
are tested.
Additional reports have also described equivalent killing of ciprofloxacin and
levofloxacin against P. aeruginosa (271, 362). MacGowan et al (225) further qualified
the differences in killing by suggesting that the bactericidal activities of levofloxacin
and ciprofloxacin are equivalent provided similar AUC/MIC ratios can be obtained.
Thus, apparent differences in the bacteristatic and bactericidal activities of ciprofloxacin
and levofloxacin may relate to the initial degree of resistance present in the parental
isolate. As has been previously implied, it is possible that once a defined degree of
resistance is achieved, the bacteristatic and bactericidal activity of ciprofloxacin and/or
levofloxacin may be compromised to the point where clinically achievable
concentrations are unable to control the mutant either through inhibition of growth or
bacterial killing. Although levofloxacin is able to achieve a high Cmax (12.1 μg/ml)
(274), it is expected to remain in excess of the MPC90 and MPC50 for 0 and 3 hr,
respectively, of the dosing interval for P. aeruginosa. Some strains of P. aeruginosa
possess MPCs which lie outside clinically achievable concentrations. Enhanced killing
related to a high Cmax may be offset by the fact that relevant killing concentrations are
attained for short periods. Serum concentrations of ciprofloxacin dosed three times

171
daily are projected to remain in excess of the MPC90 and MPC50 for 5.5 and 13 hr
respectively, of the dosing interval for P. aeruginosa. Thus, relevant killing
concentrations are also maintained for longer periods for ciprofloxacin. In my
preliminary experiments on the killing of P. aeruginosa by ciprofloxacin and
levofloxacin, MIC concentrations failed to achieve > -3 log killing and mutant colonies
could be readily recovered from cultures treated at the MIC drug concentration. As
expected, when cultures were treated at the MPC drug concentration, significant killing
was observed and mutant growth was inhibited. Mutant colonies were killed by
ciprofloxacin and levofloxacin MPC drug concentrations within a 2-to-4 hr period,
however, the entire contents of the cultures were not sampled and viable mutant
colonies may have been missed as a result. Nevertheless, these experiments
demonstrate that increased killing is observed at the MPC drug concentration and
mutant growth is prevented. Killing of characterized target mutants and detailed
analysis of the drug concentrations at the sites of infection will help to further define the
length of time ciprofloxacin and levofloxacin MPC concentrations should be targeted in
treatment of infection caused by P. aeruginosa.
Antibiotic extrusion by efflux pumps is a major determinant of antimicrobial
resistance in P. aeruginosa and four MDR efflux pumps with broad specificities have
been identified in clinical isolates (264, 265, 291). The four major efflux systems
which contribute to apparent fluoroquinolone resistance in strains of P. aeruginosa,
include MexAB-OprM (206, 208, 294), MexCD-OprJ (190, 292), MexEF-OprN (189),

172
and MexXY-OprM (161, 240, 352). The selection of non-gyrase mutants at low and
moderate fluoroquinolone concentrations raised the question of whether activity against
efflux mutants of P. aeruginosa could be used to account for differences in mutant
selection between ciprofloxacin and levofloxacin. However, the relevance of efflux
mechanisms in resistance of clinical strains pf P. aeruginosa has rarely been
demonstrated, mainly because an experimental approach for accurate measurement of
the rates of export of antibiotics into bacterial cells is lacking. The selection of efflux
mutants at low and moderate quinolone concentrations was demonstrated by Kohler et
al (190) who were able to detect spontaneously resistant colonies which expressed
efflux pumps after incubation when 109-to- 1010 CFU/ml cultures were challenged with
multiple concentrations of the fluoroquinolone MIC. The authors were able to conclude
that the preferred resistance mechanism selected by P. aeruginosa in response to a
single exposure of quinolones at low concentrations (close to the MIC) is antibiotic
efflux and not alteration of the gyrase gene (190).
As expected, when mutants over-expressing four efflux systems were tested
against increasing fluoroquinolone concentrations, a shift in the recovery of resistant
colonies, toward higher drug concentrations, was observed. For all strains tested, a
clear distinction between the MIC and the MPC measurements could be observed as
colonies continued to form at or above the MIC drug concentration. It is postulated that
resistance due to active efflux can be overcome in vivo with higher fluoroqouinolone
concentrations or more frequent dosing. Thus, in the context of minimizing resistance

173
in cells expressing MDR efflux pumps, the key factor will be the relative degree that
efflux-expressing strains shift the MPC (toward higher drug concentrations) and the
mutant selection curve. Direct comparison of the anti-pseudomonal activity for
ciprofloxacin and levofloxacin, based on the MPC values, revealed that ciprofloxacin
was on average 2.9-fold more active against first-step mutants selected from strains of
P. aeruginosa which overexpressed one of four different efflux systems. The overall
change in susceptibility (based on differences between the MIC and MPC) for
ciprofloxacin and levofloxacin was not remarkable for any of the efflux mutants tested,
but changes in susceptibility to levofloxacin tended to be less than those for
ciprofloxacin. Higher MPC values for levofloxacin resulted in low AUC/MIC ratios
which have been linked to an increased potential of a fluoroquinolone to select for
resistance (115). MPC results for nfxB and nfxC mutants of P. aeruginosa suggest that
mutants selected from strains expressing MexCD-OprJ and MexCD-OprN efflux
systems may results in clinical resistance. Sequence analysis of the gyrA and parC
regions in the recovered mutant are now required to determine if mutants selected from
nfxB mutants represent gyrA mutants. Selection of resistant mutants from 1010 CFU/ml
cultures of P. aeruginosa which overespressed one of four different efflux pumps
resulted in lower levofloxacin AUC/MPC values when compared to AUC/MPC values
obtained for ciprofloxacin. Differences among levofloxacin MPC results for the four
efflux mutants tested suggest that activity of levofloxacin against mutants selected from
strains expressing different efflux pumps is not equal. Thus, differences in mutant

174
selection between ciprofloxacin and levofloxacin among strains of P. aeruginosa may
reside in the preferential ability to restrict the growth of specific efflux mutants of P.
aeruignsoa. This suggestion is in good agreement with previously reported results by
Kohler et al (190) who demonstrated that quinolones vary in their capacity to select
efflux systems in vitro. For older quinolones such as flemequine and nalidixic acid,
nfxC efflux mutants were selected at higher concentrations and were associated with the
highest MICs. In contrast, newer quinolones, which included ciprofloxacin,
trovafloxacin and sparfloxacin, selected nfxB at 2-to-4 times the MIC and nfxB mutants
were associated with the highest levels of resistance. A comparison of ciprofloxacin
and ofloxacin, the parent drug of levofloxacin (levofloxacin is a 50:50 racemate of the
active ingredient in ofloxacin), revealed that at higher concentrations, ciprofloxacin
exclusively selected nfxB mutants, while ofloxacin selected combinations of nfxB and
nfxC mutants. These results demonstrate the differential selection of efflux systems by
quinolones in P. aeruginosa and support the hypothesis that differences in mutant
selection between ciprofloxacin and levofloxacin are attributed to a differential ability
of a fluoroquinolone to restrict the selection of first-step mutants from P.aeruginosa
strains which express different efflux pumps. This hypothesis is of particular
importance in light of recent publications demonstrating the additive effects of multiple
MDR efflux pumps on reduced susceptibility in P. aeruginosa (208, 219, 296). When I
analyzed the recovery of mutants from 1010 CFU/ml cultures of efflux mutants of P.
aeruginosa, selection of resistant mutants was approximately 3-fold higher for

175
levofloxacin when nfxB and nfxC efflux mutants were challenged against increasing
concentrations of ciprofloxacin and levofloxacin and suggests that the MexCD-OprJ
(nfxC) efflux may be a more efficient pump for levofloxacin than for ciprofloxacin in
isolates of P. aeruginosa. This finding is supported by a recent in vivo study by Jumbe
et al (179) who used type-specific efflux pump inhibitors alone and in combination to
verify the central role efflux pumps play in the initial emergence of resistance to
levofloxacin. With therapy, early time points saw the selection of the MexEF-OprN
pump. Later time points demonstrated that the predominant pump system overexpressed
in response to challenge with levofloxacin was MexCD-OprJ.
In the context of MPC testing, an additional question remains; do efflux mutants
represent first-step resistant cells as defined by the MPC measurement? Efflux
expression in P. aeruginosa is constitutive and thus, is likely to operate to some degree
in susceptible populations. It is possible that cumulative decreases in intracellular drug
concentrations for cultures containing >109 CFU/ml result in increased resistance; an
observation not seen with lower numbers of cells (i.e., 105 or 106 CFU/ml). Thus, in a
population of cells 10,000 times greater than those used in conventional susceptibility
tests, the cumulative level of efflux expression results in a shift toward higher levels of
resistance which can be overcome by higher fluoroquinolone concentrations (i.e., the
MPC). In this context, efflux mutants may not represent first-step mutants, as defined
by the conventional definition of MPC, however, in the nalB multidrug-resistant
mutant, overexpression of the mexA-mexB-oprM operon in strains of P. aeruginosa has

176
been associated with a point mutation in mexR, the regulator gene of the efflux operon,
leading to a predicted substitution of Trp for Arg at position 69 in the encoded peptide,
MexR (294). Additional point mutations in the regulatory genes of nalB, nfxB and nfxC
have recently been described (219, 347). Mutations occurring in regulatory efflux
genes are also affected by mutational frequencies that are likely to be influenced by
population dynamics. Thus, mutational events that contribute to efflux expression may
represent first-step mutants. As investigation into MPC expands to include additional
antimicrobial agents, other mechanisms of resistance and specific host-drug-pathogen
combination, the definition of MPC is likely to expand as well. Although the MPC was
initially defined with respect to susceptible populations, the idea applies to any step in
the process of gradual accumulation of mutations (85). In a broad sense, the MPC
correlates with the MIC of the most-resistant mutant present in the bacterial population.
Reductions in intracellular drug concentrations may raise the MPC in strains expressing
efflux mechanisms or may then raise the MIC of the target mutants and, thereby, also
raise the MPC. The concentration boundaries of the MSW place no restriction on the
types of mutants selected (i.e., target versus efflux) and the mechanism of resistance
need not be known to use the selection window idea for restricting the development of
resistance. Restricting the selection of resistant mutants of P. aeruginosa is likely to be
a function of both efflux and target mutations. Selection of resistant mutants within
strains expressing efflux pumps revealed that levofloxacin was less active against both

177
first-step resistant mutants (characterized and uncharacterized) and efflux mutants when
1010 CFU/ml cultures were tested.
MPC results obtained for 155 clinical isolates of P. aeruginosa indicate that no
current dosage of ciprofloxacin or levofloxacin is expected to exceed MPC90 results for
the entire duration of the dosing interval. Thus, minimizing the selection of resistant
mutants of P. aeruginosa with fluoroquinolone is likely to require combination therapy;
however, limited data exists for MPC measurements of other antimicrobial agents alone
or in combination. The primary MICs or MPCs are often the criteria utilized by
clinicians in selecting appropriate combinations of antimicrobials and, many times, only
those antibiotics to which the organism is interpreted as susceptible are used. This
practice appears to assume that synergism is obtained only when the organism is
susceptible to both antibiotics. Unfortunately, with the increased incidence of MDR P.
aeruginosa and other pathogens, the clinician is often faced with only one agent, or
class of agents, that the pathogen is susceptible to. Combination
fluoroquinolone/ceftazidime MPC results restored susceptibility (as determined by a
NCCLS breakpoints for susceptibility) in at least one of the agents used in combination
for 66% of the ciprofloxacin plus ceftazidime tested isolates and 50% of levofloxacin
plus ceftazidime tested isolates. While the remaining strains did not produce
combination MPCs that would result in a susceptible designation, all combination
results increased the length of time inhibitory concentrations are expected to remain in
excess of the MPC. The combination of ciprofloxacin plus ceftazidime extended the
178
amount of time ciprofloxacin and ceftazidime inhibitory concentrations are maintained
for an average of 6.5 and 7.6 hr, respectively, (based on 400 mg T.I.D. ciprofloxacin,
1 g Ceftazidime once daily). Levofloxacin/ceftazidime combinations increased the time
levofloxacin and ceftazidime concentrations are in excess of the combination MPC by
an average of 1.45 and 3.48 hr, respectively. Additionally, combination MPC results
revealed that for every strain tested, at least one of the agents was in excess of the MPC
for >11 hr of a potential 24 hr dosing interval.
The mechanistic difference in anti-pseudomonal activity between ciprofloxacin
and levofloxacin used in combination with ceftazidime is still undetermined and may
attributed to differences in inherent activity of each compound which become
pronounced under combination testing conditions. In an examination of the activity of
levofloxacin in combination with ceftazidime, Visalli et al (345) reported a 12%
synergy between levofloxacin and ceftazidime, which contrasts sharply with the 75%
reported by Bustamant et al (47) with ciprofloxacin/ceftazidime combinations. These
studies highlight the observed differences in the anti-pseudomonal activity of
ciprofloxacin and levofloxacin. In my experiments, half of the isolates tested showed no
decrease in levofloxacin MPC results obtained in combination. According to the
selection window hypotheses, antimicrobial concentrations at the site of infection
should be kept outside the widow to avoid selective enrichment of resistant mutants.
For fluoroquinolones and P. aeruginosa, MPC results suggest that neither ciprofloxacin
nor levofloxacin is expected to maintain concentrations above the MPC90 for a

179
significant duration of the dosing interval, so combination therapy is required to
effectively lower the MPC and the upper boundary of the MSW.
The exact mechanism(s) of action involved in combination therapy with
different drug combinations is not known with certainty and often times “synergy” is
used to describe an increase in effect between two agents that could not demonstrate
activity independently. Enhanced uptake, mutual killing, macrophage activity and
increased permeabilization of the outer membrane have all been suggested as possible
mechanisms in the explanation of success with combination therapies (48, 141, 239).
Conceptually, a combination treatment regimen containing two or more drugs of
different classes should require at least two distinct resistance mutations for the
pathogen to grow. For example, if two agents with differing mechanisms of action
(which also lack cross-resistance) were to fall within the selection window, organisms
would still require two resistance-conferring mutations is order to express resistance.
The simultaneous occurrence of two such mutations is expected to occur much less
frequently than for a mutational event resulting in a single drug-resistant mutation.
This rationale has been used effectively in the combination treatment of M.
tuberculosis. Consequently, combination therapy with two distinct antibiotic types
provides a way to reduce mutant selection using moderate concentrations of compound
that may individually have very high MPC values. The role of combination testing and
the MPC requires further investigation and many questions remain. For example,
combination MPC testing may produce a synergistic result which effectively reduces

180
the MPC of both antimicrobials such that both agents are expected to remain in excess
of the MPC for the duration of the dosing interval. In some cases, such as M.
tuberculosis, the MPC of the first antimicrobial agent may be outside an achievable
drug concentration even when used in combination(s) with other agents, but when
combination therapy with multiple agents that have different molecular targets is
employed, the ability of the bacteria to develop resistance is reduced. For this situation,
matching the PK/PD profiles of multiple agents to ensure that concentrations will rise
and fall above and below the MIC simultaneously could be used to help restrict the
selection of resistant mutants. If at any time during the dosing interval concentrations
of one of the drugs falls below the MIC and the remaining drug is kept above the MIC,
then resistant mutants may be selected. In vitro experiments
In vitro experiments have illustrated that first-step resistant mutants are selected
by fluoroquinolone concentrations when 1010 CFU/ml are exposed to increasing
fluoroquinolone concentrations above the MIC of the wild-type strain. Experimentally,
the MPC can be measured in a two-stage decline in CFUs when 1010 cells are applied to
agar containing increasing fluoroquinolone concentrations. Mutant enrichment and
subsequent outgrowth was illustrated in killing experiments preformed using 1010
CFU/ml cultures tested at the MIC drug concentrations. However, direct in vivo
evidence confirming the selection of resistant mutants of P. aeruginosa with
fluoroquinolone therapy in infections containing >109 cells has not been obtained. I
adapted an abscess rat model (306) to test the hypothesis that resistant mutants could be

181
recovered from animals implanted with 1010 CFU/ml cultures of P. aeruginosa when
given I.V. doses of fluoroquinolones. An isolate of P. aeruginosa (CBRH 25138) with
intermediate susceptibility to ciprofloxacin and levofloxacin was chosen as the infecting
organism since it represented a potentially difficult-to-treat pseudomonal infection.
Previous in vitro experiments indicated that susceptibility differences between mutants
selected from this isolate and parental organisms would be large enough to allow me to
monitor mutant selection using 2-fold susceptibility testing. P. aeruginosa was
recovered from a total of 27 specimens (which included infected tissues, swabs, and
blood cultures) and from 9 different animals given doses of either ciprofloxacin of
levofloxacin (Table 4.3.10). Nearly 20% of the total number of recovered organisms
demonstrated elevated susceptibilities to both ciprofloxacin and levofloxacin,
suggesting the selection of resistant organisms. The recovery of P. aeruginosa from the
infected animals was not a surprising finding and virtually all of the animals tested
became bacteremic. Thus, the intent of the experiment was to demonstrate that cultures
of P. aeruginosa recovered from infected rats represented mutant organisms (with
respect to parental susceptibility) which were selected from 1010 CFU/ml cultures when
treated with fluoroquinolones. Twenty-four percent of the specimens recovered from
rats given a once a day dose of ciprofloxacin or levofloxacin showed increases in the
MICs to ciprofloxacin and levofloxacin and correlated with an average 2-fold increase
in the MIC to ciprofloxacin and 4-fold increase in MIC to levofloxacin. The MIC of the
recovered mutants were 4 and 16 μg/ml for ciprofloxacin and levofloxacin,

182
respectively, and were in agreement with the MPC for the initial strain used to create
infection. One specimen showed a 4- and 8-fold increase in the ciprofloxacin and
levofloxacin MICs that may relate to the difference in serum versus tissue
concentrations of fluoroqouinolones.
These results are based on preliminary experiments using a single isolate of P.
aeruginosa and relatively small numbers of animals and, as such, require additional
testing. However, based on these results, a number of observations can already be
made. Resistant organisms were recovered from 3/9 animals tested and phenotypic
analysis of resistance was consistent with the hypothesis that first-step resistant mutants
are selected from within 1010 CFU/ml cultures of P. aeruginosa when tested by
fluoroquinolones at sub-MPC drug concentrations. This result is consistent with my in-
vitro experiments. Resistant organisms were recovered from rats after three days of
fluoroquinolone treatment, suggesting that mutant organisms pre-exist in populations in
excess of 107 CFU/ml and can be selected for and enriched by sub-inhibitory drug
concentrations. The degree of fluoroquinolone resistance in the recovered mutants was
4-fold higher for levofloxacin than for ciprofloxacin, which is consistent with MPC90
results. Mutant organisms were only recovered from animals given a once daily dose of
fluoroquinolone. If fluoroquinolone concentrations drop below the MPC, and if the
decline of the susceptible populations occurs quickly, either as function of antibiotic
action or immune deviation, then mutant enrichment is likely to occur for a majority of
the dosing interval giving rise to the selective enrichment of mutant organisms. A

183
T.I.D. dose, which results in higher concentrations near or above the MPC for a longer
period will inhibit first-step resistant mutants and prevent the selection of resistant
organisms. For animals give T.I.D. doses of ciprofloxacin or levofloxacin, it is possible
that mutant populations were not enriched above threshold that would allow them to
detected during standardized susceptibility testing. DNA sequence analysis of gyrA and
parC QRDR regions in the recovered mutants will help to correlate increased
fluoroquinolone resistance with potential target mutations. Comparison of target
sequences in the mutants recovered from infected rats could then be compared with
those obtained under in vitro testing to demonstrate that the same mutant variant was
selected in vivo.
184
5.0 Comparison of the MIC, MBC, and MPC Measurements for Ciprofloxacin, Levofloxacin and Garenoxacin Against Enteric Gram-negative UTI Pathogens
5.1 Abstract Acute, uncomplicated UTIs are among the most commonly encountered
bacterial infections. Management of these infections has been made more complicated
by the trend toward increasing antimicrobial resistance, especially to β−lactams (i.e.,
ampicillin) and trimethoprim/sulfamethoxazole (TMP-SMX), among uropathogens in
the last decade. Fluoroquinolones are suggested as alternative antimicrobials for the
treatment of UTIs in communities for which TMP-SXT resistance is > 10%. The MPC
represents a novel susceptibility parameter designed to minimize the selection of first-
step resistant mutants present in large, >1010 CFU/ml, cultures. In the following work, I
measured MPC results for 80 clinical enteric, Gram-negative urinary isolates and 20
isolates of P. aeruginosa against ciprofloxacin, levofloxacin and an experimental
fluoroquinolone, garenoxacin. Ciprofloxacin MPC results for C. freundii, E. cloacae,
E. coli, K. pneumoniae, and P. aeruginosa were 0.5, 1, 1, 1 and 4 μg/ml, respectively.
MPC results for levofloxacin against C. freundii, E. cloacae, E. coli, , K. pneumoniae
and P. aeruginosa were 1, 2, 4, 2 and 16 μg/ml, respectively. MPC results for
garenoxacin against C. freundii, E. cloacae, E. coli, K. pneumoniae, and P. aeruginosa
were 1, 8, >8, 4 and >32 μg/ml, respectively. For ciprofloxacin against E. cloacae,
E. coli, and K. pneumoniae and for levofloxacin against C. freundii, E. coli, and K.
pneumoniae, MPC results were below susceptible breakpoints. Analysis of MPC

185
results in relation to the PK for garenoxacin, suggests that concentrations are in excess
of MPC results for the entire length of the dosing interval for E. coli. Overall, the MPC
results for ciprofloxacin and levofloxacin were within clinically achievable and
sustainable drug concentrations for > 24 hr of the dosing interval against all organisms
tested. These results further demonstrate that MPC is a novel susceptibility
measurement, reflecting drug activities against first-step resistant organisms present as
sub-populations within overall susceptible populations and, as such, is distinct from
MIC and MBC measurements of susceptibility. The application of the MPC to
fluoroquinolones and the management of UTI represents a situation where high levels
of in vitro activity, based on low MICs, is reflected in low MPC values for most of the
organisms tested. Incorporation of MPC results into current fluoroquinolone dosing in
UTIs represents a realistic approach for preventing the further selection of resistant
organisms associated with these infections.

186
5.2 Introduction
UTIs are one of the most commonly infectious diseases for which antibiotic
therapy is prescribed (350). In the United States, UTIs account for nearly 8 million
physician visits per year and > 100,000 hospital admissions (182, 350). Gram-negative
bacteria typically account for a large proportion of UTIs with E. coli accounting for 75-
to-90% of all UTIs (139, 169, 261). A number of different antimicrobials are used in
the treatment of UTI which include (TMP-SMX), amoxicillin, cephalexin,
nitrofurantoin and fluoroquinolones such as ciprofloxacin, levofloxacin, and, most
recently, gatifloxacin (29, 261, 350). Emerging antimicrobial resistance is beginning to
impact on the empiric treatment of UTIs. For example, among E. coli isolates, 33-to-
60% of the bacterial strains causing cystitis and phylonephritis demonstrate resistance
to either amoxicillin or ampicillin (121, 182, 261), and up to 22% of strains may be
resistant to TMP-SMX (330). In comparison, resistance to the commonly used
fluoroquinolones ciprofloxacin and levofloxacin remains low, at approximately 2-to-5%
(182, 184).
Many characteristics of the fluoroquinolones make them ideal agents for the
management of UTIs. As a class, the fluoroquinolones are highly active in vitro against
nearly all significant urinary pathogens (30). They are able to penetrate the prostate
well and most are renally excreted, allowing them to concentrate to very high
concentrations in the urine (168, 251). Fluoroquinolones generally have a high degree
of oral bioavailability, which allows for oral therapies for infections that traditionally

187
would have been treated with intravenous antibiotics and their long half-lives allow for
once or twice daily dosing. Consequently, fluoroquinolones have been and will
continue to be used extensively in the treatment and prevention of UTIs, particularly in
situations were TMP-SMX resistance is > 10% (350).
When fluoroquinolones were first introduced in the 1980s, nearly all organisms
recovered from patients with UTIs were considered susceptible in vitro. Even today,
fluoroquinolones remain among the most active oral agents against urinary tract
isolates (26, 101). However, over the past decade a number of studies have reported a
substantial increase in the prevalence of fluoroquinolone resistance among urinary tract
isolates and the prevalence of fluoroquinolone resistance has progressively risen. For
example, fluoroquinolone resistance levels among urinary isolates of E. coli have been
reported as high as 25% within Latin America (121). More disturbingly, many isolates
commonly now have single point mutations in gyrA that presage progression to full
resistance with additional mutations. Therefore, minimizing the step-wise selection of
fluoroquinolone-resistant Gram-negative bacteria is an important factor in preventing
further increases in fluoroquinolone resistance among Gram-negative uropathogens.
The MPC is a novel susceptibility measurement designed to identify and inhibit the
most-resistant first-step resistant organisms present in large (>1010 CFU/ml).
heterogeneous bacterial cultures. In the following work, I measured MIC, MBC and
MPC results for 100 Gram-negative urinary tract isolates for two commonly prescribed
fluoroquinolones, ciprofloxacin and levofloxacin, and for a developmental

188
fluoroquinolone garenoxacin (BMS 284756) which has been shown to possess activity
against Gram-negative UTI pathogens in vitro (59, 118).

189
5.3 RESULTS
Clinical isolates of C. freundii (n=20), E. cloacae (n=20), E. coli (n=20), K.
pneumoniae (n=20) and P. aeruginosa (n=20) obtained from urinary tract specimens
were tested by MIC, MBC and MPC as described in the Materials and Methods section.
Comparison of MPC90 values revealed a relative hierarchy in fluoroquinolone potency
(table 5.3.1).
Against the 20 C. freundii isolates, modal MIC values were <0.06, 0.25 and
<0.06-0.125 μg/ml, respectively, for ciprofloxacin, levofloxacin and garenoxacin, while
modal MPC values were 0.125-0.5, 0.5 and 0.25 μg/ml, respectively. For the 20 E.coli
isolates (Figure 5.3.1) the modal MIC values for ciprofloxacin, levofloxacin and
garenoxacin was <0.06, while the modal MPC values were 0.125-0.25, 0.25 and 0.25-
0.5 μg/ml, respectively. Ciprofloxacin and levofloxacin had the same modal MIC
values against strains of E. cloacae (<0.06 μg/ml), whereas the values for garenoxacin
were between <0.06-0.125 μg/ml. The modal MPC values against E. cloacae strains
were 0.125 μg/ml for ciprofloxacin and 1 μg/ml for levofloxacin and garenoxacin.
Against the 20 clinical strains of K. pneumoniae, modal MIC values were <0.06 μg/ml
for ciprofloxacin, <0.06-0.125 μg/ml for levofloxacin and 0.125 μg/ml for garenoxacin;
modal MPC values were 0.5 μg/ml, 1 μg/ml and 1-4 μg/ml, respectively. Finally, the
modal MIC values against the 20 clinical isolates of P. aeruginosa were <0.06 mg/ml,

190
Table 5.3.1 MIC, MBC, and MPC Distributions for UTI Isolates Against Ciprofloxacin, Levofloxacin, and Garenoxacin
Fluoroquinolone Susceptibility μg/ml
Pathogen
FQ Measurement
<0.06 0.125 0.25 0.5 1 2 4 8 16 >32 Mean number of cells tested (CFU/ml)
MPC/susceptibililty measurement
Result for 90% of isolates
Cpx MIC-AD MIC-MB MBC MPC
14 16 15 0
4 2 1 5
1 0 0 3
1 2 1 5
0 1 1 3
0 0 0 4
0 0 0 0
0 0 0 0
2.33x10⁶ 2.33x10⁶ 2.33x10⁶ 2.87x10¹⁰
16 4 4 ----
0.125 0.5 0.5 2
Grx MIC-AD MIC-MB MBC MPC
5 3 3 0
5 5 5 0
2 3 3 4
0 1 1 2
3 2 2 4
1 2 2 3
4 3 3 4
0 1 1 4
2.33x10⁶ 2.33x10⁶ 2.33x10⁶ 2.87x10¹⁰
2 2 2 ----
4 4 4 8
C. freundii (n=20)
Lfx MIC-AD MIC-MB MBC MPC
5 9 5 0
5 3 5 1
6 5 5 0
4 3 3 8
0 0 2 3
0 0 0 8
0 0 0 0
0 0 0 0
2.33x10⁶ 2.33x10⁶ 2.33x10⁶ 2.87x10¹⁰
4 4 1 ----
0.5 0.5 1 2
Cpx MIC-AD MIC-MB MBC MPC
18 18 18 4
1 0 0 7
0 0 0 5
1 1 1 1
0 1 1 1
0 0 0 1
0 0 0 1
0 0 0 0
1.60x10⁶ 1.60x10⁶ 1.60x10⁶ 6.62x10¹⁰
16.6 16.6 16.6 ----
<0.06 <0.06 <0.06 1
E. cloaceae (n=20)
Grx MIC-AD MIC-MB MBC MPC
7 7 7 0
7 7 7 0
3 2 2 0
2 0 0 4
1 4 4 8
0 0 0 3
0 0 0 1
0 0 0 >4
1.60x10⁶ 1.60x10⁶ 1.60x10⁶ 6.62x10¹⁰
>16 >8 >8 ----
0.5 1 1 >8

191
Lfx MIC-AD MIC-MB MBC MPC
14 15 15 0
3 3 3 1
2 1 1 3
1 0 0 6
0 1 1 7
0 0 0 0
0 0 0 2
0 0 0 1
1.60x10⁶ 1.60x10⁶ 1.60x10⁶ 6.62x10¹⁰
4 32 32 ----
0.25 0.25 0.25 4
Cpx MIC-AD MIC-MB MBC MPC
17 19 19 1
2 1 1 8
1 0 0 8
0 0 0 3
0 0 0 0
0 0 0 0
0 0 0 0
0 0 0 0
1.63x10⁶ 1.63x10⁶ 1.63x10⁶ 7.78x10¹⁰
4 8.3 8.3 ----
0.125 <0.06 <0.06 0.5
Grx MIC-AD MIC-MB MBC MPC
15 19 19 0
4 1 1 0
0 0 0 8
1 0 0 8
0 0 0 3
0 0 0 1
0 0 0 0
0 0 0 0
1.63x10⁶ 1.63x10⁶ 1.63x10⁶ 7.78x10¹⁰
8 16.6 16.6 ----
0. 125 <0.06 <0.06 1
E.coli (n=20)
Lfx MIC-AD MIC-MB MBC MPC
16 19 19 0
2 1 1 0
1 0 0 12
1 0 0 5
0 0 0 2
0 0 0 1
0 0 0 0
0 0 0 0
1.63x10⁶ 1.63x10⁶ 1.63x10⁶ 7.78x10¹⁰
4 16.6 16.6 ----
0. 25 <0.06 <0.06 1
Cpx MIC-AD MIC-MB MBC MPC
14 19 18 1
2 0 1 3
3 1 0 7
1 0 1 3
0 0 0 4
0 0 0 2
1.06x10⁶ 1.06x10⁶ 1.06x10⁶ 3.42x10¹⁰
4 16 16 ----
0.25 <0.06 <0.06 1
Grx MIC-AD MIC-MB MBC MPC
0 4 3 0
10 12 12 0
8 4 5 0
2 0 0 2
0 0 0 6
0 0 0 6
0 0 0 6
1.06x10⁶ 1.06x10⁶ 1.06x10⁶ 3.42x10¹⁰
16 16 16 ----
0.25 0.25 0.25 4
K. pneumoniae (n=20)
Lfx MIC-AD MIC-MB MBC MPC
9 10 7 0
9 5 8 0
0 3 1 1
2 3 1 4
2 1 2 10
0 1 1 4
0 0 0 1
1.06x10⁶ 1.06x10⁶ 1.06x10⁶ 3.42x10¹⁰
2 2 2 ----
0.5 1 1 1

192
Cpx MIC-AD MIC-MB MBC MPC
9 2 2 0
0 6 4 0
7 8 7 0
2 3 1 0
2 2 4 0
0 1 2 2
0 0 0 7
0 0 0 2
1.60x10⁶ 1.60x10⁶ 1.60x10⁶ 6.6x10¹⁰
4 4 2 ----
1 1 2 4
Grx MIC-AD MIC-MB MBC MPC
1 0 0 0
6 0 0 0
5 4 1 0
5 9 4 0
2 5 10 0
0 1 4 2
1 0 0 10
0 1 1 8
1.60x10⁶ 1.60x10⁶ 1.60x10⁶ 6.62x101
>8 >4 >4 ----
4 4 8 >32
P. aeruginosa (n=20)
Lfx MIC-AD MIC-MB MBC MPC
4 3 1 0
7 6 5 0
5 7 4 0
3 1 7 0
1 3 3 4
0 0 0 10
0 0 0 5
0 0 0 1
1.60x10⁶ 1.60x10⁶ 1.60x10⁶ 6.62x10¹⁰
8 4 4 ----
2 4 4 16
Cpx. Ciprofloxacin. Lfx. Levofloxacin. Grx. Garenoxacin. MIC-AD. MIC obtained with agar dilution. MIC-MB. MIC obtained with microbroth dilution.

193
012345678
1 0 0 0 0 0 0
1 0 0 0 0 0 0 0
1 E + 0 8
1 E + 0 9
1 E + 1 0
1 E + 1 1
> 4
012345678
1 0 0 0 0 0 0
1 0 0 0 0 0 0 0
1 E + 0 8
1 E + 0 9
1 E + 1 0
1 E + 1 1
1 X 1 0 7
1 X 1 0 9
1 X 1 0 1 1
L f l i
012345678
1 0 0 0 0 0 0
1 0 0 0 0 0 0 0
1 E + 0 8
1 E + 0 9
1 E + 1 0
1 E + 1 1
> 4
0
1
2
3
4
5
6
7
8
1 0 0 0 0 0 0
1 0 0 0 0 0 0 0
1 E + 0 8
1 E + 0 9
1 E + 1 0
1 E + 1 1
1 X 1 0 7
1 X 1 0 9
1 X 1 0 1 1
0
2
4
68
1 0
1 2
1 4
1 6
MIC
-agar
dilution
MIC
-microbroth
dilution
MB
C
MP
C
MIC
-agar
dilution
MIC
-microbroth
dilution
MB
C
MP
C
MIC
-agar
dilution
MIC
-microbroth
dilution
MB
C
MP
C
1 0 0 0 0 0 0
1 0 0 0 0 0 0 0
1 E + 0 8
1 E + 0 9
1 E + 1 0
1 E + 1 1
1 X 1 0 7
1 X 1 0
C ip r o f l o x a c in L e v o f l o x a ic n G a r e n o x a c in
> 1 6
1x10¹¹
1x10⁹
1x10⁷
1x10¹¹
1x10⁹
1x10⁷
1x10¹¹
1x10⁹
1x10⁷
1x10¹¹
1x10⁹
1x10⁷
1x10¹¹
1x10⁹
1x10⁷
Sus
cept
ibili
ty v
alue
(μg/
ml)
Inoc
ulum
test
ed (C
FU/m
L)
Figure 5.3.1 MIC, MBC and MPC Results for 100 Gram-negative Urinary Isolates of C. freundii, E. coli, E. cloacae, K. pneumoniae and P aeruginosa for Ciprofloxacin, Garenoxacin, and Levofloxacin
MIC, MBC and MPC distributions for C. freundii (n=20), E. coli (n=20), E. cloacae (n=20), K. pneumoniae (n=20), and P. aeruginosa (n=20) against ciprofloxaicn, levofloxaicn, and garenoxacin. MIC-agar refers to MICs performed using the agar dilution method, MIC-microbroth refers to performed using the microbroth dilution method. Lines indicate the number of cells tested for each test.
C. freundii
E. coli
E. cloacae
K. pneumonia
P. aeruginosa

194
0.5 μg/ml and 1-2 μg/ml, respectively for ciprofloxacin, levofloxacin and
garenoxacin. The modal MPC values were 4 μg/ml, 8 μg/ml and 16 μg/ml,
respectively. MPC distributions did not directly correlate with MIC results. For
example, all agents tested had MIC90 values of <0.06 μg/ml against E. coli but
ciprofloxacin was 2-fold more active by MPC than both levofloxacin and
garenoxacin. Based on MIC values, ciprofloxacin was at least 8-fold more active
than levofloxacin against isolates of K. pneumoniae, but both ciprofloxacin and
levofloxacin reported MPC90 values of 1 μg/ml. Garenoxacin was 4-fold more
active than levofloxacin against K. pneumoniae as determined by the MIC90, but
was 2-fold less active by MPC. Low MPC results tended to correlate with low
MIC results, however, MPC measurements against the Gram-negative organisms
tested could not be directly extrapolated from MIC results in all instances, which
were reflected in the ratios of MPC/MIC. Although all three quinolones
demonstrated high levels of in vitro activity against strains of E. coli, the range
between the MIC and the MPC was among the highest observed for any pathogen.
The MPC results obtained for C. freundii, E. cloacae, E. coli, K. pneumoniae and
P. aeruginosa for the three quinolones were generally 2-4, 8-16, 16, 16 and 4 times
greater than the MIC. The only exception to this trend was found for levofloxacin
against K. pneumoniae, were a 2-fold difference between the MIC and MPC was
observed. As a greater number of organisms are tested, the MPC/MIC ratio may
serve as a general guideline for assessing quinolone MPCs against different

195
pathogens through batch studies that may eliminate the need for determining an
individual MPC.
The lowest MPC results were observed for isolates of E. coli, followed by K.
pneumoniae, E. cloacae, C. freundii and P. aeruginosa (Table 5.3.1). MPC results for
ciprofloxacin and levofloxacin against Gram-negative urinary tract pathogens were
generally low. For ciprofloxacin, the MPC results for E. cloacae, E. coli, and K.
pneumoniae were all at or below the susceptible breakpoint as set by the NCCLS (< 1
μg/ml). The MPC results for C. freundii and P. aeruginosa were at an intermediate (2
μg/ml) and above a resistant (4 μg/ml) breakpoint. For levofloxacin, MPCs against C.
freundii, E. coli, and K. pneumoniae were below a susceptible breakpoint (<2 μg/ml),
while MPCs against E. cloacae and P. aeruginosa were at intermediate (4 μg/ml) and
resistant (8 μg/ml) breakpoints. No breakpoints for garenoxacin have been developed,
however, based on the published PK (120) and reports on the in vitro activity (118), it
is hypothesized that only E. coli may have low enough garenoxacin MPC values to still
be considered susceptible.

196
5.4 DISCUSSION
Acute, uncomplicated UTIs are among the most commonly encountered
bacterial infections. Management of these infections has been made more complicated
by the trend toward increasing antimicrobial resistance, especially to β−lactams and
TMP-SMX, among uropathogens in the last decade (168). The current standard of
therapy for empiric treatment of acute, uncomplicated UTIs is TMP-SXT (350), but the
prevalence of resistance to TMP-SMX among uropathogens is increasing (168, 169)
and empiric therapy without the guide of laboratory results can no longer ensure
success. Consequently, quinolones are increasingly being used as first line agents for
the treatment of UTIs and in vitro susceptibility results have become important in the
management of these infections (26). Laboratory susceptibility results are a valuable
tool for clinicians and can be used to guide therapeutic decisions. MICs obtained via
microbroth dilution, agar dilution, disk diffusion, or E-tests are typical susceptibility
tests preformed in clinical settings (258). The MBC is less commonly preformed and
represents concentrations which kill 99% of the culture. The bactericidal action of
quinolones generally results in a very tight dispersion between MIC and MBC results,
usually <1 doubling dilution (247, 270, 346). To date, no studies have specifically
addressed the relationship between MBC and MPC measurements. Differences of 2- to
16-fold were noted between MPC and MBC measurements for ciprofloxacin,
garenoxacin, and levofloxacin against isolates of C. freundii, E. cloacae, E. coli, , K.
pneumoniae, and P. aeruginosa. MPC results measured for isolates of C. freundii, E.

197
cloacae, E. coli, K. pneumoniae, and P. aeruginosa fell within a susceptible NCCLS
designation for many of the quinolones tested, however, differences between the
MIC/MBC and MPC were observed for every drug-pathogen combination which ranged
from 4-to-16-fold for ciprofloxacin, 2-to 16-fold for levofloxacin and 2-to 16-fold for
garenoxacin. With the exception of MBC measurements, all susceptibility tests were
preformed using identical test volumes, differing only in the number of cells tested.
Thus, the MPC measurement is fundamentally different from standardized susceptibility
measurements because it utilizes an inoculum that accounts for the presence of first-step
resistant cells. Inhibiting the growth of the most-resistant mutant present in
subpopulations within susceptible 1010 CFU/ml cultures will minimize the step-wise
development of fluoroquinolone resistance. No differences in ciprofloxacin and
levofloxacin MPC results were seen for C. freundii, E. coli, and K. pneumoniae.
Ciprofloxaicn MPC results were 4-fold lower seen with levofloxacin against isolates of
E. cloacae and P. aeruginosa.
PK/PD analysis of ciprofloxacin and levofloxacin concentrations in healthy
volunteers have demonstrated urinary Cmax of 43 and 84 μg/ml, respectively (45, 252).
Therefore, ciprofloxacin and levofloxacin concentrations are expected to remain in
excess of the MPC for greater than 24 hr of the dosing interval for all Gram-negative
uropathogens tested. No published experiments regarding urine Cmax values for
garenoxacin have been determined, but it is expected that urinary Cmax concentrations
will exceed published serum levels. Thus, garenoxacin may be effective at preventing

198
the selection of resistant organisms of E. coli and K. pneumoniae if concentrations
above the MPC for these organisms can be achieved and maintained.
Fluoroquinolone treatment for UTIs can be used as a model to examine the
clinical utility of the MPC measurement. Despite nearly 25 years of documented use of
fluoroquinolones in the treatment of UTI, the incidence of fluoroquinolone resistance
remains low (112), ranging from 2-to-5% in Canada and the United States (139, 181,
182). Correlations between antimicrobial consumption and resistance for other
antimicrobial classes and examination of fluoroquinolone resistance for Gram-negative
pathogens outside the urinary tract, implies that a higher incidence of quinolone
resistance should be expected among urinary tract pathogens. A possible explanation
for the low incidence of fluoroquinolone resistance among Gram-negative urinary tract
pathogens is that urinary concentrations of fluoroquinolones may be 100- to 1000-fold
higher than those obtained at other anatomical sites (251, 252). Thus, urinary quinolone
concentrations are expected to remain in excess of the MPC for a number of Gram-
negative pathogens throughout the majority of the dosing interval. This argument does
not preclude resistance from occurring; clearly fluoroquinolone resistance rates among
Gram-negative pathogens have been described (121). It is possible, particularly within
Latin American and developing countries, that quinolone resistance is higher because of
the use of less active quinolones such as nalidixic acid and or the use of low dosages
which may select resistant isolates (121). High-level resistant organisms may be
selected at different sites of infection where MPC values cannot be achieved or

199
maintained for sufficient periods to prevent the selection of resistant organisms that can
then infect the urinary tract. However, high concentrations of quinolones obtained in
the urine do not guarantee success as is illustrated by the observation that in vitro
resistance to TMP-SMX predicts an approximate 50% failure rate with TMP-SMX
therapy despite this agent’s high urine concentrations and long half life (139, 231, 234,
299, 335, 359). Thus, clinical failures can be expected with fluoroquinolones as well.
Sheng et al (325) examined sets of isolates from the mid to late 1980s and mid to late
1990s to examine fluoroquinolone resistance in clinically important Gram-negative
bacteria in Japan. E. coli isolates were highly susceptible to fluoroquinolones prior to
1996; however, by 1996, 20% of the strains had become resistant to one of the
fluoroquinolone tested, although ciprofloxacin resistance remained low. The authors
also noted a 13-to-20% decline in susceptibility to fluoroquinolones for Enterobacter
spp. and P. aeruginosa. While resistance correlates with the wide spread use of these
antimicrobial agents in Japan, increased use alone could not account for these
observations. Some strains of S. marcescens and P. aeruginosa demonstrated in vitro
resistance prior to the introduction of fluoroquinolones in Japan (229) and many strains
demonstrated clonal diversity suggesting that resistance was due to more than one
resistant clone. It was further noted that 62% of the patients infected with a
fluoroquinolone-resistant bacteria had no previous exposure to the drug (229).
Fluoroquinolone-pathogen combinations that result in small MPC/MIC ratios and
overall low MPCs (below a breakpoint for resistance) should be targeted in strategies

200
designed to maximize clinical outcomes while minimizing resistance. Fluoroquinolone
use in UTIs for the treatment of infections caused by Gram-negative bacteria describes
situations where the initial degree of resistance (based on the MIC) and the potential to
selectively amplify resistant subpopulations (based on the MPC) are also low.
The future role of fluoroquinolones in UTI remains strong and the clinical
longevity of these agents will be influenced by how resistance evolves. For
fluoroquinolones and Gram-negative urinary tract pathogens, the distinction between
the MIC and the MPC remains relatively small and concentrations of quinolones in the
urine suggest that MPC drug concentrations can be maintained throughout dosing.
Therefore, the recognition of spontaneous first-step mutants present within large (i.e.,
>107 CFU/ml) susceptible cultures is an important factor in preventing the step-wise
selection of quinolone-resistant strains. MPC results for C. freundii, E. coli and K.
pneumoniae fall beneath a susceptible breakpoint and demonstrate how the MPC
measurement can be easily incorporating in current dosing regimes. Urinary
concentrations of fluoroquinolones suggest that in organisms with high MPCs such as
E. cloacae and P. aeruginosa, minimizing the selection of resistant mutants may still
be accomplished due to the high urinary concentrations achieved and maintained
throughout current dosing.

201
6.0 CONCLUDING REMARKS
Since the introduction of sulfa drugs and penicillin in the 1930s and 1940s,
science and medicine have witnessed more than half a century of development and
use of antibiotics which have clearly altered the course of medical history and will
continue to define the antibiotic era. Past policies for dealing with resistance have at
best been only partially effective and despite developments, we continue to face the
same challenges encountered at the beginning of the antibiotic era. As an example, in
1960, Gould stated, “we are as yet at an elementary stage in correlating the clinical
administrations of antibiotics with in vitro sensitivity determinations” (136).
Based on current knowledge, one can surmise three inherent principals involved
with antibiotics and resistance:
1. antibiotic resistance is an undeniable fact and will continue to be a problem as long
as we use (and misuse) antimicrobial agents,
2. bacteria are remarkably adaptive and will continue to evolve and acquire new
mechanisms of resistance to antimicrobial agents, and
3. prior strategies for dealing with antibiotic resistance have failed to slow the
progression and in some cases have clearly failed. Therefore, novel approaches for
dealing with resistance are required.
In this thesis, I have discussed a novel measure of drug potency that is based on
a susceptibility parameter termed the MPC and highlighted how incorporation of the

202
MPC into the concept of the MSW may be used in an attempt to preserve antimicrobial
efficacy, minimize resistance, and maximize clinical outcome.
Experimentally, the MPC can be described in a characteristic two-stage decline in
bacterial growth. The first stage of colony decline occurs at fluoroquinolone
concentrations which approximate the MIC of the wild-type strain. At fluoroquinolone
concentrations above the MIC of the wild-type strain, a plateau in cell death occurs
which corresponds to the emergence of drug-resistant mutants. Increasing
fluoroquinolone concentrations results in a second decline in colony recovery, leading
to the eventual MPC for the given isolate. For any given fluoroquinolone-pathogen
combination, the selection of resistant mutants and the corresponding MSW will be
different. For example, for organisms which remain highly susceptible to
fluoroquinolones, such as S. pneumoniae, the plateau in cell death will be relatively
short, and the MPC may fall within a susceptible breakpoint for the drug. Conversely,
P. aeruginosa represents an organism where the differences between MIC and MPC
measurements are large and mutant selection occurs over broad concentration ranges.
However, despite these differences, the potential utility of the MPC measurement for
restricting the selection of fluoroquinolone resistant mutants remain the same.
In chapter 3, I described how the MPC measurement could be used to identify
key differences in the anti-pneumococcal activity of six fluoroquinolones deemed
clinically equivalent. When applied to drug PK/PD profiles, MPC measurements were
used to predict the potential of each agent to select for resistance. In order of

203
descending activity, a hierarchy of potency based on the ability to inhibit first-step
resistant mutants was determined: gemifloxacin>moxifloxacin>gatifloxacin =
trovafloxacin >grepafloxacin > levofloxacin. Gemifloxacin, and moxifloxacin were the
only compounds tested whose serum/tissue concentrations are expected to remain in
excess of the MPC for >12 hr of the dosing interval, suggesting that they may be
appropriate for once daily dosing. Levofloxacin selected mutants at the highest
concentration of any quinolone tested and serum concentrations of levofloxacin were
projected to remain in excess of the MPC for approximately 3 hr of the dosing interval
(the lowest of any quinolone tested). Thus, a higher (possibly 750 mg) dose of
levofloxacin and/or more frequent dosing may be required to prevent the selection of
fluoroquinolone-resistant S. pneumoniae, which is consistent with recent reports of
levofloxacin-associated clinical failures in the treatment of S. pneumoniae (7, 70, 340,
351). Sequence analysis of the QRDR for the parC and gyrA genes of selected clinical
isolates revealed the presence of target mutants which raises concerns about
accumulation of fluoroquinolone resistance alleles among clinical isolates of S.
pneumoniae that are not detected in traditional susceptibility testing procedures.
Fluoroquinolone killing of S. pneumoniae at the MPC drug concentration resulted in
increased killing and bacterial eradication by 24 hr, indicating that targeting the MPC
may also have an impact on the speed of clinical resolution. There is little doubt that
fluoroquinolone resistance in strains of S. pneumoniae has increased during the past
decade (53). For example, a number of studies have shown that once the prevalence of

204
resistance begins to increase noticeably, it can advance from below 5% to above 20%
within a few years (13, 175) .
Currently, fluoroquinolone resistance among clinical isolates of S. pneumoniae
remains relatively low and new strategies/susceptibility testing procedures, such as the
MSW and the MPC, can impact the degree of resistance and the rate at which it
develops. Past lessons, such as the escalation of penicillin resistance within S.
pneumoniae have shown us that low dose therapy caused an increase in the carriage of
resistant isolates and, after mutant spread to fresh hosts, curing infections required
higher doses of penicillin or new derivatives having greater potency or different binding
targets. Prolonged and gradual step-wise selection with β-lactams coupled with
dissemination of plasmid-borne factors resulted in the selective enrichment of resistant
isolates which has made penicillin ineffective against a third of the S. pneumoniae
isolates in some areas (79, 160). Therefore, MPC testing for fluoroquinolones and S.
pneumoniae represents a realistic approach for dealing with resistance before it
becomes highly disseminated among clinical isolates and is of particular importance in
light of the fact that fluoroquinolone treatment for S. pneumoniae is often administered
in culture-negative patients.
The in vitro susceptibility of P. aeruginosa to ciprofloxacin and levofloxacin has
not always correlated with clinical outcomes and a number of clinical observations
suggest that differences in anti-pseudomonal activity are not reflected by the MIC.
When clinical isolates of P. aeruginosa were tested by the MPC approach, ciprofloxacin

205
was 2 -to 4-fold more active than levofloxacin. MPC90 results indicate that no current
dose of levofloxacin is able to exceed the levofloxacin MPC90 result for any length of a
dosing period. In contrast, a 400 mg I.V. T.I.D. dose of ciprofloxacin is expected to
exceed the ciprofloxacin MPC90 result for approximately 5.5 hr of the 24-hr dosing
interval. Based on these results, I conclude that: i) neither compound should be used in
monotherpy, ii) levofloxacin selects and enriches more first step mutants at higher
concentrations and, iii) for a longer duration of the dosing interval. Thus, observed
differences in clinical outcomes may be attributed to the fact that the levofloxacin MPC
is not achieved or maintained under current dosing regimes, allowing first-step resistant
mutants to proliferate during therapy. Sequence analysis of regions of the gyrA and
parC genes revealed target mutations in recovered mutants that were not present in
parental isolates. Differences in the anti-mutant activity between ciprofloxacin and
levofloxacin may reside in the differential selection of resistant mutants. Sequence
analysis of the target genes in recovered mutants revealed that levofloxacin may select
different target mutants and mutant-selection curves preformed on efflux mutants
revealed that levofloxacin was more efficient at selecting efflux mutants at low and
moderate concentrations. MPC-based killing experiments revealed that killing at the
MPC drug concentration severely restricted mutant growth when the MPC and MIC
drug concentrations were directly compared. Preliminary in vivo experiments
preformed with a rat abscess model of infection revealed that resistant mutants are
selected during therapy.

206
Examination of MPC results for Gram-negative urinary tract pathogens
suggested that the MPC measurement could be practically applied in current dosing to
prevent the selection of resistant mutants and maximizing clinical outcomes. The MPC
measurement and concept of MSW provides a rationale strategy designed to prevent the
selection and amplification of de novo resistance, however, a number of limitations in
MPC testing currently exist. As indicated by Allen (6), the most important difficulty
encountered in determination of the MPC lies in achieving the targeted inoculums.
Bacterial organisms which do not readily achieve >1010 CFU/ml may require additional
numbers of MPC plates, for each concentration tested, to ensure that 1010 CFU/ml are
tested. This procedure does not lend itself to a high throughput clinical setting. If the
MPC is to gain utility in a typical clinical setting, streamlining of the methodology may
be necessary (6). The application of MPC testing to the clinical microbiology
laboratory may require that batch studies be performed on a representative number of
bacterial species which could serve as an indicator of activity for the entire species
population. If a relationship between MIC and MPC results can be deciphered, then
clinicians, microbiologist, pharmacologists and scientists may be able to extrapolate
MPC activity directly from the MIC. Advances in molecular diagnostics may allow for
the real-time detection of a single first-step mutant within a background of 108 cells
(215-217). Currently, MPC testing relies on an agar dilution method and some drug-
pathogen combinations require broth dilution testing as per NCCLS recommendations.

207
The application of MPC testing to non-quinolone antimicrobials is an area that
requires further investigation. While the majority of experiments describing the MPC
have been conducted with fluoroquinolones, additional studies on other antimicrobial
agents have been performed (147, 221). Zhoa et al (367) published MPC data for
chloramphenicol, penicillin G, rifampicin and tobramycin against E. coli . Recently,
my colleagues and I described the effect of antimicrobial concentration on colony-
forming ability of resistant mutant subpopulations of Mycobacterium smegmatis and S.
aureus for chloramphenicol, erythromycin, moxifloxacin, penicillin and tetracycline
(221). Ongoing investigations of MPC measurements with macrolides and S. aureus
and S. pneumoniae suggest that MPC studies are relevant to this class of agents (32,
235) Azithromycin-susceptible strains (MICs <0.5 µg/ml) were tested by MPC. For
some isolates, MPC values ranged from 16->512 µg/ml and were positive for the ermC
gene, whereas the wild-type parental strains were negative (Blondeau and Metzler,
unpublished observations). The ermC-positive isolates also had elevated MIC/MPC
values to other macrolide compounds (32). MPC is most easily considered with
organisms in which resistance arises as a function of single point mutation which
include fluoroquinolones and third generation cephalosporins among others. However,
in the broadest sense, resistance to an antimicrobial agent means that a particular
microorganism is able to reproduce in the presence of the agent under specified
conditions. Resistance may be associated with a specific heritable alteration or
induction of protective genes such as those encoding β-lactamses. Heritability would

208
seem to make resistance an absolute term since changes in DNA primary structure are
unequivocal. However, in some cases resistance genes are not fully protective and
some drugs, perhaps used at higher concentrations, prove effective. Consequently, the
term resistance must be qualified to take into account the antimicrobial drug
concentration (85). As initially proposed in the discussion of efflux resistance in
Chapter 5, the MSW hypothesis (for which the MPC is the upper boundary) places no
restriction on the type of resistance mechanism selected. As bacterial inoculums
increase, so too does the heterogeneity of the bacterial culture. Increased inoculums
may dilute intracellular targets or enzymatic activity of resistance mechanisms which
serve to increase resistance beyond what is measured by the MIC. If under these
conditions, higher concentrations of antimicrobial are required to inhibit cultures, then a
MPC measurement may apply. In a recent clarification of the mutant selection window,
Zhao (366) suggests that once a small fraction of mutants is present in an infected
individual or heterogeneous culture, the key idea in preventing the selection of
resistance will be whether resistant mutants will be enriched; not how they came into
being. In this respect, the MPC may apply to a number of different antimicrobial
agents.
The issue of “collateral damage”, or the unwanted selection of resistant
organisms due to high quinolone concentrations, was an issue raised by Livermore
(218) in regard to the MPC. Prolonged low-dose therapy has unquestionably led to the
development of resistance, however, dosing based on MPC measurements champions

209
higher doses administered over a potentially shorter duration of therapy; a hypothesis
supported by preliminary killing experiments. The implication that quinolones may
directly contribute to the selection of resistant mutants can be inferred based on
evidence that quinolones are strong inducers of the S.O.S. response (284-286).
However, a number of observations suggest that quinolones contribute minimally to
resistance. For example, maximal induction of the S.O.S. response by fluoroquinolones
in various organisms typically occurs at concentrations 10-to 15-fold above the MIC
values for a number of bacterial species (284). The MPC results, for most bacterial
species, are generally 2- to 8-fold greater than typical MIC results. Mutational studies
on a LexA- strain of E. coli revealed no differences in the mutational frequency at which
quinolone resistance developed when compared to LexA isogenic strains (Xillin Zhao,
personal communications).
Perhaps the most important question surrounding the MPC concerns its potential
clinical impact. Although in vitro observations and retrospective clinical observations
support the role of MPC in minimizing the selection of resistant mutants,
no direct evidence from animal or human trials are currently available to test the
hypothesis that incorporation of MPC-based testing in antimicrobial management will
correlate with decreased clinical resistance and improved therapeutic outcomes. In my
animal studies, organisms displaying elevated resistance could be recovered from
infected animals when a strain with an intermediate MIC was used to create infection.
The enrichment of mutant subpopulations in vivo is a reasonable explanation for the

210
recovery of such resistant organisms. A recent report which used a rabbit model of
pneumococcal infection to investigate the selection of resistant mutants of S.
pneumoniae revealed that, after levofloxacin or moxifloxacin treatments, mutants could
be recovered from strains with a pre-existing parC mutation (99). The authors
rationalized this finding by suggesting that strains with a pre-existing parC mutation
caused drug concentrations to fall below the MPCs of these strains. Further in vivo
(animal and human trials) are now required to test theimplicatons of the MPC
measurement and the MSW concept.
Conventional wisdom suggests that resistant mutants are inherently less “fit”
than wild-type cells and as a result, elicit reduced growth rates (129). However, recent
data suggests that mutations in parC and gyrA genes may, on some occasions, not be
associated with a physiological deficit (129). Furthermore, in some cases resistance
may associated with an increase in fitness, as assessed by increased growth rate (42).
The clinical consequence of mutant subpopulations is currently unknown. The theory
behind the MPC measurement implies that one resistant mutant is as etiologically
important as 100,000 mutants; however, from a clinical perspective, this argument may
not hold true. The dissemination of penicillin-resistant S. pneumoniae serotypes 3, 14,
19F and 23F demonstrate how the spread of individual resistant clones can impact on
global resistance and demonstrates the necessity for minimizing resistance. In the
context of S. pneumoniae, recent evidence (7, 70) indicates that treatment failures are
associated with resistant organisms which were not present at the start of therapy. In

211
light of these observations, strategies designed to minimize the impact of resistance
should incorporate ideas which make it difficult for organisms to select and/or acquire
resistance mechanisms. In this context, the clinical application of the MPC is clear:
maintaining serum/tissue concentrations in excess of the MPC (within tolerable doses)
will require cells to obtain two concurrent resistance mutations for growth and thereby
severely restrict the likelihood that resistant mutants will be selected during therapy.
As we learn more about the accumulation of antibiotics in infected tissues, the
types of resistance mutants selected by different agents within different drug
concentration spectrums, and the concentrations required to inhibit their growth, the
practical implications of the MPC will continue to emerge. A recent review of MPC by
Blondeau et al (32) noted that the development of MPC is a relatively new concept that
continues to evolve with every report. Therefore, with such a new concept and
relatively limited studies published to date, it may be premature to comment on
overstretching the limits of MPC when we do not yet know if the limits have been
defined (32). Open debates and discussions will help to develop a greater
understanding of fluoroquinolone resistance and the potential impact of the MPC.
Based on the development of penicillin-resistant S. pneumoniae, clinical validation may
come in the form of increased clinical failures and a rapid rise in the rates of resistance.
Thus, perhaps the most meaningful clinical question regarding the MPC is whether or
not we can afford to take “a wait and see” approach to fluoroquinolone resistance?

212
7.0 REFERENCES
1. 1998. National Nosocomial Infections Surveillance (NNIS) System report, data
summary from October 1986-April 1998, issued June 1998. American Journal of Infection Control. 26:522-633.
2. Akasaka, A., M. Tanaka, A. Yamaguchi, and K. Sato. 1999. Cloning, expression, and enzymatic characterization of Pseudomonas aeruginosa topoisomerase IV. Antimicrobial Agents and Chemotherapy. 43:530-536.
3. Akasaka, A., M. Tanaka, A. Yamaguchi, and K. Sato. 1999. Cloning, expression, and enzymatic characterization of Pseudomonas aeruginosa topoisomerase IV. Antimicrob Agents Chemother 43:530-536.
4. Akasaka, T., M. Tanaka, J. Yamaguchi, and K. Sato. 2001. Type II topoisomerase mutations in fluoroquinolone-resistant clinical strains of Pseudomonas aeruginosa isolated in 1998 and 1999: role of target enzyme in mechanism of fluoroquinolone resistance. Antimicrobial Agents and Chemotherapy. 45:2263-2268.
5. Allen, A., E. Bygate, S. Oliver, M. Johnson, C. Ward, A. J. Cheon, Y. S. Choo, and I. C. Kim. 2000. Pharmacokinetics and tolerability of gemifloxacin (SB-265805) after administration of single oral doses to healthy volunteers. Antimicrobial Agents and Chemotherapy. 44:1604-8.
6. Allen, G. P. 2003. The Mutant Prevention Concentration (MPC): A Review. Journal of Infectious Disease Pharmacotherapy. 6:27-47.
7. Anderson, K. B., J. S. Tan, T. M. File, Jr., J. R. DiPersio, B. M. Willey, and D. E. Low. 2003. Emergence of levofloxacin-resistant pneumococci in immunocompromised adults after therapy for community-acquired pneumonia. Clinical Infectious Disease. 37:376-81.
8. Andrews, J. M., D. Honeybourne, G. Jevons, N. P. Brenwald, B. Cunningham, and R. Wise. 1997. Concentrations of levofloxacin (HR 355) in

213
the respiratory tract following a single oral dose in patients undergoing fibre-optic bronchoscopy. Journal of Antimicrobial Chemotherapy. 40:573-7.
9. Appelbaum, P. C., and P. A. Hunter. 2000. The fluoroquinolone antibacterials: past, present and future perspectives. International Journal of Antimicrobial Agents 16:5-15.
10. Atlas, E., H. Clark, F. Silverblatt, and M. Turck. 1969. Nalidixic acid and oxolinic acid in the treatment of chronic bacteriuria. Annals of Internal Medicine 70:713-21.
11. Azoulay-Dupuis, E., J. P. Bedos, J. Mohler, G. Peytavin, R. Isturiz, P. Moine, V. Rieux, C. Cherbuliez, J. C. Pechere, B. Fantin, and T. Kohler. 2004. Activities of garenoxacin against quinolone-resistant Streptococcus pneumoniae strains in vitro and in a mouse pneumonia model. Antimicrobial Agents and Chemotherapy 48:765-73.
12. Ball, P. A. 1998. The Quinolones: history and overivew, p. 29-80. In A. VT (ed.), The Quinolones. Academic Press, San Francisco.
13. Baquero, F. 1996. Trends in antibiotic resistance of respiratory pathogens: an analysis and commentary on a collaborative surveillance study. Antimicrobial Agents and Chemotherapy 38 (suppl A):117-132.
14. Baquero, F., and M. C. Negri. 1997. Strategies to minimize the development of antibiotic resistance. journal of Chemotherapy 9 Suppl 3:29-37.
15. Bartlett, J. G., R. F. Breiman, L. A. Mandell, and T. M. File. 1998. Comunity-acquired pneumonaie in adults: guidelines for management. Clinical Infectious Disease 26:811-838.
16. Bartlett, J. G., S. F. Dowell, M. L. A., F. T. M., M. D. M., and F. M. J. 2000. Practice guidelines for the management of community-acquired pneumonia in adults. Clinical Infectious Disease 31:347-382.

214
17. Bast, D. J., D. E. Low, C. L. Duncan, L. Kilburn, L. A. Mandell, R. J. Davidson, and J. C. de Azavedo. 2000. Fluoroquinolone resistance in clinical isolates of Streptococcus pneumoniae: contributions of type II topoisomerase mutations and efflux to levels of resistance. Antimicrobial Agents and Chemotherapy 44:3049-54.
18. Bates, A. D., M. H. O'Dea, and M. Gellert. 1996. Energy couplin in Escherichia coli DNA gyrase: the relationship between nucleotide binding, strand passage, and DNA supercoiling. Biochemistry 25:1408-1416.
19. Bauer, L. A., J. J. Piecoro, Jr., H. D. Wilson, and R. A. Blouin. 1983. Gentamicin and tobramycin pharmacokinetics in patients with cystic fibrosis. Clinical Pharmacology 2:262-4.
20. Bauernfeind, A., and C. Petermuller. 1983. In vitro activity of ciprofloxacin, norfloxacin and nalidixic acid. European Journal of Clinical Microbiology 2:111-5.
21. Benko, A. S., D. M. Cappelletty, J. A. Kruse, and M. J. Rybak. 1996. Continuous infusion versus intermittent administration of ceftazidime in critically ill patients with suspected gram-negative infections. Antimicrobial Agents and Chemotherapy 40:691-5.
22. Bhavnani, S. M., W. A. Callen, A. Forrest, K. K. Gilliland, D. A. Collins, J. A. Paladino, and J. J. Schentag. 2003. Effect of fluoroquinolone expenditures on susceptibility of Pseudomonas aeruginosa to ciprofloxacin in U.S. hospitals. American Journal of Health System Pharmacists 60:1962-70.
23. Birmingham, M. C., R. Guarino, A. Heller, J. H. Wilton, A. Shah, Hejmanowski, D. E. Nix, and J. J. Schentag. 1999. Ciprofloxacin concentratins in lung tissue following a single 400 mg I.V dose. Journal of Antimicrobial Chemotherapy 43 (suppl A):43-48.
24. Blanche, F., B. Cameron, F. X. Bernard, L. Maton, B. Manse, L. Ferrero, N. Ratet, C. Lecoq, A. Goniot, D. Bisch, and J. Crouzet. 1996. Differential behaviors of Staphylococcus aureus and Escherichia coli type II DNA topoisomerases. Antimicrobial Agents and Chemotherapy 40:2714-20.

215
25. Blaser, J., B. B. Stone, M. C. Groner, and S. H. Zinner. 1987. Comparative study with enoxacin and neilimicin in a pharmacodynamic model to determine importance of ratio of peak concentration to MIC for bacterial activity and emergence of resistance. Antimicrobial Agents and Chemotherapy 31:1054-1060.
26. Blondeau, J. M. 2004. current issues in the management of urinary tract infections: extended release ciprofloxacin as a novel treatment option. Drugs 64:611-628.
27. Blondeau, J. M. 2003. Emerging resistance to vancomycin, rifampin, and fluoroquinlones in Streptococcus pneumonaie., p. 49-78. In S. H. Gillespie (ed.), Management of Multiple Drug Resistance Infections. Human Press Inc., Totowa, NJ.
28. Blondeau, J. M. 1999. Expanded activity and utility of the new fluoroquinolones: a review The quinolones: decades of development and use. Clinical Therapeutics 21:3-40.
29. Blondeau, J. M. 2000. Gatifloxacin: a new fluoroquinolone. Expert Opininon
on Investigational Drugs 9:1877-95.
30. Blondeau, J. M. 2000. A review of clinical trials with fluoroquinolones with an emphasis on new agents. Expert Opinion on Investigational Drugs 9:383-413.
31. Blondeau, J. M., G. Hansen, S. Borsos, L. Irivine, and L. Blanco. 2003. In vitro susceptibility of 4903 bacterial isolates of gemifloxacin-an advanced fluoroquinolone. International Journal of Antimicrobial Agents. 22:-147-154.
32. Blondeau, J. M., G. Hansen, K. Metzler, and P. Hedlin. 2004. The Role of PK/PD Parameters to Avoid Selection and Increase of Resistance: Mutant Prevention Concentration. Journal of Chemotherapy Suppl 3: 1-19.
33. Blondeau, J. M., and G. T. Hansen. 2001. Moxifloxacin: a review of the microbiological, pharmacological, clinical and safety features. Expert Opininon in Pharmacotherapy 2:317-35.

216
34. Blondeau, J. M., G. T. Hansen, K. L. Metzler, and K. Drlica. 2002. Optimal Killing of Streptococcus pneumoniae by gemifloxacin, levofloxacin, and moxifloxacin. Royal society of Medicine press 76:15-26.
35. Blondeau, J. M., and B. Missaghi. 2004. Gemifloxacin: a new fluoroquinolone. Expert Opinion in Pharmacotherapy 5:1-34.
36. Blondeau, J. M., M. E. Suter, S. Borsos, and C. Misfeldt. 1998. Canadian Pseudomonas aeruginosa susceptibility study from 48 medical centers: focus on ciprofloxacin. International Journal of Antimicrobial Agents 10:297-302.
37. Blondeau, J. M., and Y. Yaschuk. 1996. Canadian ciprofloxacin susceptibility study: comparative study from 15 medical centers. Canadian Ciprofloxacin Study Group. Antimicrobial Agents and Chemotherapy 40:1729-32.
38. Blondeau, J. M., and Y. Yaschuk. 1997. Canadian Multicenter Susceptibility Study, with a focus on cephalosporins, from 15 Canadian medical centers. The Canadian Multicenter Study Group. Antimicrobial Agents and Chemotherapy 41:2773-5.
39. Blondeau, J. M., Y. Yaschuk, M. Suter, and D. Vaughan. 1999. In-vitro susceptibility of 1982 respiratory tract pathogens and 1921 urinary tract pathogens against 19 antimicrobial agents: a Canadian multicentre study. Canadian Antimicrobial Study Group. Journal of Antimicrobial Chemotherapy 43 Suppl A:3-23.
40. Blondeau, J. M., X. Zhao, K. Drlica, and G. Hansen. 2000. Presented at the 40th Interscience Conference on Antimicrobial Agents and Chemotherapy., Toronto, Ont, Canada. Sept 17-20.
41. Blondeau, J. M., X. Zhao, G. Hansen, and K. Drlica. 2001. Mutant prevention concentrations of fluoroquinolones for clinical isolates of Streptococcus pneumoniae. Antimicrobial Agents and Chemotherapy 45:433-8.

217
42. Blot, M., B. Hauer, and G. Monnet. 1994. The Tn5 bleomycin resistance gene confers improved survival and growth advantage on Escherichia coli. Molecular Genetics 242:595-601.
43. Bowker, K. E., M. Wooton, C. A. Rodgers, R. Lewis, H. A. Holt, and A. P. MacGowan. 1999. Comparison of in vitro pharmacodynamics of once and twice daily ciprofloxacin. Journal of Antimicrobial Chemotherapy 44:661-667.
44. Bristol Myers Squibb. Coneticut, U. 2001. Package insert Gatifloxacin.
45. Brittain, D. C., B. E. Scully, M. J. McElrath, R. Steinman, P. Labthavikul, and H. Neu. 1985. The pharmacokinetics and serum and urine bactericidal activity of ciprofloxacin. Journal of Clinical Pharmacology 25:82-88.
46. Brueggemann, A. B., S. L. Coffman, P. Rhomberg, H. Huynh, L. Almer, A. Nilius, R. Flamm, and G. V. Doern. 2002. Fluoroquinolone resistance in Streptococcus pneumoniae in United States since 1994-1995. Antimicrobial Agents and Chemotherapy 46:680-8.
47. Bustamante, C. I., R. C. Wharton, and J. C. Wade. 1990. In vitro activity of ciprofloxacin in combination with ceftazidime, aztreonam, and azlocillin against multiresistant isolates of Pseudomonas aeruginosa. Antimicrobial Agents and Chemotherapy 34:1814-5.
48. Cappelletty, D. M., and M. J. Rybak. 1996. Bactericidal activities of cefprozil, penicillin, cefaclor, cefixime, and loracarbef against penicillin-susceptible and -resistant Streptococcus pneumoniae in an in vitro pharmacodynamic infection model. Antimicrobial Agents and Chemotherapy 40:1148-52.
49. Catchpole, C., J. M. Andrews, J. Woodcock, and R. Wise. 1994. The comparative pharmacokinetics and tissue penetration of single-dose ciprofloxacin 400 mg i.v. and 750 mg po. Journal of Antimicrobial Chemotherapy 33:103-10.
50. (CBSN), C. B. S. N. 2002, posting date. http://www.microbiology.mtsinai.on.ca/research/cbsn.shtml. [Online.]

218
51. Chamberland, S., J. L'Ecuyer, C. Lessard, M. Bernier, P. Provencher, and M. G. Bergeron. 1992. Antibiotic susceptibility profiles of 941 gram-negative bacteria isolated from septicemic patients throughout Canada. The Canadian Study Group. Clinical Infectious Disease 15:615-28.
52. Chen, C. R., M. Malik, M. Snyder, and K. Drlica. 1996. DNA gyrase and topoisomerase IV on the bacterial chromosome: quinolone-induced DNA cleavage. Journal of Molecular Biology 258:627-637.
53. Chen, D., A. McGeer, J. C. de Azavedo, D. E. Low, and T. C. B. S. Network. 1999. Decreased susceptibility of Streptococcus pneumonaie to fluoroquinolones in Canada. New England Journal of Medicine 341:233-239.
54. Chen, Y. W., Y. S. Chen, S. S. Lee, M. Y. Yen, S. R. Wann, H. H. Lin, W. K. Huang, and Y. C. Liu. 2002. A pilot study of oral fleroxacin once daily compared with conventional therapy in patients with pyogenic liver abscess. Journal of Microbiology and Immunology Infection 35:179-83.
55. Chien, S. C., A. T. Chow, J. Natarajan, R. R. Williams, F. A. Wong, M. C. Rogge, and R. K. Nayak. 1997. Absence of age and gender effects on the pharmacokinetics of a single 500-milligram oral dose of levofloxacin in healthy subjects. Antimicrobial Agents and Chemotherapy 41:1562-5.
56. Chien, S. C., M. C. Rogge, L. G. Gisclon, C. Curtin, F. Wong, J. Natarajan, R. R. Williams, C. L. Fowler, W. K. Cheung, and A. T. Chow. 1997. Pharmacokinetic profile of levofloxacin following once-daily 500-milligram oral or intravenous doses. Antimicrobial Agents and Chemotherapy 41:2256-60.
57. Chien, S. C., F. A. Wong, C. L. Fowler, S. V. Callery-D'Amico, R. R. Williams, R. Nayak, and A. T. Chow. 1998. Double-blind evaluation of the safety and pharmacokinetics of multiple oral once-daily 750-milligram and 1-gram doses of levofloxacin in healthy volunteers. Antimicrobial Agents and Chemotherapy 42:885-8.
58. Chow, J. W., M. J. Fine, D. M. Shlaes, J. P. Quinn, D. C. Hooper, M. P. Johnson, R. Ramphal, M. M. Wagener, D. K. Miyashiro, and V. L. Yu.

219
1991. Enterobacter bacteremia: clinical features and emergence of antibiotic resistance during therapy. Annals of Internal Medicine 115:585-90.
59. Christiansen, K. J., J. M. Bell, J. D. Turnidge, and R. N. Jones. 2004. Antimicrobial Activies of Garenoxacin (BMS 283756) against Asia-Pacific Region Clinical Isolates from the SENTRY Program, 1999 to 2001. Antimicrobial Agents and Chemotherapy 48:2049-2055.
60. Chu, D. T., P. B. Fernandes, A. K. Claiborne, L. Shen, and A. G. Pernet. 1988. Structure-activity relationships in quinolone antibacterials: design, synthesis and biological activities of novel isothiazoloquinolones. Drugs Experimental Clinical Research 14:379-83.
61. Chu, D. T., I. M. Lico, A. K. Claiborne, J. J. Plattner, and A. G. Pernet. 1990. Structure-activity relationship of quinolone antibacterial agents: the effects of C-2 substitution. Drugs Experimal Clinical Research 16:215-24.
62. Chu, D. T., I. M. Lico, R. N. Swanson, K. C. Marsh, J. J. Plattner, and A. G. Pernet. 1990. Synthesis and biological properties of A-71497: a prodrug of tosufloxacin. Drugs Experimal Clinical Research 16:435-43.
63. Cohen, S. P., H. Hachler, and S. B. Levy. 1993. Genetic and functional analysis of the multiple antibiotic resistance (mar) locus in Escherichia coli. Journal of Bacteriology 175:1484-92.
64. Cohen, S. P., D. C. Hooper, J. S. Wolfson, K. S. Souza, L. M. McMurry, and S. B. Levy. 1988. Endogenous active efflux of norfloxacin in susceptible Escherichia coli. Antimicrobial Agents and Chemotherapy 32:1187-91.
65. Craig, W. A. 1998. Pharmacokinetic/Pharmacodynamic parameters: rationale for antibacterial dosing of mice and men. Clinical Infectious Disease 26:1-10.
66. Croisier, D., M. Etienne, L. Piroth, E. Bergoin, C. Lequeu, H. Portier, and P. Chavanet. 2004. In vivo pharmacodynamic efficacy of gatifloxacin against Streptococcus pneumoniae in an experimental model of pneumonia: impact of

220
the low levels of fluoroquinolone resistance on the enrichment of resistant mutants. Journal of Antimicrobial Chemotherapy 54:640-647.
67. Dagan, R., K. P. Klugman, W. A. Craig, and F. Baquero. 2001. Evidence to support the rationale that bacterial eradication in respiratory tract infection is an important aim of antimicrobial therapy. Journal of Antimicrobial Chemotherapy 47:129-40.
68. Dalhoff, A. 1999. Pharmacodynamics of fluoroquinolones. Journal of Antimicrobial Chemotherapy 43:51-59.
69. Dalhoff, A., and F.-J. Schmitz. 2003. In vito antibacterial activity and pharmacodynamics of new quinolones. European Journal of Clinical Microbiology 22:203-221.
70. Davidson, R., R. Cavalcanti, J. L. Brunton, D. J. Bast, J. C. de Azavedo, P. Kibsey, C. Fleming, and D. E. Low. 2002. Resistance to levofloxacin and failure of treatment of pneumococcal pneumonia. New England Journal of Medicine 346:747-50.
71. Davies, T. A., A. Evangelista, S. Pfleger, K. Bush, D. F. Sahm, and R. Goldschmidt. 2002. Prevalence of single mutations in topoisomerase type II genes among levofloxacin-susceptible clinical strains of Streptococcus pneumoniae isolated in the United States in 1992 to 1996 and 1999 to 2000. Antimicrobial Agents and Chemotherapy 46:119-24.
72. Davis, R., A. Markham, and J. A. Balfour. 1996. Ciprofloxacin. An updated review of its pharmacology, therapeutic efficacy and tolerability. Drugs 51:1019-74.
73. Deitz, W. H., J. H. Bailey, and E. J. Froelich. 1963. In Vitro Antibacterial Properties of Nalidixic Acid, a New Drug Active against Gram-Negative Organisms. Antimicrobial Agents and Chemotherapy 161:583-7.
74. den Hollander, J. G., J. W. Mouton, and H. A. Verbrugh. 1998. Use of pharmacodynamic parameters to predict efficacy of combination therapy by

221
using fractional inhibitory concentration kinetics. Antimicrobial Agents and Chemotherapy 42:744-8.
75. d'Escrivan, T., M. Roussel-Delvallez, S. Alfandari, and B. Guery. 2003. High level of resistance to levofloxacin of Streptococcus pneumoniae following fluoroquinolone therapy. Infection 31:366.
76. Diekema, D. J., M. A. Pfaller, R. N. Jones, G. V. Doern, P. L. Winokur, A. C. Gales, H. S. Sader, K. Kugler, and M. Beach. 1999. Survey of bloodstream infections due to gram-negative bacilli: frequency of occurrence and antimicrobial susceptibility of isolates collected in the United States, Canada, and Latin America for the SENTRY Antimicrobial Surveillance Program, 1997. Clinical Infectious Disease 29:595-607.
77. Diver, J. M., L. J. Piddock, and R. Wise. 1990. The accumulation of five quinolone antibacterial agents by Escherichia coli. Journal of Antimicrobial Chemotherapy 25:319-33.
78. Doern, G. V. 2001. Antimicrobial use and the emergence of antimicrobial resistance with Streptococcus pneumoniae in the United States. Clinical Infectious Disease 33 Suppl 3:S187-92.
79. Doern, G. V., and S. D. Brown. 2004. Antimicrobial susceptibility among community-acquired respiratory tract pathogens in the USA: data from PROTEKT US 2000-01. Infection 48:56-65.
80. Doern, G. V., K. P. Heilmann, H. K. Huynh, P. R. Rhomberg, S. L. Coffman, and A. B. Brueggemann. 2001. Antimicrobial resistance among clinical isolates of Streptococccus pneumonaie in the United States during 1999-2000, including a comparison of resistance rates since 1994-1995. Antimicrobial Agents and Chemotherapy 45:1721-1729.
81. Domagala, J. M. 1994. Structure-activity and structure-side-effect relationships for the quinolone antibacterials. Journal of Antimicrobial Chemotherapy 33:685-706.

222
82. Domagala, J. M., L. D. Hanna, C. L. Heifetz, M. P. Hutt, T. F. Mich, J. P. Sanchez, and M. Solomon. 1986. New structure-activity relationships of the quinolone antibacterials using the target enzyme. The development and application of a DNA gyrase assay. Journal of Medical Chemistry 29:394-404.
83. Dong, Y., X. Zhao, J. Domagala, and K. Drlica. 1999. Effect of fluoroquinolone concentration on selection of resistant mutants of Mycobacterium bovis BCG and Staphylococcus aureus. Antimicrobial Agents and Chemotherapy 43:1756-8.
84. Dong, Y., X. Zhao, B. N. Kreiswirth, and K. Drlica. 2000. Mutant prevention concentration as a measure of antibiotic potency: studies with clinical isolates of Mycobacterium tuberculosis. Antimicrobial Agents and Chemotherapy 44:2581-4.
85. Drlica, K. 2003. Controlling Antibioitc Resistance: strategies based on the mutant selection window, p. 295-331. In F. Drlica (ed.), Reemrgence of established pathogens in the 21st century. Plenum publishers, New York.
86. Drlica, K. 2003. The mutant selection window and antimicrobial resistance. Journal of Antimicrobial Chemotherapy 52:11-7.
87. Drlica, K. 2001. A Strategy for fighting antibioitc resistance. ASM News 67:27-33.
88. Drlica, K., and M. Malik. 2003. Fluoroquinolone: Action and Resistance. Current Topics in Medicinal Chemistry 3:249-282.
89. Drlica, K., and F. Schmitz. 2002. Therapeutic options in an era of decreasing antimicrobial susceptibility. Journal of Chemotherpay 14 (suppl. 2):5-12.
90. Drlica, K., and X. Zhao. 1997. DNA gyrase, topoisomerase IV, and the 4-quinolones. Microbiology and Molecular Biology Reviews 61:377-392.

223
91. Drusano, G., M. T. Labro, O. Cars, P. Mendes, P. Shah, F. Sorgel, and W. Weber. 1998. Pharmacokinetics and pharmacodynamics of fluoroquinolones. Clinical Microbiology and Infection 4 Suppl 2:S27-S41.
92. Drusano, G. L. 1995. Pharmacology of antiinfective agents, p. 225-233. In B. J. Mendel GL, Dolin R (ed.), Principles and Practice of Infectious Diseases. Churchill Livingstone, New York.
93. Drusano, G. L., D. Johnson, M. Rosen, and M. Standiford. 1993. Pharmacodynamics of a fluoroquinolone antimicrobial agent in a neutropenic rat model of Pseudomonas spesis. Antimicrobial Agents and Chemotherapy 37:483-40.
94. Drusano, G. L., S. L. Preston, R. C. Owens, Jr., and P. G. Ambrose. 2001. Fluoroquinolone pharmacodynamics. Clinical Infectious Disease 33:2091-6.
95. Efthymiopoulos, C. 1997. Pharmacokineitcs of grepafloxacin. Journal of Antimicrobial Chemotherapy 40(suppl A):35-43.
96. Emmerson, A. M., and A. M. Jones. 2003. The quinolones: decades of development and use. Journal of Antimicrobial Chemotherapy 51 Suppl 1:13-20.
97. Empey, P. E., H. R. Jennings, A. C. Thornton, R. P. Rapp, and M. E. Evans. 2001. Levofloxacin failure in a patient with pneumococcal pneumonia. Annals of Pharmacotherapy 35:687-90.
98. Erttmann, M., R. Krausse, and U. Ullmann. 1990. Pharmacokinetics of imipenem in patients undergoing major colon surgery. Infection 18:367-71.
99. Etienne, M., D. Croisier, P. E. Charles, C. Lequeu, L. Piroth, H. Portier, K. Drlica, and P. Chavanet. 2004. Effect of low-level resistance on subsequent enrichment of fluoroquinolone-resistant Streptococcus pneumoniae in rabbits. Journal of Infectious Disease 190:1472-1475.
224
100. Feldman, W. E. 1976. Concentrations of bacteria in cerebrospinal fluid of patients with bacterial meningitis. Journal of Pediatrics 88:549-52.
101. Felmingham, D., and S. Arakawa. 2001. Resistance among urinary tract pathogens. Expereinece outside the USA. Clinical Drug Investigation 21:7-11.
102. Felmingham, D., D. J. Farrell, R. R. Reinert, and I. Morrissey. 2004. Antibacterial resistance among children with community-acquired respiratory tract infections (PROTEKT 1999-2000). Journal of Infection 48:39-55.
103. Felmingham, D., M. D. O'Hare, M. J. Robbins, R. A. Wall, A. H. Williams, A. W. Cremer, G. L. Ridgway, and R. N. Gruneberg. 1985. Comparative in vitro studies with 4-quinolone antimicrobials. Drugs Experimental Clinical Research 11:317-29.
104. Ferrero, L., B. Cameron, and J. Crouzet. 1995. Analysis of gyrA and grlA mutations in stepwise-selected ciprofloxacin-resistant mutants of Staphylococcus aureus. Antimicrobial Agents and Chemotherapy 39:1554-8.
105. Ferrero, L., B. Cameron, and B. Manse. 1994. Cloning and primary structure of Stapylococcus aureus DNA topoisomerase IV: a primary target of fluoroquinolones. Molecular Microbiology 13:641-653.
106. File, T. M., Jr., J. Garau, F. Blasi, C. Chidiac, K. Klugman, H. Lode, J. R. Lonks, L. Mandell, J. Ramirez, and V. Yu. 2004. Guidelines for empiric antimicrobial prescribing in community-acquired pneumonia. Chest 125:1888-901.
107. Finegold, S. M., L. G. Miller, D. Posnick, D. K. Patterson, and A. Davis. 1966. Nalidixic acid: clinical and laboratory studies. Antimicrobial Agents and Chemotherapy 6:189-97.
108. Fink, M. P., D. R. Snydman, M. S. Niederman, K. V. Leeper, Jr., R. H. Johnson, S. O. Heard, R. G. Wunderink, J. W. Caldwell, J. J. Schentag, G. A. Siami, and et al. 1994. Treatment of severe pneumonia in hospitalized patients: results of a multicenter, randomized, double-blind trial comparing

225
intravenous ciprofloxacin with imipenem-cilastatin. The Severe Pneumonia Study Group. Antimicrobial Agents and Chemotherapy 38:547-57.
109. Firsov, A. A., S. N. Vostrov, I. Y. Lubenko, K. Drlica, Y. A. Portnoy, and S. H. Zinner. 2003. In vitro pharmacodynamic evaluation of the mutant selection window hypothesis using four fluoroquinolones against Staphylococcus aureus. Antimicrobial Agents and Chemotherapy 47:1604-13.
110. Fish, D. N., M. K. Choi, and R. Jung. 2002. Synergic activity of cephalosporins plus fluoroquinolones against Pseudomonas aeruginosa with resistance to one or both drugs. Journal of Antimicrobial Chemotherapy 50:1045-9.
111. Fish, D. N., and A. T. Chow. 1997. The clinical pharmacokinetics of levofloxacin. Clinical Pharmacokinetics 32:101-19.
112. flemingham D, A. S. 2001. Resistance among urinary tract pathogens. Expereinece outside the USA. Clinical Drug Investigation 21:7-11.
113. Florea, N. R., P. R. Tessier, C. Zhang, C. H. Nightingale, and D. P. Nicolau. 2004. Pharmacodynamics of moxifloxacin and levofloxacin at simulated epithelial lining fluid drug concentrations against Streptococcus pneumoniae. Antimicrobial Agents and Chemotherapy 48:1215-21.
114. Fogarty, C., R. Goldschmidt, and K. Bush. 2000. Bacteremic pneumonia due to multidrug-resistant pneumococci in 3 patients treated unsuccessfully with azithromycin and successfully with levofloxacin. Clinical Infectious Disease 31:613-5.
115. Forrest, A., D. E. Nix, C. H. Ballow, T. F. Goss, M. C. Birmingham, and J. J. Schentagg. 1993. Pharmacodynamics of intavenous ciprofloxacin in seriously ill patients. Antimicrobial Agents and Chemotherapy 37:1073-1081.
116. Frisch, A. W., J. T. Tripp, C. D. Barrett, and B. E. Pidgeon. 1942. Specific polysaccaride content of pneumonia lungs. Journal of Experimental Medicine 76:505-510.

226
117. Fukuda, H., and K. Hiramatsu. 1999. Primary targets of fluoroquinolones in Streptococcus pneumoniae. Antimicrobial Agents and Chemotherapy 43:410-2.
118. Fung-Tomc, J. C., B. Minassian, B. Kolek, E. Huczko, L. Aleksunes, T. Stickle, T. Washo, E. Gradelski, L. Valera, and D. Bonner. 2000. Antibacterial spectrum of a novel des-fluoro(6) quinolone, NMS-284756. Antimicrobial Agents and Chemotherapy 44:3351-3356.
119. Furet, Y. X., J. Deshusses, and J. C. Pechere. 1992. Transport of pefloxacin across the bacterial cytoplasmic membrane in quinolone-susceptible Staphylococcus aureus. Antimicrobial Agents and Chemotherapy 36:2506-2511.
120. Gajjar, D. A., A. Bello, Z. Ge, L. Christopher, and M. Grasella. 2003. Multiple dose safety and pharmacokinetics of oral garenoxacin in healthy subjects. Antimicrobial Agents and Chemotherapy 47:2256-2263.
121. Gales, A. C., R. N. Jones, K. Gordon, H. S. Sader, W. W. Werner, W. Mondell, L. Beach, M. A. Pfaller, G. V. Doern, and a. t. S. s. g. L. America). 2000. Activity and spectrum of 22 antimicrobial agents tested against urinary tract infection patehtogens in hospitalized patients in Latin America: report from the second year of the SENTRY antimicrobial surveillance program (1998). Journal of Antimicrobial Chemotherapy 45:295-303.
122. Gellert, M. 1981. DNA topoisomerases. Annual Reviews in Biochemisrty 50:879-910.
123. Gellert, M., K. Mizuuchi, M. H. O'Dea, T. Itoh, and J. I. Tomizawa. 1977. Nalidixic acid resistance: a second genetic character involved in DNA gyrase activity. Procedings from the National Acadamy of Science U S A 74:4772-6.
124. Giamarellou, H. 2002. Prescribing guidelines for severe Pseudomonas infections. Journal of Antimicrobial Chemotherapy 49:229-33.
125. Giamarellou, H. 2000. Therapeutic guidelines for Pseudomonas aeruginosa infections. International Journal of Antimicrobial Agents and Chemotherapy 16:103-6.
227
126. Giamarellou, H., and A. Antoniadou. 2001. Antipseudomonal antibiotics. Medical Clinics of North America 85:19-42, v.
127. Gilbert, D. N., R. C. Moellering Jr, and M. A. Sande. 2004. The Sanford guide to Antimicrobial Therapy, 13 ed. Antimicrobial Therapy Inc, Hyde Park VT.
128. Gillespie, S. H., and A. Dickens. 2003. Fluoroquinolone resistance in Streptococcus pneumoniae: evidence that gyrA mutations arise at a lower rate and that mutation in gyrA or parC predisposes to further mutation. Microbial Drug Resistance 9:17-24.
129. Gillespie, S. H., L. L. Voelker, and A. Dickens. 2002. Evolutionary barriers to quinolone resistance in Streptococcus pneumoniae. Microbial Drug Resistance 8:79-84.
130. Gillespie, T., and R. G. Masterton. 2002. Investigation into the selection frequency of resistant mutants and the bacterial kill rate by levofloxacin and ciprofloxacin in non-mucoid Pseudomonas aeruginosa isolates from cystic fibrosis patients. International Journal of Antimicrobial Agents and Chemotherapy 19:377-82.
131. Goldman, J. D., D. G. White, and S. B. Levy. 1996. Multiple antibiotic resistance (mar) locus protects Escherichia coli from rapid cell killing by fluoroquinolones. Antimicrobial Agents and Chemotherapy 40:1266-9.
132. Gootz, T. D., K. E. Brighty, J. M. Blondeau, A. M. Emmerson, and A. M. Jones. 1996. Fluoroquinolone antibacterials: SAR mechanism of action, resistance, and clinical aspects Expanded activity and utility of the new fluoroquinolones: a review The quinolones: decades of development and use. Medical Research Reviews 16:433-86.
133. Goss, T. F., A. Forrest, D. E. Nix, C. H. Ballow, M. C. Birmingham, T. J.
Cumbo, and J. J. Schentag. 1994. Mathematical examination of dual individualization principles (II): The rate of bacterial eradication at the same area under the inhibitory curve is more rapid for ciprofloxacin than for cefmenoxime. Annals of Pharmacotherapy. 28:863-8.
228
134. Goss, W. A., W. H. Deitz, and T. M. Cook. 1965. Mechanism of Action of Nalidixic Acid on Escherichia Coli Inhibition of Deoxyribonucleic Acid Synthesis. Journal of Bacteriology 89:1068-1074.
135. Gotfried, M. H., L. H. Danziger, and K. A. Rodvold. 2001. Steady-state plasma and intrapulmonary concentrations of levofloxacin and ciprofloxacin in healthy adult subjects. Chest 119:1114-22.
136. Gould, J. C. 1960. The laboratory control of antibiotic therapy. British Medical Bulletin 16:29-34.
137. Grundmann, H., C. Schneider, and F. D. Daschner. 1995. Fluorescence-based DNA fingerprinting elucidates nosocomial transmission of phenotypically variable Pseudomonas aeruginosa in intensive care units. European Journal of Clinical Microbiology 14:1057-1062.
138. Grundmann, H., C. Schneider, D. Hartung, F. D. Daschner, and T. Pitt. 1995. Discriminatory power of three DNA-based typing techniques for Pseudomonas aeruginosa. Journal of Clinical Microbiology 33:528-534.
139. Gupta, K., T. M. Hooton, and W. E. Stamm. 2001. Increasing antimicrobial resistance and the management of uncomplicated community-acquired urinary tract infections. Annals of Internal Medicine 135:41-50.
140. Hane, M. W., and T. H. Wood. 1969. Escherichia coli K-12 mutants resistant to nalidixic acid: genetic mapping and dominance studies. Journal of Bacteriology 99:238-41.
141. Hanock, R. E., V. J. Raffle, and T. I. Nicas. 1981. Involvement of the outer membrane in gentamicin and streptomycin uptake and killing in Pseudomonas aeruginosa. Antimicrobial Agents and Chemotherapy 29:765-768.
142. Hansen, G., J. M. Blondeau, K. Drlica, and X. Xhao. 2001. Presented at the 41st Interscience Conference on Antimicrobial Agents and Chemotherapy, Chicago, Il, U.S.A. Dec 16-20, Chicago IL.

229
143. Hansen, G., K. Drlica, and J. M. Blondeau. 2002. Presented at the 42nd Interscience Conference on Antimicrobial Agents and Chemotherpy, San Diego, CA, USA, Sept. 27-30.
144. Hansen, G., K. Drlica, X. Zhao, and J. M. Blondeau. 2001. The mutant prevention concentration (MPC) for ciprofloxacin (C) and levofloxacin (L) against non-urinary isolates of Pseudomonas aeruginosa. The Journal of Antimicrobial Chemotherapy. 47(suppl 1):37.
145. Hansen, G., L. Ekert, and J. M. Blondeau. 2002. Presented at the 42nd Interscience Conference on Antimicrobial Agents and Chemotherapy, San Diego, Ca, USA. Sept 27-30.
146. Hansen, G. T., and J. M. Blondeau. 2003. Presented at the 43rd Interscience Conference on Antimicrobial Agents and Chemotherapy, Chicago IL, USA. Sept 14-17.
147. Hansen, G. T., and J. M. Blondeau. 2001. Presented at the 22nd International Congress of Chemotherpay, Amsterdam, NL.
148. Hansen, G. T., K. Drlica, and J. M. Blondeau. 2002. Presented at the American Urological Association Annual Meeting. Orlando Florida. May 25-29.
149. Hansen, G. T., K. Metzler, K. Drlica, and J. M. Blondeau. 2003. Mutant prevention concentration of gemifloxacin for clinical isolates of Streptococcus pneumoniae. Antimicrobial Agents and Chemotherapy 47:440-1.
150. Harris, A., C. Torres-Viera, L. Venkataraman, P. DeGirolami, M. Samore, and Y. Carmeli. 1999. Epidemiology and clinical outcomes of patients with multiresistant Pseudomonas aeruginosa. Clinical Infectious Disease 28:1128-33.
151. Hawkey, P. M. 2003. Mechanisms of quinolone action and microbial response. Journal of Antimicrobial Chemotherapy 51 Suppl 1:29-35.
230
152. Heaton, V. J., J. E. Ambler, and L. M. Fisher. 2000. Potent antipneumococcal activity of gemifloxacin is associated with dual targeting of gyrase and topoisomerase IV, an in vivo target preference for gyrase, and enhanced stabilization of cleavable complexes in vitro. Antimicrobial Agents and Chemotherapy 44:3112-7.
153. Heddle, J. G., F. M. Barnard, L. M. Wentzell, and A. Maxwell. 2000. The interaction of drugs with DNA gyrase: a model for the molecular basis of quinolone action. Nucleosides Nucleic Acids 19:1249-64.
154. Heffelfinger, J. D., S. F. Dowell, and H. Jorgensin. 2000. Management of community-acquired pneumonia in the era of antimicrobial resistance: a report from the Drug-resistant Streptocccus pneumonaie Therapeutic Working Group. Archives of Internal Medicine 160:1399-1408.
155. Hiasa, H., D. O. Yousef, and K. J. Marians. 1996. DNA strand cleavage is required for replication fork arrest by a frozen topoisomerase-quinolone-DNA ternary complex. Journal of Biological Chemistry 271:26424-9.
156. Higgins, P. G., A. C. Fluit, D. Milatovic, J. Verhoef, and F.-J. Schmitz. 2003. Mutations in GyrA, ParC, MexR and NfxB in clinical isolates of Pseudomonas aeruginosa. International Journal of Antimicrobial Agents 21:409-413.
157. Hirai, K., H. Aoyama, T. Irikura, S. Iyobe, and S. Mitsuhashi. 1986. Differences in susceptibility to quinolones of outer membrane mutants of Salmonella typhimurium and Escherichia coli. Antimicrobial Agents and Chemotherapy 29:535-8.
158. Hirai, K., S. Suzue, T. Irikura, S. Iyobe, and S. Mitsuhashi. 1987. Mutations producing resistance to norfloxacin in Pseudomonas aeruginosa. Antimicrobial Agents and Chemotherapy 31:582-6.
159. Ho, P. L., R. W. Yung, D. N. Tsang, T. L. Que, M. Ho, W. H. Seto, T. K. Ng, W. C. Yam, and W. W. Ng. 2001. Increasing resistance of Streptocccous pneumonaie to fluoroquinolones: results of a Hong Kong multicenter study in 2000. Journal of Antimicrobial Chemotherapy 48:659-665.

231
160. Hoban, D., K. Waites, and D. Felmingham. 2003. Antimicrobial susceptibility of community-acquired respiratory tract pathogens in North America in 1999-2000: findings of the PROTEKT surveillance study. Diagnotic Microbiolgy and Infectious Disease 45:251-9.
161. Hocquet, D., C. Vogne, F. El Garch, A. Vejux, N. Gotoh, A. Lee, O. Lomovskaya, and P. Plesiat. 2003. MexXY-OprM efflux pump is necessary for a adaptive resistance of Pseudomonas aeruginosa to aminoglycosides. Antimicrobial Agents and Chemotherapy 47:1371-5.
162. Honeybourne, D., D. Banerjee, J. Andrews, and R. Wise. 2001. Concentrations of gatifloxacin in plasma and pulmonary compartments following a single 400 mg oral dose in patients undergoing fibre-optic bronchoscopy. Journal of Antimicrobial Chemotherapy 48:63-6.
163. Hoogkamp-Korstanje, J. A. 1984. Comparative in vitro activity of five quinoline derivatives and five other antimicrobial agents used in oral therapy. European Journal of Clinical Microbiology and Infectious Disease 3:333-8.
164. Hooper, D. C. 2001. Emerging mechanisms of fluoroquinolone resistance. Emergerging Infectious Disease 7:337-41.
165. Hooper, D. C. 2001. Mechanisms of action of antimicrobials: focus on fluoroquinolones. Clinical Infectious Disease 32 Suppl 1:S9-S15.
166. Hooper, D. C. 1999. Mechanisms of fluoroquinolone resistance. Drug Resistance Updates 2:38-55.
167. Hooper, D. C., J. S. Wolfson, E. Y. Ng, and M. N. Swartz. 1987. Mechanisms of action of and resistance to ciprofloxacin. American Journal of Medicine 82:12-20.
168. Hooton, T. M. 2003. The current management strategies for community-acquired urinary tract infection. Infectious Disease Clinics of North America 17:303-332.

232
169. Hooton, T. M. 2003. Fluoroquinolones and resitance in the treatment of uncomplicted urinary tract infection. International Journal of Antimicrobial Agents 22:65-72.
170. Hurst, M., H. M. Lamb, L. J. Scott, and D. P. Figgitt. 2002. Levofloxacin: an updated review of its use in the treatment of bacterial infections. Drugs 62:2127-67.
171. Imada, T., S. Miyazaki, M. Nishida, K. Yamaguchi, and S. Goto. 1992. In vitro and in vivo antibacterial activities of a new quinolone, OPC-17116. Antimicrobial Agents and Chemotherapy 36:573-9.
172. Ishii, H., K. Sato, K. Hoshino, M. Sato, A. Yamaguchi, T. Sawai, and Y. Osada. 1991. Active efflux of ofloxacin by a highly quinolone-resistant strain of Proteus vulgaris. Journal of Antimicrobial Chemotherapy 28:827-36.
173. Jameson, R. M. 1965. Tissue concentration of nalidixic acid and its use in pyelonephritis. British Medical Journal 2:621.
174. Jarvis, W. R., and W. J. Martone. 1992. Predominant pathogens in hospital infections. Journal of Antimicrobial Chemotherapy 29 Suppl A:19-24.
175. Johnson, A. P. 1998. Antibiotic resistance among clinically important gram-positive bacteria in the UK. Journal of Hospital Infection 40:17-26.
176. Join-Lambert, O. F., M. Michea-Hamzehpour, T. Kohler, F. Chau, F. Faurisson, S. Dautrey, C. Vissuzaine, C. Carbon, and J.-C. Pechere. 2001. Differential Selection of Multidrug Efflux Mutants by Trovafloxacin and Ciprofloxacin in an Experimental Model of Pseudomonas aeruginosa Acute Pneumonia in Rats. Antimicrobial Agents and Chemotherapy 45:571-576.
177. Jones, R. N., M. L. Beach, and M. A. Pfaller. 2001. Spectrum and activity of three contemporary fluoroquinolones tested against Pseudomonas aeruginosa isolates from urinary tract infections in the SENTRY Antimicrobial Surveillance Program (Europe and the Americas; 2000): more alike than different! Diagnostic Microbiology and Infectious Disease 41:161-3.

233
178. Jones, R. N., and L. A. Mandell. 2002. Fluoroquinolones for the treatment of outpatient community-acquired pneumonia. Diagnostic Microbiology and Infectious Disease 44:69-76.
179. Jumbe, N., A. Louie, R. Leary, W. Liu, M. R. Deziel, V. H. Tam, R. Bachhawat, C. Freeman, J. B. Kahn, K. Bush, M. N. Dudley, M. H. Miller, and G. L. Drusano. 2003. Application of a mathematical model to prevent in vivo amplification of antibiotic-resistant bacterial populations during therapy. Journal of Clinical Investigation 112:275-85.
180. Kampranis, S. C., and A. Maxwell. 1998. Conformational changes in DNA gyrase revealed by limited proteolysis. Journal of Chemotherapy 273:22606-14.
181. Karlowsky, J. A., M. E. Jones, C. Thornsberry, I. Critchley, L. J. Kellly, and D. F. Sahm. 2001. Prevalence of antimicrobial resistance among urinary tract pathogens isolated from female outpaitents across the US in 1999. International Journal of Antimicrobial Agents 18:121-127.
182. Karlowsky, J. A., L. J. Kellly, C. Thornsberry, M. E. Jones, and D. F. Sahm. 2002. Trends in antimicrobial resistance among urinary tract infecection isolates of E.coli from female outpaitents in the United States. Antimicrobial Agents and Chemotherapy 46:2540-2545.
183. Karlowsky, J. A., Y. R. Mauriz, C. Thornsberry, L. J. Kelly, I. A. Critchley, D. F. Sahm, and M. E. Jones. 2001. Susceptibility of Pseudomonas aeruginosa to fluoroquinolones: A year 2000 surveillance study. Journal of Antimicrobial Chemotherapy 47:23-24.
184. Karlowsky, J. A., C. Thornsberry, M. E. Jones, and D. F. Sahm. 2003. susceptibility of antimicrobial-resistant urinary Escherichia coli isolates to fluoroquinolones and nitrofurantoin. Clinical Infectious Disease 36:183-187.
185. Kato, J., Y. Nishimura, R. Imamura, H. Niki, S. Hiraga, and H. Suzuki. 1990. New topoisomerase essential for chromosome segregation in E. coli. Cell 63:393-404.

234
186. Kays, M. B., D. W. Smith, M. E. Wack, and G. A. Denys. 2002. Levofloxacin treatment failure in a patient with fluoroquinolone-resistant Streptococcus pneumoniae pneumonia. Pharmacotherapy 22:395-9.
187. Kiwanuka, J. P., and J. Mwanga. 2001. Childhood bacterial meningitis in Mbarara Hospital, Uganda: antimicrobial susceptibility and outcome of treatment. African Health Science 1:9-11.
188. Koga, H., A. Itoh, S. Murayma, S. Suzue, and T. Irikura. 1980. Strucutre-activity relationship of antibacterial 6,7-and 7,8-disubstituted 1-alkyl-1,4-dihydro-4-oxoquinolone-3-carboxylic acids. Journal of Medical Chemistry 23:1358-63.
189. Kohler, T., M. Michea-Hamzehpour, U. Henze, N. Gotoh, L. K. Curty, and J. C. Pechere. 1997. Characterization of MexE-MexF-OprN, a positively regulated multidrug efflux system of Pseudomonas aeruginosa. Molecular Microbiology 23:345-54.
190. Kohler, T., M. Michea-Hamzehpour, P. Plesiat, A. L. Kahr, and J. C. Pechere. 1997. Differential selection of multidrug efflux systems by quinolones in Pseudomonas aeruginosa. Antimicrobial Agents and Chemotherapy. 41:2540-3.
191. Kohno, S. 2002. Clinical assessment of tosufloxacin tosilate. Journal of Infection and Chemotherapy 8:19-27.
192. Kotera, Y., M. Watanabe, S. Yoshida, M. Inoue, and S. Mitsuhashi. 1991. Factors influencing the uptake of norfloxacin by Escherichia coli. Journal of Antimicrobial Chemotherapy 27:733-9.
193. Krueger, S., G. Zaccai, A. Wlodawer, J. Langowski, M. O'Dea, A. Maxwell, and M. Gellert. 1990. Neutron and light-scattering studies of DNA gyrase and its complex with DNA. Journal of Molecular Biology 211:211-20.

235
194. Kumarasinghe, G., C. Chow, and P. A. Tambyah. 2000. The emergence of resistance to levofloxacin before clinical use in a university hospital in Singapore. Journal of Antimicrobial Chemotherapy 46:862-3.
195. Kureishi, A., J. Diver, B. Beckthold, T. Schollaardt, and L. Bryan. 1994. Cloning and nucleotide sequence of Pseudomonas aeruginosa DNA gyrase gyrA gene from PAO1 and quinolone-resistant clinical isolates. Antimicrob. Agents Chemother. 38:1944-1952.
196. Kureishi, A., J. Diver, B. Beckthold, T. Schollaardt, and L. Bryan. 1994. Cloning and nucleotide sequence of Pseudomonas aeruginosa DNA gyrase gyrA gene from PAO1 and quinolone-resistant clinical isolates. Antimicrobial Agents and Chemotherapy 38:1944-1952.
197. LaCreta, F. P., S. Kaul, G. D. Kollia, G. Duncan, D. M. Randall, and D. M. Grasela. 2000. Interchangeability of 400-mg intravenous and oral gatifloxacin in healthy adults. Pharmacotherapy 20:59S-66S.
198. Lacy, M. K., W. Lu, X. Xu, P. R. Tessier, D. P. Nicolau, R. Quintiliani, and C. H. Nightingale. 1999. Pharmacodynamic comparisons of levofloxacin, ciprofloxacin, and ampicillin against Streptococcus pneumoniae in an in vitro model of infection. Antimicrobial Agents and Chemotherapy 43:672-7.
199. LaForce, F. M. 1992. Antibacterial therapy for lower respiratory tract infections in adults: a review. Clinical Infectious Disease 14 Suppl 2:S233-7; discussion S244-5.
200. Le Thomas, I., G. Couetdic, O. Clermont, N. Brahimi, P. Plesiat, and E. Bingen. 2001. In vivo selection of a target/efflux double mutant of Pseudomonas aeruginosa by ciprofloxacin therapy. The Journal Of Antimicrobial Chemotherapy 48:553-555.
201. Lesher, G. Y., E. J. Froelich, M. D. Gruett, J. H. Bailey, and R. P. Brundage. 1962. 1-8 napthyridine derivatives. A new class of chemotheraapeutic agents. Journal of Medicinal and Phamaceutical Chemistry 5:1063-1068.
236
202. Lettieri, J. T., M. C. Rogge, L. Kaiser, R. M. Echols, and A. H. Heller. 1992. Pharmacokinetic profiles of ciprofloxacin after single and intravenous and oral doses. Antimicrobial Agents and Chemotherapy 36:993-996.
203. LEVAQUIN® (levofloxacin tablets/injection) Tablets/Injection. Package Insert. Ortho-McNeil Pharmaceutical, I., Raritan, NJ 08869. REVISED November 2000.
204. Lewis, R. J., F. T. Tsai, and D. B. Wigley. 1996. Molecular mechanisms of drug inhibition of DNA gyrase. Bioessays. 18:661-71.
205. Li, X., D. Ma, D. Livermore, and H. Nikaido. 1994. Role of efflux pump(s) in intrinsic resistance of Pseudomonas aeruginosa: active efflux as a contributing factor to beta-lactam resistance. Antimicrobial Agents and Chemotherapy. 38:1742-1752.
206. Li, X., H. Nikaido, and K. Poole. 1995. Role of mexA-mexB-oprM in antibiotic efflux in Pseudomonas aeruginosa. Antimicrobial Agents and Chemotherapy. 39:1948-1953.
207. Li, X., X. Zhao, and K. Drlica. 2002. Selection of Streptococcus pneumoniae mutants having reduced susceptibility to moxifloxacin and levofloxacin. Antimicrobial Agents and Chemotherapy. 46:522-4.
208. Li, X. Z., L. Zhang, and K. Poole. 2000. Interplay between the MexA-MexB-OprM multidrug efflux system and the outer membrane barrier in the multiple antibiotic resistance of Pseudomonas aeruginosa. Journal of Antimicrobial Chemotherapy. 45:433-6.
209. Li, X. Z., L. Zhang, and K. Poole. 1998. Role of the multidrug efflux systems of Pseudomonas aeruginosa in organic solvent tolerance. Journal of Bacteriology. 146.
210. Lim, S., D. Bast, A. McGeer, J. de Azavedo, and D. E. Low. 2003. Antimicrobial susceptibility breakpoints and first-step parC mutations in

237
Streptococcus pneumoniae: redefining fluoroquinolone resistance. Emerging Infectious Diseases. 9:833-7.
211. Linares, J., A. G. De La Campa, and R. Pallares. 1999. Fluroqouinolone resistance is Streptococcus pneumonaie. New England Journal of Medicine. 341:1546-1547.
212. Lipman, J., J. Scribante, A. G. Gous, H. Hon, and S. Tshukutsoane. 1998. Pharmacokinetic profiles of high-dose intravenous ciprofloxacin in severe sepsis. The Baragwanath Ciprofloxacin Study Group. Antimicrobial Agents and Chemotherapy. 42:2235-9.
213. Lister, P. D., and C. C. Sanders. 1999. Pharmacodynamics of levofloxacin and ciprofloxacin against Streptococcus pneumoniae. Journal of Antimicrobial Chemotherapy. 43:79-86.
214. Lister, P. D., and C. C. Sanders. 1999. Pharmacodynamics of trovafloxacin, ofloxacin, and ciprofloxacin against Streptococcus pneumoniae in an in vitro pharmacokinetic model. Antimicrobial Agents and Chemotherapy. 43:1118-23.
215. Liu, Q., and S. S. Sommer. 2004. PAP: detection of ultra rare mutations depends on P* oligonucleotides: "sleeping beauties" awakened by the kiss of pyrophosphorolysis. Human Mutations. 23:426-436.
216. Liu, Q., and S. S. Sommer. 2002. Pyrophosphorolysis-activatable oligonucleotides may facilitate detection of rare alleles, mutation scanning and analysis of chromatin structures. Nucleic Acids Research. 15:598-604.
217. Liu, Q., and S. S. Sommer. 2000. Pyrophosphorolysis-activated polymerization (PAP): application to allele-specific amplification. Biotechniques. 29:1072-1076.
218. Livermore, D. M. 2003. Overstretching the mutant prevention concentration. Journal of Antimicrobial Chemotherapy. 52:732.
238
219. Llanes, C., D. Hocquet, C. Vogne, D. Benali-Baitich, C. Neuwirth, and P. Plesiat. 2004. Clinical Strains of Pseudomonas aeruginosa Overproducing MexAB-OprM and MexXY Efflux Pumps Simultaneously. Antimicrobial Agents and Chemotherapy. 48:1797-1802.
220. Low, D. E., J. C. de Azavedo, and K. Weiss. 2000. Antimicrobial resistance among clinical isolates of Streptococcus pneumonaie in Canada during 2000. Antimicrobial Agents and Chemotherapy. 46:1295-1301.
221. Lu, T., X. Zhao, X. Li, G. Hansen, J. Blondeau, and K. Drlica. 2003. Effect of chloramphenicol, erythromycin, moxifloxacin, penicillin and tetracycline concentration on the recovery of resistant mutants of Mycobacterium smegmatis and Staphylococcus aureus. Journal of Antimicrobial Chemotherapy. 52:61-4.
222. Lubasch, A., I. Keller, K. Borner, P. Koeppe, and H. Lode. 2000. Comparative pharmacokinetics of ciprofloxacin, gatifloxacin, grepafloxacin, levofloxacin, trovafloxacin, and moxifloxacin after single oral administration in healthy volunteers. Antimicrobial Agents and Chemotherapy. 44:2600-3.
223. Lynch, A. S., and J. C. Wang. 1993. Anchoring of DNA to the bacterial cytoplasmic membrane through cotranscriptional sythensis of poplypeptides encoding membrane protiens or protiens for export: a mechanism of plasmid hypernegative supercoiling in mutants defective in DNA topoisomerase I. Journal of Bacteriology 175. 1645-1655.
224. MacGowan, A. P., C. A. Rogers, H. A. Holt, M. Wootton, and K. E. Bowker. 2001. Pharmacodynamics of gemifloxacin against Streptococcus pneumoniae in an in vitro pharmacokinetic model of infection. Antimicrobial Agents and Chemotherapy. 45:2916-21.
225. MacGowan, A. P., M. Wootton, and H. A. Holt. 1999. The antibacterial efficacy of levofloxacin and ciprofloxacin against Pseudomonas aeruginosa assessed by combining antibiotic exposure and bacterial susceptibility. Journal of Antimicrobial Chemotherapy. 43:345-9.
226. Madaras-Kelly, K. J., B. E. Ostergaard, L. B. Hovde, and J. C. Rotschafer. 1996. Twenty-four hour area under the concentration-time curve/MIC ratio as a

239
generic predictor of fluoroquinolone antimicrobial effect by using three strains of Pseudomonas aeruginosa and an in vitro pharmacodynamic model. Antimicrobial Agents and Chemotherapy. 40:627-632.
227. Maigaard, S., N. Frimodt-Moller, U. Hoyne, and P. O. Madsen. 1979. Rosaxacin and cinoxacin distribution in prostate, vagina and urethra. An experimental study in dogs. Investigative Urology. 17:149-152.
228. Manian, F. A., L. Meyer, J. Jenne, A. Owen, and T. Taff. 1996. Loss of antimicrobial susceptibility in aerobic gram-negative bacilli repeatedly isolated from patients in intensive-care units. Infection Control and Hospial Epidemiology. 17:222-6.
229. Marians, K. J., and H. Hiasa. 1997. Mechanism of quinolone action. A drug-induced structural perturbation of the DNA precedes strand cleavage by topoisomerase IV. Journal of Biological Chemistry. 272:9401-9.
230. Martinez-Martinez, L., A. Pascual, C. Conejo Mdel, I. Garcia, P. Joyanes, A. Domenech-Sanchez, and V. J. Benedi. 2002. Energy-dependent accumulation of norfloxacin and porin expression in clinical isolates of Klebsiella pneumoniae and relationship to extended-spectrum beta-lactamase production. Antimicrobial Agents and Chemotherapy. 46:3926-32.
231. Masterton, R. G., and J. A. Bochsler. 1995. High-dosage co-amoxiclav in a single dose versus 7 days of co-trimoxazole as treatment of uncomplicated lower urinary tract infection in women. Journal of Antimicrobial Chemotherapy. 35:129-37.
232. Masuda, N., and S. Ohya. 1992. Cross-resistance to meropenem, cephems, and quinolones in Pseudomonas aeruginosa. Antimicrobial Agents and Chemotherapy. 36:1847-1851.
233. McCabe, W. R., M. Buchbinder, S. S. Kunin, and J. Saleh. 1963. Bacteriuria and Bacteremia with Genitourinary Surgery: Modification by Antimicrobial Prophylaxis. Antimicrobial Agents and Chemotherapy. 161:725-30.
240
234. McCarty, J. M., G. Richard, W. Huck, R. M. Tucker, R. L. Tosiello, M. Shan, A. Heyd, and R. M. Echols. 1999. A randomized trial of short-course ciprofloxacin, ofloxacin, or trimethoprim/sulfamethoxazole for the treatment of acute urinary tract infection in women. Ciprofloxacin Urinary Tract Infection Group. American Journal of Medicine. 106:292-9.
235. Metzler, K., G. Hansen, P. Hedlin, E. Harding, K. Drlica, and J. M. Blondeau. 2004. Comparison of minimal inhibitory and mutant prevention drug concentrations of 4 fluoroquinolones against clinical isolates of methicillin-susceptible and -resistant Staphylococcus aureus. International Journal of Antimicrobial Agents 24:161-167.
236. Meyer, K. S., C. Urban, J. A. Eagan, B. J. Berger, and J. J. Rahal. 1993. Nosocomial outbreak of Klebsiella infection resistant to late-generation cephalosporins. Annals of Internal Medicine. 119:353-8.
237. Michea-Hamzehpour, M., Y. X. Furet, and J. C. Pechere. 1991. Role of protein D2 and lipopolysaccharide in diffusion of quinolones through the outer membrane of Pseudomonas aeruginosa. Antimicrobial Agents and Chemotherapy. 35:2091-7.
238. Milatovic, D., and I. Braveny. 1987. Development of resistance during antibiotic therapy. European Journal of Clinical Microbiology. 6:234-44.
239. Miller, M. H., S. A. Feinsein, and R. T. Chow. 1987. Early effects of beta-lactams on aminoglycoside uptake, bacterial rates, and turbidimetrically measured growth in Pseudomonas aerugionosa. Antimicrobial Agents and Chemotherapy. 31:108-110.
240. Mine, T., Y. Morita, A. Kataoka, T. Mizushima, and T. Tsuchiya. 1999. Expression in Escherichia coli of a New Multidrug Efflux Pump, MexXY, from Pseudomonas aeruginosa. Antimicrobial Agents and Chemotherapy. 43:415-417.
241. Mitchison, D. A. 1984. Drug resistance in mycobacteria. British Medical Bulletin. 40:84-90.

241
242. Mitsuyama, J., Y. Itoh, M. Takahata, S. Okamoto, and T. Yasuda. 1992. In vitro antibacterial activities of tosufloxacin against and uptake of tosufloxacin by outer membrane mutants of Escherichia coli, Proteus mirabilis, and Salmonella typhimurium. Antimicrobial Agents and Chemotherapy. 36:2030-6.
243. Mohr, J., A. Jones, and G. S. Tillotson. 2003. Presented at the 3rd International Meeting on Antimicrobial Chemotherapy in Clinical Practice, Santa Margherita Ligure.
244. Moreau, N. J., H. Robaux, L. Baron, and X. Tabary. 1990. Inhibitory effects of quinolones on pro- and eucaryotic DNA topoisomerases I and II. Antimicrobial Agents and Chemotherapy. 34:1955-60.
245. Morrissey, I., and J. T. Geogre. 2000. Bacterial activity of gemifloxacin and other quinolones against Streptoccocus pneumonaie. Journal of Antimicrobial Chemotherapy. 45:107-110.
246. Morrissey, I., and J. George. 1999. Activities of fluoroquinolones against Streptococcus pneumoniae type II topoisomerases purified as recombinant proteins. Antimicrobial Agents and Chemotherapy. 43:2579-85.
247. Morrissey, I., and J. T. George. 2001. Measurement of the bactericidal activity of fluoroquinolones against Streptococcus pneumoniae using the bactericidal index method. International Journal of Antimicrobial Agents. 17:33-37.
248. Mouneimne, H., J. Robert, V. Jarlier, and E. Cambau. 1999. Type II topoisomerase mutations in ciprofloxacin-resistant strains of Pseudomonas aeruginosa. Antimicrobial Agents and Chemotherapy. 43:62-66.
249. Mouton, J. W., M. N. Dudley, O. Cars, H. Derendorf, and G. L. Drusano. 2002. Standardization of pharmacokinetic/pharmacodynamic (PK/PD) terminology for anti-infective drugs. International Journal of Antimicrobial Agents. 19:355-8.

242
250. Murray, P. R., E. J. Baron, M. A. Pfaller, F. C. Tenover, and R. H. Yolken. 1996. Manual of Clinical Microbiology, vol. 6th edition. ASM Press, Washington, D.C.
251. Naber, C. K., M. Hammer, M. Kinzig-Schippers, C. Sauber, F. Sorgel, E. A. Bygate, A. J. Fairless, K. Machka, and K. G. Naber. 2001. Urinary excretion and bactericidal activities of gemifloxacin and ofloxacin after a single oral dose in healthy volunteers. Antimicrobial Agents and Chemotherapy. 45:3524-30.
252. Naber, K. G. 2001. Which fluroqouinolones are suitable for the treatment of urinary tract infections? International Journal of Antimicrobial Agents. 17:331-342.
253. Naber, K. G., and D. Adam. 1998. Classification of fluoroquinolones. Internatinal Journal of Antimicrobial Agents. 10:255-7.
254. Nagai, K., T. A. Davies, B. E. Dewasse, M. R. Jacobs, and P. C. Appelbaum. 2001. Single- and multi-step resistance selection study of gemifloxacin compared with trovafloxacin, ciprofloxacin, gatifloxacin and moxifloxacin in Streptococcus pneumoniae. Journal of Antimicrobial Chemotherapy. 48:365-74.
255. Nakamura, S., M. Nakamura, T. Kojima, and H. Yoshida. 1989. gyrA and gyrB mutations in quinolone-resistant strains of Escherichia coli. Antimicrobial Agents and Chemotherapy. 33:254-5.
256. Nakano, M., T. Deguchi, T. Kawamura, M. Yasuda, M. Kimura, Y. Okano, and Y. Kawada. 1997. Mutations in the gyrA and parC genes in fluoroquinolone-resistant clinical isolates of Pseudomonas aeruginosa. Antimicrobial Agents and Chemotherapy. 41:2289-91.
257. Nakashima, M., T. Uematsu, K. Kosuge, H. Kusajima, T. Ooie, Y. Masuda, R. Ishida, and H. Uchida. 1995. Single- and multiple-dose pharmacokinetics of AM-1155, a new 6-fluoro-8-methoxy quinolone, in humans. Antimicrobial Agents and Chemotherapy. 39:2635-40.

243
258. NCCLS. 2000. National Committee for Clinical Laboratory Standards. Methods for dilution antimicrobial susceptibility tests for bacteria that grow aerobically Approved standard, Approved standard M7-A5, 5th ed. NCCLS, Wayne, PA.
259. Neuhauser, M. M., R. A. Weinstein, R. Rydman, L. H. Danziger, G. Karam, and J. P. Quinn. 2003. Antibiotic resistance among gram-negative bacilli in US intensive care units: implications for fluoroquinolone use. Journal of American Medical Association. 289:885-8.
260. Ng, E. Y., M. Trucksis, and D. C. Hooper. 1996. Quinolone resistance mutations in topoisomerase IV: relationship to the flqA locus and genetic evidence that topoisomerase IV is the primary target and DNA gyrase is the secondary target of fluoroquinolones in Staphylococcus aureus. Antimicrobial Agents and Chemotherapy. 40:1881-8.
261. Nicolle, L. E. 2002. Urinary tract infection: Traditional pharmacologic therapies. The American Journal of Medicine. 2002:35s-44s.
262. Niederman, M. S., L. A. Mandell, A. Anzueto, J. B. Bass, W. A. Broughton, G. D. Campbell, N. Dean, T. File, M. J. Fine, P. A. Gross, F. Martinez, T. J. Marrie, J. F. Plouffe, J. Ramirez, G. A. Sarosi, A. Torres, R. Wilson, and V. L. Yu. 2001. Guidelines for the management of adults with community-acquired pneumonia. Diagnosis, assessment of severity, antimicrobial therapy, and prevention. American Journal of Respiratory Critical Care Medicine. 163:1730-54.
263. Nikaido, H. 1998. Antibiotic resistance caused by gram-negative multidrug efflux pumps. Clinical Infectiious Disease. 27 Suppl 1:S32-41.
264. Nikaido, H. 1996. Multidrug efflux pumps of gram-negative bacteria. Journal of Bacteriology. 178:5853-9.
265. Nikaido, H. 1994. Prevention of drug access to bacterial targets: permeability barriers and active efflux. Science. 264:382-8.

244
266. Nikaido, H., and D. G. Thanassi. 1993. Penetration of lipophilic agents with multiple protonation sites into bacterial cells: tetracyclines and fluoroquinolones as examples. Antimicrobial Agents and Chemotherapy. 37:1393-9.
267. Nishino, Y., T. Deguchi, M. Yasuda, T. Kawamura, M. Nakano, E. Kanematsu, S. Ozeki, and Y. Kawada. 1997. Mutations in the gyrA and parC genes associated with fluoroquinolone resistance in clinical isolates of Citrobacter freundii. FEMS Microbiology Letters. 154:409-14.
268. Norrby, S. R., and M. Jonsson. 1983. Antibacterial activity of norfloxacin. Antimicrobial Agents and Chemotherapy. 23:15-18.
269. Northe, D. S., D. N. Fish, and J. J. Redington. 1998. Levofloxacin, a second generation fluoroquinolone. Pharmacotherapy. 18:915-935.
270. Noskin, G. A., P. Mehl, and J. R. Warren. 1993. Bactericidal activity of the fluoroquinolone WIN 57273 against high-level gentamicin-resistant Enterococcus faecalis. Antimicrobial Agents and Chemotherapy. 37:2470-2473.
271. Odenholt, I., E. Lowdin, and O. Cars. 1998. Bactericidal effects of levofloxacin in comparison with those of ciprofloxacin and sparfloxacin. Clinical Microbiology Infectection. 4:264-270.
272. O'Donnell, J. A., S. P. Gelone, T. D. Gootz, K. E. Brighty, J. M. Blondeau, A. M. Emmerson, and A. M. Jones. 2000. Fluoroquinolones Fluoroquinolone antibacterials: SAR mechanism of action, resistance, and clinical aspects Expanded activity and utility of the new fluoroquinolones: a review The quinolones: decades of development and use. Infectious Disease Clinics of North America. 14:489-513,
273. O'Hare, M. D., D. Felmingham, G. L. Ridgway, and R. N. Gruneberg. 1985. The comparative in vitro activity of twelve 4-quinolone antimicrobials against enteric pathogens. Drugs Experimental Clinical Research. 11:253-7.
274. Ortho-McNeil Pharmaceutical, I. REVISED November 2003. LEVAQUIN® (levofloxacin tablets/injection) Tablets/Injection. Package Insert.

245
275. Pan, X. S., J. Ambler, S. Mehtar, and L. M. Fisher. 1996. Involvement of topoisomerase IV and DNA gyrase as ciprofloxacin targets in Streptococcus pneumoniae. Antimicrobial Agents and Chemotherapy. 40:2321-6.
276. Pan, X. S., and L. M. Fisher. 1998. DNA gyrase and topoisomerase IV are dual targets of clinafloxacin action in Streptococcus pneumoniae. Antimicrobial Agents and Chemotherapy. 42:2810-6.
277. Pan, X. S., and L. M. Fisher. 1999. Streptococcus pneumoniae DNA gyrase and topoisomerase IV: overexpression, purification, and differential inhibition by fluoroquinolones. Antimicrobial Agents and Chemotherapy. 43:1129-36.
278. Pan, X. S., and L. M. Fisher. 1997. Targeting of DNA gyrase in Streptococcus pneumoniae by sparfloxacin: selective targeting of gyrase or topoisomerase IV by quinolones. Antimicrobial Agents and Chemotherapy. 41:471-4.
279. Pangrazzi, G. e. a. 1999. Can a quinolone therapeutic interchange program induce class resistance? American Society of Hospital Pharmacistics. 34:P-271R.
280. Pechere, J. C., and I. R. Vladoianu. 1992. Development of resistance during ceftazidime and cefepime therapy in a murine peritonitis model. Journal of Antimicrobial Chemotherapy. 29:563-73.
281. Pestova, E., R. Beyer, N. P. Cianciotto, G. A. Noskin, and L. R. Peterson. 1999. Contribution of topoisomerase IV and DNA gyrase mutations in Streptococcus pneumoniae to resistance to novel fluoroquinolones. Antimicrobial Agents and Chemotherapy. 43:2000-4.
282. Pestova, E., J. J. Millichap, G. A. Noskin, and L. R. Peterson. 2000. Intracellular targets of moxifloxacin: a comparison with other fluoroquinolones. Journal of Antimicrobial Chemotherapy. 45:583-590.
283. Peterson, L. R., M. Postelnick, T. L. Pozdol, B. Reisberg, and G. A. Noskin. 1998. Management of fluoroquinolone resistance in Pseudomonas aeruginosa--

246
outcome of monitored use in a referral hospital. Internatinal Journal of Antimicrobial Agents. 10:207-14.
284. Phillips, I. 1987. Bacterial mutagenicity and the 4-quinolones. Journal of Antimicrobial Chemotherapy. 20:771-3.
285. Phillips, I., E. Culebras, F. Moreno, and F. Baquero. 1987. Induction of the SOS response by new 4-quinolones. Journal of Antimicrobial Chemotherapy. 20:631-8.
286. Piddock, L., and R. Wise. 1987. Induction of the SOS response in Escherichia coli by 4-quinolone antimicrobial agents. FEMS Microbiology Letters. 41:289-294.
287. Piddock, L. J., Y. F. Jin, V. Ricci, and A. E. Asuquo. 1999. Quinolone accumulation by Pseudomonas aeruginosa, Staphylococcus aureus and Escherichia coli. Journal of Antimicrobial Chemotherapy. 43:61-70.
288. Piddock, L. J., and R. Wise. 1986. The effect of altered porin expression in Escherichia coli upon susceptibility to 4-quinolones. Journal of Antimicrobial Chemotherapy. 18:547-9.
289. Polk, R. E., C. K. Johnson, D. McClish, R. P. Wenzel, and M. B. Edmond. 2004. Predicting hospital rates of fluoroquinolone-resistant Pseudomonas aeruginosa from fluoroquinolone use in US hospitals and their surrounding communities. Clinical Infectiious Disease. 39:497-503.
290. Polk RE. I. 2001. Presented at the nterscience Conference on Antimicrobial Agents and Chemotherapy, American Society of Microbiology, Washington, DC.
291. Poole, K. 2000. Efflux-Mediated Resistance to Fluoroquinolones in Gram-Negative Bacteria. Antimicrobial Agents and Chemotherapy. 44:2233-2241.

247
292. Poole, K., N. Gotoh, H. Tsujimoto, Q. Zhao, A. Wada, T. Yamasaki, S. Neshat, J. Yamagishi, X. Z. Li, and T. Nishino. 1996. Overexpression of the mexC-mexD-oprJ efflux operon in nfxB-type multidrug-resistant strains of Pseudomonas aeruginosa. Molecular Microbiology. 21:713-24.
293. Poole, K., K. Krebes, C. McNally, and S. Neshat. 1993. Multiple antibiotic resistance in Pseudomonas aeruginosa: evidence for involvement of an efflux operon. Journal of Bacteriology. 175:7363-72.
294. Poole, K., K. Tetro, Q. Zhao, S. Neshat, D. Heinrichs, and N. Bianco. 1996. Expression of the multidrug resistance operon mexA-mexB-oprM in Pseudomonas aeruginosa: mexR encodes a regulator of operon expression. Antimicrobial Agents and Chemotherapy. 40:2021-2028.
295. Preston, S. L., G. L. Drusano, A. L. Berman, C. L. Fowler, A. T. Chow, B. Dornseif, V. Reichl, J. Natarajan, and M. Corrado. 1998. Pharmacodynamics of levofloxacin: a new paradigm for early clinical trials. Journal of American Medical Association. 279:125-129.
296. Pumbwe, L., and L. J. V. Piddock. 2000. Two efflux systems expressed simulataneously in multidrug resistant Pseudomonas aeruginosa. Antimicrobial Agents and Chemotherapy. 44:2861-2864.
297. Randinitis, E. J., J. I. Brodfuehrer, I. Eiseman, and A. B. Vassos. 2001. Pharmacokinetics of clinafloxacin after single and multiple doses. Antimicrobial Agents and Chemotherapy. 45:2529-35.
298. Randinitis, E. J., J. R. Koup, G. Rausch, R. Abel, N. J. Bron, N. J. Hounslow, A. B. Vassos, and A. J. Sedman. 2001. Clinafloxacin pharmacokinetics in subjects with various degrees of renal function. Antimicrobial Agents and Chemotherapy. 45:2536-42.
299. Raz, R., B. Chazan, Y. Kennes, R. Colodner, E. Rottensterich, M. Dan, I. Lavi, and W. Stamm. 2002. Empiric use of trimethoprim-sulfamethoxazole (TMP-SMX) in the treatment of women with uncomplicated urinary tract infections, in a geographical area with a high prevalence of TMP-SMX-resistant uropathogens. Clinical Infectious Disease. 34:1165-9.
248
300. Ricci, V., and L. Piddock. 2003. Accumulation of garenoxacin by Bacteroides fragilis compared with that of five fluoroquinolones. Journal of Antimicrobial Chemotherapay. 52:605-9.
301. Rice, L. B., E. C. Eckstein, J. DeVente, and D. M. Shlaes. 1996. Ceftazidime-resistant Klebsiella pneumoniae isolates recovered at the Cleveland Department of Veterans Affairs Medical Center. Clinical Infectious Disease. 23:118-24.
302. Rice, L. B., S. H. Willey, G. A. Papanicolaou, A. A. Medeiros, G. M. Eliopoulos, R. C. Moellering, Jr., and G. A. Jacoby. 1990. Outbreak of ceftazidime resistance caused by extended-spectrum beta-lactamases at a Massachusetts chronic-care facility. Antimicrobial Agents and Chemotherapy. 34:2193-9.
303. Rifenburg, R. P., J. A. Paladino, S. M. Bhavnani, D. D. Haese, and J. J. Schentag. 1999. Influence of fluoroquinolone purchasing patterns on antimicrobial expenditures and Pseudomonas aeruginosa susceptibility. American Journal of Health Systems Pharmarmacists. 56:2217-23.
304. Ronald, A. R., M. Turck, and R. G. Petersdorf. 1966. A critical evaluation of nalidixic acid in urinary-tract infections. New England Journal of Medicine. 275:1081-9.
305. Ross, J. J., M. G. Worthington, and S. L. Gorbach. 2002. Resistance to levofloxacin and failure of treatment of pneumococcal pneumonia. New England Journal of Medicine. 347:65-7; author reply 65-7.
306. Rubinstein, E., Z. Dreznik, and Z. Mark. 1982. Gentamicin and cefsulin efficacy in a rat absess model. Surgery, Gynecology and Obstetrics. 155:363-368.
307. Ruiz, J., A. Jurado, E. Garcia-Mendez, F. Marco, L. Aguilar, M. T. Jimenez de Anta, and J. Vila. 2001. Frequency of selection of fluoroquinolone-resistant mutants of Neisseria gonorrhoeae exposed to gemifloxacin and four other quinolones. Journal of Antimicrobial Chemotherapy. 48:545-8.

249
308. Ryan, B. M., T. J. Dougherty, D. Beaulieu, J. Chuang, B. A. Dougherty, and J. F. Barrett. 2001. Efflux in bacteria: what do we really know about it? Expert Opinion Investigational Drugs. 10:1409-22.
309. Sader, H. S., H. K. Huynh, and R. N. Jones. 2003. Contemporary in vitro synergy rates for aztreonam combined with newer fluoroquinolones and beta-lactams tested against gram-negative bacilli. Diagnostic Microbiology and Infectious Disease. 47:547-550.
310. Sahm, D. F., I. A. Critchley, L. J. Kelly, J. A. Karlowsky, D. C. Mayfield, C. Thornsberry, Y. R. Mauriz, and J. Kahn. 2001. Evaluation of current activities of fluoroquinolones against gram-negative bacilli using centralized in vitro testing and electronic surveillance. Antimicrobial Agents and Chemotherapy. 45:267-74.
311. Sanders, C. 1988. Ciprofloxacin: in vitro activity, mechanism of action and resistance. Review of Infectious Diseases. 10:516-553.
312. Sanders, C. 1992. Review of preclinical studies of ofloxacin. Clinical Infectious Disease. 14:539-554.
313. Sanders, W. 1992. Oral ofloxacin: A critical review of the new drug application. Clinical Infectious Disease. 14:539-554.
314. Scaglione, F., J. W. Mouton, R. Mattina, and F. Fraschini. 2003. Pharmacodynamics of levofloxacin and ciprofloxacin in a murine pneumonia model: peak concentration/MIC versus area under the curve/MIC ratios. Antimicrobial Agents and Chemotherapy. 47:2749-55.
315. Scheld, W. M. 2003. Maintaining fluoroquinolone class efficacy: review of influencing factors. Emerging Infectious Diseases. 9:1-9.
316. Schentag, J. J. 2003. Fluoroquinolone AUIC breakpoints and the link to bacterial killing rates part 2: Human trials. The Annals of Pharmacotherapy. 37:1478-1488.
250
317. Schentag, J. J. 2002. Pharmacokineitc and pharmacodynamic predictors of antimicrobial efficacy: moxifloxacin and Streptoccous pneumonaie. Journal of Chemotherapy. suppl 2:13-21.
318. Schentag, J. J., K. K. Gilliand, and J. A. Paladino. 2001. What have we learned from pharmacokinetic and pharmacodynamic theories? Clinical Infectious Disease. 32:39-46.
319. Schentag, J. J., A. K. Meagher, and A. Forrest. 2003. Fluoroquinolone AUIC break points and the link to bacterial killing rates. Part 1: In vitro and animal models. Annals of Pharmacotherapy. 37:1287-1289.
320. Schentag, J. J., D. E. Nix, and M. H. Adelman. 1991. Mathematical examination of dual individualization principles (I): Relationships between AUC above MIC and area under the inhibitory curve for cefmenoxime, ciprofloxacin, and tobramycin. DICP. 25:1050-7.
321. Schentag, J. J., D. E. Nix, A. Forest, and M. H. Adelman. 1996. AUIC: the universal parameter within the constraint of a reasonable dosing interval. Annals of Pharmacotherapy. 30:1029-1031.
322. Segatore, B., D. Setacci, M. Perilli, N. Franceschini, A. De Santis, F. Marchetti, and G. Amicosante. 1999. Italian survey on comparative levofloxacin susceptibility in 334 clinical isolates of Pseudomonas aeruginosa. Antimicrobial Agents and Chemotherapy. 43:428-31.
323. Segatore, B., D. Setacci, M. Perilli, N. Franceschini, F. Marchetti, and G. Amicosante. 2000. Bactericidal activity of levofloxacin and ciprofloxacin on clinical isolates of different phenotypes of Pseudomonas aeruginosa. International Journal of Antimicrobial Agents. 13:223-6.
324. Shen, L. L., and D. T. W. Chu. 1996. Type II DNA topoisomerases as antibacterial targets. Current Pharmaceutical Design. 2:195-200.
325. Sheng, W.-H., Y.-C. Chen, J. T. Wang, S. C. Chang, K. T. Luh, and W. C. Hsieh. 2002. Emerging fluoroquinolone-resistance for common clinically
251
important gram-negative bacteria in Taiwan. Diagnotic Microbiolgy and Infectious Disease. 43:141-147.
326. Shimizu, M., Y. Takase, S. Nakamura, H. Katae, and A. Minami. 1975. Pipemidic acid, a new antibacterial agent active against Pseudomonas aeruginosa: in vitro properties. Antimicrobial Agents and Chemotherapy. 8:132-8.
327. Sindelar, G., X. Zhao, A. Liew, Y. Dong, T. Lu, J. Zhou, J. Domagala, and K. Drlica. 2000. Mutant prevention concentration as a measure of fluoroquinolone potency against mycobacteria. Antimicrobial Agents and Chemotherapy. 44:3337-43.
328. Smith, H. J., K. A. Nichol, D. J. Hoban, and G. G. Zhanel. 2003. Stretching the mutant prevention concentration (MPC) beyond its limits. Journal of Antimicrobial Chemotherapy. 51:1323-5.
329. Stamey, T., and J. Bragonje. 1976. Resistance to nalidixic acid. A misconception due to uderdosage. Journal of American Medical Association. 236:1857-1860.
330. Stamm, W. E. 2002. Scientific and clinical challengesin the management of urinary tract infections. The American Journal of Medicine. 113:s1-s4.
331. Sugino, A., N. P. Higgins, and N. R. Cozzarelli. 1980. DNA gyrase subunit stoichiometry and the covalent attachment of subunit A to DNA during DNA cleavage. Nucleic Acids Research. 8:3865-74.
332. Sullivan, E. A., B. N. Kreiswirth, L. Palumbo, V. Kapur, J. M. Musser, A. Ebrahimzadeh, and T. R. Frieden. 1995. Emergence of fluoroquinolone-resistant tuberculosis in New York City. Lancet. 345:1148-50.
333. Sullivan, J. T., M. Woodruff, J. Lettieri, V. Agrawal, G. J. Krol, P. T. Leese, S. Watson, and A. H. Heller. 1999. Pharmacokinetics of a once daily oral dose of moxifloxacin (bay 12-8039), a new enantiomerically pure 8-methoxy quinolone. Antimicrobial Agents and Chemotherapy. 43:2793-2797.

252
334. Takiff, H. E., L. Salazar, C. Guerrero, W. Philipp, W. M. Huang, B. Kreiswirth, S. T. Cole, W. R. Jacobs, Jr., and A. Telenti. 1994. Cloning and nucleotide sequence of Mycobacterium tuberculosis gyrA and gyrB genes and detection of quinolone resistance mutations. Antimicrobial Agents and Chemotherapy. 38:773-80.
335. Talan, D. A., W. E. Stamm, T. M. Hooton, G. J. Moran, T. Burke, A. Iravani, J. Reuning-Scherer, and D. A. Church. 2000. Comparison of ciprofloxacin (7 days) and trimethoprim-sulfamethoxazole (14 days) for acute uncomplicated pyelonephritis in women: a randomized trial. Journal of American Medical Association. 283:1583-90.
336. Thomas, J. K., A. Forrest, S. M. Bhavnani, J. M. Hyatt, A. Cheng, C. H. Ballow, and J. J. Schentag. 1998. Pharmacodynamic evaluation of factors associated with the development of bacterial resistance in acutely ill patients during therapy. Antimicrobial Agents and Chemotherapy. 42:521-7.
337. Thornsberry, C., P. Ogilvie, J. Kahn, and Y. Mauriz. 1997. Surveillance of antimicrobial resistance in Streptococcus pneumoniae, Haemophilus influenzae, and Moraxella catarrhalis in the United States in 1996-1997 respiratory season. The Laboratory Investigator Group. Diagnostic Microbiology and Infectious Disease. 29:249-57.
338. Trunkel, A. R., and W. M. Scheld. 1991. Ofloxacin. Infection Control and Hospital Epidemiology. 12:549-557.
339. Turner, P. J. 2000. MYSTIC (Meropenem Yearly Susceptibility Test Information Collection): a global overview. Journal of Antimicrobial Chemotherapy. 46 Suppl T2:9-23.
340. Urban, C., N. Rahman, X. Zhao, N. Mariano, S. Segal-Maurer, K. Drlica, and J. J. Rahal. 2001. Fluoroquinolone-resistant Streptococcus pneumoniae associated with levofloxacin therapy. Journal of Infectious disease. 184:794-8.
341. Van Eldere, J. 2003. Multicentre surveillance of Pseudomonas aeruginosa susceptibility patterns in nosocomial infections. Journal of Antimicrobial Chemotherapy. 51:347-352.
253
342. Vila, J., J. Ruiz, P. Goni, and M. T. De Anta. 1996. Detection of mutations in parC in quinolone-resistant clinical isolates of Escherichia coli. Antimicrobial Agents and Chemotherapy. 40:491-3.
343. Vincent, J., L. Dogolo, B. A. Baris, S. A. Willavize, and R. Teng. 1998. Single- and multiple-dose administration, dosing regimens, and pharmacokinetics of trovafloxacin and alatrofloxacin in humans. European Journal of Clinical Microbiology and Infectious Disease. 17:427-30.
344. Vincent, J. L., D. J. Bihari, P. M. Suter, H. A. Bruining, J. White, M. H. Nicolas-Chanoin, M. Wolff, R. C. Spencer, and M. Hemmer. 1995. The prevalence of nosocomial infection in intensive care units in Europe. Results of the European Prevalence of Infection in Intensive Care (EPIC) Study. EPIC International Advisory Committee. Journal of American Medical Association. 274:639-44.
345. Visalli, M. A., M. R. Jacobs, and P. C. Appelbaum. 1998. Determination of activities of levofloxacin, alone and combined with gentamicin, ceftazidime, cefpirome, and meropenem, against 124 strains of Pseudomonas aeruginosa by checkerboard and time-kill methodology. Antimicrobial Agents and Chemotherapy. 42:953-5.
346. Visser, M. R., M. Rozenberg-Arska, H. Beumer, I. M. Hoepelman, and J. Verhoef. 1991. Comparative in vitro antibacterial activity of sparfloxacin (AT-4140; RP 64206), a new quinolone. Antimicrobial Agents and Chemotherapy. 35:858-868.
347. Vogne, C., J. R. Aires, C. Bailly, D. Hocquet, and P. Plesiat. 2004. Role of the Multidrug Efflux System MexXY in the Emergence of Moderate Resistance to Aminoglycosides among Pseudomonas aeruginosa Isolates from Patients with Cystic Fibrosis. Antimicrobial Agents and Chemotherapy. 48:1676-1680.
348. Waites, K., and S. Brown. 2003. Antimicrobial resistance among isolates of respiratory tract infection pathogens from the southern United States: data from the PROTEKT US surveillance program 2000/2001. South Medical Journal. 96:974-85.
254
349. Wang, J. C., and A. S. Lynch. 1993. Transcription and DNA supercoiling. Current opinions Genetic Development. 3:764-768.
350. Warren, J. W., E. Abrutyn, J. R. Hebel, J. R. Johnson, A. J. Schaffer, and W. E. Stamm. 1999. Guidelines for antimicrobial treatment of uncomplicated acute bacterial cystitis and acute pyelonephritis in women. Clinical Infectious Disease. 29:745-758.
351. Weiss, K., C. Restieri, R. Gauthier, M. Laverdiere, A. McGeer, R. J. Davidson, L. Kilburn, D. J. Bast, J. de Azavedo, and D. E. Low. 2001. A nosocomial outbreak of fluoroquinolone-resistant Streptococcus pneumoniae. Clinical Infectious Disease. 33:517-22.
352. Westbrock-Wadman, S., D. R. Sherman, M. J. Hickey, S. N. Coulter, Y. Q. Zhu, P. Warrener, L. Y. Nguyen, R. M. Shawar, K. R. Folger, and C. K. Stover. 1999. Characterization of a Pseudomonas aeruginosa efflux pump contributing to aminoglycoside impermeability. Antimicrobial Agents and Chemotherapy. 43:2975-2983.
353. Whitney, C. G., M. M. Farley, and J. Hadler. 2000. Increasing prevelance of multidrug resistance among clinical isolates of Streptoccus pneumonaie. New England Journal of Medicine. 343:1917-1924.
354. Wiedemann, B., and P. Heisig. 1994. Mechanisms of quinolone resistance. Infection. 22 Suppl 2:S73-9.
355. Wise, R., J. M. Andrews, J. P. Ashby, and J. Marshall. 1999. A study to determine the pharmacokinetics and inflammatory fluid penetration of gatifloxacin following a single oral dose. Journal of Antimicrobial Chemotherapy. 44:701-4.
356. Wise, R., J. M. Andrews, and L. J. Edwards. 1983. In vitro activity of Bay 09867, a new quinoline derivative, compared with those of other antimicrobial agents. Antimicrobial Agents and Chemotherapy. 23:559-64.
255
357. Wise, R., I. A. Donovan, M. R. Lockley, J. Drumm, and J. M. Andrews. 1986. The pharmacokinetics and tissue penetration of imipenem. Journal of Antimicrobial Chemotherapy. 18 Suppl E:93-101.
358. Wortmann, G. W., and S. P. Bennett. 1999. Fatal meningitis due to levofloxacin-resistant Streptococcus pneumoniae. Clinical Infectious Disease. 29:1599-600.
359. Wright, S. W., K. D. Wrenn, and M. L. Haynes. 1999. Trimethoprim-sulfamethoxazole resistance among urinary coliform isolates. Journal of Genitourinary Medicine. 14:606-9.
360. Yoshida, H., M. Bogaki, S. Nakamura, K. Ubukata, and M. Konno. 1990. Nucleotide sequence and characterization of the Staphylococcus aureus norA gene, which confers resistance to quinolones. Journal of Bacteriology. 172:6942-9.
361. Zechiedrich, E. L., and N. R. Cozzarelli. 1995. Roles of topoisomerase IV and DNA gyrase in DNA unlinking during replication in Escherichia coli. Genes and Development. 9:2859-2869.
362. Zeitlinger, M. A., P. Dehghanyar, B. X. Mayer, B. S. Schenk, U. Neckel, G. Heinz, A. Georgopoulos, M. Muller, and C. Joukhadar. 2003. Relevance of soft-tissue penetration by levofloxacin for target site bacterial killing in patients with sepsis. Antimicrobial Agents and Chemotherapy. 47:3548-53.
363. Zhanel, G. G., J. A. Karlowsky, L. Palatnick, L. Vercaigne, D. E. Low, D. J. Hoban, and T. C. R. I. S. Group. 1999. Prevalence of Antimicrobial resistance in Respiratory tract isolates of Streptococcus pneumonaie: results of a Canadian National Surveillance Study. Antimicrobial Agents and Chemotherapy. 43:2504-2509.
364. Zhanel, G. G., and A. M. Noreddin. 2003. Pharmacokinetics and Pharmacodynamics of fluoroquinolones, p. 87-106. In A. Ronald, Low DE. (ed.), Fluoroquinolone antibioitcs. Birkhauser Verlag, Basel Switzerland.

256
365. Zhao, Q., X. Z. Li, R. Srikumar, and K. Poole. 1998. Contribution of outer membrane efflux protein OprM to antibiotic resistance in Pseudomonas aeruginosa independent of MexAB. Antimicrobial Agents and Chemotherapy. 42:1682-8.
366. Zhao, X. 2003. Clarification of the MPC and the mutant selection window. Journal of Antimicrobial Chemotherapy. 52:731.
367. Zhao, X., and K. Drlica. 2002. Restricting the selection of antibiotic-resistant mutant bacteria: measurement and potential use of the mutant selection window. Journal of Infectious Disease. 185:561-5.
368. Zhao, X., J. Y. Wang, C. Xu, Y. Dong, J. Zhou, J. Domagala, and K. Drlica. 1998. Killing of Staphylococcus aureus by C-8-methoxy fluoroquinolones. Antimicrobial Agents and Chemotherapy. 42:956-8.
369. Zhao, X., C. Xu, J. Domagala, and K. Drlica. 1997. DNA topoisomerase targets of the fluoroquinolones: a strategy for avoiding bacterial resistance. Procedings from the National Acadamy of Science U S A. 94:13991-6.
370. Zhou, J., Y. Dong, X. Zhao, S. Lee, A. Amin, S. Ramaswamy, J. Domagala, J. M. Musser, and K. Drlica. 2000. Selection of antibiotic-resistant bacterial mutants: allelic diversity among fluoroquinolone-resistant mutations. Journal of Infectious Disease. 182:517-25.
371. Zinner, S. H., I. Y. Lubenko, D. Gilbert, K. Simmons, X. Zhao, K. Drlica, and A. A. Firsov. 2003. Emergence of resistant Streptococcus pneumoniae in an in vitro dynamic model that simulates moxifloxacin concentrations inside and outside the mutant selection window: related changes in susceptibility, resistance frequency and bacterial killing. Journal of Antimicrobial Chemotherapy. 52:616-22.
257
8.0 APPENDIX A 8.1 Solutions and Buffers 10X TE Buffer
Dissolve 12.1 g of Tris Base and 3.72 g of EDTA in 750 ml of distilled water. Bring to pH 8.0 using HCl. Adjust volume to 1 L and autoclave. 10X TBE Dissolve 90.8 g of Tris Base, 15.4 g of Boric acid and 0.37 g of EDTA in 1000 ml of distilled water and autoclave. 0.5 M EDTA Add 93.05 g of EDTA to 400 ml of distilled water. Add NaOH pellets one at a time until the EDTA is completely dissolved. Bring the pH to 8.0 by adding 5 M NaOH. Adjust volume to 500 ml and autoclave. 0.1 M Cacodylate Buffer Combine 16 g of sodium cacodylate (Mol. Wt. 160.0) with 920 ml of distilled water. pH to 7.2 with 0.1 N HCL. Adjust to 1000 ml with distilled water. 10% Sarcosyl Dissolve 10 g of sodium sarcosinate in 70 ml distilled water. Use of heat will aid in dissolving the sarcosyl. Adjust volume to 100 ml and autoclave. 1% Pulsed-Field Agarose Add 1.0 g pulsed-field agarose to 100 ml 0.5X TBE. Boil until agarose is dissolved and cool to 50°C before pouring the gel. Allow gel to solidify for a minimum of 30 min before use. 1% Agarose Gel for PCR Add 0.35 g to 35 ml of TBE Buffer containing ethidium bromide (ETBr). Microwave on high until the agarose is completely dissolved. Pour gel and allow it to solidify for ~30 min. 2% Glutaraldehyde Add 10 ml of 25% EM grade Glutaraldehyde to 115 ml of 0.1 M cacodylate buffer.

258
Cell Suspension Buffer Combine 100 μl of 1 M Tris-HCl (pH 7.2), 200 μl of 1 M NaCl and 1.0 ml of 0.5 M EDTA (pH 8.0). Dilute to 10 ml with sterile distilled water. ETBr Buffer Add 50 μl of ETBr at 10 mg/ml to 1 L of TBE Buffer for a final ETBr concentration of 500 µg/ml. ETBr Solution For Staining a Pulsed Field Gel Combine 40 μl stock ethidium bromide with 400 ml of distilled of distilled water. Low Melting Point Agarose Dissolve 1 g in 100 ml of TE Buffer at pH 8.0. Boil for 1-to-1.5 min and cool to 50-65°C in water bath. Lysis Buffer Combine 100 μl of 1 M Tris-HCl (pH 7.2), 500 μl of 1 M NaCl and 1.0 ml of 0.5 M EDTA (pH 8.0). Weigh out 20 mg of deoxycholate and 50 mg of N-Lauroylsarcosine and add to above mixture. Dilute to 10 ml with sterile distilled water. PFGE Running Buffer Dilute 300 ml of 10X TBE in 2700 ml of distilled water for a concentration of 1X TBE. Proteinase K Buffer Combine 50 ml of 0.5 M EDTA (pH 8.0) and 10 ml of 10% N-Lauroylsarcosine. Adjust pH to 9.0, then dilute to 100 ml with sterile distilled water. Proteinase K/Proteinase K Buffer Add 25 μl of 20 mg/ml of Proteinase K to 10 ml of Proteinase K Buffer.
Reynold’s Lead Citrate
Mix 1.33 g lead acetate, 1.76 g of sodium citrate and 30 ml of double distilled water that has been boiled to remove CO2. Shake vigorously for 1 min then place on a magnetic stirrer for 30 min. Add 8 ml of 1 N NaOH. Adjust to 50 ml using boiled deionized water. Mix well.

259
Skim Milk Dissolve 200 g of powdered skim milk in 1000 ml of distilled water and autoclave. TE Buffer Add 5 ml of 1 M Tris-HCl, pH 8.0, and 8 ml of 0.25 M EDTA, pH 8.0, into 494 ml of distilled water. Toluidine Blue Mix 2.5 g of Toluidine Blue, 2.5 g of sodium borate and 250 ml of distilled water for several hr. Tracking Dye Add 60 g of sucrose into 100 ml sterile distilled water to make a 60% sucrose mixture. Add 0.25 g of xylene cyanol into 100 ml of sterile distilled water. Add 10 mM Tris at pH 8.0. Combine the 60% sucrose, the 0.25% xylene cyanol. TSA Add 40 g to 1 L of distilled water. Autoclave.
Wash Buffer Combine 10 ml of 1M Tris-HCl (pH 7.6) and 20 ml of 0.5 M EDTA, pH 8.0. Dilute to 100 ml with sterile distilled water.

260
8.2 APPENDIX B
8.2 Suppliers 8.2.1 Media Mueller Hinton Broth (MHB) Becton, Dickinson and Co., Sparks, MD Todd Hewitt Broth (THB) Becton, Dickinson and Co., Sparks, MD Tryptic Soy Agar (TSA) with Becton, Dickinson and Co., Sparks, MD 5% Sheep Blood 8.2.2 Antimicrobial Agents Moxifloxacin, ciprofloxacin – Bayer pharmaceutical, West Haven, CT
Levofloxacin – The R. W. Johnson Pharmaceutical Research Institute, Raritan, NJ
Gatifloxacin – Bristol Myers Squibb, Montreal, QC Grepafloxacin – – Bristol Myers Squibb, Montreal, QC Trovafloxacin – Pfizer Canada, Kirkland, QC Garenoxacin - – Bristol Myers Squibb, Montreal, QC Gemifloxacin – Glaxco Smithkiline pharmaceuticals, Collegeville, PA Ceftazadime – – Glaxco Smithkiline pharmaceuticals, Collegeville, PA Gentamiycin – Sigma-Aldrich Co., St. Louis, MO
Tobramycin - Sigma-Aldrich Co., St. Louis, MO 8.2.3 Reagents, Chemicals and Enzymes 25% Glutaraldehyde (EM Grade) Marivac, St. Laurent, QC 95% Alcohol Commercial Alcohols Inc., Brampton, ON Agarose Invitrogen, Corisbad, CA Ammonium Hydroxide BDH Inc., Toronto, ON Araldite 502 Ted Pella, Inc., Millville, NJ Boric Acid BDH Inc., Toronto, ON Buffer A New England BioLabs, Mississauga, ON Buprenorphine Reckitt and Colman Pharmaceuticals Inc.
Richmond,VI CCCP Sigma-Aldrich, St. Louis, MO
Deoxycholate Acid Sigma-Aldrich Co., St. Louis, MO DMP-30 Ted Pella, Inc., Millville, NJ [Tri(Dimethylaminoethyl Methacrylate)] EDTA Sigma-Aldrich Co., St. Louis, MO Ethidium Bromide BioRad Loaboratories, Hercules, CA
261
Ethanol Electron Microscopy Sciences, Fort Washington, PA Eyelube Sabex, Boucherville, QC Hydrochloric Acid (HCl) BDH Inc., Toronto, ON InstaGene Matrix BioRad Laboratories, Hercules, CA Kodak D-19 Developer Kodak, Saint-Laurent, QC Kodak Rapid Fixer Kodak, Saint-Laurent, QC Ketamine Warner-Lambert and Co., Bellevelle, ON Lambda Ladder New England BioLabs, Mississauga, ON Lead Acetate Anachem, Bedfordshire, United Kingdom Lead Citrate Ted Pella, Inc., Millville, NJ Low Melting Point BioRad Laboratories, Hercules, CA Agarose Sigma Chemical Co., St. Louis, MO Mass Ladder Invitrogen, Burlington, ON N-Laurylsarcosine Sigma Chemical Co., St. Louis, MO Oxidase Fisher scientific, Nepean, ON
Pentobarbital sodium Bimeda-MTC Animal Health Inc. Cambridge, ON
PCR Ladder Invitrogen, Carisbad, CA PCR Primers Sigma-Genosys, Oakville, ON PuReTaq Ready-To-Go Amersham/Pharmacia, Piscataway, NJ Pfx platinum taq polymerase Gibco-BRL, Burlington, ON Proteinase K Sigma Chemical Co., St. Louis, MO Pulsed Field Certified Agarose Sigma Chemical Co., St. Louis, MO Saline Baxter, Deerfield, IL Skim Milk Becton, Dickinson and Co., Sparks, MD Slidex Pneumo-Kit bioMerieux, Marcy-l’Etoile, France SmaI New England BioLabs, Mississauga, ON SpeI New England BioLabs, Mississauga, ON Sodium Borate Fisher Scientific, Nepean, ON Sodium Cacodylate Ted Pella, Inc., Millville, NJ Sodium Chloride (NaCl) BDH Inc., Toronto, ON Sodium Citrate BDH Inc., Toronto, ON Sodium Hydroxide (NaOH) Pellets BDH Inc., Toronto, ON Sucrose BDH Inc., Toronto, ON Tris-HCl Sigma Chemical Co., St. Louis, MO Uranyl Acetate Ted Pella, Inc., Millville, NJ Vetbond tissue adhesive 3M animal care products St. Paul MN Wizard Kit Promega, Madison, WI Xylene Cyanol BioRad Laboratories, Hercules, CA Zylazime Bayer Veterinary Division, Toronto, ON
262
8.2.4 Disposable Labware
200 µl Pipette Tips VWR International, Edmonton, AB Corning Cryovials Corning Inc., Corning, NY Cuvettes Fisher scientific, Nepean, ON Disposable scalpels Fisher scientific, Nepean, ON Falcon multiple well tissue VWR Canlab, Edmonton, AB Culture plates Glass Tubes Fisher scientific, Nepean, ON Latex Gloves Fisher scientific, Nepean, ON McFarland Tubes Fisher scientific, Nepean, ON Microcentrifuge Tube Fisher scientific, Nepean, ON
Microtitre Plates Sarstedt, Newton, NC Pasteur Pipettes Fisher scientific, Nepean, ON
Sterile Plastic Petri Plates Fisher Fisher scientific, Nepean, ON Swabs Fisher scientific, Nepean, ON
Wooden Applicator Sticks Puritan, Guilford, ME 3cc Monoject Leur Lock Syringe Sherwood Medical, St. Louis, MO 20 gauge needle Sherwood Medical, St. Louis, MO
8.2.5 Equipment
20 ul, 200 μl and 1 ml Pipettors Gilson Company, Inc., Lewis Center, OH -70°C Freezer Forma Scientific Inc., Marjetta, OH
Avanti J-E Centrifuge Beckman Coulter, Palo Alto, CA CHEF DRIII PFGE System BioRad Laboratories, Mississauga, ON
Colorimeter Hach Company, Loveland, CO DNA theromocycler MJ Research, Waltham, MA Forcepts Fisher scientific, Nepean, ON Hot Plate/Stirrer-Model 300T Fisher scientific, Nepean, ON Homegenizer Labcor Concord ON Hibitane soap Fisher scientific, Nepean, ON Needle driver Fisher scientific, Nepean, ON Pediatric Bactec blood culture Beckton Dickson, Sparks, MD
bottles PCR Gel Casting Mold BioRad Laboratories, Mississauga, ON
PFGE Gel Casting Mold BioRad Laboratories, Mississauga, ON pH Meter Corning Inc., Corning, NY
Pulsed Field Gel BioRad Laboratories, Mississauga, ON Casting Apparatus Gel Doc 1000 Illuminator BioRad Laboratories, Mississauga, ON
263
Microwave Oven Samsung, Suwon, Korea pH meter BioRad Laboratories, Mississauga, ON
Oxygen Incubator Hotpack Corp., Philadelphia, PA Rat tail vein catheter Becton Dickinson Infusion Therapy Sysem
Inc., Sandy, UT Shaking Water Bath Mandel Scientific Co., Guelph, ON Spectrophotometer Pharmacia, Cambridge, United Kingdom Thermocycler (PCR Express) Thermo Hybaid, Ashford, Middlesex, United Kingdom Vortex (Mini-Shaker Model 58) Fisher scientific, Nepean, ON Vicryl silk sutures Ethicon, Sommerville, NJ Viteck identification/susceptibility BioMerieux, St. Laurent, QC Cards Weigh Scale – Mettler PC440 DeltaRange, Zurich, Switzerland
8.2.6 Rats Male, Sprague Dawley white rats Charles River, Wilmington, MA