Embed Size (px)
Citation preview

The Mouse Embryonic Imaging Guide
I. Introduction
The mouse has always been considered a good embryological model of mammalian development
because it has good-sized litters of offspring (about 8–20 offspring per litter) and a short pregnancy (about
21 days). The introduction of transgenic and gene target methods has increased the use of mice in the study
of human diseases in recent years. Alteration or misexpression of genes induces phenotypic changes at early
embryonic stages in mouse fetal development and in many diseases [1]. The heart is the first organ to
develop and function during the development of the mouse embryo, and many mouse models with
congenital heart defects suffer early embryonic death. Therefore, assessment of the structure and function of
the fetal mouse cardiac system has become an increasingly important and popular issue. In this guide, we
will provide an introduction to mouse fetal heart development. Of critical importance in such studies is the
availability of tools that can achieve real-time evaluation and an approximately tenfold improvement of
resolution compared to clinical ultrasound machine in order to monitor in utero progress during mouse
pregnancy. A high-frequency (40–50 MHz) and high-resolution (~30 μm) ultrasound imaging system, called
the Prospect system, which is a useful tool for visualizing live mouse embryos in utero, was used in this
guide.
Before describing the scanning process, first consider the embryonic mouse cardiovascular system and
its circulation. The cardiovascular system in mammalian embryos is composed of complicated vascular
networks, both within the actual embryo and in the extraembryonic tissues, which aid its development. The
embryonic mouse cardiovascular system has three main components: the embryonic, yolk sac, and allantoic
or umbilical circulatory systems. The embryonic circulatory system is made up of the heart and the arteries
and veins; the main branches of the latter two are the aorta and the cardinal vein. The yolk sac circulatory
system comprises the vitellin arteries and veins, and the main branches of the allantoic or umbilical
circulation are the allantoic artery and vein. The proper development and coordination of all three
circulatory systems is crucial to maintaining normal cardiovascular function and ensuring embryonic
survival. Defects in any one of these systems in utero are normally fatal [2].
Rhythmic cardiac contractions can be detected as early as the 5 somite stage [~embryonic day (E) 8.25],
and blood flow is detectable by Doppler ultrasound by the 7–8 somite stages. At these stages, the mouse
heart approximates a straight tube. Notably, the onset of cardiac activity coincides precisely with entry of
primitive erythrocytes from the hematopoietic yolk sac into the embryo proper at these early stages. These
findings indicate that the establishment and early development of the initial circulation are precisely
coordinated to form a functioning pump, an intact vascular circuit, and oxygen-carrying erythrocytes to
support the growing embryo. The earliest origins of a functional cardiovascular system occur well before the
embryo becomes dependent upon the convection of oxygen and nutrients, but are probably necessary for
cardiac morphogenesis and vasculogenesis [2] [3].
The mouse embryo circulatory system gradually matures during the late embryonic stages. In brief,
maternal blood enriched with oxygen and nutrients flows from the umbilical vein into the inferior vena cava
via the ductus venosus, where it mixes with deoxygenized blood. It then enters the heart via the right atrium,

where it mixes with blood from the right superior vena cava. In the right atrium, the blood flow divides into
two paths. In one of the paths, the largest portion of the largely oxygenated blood flows through the inferior
vena cava into the left atrium via a special fetal opening between the left and right atria, called the foramen
ovale. From the left atrium, it mixes with a small amount of blood returning from the undeveloped lungs
through the pulmonary veins, moves into the left ventricle via the mitral valve, and is then pumped into the
aorta. The ascending aorta provides blood to the head and upper extremities, and blood travels from the
descending aorta to the other areas of the body, then through smaller vessels to return to the placenta via the
umbilical arteries. Returning blood from the head and upper extremities travels through the right superior
vena cava, where CO2-rich and nutrient-poor blood flows, and is pumped back into the right atrium. The
second path comprises about one-third of the blood; the deoxygenated blood that enters the rostral through
the right superior vena cava descends into the right ventricle via the tricuspid valve and is pumped through
the right-ventricle outflow tract. Most of this blood is diverted through the ductus arteriosus and into the
aorta, and a small amount continues on through the pulmonary arteries to the lungs [4]. A schematic diagram
of the circulatory system in the late mouse embryonic stages is shown in Figure 1.
Fig. 1. Schematic diagram of the circulatory system in the late mouse embryonic stages. SVC, superior vena
cava; IVC, inferior vena cava; RA, right atrium; LA, left atrium; RV, right ventricle; LV, left ventricle; RVOT,
right ventricular outflow tract; LVOT, left ventricular outflow tract.
Foramen Ovale
Aortic Arch
Ductus Arteriosus
RA
LA
RV LV
SVC
Ductus Venosus
Umbilical Arteries
Umbilical Vein
Liver
Placenta
Left Lung
Portal Vein

The embryonic circulation network differs in many ways from that of adults in both humans and mice.
The existence of the foramen ovale and the ductus arteriosus allows the circulatory system to run in parallel
rather than in series. Most of the blood being pumped from the right side of the heart to the left thus
bypasses the pulmonary circulation, which has a high resistance to blood flow, and most of the blood being
pumped from the right ventricle passes through the ductus arteriosus and into the thoracic aorta. Only a
small proportion of the blood will pass through the pulmonary arteries and into the lungs, and so the stroke
volume is greater in the right ventricle than in the left ventricle [4].
There is a gradual increase in the embryonic heart rate and systolic cardiac work in order to meet the
metabolic demands of the growing embryo. However, the continued increase in the mouse heart rate
postpartum is an important part of its developmental maturation, as opposed to the postpartum relative
reduction in heart rate observed in humans. Studies of myocardial diastolic function in mice have extended
from the middle and late stages of pregnancy to the early postnatal and young-adult stages. The E and A
waves (corresponding to the first and second peaks, respectively) across the atrioventricular valves are
characterized by diastolic function, which can be measured by pulsed-wave (PW) Doppler ultrasound;
diastolic function gradually matures from early gestation to the third week of postnatal life, with progressive
improvements in active ventricular filling [3].
II. Animal model
Normal imprinting control region (ICR) timed pregnant dams were used in this guide. The changes in
ICR mouse embryos were monitored on a daily basis, and especially their cardiac geometry and function,
from E6.5 to E18.5, using in utero ultrasound with the Prospect system.
III. Embryos Scanning
The transducer is first placed above the maternal abdomen across the urethral opening to image the
maternal bladder. Using the maternal bladder as a starting reference point, the uterine horns containing
embryos situated on either side of the maternal bladder could be sequentially imaged. It is possible to scan
adjacent embryos in order to track them; however, if there is any doubt, an embryo should be skipped to
avoid double sampling, especially when spontaneous uterine movements are excessive. There are usually six
to ten embryos available for imaging in each litter.
It is common to scan a fetus in the sagittal, frontal, and transverse planes when performing
echocardiography (as shown in Figure 2). The sagittal and frontal planes in the embryo correspond to the
parasternal long- and short-axis views in the adult mouse, respectively. The four-chamber apical view in the
adult corresponds to the transverse plane through the fetal thorax. The sagittal view should be used to
identify the atrioventricular valves. Using this view, the two ventricles and their synchronous contractions
are readily visible. The right and left ventricles, and the interventricular septum could be displayed in the
frontal plane. This is the optimal view for observing the changes in cardiac ventricular dimensions in
M-mode imaging. The embryonic heart and arms can be imaged in the transverse plane. This view
simultaneously reveals the left ventricle, right ventricle, and atrioventricular valves, corresponding to the
four-chamber view in the adult mouse heart [4].

(A)
(B) (C) (D)
Fig. 2. (A) Schematic diagram of the fetus and the three orthogonal imaging planes. (B) Embryonic B-mode
image in the sagittal plane at E13.5. (C) Embryonic B-mode image in the frontal plane at E13.5. (D)
Embryonic B-mode image in the transverse plane at E12.5. S, sagittal plane; F, frontal plane; T, transverse
plane.
B-mode imaging, which is a two-dimensional (2-D) imaging mode, allows observation of the target
structure, positioning, and analysis of the physical parameters. For example, the changes in cardiac
dimension during contraction may be used to gauge cardiac function, while the measurement of vessel size,
in conjunction with Doppler flow waveforms, allows the calculation of volume flow. Use of B-mode
scanning during the entire embryonic developmental period revealed that the size and structure of the
embryonic left and right cardiac ventricles are similar. The volume of the left ventricle becomes significantly
greater than that of the right ventricle after birth. The mouse embryonic heart can be readily identified on
real-time images as a bright, highly echogenic structure with rhythmic contractions in B-mode images
produced at frequencies of 40~50 MHz because the blood pool in the heart is echo-dense at these
frequencies. As such, the blood vessels prominently appear in real time as dramatic speckle patterns
representing blood flow. This effect is not evident on still frames since the moving speckle pattern is lost. On
real-time video images, the umbilical vessels, vitelline vessels, dorsal aorta, great veins, and cerebral vessels
can be all easily identified, and allow PW Doppler to yield clear blood velocity waveforms.
S
F
T

Doppler ultrasound is a noninvasive, in utero approach for measuring cardiovascular function. With
the Prospect system, the color/power Doppler mode provides a 2-D color velocity map superimposed on the
B-mode image, which facilitates the positioning of the targets of interest. PW Doppler mode, on the other
hand, produces the spectrum (i.e., the velocity distribution) as a function of time. Employing the triplex
function in PW Doppler mode (i.e., B-mode, color Doppler, and spectral Doppler images displayed
simultaneously in the same window) makes it possible to locate the targets and conduct quantitative flow
measurements. The analysis of cardiovascular function in mouse embryos has been further extended by
including 40- to 50-MHz pulsed Doppler, which enables precise measurements of blood velocity waveforms.
The higher-frequency Doppler transducers are also conducive to the acquisition of low-velocity blood flow
signals. The PW Doppler beam should be aligned with the blood flow direction as accurately as possible so
as to minimize anomalies in subsequent calculations of flow velocity, since the cosine of the angle between
the flow direction and the Doppler beam can affect the calculations of the Doppler frequency shift.
Furthermore, the Doppler shift frequency is proportional to the flow velocity, and so directly affects the
estimation of flow velocity. It should be noted that blood is echo-dense, and the endocardial lumen cannot be
visualized in the early to midgestation mouse embryo by using high center frequencies of 40~50 MHz [2].
That color Doppler and PW Doppler in combination with 2-D imaging is highly effective for
determining the left-to-right orientation of the heart [4]. A great deal of information is available regarding
the acquisition of images of the embryonic and extraembryonic circulatory systems using Doppler
waveforms. Data are available on both the measurements of arterial and venous flow velocities and the
visualization of the placenta. We have previously been able to discern clear Doppler signals from mouse
embryos as early as E9, which appear as biphasic inflow patterns. Embryonic blood exhibits laminar flow
with a parabolic spatial velocity, and therefore appears to behave like a Newtonian fluid. The study of major
vascular development is aided by the intrinsic contrast of primitive nucleated erythroblasts at high
frequencies [3]. Moreover, it is possible to obtain details of the mitral and tricuspid inflow in the frontal
plane of the embryo by using PW Doppler. The shape of the Doppler waveforms across the atrioventricular
valves is bicuspid. The first and second peaks (i.e., E and A waves, respectively) correspond to early
ventricular filling of diastole and atrial systole, respectively. The velocity of the A wave is usually higher
than that of the E wave, suggesting that atrial systole in ventricular filling is more important during the fetal
period than postnatally [4]. It is important to note that the cardiac valves do not develop in the mouse
embryo until E13.5. Prior to this stage, the dynamic apposition of the endocardial cushions is used to prevent
the regurgitation of blood flow. Another vessel worthy of particular attention during the embryonic
developmental period is the dorsal aorta. The embryonic dorsal aorta is the primary artery in the developing
mouse embryo, and has a diameter of ~300 μm. Fundamental characterization of cardiac systolic function
and blood flow in mouse embryos may be estimated using Doppler waveform analysis of the dorsal aorta
[2].

IV. Embryonic Staging and Main Developmental Events
The mouse embryonic development stages can be roughly separated into two periods: preimplantation
and postimplantation [5]. A summary of mouse embryogenesis throughout development will now be
provided to enable the features of embryonic mouse development to be more easily distinguished in
ultrasound images. It should be stressed that when using the Prospect system, mouse embryos can only be
visualized in the postimplantation period, around 6.5 days after conception. In this guide, embryos were
staged in days of gestation, where day 0.5 (i.e., E0.5) was defined as noon on the day on which a vaginal
plug was detected after overnight mating [1].
A. Pre-implantation Period
The various stages of the preimplantation period are described in the following sections.
E 0-1
Fertilized one-cell-stage egg (embryo). The embryo is located in the ampullary region [5].
E 1
Two-cell-stage embryo. The embryo can be seen passing down the oviduct, beyond its ampullary
region [5].
E 2
Four- to 16-cell-stage embryos. These may range from early to fully compacted morulae. Embryos can
be seen passing down the oviduct toward the uterotubal junction [5].
E 3
Embryos have developed from the morula to the blastocyst stage (zona-intact) during this stage, and
possess a distinct inner cell mass and an outer layer of trophectoderm cells. This is the result of the
polarization process. Such embryos are usually located in the uterine lumen [5].
E4
Embryos at this stage are invariably zona-free blastocysts and are located within the uterine lumen [5].
B. Post-implantation Period
The various stages of the postimplantation period are described in the following sections.
E4.5
During this stage, the blastocyst implants. The embryonic proximal or visceral endoderm cells appear
as a unique layer covering the blastocoelic surface of the inner cell mass. The endoderm cells begin to
migrate to the blastocoelic surface of the mural trophectoderm at a slightly later stage, and they complete
this during E5. The extraembryonic distal (or parietal) layer of the endoderm is composed of this second
group of cells [5].

E5.5
The number of cells constituting the inner cell mass is substantially increased by this stage, resulting in
the embryo subsequently growing toward the abembryonic pole of the implanting blastocyst, to form the egg
cylinder [5].
E 6.5
The Prospect system enables the early detection of the conceptus at E6.5. At this stage the inner cell
mass, which is composed of the epiblast, primitive endoderm, and trophectoderm, has begun to form a
cylindrical embryo [6]. Around the implantation in the lumen of the uterus, the embryo can be seen as a
slightly brighter echogenic ring near the trophoblast–decidual interface. This bright region is approximately
250 μm in diameter [6] [7]. The circumference of the ring is fairly uniform in brightness, although the
mesometrial side where the placenta will develop is brighter than the antimesometrial side [7]. Figure 3
shows the earliest detection of the conceptus at day 6.5.
(A) (B)
Fig. 3. Both (A) and (B) display the early development of the mouse embryo at E6.5, showing a slightly
brighter echogenic ring in each embryo in B-mode imaging using the Prospect system.
Egg cylinder stage embryo at center of decidual reaction
Mesometrium Egg cylinder stage embryo at center of decidual reaction
Mesometrium

E 7.5
By day 7.5 the embryo has developed three distinct cavities: the amniotic cavity (AC), the exocoelomic
cavity (ECC), and the ectoplacental cavity (EC) [3] [6]. The bright echogenic region is localized primarily
near the mesometrial side of the implantation site [7]. Shortly after the onset of this stage, the anterior and
posterior amniotic folds amalgamate, resulting in the obliteration of the proamniotic canal and the formation
of the ECC. This is attributable to the increased growing rate of the allantois into the cavity of the posterior
amniotic fold. As a consequence of these events, the embryo becomes divided into the aforementioned EC,
the ECC, and the AC, which are separated by the chorion and amnion, respectively. In the more advanced
embryos observed at this stage, the expansion of the ECC and AC leads to a reduction in the EC volume [5].
B-mode images of E7.5 mouse embryos are shown in Figure 4.
(A) (B)
(C)
Fig. 4. B-mode images of E7.5 mouse embryos obtained using the Prospect system. (A) The proamniotic
canal, inner circular layer, and the outer longitudinal layer of myometrial smooth muscle can be clearly
discerned. (B) Visualization of the proamniotic canal, and the extraembryonic and primitive ectoderm. (C)
The proamniotic canal, ectoplancental cone, and primitive ectoderm inside the uterus.
Proamniotic canal
Extraembryonic ectoderm
Primitive ectoderm
Proamniotic canal
Inner circular layer of myometrial smooth muscle
Outer longitudinal layer of myometrial smooth muscle
Proamniotic canal
Ectoplancental cone
Primitive ectoderm

E 8.5
The developmental E8.5–E13.5 stages in mouse correspond to 3–6 weeks of human gestation. The
earliest stage of heart and brain development in utero in a mouse embryo is at E8.5 [1] [8]. The allantois can
be visualized and the embryo can be seen wrapping around the amniotic cavity [6]. The most conspicuous
features evident at this stage on high-frequency ultrasound images are the open neural folds, which make it
easy to distinguish between embryonic and extraembryonic tissues. Early heart activity in the primitive heart
tube and the initial formation of the chorioallantoic placenta can be detected at this stage in more advanced
E8.5 embryos [1] [4].
The embryo changes morphologically between E8.5 and E9.5, whereby its dorsal region changes from
being the inside part of the U-shaped embryo (concave) to being the outside part (convex). A fluid-filled
neural tube will be formed at E9.5, when the open cephalic neural folds start to grow and turn over at E8.5.
This will eventually become the central nervous system of the adult mouse. Between E8.5 and E9.5 the
primitive heart is transformed from a straight tube through a looping process to form a single atrium and
ventricle. Then, at around E10.5 the initial stages of atrial and ventricular septation give rise to recognizable
precursors of the final four cardiac chambers [1].
The heart is the first organ system to differentiate and to function, and is the most prominent organ present in
the embryo at this stage. At E8.5 the heart is an asymmetrical globular structure in embryos with eight to ten
pairs of somites, and the embryonic vasculature at this stage contains primitive nucleated red blood cells. At
this stage the heart is divided into a common atrial chamber and a common ventricular chamber. The
common atrial chamber receives blood from the right and left horns of the sinus venosus, and the common
ventricular chamber is in direct continuity with the bulbus cordis region of the primitive heart, which in turn
is in direct continuity with the outflow tract of the heart [5]. Transabdominal B-mode images of E8.5 mouse
embryos are shown in Figure 5.

(A) (B)
(C) (D)
Fig. 5. B-mode images of E8.5 mouse embryos obtained using the Prospect system. (A) The amniotic and
coelomic cavities of the embryo. (B) The neural folds, chorion, and amnion inside the uterus. (C) The neural
folds, allantois, and amnion of the embryo are clearly visible. (D) The neural folds, amnion, and
mesometrium, which connect two embryos, are displayed.
Amniotic cavity
Exocoelomic cavity
Chorion
Amnion Neural folds
Neural folds
Aminon Allantois Neural folds
Aminon
Mesometrium

E 9.5
By E9.5 the neural tube is divided into three regions: forebrain, midbrain, and hindbrain. The neural
tube and beating heart are the most prominent organs present in the embryo at this stage on real-time
high-frequency ultrasound images [1]. In ultrasound images they appear as echogenic foci residing near the
maternoplacental interface upon formation of the chorioallantoic placenta. As gestation progresses the
echogenic foci will become more discrete and widely spaced at this location, and also larger and/or brighter
in images than at earlier stages [7].
Cardiac looping can be visualized from E9.5, and the common atrium and ventricle can be
distinguished. Simultaneously, synchronous atrial and ventricular contractions and the atrial contraction at
end diastole are discernible [3] [8]. At E9.5 the overall volume of the common atrial chamber in an embryo
increases substantially, and the component parts of the common atrium become more clearly delineated [5].
Between E9.5 and E14.5 the cardiac systolic work and output—such as heart rate, peak aortic flow velocity,
velocity–time integral, and ejection time—increase geometrically, and become proportional to the cycle
length which is defined as the total time of one complete injection cycle (in seconds) [2]. Images of E9.5
mouse embryos are presented in Figure 6.

(A) (B)
(C)
Fig. 6. High-frequency ultrasound images of E9.5 mouse embryos produced using the Prospect system. (A)
The heart, forebrain, midbrain, and hindbrain of the embryo are clearly visualized on B-mode imaging. (B)
The heart, amnion, and forebrain of the embryo on B-mode imaging. (C) At earlier developmental stages of
the mouse embryo, the cardiac inflow and outflow signals are generated in opposite directions in the PW
Doppler mode, since the cardiac inflow and outflow axis are at almost 180º from one another. The inflow
Doppler waveform demonstrates the presence of separate E and A waves, with A-wave dominance.
Heart
Forebrain
Midbrain Hindbrain
Heart
Forebrain Amnion
Inflow
Outflow
E A

E 10.5
At E10.5 the shape and subdivisions of the neural-tube cavity are easily identified on high-frequency
ultrasound images. Sagittal views of the embryonic cardiac image demonstrate the allantois, pericardial
effusion, ventricle, and the neural tube (forebrain, midbrain, and hindbrain).
The most obvious events that occur at this stage are the changes taking place in the embryonic heart
and the vessels that emerge from the heart and drain into it. The most important changes within the heart are
the earliest events associated with the process of septation, and a relatively broad and thickened region may
be observed in the midline in the dorsal part of the wall of the common atrial chamber [5]. The atria and
ventricles of the embryonic heart achieve a sufficiently well-developed state at E10.5 such that they can be
readily visualized (Fig. 7A). By E10.5–E11.5 the distinction between the presumptive left and right
ventricles becomes more apparent, the outflow tract is prominent, and two parallel streams of blood flow can
be displayed in real time [1] [8]. It is worth noting that the major blood vessels, such as the aorta, bulbus
cordis, or outflow tract, and the umbilical vessels can be distinguished due to the high-frequency ultrasound
signals from the blood and the resulting moving speckle patterns on real-time images [1].
In addition, the limb buds become increasingly prominent at this stage, and their sharp apical
ectodermal ridges are more clearly seen in the forelimb buds than in the hindlimb buds [5]. Furthermore, the
liver primordium can be identified lying posterior to the heart; it undergoes its first expansion at E10.5.
Between E10.5 and E13.5 the placenta changes from a discoid structure to a larger planoconvex structure,
with prominent sinusoids on its outer surface [8]. Figure 7 shows images of the E10.5 mouse embryo.
(A) (B)
Heart (atria and ventricles)
Heart
Forebrain
Dorsal aorta
Placenta

(C)
(D)
Fig. 7. High-frequency ultrasound images of E10.5 mouse embryos obtained using the Prospect system. (A)
The heart of the embryo, including the developing atria and ventricles, can be identified on B-mode imaging.
(B) The heart, dorsal aorta, and forebrain of the embryo are clearly evident on B-mode imaging. (C) PW
Doppler waveforms of mouse embryonic cardiac inflow and outflow. Increased inflow and outflow velocities
can normally only be observed in older embryos. (D) PW Doppler image of the umbilical cord. The vessels
of the umbilical circulation can be distinguished by PW Doppler imaging. Since the respective arteries and
veins flow in opposite directions, their Doppler waveforms are distinct and appear on either side of the
velocity baseline.
Inflow
Outflow
A E
Artery
Vein
Umbilical cord
Placenta

E 11.5
At E11.5 the beating heart, the neural tube, and developing somites in the tail region are visible in
longitudinal views of the embryo; the crown–rump length can be measured in this view [6]. The most
obvious events that occur at this stage are septation of the outflow tract, atria, and ventricles. The details of
these events are described below.
The undivided outflow tract can be divided into three parts: the aortic sac, truncus (anteriosus), and
conus. These different parts contribute to the outlets, valves, and bases of the aortic and pulmonary trunks,
respectively, during septation of the common outflow tract, and are formed by E13.5 [9]. Atrial septation
occurs at this stage, which involves growth of the septum primum toward the atrioventricular bulbar cushion
tissue within the common atrial chamber of the heart. The peripheral margin of the septum primum appears
to be quite bulbous at E11.5 [5]. The interventricular septum is derived from the region of ventricular wall
adjacent to the bulboventricular groove, which is apparent at this stage, although the connection between the
future ventricles is still open through the bulboventricular canal. This process is known as ventricular
septation. The interventricular septum will be produced between the future ventricles at later stages of
development [9]. Images of the E11.5 mouse embryo are shown in Figure 8.

(A) (B)
(C) (D)
(E)
Midbrain Heart
Umbilical cord Optic vesicle
Forebrain
Heart
Umbilical cord
Dorsal aorta
Umbilical cord
Placenta
Inflow
Outflow

(F)
(G)
Fig. 8. High-frequency ultrasound images of E11.5 mouse embryos obtained using the Prospect system. (A)
The heart, midbrain, optic vesicle, and umbilical cord of the embryo can be identified on B-mode imaging.
(B) The heart, forebrain, and umbilical cord of the embryo are clearly evident on B-mode imaging. (C) The
umbilical cord and placenta are observed on B-mode imaging. (D) B-mode image of the embryonic dorsal
aorta. (E) PW Doppler waveform of mouse embryonic cardiac inflow and outflow. (F) PW Doppler
waveform of the umbilical vessels obtained from the B-mode image shown in panel C. (G) PW Doppler
waveform of the mouse embryonic dorsal aorta obtained from the B-mode image shown in panel D.
Artery
Vein

E 12.5
The main developmental events that occur at E12.5 are the progressive septation of the common
outflow tract, atria, and ventricles, and the initiation of atrioventricular canal septation [3] [9]. By E12.5 the
septation of the distal portion of the outflow tract, including the semilunar outflow tract valves, is complete.
The proximal part of the outflow tract septum in the conus starts to close in a zipper-like fashion from distal
to proximal toward the ventricles. In order to divide the atrioventricular canal into separate right and left
canals, the superior and inferior atrioventricular cushions fuse to form an atrioventricular septum or septum
intermedium. The atrioventricular septum shifts over the interventricular septum, which allows the right and
left atrioventricular canals to be aligned with the corresponding ventricles. At this stage there is still
communication between the two ventricles, but by E13.5–14.0 the most proximal part of the conal ridges
together with the atrioventricular cushions will contribute to the membranous component of the
interventricular septum and will close the connection between the ventricles [9].
At E12.5–E13.5 the size of all four chambers of the heart has increased markedly, and the configuration
of the outflow tract has changed significantly. In addition, a distinct C-shaped aorta can be traced, arising
from the left ventricle and passing to the right of the pulmonary artery before looping to the left [8]. Images
of the E12.5 mouse embryo are shown in Figure 9.

(A) (B)
(C) (D)
(E)
Heart
Mesencephalic vesicle
Third vesicle
Telencephalic vesicles
Umbilical cord Spinal cord
Inflow
Outflow

(F)
(G)
Fig. 9. High-frequency ultrasound images of E12.5 mouse embryos obtained using the Prospect system. (A)
B-mode image of the embryonic heart, in which the four chambers can be identified. (B) Embryonic B-mode
image of the brain. The telencephalic vesicles (future lateral ventricles), third vesicle, and mesencephalic
vesicle (future aqueduct) inside the brain can be visualized clearly. (C) B-mode image of the umbilical cord.
(D) B-mode image of the embryonic spinal cord. (E) PW Doppler waveform of mouse embryonic cardiac
blood flow through the mitral orifice. (F) PW Doppler waveform of the umbilical vessels obtained from the
B-mode image shown in panel C. (G) PW Doppler waveform of the mouse embryonic dorsal aorta.
Artery
Vein
Dorsal aorta

E 13.5
At E13.5 several embryonic structures become visible, such as the vertebra and ribs, and the size of the
embryo begins to increase dramatically [4]. The other main event that occurs at this stage is separation of the
common outflow tract and ventricles, although the atrial and atrioventricular septa are still under formation
[3] [9]. At the site of fusion of the conal ridges, there is a fibrous raphe in the wall between the pulmonary
and aortic roots, which will be transformed into a muscularized, adult-type septum.
At this stage the various types of valve leaflet have not yet fully developed. The leaflets of both the
tricuspid and mitral valves appear to be elongated and press closely against each other. A process of
myocardial delamination separates the lower part of the atrioventricular valve leaflets from the myocardial
wall and the interventricular septum, resulting in freely moveable, bilayered leaflets. The final shaping and
composition of the atrioventricular valve leaflets occur as a result of an apoptotic process called excavation,
which takes place in the atrial face of the leaflets during E12.5–15.5. The maturation of the semilunar valve
leaflet is also progressing at this stage, and is the last major morphogenetic event pertaining to the outflow
tract [9].Images of the E13.5 mouse embryo are shown in Figure 10.
(A) (B)
(C)
Lateral ventricles
Heart
Heart
Dorsal aorta
Umbilical cord

(D)
(E)
Fig. 10. High-frequency ultrasound images of E13.5 mouse embryos obtained using the Prospect system. (A)
B-mode image of the embryo in the frontal plane; the lateral ventricle and heart can be visualized. (B)
B-mode image of the embryo in the sagittal plane; the heart and dorsal aorta can be identified. (C) Color
Doppler image of the umbilical cord. The opposing blood flow directions of the umbilical arteries and veins
are clearly evident. (D) PW Doppler image and waveform of the embryonic umbilical cord. (E) PW Doppler
waveform and image of the mouse embryonic dorsal aorta.
Umbilical cord
Placenta
Artery
Vein

E14.5
At E14.5 the different components of the central cushion tissue contribute to the atrial, ventricular, and
atrioventricular septa, and hence a normal ventricular septal defect can be seen at this stage [3]. The
common atrial chamber is divided into two by E14.0, but the lower border of the septum secundum never
completely fuses with the atrioventricular cushion, leaving an opening. There is considerable blood flow
from the right to the left atrium during fetal development via this opening and the ostium secundum. This
interatrial channel is called the foramen ovale, and its function is to allow the largely oxygenated blood to
enter the right atrium through the inferior vena cava, which is directed across the midline into the cavity of
the left atrium. The deoxygenated blood, which enters the rostral part of the right atrium through the right
superior vena cava, is directed toward the right ventricle. The foramen ovale is normally closed at birth by
the fusion of the two atrial septa [9]. In addition, the chest in cross-section with the heart, forelimb buds, and
the spine can be depicted in the transverse images at E14.5. At this stage early eye development, the third
ventricle, and the superior horns of the lateral ventricles can also be distinguished in oblique sections
through the brain and torso [6]. Images of the mouse embryo at E14.5 are shown in Figure 11.
(A) (B)
(C) (D)
Lateral ventricle Heart
Third ventricle Heart
Spinal cord in tail
Dorsal aorta
Head Eye
Forelimb Placenta
Umbilical cord

(E)
(F)
Fig. 11. High-frequency ultrasound images of E13.5 mouse embryos obtained using the Prospect system. (A)
B-mode image of the embryo in the frontal plane; the lateral ventricle, third ventricle, and heart can be
visualized. (B) B-mode image of the embryo in the sagittal plane showing the heart, dorsal aorta, and the
spinal cord in the tail. (C) The head, eyes, and forelimb can be observed in B-mode in the transverse plane.
(D) Color Doppler image of the umbilical cord, and the interlaced blood flow reveal the spiral structure of
the umbilical arteries and vein. (D) PW Doppler waveform of the mouse embryonic dorsal aorta. (E) PW
Doppler waveform of the mouse embryonic cardiac blood flow through the mitral orifice.
Inflow
Outflow

E 15.5
At E15.5 all of the components of the heart are readily recognized. Both the heart and the vascular
system have achieved their definitive external prenatal configuration, but the atrioventricular valve leaflets
and coronary arteries continue to be modified after birth. Thus, the heart size only increases after E15.5 [5]
[9]. The thicknesses of the two ventricular walls are approximately equal. The volume of the left ventricular
cavity is slightly greater than that of the right side. The two atrial chambers of the heart are in continuity
through the foramen ovale [5].
With regard to the brain, the cerebellar primordium and the olfactory lobes are the two regions of the
brain that exhibit the greatest degree of differentiation between E13.5–14 and E14.5–15. As the rhombic lip
was previously the first site of differentiation of the intraventricular septum, the size of this region has
increased considerably by this stage, and begins to encroach upon the lumen of the fourth ventricular lateral
recess [5].
Furthermore, the eyes, which are distinguishable from the rest of the structures as large hypoechoic masses
located cranially to the heart, can be identified at this stage. Echogenic foci are now sometimes visible
scattered throughout the labyrinth region of the placenta [4] [7]. Images of the E15.5 mouse embryo are
shown in Figure 12.
(A)
Placenta
Umbilical cord
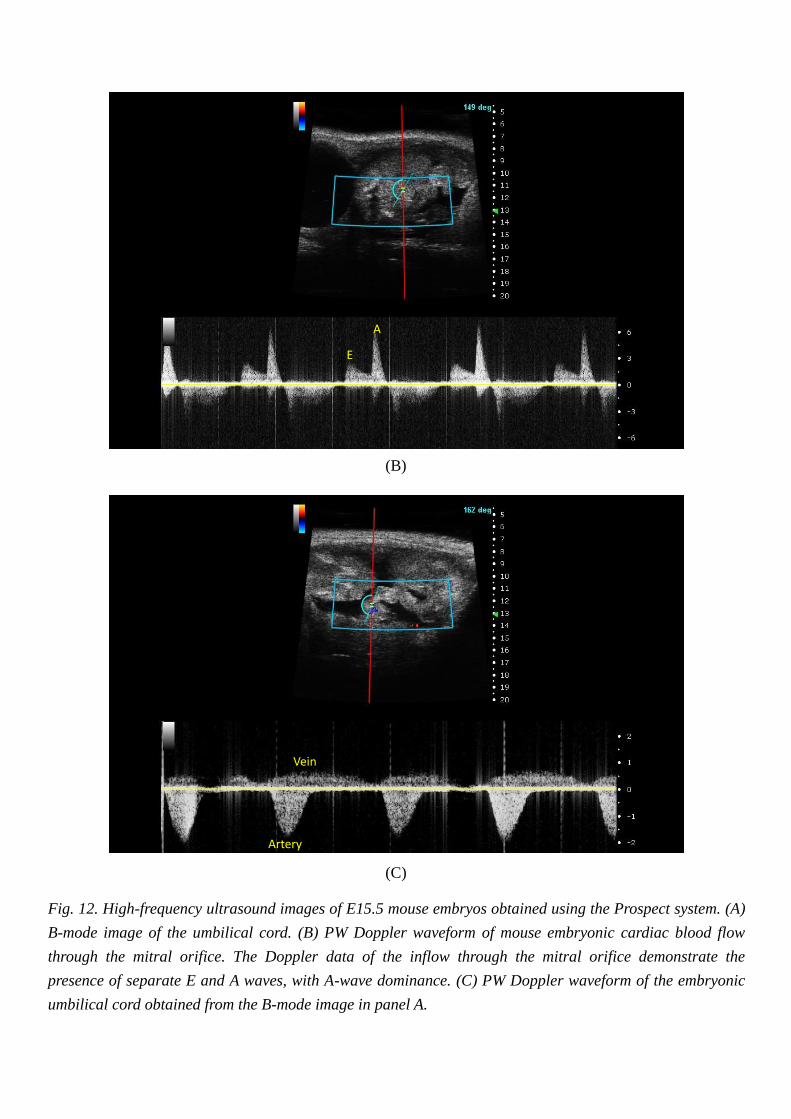
(B)
(C)
Fig. 12. High-frequency ultrasound images of E15.5 mouse embryos obtained using the Prospect system. (A)
B-mode image of the umbilical cord. (B) PW Doppler waveform of mouse embryonic cardiac blood flow
through the mitral orifice. The Doppler data of the inflow through the mitral orifice demonstrate the
presence of separate E and A waves, with A-wave dominance. (C) PW Doppler waveform of the embryonic
umbilical cord obtained from the B-mode image in panel A.
A
E
Artery
Vein

E 16.5
The most significant change in the heart at this stage is an alteration in its axis. Of particular interest is
the right atrium now being located considerably more caudally than the left atrium. The interventricular
groove is now only evident toward the apical region of the heart, and is clearly directed toward the left
anterolaterally. The axis of the heart appears to have changed from a principally anteroposterior direction to
a more oblique orientation. The main axis of the heart is oriented from the upper right to the lower left part
of the thoracic cavity. The principal axis of the heart has continued to grow, and is clearly visible in embryos
at E16.5, and at subsequent stages of development. Furthermore, the increase in the volume of the right
atrial chamber compared to that of the left is now more marked. The volume of the left ventricle continues to
be slightly greater than that of the right ventricle. In addition, the leaflets of the pulmonary and aortic valves
are considerably more differentiated than before. This equally applies to the atrioventricular valves [5].
Images of E16.5 mouse embryos are shown in Figure 13.
(A) (B)
(C)
Forth ventricle
Third ventricle
Eye
RV
LV
IVS Systole LVID
Diastole LVID
LVPW

(D)
Fig. 13. High-frequency ultrasound images of E16.5 mouse embryos obtained using the Prospect system. (A)
B-mode image of the embryonic head, revealing the fourth ventricle, third ventricle, and eyes. (B) Color
Doppler image of the embryonic heart (C) M-mode tracing of the right and left ventricles. IVS,
interventricular septal wall; LVID, left ventricular internal dimension; LVPW, left ventricular posterior wall
thickness. (D) PW Doppler image of the embryonic umbilical cord.
Artery
Vein

E 17.5
At E17.5 the orientation of the heart is essentially identical to that evident in the previous stage,
although the interventricular groove is less evident. The interventricular groove only exhibits a shallow
depression just proximal to the apex of the heart, and this is a relatively insignificant feature of the anterior
surface of the heart compared to what is observed in previous stages. The walls of the ventricles, as well as
the muscular part of the interventricular septum, are more consolidated than in the previous stage, but the
muscular walls of the atria are still extremely thin compared to those of the ventricles. The volumes of these
chambers of the heart are far greater at this stage than those of the ventricles [5]. Figure 14 shows images of
E17.5 mouse embryos.
(A) (B)
(C)
Third ventricle
Lateral ventricles
Eye Eye
Umbilical cord
Placenta

(D)
Fig. 14. High-frequency ultrasound images of E17.5 mouse embryos obtained using the Prospect system. (A)
B-mode image of the embryonic head; the lateral ventricles, third ventricle, and an eye can be visualized
clearly. (B) B-mode image of the embryonic umbilical cord. The placenta and an embryonic eye are also
displayed in this view. (C) PW Doppler waveform of the umbilical artery. (D) PW Doppler waveform of the
umbilical vein.

E 18.5
At E18.5 the heart has reached its definitive prenatal state, and exhibits only a few changes in its gross
morphology compared to that evident in the previous stage. The difference in thickness between the walls of
the atria and ventricles is essentially the same as indicated above, as is the substantial difference in the
volumes of the atria and ventricles. The thickness appears to be substantially less than that observed
previously in certain parts of the wall of the ventricles, and this is particularly noticeable in the region
subjacent to and just to the right of the interventricular groove. The ventricular wall is now substantially less
consolidated than observed previously, which may be due to the significant increase in the degree of
trabeculation at this time. This change may indicate the differentiation of the ventricular muscle that occurs
at this time, in preparation for sustaining the increased functional load after birth [5]. Images of E18.5 mouse
embryos are shown in Figure 15.
(A) (B)
LV
RV
RA LA Dorsal Aorta

(C)
Fig. 15. High-frequency ultrasound images of E18.5 mouse embryos obtained using the Prospect system. (A)
Four-chamber view of the embryonic heart in B-mode. (B) Color Doppler image of the embryonic dorsal
aorta. (C) PW Doppler waveform of the mouse embryonic cardiac blood flow through the mitral orifice. The
Doppler data of the inflow through the mitral orifice demonstrate the presence of separate E and A waves,
with A-wave dominance. AET, aortic ejection time; IVRT, isovolumic relaxation time; IVCT, isovolumic
contraction time.
A
E
IVCT IVRT
AET
References
1. D. H. Turnbull, “In utero ultrasound backscatter microscopy of early stage mouse embryos,”
Computerized Medical Imaging and Graphics, 12(1), P. 25–31, 1999.
2. C. K. Phoon and D. H. Turnbull, “Ultrasound biomicroscopy-Doppler in mouse cardiovascular
development,” Physiological Genomics, 14(1), P. 3–15, 2003.
3. C. K. Phoon, “Imaging tools for the developmental biologist: ultrasound biomicroscopy of mouse
embryonic development,” Pediatric Research, 60(1), P. 14–21, 2006.
4. H. B. Golden, S. Sunder, Y. Liu, X. Peng, and D. E. Dostal, “In utero assessment of cardiovascular
function in the embryonic mouse heart using high-resolution ultrasound biomicroscopy,” Methods in
Molecular Biology, 843, P. 245–263, 2012.
5. M. H. Kaufman, The Atlas of Mouse Development, revised edition, 1995, Academic Press.
6. F. S. Foster, M. Y. Zhang, Y. Q. Zhou, G. Liu, J. Mehi, E. Cherin, K. A. Harasiewicz, B. G. Starkoski, L.
Zan, D. A. Knapik, and S. L. Adamson, “A new ultrasound instrument for in vivo microimaging of mice,”
Ultrasound in Medicine & Biology, 28(9), P. 1165–1172, 2002.
7. C. Akirav, Y. Lu, J. Mu, D. W. Qu, Y. Q. Zhou, J. Slevin, D. Holmyard, F. S. Foster, and S. L. Adamson,
“Ultrasonic detection and developmental changes in calcification of the placenta during normal
pregnancy in mice,” Placenta, 26(2–3), P. 129–137, 2005.
8. S. Srinivasan, H. S. Baldwin, O. Aristizabal, L. Kwee, M. Labow, M. Artman, and D. H. Turnbull,
“Noninvasive, in utero imaging of mouse embryonic heart development with 40-MHz echocardiography,”
Circulation, 98(9), P. 912–918, 1998.
9. S. M. Savolainen, J. F. Foley, and S. A. Elmore, “Histology atlas of the developing mouse heart with
emphasis on E11.5 to E18.5,” Toxicologic Pathology, 37(4), P. 395–414, 2009.