Embed Size (px)
Citation preview
(www.antaike.com) ([email protected])
Hosted by:
China Nonferrous Metals Industry Association
Published by:
Beijing Antaike Information Development Co., Ltd.
Chief Editors: ZHENG Jiaju, WANG Zhongkui,
DUAN Debing, JIANG Guofeng
Executive Editors: ZHU Yan, ZENG Zheng
Editing and making by: HUANG Wei
Research Team: YAO Xizhi, GUO Qiuying,
HUO Yunbo, SHEN Lan, YU Chao
Sales Manager: YANG Xiaofei,
Tel: +86-10-6256 0921 Fax: +86-10-63971647
Web site: http://www.antaike.com
Email: [email protected]
Address: 2nd floor, 12B Fuxing Road, Haidian District,
Beijing, People's Republic of China
Post Code: 100814
Disclaimer:
Whilst every effort has been made to prepare this report,
Beijing Antaike Information Development Co., Ltd.
makes no warranty of any kind in regard to the contents
and does not accept responsibility for any losses or
damages arising directly, or indirectly, from the use of this
report.
All Rights Reserved
The contents of this report are for the sole use of the
client and its employees and may not be transmitted in
any form whatsoever to third parties.
©2012 Beijing Antaike Information Development Co., Ltd.
This issue was dispatched on December 2, 2014
Alumina & Aluminum Monthly December 2014 No.216
The Most Essential and Authoritative Source for Chinese Metals Market
INSIDE THIS ISSUE Highlight MIIT publishes the second batch of qualified aluminum smelters………..2
Market Commentary Domestic aluminum price down on growing supply………………...2
Qinghai Yellow River modernizes aluminum reduction pots………………….7
Xinfa Jingxi Aluminum & Power reactivating idled capacity…………...7
Alumina price changes little…………………………………………………….10
Bauxite imported price slightly down………………………………………….11
China primary aluminum supply/demand balance……………….………….17
News Industrial Policy, Foreign Investment & Trade
China, Australia conclude FTA talks, alumina tariff down to zero………18
Aluminum smelter that does not lay off workers can obtain subsidy….20
Bauxite and Alumina Guizhou discovers more bauxite resources…………………………...20
Aluminum China’s primary aluminum capacity to be nearly 40.0 mtpy in 2015……………21
Coal and Electric Power Guangxi Laibin Yinhai enjoys direct power supply policy……………..22
Statistics Chinese Primary Aluminum Output by Region……………………..………….23
Chinese Alumina Output by Region……………………..…………….23
Imports and Exports of Al Products…………....................................................24
LME and SHFE Aluminum Price…………….………..………………………25
LME and SHFE Reported Aluminum Stocks……………………………………26
Chalco, ATKASI, Imported Spot Alumina Arithmetic Average Price………….26

Alumina & Aluminum Monthly
(www.antaike.com) ([email protected])
2
Highlight MIIT publishes the second batch of qualified aluminum smelters
The Ministry of Industry and Information Technology of P.R. China recently published the second batch of aluminum smelters that are in line with the industrial policy and meet the “Aluminum Industry Norms” issued in July 2013. The publishing of the qualified aluminum smelters with detailed production technology and facility indicates that Chinese government firmly implements macro-control measure to curb blind investment and resolve overcapacity of the domestic aluminum smelting sector. (More details are available in the email attachment)
Market Commentary Domestic aluminum price down owing to growing supply SHFE aluminum prices has moved lower as the output of the light metal has increased more rapidly and production cost has dropped somewhat. China’s central bank cut interest rate to boost the economy but bearish sentiment still dominates the domestic commodity market and overseas market as well. Candlestick Chart of SHFE 3-Month Aluminum Futures Contract Price, Trade Volume, Open Interest (yuan/t; 10k lots)
Source: SHFE

Alumina & Aluminum Monthly
(www.antaike.com) ([email protected])
3
SHFE and LME 3-Month Aluminum Futures Contract Price in 2012-2014
1,600
1,700
1,800
1,900
2,000
2,100
2,200
12,600
13,000
13,400
13,800
14,200
14,600
15,000
15,400
15,800
USD
/t
yuan
/t
SHFE 3-Month LME 3-Month
Source: LME, SHFE
At the 2014 China Aluminum Forum, expert of the National Information Center of China predicted that China’s GDP growth will be around 7.3% in 2014 and slow down to 7.0% in 2015. Accordingly, industrial product prices and other commodity prices may further drop in 2015. The officials of NDRC and MIIT said at the meeting that Chinese government will continue to take measure to cool down investment in the domestic aluminum smelting industry. Meanwhile, China will accelerate reform of the domestic electric power system, especially the power transmission sector, in order to create a fair operating environment for industrial power users including the aluminum smelters.
Premium of Guangdong Nanhai, Shanghai Changjiang Spot Aluminum Price and SHFE Spot-Month VS SHFE 3-Month Aluminum Futures Contract Price (yuan/t, tax included)
13600
13700
13800
13900
14000
14100
14200
-300
-250
-200
-150
-100
-50
0
50
100
Nanhai Changjiang SHFE spot-month SHFE 3-month
Source: SHFE, Antaike
Price Ratio Of SHFE 3-Month Aluminum Futures Contract Price to The LME 3-Month Aluminum, Exchange Rate Of RMB against USD, Break-Even Point Of Importing Primary Aluminum from Foreign Country to China, Break-Even Point Of Exporting Aluminum from China to Foreign Country

Alumina & Aluminum Monthly
(www.antaike.com) ([email protected])
4
6.08
6.1
6.12
6.14
6.16
6.18
6.2
6.22
6.24
4.85.25.6
66.46.87.27.6
88.4
Price Ratio Import Export Exchange Rate
Source: LME, SHFE, People’s Bank of China
LME and SHFE Reported Aluminum Stocks (Unit: metric ton)
4,200,000
4,400,000
4,600,000
4,800,000
5,000,000
5,200,000
5,400,000
5,600,000
150,000
200,000
250,000
300,000
350,000
400,000
450,000
500,000
550,000
SHFE LME
Source: LME, SHFE
Domestic aluminum stocks still dropping but turning point seems to appear The SHFE reported aluminum stocks continue to decrease in November because of strong demand both at home and abroad. The aluminum stocks stood at 225,415 tonnes on November 28, down from 239,760 tonnes at the end of October. However, the aluminum inventory has slightly increased in recent two weeks. It is expected that SHFE aluminum inventory will change little or slightly increase in December. The domestic aluminum market will feel more downward pressure from the rapidly growing supply in the coming months. Macroeconomic operation and money supply China's monthly new yuan loans down in October China's new yuan-denominated lending reach 548.3 billion yuan ($89.3 billion) in October, down from 857.2 billion yuan in September, according to source from the People's Bank of China (PBOC), the central bank.
Alumina & Aluminum Monthly
(www.antaike.com) ([email protected])
5
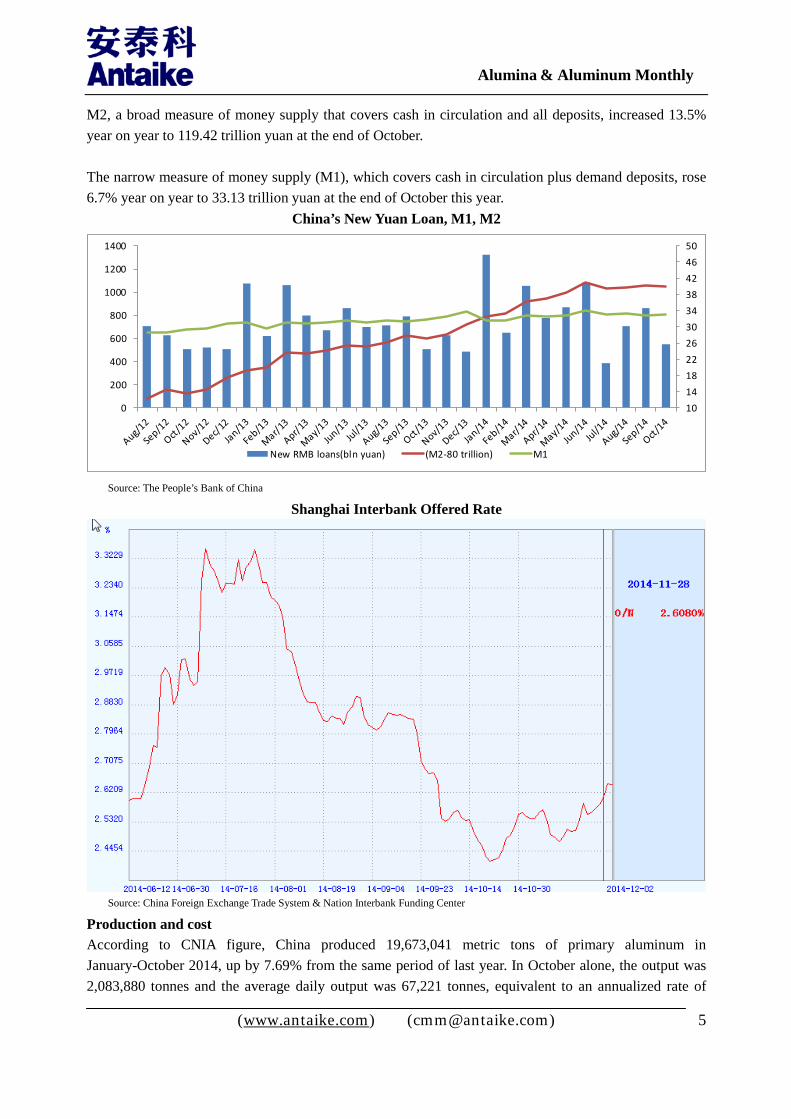
M2, a broad measure of money supply that covers cash in circulation and all deposits, increased 13.5% year on year to 119.42 trillion yuan at the end of October. The narrow measure of money supply (M1), which covers cash in circulation plus demand deposits, rose 6.7% year on year to 33.13 trillion yuan at the end of October this year.
China’s New Yuan Loan, M1, M2
1014182226303438424650
0
200
400
600
800
1000
1200
1400
New RMB loans(bln yuan) (M2-80 trillion) M1
Source: The People’s Bank of China
Shanghai Interbank Offered Rate
Source: China Foreign Exchange Trade System & Nation Interbank Funding Center
Production and cost According to CNIA figure, China produced 19,673,041 metric tons of primary aluminum in January-October 2014, up by 7.69% from the same period of last year. In October alone, the output was 2,083,880 tonnes and the average daily output was 67,221 tonnes, equivalent to an annualized rate of
Alumina & Aluminum Monthly
(www.antaike.com) ([email protected])
6
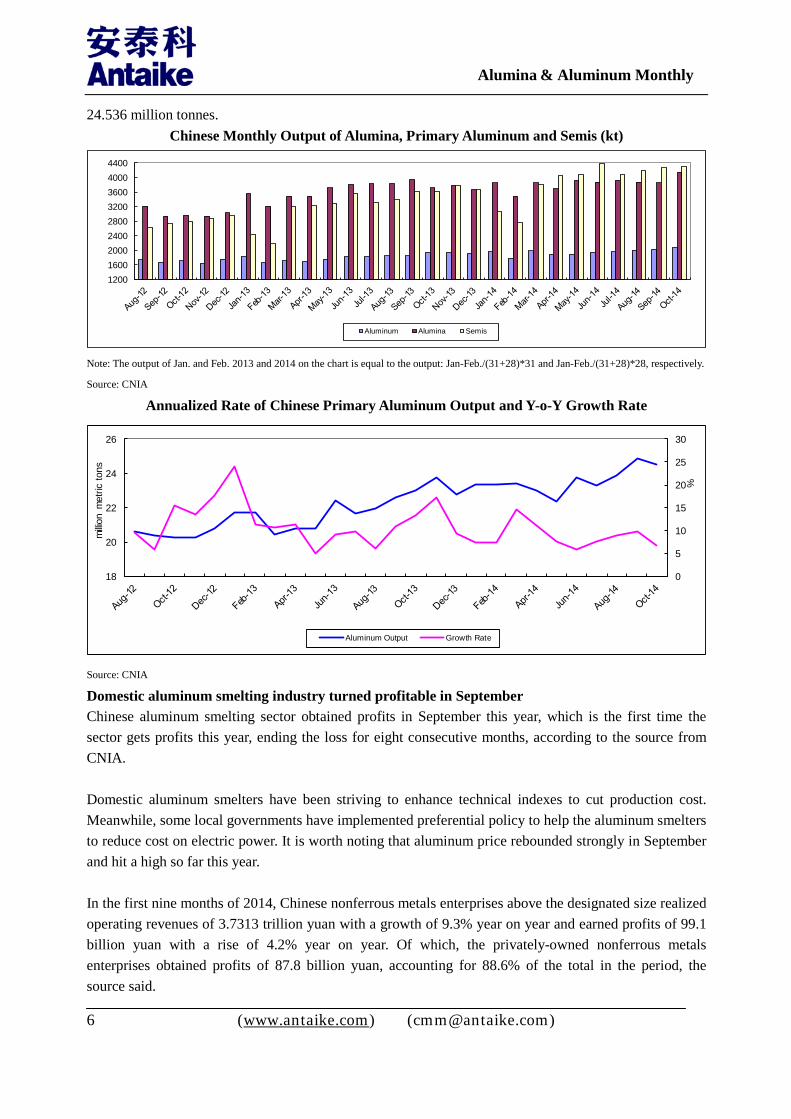
24.536 million tonnes. Chinese Monthly Output of Alumina, Primary Aluminum and Semis (kt)
120016002000240028003200360040004400
Aluminum Alumina Semis
Note: The output of Jan. and Feb. 2013 and 2014 on the chart is equal to the output: Jan-Feb./(31+28)*31 and Jan-Feb./(31+28)*28, respectively.
Source: CNIA Annualized Rate of Chinese Primary Aluminum Output and Y-o-Y Growth Rate
0
5
10
15
20
25
30
18
20
22
24
26
%
milli
on m
etric
tons
Aluminum Output Growth Rate
Source: CNIA Domestic aluminum smelting industry turned profitable in September Chinese aluminum smelting sector obtained profits in September this year, which is the first time the sector gets profits this year, ending the loss for eight consecutive months, according to the source from CNIA. Domestic aluminum smelters have been striving to enhance technical indexes to cut production cost. Meanwhile, some local governments have implemented preferential policy to help the aluminum smelters to reduce cost on electric power. It is worth noting that aluminum price rebounded strongly in September and hit a high so far this year. In the first nine months of 2014, Chinese nonferrous metals enterprises above the designated size realized operating revenues of 3.7313 trillion yuan with a growth of 9.3% year on year and earned profits of 99.1 billion yuan with a rise of 4.2% year on year. Of which, the privately-owned nonferrous metals enterprises obtained profits of 87.8 billion yuan, accounting for 88.6% of the total in the period, the source said.
Alumina & Aluminum Monthly
(www.antaike.com) ([email protected])
7
Qinghai Yellow River modernizes aluminum reduction pots Qinghai Yellow River Hydropower Recycled Aluminum Co., Ltd. is now conducting a modernization project at its 350KA pre-baked potlines. The company plans to use the Double Steel Cathode technology to upgrade the potline to reduce power consumption amid the severe market situation. The 350KA pre-baked potlines with a total capacity of 500 ktpy was put into production in 2009. Now it is the time for the company to conduct maintenance and upgrading at the potlines. Besides, the company will improve the associated systems of off-gas dust collecting and excess-heat recycling and using. The modernization project will be finished by stages. The stage 1 is to complete modernization for 94 sets of the aluminum reduction pots with a capacity of around 92 ktpy by the end of December 2014. Xinfa Jingxi Aluminum & Power reactivating idled capacity Xinfa Jingxi Aluminum & Power Co., Ltd. (located at Jingxi county of Guangxi Zhuang Autonomous Region) is currently restarting up its idled aluminum reduction pots. It is expected that the operational aluminum capacity will reach 200 ktpy at the end of December this year and all the capacity of 320 ktpy will be in operation in late-February 2015. The company slashed aluminum output in June 2013 due to relatively high power price in Guangxi and low aluminum price at home and abroad. The company is 100% owned by Shandong Xinfa Group. It now has 320 ktpy primary aluminum capacity and 2.40 million tpy alumina capacity. Aba Aluminum operating smoothly Aba Aluminum Smelter (at Aba county of Sichuan province) has been running well this year in spite of poor aluminum price. In Sichuan province, local aluminum smelters slash output because of high power price. But Aba Aluminum with designed capacity of 200 ktpy has not reduced production thanks to preferential power rate. In January-October 2014, the company realized industrial production of 2.757 billion yuan and sales incomes of 1.95 billion yuan. The aluminum smelter ever stopped production for tow times owing to force majeure: the Wenchuan earthquake in May 2008 and flood caused by heavy rain in July 2013.
Average Daily Primary Aluminum Output by Region (metric ton, the right vertical axis is for Henan)

Alumina & Aluminum Monthly
(www.antaike.com) ([email protected])
8
8,000
8,500
9,000
9,500
10,000
10,500
11,000
1,000
2,000
3,000
4,000
5,000
6,000
7,000
8,000
Shandong Inner Mongolia Gansu Shanxi Qinghai Guizhou Henan
(The right vertical axis is for Ningxia)
3,000
3,500
4,000
4,500
5,000
0
500
1,000
1,500
2,000
2,500
3,000
3,500
Shaanxi Yunnan Sichuan Guangxi Hubei Hunan Ningxia
(The right vertical axis is for Xinjiang)
2,000
4,000
6,000
8,000
10,000
12,000
14,000
16,000
0
400
800
1,200
1,600
2,000
2,400
2,800
Zhejiang Liaoning Jiangsu Chongqing Fujian Xinjiang
Source: CNIA

Alumina & Aluminum Monthly
(www.antaike.com) ([email protected])
9
Annualized Rate of Chinese Alumina Output and Y-o-Y Growth Rate
-505101520253035
30
35
40
45
50
55
%
milli
on m
etric
tons
Alumina Output Growth Rate
Average Daily Alumina Output by Region
(metric ton, the right vertical axis for Henan and Shandong)
22,000
24,000
26,000
28,000
30,000
32,000
34,000
36,000
38,000
0
4,000
8,000
12,000
16,000
20,000
24,000
28,000
Shanxi Guangxi Chongqing Guizhou Yunnan Shandong Henan
Annualized Rate of Chinese Aluminum Semis Output and Y-o-Y Growth Rate
0
10
20
30
40
50
60
25
30
35
40
45
50
55
%
milli
on m
etric
tons
Semis Output Growth Rate
Source: CNIA

Alumina & Aluminum Monthly
(www.antaike.com) ([email protected])
10
Average Monthly Spot Price of Imported Alumina and Chalco’s, ATKASI (yuan/t, tax included)
2,300
2,400
2,500
2,600
2,700
2,800
2,900
3,000
Imported Chalco ATKASI Source: Chalco, Antaike
Daily Spot Price of Non-Chalco Alumina Producers and ATKASI (yuan/t, tax included)
2200
2400
2600
2800
3000
Henan Shanxi Southwest Inner Mongolia ATKASI
Alumina price changes little The ATKASI alumina price inched down but still stayed at relatively high level in November. The offering prices of the domestic alumina producers are: Henan, 2,780-2,860 yuan/t; Shandong, 2,750-2,800 yuan/t; Shanxi, 2,720-2,820 yuan/t; southwest region, 2,700-2,750 yuan/t; Inner Mongolia, 2,780-2,850 yuan/t. The average ATKASI pr ice was 2,773 yuan/t on November 28, down from 2,784 yuan/t at the end of October. The monthly ATKASI was 2,774 yuan/t in November, down from 2,795 yuan/t in October. The demand for alumina from domestic aluminum smelters is still strong as the aluminum smelters restart up idled capacity or put new capacity into production. On supply side, the alumina production in Shanxi province significantly increases, slightly pulling down local alumina price. The domestic alumina market is still in a tight balance, which will continue to support domestic alumina price. But commissioning of more low-cost aluminum capacity in Xinjiang and Inner Mongolia will bring more downward pressure on the domestic aluminum market. Besides, the cash flow of domestic aluminum

Alumina & Aluminum Monthly
(www.antaike.com) ([email protected])
11
smelters usually gets tight at the end of each year and thus demand for alumina from the aluminum smelters is affected at the same time. It is expected that domestic alumina price will follow the trend of domestic aluminum price and move in a narrow range in December. Import and Export
Chinese Bauxite Import and Average Price (CIF to Chinese Port)
40
50
60
70
01,000,0002,000,0003,000,0004,000,0005,000,0006,000,0007,000,0008,000,0009,000,000
US
D/t
CIF
met
ric to
n
Import Price
Bauxite import and price by country in October 2014 (CIF to Chinese Port) (Unit: kt)
Bauxite imported price slightly down China imported 2.564 million tonnes of bauxite in October, less than 2.855 million tonnes in September this year, according to data provided by the Custom. The accumulative imports amounted to 30.527 million tonnes in the first ten months of 2014, down 49.91% year on year. The average price of the imported bauxite was USD57.815/t in October. The price has slightly decreased in recent months along with increase in the imports from Malaysia.
Import in Aug 14
Import in Sep 14
Import in Oct 14
Import in Jan-Oct 14
%Change Jan-Oct 14/ 13
Price (USD/t) Oct 14
Price (USD/t) Sep 14
Price (USD/t) Oct 13
India 355 591 435 3,976 -21.34 60.13 59.19 59.79
Indonesia 0 0 0 8,601 -79.33 NA - 49.74
Japan 0 0 0 0.01 NA NA NA
Malaysia 277 566 640 1,913 1125.09 49.63 50.94 44.00
Thailand 2.5 2.5 5 10769.57 86.47 87.69 NA
Turkey 0 0 0 1 NA NA - NA
Vietnam 0 0 1 2 NA 12.17 - NA
Ghana 70 137 0 703 50.00 NA 88.66 75.96
Guinea 0 0 0 185 -77.76 NA - 70.87
Brazil 114 0 0 633 73.46 NA - 81.49 Dominican Republic 143 0 147 1,456 382.71 65.54 - 60.00
Guyana 0 0 0 32 6.48 NA - NA
Australia 1,537 1,493 1,276 12,712 7.81 60.54 60.80 56.81
Fiji 0 67 63 309 -8.19 51.62 51.62 56.56 Solomon Islands 0 0 0 0.001 NA NA - NA
Alumina & Aluminum Monthly
(www.antaike.com) ([email protected])
12
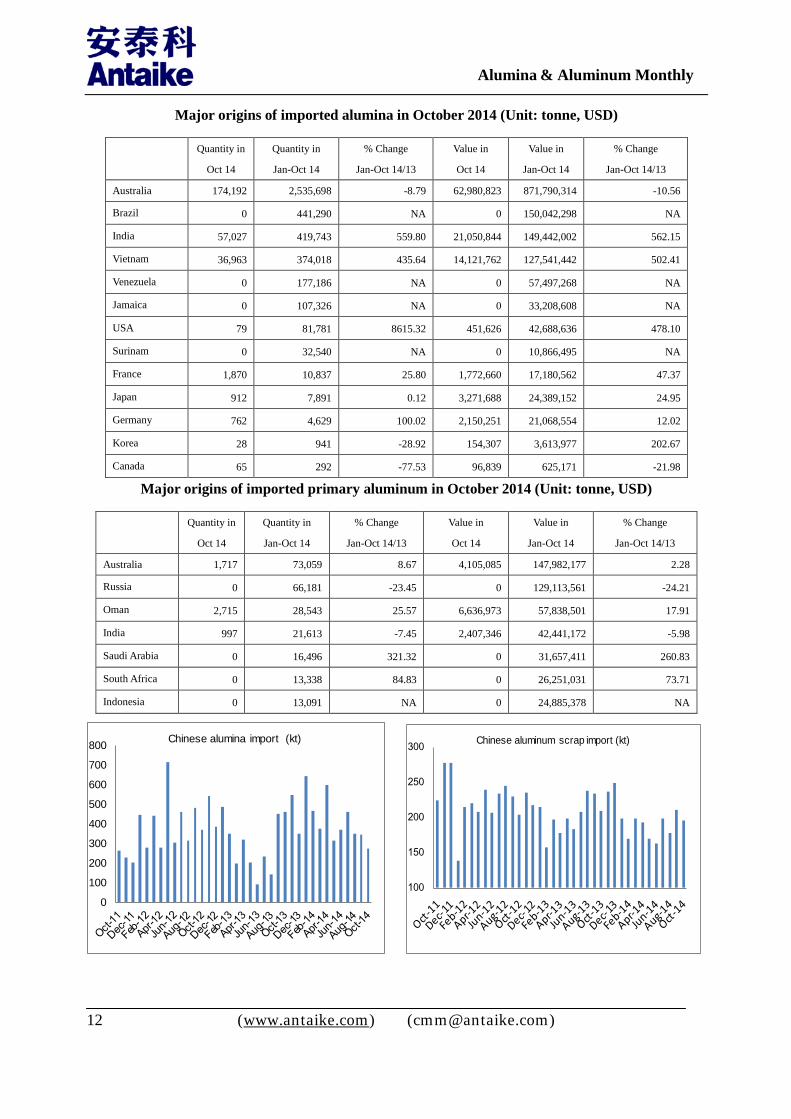
Major origins of imported alumina in October 2014 (Unit: tonne, USD)
Major origins of imported primary aluminum in October 2014 (Unit: tonne, USD)
0
100
200
300
400
500
600
700
800 Chinese alumina import (kt)
100
150
200
250
300 Chinese aluminum scrap import (kt)
Quantity in
Oct 14
Quantity in
Jan-Oct 14
% Change
Jan-Oct 14/13
Value in
Oct 14
Value in
Jan-Oct 14
% Change
Jan-Oct 14/13
Australia 174,192 2,535,698 -8.79 62,980,823 871,790,314 -10.56
Brazil 0 441,290 NA 0 150,042,298 NA
India 57,027 419,743 559.80 21,050,844 149,442,002 562.15
Vietnam 36,963 374,018 435.64 14,121,762 127,541,442 502.41
Venezuela 0 177,186 NA 0 57,497,268 NA
Jamaica 0 107,326 NA 0 33,208,608 NA
USA 79 81,781 8615.32 451,626 42,688,636 478.10
Surinam 0 32,540 NA 0 10,866,495 NA
France 1,870 10,837 25.80 1,772,660 17,180,562 47.37
Japan 912 7,891 0.12 3,271,688 24,389,152 24.95
Germany 762 4,629 100.02 2,150,251 21,068,554 12.02
Korea 28 941 -28.92 154,307 3,613,977 202.67
Canada 65 292 -77.53 96,839 625,171 -21.98
Quantity in
Oct 14
Quantity in
Jan-Oct 14
% Change
Jan-Oct 14/13
Value in
Oct 14
Value in
Jan-Oct 14
% Change
Jan-Oct 14/13
Australia 1,717 73,059 8.67 4,105,085 147,982,177 2.28
Russia 0 66,181 -23.45 0 129,113,561 -24.21
Oman 2,715 28,543 25.57 6,636,973 57,838,501 17.91
India 997 21,613 -7.45 2,407,346 42,441,172 -5.98
Saudi Arabia 0 16,496 321.32 0 31,657,411 260.83
South Africa 0 13,338 84.83 0 26,251,031 73.71
Indonesia 0 13,091 NA 0 24,885,378 NA

Alumina & Aluminum Monthly
(www.antaike.com) ([email protected])
13
0
20,000
40,000
60,000
80,000
0
5,000
10,000
15,000
20,000
25,000
30,000Chinese primary Al import/export (metric ton)
Export Import
02,0004,0006,0008,00010,00012,00014,000
0
10,000
20,000
30,000
40,000
50,000
60,000Chinese Al alloy import/export(metric ton)
Export Import
20,00025,00030,00035,00040,00045,00050,00055,000
120,000
160,000
200,000
240,000
280,000
320,000
360,000Chinese Al semis import/export (metric ton)
Export Import
1,000
2,000
3,000
4,000
5,000
6,000
60,000
100,000
140,000
180,000Oother Al products import/export (metric ton)
Export Import
Source: The General Administration of Customs of P. R. China
Consumption Real estate industry The real estate industry completed investment of 7.7220 trillion yuan with a year on year rise of 12.4% in January-October 2014 and the growth rate was 0.1 percentage points lower than that for the first nine months of 2014.
16.615.4 15.6 15.4 15.4
16.7 16.2
22.8
20.221.1 20.6 20.3 20.5
19.3 19.7 19.2 19.5 19.8 19.3
16.8 16.414.7 14.1 13.7 13.2
12.5 12.410
15
20
25 Investment growth in housing projects (Unit: %)
Source: National Bureau of Statistics of P.R. China (NBS)
Alumina & Aluminum Monthly
(www.antaike.com) ([email protected])
14
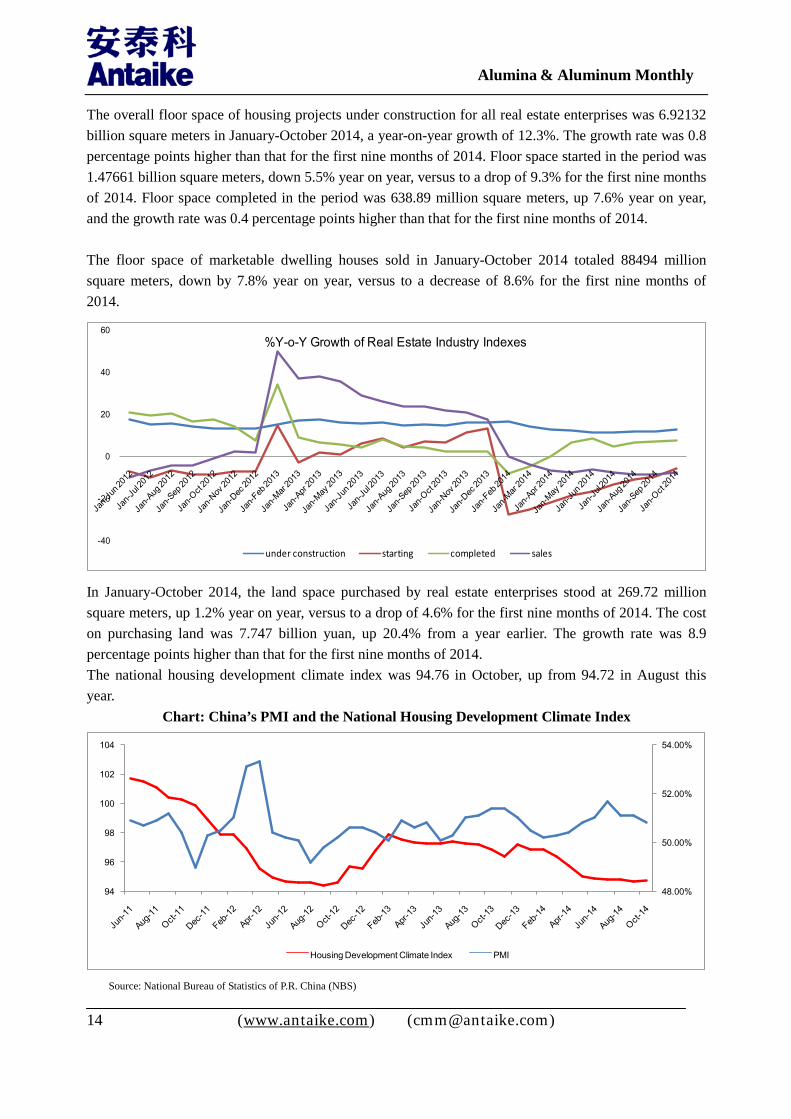
The overall floor space of housing projects under construction for all real estate enterprises was 6.92132 billion square meters in January-October 2014, a year-on-year growth of 12.3%. The growth rate was 0.8 percentage points higher than that for the first nine months of 2014. Floor space started in the period was 1.47661 billion square meters, down 5.5% year on year, versus to a drop of 9.3% for the first nine months of 2014. Floor space completed in the period was 638.89 million square meters, up 7.6% year on year, and the growth rate was 0.4 percentage points higher than that for the first nine months of 2014. The floor space of marketable dwelling houses sold in January-October 2014 totaled 88494 million square meters, down by 7.8% year on year, versus to a decrease of 8.6% for the first nine months of 2014.
-40
-20
0
20
40
60%Y-o-Y Growth of Real Estate Industry Indexes
under construction starting completed sales
In January-October 2014, the land space purchased by real estate enterprises stood at 269.72 million square meters, up 1.2% year on year, versus to a drop of 4.6% for the first nine months of 2014. The cost on purchasing land was 7.747 billion yuan, up 20.4% from a year earlier. The growth rate was 8.9 percentage points higher than that for the first nine months of 2014. The national housing development climate index was 94.76 in October, up from 94.72 in August this year.
Chart: China’s PMI and the National Housing Development Climate Index
48.00%
50.00%
52.00%
54.00%
94
96
98
100
102
104
Housing Development Climate Index PMI
Source: National Bureau of Statistics of P.R. China (NBS)
Alumina & Aluminum Monthly
(www.antaike.com) ([email protected])
15
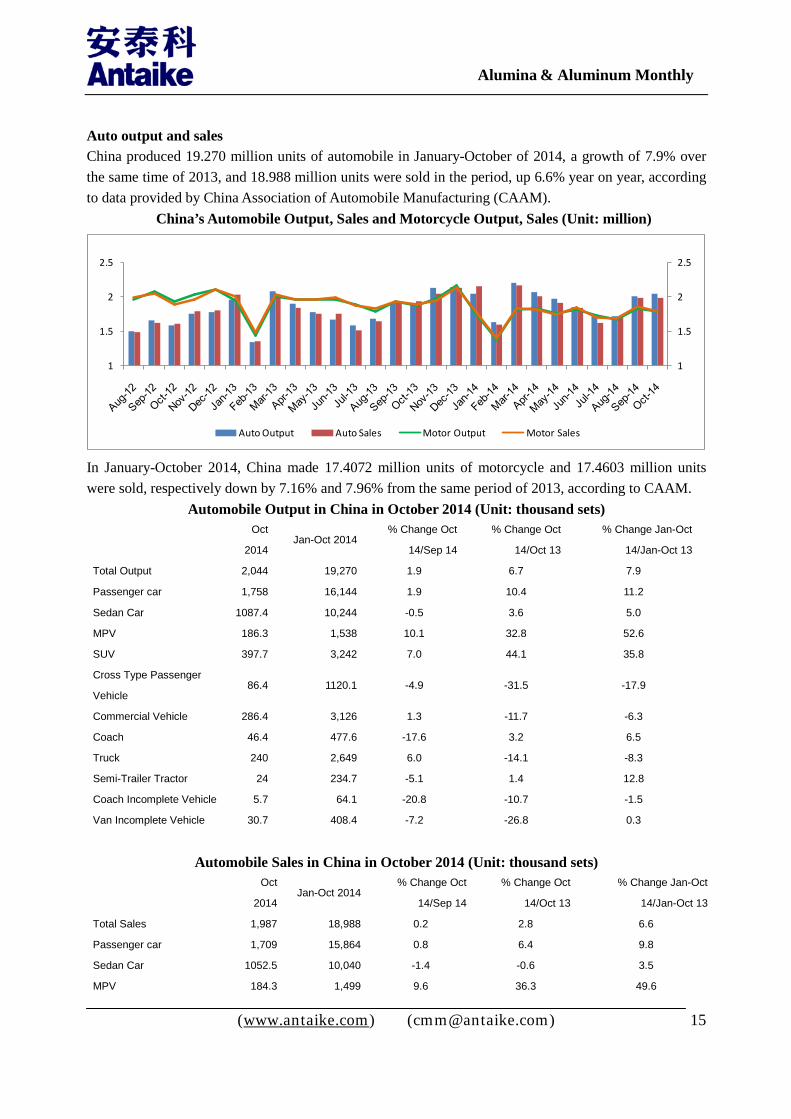
Auto output and sales China produced 19.270 million units of automobile in January-October of 2014, a growth of 7.9% over the same time of 2013, and 18.988 million units were sold in the period, up 6.6% year on year, according to data provided by China Association of Automobile Manufacturing (CAAM).
China’s Automobile Output, Sales and Motorcycle Output, Sales (Unit: million)
1
1.5
2
2.5
1
1.5
2
2.5
Auto Output Auto Sales Motor Output Motor Sales
In January-October 2014, China made 17.4072 million units of motorcycle and 17.4603 million units were sold, respectively down by 7.16% and 7.96% from the same period of 2013, according to CAAM.
Automobile Output in China in October 2014 (Unit: thousand sets)
Oct
2014 Jan-Oct 2014
% Change Oct
14/Sep 14
% Change Oct
14/Oct 13
% Change Jan-Oct
14/Jan-Oct 13
Total Output 2,044 19,270 1.9 6.7 7.9
Passenger car 1,758 16,144 1.9 10.4 11.2
Sedan Car 1087.4 10,244 -0.5 3.6 5.0
MPV 186.3 1,538 10.1 32.8 52.6
SUV 397.7 3,242 7.0 44.1 35.8
Cross Type Passenger
Vehicle 86.4 1120.1 -4.9 -31.5 -17.9
Commercial Vehicle 286.4 3,126 1.3 -11.7 -6.3
Coach 46.4 477.6 -17.6 3.2 6.5
Truck 240 2,649 6.0 -14.1 -8.3
Semi-Trailer Tractor 24 234.7 -5.1 1.4 12.8
Coach Incomplete Vehicle 5.7 64.1 -20.8 -10.7 -1.5
Van Incomplete Vehicle 30.7 408.4 -7.2 -26.8 0.3
Automobile Sales in China in October 2014 (Unit: thousand sets)
Oct
2014 Jan-Oct 2014
% Change Oct
14/Sep 14
% Change Oct
14/Oct 13
% Change Jan-Oct
14/Jan-Oct 13
Total Sales 1,987 18,988 0.2 2.8 6.6
Passenger car 1,709 15,864 0.8 6.4 9.8
Sedan Car 1052.5 10,040 -1.4 -0.6 3.5
MPV 184.3 1,499 9.6 36.3 49.6
Alumina & Aluminum Monthly
(www.antaike.com) ([email protected])
16
SUV 387.3 3,172 8.6 36.3 33.7
Cross Type Passenger
Vehicle 84.8 1154.1 -18.7 -33.4 -16.0
Commercial Vehicle 278.3 3,124 -3.2 -14.9 -7.1
Coach 45 478.5 -20.5 0.0 7.2
Truck 233.3 2,645 1.0 -17.3 -9.3
Semi-Trailer Tractor 24.1 227.6 -0.6 -0.9 9.8
Coach Incomplete Vehicle 5.8 64 -18.6 -14.2 -3.6
Van Incomplete Vehicle 31.2 398.5 -6.0 -23.9 -4.5
Source: CAAM
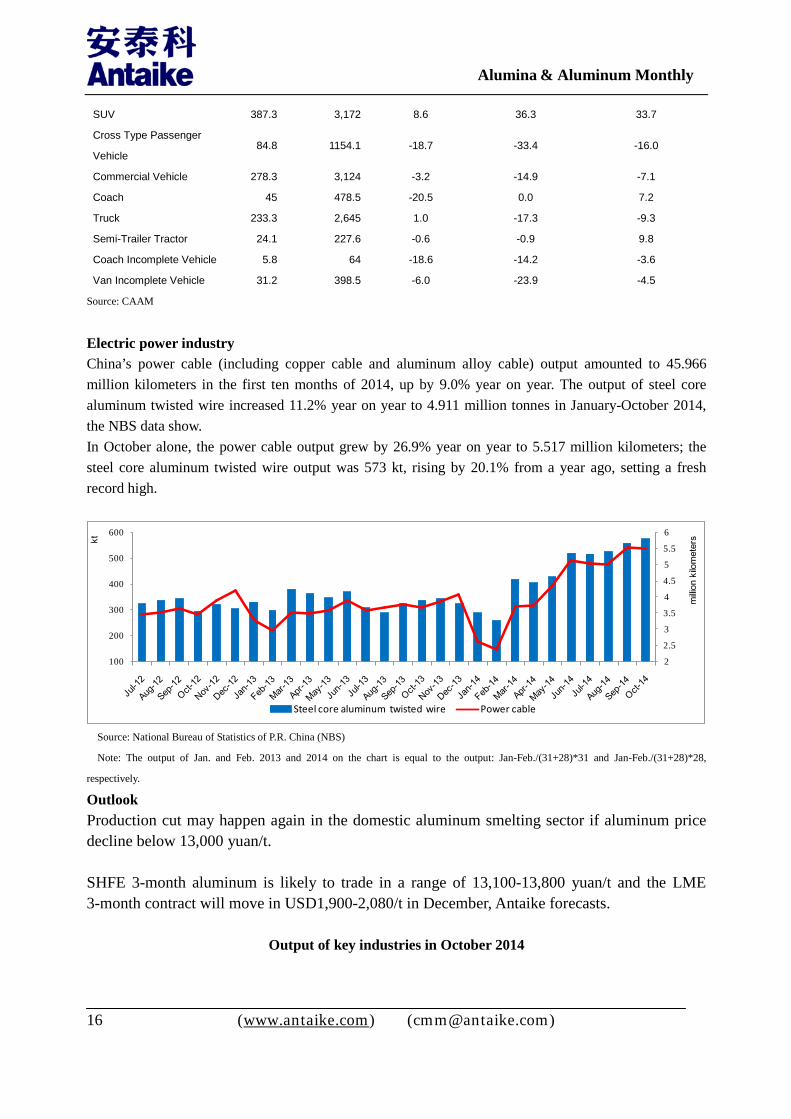
Electric power industry China’s power cable (including copper cable and aluminum alloy cable) output amounted to 45.966 million kilometers in the first ten months of 2014, up by 9.0% year on year. The output of steel core aluminum twisted wire increased 11.2% year on year to 4.911 million tonnes in January-October 2014, the NBS data show. In October alone, the power cable output grew by 26.9% year on year to 5.517 million kilometers; the steel core aluminum twisted wire output was 573 kt, rising by 20.1% from a year ago, setting a fresh record high.
2
2.5
3
3.5
4
4.5
5
5.5
6
100
200
300
400
500
600
milli
on k
ilom
eter
skt
Steel core aluminum twisted wire Power cable
Source: National Bureau of Statistics of P.R. China (NBS)
Note: The output of Jan. and Feb. 2013 and 2014 on the chart is equal to the output: Jan-Feb./(31+28)*31 and Jan-Feb./(31+28)*28,
respectively. Outlook Production cut may happen again in the domestic aluminum smelting sector if aluminum price decline below 13,000 yuan/t. SHFE 3-month aluminum is likely to trade in a range of 13,100-13,800 yuan/t and the LME 3-month contract will move in USD1,900-2,080/t in December, Antaike forecasts.
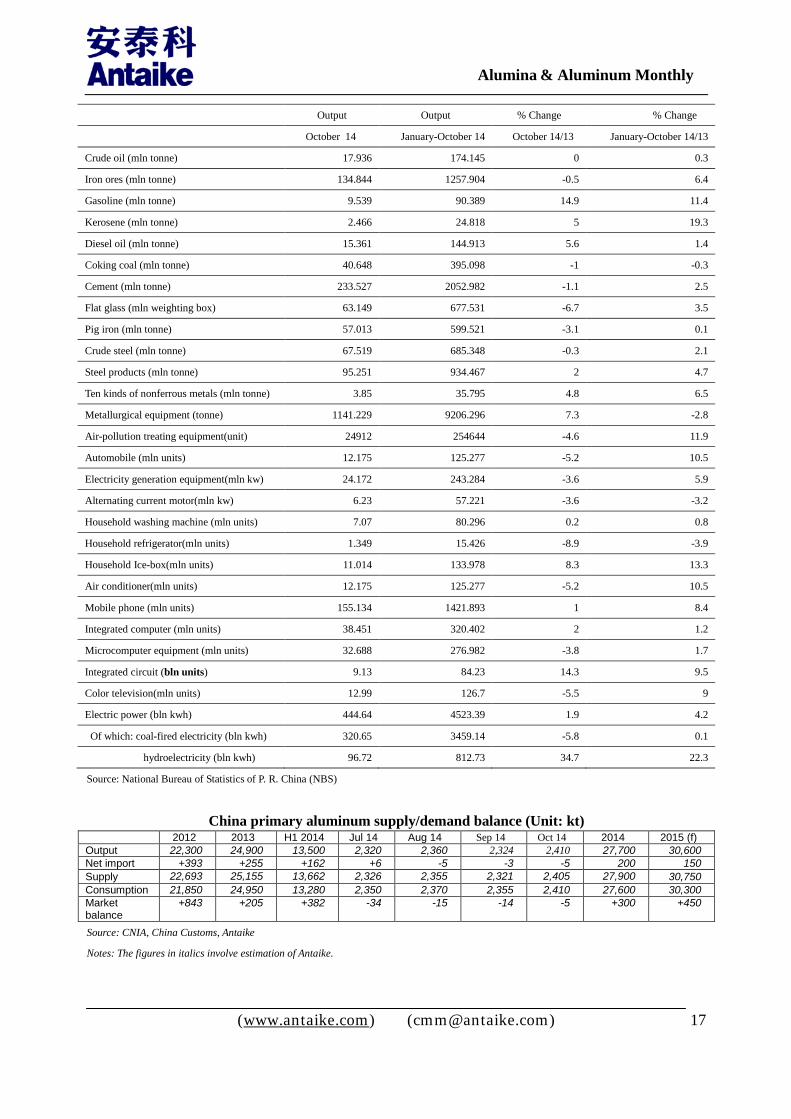
Output of key industries in October 2014
Alumina & Aluminum Monthly
(www.antaike.com) ([email protected])
17
Output Output % Change % Change
October 14 January-October 14 October 14/13 January-October 14/13
Crude oil (mln tonne) 17.936 174.145 0 0.3
Iron ores (mln tonne) 134.844 1257.904 -0.5 6.4
Gasoline (mln tonne) 9.539 90.389 14.9 11.4
Kerosene (mln tonne) 2.466 24.818 5 19.3
Diesel oil (mln tonne) 15.361 144.913 5.6 1.4
Coking coal (mln tonne) 40.648 395.098 -1 -0.3
Cement (mln tonne) 233.527 2052.982 -1.1 2.5
Flat glass (mln weighting box) 63.149 677.531 -6.7 3.5
Pig iron (mln tonne) 57.013 599.521 -3.1 0.1
Crude steel (mln tonne) 67.519 685.348 -0.3 2.1
Steel products (mln tonne) 95.251 934.467 2 4.7
Ten kinds of nonferrous metals (mln tonne) 3.85 35.795 4.8 6.5
Metallurgical equipment (tonne) 1141.229 9206.296 7.3 -2.8
Air-pollution treating equipment(unit) 24912 254644 -4.6 11.9
Automobile (mln units) 12.175 125.277 -5.2 10.5
Electricity generation equipment(mln kw) 24.172 243.284 -3.6 5.9
Alternating current motor(mln kw) 6.23 57.221 -3.6 -3.2
Household washing machine (mln units) 7.07 80.296 0.2 0.8
Household refrigerator(mln units) 1.349 15.426 -8.9 -3.9
Household Ice-box(mln units) 11.014 133.978 8.3 13.3
Air conditioner(mln units) 12.175 125.277 -5.2 10.5
Mobile phone (mln units) 155.134 1421.893 1 8.4
Integrated computer (mln units) 38.451 320.402 2 1.2
Microcomputer equipment (mln units) 32.688 276.982 -3.8 1.7
Integrated circuit (bln units) 9.13 84.23 14.3 9.5
Color television(mln units) 12.99 126.7 -5.5 9
Electric power (bln kwh) 444.64 4523.39 1.9 4.2
Of which: coal-fired electricity (bln kwh) 320.65 3459.14 -5.8 0.1
hydroelectricity (bln kwh) 96.72 812.73 34.7 22.3
Source: National Bureau of Statistics of P. R. China (NBS)
China primary aluminum supply/demand balance (Unit: kt)
2012 2013 H1 2014 Jul 14 Aug 14 Sep 14 Oct 14 2014 2015 (f) Output 22,300 24,900 13,500 2,320 2,360 2,324 2,410 27,700 30,600 Net import +393 +255 +162 +6 -5 -3 -5 200 150 Supply 22,693 25,155 13,662 2,326 2,355 2,321 2,405 27,900 30,750 Consumption 21,850 24,950 13,280 2,350 2,370 2,355 2,410 27,600 30,300 Market balance
+843 +205 +382 -34 -15 -14 -5 +300 +450
Source: CNIA, China Customs, Antaike
Notes: The figures in italics involve estimation of Antaike.

Alumina & Aluminum Monthly
(www.antaike.com) ([email protected])
18
China alumina supply/demand balance (Unit: kt) Feb Mar Apr May Jun Jul Aug Sep Oct 14 2014 2015 Output
3,980 4,380 4,150 4,230 4,140 4,390 4,330 4,130 4,290 51,150 56,000
Net import 460 370 590 270 370 460 350 340 400 5,000 5,000 Supply 4,440 4,750 4,740 4,500 4,510 4,850 4,680 4,470 4,690 56,150 61,000 Primary aluminum output 2,150 2,310 2,260 2,270 2,220 2,320 2,380 2,340 2,410 27,700 30,600
Demand for metallurgical-grade alumina
4,150 4,450 4,370 4,380 4,270 4,470 4,590 4,510 4,650
53,650 59,060
Demand for chemical-grade alumina
167 167 167 167 167 167 167 167 167 2,000
2,100
Total demand 4,317 4,617 4,537 4,547 4,437 4,637 4,757 4,677 4,817 55,650 61,160 S/D balance +123 +133 +203 -47 +73 +213 -77 -207 -127 +500 -160
Source: CNIA, China Customs, Antaike
Notes: The figures in italics involve estimation of Antaike.
News
Industrial Policy, Foreign Investment & Trade China, Australia conclude FTA talks, alumina tariff down to zero
China and Australia on November 17 signed a declaration of intent on practically concluding bilateral negotiations on a free trade agreement (FTA).
According to the results of the nine-year-long talks, Australia will eventually remove tariffs on all goods imported from China, and a vast majority of Australian products will enter China tariff-free. Of which, Australia adjusted the alumina exporting tariff down to zero on November 18, 2014. China imported 3.922 million tonnes of alumina in the first nine months this year, 2.361 million tonne of which came from Australia. Australia has been the biggest supplier of alumina for China for a long period.
As regards investment, the pair agreed to grant each other the most favored nation status once the FTA takes effect. They will greatly lower the review thresholds for corporate investment, and increase market access opportunities, predictability and transparency for such investment.
The two sides also committed themselves to opening up numerous service sectors to each other with high quality.
Visiting Chinese President Xi Jinping and Australian Prime Minister Tony Abbott witnessed the signing of the declaration of intent by Chinese Commerce Minister Gao Hucheng and Australian Minister for Trade and Investment Andrew Robb.
Chinalco president meets UC Rusal CEO
Mr. Ge Honglin, president of Aluminum Corporation of China (Chinalco), in Beijing on November 4 met with Mr. Oleg Deripaska, CEO of UC Rusal, and other high-ranking officials of Chinalco and UC Rusal

Alumina & Aluminum Monthly
(www.antaike.com) ([email protected])
19
attended the meeting to exchanged viewpoints on the global aluminum market and explored cooperation of the two companies.
Mr. Ge Honglin said Chinalco has kept a friendly cooperative relationship with UC Rusal and the two companies have signed the memorandum of understanding on R&D of new aluminum production technology, development of bauxite resource and investment in hydropower-aluminum project. Mr. Ge hopes the two companies to further expand cooperation in more areas to reduce energy cost and investment risk to do a great job in development of high-quality mineral resource globally.
Mr. Oleg Deripaska said Chinalco is good at technical R&D, engineering design, construction and operation as well as the management while UC Rusal has significant advantage in aluminum production technology, hydropower resource and so on. UC Rusal has been viewing Chinalco as the particularly important partner.
Chinalco signs strategic cooperation framework agreement with Ecuador
Aluminum Corporation of China (Chinalco) on October 29 signed a strategic cooperation framework agreement with Strategic Coordination Ministry of Ecuador. The two sides will conduct cooperation on an aluminum smelter project in Ecuador. Chinalco president Ge Honglin and Ecuador Minister Rafael Poveda attended the signing ceremony.
The nice relationship between the Ecuador government and Chinese government set a firm foundation for the companies of the two countries to conduct cooperation and also provide nice condition for Chinese companies to invest in Ecuador. Chinalco would like to provide support and take part in development of aluminum industry in Ecuador, said Mr. Ge Honglin.
The political society of Ecuador has been stable and the economy has maintained fast growth with infrastructural construction being improved continuously. The government of Ecuador has set up the economic development zone in which foreign companies can enjoy preferential policies in terms of taxation, logistics and so on. Ecuador has rich mineral resources and Ecuador government has focused on development of aluminum industry. Chinalco is welcome to Ecuador to invest in aluminum and other mineral projects, said Mr. Rafael Poveda.
JBM intends to sell bauxite ores to China
Jamaica Bauxite Mining Co., Ltd. (JBM) intends to sell partial of its bauxite ores to Chinese companies, according to source from the bauxite mining company.
JBM now owns 51% of stake in Jamaica Noranda Bauxite Mining Co., Ltd., which is capable of producing 4.50 million tonnes of bauxite ores per year. Most of which are used for alumina production. According to the agreement, JBM has the right to handle with the bauxite stocks if

Alumina & Aluminum Monthly
(www.antaike.com) ([email protected])
20
Noranda’s alumina production does not operate at full capacity So, JBM wants to export bauxite ores to China, which will bring sales revenues of USD1.3 million each year.
Aluminum smelter that does not lay off workers can obtain subsidy
The Ministry of Human Resources and Social Security, Ministry of Finance, Ministry of Industry and Information Technology, National Development and Reform Commission on November 18 jointly issue a circular Using Unemployment Insurance Funds to Support Enterprises to Stabilize Job Positions. Enterprise that adjusts the industrial structure but not reduce job positions or lay off workers can apply for the subsidy. The enterprises are classified as three groups and the domestic aluminum smelters are included in the second groups.
The policy of stabilizing job positions will continue into the end of 2020.
Bauxite & Alumina Guizhou discovers more bauxite resources
Great progress has been made in prospecting bauxite, coal and phosphor resources in Guizhou province this year and it is estimated that the newly-added bauxite reserve will be 400 million tonnes; coal, 15.0 billion tonnes; phosphor, 4.5 billion tonnes.
The province is rich in bauxite, coal and phosphor resources. In order to accelerate development of the resources, the province has outlined four production bases and conducted the prospecting projects to secure stable supply of the mineral resources for the production bases.
In addition, a shale gas field has been discovered in the north of the province. The shale gas Resource Reserve reaches 3.88 trillion cubic meters.
China’s alumina output to grow 9.8% in 2015
China’s alumina capacity is expected to reach 69.8 million tpy and the alumina output will grow by around 9.8% year on year to 56.0 million tonnes in 2015, said Ms. HUO Yunbo, Antaike alumna analyst, at 2014 China Aluminum Forum on November 27.
The alumina capacity will be around 61.0 million tpy at the end of 2014 and the output will be 51.15 million tonnes in 2014, said HUO Yunbo.
The expansion in the alumina capacity has been limited in China in recent two years due to the bauxite supply bottleneck, said the Antaike alumna analyst.
Aluminum Local government expects Chalco to build
The Mayor of Yuncheng city of Shanxi province recently met Chalco president Ge Honglin, discussing cooperation to build a production base
Alumina & Aluminum Monthly
(www.antaike.com) ([email protected])
21
coal-power-aluminum-fabrication production base in Shanxi
of coal-power-aluminum-fabrication in the city. Chalco now has three aluminum companies in the city, namely,
Chalco Shanxi Branch, Huaze Aluminum & Power Co., Ltd. and Huasheng Aluminum Co., Ltd.. The government of Shanxi province in May this year signed a strategic cooperation framework agreement with Chalco. Chalco plans to build 4×350MW coal-fired power station, aluminum smelting project (capacity substitution: closing backward and high-cost capacity and building advance and low-cost capacity) and aluminum fabrication project.
The Yuncheng Mayor said the government of Shanxi province has paid more attention to development of the local aluminum industry and outlined the development plan for the coming years: the alumina capacity of Yuncheng will reach 5.00 million tpy; primary aluminum capacity to expand to 2.00 million tpy and aluminum fabrication capacity to grow to 3.00 million tpy by the end of 2020. The government has implemented a series of preferential policy such as power price subsidy, direct supply of electricity from power station to aluminum smelter, construction of captive power station for aluminum smelter.
Chalco has been a leading aluminum company in China and played a key role in promoting development of aluminum industry in Shanxi province, said the Yuncheng Mayor.
Chalco will strengthen cooperation with the local government on development of the coal-power-aluminum-fabrication project, especially the aluminum fabrication, said the Chalco president.
China’s primary aluminum capacity to be nearly 40.0 mtpy in 2015
China’s primary aluminum capacity is expected to reach 35.64 million tpy at the end of 2014 and the capacity will be nearly 40.0 million tpy at the end of 2015, according to a report made by Antaike aluminum analyst YAO Xizhi and addressed at 2014 China Aluminum Forum.
Antaike forecasts that China’s primary aluminum output will reach 27.70 million tonnes in 2014 and grow to 30.60 million tonnes in 2015.
There are surplus of around 300 kt on China’s aluminum market this year and the surplus will be 450 kt in 2015.
East Hope Group joins hands with aluminum fabrication companies to extend aluminum industrial chain in Xinjiang
Supported by Ministry of Industry and Information Technology and the government of Xinjiang Uygur Autonomous Region, East Hope Xinjiang Nonferrous Metals Co., Ltd. has signed agreements with six domestic aluminum fabrication companies to build aluminum fabrication projects such as aluminum alloy bar, sheet & plate, aluminum alloy profile and aluminum alloy wheel in the aluminum zone of East Hope Xinjiang Nonferrous Metals Co., Ltd. , in the Wucaiwan industrial park of Jimusar county, Changji city.
The six aluminum fabrication companies have been clients of East

Alumina & Aluminum Monthly
(www.antaike.com) ([email protected])
22
Hope Xinjiang Nonferrous Metals Co., Ltd. and comes from Jiangsu, Zhejiang, Shandong and Henan: Hangzhou Fanglue Industry Co., Ltd., Shandong Linyi Dingsheng Aluminum Co., Ltd., Jiangsu Xingfa New Energy Material Co., Ltd., Shandong Mengshan Aluminum Co., Ltd., Henan Xibao Metallurgic Material Co., Ltd..
According to the agreements, the aluminum fabrication companies will build plants close to the aluminum smelter of East Hope Xinjiang and the aluminum smelter will directly supply primary aluminum liquid to the plants of aluminum fabrication companies. It is expected that East Hope Xinjiang will save aluminum casting cost of around 800 yuan/t and aluminum ingot transportation cost of about 500 yuan/t while the production cost of aluminum fabrication companies will be reduced by 500-1,000 yuan/t. Once the aluminum fabrication companies reaches full capacity, all aluminum liquid of East Hope Xinjiang will be directly used by the fabrication companies. Currently, East Hope Xinjiang operates 800 ktpy primary aluminum capacity.
Coal and electric power Guangxi Laibin Yinhai enjoys direct power supply policy
Approved by the government of Guangxi Zhuang Autonomous Region, Guangxi Laibin Yinhai Aluminum Co., Ltd. has directly bought electric power from local power station. The decrease in power cost and production cost encouraged the company to reactivate its idled potline in July this year. And now all the idled capacity have been put into production and the company is running at full capacity of 250ktpy.
Recently, a special work group comprising of officials of the local government departments such as energy and pricing paid a visit to the company to inspect implementation of the direct power supply policy. The local government intends to speed up reform of the electric power system.
Plagued by relatively high power rate, the company has reduced aluminum production for two times and partial capacity have been halted in recent two years. But now the company said it will not cut production again thanks to direct power supply policy.

Alumina & Aluminum Monthly
(www.antaike.com) ([email protected])
23
Statistics Chinese Primary Aluminum Output by Region in October 2014
Region (tonne) October 14 January-October 14 % Change January-October 14/13 September 14 October 13
Chinese total 2,083,880 19,673,041 7.69 2,041,030 1,951,134
Hebei 1,297 13,553 -23.87 1,305 1,850
Shanxi 63,364 704,409 -18.55 61,835 87,749
Inner Mongolia 223,403 2,010,218 8.79 213,685 177,220
Liaoning 17,544 206,044 -15.71 17,068 24,068
Jiangsu 34 12,465 -74.20 32 4,574
Zhejiang 609 2,824 -96.25 346 1,440
Fujian 11,937 118,769 -3.92 11,781 12,807
Shandong 210,113 1,892,777 8.23 215,184 173,725
Henan 278,553 2,813,045 2.53 277,347 284,665
Hubei 16,920 163,900 -16.81 16,753 18,311
Hunan 27,956 278,378 0.27 27,427 29,072
Guangxi 45,991 418,983 -22.82 51,013 68,834
Chongqing 54,368 518,925 96.47 57,007 31,027
Sichuan 36,460 361,910 -23.47 35,727 49,988
Guizhou 62,729 513,387 -45.41 62,029 81,130
Yunnan 93,338 840,671 5.55 90,604 91,291
Shaanxi 53,731 564,932 57.40 55,663 47,434
Gansu 192,495 1,753,946 6.77 184,325 173,983
Qinghai 190,882 1,944,909 5.14 192,726 192,077
Ningxia 109,318 1,154,394 -8.47 110,564 113,924
Xinjiang 392,836 3,384,603 73.66 358,609 285,965
Note: 1. All the figures listed above are from China Nonferrous Metals Industry Association (CNIA).
2. The original CNIA table only includes the data of output of the month, output of year up to the month and the % change. The
data on output of the month a year earlier and the previous month come from the CNIA data released a year earlier and a month earlier
respectively.
Chinese Alumina Output by Region in October 2014 Region tonne October 14 January-October 14 % Change January-October 14/13 September 14 October 13

Alumina & Aluminum Monthly
(www.antaike.com) ([email protected])
24
Region tonne October 14 January-October 14 % Change January-October 14/13 September 14 October 13
Chinese Total 4,166,935 39,322,555 6.60 3,873,445 3,736,631
Shanxi 825,867 7,375,548 12.78 693,075 636,882
Inner Mongolia 25,358 344,323 34,588
Liaoning 1,306 12,814 4.43 1,281
Shanghai 154 1,155 -31.31 161
Jiangxi 1,871 7,638 1,465
Shandong 1,056,447 10,073,514 1.77 1,050,772 988,111
Henan 1,061,497 10,297,721 1.58 985,581 1,034,166
Guangxi 667,834 6,674,201 11.49 645,483 900
Chongqing 22,546 556,105 -37.03 26,096 204
Guizhou 373,620 3,304,098 11.29 368,266 569,579
Yunnan 130,435 675,438 46.61 66,677 120,144
Note: All the figures listed above are from China Nonferrous Metals Industry Association (CNIA).
Imports and Exports of Al Products in October 2014
Import Quantity in
Oct 14
Quantity in
Jan-Oct 14
Y-o-Y
Jan-Oct
Value in
Oct 14
Value in
Jan-Oct 14
Y-o-Y
Jan-Oct
(Unit:) Tonne Tonne % USD USD %
Bauxite 2,564,150 30,527,546 -49.91 148,246,947 1,730,024,498 -46.86
Alumina 271,943 4,194,635 42.81 106,117,356 1,513,178,220 39.85
Unwrought aluminum alloys 6,482 74,460 -18.26 16,684,595 178,125,429 -13.27
Aluminum waste and scrap 196,412 1,877,579 -7.00 296,581,994 2,813,136,596 -11.49
Primary Al Sub-total 5,756 260,884 1.44 14,321,797 520,948,730 -2.46
Al semis
Sub-total 40,210 412,952 2.77 249,676,820 2,486,389,764 -2.03
Powder 115 1,435 -20.75 1,637,913 15,948,944 -5.11
Bar, rod, section 4,992 53,192 4.85 27,580,860 285,929,370 5.24
Wire 620 7,238 21.27 3,584,525 46,209,788 20.24
Sheet & strip 28,665 289,052 1.54 115,927,519 1,156,006,549 -5.60
Foil 4,807 49,595 5.65 90,211,227 868,089,308 -1.13
Tube 1,011 12,441 6.23 10,734,776 114,205,805 5.52
Other products (window, door, etc) 3,310 34,825 2.39 63,116,438 684,708,214 16.44
Export
Bauxite 777 5,244 NA 258,940 1,891,886 NA
Alumina 3,420 111,647 -27.92 3,839,872 101,331,325 29.71
Unwrought aluminum alloys 53,846 465,853 24.21 117,094,077 1,004,611,842 18.43
Aluminum waste and scrap 62 819 -28.21 109,259 1,308,494 -34.84
Primary Al Sub-total 3,435 92,787 7.61 7,036,671 191,556,397 1.59
Al semis Sub-total 318,417 2,841,887 10.94 1,027,991,200 9,272,213,517 6.44
Powder 674 8,514 27.23 3,625,874 42,934,664 27.27

Alumina & Aluminum Monthly
(www.antaike.com) ([email protected])
25
Bar, rod, section 65,424 606,202 19.63 223,773,847 2,064,900,311 17.09
Wire 1,960 17,625 20.68 9,722,472 79,450,446 29.74
Sheet & strip 155,170 1,367,644 4.34 427,744,506 3,865,915,014 -3.76
Foil 77,250 715,964 13.95 284,227,956 2,627,185,946 10.52
Tube 17,939 125,939 33.09 78,896,545 591,827,136 29.12
Other products ( window, door, etc) 162,361 1,499,958 9.59 806,871,123 7,509,187,657 9.92
Note: 1. Figures are provided by the General Administration of Customs of P. R. China
2. All Imports/exports of commodity are in physical weight.
LME and SHFE Aluminum Trade Volume Weighted Average Price LME: USD/t SHFE: yuan/t(tax included)
LME cash settlement LME 3-month SHFE spot month SHFE 3- month
2010 average 2,173 2,198 15,791 16,104
2011 average 2,398 2,422 16,833 16,870
2012 average 2,019 2,051 15,706 15,795
Average 12 /11 -15.79% -15.349% -6.69% -6.37%
January 2013 2,038 2,075 15,073 15,280
February 2013 2,053 2,095 14,989 15,202
March 2013 1,913 1,953 14,636 14,855
April 2013 1,856 1,889 14,560 14,669
May 2013 1,830 1,862 14,509 14,564
June 2013 1,816 1,856 14,725 14,740
July 2013 1,767 1,812 14,453 14,371
August 2013 1,814 1,863 14,309 14,333
September 2013 1,760 1,808 14,348 14,389
October 2013 1,812 1,859 14,441 14,274
November 2013 1,749 1,795 14,433 14,336
December 2013 1,738 1,784 14,257 14,088
2013 average 1,846 1,888 14,561 14,592
Average 13 /12 -8.6% -8.0% -7.3% -7.6%
January 2014 1,726 1,770 14,026 13,943
February 2014 1,694 1,737 13,464 13,531
March 2014 1,703 1,746 13,133 13,287
April 2014 1,809 1,847 12,843 13,007
May 2014 1,749 1,791 13,235 13,349
June 2014 1,834 1,869 13,322 13,533
July 2014 1,945 1,967 13,437 13,608
August 2014 2,030 2,038 13,963 14,083
September 2014 1,992 2,023 14,478 14,643
October 2014 1,938 1,956 14,097 14,002
November 2014 2,054 2,041 13,728 13,865
Source: SHFE, LME

Alumina & Aluminum Monthly
(www.antaike.com) ([email protected])
26
LME and SHFE Reported Aluminum Stocks in Late of the Period (kt) 2008 2009 2010 2011 2012 2013 Jul 14 Aug 14 Sep 14 Oct14 Nov14
LME (kt) 2,329 4.629 4.275 4,970 5,217 5,467 4,913 4,843 4,634 4,462 4,324
SHFE (kt) 203 298 441 208 442 181 378 344 277 238 225
Aluminum Arithmetic Average Price (A00, 99.7%) on Chinese Spot Markets (yuan/t, tax included)
Market 2012 H1 13 Q3 13 Q4 13 H2 13 2013 Q1 14 Q2 14 H1 14 Q3 14 Oct 14 Nov 14
Nanhai 15,630 14,624 14,535 14,454 14,471 14,655 13,297 13,171 13,233 14,170 13,735 13,780
Changjiang 15,623 14,639 14,374 14,369 14,356 14,511 13,158 13,123 13,140 14,052 13,688 13,683
Note: Guangzhou Nanhai Nonferrous Metals Spot Market (Guangzhou) is located in Guangdong Province, South China. Changjiang
Nonferrous Metals Spot Market (Changjiang) is located in Shanghai City, East China.
Chalco, ATKASI and Imported Spot Alumina Arithmetic Average Price (yuan/t, tax included) 2008 2009 2010 2011 2012 2013 Aug 14 Sep 14 Oct 14 Nov 14
Chalco 3,541 2,392 2,871 2,967 2,858 2,900 2,900 2,900 2,900 2,900
ATKASI 3,137 2,271 2,750 2,781 2,612 2,498 2,435 2,649 2,795 2,774
Imported 3,375 2,340 2,883 2,975 2,701 2,622 2,490 2,681 2,830 2,825
Note: ATKASI is the short for Antaike Alumina Spot Index. It is the average price of non-Chalco alumina producers in Shandong, Shanxi,
Henan and the southwest regions.
Domestic Producers’ Offering Prices of Aluminum and Related Products (yuan/t, tax included) Products Company Price in Mid-November 2014
Primary aluminum ingot Guangdong Nanchu Storage Co., Ltd. (Foshan city of Guangdong province) 13,640-13,740
Primary aluminum ingot The Shanghai branch of Guangdong Nanchu Storage Co., Ltd. (Shanghai) 13,610-13,650
Primary aluminum ingot Huabei Supply and Marketing Co., Ltd. (Tianjin) 13,750
Primary aluminum ingot Chinalco Guizhou Branch(Guiyang city of Guizhou province) 13,800
Al alloy A365 Chinalco Baotou Aluminum Co., Ltd. 14,140
Aluminum wirerod Fujian Nanping Aluminum Co., Ltd. 14,440
Aluminum alloy profile Fujian Nanping Aluminum Co., Ltd. 24,100
Aluminum alloy profile Shandong Huajian Aluminum Co., Ltd. 19,200
Aluminum hydroxide Aluminum Corporation of China Limited (Chalco) Guangxi Branch 1,800
Aluminum hydroxide Aluminum Corporation of China Limited (Chalco) Henan Branch 1,600
Anode Carbon Block Aluminum Corporation of China Limited (Chalco) Henan Branch 2,920
Cryolite Do-Fluoride Chemicals Co., Ltd. 6,300-6,500
Aluminum fluoride Do-Fluoride Chemicals Co., Ltd. 6,900-7,200
Iron fines( TFe 55°) Chalco Guangxi Branch (magnetic separation; made from red mud) 448

Alumina & Aluminum Monthly
(www.antaike.com) ([email protected])
27
News Release
Novelis Opens China’s First Manufacturing Facility
for Heat-Treated Aluminum Automotive Sheet • Dedicated to Vehicle Light Weighting to Advance China’s Environmental Goals • Expands Novelis Footprint to All Major Auto-Producing Regions of the World
ATLANTA, USA and CHANGZHOU, CHINA, Oct. 21, 2014– Novelis, the global leader in aluminum rolling and recycling, today officially opened China’s first plant dedicated to the production of heat-treated aluminum automotive sheet. The opening makes Novelis the only company to produce automotive aluminum sheet in all three of the world’s major automobile producing regions -- Asia, Europe and North America. The wholly-owned facility, located in the Changzhou National Hi-Tech District, represents a $100 million investment by Novelis to expand its global footprint to serve the rapidly growing market for automotive aluminum. With an annual capacity of 120,000 metric tons, the new facility will assist China in meeting its environmental goals and provide customers in Asia and abroad with high-quality automotive sheet for use in lightweight vehicle structures and body panels such as hoods, doors, fenders and lift gates. “The opening of our Changzhou plant further solidifies Novelis’ position as the aluminum partner-of-choice for automakers around the world,” said Phil Martens, President and CEO of Novelis. “Global automakers seeking to drive fuel efficiency, higher performance and innovative design can now source locally-produced Novelis aluminum automotive sheet in every major region where they make vehicles.” Since 2011, Novelis has invested more than $550 million globally to triple its automotive sheet capacity to 900,000 metric tons by 2015. Demand for aluminum is rapidly increasing as automakers strive to design a new generation of lighter, more fuel-efficient vehicles with reduced life-cycle emissions. Each 10 percent weight reduction can result in a 5 to 7 percent fuel savings. “The opening of our Changzhou plant marks an important milestone for Novelis as our first manufacturing facility in China,” said Shashi Maudgal, Senior Vice President, Novelis and President, Novelis Asia. “This new facility will be integrated with our existing operations in Korea, strengthening Novelis’ leadership in the Asian market, the largest and fastest growing region in the world for aluminum.” James Liu, Managing Director for Novelis China, says the expansion in China is in direct response to

Alumina & Aluminum Monthly
(www.antaike.com) ([email protected])
28
market demand:“Building on decades of deep technical experience in developing products and processes, the Changzhou facility sets the standard of excellence in the automotive application of aluminum. It helps Novelis support automakers in China to advance the use of lightweight aluminum.” “We are pleased to have worked closely with the Changzhou municipal government on this project and look forward to being an employer of choice in the region as Changzhou solidifies its reputation as a great place to do business in China," concluded Liu. As the world’s leading supplier of aluminum sheet to the automotive industry, Novelis' unrivaled research and technology capabilities have helped to pioneer the widespread adoption of aluminum in the auto industry. Currently, Novelis aluminum products are now featured in more than 180 models of vehicles produced by leading automakers around the globe. Novelis forecasts the global demand from automakers for aluminum sheet will grow by approximately 30 percent each year through the end of the decade For more detail about the Changzhou facility and Novelis’ leadership in automotive, including a fact sheet, photos and video, visit novelis.com/china. About Novelis Novelis Inc. is the global leader in aluminum rolled products and the world's largest recycler of aluminum. The company operates in 11 countries, has approximately 11,200 employees and reported revenue of approximately $10 billion for its 2014 fiscal year. Novelis supplies premium aluminum sheet and foil products to transportation, packaging, construction, industrial and consumer electronics markets throughout North America, Europe, Asia and South America. The company is part of the Aditya Birla Group, a multinational conglomerate based in Mumbai, India. For more information, visit novelis.com and follow us at facebook.com/NovelisInc and twitter.com/Novelis. Forward Looking Statements Statements made in this news release which describe Novelis' intentions, expectations or predictions may be forward-looking statements within the meaning of securities laws. Examples of forward-looking statements in this news release include the anticipated capacity of the new plant and anticipated growth in the global automotive market. Novelis cautions that, by their nature, forward-looking statements involve risk and uncertainty. We do not intend, and we disclaim any obligation, to update any forward-looking statements, whether as a result of new information, future events or otherwise. Important risk factors which could impact outcomes are included under the caption "Risk Factors" in our Annual Report on Form 10-K for the year ended March 31, 2014. Media Contacts: Investor Contact: Neil Hirsch, Corporate Megan Cochard +1 404 983 3470 +1 404 760 4170 [email protected] [email protected] ChiHyang Chung, Novelis Asia +821 09017 0951 [email protected] Vivienne Wei, Edelman Shanghai +86 216193 7417 [email protected]

Alumina & Aluminum Monthly
(www.antaike.com) ([email protected])
29
Energy-saving Equipment -- Stepped Cooling Equipment for Decomposition Tank of Alumina Refinery
NJKC-101 Air-cooling and Water-cooling Integrated Heat Pipe Exchanger
Alumina refineries have always been adopting broad-flow stainless steel plate heat exchanger for many
years for stepped cooling of decomposition tank, with slurry pump equipped for delivering slurry into plate
heat exchanger, so as to realize cooling by heat convection with circulating cooling water. Each production
line is equipped with 6 sets.
Service rating of slurry pump is 132KW per set. Each production line is equipped with 6 sets, and the
consumption of electric energy is about 700 degrees per hour, 16800 degrees per day and 6132000 degrees per
year as per calculation of 90% load.
As traditional cooling equipment, plate heat exchanger and slurry pump consume high energy, and are
easily subjected to scab, jam and damage as well. Thus, it requires frequent maintenance and high
maintenance costs.
Through many experiments, Nanjing Kechen Energy Saving Equipment Co., Ltd has successfully
developed NJKC-101 Air-cooling and Water-cooling Integrated Heat Pipe Exchanger (title of invention:
Cooling Heat Pipe Exchanger for Alumina Refinery Decomposition Tank, patent number: ZL201110210358.3),
which is applied in production process of stepped cooling of decomposition. This new type of heat exchanger
requires no slurry pump without power loss during running. It only needs circulating cooling water with
hydraulic pressure of 0.3Pa~0.4Pa, then bringing you the outstanding cooling effect, reliable operation and
zero maintenance. It is easy to conduct maintenance and the life span of this heat pipe exchanger is more than
6 to 8 years. Compared with plate heat exchanger, it can
save 100% slurry pump electric power.
As shown in figure 1, heat pipe absorbs heat by
hot arc and delivers heat to working fluid (liquid). After
working medium has absorbed heat, it will transform
into vapor in the form of boiling and evaporation. Under
the effect of differential pressure, vapor goes up to cold
side and coagulates into liquid, releasing latent heat of
vaporization. Then heat passes on to the cold fluid
(circulating cooling water) in cold side. Condensed fluid
back flows to hot side by gravity. Since the lumen of heat
pipe has been pumped to high vacuum, working fluid is rather liable to boil and evaporate. With quick starting,
high-efficient heat transport and independent work of heat pipe, the running of heat pipe has no power loss
without virtue of external power.
Figure 2: Diagram of Heat Pipe Exchanger Installation and Water
Figure 1: Schematic Diagram of Gravity Assisted Heat Pipe
Alumina & Aluminum Monthly
(www.antaike.com) ([email protected])
30
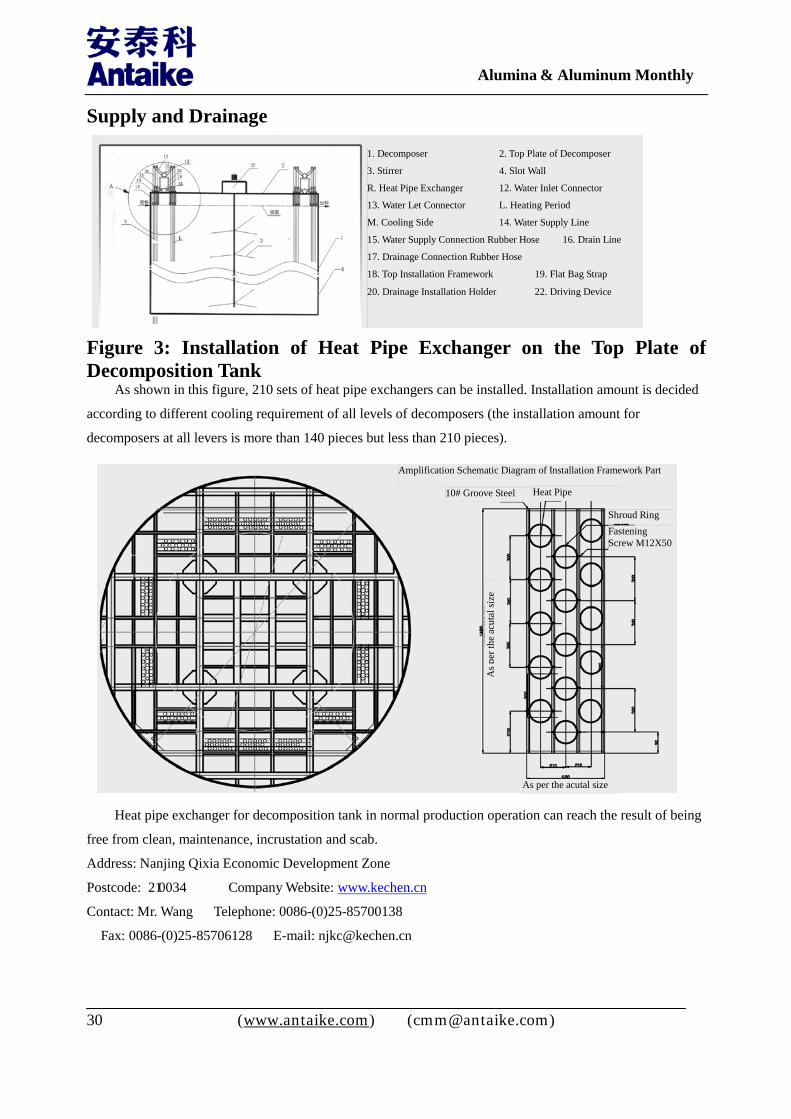
Supply and Drainage
Figure 3: Installation of Heat Pipe Exchanger on the Top Plate of Decomposition Tank
As shown in this figure, 210 sets of heat pipe exchangers can be installed. Installation amount is decided
according to different cooling requirement of all levels of decomposers (the installation amount for
decomposers at all levers is more than 140 pieces but less than 210 pieces).
Heat pipe exchanger for decomposition tank in normal production operation can reach the result of being
free from clean, maintenance, incrustation and scab.
Address: Nanjing Qixia Economic Development Zone
Postcode: 210034 Company Website: www.kechen.cn
Contact: Mr. Wang Telephone: 0086-(0)25-85700138
Fax: 0086-(0)25-85706128 E-mail: [email protected]
1. Decomposer 2. Top Plate of Decomposer
3. Stirrer 4. Slot Wall
R. Heat Pipe Exchanger 12. Water Inlet Connector
13. Water Let Connector L. Heating Period
M. Cooling Side 14. Water Supply Line
15. Water Supply Connection Rubber Hose 16. Drain Line
17. Drainage Connection Rubber Hose
18. Top Installation Framework 19. Flat Bag Strap
20. Drainage Installation Holder 22. Driving Device
Amplification Schematic Diagram of Installation Framework Part
10# Groove Steel Heat Pipe
Shroud Ring Fastening Screw M12X50
As per the acutal size
As p
er th
e ac
utal
size