Embed Size (px)
Citation preview

The Monetary Geography of AfricaBy Paul Masson and Catherine Pattillo
Table of Contents
Preface
Acknowledgements
List of Abbreviations and Acronyms
I. Introduction
II. African Currency Regimes Since World War II
III. Economic and Political Criteria for Currency Unions or the Adoption of
Another Currency
IV. Lessons from Two African Monetary Unions: the CFA Franc Zone and the
South African CMA
V. Experiences of Countries in Managing Independent Currencies
VI. Proposed Single Currency for West Africa
VII. Regional Integration in the Southern Africa Development Community
VIII. East African Community and COMESA in East and Southern Africa
IX. A Single Currency for Africa?
X. Conclusions : the Likely Evolution of Africa’s Monetary Geography in Coming
Decades
References

9/23/03The Monetary Geography of Africa
Preface
This book describes the use of moneys in Africa, currently and in the recent past, andattempts to draw conclusions concerning the evolution of exchange rate regimes in the future.Before getting into the substance, two questions need to be answered: what is the meaning of“monetary geography,” and why is it an interesting topic for Africa? We have adapted the term“monetary geography” from the title of a book by Benjamin Cohen, The Geography of Money1.In that book, Cohen argues forcefully that money has become “deterritorialized,” that is, thecirculation of a particular money is no longer coterminous with the country of issue. A primecase in point is the creation of the euro, which is not associated with a single country but ratherwith a supranational central bank. In addition, foreign currencies circulate widely in manydeveloping countries, because of uncertainty about the ability of the domestic currency tomaintain its value. Thus, in this book, we are concerned with the use of money, whether withinthe issuing country’s borders or outside of them. We are especially interested in the potentialspread of regional currency areas. In keeping with the geographical notion, we will rely on mapsto convey some of the key data not only on the use of moneys but also on the economic variablesthat influence their use and determine their value.
This brings us to the second question: why is that an interesting topic in Africa today? Infact, Africa is arguably a more useful laboratory than is Europe for studying the use of money. Itcontains two monetary unions characterized by joint decision-making among sovereign statesthat have existed for some 40 years, the two CFA franc zones, and a monetary area betweenSouth Africa and smaller neighboring countries, in which South Africa sets monetary policy, thatdates back to the early years of the 20th century. This justifies a more thorough look at theAfrican experience than has been attempted thus far, in notable contrast to the European case,which has received enormous attention. Moreover, the African continent has several projects forfurther monetary unions that are intended to culminate in a single African currency. So there is agreat need for analysis of the advisability of the monetary union projects and for research intohow best to proceed. We hope that this book goes some way towards meeting those needs.
1 Cohen (1998).
10/14/03Acknowledgements
We would like to thank a great number of our colleagues at the International MonetaryFund and the World Bank, at the UN Economic Commission for Africa, the West AfricanMonetary Institute, other official institutions, and in academe. Our collaboration began whenChristian François, then in the African Department of the IMF, suggested that we analyze theproposed monetary union for ECOWAS. Each of us had earlier worked on currency issues forAfrica, and we are grateful for the encouragement of Paul Collier, Ernesto Hernández-Catá, andCharles Humphreys in that regard. Our work on ECOWAS was greatly assisted by thehospitality and information provided by the West African Monetary Institute in Accra, andespecially by Ernest Addison, Rebiliy Asante, Siradiou Bah, and Michael Ojo. This book grewout of our earlier collaboration and also involvement with the CFA franc zone by one of us(Masson), who would like to thank his collaborators in that work at the IMF, especially OusmaneDoré, Christian Durand, Papa Ousmane Sakho, Pierre van den Boogaerde, and JohannesWiegand; the BCEAO and the BEAC for hospitality provided in Dakar and Yaoundé,respectively; and Philippe Bonzom, Christian DeBoissieu, Patrick Guillaumont and SylvianeGuillaumont-Jeanneney, Célestin Monga, and Marc-Olivier Strauss-Kahn, for interestingdiscussions on the topics of this book.
The book itself has benefited from comments from some of the above as well as:Christopher Adam, Luis de Azcarate, Pierre Ewenczyk, A. Laure Gnassou, John Green, CharlesHarvey, Jacqueline Irving, Christiane Kraus, Luca Ricci, Klaus-Walter Riechel, Jon Shields,Meshack Tjirongo, and Romain Veyrune. Benjamin Cohen encouraged us to undertake theproject, which is inspired by his own work, and gave us detailed comments on the outline. Thebuilding blocks for our book were presented at various conferences, including the AmericanEconomic Association annual meeting (New Orleans, January, 2000), CDC/CEPII conference onmonetary unions (Santiago, March, 2002), regional currency areas conference sponsored by theUN Economic Commission for Africa (Accra, October, 2002), and seminars at the Bank ofCanada and the University of Aix-Marseille. We would like to thank Frank Bohn, AgnèsBénassy-Quéré, Patrick Osakwe, Malcolm Knight, and Gilles Nancy for offering us theopportunity to do so. A conference at the BIS on regional currency areas (September 2002)provided insights and useful contacts, for which we are grateful to Philip Turner and JohnHawkins.
Indispensable inputs to our analysis of Southern Africa, Botswana, and SADC wereobtained thanks to visits to Pretoria and Gaborone by Masson which were arranged with the kindassistance of Lambertus van Zyl and Don Stephenson. He would especially like to thank, amongthe many whom he met there, Werner Brümmerhoff, Derek Hudson, Keith Jefferis, Brian Kahn,Christopher Loewald, Elias Masilela, Oduetse Motshidisi, Andrew Motsomi, Jay Salkin, andMoeketsi Senaoana.
We would especially like to acknowledge our debt to our close collaborators. XavierDebrun has coauthored with us several papers on monetary unions in Africa, and our book buildson that work. Heather Milkiewicz put together much of the data used in this book, has masteredthe technology of creating maps, and has done much of the statistical analysis. Finally, Masson

would like to thank the Brookings Institution, and in particular Carol Graham and Robert Litan,for providing excellent facilities and financial support without which the book would not havebeen possible.
The views expressed in this book are those of the authors and do not represent those ofthe Brookings Institution, the International Monetary Fund, or other institutions.

9/23/03List of Abbreviations and Acronyms
AEC- African Economic Community, created by the 1991 Abuja Treaty
AMU- Arab Maghreb Union, a regional group that includes Algeria, Libya, Mauritania,Morocco, and Tunisia.
APRM- African Peer Review Mechanism: an instrument of the NEPAD that will reviewcountries’ performance in the area of governance and exert peer pressure to improve it.
AU- African Union, a pan-African organization whose Constitutive Act entered into force in2001; it aims to bring about economic and political integration.
BCEAO- Banque Centrale des états de l’Afrique de l’ouest: the central bank of WAEMU
BEAC- Banque des états de l’Afrique Centrale: the central bank of CAEMC
CFA franc zone - a common currency area that uses the CFA franc which is pegged to the eurowith the assistance of the French Treasury. Its African members are comprised of two groups ofcountries (plus the Comoros), WAEMU and CAEMC, each with its own central bank and itsown currency. In French, franc CFA stands for franc de la Communauté Financière d'Afrique forWAEMU and franc de la Coopération Financière en Afrique Centrale for CAEMC.
CMA- Common Monetary Area, is comprised of South Africa, Lesotho, Namibia, andSwaziland.
CAEMC- (CEMAC in Frenc) Central African Economic and Monetary Community, comprisedof Cameroon, the Central African Republic, Chad, Republic of the Congo, Equatorial Guinea,and Gabon. They use the CFA franc issued by the region’s central bank, the BEAC.
COMESA- Common Market for Eastern and Southern Africa, extending from Egypt in the northto Namibia in the south.
EMS- European Monetary System, a transitional regime leading to EMU.
EMU- European Economic and Monetary Union, the common currency area based on the euro.
EU- European Union, a grouping of at present 15 countries, 12 of which belong to EMU.
ECCAS- Economic Community of Central African States, an embryonic grouping of CAEMCcountries and their neighbors in central Africa.
ECOWAS- Economic Community of West African States, founded in 1975, and which iscomprised of WAEMU and WAMZ countries.
IMF- International Monetary Fund
MMA- Multilateral Monetary Agreement: the 1992 agreement that governs the CMA.
NEPAD- New Partnership for African Development; a 1999 initiative of Presidents Mbeki,Wade, Bouteflika, and Obasanjo to encourage African countries to work together in order toimprove governance and further development.
NOFP- Net Open Forward Position
OAU- Organization of African Unity, the predecessor (with the AEC) to the AU.
OECD- Organization for Economic Co-Operation and Development, grouping the developedcountries.
OHADA- Organisation pour l'harmonisation du Droit des Affaires en Afrique/Organization forthe Harmonization of Business Law in Africa; Agreement on common business law involvingmainly francophone African countries.
OCA- Optimum currency area
REC- Regional Economic Community, considered building blocks of the African Union. Theprincipal RECs are AMU, COMESA, ECCAS, ECOWAS, and SADC.
SACU- South African Customs Union; Includes Botswana, Lesotho, Namibia, South Africa, andSwaziland
SADC- Southern African Development Community, whose goals are to foster successfuleconomic, and social development among members states (Angola, Botswana, DemocraticRepublic of the Congo, Lesotho, Malawi, Mauritius, Mozambique, Namibia, Seychelles, SouthAfrica, Swaziland, Tanzania, Zambia, Zimbabwe).
SARB- South African Reserve Bank; the central bank of South Africa, which issues the rand.
SSA- Sub-Saharan Africa
WAEMU-(UEMOA in French) West African Economic and Monetary Union; whose members(Benin, Burkina Faso, Cote d’Ivoire, Guinea-Bissau, Mali, Niger, Senegal and Togo) use theCFA franc issued by their central bank, the BCEAO.
WAMI- West African Monetary Institute, located in Accra, is the precursor to the central bankfor the WAMZ.
WAMZ- West African Monetary Zone, which aims to create a common central bank with asingle currency by July, 2005. Its members include The Gambia, Ghana, Guinea, Liberia,Nigeria, and Sierra Leone.

1
9/23/03Chapter I. Introduction
Africa at the beginning of the 21st century is at an important juncture in its history. It isnow roughly 50 years since the beginning of decolonization,1 and there is a widespreadconsensus that Africans need to take greater responsibility for their destiny. The Africancontinent has suffered from abysmal economic performance in recent decades, as the early hopesfor rapid development have faded. The continent has largely failed to benefit from the largeincrease in prosperity that has accompanied the expansion of trade and other aspects ofglobalization in the rest of the world. Instead, African countries have become increasinglymarginalized, with their share of world exports falling from already low levels, 4 percent in 1980to 1.6 percent in 2000. Per capita incomes have almost everywhere declined relative to worldaverages, and have even fallen in absolute terms in a number of countries. While the causes ofthis poor performance are many and diverse, they include inappropriate development strategiesdependent on inward-looking policies meant to capture rents rather than foster growth, obstaclesto trade (especially in agricultural products) imposed by OECD countries, undemocratic politicsthat have produced kleptocratic leaders, and the persistence of tribal and ethnic conflicts leadingto civil strife and wars with neighboring countries.
Starting in the mid-1980s, some countries liberalized payments and trade regimes in anattempt to stimulate growth, but despite a few success stories there has not been a generalizedtakeoff towards rapid growth or expansion of trade. A recognition of the need to carry out furtherstructural changes and to take responsibility in Africa for the success or failure of economicpolicies has led to a consensus in favor of formulating outward-looking and efficiency-enhancingpolicies, making leaders accountable for their shortcomings, and favoring regional cooperation.The formation of the African Union, and its implementation plan, the New Partnership forAfrican Development, or NEPAD, are manifestations of this determination. They were unveiledat a summit of African leaders in Lusaka in 2000 and adopted at the Durban summit in July,2001.
Another manifestation has been the renewed impetus given to subregional integrationinitiatives, and in particular projects to create monetary unions. Monetary unions, that is,groupings of countries sharing a common currency and central bank, are a particular type ofmonetary integration linking countries whose popularity has been dramatically increased by thecreation of the euro zone in January 1999. Three years later, in January, 2002 euro notes andcoin were introduced to replace the deutsche mark, the French franc, the Italian lira, and theother currencies of the (at present) 12 member countries. Box I.1 explains some of the formsthat monetary integration can take.
1 In Sub-Saharan Africa, Ghana in 1957 was the first country to become independent after World War II; a numberof other countries achieved independence in the following few years.

2
Box I.1
Box on Types of Monetary Integration
The study by the European Commission preparing Economic and Monetary Union and a subsequent article byCobham and Robson,1 distinguish between three types of monetary integration. Each of them would involve current andcapital account convertibility, but they are distinguished by whether there are separate currencies (and central banks) and,if so, whether their parities are perfectly fixed.
• An informal exchange rate union consists of separate currencies whose parities are fixed, but only within margins (and central parities can be adjusted). The European Monetary System’s exchange rate mechanism after August 1993 (ERM) is an example.• A formal exchange rate union has separate currencies but rates fluctuating within narrow or zero margins, and a strong degree of coordination among the central banks. In Africa, the Common Monetary Area is an example, since the currencies of Lesotho, Namibia, and Swaziland are linked one for one with the South African rand.• A full monetary union involves a single currency and central bank. The euro zone and both of the CFA franc zones would be examples of full monetary union.
We would add two other types of monetary integration2, namely:
• Adoption of another country’s currency (often called dollarization or, by extension, euroization). In this case, there is only a single currency but not monetary union, since the country issuing the currency does not take into account the goals of the dollarizing country. Examples of dollarized countries are Panama, El Salvador, and Ecuador. There are several examples in Africa of countries using other countries’ currencies temporarily, before issuing their own (for instance, Botswana upon independence used the rand, but in 1976 issued its own currency, the pula, and Eritrea used the Ethiopian birr for a period after independence).• A currency board, in which a country pegs to another currency with zero margins, and the link between the two currencies is institutionalized through a mechanism that limits the money supply in the currency board country to the quantity of reserves held in the other currency. Countries operating currency boards include Bulgaria, Estonia, and Djibouti.
Within these five types of arrangements, it is interesting to distinguish those in which decisions on monetary policy (or coordination of exchange rate policies) are symmetric (i.e. reflect the interests of all countries) from those that are asymmetric. By their very nature, dollarization and currency boards are asymmetric--countries adopt or peg to another currency unilaterally: there is no shared responsibility for monetary policy. But the first three arrangements can differ in their degree of asymmetry. The ERM was designed to be symmetric (with a parity grid defined around a basket currency, the ECU), but in practice, given the superior credibility of the Bundesbank and the strength of the German economy, operated to an extent asymmetrically. Full monetary union is likely to be symmetric, since the creation of a single supranational central bank is likely to involve institutions that represent all countries, but this is not necessarily the case, nor true of formal exchange rate unions. In particular, in the CMA, South Africa, given the size of its economy, effectively sets monetary policy for the zone; the other countries peg their currencies to the rand. In discussing projects for monetary integration within SADC (Chapter VII), we give considerable attention to the issue of whether an exchange rate or monetary union would be symmetric or asymmetric.
1 Emerson et al., (1991) and Cobham and Robson (1994)2 See Hawkins and Masson (2003)

3
There are a number of regional monetary integration initiatives presently beingconsidered in Africa. In West Africa, ECOWAS2 since its formation has had the objective ofconstructing a free trade area and single currency union. The absence of any progress on thelatter led a subset of ECOWAS countries to propose a second monetary zone—in addition to theexisting CFA franc zone in West Africa, WAEMU--as a fast-track to the creation of the unifiedWest African monetary zone. The timetable, which has been set back by a few years, now callsfor the creation of this second monetary zone, or WAMZ (West African Monetary Zone) by July,2005, to include the Gambia, Ghana, Guinea, Nigeria, and Sierra Leone. Such a monetary unionwould overlap closely with an earlier colonial grouping, the West African Currency Board. Itwould be subsequently merged with WAEMU to achieve the goal of a single West Africancurrency.
In East Africa, Kenya, Tanzania, and Uganda have agreed to revitalize the East AfricanCommunity, which was effectively dissolved in the 1960s. The project envisions a singlecurrency, in effect reestablishing the currency union constituted around the East African shillingthat was in place at the time of independence.
Southern Africa has been exploring regional integration in the context of the SouthernAfrican Development Community, to build on the long-standing but more restricted SouthAfrican Customs Union and the Common Monetary Area. Though the focus of SADC is ontrade and structural policies, some consideration is also being given to expanding the CommonMonetary Area centered on the rand, which now includes Lesotho, Namibia, and Swaziland, toinclude other SADC countries. An expanded monetary zone could involve shared monetarypolicy responsibility by South Africa’s Reserve Bank with neighboring central banks.
A feature of regional cooperation in Africa is the existence of overlapping regionalintegration initiatives. For instance, the Common Market for Eastern and Southern Africa(COMESA) includes most of the countries of SADC but also Egypt, Sudan, and East Africancountries, and it has a different timetable for trade liberalization. The CFA franc zones overlappartially with ECOWAS, as only one of the two CFA zones, WAEMU, is part of West Africa.Both WAEMU and ECOWAS have criteria for regional surveillance, but not identical ones, anddismantling of trade restrictions has proceeded differently in the two organizations. Overlappinginitiatives with sometimes conflicting provisions may prove to be an obstacle to achieving theobjectives of each; at the very least, they squander resources of expertise and money which are inshort supply in Africa.
It is useful first to review the history of monetary arrangements in Africa to understandhow exchange rate regimes evolved into their current constellation. Chapter II provides a briefhistory, showing that in the early postcolonial period the non-French-speaking colonies largelyabandoned their colonial monetary arrangements, which were typically currency boards linked tothe pound sterling, Belgian franc, Spanish peseta, or Portuguese escudo, in favor of the creationof a national central bank and a looser exchange rate arrangement such as an adjustable peg or 2 See table following Preface for a list of abbreviations used in the book and the membership of regionalorganizations.

4
managed floating. In contrast, the francophone countries largely retained their institutionalstructures, which linked them to their neighbors in a multilateral framework as well as to France.The reasons for the difference in postcolonial experience seem to be essentially two: i) theBritish, Belgian, Spanish, and Portuguese monetary arrangements were bilateral links with thehome country, and did not have sufficient institutional structure to survive independence; and ii)the French made efforts to adapt the CFA franc zone in order to preserve it, while the othercolonial powers did not resist the dissolution of the colonial currency boards. A third set ofcountries are those in Southern Africa. Lesotho, Swaziland, and Namibia upon independencecontinued their strong link with the rand, the currency of the continent’s largest economy, SouthAfrica, while another country in the region, Botswana, abandoned the monetary union and pegsthe pula to a basket of currencies (in which the rand is given a large weight, however).
The advantages and disadvantages of monetary integration are considered in Chapter IIIfrom the perspective of the traditional criteria for a monetary union, as well as from the point ofview of providing discipline over fiscal policies. The advantages of a common currency (for aregion or for the continent as a whole) depend on the savings of transactions costs, and thesesavings depend on the extent of trade among countries. Unfortunately, data for most Africanregions do not hold out much promise that savings of transactions costs will be large: tradewithin regional groupings (or even with all of Africa) is typically quite low. A new currency willbe more attractive if it exhibits more stability (i.e., maintains its purchasing power better) thanthe currencies it replaces, and this might be the case if monetary union provides an institutionalframework for achieving more discipline over fiscal policies, and a sustainable regime thatinsulates the (regional) central bank from pressures to provide monetary financing. On the otherside of the ledger, as stressed by the “optimum currency area” (OCA) literature pioneered byrecent Nobel prize winner Robert Mundell, having a common monetary policy is likely to bemore constraining, the more dissimilar the countries are, in that their economies face shocks of aquite different nature (because they export different commodities, for example). Greater labormobility or compensating flows of capital, achieved in a federation through a system of taxes andtransfers, can mitigate the effects of asymmetric shocks. Labor mobility between some countrieshas been quite high, for instance to South Africa from neighboring countries . In others, thereare periods of high mobility but when the economic or political situation changes, migrants areexpelled, as has occurred in several countries in both West and East Africa. As for fiscal flows,shortage of financial resources means that they are likely to be severely limited.
We argue in this Chapter that an important source of asymmetry among countries relatesto the degree of fiscal discipline. This is likely to be especially important in the African context,since in practice a central bank’s independence cannot be guaranteed—even if it is asupranational institution associated with a regional monetary union. As a result, moredisciplined countries will not want to form a monetary union with countries (especially if theyare large) whose excessive spending puts upward pressure on the central bank’s monetaryexpansion. We sketch out a simple model embodying this feature (as well as the traditionalOCA criteria) and calibrate it to African data. It will serve in later chapters to evaluate the costsand benefits of various monetary union proposals.
The experience of the currency union countries in Africa, those that are members of theCFA and CMA zones, has been different from that of countries managing independent

5
currencies. As shown in Chapter IV, the CFA franc zone countries experienced significantlylower inflation than the rest of sub-Saharan Africa, though no better growth performance. Andthey suffered a period of exchange rate overvaluation and economic crisis in the late 1980s andearly 1990s that culminated in a large devaluation in 1994 (cutting in half the value of thecurrency relative to the French franc). The crisis was due in part to the weakness of commodityprices, the strength of the French franc, and over-expansionary fiscal policies in the zone. Inrecognition of the latter problem, member countries have attempted to put in place a process ofregional surveillance over national fiscal policies in order to provide fiscal discipline. Each ofthe two CFA franc zones has also made progress in creating an effective customs union with acommon external tariff. It must be recognized, however, that even these two sets of countriesdiffer considerably: regional surveillance, trade, and cooperation are more advanced in WAEMUthan in CAEMC. The CMA countries have also generally benefited from low inflation, thanks tothe monetary anchor provided by South Africa’s Reserve Bank, and trade linkages are verystrong between South Africa and the smaller CMA countries. However this zone, unlike theCFA, has not been accompanied by regional surveillance over fiscal policies, due probably to thegreat asymmetry in size which has not favored the establishment of multilateral institutions.
In most of Sub-Saharan Africa (with the exception of Southern Africa), independentcurrency regimes have been associated with higher inflation and periodic devaluations. Thisexperience is discussed in Chapter V. Initially, the official pegs were maintained with exchangecontrols accompanied typically by inefficiencies and corruption, and parallel exchange marketsdeveloped. Under pressure from the Bretton Woods institutions, these countries moved towardliberalizing their payments regimes starting in the mid-1980s to enable current accountconvertibility and the elimination of parallel markets. In many of these countries, the currentexchange rate regime is some form of managed floating.
Lessons from both experience and theory are then applied to the proposals for regionalmonetary unions in Chapters VI-VIII. We first consider (in Chapter VI) ECOWAS, which asnoted above has a project to create a second monetary zone of mainly Anglophone countries inWest Africa—those not members of WAEMU—by mid-2005. This region however faces amajor problem because Nigeria has both asymmetric terms of trade shocks—it is a large oilexporter while its potential partners are oil importers—and also has large fiscal imbalances thatwould not bode well for the effective independence or monetary discipline of a regional centralbank. Any sustainable monetary union among these countries would have to be accompanied byreinforced fiscal discipline through effective regional surveillance and controls. We go on toconsider another possible way towards greater monetary integration in West Africa, namelythrough the expansion of the CFA franc zone. We find that indeed a few candidates would bothgain, and also produce gains for existing WAEMU members, but that WAEMU would lose fromadmitting some of the other ECOWAS countries.
In Chapter VII, we examine the concept of a monetary union among the SADC countriesof Southern Africa. Again, a full monetary union seems infeasible at this stage, since a numberof countries suffer from the effects of civil conflicts and drought, and are far from havingconverged with the macroeconomic stability of South Africa and her CMA partners. Morelikely, any progress in achieving a monetary union would involve a limited expansion of theCMA, and it would likely involve a monetary policy set by South Africa (as in the existing

6
CMA) rather than involve the delegation by that country of monetary policy to a new and untriedsupranational institution.
Chapter VIII considers the plan by Kenya, Tanzania, and Uganda to revive the monetaryunion that formed part of the East African Community. Such a limited monetary union, thoughunlikely to produce enormous economic gains, does seem to be generally compatible with otherinitiatives that could contribute to greater regional solidarity. However, economic gains wouldlikely favor Kenya, which, unlike the other two countries, has substantial exports to itsneighbors, and the main issues would be whether the political will exists now to push regionalintegration ahead, and whether it would continue to exist in the future. We also discuss in thischapter a wider project that includes all but Tanzania among these countries, namely a project ofa monetary union among countries in eastern and southern Africa (COMESA) countries. Thisregional grouping also partly overlaps with SADC—exhibiting the overlapping regionalcommitments that prevail in Africa and that often lead to inaction and contention. As is the casefor SADC, differences in macroeconomic stability, fiscal discipline, and financial developmentamong COMESA countries are great, making it unlikely that such a project is achievable ascurrently envisioned. Moreover, South Africa is not a member, and so that COMESA would notbenefit from the track record of monetary stability of South Africa’s Reserve Bank.
Does that mean that the goal of a single African currency—the subject of Chapter IX--isbeyond reach?3 Probably, and in any case the idea that currencies should span a continent doesnot make a lot of sense. At present, the only regional currency with a global role is the euro.Creating a single African currency would not likely give it such a role, and the single Africanmonetary policy (whatever it was) would impose considerable costs on very dissimilareconomies. If exchange rate stability is the primary objective, then it could be achieved at amuch lower cost through a unilateral peg to the dollar, the euro, or a combination of the two—depending on a country’s pattern of trade and financial relations. If the objective of a singlecurrency is primarily to demonstrate continental solidarity, we think that since the economiccosts would be substantial, a better way should be found to demonstrate that solidarity—forinstance through agreement to dismantle barriers to the movement of goods, people, and capitalthroughout the region. Of course, regional integration would be abetted by succeeding with theNEPAD initiative: by reducing conflicts, improving governance, eliminating corruption andfiscal excesses, and promoting the rule of law, African countries would become much moreattractive partners in regional cooperation.
We go on to speculate in Chapter X on the evolution of exchange rate regimes in Africain the short run to medium run, in the light of developments in the rest of the world. We believethat economic realities suggest that grand new projects for monetary unions are unlikely to besuccessful, though it is possible that expansion of existing monetary unions may take place,building on the considerable experience and credibility of the CFA franc zone and the CMA.However, enlargement of the CFA franc zone poses institutional problems: indeed, in accordancewith European Council decision of November 23, 1998, any modification of its scope ormembership would require the approval of France’s EU partners. It is likely that any majorexpansion would require giving up the French Treasury’s guarantee of convertibility of the CFA
3 Robert Mundell has argued (Mundell, 2002) that though a common currency would be a good thing, a morerealistic goal in the medium term would be a common peg to the euro.
7
franc into the euro at a fixed parity4. And the CMA countries differ considerably in financialdevelopment and in macroeconomic stability from their neighbors in Southern Africa, so anyexpansion of the CMA is likely to be limited and delayed.
We also consider the issue of external monetary anchors for African currencies.Recently, a great deal of attention has been paid to the hypothesis that countries need to choosebetween very hard pegs (in the limit, a monetary union) or flexible exchange rates: theintermediate regimes are not sustainable. The main argument relates to the trend toward capitalaccount liberalization, which makes the maintenance of anything but perfectly credible pegsdifficult. We consider that this factor is unlikely to dictate the choice of regime for most Africancountries, which continue not to be well integrated with international capital markets. If true, thiswould leave open the full range of possible regimes, including adjustable pegs.
A major issue concerns the choice between a domestic nominal anchor and some form ofexchange rate target. Exchange rate targets are fairly transparent (especially single currencypegs, less so for a basket peg) and do not require sophisticated financial systems, since thecentral bank essentially makes the foreign exchange market, buying and selling as necessary. Ifan exchange rate peg is preferred, the choice of the anchoring currency is also important. TheEuropean Union has successfully created a new currency, the euro, and on January 1, 2002,introduced notes and coins that have replaced those of 12 separate national currencies. The eurois already the world’s second most important currency, and the euro area is set to expand further.Given the extent of Africa’s trade with Europe, a peg to the euro may be an attractive option.
In this context, the question arises as to whether the European Union could play somerole in guaranteeing a peg to its currency, as is done by France for the CFA franc, now that theeuro has replaced the French franc as the anchoring currency. An expansion (andtransformation) of the CFA franc zone would allow countries joining it to achieve stability withthe euro, while at the same time benefiting from the considerable credibility associated with theCFA franc. It would be natural to envision the EU assuming France’s role of guaranteeing thecurrency peg. However, France’s EU partners have shown no enthusiasm for doing so,especially since an enlarged CFA might have more serious budgetary and monetaryconsequences for Europe than is the case at present. The question for African countries wouldthen arise of whether to continue to anchor the CFA franc to the euro, and if so, how. Thealternatives would be a joint float, a currency board with a peg to the euro, or “euroisation,” thatis, the outright adoption by African countries of the euro as their currency If the former, thecurrency would then rely solely on the discipline and independence of the central bank, operatinga credible domestic monetary anchor. If the latter, countries would abandon any possibility ofmonetary independence vis-à-vis Europe, and doing so would likely revive perceptions ofcolonial dependence.
With increasing financial development, a domestic financial target becomes both moredesirable and achievable. This is likely to be the route followed by the more advanced and largereconomies—or regional monetary unions. It is already practiced in South Africa, which targetsdomestic inflation and lets the rand float freely in foreign exchange markets. At present, this isan option that is open to few of the countries or regions in Africa, but greater institutional and 4 Currently 655.957 CFAF=1 euro.

8
financial development could make it an attractive option for more—but by no means all—African countries. In the future, therefore, we see the monetary geography of Africa as includingdiverse arrangements--some regional currencies, some countries with independent currencies,and these currencies either pegged to international currencies or floating—as is currently thecase.

10/2/03
Chapter II. African Currency Regimes Since World War II
This chapter describes the historical evolution of monetary and exchange rate regimes inAfrica, during the period since the Second World War. This exercise is doubly important for ourpurposes: it provides at least a partial explanation for the current constellation of currency areas,and it throws some light on the potential success of initiatives towards greater monetaryintegration. Indeed, the proposals to create a monetary union in West Africa (ECOWAS) and inEast and Southern Africa (COMESA), to reinforce or enlarge the CFA franc zone, or to extendthe rand area to SADC, to say nothing of the plan to create a single currency for Africa, need tobe evaluated in the light of past experiences with monetary integration. However, this is not theplace for an exhaustive survey of the use of money since the dawn of recorded time. Instead, theexperience in the post-war period, both before and after decolonization, seems most relevant, tothe extent that economies had already acquired some of the structural features that characterizethem today. A look at the immediate pre-colonial experience shows that much of the continenthad currencies that were tightly linked to the currency issued by the European colonizer;moreover, neighboring colonies often shared the same (African) currency.
This fact could be used in support of the argument that reestablishing those monetaryunions is both feasible and (more speculatively) desirable. However, subsequent historysuggests reasons to doubt that assessment, since in most cases those monetary unions weredissolved shortly after independence and African countries now typically have their owncurrencies and independent monetary policies. The two major exceptions are the CFA franczones in West and Central Africa, which consist mainly of former French countries, and theCMA centered around South Africa and the rand. We discuss below why those monetary unionshave survived, and compare them with the experience after independence of other colonies, inparticular the former British ones. These cases provide interesting insights into why currencyunions get dissolved, and the institutional development needed for their success. Thus, theprospects for the continued existence of the CFA and CMA zones and the creation of newmonetary unions are illuminated by the historical experience.
A. Prologue: Pre-colonial times
Africa has had an important role in the monetary history of the world at various times, inparticular by supplying precious metals that served as money. During the medieval period, itwas a major source of gold, most of which reached Europe via trans-Saharan trade routes fromWest Africa to North Africa. From the 9th to the 16th century, Africa was a prime supplier ofgold to the world economy, until it was eclipsed by the gold discoveries in the new world.During the earlier period, “… West African gold was absolutely vital for the monetization of themedieval Mediterranean economy and the maintenance of its balance of payments with SouthAsia.” (Austen, 1987, p. 36).
Gold served little role for Africa’s own monetary use, however. Instead, a variety ofgoods served as units of account, and these included palm oil, cotton cloths, cowries, copperingots, brass or iron bars, and brass horseshoe-shaped ‘manillas’ (Austen, 1987, p. 92). The case

2
of cowrie shells in West Africa has received considerable attention. These shells were importedfrom the Indian Ocean, so that transport costs limited the expansion of the money supply.However, improved shipping technology in the late 19th century led to rampant inflation (Austen,1987, p. 134). Because they were awkward to carry, the cowries served mainly as units ofaccount rather than as means of payment. They maintained this role to some extent under Britishrule, and they still had some exchange value in markets of north-western Ghana in the 1960s(Johnson, 1970).
Despite being overshadowed by other sources of bullion, Africa continued to be a notablesupplier of precious metals. The British “guinea” coin was named after the area in West Africawere the silver was mined, which had unusually rich deposits. And South Africa became in thelate 19th and early 20th century an important enough source of gold that an interruption of itssupply to the London market would have had implications for the international monetary system,in a period when the world economy was on the gold standard or the Bretton Woods gold-exchange standard.
B. Colonial monetary arrangements
As Africa increased its contacts with European powers, coastal areas tended to adoptEuropean silver coins of various kinds (e.g. Maria Theresa thalers and French five franc pieces)alongside African commodity currencies. However, the advent of colonization led soon to thereplacement of both African commodity currencies and silver coins by government-issued coinsand notes linked to the metropolitan currency (Austen, 1987, p. 134). Since the metropolitangovernments were on the gold standard, this essentially linked African currencies to gold.
Incorporating Africa into the international monetary system via linkage with themetropolitan currency had both advantages and disadvantages. It facilitated international trade,but could discourage internal trade in areas with little access to the official currency. And it wasa manifestation of dependency on the financial system of the metropole, which may haveinhibited the development of domestic financial institutions.
The Great Depression and the Second World War ushered in regimes which, at least inthe early post-war years, involved extensive restrictions on the convertibility of the Europeancurrencies to which the African colonies were linked. Since European economies had beenweakened by the war and their import needs greatly exceeded their export capacities, they allimposed various import restrictions and exchange controls that prevented the free internationaluse of their currencies. So instead of being a link to a single international monetary standard, thecolonial monetary arrangements served to tie each African economy much more closely to itscolonial power. Payments restrictions were accompanied by import preferences vis-à-vis themetropolitan country that had much the same effect.
This period also saw the creation of monetary institutions that gave further structure tothe African monetary arrangements, while maintaining the close link with the metropolitancurrency. Initially the French franc circulated in its African colonies, but in 1945 Franceintroduced new currencies for its colonies. For the major groups of tropical African colonies, thecurrency was called the CFA (for Colonies Françaises d’Afrique) franc; in 1948, it was pegged
3
to the French franc at a rate of 1 CFA franc=2 French francs1. The CFA franc served as currencyfor two separate groupings of sub-Saharan countries, French West Africa and French EquatorialAfrica2. The French treasury guaranteed the exchange rate and ensured transferability to andfrom France and the other territories through potentially unlimited financing provided by an“Operations Account.” Until 1955, the right of bank note issue in the CFA franc zones wasvested in certain private banks. In 1955, two new public institutions were given responsibilityfor note issue in West and Central Africa: the Institut d’émission de l’Afrique occidentalefrançaise et du Togo (Dahomey, Guinea, Ivory Coast, Mali, Mauritania, Niger, Senegal, UpperVolta, and Togo), and the Institut d’émission de l’Afrique équatoriale française et du Cameroun(Cameroun, Central African Republic, Chad, Congo-Brazzaville, and Gabon) (Abdel-Salam,1970, p. 341). Each of these monetary institutes, based in Paris and controlled by the Frenchgovernment, issued a distinct bank note that was the respective monetary area’s version of theCFA franc.
The Operations Account system (which is still in place in the existing CFA franc zones,albeit in modified form, as will be discussed below) needs to be distinguished from a traditionalsystem based on foreign exchange reserves, since it provides unlimited access to a particularforeign currency, the French franc. In the colonial system, the African countries in the franczone were obliged to deposit all their earnings in francs and the countervalue of their earnings inforeign currency in their Operations Account with the French Treasury, but had unlimited accessto French francs in exchange for their own currency (Abdel-Salam, 1970, p. 340). Access toFrench francs was not the same as access to foreign exchange (in particular US dollars),however, since at the time the French franc was not freely convertible into other majorcurrencies. Access to French franc balances was unlimited, since Operations Account balancescould become negative, providing financing for potentially large balance of payments deficits,but only vis-à-vis the franc zone, since international use of the French franc was restricted.
Most of the British colonies were grouped into three currency boards, the West AfricanCurrency Board, the Southern Rhodesia Currency Board, and the East African Currency Board,in each of which the quantity of money was linked to the amount of sterling assets held by thecurrency board3. The membership of the West African Currency Board was comprised ofGambia, Gold Coast, Nigeria, Sierra Leone, and later the British Cameroons. The SouthernRhodesia Currency Board (or Central African Board after 1954) included Southern Rhodesia,Northern Rhodesia, and Nyasaland. The East African Currency Board grouped Kenya,Tanganyika, Uganda, and later Zanzibar, Aden, Somalia, and Ethiopia. Each of the currencyboards was characterized by a fixed parity with the pound sterling, an automatic system of issue,and 100 percent sterling cover for the local currency (Abdel-Salam, 1970, p. 346). Thus, theBritish had a quite different mechanism from the French for ensuring the convertibility of theircurrencies into the metropolitan currency. The automaticity of the currency board ensured thatthe parity vis-à-vis the pound sterling could be maintained and would not be strained by
1 With the move to the new French franc in 1960, the parity became 1 CFA franc=0.02 French francs. This parityremained in effect until the devaluation of the CFA franc on January 11, 1994, making 1 CFA franc=0.01 Frenchfrancs.2 And also League of Nations mandated territories Cameroun and Togo, and French controlled islands in the IndianOcean, including Madagascar and Comoros.3 As described below, British Protectorates in Southern Africa depended on the Reserve Bank of South Africa.
4
excessive monetary expansion, without the British monetary authorities having to provideoverdraft facilities.
Spain, Belgium, and Portugal had various arrangements with their colonies that in eachcase provided for a link with the metropolitan currency. Belgian colonies of the Congo andRwanda-Urundi formed a monetary union, whose currency, the Congolese franc, was pegged tothe Belgian franc. Portuguese and Spanish colonies typically used the escudo or peseta,respectively. The British protectorates in southern Africa were linked to the Union of SouthAfrica, the major economy in the region, which was formed in 1910. It had its own currency, theSouth African pound, which upon creation of South Africa’s central bank (the Reserve Bank ofSouth Africa) in 1921, became the sole circulating medium and legal tender for the small Britishprotectorates of Bechuanaland (Botswana), Basutoland (Lesotho), and Swaziland, and also forthe League of Nations’ trusteeship territory of South-West Africa. The South African pound wasreplaced by a new currency, the rand, in 1961, and the monetary union became known informallyas the rand monetary area.
C. The period after independence
As the movement leading to general decolonization gained strength, Britain and Francediffered in the arrangements that they proposed for their African colonies. France attempted topreserve and strengthen the currency unions based on the CFA franc by allowing for greaterAfrican representation on governing boards and offering a currency guarantee on French francreserves. The link with the French franc was maintained, as was France’s strong influence onmonetary policy, while the French treasury continued to provide a guarantee of convertibility.
Britain, in contrast, did not try to influence the post-colonial monetary policy regimes byoffering inducements to her colonies to remain linked to sterling. One by one the newly-independent countries created their own central banks and their own currencies. Even whenthese new currencies were to be linked together, as in the East African Community composed ofKenya, Tanzania, and Uganda, the forces of disintegration were irresistible in the absence ofexternal inducements to cooperate. Thus, while the former French colonies are still grouped intotwo currency unions, the West African Economic and Monetary Union and the Central AfricanEconomic and Monetary Community, the former British colonies (with the exception of theBritish protectorates in southern Africa) all have independent monetary policies and separatecurrencies. The same is generally true of the former Spanish and Portuguese colonies, thoughseveral of them have in fact joined one or the other of the CFA zones (Equatorial Guinea joinedthe Central African currency zone in 1985, and Guinea-Bissau joined the West Africa MonetaryUnion in 1997) or linked their currencies to the euro (Cape Verde has done so, with the financialassistance of Portugal), also producing exchange rate stability vis-à-vis the CFA franc.
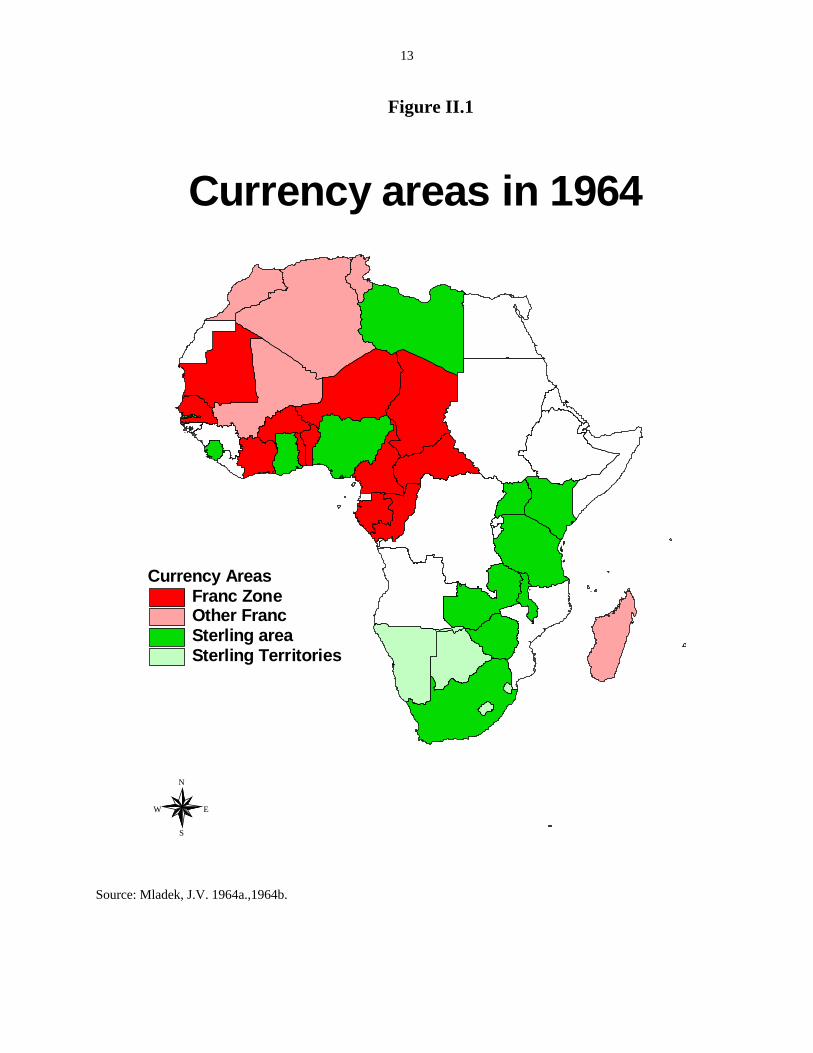
It is true that the former colonies of Britain did tend to remain in the sterling area, in thesense that payments regulations gave preference to transfers vis-à-vis other countries using thepound sterling or linked to it. Map 1 (based on Mládek, 1964a, 1964b) shows what can looselybe called the French franc and sterling area countries in Africa in 1964, less than a decade afterindependence. However, while the franc zone is an institutionally supported monetary union, the

5
sterling area at this time is only a loose arrangement mainly based on preferential paymentsregulations.
The franc area in 1964 included Algeria, Morocco, and Tunisia, which maintained somemonetary arrangements with France, though increasingly loose ones; the monetary unionsconstituted by the two CFA franc zones in West and Central Africa; and the Malagasy Republicand Comoros. The sterling area at this time was characterized not by monetary unions (with theexception of the East African currency union, which was shortly to disappear) or OperationsAccounts in sterling, but rather the following characteristics which generally applied to membercountries: rates of exchange quoted in sterling; official reserves held in sterling; payments andprivate assets normally routed or held in London; and freedom of payments made within thesterling area, but restrictions on payments outside (Mládek, 1964b). Sterling area countries andterritories in 1964 included all former and present British colonies in Africa (including theRepublic of South Africa) except British Cameroons (which merged with French Cameroun),and British Somaliland, which was absorbed in the Republic of Somalia. By this time, othercolonial powers’ currency areas have disappeared, or only survive in countries not yetindependent, such as Angola and Mozambique, which are part of the Portuguese escudo zone,though have their own bank notes4. Mozambique adopted a new currency, the metical, in 1980,5 years after independence, and initially its official fixed parity was defined in terms of a basketof 6 currencies.5 Upon independence in 1960 (and the independence of the Belgian Congo),Ruanda and Burundi ceased using the Congolese franc and responsibility for issuing the newfranc of Ruanda and Burundi was given to a joint monetary institution.6 However, the economicunion did not survive the tribal conflicts that occurred in 1963-64, and each country subsequentlyadopted its own currency.
The sterling area ceased to have any operational significance with the abandonment ofexchange controls by Britain in the late 1970s. Moreover, the breakdown of the Bretton Woodssystem of fixed by adjustable parities and the advent of generalized floating of the currencies ofthe major powers led many African countries to loosen their exchange rate links with the formercolonial power and to devalue or abandon their exchange rate parities with the metropolitancurrency. However, the CFA franc zone retains, with the financial support of France, the fixedparity with the French franc, despite the devaluation that occurred in 1994.
Dissolution of British Currency Boards
The seeds of the dismemberment of the currency boards in western and eastern Africawere already planted before independence. Their rigidity and automaticity evoked the criticismthat they could not be managed flexibly enough to attain such policy objectives as stimulatingeconomic activity, and that forcing colonies to hold reserves in London detracted from use oftheir savings to foster development (Hazlewood, 1952). Sterling balances yielded at the timevery low rates of interest, stimulating demands that the colonies be allowed to hold a morediversified portfolio of assets. In any case, despite resistance from the Bank of England, which
4 The escudo zone broke down before independence because of payments imbalances, and the colonial escudos weremade inconvertible in the metropolitan currency. See Valério (2002).5 See Indian Ocean Newsletter (1986).6 See Institut Royal des Relations Internationales (1963).
6
feared that African central banks would be subjected to political pressures and would beineffective if capital markets were not in place, the British authorities succumbed to thecriticisms (including those of economists from the US Federal Reserve and the World Bank) andagreed to dismantle the currency boards and set up central banks in each of the colonies (Uche,1997, pp. 152-53; Helleiner, 2001).
The Central African Currency Board was abolished in April 1956 and replaced by theCentral Bank of Rhodesia and Nyasaland, which operated until 1964, when the newlyindependent countries of Malawi, Rhodesia, and Zambia started issuing their own banknotes. Inlarge part because of political frictions and diverging economic interests among the membercountries (see Birmingham and Martin, 1983), the monetary area was definitively dissolved inJune 1965 and each of the countries created its own central bank (Abdel-Salam, 1970, p. 347).In West Africa, member countries progressively withdrew from the West African CurrencyBoard, Ghana doing so in 1957, Nigeria in 1959, British Cameroons in 1962 (to join the CentralAfrican CFA franc zone as part of Cameroun), Sierra Leone in 1963, and Gambia in 1964. Thenew currencies in Ghana (the Ghanaian pound, later the cedi) and Nigeria (the Nigerian pound,later the naira) were initially linked at par with sterling but subsequently depreciated.
In East Africa, the former colonies aimed to retain cohesion among the member countriesand replace the currency board with some type of monetary union, in the context of a new EastAfrican Community linking Kenya, Tanzania, and Uganda. However, after protractednegotiations that broke down in 1966 each of the three countries decided to issue its owncurrency and create its own central bank (Abdel-Salam, 1970, p. 349). The currencies were to befreely convertible at par, but subsequent events and political disagreements led to restrictions onconvertibility and exchange rate fluctuations, effectively ending the monetary union (Cohen,1998, p. 73). Capitalist Kenya and socialist Tanzania were following quite different economicpolicies, while the Uganda of Idi Amin was practically at war with her neighbors. In thesecircumstances, the cooperation required to make monetary union work was clearly not present.
Consolidation of the CFA franc zone
In contrast to Britain, France moved to shore up the institutions that linked her formerAfrican colonies to the French franc, by increasing African participation in decisions, whilemaintaining the financing facility embodied in the Operations Accounts. In 1959, the Institutsd’émission were transformed into central banks, called the Banque centrale des états de l’Afriquede l’ouest (BCEAO) and the Banque centrale des états de l’Afrique équatoriale et du Cameroun(BCEAEC) subsequently renamed Banque des états de l’Afrique centrale (BEAC). Theirheadquarters were initially in Paris, but provisions were made for them to move to Africa. Inaddition to the currency issue, the two central banks were authorized to extend credit tocommercial banks and the treasuries of the member countries. Starting in 1966, each centralbank could grant short term loans to a national treasury equal to 10 percent of the country’s fiscalreceipts; in 1970, this limit was raised to 15 percent in exceptional circumstances; and in 1972-73, boosted to 20 percent, accompanied by abandonment of restrictions on the exceptional natureof full access and the short maturity of the loans (Vinay, 1988, p. 24). The agreementsestablishing the central banks provided for each of them to pool the foreign exchange reserves oftheir member countries and to maintain a separate Operations Account at the French Treasury.
7
The boards of the two banks now included both French and African representatives (Abdel-Salam, 1970).
The former French colonies upon independence chose to remain in the CFA franc zoneand to participate in the regional central bank, with the exception of Guinea and Mali7, whichchose an anti-capitalist path of national self-reliance rather than integration with the worldeconomy (Yansané, 1984). Both countries created their own central banks and currencies.Whether the decision of the other, non-socialist, countries to remain in the franc zone was due toa calculation of the benefits of monetary stability and the financing guarantee of the OperationsAccount or to the advantages of maintaining other links with France is hard to say. Culturallinks with the former metropolitan power remained strong, as France had long welcomed theparticipation of African elites in French life, for instance honoring the contributions of poet (andlater statesman) Leopold Senghor by naming him to the Académie Française. France in any casewas keen on maintaining the monetary relationship with African countries and brought pressuresto bear to induce them to continue to participate.8 The economic performance of the CFA franczone will be reviewed in another chapter, but it is clear that price and monetary stability was animportant benefit of the continuing link with a currency of a major economic power. Indeed,Boughton (1991) argues that considered alone, monetary union among the African members ofthe CFA franc zone would not seem to yield obvious benefits; instead, France needs to beconsidered an integral part of the system, and a source of benefits that include discipline,credibility, and stability in international competitiveness. This may, however, be too negative aview of a purely African monetary union since it ignores the advantages of having asupranational central bank that is at least partially insulated from pressures from nationaltreasuries—an issue that will be discussed in a subsequent chapter. It is also noteworthy thateven in 1970 an observer could say that “… one of the fundamental ills of the C.F.A. francsystem is that it had given its member countries an essentially overvalued currency, which hasseriously impaired the competitiveness of their export products, and has tied their economies toFrench markets …” (Abdel-Salam, 1970, p. 345). This ill became evident in the course of the1980s and led to an economic crisis that culminated in the devaluation in 1994 of the CFA franc.
The CFA franc zone was further modified in 1972-73 by new treaties between France andthe African members. In Central Africa, the central bank was renamed the Banque des Etats del’Afrique centrale, its headquarters was moved to Yaoundé as of 1977, and an African named asGovernor. In West Africa, similarly, the headquarters was moved to Dakar in 1978 andhenceforth the BCEAO was headed by an African, Abdoulaye Fadiga. The requirements forholding reserves in the Operations Account were loosened somewhat, and now only constitute 65percent of total reserves, but emergency measures are to be taken if the ratio of reserves to thecentral bank’s sight liabilities decline below 20 per cent or if the Operations Account balance
7 Mali subsequently reached agreement in 1967 with France on the conditions for Mali to rejoin the CFA franc zone,and, after a period of pegging to the French franc with French support, Mali did so in 1984.8 Monga and Tchatchouang (1996), p. 23, argue that the continued existence of the CFA franc zone was primarilythe result of French pressure rather than the wishes of the African colonies, which were given independence on thecondition that they would sign cooperation accords with France. Helleiner (2001) notes that the harsh treatment thatFrance accorded to Guinea and Mali served as a caution to the others. Mundell (1972) suggests that the differentchoices of policy regime made by leaders of francophone and anglophone African countries were related in part totheir different economic training. Keynesian heterodoxy in monetary matters was much more in vogue in Londonthan in Paris in the postwar period.

8
becomes negative. The limit on lending to national treasuries was raised to 20 percent of theirfiscal receipts in the previous year. France provided an exchange rate guarantee for reserves inthe Operations Account, compensating for any decline in the value of the French franc againstthe SDR (Vinay, 1988, Annex 6). This guarantee and generous remuneration of French Francbalances (linked to the French money market rate) made the requirement to hold 65 percent ofreserves in the Operations Account not constraining; indeed it was in the interest of Africancentral banks to hold reserves in excess of the minimum, because in effect they were being paidan interest rate whose high level reflected an exchange rate risk to which they were not exposed(Vizy, 1989, p. 47). As a counterpart for the overdraft facilities of the Operations Account,France retained some representation on the bodies in each central bank that made monetarypolicy decisions; however, that representation was a minority one.9
Despite these changes, Madagascar and Mauritania chose to quit the CFA franc zonerather than sign the new treaties with France. Madagascar’s decision was the result of a choice infavor of a planned economy, while Mauritania’s decision reflected lack of solidarity with itsWest African neighbors, with whom it had had ethnic conflicts (Parmentier and Tenconi, 1996,p. 39).
The 1994 devaluation was a major event that risked destroying the CFA franc zones. Thedecision to devalue came after years of wrangling; it was advocated early on by the IMF andWorld Bank, but resisted by both the French and African authorities. France signaled a changein its position at a meeting of the Franc Zone in Abidjan in September, 1993, when it made clearthat it would only provide aid to countries having agreed to programs with the Bretton Woodsinstitutions (Parmentier and Tenconi, 1996, p. 155). The depth of the economic and financialcrisis eventually forced African heads of state to accept the fact that there was no alternative todevaluation, and on January 11, 1994, the decision to cut the value of the CFA franc in half, from50 to the French franc to 100, was announced.10 Instead of destroying the monetary union orcutting the link with the French franc, the commitment to a fixed parity was reiterated and thetwo African zones agreed on measures that would reinforce their cooperation on fiscal policy,banking supervision, and regional free trade.11 The framework for enhanced cooperation wasembodied in treaties setting up the West African Economic and Monetary Union (WAEMU) andthe Central African Economic and Monetary Community (CAEMC), respectively. Theoperation of these organizations and the subsequent performance of the CFA franc zones will bediscussed in Chapter IV.
Creation of the Common Monetary Area in Southern Africa
As mentioned above, the British Protectorates in southern Africa adopted the SouthAfrican currency. After they became independent in the late 1960s, Botswana, Lesotho andSwaziland continued to use the rand as the sole currency in circulation, without any formalagreement with the South African government; however, informally they and the Republic of
9 There are currently 2 French representatives (out of 18) on the board of the BCEAO, and 3 (out of 13) on the boardof the BEAC. See Gnassou (2001).10 The Comoros franc was devalued by half this amount, from 50 to 75 to the French franc.11 See, for instance, Clément et al. (1996). For the lead-up to the devaluation, see for instance the article inBoughton (1993).
9
South Africa constituted the “rand area.” There were no internal restrictions on payments withinthe zone, and the smaller members imposed similar payments restrictions outside the zone tothose of South Africa.
In 1969, after a customs union agreement was renogotiated with South Africa, attentionturned to formalizing and adapting monetary relations between the smaller countries and SouthAfrica. This led eventually, in December 1974, to a formal agreement recognizing the RandMonetary Area linking Lesotho and Swaziland with South Africa; Botswana had decided towithdraw from the monetary union. The agreement provided that the rand would be legal tenderand exchangeable at par within Lesotho and Swaziland, but the latter would have the right toissue their own currencies, whose note issue would be backed 100 percent by rand deposits withthe South African Reserve Bank (d’A. Collings et al., 1978, p. 102). There would be norestrictions on transfers of funds within the union or on access of the smaller countries to SouthAfrica’s capital markets. The smaller countries would apply substantially the same foreignexchange controls as South Africa for transfers outside the area, though they could apply theirown regulations on foreign direct investment. Uniquely among monetary unions with a dominantmember, South Africa agreed to share seigniorage on the basis of an estimate of the randcurrency circulating in the other two member countries. Swaziland established its own monetaryauthority and began to issue its own currency, while Lesotho did not. Botswana continued to usethe rand on an informal basis until the introduction of the pula in August 1976, which waspegged to the U.S. dollar until 1980, when it was pegged to a basket of currencies. Botswana’sdecision to have its own currency and, on occasion, to vary its exchange rate peg and the basketor currency to which it is pegged has allowed the authorities to insulate the economy to someextent from fluctuations in the demand for its exports, in particular diamonds (Masalila andMotshidisi, 2003).
The Rand Monetary Area was replaced in July 1986 by the Common Monetary Area as aresult of agreement among the three countries to accommodate certain concerns of Swaziland.The Multilateral Monetary Agreement (MMA) made Namibia an independent member of theCMA in February 1992, though the latter had long been a de facto member of the rand zone. Aswas the case for the Rand Monetary Area, the CMA is a decentralized monetary union in whichmonetary policy is effectively set by South Africa but where the smaller members have the rightto issue their own currencies. There are no restrictions on transfers of funds within the CMA,and the smaller countries’ currencies are convertible into rand at a one-to-one rate; they are notlegal tender in South Africa, however. Namibia and Lesotho issue their own currencies (as doesSwaziland), but they have to be fully backed by prescribed rand assets; the latter is not true forSwaziland (Van Zyl, 2003).
South Africa introduced a dual currency system in 1979, which applied to paymentsoutside the CMA. The commercial rand rate was determined in the market subject to reservebank intervention, while the financial rand, which applied to most nonresident portfolio anddirect investment, floated cleanly (except for some intervention in the early 1990s), with marketthinness making the rate volatile. One of the objectives was to break the link between domesticand foreign interest rates, and to insulate the capital account from certain categories of capitalflows (Aron et al, 2000). The financial rand was abolished in 1983, and some capital controls onresidents liberalized, but following large depreciations of the single rate associated with gold

10
price weakness and the debt crisis in 1985, the financial rand was reintroduced and controlstightened again. The dual currency system remained in effect until exchange rate unification in1995. The objective of the reserve bank’s intervention in the commercial rand market during theperiod 1979-99 has been characterized as aiming to maintain the profitability and stability in thegold industry by smoothing the real rand price of gold, with, as a consequence, a highly variablereal exchange rate. After 1988, however, the real rand gold price was allowed to fall and thereserve bank was more active in limiting movements of the real exchange rate (Aron et al, 2000).The current regime of inflation targeting is discussed in Chapter IV below.
The continued existence of a monetary union based around South Africa’s currency isevidence of the mutual advantage of a common currency in the area (much of the revenues of thesmaller countries come from remittances from workers in South Africa). The willingness ofSouth Africa to listen to the concerns of its neighbors, as evidenced by the various adaptations ofthe monetary union over time, has also contributed to its success. The relative size of thecountries is a factor in the durability of the relationship, as there is no doubt where theresponsibility for monetary policies lies.12
D. Exchange Rate Regimes in Effect at the Beginning of the 21st Century
The international environment in which African currencies function is very differenttoday compared to what prevailed in the early post-colonial period. In that period, the sterlingand French franc zones (Figure II.1) were essentially comprised of countries with currenciesfixed to the two European currencies. Since both the franc and the pound sterling were peggedto gold via the US dollar, albeit with possible changes in parities13, African currencies exhibitedexchange rate stability against all other major reserve currencies. Three major events haveoccurred in the meantime, two external and one internal, each with significant effects for themonetary geography of Africa.
First, starting in 1973 the central banks of countries issuing the major currencies nolonger attempted to maintain parities, either against the dollar or against gold. Thus, an Africancountry’s choice of which currency to use as an anchor could have major repercussions on itseffective exchange rate (that is, a weighted average of its exchange rate against other currencies),since the major currencies now fluctuated among themselves. In particular, countries thatpegged to a European currency could experience a large real appreciation if the dollar was weak,and vice versa. Movements of European currencies among themselves could have similareffects. While the formation of the European Monetary System (EMS) and the progressivehardening of exchange rates between pairs of EMS currencies during the 1980s limited the latterproblem, the exchange rate crises in 1992-93 exacerbated intra-European exchange rate volatilityonce again, especially after Britain and Italy were forced to leave the Exchange Rate Mechanismin September, 1992. Movements among the exchange rates of the major currencies thus madeexchange rate pegs more difficult for the African countries, as is also true for other developingcountries.
12 Cohen (1998) argues that the existence of a hegemonic power is a strong factor favoring the survival of commoncurrency areas.13 There was a devaluation of the pound in 1967 and of the franc in 1969.

11
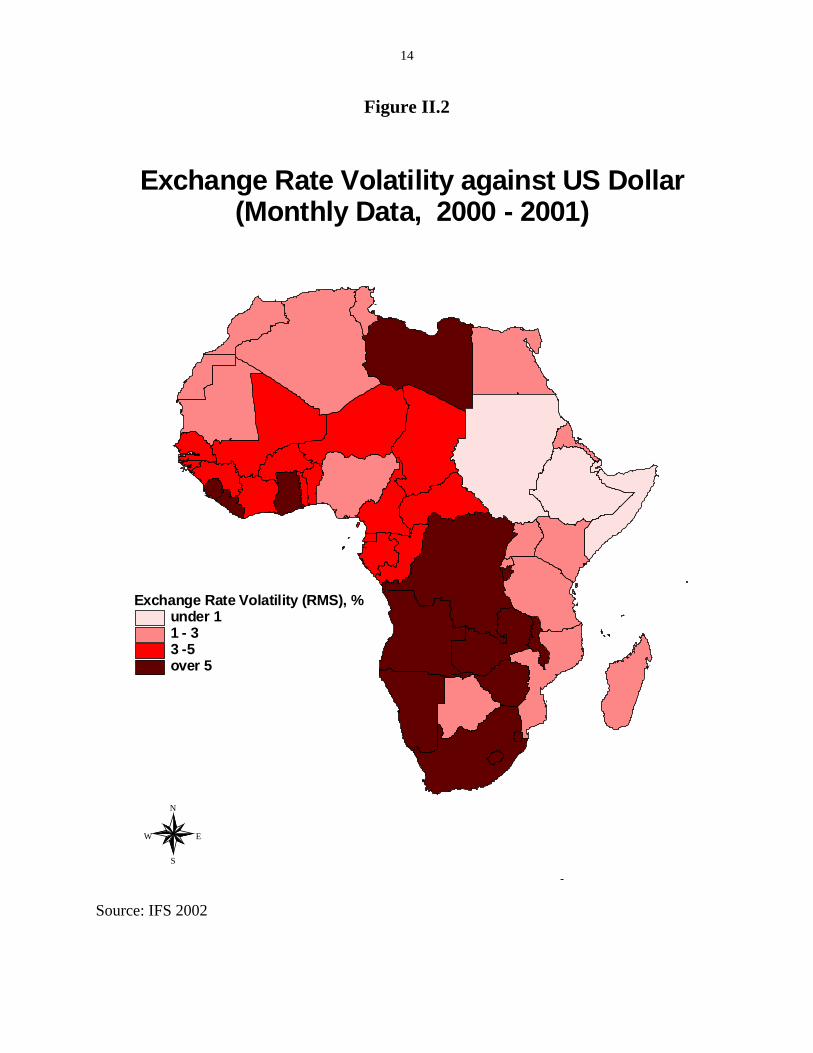
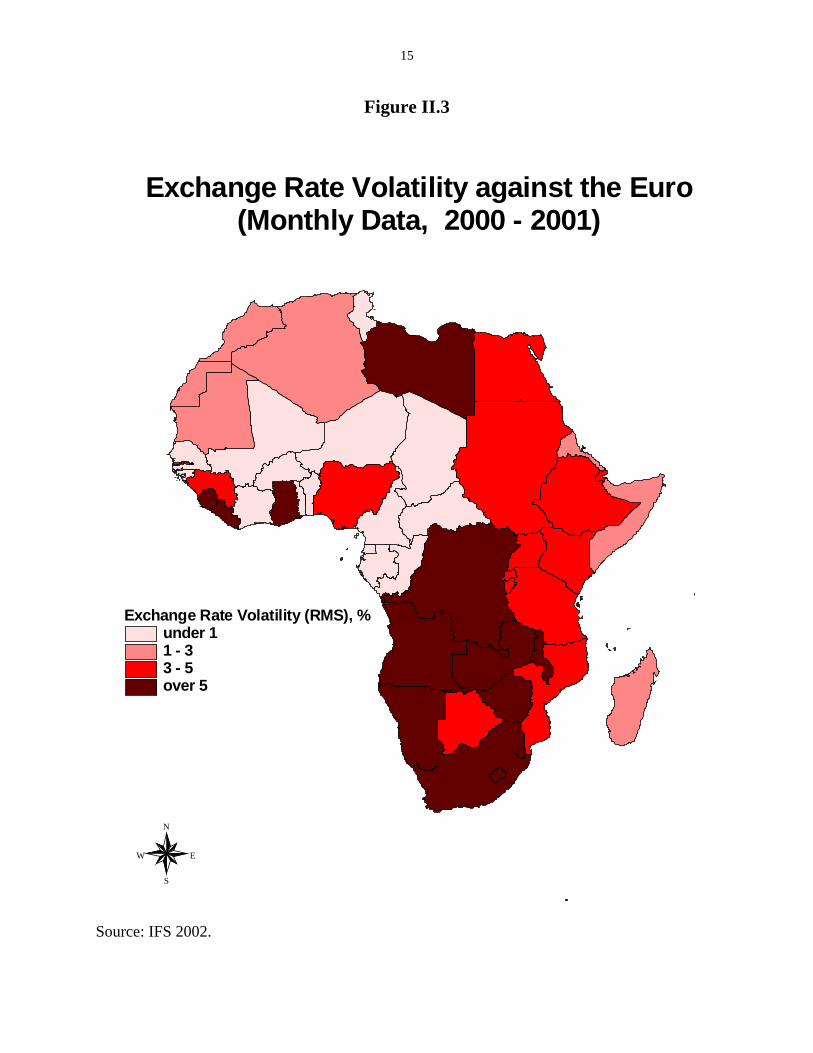
Second, payments restrictions needed to prop up pegged exchange rates in environmentswhere fiscal discipline did not exist and inflation resulted in a continual decline incompetitiveness were seen to produce widespread inefficiencies. In particular, exchangecontrols and rationing of foreign exchange opened up widespread opportunities for corruptionand distortions across sectors. As a result of this realization and pressures from official lenders,African countries moved to liberalize their international payments and to give greater weight tomarket forces in the determination of their exchange rates. Many countries therefore moved togreater exchange rate flexibility, though not to free floating, either abandoning exchange rateparities or allowing greater fluctuations around them. As a result, in 2001 most countriesexhibited substantial exchange rate volatility against the two most important reserve currencies,the dollar and the euro (Figures II.2 and II.3, respectively). Countries’ experiences in managingindependent currencies is analyzed in a Chapter V.
The principal exception was constituted by the countries of the two CFA franc zones, theWest African Economic and Monetary Union and the Central African Economic and MonetaryCommunity. As indicated on Figure II.3, the two CFA francs are perfectly stable against theeuro (at a rate of 655.967 CFAF=1 euro), and have been since the introduction of the latter onJanuary 1, 1999, at which time the euro replaced the French franc as the anchor for the Africancurrency.14
The official exchange rate classification published by the IMF to some extent reflects thisreality, as a majority of African countries in 2001 practiced either “managed floating” or“independent floating”—26 out of 49 countries (see Table II.1). Aside from the countries of theCFA and CMA zones (excluding South Africa, which as the anchor of the CMA was classifiedas independently floating against the rest of the world), few African countries had hard pegs orcurrency board arrangements (only Botswana, which pegs to a basket, Djibouti, Eritrea, Libya,Morocco, Seychelles, and Zimbabwe). Only one country, Egypt, was classified as having a“pegged exchange rate with horizontal bands.”
An alternative classification created by Levy-Yeyati and Sturzenegger (2002) on thebasis of the actual behavior of exchange rates and reserves broadly supported the existence ofintermediate and floating rate regimes, albeit with some differences with respect to some of thecountries officially declared as peggers (see Table II.1). A different classification scheme alsobased on observed behavior is provided by Reinhart and Rogoff (2002). They classify mostcountries as pegging to the euro (principally the CFA franc zone countries) or to the rand; havinga de facto peg, crawling or not, with respect to the euro or the dollar; or having managedfloating. Only three countries at end-2001 are free floaters, namely Madagascar, South Africa,and Zambia, while a novel category that applies to some flexible rate countries in earlier periodsis “freely falling,” for instance Nigeria during 1991-96 and Zambia from 1985 to August 2001.
The third major event is the creation of the euro, which is likely to have furthersignificant repercussions for Africa and influence on the evolution of exchange regimes in thefuture. The peg to the euro provides both a potentially more stable anchor for African currencies
14 As a result of an agreement reached in March, 1998, Cape Verde is also linked to the euro at a fixed parity, withthe convertibility of the Cape Verde escudo guaranteed by Portugal (Alibert, 1999).

12
than a peg to the French franc (because the euro is based on a larger, and more economicallydiversified, geographic area), and it insulates a greater fraction of African trade from exchangerate fluctuations. In addition, the successful launch of the euro has stimulated interest elsewherein monetary unions, including in Africa. We will discuss in later chapters whether that renewedinterest is warranted, and also review in Chapter IV the experience of the two existing monetaryunions in Africa, the CFA and CMA zones.
The experience with African monetary unions in the post-colonial period underscores theimportance of political forces in leading to their dissolution or, in the case of the Frenchinvolvement with the CFA franc zone, in encouraging their continued existence. Either a strongshared commitment to regional integration in its various dimensions or a hegemonic powerwilling to support other members seem to be essential for the durable success of a monetaryunion. Whatever the economic costs and benefits, therefore, and in the absence of an externalguarantor or hegemonic power, political solidarity among member countries will be crucial tomake a success of current projects for monetary union. The continued episodes of regionalconflict suggest that the bases for such solidarity do not seem to exist among many of thecandidates for regional monetary integration in Africa—but the same could have been said ofEurope in the immediate post-war period.
13
Figure II.1
N
EW
S
Currency areas in 1964
Currency AreasFranc ZoneOther FrancSterling areaSterling Territories
Source: Mladek, J.V. 1964a.,1964b.
14
Figure II.2
Exchange Rate Volatility (RMS), %under 11 - 33 -5 over 5
N
EW
S
Exchange Rate Volatility against US Dollar(Monthly Data, 2000 - 2001)
Source: IFS 2002
15
Figure II.3
Exchange Rate Volatility (RMS), %under 11 - 33 - 5over 5
N
EW
S
Exchange Rate Volatility against the Euro(Monthly Data, 2000 - 2001)
Source: IFS 2002.
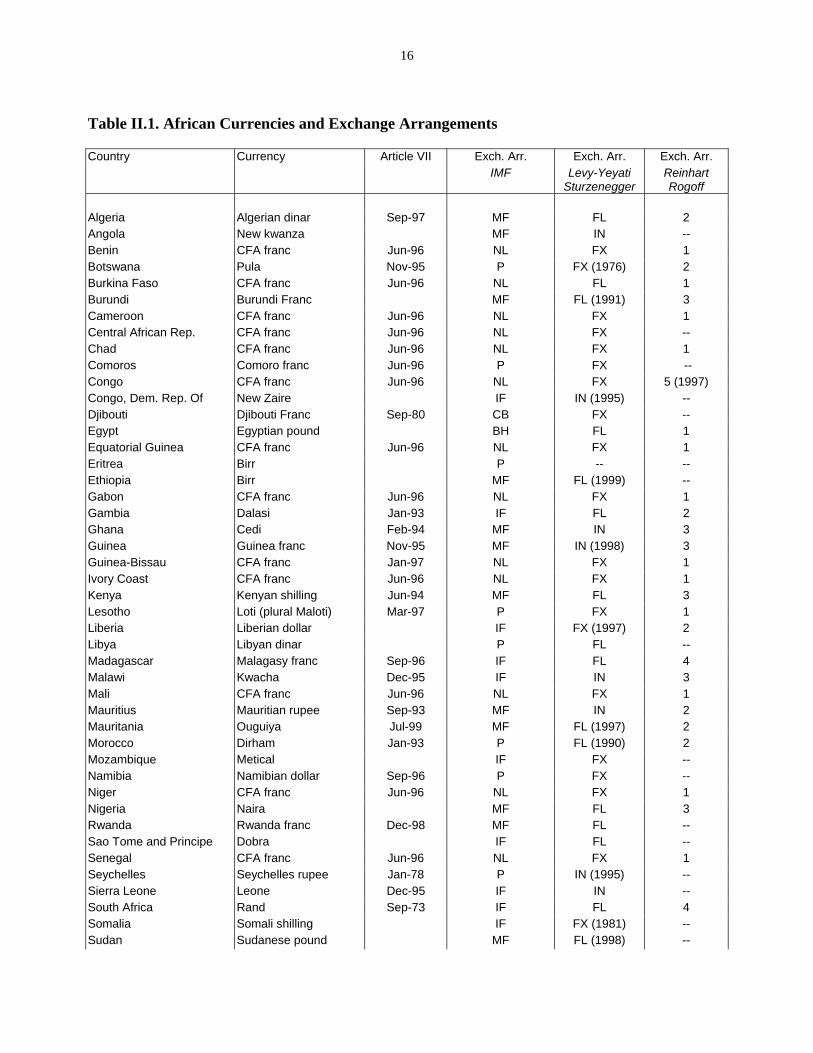
16
Table II.1. African Currencies and Exchange Arrangements
Country Currency Article VII Exch. Arr. Exch. Arr. Exch. Arr.IMF Levy-Yeyati
SturzeneggerReinhartRogoff
Algeria Algerian dinar Sep-97 MF FL 2Angola New kwanza MF IN --Benin CFA franc Jun-96 NL FX 1Botswana Pula Nov-95 P FX (1976) 2Burkina Faso CFA franc Jun-96 NL FL 1Burundi Burundi Franc MF FL (1991) 3Cameroon CFA franc Jun-96 NL FX 1Central African Rep. CFA franc Jun-96 NL FX --Chad CFA franc Jun-96 NL FX 1Comoros Comoro franc Jun-96 P FX --Congo CFA franc Jun-96 NL FX 5 (1997)Congo, Dem. Rep. Of New Zaire IF IN (1995) --Djibouti Djibouti Franc Sep-80 CB FX --Egypt Egyptian pound BH FL 1Equatorial Guinea CFA franc Jun-96 NL FX 1Eritrea Birr P -- --Ethiopia Birr MF FL (1999) --Gabon CFA franc Jun-96 NL FX 1Gambia Dalasi Jan-93 IF FL 2Ghana Cedi Feb-94 MF IN 3Guinea Guinea franc Nov-95 MF IN (1998) 3Guinea-Bissau CFA franc Jan-97 NL FX 1Ivory Coast CFA franc Jun-96 NL FX 1Kenya Kenyan shilling Jun-94 MF FL 3Lesotho Loti (plural Maloti) Mar-97 P FX 1Liberia Liberian dollar IF FX (1997) 2Libya Libyan dinar P FL --Madagascar Malagasy franc Sep-96 IF FL 4Malawi Kwacha Dec-95 IF IN 3Mali CFA franc Jun-96 NL FX 1Mauritius Mauritian rupee Sep-93 MF IN 2Mauritania Ouguiya Jul-99 MF FL (1997) 2Morocco Dirham Jan-93 P FL (1990) 2Mozambique Metical IF FX --Namibia Namibian dollar Sep-96 P FX --Niger CFA franc Jun-96 NL FX 1Nigeria Naira MF FL 3Rwanda Rwanda franc Dec-98 MF FL --Sao Tome and Principe Dobra IF FL --Senegal CFA franc Jun-96 NL FX 1Seychelles Seychelles rupee Jan-78 P IN (1995) --Sierra Leone Leone Dec-95 IF IN --South Africa Rand Sep-73 IF FL 4Somalia Somali shilling IF FX (1981) --Sudan Sudanese pound MF FL (1998) --
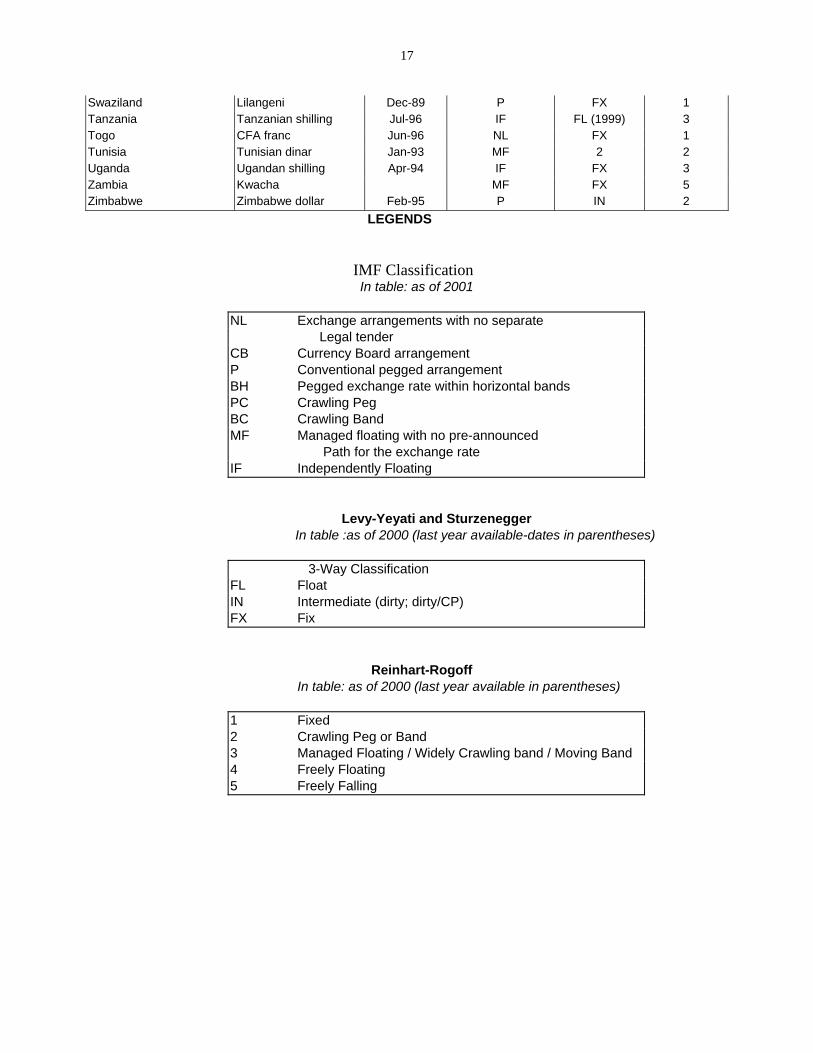
17
Swaziland Lilangeni Dec-89 P FX 1Tanzania Tanzanian shilling Jul-96 IF FL (1999) 3Togo CFA franc Jun-96 NL FX 1Tunisia Tunisian dinar Jan-93 MF 2 2Uganda Ugandan shilling Apr-94 IF FX 3Zambia Kwacha MF FX 5Zimbabwe Zimbabwe dollar Feb-95 P IN 2
LEGENDS
IMF Classification In table: as of 2001
NL Exchange arrangements with no separate Legal tender
CB Currency Board arrangementP Conventional pegged arrangementBH Pegged exchange rate within horizontal bandsPC Crawling PegBC Crawling BandMF Managed floating with no pre-announced
Path for the exchange rateIF Independently Floating
Levy-Yeyati and SturzeneggerIn table :as of 2000 (last year available-dates in parentheses)
3-Way ClassificationFL FloatIN Intermediate (dirty; dirty/CP)FX Fix
Reinhart-RogoffIn table: as of 2000 (last year available in parentheses)
1 Fixed2 Crawling Peg or Band3 Managed Floating / Widely Crawling band / Moving Band4 Freely Floating5 Freely Falling
1
10/2/03
Chapter III. Economic and Political Criteria for Currency Unions or the Adoption ofAnother Currency
The issue of the choice of a currency regime, and in particular whether to adopt acommon currency in the context of regional integration, has received much attention over thepast four decades—stimulated greatly by the plan to create the euro zone in the EU. Itssuccessful launch helps explain the current interest in other regions, in particular Africa, formonetary unions. Despite the extensive analysis that monetary unions have received in theeconomics literature and some agreement on the factors that would produce costs and benefits,there is no consensus even among economists on whether the benefits outweigh the costs whenconsidering a particular region—much less a general presumption that monetary unions arenecessarily a good thing.1 Despite this, there is considerable political support for the idea, oftenin the context of a desire to further regional solidarity, which suggests that the economicliterature has not paid sufficient attention to the political dimension. In addition, we will arguebelow that some of the existing literature is less applicable to Africa than to Europe, because offundamental problems of lack of central bank independence and fiscal distortions leading tooverspending and pressures to monetize deficits.
The economics literature on optimum currency areas, which derives in large part from theseminal article by Robert Mundell (1961), has already been much surveyed, so we will onlybriefly discuss it in the section that follows (section A). In a nutshell, a common currency cansave on transactions costs of various types, but a country in abandoning its own currency givesup the ability to use monetary policy to respond to asymmetric shocks, that is to shocks whichaffect it differently from the other countries in the union. Those costs, in turn, can be minimizedby greater flexibility of the economy, in particular labor mobility, wage/price flexibility, andfiscal transfers; and the likelihood of asymmetric shocks depends inversely on how diversified acountry’s economy is and how similar its production and export structures are relative to itspartners in the monetary union.
The analysis when applied to Europe has usually assumed that institutional design issueshave by and large been resolved. In particular, the central bank can be insulated by statute fromhaving to finance government spending (in Europe, this is ensured by a no-bailout provisionpreventing the central bank from lending to governments, buttressed by a history of central bankindependence, particularly in Germany). The main danger is that fiscal policy may indirectly putpressures on monetary policy; for instance, if a country got into trouble servicing its debt, thecentral bank might be led to ease monetary policy to lower the treasury’s interest costs andprevent a financial crisis. The Stability and Growth Pact was aimed at minimizing that danger inEurope. Though there is considerable controversy at present about the effectiveness of the Pact,and several governments are in danger of breaching the deficit ceiling (3 percent of GDP), thereis no immediate concern that the ECB’s independence is being put in peril.
In Africa, however, the institutional challenges are at least an order of magnitude greater.Existing national central banks are generally not independent, and countries with their own
1 This is in contrast to the sweeping statement by John Stuart Mill that separate currencies are a form of “barbarism”and that the common interest would require moving to a single, world currency. While there are some supporters ofthis view (e.g. Cooper, 1987), it is certainly not generally held at present.
2
currencies have often suffered periods of high inflation because those central banks have beenforced to finance public deficits. Hence the interest in the African context in whether thecreation of a regional central bank can be a vehicle for solving pre-commitment and credibilityproblems that bedevil existing central banks. If so they may be able to provide an “agency ofrestraint” (in Paul Collier’s words), producing a central bank that is more independent and thatexerts greater discipline over fiscal policies than do national central banks. We consider thisquestion in Section B.
A further important motivation for monetary union in Africa is to provide impetus forgreater regional integration. Monetary union is often seen as an important symbol of regionalsolidarity, one that is likely to reinforce popular (and hence political) support for regionalinitiatives. In Europe, that aspect was important, but the implementation of monetary union(envisioned already some 40 years ago) followed, rather than preceded, deep structuralintegration, the creation of other regional institutions, and experience of close inter-governmentalcooperation. We discuss this issue in Section C, noting that a common currency that is notsupported adequately by institutions and by regional solidarity may fail, and this would harm, nothelp, other regional integration initiatives. There are examples of this, including the ruble zoneat the dissolution of the Soviet Union and the monetary union in the East African Communityshortly after independence. Thus we argue that it is unrealistic to assume that creating acommon currency will necessarily enhance integration. On the contrary, a strong politicalcommitment to common regional goals and the presence of other economic institutions thatmake sticking with the monetary union in every country’s interest are necessary to ensure itssuccess and continued existence.
In Section D, we describe a formal model based on our previous work that serves as thebasis for evaluating monetary projects in later chapters of the book. It integrates the idea ofasymmetry of shocks with the absence of institutions able effectively to insulate the central bankfrom pressures to finance deficits and to produce over-expansionary monetary policies. Thoughmonetary unions reduce somewhat the bias towards monetary expansion (because, by fixing theexchange rate between countries in the monetary union, they reduce the scope for competitivedevaluations), the composition of the monetary union is crucial. Not only would a country notwant to join in a monetary union with another country that faced very different external shocks(e.g. to its terms of trade)—at least if that country was large enough to matter--it would also notwant to link to a country that had much less disciplined fiscal policies. The latter country wouldcause the central bank to produce higher inflation, and this would have adverse consequences onthe first country’s welfare. Measuring fiscal discipline is difficult, but we attempt to do so usingmeasures of institutional development and of absence of corruption. In Africa, as described inthis section, countries with their own monetary policies tend to suffer from higher inflation, thelower they score on these measures that proxy for diversion of spending and taxes to purposesthat do not reflect social needs but rather the private objectives of the government in power(through tolerance of corruption and rewarding of supporters, for instance). Though we focus inwhat follows on fiscal distortions and shock asymmetries, we do not neglect political factors,which we highlight as important influences on the potential success or failure of monetary unionprojects—a point forcefully made by Benjamin Cohen (2000).

3
The Appendix provides some more details concerning the model and its calibration,forming the basis for its application in subsequent chapters.
A. Optimum Currency Areas2
If there were no nominal frictions, so that wages and prices were perfectly flexible, thenit would surely be optimal from an economic perspective to have but a single, world currency.But for various reasons, however, there is stickiness of wages and prices, which opens the doorfor monetary policy to have a significant effect on economic activity. This stabilization role formonetary policy in the face of shocks to the domestic economy is all the more valuable, thegreater is the magnitude of those shocks and the less important are other available shockabsorbers.
Mundell in 1961 emphasized labor mobility as the key shock absorber that couldcompensate for lack of flexibility of prices and a fixed exchange rate. When the region wherethey lived was hit by a negative shock, workers could migrate to regions that had betteremployment prospects. Thus, an “optimum currency area” would exhibit high labor mobilitywithin the area, and relatively low labor mobility outside it. Others (e.g. Kenen, 1969) suggestedthat financial transfers could also provide a shock absorbing role: income losses could bepartially offset by payments from areas that were relatively favorably affected. There is aconsiderable literature examining the role of federal taxes and spending in compensating forasymmetric shocks in existing federations (e.g. Sala-I-Martin and Sachs, 1992; Bayoumi andMasson, 1995). Since multi-national monetary unions would typically not provide for suchfinancial transfers, or at least not to the extent of fiscal federations, they would need other formsof flexibility if faced with large asymmetric shocks.
The optimum currency area approach to the cost benefit analysis of monetary unionsemphasizes three key factors that need to be quantified:
• Potential losses from membership in a monetary union depend on the extent that acountry faces large shocks that are asymmetric, that is differ from those of potentialpartners in the monetary union. If all countries faced the same shocks (and wereaffected in the same way by them), then a common monetary policy would beoptimal.
• Potential gains depend on the saving of transactions costs that are incurred bychanging currencies, and these transactions costs are larger, the greater is actual orpotential trade between the countries (Frankel and Rose, 1998). Countries that wouldnot benefit from trade would not gain from using the same currency. However,currency union may in itself stimulate an increase in trade (Rose, 2000).
• The losses are mitigated by the extent that other shock absorbers exist, in particularfactor mobility and financial transfers. Asymmetric shocks would not be a seriousproblem for a monetary union if economies were sufficiently flexible.
The above three factors have formed the basis for much of the discussion of the costs andbenefits of monetary union in Europe and in other regions. In Europe, the gains were seen to besignificant given the extent that EU countries trade among themselves. Moreover, losses due to
2 There are many good surveys of the literature. A recent one containing an extensive bibliography is Hawkins andMasson (2003).

4
asymmetric shocks, at least for most EU countries, were considered relatively small, given thesimilarity of their economies (diversified manufacturing and services sectors, relatively lowdependence on commodity exports)3. Other shock absorbers are widely recognized to be presentin only very limited form: labor mobility is low, fiscal transfers through the EU budget are small(and not linked to asymmetric shocks) but countries perform stabilization policy effectivelythrough national fiscal policies (Bayoumi and Masson, 1995).
In Africa, as we will discuss in subsequent chapters, the scope for significant gains andthe factors attenuating losses are much reduced. Asymmetric shocks are in many cases likely tobe more important: countries are often dependent on only a few export commodities, whoseprices do not move together; intra-regional trade is low, so the scope for saving on transactionscosts is limited; and the availability of shock absorbers such as labor mobility and financialtransfers is inhibited by ethnic conflicts and a general lack of financial resources. This generallynegative assessment of monetary unions leads us to consider other arguments that go beyond theoptimum currency area approach.
B. Credibility and an Agency of Restraint
Losing the ability to use monetary policy is not worrisome if the latter is an instrumentthat is in any case misused. On the contrary, a new regional central bank might be able toproduce a better monetary policy because it was more independent of any particular government.In turn, this independence might force greater discipline on fiscal policies, that is, provide an“agency of restraint” for them. In this section we review the arguments for and against this view.
Some have argued, for instance Hausman et al. (2001) for Latin America, that thetheoretical advantage of having monetary policy in reserve to offset asymmetric shocks is inpractice not worthwhile. They argue that instead of offsetting asymmetric shocks, monetarypolicy has typically just produced inflation, no doubt because of absence of effective centralbank independence and because of lack of public support for low inflation. Hence tying thehands of the monetary authorities would be a good thing. One way of doing so would be toconstrain monetary policy in the context of a monetary union.
The experience of African countries with independent currencies is discussed below, inChapter V. These countries have not, with a few exceptions, been notably successful inapproximating price stability, and it is doubtful whether monetary policy changes that occurredwere optimal responses to asymmetric shocks. Instead, in many countries monetary policy hasbeen dictated by the need to finance fiscal policy. In the absence of central bank independenceand of debt markets where governments could finance themselves, persistent deficits have led toexcessive money creation, as governments have used seigniorage to plug the gap betweenexpenditure and taxes.
A monetary union with a regional central bank might avoid this pitfall. Each country inthe union would have less influence over the actions of the central bank than they would have ina national setting; this could enhance the central bank’s independence and its ability to resistpressures to provide monetary financing. No longer able to obtain seigniorage revenue on
3 Nevertheless, even in Europe there was considerable disagreement on whether EMU would produce net gains, andthe issue remains open for the EU countries not yet members. See, for instance, UK Treasury (2003).
5
demand, governments would bite the bullet and tailor their spending to their revenues (or if theyborrowed, they would be subject to the discipline exerted by financial markets).
Experience contradicts this sanguine assessment. The CFA franc zone has two regionalcentral banks, yet the independence of the two central banks was compromised in the 1980s bylarge countries bypassing limits on monetary financing through borrowing by state-owned banks(Guillaume and Stasavage, 2000). This led to a serious economic downturn and a banking crisis,culminating in the 1994 devaluation. Since then, both WAEMU and CAEMC have attempted toput in place additional institutional mechanisms to reinforce fiscal discipline. On its own,monetary union is unlikely to ensure that a regional central bank will be able to resist pressuresfor monetization.
Though the weaknesses of existing national central banks make it natural to envisioncreating new institutions, there is no guarantee that a regional central bank would do better.Regional development banks and public investment funds in Africa have sometimes been viewedas just another opportunity for capturing rents or funneling revenues. Hence, design of adequatesafeguards is key. We have argued elsewhere in the context of West Africa (Masson andPattillo, 2002), that it is essential to complement a well-designed institutional framework for thecentral bank with regional surveillance over fiscal policies that includes sanctions on thosegovernments that run excessive deficits. This conclusion has, we would argue, general relevanceto the continent.
In Europe too, despite greater institutional development and a longer historical record ofmacroeconomic stability, the project of monetary union was attractive in part because it built onthe monetary institution with the greatest reputation for monetary rectitude—the GermanBundesbank. African countries may not be able to benefit from as credible a model, but shouldin any case attempt to use what credibility exists rather than rely on the presumptive credibilitygains that might accrue to an untried institution. The two existing monetary unions, the CFAfranc zone and the CMA, discussed in Chapter IV below, because they have track records ofstability and institutional development, are likely to be more credible than de novo monetaryunions.
C. Will Monetary Union Enhance Regional Integration and Solidarity?
As mentioned above, monetary unions are often favored by politicians because they are asymbol of regional solidarity. It is believed that the creation of such a symbol may bring aboutforces that lead to stronger regional linkages in other areas too—creating a virtuous circle ofcloser integration. For instance, monetary union could increase trade, lead to harmonization offiscal policies, and integrate financial markets. In turn, these changes would increase the netbenefits from having a common currency.
In fact, monetary unions (surveyed in Masson and Pattillo, 2001), display very differentdegrees of integration in other areas. The Eastern Caribbean Currency Union has nocoordination of fiscal policies, low trade between member countries, and no harmonization ofcapital controls. Even the CFA franc zone, despite a history extending more than 50 years,exhibits little financial integration, as banking systems tend to be segmented and regionalfinancial markets rudimentary. Coordination of fiscal policies emerged in earnest only followingthe 1994 devaluation, which brought home to leaders the deficiencies of the existing system.
6
An influential recent paper (Rose, 2000) offers empirical evidence in support of thecontention that membership in a currency union should increase intra-regional trade by a factorof about 3. We revisit that evidence in the African context in Chapter IV, for the two existingmonetary unions (the CFA franc zone and the CMA), and provide some support for Rose’sestimates. This enhances the advantages of forming monetary unions in Africa. Even if thatestimate is accepted, however, the fact remains that given low per capita income andconcentration on primary commodity exports, it is likely that trade within African regionalgroupings will remain small relative to trade with Europe or Asia.
In Europe the debate over whether creation of the monetary union should precede otherforms of integration or rather come later, “crowning” the successes in other fields, was resolvedin favor of the latter position. It was felt that the dangers of introducing monetary union whencountries were not sufficiently integrated for them to form an “optimum currency area”outweighed the symbolic value of its early creation. Other regions illustrate the possibility thatan inadequately designed monetary union or one with insufficiently committed countries mayharm, not help, the cause of regional integration. This was the case for the ruble zone at thebreakup of the Soviet Union and for the monetary union based on the East African shilling,which broke down as the EAC member countries attempted each to extract seigniorage at theexpense of the others (Masson and Pattillo, 2001).
Though the goal of African unity receives much lip service, the reality in Africa is muchdifferent. Countries that are members of the same regional organization whose goal is to achievethe closest form of integration are often engaged in overt or covert warfare through supportingrebel groups. Examples include conflicts in Sierra Leone, Liberia, Cote d’Ivoire, Rwanda, theD.R. of the Congo, Angola, and the Sudan. As mentioned above, hostilities among membergovernments helped to sink the East African Community. The ideal that the existence of amonetary union could effectively curb warlike impulses is dubious. At most, the stabilityafforded by a common currency could dampen the negative economic effects of civil conflicts.But it seems likely that in the end, hostility between members of a monetary union would simplydestroy it. The prospects for a single African currency, which is the goal of the African Union,are discussed in Chapter IX below.
This is not to deny that political objectives are important to the formation of monetaryunions, but rather to argue that rhetoric and reality need to be aligned. As we saw in Chapter II,the continued existence of Africa’s monetary unions—the CFA franc zone and the CMA—is duein large part to the perceived political self-interest of the major power—France in the formercase and South Africa in the latter. While economic advantage may be part of the story, otherfactors were at least as important: security and regional/global influence. As Cohen (1998)notes, the commitment of a hegemonic power is often a precondition for making a monetaryunion work.
D. An Augmented OCA Model with Fiscal Distortions
The model that we use to analyze monetary union is described in fuller technical detail inprevious papers with Xavier Debrun (Debrun, Masson, and Pattillo, 2002, 2003). It is based onthe optimum currency area literature, which focuses on asymmetries of shocks, but furtheridentifies another important asymmetry, political distortions affecting fiscal policy decisions.The model focuses on the monetary impact of country-specific differences in preferences overthe size of the government and differences in distortions (political or structural) affecting fiscal

7
policy (either through tax collection costs, spending diversion, or corruption). The regionalcentral bank is assumed not to be fully independent, but to set monetary policy to reflect averageconditions (including fiscal deficits) in the region. As a result, countries that were very differentwith respect to the fiscal distortion would be unattractive partners for a monetary union, becausethe central bank would produce undesirable outcomes for one or both of them.
In particular, it is assumed that policymakers manipulate fiscal policy to serve their ownprivate objectives. The political distortion is modeled as a wedge between the true sociallyoptimal level of public expenditure (reflecting the population’s demand for public goods in thecountry) and the level targeted by the government. We posit that the government’s spendingtarget exceeds the social target by the amount of public resources policymakers wish to devote tothe exclusive benefit of themselves and their supporters. For instance, ministers maysystematically hire too many civil servants among their constituents to provide a given service tothe general public, and approve spending on “white elephants” and wasteful infrastructureprojects. This shows up as higher spending than is socially desirable. This political distortionadds a source of divergence among states that is highly relevant in the African context.
Central banks have two incentives to generate inflation. On the one hand, since they arenot independent of the government, they reflect the trade-off that society perceives between thecosts of tax distortions and inflation. On the other hand, following the insight of Barro andGordon (1983), they have incentives to stimulate output by monetary expansion (see Jensen 2003for a modern reinterpretation). We extend their model along the lines of Martin (1995), toencompass another effect of monetary expansion—namely depreciation relative to tradingpartners, increasing exports (in Martin, this works through direct investment). Systematicallyusing monetary policy to stimulate output, however, is self-defeating, as individuals and firmsanticipate the higher inflation and economic activity does not rise. Instead, only inflation ishigher, and the exchange rate depreciates continually. Hence, the resulting equilibrium is sub-optimal even from the standpoint of the distorted objectives of the government. Thegovernment’s decision to join a monetary union will depend on the whether the new regimemoves the economy closer to the government’s optimum. Monetary union reduces the centralbank’s incentive to expand monetary policy because the scope for depreciating the currencyagainst neighboring countries is eliminated, as they share the same currency. However,asymmetries (both of shocks and of fiscal policy distortions) can still be a serious problem thatproduce a welfare loss relative to an independent currency.
We restrict our analysis to a comparison of two benchmark regimes. Under the firstregime (autonomy), each country simultaneously sets monetary and fiscal instruments,considering its neighbors’ decisions as given. This (Nash) conjecture implicitly assumescomplete discretion and flexible exchange rates. Under the second regime (monetary union),fiscal policies remain under the responsibility of national authorities while monetary policy isunder the control of a central bank that maximizes a weighted sum of member states’ objectivefunctions, leading to the same inflation rate for all the member states. Again, there is no reason tobelieve that a commitment device would be available to the supranational central bank, so that itcontinues to internalize the incentives of the member governments proportionally to their weightin the union. However, the big difference with respect to monetary autonomy is that a singlegovernment now has a limited impact on joint decisions. Moreover, conflicting demands bydifferent member states may cancel out to the benefit of all.
8
The properties of the model regarding the incentives to form a regional currency unioncan be summarized as follows. Those general properties reflect the fact that, as alreadymentioned, the gains from monetary unification depend on the ability of the new regime toaddress the excessive inflation problem and the implications of the latter on fiscal strategies.
First, if all countries in the region were identical and subject to the same shocks, then acurrency union including all countries would be desirable for all. In such a configuration, the lossof monetary autonomy does not entail any cost since, in line with the OCA literature, thecommon monetary policy optimally corresponds to everyone’s needs. Moreover, all countriesbenefit from lower inflation because the common central bank internalizes the beggar-thy-neighbor effect of autonomous policies. In that sense, it is spontaneously more “conservative”than a national central bank because the regional central bank cannot exploit the competitivedevaluation channel that is available to national central banks. Hence, monetary unificationserves as a partial surrogate for the credible appointment of a conservative central banker. As acorollary, the gains from monetary unification tend to increase with the seriousness of theinflationary bias, which itself positively depends on the degree of regional trade integration. Inother words, all other things being equal, a group of high-inflation countries would expect togain more from monetary unification than a group of low-inflation countries.
Second, structural cross-country differences (i.e. differences in size, political distortionsor social spending targets) do not necessarily reduce the net gains from monetary unification forall member states. On the one hand, differences in governments’ spending targets are a source ofcost because the union-wide inflation rate will only by chance coincide with a country’s desiredtrade-off between seigniorage and tax revenues. On the other hand, differences in spendingtargets may also be a source of gains depending on the country’s position in the distribution ofspending targets. More specifically, a government with a relatively high spending target may getadditional benefits from participating in a monetary union with more fiscally conservativeneighbors (i.e. countries with lower spending targets) because the latter will exert restrainingpressures on the central bank. From the point of view of big spenders, that “imported” monetaryrestraint represents an extra disciplinary benefit that partly addresses the inflationary bias theyface under autonomy. By contrast, the small spenders will incur additional losses stemming fromthe excessive demands of the big spenders for monetary financing, pushing them further awayfrom the low inflation equilibrium. As the model assumes that the pressure exerted by a countryon the central bank is proportional to its size, the country-sizes and spending targets are criticalinfluences on the feasibility of monetary unions: countries with low fiscal distortions will notagree to a monetary union with large undisciplined neighbors.
Third, the model captures the essence of the OCA theory with respect to asymmetricshocks. It assumes that the union-wide inflation target of the common central bank will onlyaccommodate the common component of supply disturbances, that is the average shock acrossthe countries in the union. In our empirical work, these shocks are identified with terms of tradedisturbances, consistent with much evidence of developing countries’ vulnerability to theselargely exogenous shocks. The fact that the central bank cannot tailor its monetary policy todifferent shocks facing each country makes abandoning an independent monetary policy in theface of country-specific shocks costly, and underscores the role of the joint distribution of supplydisturbances in influencing feasible monetary unions.
The calibration of the model to African data is described in the Appendix to this chapter.Essentially, we use the available data for 1995-2000 on African countries’ government revenue,

9
spending, and inflation to fit the model and estimate its parameter values. The comparison ofoutcomes for these variables across countries with independent currencies and those in monetaryunions helps pin down the disciplining effect of a common currency (through its reduction of thetemptation to produce inflation and depreciation). Though limited by data problems, the resultsof this exercise are broadly supportive of the model. Inflation depends positively andsignificantly on the size of spending targets, and negatively on the extent of trade that is internalto the monetary union. Thus, this empirical application of the model to historical data gives ussome confidence that it may shed some light on the economic advantages of monetary unionprojects. We recognize that this leaves open some of the political motives behind these projects,and we discuss them on a case-by-case basis in the chapters that follow.

10
Appendix: Calibration of the Model
The main elements of the model (described in Debrun, Masson, and Pattillo, 2002,abbreviated DMP) are a Barro-Gordon supply equation or expectations-augmented Phillips curveextended to include international spillovers from neighbors’ monetary policies; the government’sbudget constraint; and an assumed objective function for the government. Governments exertcontrol over the central bank, so that the former jointly chooses the monetary and fiscal policyinstruments to maximize an objective function that depends linearly on higher output, andnegatively on squared deviations of inflation from a target that reflects supply shocks, ofgovernment spending from its target, and of tax rates. In a monetary union, the central bank isassumed to maximize a weighted average of the member countries’ objective functions (whereweights reflect relative GDP), while each government chooses its own fiscal policy. In eachcase, governments satisfy a one-period budget constraint that forces spending to be financedeither by taxes or by the country’s share of seigniorage (again, in a monetary union this isassumed to be divided up using GDP shares).
The building blocks of the model are thus the following equations:
Supply equation
( ) ( ) i
n
kik
ekkkii
eiii ccy εππθτππ +−−−−= ∑
=≠ 1,, , ni ,...,1= (1)
where y is output, τ a tax rate, π is inflation, and ε a supply shock.
Government budget constraint
iiig τµπ += (2)where ig is the ratio of government spending to GDP and µ is the inflation tax base.
Government Objective function
(3)
where ~~
, gπ are targets for inflation and government spending, respectively.
A monetary union affects the scope for monetary expansion to stimulate output, since onechannel for its effect, namely depreciation of the exchange rate, is limited because countriescannot depreciate against other members of the union. Thus, the proportion of trade that isinternalized by the monetary union is an important parameter: the greater it is, the lower is theincentive to stimulate output beyond its potential through monetary expansion. As in the Barro-Gordon model, this temptation is self-defeating since its systematic use produces needlessinflation without stimulating output. However, we retain a stabilization role for monetary policy,so that there is some value to retaining monetary policy discretion—it is not always better to tie
( )( ) ( ){ } iiiiiiGi yggbaU +−−−−−= 222~
21 γτεππ ~

11
the hands of the monetary authorities, as in a monetary union. Secifically, we assume
ηεεπ −=)(~
, i.e, that the inflation target is affected by the supply shock.
A key linkage in the model is the effect of spending targets on inflation and taxes, sincehigher spending needs to be financed one way or the other. Membership in a monetary unionmoderates the influence of a country’s spending target on inflation relative to having anindependent currency. In reality, spending (as ratio to GDP) differs across countries for variousreasons. Countries with higher per capita incomes can generally afford to offer moregovernment services, as both revenues and spending rise in tandem, and this component causesno problem for inflation. Thus, we estimate the relationship to per capita income of spendingand revenues together, and evaluate spending at an average level of per capita GDP (across allAfrican countries in our sample). However, a second force tending to increase spending targetsis the attempt by governments in power to reward their supporters—that is, it is a symptom ofcronyism or corruption. We argue that this component of spending targets is a form ofdistortion; moreover, it is unlikely to be matched by higher tax revenues so that it would putpressure on the central bank to generate higher inflation and seigniorage.
The model implies that inflation π and tax revenues τ (as a ratio to GDP) will bedetermined differently in countries with independent currencies compared to those that aremembers of a monetary union. In particular, we can summarize the model as
AiAiAiibabbgb εγηθγµγγµπΛ
+−Λ+−
Λ+++
Λ= )()1(~
(4)
AiAiAiiiiaagg
bbga εηγµθγµµγµ
γµγγτ
Λ+
Λ+
Λ++−−
Λ++
Λ= )1()(
)(
~~22~ (5)
where ~
ig is country i’s own spending target, ~
Aig is the average over the spending targets for the
monetary union of which i is a member (and equal to ~
ig for a country not in a monetary union),
Aiθ is the proportion of trade internalized by the monetary union (equal to zero for a country notin a monetary union), Aiε is the average over the supply shocks in the monetary union (or thecountry’s own shock, if not in a monetary union), ηµγ ,,,,ba are positive parameters, and
( ) 02 >++=Λ bba γµγ . We use the two equations above to derive the parameter values, notingthat the third term in the inflation equation, and the second and fourth terms in the tax equation,are zero for countries that are not in a monetary union.
The first step requires an estimate for the spending targets. We note that spending andrevenues tend to rise with per capita incomes; since this part does not put financing pressures onthe central bank, we remove its effect from both series, by evaluating them at the average(weighted by GDP) per capita income across our sample of 32 countries for which we havecomplete data (which equaled $1,759 in 1995-2000)4.
4 Table III.2 includes data for 34 countries, but Angola and the Democratic Republic of the Congo have poor dataresulting from high inflation and periods of civil war, and were excluded from our calibration.

12
Estimating a quadratic function of per capita income confirms the positive relationship,which flattens out as income rises. The following table gives maximum likelihood estimates of
⎟⎟⎠
⎞⎜⎜⎝
⎛+++=⎟⎟
⎠
⎞⎜⎜⎝
⎛
i
iii
i
i
vu
ygyggg 2
210τ(6)
Table III.1. Estimates of Spending and Revenue Ratios as Functions of Per Capita Income------------------------------------------------------------------------------ | Coef. Std. Err. z P>|z| [95% Conf. Interval]-------------+----------------------------------------------------------------g0 | | .1774154 .0133362 13.30 0.000 .1512769 .2035539-------------+----------------------------------------------------------------g1 | | .1078046 .0243236 4.43 0.000 .0601313 .1554779-------------+----------------------------------------------------------------g2 | | -.0181573 .0062355 -2.91 0.004 -.0303787 -.005936-------------+----------------------------------------------------------------
)log( uσ |
| -2.95668 .1313506 -22.51 0.000 -3.214122 -2.699238-------------+----------------------------------------------------------------
)log( vσ |
| -2.765808 .1313506 -21.06 0.000 -3.02325 -2.508365------------------------------------------------------------------------------
Spending and revenue ratios are decimal fractions, while per capita income is in thousands ofdollars. The quadratic implies that the maximum tax or spending ratio is reached at a per capitaincome of about $3000 (Chart III.1). We label the spending and tax ratios purged of the percapita income effect, i.e. predicted values at average per capita income 759.1=y plus theresiduals from the above equations, as ig and iτ , respectively:
⎟⎟⎠
⎞⎜⎜⎝
⎛+++=⎟⎟
⎠
⎞⎜⎜⎝
⎛
i
i
i
i
vu
ygyggg 2210τ
(7)
The next step concerns estimating the unobservable component of spending that corresponds todistortions leading to overspending. A practical difficulty in estimating excessively highspending objectives is that politically motivated outlays also divert resources from sociallydesirable projects rather than come on top of socially optimal expenditure plans. As a result,actual budget figures are more likely to reflect underspending on social priorities such as healthand education instead of overspending at the aggregate level. To reconcile this feature of the datawith the model’s assumption, as in Debrun, Masson and Pattillo (2002) we assume a mappingfrom the extent of actual resource diversion (viewed as underspending on priority sectors) to theoverspending bias affecting the model’s unobservable targets.

13
Source: World Bank Africa Database 2002.
Chart III.1 Government Spending and Revenues as Percent of GDP
0
5
10
15
20
25
30
35
40
45
0 500 1000 1500 2000 2500 3000 3500 4000 4500 5000GDP per Capita
Spending
QuadraticTrend
Revenues

14
Table III.2. Expenditure on Priority Sectors: Estimates of the Diversion Effect
ICRG
Institutional Health (1999) Education (1999)
Quality Index ActualNoDiversion Actual
NoDiversion
Diversion inPercent of No
DiversionAlgeria 4.88 3.3 4.4 n.a. n.a. 25.1Angola 4.20 3.9 5.2 n.a. n.a. 25.5Botswana 6.51 2.4 3.3 4.0 4.6 18.3Burkina Faso 4.31 1.2 2.6 2.0 2.9 42.2Cameroon 5.09 1 2.4 n.a. n.a. 57.6Congo, Dem. Rep. 1.96 1.2 3.3 n.a. n.a. 63.4Congo Rep. 4.23 1.8 3.0 6.1 7.0 20.9Cote d'Ivoire 5.53 1.2 2.3 5.5 6.2 21.5Egypt 5.61 1.8 2.9 n.a. n.a. 37.4Ethiopia 3.56 1.4 2.9 2.7 3.7 37.9Gabon 4.99 1.9 3.4 n.a. n.a. 43.4Gambia, The 5.62 1.6 2.6 2.6 3.2 29.3Ghana 5.56 1.4 2.7 n.a. n.a. 47.7Guinea 4.59 2.1 3.3 1.6 2.4 35.7Guinea-Bissau 2.59 1.1 2.9 n.a. n.a. 62.7Kenya 5.69 n.a. 3.5 n.a. 6.0 19.0Madagascar 4.95 2.4 2.0 5.3 3.4 31.5Malawi 4.13 n.a. 4.7 n.a. 3.3 28.9Mali 3.42 1.1 3.4 2.6 3.2 38.2Morocco 5.64 3.3 2.7 2.4 5.3 26.0Mozambique 4.77 1.9 3.0 2.2 2.2 38.9Namibia 7.07 1.3 4.8 4.6 8.3 9.3Niger 3.96 1.8 2.8 1.4 n.a. 49.9Nigeria 4.20 4 2.4 7.8 n.a. 70.6Senegal 5.27 1.4 3.6 n.a. 4.3 21.6Sierra Leone 2.98 0.7 2.7 n.a. 2.2 57.6South Africa 7.07 2.6 3.8 3.6 6.8 9.1Sudan 2.66 1 2.6 1.1 1.9 67.1Tanzania 5.14 n.a. 2.3 n.a. 3.4 34.1Togo 3.41 3.3 2.8 6.3 5.2 34.0Tunisia 5.53 0.7 3.4 0.8 5.9 21.0Uganda 4.06 1.1 3.3 2.6 4.4 32.1Zambia 4.47 1.1 4.5 4.2 3.1 25.9Zimbabwe 5.60 2.2 4.1 5.2 7.3 16.3
Sources: www.icrgonline.com, World Bank Africa database.Note: The health expenditure regression includes a constant, the log of GDP per capita at PPP (average 1990–97),an index of institutional quality (simple average of ICRG indices for political stability, democratic accountabilityand corruption, ranging from 0–10, higher numbers indicating better institutions), a dummy identifying countrieswith HIV/AIDS prevalence rate above 10 percent, life expectancy and infant mortality. The sample consists of 34African countries and estimates were obtained by OLS. The education expenditure regression includes a constant,the log of GDP per capita at PPP (average 1984–98), illiteracy and an interaction variable between illiteracy andinstitutional quality (simple average of ICRG indices for political stability, democratic accountability, corruption,rule of law and bureaucratic quality). Here, the sample only consists of 24 Africa countries due to missing data.

15
Table III.3 Selected Indicators, Averages 1995-2000(Percent of GDP, unless noted otherwise)
Country Name Gov’tRevenue1
Gov’tSpending
Overallsurplus/deficit1
Inflation2 GDP per cap(Cur. US$)
Gov’tSpendingat average
income2
Diversion2 SpendingTarget 3
Algeria 32.18 30.60 1.57 10.4 1621 31.25 25.06 43.78Angola 44.29 57.12 -12.83 1271.4 586 64.77 25.50 77.52Benin4 19.08 19.48 -0.40 5.6 370 29.09 34.57 46.37Botswana 42.02 40.79 1.23 9.9 3262 38.29 18.33 47.45Burkina Faso 21.82 25.12 -3.29 3.1 222 36.16 42.21 57.26Cameroon 15.45 17.09 -1.64 6.9 626 24.40 57.63 53.21Congo 25.60 33.24 -7.63 6.2 904 38.32 20.94 48.79Cote d'Ivoire 21.64 23.58 -1.94 3.9 711 30.18 21.51 40.93Egypt, Arab Rep. 25.78 27.24 -1.46 5.5 1291 29.70 37.36 48.38Ethiopia 21.28 27.44 -6.16 3.3 104 39.69 37.91 58.64Gabon 27.67 28.80 -1.13 2.1 4305 29.38 43.39 51.07Gambia 20.53 25.33 -4.80 2.6 343 35.19 29.33 49.85Ghana 22.50 28.60 -6.10 31.8 374 38.17 47.70 62.02Guinea 13.99 16.60 -2.61 4.5 512 24.90 35.71 42.75Guinea-Bissau 23.75 34.66 -10.91 27.6 210 45.83 62.68 77.17Kenya 27.37 28.01 -0.65 6.6 359 37.72 19.00 47.22Lesotho5 46.00 47.00 -1.00 7.8 459 55.78 12.26 61.91Madagascar 14.11 18.64 -4.53 16.9 257 29.34 31.46 45.07Malawi 23.17 28.18 -5.01 38.5 187 39.58 28.92 54.04Mali 21.77 24.88 -3.11 3.4 246 35.69 38.16 54.77Mauritius5 20.81 25.88 -5.07 6.1 3620 24.00 12.26 30.13Morocco 25.95 30.25 -4.30 2.6 1256 32.92 25.98 45.91Mozambique 21.18 23.89 -2.71 20.3 200 35.16 38.85 54.58Namibia 31.58 35.18 -3.59 8.5 2136 33.78 9.34 38.45Niger 12.95 15.78 -2.83 4.0 195 27.10 49.94 52.07Nigeria 25.90 25.00 0.90 22.4 290 35.37 70.57 70.65Senegal 20.21 20.11 0.10 2.6 511 28.43 21.61 39.23Seychelles5 45.11 56.64 -11.53 2.0 7416 89.90 12.26 96.03Sierra Leone 11.41 19.73 -8.32 22.1 167 31.33 57.61 60.13South Africa 28.52 33.31 -4.78 7.0 3393 30.98 9.12 35.54Sudan 8.04 9.61 -1.57 60.7 342 19.48 67.06 53.01Swaziland5 29.89 30.39 -0.50 8.7 1370 32.38 12.26 38.51Tanzania 14.22 14.91 -0.69 17.5 238 25.80 34.11 42.85Togo 16.38 20.19 -3.81 4.7 317 30.31 33.99 47.30Tunisia 29.54 32.97 -3.42 3.7 2098 31.69 20.96 42.17Uganda 15.19 17.03 -1.84 5.5 302 27.30 32.14 43.37Zambia 26.00 28.91 -2.91 30.6 349 38.72 25.94 51.69Zimbabwe 29.44 39.25 -9.81 34.4 604 46.75 16.34 54.92
Source- World Bank Africa Database, 2002 and calculations reported in Table III.21/ Including grants2/ Percent3/ Government spending at average income plus diversion/24/ Diversion estimate for Benin is calculated as the average for other WAEMU countries (excluding Guinea-Bissau)5/ Diversion estimate for Lesotho, Mauritius, Seychelles and Swaziland is calculated as the average for Botswana, Namibia, andSouth Africa
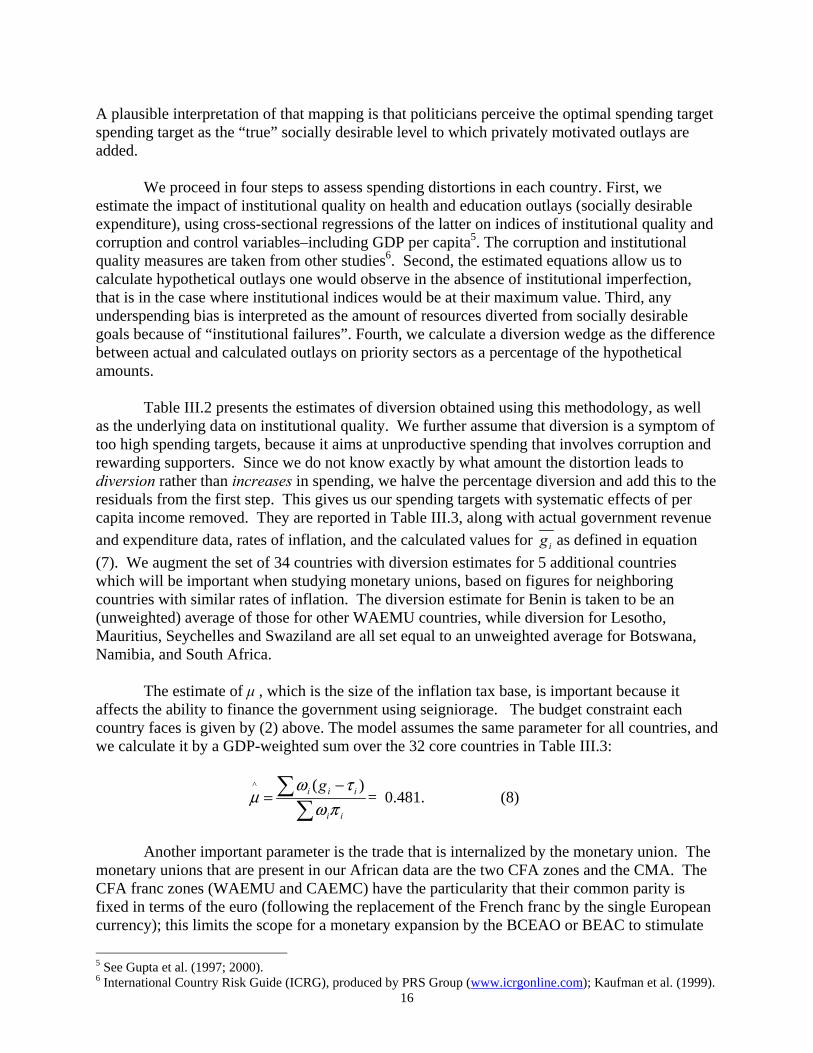
16
A plausible interpretation of that mapping is that politicians perceive the optimal spending targetspending target as the “true” socially desirable level to which privately motivated outlays areadded.
We proceed in four steps to assess spending distortions in each country. First, weestimate the impact of institutional quality on health and education outlays (socially desirableexpenditure), using cross-sectional regressions of the latter on indices of institutional quality andcorruption and control variables–including GDP per capita5. The corruption and institutionalquality measures are taken from other studies6. Second, the estimated equations allow us tocalculate hypothetical outlays one would observe in the absence of institutional imperfection,that is in the case where institutional indices would be at their maximum value. Third, anyunderspending bias is interpreted as the amount of resources diverted from socially desirablegoals because of “institutional failures”. Fourth, we calculate a diversion wedge as the differencebetween actual and calculated outlays on priority sectors as a percentage of the hypotheticalamounts.
Table III.2 presents the estimates of diversion obtained using this methodology, as wellas the underlying data on institutional quality. We further assume that diversion is a symptom oftoo high spending targets, because it aims at unproductive spending that involves corruption andrewarding supporters. Since we do not know exactly by what amount the distortion leads todiversion rather than increases in spending, we halve the percentage diversion and add this to theresiduals from the first step. This gives us our spending targets with systematic effects of percapita income removed. They are reported in Table III.3, along with actual government revenueand expenditure data, rates of inflation, and the calculated values for ig as defined in equation(7). We augment the set of 34 countries with diversion estimates for 5 additional countrieswhich will be important when studying monetary unions, based on figures for neighboringcountries with similar rates of inflation. The diversion estimate for Benin is taken to be an(unweighted) average of those for other WAEMU countries, while diversion for Lesotho,Mauritius, Seychelles and Swaziland are all set equal to an unweighted average for Botswana,Namibia, and South Africa.
The estimate of µ , which is the size of the inflation tax base, is important because itaffects the ability to finance the government using seigniorage. The budget constraint eachcountry faces is given by (2) above. The model assumes the same parameter for all countries, andwe calculate it by a GDP-weighted sum over the 32 core countries in Table III.3:
∑∑ −
=ii
iii gπω
τωµ
)(^= 0.481. (8)
Another important parameter is the trade that is internalized by the monetary union. Themonetary unions that are present in our African data are the two CFA zones and the CMA. TheCFA franc zones (WAEMU and CAEMC) have the particularity that their common parity isfixed in terms of the euro (following the replacement of the French franc by the single Europeancurrency); this limits the scope for a monetary expansion by the BCEAO or BEAC to stimulate 5 See Gupta et al. (1997; 2000).6 International Country Risk Guide (ICRG), produced by PRS Group (www.icrgonline.com); Kaufman et al. (1999).
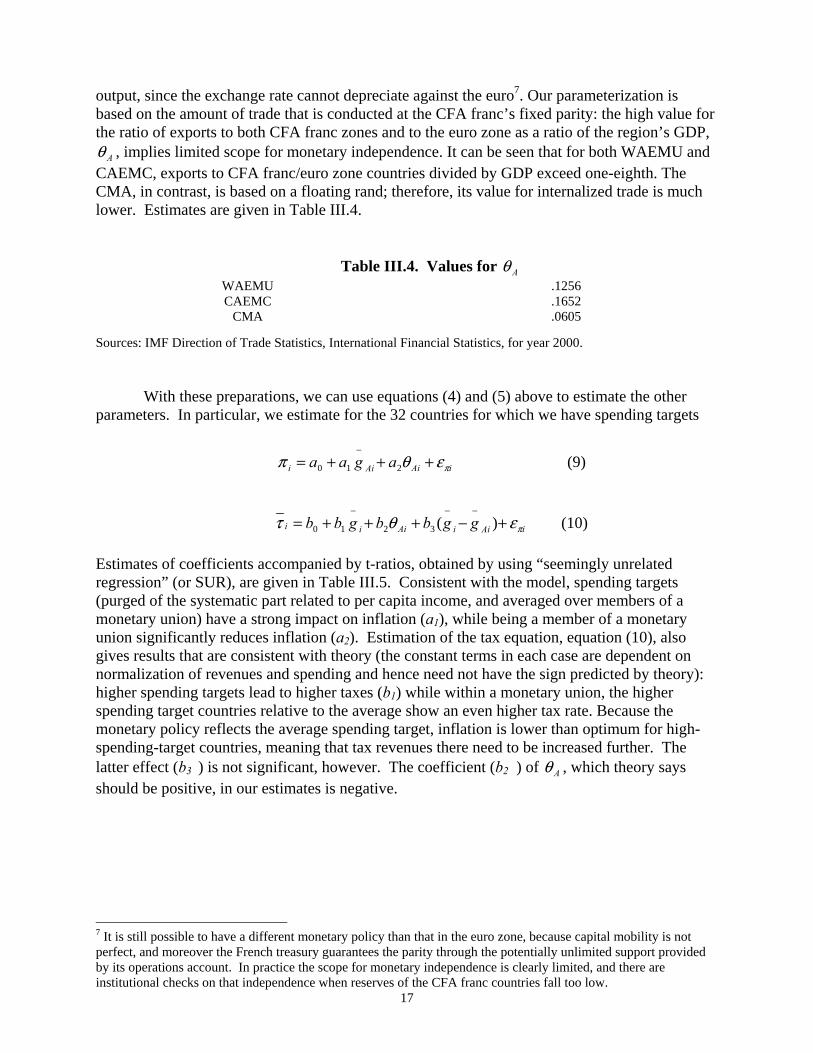
17
output, since the exchange rate cannot depreciate against the euro7. Our parameterization isbased on the amount of trade that is conducted at the CFA franc’s fixed parity: the high value forthe ratio of exports to both CFA franc zones and to the euro zone as a ratio of the region’s GDP,
Aθ , implies limited scope for monetary independence. It can be seen that for both WAEMU andCAEMC, exports to CFA franc/euro zone countries divided by GDP exceed one-eighth. TheCMA, in contrast, is based on a floating rand; therefore, its value for internalized trade is muchlower. Estimates are given in Table III.4.
Table III.4. Values for AθWAEMUCAEMC
CMA
.1256
.1652
.0605
Sources: IMF Direction of Trade Statistics, International Financial Statistics, for year 2000.
With these preparations, we can use equations (4) and (5) above to estimate the otherparameters. In particular, we estimate for the 32 countries for which we have spending targets
iAiAii agaa πεθπ +++=−
210 (9)
iAiiAiii ggbbgbb πεθτ +−+++=−−−
)(3210 (10)
Estimates of coefficients accompanied by t-ratios, obtained by using “seemingly unrelatedregression” (or SUR), are given in Table III.5. Consistent with the model, spending targets(purged of the systematic part related to per capita income, and averaged over members of amonetary union) have a strong impact on inflation (a1), while being a member of a monetaryunion significantly reduces inflation (a2). Estimation of the tax equation, equation (10), alsogives results that are consistent with theory (the constant terms in each case are dependent onnormalization of revenues and spending and hence need not have the sign predicted by theory):higher spending targets lead to higher taxes (b1) while within a monetary union, the higherspending target countries relative to the average show an even higher tax rate. Because themonetary policy reflects the average spending target, inflation is lower than optimum for high-spending-target countries, meaning that tax revenues there need to be increased further. Thelatter effect (b3 ) is not significant, however. The coefficient (b2 ) of Aθ , which theory saysshould be positive, in our estimates is negative.
7 It is still possible to have a different monetary policy than that in the euro zone, because capital mobility is notperfect, and moreover the French treasury guarantees the parity through the potentially unlimited support providedby its operations account. In practice the scope for monetary independence is clearly limited, and there areinstitutional checks on that independence when reserves of the CFA franc countries fall too low.

18
Table III.5. SUR Estimates, Equations (9)-(10)Seemingly unrelated regression----------------------------------------------------------------------Equation Obs Parms RMSE "R-sq" chi2 P---------------------------------------------------------------------- (9) 32 2 .1149608 0.2877 12.93 0.0016 (10) 32 3 .0463683 0.1456 6.92 0.0744---------------------------------------------------------------------- (9) coefficient std. err. t P>|t| [95% conf. interval] a
1 | .7985308 .2826389 2.83 0.005 .2445687 1.352493
a2
| -.4031944 .1980567 -2.04 0.042 -.7913784 -.0150104 a
0 | -.2301882 .1408816 -1.63 0.102 -.5063111 .0459348
-------------+---------------------------------------------------------------- (10) b
1 | .2016095 .1150248 1.75 0.080 -.0238349 .427054
b2
| -.0897106 .0802053 -1.12 0.263 -.24691 .0674888 b
3 | .0415647 .1591399 0.26 0.794 -.2703438 .3534732
b0 | .2005066 .0575407 3.48 0.000 .0877289 .3132844
------------------------------------------------------------------------------
We use the coefficients with the correct signs in the two equations to estimate the parameters a,b,and γ. In particular, equating 3121 ,,, bbaa to the corresponding expressions in equations (1) and(2), we can derive
32
11
^^
babaa µ−= ,
32
21
^
baab −= and
32
^
21
21
^
baaa
a
−−=
µγ .
The resulting estimates are given below:
parameter First estimate Final estimatea 4.620711 0.9569204b 38.0491 7.87973γ 4.617129 8.623756
The estimates of a and b are not well determined because the denominator is close tozero. If we increase the value of the coefficient b3 by one standard error, then the denominatorincreases away from zero, yielding estimates that seem more sensible and much closer to thatobtained using a different methodology (Debrun, Masson, and Pattillo, 2002, Appendix). Weadopt them as our final estimates here. In that paper, we also examine the sensitivity ofevaluations of the net benefits of monetary union to changes in the parameters, and conclude thatthose evaluations are reasonably robust to changes within the range of estimates given above.
Finally, the value of η captures the stabilization role for monetary policy. We normalizethis parameter to unity, meaning that a negative supply shock (i.e. terms of trade shock) leads toan equal percentage point increase in the target for inflation.

10/14/03Chapter IV: Lessons from Two African Monetary Unions: the CFA Franc Zone and the
South African CMA
It is natural when analysing the prospects for monetary integration in Africa to examinefirst the two examples of monetary unions on the continent: the CFA franc zone (or, to be moreprecise, the two regions composing it1, namely the West African Economic and Monetary Union,or WAEMU, and the Central African Economic and Monetary Community, or CAEMC), and theCommon Monetary Area based on South Africa’s rand. These monetary unions also have theadvantage for our purposes of having been in place for a long time, albeit having evolvedsomewhat over the course of their existence: monetary union in southern Africa dates back to theearly years of the 20th century, while the CFA franc zone was formed at the time of the SecondWorld War. Thus, the effects of monetary union should have shown themselves by now.
As discussed in the previous chapter, some have claimed that monetary union will ofitself greatly stimulate trade and will promote fiscal discipline and regional convergence. Datafor these monetary unions can help test these hypotheses. Arguably, the experience of thesemonetary unions will be more relevant to other proposed monetary unions in Africa, than, forinstance, data for the EU, because there may be special characteristics and common features thatprevail on the continent, including a relatively similar level of institutional development. At thevery least, a detailed examination of these cases can supplement a more inclusive but broad-brush econometric analysis of country examples drawn from a global sample.
A. The CFA Franc Zone
As described in Chapter II, the CFA franc zone was created by France during its colonialoccupation of Africa, but unlike other regional monetary arrangements imposed by Europeanpowers it survived decolonization, thanks to the efforts made by France to maintain it. Francecontinues to provide a guarantee of convertibility of the CFA franc into the euro, at a fixedexchange rate parity. The CFA/French franc exchange rate, which had remained unchanged foralmost 50 years, was increased by a factor of two in 1994, helping to resolve a long crisis thatwas associated with the overvaluation of the CFA franc.
The fixed parity with the euro (before 1999, to the French franc) at a considerablyconstrains the scope for an independent monetary policy in the CFA franc zone. Accordingly, akey indicator guiding monetary policy is the reserve cover ratio, that is the ratio of foreignexchange reserves to the short-term liabilities of the central bank. When that indicator declinesbelow 20 percent for three consecutive months, then emergency measures must be taken by thecentral bank to protect the parity: increases in official interest rates and reductions in refinancingceilings. An agreement with France provides for at least 65 per cent of reserves to be held with 1 The two regions issue two distinct versions of the CFA franc: in West Africa, it is called the franc of the“Communauté Financière Africaine” and in Central Africa, the franc of the “Coopération Financière en AfriqueCentrale.” Thus, the two currencies are distinguishable and are not freely exchangeable, and they may face differentdevaluation risk (Vizy, 1989, p. 50). In fact, the CFA franc zone also includes Comoros, with its own currency andcentral bank, and France, which guarantees the parities of the 3 currencies against the euro. See the annual report ofthe Zone Franc (Bank of France, 2002).

2
the French Treasury, in the operations account. I If that account goes into deficit for 30 days,then specific measures are also triggered: reduction by 20 percent of refinancing ceilings forcountries in deficit, and by 10 percent for countries whose surplus is less than 15 percent of itsmoney supply. This limits the potential liability of the Treasury and provides an extra rule-basedelement of credibility to the existing parity.
Reserves for the WAEMU and the CAEMC are pooled at the respective central banks.However, these reserves are attributed to each of their respective member countries, as is themonetary circulation (with a grid used to estimate the shares of each country in the total currencyoutstanding). Similarly, monetary programming in each of the two regions is built up fromcountry-by-country estimates of GDP growth (leading to an estimate for money demand) andcredit demand from the private and public sectors. The latter produces individual countryceilings for central bank credit to the economy. In fact, however, these ceilings are not rigidlyenforced (Parmentier and Tenconi, 1996, pp. 133-43). Questions can be raised about whether acountry-by-country monetary programming exercise makes sense in an integrated monetary area;if there is a single monetary policy (as is the case for WAEMU and CAEMC separately), thedistribution of the money supply across countries should have little importance, and be purelyendogenous and demand determined2. Similarly, in an integrated banking system it should notmatter whether a loan is made from a bank in country A to a firm or individual in country B, norwhat proportions of total bank assets are held in each of the two countries.
The two regions composing the CFA franc zone have regional institutions3 that supervisetheir respective banking systems, and banks in principle can establish branches in any membercountry. Banks need only obtain a single banking permit, the agrément unique, to operate withineither WAEMU or CAEMC. However, in practice banks do not operate across borders, nor doeseither region have an effective regional money market. In addition to the agrément unique,banks need to get the permission of the national finance ministry to set up shop, and this seemsto be used to protect local banks. Thus, there are restrictions on the ability of banks to operate inseveral countries and banks are reluctant to lend across borders in either region (IMF 2002b;Hernández-Catá et al., 1998). Another feature that interferes with creation of a level playingfield is the existence of bank reserve requirements that are differentiated by country in WAEMU(but not in CAEMC).
Continued use of a country-by-country monetary programming exercise no doubt in partreflects the reality that neither the WAEMU nor the CAEMC is in fact a perfectly integratedmonetary zone. Another factor explaining its existence is that the loans made by the central bankto national treasuries are subject to a ceiling that is equal to the country’s fiscal revenues in theprevious year. This situation will change with the implementation of decisions made in bothWAEMU and CAEMC to eliminate monetary financing of treasuries. Its elimination wouldmake it easier to move to a system in which there was an overall refinancing target for the zone,and lending by the central bank involved repo or other operations with commercial banks,regardless of their location in the zone. In WAEMU, the Council of Ministers decided inSeptember 2002 that the BCEAO would not provide new government financing as of January,
2 Ndiaye (2000) finds that there is not much heterogeneity across national money demands in West Africa, so that aWAEMU money demand function performs well compared to individual country demand functions.3 The Commission bancaire, located in Abidjan, for WEAMU, and the COBAC, located in Bangui, for CAEMC.
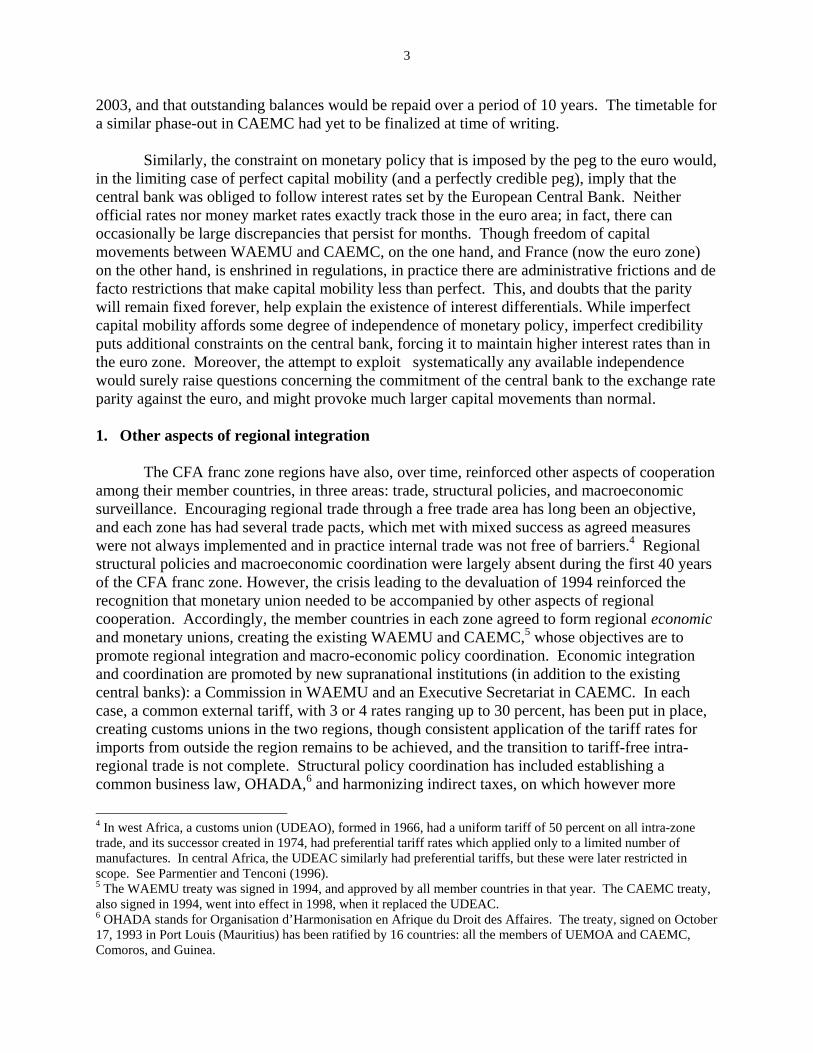
3
2003, and that outstanding balances would be repaid over a period of 10 years. The timetable fora similar phase-out in CAEMC had yet to be finalized at time of writing.
Similarly, the constraint on monetary policy that is imposed by the peg to the euro would,in the limiting case of perfect capital mobility (and a perfectly credible peg), imply that thecentral bank was obliged to follow interest rates set by the European Central Bank. Neitherofficial rates nor money market rates exactly track those in the euro area; in fact, there canoccasionally be large discrepancies that persist for months. Though freedom of capitalmovements between WAEMU and CAEMC, on the one hand, and France (now the euro zone)on the other hand, is enshrined in regulations, in practice there are administrative frictions and defacto restrictions that make capital mobility less than perfect. This, and doubts that the paritywill remain fixed forever, help explain the existence of interest differentials. While imperfectcapital mobility affords some degree of independence of monetary policy, imperfect credibilityputs additional constraints on the central bank, forcing it to maintain higher interest rates than inthe euro zone. Moreover, the attempt to exploit systematically any available independencewould surely raise questions concerning the commitment of the central bank to the exchange rateparity against the euro, and might provoke much larger capital movements than normal.
1. Other aspects of regional integration
The CFA franc zone regions have also, over time, reinforced other aspects of cooperationamong their member countries, in three areas: trade, structural policies, and macroeconomicsurveillance. Encouraging regional trade through a free trade area has long been an objective,and each zone has had several trade pacts, which met with mixed success as agreed measureswere not always implemented and in practice internal trade was not free of barriers.4 Regionalstructural policies and macroeconomic coordination were largely absent during the first 40 yearsof the CFA franc zone. However, the crisis leading to the devaluation of 1994 reinforced therecognition that monetary union needed to be accompanied by other aspects of regionalcooperation. Accordingly, the member countries in each zone agreed to form regional economicand monetary unions, creating the existing WAEMU and CAEMC,5 whose objectives are topromote regional integration and macro-economic policy coordination. Economic integrationand coordination are promoted by new supranational institutions (in addition to the existingcentral banks): a Commission in WAEMU and an Executive Secretariat in CAEMC. In eachcase, a common external tariff, with 3 or 4 rates ranging up to 30 percent, has been put in place,creating customs unions in the two regions, though consistent application of the tariff rates forimports from outside the region remains to be achieved, and the transition to tariff-free intra-regional trade is not complete. Structural policy coordination has included establishing acommon business law, OHADA,6 and harmonizing indirect taxes, on which however more
4 In west Africa, a customs union (UDEAO), formed in 1966, had a uniform tariff of 50 percent on all intra-zonetrade, and its successor created in 1974, had preferential tariff rates which applied only to a limited number ofmanufactures. In central Africa, the UDEAC similarly had preferential tariffs, but these were later restricted inscope. See Parmentier and Tenconi (1996).5 The WAEMU treaty was signed in 1994, and approved by all member countries in that year. The CAEMC treaty,also signed in 1994, went into effect in 1998, when it replaced the UDEAC.6 OHADA stands for Organisation d’Harmonisation en Afrique du Droit des Affaires. The treaty, signed on October17, 1993 in Port Louis (Mauritius) has been ratified by 16 countries: all the members of UEMOA and CAEMC,Comoros, and Guinea.
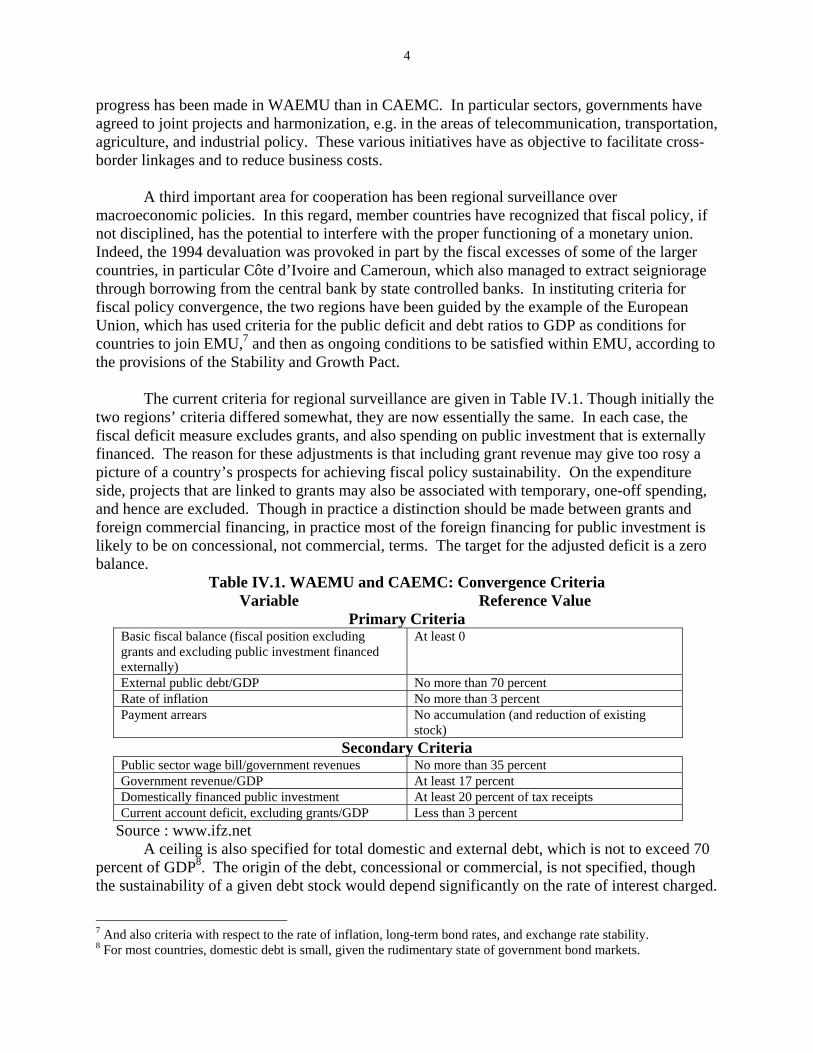
4
progress has been made in WAEMU than in CAEMC. In particular sectors, governments haveagreed to joint projects and harmonization, e.g. in the areas of telecommunication, transportation,agriculture, and industrial policy. These various initiatives have as objective to facilitate cross-border linkages and to reduce business costs.
A third important area for cooperation has been regional surveillance overmacroeconomic policies. In this regard, member countries have recognized that fiscal policy, ifnot disciplined, has the potential to interfere with the proper functioning of a monetary union.Indeed, the 1994 devaluation was provoked in part by the fiscal excesses of some of the largercountries, in particular Côte d’Ivoire and Cameroun, which also managed to extract seignioragethrough borrowing from the central bank by state controlled banks. In instituting criteria forfiscal policy convergence, the two regions have been guided by the example of the EuropeanUnion, which has used criteria for the public deficit and debt ratios to GDP as conditions forcountries to join EMU,7 and then as ongoing conditions to be satisfied within EMU, according tothe provisions of the Stability and Growth Pact.
The current criteria for regional surveillance are given in Table IV.1. Though initially thetwo regions’ criteria differed somewhat, they are now essentially the same. In each case, thefiscal deficit measure excludes grants, and also spending on public investment that is externallyfinanced. The reason for these adjustments is that including grant revenue may give too rosy apicture of a country’s prospects for achieving fiscal policy sustainability. On the expenditureside, projects that are linked to grants may also be associated with temporary, one-off spending,and hence are excluded. Though in practice a distinction should be made between grants andforeign commercial financing, in practice most of the foreign financing for public investment islikely to be on concessional, not commercial, terms. The target for the adjusted deficit is a zerobalance.
Table IV.1. WAEMU and CAEMC: Convergence CriteriaVariable Reference Value
Primary CriteriaBasic fiscal balance (fiscal position excludinggrants and excluding public investment financedexternally)
At least 0
External public debt/GDP No more than 70 percentRate of inflation No more than 3 percentPayment arrears No accumulation (and reduction of existing
stock)Secondary Criteria
Public sector wage bill/government revenues No more than 35 percentGovernment revenue/GDP At least 17 percentDomestically financed public investment At least 20 percent of tax receiptsCurrent account deficit, excluding grants/GDP Less than 3 percent
Source : www.ifz.netA ceiling is also specified for total domestic and external debt, which is not to exceed 70
percent of GDP8. The origin of the debt, concessional or commercial, is not specified, thoughthe sustainability of a given debt stock would depend significantly on the rate of interest charged.
7 And also criteria with respect to the rate of inflation, long-term bond rates, and exchange rate stability.8 For most countries, domestic debt is small, given the rudimentary state of government bond markets.

5
In practice, many of the countries concerned have started from situations of high indebtedness,recently alleviated to some extent by the Highly Indebted Poor Country (HIPC) initiative of theIMF and the World Bank to write down the debt they owe, and by debt forgiveness by G-7 andother industrial countries.
In addition to criteria on the overall fiscal policies of member countries, the two regionshave also targeted specific aspects of their fiscal policies. This has included the ratio of fiscalrevenues to GDP, considered too low in most member countries; the ratio of public wages andsalaries to fiscal revenues, considered too high; and spending on public investment, for which thetarget is above what most governments spend.
The process of regional surveillance has experienced setbacks in implementation thathave hindered achievement of agreed objectives. Difficulties include getting national authoritiesto produce reliable and comparable data, focusing their attention on the key deficit criterion andaway from the multiplicity of secondary criteria, making governments take a serious interest inexamining policies in neighboring countries, and creating effective procedures for imposingsanctions in case of noncompliance. In the early years, the central banks in the two regions werethe only regional institutions able to marshall data and prepare the necessary documentation forregional surveillance meetings. This responsibility has now passed to the Commission of theWAEMU and the Executive Secretariat of the CAEMC. However, data problems persist. Theattention given to regional surveillance has increased as experience has been gained. In 1999,WAEMU countries agreed to the Convergence, Stability, Growth, and Solidarity Pact, whichmandated a convergence phase over 2000-2002 and a stability phase starting in 2003 after whichcountries would be expected to meet the criteria. However, given the difficulties encountered bycountries in meeting the criteria, the heads of state and government of the WAEMU decided inJanuary, 2003, to postpone the stability phase until January 1, 2006, after which time all memberstates should meet the primary criteria. CAEMC countries approved new convergence criteriaand surveillance procedures in 2001. The success that countries have had in meeting the criteriais reviewed in section 3 below.
2. Has monetary union been associated with increased trade and growth, and lowerinflation?
Adopting a common currency lowers transactions costs for regional trade, sincepurchasing goods from neighboring countries no longer involves changing currencies. As aresult, a monetary union could be expected to increase regional trade, as would forming a freetrade area or common market. It may be hard, however, to distinguish the purely monetaryunion effects from other aspects of regional integration, since the two are often associated, as isdescribed above for WAEMU and CAEMC.
Table IV.2 gives the extent of regional trade within these two CFA franc zone regions,between the two of them, and between them and France. Trade both between the two regionsand with France involves a currency exchange, since neither region’s CFA franc is legal tenderin France. However, such an exchange should in principle be free of commission. Intra-regionaltrade is modest, especially within CAEMC, and practically non-existent between the two, butvery substantial with France.

6
It is, of course, necessary to have a standard with which to evaluate whether the extent ofintra-regional trade is out of the ordinary. This is provided by the “gravity model,” which hasbeen tested extensively and seems to capture well the determinants of bilateral trade betweencountries. It predicts that larger countries exert a greater gravitational pull on imports and pushto exports; that richer countries (in per capita terms) also tend to have higher trade; and that tradediminishes with distance. The model, estimated in log form, generally gives a good empirical fitacross a range of countries (but as we will see below, does not do a good job predicting CFAtrade). See Box IV.1 for the coefficient estimates when the gravity model is applied to Africa;they suggest that membership in the same currency union has a positive effect on trade betweenAfrican countries, and this effect is very close to the estimates obtained from the global sample.
Table IV.2. CFA Franc Zone: Intra-Regional Trade and Trade with France,(actual and predicted by gravity model, as a percent of total trade in 1997-98)
Region WAEMU CAEMC CFA 1/Actual trade
Intra-regional 9.4 2.8 7.8With France 43.4 32.9 38.7
Predicted trade withcurrency uniondummy
Intra-regional 2.5 2.5 2.2With France 42.7 38.2 41.2
Predicted tradewithout currencyunion dummy
Intra-regional 1.3 1.0 1.2With France 41.0 36.5 39.5
Sources: Actual data from DOT, IFS; predictions using estimated coefficients from Box IV.1.1/ excluding Comoros
It is also of interest to look at the effect of currency union on trade in specific regions.Table IV.2 also gives the predictions of the gravity model with respect to the CFA regions’internal trade. It can be seen that though intra-regional trade in WAEMU is considerably greaterthan predicted by the gravity model (with or without the currency union dummy), the same is nottrue of the CAEMC which actually trades about what the model with the currency union dummywould have predicted. Trade with France is also roughly as predicted by the gravity model. TheWAEMU results for internal trade are surprising, since the second panel of Table IV.2incorporates the effect of a dummy variable that implies that trade within a currency union ismultiplied by about 3 relative to what it would have been.9 Thus, it seems that WAEMU has
9 Rose (2000). See also the comment by Nitsch (2001) and Tenreyro and Barro (2003).

7
been successful in furthering regional integration beyond what would be the case in the usualcurrency union, while the same is not true of CAEMC.10
The evidence is mixed on whether monetary union provides an important stimulus togrowth. Evidence from WAEMU and CAEMC initially suggested a positive impact relative tothe rest of sub-Saharan Africa (Guillaumont and Guillaumont, 1984; Devarajan and de Melo,1987). It has also been argued (Vizy, 1989, p. 136) that the existence of France’s guarantee ofconvertibility embodied in the Operations Account has cushioned the effects of negative shocks,by reducing the risk countries would face a flight from their currency and drying up of access toforeign exchange, which could bring the economy to a halt.11 However, the CFA franc zoneseverely underperformed during 1986-93, as the overvaluation of the CFA franc contributed to apersistent economic downturn, and adjustment of the exchange rate was difficult given theinstitutional structure which requires unanimity among member countries for a parity change.The problem of CFA overvaluation may recur, if domestic inflation cannot be kept to levels inthe euro zone, especially during periods when the euro is strong against the US dollar.
In contrast, the CFA franc zone has unambiguously delivered better price performancethan floating rate or crawling peg regimes in Africa (Masson and Pattillo, 2001). Inflation islower in CFA franc zone countries than in the rest of sub-Saharan Africa, helped no doubt by thepeg to the French franc, which has anchored the monetary policies of WAEMU and CAEMC. Asupranational central bank may also deliver lower inflation in the absence of a peg if it is moreindependent of national treasuries, as discussed in Chapter III.
3. Per capita income convergence
Another objective of regional integration, and one advanced by creating a monetaryunion, may be to achieve convergence of income levels by stimulating growth in the poorercountries. It is plausible that this would result from increased trade, and hence is subject to theabove mentioned uncertainties about the effect of a common currency on trade. Relatedinitiatives to liberalize factor movements would also favor growth by allowing capital and laborto move to the locations where they are most productive.12
There is an extensive literature testing for convergence, which suggests that it has notoperated when all the countries of the world are included. However, there seem to be“convergence clubs,” such as the OECD, where convergence operates strongly (Baumol et al.,eds, 1994). Jenkins and Thomas (1996) assert: “There is a growing consensus that ‘convergence
10 The estimated equation also includes a dummy variable for common colonial links with the former metropolitanpower, and arguably this effect could be expected to be much stronger for former French colonies than others inAfrica, for reasons discussed in Chapter II. But given the common experience of WAEMU and CAEMC, neitherformer colonial links nor common language is likely to be the explanation for the high level of WAEMU internaltrade. A complicating factor, however, is oil: the CAEMC countries trade little among themselves because theyexport crude oil, which mainly goes to refineries outside of Africa.11 The recent political crisis and civil unrest in Côte d’Ivoire may be an example of this, since the economicimpacts, though serious, have not been as dire as in other African countries facing similar situations.12 However, equalizing effects on incomes are not unambiguous, since monetary union might lead to agglomerationas businesses migrate to the major metropolitan centers. Tenreyro and Barro’s results (op. cit.) suggest that currencyunions lead to greater specialization.
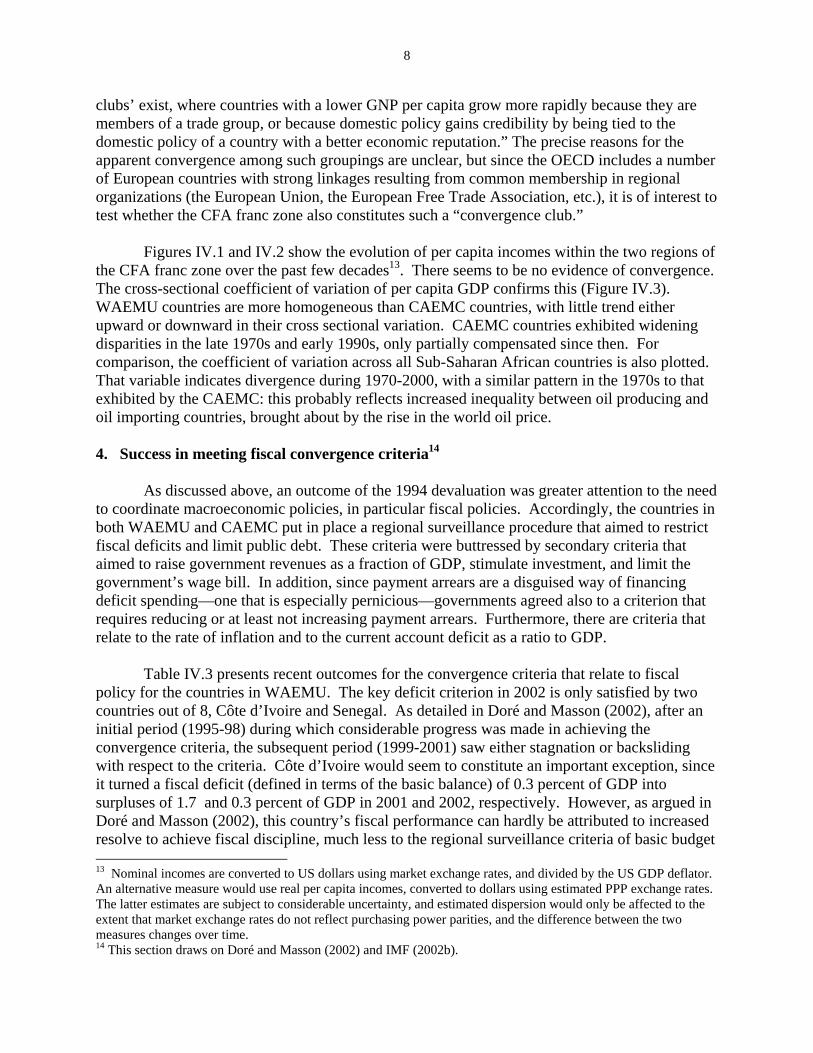
8
clubs’ exist, where countries with a lower GNP per capita grow more rapidly because they aremembers of a trade group, or because domestic policy gains credibility by being tied to thedomestic policy of a country with a better economic reputation.” The precise reasons for theapparent convergence among such groupings are unclear, but since the OECD includes a numberof European countries with strong linkages resulting from common membership in regionalorganizations (the European Union, the European Free Trade Association, etc.), it is of interest totest whether the CFA franc zone also constitutes such a “convergence club.”
Figures IV.1 and IV.2 show the evolution of per capita incomes within the two regions ofthe CFA franc zone over the past few decades13. There seems to be no evidence of convergence.The cross-sectional coefficient of variation of per capita GDP confirms this (Figure IV.3).WAEMU countries are more homogeneous than CAEMC countries, with little trend eitherupward or downward in their cross sectional variation. CAEMC countries exhibited wideningdisparities in the late 1970s and early 1990s, only partially compensated since then. Forcomparison, the coefficient of variation across all Sub-Saharan African countries is also plotted.That variable indicates divergence during 1970-2000, with a similar pattern in the 1970s to thatexhibited by the CAEMC: this probably reflects increased inequality between oil producing andoil importing countries, brought about by the rise in the world oil price.
4. Success in meeting fiscal convergence criteria14
As discussed above, an outcome of the 1994 devaluation was greater attention to the needto coordinate macroeconomic policies, in particular fiscal policies. Accordingly, the countries inboth WAEMU and CAEMC put in place a regional surveillance procedure that aimed to restrictfiscal deficits and limit public debt. These criteria were buttressed by secondary criteria thataimed to raise government revenues as a fraction of GDP, stimulate investment, and limit thegovernment’s wage bill. In addition, since payment arrears are a disguised way of financingdeficit spending—one that is especially pernicious—governments agreed also to a criterion thatrequires reducing or at least not increasing payment arrears. Furthermore, there are criteria thatrelate to the rate of inflation and to the current account deficit as a ratio to GDP.
Table IV.3 presents recent outcomes for the convergence criteria that relate to fiscalpolicy for the countries in WAEMU. The key deficit criterion in 2002 is only satisfied by twocountries out of 8, Côte d’Ivoire and Senegal. As detailed in Doré and Masson (2002), after aninitial period (1995-98) during which considerable progress was made in achieving theconvergence criteria, the subsequent period (1999-2001) saw either stagnation or backslidingwith respect to the criteria. Côte d’Ivoire would seem to constitute an important exception, sinceit turned a fiscal deficit (defined in terms of the basic balance) of 0.3 percent of GDP intosurpluses of 1.7 and 0.3 percent of GDP in 2001 and 2002, respectively. However, as argued inDoré and Masson (2002), this country’s fiscal performance can hardly be attributed to increasedresolve to achieve fiscal discipline, much less to the regional surveillance criteria of basic budget 13 Nominal incomes are converted to US dollars using market exchange rates, and divided by the US GDP deflator.An alternative measure would use real per capita incomes, converted to dollars using estimated PPP exchange rates.The latter estimates are subject to considerable uncertainty, and estimated dispersion would only be affected to theextent that market exchange rates do not reflect purchasing power parities, and the difference between the twomeasures changes over time.14 This section draws on Doré and Masson (2002) and IMF (2002b).

9
balance. Instead, during 2000-2002 Côte d’Ivoire was gripped by a severe political crisis whichled to a drying up of its external sources of funding. As a result, the country was forced to livewithin her means, and to cut back severely on discretionary government spending. Capitalexpenditure was reduced from 26.7 percent of government revenues to 8.8 percent in 2001-02.A similar situation of political crisis prevailed in Togo during 2000-2001, so that it is dangerousto rely on averages across WAEMU countries (especially given the large weight of Côted’Ivoire) to evaluate the success of regional surveillance.
Table IV.3. WAEMU: Convergence Criteria Values, Estimates for 2002Country Basic
fiscalbalance 1/
Publicdebt 1/
Inflationrate
Arrears Wage bill2/
Publicinvestm.
2/
Govt.revenue 1/
Currentaccount 1/
Benin -0.2 59.8 2.5 Decr. 32.7 22.0 14.3 -8.2
B. Faso -4.5 66.6 2.4 Decr. 41.1 43.4 12.8 -13.7
C.d’Ivoire 0.3 107.7 3.0 Incr. 44.5 10.6 15.9 -1.0
G-Bissau -7.3 396.4 3.3 Incr. 94.6 5.3 7.5 -21.1
Mali -1.5 88.3 5.1 -- 27.0 22.3 14.3 -8.1
Niger -2.1 91.4 2.8 Decr. 35.9 14.0 10.7 -9.7
Senegal 1.6 69.2 2.4 -- 29.9 21.7 18.3 -6.2
Togo -1.0 123.2 3.5 Incr. 46.0 9.1 12.6 -14.8
# meetingtarget
2 3 5 5 3 4 1 1
Source: Commission de l’UEMOA, Rapport semestriel d’éxecution de la surveillancemultilatérale, December 2002. 1/ as percent of GDP 2/ as percent of government revenues
Factors outside countries’ control also affect the recorded deficit and can complicate anevaluation of the success of regional surveillance. Since many of the countries concerned arehighly dependent for their export revenues and tax receipts on primary commodities whoseprices are beyond their control, it is natural to relate the fiscal deficit to changes in a country’sterms of trade, as well as to a measure of the cyclical position of the economy. An estimatedequation regressing the overall budget balance as a ratio to GDP for WAEMU (OB) on theoutput gap (YGAP) and the terms of trade (TOT) yields the following15:
ε+++−= TOTYGAPOB 075.0293.03.6(2.24) (2.68)
where the t-ratios are in brackets. Since these movements are largely exogenous to the countriesconcerned, it is important to account for the cycle and movements in the terms of trade whenevaluating macro-economic policies in WAEMU. If one sets the variables YGAP and TOT to
15 The overall balance was used in preference to the basic balance because of a longer availability of data.
10
their 1994 values and uses the above equation to generate a corrected deficit figure, the budgetbalance can be shown still to improve over 1995-98, and to deteriorate subsequently, when oneexcludes Côte d’Ivoire and Togo (Doré and Masson, 2002, Figure 5).
The contrast between raw data and a corrected deficit figure is even starker, but goes inthe other direction, for the CAEMC, since 4 of the 6 countries (Cameroon, Congo, EquatorialGuinea, and Gabon) have substantial production of crude oil and are highly sensitive to changesin the world price. Chad will be in this position also in a few years. For these countries, thoughunadjusted data from the post 1996 period seem to indicate greater budgetary discipline andreinforced regional surveillance--4 countries out of 6 meet the deficit criterion in 2002 (TableIV.4)--that impression is dissipated once account is taken of movements in the terms of trade, forexample by using a constant world oil price based on a decade average to calculate governmentrevenues. On the contrary, recent years have seen a deterioration of the underlying fiscalposition, calculated in this fashion, so that countries such as Gabon and Equatorial Guinea arehighly vulnerable to a decline in the world price for oil, despite apparently favorable fiscalpositions.16
Table IV.4. CAEMC: Selected Convergence Criteria, Estimates for 2002
Country Basic fiscalbalance 1/
Inflation rate Current account1/
Cameroon 1.3 4.5 -7.2
Central Afr.Rep.
-5.6 2.5 -4.8
Chad -22.3 3.0 -59.6
Congo 2.2 3.6 0.3
Eq. Guinea 11.4 6.0 0.1
Gabon 9.0 1.5 -1.8
# meeting 4 3 3
Source: BEAC, Notes de conjoncture, posted on izf.net, February, 2003.1/ in percent of GDP
In sum, the experience with regional surveillance over fiscal positions has been mixed.While an attempt to exert peer pressure over neighboring countries undoubtedly can havepositive effects, that pressure has to date been very light. Future developments may lead to areinforcement of the process, and a willingness to consider sanctions and apply them in caseswhere overshoots of criteria were the result of policy errors or lack of political will rather thanexternal factors beyond countries’ control. Effective surveillance should attempt to distinguishthe effects of policy from external forces, especially as concerns the terms of trade. Otherwise
16 See discussion in Wiegand (2002).
11
governments will easily meet the criteria in times of favorable world market conditions, but havelittle chance of succeeding when times are bad.
There is little evidence that monetary union in itself automatically provides the “agencyof restraint” that would discipline fiscal policies (Masson and Pattillo, 2002). This conclusionalso results from a detailed historical look at the period leading up to the devaluation of 1994.Guillaume and Stasavage (2000) document that even the rules on monetary financing wereundermined by successful attempts to exert pressure on state-controlled banks to borrow in orderto finance government deficits. This was especially true for large countries (Côte d’Ivoire inWAEMU, Cameroun in CAEMC) whose governments could influence the decisions of thecentral bank.
5. Costs of Monetary Union
Joining a monetary union has costs that are to the result of asymmetries across countries:these asymmetries would make a common monetary policy inappropriate for all or some of thepotential member countries. In these circumstances, as discussed by Mundell (1961) in aseminal article, and by many economists since then, separate currencies and flexible exchangerates may be desirable.
It is difficult to assess asymmetries without some standard of comparison. In a laterchapter, we will analyze proposals for a monetary union that would apply to the whole of WestAfrica, namely the members of ECOWAS (the Economic Community of West African States).In that chapter, we show that correlations of shocks to either the terms of trade or to real GDP areconsiderably higher among the WAEMU countries than with their non-WAEMU neighbors inECOWAS. Table IV.5 summarizes the correlations among WAEMU, CAEMC, and all Sub-Saharan African countries, by presenting the proportion of the regional variance of the change inthe log of the terms of trade or real GDP accounted for by the first principal component17. Eachof the two regions composing the CFA--WAEMU and CAEMC--exhibits a higher commonvariation than the rest of Sub-Saharan Africa, and therefore would, other things equal, be a bettercandidate for a monetary union than others in the region.18 The higher correlations could ofcourse be caused by the very existence of the monetary union, as countries may have becomemore similar and their fluctuations more highly correlated (Frankel and Rose, 1998). However,this is unlikely to apply to terms-of-trade correlations, since the choice of which primarycommodities to produce would plausibly not have been influenced by the monetary regime, norare the terms of trade endogenous to a small, open economy. Note that if one combines all theCFA countries, they are much less similar than they are separately, and the correlation for theterms of trade resembles that for the rest of SSA. This illustrates the fact that CAEMC is anexporter of oil, while WAEMU is an importer.
17 Principal components decomposes the total cross-country variance into orthogonal components that are linearcombinations of the underlying data. The first principal component is constructed to maximize the explainedvariance.18 Fielding and Shields (2001) however identify groupings of CFA franc zone countries where correlations arehighest and suggest reorganization of the CFA to reflect those groupings might be appropriate.

12
Table IV.5. Percent of Variation of Changes in the Terms of Trade and Real GDPwithin Regional Groups Accounted for by First Principal Component
WAEMU 1/ CAEMC 2/ CFA 2/ SSA 2/ 3/Terms oftrade
0.43 0.41 0.34 0.27
Real GDP 0.34 0.34 0.30 0.18 Source: World Bank Africa Database 2002; UNCTAD and World Bank (see Cashin et. al, 2003) Sample is longest available.1/ 1981-1999 2/ 1986-1999 3/ 45 countries
Another aspect of asymmetry, which we have discussed in Chapter III, is differences ingovernment spending propensities. This is important for potential monetary unions becausemonetary policy is likely to be influenced by the need to provide seigniorage to financegovernment spending—unless central banks are functionally independent and are prohibitedfrom providing monetary financing to treasuries, which may be difficult to enforce in practice.Thus, fiscal asymmetries should make independent currencies more attractive than membershipin a common currency area. Again, this is an issue that can only be evaluated by comparison toother sets of countries. We show in Chapter VI that differences in spending propensities, and inestimates of spending distortions, are less pronounced among WAEMU countries than inECOWAS as a whole.
Finally, potential costs from asymmetries can be mitigated by wage/price flexibility,fiscal transfers, and factor mobility between countries of a monetary union. More data is neededto give a definitive answer, but migration between countries of WAEMU seems moderately high(World Bank, 2000), even if there are episodes of backlash against immigration. Fiscal transfersamong countries are very limited, while wage/price flexibility is no doubt greater than in mostindustrial countries, especially in the informal sector.
B. The CMA in Southern Africa
The Common Monetary Area, which groups the Republic of South Africa, Lesotho,Namibia, and Swaziland, is characterized by eclecticism and adaptability. As described inChapter II, it has evolved from arrangements between the Union of South Africa and the BritishProtectorates in Southern Africa plus the League of Nations mandated territory of South WestAfrica. The monetary union continued to encompass these countries upon their independence,though Botswana left the CMA 10 years later, and agreements subsequently concluded allowedthe smaller members to issue their own currencies. The rand is legal tender in Lesotho andNamibia, but not in Swaziland. All three have their own currencies, which while not legal tenderin South Africa circulate to some extent in border areas of that country. Monetary policy isdetermined by the South African Reserve Bank (SARB) based on domestic South Africanobjectives; since 2000, the SARB targets the rate of inflation. Exchange rates within the CMAare not irrevocably fixed, but the currencies have always exchanged one-for-one. South Africashares seigniorage with Lesotho and Namibia, to compensate for the circulation of the rand inthose countries, but not with Swaziland since the 1986 decision by the latter no longer to acceptthe rand as legal tender.

13
The currency area is of interest in part also because Botswana shares many characteristicswith the member countries of the CMA, but since 1976 is no longer part of it. It continues to bepart of the Southern Africa Customs Union, SACU, which links the 5 countries. HenceBotswana provides interesting evidence on the relative importance of a common currency versuscommon membership in regional trade pacts in stimulating inter-regional trade19.
The CMA differs from the CFA franc zone by not having put in place regionalsurveillance over macroeconomic policies (though a larger grouping that includes CMAmembers, SADC, is beginning to institute such surveillance—see Chapter VII below). Instead,favorable circumstances or the discipline resulting from the inability of the smaller countries toextract seigniorage by running expansionary monetary policies has led to generally sustainablefiscal deficits and low public debt. South Africa itself, though facing significant problems thatinclude high unemployment, has generally followed conservative macroeconomic policies,helping to provide a pole of monetary stability to the region. Despite this, the rand experienced atrend depreciation against both the dollar and euro until mid-2002, and this allowed CMAcountries with higher inflation than South Africa’s, in particular Swaziland, to maintaininternational competitiveness when averaged across all their trading partners, so thatdeteriorating competitiveness with respect to South Africa was compensated for by increasedcompetitiveness abroad. A period of appreciating rand would make the conditions for achievinggrowth more difficult for them, and might put strains on the monetary union.
19 In practice, government revenue from the tariff sharing in SACU has dwarfed any seigniorage received by thesmaller CMA countries. The Customs Union Agreement concluded in 1969 provided for a generous share ofcustoms and excise revenues to paid to Botswana, Lesotho, and Swaziland and as a result constituted upwards of 50percent of government revenues for the latter two countries. Namibia was later included; South Africa received theresidual after a complicated calculation that guaranteed certain rates to the BLNS countries. A new agreementsigned in October 2002 provides for both more equitable division of revenues, and the creation of institutions forjoint decision making and administration of the tariff setting and collection to replace the dominance exerted bySouth Africa. The new agreement includes a “development component” favoring the smaller countries (exceptBotswana); that component is initially 15 percent of the excise pool and is distributed inversely to GDP per capita.Customs revenues are paid disproportionately to the BLNS countries, but excise revenues, minus the developmentcomponent and the costs of funding SACU institutions, are distributed proportionately to GDP. See McCarthy,2003.

14
1. The situation of countries in the CMA
Table IV.6 shows the large disparities in size among the member countries of the CMA.The Republic of South Africa, with a population of about 43 million people and the largesteconomy in Sub-Saharan Africa, dominates its smaller neighbors. Except for Lesotho and to alesser extent Swaziland, however, the countries are relatively similar to each other in per capitaincome terms.
Table IV.6. SACU: Selected Indicators(Average 1998-2001)
SouthAfrica
Lesotho Namibia Swaziland Botswana
Population (in millions) 1/ 42.80 2.15 1.74 1.05 1.60GDP per capita (current$US) 1/
2,941 417 2,000 1,297 3,299
GDP growth rate 2.1 3.3 3.2 2.7 6.5Inflation 5.8 7.7 6.2 7.7 7.4Broad money growth rate 12.3 7.0 8.4 8.2 22.5Fiscal position 2/ -1.6 -6.4 -3.5 -1.3 2.1Government Debt 2/ 45.5 14.4 … 22.2 9.1Current Account Balance 2/ -0.7 -16.5 3.9 -4.1 8.7
1/ Using data for 2000 only2/ As a percentage of GDP
Source: IMF and World Bank Africa Database 2002
The extent of intra-regional trade and labor mobility is high, resulting in substantialintegration, especially for South Africa, Lesotho, and Swaziland. Namibia is larger than Lesothoand Swaziland, and trades more with countries outside the CMA. Changes in Namibia’s termsof trade are less well correlated with those of South Africa than is the case for Lesotho andSwaziland. Indeed, for this reason, Tjirongo (1995) concludes that remaining in the CMA is notoptimal for Namibia. A contrary view of the net benefits of the CMA for Namibia is given byAlweendo (1999), who stresses the advantages of reduced transactions costs and the credibilityassociated with South Africa’s monetary policy.
Data on real per capita income show some evidence of convergence within the CMA, asthe coefficient of variation across countries has declined over the past 3 decades (Figures IV.4and IV.5). Thus, despite large remaining disparities, it may be argued that this region forms a“convergence club” (Jenkins and Thomas, 1996). However, convergence is even more evidentwhen Botswana is included, since that country, initially poorer than South Africa, is nowsomewhat richer in per capita terms. Botswana’s real GDP growth averaged 4.8 percent over1990-2000, compared to 1.7 percent in South Africa. In any case, convergence in the regiondoes not seem to depend on using the same currency, as Botswana since 1976 is no longer linkedone-to-one to the rand.
15
2. Monetary policies
South Africa has over the past decade moved from a pegged exchange rate, to a monetarypolicy with explicit monetary growth targets and a managed float of the rand, and finally to amonetary policy based on a target for the rate of inflation and a free float.20 Monetary growthtargets for M3 were pre-announced during 1986-98, but structural changes to the financialsystem made money demand unstable and altered the transmission mechanism. This led, inMarch 1998, to their replacement by M3 guidelines accompanied by an informal inflation targetof 1 to 5 percent. In order to reap the credibility benefits from increased transparency, SouthAfrica went to a formal inflation target in February 2000; the Minister of Finance announced aninflation target of 3 to 6 percent, to be achieved by 2002. The target is formulated for the rate ofinflation excluding mortgage interest costs, the CPIX, in order to remove the direct effects of theSARB’s interest rate policy on consumer prices. The SARB benefits from a long history ofindependence which allows it to use the instruments under its control—principally interest ratepolicy—to achieve its mandated target. However, South Africa, is a medium-sized, moderately-open economy that is strongly influenced by the external environment, and the SARB may missits target due to external shocks (to oil or diamond prices, or to international financial markets)as well as domestic shocks (such as drought or rises in indirect taxes). Escape clauses excusingthe SARB from reaching the inflation target include a sharp rise in the international oil price andinternational financial contagion. The effort to lower inflation suffered a big setback in the lastquarter of 2001 when the rand depreciated sharply. A range of contributory factors has beencited, including declines in world commodity prices, looser monetary conditions and delays inthe privatization program.
Post-1994 South Africa has experienced four periods of unusually severe balance ofpayments pressure, or currency crises: 1994, 1996, 1998 and 2001. During the first threeepisodes increases in the Net Open Forward Position21 (NOFP) played a key role—already atend-1994 it had reached the equivalent of 12 percent of GDP. During the post-1994 period, therand came under frequent attack, with very large losses and/or forward sales of reserves erodingthe progress in lowering the NOFP that had been achieved during calmer periods. Each of thecrises, except the last, was characterized by sharp increases in the NOFP, increases in interestrates and sharp depreciations. In 2001 the NOFP was at a substantially lower level than in earliercrises, and it did not increase during the crisis, as the reserve bank refrained from intervening tosupport the rand.
The different response of the SARB compared to earlier episodes indicates the evolvingstance of monetary policy,22 in particular the increased attention given to the inflation rate ratherthan to the exchange rate per se (though changes in the latter, if permanent, would feed throughinto domestic prices). In 2001, the SARB did not raise interest rates as sharply nor intervene inthe foreign exchange market. Consequently, growth was not significantly impacted andconfidence in the management of the economy remained high, as signalled by a rise in theJohannesburg stock exchange. In 2002, the rand recouped most of its 2001 losses, and after
20 See Casteleijn (2001) for a detailed discussion.21 The NOFP is the central bank’s forward liabilities in foreign currency minus its assets.22 See the discussion in Box 2, IMF Country Report 02/244.

16
appreciating further, its dollar exchange rate by March, 2003, was under 8 to the dollar, a valuelast seen in September, 2001. The appreciation should substantially reverse the inflationarypressures triggered by the earlier crisis.
Exchange rate flexibility has served South Africa well, arguably preventing some of theworst effects of contagion from financial crises in Asia in 1997-98 (Mussa et al., 2000). Anexchange rate peg to a major international currency (euro or dollar) might have led to a majorcrisis hitting South Africa, given the extent of its capital account liberalization and thesophistication of its financial markets. The smaller CMA countries (whose currencies arepegged to the rand) do not however benefit equally from thet flexibility of the rand, since theshocks hitting them are not the same as those impinging on South Africa—the shocks thatinfluence the setting of monetary policy for the CMA by the SARB.
Table IV.7, which reports on the asymmetry of shocks to the terms of trade shocks and toreal GDP growth, suggests that these countries behave quite similarly. Table IV.8 gives someevidence on the extent of trade integration within the CMA. Trade with South Africa isobviously very important to the smaller members of the CMA, but the gravity model gives mixedevidence on whether it may have been favored by the currency union. For Swaziland, the gravitymodel with currency dummies exactly predicts the extent of South African trade, whileNamibia’s and Lesotho’s trade with South Africa is considerably underpredicted. Botswana’strade with South Africa is bracketed by the predictions of the two versions of the model, makingit hard to conclude anything about the effect of currency union on trade within the CMA.
Table IV.7. Percent of Variation of Changes in the Terms of Trade and Real GDPwithin Regional Groups Accounted for by First Principal Component
CMA 1/ SACU 1/ SSA 2/ 3/Terms oftrade
0.44 0.36 0.27
Real GDP 0.43 0.37 0.18 Source: World Bank Africa Database 2002; UNCTAD and World Bank (see Cashin et. al, 2003). Sample is longest available.1/ 1981-1999 2/ 1986-1999 3/ 45 countries
Given the small size of the Swaziland, Lesotho, and (to a lesser extent) Namibia,payments to and from South Africa, including settlements of exports and imports and workers’remittances, are a very large proportion of GDP. Hence the reduction in transactions costsassociated with use of a common currency and the absence of exchange rate volatility whenconverting among CMA countries’ currencies likely dominates the potential costs due to loss ofmonetary policy autonomy. This no doubt provides an explanation for the durability of therelationship among the CMA countries. As noted in Chapter II, the willingness of the Republicof South Africa to accommodate the concerns of its smaller neighbors also is an important part ofthe story. Cohen (2000) describes the use of the rand in Lesotho and Namibia as a case of‘dollarization’, and argues that these countries are willing to make the rand legal tender becauseof side-payments by South Africa, in the form of offering to stand as lender of last resort to theirdomestic banking systems, and of providing direct compensation for the seigniorage involved.

17
Nevertheless, the CMA’s durability should not be taken to imply that there are nopotential stresses affecting the monetary union. The unemployment rate is high in all of theCMA countries: it exceeds 30 percent in Swaziland, and approaches that level in South Africa.Because inflation has been consistently higher in Swaziland (averaging 8 percent over 1998-2001, compared to 5.5 percent in South Africa), by some measures bilateral competitivenessrelative to South Africa has suffered23. As noted above, this has been compensated by thedepreciation of the rand against major currencies, helping to sustain Swaziland’s exports to thirdcountries. If the strength of the rand that prevailed early in 2003 persisted for an extendedperiod, however, the advisability of the link of the lilangeni to the rand might be called intoquestion. South Africa has shown increased attention to the concerns of its partners in the CMA,and the quarterly meetings of the SARB’s Monetary Policy Committee are since 2002 precededby meetings of the Governors of the member countries. However, there are clearly limits toSouth Africa’s willingness to move to a multilateral monetary union: SARB Governor TitoMboweni is quoted as telling the South African parliament's finance committee: "We haveagreed we will do some research on what the feasibility is of a common central bank for SouthAfrica, Lesotho, Swaziland and Namibia. It is not a bad idea -- but I don't think it will flypolitically -- it's a dead duck."24
Table IV.8. CMA and SACU: Trade with South Africa
CMABotswana Lesotho Namibia Swaziland
Actual Trade 1/ Percent of total trade 40 85 55 70
Percent of GDP 42 104 47 112Prediction of Gravity Model 2/
(percent of total trade)Without Currency Variable 45 38 18 47
With Currency Variable 39 64 39 70
1/ For 2001. Source: IMF Country Report 03/21, Box 42/ Predictions for 1997, using estimated coefficients from Box IV.1.
3. The case of Botswana
Botswana, almost a decade after achieving independence in 1966, created its owncurrency and central bank, and, unlike its neighbors, decided to break the exchange rate link withthe rand.25 Botswana has strong trade links with South Africa, though linkages are somewhat 23 However, the relative CPIs may not be a good measure of competitiveness, since they include the price ofnontraded goods which evolve differently from either traded goods prices or labor costs.24 “S.Africa's Mboweni-regional cbank idea ‘dead duck’” Reuters North American Securities News,June 24, 2003.25 The Bank of Botswana commenced operations on 1 July 1975, and the new currency, the pula, was introduced inthe course of 1976. The history of this period and the background to the decision to introduce the pula (whose namemeans “rain” or “blessings”) are described by the Bank of Botswana’s first Governor in Hermans (1997). He notes
18
lower than for the CMA countries—Lesotho, Namibia, and Swaziland—that retained the one-to-one parity (Table IV.8). As noted above, the gravity model does a good job in bracketing theextent of trade between Botswana and South Africa, with the model without the currencyvariable giving the more accurate prediction. As is true of its neighbors, Botswana also has arelatively high correlation between its terms of trade and those of South Africa. Botswana’smining sector accounts for about 35 percent of GDP, and diamonds (also important for SouthAfrica), account for about three-quarters of total exports (OECD, 2002). In contrast, SouthAfrica is much more dependent on manufacturing exports.
The objectives of Botswana’s exchange rate policy are to maintain exchange rate stabilityand to achieve low inflation. Exports of diamonds, because they are priced in dollars, are notsensitive to the exchange rate of the pula, but the authorities fear the effects of the “Dutchdisease,” namely that diamond exports would crowd out the development of other export sectors.The pula is pegged to a basket, with the peg adjusted from time to time. By keeping the nominaleffective exchange rate roughly constant and keeping the rate of inflation equal to that of tradingpartners, the authorities hope to keep the real effective exchange rate constant, thus helping toinsulate the rest of the economy from movements in the price and volume of diamond exports. Afurther benefit of the adjustable peg is that it diminishes the impact on the pula of rand volatilityagainst other currencies. Accordingly, Botswana introduced a peg to a basket consisting theSDR and the rand in June 1980.26 Since then, the pula has been revalued and devalued severaltimes against the basket. By the end of 2002, however, the pula had appreciated by about 60percent against the rand.
Botswana, as mentioned above, has been very successful in stimulating growth (indeed, itwas the fastest growing country in the world in the two decades after independence), and thoughits inflation rate has on average exceeded that of its main trading partners, it has been roughly thesame as South Africa’s in recent years (Table IV.6). Unlike many other central banks in Africawith independent currencies, the Bank of Botswana has not resorted to accelerating monetaryexpansion and continual depreciation. Its success had been due to the fact that the Governmenthas run persistent budget surpluses, making it unnecessary for the Bank to provide monetaryfinancing. On the contrary, Botswana has used the adjustable peg to maintained internationalcompetitiveness on average.27 Responsibility for setting the framework for how the external
that the IMF strongly warned against creating a separate currency because holding the necessary reserves would betoo costly, given Botswana’s “poor long-term economic prospects” (quoted by Hermans, 1997, p. 180). Fears thatthe population would not be willing to exchange their rand for a new, untested currency proved groundless, and bythe end of 1976 the Bank of Botswana had a comfortable cushion of reserves, as a result of foreign currency creditedto the new central bank by the Reserve Bank of South Africa in exchange for the rand currency withdrawn fromcirculation (Hermans, 1997, p. 187). The reserve position was strong enough that the Botswana authorities couldrevalue the currency in 1977 by 5 percent against the US dollar (to which the rand was also pegged). As the thenGovernor describes it with apparent glee: “The revaluation was greeted with disbelief in South Africa. TheGovernor of the South African Reserve Bank, Dr. T. De Jongh, who had advised so strongly against Botswana’swithdrawal from the Rand Monetary Area, was speechless when he was informed, as a courtesy, by the thenGovernor of the Bank of Botswana. The IMF also expressed surprise when it was officially informed of thechange.” (Hermans, 1997, p. 208).26 The weights in the basket are undisclosed, but roughly reflect trade weights. They are reviewed whencircumstances make it desirable to do so.27 Estimated interest rate reaction functions show that official rates respond positively to domestic inflation, but notto the real exchange rate (Bleaney and Lisenda, 2001).

19
value of the pula is determined is given to the President, but the latter has in this regard typicallyfollowed the advice of the Bank of Botswana and the Minister of Finance, whom he is requiredto consult (Hermans, 1997, p. 197). These developments have not led to speculative attacks (orstrong pressures to revalue), probably because the economy does not have well developedfinancial markets, in particular instruments allowing investors to take positions with respect tothe currency or domestic assets (see IMF Country Report 02/244). The credibility of the peg hasbeen enhanced by large foreign exchange reserves, which are a multiple of the domestic moneysupply (M2).
Because of persistent budget surpluses, capital inflows have not been able to takeadvantage of a large or deep market for government debt. Moreover, the short-term monetaryinstrument that is used to mop up liquidity, the Bank of Botswana Certificate, cannot be acquiredby non-residents. Sterilization of foreign exchange reserves has also been facilitated by the factthat the reserves have grown hand-in-hand with government deposits with the central bank, thelatter corresponding in large part to government revenues from diamond sales, which, due tobudget surpluses, have not all been spent domestically; a portion has been saved. Given its largefiscal surpluses and foreign exchange earnings, Botswana is unlikely to be a model for otherSub-Saharan African countries, which face greater demands on limited resources. It is alsoquestionable whether Botswana can maintain a strict basket peg, as financial markets becomemore developed and the strong growth in diamond revenues levels off. It seems likely that atsome point in the future Botswana may be forced to evolve away from its current exchange rateregime, as financial markets become more developed and open to outside investors. In such anenvironment, strong pressures to revalue or devalue the pula might at times develop. Exchangerate regimes with more flexibility or even greater commitment to fixity would be better able tocontain such pressures. The two likeliest alternatives would be an inflation target associatedwith a free (or managed float), or a move to a monetary union with her neighbors, in the contextof SADC or the CMA. This is discussed further in Chapter VII.
C. Conclusions
The experience of the CFA and CMA is varied, but it seems difficult to conclude that theexistence of a monetary union per se has been associated with a dramatic increase in regionaltrade and policy coordination. In the CFA zone, monetary union in the first three decades afterindependence was accompanied by relatively little coordination of other policies. Free tradeareas did not take hold, and there was no attempt at regional surveillance over fiscal policies orcommon banking supervision. It took the severe crisis of the late 1980s and early 1990s to spura major effort at regional integration, leading to new supranational institutions and greater inter-governmental cooperation. Even here, despite being governed by the same monetaryarrangements, the two regions of the CFA franc zone evolved somewhat differently, with greaterprogress made in the WAEMU than in the CAEMC. Similarly, the extent of intra-regional tradediffers substantially in the two regions, the former trading more than predicted by the basicgravity model, the latter about the same as predicted.
The CMA (with its predecessors) constitutes an even older monetary arrangement thatties the smaller countries to the rand, with asymmetry in size giving South Africa the power toset the monetary policy for the region. Lesotho, Namibia, and Swaziland thus delegate theirmonetary policy, even if they have their own currencies. Aside from the monetary arrangements,

20
there is no other macroeconomic coordination, such as limits on fiscal deficits, there there isclose contact in a number of areas (including as concerns the customs union). Thus, monetaryunion does not inevitably lead to, or require, regional macroeconomic surveillance.
The continued existence of both unions is due to special political circumstances as muchas economic imperatives. Without the active encouragement by France of its former colonies toremain in the CFA franc zone, and sanctions on non-compliers, it is likely that the monetaryunions in West and Central Africa would have dissolved, like those in the former Britishcolonies. In southern Africa, sharing the currency of an important neighbor with a crediblemonetary policy made economic sense. Given the importance of their trade with South Africaand the restricted domain for the circulation of their currencies, losing the possibility of anindependent monetary policy was not a great loss for Lesotho, Namibia, and Swaziland.However, it is likely that even that monetary union might not have survived without thewillingness of South Africa to adapt the arrangements to the needs of her neighbors, includingcompensating them for seigniorage and offering lender of last resort facilities.
It may be difficult, given the existence of relatively few monetary unions and the specialfeatures of each, to resolve conclusively the question of whether creating a monetary unionelsewhere in Africa can be expected to stimulate trade significantly. WAEMU and the CMA onthe one hand, and CAEMC on the other, provide opposing indications. In any case, based on thepredictions of the gravity model, trade cannot be expected even in favorable circumstances to beas large as with richer countries in Europe or elsewhere. Thus, stimulating regional tradeprobably should not be a preponderant argument in favor of creating currency unions in Africa.

21
Sources: World Bank Africa Database 2002, IFS 2002
Sources: World Bank Africa Database 2002, IFS 2002
Figure IV.1 WAEMU Countries: Real Per Capita Income in 1995 US dollars (using US GDP deflator)
0
200
400
600
800
1000
1200
1400
1985 1986 1987 1988 1989 1990 1991 1992 1993 1994 1995 1996 1997 1998 1999 2000
Rea
l GD
P pe
r Cap
ita ($
US)
Benin
Burkina Faso
Cote d'Ivoire
Mali
Niger
Senegal
Togo
Figure IV.2 CAEMC Countries: Real Per Capita Income in 1995 US dollars(Using US GDP deflator)
0
1000
2000
3000
4000
5000
6000
7000
8000
1985 1986 1987 1988 1989 1990 1991 1992 1993 1994 1995 1996 1997 1998 1999 2000
Rea
l GD
P pe
r Cap
ita ($
US)
Chad
Congo, Rep.
Equatorial Guinea
Gabon
Cameroon
Central Af ricanRep.

22
Sources: World Bank Africa Database 2002, IFS 2002, UNCTAD and World Bank (see Cashinet. al, 2003)
Sources: World Bank Africa Database 2002, IFS 2002
Figure IV. 3 CFA franc zone regions: Coefficient of Variation of Real Per Capita Income, in 1995 US dollars
0.0000
0.5000
1.0000
1.5000
2.0000
2.5000
1970 1972 1974 1976 1978 1980 1982 1984 1986 1988 1990 1992 1994 1996 1998 2000
WAEMU
CAEMC
SUB-SAHARAN
Figure IV.4 SACU Countries: Real Per Capita Income, in 1995 US dollars (using US GDP deflator)
0
1000
2000
3000
4000
5000
6000
1980 1982 1984 1986 1988 1990 1992 1994 1996 1998 2000
Rea
l GD
P pe
r Cap
ita ($
US
)
Lesotho
Namibia
South Africa
Swaziland
Botswana

23
Sources: World Bank Africa Database 2002, IFS 2002, UNCTAD and World Bank (see Cashinet. al, 2003)
Figure IV.5 SACU and CMA: Coefficient of Variation of Real Per Capita Income, in 1995 US dollars
0.0000
0.5000
1.0000
1.5000
2.0000
2.5000
1970 1972 1974 1976 1978 1980 1982 1984 1986 1988 1990 1992 1994 1996 1998 2000
CMA
SACU
SUB-SAHARAN

24
Box IV.1. The Gravity Model
The gravity model is usually specified to include as explanatory variables the product of the two countries’ realGDP, both in levels and per capita, the distance between them, and the land areas of the two countries. In addition, a numberof dummy variables are included to capture the possible effects of common features of the countries: membership in a freetrade area or currency union, a common language, border, or colonizer, etc. The gravity equation is typically specified inlogarithms, so that (time subscripts are omitted)
∑=
+++++=n
kkkji
j
j
i
ijiij DAreaArea
PopY
PopYYYX
133210 )ln()ln()ln()ln( βββββ
where X is the bilateral trade, Y is real GDP, Pop is population, Area is land area, and the D are various dummy variables.The gravity model has been applied to Africa in a number of papers, in particular, to test whether regional tradingarrangements have stimulated trade, and to explain why Africa generally trades less than other countries. For instance,Hanink and Owusu (1998) found that membership in ECOWAS had not promoted trade among its members. Foroutan andPritchett (1993) concluded that the low level of African trade is consistent with the gravity model, and is explained by lowlevels of GDP and distance. However, a more recent study by Subramanian and Tamirisa (2001) supports the view thatAfrica has not taken advantage of trading opportunities, and actually is becoming less integrated with the rest of the world.
Of greatest relevance to our study is the effect of membership in a currency union on trade. A widely cited recentpaper (Rose, 2000), using a global sample, finds that currency unions increase trade by about a factor of 3. While it is usefulto have the widest sample possible if that sample is homogeneous, it may also be the case that there are particularities in aregion that make it not comparable to others. Thus, we report below both estimates from the global sample and more limitedestimates, restricted to Africa.
Glick and RoseAfrica Only
with currency uniondummy
Africa Onlyw/o currency union
dummy
Log of Bilateral Trade Coeff. t Coeff. t Coeff. t
Economic Variables, in log formDistance -1.11 -47.28 -1.20 -24.78 -1.25 -25.37Real GDP 0.93 93.01 1.00 56.89 0.99 56.12Real GDP per Capita 0.46 30.18 0.39 14.90 0.39 14.96Land Area -0.09 -11.27 -0.17 -12.82 -0.16 -12.02
Dummy Variables
Currency Union 1.30 10.15 1.29 7.88Common Language 0.32 7.68 0.11 1.65 0.16 2.36Common Border 0.43 3.57 1.18 6.68 1.23 6.68Same Regional Trade Agreement 0.99 7.58 (dropped) (dropped)Number Landlocked (0,1, or 2) -0.14 -4.21 -0.17 -3.65 -0.17 -3.69Number Islands (0,1, or 2) 0.05 1.40 -0.17 -2.50 -0.18 -2.53Common Colonizer 0.45 6.45 0.40 4.17 0.53 5.65Both are Current Colonies 0.82 3.25 -0.78 -1.89 0.03 0.06Ever Colonized (or by) Partner 1.31 10.06 2.05 13.71 2.08 14.03Part of Same Nation -0.23 -0.22 2.20 5.36 1.98 4.20Constant -30.58 -81.16 -30.5 -44.09 -23.48 -43.30
StatisticsR2
No. Obs.0.64
219,5580.51
91,7910.51
91,791
25
As noted, the full estimate produces a large, and significant estimate for the effects of a currency union on trade.The estimates in column 1 of the table (which are identical to those in Glick and Rose (2001)) are consistent with the aboveeffect, since a coefficient of 1.3 on a dummy variable that is unity if the two countries are members of the same currencyunion yields a factor in excess of 3 ( 67.33.1 =e ).
When we estimate the identical model limited to African bilateral trade (including African countries’ trade with therest of the world) , the estimated effect of the currency union dummy is almost the same. Not surprisingly, perhaps, the“Common language” dummy variable becomes less significant (since the monetary unions in the sample are mainlycomposed of francophone countries). “Common border” becomes much more important, which is consistent with the poortransportation links between many African countries. Other dummy variables change substantially, including the sign of the“Number of islands” and “Current colonies” variables.
Disentangling the effects of currency union from regional integration initiatives such as preferential trading areas isdifficult, and the models reported in the table do not include dummy variables for the latter. Though the Glick and Rosestudy includes dummy variables for regional trading agreements, this dummy is zero for all pairs of African countriesbecause none of these agreements is registered with the World Trade Organization. It would nevertheless be worth exploringthe differential effects of the various agreements in Africa, among member countries of CAEMC, COMESA, ECOWAS,SACU, SADC, WAEMU, etc. One of the major problems however is that regional trading agreements overlap with monetaryunions, as is detailed in the text discussion of the CFA and CMA: each of the monetary unions is accompanied by free tradeareas (though the converse is not true). Another problem is that neither the CMA nor SACU is included in our sample forlack of bilateral trade data among its members.
10/8/03Chapter V. Experience Of Countries in Managing Independent Currencies
This chapter will describe countries’ experience with independent currency regimes, fromthe 1970s to the end of the 1990s. We consider almost all Sub-Saharan African countries that arenot currently members of monetary unions (the CFA Franc Zone or the CMA zone). Countriesare grouped into two broad categories; those that have moved to some form of flexible exchangerate system (the majority); and those with continued unilateral pegged (fixed or adjustable)exchange rate regimes. The purpose is two-fold. First, and most importantly, countries currentlyinvolved in proposals either to form or to join existing monetary unions have to evaluate thepotential desirability of such arrangements against the costs and benefits of the alternative:continued use of independent currencies, in either flexible or fixed rate systems. Specifically,countries planning to form the WAMZ and to revitalize the EAC would all be changing fromcurrently flexible rate regimes, and a potential COMESA or SADC monetary union wouldinvolve new monetary union status for both some currently flexible and some currently peggedrate countries. Secondly, by highlighting periods or situations during which exchange ratemanagement became a key macroeconomic issue, we draw out some key areas or “potential faultlines” that exchange rate regimes, including monetary unions, would need to be designed orprepared to deal with.1 In a few cases, the country vignettes discuss differences of opinionbetween the International Monetary Fund (IMF) and the country authorities on exchange ratepolicies. As the IMF is the primary international organization advising on exchange rates, theseinstances again highlight important, sometimes controversial issues, including the appropriatedegree of flexibility, sterilization of capital inflows, controls versus use of other policies inaddressing balance of payment pressures, and the appropriate level of the exchange rate forcompetitiveness.
One preliminary point: our flexible and fixed exchange rate groupings use officialclassifications published by the IMF, which are “de jure” or based on countries' self-reporting oftheir regime. Alternative “de facto” classifications based on actual behavior, discussed inChapter II, show that a number of countries officially classified as managed or independentfloaters actually behave more like intermediate regimes (very dirty floats or crawlingpegs/bands). The same is true, where data is available, for the smaller number of officialunilateral pegs.
To help visualize the set of countries considered, we present a map for SSA (Figure V.1)indicating officially designated flexible exchange regime countries (classified as managed orindependently floating) and pegged regimes, excluding monetary unions, as of 2001.
The plan of this chapter is as follows. First, we cover the evolution toward flexibleexchange rates, starting with a background overview of the general pattern of post-currency-board exchange arrangements, focusing on a regime characterizing many countries, thecontrolled economy, with rationing of both goods and foreign exchange. For various reasons, 1 Of course the experience of African monetary unions discussed in Chapter IV should alsoinform understanding of these issues.
- 2 -
these countries were not able to sustain their pegs, and began liberalizing payments regimes andsome form of market determination of exchange rates starting in the mid-1980s. We describevarious countries’ experience with flexible exchange rates, highlighting periods during whichexchange rate policies were a key macroeconomic issue.2 Second, country experiences from afew fixed rate countries are presented. A number of assessments arising from the countryvignettes follows.
A. Pre-Liberalization Regimes
Many post-independence governments sought to promote development by establishingimport-substitution industries. The primary policy instruments were a protectionist trade regime(restricting imports through increasingly cumbersome systems of tariffs, quotas, exchangecontrols and licensing), and state-owned enterprises. At the root of many of the problems duringthe 1970s and 1980s were high government deficits, financed by money creation, which led tohigh inflation. In combination with fixed exchange rates that were not adjusted, real exchangerates became increasingly overvalued. Excessive domestic credit creation and the overvaluedexchange rates also spilled over into high import demand. As devaluations were consideredpolitically dangerous to incumbents, countries reacted to balance of payments difficulties bytightening exchange and trade restrictions, leading to large parallel premiums for foreignexchange. Asset motives also generated demand for parallel market foreign exchange, asextremely high financial sector taxation, high inflation, and controlled low nominal interest ratesreduced the attractiveness of saving in domestic currency. At some point the authorities began tolose control of a vicious circle. Money financed deficits and foreign exchange controls led to anincrease of smuggled or misinvoiced goods (both exports and imports), resulting in decliningtrade tax revenues which further worsened the deficit and started the cycle again.3
The controlled/rationed economy describes the extreme form of these regimes—someAfrican countries exhibited less severe controls, for example in goods markets. In other regimes,while foreign exchange controls existed, the dominant characteristic of the regime was rather the“printing press” where any shocks, fiscal or external, were met with passive monetaryaccommodation (Zaire, Sierra Leone and Zambia during certain periods) (Honohan and
2 By focusing on periods on periods when exchange rate management became an important issueor problem, we risk overplaying the downsides of flexible rates relative to their potentialbenefits. Some additional positive effects are mentioned in the summary assessment.
3 These rationed economies in Africa have been examined in the literature. One type of analysiscontrasts dynamically unstable systems where market interventions and fiscal requirements arenot mutually compatible (which eventually must change radically or implode) (for example,Tanzania, Ghana) , with systems that, while grossly sub-optimal, display policies that lead to asustainable equilibrium (Kenya) (Bevan et al, 1990). Another approach focuses on the rentsgenerated by rationing that lead to the development of parallel markets with market-clearingprices for credit, goods and foreign exchange (Agénor and Haque, 1995).

- 3 -
O’Connell, 1997). Macroeconomic shocks led to almost automatic responses of prices and theexchange rate, as these systems lacked any nominal anchor.
An attempt to change these systems began anywhere from the mid-1980s for somepioneering countries, to the mid- or late 1990s for others. Reforms were often brought about bythe presence of a new government (and sometimes a new political ideology), an external crisis,or the combination of an unsustainable balance of payments position and conditionalities fromthe IMF/World Bank accompanying new adjustment loan programs.4 Movement toward moremarket-determined, flexible exchange rate systems became a centerpiece of reform programs inmany countries. The reform process has varied substantially across countries, from extremelygradualist to “big-bang” liberalizations. Many countries began with a mega-devaluation, andcontinued with periodic devaluations, or managed crawls, gradually liberalizing export surrenderrequirements, and other trade and exchange control regulations, while introducing additionalflexible exchange markets such as foreign exchange bureaus, auctions, or interbank markets.Reforms often culminated with the unification of the parallel market and the flexible exchangerate, that is the shrinking of the spread to very small levels. Even in countries where reformswere sustained, however, sizable parallel premiums often reemerged later during periods ofmacroeconomic instability or increasing effective market segmentation.
Table V.1 indicates the dates when countries adopted flexible exchange rate regimes.5These dates often correspond to initiation of a comprehensive liberalization program. The tablealso shows dates when countries accepted the current account convertibility associated withArticle VIII status under the IMF’s Articles of Agreement—most, but not all, of these flexiblerate countries also have current account convertiblility.
B. Country Experiences with Flexible Exchange Rates
What has been the experience of SSA countries with flexible exchange rate systems?Rather than attempting comprehensive coverage, we will describe several categories of countriesthat have undergone periods during which, for similar reasons, exchange rate policies were a keymacroeconomic issue.6 Clearly, this categorization is not meant to describe the countries’ entirehistory with flexible exchange rates.
4 Early success stories such as Ghana also inspired other countries to undertake difficult reformspreviously viewed as politically dangerous and not likely to work.
5 Most of these regimes are still in existence; footnotes indicate where this is not the case. Also,the footnotes indicate periods of earlier, unsuccessful attempts at flexible regimes.
6 The only flexible rate countries not covered are selected war-torn countries (Rwanda, SierraLeone, Somalia), as well as a few others (Guinea-Bissau (flexible from 1983-97 when it joinedWAEMU), Malawi, Mauritania, Sao Tome and Principe). South Africa was discussed inChapters II and IV.
- 4 -
Several themes emerge. Although notionally flexible, the extent to which exchange rateshave been market determined under these systems varies significantly. Rates are often heavilymanaged through central bank intervention, changing rules or regulations in auction or interbankmarkets, or institution of temporary trade or payments controls to affect the path of the exchangerate. Efficient operation of flexible rate systems is made difficult by underdevelopment offinancial markets, and structural conditions such as the extreme seasonality of foreign exchangereceipts. Exchange market liberalizations resulted in initial large real depreciations, although inlater years real exchange rates have often fluctuated around a constant trend or appreciated.While it appears that real exchange rates have been adjusting to terms of trade movements, withfewer periods of serious misalignment than earlier regimes, adequate adjustment may not havetaken place in some countries. During different periods, many countries exhibit “fear of floating”(Calvo and Reinhart, 2002). Fear of depreciation often stems from concerns that rapiddepreciation will increase inflation, while fear of appreciation relates to concerns about exportcompetitiveness. In the context of appreciation fears when there are large aid inflows, limitedsterilization options can lead to high and volatile interest rates, fiscal pressures, and volatileexchange rates.
1. Continued Severe Macroeconomic Instability, and/or Limited Stop-StartLiberalization
The most extreme example of this pattern is the Democratic Republic of the Congo(DRC). DRC has been technically classified as a floating exchange rate system since it firstattempted to float the currency in the context of an interbank market in 1984 (See Table V.1).Although there was some success in narrowing the huge parallel market premium, the centralbank came under intense political pressure to slow the speed of depreciation, and so a premiumreemerged. The authorities tried floating again in 1991, but the policy was again complicated byanti-depreciation pressure and lack of bank notes, so that a complicated multiple rate systememerged instead. This was the start of the hyper-inflation period of 1990-96, where thecumulative increase in prices was 6.3 billion percent. The primary cause of hyperinflation wasthe uncontrolled budget deficit financed by money creation, a deficit arising from the breakdownof public administration in the context of political instability, governance problems, civil strifeand war (Beaugrand, 1997). Hyper-inflation created a vicious circle of a breakdown in financialintermediation, an uncontrolled spiral of parallel exchange rate depreciation, and increaseddollarization, that all further compounded the fall in fiscal revenue. Following a brief respiteafter 1996, resumption of the war in 1998 led to a similar cycle of budget monetization, highinflation and depreciation, now under a fixed rate system (IMF Country Report 01/123) . In aneffort to conserve foreign exchange for official uses, the system was progressively tightened,leading to the banning, in January 1999, of domestic transactions in foreign exchange, andculminating with the banning of domestic holding of foreign currencies. A floating rate wasreintroduced in 2001, resulting in a large depreciation and re-unification of multiple rates.
The pattern in Angola was similar in many respects. A first attempt at a flexibleexchange rate system in 1994-95 made some initial progress in lowering the 9000% parallelmarket premium, but the very small amounts of foreign exchange allocated to the flexiblesystem, highly over-expansionary fiscal and monetary policies, and external pressures led tolarge rapid depreciation. The exchange rate was re-fixed in 1996. Subsequently, a number of

- 5 -
currency exchanges (introductions of new currencies involving changes in parity) took place.Another attempt at a float occurred in May 1999, but the very large depreciation, andintensification of the war led back to triple digit inflation in 2000.
Sudan has had a two-decade long history of attempted exchange market reform. One ofthe main objectives of reforms in the 1980s was to increase the share of remittances (from thesizable community of nationals working abroad) brought through legal channels. The authoritiesattempted to unify the exchange markets through discrete maxi-devaluations and gradual tradeliberalization, but failed, largely due to lack of fiscal reform(Elbadawi, 1997). From 1992-96, theauthorities again undertook several unsuccessful reform efforts, now in the context of anexchange rate system classified as flexible. However, attempts were often partial, significantmarket segmentation continued, and regulations were often changed. Again, lack of supportingfiscal polices and foreign exchange reserves hampered reforms (IMF Country Report 99/53).Another gradual attempt beginning in 1997 achieved unification of exchange markets in 1998;however from 1999-mid-2001, the central bank dictated that the market determined rate had tomove in a certain range. A managed float implemented through an auction was introduced in2001, but the narrow exchange rate band, and the administrative restrictions and accommodationused to respond to the negative terms of trade shock indicated that the system was still heavilymanaged. The authorities have committed to use newly developed monetary policy instrumentsin the future to respond to exchange market pressures (IMF Country Report 02/245).
Nigeria began a structural reform program in 1986-90, but since then economicmismanagement, and stop and go policies, particularly regarding the exchange rate, havecontributed to high and variable inflation and a generally overvalued RER. In 1994 thegovernment reimposed interest rate ceilings, and eliminated the free market for foreignexchange, pegging the currency at an overvalued rate. Partial deregulation began again in 1995,with the liberalization of exchange rate controls, restoring of foreign exchange bureaus, andintroduction of a dual exchange rate regime, with an administratively determined official rate anda flexible auction rate (Moser et. al, 1997). Relatively prudent fiscal and monetary policiesduring 1996-7 together with high oil prices contributed to reducing inflation from a peak of 77percent in 1994 to 10 percent in 1997, and increasing average real GDP growth to 4 percent.Economic growth, however, continued to be hampered by fuel, power and fertilizer shortagesand political uncertainties.
By early 1998, Nigeria had a multiple exchange rate system: an artificially overvaluedofficial rate for government and oil transactions, an “autonomous foreign exchange market”(AFEM) with a rate administratively determined in a managed float (with reference to theinterbank and parallel rate, and supported by net infusions of foreign exchange from oil exports),plus foreign exchange bureaus and an active parallel market. Access to foreign exchange forcurrent account transactions was quite liberal, although some restrictions remained. TheAbubakhar administration abolished the official exchange rate in 1998. Some initial progresswas made in the face of sharp drops in petroleum revenues, but then large extra budgetaryexpenditures increased the budget deficit to over 8 percent in the first half of 1999, financed bycentral bank credit. Although some initial progress occurred with democratically-electedPresident Obasanjo in June 1999, by 2000 severe macroeconomic imbalances had increased asthe deficit surged with pressures to deliver a “democracy dividend”: expenditure dissipated the
- 6 -
large windfall oil gains, inflation accelerated to double digits and instability dominated theforeign exchange market. (IMF Country Report, 01/131). After abolition of the AFEM andsuccessful introduction of the interbank market (or IFEM) in 1999, the central bank prohibited in2000 the transfer between banks of foreign exchange purchased from the central bank, leading tothe segmentation of the IFEM with two distinct rates (one effectively a predetermined rate), andthe widening of the parallel market premium. Macroeconomic instability continued and by 2002,facing a rapid decline in international reserves, the authorities were forced to carry out a series ofdevaluations and later adopted a new Dutch auction system (DAS). The depreciation thatoccurred helped lower the premium and stabilize the market, although it still remains segmentedand excessively regulated (IMF Country Report 03/3).
Lessons: It is difficult to successfully liberalize and make more flexible the exchangeregime, when monetary, and particularly fiscal policies, are excessively expansionary.Conditions during hyper-inflation are merely the most extreme example. In addition, stop-start,or extremely gradual liberalizations where there the real objectives of policy-makers are unclear,are less likely to be successful, most likely as agents lose confidence in the credibility of thereform.
2. Poor Management of Fiscal Policies and Large External Shocks
Ghana’s 1983-91 reform program achieved initial successes in sharply turning aroundnegative growth, triple digit inflation and parallel market premiums, and a large part of economicactivity in parallel markets (Kapur et. al, 1991). Gradual liberalization of the exchange and tradesystem was the centerpiece of the reform program. Loss of fiscal control after 1992, however, ledto high and variable inflation (Pellechio et. al, 2001). In 1999, Ghana suffered a major TOTshock, as world prices for its main exports cocoa and gold plummeted, and oil prices doubled.Neither fiscal nor monetary policies responded appropriately, however. The governmentmaintained too high a cocoa price for farmers that severely compromised revenue from cocoataxes and borrowed from the banking system to finance the resulting higher deficit. Fearing thatrapid depreciation would further stoke inflation, the Bank of Ghana intervened in the foreignexchange market to slow nominal depreciation, resulting in continued real appreciation of thecedi. The central bank was finally forced to abandon this strategy in November 1999 whenreserves were run down to dangerous levels (IMF Country Report 01/141).
An initially very high real appreciation followed Zambia’s move to a flexible exchangerate system in 1992, in the context of triple-digit inflation, high copper prices, and high interestrates that attracted some private capital flows. The introduction of a cash-budget rule in 1993succeeded in ratcheting down inflation (Adam and Bevan, 2001).
The stability of the nominal exchange rate since 1996 and the dominant role of theZambia Consolidated Copper Mines (ZCCM) in the foreign exchange market have raisedquestions about the true degree of exchange rate flexibility, but the authorities’ view was thatZCCM played a stabilizing role. The late 1990s illustrate the volatility Zambia faces. During1998-99 both copper and agricultural production were depressed, the budget in larger deficit thanplanned, and the external position had weakened because of uncertainty regarding protracteddelays in the ZCCM privatization, donors’ withholding of aid, and inappropriate macroeconomic

- 7 -
policies. The currency depreciated sharply and there was a large loss of reserves. Theinflationary impact of the steep depreciation complicated anti-inflation policy, and failure totighten money contributed to continued currency weakness and creeping dollarization.Performance bounced back in 2000-01 given the recovery of the privatized mining sector, aswell as manufacturing and services. A sizable appreciation of the real exchange rate ensued. Thesituation was reversed again in 2002 with the withdrawal of Anglo-American, declining copperprices and drought, which lowered growth and increased inflationary pressures. Although therehas been volatility in the real exchange rate, this measure of competitiveness has remainedbroadly unchanged since the mid-1990s, despite a large deterioration in the terms of trade andpersistently large current account deficits.
Lessons: Policy-makers perceive there are conflicts involved trying to both controlinflation and maintain a competitive real exchange rate, particularly when the terms of trade aredeteriorating. In this environment, losses of fiscal discipline in the face of external shocks cancontribute to accelerating inflation and macroeconomic volatility.
3. Challenges in Monetary Management of Recent Large Aid Inflows7
Before summarizing country cases, we describe a few common background featuresrelevant to the experience of Uganda, Tanzania and Mozambique in managing large aid inflowsduring the late 1990s-2002. Each country implemented deep structural reforms, includingexchange rate unification (Uganda, 1992, Tanzania, 1994, Mozambique, 1993), achievedconsistently tight fiscal positions, and experienced rapid growth during the late 1990s-2002. Allthree countries emerged from their stabilization phases with very low levels of domestic moneydemand8 and of domestic debt and very thin markets in government securities. Against abackdrop of already high aid inflows, there was a surge in new aid starting in the late 1990s—forinstance, net donor inflows amounted to 11 % of GDP in Uganda in 2000/2001. Given the strongnon-tradable bias in public expenditure, all three countries are generating net domestic liquidityinjections from government which are large relative to the existing levels of debt and money. Inaddition to aid inflows, the countries have also experienced substantial increases in privatecapital flows.
Uganda’s recent aid surge came at a time of a sharp deterioration in the terms of trade,given the world slump in coffee prices. Although the exchange rate was notionally flexible, theBank of Uganda did not adhere to the strategy of sterilizing the liquidity through sale of foreignexchange proceeds to the private sector (i.e. by letting the exchange rate float)—because of itsunwillingness to let the exchange rate appreciate in the face of the TOT deterioration. Instead,the Bank initially attempted sterilization through the domestic debt market, but given therequired scale of the sterilization, this led to a rapid increase in domestic interest rates, debt stockand debt service costs-- so rapid, that the Bank reversed its strategy in 2001, although initiallywithout sterilizing through foreign exchange sales (IMF Country Report 03/97). Reserve money 7 This section draws on Adam et al. (2003).
8 At the end of the 1990s, reserve money in each country averaged around 4 percent of GDP.

- 8 -
grew much faster than programmed, and the IMF and Uganda’s Ministry of Finance pressuredthe Bank to let the exchange rate float. The episode led to high volatility in interest rates and theexchange rate, but inflation still remained low, and the RER did not appreciate.
In Tanzania, motivated by a similar fear of RER appreciation as in Uganda, the Bank ofTanzania responded to the aid surge by, in effect, abandoning its flexible exchange rate, andaccumulating foreign exchange reserves in order to target the nominal exchange rate (IMFCountry Report 03/2). The shilling first depreciated against the dollar in 1999 and then was heldconstant for 18 months before depreciating again in 2002. Initially sterilizing the liquiditythrough domestic debt sales, concerns over interest costs led the Bank to fix bond prices tostabilize yields. With both conventional sterilization instruments now essentially frozen, reservemoney grew rapidly. Tensions emerged between the Bank of Tanzania, which argued that theeconomy was experiencing a structural shift in money demand, so that it was unnecessary andinappropriate to fully sterilize the growth in reserve money, and the International MonetaryFund, which took the position that any increase in money demand was likely running its courseand the strategy risked re-igniting inflation (IMF Country Report 03/1). As of February 2003,while the RER had appreciated, there was no evidence of a resurgence in inflation.
A surge in private capital inflows preceded the rapid aid increase in Mozambique, andthe reserve build up was sterilized through the fiscal channel, by falls in net domestic assets asthe government accumulated deposits. But by late 1999 and into 2000, official aid flows hadincreased, and the previously tight fiscal stance was loosened somewhat, partly due toreconstruction expenditures and lower revenues reflecting a massive flood crisis. Now althoughthe Bank of Mozambique was not attempting to offset an exchange rate appreciation, it was stillreluctant to sterilize, arguing as in Uganda, that the increase in reserve money was non-inflationary and reflected a recovery in money demand. (IMF Country Report No. 01/17). In thiscase, however, there was a sharp increase in inflation.
Lessons: Countries facing large aid inflows face particular difficulties in determiningsterilization policies when inflows are likely to be long-lasting. Fear of appreciation limitsforeign exchange sterilization (so the exchange rate is managed to prevent appreciation). Thus,domestic bond sterilization must play a major role, but lack of depth in domestic debt marketsmeans that large-scale bond sterilization leads to large increases in domestic interest rates anddebt service costs with adverse effects on the deficit. Assessing whether a strategy of letting aidflows increase the monetary base (limited sterilization) will be inflationary is also complicatedby uncertainty about the underlying demand for money (and rapidly changing conditions). As forthe divergent views of the IMF and country authorities on this issue, to date evidence “on theground” is mixed. (In Uganda and Tanzania, but not Mozambique, inflation has remained lowdespite instances of rapid growth in reserve money, suggesting the countries’ preferred strategyof limited sterilization is appropriate.)
4. Private Capital Flows
Following a comprehensive liberalization program began in 1991 (with foreign exchangeliberalization completed by 1994), but failing to correct an underlying fiscal problem, theZimbabwean authorities assigned too many objectives to monetary policy: controlling inflation,

- 9 -
managing the exchange rate (attempting a constant RER rule), and stimulating real activitythrough interest rate policy (Ellyne, 2000). High budget deficits resulted in rapid accumulationof domestic debt, high inflation and correspondingly high interest rates. Private capital inflowsfrom 1993-mid-96 put pressure on the RER. The authorities’ response was nominal depreciation,accumulation of reserves, and partial sterilization through treasury bill sales. This led, however,to the classic cycle of higher interest rates, more inflows, and higher budgetary costs. By 1997, itbegan to be clear that the government had switched to money creation to finance the deficit,while trying to force interest rates lower. With classic signs of an impending crisis (excessmoney balances, overvaluation, declining reserves) the market looked for signs of a policyreversal in the government’s budget for 1997, but saw the opposite, and a currency crisis ensued(IMF Country Report 01/13).
Following exchange market unification in 1993 in Kenya, the policy focus was to keepreserve money on its targeted path while intervening in the foreign exchange market to minimizeappreciation. Early capital inflows led to a similar scenario as in Zimbabwe: in 1995 the CentralBank of Kenya tried to bring interest rates down, but this led to a big redemption of treasurybills, capital outflow, and pressure for depreciation of the exchange rate. After a successfuldefense, the Bank returned to a high interest rate policy to stabilize the exchange rate and buildreserves (Ndung’u and Ngugi, 1999). Although unlike Zimbabwe, there was not the hugeunderlying fiscal problem, capital flows again put pressure on the exchange rate in 1996, and ledto classic sterilization cycles. The non-bank public also shifted into holding government paper,which may have depressed money demand, and inflation increased. Tables turned, however,when the IMF suspended its program in 1997 because of governance problems, and other donorsalso pulled out. Following an initial response where investors pulled out of government paper,reserves dropped and the currency depreciated, later a fragile stability returned to the financialmarkets. In 1999 central bank intervention in the exchange market was limited to achieving thereserve target (replenishing the foreign exchange the government sells to the government toservice the external debt, while gradually building reserves) and fiscal steps became the key toavoid pressure on the exchange rate. From 2000-02 the nominal and real exchange rate remainedrelatively stable, despite worsening of the terms of trade. However, the authorities' view was thatexchange rate stability may have reduced currency risk premiums and interest rates over theperiod (IMF Country Report 02/85).
Lessons: Attempts at targeting the real exchange rate and controlling inflation in the faceof significant capital inflows can lead to crises, particularly if the underlying problem—the largebudget deficit—is not controlled (Zimbabwe). Trying to target the real interest rate below itsequilibrium value can also contribute to loss of confidence in monetary policy. Budget financingbecomes sensitive to expectations about policies, when high interest rates associated withsterilization policies lead to significant treasury bill holdings by the bank and non-bank sectors.
5. Notionally Flexible Exchange Rates with a Controlled, Single State-BankDominated Financial Sector
After a socialist history of extensive controls, Ethiopia liberalized its foreign exchangemarkets with the introduction of an auction market in 1994. The first test of the system was the1994/95 coffee boom, where the ability to control monetary and inflationary effects was limited

- 10 -
by import restrictions and the maintenance of 100 percent export surrender requirements, so thatexporters could not use foreign exchange to import capital goods, for example. Policy responseswere generally in the right direction, but relatively weak. For example, the amount allocated tothe foreign exchange auction was increased, but not enough to prevent excess demand forimports and an inflationary increase in net foreign assets. Upward pressure on prices was adisincentive to keep wealth in birr-denominated assets, but as there were no other assets besideforeign exchange, the parallel premium increased (IMF Country Report 96/52).
After some “first-generation” liberalizations, the process stalled and regulations remainedburdensome (IMF Country Report 99/98). The nominal and RER were kept quite stable. Theinstitutional structure of the exchange market was changed to an interbank market in 1999, butthere has not been much activity. Clearly, it is difficult to have a genuine market when thefinancial sector is heavily dominated by a single state bank.
Lessons: It is difficult to have a flexible exchange rate system with continued tight tradeand payments restrictions and controlled financial markets so that there are no other domesticassets. Demand for foreign exchange for trade and asset motives will continue to encourage theparallel market. Institutional set-ups for generating exchange rate flexibility are severely limitedin state-bank dominated financial sectors.
6. Heterodox Trade Liberalization Accompanied by Limited Liberalization ofForeign Exchange Markets
Mauritius has achieved strong export-led growth during the past three decades,notwithstanding the limited liberalization of its foreign exchange markets that took place duringits adjustment period 1980-86. Trade liberalization during this period concentrated oninstitutional reforms to ensure that returns to exporting were high, while the regime remainedhighly restrictive on the import side (Subramanian and Roy, 2001). Success allowed theauthorities to resist the Bretton Woods institutions’ calls for further import and exchangeliberalization, arguing that reforms would not be sustainable as the balance of payments andbudget would worsen (Bundoo and Dabee, 1999). Mauritius waited to liberalize exchangecontrols in the context of a managed float until 1994, when foreign exchange reserves weresteadily rising and it was clear there would not be excess demand for foreign exchange. Theexchange rate was managed to ensure some real depreciation. Later, in 1999-2000 the lack ofsensitivity of the exchange rate to market pressures meant that the real exchange rateappreciated, perhaps more than necessary. In this instance, the authorities were interested indampening entrenched depreciation expectations to force the tradable sector to improvecompetitiveness through cost reductions and productivity improvements. There was somedisagreement with the IMF on the authorities’ response to the appreciation by providing targetedexport subsidies and reimposing surrender requirements, when the appropriate responseaccording to the Fund, was monetary tightening. (IMF Country Report 01/77). The Mauritianposition was that interventions were necessary because of the thinness, seasonality, andconcentration of foreign exchange suppliers that make the foreign exchange market vulnerable todisruptive movements.

- 11 -
Lessons: Even in very export-oriented markets, thinness of the foreign exchange markets(which are still small) leads to dilemmas regarding whether intervention or monetary policychanges are appropriate responses to excessive appreciations or depreciations. Success withheterodox trade liberalization (selective controls and interventions) may encourage theauthorities to pursue heterodox exchange market liberalization, although it is not clear if thisstrategy works well.
7. Institutional Problems With Operating A Flexible Rate When Financial Sectorsare Under-Developed
While the Gambian economy has had its ups and downs since the beginning of theEconomic Recovery Program in 1986, the market-based flexible exchange rate is generallyviewed as having served the economy well. However, while the system has had some favorablemacroeconomic effects, like in many African countries, an underdeveloped financial sectorcontinues to limit efficient operation of the exchange market. We thus use The Gambia tohighlight the institutional difficulties of operating a flexible exchange rate system in a financialsector with limited competition and large structural problems. While the system operates throughan interbank market, by the late 1990s, activity in the market was still limited as authorizeddealers avoided revealing their financial positions to each other and rarely dealt amongthemselves, preferring instead to deal with the central bank, or sometimes with the parallelmarket. (Some improvement was registered by 2002). Spreads of 3-5 percent between theinterbank and the parallel market (the foreign exchange bureaus that transact mainly in cash)reflected limited competition in the interbank market and the efficiency of the informal market.Although the market has been liberalized, there is a prudential limit on the amount of foreignexchange that commercial banks can hold—which sometimes makes banks dependent on short-term credit from their overseas partners or parents in order to meet the demand for foreignexchange (IMF Country Report 99/71). Foreign exchange transactions costs are high, and banksare not allowed to accept foreign currency deposits, although that policy was under review in2001. At times of pressures or turbulence in the foreign exchange market, spreads of 10 percentor so often emerge for a period as the parallel market adjusts much more quickly than theinterbank market. For example, in 2000/2001 the central bank attempted to meet pent-up demandfor foreign exchange in the interbank market using competitive bids (rather than selling atprevailing rates) to reduce spreads that were over 15 percent (IMF Country Report 01/148).
The interbank market in Guinea during the 1994-99 period illustrates similar institutionalproblems. Before September 1999, the foreign exchange market was highly segmented. Anofficial market was dominated by state enterprises and donors, who operated through two largebanks, and by large importers. The rest of transactions took place in a so-called parallel marketof foreign exchange bureaus, many of which gained official status when licensing was allowed in1997. The spread between the two rates was between 4-6 percent until mid-1998, when it beganwidening, as the authorities began propping up the official rate. By early 1999 the parallelmarket accounted for about 60-70 percent of the foreign exchange market and the spread was 10-15 percent. Market segmentation became more pronounced, with “shortages” while those withaccess to official rates earned substantial rents. The central bank introduced a weekly auction forforeign exchange in 1999, which helped to reduce the spread significantly (IMF Country Report00/33). Since then the spread has remained below 2 percent, although with periodic spikes
- 12 -
during periods of central bank interventions to prop up the currency, as for example in the firstquarter of 2000. The market is still quite segmented, however, between the auction market(commercial banks, authorized bureaus and the central bank) and the unofficial parallel market(unauthorized agents transacting mainly in cash, but also through off-shore accounts). Theparallel market is increasingly involved in transactions of the informal mining sector. There is ageneral shortage of foreign exchange on the official market, and given the banks’ lack ofconfidence in each other, there are no interbank transactions between auctions (where thebidding does not appear to be purely competitive). In 2001 the central bank progressivelylengthened the intervals between auctions in order to try and reduce pressure for depreciation onthe exchange rate (IMF Country Report 02/153).
Lessons: Efficiency of interbank markets is limited when structural problems in thefinancial sector and lack of information inhibit banks dealing with each other, or the market ishighly segmented to include only a few large banks and other players. These problems ledGuinea to change to an auction market, an arrangement which relies less on well-functioningfinancial markets, but is subject to other difficulties. Generalized excess demand for foreignexchange on official markets may lead authorities to manipulate institutional arrangements toease depreciation pressure.
8. Summary of Performance in Pre-Flexible and Flexible Periods9
How have the countries that have moved to flexible exchange rate systems performed interms of key macroeconomic indicators? Table V.2 summarizes average performance acrossthese countries during their flexible periods, as well as two pre-flexible periods: the 5 years and10 years prior to changing to a flexible rate system.10 ( See Appendix Table V.1A-1C for thecountry specific averages and time periods covered). War-torn countries are excluded aseconomic performance is heavily dependent on the effects of the conflict, and this exclusionsignificantly affects the overall averages. First, following Calvo and Reinhart (2001), anexchange rate flexibility index is calculated, as the ratio of the variance of monthly percentchange in the exchange rate to the sum of variances of monthly percent change in the exchangerate and reserves. According to this index, exchange rate regimes in these countries have indeedbecome more flexible in the de jure declared flexible periods, although the size of change in theaverage index is not extremely large.
9 In addition to these groups of countries above, the case of Madagascar warrants mention. Monetary nominalanchors have not succeeded well there in controlling inflation, and the problem does not seem related to underlyinglosses of fiscal control (Azam, 2001). The adjustment of inflation to disequilibria in the money market is relativelyslow, there is high pass-through from the exchange rate, and inflation inertia is quite strong (Sacerdoti and Xiao,2001).
10 Countries included in the averages table are those covered in the vignettes (Ethiopia, Ghana, Guinea, Kenya,Madagascar, Mauritius, Mozambique, Nigeria, South Africa, Sudan, Tanzania, The Gambia, Uganda, Zambia, andZimbabwe), as well as additional flexible rate countries (Guinea-Bissau, Malawi, Mauritania, Sao Tome andPrincipe) but excluding war-torn countries (Angola, Burundi, Democratic Republic of Congo, Liberia, Rwanda,Sierra Leone, Somalia).
- 13 -
Next, we look at a number of macroeconomic indicators. The idea is not to argue forcausal relationships--in examining unconditional changes across periods, clearly factors otherthan changes in the exchange regime could be driving differential performance. In general,macroeconomic indicators have improved in the more recent flexible exchange rate period forthese countries. Growth in both real GDP and real GDP per capita is on average higher. Inflationand black market premiums are generally lower. Appendix Tables V.1A-1C show a significantdegree of variance across the countries, however: the average black market premium in flexibleperiods would be substantially lower excluding Nigeria, and inflation falls more excluding Sudanand Zambia, two very high inflation countries.
Table V.2 also indicates that real effective exchange (REER) rates have depreciated onaverage, during these countries’ flexible periods, after appreciating during the pre-flexibleperiods. Figure V.2 graphs the country-specific REERs, with a vertical bar in each panelindicating the year of movement to a flexible regime. One of the most important fundamentalsassociated with the real exchange rate, a real commodity price index (see Cashin et al, 2002), isalso shown, to illustrate the extent to which movements in the REER are influenced bycommodity prices, in the pre- and post-flexible periods. For most of the countries, the graphsshow that the movement to a flexible exchange regime was accompanied by a large depreciationof the REER. On average, REERs remain more depreciated in the flexible period, and for anumber of countries, exhibit a continual depreciating trend after the adoption of flexible rates.
Finally, the last column shows that fiscal deficits are on average very similar during thesecountries’ pre-flexible and flexible exchange rate periods. Thus, we have little evidence onwhether fixed or flexible rates are associated with greater fiscal discipline. In any case, causalityis an important question here. It could be that progress on fiscal discipline contributes to theability to maintain some degree of fixed or flexible rates, or that fixed or flexible regimes helpsupport fiscal discipline.
C. Country Experiences with Fixed or Adjustable Pegs
As noted above, the alternatives for countries which are not currently members ofcurrency unions (CFA franc zone, or CMA) are a continuation of their existing flexible or fixedexchange rate systems, or forming/joining monetary unions. We complete the description ofexperience with existing regimes by considering countries (outside the CFA or CMA) with fixedrate systems: single or basket pegs, both fixed and adjustable. By the late 1990s-2002, therewere actually only a very few countries having such arrangements. A number of these countriesare considering joining various monetary union projects. Unfortunately, since several of thesecountries were also war-torn (Burundi, Liberia, Eritrea), economic performance was dominatedby the wars, and not exchange rate or other policies. It is useful, however, to describe theinteresting and unique monetary experience of Liberia largely before the onset of the civil war. Itis also difficult to generalize from Zimbabwe’s case, which moved back from a flexible to afixed rate system (notionally adjustable, but very rarely changed) in 1999, since that country hasbeen in the midst of a severe general economic crisis and large contraction, accompanied by acut-off in external assistance and capital flows. The four other Sub-Saharan African countriescurrently with some (as of 2001) form of peg are Botswana (see Ch. IV) and three small islands

- 14 -
or city-states, which are more dependent on services (Djibouti), tourism and maritime activities(Seychelles), or remittances (Cape Verde), rather than the commodity exports that dominate mostAfrican countries’ structures. However, these three countries’ experience is also instructive, tosome extent.
1. Description of Fixed Rate Systems in War Countries
During the 1980s-1993, the Burundian Franc was pegged to the SDR, with the pegadjusted several times by the authorities in order to maintain competitiveness. The real exchangerate depreciated from 1985-92. Burundi began a comprehensive reform program in 1991, but thegovernment’s priorities were soon dominated by the outbreak of civil conflict in 1993. The pegwas changed to a weighted basket of principal trading partners’ currencies and adjustedperiodically, but the real exchange rate appreciated by 33 percent during 1993-97 and parallelmarket spreads of over 50 percent began to emerge (IMF Country Report 97/114). A fragilepeace was achieved in 2000. The new government moved from a peg to a managed float,managing the exchange rate to limit the spread between the official and parallel rate (IMFCountry Report 02/242).
Eritrea’s record with a fixed rate system is too short to analyze. For the record, wedescribe briefly how the country moved to a peg. The Ethiopian birr (flexible rate) was adoptedstarting from independence in 1993, originally with an official rate that applied to transactionsbetween the two countries, and a preferential rate for private imports and all exports. The tworates were unified in April 1997, and Eritrea introduced its own currency, the nafka, to replacethe birr at a one-to-one parity in November 1997 (IMF Country Report 97/88). A war betweenthe two countries broke out it May 1998. Throughout the war, which ended in December 2000,Eritrea’s exchange rate was market-determined. With reserves nearly depleted and the authoritiesworried about the effect of rapid depreciation on inflation, exchange controls were implementedin July 2000 and the exchange rate fixed. Although the controls were later repealed in 2001, therate had barely moved (the system is essentially a fixed rate, although notionally flexible) byend-2002. The essentially fixed rate, precarious reserve position, and extensive restrictions oncurrent account payments have led to a parallel market premium of around 60 percent,encouraging rent seeking and fraud. (IMF Country Report 03/165).
Liberia is an interesting case because of its long history as an independent country usingthe US dollar, and more recent experience with the circulation of competing currencies.11 From1944 the U.S. dollar was legal tender and the Liberian dollar was held at a fixed one-for-oneparity until August 1988 when the rate became market determined. Liberia’s economic situationbegan deteriorating in the early 1980s following terms of trade declines, economicmismanagement, and mounting arrears that lead to a break down of relations with creditors anddonors. By the mid-1980s, the U.S. dollar-based financial system was near collapse. Although 11 Founded as a colony to serve as home for liberated American slaves in 1821, it becameindependent in 1847. US notes and coins circulated as currency from the first, while BritishWest African Pounds were also legal tender until 1944, when Liberia issued the Liberian dollar,which was linked at par to the US dollar.

- 15 -
the traditionally circulating medium was both U.S. and Liberian dollars, starting in 1985 aparallel market for foreign exchange emerged, with the Liberian dollar trading at a discount,reaching Liberian $2.30 per US $1 by 1989. The 1989-97 civil war brought most economicactivity to a virtual standstill. When the war broke out 5 dollar banknotes with the portrait of JJRoberts (Liberia’s first president) were issued in areas controlled by rebels led by CharlesTaylor. In 1991, “Liberty” banknotes where issued in areas controlled by ECOWAS’s militaryforces (ECOMOG). The competing currencies were exchanged at various rates that differedfrom their official parity with the US dollar. With the winding down of the civil war and electionof Charles Taylor president in 1997, the currency was once again unified. However, parity withthe US dollar was not reestablished, and the currency quickly depreciated to over 50 to the USdollar (IMF Country Report 00/50).
2. Other Fixed Rate Systems as of 2001
Two-thirds of Djibouti’s population live in the capital, and the rest lead a poor pastoralexistence in the desert.12 The economy was traditionally based on services for the substantialpresence of French military and dependents, offshore banking, and the port. The Djibouti franc isfreely convertible, and has been pegged at an unchanged level to the U.S. dollar since 1973,although most trade is conducted with Europe. The central bank operates a currency board, withfrancs in circulation covered by U.S. dollar deposits. Up until the early 1990s, the currency boardand fixed exchange rate appeared to have contributed to Djibouti’s development as a regionaltrade and financial center, although the external position was chronically weak. Even in thesecond half of the 1980s, however, economic performance had begun to weaken. Real GDPdeclined by 1 percent annually from 1984-90, following the end of a real estate boom and a dropin public investment, as well as deterioration in neighboring countries. In 1991, an ethnic basedconflict broke out. Deterioration of the fiscal position was the key economic issue throughout the1990s. In the first half of the decade, budget deficits grew with the effect of conflict, unstableregional politics, declining aid, the heavy weight of the government wage bill, and poor fiscaldiscipline. IMF staff reports assessed that the sustainability of the exchange rate regime requiredsubstantial fiscal tightening. Although some on-again off-again adjustment did take place in thesecond half of the decade under IMF programs, by the late 1990s, there was substantial concernabout competitiveness and the strain on the exchange rate, also considering the real appreciation(about 55 percent over the decade) stemming from the U.S. dollar peg. IMF staff have arguedthat the deterioration in competitiveness, suggested by overvaluation and very high real wages, isa major factor behind sluggish growth and persistent balance of payments pressures, and that anexchange rate devaluation should be seriously considered. The authorities also recognize thatimprovements in competitiveness are critical for growth. 12 Djibouti also has had an interesting monetary history. Djibouti, also known as FrenchSomaliland, was a colony of France until 1946 when it became an overseas territory, known asAfars and Issas. Upon independence in 1977, it became known as the Republic of Djibouti.From 1885 until 1943, Maria Theresa Thalers, French Francs, and Indian Rupees all had legaltender status, though as of 1907 the Banque de l’Indochine also issued a Franc note for Djibouti.Djibouti was part of the CFA Franc Zone at its formation in 1945, but in 1949 it left the zone andpegged its currency to the US dollar.
- 16 -
Seychelles is a small open economy, dependent on tourism and maritime activities, witha traditionally large role of the public sector in economic activity and employment. TheSeychelles rupee was pegged to the SDR until 1996, followed by a peg to a basket, withchanging weights. Substantial social progress was recorded from independence in 1976, with percapita GDP rising from $800 to $7000 in 1998. However, rising macroeconomic imbalancesduring the 1990s seriously affected efficiency and competitiveness, such that the average growthrate declined during this period. At the outset of the decade there were no exchange controls,although significant import and price controls. That system was disrupted by external difficultiesduring the Middle East crisis of 1991, and external payments restrictions and surrenderrequirements were reinstated, although they did not prevent accumulation of external arrears. Asmall parallel market was in existence by 1993 with a spread of 7-10 percent. Monetarydevelopments during 1994-96 were dominated by shortages of foreign currency and commercialpayments arrears. The central bank introduced a pipeline scheme (or queuing) for the allocationof foreign exchange, and a system for the allocation of foreign exchange to seven categories ofexpenditure.13 (IMF Country Report 00/142). At the root of the external pressures during thesecond half of the decade was the rising fiscal deficit (14 percent of GDP during 1996-99),fueled by the expanding welfare system, rising wage bill, transfers to parastatals and a big capitalspending program. The authorities responded to balance of payments pressures with furthertightening of trade and exchange restrictions in 1998 and 2001. Since this time, IMF staff reportshave been pushing for the dismantling of price, trade and exchange controls. While real GDPfell more than 15 percent from 1998-2001, and the current account deficit averaged 17 percent ofGDP during 1999-2001, there was a massive accumulation of external debt and arrears, andfalling reserves. There is anecdotal evidence that the rupee seems far overvalued. The authoritiescurrent program focuses on the resolution of the large monetary overhang resulting from theexcessive public financing.
Cape Verde operated a basket peg until 1998. Although central planning and aneconomically dominant public sector determined strategy from 1975-91, relatively prudentpolicies (and large foreign transfers) allowed solid economic growth through the 1980s. Towardthe decade’s end, however, the government did not respond to declining aid and remittances bycutting large expenditures, but used bank credit to finance deficits. Unemployment and inflationrose, and official reserves fell. An adjustment program starting in 1992 restored reasonablegrowth, with significant contributions from services and foreign investment in export-orientedmanufacturing. Until 1997, however, fiscal policies were unsustainably lax, leading toaccumulation of domestic debt and depletion of foreign exchange reserves (IMF Country Report99/58). Rapid progress was made under the precautionary arrangement begun with the Fund in1998: real GDP growth increased to 8 percent in 1998-99, and inflation was halved from 8.6percent in 1997 to 4.3 percent in 1999. Current account and capital transactions were liberalizedin mid-1998, policies aimed at ensuring the escudo’s convertibility. In order to signal acommitment to low inflation and macroeconomic stability, the basket peg was replaced with afixed link of the Cape Verdean escudo to the Portuguese escudo, and, since the replacement of 13 The pipeline scheme requires rupee deposits, which queue for forex allocation, while theallocation system by categories does not require previous deposits in rupees.

- 17 -
the latter by the euro in 1999, a peg to the EU’s common currency, the euro. Overlyexpansionary fiscal policies in 1999, however, partially financed by credit from the central bankand a credit line facility from Portugal (designed to ensure convertibility between the twocountries’ currencies), led to a widening current account deficit (14 percent of GDP). Theauthorities responded to the pressure on reserves by temporarily introducing foreign exchangerationing.14 Fiscal deterioration worsened in 2000, however, in the run-up to elections,endangering the peg to the euro. With limited statutory independence, the central bank wasunable to prevent monetization of the deficit, financed also by accumulation of domestic andexternal arrears. The balance of payments deteriorated, reflecting lower FDI and the suspensionof aid. In particular, since they had not repaid the credit line with Portugal by previous year’send, access to this facility was supposed to be blocked, raising further questions about thesustainability of the peg.15
D. Assessment of Country Experiences
A number of lessons or patterns can be drawn from the brief country narratives above.We present a few general assessments of country experiences under fixed or adjustable pegsystems, followed by assessments of experiences with flexible exchange rate systems.
1. Fixed or Adjustable Pegs
• Adjustable pegs have contributed to low or moderate inflation and periods ofstrong growth.
• When concerns have arisen about the sustainability of pegs, the underlyingproblem has usually been overly expansionary fiscal policies. The scope for macro policies isconstrained by very high degrees of openness, the fixed exchange rate, and free flows ofcapital. Demand management must rely heavily on budgetary, and in some cases, wagepolicies. This situation is most stark in the case of Djibouti’s currency board, but is also truefor the other countries.
• When the authorities respond to the balance of payments pressures with trade andforeign exchange restrictions (preventing pressures from affecting the exchange rate), macro-imbalances continue to build, and competitiveness and efficiency decline precipitously as thereal exchange rate becomes overvalued.
• Central bank independence from pressures to monetize large fiscal deficits is alsoimportant in these regimes in order to maintain adequate reserve cover and the viability ofthe peg.
• Close relations with an industrial country can help in critical situations, but havedownsides also. For example, while Cape Verde’s drawing on the credit line with Portugal in
14 By year’s end, however, inflows of foreign direct investment, related to privatization, and aidinflows, turned the overall balance of payment into surplus.
15 The credit line was subsequently reopened in 2001 when Cape Verde and Portugal agreed totransform the outstanding payments into a long-term bridge loan.
- 18 -
2000 even though it was officially blocked (because of previous non-compliance with therules) helped sustain the peg at that time, the expectation of future “bail-outs” may notcontribute to maintenance of fiscal discipline.
• Ongoing adjustments of the peg are important to prevent the emergence of largemisalignments. When delayed such that a mega-devaluation is probably warranted, countriesresist, concerned about potential costs.
• In contrast to the three countries above, Botswana has successfully managed itsbasket peg system generally to maintain competitiveness and support growth. An importantpart of that success has been maintenance of fiscal discipline, liberalized exchange controlsystem, some degree of central bank independence, and occasional adjustment of theexchange rate.
• 2. Flexible Rate Systems
General Patterns following Reforms
Moves to market determined rates in the contexts of floats, auctions, and inter-bank markets that made significant progress in unifying official and parallel rates did not leadto immediate large increases in the level of inflation, as had been feared.
Reforms have been successful to a large extent, in eliminating the corruption andinefficiencies associated with non-market allocation of foreign exchange. Many previoushuge overvaluations of official RERs that constituted large implicit taxes on the tradablessector, and corresponding subsidy on the consumption of imports have been corrected.
The extent to which exchange rates are currently market-determined variessignificantly. Central banks often intervene heavily to manage the exchange rate.
Thin markets can lead to excessive volatility of the exchange rate with negativeconsequences for real sector activities. Central banks often currently state that they areintervening only to smooth fluctuations and achieve reserve targets—although thisdesignation could be interpreted quite broadly to mask other types of intervention.
Institutional and Structural Difficulties with Operating Flexible Exchange RateSystems
Many countries have progressed to market determined rates and foreign exchangeallocation through the creation of interbank markets. The development of efficient interbankmarkets, however, has been hindered by structural problems in the financial sector (smallmarket size, limited competition among banks, government involvement or management ofbanks, limited financial instruments, solvency and liquidity problems). In some casescountries have switched back to auction markets, which do not require well-functioningfinancial markets. Auctions, however, can be manipulated by the government, and imposeuncertainty about pricing and delivery of foreign exchange to participants.
In addition to financial market underdevelopment, other structural conditionsmake efficient operation of flexible exchange rate systems difficult in SSA. First, foreignexchange receipts are extremely seasonal or lumpy, given export structures dominated by afew commodities, providing motivation for extensive intervention to smooth predictableexchange rate cycles. Second, the foreign exchange market is often dominated by a few big

- 19 -
players: large companies or marketing boards on the export side, and aid agencies and largetrading companies on the import side. Third, there are few (or no) private speculatorsengaging purely in foreign currency trading.
Real Exchange Rates, Terms of Trade and Inflation
Most countries adopting reform programs achieved significant depreciations ofthe real exchange rate. In recent years, however, real exchange rates have either fluctuatedaround a constant trend or appreciated implying that for some countries competitiveness hasbeen eroded.
More flexible exchange rate arrangements seem to have allowed adjustment ofreal exchange rates to TOT movements with fewer periods of serious misalignment than inthe earlier pre-liberalization, fixed exchange rate experiences of these countries.16
Since the exchange rate is no longer the nominal anchor for price stability,governments have chosen various forms of monetary nominal anchors. The root causes oflosses of control over inflation, however, have come from the inability to shield the centralbank from weak fiscal discipline, or from losses of fiscal control in the face of shocks.
“Fear of Floating”
There appears to be some “fear of floating” (Calvo and Reinhart, 2002),including, in different countries and at different times, fear of depreciation and fear ofappreciation.
Fear of depreciation often relates to concerns that rapid nominal depreciation willignite inflation. The higher costs of servicing external debt are another factor, although muchless so given large debt relief. There is often no effective domestic lobby for depreciation toensure competitiveness, as export sectors are often comprised of enclaves or ruralsmallholder producers. In contrast, urban consumers and import-substituting manufacturingsectors can be vocal lobbies for cheap imported final and intermediate goods.
Fear of appreciation often stems from government concerns aboutcompetitiveness of the export sector, both traditional commodity exports, and sometimesnon-traditional exports. Thus, authorities facing rapid increases in aid often eschew theoption of foreign exchange sterilization. Difficulties with domestic bond sterilization,however, can lead to high and volatile interest rates, budgetary pressures, and changes inpolicy direction that make it difficult for the market to determine the objectives of foreign
16 The question of whether RERs in developing countries adjust more to TOT shocks underflexible rates is not settled in the literature. Broda’s (2001) evidence says yes, while Calvo andReinhart (2000) suggest no. For SSA, Hoffmaister, Roldos, and Wickham (1998) find,paradoxically, that RERs in CFA countries respond more to TOT shocks than in non-CFAcountries. Cashin et al. (2002) find a long-run relationship between real commodity prices andthe RER in a number of countries, and find that both some fixed and some flexible exchange rateSSA countries can designated as commodity currencies.

- 20 -
exchange and interest rate policy. Uncertainty about the underlying demand for moneycomplicates determining whether limited sterilization, or a policy of letting the aid inflowsincrease the money base, will be inflationary.
F. Conclusions
Countries contemplating joining or forming monetary unions must compare the costs andbenefits against the alternative of continued use of independent currencies, in either flexible orfixed rate systems. Currently, de jure flexible rate systems are much more prevalent in SSA(outside the CFA and CMA zones). Historically, the move of many of these countries to flexiblerates was an important part of the liberalization/reform process of the 1980s and 90s. Collier andGunning (1999) argue that it would have been very difficult for a liberalizing government to becredible if it maintained a fixed exchange rate regime, as the maintenance of the overvaluedfixed regime had been at the centerpiece of the control regime (foreign exchange rationing,import licensing, price controls), with its associated corruption and inefficiencies. Also,flexibility was important to help determine the appropriate level of the exchange rate—a difficultprocess during periods of transition.
Currently, what is the relevance to SSA of exchange rate flexibility? For Latin America,some have argued, (Hausman et. al, 2000) that exchange rate flexibility and independentmonetary policies have been misused, and have typically just produced inflation. Is the same truefor Africa? Flexible exchange rate regimes in Africa have successfully reduced corruption andinefficiencies associated with non-market allocation of foreign exchange, dramatically loweredor eliminated parallel market spreads, reduced large initial real exchange rate overvaluations and,by allowing some adjustment to terms of trade shocks, have cushioned some of the negativeeffects on output. The designation of some of these regimes as flexible, however, is questionable,as rates are often heavily managed. However, management has sometimes not been disciplinedresulting in high inflation and exchange rate instability.
In addition, as our country reviews indicate, operation of truly flexible exchange rateregimes requires efficient financial markets. However, financial markets in most Africancountries are plagued by structural problems and underdevelopment.
Finally, it is also clear from our review of country experiences that successful use ofindependent currencies requires fiscal discipline, which although improving, is still a major issuein many countries. Central bank independence is the other major pillar for having independentcurrencies. Except for South Africa, the degree of central bank independence is extremely low.
From the experience of the small number of non-war or crisis countries with fixed oradjustable pegged regimes, however, it is clear that neither the fixed or flexible system option iswithout pitfalls. Adjustable fixed rate systems have contributed to low-to-moderate inflation,stability and periods of strong growth. Botswana, in particular, has been well served by itsadjustable basket peg. In other cases, however, losses of fiscal control and restoration ofexchange controls have led throughout the 1990s to deteriorating competitiveness and/or severeconcerns over the viability of the peg.

- 21 -
These costs and benefits of current regimes will need to be weighed against potentialoutcomes with monetary unions, discussed in later chapters. The current experience with flexibleand unilateral fixed rates has also highlighted important issues that any future monetary andexchange rate systems will likely confront. These include the crucial requirement to maintainfiscal discipline, associated importance of central bank independence, development of efficientfinancial systems (for operating flexible rates or facilitating domestic bond markets forgovernment financing), and the need for real exchange rates to adjust to terms of trade shocksand generally to maintain competitiveness.

- 22 -
Table V.1 Exchange Arrangements
Country Most recent and sustainedflexible exchange rate1
Accepted IMF ArticleVIII
Angola 1998Burundi 1999DRC 1983Ethiopia 1993Ghana 1986 1994Guinea 1986 1995Guinea-Bissau 1983 1997Kenya 1993 1994Liberia 1997Madagascar 1994 1996Malawi 1994 1995Mauritania 1995 1999Mauritius 1994 1993Mozambique 1992Nigeria 1998Rwanda 1995 1998Sao Tome & Principe 1991Sierra Leone 1990 1995Somalia 1990South Africa 1979 1973Sudan 1992Tanzania 1993 1996The Gambia 1986 1993Uganda 1992 1994Zambia 1992Zimbabwe 1994 1995
Source: IMF Annual Report on Exchange Arrangements and Exchange Restrictions 2002 1/ Prior period in flexible exchange rate, Angola: 1994-1995, Mauritania: 1987-1991, Nigeria: 1975-1993, Sierra-Leone: 1982 and 1986, Uganda: 1981-1985, DRC: 1978, Zambia: 1985-1986. Most recent year that a country went off flexible rate, Namibia: 1992, Guinea-Bissau: 1997, Zimbabwe: 1999.
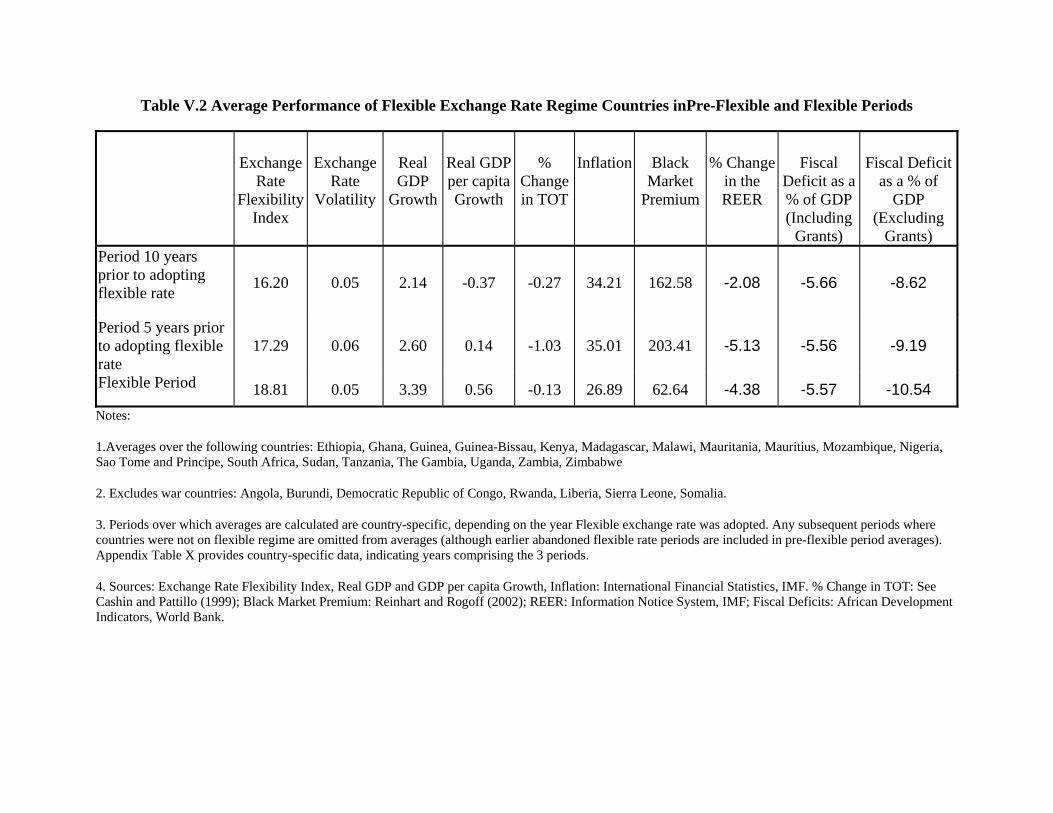
Table V.2 Average Performance of Flexible Exchange Rate Regime Countries inPre-Flexible and Flexible Periods
ExchangeRate
FlexibilityIndex
ExchangeRate
Volatility
RealGDP
Growth
Real GDPper capitaGrowth
%Changein TOT
Inflation BlackMarket
Premium
% Changein theREER
FiscalDeficit as a% of GDP(Including
Grants)
Fiscal Deficitas a % of
GDP(Excluding
Grants)Period 10 yearsprior to adoptingflexible rate 16.20 0.05 2.14 -0.37 -0.27 34.21 162.58 -2.08 -5.66 -8.62
Period 5 years priorto adopting flexiblerate
17.29 0.06 2.60 0.14 -1.03 35.01 203.41 -5.13 -5.56 -9.19
Flexible Period 18.81 0.05 3.39 0.56 -0.13 26.89 62.64 -4.38 -5.57 -10.54Notes:
1.Averages over the following countries: Ethiopia, Ghana, Guinea, Guinea-Bissau, Kenya, Madagascar, Malawi, Mauritania, Mauritius, Mozambique, Nigeria,Sao Tome and Principe, South Africa, Sudan, Tanzania, The Gambia, Uganda, Zambia, Zimbabwe
2. Excludes war countries: Angola, Burundi, Democratic Republic of Congo, Rwanda, Liberia, Sierra Leone, Somalia.
3. Periods over which averages are calculated are country-specific, depending on the year Flexible exchange rate was adopted. Any subsequent periods wherecountries were not on flexible regime are omitted from averages (although earlier abandoned flexible rate periods are included in pre-flexible period averages).Appendix Table X provides country-specific data, indicating years comprising the 3 periods.
4. Sources: Exchange Rate Flexibility Index, Real GDP and GDP per capita Growth, Inflation: International Financial Statistics, IMF. % Change in TOT: SeeCashin and Pattillo (1999); Black Market Premium: Reinhart and Rogoff (2002); REER: Information Notice System, IMF; Fiscal Deficits: African DevelopmentIndicators, World Bank.

Appendix Table V.1A Performances of Countries During Flexible Exchange Rate Regime
Country Type Year
%Chgin
TOT
RealGDP
Growth
RealGDP per
capitaGrowth
Inflation Black MarketPremium
CR1variance
based
ExchangeRate
FlexibilityIndex
FiscalDeficitas a %of GDP(Excl.
Grants)
FiscalDeficitas a %of GDP(Incl.
Grants)
%Changein theREER
ExchangeRate
Volatility
Angola flexible 1998-2000 0.93 4.40 1.45 232.70 … 18.23 32.40 -10.11 -1.10 -0.04 0.16Burundi flexible 1999-2000 1.69 -1.53 -2.49 13.85 … 30.24 32.16 -6.65 -3.60 -0.07 0.05DRC flexible 1983-2000 -0.91 -3.04 -6.64 2263.47 13,214,286 34.52 37.61 … … -0.03 0.17Ethiopia flexible 1993-2000 2.95 5.76 2.84 3.36 71.81 3.27 10.84 -9.41 -6.31 -0.11 0.01Ghana flexible 1986-2000 -1.83 4.47 1.99 28.15 17.91 12.20 19.58 -7.65 -4.20 -0.10 0.04Guinea flexible 1986-2000 -1.30 4.26 0.46 … 8.53 0.32 4.10 -6.81 -3.62 -0.02 0.08Guinea-Bissau flexible 1983-1996 2.04 2.92 0.83 51.18 … 11.29 24.81 -31.45 -14.16 -0.06 0.06Kenya flexible 1993-2000 1.36 2.07 -0.99 14.11 16.75 15.14 26.20 -2.80 -0.78 0.03 0.04Liberia flexible 1997-2000 1.01 … … … 2384 36.92 45.34 … … … 0.29Madagascar flexible 1994-2000 -0.10 2.98 -0.18 20.06 8.11 24.36 32.28 -8.85 -5.12 0.00 0.06Malawi flexible 1994-2000 0.95 3.80 2.15 38.41 9.25 19.55 24.45 -13.95 -6.78 -0.05 0.06Mauritania flexible 1995-2000 1.52 … … 5.20 4.85 0.85 9.71 1.32 3.08 … 0.02Mauritius flexible 1994-2000 0.06 2.36 -0.07 20.21 113.87 11.33 17.28 -5.11 -4.90 0.01 0.02Mozambique flexible 1992-2000 0.30 5.81 3.47 32.65 … 6.07 18.64 -13.88 -3.10 -0.02 0.02Nigeria flexible 1998-2000 1.10 2.25 -0.53 7.96 317.29 0.00 0.00 -4.87 -4.87 -0.19 0.14Rwanda flexible 1995-2000 -2.23 14.05 5.54 11.36 … 16.83 23.91 -10.48 -2.87 -0.04 0.04Sao Tome &Principe flexible 1991-2000 -7.42 1.77 -0.86 … … 5.70 14.87 -50.97 -31.20 -0.10 0.03
Sierra Leone flexible 1990-2000 0.37 -6.37 -8.18 41.67 37.92 12.57 19.25 -10.13 -8.59 -0.03 0.06Somalia flexible 1990-2000 -0.18 … … … … … … … … … …South Africa flexible 1979-2000 -0.26 1.65 -0.69 11.98 278.20 6.71 14.38 -5 -6 0 0Sudan flexible 1992-2000 -2.48 … … 76.92 … 31.93 33.16 -3.91 -3.91 -0.19 0.12Tanzania flexible 1993-2000 1.84 3.65 0.78 18.88 4.58 6.26 15.94 -3.56 -0.49 0.07 0.02The Gambia flexible 1986-2000 -0.29 3.77 -0.06 10.34 7.18 6.47 19.36 -6.82 -0.47 -0.02 0.03Uganda flexible 1992-2000 -0.49 6.62 3.59 11.13 14.16 16.99 27.41 -8.35 -2.81 0.00 0.03Zambia flexible 1992-2000 -2.84 0.00 -3.14 86.00 19.52 19.22 25.04 -10.03 -3.69 0.02 0.10Zimbabwe flexible 1994-1998 1.17 4.38 1.03 23.37 10.54 6.40 16.22 -8.44 -6.98 -0.03 0.05Average -0.12 3.00 0.01 137.41 73,4312 14.13 21.80 -10.33 -5.31 -0.04 0.07
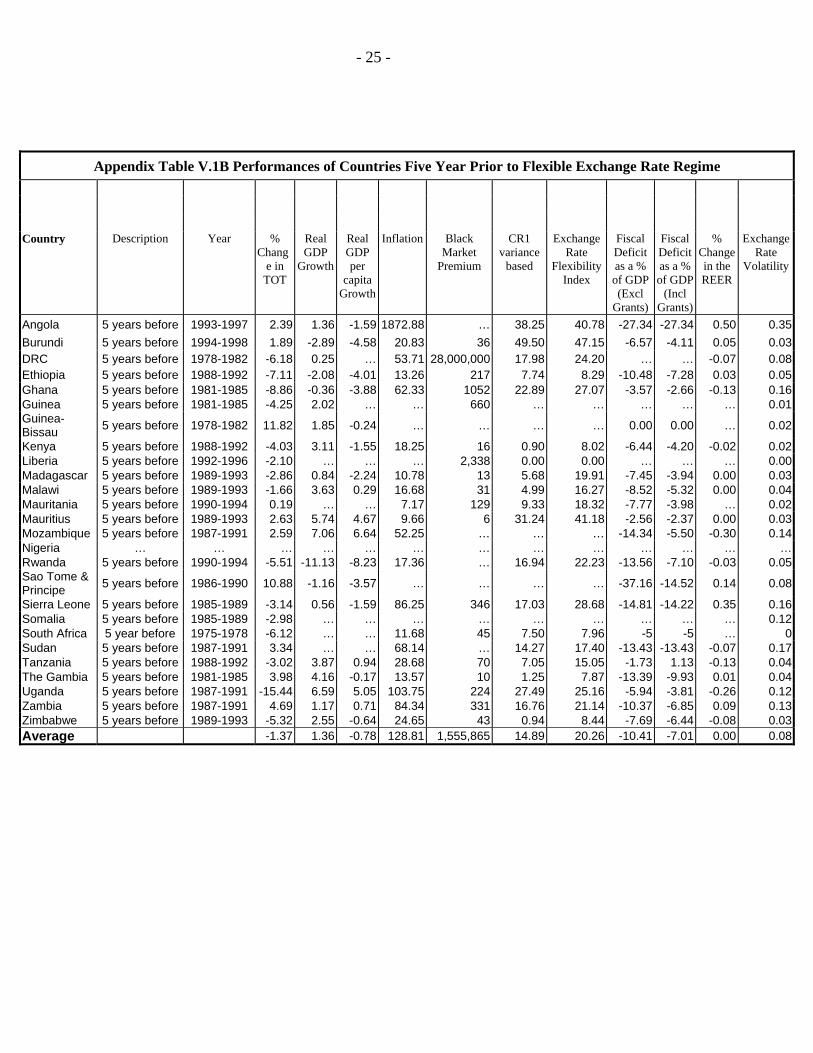
- 25 -
Appendix Table V.1B Performances of Countries Five Year Prior to Flexible Exchange Rate Regime
Country Description Year %Chang
e inTOT
RealGDP
Growth
RealGDPper
capitaGrowth
Inflation BlackMarket
Premium
CR1variance
based
ExchangeRate
FlexibilityIndex
FiscalDeficitas a %of GDP(Excl
Grants)
FiscalDeficitas a %of GDP
(InclGrants)
%Changein theREER
ExchangeRate
Volatility
Angola 5 years before 1993-1997 2.39 1.36 -1.59 1872.88 … 38.25 40.78 -27.34 -27.34 0.50 0.35Burundi 5 years before 1994-1998 1.89 -2.89 -4.58 20.83 36 49.50 47.15 -6.57 -4.11 0.05 0.03DRC 5 years before 1978-1982 -6.18 0.25 … 53.71 28,000,000 17.98 24.20 … … -0.07 0.08Ethiopia 5 years before 1988-1992 -7.11 -2.08 -4.01 13.26 217 7.74 8.29 -10.48 -7.28 0.03 0.05Ghana 5 years before 1981-1985 -8.86 -0.36 -3.88 62.33 1052 22.89 27.07 -3.57 -2.66 -0.13 0.16Guinea 5 years before 1981-1985 -4.25 2.02 … … 660 … … … … … 0.01Guinea-Bissau 5 years before 1978-1982 11.82 1.85 -0.24 … … … … 0.00 0.00 … 0.02
Kenya 5 years before 1988-1992 -4.03 3.11 -1.55 18.25 16 0.90 8.02 -6.44 -4.20 -0.02 0.02Liberia 5 years before 1992-1996 -2.10 … … … 2,338 0.00 0.00 … … … 0.00Madagascar 5 years before 1989-1993 -2.86 0.84 -2.24 10.78 13 5.68 19.91 -7.45 -3.94 0.00 0.03Malawi 5 years before 1989-1993 -1.66 3.63 0.29 16.68 31 4.99 16.27 -8.52 -5.32 0.00 0.04Mauritania 5 years before 1990-1994 0.19 … … 7.17 129 9.33 18.32 -7.77 -3.98 … 0.02Mauritius 5 years before 1989-1993 2.63 5.74 4.67 9.66 6 31.24 41.18 -2.56 -2.37 0.00 0.03Mozambique 5 years before 1987-1991 2.59 7.06 6.64 52.25 … … … -14.34 -5.50 -0.30 0.14Nigeria … … … … … … … … … … … … …Rwanda 5 years before 1990-1994 -5.51 -11.13 -8.23 17.36 … 16.94 22.23 -13.56 -7.10 -0.03 0.05Sao Tome &Principe 5 years before 1986-1990 10.88 -1.16 -3.57 … … … … -37.16 -14.52 0.14 0.08
Sierra Leone 5 years before 1985-1989 -3.14 0.56 -1.59 86.25 346 17.03 28.68 -14.81 -14.22 0.35 0.16Somalia 5 years before 1985-1989 -2.98 … … … … … … … … … 0.12South Africa 5 year before 1975-1978 -6.12 … … 11.68 45 7.50 7.96 -5 -5 … 0Sudan 5 years before 1987-1991 3.34 … … 68.14 … 14.27 17.40 -13.43 -13.43 -0.07 0.17Tanzania 5 years before 1988-1992 -3.02 3.87 0.94 28.68 70 7.05 15.05 -1.73 1.13 -0.13 0.04The Gambia 5 years before 1981-1985 3.98 4.16 -0.17 13.57 10 1.25 7.87 -13.39 -9.93 0.01 0.04Uganda 5 years before 1987-1991 -15.44 6.59 5.05 103.75 224 27.49 25.16 -5.94 -3.81 -0.26 0.12Zambia 5 years before 1987-1991 4.69 1.17 0.71 84.34 331 16.76 21.14 -10.37 -6.85 0.09 0.13Zimbabwe 5 years before 1989-1993 -5.32 2.55 -0.64 24.65 43 0.94 8.44 -7.69 -6.44 -0.08 0.03Average -1.37 1.36 -0.78 128.81 1,555,865 14.89 20.26 -10.41 -7.01 0.00 0.08
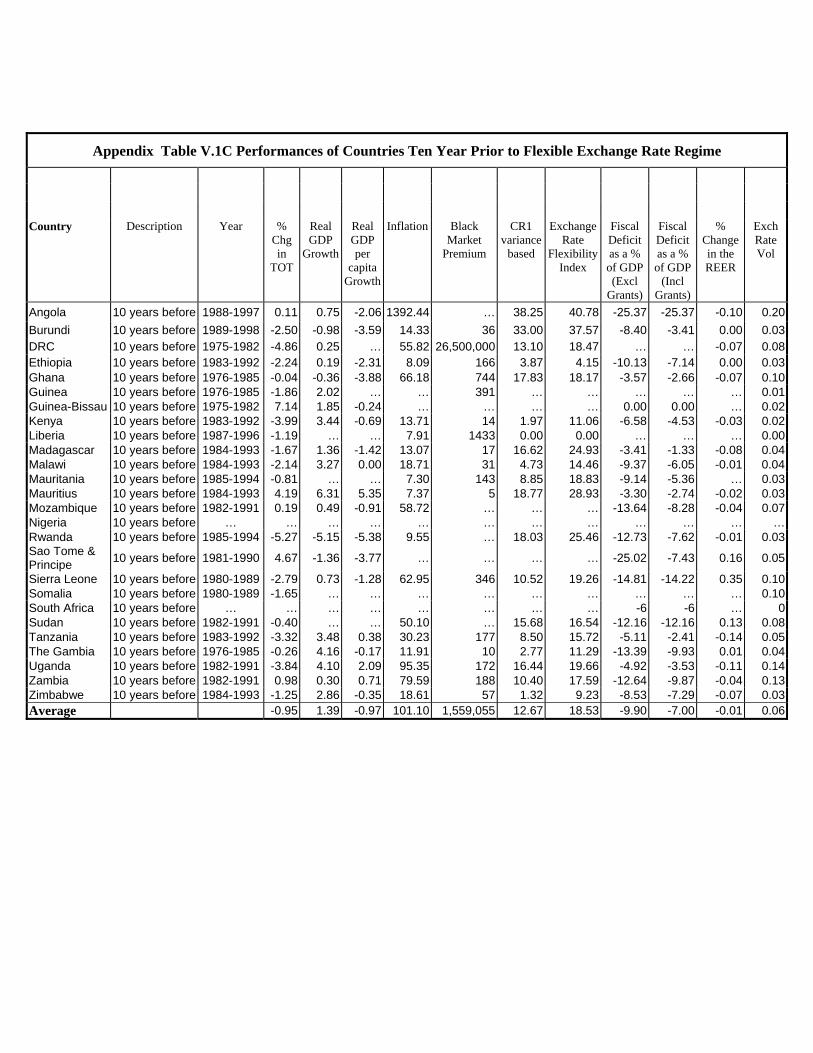
Appendix Table V.1C Performances of Countries Ten Year Prior to Flexible Exchange Rate Regime
Country Description Year %Chgin
TOT
RealGDP
Growth
RealGDPper
capitaGrowth
Inflation BlackMarket
Premium
CR1variance
based
ExchangeRate
FlexibilityIndex
FiscalDeficitas a %of GDP(Excl
Grants)
FiscalDeficitas a %of GDP
(InclGrants)
%Changein theREER
ExchRateVol
Angola 10 years before 1988-1997 0.11 0.75 -2.06 1392.44 … 38.25 40.78 -25.37 -25.37 -0.10 0.20Burundi 10 years before 1989-1998 -2.50 -0.98 -3.59 14.33 36 33.00 37.57 -8.40 -3.41 0.00 0.03DRC 10 years before 1975-1982 -4.86 0.25 … 55.82 26,500,000 13.10 18.47 … … -0.07 0.08Ethiopia 10 years before 1983-1992 -2.24 0.19 -2.31 8.09 166 3.87 4.15 -10.13 -7.14 0.00 0.03Ghana 10 years before 1976-1985 -0.04 -0.36 -3.88 66.18 744 17.83 18.17 -3.57 -2.66 -0.07 0.10Guinea 10 years before 1976-1985 -1.86 2.02 … … 391 … … … … … 0.01Guinea-Bissau 10 years before 1975-1982 7.14 1.85 -0.24 … … … … 0.00 0.00 … 0.02Kenya 10 years before 1983-1992 -3.99 3.44 -0.69 13.71 14 1.97 11.06 -6.58 -4.53 -0.03 0.02Liberia 10 years before 1987-1996 -1.19 … … 7.91 1433 0.00 0.00 … … … 0.00Madagascar 10 years before 1984-1993 -1.67 1.36 -1.42 13.07 17 16.62 24.93 -3.41 -1.33 -0.08 0.04Malawi 10 years before 1984-1993 -2.14 3.27 0.00 18.71 31 4.73 14.46 -9.37 -6.05 -0.01 0.04Mauritania 10 years before 1985-1994 -0.81 … … 7.30 143 8.85 18.83 -9.14 -5.36 … 0.03Mauritius 10 years before 1984-1993 4.19 6.31 5.35 7.37 5 18.77 28.93 -3.30 -2.74 -0.02 0.03Mozambique 10 years before 1982-1991 0.19 0.49 -0.91 58.72 … … … -13.64 -8.28 -0.04 0.07Nigeria 10 years before … … … … … … … … … … … …Rwanda 10 years before 1985-1994 -5.27 -5.15 -5.38 9.55 … 18.03 25.46 -12.73 -7.62 -0.01 0.03Sao Tome &Principe 10 years before 1981-1990 4.67 -1.36 -3.77 … … … … -25.02 -7.43 0.16 0.05
Sierra Leone 10 years before 1980-1989 -2.79 0.73 -1.28 62.95 346 10.52 19.26 -14.81 -14.22 0.35 0.10Somalia 10 years before 1980-1989 -1.65 … … … … … … … … … 0.10South Africa 10 years before … … … … … … … … -6 -6 … 0Sudan 10 years before 1982-1991 -0.40 … … 50.10 … 15.68 16.54 -12.16 -12.16 0.13 0.08Tanzania 10 years before 1983-1992 -3.32 3.48 0.38 30.23 177 8.50 15.72 -5.11 -2.41 -0.14 0.05The Gambia 10 years before 1976-1985 -0.26 4.16 -0.17 11.91 10 2.77 11.29 -13.39 -9.93 0.01 0.04Uganda 10 years before 1982-1991 -3.84 4.10 2.09 95.35 172 16.44 19.66 -4.92 -3.53 -0.11 0.14Zambia 10 years before 1982-1991 0.98 0.30 0.71 79.59 188 10.40 17.59 -12.64 -9.87 -0.04 0.13Zimbabwe 10 years before 1984-1993 -1.25 2.86 -0.35 18.61 57 1.32 9.23 -8.53 -7.29 -0.07 0.03Average -0.95 1.39 -0.97 101.10 1,559,055 12.67 18.53 -9.90 -7.00 -0.01 0.06

Figure V.1
Source: IMF Annual Report on Exchange Arrangements and Exchange Restrictions 2002
Exchange Arrangements for Countries listed in Table V.1
(as of December 2001)
Exchange ArrangementFlexiblePegged

Figure V.2 Real Effective Exchange Rate and Real Commodity Prices, 1979:1-2001:12
Real Commodity PriceReal Effective Exchange Rate (1990 =100)
Vertical Bars indicate the year in which countries adopted flexible exchange rate regimes
Angola
0
100
200
300
400
500
600
700
79 81 83 85 87 89 91 93 95 97 99 01
Guinea
0
50
100
150
200
79 81 83 85 87 89 91 93 95 97 99 01
Ethiopia
0
50
100
150
200
250
79 81 83 85 87 89 91 93 95 97 99 01
Ghana
0
500
1000
1500
2000
2500
79 81 83 85 87 89 91 93 95 97 99 01
Burundi
0
50
100
150
200
79 81 83 85 87 89 91 93 95 97 99 01
Gambia
0
50
100
150
200
79 81 83 85 87 89 91 93 95 97 99 01

Guinea-Bissau
0
50
100
150
200
250
79 81 83 85 87 89 91 93 95 97 99 01
Kenya
0
50
100
150
200
79 81 83 85 87 89 91 93 95 97 99 01
Madagascar
0
50
100
150
200
250
300
79 81 83 85 87 89 91 93 95 97 99 01
Malawi
0
50
100
150
200
250
79 81 83 85 87 89 91 93 95 97 99 01
Mozambique
0
100
200
300
400
500
600
79 81 83 85 87 89 91 93 95 97 99 01
Mauritius
0
50
100
150
200
79 81 83 85 87 89 91 93 95 97 99 01

Note: Flexible exchange rate for entire period except 1994-1997
Nigeria
0
100
200
300
400
500
600
700
800
900
79 81 83 85 87 89 91 93 95 97 99 01
Rwanda
0
50
100
150
200
79 81 83 85 87 89 91 93 95 97 99 01
South Africa
0
50
100
150
200
78 80 82 84 86 88 90 92 94 96 98 00
Sudan
0
50
100
150
200
250
300
79 81 83 85 87 89 91 93 95 97 99 01
Tanzania
0
100
200
300
400
500
600
79 81 83 85 87 89 91 93 95 97 99 01
Uganda
0
200
400
600
800
1000
1200
1400
1600
79 81 83 85 87 89 91 93 95 97 99 01
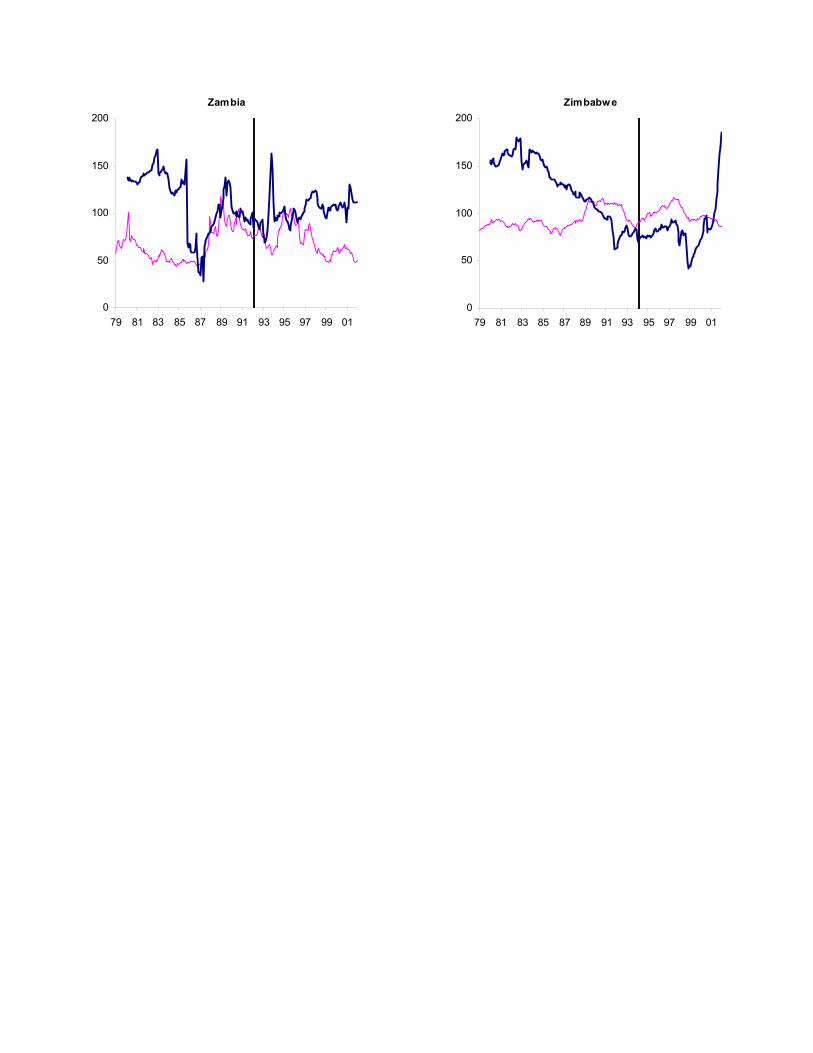
Zambia
0
50
100
150
200
79 81 83 85 87 89 91 93 95 97 99 01
Zimbabwe
0
50
100
150
200
79 81 83 85 87 89 91 93 95 97 99 01
1
PRM 9/23/03Chapter VI. Monetary Union Projects in West Africa for the WAMZ and ECOWAS
On April 20, 2000 in Accra, Ghana, the leaders of six West African countries1
declared their intention to proceed to a monetary union, the West African Monetary Zone(WAMZ), by January 2003, as a first step toward a wider monetary union including all theECOWAS countries in 2004. The leaders committed themselves to lowering central bankfinancing of budget deficits to 10 percent of the previous year’s government revenue;reducing budget deficits to 4 percent of GDP by 2003; creating a Convergence Council tohelp coordinate macroeconomic policies; and setting up a common central bank. Thedeclaration states that, “Member States recognise the need for strong political commitmentand undertake to pursue all such national policies as would facilitate the regional monetaryintegration process.”
The goal of a monetary union in ECOWAS has long been an objective of theorganization, going back to its formation in 1975, and is intended to accompany a broaderintegration process that would include enhanced regional trade and common institutions.Although there have been attempts to advance the agenda of ECOWAS monetarycooperation, political problems and other economic priorities in several of the region’scountries have to date inhibited progress. The initiative to create a second monetary zonewas bolstered by the election in 1999 of a democratic government and a leader committed toregional integration in Nigeria, the largest economy of the region, raising the hopes that thelong-delayed project could be revived. Since 2000, however, it has become clear that thetimetable was too ambitious (as argued, for instance, by Masson and Pattillo, 2001), andcountries have made little progress in achieving macroeconomic convergence. Therefore,ECOWAS heads of state in December, 2002, decided to postpone the introduction of a singlecurrency for the WAMZ until July, 2005, while the target date for merger with WAEMU hasnot been set.
The plan to create a second monetary union (in addition to that constituted byWAEMU), as well as a full ECOWAS monetary union, raises a number of questions aboutthe advantages and disadvantages of various alternative arrangements and strategies. There isclearly an important political dimension behind the recent initiative, but it is neverthelessimportant to carefully examine the economic benefits and costs. We quantify the net benefitsusing the model introduced in Chapter III and calibrated there to Africa-wide data. Inconsidering the possible net economic benefits of monetary union, the model uses data on thestrength of trade linkages, and on the degree of symmetry in terms of trade shocks and infiscal policies of potential members. In fact, there are major differences among the WestAfrican economies. In particular, Nigeria, a major oil exporter, faces a very different patternof terms of trade shocks from the other economies of the region. It has also had relatively
1The meeting was attended by three heads of state, Presidents Olusegun Obasanjo of Nigeria, Jerry Rawlings ofGhana, and Lansana Conté of Guinea, as well as representatives from Liberia, Sierra Leone and the Gambia.Cape Verde, the remaining non-CFA ECOWAS member, has a currency peg to the euro with the support ofPortugal, and was not a signatory of the “Accra Declaration on a Second Monetary Zone.” Liberia has notactively participated in subsequent preparations for the WAMZ.
2
undisciplined fiscal policies. Moreover, existing trade among the region’s countries is quitelow, although there is no doubt considerable informal trade which is not recorded. Of course,one of the reasons for proceeding to monetary union quickly is to promote improvement inmacroeconomic policies and to enhance prospects for other aspects of regional integration,including regional trade. As discussed above (Chapter IV), the empirical literature suggestssome boost to the trade among members of a monetary union.
In addition to the advisability of a monetary union, there are important institutionalissues that must be faced. The first choice is that of a central bank for the monetary union.Unfortunately, none of the WAMZ countries has a central bank with a track record ofcurrency stability and low inflation. Nigeria, which accounts for more than half thepopulation of ECOWAS and 75 percent of the GDP of the six countries proposing an initialmonetary union, would be a natural candidate to provide the nucleus of a regional centralbank, but Nigeria has a history of high inflation, and the Nigerian currency is inconvertible.
The second stage also raises the issue of whether the French Treasury’s guarantee ofconvertibility of the CFA franc to the euro, at a fixed parity, would continue, and, if not, whatwould guide the region’s monetary policy. A second choice associated with a full monetaryunion is therefore whether the region’s common currency(ies) should have an externalexchange rate anchor, such as a peg to the euro. A peg to the euro would provide exchangerate stability with the 12-member euro area and with the neighboring six-member CentralAfrican CFA zone (CAEMC). Such a peg would however not have the credibility of theWAEMU peg, in the absence of the French guarantee. Choosing instead to peg to a basketrather than to a single currency, would permit some insulation from the fluctuations amongmajor currencies, in particular the dollar and the euro. An alternative monetary frameworkwould be to forsake an external target and to key monetary policy onto a domestic objective,such as inflation.
These issues are discussed below.
A. Linkages and Asymmetries among West African Countries
An important advantage of a single currency is the saving of transactions costsinvolved in regional trade. However, as Table VI.1 shows, the trade among WAMZcountries is much lower than among WAEMU countries, despite the fact that the GDP of theformer is greater than that of the latter. WAEMU trade, as we saw in Chapter IV, is in factgreater than can be explained by a traditional gravity model, suggesting that there may havebeen a boost to WAEMU trade as a result of decades of economic cooperation and of sharingof the same currency. Therefore, the low level of WAMZ trade may not be a bar toconsidering a monetary union among those countries. The second stage, a full ECOWASmonetary union, would internalize a greater fraction of the region’s trade than is the case forWAEMU—even without allowing for the possibility that trade might increase endogenouslyin response to the creation of a monetary union. Hence WAMZ might make sense as ameans to an end—the ECOWAS monetary union; we will examine that possibility below.

3
Table VI.1. ECOWAS: Patterns of Trade, 2002
ECOWASExports
(Percent ofTotal Exports)
Imports(Percent of
Total Imports)ECOWAS 11.0 10.1European Union 35.1 40.4Rest of the World 53.9 49.5
WAEMUWAEMU 12.7 8.9WAMZ 7.6 9.7European Union 45.1 42.8Rest of the World 34.6 38.6
WAMZWAMZ 3.6 4.6WAEMU 4.2 3.4European Union 28.0 42.2Rest of the World 64.2 49.8
Source: IMF, Direction of Trade Statistics, July 2003 Online Version
A second important factor influencing net benefits is the degree of symmetry of theshocks that affect the region’s economies. Table VI.2 indicates that there is a major problemof asymmetry as concerns Nigeria, a country facing terms of trade shocks that are negativelycorrelated with those of some of the other economies of the region. This applies both toWAEMU and to Nigeria’s potential WAMZ partners. The source of this asymmetry is clear:Nigeria’s exports are mainly crude oil, while other countries of the region are oil importers.While they too typically export primary commodities, the prices of the latter do not movetogether with the world oil price. Thus, the terms of trade of Nigeria and the other ECOWAScountries behave quite differently. Moreover, not only are the correlations low or negative,but also the variability of Nigeria’s terms of trade shocks is large—the standard deviation ofyearly changes in the terms of trade equal 21.5 percentage points, higher than that of any ofthe other countries in the region—making it an unstable partner whose size might induceundesirable movements in the region’s real exchange rate. In contrast, as is evident fromTable VI.2, the correlations of terms of trade shocks are higher among WAEMU countriesthan between them and WAMZ countries, or among WAMZ countries, suggesting thatWAEMU forms a more desirable currency area. Forming a larger currency area might diluteWAEMU’s advantage in that regard.

5
Table VI.2. Openness, Standard Deviation and Correlation of Terms of Trade Shocks
Openness1 Standard Deviation ofTOT shocks Correlation of Terms of Trade Shocks
Unscaled Scaled2 Benin BurkinaFaso
Coted'Ivoire Mali Niger Senegal Togo Gambia Ghana Guinea Nigeria Sierra
LeoneBenin 61% 0.178 0.109 0.56 * 0.22 0.43 ** -0.03 0.46 ** 0.28 0.14 0.33 -0.19 0.07 0.19Burkina Faso 43% 0.072 0.031 0.56 * 0.06 0.94 * -0.02 0.57 * 0.11 0.37 0.16 0.26 0.02 0.06Cote d'Ivoire 82% 0.063 0.052 0.22 0.06 -0.01 -0.40 ** 0.59 * 0.52 * 0.36 0.75 * -0.16 -0.23 0.65 *Mali 63% 0.051 0.032 0.43 ** 0.94 * -0.01 -0.06 0.48 * 0.07 0.26 0.08 0.32 0.01 -0.05Niger 47% 0.064 0.030 -0.03 -0.02 -0.40 ** -0.06 -0.57 * -0.41 ** -0.31 0.05 -0.13 -0.17 0.06Senegal 67% 0.065 0.043 0.46 ** 0.57 * 0.59 * 0.48 * -0.57 * 0.49 * 0.62 * 0.28 0.33 0.09 0.15Togo 76% 0.081 0.062 0.28 0.11 0.52 * 0.07 -0.41 ** 0.49 * 0.03 0.14 0.07 0.27 0.26Gambia 154% 0.186 0.286 0.14 0.37 0.36 0.26 -0.31 0.62 * 0.03 0.17 0.54 * 0.06 0.17Ghana 62% 0.111 0.069 0.33 0.16 0.75 * 0.08 0.05 0.28 0.14 0.17 -0.41 -0.54 * 0.62 *Guinea 39% 0.073 0.029 -0.19 0.26 -0.16 0.32 -0.13 0.33 0.07 0.54 * -0.41 0.59 * -0.44Nigeria 71% 0.215 0.152 0.07 0.02 -0.23 0.01 -0.17 0.09 0.27 0.06 -0.54 * 0.59 * -0.38Sierra Leone 45% 0.063 0.028 0.19 0.06 0.65 * -0.05 0.06 0.15 0.26 0.17 0.62 * -0.44 -0.38
Average All 0.19 0.24 0.18 0.19 -0.15 0.27 0.14 0.19 0.13 0.06 -0.02 0.10Average WAEMU 0.32 0.37 0.16 0.31 -0.25 0.34 0.17 0.21 0.26 0.07 0.01 0.19Average Non-WAEMU 0.08 0.13 0.20 0.09 -0.07 0.21 0.11 0.16 -0.03 0.05 -0.05 0.00
Source: Calculated from the Terms of Trade Index (1987=100,US$-based), World Tables (World Bank).Openness calculated from Balance of Payments Yearbook 2001, Direction of Trade Statistics 2001, and International Financial Statistics.* Significant at 5% level.** Significant at 10% level.1/Calculated as the sum of exports and imports as a percent of GDP2/ Scaled by openness

6
Third, an important aspect of asymmetry that can interfere with the success of a monetaryunion when a central bank is not insulated from fiscal pressures is the degree of fiscal(in)discipline. A key aspect of the model discussed in Chapter III lies in the extent to whichgovernment spending objectives exceed the socially optimal levels. Of course, goals aregenerally unobservable. However, reasonable estimates of the cross-country differences inspending targets can be obtained by looking at the determinants of political distortions. From“white elephants” to pervasive inefficiencies in the provision of priority services like health andeducation, socially wasteful outlays often originate in corruption. Table VI.3 comparescorruption measures for the ECOWAS countries with the average for the rest of Sub-SaharanAfrica (SSA), as well as a global sample. African countries perform significantly worse thanother regions. Most importantly for our analysis, there are also large differences in the scoresacross the ECOWAS countries, with Niger and Nigeria emerging as the most affected bycorruption while the Gambia is very close to the World average.
Other aspects of a country’s institutional environment may distort expenditure policies.Using International Country Risk Guide (ICRG) data, we calculated an institutional qualityindex, which combines equally weighted indices of democratic accountability, corruption,government stability, bureaucratic quality and rule of law.2 This broader index is similar to thoseused in the literature on institutions and growth (see e.g. Hall and Jones, 1999 or Easterly andLevine, 2003). Table VI.3 shows that the average institutional quality index for both WAEMUand WAMZ member states is lower than the average for SSA. The Gambia, Ghana, Côted’Ivoire and Senegal have the highest indices for the countries considered, while Sierra Leone,Togo and Mali are at the low end of the scale.
2 A score of 10 is the maximum and indicates the highest institutional quality.

7
Table VI.3. Corruption and Institutional Quality IndicesCorruption1/ ICRG Institutional
Quality Index2/
Gambia,The -0.02 5.62 Ghana -0.30 5.56 Guinea -0.85 4.59 Nigeria -0.95 4.20 Sierra Leone -0.02 2.98 WAMZ average -0.43 4.59
Benin -0.78 BurkinaFaso -0.37 4.31 Côte d'Ivoire -0.08 5.53 Mali -0.48 3.42 Niger -1.57 3.96 Senegal -0.24 5.27 Togo -0.24 3.41 WAEMU average -0.54 4.32
Sub Saharan Africa -0.48 4.68
The whole sample 0.00
Sources: Corruption scores from Kaufman et al. (1999); International Country Risk Guide(ICRG) from PRS Group, www.icrgonline.com.1/ Scores range from -2.5 to 2.5, with higher numbers indicating less corruption.2/ ICRG index is average of scores for measures of democratic accountability, corruption,government stability, bureaucratic quality, and rule of law. Scores range from 0 to 10, withhigher numbers indicating better institutions.
Using the methodology described in the Appendix to Chapter III, we find that estimateddiversion wedges vary substantially across the region, ranging from 21 percent of actualexpenditure in Côte d’Ivoire and Senegal to more than 70 percent in Nigeria (Table VI.4). Weneed to make a further calculation to obtain spending targets. In particular, we note that actualspending may vary because of other reasons related to the extent of development: countries withhigher per capita incomes have a higher tax capacity, which permits them to offer greater socialservices to their citizens. While doing so may have ancillary costs, such as the reducedincentives to work associated with higher taxes, nevertheless this choice is quite separate fromissues of corruption or of pressures on central banks to finance deficit spending. Thus, asdescribed in the Appendix to Chapter III, we remove the systematic effect of per capita incomeon both expenditure and revenues (as ratios to GDP), and only consider spending evaluated at theaverage level of per capita income for Africa plus the government spending residual, i.e., theextent that countries spend more than predicted by their level of income. We then add this to afraction (half) of the diversion wedge described above3, to get the estimate of the component of
3 Only a fraction is added to allow for diversion of spending as well as a higher spending target. We have no firmevidence of their relative importance, so we choose equal proportions.

8
the spending target that is likely to put pressure on the central bank to monetize deficitspending—we term them “distorted spending targets.” These figures, which are reported inTable VI.4 for ECOWAS countries (a more complete set of data is in Appendix of Chapter III),indicate higher distorted spending targets for Nigeria, Ghana, and Sierra Leone than for theremaining ECOWAS countries. WAEMU countries all have lower ratios, though Burkina Fasoand Mali have considerably higher values than Senegal and Côte d’Ivoire.
Table VI.4 Selected Indicators for ECOWAS Countries*, Averages 1995-2000(Percent of GDP, unless noted otherwise)
Country Name Gov’tRevenue1
Gov’tSpending
Overallsurplus/deficit1
Inflation2 GDP percapita
(Cur. US$)
Gov’tSpendingat average
income2
Diversion2 SpendingTarget3
WAEMUBenin4 19.08 19.48 -0.40 5.6 370 29.09 34.57 46.37Burkina Faso 21.82 25.12 -3.29 3.1 222 36.16 42.21 57.26Cote d'Ivoire 21.64 23.58 -1.94 3.9 711 30.18 21.51 40.93Mali 21.77 24.88 -3.11 3.4 246 35.69 38.16 54.77Niger 12.95 15.78 -2.83 4.0 195 27.10 49.94 52.07Senegal 20.21 20.11 0.10 2.6 511 28.43 21.61 39.23Togo 16.38 20.19 -3.81 4.7 317 30.31 33.99 47.30
WAMZGambia 20.53 25.33 -4.80 2.6 343 35.19 29.33 49.85Ghana 22.50 28.60 -6.10 31.8 374 38.17 47.70 62.02Guinea 13.99 16.60 -2.61 4.5 512 24.90 35.71 42.75Nigeria 25.90 25.00 0.90 22.4 290 35.37 70.57 70.65Sierra Leone 11.41 19.73 -8.32 22.1 167 31.33 57.61 60.13Data- World Bank Africa Database 2002 Edition and calculations by author (see Table III.3)* Excluding Cape Verde, Liberia and Guinea-Bissau1/ Including grants2/ Percent3/ Government spending at average income plus diversion/24/ Diversion estimate for Benin is calculated as the average for the other WAEMU countries

9
B. Model Evaluations of the Net Benefits of Monetary Unions
We first consider whether the existing WAEMU is better than floating exchange rates forthe countries concerned. Table VI.5 gives the result of that exercise (Guinea-Bissau was notincluded, because of data problems and also the fact that it has been a member of WAEMU onlysince 1997). To help in understanding the results, the various columns of the table presentrespectively the country shares of the GDP of the union, the net welfare gain or loss (if negative)to the country, the correlation of its terms of trade shocks with the union’s average shock, andthe ratio of the average spending target to the country’s own value. The table suggests thatWAEMU is indeed beneficial for all countries, essentially for two reasons: 1) the monetaryunion fixes the exchange rate for a substantial proportion of trade (within the region or to theeuro zone or rest of the CFA franc zone), and 2) the asymmetries between countries, either dueto low correlations of shocks or very different government spending targets, are not so large as tomake the monetary union unsustainable. To be sure, there are differences across countries, andCôte d’Ivoire and Senegal are estimated to gain the least from membership because theirspending targets are lower than those of other members.4
Table VI.5. Costs and Benefits of WAEMU
Share ofGDP
Net gainor loss
Correlation of shocks
Ratio of averageto own spending
target Benin 0.0824 0.0827 0.6911 0.9377
Burkina F. 0.0985 0.1543 0.6009 0.7920
C. d'Ivoire 0.4137 0.0192 0.7737 1.1080
Mali 0.0987 0.1373 0.4905 0.8282
Niger 0.0729 0.1159 -0.3161 0.8711
Senegal 0.1816 0.0020 0.8331 1.1561
Togo 0.0521 0.0778 0.5628 0.9588
Decomposition of Net Gains NetGain
Externality FiscalAsymmetry
Shock Asymmetry
Benin 0.0827 0.0617 0.0303 -0.0053
Burkina F. 0.1543 0.0617 0.1090 -0.0008
C. d'Ivoire 0.0192 0.0617 -0.0479 -0.0004
Mali 0.1373 0.0617 0.0885 -0.0006
Niger 0.1159 0.0617 0.0650 -0.0020
Senegal 0.0020 0.0617 -0.0674 -0.0003
Togo 0.0778 0.0617 0.0198 -0.0011
4 The notion that these two countries are more disciplined flies in the face of the experience of WAEMU before thedevaluation of 1994, when the two larger countries exploited the lax enforcement of rules on monetary financing ofdeficits (see Stasavage, 1997). It seems that the reinforced fiscal surveillance that emerged from the devaluationcrisis has helped to produce greater fiscal discipline in these two countries.

10
The bottom panel decomposes the gains into three components: those due to externalizingthe monetary policy externality (i.e., lowering the temptation to create monetary expansion tostimulate output), gains or losses due to fiscal asymmetries, and losses due to asymmetric termsof trade shocks5. It can be seen that the monetary policy externality is the source of large gains,while fiscal asymmetries give large gains for the less disciplined countries and substantial lossesfor the more disciplined ones. In contrast, asymmetries of terms of trade shocks seem to haveonly small costs.
We then proceed to evaluate the proposal for a full monetary union among ECOWAScountries. At this stage, we do not call into question the link to the euro that is associated withthe French guarantee of convertibility—though, as discussed below, that would be a major issueshould WAEMU be expanded in that way or merged with another monetary union. Instead, weassume that monetary union would simply add to the trade that was internalized by the monetaryunion, as well as changing the monetary policy settings by modifying fiscal pressures andintroducing new shock asymmetries.
Table VI.6 presents the result of creating a full ECOWAS monetary union (again,omitting Guinea-Bissau, and also Cape Verde and Liberia). For countries currently operating anindependent, and at least partially floating, currency, monetary union is compared to a regime ofmonetary independence. For the WAEMU countries, however, the relevant comparison is not tofloating but to their existing institutional framework, namely a monetary union amongthemselves. Hence, for those countries, the welfare gain or loss is calculated accordingly.Simulation results suggest that only the WAMZ countries would gain from an ECOWASmonetary union, and even among them not all would gain6. In particular, Guinea, with its lowspending target would not gain from a monetary union that included a large, undisciplinedcountry like Nigeria7. Similarly, if WAEMU countries’ were allowed to choose between theircurrent monetary union and a larger, ECOWAS arrangement, they would clearly prefer theformer. The advantages of the existing WAEMU is its membership composed of fairlyhomogeneous countries. In ECOWAS, the large size of Nigeria—assuming that it had acorresponding influence over the union’s monetary policy—would produce higher inflation inresponse to Nigeria’s higher spending target and a monetary policy that was affected by a verydifferent terms of trade shock, dominated by Nigeria’s export dependence on oil.Correspondingly, the correlation between a country’s terms of trade and the average for themonetary union (reported in Table VI.6) gives a value near unity for Nigeria (since it is a largepart of the average) but negative correlations for Ghana and Niger, and only small positivecorrelations for many of the others.
5 The components do not sum exactly to the calculated net gains due to interaction effects.6 Welfare gains and losses are stated in terms of proportional (log) changes in GDP: for instance, welfare would belower in Benin by the equivalent of 8.24% of GDP in an ECOWAS monetary union than in the current WAEMU.7 Nevertheless, its loss is relatively modest, because the loss from fiscal asymmetry is partially offset by the lowerincentive to simulate output by causing inflation associated with a regional central bank.
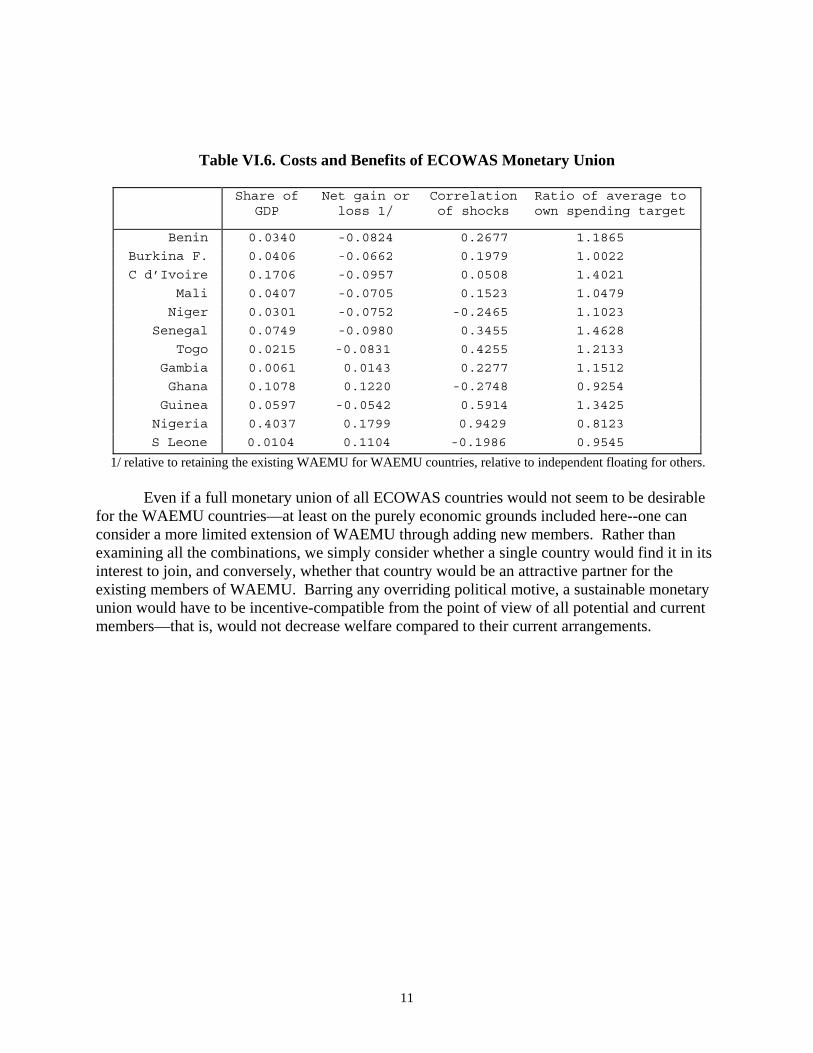
11
Table VI.6. Costs and Benefits of ECOWAS Monetary Union
Share ofGDP
Net gain orloss 1/
Correlationof shocks
Ratio of average toown spending target
Benin 0.0340 -0.0824 0.2677 1.1865
Burkina F. 0.0406 -0.0662 0.1979 1.0022
C d’Ivoire 0.1706 -0.0957 0.0508 1.4021
Mali 0.0407 -0.0705 0.1523 1.0479
Niger 0.0301 -0.0752 -0.2465 1.1023
Senegal 0.0749 -0.0980 0.3455 1.4628
Togo 0.0215 -0.0831 0.4255 1.2133
Gambia 0.0061 0.0143 0.2277 1.1512
Ghana 0.1078 0.1220 -0.2748 0.9254
Guinea 0.0597 -0.0542 0.5914 1.3425
Nigeria 0.4037 0.1799 0.9429 0.8123
S Leone 0.0104 0.1104 -0.1986 0.9545
1/ relative to retaining the existing WAEMU for WAEMU countries, relative to independent floating for others.
Even if a full monetary union of all ECOWAS countries would not seem to be desirablefor the WAEMU countries—at least on the purely economic grounds included here--one canconsider a more limited extension of WAEMU through adding new members. Rather thanexamining all the combinations, we simply consider whether a single country would find it in itsinterest to join, and conversely, whether that country would be an attractive partner for theexisting members of WAEMU. Barring any overriding political motive, a sustainable monetaryunion would have to be incentive-compatible from the point of view of all potential and currentmembers—that is, would not decrease welfare compared to their current arrangements.

12
Table VI.7. Net Benefits of Adding Countries Individually to WAEMU
Share of GDPNet gain orloss 1/
Correlationof shocks
Ratio ofaverage to ownspending target
Benin 0.0812 -0.0003 0.6808 0.9390 Burkina F. 0.0971 -0.0002 0.6058 0.7932C. d'Ivoire 0.4077 -0.0004 0.7735 1.1096 Mali 0.0973 -0.0003 0.4921 0.8294 Niger 0.0719 -0.0003 -0.3251 0.8724 Senegal 0.1790 -0.0004 0.8459 1.1577 Togo 0.0513 -0.0004 0.5497 0.9602
Gambia 0.0145 0.0933 0.4915 0.9111
Benin 0.0653 -0.0244 0.6104 1.0090 Burkina F. 0.0781 -0.0195 0.4780 0.8523C. d'Ivoire 0.3280 -0.0285 0.8416 1.1924 Mali 0.0783 -0.0209 0.3691 0.8912 Niger 0.0578 -0.0223 -0.1956 0.9374 Senegal 0.1440 -0.0298 0.6869 1.2441 Togo 0.0413 -0.0252 0.4436 1.0318
Ghana 0.2072 0.1665 0.8466 0.7870
Benin 0.0720 0.0027 0.6335 0.9308 Burkina F. 0.0860 0.0025 0.6426 0.7863C. d'Ivoire 0.3614 0.0035 0.7206 1.1000 Mali 0.0862 0.0027 0.5478 0.8221 Niger 0.0637 0.0029 -0.3366 0.8648 Senegal 0.1587 0.0038 0.8844 1.1477 Togo 0.0455 0.0031 0.5644 0.9519
Guinea 0.1265 0.0394 0.2176 1.0533
Benin 0.0416 -0.0921 0.2246 1.1964 Burkina F. 0.0498 -0.0744 0.1548 1.0106C. d'Ivoire 0.2090 -0.1070 -0.0539 1.4138 Mali 0.0499 -0.0791 0.1201 1.0567 Niger 0.0369 -0.0844 -0.2394 1.1115 Senegal 0.0918 -0.1094 0.2764 1.4751 Togo 0.0263 -0.0928 0.3939 1.2234
Nigeria 0.4947 0.1765 0.4947 0.8191
Benin 0.0804 -0.0040 0.6861 0.9452 Burkina F. 0.0961 -0.0031 0.5931 0.7984C. d'Ivoire 0.4035 -0.0046 0.7825 1.1170 Mali 0.0963 -0.0033 0.4809 0.8348 Niger 0.0711 -0.0035 -0.3090 0.8781 Senegal 0.1771 -0.0048 0.8245 1.1654 Togo 0.0508 -0.0040 0.5622 0.9665
S. Leone 0.0247 0.1697 0.5075 0.7604
1/ relative to WAEMU for WAEMU countries, relative to independent floating for others.
13
Table VI.7 suggests that each of the WAMZ countries would want to join (includingGuinea, contrary to the ECOWAS case), in order to benefit from the larger monetary area and amore disciplined monetary policy However, only Guinea would be an attractive candidate fromthe point of view of existing WAEMU members, because the generally higher governmentspending targets of the WAMZ countries, which would lead to a more inflationary monetarypolicy than desired by WAEMU. Again, the problem is compounded in the case of Nigeria byvery asymmetric terms of trade shocks.
C. Endogenous Adjustment of Countries’ Economic Structures
While the analysis discussed above has taken existing economic structures as given, thereare reasons to believe that they might evolve over time. Such evolution might modify thenegative conclusion concerning the scope for creating or extending incentive-compatiblemonetary unions. A first reason for being less pessimistic has been suggested in the context ofEuropean integration: monetary union may modify the correlation of fluctuations affectingeconomies, making them more similar. For instance, Frankel and Rose (1998) find evidence thatbusiness cycles tend to become more synchronized as trade increases. Since the latter can beexpected to rise with the creation of a monetary union, it may be misleading to look at the initialcorrelation of fluctuations to assess the desirability of entering a union. Thus, it is argued,monetary union may be attractive to a wider set of countries than would be appear from a staticapplication of OCA criteria.
While this argument may have some validity for industrial countries, it is much lessplausible for African countries, since their production is still heavily weighted toward primarycommodities. This production structure is largely influenced by climate and resourceendowments, and price shocks to the economies are largely exogenous—unlike the case ofdifferentiated manufactured goods where the exporting country is likely to have some marketpower. While over time a monetary union may allow development of manufacturing sectors toserve the larger regional market, this is unlikely to make a large difference to the economies’aggregate fluctuations or terms of trade shocks for a number of years. In West Africa’s case, it ishighly improbable that Nigeria will substantially reduce dependence on oil exports, or that othercountries will follow suit and begin exporting oil—as a result of membership in a monetaryunion.
A second reason concerns the prospects that regional surveillance may enhance fiscaldiscipline, so that membership in a monetary union would result in much lower governmentspending for the initially undisciplined country joining. A careful analysis of the experience inAfrica suggests that monetary unions per se are not “agencies of restraint” over fiscal policies(Masson and Pattillo, 2002). The CFA franc zones both ran into major banking crises andextended economic downturns in part because their fiscal policies were not disciplined—despitehaving benefited from a common monetary policy and an unchanged exchange rate peg for about40 years. Instead, that experience shows that some other mechanisms have to be put in place—such as institutions performing regional surveillance over fiscal policies—that are effective inenhancing discipline. While there is no silver bullet, it seems as though progress has been madealong these lines since the 1994 devaluation in both WAEMU and CAEMC. As discussed in

14
Chapter IV above, peer pressure operates to some extent to limit governments’ tendencies toexceed the ceilings for government deficits and debt. However, it is clear that furtherreinforcement of the effectiveness of the process is needed, since countries face essentially noeconomic sanction if they miss their targets.
In the context of the WAMZ monetary union, similar (though looser) convergencecriteria have been put in place. However, countries have made little progress in meeting theirtargets, starting from initial levels that were far away from them. There seems to be littleappreciation of the need to prepare the grounds for entering monetary union by achieving lowinflation and fiscal discipline. What would be needed to make an ECOWAS monetary unionsustainable, and desirable to WAEMU members, would be to design strict rules that includedsanctions for non-compliance. Only then could the creation of monetary union hope to bringabout the fiscal discipline that would be required, in particular by Nigeria, for an ECOWASmonetary union. Unless agreement were reached on such mechanisms before countries weregiven a chance to join the monetary union, its sustainability would be in doubt, since theincentives for countries to agree later would be absent. Countries need to be able to apply peerpressure in order to make adjustment a precondition for joining a monetary union. A mechanismfor applying peer pressure has just been created—the APRM of the NEPAD. Though stilluntested, it aims to produce the necessary improvement in governance that would help solve thefiscal problems; we return in Chapter IX to the issue of whether the application of NEPADcriteria can abet regional integration.
If progress is made in producing fiscal discipline, then as shown in Debrun, Masson andPattillo (2002), the prospects for a welfare-enhancing monetary union are much better8. Forinstance, in that paper we assume that Nigeria’s spending target is brought down to the averagelevel for the rest of ECOWAS. In that case, monetary union becomes attractive for allconcerned, including the present WAEMU countries—despite a continued asymmetry in exportcomposition and terms of trade shocks. The challenge will be to create the conditions thatachieve such a result.
D. Prospects for Evolution of the CFA Franc Zone
The project to create the ECOWAS monetary union calls into question the continuedexistence of WAEMU, and hence of the CFA franc zone itself. Though the terms of the eventualmerger between WAMZ and WAEMU have not been agreed, the issue of the French guaranteeof convertibility of the CFA franc issued by the central bank of the latter—the BCEAO—wouldnecessarily come up for reexamination. Indeed, negotiations prior to the creation of the eurozone raised the question whether France’s arrangement with the CFA franc zone constituted amonetary arrangement, falling under the legal framework created by the Maastricht Treaty to bedecided by common accord, or instead was a purely budgetary arrangement, with (minor)implications only for France’s commitment not to run excessive deficits.9 Though the latterinterpretation was generally accepted, nevertheless France’s EU partners insisted that anysubstantial modification of the arrangements with the CFA franc zone would require their
8 The earlier paper calibrated the parameters using just West African data, here (as described in Chapter III,Appendix) we use the full sample of African countries for which data were available.9 See Gnassou (1999) for a discussion of the legal issues and for details on the European Council’s decision.

15
accord. In particular, a decision of the Council of the European Union of 23 November 1998,requires France to inform European institutions of the operation of the CFA franc zone, and tosubmit for their approval any proposed changes that would modify the nature or scope of thearrangements. Any such changes would have to be then approved by the European Council, onrecommendation of the EU Commission and after consultation with the European Central Bank.
The addition of a single country, especially one of only moderate size, might well notraise objections from the EU, nor imply any major additional demands on the French treasury.However, what is envisioned by WAMZ is a merger of equals with WAEMU, and the newECOWAS union would have a combined GDP that was more than double that of WAEMU atpresent. Nigeria alone would constitute 40 percent of the ECOWAS monetary union’s GDP(Table VI.6). It is unlikely that France would accept to continue to provide a convertibilityguarantee for a monetary union of that size, especially given issues relating to monetary andfiscal discipline of the larger zone. An alternative that might seem attractive to ECOWAS but isunlikely to be agreed by the European Union would be for EU institutions to take over fromFrance in providing for the link to the euro, either through the EU budget or by intervention ofthe European Central Bank. Currently, the EU has not provided assistance even to countriesabout to accede to EU membership for them to adopt the euro or to peg to it; the EU is unlikelyto do so for ECOWAS countries with which political links are much looser.
If an ECOWAS monetary union went ahead it would likely be as a result of WAEMUcountries agreeing to break the existing link with the French treasury’s Operations Account.Consequently, ECOWAS would assure the convertibility of the currency by the central bank’sown reserves. ECOWAS countries would have to decide, as well, what would be the exchangerate regime of their currency, whether it would be pegged to the euro as is at present the case forthe CFA franc, would be pegged to some other currency (or basket of currencies), or would floatwith or without intervention by the central bank. While these are distant issues they areimportant for gauging the desirability of a monetary union. If fiscal discipline cannot beenhanced then there is a great likelihood that the new currency, left to its own devices with theloss of French treasury support, would share the experience of independent African currenciesdescribed in Chapter V, and would be associated with bouts of high inflation and exchangemarket instability.
E. Conclusions
An ECOWAS monetary union is an ambitious project driven more by political thaneconomic logic. While there may be some increase in trade resulting from sharing a commoncurrency, asymmetries due to fiscal positions and export composition in the region are great, andthe existing trade linkages are small, suggesting that economic net benefits to the countriesconcerned would on balance be negative. Indeed, our simulations indicate that for WAEMUcountries, enlargement to the rest of ECOWAS of their monetary union would not be desirable,and this might well lead WAEMU not to agree to such a union. Most of the WAMZ countrieswould gain, but they would gain even more from a union of which Nigeria was not a member.Nigeria would produce problems for other countries if it continued to exhibit lack of fiscaldiscipline. However, if an effective disciplining device were put in place, for instance throughinstitutions of multilateral surveillance able to impose sanctions for non-compliance or an

16
improvement of governance associated with NEPAD, and as a result Nigeria were able toachieve fiscal discipline on a par with its neighbors (or better), then monetary union might bedesirable and sustainable for all concerned.
The creation of a new ECOWAS currency raises other issues related to the exchange rateregime, since the involvement of France in the operations of the WAEMU monetary unionwould probably cease. The ECOWAS central bank could itself commit to a peg to the euro, thedollar, or a basket of currencies, but this would require an adequate level of reserves and somerestrictions on capital movements. While there would be potential advantages of greaterflexibility, there would also be dangers that the central bank, subject to pressures by membergovernments, would not be able to deliver on price and exchange rate stability.

1
10/14/2003Chapter VII: Regional Integration in the Southern Africa Development Community
The Southern African Development Community, or SADC, is a grouping of the countriesin the region that emerged from SADCC, the Southern African Development CoordinationConference. That organization, which was in existence from 1980 until 1992, excluded SouthAfrica, and had as objectives to contain the apartheid regime and minimize its unfavorableeffects on neighboring countries. Following the formation of the ANC government and thedismantling of apartheid, in 1994 South Africa joined a revamped organization whose purposesbecame to foster harmonization and rationalization of policies and strategies for sustainabledevelopment in the region, to achieve peace and security, and to evolve common political values,systems, institutions, and other links among people of the region. It has contributed importantlyto political cooperation among member countries and helped to limit regional conflicts, but onthe economic policy side its main achievement to date has been agreement on a Trade Protocol,calling for an 85 percent reduction of internal trade barriers over eight years, starting fromSeptember 1, 2000. So far progress has been slow in implementing the trade protocol, and it isuncertain whether it will be applied as agreed. It has also put in place the sharing of information,especially in the financial area, through the SADC Committee of Central Bank Governors, andput in place mechanisms for harmonizing financial regulations and improving payments systemsin the region.
Monetary union is not yet an objective with an explicit timetable for achievement, but itis an implicit objective, since the African Union aims to build a monetary union for the entirecontinent in stages starting with each of the sub-regions. Monetary integration in the wider sensehas already received considerable attention within SADC. Until 2001, sectoral responsibilitieswere devolved to the member countries, and South Africa had responsibility for the Finance andInvestment Sector. South Africa also chaired the SADC Committee of Central Bank Governors,which is currently entrusted with various projects: to develop a common database of monetaryand financial statistics, to develop payment systems in SADC countries, to examine the impact ofexchange controls, to coordinate training, and to analyze differences in legal and operationalframeworks among central banks. The SADC governments have also agreed to a set ofindicators which will allow monitoring of progress toward macroeconomic convergence,focusing in particular on reducing the rate of inflation to low and stable levels, which could laythe groundwork for an eventual common monetary policy.
Moreover, monetary integration is viewed as an important building block for the freetrade area. For instance, SARB Governor Tito Mboweni, who is not a proponent of a rapidmonetary union, is quoted as saying “One cannot implement free trade in goods and serviceswithout having the proper financial systems in place.”1 In the same interview, he is quoted asstressing that monetary union itself is however still a long way off. But politicians have the habitof overcoming the caution of central bankers when high profile political objectives are at stake,such as taking an important step towards regional integration. So the issue of a SADC monetaryunion needs to be analyzed carefully because it might at some point become an explicitcommitment. This is the objective of the current chapter. 1 “Single currency concept ‘a long way away for SADC’”, by William Dhlamini, The Namibian, August 24, 2000(www.namibian.com.na/Netstories/2000/August/Marketplace/009C27F854.html)
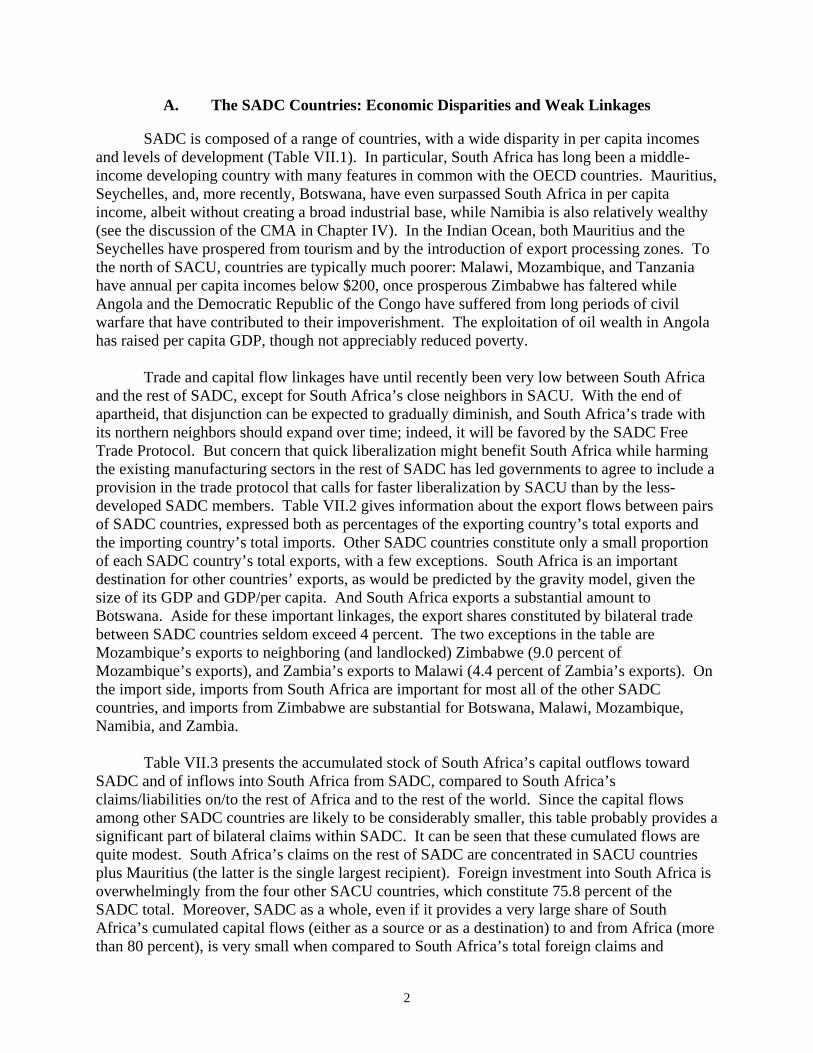
2
A. The SADC Countries: Economic Disparities and Weak Linkages
SADC is composed of a range of countries, with a wide disparity in per capita incomesand levels of development (Table VII.1). In particular, South Africa has long been a middle-income developing country with many features in common with the OECD countries. Mauritius,Seychelles, and, more recently, Botswana, have even surpassed South Africa in per capitaincome, albeit without creating a broad industrial base, while Namibia is also relatively wealthy(see the discussion of the CMA in Chapter IV). In the Indian Ocean, both Mauritius and theSeychelles have prospered from tourism and by the introduction of export processing zones. Tothe north of SACU, countries are typically much poorer: Malawi, Mozambique, and Tanzaniahave annual per capita incomes below $200, once prosperous Zimbabwe has faltered whileAngola and the Democratic Republic of the Congo have suffered from long periods of civilwarfare that have contributed to their impoverishment. The exploitation of oil wealth in Angolahas raised per capita GDP, though not appreciably reduced poverty.
Trade and capital flow linkages have until recently been very low between South Africaand the rest of SADC, except for South Africa’s close neighbors in SACU. With the end ofapartheid, that disjunction can be expected to gradually diminish, and South Africa’s trade withits northern neighbors should expand over time; indeed, it will be favored by the SADC FreeTrade Protocol. But concern that quick liberalization might benefit South Africa while harmingthe existing manufacturing sectors in the rest of SADC has led governments to agree to include aprovision in the trade protocol that calls for faster liberalization by SACU than by the less-developed SADC members. Table VII.2 gives information about the export flows between pairsof SADC countries, expressed both as percentages of the exporting country’s total exports andthe importing country’s total imports. Other SADC countries constitute only a small proportionof each SADC country’s total exports, with a few exceptions. South Africa is an importantdestination for other countries’ exports, as would be predicted by the gravity model, given thesize of its GDP and GDP/per capita. And South Africa exports a substantial amount toBotswana. Aside for these important linkages, the export shares constituted by bilateral tradebetween SADC countries seldom exceed 4 percent. The two exceptions in the table areMozambique’s exports to neighboring (and landlocked) Zimbabwe (9.0 percent ofMozambique’s exports), and Zambia’s exports to Malawi (4.4 percent of Zambia’s exports). Onthe import side, imports from South Africa are important for most all of the other SADCcountries, and imports from Zimbabwe are substantial for Botswana, Malawi, Mozambique,Namibia, and Zambia.
Table VII.3 presents the accumulated stock of South Africa’s capital outflows towardSADC and of inflows into South Africa from SADC, compared to South Africa’sclaims/liabilities on/to the rest of Africa and to the rest of the world. Since the capital flowsamong other SADC countries are likely to be considerably smaller, this table probably provides asignificant part of bilateral claims within SADC. It can be seen that these cumulated flows arequite modest. South Africa’s claims on the rest of SADC are concentrated in SACU countriesplus Mauritius (the latter is the single largest recipient). Foreign investment into South Africa isoverwhelmingly from the four other SACU countries, which constitute 75.8 percent of theSADC total. Moreover, SADC as a whole, even if it provides a very large share of SouthAfrica’s cumulated capital flows (either as a source or as a destination) to and from Africa (morethan 80 percent), is very small when compared to South Africa’s total foreign claims and

3
liabilities, which are no doubt overwhelmingly with respect to the world’s developed economies.It needs to be recognized, however, that the destination of capital flows may not be adequatelycaptured by the data, if, for instance, South African subsidiaries abroad are intermediaries forholdings in other African countries. This would tend to understate South Africa’s directinvestment in neighboring countries.2
The SADC countries differ considerably in their starting points with respect to thecommon convergence indicators adopted by their governments, in a Memorandum ofUnderstanding on Macroeconomic Convergence (agreed 8th August 2002 in Pretoria). Asmentioned above, the primary focus of the regional surveillance over macroeconomic policies isto maintain a low rate of inflation; other indicators are the ratio of the budget deficit to GDP, theratio of public and publicly-guaranteed debt to GDP, and the balance and structure of the currentaccount. Reference values for the first two of these indicators, as well as two more specificallyfinancial variables, have apparently been specified by the Committee of Central Bank Governorsfor two sub-periods, to prepare for a possible monetary union in 2013-2015: they are given inTable VII.4.
Table VII.4. SADC Convergence Indicators2004-08 2009-12
Inflation Under 10 Under 5Budget deficit No more than 5 No more than 3
Central bank credit to govern.3 No more than 10 No more than 5External reserves 3 months of imports 6 months of imports
Table VIII.5 gives average values over 1995-2000 for the two main macroeconomicconvergence indicators, inflation and the deficit, as well as data for 2002 or the most recent year.It was noted several years ago by Jenkins and Thomas (1996), that the distance from themacroeconomic convergence targets is very widely different across SADC countries. WhileSACU countries have inflation of about 10 percent (which should decline in 2003 due to theappreciation of the rand) and Mauritius, the Seychelles, and Tanzania have single-digit inflation,the remaining countries exhibit persistently high inflation rates. While budget deficit figures areperhaps less reliable or easily compared, the recent data indicate considerably higher figures forZimbabwe, Mozambique, and Malawi than for the other SADC countries.
B. Factors Affecting the Costs and Benefits of VariousConfigurations for Monetary Integration
The design of a monetary union will influence the extent that the monetary policy reflectsthe circumstances of each of the member countries. In one case, a single country may setmonetary policy for the others. This would be the case where smaller countries adopt thecurrency of another, presumably larger, one; this is often called “dollarization” but also appliesto the CMA, in which Lesotho, Namibia, and Swaziland issue their own currencies but align 2 We are grateful to Charles Harvey for this point, which would seem to be increasingly relevant with the recentLondon listings of major South African companies such as De Beers and South African Breweries.3 As ratio to previous year’s tax revenues.

4
their monetary policies to those of South Africa, and allow the rand to circulate within theireconomies (though it is not legal tender in Swaziland). In these cases, it is the fiscal discipline ofthe anchor country that determines the monetary policy of the union, if the central bank is notindependent of the treasury. Fiscal policies of other countries may influence their ability tomaintain their place in the currency area, but do not affect the fundamental properties of thecurrency4. We term this an asymmetric monetary union. For a country considering joining theunion, the extent of fiscal discipline of the anchor country that will be important for the stabilityproperties of the currency. For this reason (and also the independence of the Bundesbank), thedeutsche mark was an attractive currency on which to center the transition to monetary union inEurope, though with the creation of the euro zone there is now a symmetric monetary union inwhich monetary policy is based on conditions in the whole of the euro area. Similarly, the randserves as the anchor of the CMA not only because of the size of South Africa, but also becausethe rand has not suffered high inflation as a result of fiscal pressures.5
In contrast, in a symmetric monetary union all the countries have some influence overmonetary policy. Hence, if a country has fiscal objectives that cannot be matched by revenues, itmay influence monetary policy in an expansionary direction. Thus the benefits and costs of asymmetric monetary union need to take into account the degree of fiscal discipline of allpotential members. Though the problem of governments putting pressure on weak central banksmay be partially ameliorated by the existence of a supranational central bank that is in a strongerposition relative to any single national government, it is not completely solved: a large countrywith weak fiscal discipline can adversely influence the actions of the central bank. The resultingmonetary expansion and high inflation may make a monetary union unattractive for countrieswith a less pressing need for monetary financing of government deficits.
As we have argued in previous chapters, these fiscal issues need to be consideredalongside the traditional criteria related to optimum currency areas, namely the asymmetry ofshocks. Thus, countries that are very dissimilar because they face very different shocks may notfind it optimal to share a common monetary policy. In the African context where many countriesrely on a few commodity exports whose price is determined in world markets, variations in theterms of trade are a potent source of shocks whose correlation (or lack thereof) is an importantpotential influence on the desirability of monetary union. Again, one needs to contrast anasymmetric monetary union, where a potential entrant will be concerned only with similaritywith the anchor country’s shocks, with a symmetric union where the correlation with the averageshock across all countries will be important.
Table VII.5 reports estimates for government spending targets, corrected for differentlevels of per capita income, that include a measure of fiscal distortions (based on themethodology described in the Appendix to Chapter III). We see that CMA countries (aside fromLesotho) and Mauritius have much lower estimates for government spending targets than the
4 There are other externalities related to fiscal policy, even when central banks do not face direct pressures to financepublic deficits, but these are likely to be of second order.5 The issue of formal independence of the central bank may also come into play, though it is unlikely that a centralbank, even if formally independent, could succeed in the face of fiscal policies that generated continued largedeficits.

5
others, Tanzania and Botswana are somewhat higher, followed by Zambia, Malawi,Mozambique, and Zimbabwe, while at the top end of the range are Angola and the DRC.
Table VII.6 gives the correlations across countries of the percent changes in their termsof trade, to gauge the degree of asymmetry of the shocks that affect SADC economies. It can beseen that over the period 1987-97, which is the longest one for which data exist for all countries,6there are numerous negative correlations, indicating severe asymmetries. Some countries, forinstance Mozambique and Tanzania, have mostly negative correlations with other SADCcountries. In contrast, South Africa is positively correlated with Botswana, Lesotho, andNamibia,7 which is not surprising given their close links within SACU. Broadly speaking, thereseem to be two groups of countries, distinguished by the signs of their correlation with SouthAfrica. On the one hand, South Africa’s terms of trade are positively correlated with those of theother SACU countries, Mozambique, Tanzania, Zambia, and to a lesser extent, Zimbabwe. Onthe other hand, South Africa’s terms of trade are negatively correlated with those of Angola, theDRC, Malawi, and the Seychelles.
C. Simulations of Various Monetary Unions
In order to quantify whether the welfare costs of a monetary union due to asymmetries inshocks and fiscal policies are offset by the gains due to limiting tendencies toward over-expansionary monetary policies (through internalizing trade), we draw on the theoretical modeland its calibration, described in Chapter III above.
Simulations of the calibrated model were first conducted for the existing asymmetricmonetary union, the CMA, assuming that monetary policy is set by South Africa. In fact, themodel results indicate that compared to independently floating currencies, the CMA is in theinterest of all participants, given their close trade links and the generally large positivecorrelation of shocks. Each of the CMA countries, namely Lesotho, Namibia, South Africa andSwaziland, would prefer to be a member than to pursue its own, independent monetary policy(Table VII.7). This is true even though we have modeled the monetary policy decision-makingas reflecting only South Africa’s economic conditions (it is assumed that South Africa does,however, internalize the fact that exchange rates are fixed vis-à-vis its trading partners, hencedecreasing slightly the temptation for monetary expansion). If we modeled the CMA as sharingmonetary policy responsibility on the basis of relative GDPs, there would be little difference inthe results, since South Africa contributes 96 percent of the CMA’s GDP. However, all thecountries would in fact slightly prefer the current, asymmetric version, because South Africa hasthe lowestspending target and thus provides a better anchor.
We then consider whether adding other SADC countries individually to the CMA isincentive compatible, both for the new member and for the countries that form the existing CMA(Table VII.8). Again, we assume that the current asymmetric arrangement would continue,namely that South Africa would continue to have sole responsibility over monetary policy. Allcountries except Mauritius would find joining the CMA in their interest, on the basis of the
6 Excluding Swaziland, which had only two available observations.7 The negative correlation with Swaziland should be ignored, and is probably due to the data problems mentioned inthe previous footnote.

6
economic criteria modeled here. Moreover, the existing CMA members would all gain, if anycountry (including Mauritius) joined. Mauritius, in contrast, has a sufficiently low governmentspending target (and the lowest inflation in our sample) that it would not gain by adopting SouthAfrica’s monetary policy.
As an illustration of the forces at work, Table VII.9 decomposes the net gains faced byCMA countries if either Mauritius or Zimbabwe were to join (and also the latter countries’ netgains). It can be seen that internalizing the monetary policy externality (i.e., lowering thetemptation to create monetary expansion by depreciating the rand against the Zim dollar) is amajor source of gains for all countries, while in Mauritius’ case, the negative effect of lowerfiscal discipline of the union offsets the other gains. In both cases, asymmetries of terms of tradeshocks diminish the gains only slightly.
Given the results presented in Table VII.8, we simulate a monetary union between theCMA and all SADC countries except Mauritius; this is presented in Table VII.10. However, alarger monetary union, for instance one including most of the SADC countries, would challengethe existence of a monetary policy made in South Africa. Would a symmetric system makemonetary union more desirable to the non-CMA countries? Table VII.10 suggests that this is notthe case; in fact, only for the Seychelles are the net benefits larger in the symmetric than in theasymmetric case. The Seychelles has a large spending target and would prefer a situation inwhich monetary policy was easier than that dictated by South Africa. For all the other countries,however, the fact that South Africa’s Reserve Bank provided low inflation consistent with itsdisciplined fiscal policies would make it a more desirable anchor than a multilateral central bankreflecting the average spending target. Thus, economic logic would suggest that the SARBcontinue to set monetary policy, meaning that a SADC monetary union would be essentially arand zone.
D. Conclusions
It would seem that there should be the basis for at least some partial SADC monetaryunion, since an expanded monetary union that retained the existing asymmetric structure wouldbe in the economic interests of SADC’s largest economy as well as most of the other members.However, the economic benefits run in the face of the political imperatives for a multilateralmonetary union in which monetary policy would be decided in a symmetric framework (thoughpresumably larger countries would have more weight). Indeed, while an asymmetric monetaryunion with additional members would be desirable to the CMA countries, since it wouldinternalize a larger proportion of their trade without adding to fiscal pressures on monetarypolicy, the same would not be true of a symmetric monetary union with the rest of SADC, whichaccording to our results would be viewed negatively by the CMA, and in particular by SouthAfrica. However, a monetary union for most of SADC that left monetary policy in the hands ofthe SARB is likely to be unacceptable to South Africa’s SADC partners.
This tension is likely to limit expansion of the CMA in the next decades. The impetus forcreating a larger monetary union would doubtless have to come from South Africa, since it isalready at the center of a successful monetary union, the CMA. Going to a monetary union withother SADC members is likely to be on South Africa’s terms, therefore, since its central bank is(with the exception of Botswana’s, which has however a much more recent history of central
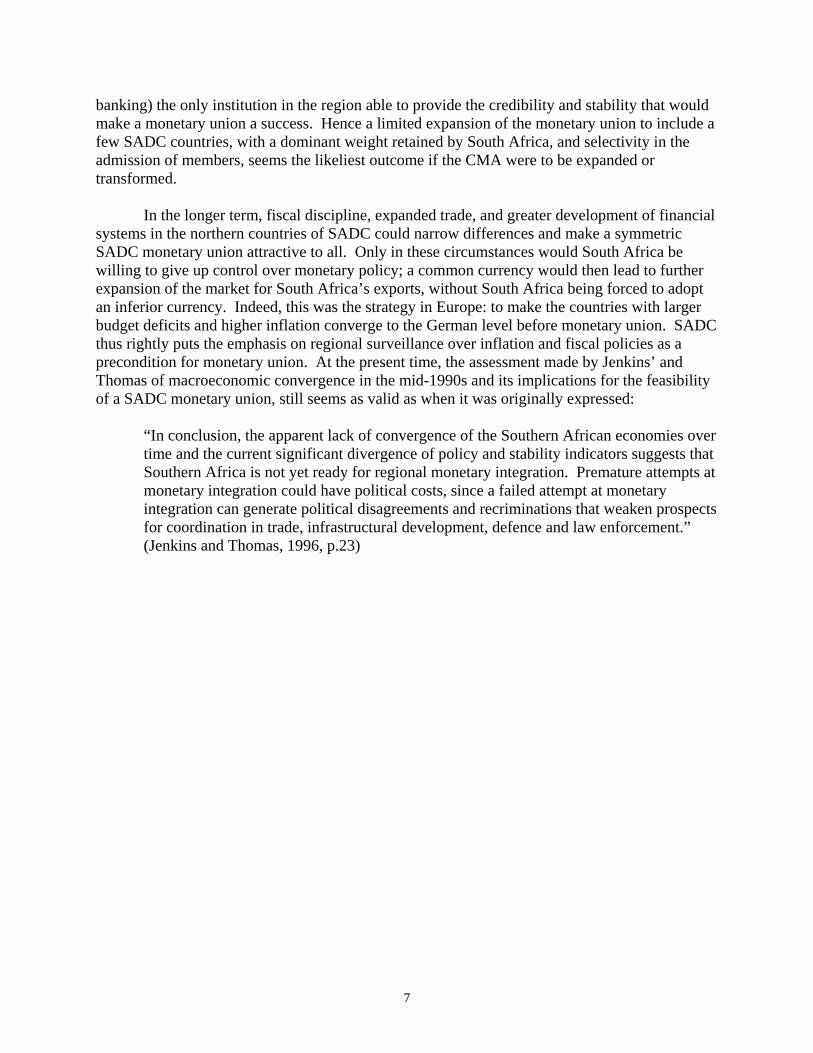
7
banking) the only institution in the region able to provide the credibility and stability that wouldmake a monetary union a success. Hence a limited expansion of the monetary union to include afew SADC countries, with a dominant weight retained by South Africa, and selectivity in theadmission of members, seems the likeliest outcome if the CMA were to be expanded ortransformed.
In the longer term, fiscal discipline, expanded trade, and greater development of financialsystems in the northern countries of SADC could narrow differences and make a symmetricSADC monetary union attractive to all. Only in these circumstances would South Africa bewilling to give up control over monetary policy; a common currency would then lead to furtherexpansion of the market for South Africa’s exports, without South Africa being forced to adoptan inferior currency. Indeed, this was the strategy in Europe: to make the countries with largerbudget deficits and higher inflation converge to the German level before monetary union. SADCthus rightly puts the emphasis on regional surveillance over inflation and fiscal policies as aprecondition for monetary union. At the present time, the assessment made by Jenkins’ andThomas of macroeconomic convergence in the mid-1990s and its implications for the feasibilityof a SADC monetary union, still seems as valid as when it was originally expressed:
“In conclusion, the apparent lack of convergence of the Southern African economies overtime and the current significant divergence of policy and stability indicators suggests thatSouthern Africa is not yet ready for regional monetary integration. Premature attempts atmonetary integration could have political costs, since a failed attempt at monetaryintegration can generate political disagreements and recriminations that weaken prospectsfor coordination in trade, infrastructural development, defence and law enforcement.”(Jenkins and Thomas, 1996, p.23)
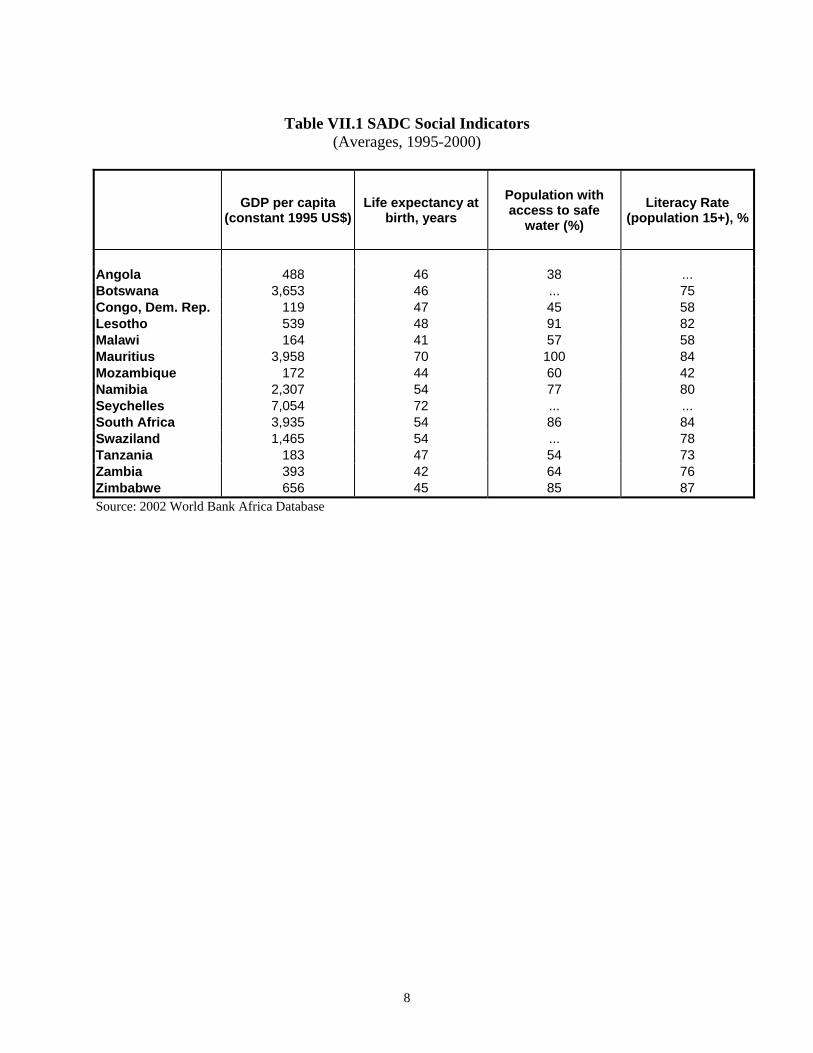
8
Table VII.1 SADC Social Indicators(Averages, 1995-2000)
GDP per capita(constant 1995 US$)
Life expectancy atbirth, years
Population withaccess to safe
water (%)Literacy Rate
(population 15+), %
Angola 488 46 38 ...Botswana 3,653 46 ... 75Congo, Dem. Rep. 119 47 45 58Lesotho 539 48 91 82Malawi 164 41 57 58Mauritius 3,958 70 100 84Mozambique 172 44 60 42Namibia 2,307 54 77 80Seychelles 7,054 72 ... ...South Africa 3,935 54 86 84Swaziland 1,465 54 ... 78Tanzania 183 47 54 73Zambia 393 42 64 76Zimbabwe 656 45 85 87Source: 2002 World Bank Africa Database

9
Table VII.2. Bilateral Trade Flows, averages 1995-2000
A. In percent of Country 1's Total Exports
Country 1 Country 2
Angola Botswana Congo, DR Lesotho Malawi Mauritius Mozamb Namibia Seychelles SouthAfrica Swaziland Tanzania Zambia Zimbabwe
Angola … 0.00 … 0.00 0.00 0.00 … 0.00 0.42 0.00 0.00 0.00 0.00
Botswana … … 0.09 … 0.01 0.05 0.33 0.00 13.77 0.12 0.15 0.89 3.19
Congo, DR 0.00 … … 0.00 0.01 0.00 … 0.00 2.15 … 0.04 0.22 0.10
Lesotho … 0.32 … 0.00 0.00 0.00 2.03 … 85.00 0.75 0.08 0.03 0.41
Malawi 0.00 0.00 0.16 0.00 0.37 0.76 … 0.01 14.52 0.00 0.74 0.79 2.51
Mauritius 0.00 0.01 0.00 0.01 0.13 0.03 0.00 0.32 2.27 … 0.13 0.06 0.59
Mozambique 0.21 0.03 0.02 0.00 3.50 0.39 0.02 0.00 13.74 1.13 0.59 0.42 8.97
Namibia … 0.32 … 0.36 … 0.02 0.30 0.01 55.00 0.49 0.02 0.33 1.18
Seychelles 0.00 0.00 … … 0.00 0.39 0.00 0.06 1.81 0.00 0.01 0.09 0.01
South Africa 0.92 5.63 0.66 1.18 0.89 1.08 1.97 2.34 0.15 1.17 0.64 1.62 3.52
Swaziland 0.00 0.21 … 0.46 0.00 1.43 3.13 1.68 0.10 70.00 3.12 2.01 3.52
Tanzania 0.02 0.08 1.04 0.01 0.85 0.05 0.07 0.01 0.02 0.97 0.02 1.63 0.90
Zambia 0.06 0.34 1.85 0.00 4.77 0.01 0.08 0.27 0.00 6.12 0.05 1.78 2.61
Zimbabwe 0.33 3.01 0.43 0.02 2.95 0.26 1.79 0.73 0.04 11.73 0.05 0.39 3.83
B. In percent of Country 2's Total Imports
Country 1 Country 2Angola Botswana Congo, DR Lesotho Malawi Mauritius Mozamb Namibia Seychelles South Africa Swaziland Tanzania Zambia Zimbabwe
Angola … 0.00 … 0.00 0.00 0.00 … 0.00 0.07 0.00 0.00 0.00 0.00
Botswana … … 0.59 … 0.00 0.02 0.57 0.00 0.22 0.69 0.04 0.45 0.52
Congo, DR 0.00 … … 0.00 0.01 0.00 … 0.00 0.10 … 0.03 0.31 0.05
Lesotho … 0.12 … 0.00 0.00 0.00 1.09 … 0.43 1.30 0.01 0.00 0.02
Malawi 0.00 0.00 0.07 0.00 0.08 0.37 … 0.01 0.24 0.00 0.21 0.41 0.41
Mauritius 0.00 0.06 0.00 0.27 0.35 0.05 0.00 1.43 0.13 0.01 0.13 0.11 0.34
Mozambique 0.02 0.02 0.00 0.00 1.53 0.04 0.02 0.00 0.12 3.49 0.09 0.12 0.81
Namibia … 0.44 … 2.71 … 0.00 0.17 0.01 1.02 3.16 0.01 0.19 0.22
Seychelles 0.00 0.00 … … 0.00 0.02 0.00 0.03 0.01 0.00 0.00 0.01 0.00
South Africa 10.24 66.33 15.96 36.72 37.88 12.10 50.65 27.31 9.95 32.41 9.56 44.12 30.86
Swaziland 0.00 0.16 … 1.97 0.00 0.20 0.98 1.87 0.08 0.74 0.57 0.67 0.38
Tanzania 0.01 0.14 0.69 0.08 1.00 0.02 0.05 0.03 0.04 0.02 0.19 1.22 0.22
Zambia 0.03 0.80 1.67 0.01 7.45 0.01 0.08 0.92 0.00 0.20 0.51 0.98 0.84
Zimbabwe 0.33 17.27 0.95 0.50 11.29 0.26 4.14 6.05 0.27 0.92 1.41 0.53 9.391/ Bilateral Trade is calculated by averaging exports from 1 to 2, and imports of 2 from 1 Figures over 4 percent are in boldSources: DOT, Bank of Botswana, and IMF country reports, … Not Available

10
Table VII.3 South Africa: Foreign Assets and LiabilitiesDecember 31, 2000 ($US millions)
Assets: Foreign Investment from South Africa into SADC and other CountriesDirect Portfolio Other Total
Angola 3.1 1.4 2.9 7.4Botswana 36.4 41.6 81.6 159.6Democratic Republic of Congo 0.6 0 13.3 13.9Lesotho 23.4 8.8 207.1 239.3Malawi 24.6 0.4 16.4 41.4Mauritius 357.8 66.5 553.4 977.8Mozambique 505.8 0 73.8 579.6Namibia 156.8 9.4 140.3 306.5Swaziland 174.4 9.1 88.3 271.9Tanzania 10.9 0 11.8 22.7Zambia 1.8 0 53.6 55.4Zimbabwe 43.3 2.8 108.1 154.1Total SADC 1,339 140 1,351 2,830Other Africa 378.1 6.9 169.3 554.3
Total Africa 1,717 147 1,520 3,384Total Foreign Assets 34,251 48,141 18,900 101,292
Liabilities: Foreign Investment from SADC Countries into South AfricaDirect Portfolio Other Total
Angola 1.3 0.3 79.1 80.6Botswana 11.1 569.0 185.6 765.7Democratic Republic of Congo 2.2 0 2.0 4.2Lesotho 2.7 5.9 295.1 303.7Malawi 3.6 2.2 32.9 38.8Mauritius 156.9 30.4 481.7 669.1Mozambique 2.7 0.7 47.6 51.0Namibia 17.6 1196.9 287.4 1501.9Swaziland 24.1 8.7 308.0 340.8Tanzania 1.5 0.14 1.4 3.1Zambia 2.2 0.56 5.2 8.0Zimbabwe 16.8 8.7 51.4 76.9Total SADC 243 1,823 1,777 3,844Other Africa 76.3 10.4 228.3 315.0
Total Africa 319 1,834 2,006 4,159Total Foreign Liabilities 46,040 38,743 23,540 108,323
Source: Unpublished data provided by the South Africa Reserve Bank, and SARB Quarterly Bulletin, December 2002.

11
Table VII.5 Selected Indicators, Averages 1995-2000(Percent of GDP, unless noted otherwise)
Country Name Overall surplus/deficit1 Inflation2
Gov’tRevenue1
Gov’tSpending
1995-2000 2002 1995-2000 2002
GDP percap
(Cur. US$)
Gov’tSpendingat average
income2
Diversion2 SpendingTarget 3
Angola 44.29 57.12 -12.83 -3.97 1271.4 105.6 586 64.77 25.50 77.52Botswana 42.02 40.79 1.23 -3.0 9.9 11.4 3262 38.29 18.33 47.45DRC6 5.26 5.79 -0.53 -1.27 458.8 18.0 125 17.73 63.38 18.05Lesotho 46.00 47.00 -1.00 -4.5 7.8 11.9 459 55.78 12.26 61.91Malawi 23.17 28.18 -5.01 -12.6 38.5 14.8 187 39.58 28.92 54.04Mauritius4 20.81 25.88 -5.07 -6.5 6.1 6.4 3620 24.00 12.26 30.13Mozambique 21.18 23.89 -2.71 -18.07 20.3 21.97 200 35.16 38.85 54.58Namibia 31.58 35.18 -3.59 -3.8 8.5 9.27 2136 33.78 9.34 38.45Seychelles4 45.11 56.64 -11.53 -9.47 2.0 6.07 7416 89.90 12.26 96.03South Africa 28.52 33.31 -4.78 -1.07 7.0 10.1 3393 30.98 9.12 35.54Swaziland4 29.89 30.39 -0.50 -5.0 8.7 11.7 1370 32.38 12.26 38.51Tanzania 14.22 14.91 -0.69 -0.1 17.5 4.6 238 25.80 34.11 42.85Zambia 26.00 28.91 -2.91 -8.07 30.6 21.07 349 38.72 25.94 51.69Zimbabwe 29.44 39.25 -9.81 -21.88 34.4 133.2 604 46.75 16.34 54.92
CMA 28.72 33.42 -4.69 -1.1 7.1 10.1 3325 31.22 9.18 35.81SADC, excl CMA5 25.51 29.32 -3.81 -9.6 21.2 37.9 1329 36.19 24.08 48.23
Source- World Bank Africa Database 2002, International Financial Statistics 2003 Online Version, SADC Committee of Central Bank Governors, August 2003 and calculations reported in Table III.2
1/ Including grants2/ Percent3/ Government spending at average income plus diversion/24/ Diversion estimate for Lesotho, Mauritius, Seychelles and Swaziland is calculated as the average for Botswana, Namibia, and South Africa.5/ Excluding Angola and DRC6/ Data for revenue, spending and surplus/deficit, 1995-1997 average7/ 20018/ 2000
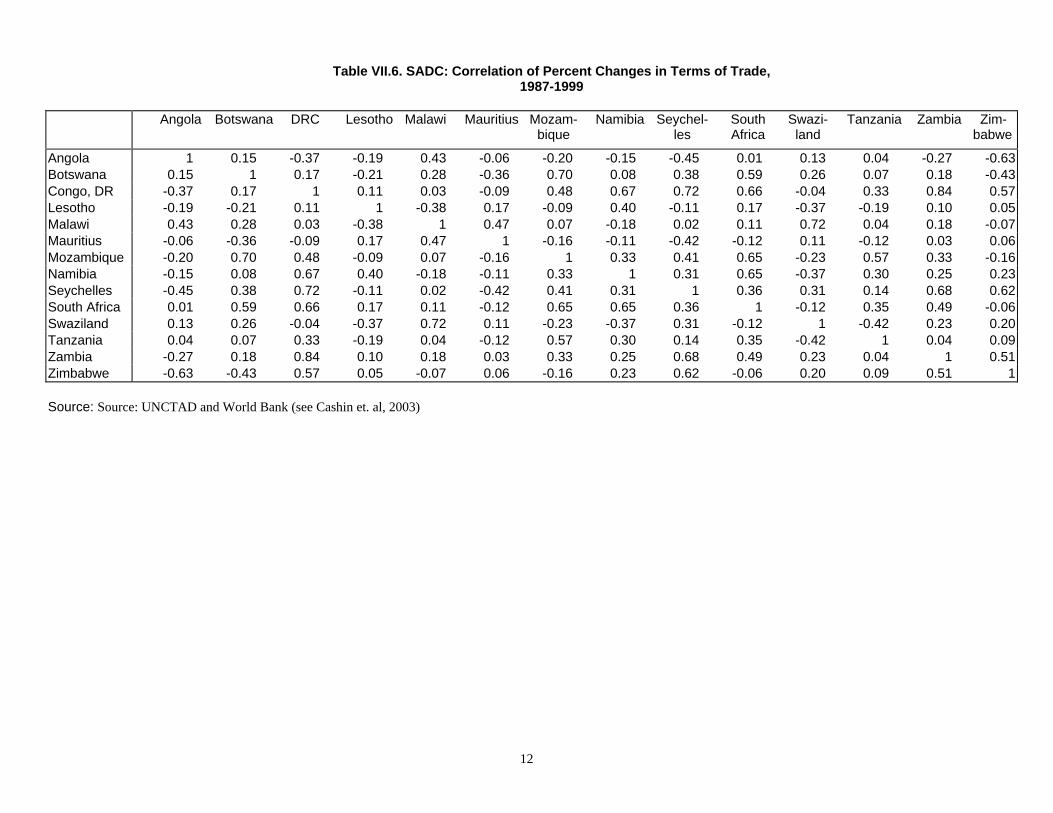
12
Table VII.6. SADC: Correlation of Percent Changes in Terms of Trade,1987-1999
Angola Botswana DRC Lesotho Malawi Mauritius Mozam-bique
Namibia Seychel-les
SouthAfrica
Swazi-land
Tanzania Zambia Zim- babwe
Angola 1 0.15 -0.37 -0.19 0.43 -0.06 -0.20 -0.15 -0.45 0.01 0.13 0.04 -0.27 -0.63Botswana 0.15 1 0.17 -0.21 0.28 -0.36 0.70 0.08 0.38 0.59 0.26 0.07 0.18 -0.43Congo, DR -0.37 0.17 1 0.11 0.03 -0.09 0.48 0.67 0.72 0.66 -0.04 0.33 0.84 0.57Lesotho -0.19 -0.21 0.11 1 -0.38 0.17 -0.09 0.40 -0.11 0.17 -0.37 -0.19 0.10 0.05Malawi 0.43 0.28 0.03 -0.38 1 0.47 0.07 -0.18 0.02 0.11 0.72 0.04 0.18 -0.07Mauritius -0.06 -0.36 -0.09 0.17 0.47 1 -0.16 -0.11 -0.42 -0.12 0.11 -0.12 0.03 0.06Mozambique -0.20 0.70 0.48 -0.09 0.07 -0.16 1 0.33 0.41 0.65 -0.23 0.57 0.33 -0.16Namibia -0.15 0.08 0.67 0.40 -0.18 -0.11 0.33 1 0.31 0.65 -0.37 0.30 0.25 0.23Seychelles -0.45 0.38 0.72 -0.11 0.02 -0.42 0.41 0.31 1 0.36 0.31 0.14 0.68 0.62South Africa 0.01 0.59 0.66 0.17 0.11 -0.12 0.65 0.65 0.36 1 -0.12 0.35 0.49 -0.06Swaziland 0.13 0.26 -0.04 -0.37 0.72 0.11 -0.23 -0.37 0.31 -0.12 1 -0.42 0.23 0.20Tanzania 0.04 0.07 0.33 -0.19 0.04 -0.12 0.57 0.30 0.14 0.35 -0.42 1 0.04 0.09Zambia -0.27 0.18 0.84 0.10 0.18 0.03 0.33 0.25 0.68 0.49 0.23 0.04 1 0.51Zimbabwe -0.63 -0.43 0.57 0.05 -0.07 0.06 -0.16 0.23 0.62 -0.06 0.20 0.09 0.51 1
Source: Source: UNCTAD and World Bank (see Cashin et. al, 2003)

14
Table VII.7. Net Benefits from Membership in CMA
Shareof GDP
Correlationof shocks
Avg/OwnSpendingTarget
Net Gain Rel to float
Net Gain fromSymmetric CMA
Lesotho 0.0065 0.1730 0.5784 0.2088 -0.0013
Namibia 0.0242 0.2906 0.9312 0.0366 -0.0026
South Africa 0.9601 0.9965 1.0075 0.0080 -0.0027
Swaziland 0.0092 0.2174 0.9299 0.0373 -0.0026

15
Table VII.8. Net Benefits of Adding Countries Individually to CMA
Share of GDPNet gain orloss 1/
Correlationof shocks
Avg/OwnSpendingTarget
Angola 0.0459 0.2391 0.7749 0.4866Lesotho 0.0062 0.0003 0.5632 0.6093Namibia 0.0231 0.0008 0.8901 0.9810South Africa 0.9160 0.0006 0.5267 1.0614Swaziland 0.0088 0.0006 0.7176 0.9796Botswana 0.0336 0.1195 0.4322 0.7628Lesotho 0.0062 0.0028 0.1946 0.5847Namibia 0.0234 0.0056 0.3090 0.9414South Africa 0.9279 0.0059 0.9930 1.0185Swaziland 0.0089 0.0056 0.2378 0.9401Lesotho 0.0064 0.0005 0.0949 0.5823Malawi 0.0133 0.1599 -0.3951 0.6671Namibia 0.0239 0.0011 0.2519 0.9375South Africa 0.9473 0.0011 0.9933 1.0144Swaziland 0.0091 0.0011 0.1581 0.9362
Lesotho 0.0063 0.0005 0.1602 0.5758Mauritius 0.0281 -0.0496 0.1292 1.1833Namibia 0.0235 0.0010 0.2515 0.9271South Africa 0.9332 0.0011 0.9921 1.0031Swaziland 0.0090 0.0010 0.1916 0.9258Lesotho 0.0063 0.0010 0.1244 0.5853Namibia 0.0236 0.0020 0.2649 0.9424Mozambique 0.0228 0.1653 0.5011 0.6639South Africa 0.9382 0.0021 0.9877 1.0196Swaziland 0.0090 0.0020 0.1813 0.9410
Lesotho 0.0064 0.0001 0.1904 0.5822Namibia 0.0241 0.0001 0.2848 0.9374Seychelles 0.0039 0.2475 -0.1057 0.3754South Africa 0.9563 0.0001 0.9961 1.0142Swaziland 0.0092 0.0001 0.2232 0.9361Lesotho 0.0061 0.0001 0.0428 0.5840Namibia 0.0230 0.0003 0.2017 0.9404South Africa 0.9122 0.0003 0.9823 1.0174Swaziland 0.0088 0.0003 0.1101 0.9391Tanzania 0.0499 0.0768 0.7071 0.8438Lesotho 0.0063 0.0009 0.2858 0.5841Namibia 0.0237 0.0017 0.3031 0.9405South Africa 0.9385 0.0018 0.9478 1.0176Swaziland 0.0090 0.0017 0.2822 0.9392Zambia 0.0225 0.1412 0.5893 0.6996Lesotho 0.0061 0.0021 0.1765 0.5961Namibia 0.0230 0.0042 0.2885 0.9550South Africa 0.9141 0.0045 0.9960 1.0333Swaziland 0.0088 0.0042 0.2182 0.9537Zimbabwe 0.0479 0.1700 0.0989 0.6687 1/ relative to CMA for CMA countries, relative to independent floating for others
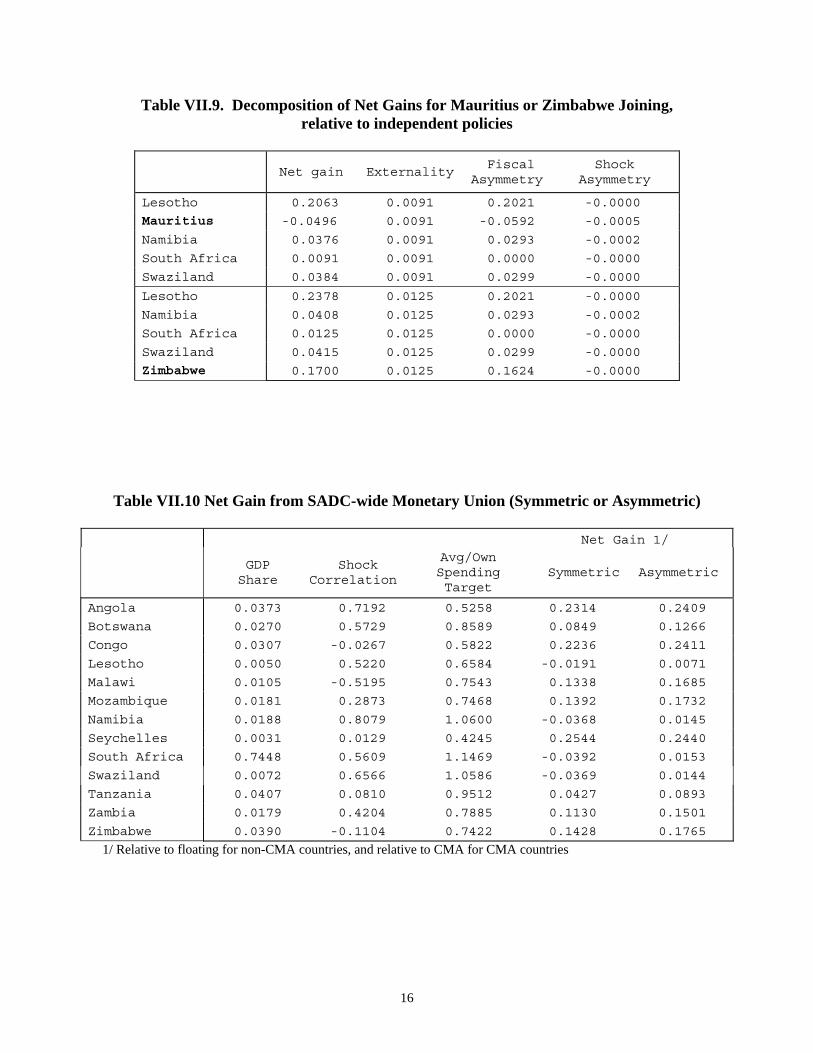
16
Table VII.9. Decomposition of Net Gains for Mauritius or Zimbabwe Joining,relative to independent policies
Net gain Externality FiscalAsymmetry
ShockAsymmetry
Lesotho 0.2063 0.0091 0.2021 -0.0000
Mauritius -0.0496 0.0091 -0.0592 -0.0005
Namibia 0.0376 0.0091 0.0293 -0.0002
South Africa 0.0091 0.0091 0.0000 -0.0000
Swaziland 0.0384 0.0091 0.0299 -0.0000
Lesotho 0.2378 0.0125 0.2021 -0.0000
Namibia 0.0408 0.0125 0.0293 -0.0002
South Africa 0.0125 0.0125 0.0000 -0.0000
Swaziland 0.0415 0.0125 0.0299 -0.0000
Zimbabwe 0.1700 0.0125 0.1624 -0.0000
Table VII.10 Net Gain from SADC-wide Monetary Union (Symmetric or Asymmetric)
Net Gain 1/
GDP Share
ShockCorrelation
Avg/OwnSpendingTarget
Symmetric Asymmetric
Angola 0.0373 0.7192 0.5258 0.2314 0.2409
Botswana 0.0270 0.5729 0.8589 0.0849 0.1266
Congo 0.0307 -0.0267 0.5822 0.2236 0.2411
Lesotho 0.0050 0.5220 0.6584 -0.0191 0.0071
Malawi 0.0105 -0.5195 0.7543 0.1338 0.1685
Mozambique 0.0181 0.2873 0.7468 0.1392 0.1732
Namibia 0.0188 0.8079 1.0600 -0.0368 0.0145
Seychelles 0.0031 0.0129 0.4245 0.2544 0.2440
South Africa 0.7448 0.5609 1.1469 -0.0392 0.0153
Swaziland 0.0072 0.6566 1.0586 -0.0369 0.0144
Tanzania 0.0407 0.0810 0.9512 0.0427 0.0893
Zambia 0.0179 0.4204 0.7885 0.1130 0.1501
Zimbabwe 0.0390 -0.1104 0.7422 0.1428 0.1765
1/ Relative to floating for non-CMA countries, and relative to CMA for CMA countries
10/8/03Chapter VIII: East African Community and COMESA in East and Southern Africa
Plans for monetary integration in East and Southern Africa are complicated byoverlapping membership of countries in a number of regional organizations (including SADC).In this chapter we first consider prospects for monetary integration in a small, three countrygroup--the East African Community, followed by a discussion of a much larger twenty countrygroup stretching from Egypt in the north to Namibia in the South—COMESA.
A. East African Community
The treaty establishing the East African Community (EAC), comprised of Kenya,Tanzania and Uganda, was signed by the three member governments in November 1999.Formally launched in January 2001, the EAC succeeded a 1996 cooperation agreement to reviveregional integration which had ended following the 1977 collapse of the original East AfricanCommunity. The 1999 treaty provides for the formation of a customs union by 2004, to befollowed by a common market, subsequently a monetary union, and ultimately a politicalfederation. A Second EAC Development Strategy (2001-5) agreed to by the membergovernments sets out an action plan for widening and deepening cooperation in a range ofspheres including political, economic, social, cultural, research and technology, defense, as wellas legal and judicial affairs. The declared vision for regional integration is to create wealth andenhance competitiveness through increased production, trade and investment in the region.
Regarding the monetary union objective of the Community, Article 82 of the Treatystates that the partner states will “co-operate in monetary and financial matters and maintain theconvertibility of their currencies as a basis for the establishment of a monetary union.” The treatyelaborates that co-operation will be “in accordance with the approved macro-economic policiesharmonization programmes and convergence framework of the Community in order to establishmonetary stability.” (East African Community, 1999).
Monetary union is seen as a rather distant goal, however, and specificities and timetablesare not currently under discussion. To date, the priority for the Community has been movementtoward a customs union through a program of tariff harmonization, establishment of a commonexternal tariff and elimination of internal tariffs. Progress has been relatively slow, and thepartner states are still very actively negotiating over the latter two areas. On monetary union, thestrategy is to lay the groundwork by maintaining currency convertibility, harmonizingmacroeconomic policies-- particularly exchange rate, interest rate, monetary and fiscal policies,and work toward closer macro-economic convergence. In practice, progress has been made oncurrency convertibility and sharing of information through the synchronization of budget days inthe three countries. But macro-policy coordination or convergence is currently not high on thepriority list for policy makers in the region.

2
1. Revival of the “old” EAC
The current EAC is a revival of the “old” East African Community, which included, atsome point, a customs and monetary union, and joint administration of taxes and many services.The countries, which shared a common currency under Britain’s colonial rule, issued separatecurrencies after independence, but the 1967 Treaty formally establishing the EAC communityspecified free exchange at par. The link to sterling was broken following the 1967 sterlingdevaluation.
Why did the old EAC collapse? The two major contributing factors—namely differencesrelating to the distribution of benefits, and ideological clashes--were not specific to the monetaryintegration aspect. Kenya, the more industrialized partner, ran a persistent trade surplus withUganda and Tanzania. The latter two countries felt that Kenya benefited more from thearrangement in terms of trade and fostering industrial development, and were disappointed thatcompensating mechanisms (subsidies, concessions from Kenya, or redistribution through theEast African Development Bank) did not work. (Goldstein and Ndung’u, 2001). Politically,Tanzania, under President Julius Nyerere, and Uganda, under President Milton Obote, pursuedsocialist-oriented strategies, while Kenya was more capitalistic. Tanzania did not recognize theAmin government that took power in a 1971 coup in Uganda, precluding summit meetings andcontributing to the eventual collapse of the community. Ideological and economic factors alsoresulted in all three governments extending exchange controls to each other’s currencies,culminating in the 1977 collapse (Cohen, 1998). Another contributing factor on the monetaryfront was the erosion of regional controls on national monetary creation, undermining monetarydiscipline (Guillaume and Stasavage, 2000).
The three countries agreed to re-launch the EAC in the early 1990s, and set up the EACSecretariat in 1996. An important step was taken when the agreement was signed as a Treaty inNovember 1999. Since its inception, the new EAC has achieved a number of its objectives. Inthe area of monetary and fiscal policy coordination, for example, there is full convertibility of thethree currencies in each of the countries, and an agreement has been reached to liberalize capitalaccounts. Finance ministers hold pre- and post-budget consultations, and the budget presentationdays have been synchronized. Other notable achievements include establishment of an EastAfrican passport and reductions in border delays, harmonization of customs documentation andexecution of a tripartite agreement on avoidance of double taxation (Mkenda, 2001).
Currently, the primary focus of high-level negotiations is movement towards a customsunion. Although an initial report on the strategy was adopted by the member states in 1999(Rajaram et. al, 1999), its findings were not implemented: initially, negotiations towards removalof internal tariffs bore no fruit, and there was no agreement on a common external tariff (CET).Since that time the Treaty has come into force (July 2000), the EAC was formally launched(January 2001) (see EAC Secretariat, 2000) and agreement on a protocol for establishment of acustoms union is now expected to be reached in 2003. The three countries are starting from aposition where although significant progress on trade liberalization was made in the 1990s,tariffs are still high, and bureaucratic application of rules and regulations still continue to act as
3
non-tariff barriers. Limited progress in reducing internal tariffs has been achieved recently underboth COMESA and EAC. Tanzania’s continued low trade with regional partners has contributedto its negative view on regionalism, withdrawal from COMESA, and insistence that cooperationunder EAC should be based on the principle of “asymmetry,” or ensuring that more developedpartners open their markets faster than others (Ng’eno, 2002). While the 1999 report adopted bythe EAC Secretariat had recommended that EAC countries adopt the Uganda tariff structure of(0, 7, 15) percent , for primary, intermediate, and final goods, it was unacceptable to Kenya andTanzania; some simulations have shown that it would result in large revenue losses for thesecountries (Ng’eno, 2002). Other studies differ, however, indicating that the revenue losses fromthe range of CET structures under consideration would be quite small for all countries[reference]. The countries are currently negotiating over a (0,10,20) CET, and over the structureof internal tariffs (Kraus, 2003). The real sticking point appears to be the latter; Uganda andTanzania are reluctant to give up protection against Kenyan imports. Current negotiations aimfor agreement to phase out, asymmetrically, internal surcharges over a 5-year period. Goingforward, there is need for further work on mechanisms for sharing costs and benefits of regionalintegration, and on the appropriate application of asymmetry, if the new EAC is to avoid theproblems faced by the old EAC.
It is of course, extremely difficult to judge prospects for success in forming a customsunion, common market, monetary union, and ultimately a political federation, as envisioned. Thekey factor, is the always unknowable amount of political will. On the customs union, the difficultissue of distribution of benefits is also raised in a recent paper by Venables (2000), who uses theold EAC as an example of a regional integration agreement likely to fail because it promotedincome divergence. Quite slow progress in moving from the cooperation stage to formalnegotiations for a customs union protocol is also not a good sign. Institutionally, the politicalweakness of the EAC Secretariat has hampered timely implementation of agreed measures.Limited institutional capacity may also be spread thin as the Treaty specifies cooperation in sucha broad range of areas: political, economic, social, cultural, environmental, research andtechnology, defense, security, and legal and judicial affairs.
To date, high level discussions on the steps toward or the ultimate form of monetaryunion do not seem to have taken place. The EAC Development Strategy for 2001-05, agreed toby the heads of state, discusses co-operation in macroeconomic policy as the precursor to plansfor monetary union. The importance of maintaining convertibility of currencies is stressed.1Macroeconomic convergence indicators are also specified, covering real GDP growth rates,inflation, current account deficits, fiscal deficits, reserve ratios, domestic savings, and externaldebt/revenue ratios. While written down “on paper” it does not seem, however, that EAC andgovernment officials in the three countries are actually aware of or committed to theseconvergence goals. It is also not clear what specific progress or plans for capital accountliberalization are associated with EAC co-operation efforts.
1 While the IMF AREAR (2002) notes that currencies are freely convertible, and that excessholdings of partner country shillings are repatriated to the respective central banks for immediatecredit in dollars, it is not completely clear how convertibility is operating “on the ground.”

4
The objective of monetary cooperation is to have an East African single currency in placeby 2010. No official statements have been made about the form of the exchange rate regime,although some documents do mention the desire to maintain market determined exchange ratesand acceptable levels of reserves. The Monetary Affairs Committee of the EAC has proposedthat a Monetary Institute be set up to develop and monitor realistic convergence targets, makeplans for monetary union, and follow-up on implementation of agreements in this area (USAID,n.d). It does not seem, however, that this proposal is being seriously discussed.
2. The EAC Countries: A Fair Degree of Linkages
Economic disparities across the three countries have narrowed since the second half ofthe 1990s, as Tanzania and Uganda have pursued macroeconomic and structural reformprograms, spurring strong real GDP growth, while Kenya has lagged behind (related also to thesuspension of donor aid in 2000 because of concerns about corruption). During 1995-2000, realGDP growth averaged 4 % in Tanzania and 7 % in Uganda, compared to 2 % in Kenya. Kenyais still generally ahead of the other two countries in terms of social indicators (Table VIII.1).
As discussed in Chapter III, the benefits of a fixed rate between countries in a monetaryunion tend to be greater if countries have substantial intraregional trade, and more symmetricshocks (which is more likely if economic structures are similar).
Internal trade within the region is relatively small, averaging 7 percent of exports andimports (Table VIII. 2). Still, this is close to the level of trade in ECOWAS (much higher thanfor the non-WAEMU countries) and higher in general than internal trade in SADC, except forSouth Africa’s very high trade with other SACU countries. The pattern of trade is quite uneven,however. For Kenya, the EAC (and COMESA) is an important, and growing export market.Uganda and Tanzania, on the other hand, export very little to their EAC partners (althoughTanzania’s exports to Kenya are growing). Kenya’s imports from the rest of the EAC areinsignificant, part of its trend of declining imports from other African countries overall. ForUganda, Kenya is its most important import source, followed by Asia and the EU. In contrast,Tanzania’s imports from the rest of the EAC are quite low. (Ng’eno, 2002).
Unofficial cross-border trade, although difficult to quantify, is thought to be considerable,however. One set of surveys done in the mid-1990s, estimated unofficial cross-border trade ashighest between Kenya and Uganda at 49 percent of official trade, followed by Tanzania-Ugandatrade at 45 percent of official trade, and Tanzania-Kenya cross-border trade of about 12 percent(see references in Mkenda, 2001). In our simulations of currency union, as for the other regionswe increase bilateral flows by 25 per cent to account for informal trade.
Terms of trade shocks are the most important source of shocks for primary commodityexporting countries. The correlations of changes in the terms of trade calculated in Table VIII.3shows that the average of correlation between countries (0.67) is higher than those for theexisting monetary unions, WAEMU (0.20) and the CMA (0.37). Coffee is the primary exportfor both Tanzania and Uganda, which have the highest correlation of terms of trade shocks in theEAC. Following tea, coffee is also the second largest export for Kenya, whose shocks arerelatively highly correlated with those in Uganda and Tanzania.

5
As noted above, macroeconomic convergence indicators and their specific target valuesdo not appear to be firmly agreed to. Table VIII.4 indicates where countries stand relative toindicators specified in the EAC Development Strategy 2001-5 document. Performance on theGDP growth, inflation, and current account deficit indicators appears reasonable, except forKenya’s anemic growth figures. It is not clear whether the 5 percent targets for fiscal and currentaccount deficits as a share of GDP are including or excluding grants. Assuming that the currentaccount target includes grants and the fiscal deficit excludes grants, Uganda is still far off on thefiscal target. Performance is more mixed on the indicators for reserves, domestic savings, anddebt service to revenues.
3. Net Benefits from Monetary Union
The appendix to Chapter III discusses calibration of the Debrun, Masson, and Pattillo(2002) model using data on the broadest set of African countries available. As for other plannedor existing monetary unions, here we use the common parameters and some region-specificparameters to calibrate the model for the EAC. Recall that the model implies that for anycountry, the net gains from joining a monetary union depend on: differences in fiscal policydistortions, the negative effect of inflation surprises in one country on neighboring country’soutput operating through the strength of trade linkages, and the correlation of shocks. Given therelatively strong (compared to other regions) trade linkages and shock correlation, we mightexpect a monetary union among the three countries to be mutually beneficial. On the other hand,however, Kenya—the country with the largest GDP weight--which in the model implies thelargest weight in the common central bank’s monetary policy, has the least fiscal discipline, asevidenced by a high government spending target (as well as actual government spending/GDP).
In fact, Table VIII.5 indicates that participation in a monetary union is better thanindependent monetary policies (and separate currencies) only for Kenya among the EACmember countries. In contrast, both Tanzania and Uganda have small net losses—theirmagnitudes are will under 1 percent of GDP however, and they could well be offset by otherfactors (including political ones) that we haven’t modeled.
The second panel of the table decomposes the net gains for each country. Internalizingthe monetary policy externality—the reduced incentive to boost output through unexpectedinflation, or competitive devaluations—provides the largest source of gain, following from thereasonable degree of inter-regional trade. Kenya, with a higher government spending target thanthe other two countries, gains from a central bank that is more disciplined, while Tanzania andUganda,, with more conservative government spending targets, show small losses from theexcessive monetary financing. Asymmetry of shocks leads to losses, although extremely smallones.

6
Thus, the DMP model simulations indicate that an EAC monetary union may run into thesame asymmetry that contributed to the demise of the old EAC.2 What are the prospects forsuccessful movement toward monetary integration? East Africa’s long history of attempts atforging regional co-operation can either be viewed a bad legacy of failures that are difficult toovercome, or greater experience at regionalism than most other regions in the continent.
The prospects of moving forward depend on whether the first step of forming a customsunion proves to be successful. Here, the distribution of trade benefits will clearly be an issue:Tanzania and Uganda continue to be concerned that Kenya will benefit disproportionately.Manufacturers in Kenya have protested that the CET under consideration would leave themunable to compete with import products (Kraus, 2003). The magnitude of potential tariff revenuelosses is still not clear and the World Bank is currently undertaking a further study.
The EAC is considering installation of a compensatory mechanism for either countries orsectors that suffer losses from the customs union, an important outstanding issue in thenegotiations. Finally, overlapping membership in other regional organizations (discussed below),both creates difficulties for negotiating CET rates, and could provide the EAC countries with“exit options” should the integration process falter.
On the positive side, there appears to be some political momentum to the process. Factorssuch as a common language, significant donor interest in the project, attention to involvement ofthe private sector, and a new government in Kenya (where prospects appear brighter foreconomic reforms and resumption of donor aid), all also auger well for progress on regionalintegration.
B. The Common Market for Eastern and Southern Africa (COMESA)
In addition to membership in the EAC, Kenya and Uganda are also members ofCOMESA. Tanzania, concerned about potential harm to its industrial development from aplanned zero internal tariff, withdrew from COMESA in 2000, but is reported to be consideringre-entry. As the overlapping membership and similarity of some integration objectives affectincentives and prospects for monetary union in the EAC, we briefly review the main objectivesand monetary integration plans of COMESA.
COMESA was established in 1994 as a strengthened successor to the Preferential TradeArea for eastern and southern Africa founded in 1981. Twenty countries now make upCOMESA: Angola, Burundi, Comoros, Democratic Republic of Congo, Djibouti, Egypt, Eritrea,Ethiopia, Kenya, Madagascar, Malawi, Mauritius, Namibia, Rwanda, Seychelles, Sudan,Swaziland, Uganda, Zambia, and Zimbabwe. COMESA’s broad strategy is that in order to attractprivate investment into the region, the small countries must be able to offer a large single market,leading to a focus on liberalization of the trade and investment environment. (Ngwenya, n.d).Specific objectives include: a full free trade area, a customs union (by 2004), free movement of 2 In contrast, Mkenda (2001) concludes that the EAC forms an optimum currency area, based ona method that finds cointegration of real exchange rates.
7
capital and investment, establishment of a monetary union with a common currency, and freemovement of persons, including right of establishment by 2025. COMESA’s most importantachievement has been the formation in 2000 by nine member countries of a Free Trade Area(FTA) which eliminated tariffs and quotas on goods that conform to COMESA rules of origin.3Other COMESA countries not yet part of the FTA have reduced tariffs on COMESA-originatinggoods by between 60 to 80 percent. Member states are still negotiating over the structure of theproposed common external tariff.
Monetary integration planning has been “on the books” for some time. A MonetaryHarmonization Programme (MHP) was prepared in 1990 for the then PTA, and this programmewas later endorsed in the treaty establishing COMESA. (COMESA, Finance and Economics,n.d). The program envisaged a gradualist approach with several stages: full utilization of theClearing House’s payments mechanism (1992-96); limited currency convertibility and aninformal exchange rate union (1997-2000); fixed exchange rates fluctuating within a givenmargin; central banks remain independent but monetary policy co-ordinated by a commonmonetary institution (2000-24); the common monetary authority issues common currency (2025onwards). A 1995 review of the MHP recommended a set of measurable macroeconomic andinstitutional targets. We review progress towards these targets below, although the extent ofhigh-level official commitment is not clear.
A more recent review of the MHP commissioned by the COMESA Secretariat in 2000found that while some progress had been made toward the policy and institutional targets, it wasthe result of individual country decisions or IMF/World Bank conditionality, not in order to meetcommitments made to COMESA (BIDPA and CSAE, 2001). The study argued that furtherprogress would require stricter macroeconomic targets. It recommended that countries proceed attheir own speed, and that individual countries which have achieved macroeconomic stabilitycould gain credibility by establishing currency boards linked preferably to the euro.
1. COMESA Countries: Weak Linkages
Prospects for trade and monetary integration in the region are complicated by overlappingmembership in regional organizations. Nine of the COMESA partner states are also members ofSADC4. Of these, Namibia and Swaziland are already members of the CMA, with currencieslinked to the South African Rand. Kenya and Uganda are members of both EAC and COMESA,and so have conflicting commitments to two different planned customs and monetary unions.Tanzania is the only EAC country that is also a member of SADC.
3 The FTA members are Djibouti, Egypt, Kenya, Madagascar, Malawi, Mauritius, Sudan,Zambia and Zimbabwe.
4 Angola, Congo, Malawi, Mauritius, Namibia, Seychelles. Swaziland, Zambia and Zimbabwe.

8
Similar to SADC, COMESA countries span a wide range of development levels andeconomic/political conditions.5 Although promoting trade in the region was the objective of theprecursor PTA and COMESA, internal trade remains quite low (Table VIII.6). Exports to otherCOMESA countries as a share of total exports are most important for Kenya—in fact, the largestintra-COMESA trade is Kenya’s exports to Uganda. Egypt imports one of the highest sharesfrom other COMESA countries, which would be expected given the very large size of its market,but the share is still very low. For most other countries, export or import shares constituted bybilateral trade between COMESA countries seldom exceed 4 percent of total exports. Exceptionsinclude substantial trade among neighboring Djibouti and Ethiopia (11 percent of Djibouti’sexports go to Ethiopia, and 9 percent of Ethiopia’s exports flow to Djibouti); as well as a fewother neighbors: six percent of Madagascar’s exports go to Mauritius, Zambia exports fivepercent of its goods to Malawi, and Zimbabwe exports 4 percent of its goods to Zambia.
Given the wide range of export commodities, as expected, the countries in the region facequite asymmetric terms of trade shocks. Table VIII.7 shows that the average correlation ofshocks, 0.12, is lower than that for all existing or potential monetary unions that we haveconsidered. The correlation of shocks is negative for a number of country pairs; shocks arenegatively correlated on average with the rest of COMESA countries for Angola, Djibouti, andSwaziland. Average correlations are highest for a few countries that primarily export coffee:Burundi, Uganda, Ethiopia, and Rwanda.
As noted above, the degree of official commitment to the targets proposed in theMonetary Harmonization Programme is not clear, and the specific targets are currently underreview. Table VIII.8 shows that progress, measured by average levels of the indicators during1995-2000 as well as the latest year available, is extremely varied across the countries.Performance is clearly worst in the countries involved in wars or severe political crises (Angola,Democratic Republic of Congo, Eritrea, Zimbabwe). On the key indicators of inflation andbudget deficits, nine of the twenty countries had average inflation (1995-2000) greater than 10percent, while seven had budget deficits (excluding grants) greater than 10 percent of GDP.
Lastly, Table VIII.9 provides information on government revenue, spending, and otherfiscal indicators utilized in the calibration of the Debrun, Masson and Pattillo (2002) model.Although performance is again varied, one notable feature is that fiscal discipline is quite strongin Egypt, which with a 50 percent share in the GDP of the region would have a large weight indecision-making of a common central bank.
5 Centre for the Study of African Economies (2001) suggests that sub-groups of COMESA couldaim for policy convergence, as an interim step toward monetary integration. Currently, however,he finds no evidence of convergence within these groups: (1) Northern: Egypt, Sudan, Djibouti,Ethiopia, Eritrea; (2) Central: Kenya, Burundi, Comoros, Congo, Mauritius, Rwanda, Seychelles,Tanzania, Uganda; (3) Southern: Zimbabwe, Angola, Madagascar, Malawi, Namibia, Swaziland,Zambia.

9
2. Net Benefits from a Monetary Union
Table VIII.10 presents the results of simulating a monetary union for COMESA. It canbe seen that differences across countries, and in particular, in our measure of fiscal discipline, thegovernment spending target, are large enough so that a number of countries would not gain bybeing members, compared to retaining their independent monetary policies. Interestinglyenough, this includes Kenya and Uganda, whose overlapping project of an EAC currency wasanalyzed above. The largest economy of the region, Egypt, is also estimated to be a small netloser. Tthe largest gainers are identified as those with the weakest fiscal discipline—Angola,Ethiopia, Seychelles, Sudan, and Zimbabwe.
Unlike SADC, COMESA has no natural anchor country, so we do not simulate anasymmetric monetary union. While Egypt, the largest economy, has generally had low inflationand a stable currency, this was in the context of price controls and obstacles to capital mobility.Nor does its central bank have a tradition of independence that would lend credibility to aregional monetary policy.
C. Conclusions
Of the two projects, a monetary union constituted by the countries of the EAC seems themore viable. First, it is in the context of a serious effort to achieve political and economicintegration. Second, the countries have a long, if chequered, history of collaboration. Finally,the economic disparities between the countries are substantial, but not as wide as are faced by theCOMESA, which virtually spans the continent from north to south and includes countries withvery different levels of per capita income and financial development.

10
Table VIII.1 EAC Social Indicators(Averages, 1995-2000)
GDP per capita(constant 1995 US$)
Life expectancy atbirth, total, years
Population withaccess to safe
water (%)Literacy Rate
(population 15+), %
Kenya 338.5 49.2 49 79.7
Tanzania 183.1 46.4 54 72.1
Uganda 327.0 42.6 50 64.5Source: 2002 World Development Indicators (WDI) and African Indicators database.
Table VIII.2 EAC Bilateral Trade Flows1
(Averages, 1995-2000)
In percent of Country 1's Total Exports
Country 2
Country 1 Kenya Tanzania Uganda
Kenya 0 8.46 16.59
Tanzania 4.33 0 2.08
Uganda 0.68 1.03 0
In percent of Country 2's Total Imports
Country 2
Country 1 Kenya Tanzania Uganda
Kenya 0 10.06 38.19
Tanzania 0.92 0 1.65
Uganda 0.10 0.29 0 1/ Bilateral Trade is calculated by averaging exports from 1 to 2, and imports of 2 from 1
Source: Direction of Trade (DOT) Statistics Online, 2003.

11
Table VIII.3 EAC Correlation of Percent Changes in Terms of Trade(1987-1999)
Kenya Tanzania Uganda
Kenya 1.00 0.56 0.64Tanzania 0.56 1.00 0.80Uganda 0.64 0.80 1.00
Source: UNCTAD and World Bank (see Cashin et. al, 2003)
Table VIII.4 EAC Macroeconomic Convergence Indicators and Performance, 2001(in percent, unless otherwise indicated)
Target Kenya Tanzania UgandaReal GDP Growth 7 1.1 5.9 5.0
Inflation 5 5.8 5.1 5.0
Current Account Deficit to GDP 1/ 5 3.2/ 2.4 9.8/2.6 13.1/4.5
Fiscal Deficit to GDP 1/ 5 3.8/2.6 4.5/1.2 11.5/1.6Reserves (in terms of Monthsof Imports of Goods & NFS) 6 months 3.6 months 5.1 months 4.9 months
Domestic Savings/GDP 11.0 15.3 14.0
Debt Services/Revenues 15 20.1 27.0 12.81/ Excluding grants/including grantsSource: Real GDP growth, Inflation, current account and fiscal deficits, and reserves from IMF Staff Reports,domestic savings and debt service/revenues from the IMF World Economic Outlook (WEO) database.
Table VIII.5. Net Gains from EAC Monetary Union
Shareof GDP
Correlationof shocks
Avg/OwnSpendingTarget
Net Gain
From MU
Kenya 0.4247 0.8995 0.9496 0.0378
Tanzania 0.3156 0.8362 1.0465 -0.0060
Uganda 0.2597 0.8889 1.0339 -0.0006
Decomposition of Net Gains relative to independent policies
Netgain
from MUExternality Fiscal
ShockAsymmetry
Kenya 0.0378 0.0145 0.0241 -0.0001
Tanzania -0.0060 0.0145 -0.0211 -0.0001
Uganda -0.0006 0.0145 -0.0155 -0.0001

Table VIII.6 Bilateral Trade Flows Within COMESA1
(Averages 1995-2000)
A. In percent of Country 1's Total Exports Country 2
Country 1 Angola Burundi Comoros DRC Djbouti Egypt Eritrea Ethiopia Kenya Madag-ascar
Malawi Mauritius Namibia Rwanda Seychelles
Sudan Swazli-land
Uganda Zambia Zimba-bwe
Angola 0 … 0 … 0.00 … 0 0.04 0 0 0 … 0 0 0 0 … 0.00 0.00Burundi 0.08 … 0.13 0 0.02 … 0 2.97 0.00 0 0 … 2.29 0 0 0 0.28 0.08 0.06Comoros 0 … 0 0 0 … … 0 0.50 0 0.06 … … 0 … … … 0 0DRC 0 0.06 0 0 0.07 … 0 0.08 0.01 0.00 0.01 0 0.37 0.00 0 0 0 0.22 0.10Djbouti … 0.10 0.00 0 0.00 … 10.99 0.08 0.02 0.02 0 … 0 0 0 0 … 0.15 0Egypt 0.01 0.00 0.00 0.01 0.06 0.01 0.09 0.14 0.01 0.00 0.04 0.00 0.00 0.00 0.53 0.00 0.02 0.03 0.02Eritrea … 0 0 0 0 0.16 … 1.06 0 0 0 0 0 0 0 0 0.01 0.07 0.2Ethiopia 0 0 0 0 9.23 2.55 … 0.68 0.00 0.00 0.00 0 0.05 0 0.07 0 0.06 0.01 0.07Kenya 0.02 0.35 0.18 1.92 0.13 3.83 0.12 1.52 0.08 0.29 0.52 0.00 2.49 0.19 2.02 0.00 16.59 0.17 0.31Madagascar 0.00 0.00 0.47 0.01 0.01 0.03 … 0.00 0.15 0.00 6.17 0.00 0.00 0.15 0.00 0.00 0.01 0.02 0.07Malawi 0 0.04 0.00 0.16 0 2.47 … 0.00 0.04 0.00 0.37 … 0.00 0.01 0.01 0 0.30 0.79 2.51Mauritius 0 0.00 0.08 0.00 0.00 0.00 … 0.00 0.24 2.10 0.13 0.00 0.06 0.32 0 0.00 0.04 0.06 0.59Namibia … … … … … 0.01 … … 0.01 0 0 0.02 … 0.01 … 0.49 … 0.33 1.18Rwanda … 0.98 … 0.86 0 0.02 … 0 0.58 0.00 0 0 … 0 0 0 0 0.02 0.01Seychelles 0 0 0 … 0 0.00 0 0 0.07 0.25 0 0.39 0.06 0 0 0 0 0.09 0.01Sudan 0 0 … 0 0 3.10 … 0.18 0.25 0 0 0.00 … 0 0 … 0 0.00 0.00Swaziland … 0 … … … 0.00 … 0 0.02 0.05 0 1.43 1.68 1.68 0.10 … 0 2.01 3.52Uganda … 0 … 0 … 0.44 0.00 0.00 0.52 0.00 0.00 0 … 0.34 0 0.05 … 0.02 0.05Zambia 0.06 0.71 0 1.85 0 0.20 0.02 0.02 0.29 0.02 4.77 0.01 0.27 0.43 0.00 0.00 0.05 0.19 2.61Zimbabwe 0.33 0.09 0.00 0.43 0 0.34 0.01 0.01 0.31 0.00 2.95 0.26 0.73 0.03 0.04 0.14 0.05 0.12 3.83

13
B. In Percent of Country 2’s Total Imports Country 2
Country 1 Angola Burundi Comoros DRC Djbouti Egypt Eritrea Ethiopia Kenya Madag-ascar
Malawi Mauritius Namibia Rwanda Seychelles
Sudan Swazli-land
Uganda Zambia Zimba-bwe
Angola 0 0 0 0 0 0.00 0 0 0.06 0 0 0 0 0 0 0 0 0 0.00 0.00Burundi 0.00 0 0 0.01 0 0.00 0 0 0.07 0.00 0 0 0 0.57 0 0 0 0.02 0.01 0.00Comoros 0 0 0 0 0 0 0 0 0 0.01 0 0.00 0 0 0 0 0 0 0 0DRC 0 0.53 0 0 0 0.01 0 0 0.03 0.01 0.00 0.01 0 1.62 0.00 0 0 0 0.31 0.05Djbouti … 0.08 0 0 0 0.00 … 0.97 0.00 0.00 0.00 0 … 0 0 0 0 … 0.02 0Egypt 0.02 0.02 0.02 0.04 0.46 0 0.05 0.25 0.18 0.05 0.00 0.07 0.01 0.02 0.00 1.45 0.01 0.10 0.14 0.03Eritrea … 0 0 0 0 0.00 0 … 0.05 0 0 0 0 0 0 0 0 0.00 0.01 0.01Ethiopia 0 0 0 0 9.28 0.08 … 0.11 0.00 0.00 0.00 0 0.09 0 0.02 0 0.03 0.01 0.01Kenya 0.02 4.51 3.81 3.75 0.50 0.49 0.43 2.14 0 0.27 0.98 0.47 0.01 16.85 1.03 2.70 0.02 38.19 0.36 0.22Madagascar 0.00 0.00 1.72 0.00 0.01 0.00 … 0.00 0.02 0.00 0.93 0.00 0.00 0.14 0.00 0.01 0.00 0.01 0.01Malawi 0 0.12 0 0.07 0 0.07 … 0.00 0.01 0.00 0.08 0 0.00 0.01 0.00 0 0.16 0.41 0.41Mauritius 0 0.05 1.36 0.00 0.00 0.00 … 0.00 0.12 6.13 0.35 0.00 0.36 1.43 0 0.01 0.08 0.11 0.34Namibia … … … … … 0.00 … … 0.00 0 0 0.00 … 0.01 … 3.16 … 0.19 0.22Rwanda … 0.65 … 0.09 0 0.00 … 0 0.02 0.00 0 0 … 0 0 0 0 0.00 0.00Seychelles 0 0 0 … 0 0.00 0 0 0.00 0.05 0 0.02 0.03 0 0 0 0 0.01 0.00Sudan 0 0 … 0 0 0.15 … 0.10 0.06 0 0 0.00 … 0 0 … 0 0.00 0.00Swaziland … 0 … … … 0.00 … 0 0.00 0.03 0 0.20 1.87 1.72 0.08 … 0 0.67 0.38Uganda … 0 … 0 … 0.01 0.00 0.00 0.08 0.00 0.00 0 … 0.55 0 0.02 … 0.01 0.01Zambia 0.03 4.23 0 1.67 0 0.01 0.03 0.01 0.08 0.03 7.45 0.01 0.92 1.33 0.00 0.00 0.51 0.20 0.84Zimbabwe 0.33 1.32 0.00 0.95 0 0.05 0.05 0.02 0.22 0.01 11.29 0.26 6.05 0.19 0.27 0.21 1.41 0.30 9.39
1/ Bilateral Trade is calculated by averaging exports from 1 to 2, and imports of 2 from 1 Source: Direction of Trade (DOT) Statistics Online, 2003.
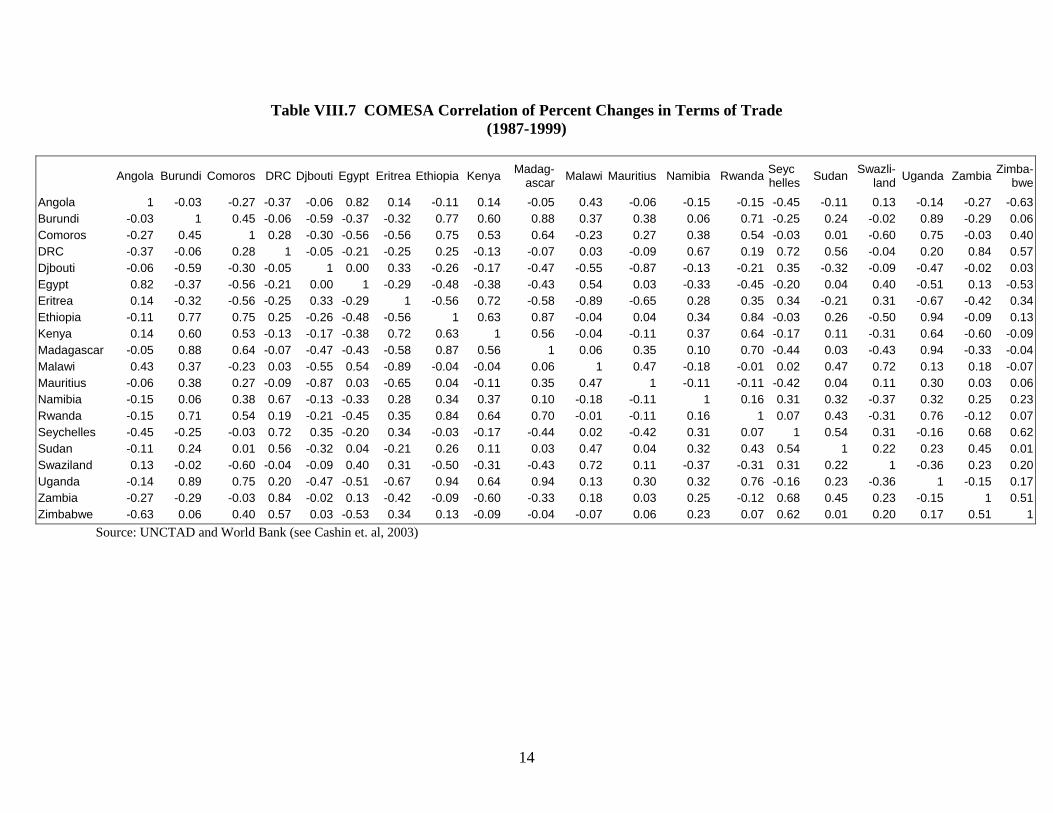
14
Table VIII.7 COMESA Correlation of Percent Changes in Terms of Trade(1987-1999)
Angola Burundi Comoros DRC Djbouti Egypt Eritrea Ethiopia Kenya Madag-ascar Malawi Mauritius Namibia Rwanda Seyc
helles Sudan Swazli-land Uganda Zambia Zimba-
bweAngola 1 -0.03 -0.27 -0.37 -0.06 0.82 0.14 -0.11 0.14 -0.05 0.43 -0.06 -0.15 -0.15 -0.45 -0.11 0.13 -0.14 -0.27 -0.63Burundi -0.03 1 0.45 -0.06 -0.59 -0.37 -0.32 0.77 0.60 0.88 0.37 0.38 0.06 0.71 -0.25 0.24 -0.02 0.89 -0.29 0.06Comoros -0.27 0.45 1 0.28 -0.30 -0.56 -0.56 0.75 0.53 0.64 -0.23 0.27 0.38 0.54 -0.03 0.01 -0.60 0.75 -0.03 0.40DRC -0.37 -0.06 0.28 1 -0.05 -0.21 -0.25 0.25 -0.13 -0.07 0.03 -0.09 0.67 0.19 0.72 0.56 -0.04 0.20 0.84 0.57Djbouti -0.06 -0.59 -0.30 -0.05 1 0.00 0.33 -0.26 -0.17 -0.47 -0.55 -0.87 -0.13 -0.21 0.35 -0.32 -0.09 -0.47 -0.02 0.03Egypt 0.82 -0.37 -0.56 -0.21 0.00 1 -0.29 -0.48 -0.38 -0.43 0.54 0.03 -0.33 -0.45 -0.20 0.04 0.40 -0.51 0.13 -0.53Eritrea 0.14 -0.32 -0.56 -0.25 0.33 -0.29 1 -0.56 0.72 -0.58 -0.89 -0.65 0.28 0.35 0.34 -0.21 0.31 -0.67 -0.42 0.34Ethiopia -0.11 0.77 0.75 0.25 -0.26 -0.48 -0.56 1 0.63 0.87 -0.04 0.04 0.34 0.84 -0.03 0.26 -0.50 0.94 -0.09 0.13Kenya 0.14 0.60 0.53 -0.13 -0.17 -0.38 0.72 0.63 1 0.56 -0.04 -0.11 0.37 0.64 -0.17 0.11 -0.31 0.64 -0.60 -0.09Madagascar -0.05 0.88 0.64 -0.07 -0.47 -0.43 -0.58 0.87 0.56 1 0.06 0.35 0.10 0.70 -0.44 0.03 -0.43 0.94 -0.33 -0.04Malawi 0.43 0.37 -0.23 0.03 -0.55 0.54 -0.89 -0.04 -0.04 0.06 1 0.47 -0.18 -0.01 0.02 0.47 0.72 0.13 0.18 -0.07Mauritius -0.06 0.38 0.27 -0.09 -0.87 0.03 -0.65 0.04 -0.11 0.35 0.47 1 -0.11 -0.11 -0.42 0.04 0.11 0.30 0.03 0.06Namibia -0.15 0.06 0.38 0.67 -0.13 -0.33 0.28 0.34 0.37 0.10 -0.18 -0.11 1 0.16 0.31 0.32 -0.37 0.32 0.25 0.23Rwanda -0.15 0.71 0.54 0.19 -0.21 -0.45 0.35 0.84 0.64 0.70 -0.01 -0.11 0.16 1 0.07 0.43 -0.31 0.76 -0.12 0.07Seychelles -0.45 -0.25 -0.03 0.72 0.35 -0.20 0.34 -0.03 -0.17 -0.44 0.02 -0.42 0.31 0.07 1 0.54 0.31 -0.16 0.68 0.62Sudan -0.11 0.24 0.01 0.56 -0.32 0.04 -0.21 0.26 0.11 0.03 0.47 0.04 0.32 0.43 0.54 1 0.22 0.23 0.45 0.01Swaziland 0.13 -0.02 -0.60 -0.04 -0.09 0.40 0.31 -0.50 -0.31 -0.43 0.72 0.11 -0.37 -0.31 0.31 0.22 1 -0.36 0.23 0.20Uganda -0.14 0.89 0.75 0.20 -0.47 -0.51 -0.67 0.94 0.64 0.94 0.13 0.30 0.32 0.76 -0.16 0.23 -0.36 1 -0.15 0.17Zambia -0.27 -0.29 -0.03 0.84 -0.02 0.13 -0.42 -0.09 -0.60 -0.33 0.18 0.03 0.25 -0.12 0.68 0.45 0.23 -0.15 1 0.51Zimbabwe -0.63 0.06 0.40 0.57 0.03 -0.53 0.34 0.13 -0.09 -0.04 -0.07 0.06 0.23 0.07 0.62 0.01 0.20 0.17 0.51 1
Source: UNCTAD and World Bank (see Cashin et. al, 2003)

15
Table VIII.8 COMESA Monetary Harmonization Program Indicators
Budget Deficit to GDP Broad Money Growth
Central Bank Financeof Government
Spending (as a % ofprevious years tax
revenue)
Real Lending andDeposit Rates
Debt Services as a % ofExport Earnings Inflation
Target 10.00% 10.00% < 10% Positive 20.00% 10.00%(1995-2000) Latest (1995-
2000) Latest (1995-2000) Latest (1995-
2000) Latest (1995-2000) Latest (1995-
2000) Latest
Angola -12.83 4.93 1015.01 160.59 543.19 1.14 -55.51 -13.93 23.52 26.46 1271.41 344.45Burundi -4.26 -0.84 11.74 15.73 54.57 87.85 1.95 3.01 38.81 39.81 19.51 24.30Comoros -3.78 -1.91 3.05 46.74 36.63 37.58 3.65 3.58 4.00 2.58DRC 121.12 1829.36 -33.23 -63.71 1.87 1.73 373.39 550.00Djibouti -3.21 -1.79 -2.25 7.53 8.68 15.65 8.74 4.41 5.50 2.95 2.40Egypt -1.46 -3.25 9.92 13.22 141.35 212.84 7.59 9.13 10.90 8.89 5.54 2.80Eritrea -32.41 -48.23 116.94 222.13 272.11 411.50 0.73 1.96 10.61 19.90Ethiopia -6.16 -11.45 8.28 9.79 196.41 171.60 6.46 19.22 18.69 18.67 3.28 4.30Kenya -0.65 -2.97 13.66 2.49 46.64 24.56 16.53 7.56 24.42 15.35 6.60 7.80Madagascar -4.53 -2.81 15.92 23.83 118.39 70.53 13.39 14.86 14.24 43.27 16.88 11.90Malawi -5.01 -5.05 37.80 14.84 34.50 35.94 5.31 23.86 15.39 7.82 38.45 29.60Mauritius -5.07 -7.19 13.05 10.93 13.91 10.06 14.16 18.00 9.96 6.90 6.12 4.40Namibia -3.59 -2.90 17.09 4.48 9.08 4.88 8.48 9.28Rwanda -2.87 0.07 22.38 10.98 180.81 66.57 2.00 4.85 20.79 11.35 8.48 3.90Seychelles -11.53 -15.75 19.91 11.99 76.59 69.71 8.78 4.14 5.28 2.64 2.00 2.10Sudan -1.57 -0.79 44.42 24.68 145.74 123.86 4.71 2.26 60.66 8.03Swaziland -0.50 -1.45 10.25 10.71 5.39 4.46 2.60 2.74 8.70 12.19Uganda -1.84 -3.57 17.89 9.22 249.17 171.99 15.31 14.21 18.10 7.39 5.55 6.30Zambia -2.91 -6.80 40.44 13.61 496.47 449.47 13.29 17.63 46.25 11.69 30.63 30.10Zimbabwe -9.81 -21.35 36.02 128.46 157.21 46.93 9.73 -18.88 25.75 6.83 34.41 55.70
Sources: World Bank World Development Indicators (WDI), African Indicators, and IMF International Financial Statistics (IFS) databases.

16
Table VIII.9 Selected Indicators for COMESA, Averages 1995-2000(Percent of GDP, unless noted otherwise)
Country Name Gov’tRevenue1
Gov’tSpending
Overallsurplus/deficit1
Inflation2 GDP percap
(Cur. US$)
Gov’tSpendingat averageincome2
Diversion2 Spending
Target 3
Angola 44.29 57.12 -12.83 1271.4 586 64.77 25.50 77.52Burundi 21.21 25.47 -4.26 19.51 133 … … …Comoros 20.72 24.50 -3.78 4.00 403 … … …DRC 5.26 5.79 -0.53 458.8 125 17.73 63.38 18.05Egypt, Arab Rep. 25.78 27.24 -1.46 5.5 1291 29.70 37.36 48.38Eritrea 47.49 79.90 -32.41 10.61 165Ethiopia 21.28 27.44 -6.16 3.3 104 39.69 37.91 58.64Kenya 27.37 28.01 -0.65 6.6 359 37.72 19.00 47.22Madagascar 14.11 18.64 -4.53 16.9 257 29.34 31.46 45.07Malawi 23.17 28.18 -5.01 38.5 187 39.58 28.92 54.04Mauritius4 20.81 25.88 -5.07 6.1 3620 24.00 12.26 30.13Namibia 31.58 35.18 -3.59 8.5 2136 33.78 9.34 38.45Rwanda 17.01 19.88 -2.87 8.48 223 … … …Seychelles4 45.11 56.64 -11.53 2.0 7416 89.90 12.26 96.03Sudan 8.04 9.61 -1.57 60.7 342 19.48 67.06 53.01Swaziland4 29.89 30.39 -0.50 8.7 1370 32.38 12.26 38.51Uganda 15.19 17.03 -1.84 5.5 302 27.30 32.14 43.37Zambia 26.00 28.91 -2.91 30.6 349 38.72 25.94 51.69Zimbabwe 29.44 39.25 -9.81 34.4 604 46.75 16.34 54.92
Source- World Bank Africa Database, 2002 and calculations reported in Table III.2 1/ Including grants 2/ Percent 3/ Government spending at average income plus diversion/2
4/ Diversion estimate for Mauritius, Seychelles and Swaziland is calculated as the average for Botswana, Namibia, and South Africa

17
Table VIII.10 Net Gains from COMESA monetary union
Shareof GDP
Correlationof shocks
Avg/OwnSpendingTarget
Net Gainfrom MU
Angola 0.0483 0.7843 0.6446 0.1844Egypt 0.5482 0.7616 1.0328 -0.0121Ethiopia 0.0434 0.0702 0.8521 0.0849Kenya 0.0708 0.0976 1.0582 -0.0251Madagascar 0.0255 -0.0155 1.1087 -0.0485Malawi 0.0135 0.7295 0.9247 0.0443Mauritius 0.0290 0.0724 1.6584 -0.2406Namibia 0.0243 0.0487 1.2996 -0.1278Seychelles 0.0040 -0.0313 0.5203 0.2567Sudan 0.0670 0.4991 0.9426 0.0269Swaziland 0.0094 0.2923 1.2975 -0.1269Uganda 0.0433 0.0426 1.1521 -0.0684Zambia 0.0230 0.1645 0.9667 0.0181Zimbabwe 0.0504 -0.4301 0.9098 0.0521

1
10/2/03Chapter IX. A Single Currency for Africa?
The creation of a common African currency has long been a pillar of Africanunity, a symbol of the strength that its backers hope will emerge from efforts to integratethe continent. A common currency was an objective of the Organization for AfricanUnity, created in 1963, and the African Economic Community, agreed in 1991. Theproject is intimately associated with the newly-formed African Union (AU), whoseConstitutive Act (which was signed by 27 governments at the OAU/AEC Assembly ofHeads of State and Government in Lomé, Togo, on 11 July 2000, and which entered intoforce on 26 May 2001 with the 36th signature) has superseded the OAU Charter and theAEC Treaty, which were the legal instruments underlying the OAU.
The 1991 Abuja Treaty establishing the African Economic Community (whichbecame effective in May 1994 after the required number of signatures) outlines six stagesfor achieving an integrated economic and monetary zone for Africa that were set to becompleted by approximately 2028. The strategy for African integration is based onprogressive integration of the activities of the regional economic communities (RECs),which are regarded as building blocks for Africa. These stages consist of the followingsteps (the time that each stage was expected to take is given within parentheses)1:
• “STAGE 1: Strengthening existing RECs and creating new ones where needed (5years);
• STAGE 2: Stabilisation of tariff and other barriers to regional trade and the strengtheningof sectoral integration, particularly in the field of trade, agriculture, finance, transport andcommunication, industry and energy, as well as coordination and harmonisation of theactivities of the RECs (8 years);
• STAGE 3: Establishment of a free trade area and a Customs Union at the level of eachREC (10 years);
• STAGE 4: Coordination and harmonisation of tariff and non-tariff systems among RECs,with a view to establishing a Continental Customs Union (2 years);
• STAGE 5: Establishment of an African Common Market and the adoption of commonpolicies (4 years); and
• STAGE 6: Integration of all sectors, establishment of an African Central Bank and asingle African currency, setting up of an African Economic and Monetary Union andcreating and electing the first Pan-African Parliament (5 years). “
It can be seen that the proposed creation of the African common currency is left to theend, the sixth stage which was intended to occur during the period 2023-2028. However,the September, 1999 Sirte (Libya) Declaration proposing the establishment of the AfricanUnion called for shortening implementation periods and the speedy establishment of theinstitutions provided for in the Abuja Treaty, in particular the African financialinstitutions. Article 19 of the Constitutive Act of the AU calls for the creation of the 1 See “African Economic Community,” South Africa Department of Foreign Affairs, 28 May 2001,http://www.dfa.gov.za/for-relations/multilateral/aec.htm.

2
African Central Bank, the African Monetary Fund, and the African Investment Bank,with their responsibilities to be defined in subsequent protocols. While the time horizonfor replacing national currencies by an African currency is still distant2, it seems thatprocedures for countries to bid to host the central bank are soon to be announced, andseveral countries, including Ghana and Botswana, have already expressed interest inhosting it.
The existing RECs which are viewed as playing the role of building blocks are:AMU, COMESA, ECCAS, ECOWAS, and SADC (see Figure IX.1 for a list of theirmembers and their geographical locations). Thus, the creation of a single Africancurrency relies on plans for creating regional monetary unions, which would be anintermediate stage before their merger into the single African central bank and currency.We have already considered several of these projects in earlier chapters. The likelihoodthat countries in the regional groupings would all find it in their interest to form aregional currency is slight. Another problem is that these RECs only partially overlapwith existing monetary unions, and at least one proposed monetary union (for the EACoverlaps two RECs3. The two CFA franc zones, WAEMU and CAEMC, are importantcomponents of ECOWAS and ECCAS, respectively, but WAEMU is only about half ofECOWAS, and CAEMC does not include Burundi, the Democratic Republic of theCongo, Rwanda, or Sao Tome and Principe. South Africa and its CMA partners are only4 of the 14 current members of SADC.
Though there could be ad hoc expansion of the existing currency areas--the CFAfranc zone and the CMA--and the creation of a modest new currency union for the EastAfrican Community, in our view they are unlikely to span the RECs defined above.Nevertheless, we go on to consider in this chapter whether combining regional currenciesin the five major geographical areas would make sense: though they might notthemselves constitute desirable currency areas, we assume nevertheless that they havebeen formed. Then, we look at whether all of the regions would find it incentive-compatible to agree to share a single currency. As was the case within proposed currencyareas, we find that there are asymmetries across the regions that would probably inhibitthe creation, at a final stage, of a single African currency. In particular, corruption andlack of fiscal discipline are likely to make many African countries poor partners in amonetary union project.
One theme of the book has been skepticism about the effectiveness of monetarysolutions for non-monetary problems. In particular, Africa has suffered from decades ofdecline and marginalization, as the early hopes of rapid development and enlightenedgovernment after independence were dashed by poor economic policies, civil wars, andkleptocratic rulers. This tragedy has led, first, to a reexamination of the effectiveness ofaid by the major donor countries, and second, a recognition by Africans that they need totake charge of their own destiny. Monetary union in itself would not solve these
2 The Association of African Central Bank Governors at its August 2003 meeting in Kampala declared thatthe governors would work for a single currency and common central bank by 2021 (Agence France Presse,8/20/03).3 Kenya and Uganda belong to COMESA, but not Tanzania, which is a member of SADC.

3
problems. Fortunately a new initiative has emerged, the New Partnership for AfricanDevelopment, or NEPAD, which aims at improving economic and political governanceby Africans, and thus of assuring donors (and private investors) that resource flows toAfrica would not be wasted. It has the potential for correcting the fundamental problemsbehind Africa’s poor economic performance. If successful, it could create the conditionsfor African unity, including a single currency.
A. Why the Initiative to Form an African Monetary Union?
There are two principal reasons for the enthusiasm for monetary union in Africa.First, it is clear that the successful launch of the euro has stimulated interest in otherregions. From Latin America to the Middle East and East Asia, monetary union is seen asa way of reinforcing regional cohesion and demonstrating a commitment to regionalsolidarity. However, it is sometimes forgotten just how long the road to monetary unionin Europe actually was. The transition was fraught with obstacles and missteps, and evenin official circles there were doubts until the ultimate day of the changeover whether thereplacement of national currencies by euro notes and coins in January 2002 would gosmoothly. Designing new institutions that were able to deliver stability-oriented monetarypolicy—particularly the European System of Central Banks—was complicated, as wascreating the Solidarity and Growth Pact, which provides for regional coordination offiscal policies. Despite the intense planning process, the institutions are still the object ofconsiderable controversy and contention. In Africa, fiscal problems are more severe andthe credibility of monetary institutions is more fragile. If the process of institutioncreation was so difficult for a set of rich countries with highly competent bureaucraciesthat have cooperated closely for more than fifty years, then realistically, the challenge forAfrican countries must be considered enormous.
The second important motivation in Africa has been the desire to counteractperceived economic and political weakness by creating regional solidarity andcooperation, of which a common currency and monetary union would be potent symbols.Regional groupings would help Africa in negotiating favorable trading arrangements,either globally (in the WTO context) or bilaterally (with the EU and the US). Thisobjective of regional integration seems well founded, but it is unclear whether forming amonetary union would contribute greatly to it. A common currency may be the symbolof weakness, not strength—as was the case for the ruble in the dying days of the SovietUnion and at the time of the creation of the Commonwealth of Independent States. Acurrency that is ill-managed and subject to continual depreciation is not likely tostimulate pride in the region or give the member countries any clout on the world stage.Moreover, as Robert Mundell, the 1999 Nobel Prize winner in economics, emphasizes, itis great countries (or regions) that make great currencies. While the countries in the eurozone are important enough economically for the euro eventually to rival the dollar, that isnot likely to be the case for an African currency even in the best circumstances. Africa’sGross Domestic Product (GDP) is, and is likely to remain, only a small fraction of that ofEurope or the United States—in fact, at present the GDP of all of Sub-Saharan Africa isno more than that of a medium-sized EU country.

4
B. Strategies for Achieving a Single African Currency
The strategy for forming an African currency relies on first creating currencyunions in Africa’s regions, then merging them into a single currency area4. As discussedin earlier chapters, Africa already has three common currency areas, the two regions inthe CFA franc zone and the Common Monetary Area in Southern Africa. In each case,the countries in these monetary unions are members of wider regional organizationswhich have plans to create their own monetary unions. These would subsume theexisting monetary unions. In West Africa, ECOWAS would merge the West AfricanCFA zone (WAEMU) with a projected second monetary zone. Doing so would mostlikely mean the end of the CFA zone (see Chapter VI). Similarly, SADC andCOMESA’s embryonic projects for monetary union envisage the creation of new centralbanks and a symmetric monetary union. If South Africa and the smaller CMA countrieswere to be a part, the rand area with its considerable track record and credibility wouldlikely disappear (Chapter VII).
The following summarizes the status of the projects for new regional monetaryunions.
The West African Monetary Zone is to be created by July 2005 and is expectedto lead to a merger with the West African part of the CFA franc zone to produce a singlecurrency for ECOWAS. However, Nigeria will make a difficult partner for the rest ofWest Africa. Given Nigeria’s much larger size, large budget deficit, generallyundisciplined fiscal policies, and an export structure that differs greatly from itsneighbors (which export other primary commodities while Nigeria exports oil), Nigeriahas the potential to influence monetary policies in ways that potential partners in amonetary union would find undesirable. Without an effective way of discipliningcountries’ fiscal policies and in the absence of similar shocks to the prices of countries’exports and imports (or “terms of trade”), a single currency for ECOWAS would notseem advisable.
In Southern Africa, countries that comprise the Southern African DevelopmentCommunity (SADC) intend to form a monetary union, though this is a much vaguer andmore distant project. Many SADC members are in any case very far frommacroeconomic stability. The southernmost countries, South Africa and the smallermembers of the Southern Africa Customs Union, are reasonably advanced and stable.However, their neighbors to the north include countries with recent or continuingproblems of civil unrest (Angola, Democratic Republic of the Congo, and Zimbabwe) aswell as some facing severe drought and poverty (Malawi and Zambia, for instance). Theirfinancial systems are generally much less developed than those of the southernmostcountries and the shares of manufactures in production and exports are low.
4 Article 44.2.(g) of the AEC Treaty states: “[Member states shall] Establish an African monetary unionthrough the harmonization of regional monetary zones.”

5
The Common Market for Eastern and Southern Africa (COMESA), a group ofcountries that cuts across two geographical regions, is also developing a monetary unionproject. Disparities among COMESA countries are about as important as those affectingSADC (and there is considerable overlap in membership of the two organizations); butCOMESA’s drawback is that South Africa—the greatest pole of monetary stability in theregion—is not one of its members. Three countries—Kenya, Tanzania, and Uganda(only two of which are in COMESA)—also plan to revive the East African Communityand the common currency that were dissolved in the decade following independence.These different projects illustrate a pervasive problem in Africa—overlappingcommitments that are not necessarily consistent. Attempts to advance on too many frontsoften result in inaction. Within the five main RECs associated with the AU (the threementioned above along with the Arab Maghreb Union and the Economic Communityof Central African States), ten countries belong to more than one regional grouping,with the Democratic Republic of the Congo holding three memberships (see Figure IX.1).
A second, and potentially more promising strategy, and an alternative tocreating new, ambitious monetary unions based on the RECs would be to build on thecredibility of existing monetary unions (the CFA franc zone and the CMA) by adding tothem countries that have demonstrated their commitment and ability to deliver soundeconomic policies by satisfying convergence criteria for a significant length of time.Unfortunately, the western African CFA franc zone has been hurt by unrest in Côted’Ivoire and its central African counterpart is composed mainly of oil-producingcountries with pronounced terms of trade swings. Extending the CMA, where SouthAfrica is a fairly stable, developed pole, may be a more attractive possibility in the shortrun. However, its SADC neighbors are, with a few exceptions, too far from themacroeconomic stability necessary to converge with South Africa and share the samecurrency, so many will not be candidates to join for decades. Thus this strategy, which ismore likely to succeed and produce gains for the countries concerned, would however notlead to a continent-wide currency. It would produce some modest gains in the use of theCFA franc and the rand, but not prepare the ground for the adoption of a commoncurrency in all regions.
Another disadvantage to hinging the goal of a single African currency on firstcreating new monetary unions spanning pre-defined regions is that the countries in eachregion may have little incentive to adapt their policies to some standard of “bestpractice,” since it is taken for granted that all countries will join. It will be very difficultfor countries that have achieved a modicum of fiscal discipline to deny membership tothose that have not. Thus, there is a strong likelihood that an unstable and unattractivemonetary union would be created. In contrast, adding countries to the existing monetaryunions would give strong incentives for existing members to scrutinize potentialmembers. Given the widespread problems of lack of fiscal discipline and stablemacroeconomic policies, it is important to use the objective of monetary union to bring tobear pressures for greater discipline and better governance. Moreover, success breedssuccess; as the monetary union grows through adding countries with stablemacroeconomic policies, it becomes more attractive for others to join. Thus, the pathchosen for creating monetary unions matters. It may be impossible to get all countries to
6
agree to forming a currency union that spans the continent, but a partial monetary unioncould be feasible. If combined with stringent entrance criteria, it could provide a potentincentive for improved policies.
A third strategy for furthering monetary cooperation would be for Africancountries to have a common peg to an international currency, and perhaps also a commonregional currency board based on it5. Such a strategy would have the advantage ofproviding an external anchor for monetary policy (this is discussed in Chapter X below),and a peg to the euro would produce exchange rate stability vis-à-vis Africa’s maintrading partner.6 It would further clearly place the onus on each country to followappropriate policies to maintain the peg; it would be clear where responsibility lies fordoing so. However, the big drawback of such a proposal would be political: unilateralpegs, though they would produce stability between pairs of African currencies as a by-product, would not involve the African institution-building and the creation of a newcurrency that could serve as symbols of African solidarity. One suspects that they wouldnot be durable either, since no external “agency of restraint” would have been created tomodify existing unsustainable fiscal policies.
C. Is a Single African Currency a Good Thing?
We have considered above in Chapter III the factors that influence the benefitsand costs from monetary union, highlighting the importance of trade linkages in creatingbenefits, and of asymmetries in terms of trade shocks and in fiscal discipline ingenerating costs. The same factors apply at the Africa-wide level; but both benefits andcosts are amplified as the potential size of a monetary union is increased. In particular, amonetary union that includes more countries is likely to internalize more trade (and in thelimit of a single world currency, all trade becomes domestic trade), but it also tends toinclude a more heterogeneous group of countries.7
An important motivation for monetary union in Europe was to reduce the costs ofchanging money associated with trade and tourism. We have shown that trade withinAfrican regions tends to be a small proportion of total trade (an exception being theCMA), and the same is true even at the continent-wide level. Intra-African trade ismodest, so gains for a monetary union deriving from lower transactions costs wouldnecessarily be much smaller than in Europe. Consistent with the gravity model, whichposits that a country will trade more with countries that have higher per capita incomes,most African trade is conducted with the richer countries of Europe, North America, andAsia (see Figure IX.2), and will remain so. Thus trade both within African regions andbetween them is small relative to their trade with the rest of the world (Table IX.1).
5 This has been advocated by Honohan and Lane (n.d.) and BIDPA and CSAE (2001).6 Honohan and Lane point out that this advantage would be enhanced should the UK join the euro zone.7 Thus Alesina and Barro (2002) show that in general neither a world where all countries have independentcurrencies nor a single world currency is optimal; see also Debrun (2003) for the factors that determine theequilibrium size of currency unions.

7
A second important reason to create a monetary union may be to improve on themonetary policies provided by national central banks, which have typically fallen prey topressures to finance government deficits and hence have produced high inflation anddepreciating currencies. There may be some advantage to delegating monetary policy toinsulate it from pressures to finance governments. However, unless this occurs in thecontext of a large, stable anchor country (e.g., South Africa) or existing multilateralinstitutions with a track record of independence and sound policies (e.g., the WestAfrican CFA franc zone’s central bank), new institutions are unlikely to provide adurable “agency of restraint.” Instead, large countries (whose governments exert animportant influence over monetary policy actions) will continue to use the central bank asa printing press, directly or indirectly financing their spending. This was the experiencebefore the 1994 devaluation of the CFA franc in both western and central CFA franczones. Hopefully, reinforced fiscal surveillance and the recent agreement to eliminatecompletely central bank advances to governments have solved the problem in the CFAfranc zone. However, the mere creation of a regional central bank will not ensure itsindependence from fiscal policy.8
Honohan and Lane provide two other reasons in support of the creation of Africanmonetary unions: as a bulwark against contagious speculation and as a way of achievingeconomies of scale in the financial sector. However, they acknowledge that financialcontagion has not been a problem to date because African currencies do not appear onspeculators’ “radar screens”, and perversely the creation of a common currency mightattract more speculative attention. As for financial sector economies of scale, the twoCFA zones provide a mixed example of this benefit, since even now there is very littlecross-border banking or activity on regional money markets. However, since the bankingcrisis and devaluation of the early 1990s, each zone has created a supranational bankingsupervisory agency, no doubt achieving some economies of scale in that activity.
We now turn to simulations of the strategy of creating a single currency for Africafrom regional monetary unions. Here, in order to rationalize the RECs, we removeoverlap by assigning each of the 39 countries in our sample to one or another group. Inparticular, AMU, ECCAS, and ECOWAS remain with their existing memberships.SADC is assumed to keep its current membership, except for the Democratic Republic ofthe Congo (which is assumed solely to be a member of ECCAS) and Tanzania, which weassign to COMESA to be with its EAC partners Kenya and Uganda. The remainingcountries are assumed to be members of COMESA.
In considering the formation of a larger monetary union from existing ones, it isnatural to consider whether each member country in a REC would gain, and also whetheron average welfare in the REC would increase. If decisions require unanimity, theformer would be most relevant, while the latter calculation, if positive, suggests that theremay be scope for side payments that could induce the participation of all. Of course, themodel, as described in Chapter III, excludes political considerations, which we haveemphasized are likely to be important. 8 Honohan and Lane (n.d.) acknowledge this point, though they argue that regional monetary unions can inprinciple provide an agency of restraint.

8
Table IX.2 gives the results of the simulations of a single currency for the AfricanUnion, presenting the proportion of gainers in each REC, the average net welfaregain/loss, the average spending target for the REC, correlations with the AU terms oftrade shock, and each REC’s trade with the rest of the AU as a ratio to REC GDP. Eachof the REC monetary unions is assumed to be symmetric, so that countries influence theREC central bank’s monetary policy in proportion to their share of regional GDP9. Thesame is assumed for the AU monetary union, where the region becomes the wholecontinent.
The estimates of Table IX.2 suggest that only 2 of the 5 RECs—ECOWAS andCOMESA—would in fact gain on average from a single currency. These are the regionswith the highest spending targets. Even within these regions, there would be some losersas well as gainers. In contrast, the regions with more disciplined fiscal policies—AMU,SADC, and ECCAS—would not gain on average. Within SADC, in particular, SouthAfrica (with its large share of the region’s GDP) would face a significant welfare loss asa result of the common currency. For all the regions, trade with the rest of the AU is onlya small fraction of GDP—typically less than 1 percent—suggesting that the gains from acommon currency resulting from a reduction in the temptation for beggar-thy-nighbordepreciations would be very limited. In addition, absent improvements in fiscaldiscipline that would make the common central bank less subject to pressures to monetizedeficits, the single African currency would not deliver low inflation and a stableexchange rate. Hence it would be inferior to some existing currencies, in particular SouthAfrica’s rand.
D. NEPAD
Monetary arrangements cannot provide solutions to the profound developmentproblems facing many African countries. At best, a monetary regime supported by fiscaldiscipline and good structural policies can provide a framework for low inflation. Itcannot guarantee high growth. Thus, monetary union should not be seen as a panacea orbe driven by a grandiose political vision that hopes to find a symbol of unity and stabilitywhen the reality is quite different.
An parallel initiative to the ambitious monetary union project for Africa is theNew Partnership for African Development, or NEPAD. NEPAD, whose goal is topromote economic growth and good governance, emerged from the efforts of PresidentThabo Mbeki of South Africa (who proposed the Millenium Partnership for the AfricanRecovery Programme), President Abdoulaye Wade of Senegal (Plan Omega), NigerianPresident Obasanjo, and Algerian President Bouteflika. The structure of NEPAD consistsof an Implementation Committee of Heads of State and Government, a steeringcommittee and a secretariat to oversee the various programs. It starts from the recognitionthat governance problems are key, that each country must make changes to promotedemocracy, peace, and stability. Hence it is the responsibility of each African 9 Neither the ECOWAS monetary union nor the others is assumed to benefit from a guaranteed peg to theeuro.
9
government to put its own house in order—but also peer pressure within Africa can helpin that process. NEPAD aims to create the conditions within Africa that would make thecontinent attractive to foreign investors, and it is hoped that the resulting inflows wouldhelp in producing sustained development. The NEPAD initiative has received thesupport of donor countries, and this support was reiterated at the June, 2003, G-8 summitin Evian, France. NEPAD’s objective to become a driving force for promoting economicgrowth and prosperity across the continent was emphasized at the July, 2003, AfricanUnion summit in Maputo, Mozambique.
There are four priority areas where actions by African countries are mostessential:
• Stop regional conflicts through regional peacekeeping forces and by makingconcerted regional efforts to prevent armed involvement and material support ofrebels by neighboring countries
• Increase transportation and communication links to stimulate trade andcompetition and to exploit economies of scale
• Adopt sustainable macroeconomic policies by making currencies convertible andmonetary policies consistent with low inflation, reducing budget deficits, andeliminating central bank financing of government spending
• Promote and attract investment in infrastructure, health, and education byconvincing donors and private investors of African countries’ ability to provide astable, non-corrupt environment based on the rule of law.
NEPAD must prove itself in the above four areas, and deliver on its peer reviewmechanism. If it does, and a genuine domestic consensus in favor of sound policiesemerges in African countries, Africa can benefit from more generous aid flows fromdonors. Moreover, monetary union, if viewed as desirable, could “crown” the reality, notjust the promise, of African unity. However, if African governments fail to improvegovernance, they risk getting lower aid flows than in the past, as donors, noting a historyof aid ineffectiveness, pull back further. Attempts to forge a grand monetary union wouldlikely produce yet another failure that harms, rather than helps, regional solidarity andintegration.
The NEPAD process has just begun. As of May 31, 2003, fifteen Africancountries have agreed to submit themselves to the African Peer Review Mechanism(APRM), a self-monitoring organization comprised of African Union member states. Thepurpose of the peer review panel, which will have between five and seven members, is topromote the implementation of policies and standards that will lead to political stability,economic growth, development, and integration on a regional and continent-wide level.How the APRM will be applied, however, has yet to be seen. While signals from heads ofstate are thus far not promising, the appointment of distinguished and respectedindividuals to the peer review panel is a good sign. Reviewing of individual countries isscheduled to begin with Ghana and South Africa before the start of 2004.

10
African leaders must recognize and assume responsibility for their currentfinancial problems in order to pave the way toward regional economic integration. On thecontrary, if nations throughout Africa continue to be beset by civil wars, poorinfrastructure, unsustainable fiscal policies, and low investment linked to corruption andthe absence of rule of law, a monetary union will not be desirable or sustainable10. But ifNEPAD is pursued consistently, the way would be paved for effective regionalintegration. Indeed, the principles of NEPAD could—and should—be applied tocountries seeking to join a monetary union. Success in achieving NEPAD’s goals wouldgo a long way toward solving the problems of fiscal indiscipline that make currentprojects for monetary unions unviable.
E. Conclusions
Africa, like other regions of the world, is fixing its sights on creating a commoncurrency. Already, there are projects for regional monetary unions, and the biddingprocess for an eventual African central bank is about to begin. Is it worth the effort, andwill it provide an important solution to Africa’s problems? Most observers judge thatthose problems are linked to civil conflicts, corruption, absence of rule of law,undisciplined fiscal policies, poor infrastructure, and low investment—the last of whichis due in part to foreign investors’ mistrust of African governments. Only if theseproblems are solved can Africa gain from globalization as an equal partner with thedeveloped world. The countries of the latter must help by providing markets for Africa’sgoods—in particular, by reducing the subsidies to their own farmers that effectivelyeliminate the comparative advantage that African farmers would have in production, forinstance, of cotton.
Monetary union can in fact address very few of Africa’s fundamental ills. At best,it can produce low inflation, but it cannot guarantee growth, and at worst, it can distractattention from essential issues. A more promising initiative is the New Partnership forAfrican Development, through which African countries hope to exert peer pressure tocorrect governance failures and thus make progress in correcting Africa’s problems. It istoo early to see how effective that process will be, but if it succeeds, then Africa canbenefit from enhanced international trade and foreign direct investment. Moreover,regional economic integration, including monetary union, could build on thatachievement. If not, monetary union will almost certainly fail, and highlight Africa’smore fundamental policy failures.
10 This point has been acknowledged by some African policymakers: “ … other participants pointed toobstacles in Africa to monetary integration including unrest and a lack of political commitment and of ruleof law” (“Africa’s bank governors debate monetary integration,” Agence France Presse, 8/20/03).

11
Table IX.1 Bilateral Trade Flows for Regional Economic CommunitiesAverage 1995-20001
(In percent of Group 1’s total exports) Group 2
Group 1 AMU COMESA ECCAS ECOWAS SADC EuropeanUnion
Rest ofWorld
AMU 2.74 0.67 0.11 0.45 0.06 71.78 24.19
COMESA 0.77 5.47 0.74 0.19 5.94 41.25 45.64
ECCAS 0.61 0.67 1.89 0.68 0.95 43.76 51.45
ECOWAS 1.01 0.56 1.61 9.08 1.25 37.15 49.34
SADC 0.19 8.28 0.83 0.79 10.28 36.87 42.76
(In percent of Group 2’s total imports)
Group 2
Group 1 AMU COMESA ECCAS ECOWAS SADC EuropeanUnion
Rest ofWorld
AMU 3.00 0.73 0.74 0.69 0.38 1.29 0.26
COMESA 0.50 3.52 2.95 0.17 23.56 0.44 0.29
ECCAS 0.17 0.19 3.26 0.27 1.63 0.20 0.14
ECOWAS 0.77 0.43 7.46 9.62 5.80 0.46 0.36
SADC 0.22 9.77 6.00 1.32 74.72 0.72 0.491/ Regional trade sums up member countries’ bilateral trade (including trade internal to the region)
Source: Direction of Trade (DOT) Statistics Online, 2003.

12
Table IX.2 Net Gains of RECs from Single African Countriesto Full AU Monetary Union
Average NetGain
GovernmentSpending
Target
Trade with Restof AU/GDP
NumberGaining/Number
in RegionAMU -0.0011 0.4420 0.0021 0/3
COMESA 0.0395 0.4848 0.0028 7/7
ECCAS -0.0128 0.4309 0.0086 0/4
ECOWAS 0.1125 0.5920 0.0135 13/13
SADC -0.0739 0.3948 0.0091 1/12
Figure IX. 2
Using exports + imports from the IMF Direction of Trade Statistics Yearbook 2002
Origin and Destination of Africa's Trade in 2000
AfricaEuropeWestern HemisphereAsiaMiddle East

Figure IX.1Membership in Regional Arrangements
AMU - Arab Maghreb UnionAlgeria, Libya, Mauritania,Morocco, Tunisia
COMESA - Common Marketfor Eastern and SouthernAfricaAngola, Burundi, Comoros,Democratic Republic ofCongo, Djibouti, Egypt,Eritrea, Ethiopia, Kenya,Madagascar, Malawi,Mauritius, Namibia, Rwanda,Seychelles, Sudan, Swaziland,Uganda, Zambia, Zimbabwe
ECCAS - EconomicCommunity of Central African StatesBurundi, Cameroon, CentralAfrican Republic, Chad,Democratic Republic ofCongo, Equatorial Guinea,Gabon, Rwanda, Sao Tomeand Principe
ECOWAS - EconomicCommunity of West African StatesBenin, Burkina Faso, CapeVerde, Cote d’Ivoire, Ghana,Guinea, Guinea-Bissau,Liberia, Mali, Niger, Nigeria,Senegal, Sierra Leone,Gambia, Togo
SADC - Southern AfricanDevelopment CommunityAngola, Botswana, DemocraticRepublic of the Congo,Lesotho, Malawi, Mauritius,Mozambique, Namibia,Seychelles, South Africa,Swaziland, Tanzania, Zambia,Zimbabwe
Source: Brookings Policy Brief 121, “Africa’s Economic Morass—Will aCommon Currency Help?” (Washington, DC: The Brookings Institution,July 2003).

1
8/29/03Chapter X. Conclusions : The Likely Evolution of Africa’s Monetary Geography
in Coming Decades
We began this book by showing, in Chapter II, how different the current monetarygeography was when compared to the period around the time of independence, roughly 1960.Some of this difference was accounted for by the change in the international environment, inparticular the generalized move to floating currencies in the early 1970s, so that currently themajor currencies—in particular, the dollar, the euro, and the yen—fluctuate in value against eachother. This has made keeping fixed exchange rates against some external anchor more difficult,though the CFA franc zone is still rigidly fixed against the euro, the successor to the Frenchfranc. We end by drawing some lessons from the experience since independence, and presentingour views on how Africa’s monetary geography may evolve in future decades. Like all suchexercises, this is more akin to crystal ball gazing than scientific forecasting. And we stress thatthese are our own views and not the hidden agenda of some official institution.
The current vogue for monetary union projects has been a response in Africa to therecognition that many national currencies are not successful at providing good means of paymentor stores of value. It has also been driven by political imperatives, in particular to demonstrateregional solidarity in the hope that addressing Africa’s serious fundamental problems throughregional groupings may provide extra discipline and mutual assistance, for instance throughmore independent, supranational institutions and through regional peer pressure. The example ofEurope is clearly strongly influential, but as we have argued, not really appropriate. The benefitsof a common currency in Europe are clearly greater, given much stronger trade linkages, and theextent of regional integration in other domains (including institutions that have functionedeffectively for decades) provides much greater support for the European monetary union. Evenif a single currency were created for Africa, it would not become an international currency withthe same stature and usefulness as the euro.
Just as the example of Europe is of limited relevance, so are the standard analytical toolsused to assess the costs and benefits of monetary union. Hence we argued, in Chapter III, thatthe appropriate framework for considering monetary unions in Africa was one where, in additionto the Optimum Currency Area criteria of symmetry of shocks and factor mobility, the extent towhich countries share similar spending targets and are not subject to pressures for spendingdiversion and corruption makes a big difference for the sustainability of a monetary union.While institutional design is important, it is unlikely that a newly created central bank would beable to assert its independence from fiscal policies; instead, it would be a dependent central bank,even if not as dependent as a national central bank facing just one treasury. In thesecircumstances, including in a monetary union a country with undisciplined fiscal policies(especially if that country were large) would not be attractive.
We proceeded to use this analytical framework to assess the costs and benefits tocountries of various proposed monetary unions, including a single currency for Africa. Weconcluded that these projects, assuming that they went ahead, would be unlikely to achieve theirstated aim of including all countries in a region (or, ultimately, the whole continent). As assertedin the previous paragraph, countries with poor fiscal policies make unattractive partners, and if

2
admitted to a monetary union, could threaten its continued existence. Unfortunately, in mostregions there are countries that fit this description. The idea that the mere membership in amonetary union would curb such fiscal indiscipline is implausible. More promising, however, isthe use of membership in a union as a carrot to induce countries to rein in deficits and makefundamental structural adjustments. Such a use of peer pressure is consistent with the principlesof NEPAD, and could augment the effectiveness of the latter process. It is however inconsistentwith the idea that creating an inclusive monetary union will induce countries to modify theirbehavior and “get religion.” And strong use of the carrot of membership is almost sure to meanthat some countries would not qualify.
If the current projects for monetary unions based on regional economic communities, orRECs, do not bear fruit, nor lead to a single currency by the target date of 2021, what will themonetary geography of Africa look like in twenty or so years? An important issue in this contextis whether currencies (national or supranational) are fixed or float, or do something in between.This boils down to a choice between an external anchor or domestic target for monetary policy.As before, the international environment will have an important influence on this choice, and weconsider this first. Second, we consider how the domestic context for policymaking may evolve.In particular, the important NEPAD initiative to improve governance—its success or failure—will help dictate the shape of the African currency landscape.
A. The International Environment
For the past thirty years, exchange rates of the major international currencies havefluctuated with respect to each other, generally without much intervention, despite occasionalperiods of coordination (such as a result of the Plaza Agreement and Louvre Accord in 1985-87).This has made it difficult for countries with trade that is diversified geographically to peg to asingle international currency, since fluctuations of dollar, euro, and yen exchange rates have beensubstantial and have produced large fluctuations in competitiveness for countries with a singlecountry peg. Basket pegs, with weights given to the various currencies that reflect theimportance of trade linkages, are a possible solution to this problem, but only an imperfect one:basket pegs are not very transparent and in practice are often changed, so that this regime tendsto resemble more closely managed floating than a fixed peg.
It seems likely that this international environment of fluctuations among the majorcurrencies will continue. These three currency blocs are closed enough that they do not suffertoo much from exchange rate volatility (induced by speculative shifts, for instance), while theybenefit from the possibility of varying their monetary policies to accord with different domesticeconomic fluctuations. In practice, the inflation pressures and business cycles affecting theseeconomies have not been the same, and hence their central banks have appropriately movedinterest rates in ways that have temporarily opened up differentials in favor of one or anotherbloc, and exchange rates have tended to fluctuate accordingly. Since average inflation has notbeen very different, however, there has, at least over the last decade and a half, been little trendto their exchange rates.
This feature of the international monetary system argues for some flexibility of Africancurrencies, at least for countries that do not have very strong economic linkages with one or

3
another of the currency blocs. Though the regions in Africa trade most with Europe, thatproportion is typically at most 50 percent or so, leaving them exposed to other currencyfluctuations. While the creation of the euro and prospects for its expansion will make a euro pegfor a few countries an attractive proposition, this is not true for all. In particular, the oilexporting countries (Angola, Gabon, Nigeria, among others) would probably benefit more fromstability against the dollar than the euro, and South Africa, like other “emerging market”economies with a high level of financial development, will continue to benefit from flexibilitywith respect to all the major currencies.
A second important influence on the future evolution of African currency regimesconcerns European attitudes toward the CFA franc zone, and other pegs to the euro. At present,EU countries are reticent, not to say opposed, to committing resources to assist non-EU countriesto peg to the euro. The exception is France, which of course continues its involvement with theCFA franc zone1. However, if the ECOWAS monetary union goes ahead, then France wouldneed to get the accord of her EU partners to continue to provide overdraft privileges and aconvertibility guarantee—assuming that France wanted to do so. If instead a decision were takenby the EU to favor exchange rate stability of African currencies against the euro, the EUinstitutions could take over from the French treasury in this regard. Doing so would of coursefavor the continued fixed peg of the CFA franc to the euro, and might also favor the creation ofother monetary unions or currency boards with euro pegs.
On balance, this possibility does not seem very likely. Economic advantages to Europeseem small, since trade with Africa is only a small proportion of Europe’s exports or imports.While the international use of Europe’s currency would be increased somewhat, this is notgenerally viewed as an objective of policy; on the contrary, Germany and Japan have at timestried to discourage the international use of the deutsche mark and the yen. It is also not clearwhether any political benefits (e.g., evidence of Europe’s generosity or its larger sphere ofinfluence) would offset political costs (charges of neo-colonialism).
What would this mean for the CFA franc zone? It seems quite possible in our view thatin 20 years it will no longer exist in its current form. While there may well be a currency union,perhaps with additional members, it seems more likely that it will not be pegged to the euro withthe help of France. This would then raise the issue of what would guide monetary policy in theCFA franc zones—a general issue of the exchange rate/monetary policy regime.
B. “Hollowing Out” of Exchange Rate Regimes
Advocates of the “hollowing out” hypothesis argue that the increase in capital mobilitythat has occurred as a result of liberalization and technological advances (and by implication,will continue) would tend to make intermediate exchange rate regimes (for instance, adjustablepegs, bands, or dirty floating) disappear, in favor of the polar cases of hard fixes (monetaryunions or currency boards) or free floats (Eichengreen, 1994; Obstfeld and Rogoff, 1995; Fischer2001). They point out that industrial countries have mainly moved to the poles, as the result ofspeculative crises leading to the breakdown of the Bretton Woods regime of adjustable pegs orthe European Monetary System’s narrow bands around central parities. These crises have shown 1 And Portugal assists in the Cape Verde escudo’s peg to the euro.
4
the lack of credibility associated with such pegs, which are not viewed as irrevocable unlessinstitutions are in place to make them extremely difficult to change. The example of Argentina’scurrency board shows that even that case may not be sufficiently “hard”, so the elimination ofone’s currency by adopting another may be required in order to prove irrevocability2. While theEU countries have chosen the “hard” pole, the other industrial countries have mainly chosen tofloat their currencies with little intervention. The hollowing out hypothesis, if true, would haveimportant implications for the exchange rate regime choice of African countries. It might tend toreinforce the momentum in favor of monetary unions, especially if countries did not want toaccept the volatility of freely floating exchange rates (which, as Calvo and Reinhart (2002) show,is evident in the behavior of most developing countries3).
However, the implications for Africa are nowhere near that stark. First, as Frankel(1999) has pointed out, while it is generally accepted that financial market integration, monetaryindependence, and pegged exchange rates are incompatible, it is still possible to trade off somemonetary independence for some exchange rate flexibility, without going to the polar cases.Moreover, countries may choose not to fully integrate into world financial markets: in thepresence of imperfect capital mobility, adjustable pegs and other intermediate exchange rateregimes are much easier to maintain. Many African countries, including the most financiallydeveloped, South Africa, maintain some sort of capital controls4. Speculative capital flows insufficient volume to swamp countries’ foreign exchange reserves require that financialinstruments be available to take positions against the currency. Otherwise, capital mobility islimited. Many African countries have very little debt that is traded on financial markets thatcould be potentially held (and sold) by foreign investors, nor do foreign investors have thepossibility of borrowing domestically or trading derivative instruments in the currency. Hence,as Honohan and Lane (n.d.) note, most African currencies (with the single exception of the rand)are not on investors’ “radar screens” and have not been affected by the speculative crisesaffecting other developing countries. Third, some intermediate regimes may be immune even ifcapital mobility is high, if they do not give “one-way bets” to speculators, e.g. by guaranteeing arate “come-what-may.” For instance, dirty floating, smoothing of exchange rate fluctuations, oradjustable pegs and bands may not exacerbate speculative behavior if the monetary authoritiesshow sufficient willingness to modify their targets for the rate. Of course, such regimes are alsounlikely to deliver as much exchange rate stability.
There is in fact little evidence for hollowing out in the data on exchange rate regimes ofdeveloping countries—even allowing for the fact that countries’ official, or de jure classification,often differs from what they actually do (Masson, 2001). While this may reflect much lessadvanced financial development than in the industrial countries, so that the changes seen in thelatter will affect the former at some later date, it does not seem obvious that this is inevitable.Instead, choices among exchange rate regimes are likely to remain for African countries, at leastfor the next few decades. 2 And in that case, even though the use of another currency might not be irrevocable, financial instruments wouldnot be readily available to speculate against it.3 They typically moderate exchange rate volatility through foreign exchange market intervention, rather than floatingfreely.4 Though such controls were not sufficient in South Africa’s case to prevent speculation and substantial depreciationof the rand. Consequently, the South African authorities have moved in the late 1990s to a more flexible system,and have also loosened capital controls recently, while the currency has strengthened.

5
C. Domestic versus External Anchors
An important choice, which we have largely ignored so far, both for countries withindependent currencies and for monetary unions themselves, is the choice of the target or anchorfor monetary policies. While the CFA franc zone has maintained its external anchor, i.e., its pegto the euro, other countries have, in parallel with moves to greater exchange rate flexibility,shifted to domestic monetary anchors--typically some monetary or credit aggregate (often in thecontext of IMF-supported programs). While it is beyond the scope of this book to review the useof domestic monetary or inflation anchors in Africa, the experience of other developingcountries, as well as industrial countries, suggests that inflation-targeting may be increasinglyadopted by African countries. At present, South Africa is the only country that has adopted anexplicit inflation-targeting regime for monetary policy, and moreover that adoption was recentand details of its implementation are still evolving (see Chapter IV). It seems likely,nevertheless, that countries with developed financial markets, liberalized prices, and absence offiscal dominance may want to follow suit (see Eichengreen et al., 1999, for a discussion of thepre-requisites for inflation targeting).
In the CFA franc zone, the peg to the French franc, and now the euro, has beenmaintained with the financial assistance of the French Treasury. This has helped to assure thepermanence of the peg and its credibility in the minds of investors. Given the size of Francecompared to the CFA franc zone, it is clear that the resources available are sufficient to defend aparity if France is willing to do so, and the 1994 devaluation was only necessary because Francehad decided that the real exchange rate was severely out of line, and hence maintaining it washarmful for the health of the economies concerned.
We have speculated in earlier chapters on whether France would continue to guaranteethe value of the CFA franc. In some circumstances, for instance a substantial enlargement of theWest African zone to encompass ECOWAS, we have expressed the view that France wouldprobably not agree to extending its guarantee, nor would the EU take over that commitment fromFrance. CFA franc zone countries might then have to choose between the status quo andextension of regional monetary zones. In the latter case, WAEMU, CAEMC, or both, wouldhave to consider the choice between maintaining the exchange rate peg to the euro through usingtheir own reserves, moving to an intermediate arrangement where the euro peg (or other peg, forinstance to a basket) was one (but perhaps not the sole) variable guiding monetary policy, and adomestic target.
Maintaining a rigid peg without other institutional changes might be difficult, even withcomfortable reserve cover as is currently the case for the CFA franc zones. Capital mobility islikely to increase in the absence of explicit attempts to limit it, and a currency circulating in awide area might well appear on the “radar screens” of speculators. An alternative to “harden”the peg would be to create an explicit currency board based on the euro, which would forceautomatic contraction or expansion of the money supply in response to reserve outflows andinflows. This would give some extra guarantee that monetary policy would be adjustedappropriately for the maintenance of the peg. The case of Argentina shows the limitations of this

6
approach, however. Without support from other policies, the strain on the parity may be toogreat to bear.
Given a degree of independence of the central bank from fiscal authorities, as is the casefor the BCEAO and the BEAC, a less constraining and more sustainable regime would be anintermediate regime where the value of the currency vis-à-vis a basket of international currenciesguided monetary policy, but some weight was also given to domestic inflation and economicactivity. A natural basket would give equal weights to the dollar and euro, and such acompromise would facilitate monetary cooperation within ECOWAS, given the extent ofNigeria’s dollar-based trade. The commitment to the basket peg could be deliberately vague toremove the perception of one-way bets, and yet considerable attention could still be paid to theexternal value of the currency. Such a regime might either be a transition to an inflation-targeting regime (as in practice it proved to be in Israel and Chile5), or might instead be intendedto be permanent.
D. Africa in the Global Economy in 2025
In order to envisage a future that is at all bright, it is necessary to assume that NEPADsucceeds in its objectives of improving governance and growth on the continent. Whetherprogress is due to NEPAD itself, or more likely to the revised attitudes of individual countries’leaders and citizens, is not important: Africa must succeed in stopping conflicts, promoting therule of law, reducing corruption, and achieving sustainable macroeconomic policies. If so, onecan imagine that Africa develops around some dynamic regional economies: South Africa,Nigeria, Kenya, Algeria, and Cameroon, among others, and that regional integration proceeds tolink countries within these regions in a way that exploits economies of scale. What will Africa’strade arrangements be with the rest of the world? It is plausible that as in Asia at a similar stageof development, Africa in 20 years will still try to use trade barriers to protect domestic marketsand develop a manufacturing sector. Nevertheless, many countries will use export processingzones as tools for development, plugging themselves into the global economy without being fullyexposed to its competitive winds.
What is likely to be the situation for Africa’s currencies? In purely economic terms,Africa is unlikely to benefit from having its own, single currency rather than adopting a widelyused international currency—the dollar or the euro. When the political enthusiasm for anAfrican currency abates, different regions are likely to choose different solutions. North Africamay well peg to, or adopt, the euro, as ties with the EU will continue to increase. The CFA franczone will probably not exist in its current form; the countries concerned may move to use theeuro, or to be linked to it with EU support—but this will depend very much on Europe. Thelikelier alternative is a regional currency with a regime of managed floating against the euro or abasket of currencies. The difficult challenge will be to generate enough monetary discipline toensure that such a currency is stable, as will also be true of East Africa, if a common currency isintroduced there. In southern Africa, the area based on the rand, the continent’s only floatinghard currency, is likely to have expanded. But it will not form the nucleus for a pan-Africancurrency, because Africa is too diverse in its export commodities and financial development. SoAfrican economic integration is likely to continue to fall far short of a continent-wide union in 5 See discussion in Eichengreen et al.(1999).

7
many dimensions. But this should not inhibit progress in economic development, providedNEPAD delivers on its promises.
1
References
Abdel-Salam, Osman Hashim. 1970. “The Evolution of African Monetary Institutions” TheJournal of Modern African Studies, Vol. 8, No. 3., Oct., pp. 339-362.
Adam, Christopher S., David L. Bevan. 2000. “The Cash-Budget as a Restraint: The Experienceof Zambia,” in Investment and Risk in Africa, ed. by Paul Collier and Catherine Pattillo(New York: St. Martin’s Press; London: MacMillan Press) pp. 185–215.
Adam, Christopher, Edward Buffie, Stephen O’ Connell, and Catherine Pattillo. 2003.“Exchange Rate Policy and Management of Official and Private Capital Flows inAfrica,” (unpublished).
Alesina, Alberto and Robert Barro. 2002. “Currency Unions,” Quarterly Journal of Economics,Vol. 117(2), pp. 409-36.
Alibert, Jacques. 1999. “Un nouveau satellite pour l’euro: le Cap Vert et la zone ‘Escudo’”,Afrique contemporaine, no. 189, janvier-mars.
Alweendo. 1999. “Mr. Alweendo Discusses Namibia’s Current Exchange Rate Arrangement andits Implications for the Country’s Monetary Policy,” BIS Review No. 127.
Aron, Janine, Ibrahim A. Elbadawi, Brian Kahn. 2000. “Real and Monetary Determinants of theReal Exchange Rate in South Africa,” in Development Issues in South Africa, ed. byIbrahim A. Elbadawi, and Trudi Hartzenberg (New York: St. Martin’s Press; London:MacMillan Press) pp. 195–236.
Austen, Ralph A. 1987. African Economic History : Internal Development and ExternalDependency, London: James Currey Ltd.
Azam, Jean-Paul. 2001. “Inflation and Macroeconomic Instability in Madagascar,” AfricanDevelopment Review, Vol. 13, No. 2 (Dec), pp. 175–201.
Bank of France (2002), Rapport annuel de la zone franc 2001, Paris.
Barro, Robert and David Gordon. 1983. “A Positive Theory of Monetary Policy in a NaturalRate Model,” Journal of Political Economy, Vol. 91, pp. 589-610.
Barro, Robert, and Xavier Sala-I-Martin. 1995. Economic Growth, New York: McGraw Hill.
Bayoumi, Tamim, and Paul Masson. 1995. “Fiscal Flows in the United States and Canada:Lessons for Monetary Union in Europe, European Economic Review, Vol. 39 (1995).

2
Bevan, David, Paul Collier, Jan Gunning, Arne Bigsten, and Paul Horsnell. 1990. “ControlledOpen Economies: A Neoclassical Approach to Structralism,” Vol. 13, No. 367 (England:Clarendon Press).
Beaugrand, Philippe. 1997. “Zaïre’s Hyperinflation, 1990–96,” IMF Working Paper 97/50(Washington: International Monetary Fund).
BIDPA and CSAE. 2001. “The Prerequisites for Progress Towards a Single Currency inCOMESA: Medium to Long-term Perspective Study,” Botswana Institute forDevelopment Policy Analysis (Gaborone), and Centre for the Study of AfricanEconomies (University of Oxford).
Bigsten, Arne, and Beatrice Kalinda-Mkenda. 2002. “Kenya and the East African Community: AReport for Sida,” (Sweden: Göteborg University).
Birmingham, David, and Phyllis M. Martin, eds. 1983. History of Central Africa, vol.2, NewYork and London: Longmans.
Bleaney, Michael, and Lisenda Lisenda. 2001. “Monetary Policy After Financial Liberalisation:A Central Bank Reaction Function for Botswana,” Centre for Research in EconomicDevelopment and International Trade Working Paper No. 01/17, October.
Boughton, James M. 1991. “The CFA Franc Zone: Currency Union and Monetary Standard,”IMF Working Paper WP/91/133, December.
_____ 1993. “The Economies of the CFA Franc Zone”, in Policy Issues in the Operation ofCurrency Unions, ed. by P.R. Masson and M.P. Taylor, Great Britain: CambridgeUniversity Press, pp. 96-107.
Broda, Christian. 2001. “Coping with Terms-of-Trade Shocks: Pegs versus Floats,” AmericanEconomic Review, Vol. 91, No. 2 (May), pp. 376–80.
Bundoo, Sunil Kumar, and Beealasingh Dabee. 1999. “Gradual Liberalization of Key Markets:The Road to Sustainable Growth in Mauritius,” Journal of International Development,pp. 437–64.
Calvo, Guillermo and Carmen Reinhart. 2002. “Fear of Floating,” Quarterly Journal ofEconomics, Vol. 117, pp. 379-408.
Cashin, Paul, Luis Céspedes, and Ratna Sahay. 2002. “Keynes, Cocoa, and Copper: In Search ofCommodity Currencies,” IMF Working Paper 02/223 (Washington: InternationalMonetary Fund).
Cashin, Paul, McDermott, C. John, and Catherine Pattillo. 2003. “Terms of Trade Shocks inAfrica: Are They Short-Lived or Long-Lived?” (forthcoming, Journal of DevelopmentEconomics).

3
Casteleijn, A.J.H. 2001. “South Africa’s Monetary Policy Framework,” Conference Papers onthe Monetary Policy Frameworks in Africa,” Pretoria: South Africa Reserve Bank,September 17-19.
Clement, Jean A.P., with Stéphane Cossé, Jean Le Dem, and Johannes Mueller. 1996. Aftermathof CFA Franc Devaluation, IMF Occasional Paper, No. 138, Washington: IMF.
Cobham, David, and Peter Robson. 1994. “Monetary Integration in Africa: A DeliberatelyEuropean Perspective,” World Development, Vol. 22(3): 285-99.
Cohen, Benjamin. 1998. The Geography of Money, Ithaca: Cornell University Press.
_____. 2000. “Monetary Unions: The Political Dimension,” published in French as“Dollarisation: la dimension politique,” L’Economie Politique 5:1 (January 2000), 88-112.
Collier, Paul, and Jan Willem Gunning. 1999. “Exchange Rate Management in LiberalisingAfrican Economies,” in African Economies in Transition, ed. by Jo Ann Paulson, Vol. 1,pp. 169–92.
Comesa Finance and Economics, “Monetary and Fiscal Co-operation in Comesa.” (mimeo)Available via the Internet: http://www.comesa.int/finance/econmhp.htm
Commission de l’UEMOA, Rapport semestriel d’éxecution de la surveillance multilatérale, December 2002.
Cooper, Richard. 1987. “A Monetary System for the Future,” Essays in World Economics: TheInternational Monetary System, Cambridge, MA: MIT Press.
d' A.Collings, Francis. 1978. “The Rand and the Monetary Systems of Botswana, Lesotho, andSwaziland”, The Journal of Modern African Studies, Vol. 16, No.1, Mar., pp. 97-121.
Debrun, Xavier, Paul Masson and Catherine Pattillo. 2002. “Monetary Unions in West Africa:Who Might Gain, Who Might Lose and Why?”, IMF Working Paper No 02/226.(Washington: International Monetary Fund).
_____ 2003. “Regional Currencies,” mimeo, July.
Devarajan, Shantayanan, and Jaime de Melo. 1987. “Evaluating Participation in AfricanMonetary Unions: A Statistical Analysis of the CFA Zones,” World Development, Vol.15 (4): 483-96.
4
Doré, Ousmane, and Paul Masson. 2002. “Experience with Budgetary Convergence in theWAEMU,” IMF Working Paper WP/02/108, Washington: International Monetary Fund,June.
East African Community, “EAC Development Strategy: 2001–05”, (mimeo). Available via theInternet: http://www.eachq.org/Dev_Strategy/EACDEVESTRATEGY20012005.htm.
East African Community, “East African Community—The Treaty,” (mimeo). Available via theInternet: http://www.eachq.org/eac-TheTreaty.htm
East African Community Secretariat, n.d., “East African Community: From Co-operation toCommunity (1996-2001).” (mimeo). Available via the Internet:http://www.eachq.org/About_EAC/from_co-op_to_community.htm
Easterly, William, and Ross Levine. 2003. "Tropics, Germs, and Crops: the Role of Endowmentsin Economic Development," Journal of Monetary Economics, Vol 50 (January).
Eichengreen, Barry. 1994. International Monetary Arrangements for the 21st Century,Washington: Brookings Institution.
Eichengreen, Barry, Paul R. Masson, Miguel Savastano, and Sunil Sharma. 1999. “TransitionStrategies and Nominal Anchors on the Road to Greater Exchange-Rate Flexibility,”Essays in International Finance No. 213, Princeton, N.J.: Princeton University Press.
Elbadawi, Ibrahim A.. 1997. “The Parallel Market Premium for Foreign Exchange andMacroeconomic Policy in Sudan,” in Parallel Exchange Rates in Developing Countries,ed. by Miguel Kiguel, J. Saul Lizondo, Stephen O’Connell, (New York: St. Martin’sPress; London: MacMillan Press) pp. 221–46.
Ellyne, Mark. 1999. “The Failure of Real Targets for Monetary Policy: The Case of Zimbabwe,”IMF Policy Discussion Paper (Washington: International Monetary Fund) (unpublished).
Emerson, Michael, Daniel Gros, Alexander Italianer, Jean Pisani-Ferry, and Horst Reichenbach.1991. One Market, One Money (Oxford: Oxford University Press).
Fielding, David, and Kalvinder Shields. 2001. “Modelling Macroeconomic Shocks in the CFAFranc Zone,” Journal of Development Economics, Vol. 66, pp. 199-223.
Fischer, Stanley. 2001. “Distinguished Lecture on Economics in Government—Exchange RateRegimes: Is the Bipolar View Correct?” Journal of Economic Perspectives, Vol. 15, pp.3-24.
5
Foroutan, Faezeh, and Lant Pritchett. 1993. “Intra-Sub-Saharan African Trade: Is it too Little?”Journal of African Economies, Vol. 2 (1): 74-105
Frankel, Jeffrey. 1999. "No Single Currency Regime is Right for All Countries or at All Times,"Essays in International Finance No. 215, Princeton, N.J.: Princeton University Press.
Frankel, Jeffrey and Andrew Rose. 1998. “The Endogeneity of Optimum Currency AreaCriteria”, Economic Journal, Vol. 108 (July): 1009-25.
Glick, Reuven, and Andrew Rose. 2001. “Does a Currency Union Affect Trade? The TimeSeries Evidence,” mimeo, Federal Reserve Bank of San Francisco and University ofCalifornia, Berkeley, November.
Goldstein, Andrea, and Njuguna S. Ndung’u. 2001. “Regional Integration Experience in theEastern African Region,” OECD Development Centre Technical Papers No. 171,Available via the Internet: http://www.oecd.org/dev/publication/tp1a.htm
Gnassou, A. Laure. 1999. “Après l’euro: quel statut juridique pour la zone franc africaine?”Afrique contemporaine, No. 189 (janvier-mars), pp. 6-22 (Paris: La DocumentationFrançaise).
_____. 2001. “La BCE doit tisser des liens avec les banques centrales africaines de la zonefranc,” Le Monde, June 18.
Guillaume, Dominique M., and David Stasavage. 2000. “Improving Policy Credibility: Is Therea Case for African Monetary Unions,” World Development, Vol. 28, No. 8, pp. 1391–1407.
Guillaumont, Patrick, and Sylviane Guillaumont. 1984. Zone franc et développement africain,Paris: Economica.
Gupta, Sanjeev, Keiko Honjo, and Marijn Verhoeven. 1997. “The Efficiency of GovernmentExpenditure: Experiences from Africa,” IMF Working Paper 97/153 (Washington:International Monetary Fund).
———, Hamid Davoodi and Erwin Tiongson. 2000. “Corruption and the Provision of HealthCare and Education,” IMF Working Paper 00/116 (Washington: International MonetaryFund).
Hanink, Dean, and J. Henry Owusu. 1998. “Has ECOWAS Promoted Trade Among ItsMembers?” Journal of African Economies, Vol. 7 (3): 363-83.

6
Hausman, Roberto, Ugo Panizza, and Ernesto Stein. 2001. “Original Sin, Passthrough, and Fearof Floating,” Washington: Inter-American Development Bank, mimeo.
Hazelwood, A. 1952. “Sterling balances and the Colonial Currency System”, Economic Journal,Vol LXII, no. 248, December, pp. 942-5.
Hawkins, John, and Paul Masson. 2003. “Economic Aspects of Regional Currency Areas and theUse of Foreign Currencies,” in Regional Currency Areas and the Use of ForeignCurrencies, BIS Papers No. 14, Basel: Bank for International Settlements.
Helleiner, Eric. 2001. “The Southern Side of Embedded Liberalism: The Politics of PostwarMonetary Policy in the Third World,” TPEC Working Paper 01/5.
Hermans, H.C.L. 1997. “Bank of Botswana: The First 21 Years,” in Salkin et al., eds. (1997), pp.177-222.
Hernández-Catá, Ernesto, et al. 1998. The West African Economic and Monetary Union: RecentDevelopments and Policy Issues, Occasional Paper 170, Washington: InternationalMonetary Fund.
Hoffmaister, Alexander W., Jorge E. Roldos, and Peter Wickham. 1998. “MacroeconomicFluctuations in Sub-Saharan Africa,” Staff Papers, International Monetary Fund, Vol. 45,No. 1 (Mar), pp. 132–60.
Honohan, Patrick, and Stephen A. O’ Connell. 1997. “Contrasting Monetary Regimes in Africa,”IMF Working Paper 97/64 (Washington: International Monetary Fund).
Honohan, Patrick, and Philip R. Lane. n.d. “Will the Euro Trigger More Monetary Unions inAfrica?” study prepared for UNU/WIDER Project on EMU: Impact on Europe and theWorld.
Indian Ocean Newletter. 1986. Mozambique: the Key-Sectors of the Economy: 1986 Edition,Paris.
Institut Royal des Relations Internationales. 1963. “Décolonisation et Indépendance du Rwandaet du Burundi”. Chronique de Politique Etrangère, Bruxelles, vol. XVI, no. 4-6 (juillet-novembre).
IMF. 2002a. “IMF Concludes Article IV Consultation with Namibia,” Public Information NoticeNo. 02/13, Washington: International Monetary Fund, February.
IMF. 2002b. “IMF Concludes Discussion on Recent Developments and Regional Policy Issueswith the Central African Economic and Monetary Community,” Public InformationNotice No. 02/96, Washington: International Monetary Fund, September.

7
International Monetary Fund, “Exchange Arrangements and Exchange Restrictions: AnnualReport,” Available via the Internet:
http://www-int.imf.org/depts/mae/maeweb/databases/AREAER/index.htm.
International Financial Statistics Online Database 2003, International Monetary Fund,Washington, DC.
Jenkins, Carolyn, and Lynne Thomas. 1996. “Is Southern Africa Ready for Regional MonetaryIntegration?” Centre for the Study of African Economies Working Paper 51 (November),published in Lennart Petersson, ed., Post-Apartheid Southern Africa: EconomicChallenges and Policies for the Future. London, New York: Routledge, 1998, pp. 145-70.
Jensen, Henrik. 2003. “Explaining the Inflation Bias without using the Word ‘Surprise’”, mimeo,University of Copenhagen, February.
Johnson, Marion. 1970. “The Cowrie Currencies of West Africa. Part II”, The Journal of AfricanHistory, Vol. 11, No. 3, pp. 331-353.
Kapur, Ishan, Michael T. Hadjimichael, Paul Hilbers, Jerald Schiff, and Philippe Szymczak.1991. “Ghana: Adjustment and Growth, 1983–91,” IMF Occasional Paper No. 86(Washington: International Monetary Fund).
Kaufmann, D., Kraay, A., and P. Zoido-Lobaton. 1999. “Aggregating Governance Indicators,”Working Paper No. 2195 (Washington: World Bank).
Kenen, Peter. 1969. “The Optimum Currency Area: An Eclectic View”, in Mundell, Robert andAlexander Swoboda (eds.), Monetary Problems of the International Economy, Chicago:University of Chicago Press.
Kraus, Christiane. 2003. “Concept Paper—Towards an East African Customs Union,” (mimeo,World Bank).
Levy-Yeyati, Eduardo, and Federico Sturzenegger. 2002. “Classifying Exchange Rate Regimes:Deeds vs. Words,” University of Torcuato di Tella, Buenos Aires, and websitehttp://www.utdt.edu/~ely/papers.html.
Martin, Philippe. 1995. “Free-Riding, Convergence and Two-Speed Monetary Unification inEurope,” European Economic Review, 39 (7): 1345-64.
Masalila, Kealeboga and Oduetse Motshidisi. 2003. “Botswana’s Exchange Rate Policy”, inRegional Currency Areas and the Use of Foreign Currencies, BIS Papers No. 17, Basel:Bank for International Settlements, May: pp. 122-27.

8
Masson, Paul R. 2001. “Exchange Rate Regime Transitions,” Journal of DevelopmentEconomics, Vol. 64, pp. 571-86.
Masson, Paul and Catherine Pattillo. 2001. Monetary Union in West Africa (ECOWAS)—Is itDesirable and How Could It be Achieved?, Occasional Paper No. 204 (Washington:International Monetary Fund).
______ . 2002. “Monetary Union in West Africa: An Agency of Restraint for Fiscal Policies?”Journal of African Economies, Vol. 11(September): 387-412.
McCarthy, Colin. 2003. “The Southern African Customs Union: Executive Summary,”Workshop Case Study, FAO Workshop on Regional Integration, Common AgriculturePolicies and Food Security, Pretoria, South Africa, 6-9 May 2003.
Mkenda, Beatrice Kalinda. 2001. “Is East Africa an Optimum Currency Area?” Working Papersin Economics No. 41 (Sweden: Göteborg University).
Mladek, J.V. 1964a. “Evolution of African Currencies, Part I: The Franc area”, Finance andDevelopment, A Quarterly Publication of the International Monetary Fund and the WorldBank; 1:2: Sept., pp. 81-88.
Mladek, J.V. 1964b. “Evolution of African Currencies, Part II: The Sterling”, Finance andDevelopment, A Quarterly Publication of the International Monetary Fund and the WorldBank; 1:3: Dec., pp. 184-91.
Monga, Célestin and Jean-Claude Tchatchouang. 1996. Sortir du piège monétaire, Paris:Economica.
Montiel, Peter, Pierre-Richard Agénor, and Nadeem Ul Haque, “Informal Financial Markets inDeveloping Countries: A Macroeconomic Analysis,” Vol. 11, No. 212 (Cambridge, MA:Blackwell).
Moser, Gary , Scott Rogers, Reinhold Van Til, and others. 1997. “Nigeria: Experience withStructural Adjustment,” IMF Occasional Paper No. 148 (Washington: InternationalMonetary Fund).
Mundell, Robert. 1961. “A Theory of Optimum Currency Areas,” American Economic Review,Vol. 51 (September): 657-65.
Mundell, Robert. 1972. “African Trade, Politics, and Money”, in African and MonetaryIntegration, ed. by R. Tremblay. Montreal: Les Editions HRW.
Mundell, Robert. 2002. “Does Africa Need a Common Currency?” Defining Priorities forRegional Integration (Addis Ababa: UN Economic Commission for Africa): 45-57.

9
Mussa, Michael, et al. 2000. Exchange Rate Regimes in an Increasingly Integrated WorldEconomy, Occasional Paper 193. Washington: International Monetary Fund.
Ndiaye, Mansour. 2000. The Demand for Money in the UEMOA Countries: An Application ofRecent Developments in Econometrics. Dakar: BCEAO, September.
Ndung’u, Njuguna S., and Rose W. Ngugi. 1999. “Adjustment and Liberalization in Kenya: TheFinancial and Foreign Exchange Markets,” Journal of International Development, pp.465–91.
Ng’eno, Nehemiah. 2002. “The Status of Regional Trade Liberalization in East Africa,” (Kenya:African Centre for Economic Growth).
Nitsch, V. 2002. "Honey I Shrunk the Currency Union Effect on Trade," World Economy, Vol.25; Part 4. Oxford: Blackwell Publishers.
Obstfeld, Maurice, and Kenneth Rogoff. 1995. “The Mirage of Fixed Exchange Rates,” Journalof Economic Perspectives, Vol. 9(4), pp. 73-96.
OECD. 2002. African Economic Outlook 2001/2002, Paris: Organisation for Economic Co-Operation and Development.
Parmentier, J.M. and R. Tenconi. 1996. Zone Franc en Afrique: Fin d’une ère ou renaissance?Paris et Montréal: L’Harmattan.
Pellechio, Anthony, Luisa Zanforlin, Girma Begashaw,Stefania Fabrizio, and Joachim Harnack”.2001. “Ghana: Economic Development in a Democratic Environment,” IMF OccasionalPaper No. 199 (Washington: International Monetary Fund).
Rajaram, A. A. Yeats, N. Ngen’eno, F. Musondo, G. Mwau. 1999. “Putting the Horse Before theCart: On the Appropriate Transition to an East African Customs Union,” (mimeo). WorldBank Report Prepared for the East African Community Secretariat.
REER: Information Notice System, IMF, Washington, DC.
Reinhart, Carmen and Kenneth Rogoff. 2002. “The Modern History of Exchange RateArrangements: A Reinterpretation,” NBER Working Paper 8963. Cambridge, MA:National Bureau of Economic Research.
Rose, Andrew. 2000. “One Money, One Market: Estimating the Effect of Common Currencieson Trade,” Economic Policy 30: 9-45.

10
Sacerdoti, Emilio, and Yuan Xiao. 2001. “Inflation Dynamics in Madagascar, 1971–2000,” IMFWorking Paper 01/168 (Washington: International Monetary Fund).
Sala-i-Martin, Xavier and Jeffrey Sachs. 1993. “Fiscal Federalism and Optimum CurrencyAreas: Evidence for Europe from the United States,” in Matthew B. Canzoneri, VittorioGrilli, and Paul R. Masson (eds.), Establishing a Central Bank: Issues in Europe andLessons from the United States, Cambridge: Cambridge University Press.
Salkin, J.S., D. Mpabanga, D. Cowan, J. Selwe, and M. Wright, eds. 1997. Aspects of theBotswana Economy: Selected Papers. Gaborone: Lentswe La Lesedi; Oxford: JamesCurrey.
South African Reserve Bank (SARB), Quarterly Bulletin, December 2002.
Stasavage, David. 1997. “The CFA Franc Zone and Fiscal Discipline,” Journal of AfricanEconomies, Volume 6, No. 1, pp. 132–67.
Sturm, Jan-Egbert, and Jakob de Haan. 2001. “Inflation in Developing Countries: Does CentralBank Independence Matter? New Evidence Based on a New Data Set,” Ifo Studien, Vol.47, No. 4, pp. 389–403.
Subramanian, Arvind, and Devesh Roy. 2001. “Who Can Explain The Mauritian Miracle:Meade, Romer, Sachs, or Rodrik?” IMF Working Paper 01/116 (Washington:International Monetary Fund).
Subramanian, Arvind, and Natalia Tamirisa. 2001. “Africa’s Trade Revisited,” IMF WorkingPaper WP/01/33, March.
Tenreyro, Silvana, and Robert Barro. 2003. “Economic Effects of Currency Unions,” NBERWorking Paper 9435. Cambridge, MA: National Bureau of Economic Research, January.
Tjirongo, M. 1995. “Short-Term Stabilization versus Long-Term Price Stability: EvaluatingNamibia’s Membership of the Common Monetary Area,” CFSAF Working Paper 95-18,University of Oxford
Uche, C.U. 1997. “Does Nigeria Need an Independent Central Bank?” African Review of MoneyFinance and Banking, Vol. 21, pp. 141-158.
UK Treasury (2003), UK Membership of the Single Currency: An Assessment of the FiveEconomic Tests, London: Stationery Office, Cm 5776.
USAID. n.d., “East African Community: Non-trade Policy, Economic Analysis Paper #2.2,”(mimeo). Available via the Internet: www.usaid.or.ug/econ%20papers/eac%20non-trade%20polic.doc

11
Valério, Nuno. 2002. “The Escudo Zone—A Failed Attempt at Colonial Monetary Union (1962-71),” paper presented at session 39 of the XIII International Economic History Congress(Buenos Aires).
Van Zyl, Lambertus. 2003. “South Africa’s Experience of Regional Currency Areas and the Useof Foreign Currencies” in Regional Currency Areas and the Use of Foreign Currencies,BIS Papers No. 17, Basel: Bank for International Settlements, May: pp. 134-139.
Venables, Anthony J. 2000. “Winners and Losers from Regional Integration Agreements,”CEPR Discussion Paper No. 2528, (London: Centre for Economic Policy Research).
Vinay, Bernard. 1988. Zone Franc et Coopération Monétaire, second edition. Paris: Ministère dela Coopération et du Développement.
Vizy, Marc. 1989. La Zone Franc, Paris: CHEAM (Centre des Hautes Etudes sur l’Afrique etl’Asie Modernes).
Wiegand, Johannes. 2002. “Fiscal Surveillance Criteria for Oil-Exporting Developing Countries—the Example of the CEMAC,” mimeo, Washington: International Monetary Fund.
World Bank Africa Database 2002 CD-ROM, World Bank, Washington, DC.
World Bank. 2000. “Part II: West Africa, Key Trends and Regional Perspectives,” West Africa Regional Assistance Strategy Discussion Paper (unpublished).
World Bank World Development Indicators online database 2003.
Yansané, Aguibou Y. 1984. Decolonization in West African States with French Colonial Legacy. Comparison and Contrast: Development in Guinea, the Ivory Coast and Senegal (1945- 1980). Cambridge, Massachusetts: Schenkman Publishing Co.
IMF Staff Country Reports
“Botswana: 2002 Article IV Consultation--Staff Report,” IMF Staff Country Report 02/244.
“Burundi—Recent Economic Developments,” IMF Staff Country Reports No. 97/114 .

12
“Burundi: 2002 Article IV Consultation and Use of Fund Resources—Request for Post-ConflictEmergency Assistance—Staff Report; Staff Statement; Public Information Notice andPress Release on the Executive Board Discussion; and Statement by the ExecutiveDirector for Burundi,” IMF Staff Country Report No. 02/242.
“Cape Verde—Recent Economic Developments,” IMF Staff Country Reports No. 99/58 .
“Cape Verde: 2001 Article IV Consultation—Staff Report and Public Information Notice on theExecutive Board Discussion,” IMF Staff Country Report No. 01/174 .
“Democratic Republic of the Congo: Selected Issues and Statistical Appendix,” IMF StaffCountry Report No. 01/123.
“Eritrea: 2003 Article IV Consultation—Staff Report; Public Information Notice on theExecutive Board Discussion; and Statement by the Executive Director for Eritrea,” IMFStaff Country Report No. 03/165.
“Eritrea—Selected Issues,” IMF Staff Country Reports No. 97/88.
“Ethiopia: Recent Economic Developments,” IMF Staff Country Report No. 99/98.
“Ethiopia—Selected Issues,” IMF Staff Country Report No. 96/52.
“The Gambia: Selected Issues,” IMF Staff Country Reports No. 99/71.
“The Gambia: 2001 Article IV Consultation—Staff Report; Staff Statement; Public InformationNotice on the Executive Board Discussion; and Statement by the Authorities of TheGambia,” IMF Staff Country Report No. 01/148.
“Ghana: 2001 Article IV Consultation and Third Review Under the Poverty Reduction andGrowth Facility and Request for Waiver of Performance Criteria,” IMF Staff CountryReport No. 01/141.
“Guinea: Staff Report for the 1999 Article IV Consultation and Request for the Third AnnualArrangement Under the Enhanced Structural Adjustment Facility,” IMF Staff CountryReport No. 00/33.
“Guinea-Bissau: 2002 Article IV Consultation—Staff Report; Staff Supplement; and PublicInformation Notice on the Executive Board Discussion,” IMF Staff Country Report No.02/153.
“Kenya: 2001 Article IV Consultation—Staff Report; Staff Supplement; and Public InformationNotice on the Executive Board Discussion,” IMF Staff Country Report No. 02/85.
“Lesotho: 2002 Article IV Consultation--Staff Report,” IMF Staff Country Report 02/218.
“Liberia: Selected Issues and Statistical Appendix,” IMF Staff Country Report No. 00/50.

13
“Mozambique: 2000 Article IV Consultation and Second Review Under the Poverty Reductionand Growth Facility—Staff Report; Staff Statement; Public Information Notice and PressRelease on the Executive Board Discussion; and Statement by the Authorities ofMozambique,” IMF Staff Country Report No. 01/17.
“Nigeria: 2001 Article IV Consultation—Staff Report; Staff Statement; and Public InformationNotice on the Executive Board Discussion,” IMF Staff Country Report No. 01/131.
“Nigeria: 2002 Article IV Consultation—Staff Report; Staff Statement; and Public InformationNotice on the Executive Board Discussion,” IMF Staff Country Report No. 03/3.
“Seychelles—Recent Economic Developments,” IMF Staff Country Report No. 96/46 .
“Seychelles: Recent Economic Developments,” IMF Staff Country Report No. 00/162.
“South Africa: 2002 Article IV Consultation—Staff Report; Staff Statement; Public InformationNotice on the Executive Board Discussion; and Statement by the Executive Director forSouth Africa, IMF Staff Country Report No. 03/17.
“Sudan—Recent Economic Developments,” IMF Staff Country Report No. 99/53 .
“Sudan: Final Review Under the Medium-Term Staff-Monitored Program and the 2002Program-Staff Report; and Staff Supplement,” IMF Staff Country Report No. 02/245.
“Swaziland: 2002 Article IV Consultation--Staff Report,” IMF Staff Country Report 03/21.
“Tanzania: Selected Issues and Statistical Appendix,” IMF Staff Country Report No. 03/2.
“Tanzania: 2002 Article IV Consultation, Fifth Review Under the Poverty Reduction andGrowth Facility and Request for an Extension of the Arrangement and Waiver ofPerformance Criterion—Staff Report; Public Information Notice and News Brief on theExecutive Board Discussion; and Statement by the Executive Director for Tanzania,”IMF Staff Country Report No. 03/1.
“Uganda: Financial System Stability Assessment, including Reports on the Observance ofStandards and Codes on the following topics: Monetary and Financial PolicyTransparency, Banking Supervision, Securities Regulation, Insurance Regulation,Corporate Governance, and Payment Systems,” IMF Staff Country Report No. 03/97.
Zimbabwe: Recent Economic Developments, Selected Issues, and Statistical Appendix,” IMFStaff Country Report No. 01/13.


![Ancient history [by D.M. Masson]....Title Ancient history [by D.M. Masson]. Author David Mather Masson](https://img.dokumen.tips/doc/110x75/60ec6d4334ac5766a325c5a1/ancient-history-by-dm-masson-title-ancient-history-by-dm-masson-author.jpg)