Embed Size (px)
Citation preview

The Minnesota Sex Offender Screening Tool-4 (MnSOST-4)
‖ Grant Duwe, Ph.D. ‖ Director, Research and Evaluation ‖ April 2017 ‖ Email: [email protected]

Overview
• Development and validation of the
MnSOST-4
• Sex Offender Risk Assessment in MN
• Principles of Effective Risk Assessment
• MnSOST-4 Items
• Predictive Performance Results
• Conclusions

Sex Offender Risk Assessment in MN • Minnesota Sex Offender Screening Tool
• MnSOST = 1996 (Epperson et al.)
• MnSOST-R = 1999 (Epperson et al.)
• MnSOST-3 = 2012 (Duwe and Freske)
• MnSOST series of tools used in various ways
• Assign risk levels of community notification purposes
• Prioritize sex offenders for prison-based SO treatment
• Help determine level of post-release supervision
• Screen for involuntary civil commitment
• Minnesota DOC also scored sex offenders on Static-
99 since mid-2000s

Development of MnSOST-4
• MnSOST-3
• Debut in 2012
• Uses 4-year follow-up period for sexual recidivism
• Performance data available in early 2017 for 2012 releases
• MnSOST-3 data provide a performance baseline
• Can a better assessment be developed?
• Applying proven and promising practices
• What does the literature say about developing and
validating a risk assessment instrument?

Principles of Effective Risk Assessment
1. Scoring Method
2. Classification Method
3. Item Selection and Measurement
4. Internal Validation Method
5. Evaluating Predictive Performance
6. Bias Testing
7. Feedback Loop

Scoring Method
• Process by which items on instrument are populated
• Manual or automated
• Vast majority = manual scoring
• Manual Scoring
• Inter-rater disagreement is inevitable
• Inter-rater disagreement lack of reliability lower
predictive validity
• If assessment is scored manually
• Inter-rater reliability assessment is a must

Classification Method
• Process by which item values on instrument are
calculated into a risk score
• 3 Main Types of Classification Methods
• Burgess (simple, summative algorithm)
• Statistical (logistic regression)
• Machine Learning (Random Forest, boosting, etc.)
• Statistical/ML algorithms much better than Burgess
• “No Free Lunch”: no single best algorithm
• Necessary to test multiple methods
• Increase odds of identifying optimal algorithm for data

Item Measurement and Selection
• Item Selection guided by theory
• Among theoretically-relevant predictors, what is best
method?
• No clear consensus
• Examples: bootstrapping, stepwise, gain ratio
• Items often measured at nominal/ordinal levels
• Due to popularity of Burgess method
• Continuous measures can help boost predictive
performance
• Example: age at release

Internal Validation Method
• Internal Validity: can performance be reproduced on
population underlying sample?
• 3 Main Internal Validation Methods
• Split-Sample: most popular
• Development/Training Set
• Validation/Test Set
• K-Fold: more efficient than split-sample
• Bootstrap resampling: better than K-fold

Evaluating Predictive Performance
• Predictive Validity
• Accuracy
• Discrimination
• Calibration
• Existing research: focused mainly on area under the
curve (AUC) only measures discrimination
• Multiple metrics should be used to evaluate
predictive performance

Testing for Bias
• Recent concerns over disparate/adverse effects of
risk assessment on racial/ethnic minorities
• Types of assessments
• “Low Stakes”
• Prioritize for programming, determine institutional custody
levels
• “High Stakes”
• Individual’s liberty hangs in the balance; pre-trial release,
sentencing, parole
• Bias testing should be routine
• But should also be imperative for high stakes assessments

Feedback Loop
• When should an assessment be updated?
• Past research = very little guidance
• Use a measurement feedback loop to improve
predictive performance
• “Challenger” unseats an “incumbent”
• Compare MnSOST-4 with other assessments
that have been used on MN sex offenders
• MnSOST-R
• Static-99
• MnSOST-3

Dataset
• 5,745 sex offenders released from MN prisons
between 2003 and 2012
• Sexual Recidivism
• Reconviction for new sex offense within 4 years
• 130 were recidivists; base rate = 2.3%
• Prior assessments evaluated
• MnSOST-R
• Static-99
• MnSOST-3

Applying Promising/Proven Practices
• Tested multiple classification methods
• Used split-sample internal validation method
• Training set: 2003-2009 releases
• Test set: 2010-2012 releases
• Item Selection = Bootstrap resampling
• Evaluated performance with multiple metrics
• Tested for bias
• MnSOST-4 = manually scored
• Inter-reliability assessment

MnSOST-4 Items 1. Total Violent Offenses
2. Felony/Violent Offending Ratio
3. Violations of Orders for Protection
4. Stranger Victims (sex offenses)
5. Public Location (sex offenses)
6. Male Victim Specialization (sex offenses)
7. Multiple Predatory Offenses/Multiple Victim Age Groups
8. Suicidal Tendencies
9. Complete SO/CD treatment
10. Stake in Conformity Index: marriage, education and employment
11. Age at Release
12. Release Violator
13. Unsupervised Release

Predictive Performance Results
• MnSOST-4 significantly outperformed
competitors
• Much better than MnSOST-R and Static-99
• Moderate improvement over MnSOST-3
• Regularized logistic regression = Random
Forests
• Very little difference in predictive performance
• Bias Testing
• Performance similar for Whites and Non-Whites

Predictive Performance Results ACC PRC H AUC RMSE SHARP
2010-2012 Test Set (N = 1,772)
Regularized Logistic Regression 0.981 0.224 0.180 0.835 0.131 0.418
Random Forest 0.981 0.216 0.163 0.851 0.132 0.416
MnSOST-R 0.981 0.033 0.012 0.626 0.133 0.304
2010-2012 Test Set (N = 1,604)
Regularized Logistic Regression 0.981 0.224 0.174 0.847 0.134 0.419
Random Forest 0.981 0.202 0.158 0.858 0.135 0.413
Static-99 0.981 0.047 0.022 0.654 0.137 0.314
2012 Test Set (N = 541)
Regularized Logistic Regression 0.976 0.154 0.117 0.765 0.149 0.373
Random Forest 0.976 0.150 0.117 0.786 0.151 0.376
MnSOST-3 0.975 0.118 0.099 0.716 0.138 0.355

Performance for Higher-Risk
• MnSOST used to guide risk level assignments
• Risk Levels Community Notification
• Historical Risk Level Distribution
• Level 1 (lower risk) = 55%
• Level 2 (moderate risk) = 30%
• Level 3 (higher risk) = 15%
• Identify the riskiest 15 percent (“Level 3’s”)
• How well does each assessment do?
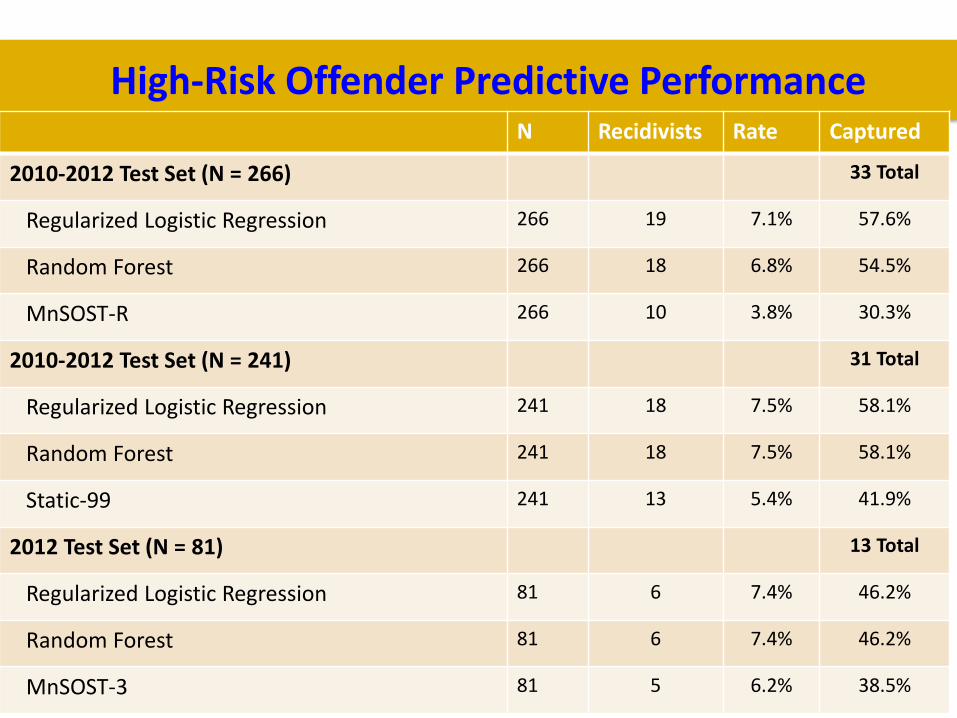
High-Risk Offender Predictive Performance N Recidivists Rate Captured
2010-2012 Test Set (N = 266) 33 Total
Regularized Logistic Regression 266 19 7.1% 57.6%
Random Forest 266 18 6.8% 54.5%
MnSOST-R 266 10 3.8% 30.3%
2010-2012 Test Set (N = 241) 31 Total
Regularized Logistic Regression 241 18 7.5% 58.1%
Random Forest 241 18 7.5% 58.1%
Static-99 241 13 5.4% 41.9%
2012 Test Set (N = 81) 13 Total
Regularized Logistic Regression 81 6 7.4% 46.2%
Random Forest 81 6 7.4% 46.2%
MnSOST-3 81 5 6.2% 38.5%

Inter-Rater Reliability
• DOC staff (8 Raters) scored same 10 cases
• Intra-Class Correlation Coefficient (ICC)
• > 0.95 = excellent
• 0.85-0.94 = good
• 0.75-0.84 = adequate
• < 0.75 = poor
• Overall ICC = 0.90
• MnSOST-4 = “good” reliability

Summary
• MnSOST-4 Performance
• Warrants replacement of MnSOST-3
• Classification Method
• RLR = relatively transparent and interpretable
• Performed just as well as Random Forests
• Ivory Tower vs. Real World
• Actual performance may not be as good
• MnSOST-3 performance
• 0.796 in development and validation study
• 0.716 in current study

Wrapping Up
• Principles may not be “best practices”
• But they are “better practices”
• Use of a feedback loop can be helpful
• Progressively more difficult for challenger to unseat
incumbent: better overall performance
• Use multiple measures and methods
• Classification methods
• Internal validation methods
• Predictive performance