Embed Size (px)
Citation preview

The Microstructure of Work: How Unexpected Breaks Let You Rest, but Not Lose Focus
Pradeep Pendem Bradley R. Staats
Paul Green Francesca Gino
Working Paper 17-058

Working Paper 17-058
Copyright © 2016 by Pradeep Pendem, Paul Green, Bradley R. Staats, and Francesca Gino
Working papers are in draft form. This working paper is distributed for purposes of comment and discussion only. It may not be reproduced without permission of the copyright holder. Copies of working papers are available from the author.
The Microstructure of Work: How Unexpected Breaks Let You Rest, but Not Lose Focus
Pradeep Pendem University of North Carolina at Chapel Hill
Bradley R. Staats University of North Carolina at Chapel Hill
Paul Green Harvard Business School
Francesca Gino Harvard Business School

1
The Microstructure of Work:
How Unexpected Breaks Let You Rest, but Not Lose Focus
Pradeep Pendem University of North Carolina at Chapel Hill [email protected]
Paul Green
Harvard Business School [email protected]
Bradley R. Staats
University of North Carolina at Chapel Hill [email protected]
Francesca Gino
Harvard Business School [email protected]
December 20, 2016
Acknowledgments
Wearegratefulfortheassistanceofnumerousindividualsatourfieldsite.WealsothankDiwasKCforinsightfulcommentsthathelpedusdevelopthiswork.Anyerrorsaretheresponsibilityoftheauthors.

The Microstructure of Work
1
Abstract How best to structure the work day is an important operational question for organizations. A key structural consideration is the effective use of breaks from work. Breaks serve the critical purpose of allowing employees to recharge, but in the short term, translate to a loss of time that usually leads to reduced productivity. We evaluate the effects of two types of breaks (expected versus unexpected), and two distinct forms of unexpected breaks, and find that unexpected breaks can, under certain conditions, yield immediate post-break performance increases. We test our hypotheses using productivity data from 212 fruit harvesters collected over one harvesting season yielding nearly 250,000 truckloads of fruit harvested over the course of 9,832 shifts. We provide a conceptual laboratory replication of these findings, showing that unexpected breaks lead to increased performance when they allow people to maintain attention on the focal task. Our results suggest that the characteristics of a break can lead the break to be experienced as an interruption, with all consequent negative outcomes, or as a rejuvenating and experience, with positive post-break consequences. Keywords: Breaks, Productivity, Attention, Workload, Harvesting
1. Introduction
The structure of work is widely recognized as key to driving performance. Various aspects of work
structure—including task design, specialization, interdependence, work scheduling and sequencing—have
been found to impact important outcomes, such as productivity and quality (Kc & Terwiesch, 2009;
Narayanan, Balasubramanian, & Swaminathan, 2009; Song, Tucker, & Murrell, 2015; Staats & Gino,
2012). The scheduling of labor has proven to be a significant consideration for ensuring prolonged
successful performance: who works, with whom they work, and when they work are important structural
factors that can lead to positive performance outcomes (Huckman, Staats, & Upton, 2009; Kesavan, Staats,
& Gilland, 2014; Song & Tucker, 2016; Tan & Netessine, 2015).
Perhaps unsurprisingly, one stream of research that explores the temporal aspects of work has
focused intensively on employees’ workday—and, more specifically, on the effects of breaks (see Jett &
George, 2003 for a review). Breaks are a practical necessity: humans are incapable of expending energy
indefinitely without real and tangible personal and organizational costs. Indeed, the bulk of the research
examining breaks offers results consistent with this intuition, suggesting that breaks can serve to arrest the
negative performance effects associated with physical and mental exhaustion (Henning, Jacques, Kissel,
Sullivan, & Alteras-Webb, 1997; Henning, Sauter, Salvendy, & Krieg Jr, 1989), boredom (Fisher, 1993)
The Microstructure of Work
2
and burnout (Schaufeli & Bakker, 2004). But this literature, collectively, also notes that breaks can be a
double-edged sword: though they serve the critical purpose of halting the harmful effects of exhaustion,
boredom, and burnout, they are often detrimental to productivity, particularly for non-creative work. In fact,
breaks are considered a form of work interruption, a term that carries negative connotations (Jett & George,
2003; Zellmer-Bruhn, 2003). Specifically, breaks are generally considered non-productive time: time spent
during a break detracts from productive time, and—more importantly—contributes to disengagement from
the job, implying a post-break “re-start” cost for employees (Froehle & White, 2014; Schultz, McClain, &
Thomas, 2003; Staats & Gino, 2012). In an extensive review of the breaks literature, Jett and George (2003:
500) suggest that the benefits associated with breaks are likely best found by examining employees’
responses to breaks more holistically: “Although taking breaks from a task does not, on the surface, appear
to contribute to a person’s immediate progress, breaks can be beneficial to a person’s well-being,
satisfaction and effectiveness,” they write. In short, the breaks literature offers little hope for any direct and
immediate increases in productivity from breaks.
Building on this prior body of work, in this paper we disentangle the positive benefits of breaks
from their negative side effects. Specifically, we argue that certain characteristics of breaks can minimize
their downsides, and maximize their benefits. We consider three types of breaks: (1) traditional, expected
breaks; (2) unexpected breaks that are distracting; and (3) unexpected breaks during which a person
maintains focus. Traditional breaks are planned rest-periods. Unexpected breaks that involve a distraction
are unplanned pauses of unknown length during the work stream during which an employee must divert
attention from her primary work task (analogous to the various forms of distractions or interruptions
described in the operations literature). Unexpected breaks during which a person maintains focus are
unplanned pauses of unknown length in the work stream during which the employee is not required to
attend to anything outside the primary work task. We propose that unexpected breaks that maintain focus
have the potential to create organizational value by offering employees much-needed refreshment, but
without the negative post-break costs to productivity so typical of traditional breaks or those that involve
some sort of distraction.

The Microstructure of Work
3
We test our hypotheses using data from 212 harvester workers collected over the course of an entire
harvesting season (July through October). We leverage data from nearly 250,000 truckloads of fruit
harvested over the course of 9,832 distinct shifts, from over 800 unique fields, each ranging in size from
20–200 acres. This context is an ideal one to explore the productivity effects of breaks, for two main
reasons. First, because it offers a wealth of productivity data broken down by specific load, we can examine
the productivity of a worker on a micro basis. Second, the data provide detailed records of break instances—
both planned (and thus expected) and unexpected breaks, the latter taking two distinct forms (those that are
distracting to the worker and those that allow the worker to maintain attention on the work). Finally, fruit
harvesting is routine work—a domain in which productivity is critically important, but where the potential
gains in creativity and knowledge processing found in other examinations of the effects of breaks will have
little effect.
We evaluate the effects of two types of breaks (expected versus unexpected) and two distinct forms
of unexpected breaks and find that unexpected breaks can, under certain conditions, yield immediate post-
break performance increases. We provide a conceptual replication of these findings in the laboratory by
showing that unexpected breaks lead to increased performance when the break keeps people’s attention
focused on the task at hand.
This study makes four distinct contributions to the operations management literature. First, we
demonstrate one way in which breaks can lead to enhanced post-break productivity, showing that breaks
that are unexpected and that allow employees an opportunity to rest and rejuvenate, but not to disengage
cognitively, can yield marked post-break productivity increases—increases that can out-pace the downtime
associated with the break, up to a point. Second, we contribute to the growing body of work studying the
micro nature of work. Though much of the literature examining the effects of workload and breaks on
performance takes an aggregate view of performance—e.g., shift- or workday-level aggregated data (e.g.
Gans, Koole, & Mandelbaum, 2003; see also Tan & Netessine, 2014), our data allow us to examine the
immediate effects of unexpected breaks on productivity. Third, we identify the mechanism—attention—
through which breaks can positively impact performance. Finally, we provide insight into the fundamental

The Microstructure of Work
4
nature of breaks. The study of breaks in the operations literature is sparse, likely because breaks are seen
as a necessary evil—inevitable but nonproductive. Work on the topic has explored how breaks interrupt
standard workflows and are thus distracting (Froehle & White, 2014; Wang, Gurvich, O’Leary, Mieghem,
& A, 2016). Our work, contributing to the growing body of research advocating a behavioral approach
within the operations literature (see Bendoly, Donohue, & Schultz, 2006 for a review; also see Gino &
Pisano, 2008), suggests that properly structured breaks can be more than merely a palliative experience but
can actually yield post-break improvements in performance.
2. The Costs and Benefits of Breaks
Breaks, particularly in physically demanding occupations such as those common in production and
manufacturing facilities, are ubiquitous and expected, both by workers and the law. Practitioners and
scholars alike have acknowledged the need for times of respite and physical replenishment to ensure
workers can keep up with physically demanding jobs and that fatigue doesn’t diminish their productivity
or lead to costly errors (Demerouti, Bakker, De Jonge, Janssen, & Schaufeli, 2001; Henning et al., 1989;
Roy, 1960; Schaufeli & Bakker, 2004). Breaks can provide mental stimulation when employees are
performing monotonous tasks (Fisher, 1993); more generally, breaks can yield indirect organizational
benefits by increasing employees’ emotional well-being when they use breaks as an opportunity to engage
in fulfilling and enjoyable activities (Csikszentmihalyi, 2000).
But, though breaks are often considered beneficial events, the relatively scant empirical work
demonstrating any positive effects of breaks on productivity has earned breaks the “interruption” label (Jett
& George, 2003). There is little empirical evidence to suggest that breaks can improve performance in most
domains (Jett & George, 2003). Breaks have been shown to yield increased creativity by providing time for
idea incubation—a process that occurs when the mind is idle and detached from otherwise mentally
strenuous activities (Elsbach & Hargadon, 2006)—and by allowing downtime opportunities for workers to
refine their ideas through informal interactions with others (e.g. Csikszentmihalyi & Sawyer, 1995;
Leonard-Barton & Swap, 1999). But in production environments, where performance is measured not by

The Microstructure of Work
5
the creativity of one’s ideas, but by the volume produced as a function of time, the empirical evidence
suggests that breaks are detrimental events. They are generally experienced as interruptions—which, when
experienced in the course of performing repetitive tasks, disrupt an employee’s functional working memory
(Froehle & White, 2014; Teyarachakul, Chand, & Ward, 2011). Jett and George (2003: 500) reconciled the
scant empirical evidence for the productivity benefits of breaks by suggesting that “breaks connote the
significance of time away from making progress on work activities as a natural and necessary part of
performing routine work.” They concluded that “taking breaks from a task does not, on the surface, appear
to contribute to a person’s immediate progress.” In short, breaks appear to be necessary evils: because they
require time away from production tasks, they don’t contribute to productivity; but they seem to forestall
prospectively worse performance outcomes by reducing errors and sustaining energy and engagement.
Workers experience breaks on two distinct levels, physical and cognitive. At the physical level,
employees disengage from their work activities and rest, or engage in other activities not related to the task
at hand—like eating or chatting with co-workers (e.g. Roy, 1960). At the cognitive level, workers
experience a break in one of two distinct ways. First, they may cognitively disengage from the work and
turn their thoughts and attention to other, unrelated activities (e.g., in the typical lunchroom, where
conversation turns to topics unrelated to work). Second, they may remain mentally engaged and focused on
the task at hand, despite taking a physical respite from work (e.g., a member of a sporting team sitting on
the sidelines during a play but remaining intently focused on the game).
The traditional form of break—those in which employees disengage both physically and
cognitively—involves an employee turning their attention to other concerns. This diversion of attention
seems, on the surface, innocuous, but is not without cost. When employees focus their attention on some
non-task-related activity or topic, they, by necessity, must cognitively disengage from the task at hand. The
increased mental focus on activities not related to the primary work task leads to a sort of cognitive
interference (Gillie & Broadbent, 1989) that detracts from the mind’s ability to guide the visuospatial
decisions and routines that are often so critically important in routine, but specialized, work (Froehle &
White, 2014; Jett & George, 2003; Wickens & Hollands, 2000). While these cognitive resources might not

The Microstructure of Work
6
seem relevant during a break—why should it matter if one’s mind is focused elsewhere, if the body is not
engaged in work?—there are switching costs associated with moving mentally from one set of activities to
another (Schultz et al., 2003). Importantly, these costs are not fleeting: depending upon the nature of the
cognitive shift, they can linger over many repeated iterations of even a familiar task (Staats & Gino, 2012).
The diversion of attention from work-related to leisure-related activities, so common in typical
production breaks, naturally leads to a switching cost when an employee restarts her work following a
break. The employee’s attention shifts, during the course of her break, to other considerations that consume
her mental memory. When ending her break, she has effectively lost the benefit of her working memory as
related to the task at hand, leading to a form of forgetting often studied in operations management (e.g.
Chiu, Chen, & Weng, 2003; Froehle & White, 2014; Smunt & Meredith, 2000; Teyarachakul et al., 2011).
Prior empirical research indirectly highlights the restart-related costs of breaks. For example, in a model of
outsourced radiologists’ productivity, Clark, Huckman, and Staats (2013) control for employee breaks and
find (from the negative coefficient) that tasks assigned immediately after a break are completed more slowly
than those not immediately preceded by a break.
Employees, though, can sometimes experience unexpected breaks at work. Production processes
are filled with interdependencies, and an upstream or downstream disruption can unexpectedly halt a focal
employee’s work for some period of time. A nuanced, but critically important, attribute of these unexpected
pauses in workflow is that, because they are unexpected, and their source is often external to the employee’s
specific task, their likely length can be unknown. Employees must, therefore, remain focused and ready for
the process to restart. These unexpected breaks, then, can yield the physical benefits of breaks while having
the potential to avoid the costs of cognitive interference and cognitive setups. Employees experience an
unexpected break as a period of refreshing and replenishment during which they remain focused and
attentive to the work process; when work restarts, they can operate at a more productive level than before
the break. We predict that unexpected breaks will have immediate net positive benefit on productivity, but
also acknowledge that the length of the break matters. Specifically, the longer the unexpected break, the
more difficult it will be for an employee to maintain focus and attention on the task at hand. Because the

The Microstructure of Work
7
break is effectively an idle state, the employee’s attention will begin to wane as time goes on, even as the
benefits of physical rejuvenation increase. Therefore, we propose:
Hypothesis 1: Unexpected breaks that do not require an employee’s active response have an inverted U-shaped relationship with post-break performance. Unexpected breaks in a production environment, though often caused by upstream or downstream
events, can sometimes be caused by breakdowns in an employee’s work area. When the breakdown occurs,
the employee experiences the physical respite of a break, but often must engage in coordination efforts
aimed at repairing the stalled process or broken equipment—that is, not the physical repair of the equipment,
but a mode of activity that is physically restful, but requires some coordination effort. The employee
experiences this form of unexpected break as what Rudolph and Repenning (2002) refer to as a “non-novel
interruption” that requires him to shift to an active mode of cognition (Louis & Sutton, 1991) and must
devote greater attention and strategic thinking to resolving the source of the unexpected event (Cook &
Woods, 1994).
This distinction leads us to a critical defining attribute of beneficial unexpected breaks: they are
possible when employees need not turn their attention or focus to other cognitively demanding activities
brought on by the unexpected break. These coordinating efforts cause the break to be experienced as a
distraction, leading to the sort of cognitive interference and cognitive setups inherent in planned or expected
breaks (Allport, Styles, & Hsieh, 1994; Schultz et al., 2003; Wylie & Allport, 2000). Thus, we predict that
unexpected breaks that involve the employee shifting her attention to strategic or action-oriented efforts
designed to resolve the issue have a negative relationship with performance. This form of pause in the flow
of work which involve a shift in attention, though also unexpected, is experienced as the “non-novel
interruption” described by Rudolph and Repenning, bringing along all the commensurate negative side-
effects associated with an interruption, including decreased post-break productivity.1
1 We do not intend to draw an artificial distinction between “interruptions” and “unexpected breaks that require an active response”; we, in fact, see them as one and the same. Our continued use of the term “unexpected break” when referring to these detrimental experiences is simply a device enacted to focus attention on the dual nature of breaks, and to demonstrate how nuanced differences in the cognitive experience during an otherwise physically restful period can lead to differences in post-break performance outcomes.

The Microstructure of Work
8
Hypothesis 2: Unexpected breaks that require an active response from the employee are negatively associated with post-break performance. The relationships described above are a direct reflection of the employee attention. The important
defining characteristic distinguishing between unexpected breaks that yield positive performance outcomes,
and unexpected breaks that don’t (interruptions) is whether the employee’s attention must, or is allowed to,
shift away from the primary work task. As attention wanes, employees suffer the performance costs
associated with switching back into task-mode when the physical break ends (Schultz et al., 2003; Wylie
& Allport, 2000). Thus, we hypothesize the following mechanism and test it directly in our studies:
Hypothesis 3: Attention to the primary work task mediates the relationship between unexpected breaks and post-break performance. The distinct benefit associated with breaks, particularly in production environments, is physical.
The replenishment comes from the opportunity to disengage from the often repetitive and generally
exhausting physical production activity for a period of time (Demerouti et al., 2001; Henning et al., 1989).
The benefits associated with this physical respite are likely to be more pronounced with increased workload.
Breaks—within a workday, and between work shifts—are, ostensibly, planned events directed at staving
off the detrimental effects of fatigue and burnout. As an employee’s time at work increases over the course
of a specific shift, or as the number of consecutive days that an employee has worked without a day off
increases, her overall level of fatigue and exhaustion increases. This increased fatigue is costly; extended
periods of intense work causes dramatic erosions in productivity (Homer, 1985; Thomas, 1992) in domains
including service (Oliva & Sterman, 2001), construction (Setyawati, 1995), and medical care (Powell,
Savin, & Savva, 2012).
The greater the workload, operationalized by longer periods of time working without a rest day,
the greater the level of fatigue that an employee is likely to experience, and, consequently, the more
refreshing and physically beneficial an unexpected break is likely to be. That is, the rejuvenating benefits
of a break will be most pronounced for those who are most extremely fatigued. Thus, we expect that
workload—operationalized as the number of days an employee has worked without a day off—will

The Microstructure of Work
9
moderate the relationship between unexpected breaks and post-break performance, such that with higher
workload, unexpected breaks yield a greater increase in post-break performance.
Hypothesis 4: Workload positively moderates the relationship between unexpected breaks that do not require an employee’s active response and post-break performance.
Increased workload also exacerbates the costs of unexpected breaks that require an active response
from the employee. Increased workload, as we have suggested, leads to fatigue. Fatigue is not only
physically depleting, but also cognitively taxing (Baumeister, Bratslavsky, Muraven, & Tice, 1998; Dai,
Milkman, Hofmann, & Staats, 2015; Hagger, Wood, Stiff, & Chatzisarantis, 2010; Muraven, Tice, &
Baumeister, 1998). Hypothesis 2 argues that unexpected breaks requiring an active response from the
employee lead to lower post-break performance due to the cognitive setup associated with restarting the
focal task when the break comes to an end. These cognitive setups, post-break, place a load on cognitive
resources—resources that, when scarce (e.g., because an employee is fatigued and depleted), people are
motivated to conserve (Muraven, Shmueli, & Burkley, 2006). Consequently, we expect that with increased
workload—operationalized as time worked within a shift, or consecutive days worked without a day off—
restarts after unexpected breaks, requiring an active response to be increasingly slower and leading to more
extreme decreases in post-break performance.
Hypothesis 5: Workload negatively moderates the relationship between unexpected breaks requiring an employee’s active response and post-break decreases in performance.
3. Data and Empirical Strategy
We test our hypotheses with a field study and two laboratory studies, which serve as conceptual replications.
Our field study allows us to test our primary performance hypotheses, and our two laboratory studies allow
us to replicate our field findings while also providing support for the hypothesized mechanism (Hypothesis
3).
3.1. Field Study

The Microstructure of Work
10
3.1.1. Setting. Our field study leverages tomato-harvester productivity and data on breaks from a
California-based vertically integrated agribusiness company. The supply chain includes tomato farming,
harvesting, trucking, and processing, as shown in Figure 1. The organization’s final products are generally
tomato products in industrial packaging (e.g., tomato paste in a 55-gallon drum).
The tomato fields harvested by the organization are spread across California and generally owned
by farmers unaffiliated with the company. The harvesting company acts as a service provider to farmers
and performs farming, cultivating, and harvesting operations counter-cyclically over the course of the year.
Fields vary in size from as few as 20 acres to more than 200 acres. Tomatoes are harvested during the
summer months, generally from early July to mid-October. During the rest of the year, fields are farmed
and cultivated. The growing season begins in February and usually ends when harvesting is complete
(October), with earlier-planted tomatoes harvested in July and later-planted tomatoes harvested in October.
Harvesting employees are paid a fixed hourly wage with no incentive compensation.
--------------------------------------------- Figure 1 about here
---------------------------------------------
The harvesting operation, due to harvester-level productivity information and high labor
involvement, provides an ideal setting to test our hypotheses. Below, we describe the harvesting process in
greater detail.
Harvesting Process. A tomato harvester (right side of Figure 2) is operated by a driver (worker) who
navigates the equipment down a row of tomatoes in a field. An oscillating clipper at the nose of the harvester
shears the plant from the root at ground level. An elevator belt lifts the plant (vine, leaf and fruit) into the
interior of the harvester. Inside the harvester, a shaker separates the tomato from the plant. Tomatoes are
transported by small conveyor belts to be sorted, while vines and leaves are chopped and disgorged into the
field. Mechanical sorters separate acceptable fruit (by color) from dirt clods, remaining vines, and
unacceptable tomatoes; this reject stream is also discharged into the field. An elevator deposits acceptable
tomatoes into a tomato trailer towed by a tractor (left side of Figure 2) which, when filled, will be left in an

The Microstructure of Work
11
open space adjacent to the field, awaiting pickup by the trucking company, which will deliver the full load
to the processing factory.
--------------------------------------------- Figure 2 about here
--------------------------------------------- Trucking. The organization’s affiliate trucking company delivers empty trailers (left side of Figure 2) to
fields and transports filled trailers to the organization’s processing facilities. The computer software
employed by the company automatically dispatches empty trailers to fields using an algorithm that
incorporates harvest rate, travel time, and acres left to harvest and adjusts for uncertain events such as
weather, traffic, road construction, and other events. The typical routine of a tomato trucker involves
receiving a computer-generated dispatch from the dispatch office, then departing to the specified field with
an empty set of trailers. Once at the field, the trucker drops the empty set of trailers in a designated area,
hooks onto the waiting full set of trailers, and drives these trailers to the processing facility. Before the
tomatoes are sent to the processing facility, field and worker information are recorded to the company server
using a GPS communication device.
Worker schedule. The harvesting process is carried out around the clock with scheduled 12-hour shifts.
Most of the shifts start at 2 a.m. or 2 p.m. and end at 2 p.m. or 2 a.m., respectively. Each harvester is
assigned (at the beginning of the harvest season) a fixed shift start and end time. Shift start and end times
are staggered so that multiple harvesters paused for shift change at the same time do not disrupt the flow of
tomatoes to the factory. Workers are not given a choice of which field to work in from day to day. The
organization uses an in-house-developed software system to assign harvesters (and corresponding workers)
to a specific field. Fields are assigned based on their size and geographical proximity to current harvester
location.
Expected breaks. During the course of a shift, workers pause the production process with their scheduled
breaks. Typically, workers have two short scheduled breaks, as well as a scheduled lunch and periods of
cleaning, which involve the worker cleaning the harvester blades and mechanical sorters. Since they are
scheduled, these breaks are expected.

The Microstructure of Work
12
Unexpected breaks. We examine two types of unexpected breaks in our data. The first is a trailer wait-
induced break. The absence of an unfilled trailer adjacent to the harvester at the time the worker completes
a previously filled trailer leads to a delay in the production process. This absence is caused by some delay
on the part of the trucking operation (e.g., road conditions, detours, or traffic that cause trucks to take longer
than expected to arrive at the field) and is generally unavoidable for the harvesting driver. No harvesting
output is realized during these trailer delays, and workers generally remain in an idle state during them,
with their harvesting equipment ready to recommence work as soon as a trailer arrives. These trailer waits
are unanticipated, and workers generally do not know how long they will last. They are expected to remain
in an at-the-ready state; consequently, they are not likely to be distracted or to divert their focus from the
work unless the trailer wait is extensive. We expect this form of break, one that is unexpected, but does not
require an active response, to, consistent with Hypothesis 1, yield increases in post-break productivity, at
least initially.
The second type of unexpected break that we observe in our data is a harvester breakdown.
Importantly, harvester breakdowns are internal to the harvesting driver’s work process; when a harvester
breaks down, the harvester driver is expected to quickly identify the source of the breakdown (to the extent
possible) and conduct a strategic assessment of the issue. Breakdowns can occur for various reasons, and
the harvester driver is responsible for coordinating the corrective action. Corrective action always includes
an assessment and attempt to determine the nature and source of the breakdown, as well as radioing for a
mechanic and communicating the issue to the mechanic. Once a mechanic arrives, the harvester driver
provides assistance if necessary, and otherwise remains with the harvesting equipment while the mechanic
makes the necessary repairs. The harvester driver cannot recommence harvesting until the repair is
completed. Though harvester breakdowns are also unanticipated, because they require, at the minimum, a
strategic assessment and coordination on the part of the harvester driver, and might even require the driver
to assist the mechanic, these breaks are experienced as requiring an active response. Practically speaking,
though this type of unexpected break is similar to trailer waits, in that both represent a sort of process or
operational failure, this type of break is experienced in much the same way as an interruption, as classically

The Microstructure of Work
13
described in the operations literature (Froehle & White, 2014; Gillie & Broadbent, 1989; Jett & George,
2003). This form of unexpected break forces the harvester driver to divert his attention to the identification
of the technical problem and then to reaching the mechanic and engaging in conversation aimed at resolving
the problem. Hence, consistent with Hypothesis 2, and with prior research exploring the effects of
interruptions and distractions on work productivity, we expect unanticipated breaks caused by harvester
breakdowns to yield decreases in post-break productivity.
3.1.2. Data. To test our hypotheses, we collected worker and load-level harvesting data for the entire harvest
season, spanning July 01, 2013 to October 18, 2013. These data include status information for each worker
over the duration of each shift, as well as load harvest data, including begin and end time.
The raw data were available disaggregated from three different sources. The first is the downtime
information in a shift. These data included information on all the types of known and expected and
unexpected breaks a worker experiences in a shift. The second is the harvesting information in a shift. This
data had information on instances of harvesting load completion (the time point at which the current trailer
truck is filled with tomatoes). The third is worker shift information, which had worker ID, harvester ID,
and shift start and end time. We merged all three datasets; the total number of records was 244,456, spread
across 212 workers, 9,832 shifts, and 829 fields from July 01, 2013 to October 18, 2013.
For illustrative purposes, we show the event-by-event aggregated record for a worker whose shift
began on September 30, 2013 at 2 a.m. and ended on the same day at 12:26 p.m. in Figure 3.
--------------------------------------------- Figure 3 about here
---------------------------------------------
After starting work at 2 a.m., the worker finished harvesting the first load, S1 (24.53 tons), at 3:52 a.m.
(time spent – 112 minutes). The worker began harvesting a second load of the shift immediately after
completing the first, indicating that an empty trailer was ready as soon as the first load was completed.
Break 1 and Break 2 (both scheduled) occurred between 5:07 a.m. to 5:27 a.m. (20 minutes) and 10:13 a.m.
to 10:29 a.m. (16 minutes), respectively. A scheduled lunch occurred between 7:00 a.m. to 7:31 a.m. (31
minutes). Cleaning took place between 7:32 a.m. and 7:58 a.m. (26 minutes). At 8:33 a.m., the harvester,

The Microstructure of Work
14
upon completing a fourth load of the shift, did not have an empty trailer to load, and consequently
experienced 11 minutes of “trailer wait” from 8:33 a.m. to 8:44 a.m. Work proceeds when an empty trailer
arrives, with events captured as indicated in the figure.
We aggregate our event level dataset at the stage of harvest completion within each shift. For
example, the shift described in the Figure 3 will have six rows with the first row representing tomato tons
harvested as 24.53 tons, a harvesting time of 112 minutes, and other break variables set to 0. The second
row has a load of 23.99 tons harvested, a harvesting time of 68 minutes, and remaining break variables set
to 0. The third row includes 26.66 tons of tomatoes harvested, a break time of 20 minutes, harvesting time
of 76 minutes, and other break variables set to 0, etc.
After aggregating the complete merged data at the stage of harvest completion for all shifts, our
final dataset includes 117,756 distinct records, including data for 212 workers who worked collectively a
total of 9,832 shifts, and harvesting in 829 distinct fields from July 1, 2013 to October 18, 2013. We perform
all of our econometric analysis on this aggregated dataset. We believe that our data represents an appropriate
sample to study the impact of unexpected breaks on worker performance in that it possesses granular worker
and event-level data. This allows us to determine productivity following each event and for each individual
load, to control for unobserved factors, and to quantify and generalize the impact of specific event types for
any worker’s day.
3.1.3. Measures
Using the worker and field as the unit of analysis, we aim to understand how unexpected breaks impact
operational performance. We operationalize our dependent variable, Productivity (specifically, worker
productivity), as follows:
Productivity: We measure our dependent variable as the ratio of tomato tons harvested during the active
time spent on harvesting.
ProductivityTomatoTonsharvestedbetweentwosuccessiveharvestcompletions
Timespentonharvesting

The Microstructure of Work
15
For the shift described in Figure 3, productivity during the first and second load harvested is given by
13.14 tons/hour (24.53*60/112) and 21.16 tons/hour (23.99*60/68).
Many of the performance studies in service operations management, such as those that examine
task execution time (Kc & Staats, 2012; Narayanan et al., 2009) and length of stay in healthcare (Kc &
Terwiesch, 2011) consider a logarithmic transformation of the dependent variable, usually due to the
primary performance indicator’s skewed distribution. We do not take a natural log transform of our
dependent variable, for two reasons. First, as shown in the density plot (Figure 4), our dependent variable
has a fairly symmetric distribution. Second, though a natural log transformation helps capture any non-
linear relationship between dependent and independent variables, here we capture it using higher-order
power of independent variables.
--------------------------------------------- Figure 4 about here
---------------------------------------------
Our key independent variables for the analysis are provided below.
Trailer wait: Trailer wait, the first form of unexpected break, is defined as the amount of time (in hours)
that a harvester driver waits for the arrival of an empty trailer after harvesting the prior load. The plot in
Figure 5 shows that the distribution of positive values of trailer wait (in hours) is right skewed. We find
that workers on average experience a trailer wait in 38% of their shifts over the course of the harvest season.
All workers experience trailer waits. Hence our findings on the impact of unexpected break (trailer wait) is
generalizable to sample of workers in our data.
--------------------------------------------- Figure 5 about here
---------------------------------------------
Harvester downtime: Harvester downtime/repair time is the second form of unexpected break and is
defined as the amount of time (in hours) during which the harvester is idle due to mechanical malfunction.
The plot in Figure 6 shows the distribution of positive values of machine repair time (in hours) is right
skewed. We find that workers experience a harvester breakdown in 50% of their shifts over the course of

The Microstructure of Work
16
the harvest season. All workers experience harvester downtime. Hence our findings on the impact of
unexpected break (harvester downtime) is generalizable to sample of workers in our data.
--------------------------------------------- Figure 6 about here
---------------------------------------------
We have two approaches to evaluating the impact of unexpected breaks due to trailer wait and
harvester downtime on worker performance. The first approach is to use the direct measure of hours
available in the data. We follow this approach because it helps the researcher or operations manager
evaluate returns or loss to productivity for a unit increase in hours. The second approach is to use a derived
measure - proportion of downtime. For example, in reference to trailer wait, proportion is computed as ratio
of trailer wait to total time between successive harvest completions. We performed the analysis using
second approach as a robustness check and found the hypotheses are still supported.
Workload: Prior studies have shown that operational performance measures vary with workload (Berry
Jaeker & Tucker, 2016; Kc & Terwiesch, 2009; Tan & Netessine, 2014). Here we are interested not in the
workload within a shift,2 but rather in the workload across shifts. Therefore, we construct a variable
“Workload” at the level of shift and have two approaches to evaluate its impact on the dependent variable.
First, and as our primary method, we operationalize it as cumulative number of days a worker has worked
continuously. We use this approach because it helps us identify the marginal impact for an additional shift.
Second, we calculate the cumulative number of shift hours that a worker has worked since the worker’s last
day off. We also performed robustness checks using this second approach and found the hypotheses are
still supported. Hence, for our main results we define workload as the cumulative number of days a
harvester driver has worked continuously without a day off.
3.1.4. Control Variables
2We operationalized workload within a shift as cumulative shift hours until the event of each load completion for each shift. We then included the variable in the main econometric specification and found it to not be significant. Hence, we do not include it in the paper.

The Microstructure of Work
17
Cumulative tons: We operationalize experience by using the cumulative value of tomato tons harvested
by a worker from the start of the season (July 01, 2013) to the time of the focal record. We include both
linear and quadratic terms to control for the effect of experience.
Breaks: The amount of time (in hours) that a worker spent on expected breaks. Typically, each worker
takes two short breaks with-in a shift. We distinguish this in our data as Break1 and Break2.
Cleaning: The amount of time (in hours) that a worker spent cleaning the harvester. Typically, this activity
is carried out during the start or end of the shift.
Lunch: The amount of time (in hours) a worker spent on lunch. Typically, this activity is carried out
halfway through the shift.
Move: The amount of time (in hours) that a worker is not actively harvesting as the harvester is in transit
from one field to another is termed Field Move hours.
Worker indicator: Workers might possess innate skill in the harvesting process. Failing to control for
unobserved heterogeneity in the model will lead to biased and inconsistent estimates, so we control for this
time-invariant effect by including a worker fixed effect in the model.
--------------------------------------------- Insert Table 1 about here
---------------------------------------------
In Tables 1 and 2, we provide the summary statistics and correlation matrix of the dependent and
independent variables. Table 1 provides the summary statistics for Productivity, Harvesting time,
Cumulative tons and Workload using the complete 117,756 records. For the remaining break variables, we
provide a summary only for non-zero values, as there are many zeros in the data. The following are some
key insights that can be drawn from Table 1. An employee works a median of three consecutive days.
Median Harvesting time, Trailer wait, Repair, and Cleaning time spent between two successive harvest
completions are 28.9, 16.0, 40.0 and 19.2 minutes respectively. Prior to receiving the data and meeting with
management, we were made aware that the time allocated to scheduled Breaks (Break1 and Break2) and
Lunch are 15 and 30 minutes. From the data, we see that median time spent on Break 1, Break 2, and Lunch
from the data are 16.8, 16.2, and 34.2 minutes, which is close to planned.

The Microstructure of Work
18
--------------------------------------------- Insert Table 2 about here
---------------------------------------------
3.1.5. Data Generation Process. Our objective in this section is to specify and analyze the data generating
process of worker-harvester production under the influence of scheduled and unscheduled breaks. We first
employ a least squares model to examine the effects of a realized measure of unexpected breaks. We refer
to the data generating process below as “Base Specification” going forward.
Productivity β
β ∗ Trailer β ∗ Trailer_wait +
β ∗ Repair
β ∗ Traıler_waıt ∗ Workload +
β ∗ Repair ∗ Workload +
β ∗ Cumulative_Tons β ∗ Cumulative_Tons +
β ∗ Break1 β ∗ Break2 β ∗ Lunch +
β ∗ Cleaning β ∗ Move β ∗ Unknown ++
β ∗ Workload β ∗ Workload +
Worker +Field +
ϵ
i, j, trepresentworker, field, andnumberofloadsharvested
In addition to including breaks in the model, we include worker and field fixed effects to control for
unobserved heterogeneity. These fixed effects control for workers’ innate skill and qualities of the field
which prevent bias and inconsistency in the estimates of the existing variables in the model.
3.1.6. Addressing Censoring and Endogeneity – Two Stage approach. To examine the true effect of
trailer wait on worker performance, it is necessary to understand why trailer waits occur? What is the true
distribution of trailer wait if a worker does/does not experience the wait?
Controls
Unexpected breaks (Hours)
Moderators
Base Specification

The Microstructure of Work
19
We defined trailer wait as the difference between the time of prior load completion and the instant
of empty trailer arrival. We observed 110,502 observations (93.8% of total 117, 756) with trailer wait 0.
When a trailer arrives prior to needing to be used, our dataset does not record a negative value, but rather a
zero. Hence one can see that our variable for trailer wait is censored. An important question then is, how
do positive values of trailer wait occur?
To explore the question of trailer wait, we had multiple discussions with management to understand
the trailer dispatching process. We learned that the dispatching of trailers is an automated process that
follows an algorithm that incorporates the average time needed to fill each trailer, the number of acres left
to harvest, and the distance from the field to the factory. In additional discussions we learned that there are
two potential reasons for a positive realization of trailer wait. First, unexpected events may occur, such as
bad weather, traffic, or a slowdown at the plant (thus preventing the unloading of existing trailers) which
could potentially cause a worker to experience trailer wait.3 Second, the fixed capacity of trailers are
allocated based on the average time needed to fill the trailer. Under the capacity constraint of trailers in a
field, a worker could potentially experience wait if his pace of harvesting is sufficiently faster than the
expected processing time in order to use up the backlog of trailers. Because this is endogenous to the worker,
we address the problem through two-stage estimation approach accounting for both censoring and
endogeneity in trailer wait.
Given the comments above, we use an instrumental variables approach for trailer wait. For an
instrument to be valid, it needs to satisfy the relevance and exclusion restriction conditions (Wooldridge,
2010). For relevance, the instrument should be correlated with the endogenous variable (trailer wait) and
for exclusion, it should be uncorrelated with idiosyncratic error. Based on the description in the previous
paragraph, we could choose immediate prior Productivity as a relevant instrument for post trailer wait.
Though it satisfies the relevance condition, it does not meet the exclusion restriction as prior productivity
3Slowdowns could occur either because of a complete plant shutdown or because things were running slowly within the plant (e.g., a key machine broke down). We have data on complete plant shutdowns, but those occur very rarely (10 out of 9,832 worker shifts during the season or 0.1%). Slowdowns occur more often, but that is not coded in the company’s data.
The Microstructure of Work
20
could impact future productivity for the same task (Staats & Gino, 2012). Instead we choose three different
instruments. First, we use average productivity of the worker group (excluding the primary worker) during
a pre-specified time interval (1 hour) around the time instant of trailer wait realized by the primary worker.
For example, let us consider 3 workers W1, W2 and W3 harvesting in a specific field. W1 has completed a
previous load at 7:00AM and experienced a trailer wait for 10 minutes from 7:00AM – 7:10AM. For the 1
hour interval around 7:00AM (i.e. 6:00AM – 8:00AM), we select the productivity of all remaining workers
in the group realized during the interval and compute the average, , and use as the instrument for the 10
minutes of trailer wait realized for W1.
This variable is clearly relevant because all group members pull trailers from a common pull; if the
two group members work faster than the focal individual, the focal individual is more likely to experience
a wait, despite their relative slower harvesting pace. For the exclusion restriction condition to be met, the
group productivity should not be correlated with primary worker productivity. Upon multiple discussions
with the management, we learned that first, workers are spread widely in fields (taking up tens to hundreds
of acres) making it difficult to observe each other’s harvesting process. Hence peer performance is unlikely
to affect primary worker productivity. Prior work examining peer effects notes that observability is a key
driver of productivity (Bandiera, Barankay, & Rasul, 2010; Mas & Moretti, 2009; Tan & Netessine, 2015),
and workers, in general, given our field setting, cannot easily observe other harvesters. Second, workers are
unlikely to discuss their performance after the shift. Finally, the organization did not implement pay for
performance incentives for higher performance during the 2013 harvest season—our period of study;
workers are paid based on the number of hours worked. Hence the performance of workers realized in the
data controlling for extraneous factors is due to their natural or inherent motivation and innate skill. Under
these conditions, we can reasonably argue the exclusion restriction condition that group productivity is not
be correlated with primary worker productivity is met.
We include two other sets of instruments, as well: (1) hour of day and (2) day of week. These
instruments are likely to impact trailer wait as different time of day and different days of the week will face
varying traffic conditions on the road, and will yield varying conditions (often labor or temperature related)

The Microstructure of Work
21
in the plant—features which can lead to incidences of trailer wait. These variables should not impact worker
productivity directly, once we control for other factors in our models such as consecutive days worked and
prior harvesting experience..
Hence in the first stage we model censored trailer wait as a function of immediate prior production
process (productivity), group productivity (instrument), hour of the day, day of the week and field fixed
effects. Field fixed effects control for the distance of the field from the trailer dispatching facility. The key
identifying assumption in our model is the use of group productivity, hour of day and day of week as
instruments. We do not include group productivity, hour of day and day of week in our second stage as they
do not affect worker productivity except through the indirect effect on trailer wait.
The first stage is modeled as the Tobit4 specification given below. We refer to it as Stage 1.
log 1 Trailer_waitlog 1 Trailer_wait∗ , Trailer_wait∗ 0
0, Trailer_wait∗ 0
log 1 Trailer ∗
α α ∗ Productivity α ∗ GroupProductivity h d Field ϑ
Trailer ∗ islatent unobserved trailerwaitandi, j, k, l, trepresentworker, field, houroftheday,
dayoftheweek andnumberofloadsharvested, respectively.
In the second stage, we aim to explain Productivity using estimated trailer wait from the first stage
and all relevant independent, control variables. We choose a linear specification as shown below:
Productivity β
β ∗ Traıler_waıt β ∗ Traıler_waıt +
β ∗ Repair
β ∗ Traıler_waıt ∗ Workload +
4We tested first stage (Tobit) with an alternative specification - a combination of two models. With the same set of independent variable, first, we used a linear probability model (or logit, probit) to estimate the probability of a worker experiencing trailer wait. Second, OLS, with dependent variable as positive values of trailer wait. The predicted trailer wait is computed by the product of estimated values in two models. The direction and significance of estimates are aligned with the Tobit results.
Stage 1
Unexpected breaks (Hours)
Moderators

The Microstructure of Work
22
β ∗ Repair ∗ Workload +
β ∗ Cumulative_Tons β ∗ Cumulative_Tons +
β ∗ Break1 β ∗ Break2 β ∗ Lunch +
β ∗ Cleaning β ∗ Move β ∗ Unknown ++
β ∗ Workload β ∗ Workload +
Worker +Field +
ϵ
i, j, trepresentworker, field, andnumberofloadsharvested
Traıler_waıt representsthepredictedTrailerwaitfromStage1
3.1.7. Results.
In Table 3, we first summarize the results from the OLS model, given by the Base Specification,
with no correction for endogeneity. We find a positive and negative coefficient for the linear and quadratic
terms of Trailer wait displaying an inverted U-shaped relationship with Productivity, consistent with our
Hypothesis 1. The coefficient of the linear term of Repair is negative and significant, implying a negative
impact on Productivity, consistent with our Hypothesis 2. Similar to Trailer wait, we find that Workload
has an inverted U-shaped relationship with Productivity, consistent with the literature (Tan & Netessine,
2014). The coefficient on the interaction of workload and trailer wait has the predicted sign, however it is
not statistically significant, thus not providing support for Hypothesis 4. The coefficient of the interaction
for workload and repair is positive and statistically significant, thus providing support for Hypothesis 5 that
workload increases the negative effect of unexpected breaks that divert workers’ attention.
--------------------------------------------- Insert Table 3 about here
---------------------------------------------
We next incorporate endogeneity and implement a two-stage approach to evaluate the impact of
unexpected breaks on productivity. In Table 4, we summarize the results from the first-stage Tobit
Stage 2
Controls

The Microstructure of Work
23
Regression model given by Stage 1. In Model 1, we explain Trailer wait for the primary worker during the
current load completion using Productivity of his immediate prior load completion, hour of the day, day of
the week and field fixed effects. In Model 2 and 3, we include group productivity and hour of the day, day
of the week individually. In all the models, first, we find the coefficient of prior productivity to be positive
and significant. This implies that if the harvester works faster while harvesting a load, he is likely to
experience a trailer wait immediately after harvest completion. Second, we find the coefficient of group
productivity5 to be positive and statistically significant. This implies that if a worker group works faster
while harvesting a load, primary worker is likely to face trailer wait. Hence providing support for the
relevance condition. We predict trailer wait using Model 3 and utilize it as an input to the second-stage
regression given by Stage 2.
--------------------------------------------- Insert Table 4 about here
---------------------------------------------
In Table 5, we summarize the results from the second-stage regression model given by the equation
Stage 2. In Model 1, we include only the control variables Move, Break1, Lunch, Break2, Cleaning, and
the linear and quadratic term of Cumulative Tons representing the individual learning of the worker. We
explain Productivity between two successive load completions by the control variables. In Model 2, we
include the linear and quadratic terms of estimated Trailer wait (Est. Trailer wait) and observe an inverted
U-shaped relationship with Productivity, supporting our Hypothesis 1.6 In Model 3, we add the linear term
of Repair and find the coefficient to be negative and statistically significant, implying a negative impact on
Productivity, supporting Hypothesis 2. In Model 4, we add the linear and quadratic term of Workload,
which is the cumulative number of shifts a worker worked continuously. We find that Workload has an
inverted U-shaped relationship with Productivity, consistent with the literature (Tan & Netessine, 2014).
Having controlled for Workload, we include the interaction of Est. Trailer wait and Workload. We find the
5 Results provided in Table 4 are for average productivity of the worker group during +/- one hour around the time instant of trailer wait realized by the primary worker. We ran the analysis for 2 hour, 3 hour interval and found the results directionally and statistically significant. 6 We test for the robustness of the inverted U shape curve in more detail in the Robustness Check section

The Microstructure of Work
24
coefficient of the interaction is negative and not significant, providing no support for our Hypothesis 4. In
Model 5, we then include the interaction of Repair and Workload. We find moderate support for Hypothesis
5 as the coefficient of the interaction is negative and statistically significant at p < .10.
--------------------------------------------- Insert Table 5 about here
---------------------------------------------
All the standard errors in Table 3, 4 and 5 are corrected for heteroscedasticity-consistent standard errors
to account for heterogenous variation by worker and field.
Based on the numerical values in Model 5 of Table 5, we provide the percentage improvement or
decline in productivity for each of the unexpected and expected breaks. First, related to unexpected breaks,
ceteris paribus, if the current level of trailer wait is five minutes, we find that productivity improves by
12.81% as compared to its average value for an additional five-minute increase in trailer wait. Similarly, if
the current level of trailer wait is 15 minutes, we find that productivity decreases by 0.69% as compared to
its average value for an additional five-minute increase in trailer wait. Productivity decreases by 0.32%
compared to its average value for a five-minute increase in repair time. Related to expected breaks,
productivity decreases by 1.64%, 2.04%, and 1.38% as compared to its average value for an additional five-
minute increase in Break1, Break2, and Lunch.
3.1.8 Robustness Checks.
To examine an inverted U-shaped relationship between an independent variable and the response
variable, most research adds linear and quadratic term of the independent variable. If the coefficients of
both the linear and quadratic terms are significant and of the opposite sign, then the researcher claims the
existence of a U-shaped relationship. However, Lind and Mehlum (2010) argue that the above criterion is
weak for claiming nonlinear relationships and propose a more rigorous test. We run this test for the Base
specification (OLS model with no correction for endogeneity) and the Stage 2 specification (OLS model
corrected for endogeneity) individually. The results for each are provided in Tables 6 and 7.

The Microstructure of Work
25
In Table 6, we display one-sided t-tests for the slopes of actual trailer wait at minimum, maximum
value and 1 and 2 standard deviation around the stationary point. We find the p-values for slopes below
the stationary point are statistically significant and not beyond.
--------------------------------------------- Table 6 about here
---------------------------------------------
Similarly, in Table 7, we display one-sided t-tests for the slopes of Estimated trailer wait at minimum,
maximum value and 1 and 2 standard deviation around the stationary point. We find the p-values for
slopes below the stationary point are statistically significant, but they are not beyond.
--------------------------------------------- Table 7 about here
--------------------------------------------- 3.1.9. Discussion
Our field study provides externally valid support for our key hypotheses. Specifically, we found
that unexpected breaks that do not require a worker to focus on another task (i.e., trailer wait) are beneficial
for performance, at least initially (Hypothesis 1). The evidence for an inverted U-shape is more muddled.
Our findings strongly support the idea that unexpected breaks can lead to productivity improvement.
However, the results suggest that we may not see the negative portion of the inverted U. Although we would
still expect it to occur theoretically, in practice, it appears that our data do not have a sufficient number of
long trailer waits for this to occur. Future work will be required to support this portion of the proposed
curve, although it seems unlikely that an extremely long trailer wait (e.g., one hour) would function
differently from an equally long other type of expected break. The primary contribution of this paper comes
in identifying the positive returns of small, unexpected breaks.
Considering our other hypotheses, we do not find that workload positively moderates the
relationship between unexpected breaks and productivity (Hypothesis 4). We did find that unexpected
breaks that require an active response from the employee are negatively associated with post-break
performance (Hypothesis 2), and we find moderate statistical support for the moderating effect of workload
(Hypothesis 5). It is possible that this weak evidence of a moderating effect is the product of the unique

The Microstructure of Work
26
field environment. We used consecutive days worked as a proxy for workload, but in conversation with
employees from the partner company, we heard many anecdotal accounts of the “grind” of the season; many
employees suggested that the nonstop nature of the harvesting season leaves employees feeling extremely
exhausted from very early in the season, and days off provide only minimal rejuvenation. In short, it is
possible that there is only minimal variance in experienced exhaustion for the average employee in this
context, and that in more typical contexts we would observe the expected moderating effect. We hope that
future empirical work will explore these hypothesized relationships in greater depth.
Though our field study provides support for our hypotheses regarding the relationship between
unexpected breaks and post-break performance (Hypotheses 1 and 2), without mechanism data, we cannot
directly test Hypothesis 3, which suggested that attention to the primary work explains the relationship
between unexpected breaks and post-break performance. Thus, we turn to the controlled environment of
the laboratory to test this hypothesis.
3.2. Lab Studies
3.2.1. Study 2
We suggested that individuals who experience an expected break would be more likely to divert
their minds during the break rather than staying focused on their work as compared to those who experience
an unexpected break (whose minds stay focused on the current task). As a result, we predicted that
performance after a break would be higher when the break is unexpected rather than expected. To test these
hypotheses using a causal design, we conducted a laboratory study in which participants completed a task
under time pressure over multiple rounds and experienced a break (framed to them differently depending
on the condition to which they had been randomly assigned) during completion of the task. To measure our
proposed mediators, we included self-reported measures for alertness (to address the idea that breaks can
interrupt one’s focus on the work) and mind wandering (to address the idea that people get distracted and
start thinking about something else).
3.2.1.1. Data & Methods
The Microstructure of Work
27
Participants. Three hundred thirty-seven U.S.-based participants recruited from Amazon’s Mechanical
Turk (an online platform where contingent workers are hired to work on short projects or tasks)
(Mage=34.15, SD=7.20, 61% male) participated in the study in exchange for a $2 payment. We calculated
our sample size based on an estimate of an effect size of d=.3, requiring a sample size of approximately 350
participants for a study powered at 80%.
Procedure. Participants were told that the study would take no more than 10 minutes and would consist of
10 rounds of the same task. They also were told they would not be able to complete the study in less than
10 minutes (we set the computer program to automatically provide the study completion code right at the
10-minute mark, which meant participants could not close out the session before 10 minutes had elapsed).
Participants then read the task instructions, which told them they would have to look at a word puzzle (like
the one depicted in Figure 7) and count the number of times a particular letter of the alphabet appeared in
it. They were told they would complete ten rounds of this task and be under time pressure in each of the ten
rounds. Participants also were told that 10% of all participants (randomly selected) who provided accurate
answers in each round would receive a $5 bonus.
--------------------------------------------- Figure 7 about here
---------------------------------------------
In the expected-break condition, on the next screen, the instructions informed participants that, “As
mentioned, you will complete TEN ROUNDS of this task. NOTE THAT YOU WILL TAKE A
SCHEDULED BREAK AFTER COMPLETING FIVE ROUNDS OF THE TASK. When ready to start,
select the button below and then click on >>.” In the unexpected-break condition, the instructions instead
read, “As mentioned, you will complete TEN ROUNDS of this task. When ready to start, select the button
below and then click on >>.”
Next, participants moved on to the counting task. In each round of this task, they had 40 seconds
to count the number of times a certain letter of the alphabet appeared in the image of the word puzzle they
saw on the screen and report the number. After the first five rounds, we varied what we told participants.
In the expected-break condition, the instructions on the screen indicated, “You have now completed FIVE

The Microstructure of Work
28
rounds of the task. You can now take a break for a couple of minutes. After the break, you will move to the
next screen automatically. You will then move onto the other rounds of the task.”
In the unexpected-break condition, participants saw a “spinning wheel” and text stating, “Please
wait until the next puzzle gets uploaded. This may take a couple of minutes. Please remain ready to continue
as soon as the upload completes.” After two minutes, a new screen appeared asking participants to answer
a few questions about their feelings and experiences to this point in the study before moving onto the next
five rounds of the counting task. We asked them to indicate their agreement with different statements (on a
7-point Likert scale ranging from 1 = strongly disagree, to 7 = strongly agree), which we used to assess
alertness and mind wandering.
After answering these measures, participants completed the remaining five rounds of the counting
task and then answered a few demographic questions about their age and gender.
3.2.1.2. Measures
Alertness and mind wandering. We used five items to measure alertness: (1) I feel re-energized, (2) I feel
full of energy, (3) I feel fully alert,�(4) I feel focused, and (5) I feel attentive. We averaged participants’
answers across these five items to create a measure of alertness (α = .93). To assess mind wandering, we
asked participants to indicate their agreement regarding how they felt after the first five rounds of the
counting task: 1) I let my mind wander, 2) I did not pay full attention to what was going on in this study, 3)
I was not focused on the task at hand, and 4) I thought of something other than this study. We averaged
participants’ answers across these items to create a measure of mind wandering (α = .91).
Dependent measure. As our main dependent measure, we computed participants’ performance by using
the sum of correct answers across rounds in the counting task both before and after the break. Higher
numbers indicate better levels of performance on the counting task. We also computed the difference
between performance after the break and before the break and used this as a measure indicating performance
improvement after the break.
3.2.1.3. Results
Table 7 shows the descriptive statistics of the variables captured in Study 2 by condition.

The Microstructure of Work
29
Alertness and mind wandering. A factor analysis on the items used to assess alertness and mind
wandering confirmed that they loaded onto two distinct factors, indicating that the two measures capture
distinct constructs, despite being negatively correlated (r = -.48, p < .001). Consistent with our predictions,
participants who experienced the unexpected break reported being more alert and engaged in lower levels
of mind wandering as compared to participants who experienced the expected break, t(335) = 4.06, p < .001
and t(335) = -3.09, p = .002, respectively.
Performance after the break. Participants who experienced the unexpected break performed better on the
counting task as compared to those who experienced the expected break, t(335) = 4.48, p < .001.
Performance, however, did not significantly differ before the break, t(335) = .39, p = .70. Consistent with
these results, performance after the break was higher in the unexpected-break condition than in the
expected-break condition, when controlling for performance before the break, F(1, 334) = 25.74, p < .001,
η2p = .072. Similarly, improvement after the break differed between the two conditions, t(335) = 3.71, p <
.001.
Mediation analyses. We predicted that alertness and mind wandering would explain why an unexpected
break leads to an increase in task performance after the break. We tested whether alertness and mind
wandering mediated the relationship between our break conditions and task performance, using the
bootstrapping approach outlined by Preacher and Hayes (2004). Based on bootstrapping (with 10,000
iterations), we estimated the direct and indirect effects of the break manipulation via alertness and mind
wandering on our dependent variable, performance after the break on the counting task (while controlling
for participants’ performance before the break). Our manipulation had a significant effect on both alertness
and mind wandering (as shown by the analyses above). In turn, alertness (B = .10, S.E. = .05, p = .042), but
not mind wandering (B = -.03, S.E. = .04, p = .41), significantly affected performance after the break. The
effect of our manipulation was reduced (from B = .57, S.E. = .11, p < .001 to B = .49, S.E. = .11, p < .001)
when the two possible mediators were included in the equation. The 95 percent bias-corrected confidence
interval for the size of the indirect effect of alertness excluded zero (.005, .141), suggesting that alertness
mediated the link between the break condition and greater accuracy. The 95 percent bias-corrected
The Microstructure of Work
30
confidence interval for the size of the indirect effect of mind wandering included zero (-.015, .070),
confirming that mind wandering did not mediate the relationship between unexpected break and increased
performance after the break. We obtained the same results when using performance improvement after the
break as our dependent measure in the mediation analyses.
--------------------------------------------- Table 6 about here
---------------------------------------------
3.2.1.4. Discussion
The results of Study 2 show that, consistent with our predictions, individuals who experience an
unexpected break perform at higher levels after the break than those who experience an expected break.
This is because, our results show, people stay on standby when the break is unexpected, and their attention
is more likely to stay focused on the task at hand. Importantly, the results of our field study show that
performance following unexpected breaks improved, while performance following unexpected breaks
requiring an active employee response decreased. Though the pattern here is similar (post-break
performance was higher in the unexpected condition than in the expected condition), this difference, in the
lab, is the product of a performance decrease following expected breaks, but no change in performance
following unexpected breaks. We might expect this pattern given that the performance benefits are found
in the rest following prolonged periods of physically exhausting labor—and participants in our lab study
were unlikely to be exhausted over the course of the study. But, importantly, when the break was expected
and participants shifted their attention, performance decreased, providing support for our mechanism, albeit
without the benefits of physical rejuvenation seen in our field context.
3.2.2. Study 3
To provide a conceptual replication of the results of Study 2, we conducted another study using a
different task that allowed us to measure performance in terms of the effort participants put into completing
the task.
3.2.2.1. Data & Methods

The Microstructure of Work
31
Participants and design. One hundred ninety-one U.S.-based participants on Amazon MTurk (Mage=34.08,
SD=7.56, 47% male) participated in the study for a $4 payment. We calculated our sample size using an
estimate of an effect size d=.4 based on the results of Study 2, requiring a sample size of 200 participants
for a study powered at 80%. As in Study 2, participants were randomly assigned to one of two conditions:
expected-break condition and unexpected-break condition.
Procedure. We used the same procedure and measures as in Study 2, with two important differences: the
time it took participants to complete the study and the task they completed. In this study, the length was 25
minutes. As for the task, participants were asked to write short essays about a variety of topics. We told
them we were interested in their style and creativity in writing about various topics. We also told them they
would be given a title for the essay (chosen randomly from a list of titles we prepared), and asked to write
about the topic specified in the title for three minutes. We told them that, for instance, they might be given
the title “One thing you would change about the world,” “A book that has changed your life,” or “How you
and your best friend met.” Participants completed six essays and experienced the break after they completed
three essays. The titles of the essays used in the study were: (1) “Your favorite time with family,” (2) “One
thing you would change about the world,” (3) “An awkward social moment,” (4) “The hardest news you
had to deliver,” (5) “If you lived 100 years ago,” and (6) “If you had power, what you would do with it?”
We used the number of words participants wrote in their essays as our measure of performance, as
it signals the effort they put into the task.
We manipulated how the break was framed as in Study 2, changing only the language regarding
the number of rounds in the task participants would complete (given that the essay task consisted of six
rounds while the counting task used in Study 2 consisted of 10 rounds).
As in the case of Study 2, we created composite measures for both alertness (α = .90) and mind
wandering (α = .90).
3.2.2.2. Results
Table 8 shows the descriptive statistics of the variables captured in Study 3 by condition.
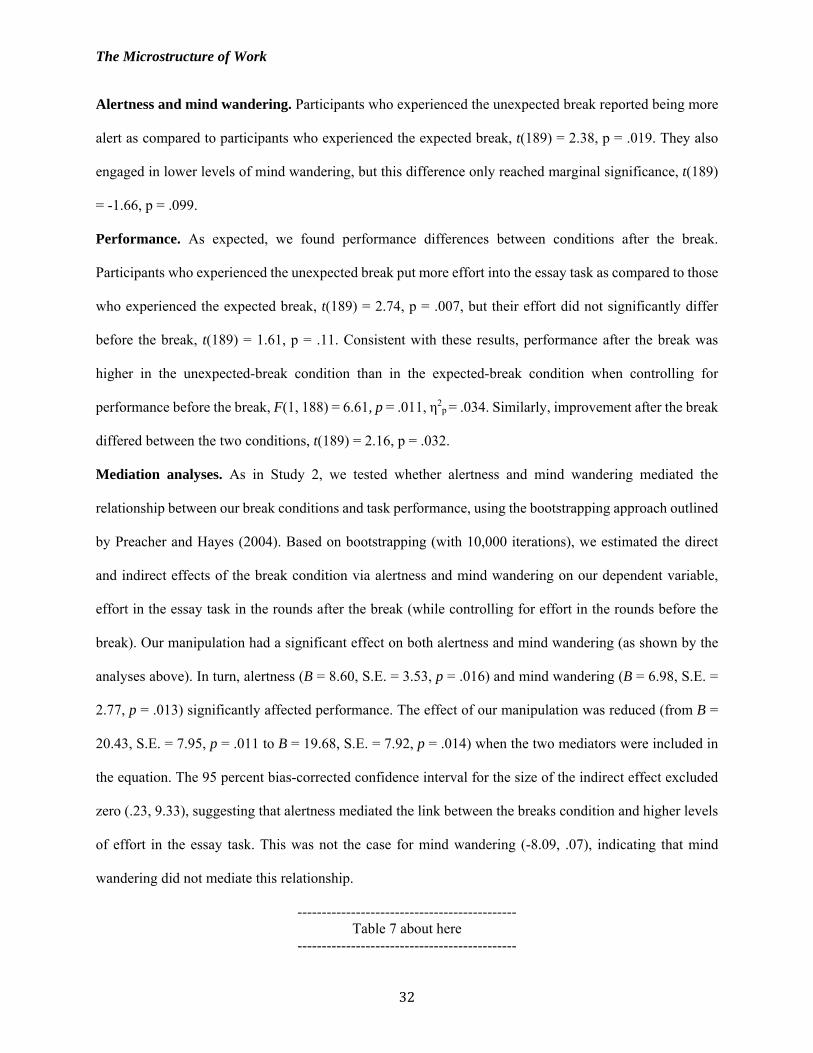
The Microstructure of Work
32
Alertness and mind wandering. Participants who experienced the unexpected break reported being more
alert as compared to participants who experienced the expected break, t(189) = 2.38, p = .019. They also
engaged in lower levels of mind wandering, but this difference only reached marginal significance, t(189)
= -1.66, p = .099.
Performance. As expected, we found performance differences between conditions after the break.
Participants who experienced the unexpected break put more effort into the essay task as compared to those
who experienced the expected break, t(189) = 2.74, p = .007, but their effort did not significantly differ
before the break, t(189) = 1.61, p = .11. Consistent with these results, performance after the break was
higher in the unexpected-break condition than in the expected-break condition when controlling for
performance before the break, F(1, 188) = 6.61, p = .011, η2p = .034. Similarly, improvement after the break
differed between the two conditions, t(189) = 2.16, p = .032.
Mediation analyses. As in Study 2, we tested whether alertness and mind wandering mediated the
relationship between our break conditions and task performance, using the bootstrapping approach outlined
by Preacher and Hayes (2004). Based on bootstrapping (with 10,000 iterations), we estimated the direct
and indirect effects of the break condition via alertness and mind wandering on our dependent variable,
effort in the essay task in the rounds after the break (while controlling for effort in the rounds before the
break). Our manipulation had a significant effect on both alertness and mind wandering (as shown by the
analyses above). In turn, alertness (B = 8.60, S.E. = 3.53, p = .016) and mind wandering (B = 6.98, S.E. =
2.77, p = .013) significantly affected performance. The effect of our manipulation was reduced (from B =
20.43, S.E. = 7.95, p = .011 to B = 19.68, S.E. = 7.92, p = .014) when the two mediators were included in
the equation. The 95 percent bias-corrected confidence interval for the size of the indirect effect excluded
zero (.23, 9.33), suggesting that alertness mediated the link between the breaks condition and higher levels
of effort in the essay task. This was not the case for mind wandering (-8.09, .07), indicating that mind
wandering did not mediate this relationship.
--------------------------------------------- Table 7 about here
---------------------------------------------

The Microstructure of Work
33
3.2.2.3. Discussion
The results of Study 3 provide further support for our main hypotheses, which predicted that performance
after a break would be higher when the break is unexpected rather than expected. This is because, we
hypothesized and found, individuals who experience an expected break are more likely to divert their minds
to something else during the break (thus becoming inattentive) than those who experience an unexpected
break (whose minds go on standby and stay focused on the task at hand). Again, as discussed in Study 2,
though participants did not experience the benefits of physical rejuvenation given the nature of the lab
context, they were subject to the detrimental effects (in the expected break condition) of shifting attention,
leading to the decreases in post-break performances that we observe.
4. Conclusion and Discussion In most operating environments, where performance is a reflection of the time spent performing the value-
creating activity, managers are conditioned to avoid downtime of any sort. Breaks are viewed as a necessary
evil. On the one hand, they stave off the unavoidable detrimental effects associated with performing
physically and cognitively exhausting work for long periods of time. On the other hand, employees on break
are not producing; time away from productive activity is considered to be lost. Consequently, breaks have
come to be seen in the operations literature as interruptions, particularly in production environments.
Our findings suggest that all breaks are not equal—that the nature of a specific break can lead to
increased post-break performance. Typical planned breaks, by their nature, allow employees to completely
disengage from their work, a state that brings physical respite and renewal, but also allows their attention
to turn to other, non-productivity-related concerns. We find that this shift in attention effectively mutes the
benefits we might expect from a break designed to provide rejuvenation to an exhausted employee. As
employees’ attention turns from production-related tasks, the short-term cognitive resources so crucial in
carrying out many visuospatial production-related tasks (like harvesting a field of tomatoes) are diverted to
whatever conversation or alternate activity occupies a worker’s mind during a break or lunch. When they

The Microstructure of Work
34
return to their work, rather than immediately carrying out the process smoothly, they incur a cognitive
restart cost.
By contrast, unexpected breaks—unplanned breaks of uncertain length— that do not require an
active response, provide a unique opportunity for the physical rejuvenation that employees need. When
breaks allow employees to physically disengage from the work task, but don’t involve them refocusing their
attention on other work-related or non-work-related concerns, employees are able to remain focused on the
process. This physical rejuvenation, combined with maintained attention, leads to post-break increases in
productivity; breaks that allow employees to maintain their focus on their work can actually lead to
improvements in performance immediately following the break.
These studies suggest that researchers—and practitioners—should think of breaks as a set of two
simultaneous experiences: physical disengagement from the work task and cognitive disengagement from
the work task. Our findings, taken together, provide evidence that an unexplored, but important, benefit of
breaks is found in providing opportunities for employees to engage in the former while avoiding the latter.
We find, in our field data, that unexpected breaks that do not require an active response, and thus permit
the worker to maintain focus, lead to increases in post-break productivity, but that the relationship has an
inverted-U shape, such that the benefits erode the longer the break. Further, when unexpected breaks
originate within a focal employee’s work domain and require that they devote attention to diagnosing a
breakdown and coordinating repair efforts, the positive post-break performance effect disappears; breaks
of this sort actually lead to post-break decreases in performance—a finding consistent with our theorizing.
Our lab studies provide evidence of our hypothesized mediator of this effect; when workers in our lab
studies allowed their attention to wander during a scheduled break, their post-break performance was worse
than those who maintained their focus because the break was unexpected (and the duration was unknown).
These findings should be immediately, and practically, applicable in operating environments; they
suggest that managers should find ways to introduce unexpected breaks—with uncertain, and varying,
lengths, and during which employees rest in place—into the production process. Further, managers should
take advantage of the prospective benefits brought on by various types of interruptions—those that, rightly,

The Microstructure of Work
35
they hope to avoid, but which nevertheless occasionally occur. When they do occur, organizational policies
might allow employees to maintain their current focus, with others who are not involved in the production
process taking charge of diagnosing or eliminating the source of the disruption. The appropriate allocation
of effort will depend on the context; for example, if the disruption generates learning, then front-line
involvement is likely worthwhile (Tucker, 2007, 2015). However, absent the potential to learn from a
disruption, a break may be most appropriate. Our research suggests disruptions of this sort might be
effectively turned into breaks—with positive post-break productivity benefits. In our field setting, simply
waiting in place seems to offer benefits, at least initially and so managers could try this simple intervention.
4.1 Limitations and Venues for Future Research
We expect that these results are generalizable to many production domains that require a meaningful level
of visuospatial coordination and in which overall productivity, at least in part, reflects an employee’s focus
and attention. But we hope this research will prompt additional empirical investigations exploring the
precise process characteristics that enable these post-break benefits. For example, we imagine benefits of
this sort might be realized in production craftworks (e.g. the manufacturing of semi-custom furniture or
custom residential fixtures). Further, past research suggests that these findings may not be generalizable to
all types of work. For example, past empirical findings have established the importance of mindless tasks
(a form of refocusing away from the task at hand) on enabling creative output (Elsbach & Hargadon, 2006).
It is likely that unexpected breaks that don’t allow or prompt a refocusing might have a detrimental effect
on workers engaged in creative tasks; we hope that future research will explore this possibility.
We also note that, in our field context, though we observe a negative effect on post-break
productivity following a harvester breakdown, we do not have data that allow us to examine or explore
spillover effects. That is, it is possible that the experience of diagnosing and coordinating the repair of a
harvester might enhance other skills not directly related to the primary task at hand, but which may prove
organizationally useful. For example, a harvester operator might come to better understand the technical
intricacies of the equipment in a way that improves repair speed (and reduces downtime) during future
similar experiences. These hypothetical downtime reductions might well offset the gains associated with

The Microstructure of Work
36
focus during the break—a counterfactual that we don’t observe in our data and thus cannot test. Future
research should manipulate employees’ requirements to refocus their attention on diagnosing and
coordinating the solution to the problem and measure the longer-term effects on future incidences of
downtime.
Finally, we do not find that workload moderates the positive relationship between unexpected
breaks that do not require an active employee response and post-break performance, and we find only
moderate statistical evidence of the moderating effect of workload on the negative relationship between
unexpected breaks that require an active employee response and post-break performance. As discussed, it
is possible that these findings are an artifact of the high energy non-stop work environment of our study—
an environment in which there is, perhaps, little practical variance in exhaustion levels as related to
workload. We hope that future research will delve more deeply into the moderating effects of workload on
the dual nature, and prospective benefits, of unexpected breaks.
Finally, though we do conceptually replicate the findings in the laboratory, our field data come
from a single site. We hope this research will prompt expanded interest in the dual nature of breaks,
unpacking the distinct nature of cognitive and physical breaks more completely, and will inspire other
archival and experimental investigations into this dual nature across various production contexts. This line
of study should also explore the optimal “mix” of breaks over the course of a work day; we find it highly
unlikely that employees can (or should) work indefinitely without cognitively disengaging—that is, we
don’t imagine work could be effectively designed such that all breaks allow for physical disengagement but
restrain cognitive disengagement. Indeed, on the aggregate, literature on burnout suggests that the
experience of burnout is not merely a physical phenomenon but also a reflection of mental exhaustion (e.g.
Demerouti et al., 2001; Homer, 1985; Maslach & Leiter, 2008; Schaufeli & Buunk, 2003). This suggests
that overweighting unexpected breaks might lead to longer-term detrimental effects; we hope future
research will explore this possibility in greater depth.
4.2 Conclusion

The Microstructure of Work
37
Finally, our work is a unique investigation into the micro-structure of work. We examine productivity not
at the aggregate level (e.g., work shift or day) but at the load level, and we examine the effects of various
forms of breaks on employees’ productivity on the load immediately following the event. Much research
on worker productivity and workday structure has examined productivity at an aggregate level—an
approach that risks missing the small instances that occur over the course of a workday, but which have
great potential to positively (or negatively) influence performance. By empirically examining the micro-
structure of work, we discover an important insight that, if examined on the aggregate, may have been
muted by the other, often detrimental events that regularly occur in a harvester’s workday. We hope this
work will prompt an increased interest in studying work, and the workday, at the event level (rather than
merely at the day level). We believe this evidence is a single example of the promise this mode of
investigation holds for better understanding the effect of moment-to-moment, hour-to-hour experiences on
employees’ performance, engagement, and overall perception of their work.

The Microstructure of Work
38
References Allport,D.A.,Styles,E.A.,&Hsieh,S.1994.Shiftingintentionalset:Exploringthedynamic
controloftasks.
Bandiera,O.,Barankay,I.,&Rasul,I.2010.Socialincentivesintheworkplace.TheReviewof
EconomicStudies,77(2):417–458.
Baumeister,R.F.,Bratslavsky,E.,Muraven,M.,&Tice,D.M.1998.Egodepletion:istheactiveselfa
limitedresource?JournalofPersonalityandSocialPsychology,74(5):1252.
Bendoly,E.,Donohue,K.,&Schultz,K.L.2006.Behaviorinoperationsmanagement:Assessing
recentfindingsandrevisitingoldassumptions.JournalofOperationsManagement,24(6):
737–752.
BerryJaeker,J.A.,&Tucker,A.L.2016.PastthePointofSpeedingUp:TheNegativeEffectsof
WorkloadSaturationonEfficiencyandPatientSeverity.ManagementScience.
http://pubsonline.informs.org.ezp‐
prod1.hul.harvard.edu/doi/abs/10.1287/mnsc.2015.2387.
Chiu,H.N.,Chen,H.M.,&Weng,L.C.2003.DETERMINISTICTIME‐VARYINGDEMANDLOT‐SIZING
MODELSWITHLEARNINGANDFORGETTINGINSETUPSANDPRODUCTION.Production
andOperationsManagement,12(1):120–127.
Clark,J.R.,Huckman,R.S.,&Staats,B.R.2013.Learningfromcustomers:Individualand
organizationaleffectsinoutsourcedradiologicalservices.OrganizationScience,24(5):
1539–1557.
Cook,R.I.,&Woods,D.D.1994.Operatingatthesharpend:thecomplexityofhumanerror.Human
ErrorinMedicine,13:225–310.
Csikszentmihalyi,M.2000.Beyondboredomandanxiety.Jossey‐Bass.

The Microstructure of Work
39
Csikszentmihalyi,M.,&Sawyer,K.1995.Creativeinsight:Thesocialdimensionofasolitary
moment.InR.J.Sternberg&J.E.Davidson(Eds.),TheNatureofInsight:329–363.
Cambridge,MA:MITPress.
Dai,H.,Milkman,K.L.,Hofmann,D.A.,&Staats,B.R.2015.Theimpactoftimeatworkandtimeoff
fromworkonrulecompliance:Thecaseofhandhygieneinhealthcare.JournalofApplied
Psychology,100(3):846.
Demerouti,E.,Bakker,A.B.,DeJonge,J.,Janssen,P.P.,&Schaufeli,W.B.2001.Burnoutand
engagementatworkasafunctionofdemandsandcontrol.ScandinavianJournalofWork,
Environment&Health,279–286.
Elsbach,K.D.,&Hargadon,A.B.2006.Enhancingcreativitythrough“mindless”work:Aframework
ofworkdaydesign.OrganizationScience,17(4):470–483.
Fisher,C.D.1993.Boredomatwork:Aneglectedconcept.HumanRelations,46(3):395–417.
Froehle,C.M.,&White,D.L.2014.InterruptionandForgettinginKnowledge‐IntensiveService
Environments.ProductionandOperationsManagement,23(4):704–722.
Gans,N.,Koole,G.,&Mandelbaum,A.2003.Telephonecallcenters:Tutorial,review,andresearch
prospects.Manufacturing&ServiceOperationsManagement,5(2):79–141.
Gillie,T.,&Broadbent,D.1989.Whatmakesinterruptionsdisruptive?Astudyoflength,similarity,
andcomplexity.PsychologicalResearch,50(4):243–250.
Gino,F.,&Pisano,G.2008.Towardatheoryofbehavioraloperations.Manufacturing&Service
OperationsManagement,10(4):676–691.
Hagger,M.S.,Wood,C.,Stiff,C.,&Chatzisarantis,N.L.2010.Egodepletionandthestrengthmodel
ofself‐control:ameta‐analysis.PsychologicalBulletin,136(4):495.
Henning,R.A.,Jacques,P.,Kissel,G.V.,Sullivan,A.B.,&Alteras‐Webb,S.M.1997.Frequentshort
restbreaksfromcomputerwork:effectsonproductivityandwell‐beingattwofieldsites.
Ergonomics,40(1):78–91.

The Microstructure of Work
40
Henning,R.A.,Sauter,S.L.,Salvendy,G.,&KriegJr,E.F.1989.Effectsofmicrobreakson
performanceandwell‐beingindataentrywork.Proceedingsofthethirdinternational
conferenceonhuman‐computerinteraction,Vol.1onWorkwithcomputers:
organizational,management,stressandhealthaspects,377–380.ElsevierScienceInc.
Homer,J.B.1985.Workerburnout:Adynamicmodelwithimplicationsforpreventionandcontrol.
SystemDynamicsReview,1(1):42–62.
Huckman,R.S.,Staats,B.R.,&Upton,D.M.2009.Teamfamiliarity,roleexperience,and
performance:EvidencefromIndiansoftwareservices.ManagementScience,55(1):85–
100.
Jett,Q.R.,&George,J.M.2003.Workinterrupted:Acloserlookattheroleofinterruptionsin
organizationallife.AcademyofManagementReview,28(3):494–507.
Kc,D.S.,&Staats,B.R.2012.Accumulatingaportfolioofexperience:Theeffectoffocalandrelated
experienceonsurgeonperformance.Manufacturing&ServiceOperationsManagement,
14(4):618–633.
Kc,D.S.,&Terwiesch,C.2009.Impactofworkloadonservicetimeandpatientsafety:An
econometricanalysisofhospitaloperations.ManagementScience,55(9):1486–1498.
Kc,D.S.,&Terwiesch,C.2011.Theeffectsoffocusonperformance:EvidencefromCalifornia
hospitals.ManagementScience,57(11):1897–1912.
Kesavan,S.,Staats,B.R.,&Gilland,W.G.2014.Labor‐mixandvolumeflexibility:Evidencefroma
retailer.ManagementSci,60(8):1884–1906.
Leonard‐Barton,D.,&Swap,W.C.1999.Whensparksfly:Ignitingcreativityingroups.Harvard
BusinessPress.
Lind,J.T.,&Mehlum,H.2010.WithorwithoutU?theAppropriateTestforaU‐ShapedRelationship.
OxfordBulletinofEconomicsandStatistics,72(1):109–118.

The Microstructure of Work
41
Louis,M.R.,&Sutton,R.I.1991.Switchingcognitivegears:Fromhabitsofmindtoactivethinking.
HumanRelations,44(1):55–76.
Mas,A.,&Moretti,E.2009.Peersatwork.TheAmericanEconomicReview,99(1):112–145.
Maslach,C.,&Leiter,M.P.2008.Earlypredictorsofjobburnoutandengagement.Journalof
AppliedPsychology,93(3):498.
Muraven,M.,Shmueli,D.,&Burkley,E.2006.Conservingself‐controlstrength.Journalof
PersonalityandSocialPsychology,91(3):524.
Muraven,M.,Tice,D.M.,&Baumeister,R.F.1998.Self‐controlasalimitedresource:Regulatory
depletionpatterns.JournalofPersonalityandSocialPsychology,74(3):774.
Narayanan,S.,Balasubramanian,S.,&Swaminathan,J.M.2009.Amatterofbalance:Specialization,
taskvariety,andindividuallearninginasoftwaremaintenanceenvironment.Management
Science,55(11):1861–1876.
Oliva,R.,&Sterman,J.D.2001.Cuttingcornersandworkingovertime:Qualityerosionintheservice
industry.ManagementScience,47(7):894–914.
Powell,A.,Savin,S.,&Savva,N.2012.Physicianworkloadandhospitalreimbursement:
Overworkedphysiciansgeneratelessrevenueperpatient.Manufacturing&Service
OperationsManagement,14(4):512–528.
Preacher,K.J.,&Hayes,A.F.2004.SPSSandSASproceduresforestimatingindirecteffectsin
simplemediationmodels.BehaviorResearchMethods,Instruments,&Computers,36(4):
717–731.
Roy,D.1960.“BananaTime”:JobSatisfactionandInformalInteraction.HumanOrganization,
18(4):158–168.
Rudolph,J.W.,&Repenning,N.P.2002.Disasterdynamics:Understandingtheroleofquantityin
organizationalcollapse.AdministrativeScienceQuarterly,47(1):1–30.

The Microstructure of Work
42
Schaufeli,W.B.,&Bakker,A.B.2004.Jobdemands,jobresources,andtheirrelationshipwith
burnoutandengagement:Amulti‐samplestudy.JournalofOrganizationalBehavior,
25(3):293–315.
Schaufeli,W.B.,&Buunk,B.P.2003.Burnout:Anoverviewof25yearsofresearchandtheorizing.
TheHandbookofWorkandHealthPsychology,2:282–424.
Schultz,K.L.,McClain,J.O.,&Thomas,L.J.2003.Overcomingthedarksideofworkerflexibility.
JournalofOperationsManagement,21(1):81–92.
Setyawati,L.1995.Relationbetweenfeelingsoffatigue,reactiontimeandworkproductivity.
JournalofHumanErgology,24(1):129–135.
Smunt,T.L.,&Meredith,J.2000.Acomparisonofdirectcostsavingsbetweenflexibleautomation
andlaborwithlearning.ProductionandOperationsManagement,9(2):158–170.
Song,H.,&Tucker,A.2016.PerformanceImprovementinHealthCareOrganizations.Foundations
andTrends®inTechnology,InformationandOperationsManagement,9(3–4):153–
309.
Song,H.,Tucker,A.L.,&Murrell,K.L.2015.Thediseconomiesofqueuepooling:Anempirical
investigationofemergencydepartmentlengthofstay.ManagementScience,61(12):3032–
3053.
Staats,B.R.,&Gino,F.2012.Specializationandvarietyinrepetitivetasks:EvidencefromaJapanese
bank.ManagementScience,58(6):1141–1159.
Tan,T.F.,&Netessine,S.2014.Whendoesthedevilmakework?Anempiricalstudyoftheimpactof
workloadonworkerproductivity.ManagementScience,60(6):1574–1593.
Tan,T.,&Netessine,S.2015.WhenYouWorkwithaSuperMan,WillYouAlsoFly?AnEmpirical
StudyoftheImpactofCoworkersonPerformance.
Teyarachakul,S.,Chand,S.,&Ward,J.2011.Effectoflearningandforgettingonbatchsizes.
ProductionandOperationsManagement,20(1):116–128.

The Microstructure of Work
43
Thomas,H.R.1992.Effectsofscheduledovertimeonlaborproductivity.JournalofConstruction
EngineeringandManagement,118(1):60–76.
Tucker,A.L.2007.Anempiricalstudyofsystemimprovementbyfrontlineemployeesinhospital
units.Manufacturing&ServiceOperationsManagement,9(4):492–505.
Tucker,A.L.2015.Theimpactofworkarounddifficultyonfrontlineemployees’responseto
operationalfailures:Alaboratoryexperimentonmedicationadministration.Management
Science,62(4):1124–1144.
Wang,L.,Gurvich,I.,O’Leary,K.,Mieghem,V.,&A,J.2016.Collaboration,InterruptionsandSetup
Times:ModelandEmpiricalStudyofHospitalistWorkload.SSRNScholarlyPaperno.ID
2616926,Rochester,NY:SocialScienceResearchNetwork.
Wickens,C.D.,&Hollands,J.G.2000.Attention,time‐sharing,andworkload.Engineering
PsychologyandHumanPerformance,439–479.
Wooldridge,J.M.2010.Econometricanalysisofcrosssectionandpaneldata.MITpress.
Wylie,G.,&Allport,A.2000.Taskswitchingandthemeasurementof“switchcosts.”Psychological
Research,63(3–4):212–233.
Zellmer‐Bruhn,M.E.2003.Interruptiveeventsandteamknowledgeacquisition.Management
Science,49(4):514–528.
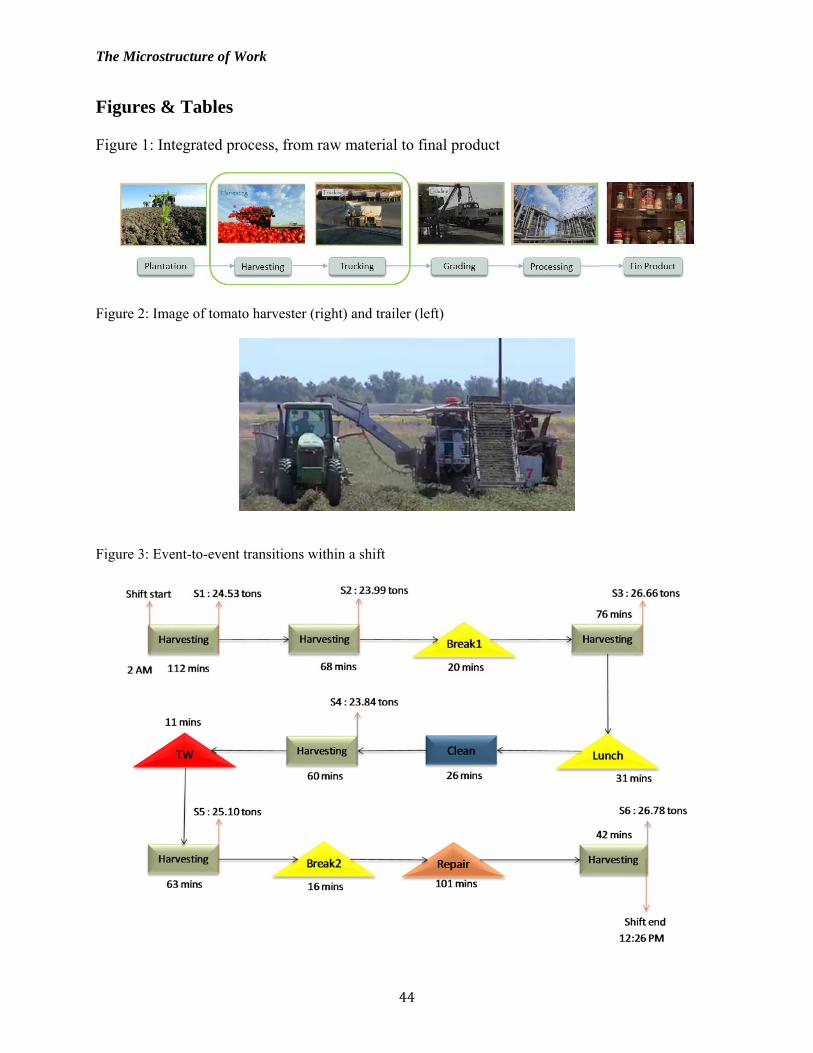
The Microstructure of Work
44
Figures & Tables Figure 1: Integrated process, from raw material to final product
Figure 2: Image of tomato harvester (right) and trailer (left)
Figure 3: Event-to-event transitions within a shift

The Microstructure of Work
45
Figure 4: Distribution of within-shift productivity
Figure 5: Distribution of within-shift trailer wait time (excluding zeros)
Figure 6: Distribution of within-shift repair time (excluding zeros)

The Microstructure of Work
46
Table 1: Field study summary statistics
Table 2: Field study variables correlation matrix
Table 3: Results from Base specification (OLS with no correction for endogeneity)
Variable Dependent variable: Productivity
Constant 46.2476***( 3.3208 )
Trailer wait 26.3593***( 1.9768 )
Trailer wait2 -11.149***( 1.3948 )
Repair -2.8574***( 0.2985 )
Trailer wait * Workload 0.5912( 0.3196 )
Repair * Workload -0.1238*( 0.0666 )
Move -2.3302***( 0.4113 )
Break 1 -6.8059***( 0.8513 )
Lunch -6.9098***( 0.4233 )
Break 2 -7.9507***( 1.2827 )
Cleaning -1.7323***( 0.6608 )
Cumulative Tons 0.001***( 0.0001 )
Cumulative Tons2 0***( 0 )
Workload 0.4782***( 0.0623 )
Workload2 -0.0279***( 0.0043 )
Employee Indicator Yes***
Field Indicator Yes***
Observations 117,756
R-Square 33.2%
Root MSE 20.155
Variable Mean SD Min P5 P25 Median P75 P95 Max N
Productivity 55.79 24.54 2.09 20.68 37.94 53.31 70.2 100.56 149.99 117,756
Harvesting (hours) 0.6 0.43 0.12 0.27 0.37 0.48 0.68 1.25 10.98 117,756
Cumulative Tons 10,888.92 7,377.90 25.26 994.42 4,718.40 9,801.98 16,187.37 24,280.52 37,094.17 117,756
Workload 3.68 2.79 1 1 2 3 5 9 24 117,756
Trailer wait (hours) 0.35 0.33 0.02 0.03 0.13 0.27 0.47 0.95 4.37 7,254
Repair (hours) 1.08 1.21 0.02 0.07 0.32 0.67 1.4 3.52 10.9 5,713
Break 1 (hours) 0.31 0.13 0.02 0.15 0.25 0.28 0.37 0.55 1.25 5,508
Break 2 (hours) 0.29 0.1 0.02 0.17 0.25 0.27 0.33 0.48 1.1 2,500
Lunch (hours) 0.6 0.21 0.02 0.29 0.5 0.57 0.7 1 1.83 7,211
Move (hours) 1.06 1.21 0.02 0.05 0.23 0.62 1.43 3.71 8.7 1,311
Cleaning (hours) 0.41 0.4 0.02 0.05 0.18 0.32 0.5 1.07 6.1 5,607
Idle (hours) 0.24 0.63 0.02 0.02 0.02 0.03 0.23 0.97 10.17 1,089
Shift hours (hours) 11.48 1.03 4 9.46 11.55 11.82 11.97 12 15.82 9,832
1 2 3 4 5 6 7 8 9 10 11
1 Productivity
2 Cumulative Tons 0.0298***
3 Workload 0.0425*** 0.1684***
4 Trailer wait 0.0968*** 0.0013 0.0023
5 Repair -0.0915*** -0.0113*** -0.0076** -0.0091**
6 Move -0.0286*** 0.004 0.0027 -0.0033 0.0235***
7 Break 1 -0.0544*** -0.0078** -0.0097*** -0.0008 0.0264*** 0.0072*
8 Break 2 -0.0426*** -0.0155*** -0.0043 -0.0099*** -0.0039 -0.002 -0.0256***
9 Lunch -0.0870*** -0.0141*** -0.0063* -0.0025 0.0479*** 0.0320*** -0.0320*** -0.0277***
10 Cleaning -0.0541*** 0.0032 -0.0062* -0.0139*** 0.0233*** 0.1919*** 0.0075* -0.0043 0.1540***
11 Idle -0.0073* 0.0082** 0.0015 -0.0017 0.0096*** 0.2265*** 0.0074* -0.001 0.0157*** 0.0268***
Variable

The Microstructure of Work
47
Table 4: Stage 1 Tobit regression results Dependent variable: log(1+Trailer wait)
Variable Model 1 Model 2 Model 3
Constant -0.86883*** (0.13191) -0.90777*** ( 0.13007 ) -0.8914*** ( 0.1315 )
Lag Productivity 0.00329*** ( 0.00016 ) 0.00309*** ( 0.00016 ) 0.00321*** ( 0.00016 )
Group Productivity 0.00166*** ( 0.00016 ) 0.00178*** ( 0.00016 )
Hour 1am 0.01768 ( 0.02338 ) 0.01722 ( 0.02338 )
2am 0.0361 ( 0.02319 ) 0.03623 ( 0.02318 )
3am 0.02945 ( 0.02262 ) 0.02952 ( 0.02262 )
4am 0.05222* ( 0.02222 ) 0.05173* ( 0.02221 )
5am 0.09099*** ( 0.02227 ) 0.09009*** ( 0.02226 )
6am 0.00959 ( 0.02319 ) 0.00835 ( 0.02319 )
7am -0.05662* ( 0.0238 ) -0.05901* ( 0.0238 )
8am -0.08831*** ( 0.02411 ) -0.09226*** ( 0.02412 )
9am -0.10377*** ( 0.0244 ) -0.10636*** ( 0.0244 )
10am -0.06603** ( 0.02362 ) -0.07067** ( 0.02362 )
11am -0.06183** ( 0.02363 ) -0.06535** ( 0.02363 )
12pm -0.06557** ( 0.02407 ) -0.06981** ( 0.02407 )
1pm -0.07947** ( 0.02448 ) -0.08412** ( 0.02449 )
2pm -0.10676*** ( 0.02468 ) -0.11257*** ( 0.02469 )
3pm -0.06556** ( 0.02335 ) -0.07184** ( 0.02336 )
4pm -0.03648 ( 0.02267 ) -0.04256. ( 0.02267 )
5pm -0.04145. ( 0.02324 ) -0.04803* ( 0.02325 )
6pm -0.03327 ( 0.02323 ) -0.03921. ( 0.02325 )
7pm -0.05408* ( 0.02355 ) -0.05965* ( 0.02356 )
8pm -0.11549*** ( 0.0246 ) -0.11778*** ( 0.02458 )
9pm 0.01121 ( 0.02282 ) 0.01021 ( 0.02282 )
10pm 0.02971 ( 0.02268 ) 0.02819 ( 0.02268 )
11pm 0.0119 ( 0.02292 ) 0.01221 ( 0.0229 )
Day Mon -0.09111*** ( 0.01503 ) -0.08803*** ( 0.0151 )
Tues -0.02059 ( 0.01457 ) -0.0149 ( 0.01464 )
Wed -0.00928 ( 0.01381 ) -0.00572 ( 0.01387 )
Thurs -0.01041 ( 0.01273 ) -0.00957 ( 0.01276 )
Sat -0.06415*** ( 0.01307 ) -0.06381*** ( 0.0131 )
Sun -0.09179*** ( 0.01431 ) -0.09082*** ( 0.01437 )
Field Indicator Yes*** Yes*** Yes*** sigma 0.542033 0.5446912 0.5446912
Observations 107,924 107,924 107,924 LR chi2 6144.73 5,915.34 6,266.39
Prob > chi2 0.00 0.00 0.00
Pseudo R2 12.81% 12.33% 13.06%
Log likelihood -20920.155 -21,034.85 -20,859.32
left censor obs 100,755 100,755 100,755
uncensored obs 7,169 7,169 7,169

The Microstructure of Work
48
Table 5: Stage 2 - Second stage OLS regression results
Dependent variable: Productivity
Variable Model 1 Model 2 Model 3 Model 4 Model 5
Constant 46.66801*** ( 3.34624 )
45.86593*** ( 3.32935 )
46.10104*** ( 3.32595 )
46.07479*** ( 3.32816 )
46.06776*** ( 3.32866 )
Est. Trailer wait 131.4631*** ( 12.27996 )
129.6264*** ( 12.22573 )
130.799*** ( 13.37852 )
130.9872*** ( 13.37722 )
Est. Trailer wait2 -280.4133*** ( 78.34048 )
-271.6478*** ( 77.65541 )
-271.4596*** ( 77.53121 )
-271.1884*** ( 77.51355 )
Repair -2.73964*** ( 0.23907 )
-2.73964*** ( 0.23907 )
-2.13865*** ( 0.43201 )
Trailer wait * Workload -0.31295
( 1.34448 ) -0.3795
( 1.34468 )
Repair * Workload -0.16648.
( 0.09989 )
Move -2.48653*** ( 0.41487 )
-2.56261*** ( 0.57599 )
-2.47357*** ( 0.56914 )
-2.47364*** ( 0.56917 )
-2.46216*** ( 0.56843 )
Break 1 -7.05299*** ( 0.85686 )
-11.31881*** ( 0.87383 )
-10.9854*** ( 0.87063 )
-10.98532*** ( 0.87063 )
-10.99568*** ( 0.8706 )
Lunch -7.21431*** ( 0.42513 )
-9.52568*** ( 0.43646 )
-9.2423*** ( 0.43584 )
-9.24249*** ( 0.43584 )
-9.24302*** ( 0.43588 )
Break 2 -8.07858*** ( 1.28693 )
-13.6524*** ( 1.30476 )
-13.67412*** ( 1.30322 )
-13.67447*** ( 1.30316 )
-13.67135*** ( 1.30339 )
Cleaning -2.0167** ( 0.66992 )
-1.75527* ( 0.81986 )
-1.71264* ( 0.81647 )
-1.71174* ( 0.81648 )
-1.71551* ( 0.81663 )
Cumulative Tons 0.00106*** ( 0.00009 )
0.00096*** ( 0.0001 )
0.00088*** ( 0.0001 )
0.00088*** ( 0.0001 )
0.00088*** ( 0.0001 )
Cumulative Tons2 -0*** ( 0 )
-0*** ( 0 )
-0*** ( 0 )
-0*** ( 0 )
-0*** ( 0 )
Workload 0.41883*** ( 0.06334 )
0.42439*** ( 0.06808 )
0.43267*** ( 0.06832 )
Workload2 -0.02331*** ( 0.00444 )
-0.02331*** ( 0.00444 )
-0.02334*** ( 0.00444 )
Employee Indicator Yes*** Yes*** Yes*** Yes*** Yes***
Field Indicator Yes*** Yes*** Yes*** Yes*** Yes***
Observations 117756 107924 107924 107924 107924
R-Square 32.2% 33.5% 33.7% 33.7% 33.7%
Root MSE 20.307 19.769 19.75 19.75 19.75
Table 6: T-tests for actual trailer wait slope in Base specification

The Microstructure of Work
49
Trailer wait Value Slope Std. error t-value p-value
Minimum 0.0000 26.3593 1.9768 13.3345 0.0000
Stationary point - 2 SD 0.9481 5.2183 1.7828 2.9271 0.0017
Stationary point - 1 SD 1.0651 2.6091 2.0145 1.2952 0.0976
Stationary point + 1 SD 1.2991 -2.6091 2.5410 -1.0268 0.1523
Stationary point + 2 SD 1.4162 -5.2183 2.8242 -1.8477 0.0323
Maximum 4.3670 -71.0163 10.8040 -6.5731 0.0000
Table 6: T-tests for estimated trailer wait slope in Stage 2
Estimated Trailer wait Value Slope Std. error t-value p-value
Minimum 0.0000 130.9872 13.3772 9.7918 0.0000
Stationary point - 2 SD 0.1989 23.1053 3.6839 6.2719 0.0000
Stationary point - 1 SD 0.2202 11.5526 6.8985 1.6747 0.0470
Stationary point + 1 SD 0.2628 -11.5526 12.0684 -0.9573 0.1692
Stationary point + 2 SD 0.2841 -23.1053 14.4805 -1.5956 0.0553
Maximum 0.4532 -114.8180 32.7586 -3.5050 0.0002
Figure 7: Example image from Study 2
Table 6: Descriptive statistics of variables captured in Study 2, by condition

The Microstructure of Work
50
Unexpected break condition Expected break condition Alertness 5.12 (1.187) 4.53 (1.476) Mind wandering 2.46 (1.483) 2.98 (1.617) Performance before break 2.78 (1.578) 2.72 (1.401) Performance before break 2.80 (1.238) 2.20 (1.205) Improvement after break .02 (1.321) -.51 (1.317)
Table 7: Descriptive statistics of variables captured in Study 3, by condition
Unexpected break condition Expected break condition Alertness 5.20 (1.155) 4.79 (1.231) Mind wandering 2.45 (1.450) 2.81 (1.569) Effort as measure by length of the essays before the break
300.62 (96.133) 277.44 (103.130)
Effort as measure by length of the essays after the break
292.30 (105.398) 251.64 (99.778)
Increase in effort after the break -8.33 (59.383) -25.80 (52.212)