Embed Size (px)
Citation preview

RESEARCH PAPER
The MiAge Calculator: a DNA methylation-based mitotic age calculator of humantissue types
Ahrim Youna,b and Shuang Wanga
aDepartment of Biostatistics, Mailman School of Public Health, Columbia University, New York, New York, U.S.A; bThe Jackson Laboratory for GenomicMedicine, Farmington, Connecticut, U.S.A
ARTICLE HISTORYReceived 23 June 2017Revised 20 September 2017Accepted 4 October 2017
ABSTRACTCell division is important in human aging and cancer. The estimation of the number of cell divisions(mitotic age) of a given tissue type in individuals is of great interest as it allows not only the study ofbiological aging (using a new molecular aging target) but also the stratification of prospective cancer risk.Here, we introduce the MiAge Calculator, a mitotic age calculator based on a novel statistical framework,the MiAge model. MiAge is designed to quantitatively estimate mitotic age (total number of lifetime celldivisions) of a tissue using the stochastic replication errors accumulated in the epigenetic inheritanceprocess during cell divisions. With the MiAge model, the MiAge Calculator was built using the trainingdata of DNA methylation measures of 4,020 tumor and adjacent normal tissue samples from eight TCGAcancer types and was tested using the testing data of DNA methylation measures of 2,221 tumor andadjacent normal tissue samples of five other TCGA cancer types. We showed that within each of thethirteen cancer types studied, the estimated mitotic age is universally accelerated in tumor tissuescompared to adjacent normal tissues. Across the thirteen cancer types, we showed that worse cancersurvivals are associated with more accelerated mitotic age in tumor tissues. Importantly, we demonstratedthe utility of mitotic age by showing that the integration of mitotic age and clinical information leads toimproved survival prediction in six out of the thirteen cancer types studied. The MiAge Calculator isavailable at http://www.columbia.edu/»sw2206/softwares.htm.
KEYWORDSDNA methylation; celldivisions; mitotic age;statistical method
Introduction
The lifetime risks of many cancers are suggested to be corre-lated with the lifetime number of cell divisions of normal stemcells within those tissues [1,2]. Thus, the estimation of thenumber of cell divisions, that is, the construction of molecularmitotic clocks of a given tissue type in individuals allows strati-fication according to prospective cancer risk. Progress wasmade very recently with the construction of the DNA methyla-tion-based mitotic-like clock epiTOC [3]. This mitotic-likeclock focuses on Polycomb group promoter CpGs and selectedthose CpGs for which DNA methylation levels increase withchronological age and are unmethylated in fetal tissues. By cor-relating the tick rate prediction from the model to the rate ofstem cell divisions in normal tissues and an mRNA expression-based mitotic index in cancer tissues, this model is demon-strated to approximate a mitotic-like clock.
Here, we approached the same problem differently andintroduced MiAge, a novel statistical model that quantitativelyestimates mitotic age of a tissue using DNA methylation data.MiAge uses a molecular clock hypothesis [4]. As a cell dividesduring normal human development and aging, in theory, thegreater the number of divisions, the greater the number ofsomatic replication errors. Based on this molecular clockhypothesis, the majority of epigenetic changes in a genome as acell divides are neutral (“passenger”), with minimal selective
value. Those passenger changes are “odometer-like” clicks of amolecular clock [5,6]. The proposed MiAge statistical modelutilizes the stochastic replication errors accumulated duringcell divisions. Per cell division, two events could occur at a CpGsite when epigenetic patterns are inherited: an existing methylgroup may be lost (failure of maintenance) or a new methylgroup may be added (de novo methylation) [7]. Observedmethylation levels at CpG sites thus may change stochasticallyover many cell divisions according to the probabilities of failureof maintenance and de novo methylation. Under the MiAgemodel, there are four types of CpG sites as a cell divides: (i) siteswith methylation levels monotonically increasing over cell divi-sions if they have low initial methylation levels at the first cellgeneration, low probability of failure of maintenance and highprobability of de novo methylation, which we name increasing-methylated CpGs and are informative in inferring mitotic age;(ii) sites with methylation levels monotonically decreasing overcell divisions if they have high initial methylation levels at thefirst cell generation, high probability of failure of maintenance,and low probability of de novo methylation, which we namedecreasing-methylated CpGs and are informative in inferringmitotic age; (iii) sites with stationary methylation levels overcell divisions that are not informative in inferring mitotic age;and (iv) sites with unstable methylation levels, which aredynamic but not informative in inferring mitotic age. The
CONTACT Shuang Wang [email protected] Department of Biostatistics, Mailman School of Public Health, Columbia University, New York, New York, U.S.ASupplemental data for this article can be accessed on the publisher’s website.
© 2018 Informa UK Limited, trading as Taylor & Francis Group
EPIGENETICS, 2018https://doi.org/10.1080/15592294.2017.1389361

MiAge model assumes site-specific parameters at a CpG site:the methylation level at the first cell generation, the probabilityof failure of maintenance, and the probability of de novo meth-ylation are the same for all tissue samples of the same type. Bycomparing observed to expected methylation levels at present-day genome under the MiAge model, we are able to estimatethe total number of cell divisions a tissue sample has gonethrough, as well as the site-specific parameters of selected CpGsthat are most informative in inferring mitotic activities using aselection procedure imbedded in the MiAge model. We appliedthe MiAge model to training data of DNA methylation meas-ures of 4,020 tumor and adjacent normal samples of 8 cancertypes and built the MiAge Calculator that consists of a panel of286 increasing-methylated CpGs that are mitotic-activity-infor-mative together with their estimated site-specific parameters,which can be applied to methylation data of new samples ofother tissue types to estimate their mitotic age. We tested thisnon-tissue-specific property of the MiAge Calculator using test-ing data of DNA methylation measures of 2,221 tumor andadjacent normal samples of 5 cancer types different from the 8cancer types in the training data. We further validated theMiAge Calculator by showing high correlations between esti-mated mitotic age and three surrogate measures of theunknown true mitotic age.
Although we focused on cancer applications, the MiAge Cal-culator is readily applicable to aging studies using DNA meth-ylation measures to estimate mitotic age as a new moleculartarget of aging marker.
Results
Estimation of mitotic age using a novel statisticalframework based on DNA methylation transmission
MiAge statistical model. The MiAge model quantitatively esti-mates total number of cell divisions, i.e., mitotic age, of a tissuesample using DNA methylation data. To model changes inmethylation patterns accumulated through cell divisions acrossCpGs, MiAge uses a previously developed model for methyla-tion transmission process per cell division (Figure 1(a)) [7],from which we derived all possible probabilistic methylationtransition events at a CpG (Figure 1(b)), where Pn is the meth-ylation status (1 if methylated and 0 otherwise) of a pre-replica-tion parent strand in the nth cell generation; Qn is themethylation status of a post-methylation parent strand; Dn isthe methylation status of a post-methylation daughter strand;m is the probability of maintaining methylation during a celldivision; and dp and dd are the probabilities of de novo methyla-tion event on the parent and daughter strand. Thus Xn =(Qn+Dn)/2 is the mean methylation status of the double strandsat a CpG site on one sister chromosome in the nth cell genera-tion in one cell. The key feature of MiAge that makes the esti-mation of mitotic age possible is that the mean methylationstatus of the double strands of one sister chromosome Xn at aCpG in the nth cell generation of one cell only depends on Xn-1,that of the previous (n-1)th cell generation. That is, the proba-bility distribution of Pr(XnjXn-1) can be readily derived basedon the methylation transmission process as a function of theprobabilities of de novo methylation dp, dd, the probability of
failure of maintenance, 1-m [see Supplementary Materials fordetailed derivation of Pr(XnjXn-1)]. We can safely assume thatthe two sister chromosomes have the same transition processduring cell divisions, thus having the same Xn at the CpG.
By recursively applying the methylation transmission proba-bility Pr(XnjXn-1), we can derive E(Xn), the mean methylationlevel at a CpG in the nth cell generation of a tissue sampleassuming all cells of this tissue sample have gone through thesame number of cell divisions n [see Supplementary materialsfor detailed derivation of E(Xn)]. If we introduce the index i forCpG sites and index j for tissue samples, we can model themean methylation level at CpG i in the nj
th cell generation oftissue sample j, EðXnj;iÞ, using Equation (1).
EðXnj;iÞ ¼ ai1� bi
þ bnj�1i EðX1;iÞ � ai
1� bi
� �; when bi 6¼ 1: (1)
Here we assume parameters ai; bi, EðX1;iÞ at CpG site i aresite-specific and are the same across samples. Here ai ¼ ðdpi þddi Þ=2 describes the average rate of de novo methylation at CpGi, and bi ¼ ð1þ mi � d
pi � ddi Þ=2 describes the fidelity of meth-
ylation maintenance at CpG i, and E(X1,i) is the methylationlevel at CpG i in the 1st cell generation. When bi ¼ 1; we havedpi ¼ ddi ¼ 0 and mi ¼ 1. That is, the methylation status is per-fectly transmitted with no random errors as cell divides, i.e.,EðXnj;iÞ ¼ EðX1;iÞ. We assume that every CpG is methylatedindependently of other CpGs in the genome.
With methylation measures at many CpG sites from manysamples, we can estimate number of cell divisions nj of sample jand parameters ai, bi, and EðX1;iÞ of CpG i by minimizing thefollowing objective function in Equation (2), which comparesthe observed methylation level at CpG i of sample j, bi,j toexpected methylation level under the MiAge model, EðXnj;iÞ,across all samples and CpG sites.
f ¼Xi
Xj
EðXnj;iÞ � bi;j
� �2: (2)
Here, f is the sum of squares of the difference betweenobserved and expected methylation levels, summed over allsamples at CpG i, and then summed over all CpGs. Details ofthe optimization procedure are in the Materials and methodssection.
MiAge is coupled with a procedure to select informative CpGs.As we pointed out, under the MiAge model, there are four typesof CpG sites as cell divides depending on the value of the site-specific parameters ai; bi, EðX1;iÞ: (i) sites with increasing-meth-ylated levels, which are informative in inferring mitotic age; (ii)sites with decreasing-methylated levels, which are also informa-tive in inferring mitotic age; and (iii) sites with stationary-methylation levels, which are not informative in inferringmitotic age; and (iv) sites with unstable methylation levels,which are dynamic but are not informative in inferring mitoticage.
We need to separate informative CpGs from uninformativeCpGs. The second step of MiAge is thus an iterative procedureto simultaneously select informative CpGs while estimating
2 A. YOUN AND S. WANG

mitotic age nj during the optimization procedure of Equation(2). To do this, we proposed an informativeness score si forCpG i, and a cutoff c0 for si to determine which sites are infor-mative, prior to the optimization procedure of the objectivefunction in Equation (2). The detailed description of the infor-mativeness score si and the procedure to define the cutoff c0 areprovided in theMaterials and methods section.
Unidentifiability problem of MiAge. One important caveatwhen minimizing the objective function f in Equation (2) isthat there is no unique solution minimizing f. As explained inmore detail in the Materials and methods section, the setsnj
� �and c�nj � cþ 1
� �for a constant c give the same value of
f with different sets of site-specific parameters ai, bi, andEðX1;iÞ. That is, if the true mitotic age is nj
� �, the best estimate
will be c�nj � cþ 1� �
for some constant c. Thus, the estimatedmitotic age is proportional to the true mitotic age and shouldbe interpreted as a relative number rather than an actual num-ber. Similarly, the estimated site-specific parameters ai, bi, andEðX1;iÞ are also proportional to the true values. However, thisunknown constant is the same for all samples, thus the esti-mated relative mitotic ages are comparable across samples.
Simulation Studies of MiAge. We conducted a set of simula-tion studies to investigate the feasibility and performance ofMiAge and the robustness of MiAge to misspecifications of
Figure 1. The methylation transmission process of the MiAge model. (a) During a cell division, each of the two strands of a DNA molecule becomes a parent strand, whichis used as a template to synthesize a daughter strand. During the intermediate post-replication stage, daughter strands are completely unmethylated, whereas parentstrands have the same methylation patterns as before. Subsequently, methyl groups are added to cytosines. In this process, failure of maintenance and/or de novo methyl-ation events can occur with certain probabilities. (b) All methylation transition events that happen within a cell division. At a CpG site, Pn is the methylation status (1 ifmethylated and 0 otherwise) of a pre-replication parent strand in the nth cell generation; Qn is the methylation status of a post-methylation parent strand; Dn is the meth-ylation status of a post-methylation daughter strand; m is the probability of maintaining methylation during a cell division; and dp and dd are the probabilities of de novomethylation event on the parent and daughter strand. Thus Xn = (Qn+Dn)/2 is the mean methylation status of the double strands at a CpG site on one sister chromosomein the nth cell generation in one cell.
EPIGENETICS 3
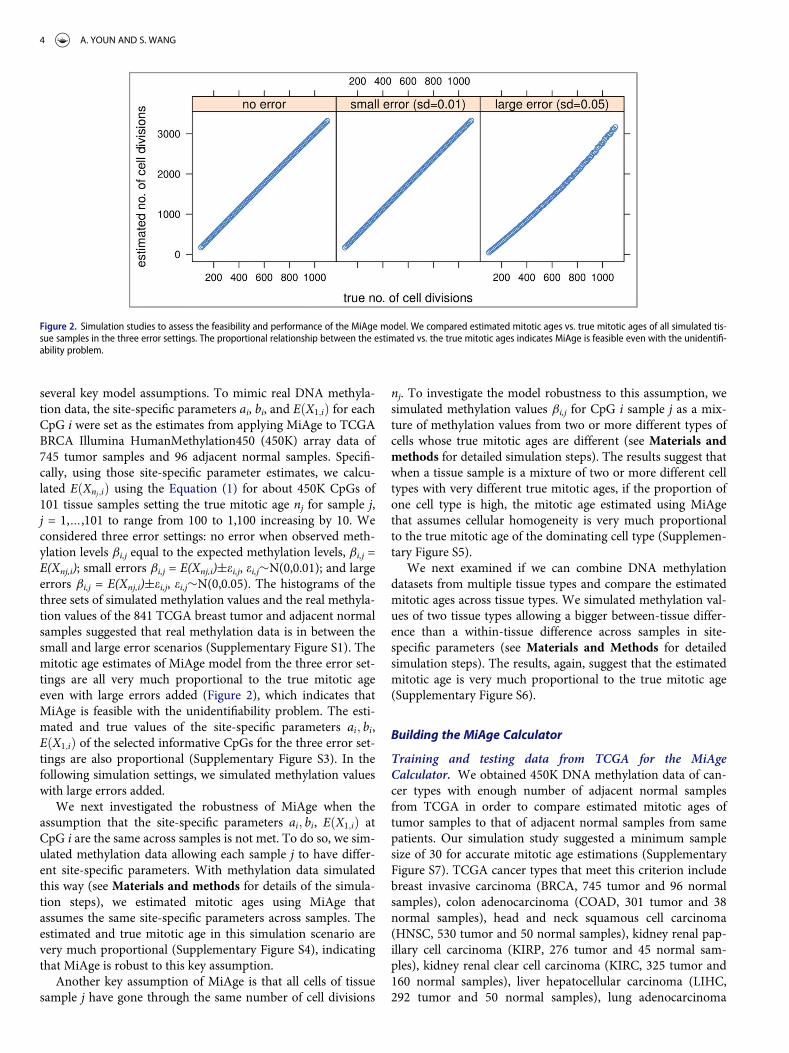
several key model assumptions. To mimic real DNA methyla-tion data, the site-specific parameters ai, bi, and EðX1;iÞ for eachCpG i were set as the estimates from applying MiAge to TCGABRCA Illumina HumanMethylation450 (450K) array data of745 tumor samples and 96 adjacent normal samples. Specifi-cally, using those site-specific parameter estimates, we calcu-lated EðXnj;iÞ using the Equation (1) for about 450K CpGs of101 tissue samples setting the true mitotic age nj for sample j,j = 1,…,101 to range from 100 to 1,100 increasing by 10. Weconsidered three error settings: no error when observed meth-ylation levels bi,j equal to the expected methylation levels, bi,j =E(Xnj,i); small errors bi,j = E(Xnj,i)§ei,j, ei,j»N(0,0.01); and largeerrors bi,j = E(Xnj,i)§ei,j, ei,j»N(0,0.05). The histograms of thethree sets of simulated methylation values and the real methyla-tion values of the 841 TCGA breast tumor and adjacent normalsamples suggested that real methylation data is in between thesmall and large error scenarios (Supplementary Figure S1). Themitotic age estimates of MiAge model from the three error set-tings are all very much proportional to the true mitotic ageeven with large errors added (Figure 2), which indicates thatMiAge is feasible with the unidentifiability problem. The esti-mated and true values of the site-specific parameters ai; bi,EðX1;iÞ of the selected informative CpGs for the three error set-tings are also proportional (Supplementary Figure S3). In thefollowing simulation settings, we simulated methylation valueswith large errors added.
We next investigated the robustness of MiAge when theassumption that the site-specific parameters ai; bi, EðX1;iÞ atCpG i are the same across samples is not met. To do so, we sim-ulated methylation data allowing each sample j to have differ-ent site-specific parameters. With methylation data simulatedthis way (see Materials and methods for details of the simula-tion steps), we estimated mitotic ages using MiAge thatassumes the same site-specific parameters across samples. Theestimated and true mitotic age in this simulation scenario arevery much proportional (Supplementary Figure S4), indicatingthat MiAge is robust to this key assumption.
Another key assumption of MiAge is that all cells of tissuesample j have gone through the same number of cell divisions
nj. To investigate the model robustness to this assumption, wesimulated methylation values bi,j for CpG i sample j as a mix-ture of methylation values from two or more different types ofcells whose true mitotic ages are different (see Materials andmethods for detailed simulation steps). The results suggest thatwhen a tissue sample is a mixture of two or more different celltypes with very different true mitotic ages, if the proportion ofone cell type is high, the mitotic age estimated using MiAgethat assumes cellular homogeneity is very much proportionalto the true mitotic age of the dominating cell type (Supplemen-tary Figure S5).
We next examined if we can combine DNA methylationdatasets from multiple tissue types and compare the estimatedmitotic ages across tissue types. We simulated methylation val-ues of two tissue types allowing a bigger between-tissue differ-ence than a within-tissue difference across samples in site-specific parameters (see Materials and Methods for detailedsimulation steps). The results, again, suggest that the estimatedmitotic age is very much proportional to the true mitotic age(Supplementary Figure S6).
Building the MiAge Calculator
Training and testing data from TCGA for the MiAgeCalculator. We obtained 450K DNA methylation data of can-cer types with enough number of adjacent normal samplesfrom TCGA in order to compare estimated mitotic ages oftumor samples to that of adjacent normal samples from samepatients. Our simulation study suggested a minimum samplesize of 30 for accurate mitotic age estimations (SupplementaryFigure S7). TCGA cancer types that meet this criterion includebreast invasive carcinoma (BRCA, 745 tumor and 96 normalsamples), colon adenocarcinoma (COAD, 301 tumor and 38normal samples), head and neck squamous cell carcinoma(HNSC, 530 tumor and 50 normal samples), kidney renal pap-illary cell carcinoma (KIRP, 276 tumor and 45 normal sam-ples), kidney renal clear cell carcinoma (KIRC, 325 tumor and160 normal samples), liver hepatocellular carcinoma (LIHC,292 tumor and 50 normal samples), lung adenocarcinoma
Figure 2. Simulation studies to assess the feasibility and performance of the MiAge model. We compared estimated mitotic ages vs. true mitotic ages of all simulated tis-sue samples in the three error settings. The proportional relationship between the estimated vs. the true mitotic ages indicates MiAge is feasible even with the unidentifi-ability problem.
4 A. YOUN AND S. WANG

(LUAD, 466 tumor and 32 normal samples), lung squamouscell carcinoma (LUSC, 359 tumor and 42 normal samples),prostate adenocarcinoma (PRAD, 503 tumor and 50 normalsamples), thyroid carcinoma (THCA, 515 tumor and 56 normalsamples), and uterine corpus endometrial carcinoma (UCEC,439 tumor and 34 normal samples).
Of these 11 cancer types, we used 8 cancer types (BRCA,COAD, HNSC, KIRP, LIHC, PRAD, THCA, UCEC) to buildthe MiAge Calculator, and used the rest 3 cancer types (LUAD,LUSC, KIRC) to test the non-tissue-specific property of theMiAge Calculator. In order to have more cancer types in thetesting data, we added two more TCGA cancer types that havethe largest number of samples with DNA methylation data andsome adjacent normal samples: bladder urothelial carcinoma(BLCA, 419 tumor and 21 normal samples), and stomach ade-nocarcinoma (STAD, 395 tumor and 2 normal samples). Formost of the TCGA cancer patients, one primary tumor samplewas taken. For a few patients, one from primary tumor and onefrom metastasized tumor were taken. Rarely, multiple primarytumor samples were taken from one patient. For validationsteps correlating mitotic age with unknown true mitotic age,we will use all samples. For correlating mitotic age with clinicalvariables and for survival prediction, we will use primary tumoronly and for those with multiple primary tumor samples, wewill use averaged mitotic age from multiple primary tumorsamples for the patient.
Building the MiAge Calculator with training data of 8 TCGAcancer types. With the MiAge model, we built the MiAge Cal-culator, a non-tissue-specific mitotic age calculator, using thetraining data of 8 TCGA cancer types. There are two majorsteps in building the MiAge Calculator: i) to select a panel of“mitotic clock CpGs” that are neither tumor-related nor tissue-specific but are mostly informative in measuring mitotic activi-ties and ii) to estimate site-specific parameters ai; bi, EðX1;iÞ ofthe selected panel of “mitotic clock” CpGs.
In identifying a panel of “mitotic clock” CpGs, the idea isthat there exist “odometer-like” CpGs that are neither tumor-related nor tissue-specific but are mostly related to mitoticactivities so that the defined panel of informative CpGs are con-sidered as “mitotic clock” CpGs and can be used for other tissuetypes in other studies. For each of the 8 TCGA cancer types inthe training data, we applied the MiAge model to DNA methyl-ation data of available tumor and normal samples and identi-fied 8 sets of informative CpGs that are either increasing- ordecreasing-methylated (see detailed steps for selecting “mitoticclock” CpGs in Supplementary Materials). We then overlappedthese 8 sets of informative CpGs and obtained 268 increasing-methylated CpGs and 4,014 decreasing-methylated CpGs. Bothincreasing- and decreasing-methylated are a known frequentcharacteristic of a variety of cancers but seem to affect differentDNA sequences, with hypermethylation playing a transcriptionsilencing role at promoters of many tumor suppressor genesand hypomethylation playing a less understood and more com-plicated role, including activation of tumor promoting genesand increased karyotypic instability [8–15]. Recent researchhas shown that age-associated methylation changes observedwithin normal samples are more coherently observed withintumor samples at age-hypermethylated sites than age-
hypomethylated sites [16]. This is also supported by Yang et al[3]. who also used age-hypermethylated sites in their mitotic-like clock epiTOC and showed that hypomethylation did notcorrelate well with the mitotic index in cancer tissue. Therefore,we chose to use the panel of 268 increasing-methylated CpGs tobuild the MiAge Calculator. We conducted a sensitivity analysisusing the combined panel of the 268 increasing-methylatedCpGs and the 4,014 decreasing-methylated CpGs as theselected panel of 4,282 “mitotic clock” CpGs and observed a lotweaker correlations between estimated mitotic ages and severalsurrogate measures of the unknown true mitotic ages (Supple-mentary Figure S9 for results of the sensitivity analysis using4,282 CpGs). This supports our choice of the panel of 268increasing-methylated CpG sites as the selected informativesites, which is also consistent with previous publications [3,16].Information on these 268 CpGs is presented in SupplementaryTable S2, where averaged informativeness scores were obtainedfrom the 8 sets of informativeness scores from the eight cancertypes in the training data.
We then estimated site-specific parameters ai; bi, EðX1;iÞ ofthe selected panel of 268 “mitotic clock CpGs”. To do so, wefurther randomly selected the same number of tumor and adja-cent normal pairs from each of the 8 cancer types in the train-ing data. This is because, the objective function in Equation (2)is the sum of squares of the differences between expected andobserved methylation values across all samples and all CpGs. Ifthe number of samples of a cancer type is much greater thanthat of other cancer types, it may dominate the objective func-tion and drive the optimization process in its favor. Among the8 cancer types in the training data, UCEC has the smallestnumber of adjacent normal samples (n = 34). We thus ran-domly selected 34 tumor and adjacent normal pairs from other7 cancer types. Using this data with 8 cancer types of 34 tumorand adjacent normal pairs each, we obtained the estimates ofsite-specific parameters ai; bi, EðX1;iÞ of the selected panel of268 “mitotic clock CpGs” through minimizing the objectivefunction in Equation (2). These parameter estimates of the 268“mitotic clock CpGs” are then built-in the MiAge Calculator.The MiAge Calculator can be applied to estimate mitotic agesof any tissue samples using the DNA methylation data of thispanel of 268 CpGs by minimizing the objective function inEquation (2).
With the panel of 268 increasing-methylated “mitotic clock”CpGs (Supplementary Table S2) and the built-in site-specificparameter estimates of the 268 “mitotic clock” CpGs, we canestimate mitotic ages, which are proportional to the truemitotic ages by an unknown constant c. Since this constant c isthe same for all samples, the estimated mitotic ages are compa-rable across samples, across tissue types, and across studies.The MiAge Calculator is computationally efficient with run-ning time increasing linearly with the number of samples. With500 samples, it takes 25 seconds on Intel(R) Xeon(R) CPU E5-2630 0 @ 2.30GHz.
Stability of the MiAge Calculator with respect to the selectionprocedure. Having different number of tumor types in thetraining set may change the mitotic informative clock sitesselected that are commonly increasing-methylated across thesetumor types. We therefore investigated how stable the MiAge
EPIGENETICS 5

Calculator is with respect to the number of tumor types used inselecting the mitotic clock sites. When we defined the mitoticclock sites as those commonly increasing-methylated in at least6 tumor types in the training data, 19,593 mitotic clock siteswere selected. In doing so, we worked on all 28 possible combi-nations of 6 tumor types out of the 8 tumor types and the19,593 mitotic clock sites are the overlapping sites out of the 28sets of mitotic clock CpGs selected from the 28 possible 6tumor sets. When we used 7 tumor types, 4,253 sites were simi-larly selected, compared to the 268 sites selected when we usedall 8 tumor types. Although the number of selected mitoticclock sites varies, the mitotic age estimates using the three dif-ferent sets of mitotic clock sites are highly correlated. We calcu-lated mitotic age of tumor and normal samples of all cancertypes (n = 6,261) and the correlation between mitotic age esti-mates using 268 sites and that using 4,253 sites is 0.97. The cor-relation between mitotic age estimates using 268 sites and thatusing 19,593 sites is 0.89, and the correlation between mitoticage estimates using 4,253 sites and that using 19,593 sites is0.96. These results show that the mitotic age estimated usingthe MiAge Calculator is very robust with respect to the numberof tumor types used in the training data for selecting mitoticclock informative sites.
In addition, in building the MiAge Calculator, after theselection of the 268 increasing-methylated mitotic clock CpGs,we randomly selected subsamples in each of the 8 tumor typesso that every tumor type is represented by equal number ofsamples. This is because, the objective function Equation (2)that estimates mitotic age is the sum of squares of the differen-ces between expected and observed methylation values acrossall samples and all CpGs. If the number of samples of a cancertype is much greater than that of other cancer types, it maydominate the objective function and drive the optimizationprocess in its favor. To investigate the impact of the randomsubsamples on the site-specific parameter estimates of the 268sites, ai; bi, EðX1;iÞ, we also conducted additional analyseswhere we repeated the random subsampling procedure 10 timesand estimated the site-specific parameters of the 268 clock sites.We then estimated mitotic ages of tumor and adjacent normalsamples of all cancer types (n = 6,261) using these 10 sets ofsite-specific parameter estimates. We found that the averagedcorrelation between the 10 sets of parameter estimates usingthe new subsamples and the parameter estimates built-in theMiAge Calculator using the first set of subsample is 0.934 forai, 0.923 for bi and 0.996 for EðX1;iÞ. The averaged correlationbetween the 10 sets of 6,261 mitotic age estimates of tumor andnormal samples of all cancer types (n = 6,261) using the 10 setsof site-specific parameter estimates and that using the MiAgeCalculator is 0.999. These results show that the MiAgeCalculator is very robust with respect to the samples used forits training.
Performance of the MiAge Calculator
Validation of the non-tissue-specific property of the MiAge Cal-culator using a testing data of 5 different cancer types. We firstvalidated the non-tissue-specific property of the MiAge Calcu-lator using a testing data of DNA methylation measures of2,221 samples of 5 independent TCGA cancer types: BLCA,
KIRC, LUAD, LUSC, and STAD. Within each cancer type inthe testing data, we first built a temporary tissue-specific calcu-lator using tumor and adjacent normal tissue samples from thecancer type only and then compared the mitotic ages estimatedusing the temporary tissue-specific calculator with the mitoticages estimated using the non-tissue-specific MiAge Calculator.Within each of the 5 cancer types in the testing data, the corre-lations are 0.98 for BLCA, 0.99 for KIRC, 0.96 for LUAD, 0.92for LUSC, and 0.94 for STAD. The high correlations indicatethat the MiAge Calculator using a panel of 268 CpGs selectedacross the 8 cancer types in the training data is indeed non-tis-sue-specific. The MiAge Calculator therefore can be applied toDNA methylation data of the panel of selected 268 CpGs fromany tissue types.
Validation of MiAge Calculator using surrogate measures ofunknown true mitotic ages. Having validated the non-tissue-specific property of the MiAge Calculator in several indepen-dent cancer types in the testing data, we next validated theMiAge Calculator by correlating mitotic age estimates with sev-eral surrogate measures of unknown true mitotic ages. We cor-related (i) the mitotic age estimates of some cell cultures withtheir passage numbers; (ii) the mitotic age estimates of TCGAtumor samples with number of somatic mutations accumulatedin the same tumor samples across the 13 cancer types in thetraining and testing data; and (iii) the mitotic age estimates ofTCGA adjacent normal samples that are proliferative withpatients’ chronological ages.
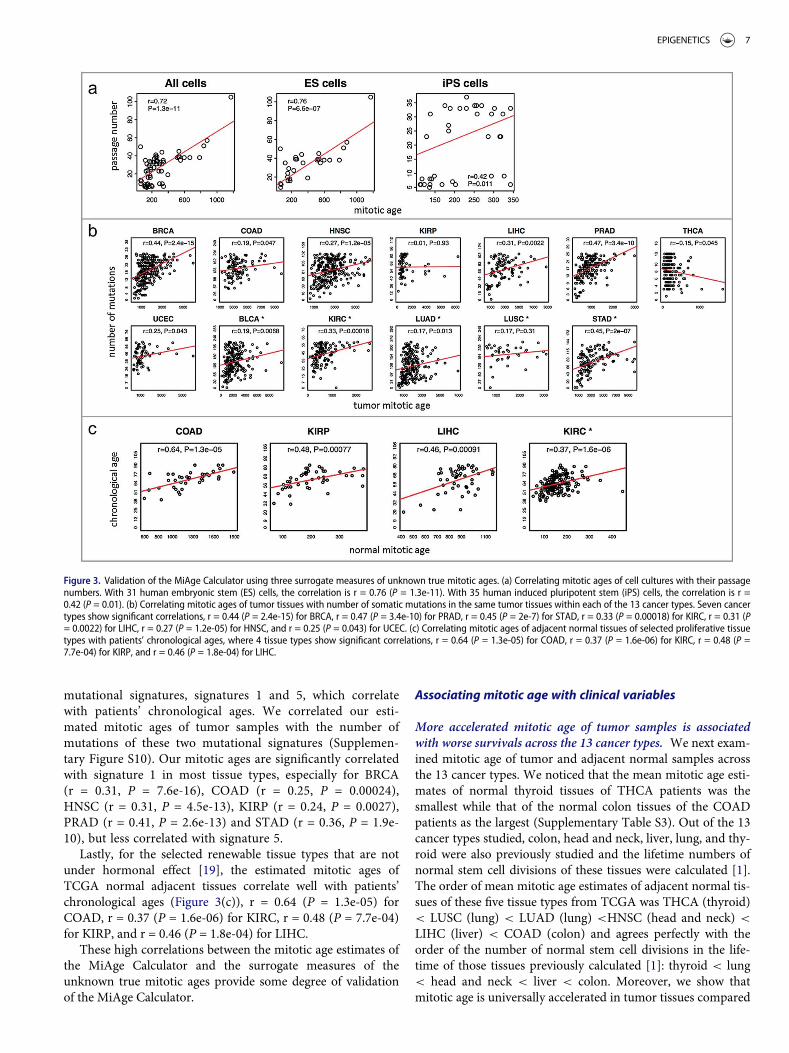
Using the MiAge Calculator, we first estimated mitoticages of 31 human embryonic stem (ES) cells and 35 humaninduced pluripotent stem (iPS) cells and then comparedthose with their passage numbers (Figure 3(a)) [17].Although ES cells and iPS cells are different from tumorcells, the MiAge Calculator can be applied to their methyla-tion measures to estimate the number of cell divisions ofthese cells, since the MiAge Calculator is based on mitoticclock informative CpG sites whose methylation alterationpatterns are mostly related to mitotic activities. The ES cells,although different from tumor and adjacent normal cells,keep dividing when replication errors during cell divisionscumulate. The passage numbers of these cell lines correlatevery well with their mitotic age estimates with r = 0.76(P = 6.6e-07) for the ES cells and r = 0.42 (P = 0.01) for theiPS cells. It is expected that the correlation for the iPS cellsis weaker since iPS cells are artificially derived from a non-pluripotent cell (adult somatic cell) by inducing a set of spe-cific genes. Thus, their passage numbers may not reflect truemitotic age accurately.
The investigation of the relationship between the mitotic ageestimates of tumor samples and the number of somatic muta-tions accumulated in the same tumor samples suggests a highcorrelation in 7 cancer types out of the 13 cancer types in thetraining and testing data (Figure 3(b)), r = 0.44 (P = 2.4e-15)for BRCA, r = 0.47 (P = 3.4e-10) for PRAD, r = 0.45 (P = 2e-7)for STAD, r = 0.33 (P = 0.00018) for KIRC, r = 0.31(P = 0.0022) for LIHC, r = 0.27 (P = 1.2e-05) for HNSC, andr = 0.25 (P = 0.043) for UCEC.
Alexandrov et al [18]. recently investigated clock-likemutational processes in human somatic cells and found two
6 A. YOUN AND S. WANG
mutational signatures, signatures 1 and 5, which correlatewith patients’ chronological ages. We correlated our esti-mated mitotic ages of tumor samples with the number ofmutations of these two mutational signatures (Supplemen-tary Figure S10). Our mitotic ages are significantly correlatedwith signature 1 in most tissue types, especially for BRCA(r = 0.31, P = 7.6e-16), COAD (r = 0.25, P = 0.00024),HNSC (r = 0.31, P = 4.5e-13), KIRP (r = 0.24, P = 0.0027),PRAD (r = 0.41, P = 2.6e-13) and STAD (r = 0.36, P = 1.9e-10), but less correlated with signature 5.
Lastly, for the selected renewable tissue types that are notunder hormonal effect [19], the estimated mitotic ages ofTCGA normal adjacent tissues correlate well with patients’chronological ages (Figure 3(c)), r = 0.64 (P = 1.3e-05) forCOAD, r = 0.37 (P = 1.6e-06) for KIRC, r = 0.48 (P = 7.7e-04)for KIRP, and r = 0.46 (P = 1.8e-04) for LIHC.
These high correlations between the mitotic age estimates ofthe MiAge Calculator and the surrogate measures of theunknown true mitotic ages provide some degree of validationof the MiAge Calculator.
Associating mitotic age with clinical variables
More accelerated mitotic age of tumor samples is associatedwith worse survivals across the 13 cancer types. We next exam-ined mitotic age of tumor and adjacent normal samples acrossthe 13 cancer types. We noticed that the mean mitotic age esti-mates of normal thyroid tissues of THCA patients was thesmallest while that of the normal colon tissues of the COADpatients as the largest (Supplementary Table S3). Out of the 13cancer types studied, colon, head and neck, liver, lung, and thy-roid were also previously studied and the lifetime numbers ofnormal stem cell divisions of these tissues were calculated [1].The order of mean mitotic age estimates of adjacent normal tis-sues of these five tissue types from TCGA was THCA (thyroid)< LUSC (lung) < LUAD (lung) <HNSC (head and neck) <LIHC (liver) < COAD (colon) and agrees perfectly with theorder of the number of normal stem cell divisions in the life-time of those tissues previously calculated [1]: thyroid < lung< head and neck < liver < colon. Moreover, we show thatmitotic age is universally accelerated in tumor tissues compared
Figure 3. Validation of the MiAge Calculator using three surrogate measures of unknown true mitotic ages. (a) Correlating mitotic ages of cell cultures with their passagenumbers. With 31 human embryonic stem (ES) cells, the correlation is r = 0.76 (P = 1.3e-11). With 35 human induced pluripotent stem (iPS) cells, the correlation is r =0.42 (P = 0.01). (b) Correlating mitotic ages of tumor tissues with number of somatic mutations in the same tumor tissues within each of the 13 cancer types. Seven cancertypes show significant correlations, r = 0.44 (P = 2.4e-15) for BRCA, r = 0.47 (P = 3.4e-10) for PRAD, r = 0.45 (P = 2e-7) for STAD, r = 0.33 (P = 0.00018) for KIRC, r = 0.31 (P= 0.0022) for LIHC, r = 0.27 (P = 1.2e-05) for HNSC, and r = 0.25 (P = 0.043) for UCEC. (c) Correlating mitotic ages of adjacent normal tissues of selected proliferative tissuetypes with patients’ chronological ages, where 4 tissue types show significant correlations, r = 0.64 (P = 1.3e-05) for COAD, r = 0.37 (P = 1.6e-06) for KIRC, r = 0.48 (P =7.7e-04) for KIRP, and r = 0.46 (P = 1.8e-04) for LIHC.
EPIGENETICS 7

to adjacent normal tissues across the 13 cancer types in thetraining and testing data (Supplementary Table S3).
We next showed that worse survivals of many cancer typesare associated with more accelerated mitotic age of tumor sam-ples of those cancer types. Specifically, the mean mitotic ageestimates of the 13 tumor tissue types are negatively correlated(r = ¡0.6, P = 0.029) with the percent surviving in 5 years ofthose cancer types (Figure 4(a)). A weaker correlation betweenthat of the 13 adjacent normal tissue types and percent surviv-ing in 5 years (r = ¡0.49, P = 0.091) was observed. When weexcluded STAD tissues for which only two normal sampleswere available, the correlation became ¡0.32 (P = 0.31). InTomasetti and Vogelstein‘s paper [1], the authors concluded ahigh positive correlation between cancer incidence rates andpopulation level number of lifetime stem cell divisions in ahypothetical population. Here we concluded a high negativecorrelation between cancer survival rates and individual levelnumber of cell divisions per lifetime in TCGA cancer patients.
Higher mitotic ages are associated with more advancedtumors. We examined the association between the estimatedmitotic age of a tumor sample with the T/N/M staging variablesthat describe the extent of the cancer. As shown in Figure 5(a),the mitotic ages of tumor tissues increase significantly as the levelof the T staging variable increases in general, except for cancertypes like COAD, HNSC, and LIHC (Supplementary Table S4,Figure 5(a)) after adjusting chronological age. This could partiallybe explained by the difference in definitions of the T staging sys-tem across different tumor types. For example, in stomach, colon,and liver cancers, T stages are determined by the extent of spread
rather than the size of tumors while for breast, kidney, thyroid,and lung cancers, T stages are mainly determined by the tumorsizes. Specifically, the T stage of colon cancer is determined bythe extent of spread through layers forming the colon wall; the Tstage of liver cancer is mainly determined by whether the cancerhas grown into nearby blood vessels or organs; while for breastcancer, T = 1,2,3 is for tumors of increasing sizes and T = 4 is fortumors of any size growing into the chest wall or skin. Themitotic age estimates correlate better with the T stage variableindicating tumor sizes than that indicating tumor spread, astumor sizes are more directly related with the number of cell divi-sions. We also noticed that the mitotic age estimates of tumor tis-sues significantly increase as chronological ages increase, asexpected for most tissue types, but not for KIRP and LUSC. How-ever, for KIRP and LUSC, the mitotic ages of adjacent normal tis-sues are positively correlated with chronological age. This mayimply that for these tissue types, tumors of older patients tend todivide slower than those of younger patients. UCEC, BLCA, andPRAD were excluded from this analysis since T stage informationwas not available for UCEC and there were no or too few T = 1stage tumors for BLCA and PRAD.
As shown in Figure 5(b), the mitotic ages of tumor tissuesincrease as tumor N stage (number of lymph nodes) increasesfor KIRP and THCA (Supplementary Table S4) after adjustingfor chronological age. There is no N stage information forUCEC. For LIHC, PRAD and THCA, there are no N = 2,3tumors. As shown in Figure 5(c), we observed that only for KIRCand KIRP, the mitotic ages of the primary tumors that weremetastasized are significantly higher than those of the primarytumors that were not metastasized (Supplementary Table S4)
Figure 4. Mitotic age of tumor tissues and cancer survival. (a) Higher averaged estimated mitotic ages of tumor tissues are associated with lower 5-year survival ratesacross the 13 cancer types in the training and testing data with r = ¡0.6 (P = 0.029) (left panel). The correlation is weaker and not significant for mitotic age of normaladjacent tissues (right panel). (b) Higher mitotic age is associated with worse survival in some cancers.
8 A. YOUN AND S. WANG

after adjusting for chronological age. This implies thatmetastasis does not necessarily occur late in tumor progres-sion for many tumors. HNSC, LIHC, PRAD, UCEC, andLUSC were excluded from this analysis, as the number ofpatients that have metastatic tumors is less than five. It isimportant to point out that the not-so-strong associationsbetween mitotic age and number of lymph nodes and metas-tasis status is not a limitation of the MiAge model, but, infact, an advantage of mitotic age since this means the mitoticage could provide additional information that current clini-cal information does not offer. It also reflects that biologicalprocesses underlying development of lymph nodes andmetastasis might be unrelated to cell divisions.
Combination of mitotic age with TNM stage informationimproves prediction of patient survival in six out of thirteencancer types studied. Finally, we investigated the prognosticvalue of mitotic age as a predictor of patient survival withineach of the 13 TCGA cancer types. We asked whether the useof mitotic age could lead to improved prediction accuracy ofpatient survival in integration with existing TNM stage infor-mation in individual cancers. To assess this clinical utility ofthe mitotic age-based survival predictor, we performed a two-fold cross validation analysis within each of the 13 cancer types(see details inMaterials and methods). Briefly, for each cancer,in each cross validation, we randomly split patients into a train-ing group of 50% patients and a testing group of the remaining
Figure 5. TNM staging variables and mitotic age estimates of tumor tissues. The plots show the regression coefficients and corresponding 95% CIs associating TNM stag-ing variables and mitotic age estimates of tumor tissues adjusting for chronological age. (a) T variable assumes a number from 1 to 4 and describes tumor sizes and itsspread to nearby tissues with higher T numbers indicating larger tumors or wider spread to nearby tissues. gk is the increase in mitotic ages for the group with T = k com-pared to the reference group with T = 1. (b) N variable assumes a number from 0 to 3 and describes the number of lymph nodes that have cancerous cells with N = 0 indi-cating no cancer in any lymph nodes and higher N numbers indicating a greater spread to nearby lymph nodes. N = 2 and N = 3 tumors were grouped together due tosparse data for most cancer types. gk is the increase in mitotic ages for the group with N = k compared to the reference group with N = 0. (c) M variable determines ifcancer has metastasized to other organs of the body with M = 0 indicating no metastasis and M = 1 indicating metastasis. g1 is the increase in mitotic ages for the metas-tasized group compared to the group with no metastasis.
EPIGENETICS 9

50% patients. Then a Cox regression was used to build the pre-dictive model either using mitotic age only, using TNM stageinformation only, or using TNM stage information plus mitoticage. We then applied the predictive model built from the train-ing group in the testing group to test the model and repeatedthe cross validation procedure 100 times. We used C-index tomeasure the prediction accuracy of the model, where a C-indexof 1 indicates perfect prediction accuracy and a C-index of 0.5indicates random guess.
As shown in Figure 6, in 6 cancer types out of the 13 cancertypes studied, integrating mitotic age with TNM stage informa-tion significantly improves the discriminatory power of clinicalinformation alone (clinical versus clinical + mitotic age P = 3e-04 for BRCA with two-sided paired Wilcoxon rank sum test;P = 2e-13 for KIRC; P = 5e-12 for KIRP; P = 2e-14 for LUSC;P = 3e-11 for STAD; and P = 2e-05 for THCA). C-index resultsfrom multiple prediction models for all 13 cancer types are pro-vided in Supplementary Figure S8. This improved predictionaccuracy across multiple cancers was not due to over-fittingsince the training group and the testing group was completelyseparated with independent patients in the cross validationprocedure. This result illustrates the potential value of utilizingmitotic age as a new predictor to improve cancer prognosis.Further studies are required in order to evaluate the clinical
potential of MiAge, e.g., see if there is an independent prognos-tic value considering TNM stage, tumor size, and patient age.
Comparison of MiAge and epiTOC. The MiAge Calculatoruses a panel of 268 mitotic clock CpGs that were commonlyidentified as increasing-methylated sites when the MiAgemodel was applied to DNA methylation data of each of the 8TCGA cancer types in the training data. These 268 mitoticclock sites together with their estimated site-specific parametersai; bi, EðX1;iÞ make up the MiAge Calculator, which can beapplied to estimate mitotic ages of any samples using theirDNA methylation data of the 268 CpGs by minimizing theobjective function in Equation (2).
The epiTOC selected 385 CpG sites that satisfy the followingthree criteria: (i) CpGs that are unmethylated in fetal tissueencompassing 11 different fetal tissue types; (ii) CpGs in genepromoters marked by the PRC2 polycomb repressive complex[Polycomb group targets (PCGTs)] in human embryonic stem
Figure 6. Boxplots of C-index of different survival predictors of 6 cancer types from cross-validation procedures. The plots show the distribution of C-indexes from 100rounds of cross-validation. P-values are from a paired (two-sided) Wilcoxon rank sum test comparing different survival predictors.
Table 1. CpG sites that are commonly used in the MiAge Calculator and epiTOC.
CpG site ID Gene Symbol Chromosome Genomic Coordinate
cg21264189 POU4F1 13 79177782cg19761848 GBX2 2 237076815
10 A. YOUN AND S. WANG

cells; and (iii) CpGs exhibiting age-associated hypermethyla-tion [false discovery rate (FDR) <0.05] [3]. For any given sam-ple, epiTOC estimates mitotic-like clock, “pcgtAge”, as theaverage DNA methylation level over these 385 CpG sites, whichrepresents the age-cumulative increase in DNA methylationlevel at these sites due to putative cell-replication errors.
Although both methods selected increasing-methylatedsites, only two CpG sites overlap between our 268 mitotic clocksites and their 385 epiTOC sites (Table 1). In spite of this differ-ence, mitotic age from the MiAge Calculator and pcgtAge fromepiTOC of both tumor and adjacent normal samples are highlycorrelated across all tumor types, ranging from 0.7 to 0.97(Table 2).
However, unlike for tumor and adjacent normal samples,mitotic age estimates of the 31 human ES cells and 35 humaniPS cells from the MiAge Calculator and pcgtAge from epiTOCare much less correlated (r = 0.29). Moreover, the correlationbetween pcgtAge of the 31 ES cells and 35 iPS cells and theirpassage numbers is only 0.24 (Figure 7), much lower than thatobserved with the mitotic age estimated using the MiAge Cal-culator, which is 0.72.
Discussion
Although it has been long established that cell division is essen-tial for the development of human cancer, no quantitativemethod exists that can directly estimate total number of celldivisions for cancer risk stratification or prognosis. Veryrecently, independent progress was made where an epigeneticmitotic-like clock was developed focusing on Polycomb-grouppromoter CpGs from which tick rates were predicted andshown to correlate with the rate of stem cell divisions in normaltissues, as well as an mRNA-based mitotic index in cancer tis-sue. Here, we developed the MiAge Calculator that can estimatemitotic ages of any tissue types using DNA methylation data ofa panel of 268 selected “mitotic clock” CpGs. The MiAge Cal-culator is based on the MiAge model, a novel statistical model
that models the stochastic replication errors accumulated inepigenetic inheritance process to infer mitotic ages. The MiAgemodel couples with an iterative procedure to select CpGs thatare informative for the mitotic activities. Using the trainingdata of 4,020 samples from 8 cancer types, we built the MiAgeCalculator that contains a panel of 268 selected informativeCpGs and the parameter estimates of the rate of de novo meth-ylation, rate of the fidelity of methylation maintenance, and themethylation level in the starting methylation state of these 268selected CpGs so that the MiAge Calculator can be readilyapplied by other researchers to any tissue samples that haveDNA methylation data of the selected 268 CpGs.
Although we acknowledge that due to the unidentifiabilityproblem of MiAge, current estimates of mitotic age are propor-tional to the true mitotic ages by an unknown constant c, thisunknown constant is the same for all samples. Thus, the mitoticage estimates of the MiAge Calculator are comparable acrosssamples, across tissue types, and across studies. Importantly,the non-tissue-specific property of the MiAge Calculator wasvalidated in five independent cancer types in the testing dataand the mitotic age estimates were further validated using sev-eral surrogate measures of unknown true mitotic ages. Withhuman ES cells and human iPS cells, the mitotic ages of thesecells are correlated with their passage numbers (r = 0.76 for theES cells and r = 0.42 for the iPS cells). Also supporting this,mitotic ages of TCGA tumor samples correlate with the num-ber of somatic mutations accumulated in the same tumor sam-ples in 7 out of the 13 cancer types studied in the training andtesting data.
Assessment of mitotic ages of TCGA normal adjacent tissuetypes that were also previously studied where the dynamics ofstem cell divisions of these tissue types have been describedexperimentally suggests a perfect agreement in the order of themagnitude of the mitotic age estimates of TCGA normal adja-cent tissues of the MiAge Calculator and number of cell divi-sions of normal stem cells calculated for hypothetical tissuesamples with known dynamics of stem cell divisions [1].
Figure 7. Passage number vs. pcgtAge for ES and iPS cells. The plot shows the correlation between pcgAge of cell cultures and their passage numbers. With 31 humanembryonic stem (ES) cells, the correlation is r = 0.54 (P = 0.0018). With 35 human induced pluripotent stem (iPS) cells, the correlation is r = 0.14 (P = 0.43). With ES andiPS cells combined, the correlation is r = 0.24 (P = 0.056).
Table 2. Correlations between mitotic age estimates from the MiAge Calculator and pcgtAge for tumor and adjacent normal samples across tumor types.
BRCA COAD HNSC KIRP LIHC PRAD THCA UCEC BLCA KIRC LUAD LUSC STAD
tumor 0.91 0.94 0.88 0.95 0.71 0.86 0.84 0.9 0.87 0.9 0.86 0.81 0.92normal 0.88 0.86 0.89 0.83 0.74 0.97 0.87 0.89 0.97 0.85 0.71 0.83 NA
EPIGENETICS 11

Another important finding of ours that shows a negative corre-lation (r = ¡0.6) between mitotic ages of tumor tissues and thepercent surviving in 5 years across the 13 TCGA cancer typesagrees with the previous conclusion that the lifetime risks ofmany cancers are positively correlated with the lifetime numberof cell divisions of normal stem cells within those tissues inhypothetical subjects from a different angle [1]. Although theassociation between mitotic age of TCGA tumor tissues andnumber of lymph nodes and metastasis status are less conclu-sive, we consider this an advantage of the mitotic age thatmeasures something current clinical information does not.Mitotic age is only observed to be associated with lymph nodesin KIRP and THCA and with metastasis status in KIRC andKIRP; therefore, reflect biological processes underlying devel-opment of lymph nodes and metastasis might be unrelated tocell divisions.
Finally, with cross-validation analyses, we evaluated theprognostic value of mitotic age and compared it to that of clini-cal information for predicting patient survival. We show thatthe mitotic age can be used as a predictor for patient survival,with improved prediction accuracy integrating mitotic age andclinical information than that of clinical predictors alone in 6out of the 13 cancer types studied. This promising result callsfor further studies to fully explore the utility of mitotic age ineach individual cancer for different clinical applications.
The MiAge Calculator can be readily applied to methylationmeasures from the MethylationEPIC array. Two hundred andforty-one sites out of the 268 selected mitotic clock CpGs arealso on the EPIC array. Note that if methylation measures from450K and EPIC array are going to be combined, a normaliza-tion step to calibrate 450K data and EPIC data should be con-ducted, where we could use the R code from Horvath https://labs.genetics.ucla.edu/horvath/dnamage/NORMALIZATION.R. For bisulfite sequencing data, the MiAge Calculator can alsobe readily applied if sequencing data are processed into methyl-ation percentages. Although with the greater coverage of theEPIC array and sequencing data the MiAge Calculator may beupdated if data were available, our sensitivity analysis using dif-ferent subsets of the mitotic informative CpGs showed that themitotic age estimates are highly correlated with almost all cor-relations greater than 0.9.
The MiAge Calculator was built using the 450K data withoutType I/II probe normalization but with sites on sex chromo-somes and sites overlapping with single nucleotide polymor-phisms (SNPs) being removed. We also investigated thepotential impact of having or not having Type I/II probe nor-malization on building the MiAge Calculator. We found thatthe estimates of the site-specific parameters of the 268 mitoticclock CpGs using methylation data with and without Type I/IIprobe normalization are almost perfectly correlated with a cor-relation of 0.999 for ai, 0.999 for bi, and 0.996 for EðX1;iÞ. Themitotic age estimates of tumor and adjacent normal samples ofall tumor types (n = 6,261) using methylation data with andwithout Type I/II probe normalization are also almost perfectlycorrelated (r = 0.9995). Finally, the mitotic age estimated usingthe 268 site-specific parameter estimates from Type I/II probenormalized methylation measures are almost perfectly corre-lated with that estimated using the MiAge Calculator(r = 0.9988). These findings suggest that the MiAge Calculator
is very robust and can be readily applied to other types of meth-ylation data with different data processing steps.
The MiAge Calculator together with the source code is avail-able for downloading at http://www.columbia.edu/»sw2206/softwares.htm. The MiAge Calculator can be applied to any tis-sue types of any cancer type. The current statistical frameworkof the MiAge Calculator is applicable to DNA methylation pro-portion data. Other type of DNA methylation data generatedfrom other platforms, such as sequencing platforms, can beused with the MiAge Calculator if processed from counts datato proportion data.
Although we focused on cancer applications of the MiAgeCalculator, it is readily applicable to aging studies using DNAmethylation measures to estimate mitotic age as a new molecu-lar target of aging marker.
Materials and methods
MiAge is coupled with a procedure to select informative CpGs.
At each CpG i, we can safely assume the fidelity of methylationmaintenance bi ¼ 1
2ð1þ mi � dpi � ddi Þ is between 0 and 1
because the methylation maintenance rate mi is in general closeto 1 and the de novo methylation rates ai ¼ ðdpi þ ddi Þ=2 areclose to 0 [7,20]. For those CpGs with bi ¼ 1, we haveEðXnj;iÞ ¼ EðX1;iÞ, which means the methylation levels in the
nthj cell generation of sample j are the same as that in the 1st cell
generation. Thus, CpGs with bi = 1 are not informative in esti-mating mitotic age. For CpGs with unstable methylation levels,e.g., when both probabilities for failure of maintenance(1� mi) and the de novo methylation rates ai ¼ ðdpi þ ddi Þ=2are comparatively high, their fidelity of methylation mainte-nance bi ¼ 1
2ð1þ mi � dpi � ddi Þ will be small. These CpGs have
EðXnj;iÞ � ai1�bi
for a reasonable range of nj (e.g., if bi < 0:5, bnj�1i
� 0 when nj > 50) according to Equation (1). Therefore, thoseCpGs are like CpGs with bi ¼ 1 and are not informative in esti-mating mitotic age. For those uninformative CpGs, we haveEðXnj;iÞ ¼ ci for some site-specific nuisance parameter ci that isunrelated to mitotic age nj. For all other informative CpGs,methylation levels either monotonically increase as nj increases(increasing-methylated CpGs) if EðX1;iÞ � ai
1�bi< 0 or monoton-
ically decrease otherwise (decreasing-methylated CpGs).The second step of MiAge is thus an iterative procedure to
update the separation of informative CpGs modeled with EðXnj;iÞ ¼ ai
1�biþ b
nj�1i ðEðX1;iÞ � ai
1�biÞ from uninformative CpGs
modeled with EðXnj;iÞ ¼ ci. With each CpG site being labeledas informative or uninformative, the objective function f inEquation (2) which measures the discrepancy between theobserved methylation measures and the expected methylationmeasures under the MiAge model becomes:
f ¼Xi
Xj
ðEðXnj;iÞ � bi;jÞ2
¼Xi
f uni IðCpG i is uninformativeÞ�þ f ini IðCpG i is informativeÞg; (3)
12 A. YOUN AND S. WANG

where f uni ¼ Pjðci � bi;jÞ2 sums over all tissue samples j = 1,…,J
at uninformative CpG i, and f ini ¼Pið ai
1�biþ b
nj�1i ðEðX1;iÞ � ai
1�biÞ � bi;jÞ
2sums over all tissue sam-
ples j = 1,…,J at informative CpG i, and I() is an indicator function.
Informativeness score si and cutoff c0. Since we do not know apriori which CpGs are informative, we need to determine thisduring the model fitting procedure. To do so, we developed aninformativeness score si for each CpG i, defined assi ¼ minciðf uni Þ �minai;bi;EðX1;iÞðf ini j njÞ. The informativenessscore si for each CpG i is the difference of residual sum ofsquares between the two models for CpG site i: model for unin-formative sites EðXnj;iÞ ¼ ci and model for informative sitesEðXnj;iÞ ¼ ai
1�biþ b
nj�1i ðEðX1;iÞ � ai
1�biÞ. By comparing which of
the two models fit the observed methylation data at CpG site ibetter, we choose between whether the CpG site i is informativeor uninformative. Because the model for informative sites hasmore parameters, the residual sum of squares for CpG i (thesum of squares of the difference between observed and expectedmethylation levels, summed over all tissue samples at CpG i)under the model for uninformative sites: minciðf uni Þ ¼ minciðPjðci � bi;jÞ2Þ ¼
Pjðbi;: � bi;jÞ2 will be larger than
that under the model for informative sites:minai;bi;EðX1;iÞðf ini j njÞ ¼ minai;bi;EðX1;iÞð
Xjð ai1� bi
þ bnj�1i ðEðX1;iÞ � ai
1� biÞ � bi;jÞ
2 j njÞ.Note that ci ¼ bi is average of methylation values for CpG site iacross all samples.
Thus, we need to define a cutoff c0 (>0, to be discussed next)for si prior to the optimization process of the objective functionin Equation (3). Once c0 is determined, it is fixed during theiterative optimization procedure where sites with si > c0 are setas informative and sites with si�c0 are set as uninformative.The objective function f then becomes:
f ¼Xi
Xj
EðXnj;iÞ � bi;j
� �2¼
Xi
f uni Iðsi�c0Þ þ f ini Iðsi > c0Þ� �
:
(4)
To determine the cutoff c0, we calculated si for each CpG site iunder the “null model” when methylation levels do not changeas cell divides. Under the “null model”, we assigned mitotic agenj to each tissue sample j generated randomly from a Unif(100,3000) distribution and calculated �si ¼ minciðf uni Þ �minai;bi;EðX1;iÞðf ini j njÞ j null model for each CpG site i. Note thatin calculating �si, we treated randomly generated nj for tissuesample j as known, but estimated site-specific parameters ai; bi;EðX1;iÞ minimizing f ini . Here, �si can be considered as thedecrease in the residual sum of squares purely due to over-fit-ting. Therefore, we set maxið�siÞ over all available CpG sites asthe cutoff c0. We conducted a simulation study to investigatethe impact of different cutoffs on the performance of MiAge.The simulation results support the choice of c0 ¼ maxið�siÞ(Supplementary Materials).
Optimization procedure. With c0 determined, we estimate theparameters nj and other site-specific parameters ai; bi; EðX1;iÞminimizing the objective function in Equation (4) through thefollowing iterative optimization process.
Let nð1Þj denote the initial value of mitotic age assigned to
each tissue sample j. Given nð1Þj , at CpG site i, we calculate sð1Þi
and determine if CpG i is informative (if sð1Þi > c0) or uninfor-
mative (if sð1Þi � c0). In calculating sð1Þi , we estimate site-specific
parameters að1Þi ; bð1Þi ; EðX1;iÞð1Þ; minimizing f ini j nð1Þj and f uni ,
respectively subject to the following linear inequality con-
straints 0� að1Þi þ bð1Þi � 1; 0� að1Þi ; bð1Þi ; EðX1;iÞð1Þ� 1: We thenupdate nj to minimize the following objective function giventhese site-specific parameters
f ð1Þ ¼X
i
Xjðcð1Þi � bi;jÞ2Iðsð1Þi �c0Þ
n
þX
j
að1Þi
1� bð1Þi
þ ðbð1Þi Þnð1Þj �1ðEðX1;iÞð1Þ�
� að1Þi
1� bð1Þi
Þ � bi;jÞ2Iðsð1Þi > c0Þg;
with the constraint 10�nj�10000 and obtain nð2Þj . We itera-
tively repeat the above steps until f ðnÞ converges. We used theR function ‘optim’ to find parameters minimizing a given func-tion.
Unidentifiability problem of MiAge. One important caveatwhen minimizing the objective function f in Equation (4) isthat there is no unique solution minimizing f. This is because
f ¼Xj
Xi
ai1� bi
þ bnj�1i EðX1;iÞ � ai
1� bi
� �� bi;j
� �2Iðsi > c0Þ
(
þXi
ci � bi;j
� �2Iðsi�c0Þg
¼Xj
Xi
ai1� bi
þ ðb1ci Þcðnj�1Þ EðX1;iÞ � ai1� bi
� �� bi;j
� �2
Iðsi > c0Þ(
þXi
ci � bi;j
� �2Iðsi�c0Þg:
Therefore, the sets nj� �
and fn0j ¼ c�ðnj � 1Þ þ 1g for a
constant c give the same value of f with different sets of site-
specific parameters ai; bi; EðX1;iÞ� �
and fa0i; b
0i; EðX1;iÞ
0g if b0i ¼
b1c
i andai
1�bi¼ a
0i
1�b0i, EðX1;iÞ ¼ EðX1;iÞ
0. That is, if the true mitotic
age of tissue sample j is nj� �
, the best estimate will be
fn0j ¼ c�ðnj � 1Þ þ 1g for some constant c. Thus, the estimated
mitotic age is proportional to the true mitotic age and shouldbe interpreted as a relative number rather than an actual num-ber. Similarly, the estimated site-specific parameters for CpGsite i are also proportional to the true values. This is becausewhen bi is close to 1 for informative sites, we havebi ¼ ðb0
iÞc ¼ ð1� ð1� b0iÞÞc � 1� ð1� b
0iÞ�c ¼ 1� cþ b
0i�c. a
0i
is also linearly related with ai because ai1�bi
¼ a0i
1�b0i.
Simulation studies of MiAge. We conducted a set of simula-tion studies to investigate the robustness of MiAge when theassumption that the site-specific parameters ai; bi, EðX1;iÞ at
EPIGENETICS 13

CpG i are the same across samples is not met. To do so, wesimulated methylation data allowing each sample j to havedifferent site-specific parameters. Note the correspondencebetween site-specific parameters ai; bi and the original parame-ters on methylation transmission rates mi; d
pi ; d
di at CpG i:
dpi þ ddi ¼ 2ai, and mi ¼ 2ðai þ biÞ � 1, where parameters d
pi
and ddi cannot be separated. Specifically, for each sample j, wefirst simulated site-sample-specific parameters mi;j; di;j ¼ ðdpi;j þddi;jÞ=2 and EðX1;i;jÞ, where mi;j were simulated from Unif ðmi �0:975;minðmi � 1:025; 1ÞÞ and mi is the parameter estimatedfrom the TCGA BRCA data. Other site-sample-specific param-eters di;j and EðX1;i;jÞ were similarly simulated. With these site-sample-specific parameters, we then calculated the expectedmethylation level EðXnj;i;jÞ at CpG i for sample j given nj usingEquation (1) and added large errors ei;j »Nð0; 0:05Þ.
We also investigated the robustness of MiAge when theassumption that all cells of tissue sample j have gone through thesame number of cell divisions nj is not met, but instead a tissuesample is a mixture of different types of cells with differentmitotic ages. We simulated methylation values bi,j for CpG i ofsample j as a mixture of methylation values from two or moredifferent types of cells whose true mitotic ages are different. Wefirst simulated mixture samples consisting of two cell types, withproportion of the dominating cell type = 0.7, 0.8, 0.9 (see Supple-mentary Materials for detailed simulation steps). We then simu-lated mixture samples consisting of three cell types, withproportion of the dominating cell type = 0.7, 0.8, 0.9 and propor-tion of each of the other two minor cell types = 0.15, 0.1, 0.05,respectively. Similarly, we simulated mixture samples consistingof four cell types with proportion of the dominating cell type =0.7, 0.8, 0.9 and proportion of each of the other three minor celltypes = 0.1, 0.0667, 0.0333, respectively.
We further investigated if multiple DNA methylation data-sets from multiple tissue types can be combined and the mitoticage estimates across different tissue types can be compared.Here, we allowed the site-specific parameters ai; bi, EðX1;iÞ atCpG i to be first different across tissue types then differentacross samples within a tissue type (see Supplementary Materi-als for detailed simulation steps).
Validation of MiAge Calculator as non-tissue-specific usingtesting data of 5 different TCGA cancer types. The MiAge Cal-culator built with the training data of 8 cancer types is expectedto be non-tissue-specific and can be applied to any tissue types.We validated this property using the testing data of 5 indepen-dent TCGA cancer types. To do so, we first built a temporary tis-sue-specific calculator for each cancer type in the testing data. Tobuild the temporary tissue-specific mitotic age calculator foreach cancer, we used the same panel of selected 268 “mitoticclock” CpGs but estimated the site-specific parameters usingavailable tumor and adjacent normal samples of each cancertype in the testing data instead of using the MiAge Calculatorbuilt-in parameters estimates. We then examined the correlationbetween mitotic ages estimated using the MiAge Calculator andmitotic ages estimated using the temporary tissue-specific calcu-lator for each cancer type in the testing data. High correlationsindicate that the MiAge Calculator is non-tissue-specific and canbe applied to DNA methylation data of the selected panel of 268“mitotic clock CpGs” of any tissue types.
Validation of MiAge Calculator using surrogate measures ofunknown true mitotic ages. We next validated the MiAge Cal-culator by correlating estimated mitotic ages with several surro-gate measures of the unknown true mitotic age: (i) correlatingmitotic ages of cell cultures with their passage number; (ii)within each of the 13 cancer types in the training and testingdata combined, correlating mitotic ages of TCGA tumor sam-ples with number of somatic mutations accumulated in thesame tumor samples; and (iii) correlating mitotic ages of adja-cent normal samples with the patients’ chronological age withineach of the selected tissue types that are proliferative.
We obtained 450K DNA methylation data of 31 human EScells and 35 human iPS cells [17]. We estimated mitotic ages ofthese cell cultures using the MiAge Calculator and correlatedthem with the passage numbers of these cell cultures.
Within each of the 13 cancer types, we then investigated therelation between the estimated mitotic age of tumor samplesand the number of somatic nucleotide mutations accumulatedin the same tumor samples. Although somatic mutations areacquired during each cell division with very low probabilities,the number of somatic mutations accumulated can reflect thetotal number of cell divisions the cell has undergone. Onepotential problem of using this measure is that there are sam-ples with much higher mutation rates than others due to factorslike environmental mutagens or mutations in genes that main-tain genomic stability. Those samples tend to accumulate moresomatic mutations and their mitotic ages might be overesti-mated [21]. To correlate number of somatic mutations intumor samples and their mitotic age estimates, we thusrestricted to tumor samples with number of somatic mutationsbelow the median of all samples within that tumor type. To cal-culate the number of somatic mutations per tumor sample, wealso excluded mutations in candidate cancer driver genes iden-tified by the MutSIG algorithm at FDR �0.3 [22].
Lastly, within each of these renewable tissue types out of the 13tissue types in the training and testing data combined, we com-pared the estimated mitotic ages of adjacent normal samples withthe chronological ages of the patients. While the mitotic age of atumor tissue is usually larger than that of the adjacent normal tis-sue from the same patient, the tumor and adjacent normal samplesof the same patient have the same chronological age. Mitotic agesof normal proliferative tissues that consist of mitotic cells capableof proliferation may correlate better with chronological age whilemitotic ages of tissues that do not divide or tissues whose divisionsare under hormonal effect may not correlate well with chronologi-cal age. Therefore, we compared mitotic ages of adjacent normaltissues from the major renewable organs such as colon, liver, andkidney with their chronological ages.
High correlations between the mitotic age estimates and thesurrogate measures provide some degree of validation of theMiAge Calculator.
Correlation of individual-level mitotic age with individual-level clinical information and survival within each cancer.Within each cancer, we evaluated associations between mitoticage of tumor samples with widely used T/N/M staging variablesthat describe the extent of the cancer. For the TCGA T/N/Mstaging variables, the T variable describes tumor sizes and itsspread to nearby tissues; the N variable describes the number
14 A. YOUN AND S. WANG

of lymph nodes that have cancerous cells; the M variable deter-mines if cancer has metastasized to other organs of the body.To examine the relationship between mitotic age of tumor sam-ples with the T/N/M staging variables, we fit the following lin-ear regression adjusting for patients’ chronological ages:
estimated mitotic age of tumor tissues
¼ aþ h�chronological ageþX
gk�IðT=N=M ¼ kÞ; (4)
where I is an indicator for the T/N/M staging variable withT = 1/N = 0/M = 0 as the reference group. Therefore, gk can beconsidered as the increase in mitotic ages for the T/N/M stagingvariables of group k compared to the reference group. The esti-mate of h is the increase in mitotic ages per one year increase inchronological age. We also examined mitotic age estimates oftumor samples to that of the matched adjacent normal samplesand examined the association between time to death and dichoto-mized mitotic age of tumor samples categorized at median usingKaplan-Meier curves and the log-rank test.
Evaluation of estimated mitotic age as a survival predictorusing cross-validation. Within each of the 13 cancer types, weevaluated and compared the survival prediction using clinicalinformation alone, using mitotic age alone, and using clinicalinformation plus mitotic age. We used two-fold cross validationwhere in each round of cross validation we randomly split cancerpatients into two groups with 50% patients in the training groupand the remaining 50% patients in the testing group. We usedeven split to ensure there are enough death events in both groups.With the training group, we built the survival prediction modelbased on estimated mitotic age, clinical information with one ofthe TNM staging variables, whichever is the most significant, andclinical information plus estimated mitotic age. After the modelwas built using the training group, we used the testing group totest the prediction accuracy of the predictive model using the C-index [23], where a C-index of 1 indicates perfect prediction and aC-index of 0.5 indicates random guess. We repeated the cross vali-dation 100 times and compared C-indexes from different predic-tive models using a paired (two-sided)Wilcoxon rank sum test.
Disclosure of potential conflicts of interest
No potential conflicts of interest were disclosed.
References
[1] Tomasetti C, Vogelstein B. Variation in cancer risk among tissuescan be explained by the number of stem cell divisions. Science.2015;347:78–81. doi:10.1126/science.1260825. PMID:25554788
[2] Wu S, Powers S, Zhu W, et al. Substantial contribution of extrinsicrisk factors to cancer development. Nature. 2016;529:43–47.doi:10.1038/nature16166. PMID:26675728
[3] Yang Z, Wong A, Kuh D, et al. Correlation of an epigenetic mitoticclock with cancer risk. Genome Biol. 2016;17:205. doi:10.1186/s13059-016-1064-3. PMID:27716309
[4] Bromham L, Penny D. The modern molecular clock. Nat Rev Genet.2003;4(3):216–224. doi:10.1038/nrg1020. PMID:12610526
[5] Shibata D. Inferring human stem cell behaviour from epigenetic drift.J Pathol. 2009;217(2):199–205. doi:10.1002/path.2461. PMID:19031430
[6] Shibata D, Tavar S. Counting Divisions in a Human Somatic CellTree: How, What and Why. Cell Cycle. 2006;5(6):610–614.doi:10.4161/cc.5.6.2570. PMID:16582617
[7] Genereux DP, Miner BE, Bergstrom CT, et al. A population-epige-netic model to infer site-specific methylation rates from double-stranded DNA methylation patterns. Proc Natl Acad Sci U S A.2005;102:5802–5807. doi:10.1073/pnas.0502036102. PMID:15827124
[8] Ehrlich M.. DNA methylation in cancer cells. Epigenomics. 2010;1(2):239–259. doi:10.2217/epi.09.33.
[9] Wilson AS, Power BE, Molloy PL. DNA hypomethylation andhuman diseases. Biochimica et Biophysica Acta. 2007;1775:138–162.PMID:17045745
[10] Ehrlich M. DNA methylation in cancer: too much, but also too little.Oncogene. 2002;21(35):5400–5413. doi:10.1038/sj.onc.1205651.PMID:12154403
[11] Kulis M, Esteller M. DNA methylation and cancer. Adv Genet.2010;70:27–56. PMID:20920744
[12] Ehrlich M. Cancer-linked DNA hypomethylation and its relationshipto hypermethylation. Curr Top Microbiol Immunol. 2006;310:251–274. PMID:16909914
[13] Shahrzad S, Bertrand K, Minhas K, et al. Induction of DNA Hypo-methylation by Tumor Hypoxia. Epigenetics. 2007;2:119–125.doi:10.4161/epi.2.2.4613. PMID:17965619
[14] Hon GC, Hawkins RD, Caballero OL, et al. Global DNA nypomethy-lation coupled to repressive chromatin domain formation and genesilencing in breast cancer. Genome Res. 2012;22:246–258.doi:10.1101/gr.125872.111. PMID:22156296
[15] Jones PA. DNA methylation and cancer. Cancer Res. 1986;46:461–466. PMID:2416425
[16] Lin Q, Wagner W. Epigenetic aging signature are coherently modi-fied in cancer. PLoS Genet. 2015;11(6):e1005334. doi:10.1371/journal.pgen.1005334. PMID:26110659
[17] Nazor KL, Altun G, Lynch C, et al. Recurrent variations in DNAmethylation in human pluripotent stem cells and their differentiatedderivatives. Cell stem cell. 2012;10:620–634. doi:10.1016/j.stem.2012.02.013. PMID:22560082
[18] Alexandrov LB, Jones PH, Wedge DC, et al. Clock-like mutationalprocesses in human somatic cells. Nat Genet. 2015;47(12):1402–1407. doi:10.1038/ng.3441. PMID:26551669
[19] Cooper GM, Hausman RE. The cell: A molecular approach.6th edition. Sunderland (Massachusetts): Sinauer Associates. 2013.
[20] Laird CD, Pleasant ND, Clark AD, et al. Hairpin-bisulfite PCR:assessing epigenetic methylation patterns on complementary strandsof individual DNA molecules. Proc Natl Acad Sci USA. 2004;101(1):204–209. doi:10.1073/pnas.2536758100. PMID:14673087
[21] Youn A, Simon R. Using passenger mutations to estimate the timingof driver mutations and identify mutator alterations. BMC Bioinfor-matics. 2013;14:363. doi:10.1186/1471-2105-14-363. PMID:24330428
[22] Lawrence MS, Stojanov P, Polak P, et al. Mutational heterogeneity incancer and the search for new cancer-associated genes. Nature.2013;499:214–218. doi:10.1038/nature12213. PMID:23770567
[23] Pencina MJ, D’Agostino RB. Overall C as a measure of discrimina-tion in survival analysis: model specific population value and confi-dence interval estimation. Stat Med. 2004;23:2109–2123.doi:10.1002/sim.1802. PMID:15211606
EPIGENETICS 15