Embed Size (px)
Citation preview

The mechanical properties and modeling of a sintered hollow spheresteel foam
S.T. Szyniszewski a,!, B.H. Smith b, J.F. Hajjar c, B.W. Schafer d, S.R. Arwade b
a Dept. of Civil and Env. Eng., University of Surrey, Guildford GU2 7XH, United Kingdomb Dept. of Civil and Env. Eng., University of Massachusetts, Amherst, MA 01003, United Statesc Dept. of Civil and Env. Eng., Northeastern University, Boston, MA 02115, United Statesd Dept. of Civil Eng., Johns Hopkins University, Baltimore, MD 21218, United States
a r t i c l e i n f o
Article history:Received 21 January 2013Accepted 14 August 2013Available online 29 August 2013
Keywords:Steel and metal foamExperimental characterizationFoam plasticityPlastic Poisson’s ratioFoam fracture and failureStochastic modelling of materials
a b s t r a c t
This paper characterizes mechanical properties of hollow sphere (HS) steel foam, and applies calibratedDeshpande–Fleck plasticity to mechanical simulations of steel foam components. Foamed steel, steelwith internal voids, provides enhanced bending rigidity, exceptional energy dissipation, and the potentialto mitigate local instability. The experimental characterization of the hollow sphere foam encompassescompressive yield stress and densification strain, compressive plastic Poisson’s ratio, compressiveunloading modulus, as well as tensile elastic modulus, tensile unloading modulus, tensile yield stress,tensile fracture strain, and shear yield stress and fracture strain. Since HS steel foam is compressibleunder triaxial pressure, Deshpande–Fleck plasticity of compressible metals was calibrated and employedin simulations. Plastic Poisson’s ratio, measured in a uniaxial test, is an important metric of foam com-pressibility, and it affects the response of the foam to multi-axial loadings significantly. This work is partof a larger effort to help develop steel foam as a material with relevance to civil engineering applications.
! 2013 Elsevier Ltd. All rights reserved.
1. Introduction
Developments in the manufacturing, processing, and applica-tions of novel metallic foams offer a promise for a significant tech-nological advancement of metallic materials. Steel foam is poroussteel, with intentionally introduced voids varying in size fromnano- to millimeters. Porosity of steel foam can be controlled,and since it affects mechanical properties of the material, Young’smodulus and yield stress can be tuned for specific needs by adjust-ing the foam porosity [1]. Mutlu and Oktay [2] reported successfulmanufacturing of Cr–Si–Ni–Mo based steel foams, and Hsu et al.produced Ti–7.5Mo alloy metallic foam [3]. These recent develop-ments indicate that increasingly exotic metallic materials are em-ployed in metallic foams.
Metallic foams, when properly designed, provide lighter andstiffer elements than solid steel components [1]. Also, metallicfoams are renowned for their compressibility of 0.9 engineeringstrain or more [4], giving them extraordinary energy dissipationcapacity [1], which is instrumental in arresting extreme dynamicevents because it dissipates the kinetic energy. Once the kinetic en-ergy is removed completely, the system reaches a stable state
[5–7]. Energy dissipation capacity has been experimentally ob-served in metallic foams even under high strain rates [8].
Metal foams enable components with higher buckling resis-tance and lower weight in comparison to traditional solid steelstructures [9]. Sandwich panels, with a metallic foam core, increasebuckling resistance even further [10,11]. Box columns with sand-wich panel walls were shown to improve buckling capacity overconventional cold-formed steel solutions [12]. Theoretical solu-tions are also available to predict behavior of sandwich panels: un-der combined in-plane compression and bending loads [13,14] aswell as for buckling of panels with functionally graded cores[15]. ‘‘An important structural advantage of metallic foams thathas not been demonstrated to date is the conversion of limit statesfrom unstable buckling modes with little or no energy dissipationto stable modes with crashing and/or post-buckling’’ [16].
Sandwich panels, with a metallic foam core, have bending stiff-ness to weight ratio an order of magnitude greater than a solidplate of the same weight [17,18]. A parking garage metallic foamfloor slab was manufactured, and full-scale load tests carried outsuccessfully. The use of the metal mesh reinforced panels reducedthe weight of the floors by 75% in comparison to conventional rein-forced concrete decks [19]. Lefebvren et al. [20], Banhart and See-liger [17] and Smith et al. [16] provide an extensive overview ofcurrent industrial applications of metallic foams.
Multi-physics properties of metallic foams such as: lower ther-mal conductivity [21], vibration attenuation [22], sound absorption
0261-3069/$ - see front matter ! 2013 Elsevier Ltd. All rights reserved.http://dx.doi.org/10.1016/j.matdes.2013.08.045
! Corresponding author. Address: 01 AA 03, Thomas Telford Building, Guildford,Surrey, GU2 7XH, United Kingdom. Tel.: +44 1483 68 3390.
E-mail addresses: [email protected], [email protected] (S.T.Szyniszewski).
Materials and Design 54 (2014) 1083–1094
Contents lists available at ScienceDirect
Materials and Design
journal homepage: www.elsevier .com/locate /matdes

[23], fluid flow through open cells [22], fire resistance [24], electro-magnetic [25] and radiation [26] shielding give metallic foams anadvantage over conventional materials with comparable structuralcharacteristics. There is great potential for multi-functional appli-cations, though such designs require more sophisticated analysismethodologies.
Metal foams differ from solid steel significantly, and warrantnovel modeling approaches. Steel foam is compressible after yield[27,28], unlike solid steel, which exhibits only shear deformationsand is incompressible in the plastic regime. Also, foams often frac-ture under tensile strains noticeably lower than crushing and com-paction strains [29], thus warranting a tailored failure criterion.
This research not only characterizes novel steel foams, but alsoinvestigates calibration of plasticity formulations suitable for por-ous metals, such as Deshpande–Fleck (D–F) plasticity [27]. Also,failure criteria available in the literatures [29,30] are evaluatedagainst experimental results, and alternative approaches to failuremodeling are proposed. This work is specifically focused on steelfoam produced by the sintering of metal hollow spheres, but theprinciples may be applicable to a much greater variety of metalfoams.
2. Materials and methods
Fifty hollow sphere (HS) steel foam bars of approximate relativedensity 0.15 were acquired from the Fraunhofer Institute for Ad-vanced Materials (IFAM) in Dresden, Germany. Each bar measuresapproximately 250 mm ! 52 mm ! 55 mm and is composed of amild steel of between 0.3% and 0.5% carbon. Measurement of thegeometry of 50 spheres under an optical microscope at five timesmagnification yielded mean sphere diameter of 1.86 mm and meansphere thickness of 0.08 mm.
Test specimen geometry and loading characteristics for com-pression, tension, and shear tests were selected to follow guidanceprovided by international standards as closely as possible while
accommodating the constraints imposed by the available testingequipment and the characteristics of the Fraunhofer HS foam,including the challenges presented by machining it. Details of thespecimens and test setup used in each of the three tests is de-scribed in the following sections, and shown photographically inFig. 1. The HS foam, which is formed by sintering the hollow steelspheres together, contains relatively weak bonds between thespheres, and we found that lathes, mills, and other rotational toolswere ineffective at smoothly removing material, instead removingentire spheres or clusters of spheres and leaving highly irregularsurfaces. However, cutting the material with a band saw with afine-tooth blade was effective, though it was difficult to form com-plicated geometries with this technique.
2.1. Compression specimens and testing protocol
For compression, draft standard ISO/DIS 13314 ‘‘CompressionTest for Porous and Cellular Metals’’ [31], suggests that rectilinearprismatic specimens should have a square cross-section and have aheight to width ratio of between 1.5 and 2.0. We selected a height-to-width ratio of 1.45–1.55 (80 mm ! 52 mm ! 55 mm) so thatthree test specimens could be machined from each250 mm ! 52 mm ! 55 mm bar. Specimens with dimensions25 mm ! 25 mm ! 55 mm were machined for tests designed tocapture the large strain densification behavior of the material.
The compression specimens were tested in a screw driven In-stron 3369 material testing machine between flat stainless steelplatens that were lubricated with a standard heavy axle grease atapplied strain rates between 10"3.7 s"1 and 10"4.0 s"1. This rangeof strain rates ensures slower load application than the minimumstrain rate of 10"3.0 s"1 defined in the ISO/DIS standard, and wasselected to allow manual measurement of the transverse strainduring compression testing. Transverse strain is required for calcu-lation of the material Poisson’s ratio, a critical calibration parame-ter for the constitutive model described later in this paper.
Fig. 1. From left to right: (a) compression test with longitudinal extensometer; (b) mounted tension specimen with longitudinal extensometer; and (c) mounted shearspecimen with longitudinal extensometer in the upper right.
Table 1Compression test characteristics.
Measurement Loading type Strain rate s"1 Strain acquisition Specimen size
Densification strain Monotonic compression 10"3.7 Crosshead displacement 55 mm ! 25 mm ! 25 mmPoisson’s ratio Monotonic compression 10"3.7 Transverse extensometer 80 mm ! 52 mm ! 55 mmElastic modulus/yield stress Compression, unloadings spaced at 0.5–1.0% strain 10"3.7 Loading Loading direction extensometer 80 mm ! 52 mm ! 55 mm
10"4.0 Unloading
1084 S.T. Szyniszewski et al. / Materials and Design 54 (2014) 1083–1094

Table 1 defines the parameters of the three compression testtypes conducted during this study. These three tests were designedto allow evaluation of the elastic modulus, yield stress, Poisson’sratio, and densification strain. The test specimen in its loading fix-ture is shown in Fig. 1.
2.2. Tension specimens and testing protocol
ASTM: E8, ‘‘Tension testing of metallic materials’’, provides themost relevant guidance for the testing of steel foam in tension dueto the lack of a published standard for tension testing of metal foams.The significantly different characteristics of steel foam as compared tosolid metals, however, necessitates several modifications to the spec-imens and testing protocols defined in that standard.
Reduced workability of the material prevented us from machin-ing smooth rounded fillets, and the specimen geometry was there-fore adopted and readily machined by cutting on a band saw. Theoverall specimen dimensions are consistent with those specified inthe ASTM standard. In place of the wedge grips specified in thestandard, which would crush the grip section of the specimen,we developed a gripping mechanism that used a solid steel plateepoxied into a notch in the specimen to transfer load betweenthe wedge grips of the Instron machine and the steel foam sample(Fig. 1b). An initial test using this configuration resulted in the frac-ture emanating from the corners of the notch but the addition of aclamping force (as shown in the figure) provided sufficient confine-ment to drive fracture into the test section. Tests were run at astrain rate of 10"2.3 s"1 based on the recommended strain ratefor compression testing of steel foams. Three samples were testedunder this protocol with an extensometer used to collect straindata in the loading direction, and a fourth test was conducted withan added unloading stage prior to the onset of nonlinearity to eval-uate the elastic modulus in tension.
2.3. Shear specimens and testing protocol
Shear testing was performed following the ISO 1922 [32] stan-dard for testing of cellular plastics, which involves attaching a thinrectangular sample to two rigid platens, and then pulling one pla-ten in a direction parallel to the platen’s face. The ISO 1922 testingstandard calls for specimens of size 25 mm by 50 mm by 250 mm.After multiple attempts at performing such tests, however, it wasfound to not be possible to machine a flat enough surface on thehollow spheres foam so that the entire surface would end up lam-inated by the epoxy, as only limited quantities of epoxy strong en-ough to hold the material was available. Therefore, the ISO 1922standard dimensions were reduced; the 25 mm thickness waskept, but the depth was reduced from 50 mm to 25 mm, and thenheight from 250 mm to 55 mm. Three such tests were performed.Devcon Plastic Welder epoxy was used for attaching the samplesto the platens for these shear tests. The ISO 1922 standard was fol-lowed precisely for the remainder of the testing procedure, and nofurther deviations were necessitated by the use of steel foam in thetests. Platens for use in this test were custom manufactured, asnone previously existed that would serve the purpose. In order tomeasure strains, an extensometer was attached between the lowerplaten and the upper. A photograph of the final setup is shown inFig. 1c.
3. Experimental results
3.1. Densification
Densification is the process by which, under large strain com-pressive loading, the cells of a foam begin to collapse, resulting
in contact between opposite faces of the cells. This contact resultsin rapid stiffening of the material. The increased stress transmis-sion may either be desirable or undesirable depending on the de-sign context, but either way must be accounted for during thedesign process.
Three replications of the densification compression test wereperformed resulting in the stress–strain curves shown in Fig. 2.Densification begins at a strain of approximately 0.65. No estab-lished definition exists for the onset of densification, and we haveadopted the following definition: Let Et,0.05(e) be the tangent mod-ulus of the material determined by performing a linear regressionon the stress strain curve over the range [e " 0.05,e + 0.05), and de-fine Et,0.05(eproof) to be the value of this tangent modulus in the win-dow immediately following the 0.01 proof stress (essentially a 0.01offset version of the yield stress). We define the densification strainto be:
ed #minfe : Et;0:05$e% > Et;0:05$eproof %g $1%
meaning that densification is assumed to begin when the tangentmodulus exceeds for the first time the post-yield tangent modulus.This definition gives an average densification strain for the threesamples of ed = 0.65 with a range of ±0.03. The tests also revealedthat the material exhibits a substantial hardening modulus betweenthe yield and densification onset of approximately 25 MPa. Thepresence of such a hardening modulus should give pause to analystswho prefer to use an elastic-perfectly plastic material model. De-spite the small value of the hardening modulus, the large strainsthat can be absorbed by the material mean that the stress level in-creases by a factor of two between yield and densification, a featurethat a perfectly plastic model would fail to capture.
Note that all strain values for this test are based upon measure-ments taken from the crosshead displacement of the Instron. Man-ual measurements and comparison with extensometer-acquiredstrain data collected in other tests indicates that the strain read-ings, while not accurate enough to estimate the initial elastic mod-ulus, do provide accurate measurement in the post yield regime asthe strains become large.
3.2. Poisson’s ratio
For isotropic elastic continuum analysis, a single value of Pois-son’s ratio is sufficient to fully characterize the material responsesince standard plastic flow rules assume incompressibility, and aPoisson’s ratio of 0.5 in the post-yield regime. Foams, however, un-dergo significant volume change even after yield, and a more
Fig. 2. Stress strain curves for nominally identical hollow spheres steel foamsamples tested in compression into the densification range, showing initial elasticloading, hardening plateau, and sharp increase in material stiffness after initiationof densification. Inset photograph shows a densification sample after testing toapproximately 0.85 strain showing collapse of hollow spheres and small asymmetryin the transverse deformations.
S.T. Szyniszewski et al. / Materials and Design 54 (2014) 1083–1094 1085

complete understanding of the Poisson’s ratio of steel foams isneeded to allow mechanistically rigorous design approaches.
Three replications of the Poisson’s ratio compression test, runwith the extensometer mounted transverse to the loading direc-tion, were performed and used to evaluate the evolution of thePoisson’s ratio with applied compressive strain. To calculate theevolving value of the Poisson’s ratio, we have assumed that thetwo transverse components of the engineering strain (ex and ez)are equal, and have calculated the average Poisson’s ratio overincrements of applied compressive strain ey of length 0.005. By thisdefinition the Poisson’s ratio is given as a function of position by:
m$ey% # &ex$ey ' 0:005% " ex$ey%( ) 0:005 $2%
where ex(ey) represents the value of the transverse strain ex evalu-ated at applied strain ey.
Fig. 3 shows the complicated evolution of Poisson’s ratio withincreasing applied strain, with a fairly rapid increase from nearzero to a peak value at an applied strain of approximately 0.4which falls in the middle of the post-yield plateau observed inFig. 2. The test was terminated at about 0.6 engineering strain, be-cause insufficient space was remaining in the test fixture to accom-modate the transverse-mounted extensometer.
The Poisson’s ratio of 0.32–0.34, which is derived based on ele-mentary mechanics of cellular networks [4], may not apply for allfoams. In the case of the HS foam tested here, the peak value ofPoisson’s ratio is in the mechanistically derived range, but over al-most all of the range tested, the HS foam exhibits a Poisson’s ratiomuch lower than 0.3. This finding is significant for the behavior ofHS steel foam under multi-axial stress states and even under uni-axial loading where the level of confinement in the interior of the
specimen would be much lower than predicted by 0.31–0.34 Pois-son’s ratio values.
3.3. Modulus through multiple unloadings
Measuring elastic modulus accurately during initial loading ischallenging due to imperfections in specimen preparation, test fix-tures, and loading apparatus. To determine the elastic modulus ofthe HS foam, therefore, we conducted uniaxial compression testswith multiple unloading segments. By repeating the unloading atregular intervals during the course of the test we were also ableto track any evolution in the modulus of the material. These tests,replicated six times, with an extensometer used to measure strainin the direction of applied load, were also used to measure theyield stress of the material.
Longitudinal strain ey was recorded using both the extensometerand the crosshead displacement of the testing machine. Beforestrains of approximately 0.05, the extensometer- and crosshead-based strains differed substantially, with the extensometer measur-ing lower strain values than the crosshead. After approximately0.05 applied strain the two values were acceptably close to one an-other. This observation lends support to our use of crosshead dis-placement for measuring ey during the densification and Poisson’sratio tests, when most of our attention was focused on large strainbehavior. Because the extensometer was placed in the middle of thespecimen, the fact that it records lower strain readings than thecrosshead indicates significant deformation early in the loading his-tory as the top and bottom surfaces of the specimen come into con-tact with the loading platens. This is to be expected because thelimited workability of the material made it difficult to obtain flatand parallel loading faces to within tight tolerances.
We tested two sets of specimens of identical cross section(52 mm ! 55 mm), but different heights (80 mm and 140 mm).From the data shown in Fig. 4, we extracted a post-yield hardeningmodulus of 25 MPa, and found that the 0.002 offset yield stressaveraged ry,0.002 = 3.2 ± 0.6 MPa. Fig. 6 shows substantial variationin the stress strain response of the material at strains lower thanroughly 0.02, but that at strains greater than 0.02 the variabilitydecreases. The 0.002 offset yield stress captures this early variabil-ity, but in designing steel foam applications in which moderate tolarge deformations are to be expected the 0.002 offset stress mayoverestimate the practical variability of the material properties.
To provide another estimate of yield stress that would capturethe reduced variability present in the post-elastic regime, weadopted the practice of the ISO/DIS 13314 [31] standard whichsuggest use of an 0.01 proof stress, which is defined simply asthe stress value at an applied strain of 0.01. For the HS foam testedhere, the 0.01 proof stress averaged rp,0.01 = 4.0 ± 0.3 MPa. Thechoice of yield stress is a particularly important consideration
Fig. 3. Instantaneous Poisson’s ratio, calculated by dividing transverse engineeringstrain by longitudinal engineering strain over 0.5% longitudinal strain intervals.
Fig. 4. Stress–strain curves for multiple unloading tests. Left: full test. Right: zoomed plot.
1086 S.T. Szyniszewski et al. / Materials and Design 54 (2014) 1083–1094

because of the frequency with which bi- or tri-linear material mod-els are used in practical analysis, and we suggest thatrp,0.01 = 4.0 ± 0.3 MPa is a better choice than ry,0.02 = 3.2 ± 0.6 MPa,and is more reflective of the actual material behavior.
This series of tests also provides the best measurement of theelastic modulus of the HS steel foam. The elastic modulus was esti-mated by performing a least square linear regression on each of theunloading episodes shown in Fig. 4. The results indicated a ratherlarge amount of uncertainty early in the loading history—the firsttwo unloadings occur in the initial elastic range—but become quiteconstant after an applied strain of ey = 0.02. Even after the modulusvalues in each test become essentially constant, there remains sub-stantial inter-specimen variability with Ey = 3150 ± 250 MPa. Thetest results show no strong evidence for evolution of the elasticmodulus during deformation, at least up to an applied strain of0.1, indicating that although the material is well past yield at thatpoint, no substantial damage has yet accumulated at the micro-structural level. The highly variable moduli measured prior toey = 0.02 are, in our judgment, due to initial imperfections in the
test specimens, and should not be regarded as characteristics ofthe material.
It is difficult to compare the elastic modulus we measured toother published values, as few published HS foams have beenabove a relative density of 0.08, and the Fraunhofer HS foam wetested had relative density of approximately 0.15. However, Friedlet al. [33] measured the elastic modulus of their q = 0.08 steel foamas being 640 MPa, compared to the 3150 MPa measured for thisq = 0.15 foam. Other material properties, including yield stress(3.4 MPa) and hardening modulus (30 MPa), were all within 10%of the values reported by Friedl et al., but these comparisons arehard to attach meaning to without more knowledge of the basematerial properties. Note that Young’s modulus and yield stressobtained are within the bounds set by the Gibson and Ashby [1]models.
3.4. Tension tests
Three replications of a uniaxial tension test were conducted toevaluate the behavior of the HS foam in tension, which have notbeen reported previously in the literature. The results, summarizedin the stress strain curves of Fig. 5, indicate poor tensile ductilityfor this material, with fracture strains ef = 0.019 ± 0.007, and a highlevel of uncertainty associated with the fracture strain. The peaktensile stresses, rf = 4.9 ± 0.9 MPa vary noticeably, although thestrength in tension is comparable to the stress in compression atequal strain levels. In an additional test, which is not shown inthe figure, several periods of unloading were included to evaluatethe material elastic modulus in tension. No significant differencewas found between the compressive and tensile moduli.
In two of the three replications two dominant cracks formed,originating from opposite sides of the specimen, while in the otherreplication a single dominant crack formed. In two of the three rep-lications the dominant crack(s) formed well away from the transi-tion from the grip to test sections leading us to conclude that thespecimen design, despite its small deviations from the most rele-vant ASTM: E8 standard, is appropriate for characterizing the ten-sile material properties of this HS steel foam. The shape of thestress strain curve in all three tests was similar up to the point ofpeak stress, the point at which a dominant crack becomes manifestin the specimen. In all three cases a distinct yield point and a smallamount of inelastic deformation was observed, meaning that thematerial does not act as a completely brittle solid in tension. Thenearly immediate drop to zero stress level in replication 3 was re-corded because the dominant crack appeared at the location of oneof the extensometer blades, meaning that additional strain ceasedto be recorded. The crosshead-based stress strain curves, which arenot shown here, indicate that the post-peak behavior was similarfor all three tests.
Fracture occurred by failure of the individual hollow spheres atthe points where they were sintered to adjoining sphere (Fig. 5,bottom far right). The fracture is located in the spheres becausethe connections between spheres, where the material thickenssubstantially (Fig. 6), are stronger than the hollow sphere shellsthemselves, and indicates that if greater tensile strength—and pos-sibly ductility—is desired from the material, thicker spheres shouldbe used. If the diameter of the spheres were increased this changecould be made without affecting the overall relative density of thematerial.
3.5. Shear tests
Shear experiments showed remarkable consistency, with shearmodulus and ultimate stress varying by less than ± 10% (see Fig. 7and Table 2). Limited ductility is evident because the materialyields before it reaches its ultimate strength. There are also twoFig. 6. Sphere wall thickness microscopy measurement.
Fig. 5. Above: Stress–strain curves of tension tests. Note that the test indicated bythe arrow shows a more sudden drop in stress due to the crack having formednearly directly underneath one of the blades of the extensometer. Below: Thefracture surfaces for each test, including one macro photograph (far right).
S.T. Szyniszewski et al. / Materials and Design 54 (2014) 1083–1094 1087
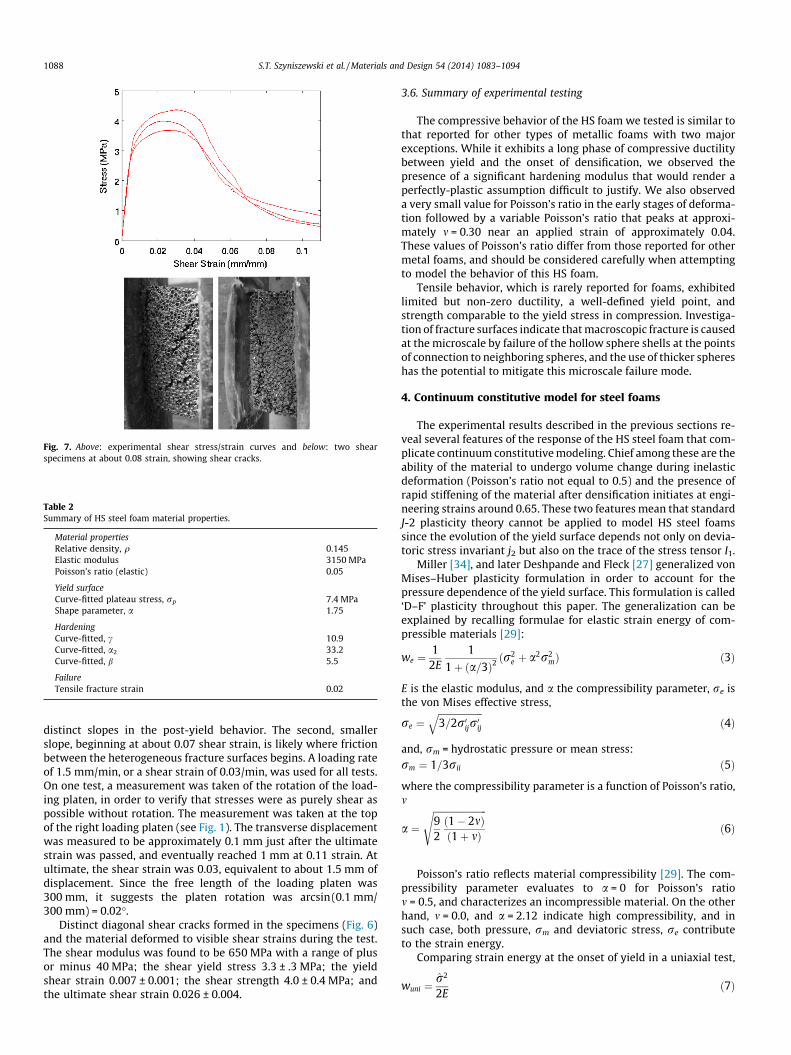
distinct slopes in the post-yield behavior. The second, smallerslope, beginning at about 0.07 shear strain, is likely where frictionbetween the heterogeneous fracture surfaces begins. A loading rateof 1.5 mm/min, or a shear strain of 0.03/min, was used for all tests.On one test, a measurement was taken of the rotation of the load-ing platen, in order to verify that stresses were as purely shear aspossible without rotation. The measurement was taken at the topof the right loading platen (see Fig. 1). The transverse displacementwas measured to be approximately 0.1 mm just after the ultimatestrain was passed, and eventually reached 1 mm at 0.11 strain. Atultimate, the shear strain was 0.03, equivalent to about 1.5 mm ofdisplacement. Since the free length of the loading platen was300 mm, it suggests the platen rotation was arcsin(0.1 mm/300 mm) = 0.02".
Distinct diagonal shear cracks formed in the specimens (Fig. 6)and the material deformed to visible shear strains during the test.The shear modulus was found to be 650 MPa with a range of plusor minus 40 MPa; the shear yield stress 3.3 ± .3 MPa; the yieldshear strain 0.007 ± 0.001; the shear strength 4.0 ± 0.4 MPa; andthe ultimate shear strain 0.026 ± 0.004.
3.6. Summary of experimental testing
The compressive behavior of the HS foam we tested is similar tothat reported for other types of metallic foams with two majorexceptions. While it exhibits a long phase of compressive ductilitybetween yield and the onset of densification, we observed thepresence of a significant hardening modulus that would render aperfectly-plastic assumption difficult to justify. We also observeda very small value for Poisson’s ratio in the early stages of deforma-tion followed by a variable Poisson’s ratio that peaks at approxi-mately m = 0.30 near an applied strain of approximately 0.04.These values of Poisson’s ratio differ from those reported for othermetal foams, and should be considered carefully when attemptingto model the behavior of this HS foam.
Tensile behavior, which is rarely reported for foams, exhibitedlimited but non-zero ductility, a well-defined yield point, andstrength comparable to the yield stress in compression. Investiga-tion of fracture surfaces indicate that macroscopic fracture is causedat the microscale by failure of the hollow sphere shells at the pointsof connection to neighboring spheres, and the use of thicker sphereshas the potential to mitigate this microscale failure mode.
4. Continuum constitutive model for steel foams
The experimental results described in the previous sections re-veal several features of the response of the HS steel foam that com-plicate continuum constitutive modeling. Chief among these are theability of the material to undergo volume change during inelasticdeformation (Poisson’s ratio not equal to 0.5) and the presence ofrapid stiffening of the material after densification initiates at engi-neering strains around 0.65. These two features mean that standardJ-2 plasticity theory cannot be applied to model HS steel foamssince the evolution of the yield surface depends not only on devia-toric stress invariant j2 but also on the trace of the stress tensor I1.
Miller [34], and later Deshpande and Fleck [27] generalized vonMises–Huber plasticity formulation in order to account for thepressure dependence of the yield surface. This formulation is called‘D–F’ plasticity throughout this paper. The generalization can beexplained by recalling formulae for elastic strain energy of com-pressible materials [29]:
we #1
2E1
1' $a=3%2$r2
e ' a2r2m% $3%
E is the elastic modulus, and a the compressibility parameter, re isthe von Mises effective stress,
re #!!!!!!!!!!!!!!!!!!!3=2r0ijr0ij
q$4%
and, rm = hydrostatic pressure or mean stress:rm # 1=3rii $5%
where the compressibility parameter is a function of Poisson’s ratio,m
a #
!!!!!!!!!!!!!!!!!!!!!!!92$1" 2m%$1' m%
s
$6%
Poisson’s ratio reflects material compressibility [29]. The com-pressibility parameter evaluates to a = 0 for Poisson’s ratiom = 0.5, and characterizes an incompressible material. On the otherhand, m = 0.0, and a = 2.12 indicate high compressibility, and insuch case, both pressure, rm and deviatoric stress, re contributeto the strain energy.
Comparing strain energy at the onset of yield in a uniaxial test,
wuni #r2
2E$7%
Fig. 7. Above: experimental shear stress/strain curves and below: two shearspecimens at about 0.08 strain, showing shear cracks.
Table 2Summary of HS steel foam material properties.
Material propertiesRelative density, q 0.145Elastic modulus 3150 MPaPoisson’s ratio (elastic) 0.05
Yield surfaceCurve-fitted plateau stress, rp 7.4 MPaShape parameter, a 1.75
HardeningCurve-fitted, c 10.9Curve-fitted, a2 33.2Curve-fitted, b 5.5
FailureTensile fracture strain 0.02
1088 S.T. Szyniszewski et al. / Materials and Design 54 (2014) 1083–1094
with the general expression for the elastic energy (Eq. (3)) suggeststhe following formula for the equivalent yield stress under multi-axial stress state [27,29]:
r2 # 11' $a=3%2
$r2e ' a2r2
m% $8%
It is worth noting that this yield criterion reduces to von Misesformulation, when a = 0 (and m = 0.5) in the case of plastic incom-pressibility. Deshpande and Fleck [27] verified their hypothesis byconducting a number of experiments on aluminum foam samples.Their criterion, calibrated against a uniaxial test, agreed well withmulti-axial tests.
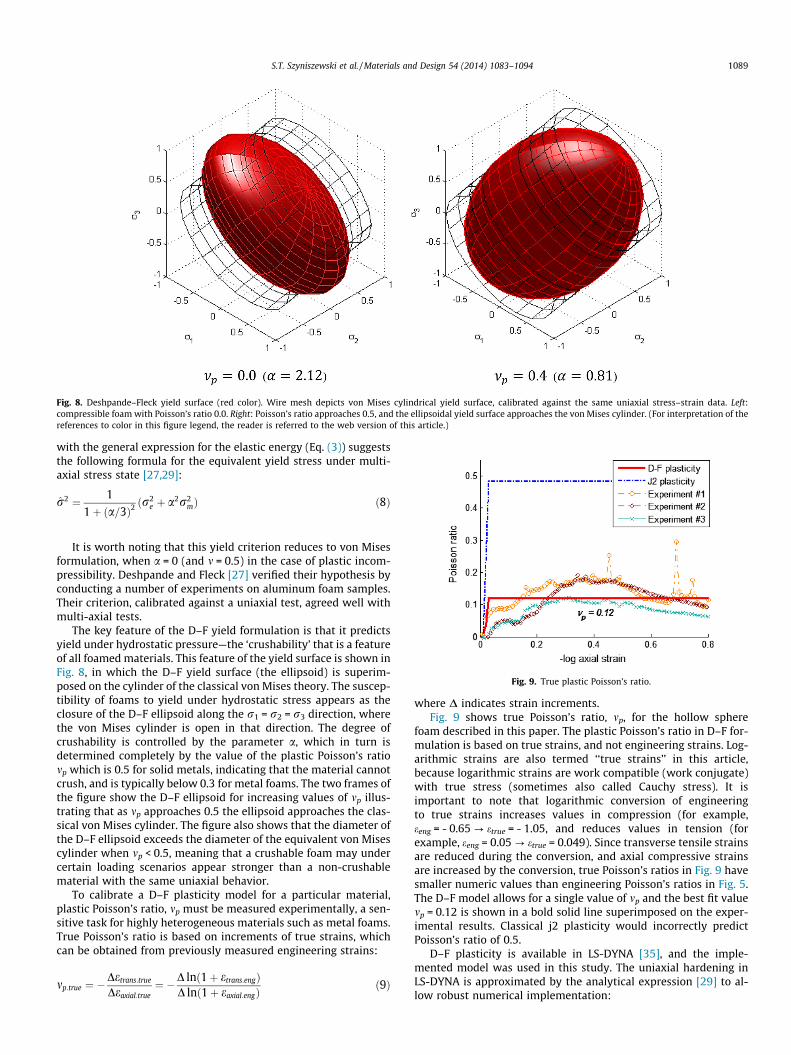
The key feature of the D–F yield formulation is that it predictsyield under hydrostatic pressure—the ‘crushability’ that is a featureof all foamed materials. This feature of the yield surface is shown inFig. 8, in which the D–F yield surface (the ellipsoid) is superim-posed on the cylinder of the classical von Mises theory. The suscep-tibility of foams to yield under hydrostatic stress appears as theclosure of the D–F ellipsoid along the r1 = r2 = r3 direction, wherethe von Mises cylinder is open in that direction. The degree ofcrushability is controlled by the parameter a, which in turn isdetermined completely by the value of the plastic Poisson’s ratiomp which is 0.5 for solid metals, indicating that the material cannotcrush, and is typically below 0.3 for metal foams. The two frames ofthe figure show the D–F ellipsoid for increasing values of mp illus-trating that as mp approaches 0.5 the ellipsoid approaches the clas-sical von Mises cylinder. The figure also shows that the diameter ofthe D–F ellipsoid exceeds the diameter of the equivalent von Misescylinder when mp < 0.5, meaning that a crushable foam may undercertain loading scenarios appear stronger than a non-crushablematerial with the same uniaxial behavior.
To calibrate a D–F plasticity model for a particular material,plastic Poisson’s ratio, mp must be measured experimentally, a sen-sitive task for highly heterogeneous materials such as metal foams.True Poisson’s ratio is based on increments of true strains, whichcan be obtained from previously measured engineering strains:
mp:true # "Detrans:true
Deaxial:true# "D ln$1' etrans:eng%
D ln$1' eaxial:eng%$9%
where D indicates strain increments.Fig. 9 shows true Poisson’s ratio, mp, for the hollow sphere
foam described in this paper. The plastic Poisson’s ratio in D–F for-mulation is based on true strains, and not engineering strains. Log-arithmic strains are also termed ‘‘true strains’’ in this article,because logarithmic strains are work compatible (work conjugate)with true stress (sometimes also called Cauchy stress). It isimportant to note that logarithmic conversion of engineeringto true strains increases values in compression (for example,eeng = - 0.65 ? etrue = - 1.05, and reduces values in tension (forexample, eeng = 0.05 ? etrue = 0.049). Since transverse tensile strainsare reduced during the conversion, and axial compressive strainsare increased by the conversion, true Poisson’s ratios in Fig. 9 havesmaller numeric values than engineering Poisson’s ratios in Fig. 5.The D–F model allows for a single value of mp and the best fit valuemp = 0.12 is shown in a bold solid line superimposed on the exper-imental results. Classical j2 plasticity would incorrectly predictPoisson’s ratio of 0.5.
D–F plasticity is available in LS-DYNA [35], and the imple-mented model was used in this study. The uniaxial hardening inLS-DYNA is approximated by the analytical expression [29] to al-low robust numerical implementation:
Fig. 8. Deshpande–Fleck yield surface (red color). Wire mesh depicts von Mises cylindrical yield surface, calibrated against the same uniaxial stress–strain data. Left:compressible foam with Poisson’s ratio 0.0. Right: Poisson’s ratio approaches 0.5, and the ellipsoidal yield surface approaches the von Mises cylinder. (For interpretation of thereferences to color in this figure legend, the reader is referred to the web version of this article.)
Fig. 9. True plastic Poisson’s ratio.
S.T. Szyniszewski et al. / Materials and Design 54 (2014) 1083–1094 1089

ry # rp ' c eeD' a2 ln
11" $e=eD%
b
!$10%
where e # effective plastic strain; eD # " ln$q%, where q is the foamrelative density, and rp, c, a2, b are obtained by the curve-fit to theexperimental curve (Fig. 10).
The model is calibrated against true logarithmic strains and trueCauchy stress. Although, true strains can be obtained with classicalconversion etrue = ln (1 + eeng), true stress is a function of the actualcross-section. Thus, measurements of transverse strains during theaxial experiment are required, not only for determination of Pois-son’s ratio, but also for calculation of true stresses from the appliedforce history.
rtrue #P
b2 #P
b2o$1' etrans:eng%2
# reng$1' etrans:eng%"2 $11%
where r is the axial stress, P the applied force, b the current trans-verse dimension, bo the original transverse dimension, and etrans.eng
is the engineering transverse strain.The classical formula for conversion of engineering to true
stress:
rtrue # reng$1' etrans:eng% $12%
is based on assumption of incompressibility, and it is not applicableto compressible materials. The general conversion formula, basedon the assumption of constant true plastic Poisson’s ratio, is:
rtrue # reng$1' etrans:eng%2mp: log $13%
where mp.log = log plastic Poisson’s ratio.Since plastic Poisson’s ratio varies with applied strains, direct
measurements of the actual cross-sectional area (changes in trans-verse dimensions of a specimen) are preferred.
Table 2 summarizes the mechanical properties measured dur-ing this series of experiments, and includes parameters corre-sponding to the Deshpande–Fleck material model. This table ofmaterial properties should provide sufficient information for ananalyst or designer interested in developing structural applicationsof HS steel foams to perform finite element simulations of compo-nent response.
5. Constitutive model validation
5.1. Tensile and compressive verification simulations
In order to assess the ability of the D–F plasticity model toreproduce the behavior of hollow sphere steel foam accurately, fi-nite element models of the tensile, compressive, and shear testcoupons were developed and the simulated response is comparedto the experimental results.
Reyes et al. [29] and Hansen et al. [30] enhanced D–F plasticitywith the tensile fracture criteria based on the maximum principalstress and this enhanced model is implemented in LS-DYNA [35],the software used in this study. As of version 9.71 release 5.1.1,LS-DYNA requires tensile fracture strain for the calibration of thiselement erosion criterion. Fracture strain of 0.02, a lower boundfrom uniaxial tensile experiments, was selected as input to LS-DYNA.
The yield stress, Young’s modulus, and fracture strain weremodeled as spatially varying random field with coefficient of vari-ation equal to 20%, and a spatially isotropic correlation length of2 mm corresponding to roughly one sphere diameter. Since yieldplateau is correlated with the fracture strain (see Fig. 5); yieldstress, Young’s modulus and the failure strain were assumed tobe perfectly correlated. In simple terms, simulated elements withlower yield stress also exhibited reduced material stiffness andfracture strain, and vice versa.
The numerical simulations, which produced fracture at varyinglocations in the coupon, are qualitatively consistent with theexperimental tests elaborated earlier in this paper. Specifically,the introduction of spatial variation into the material propertyfield successfully drives the site of fracture initiation away fromthe coupon bevel, consistent with experimental results (Fig. 11).A deterministic model failed at the bevel due to a stress concen-tration at that location (5% higher stress then in the reducedsection).
Compressive simulations of the prismatic specimen used in theexperiments produced non-uniform deformation fields and unevenexternal surfaces (Fig. 12) when the yield stress and elastic modu-lus were treated as perfectly correlated random fields as they werein the tension simulations. As expected, the compressive behaviorwas less sensitive to heterogeneity of the material property field.When the material properties were treated as spatially homoge-neous (i.e. non-random field) the simulated response also reason-ably approximated that observed in the experiments (Fig. 13).
5.2. Shear validation simulations
The D–F yield criterion predicts yield in shear at a stress levelsomewhat higher than predicted by von Mises plasticity, but stilllower than the uniaxial yield stress. In D–F plasticity the yieldstress in shear rsy is given by following equation:
rsy#!!!!!!!!!!!!!!!!!!1'a2=3
3
r*ruy#
!!!!!!!!!!!!!!!!!!!!!!1
2 * $1'mp%
s
*ruy Prj2#1!!!3p *ruy#0:58 *ruy $14%
in which ruy is uniaxial yield stress and rj2 is the von Mises yieldstress in shear. The von Mises formulation predicts yield shearstress of rj2 = 0.58*4 MPa = 2.3 MPa. For the hollow sphere foamstudied here, with mp = 0.12, D–F plasticity predictsrsy = 0.67*ruy = 0.67*4 MPa = 2.7 MPa.
Average experimental shear yield stress was 3.3 MPa. Thus, D–Fplasticity provided more accurate prediction of the tested valuesthan the classical j2 plasticity.
Shear deformation produces no volumetric strain, and there-fore element deletion criteria that rely on volumetric strain can-not be used to simulate shear failure. Reyes et al. [29] proposed
Fig. 10. Curve-fit of analytical hardening curve to experimental measurements.
1090 S.T. Szyniszewski et al. / Materials and Design 54 (2014) 1083–1094

the use of the maximum principal stress in place of volumetricstrain as an element deletion criterion. As implemented in LS-DYNA version 9.71 release 5.1.1, the maximum principal stresscriterion does not produce shear fracture patterns that resemblethose observed in experiments (compare Fig. 14c and a), althoughit does generate good predictions of the strength and post-peakresponse. Therefore, a new element deletion criterion based onequivalence of the maximum principal strain to the tensile
fracture strain (emax = 0.02) was proposed, and it was imple-mented in LS-DYNA [35] with +MAT_ADD_EROSION keyword.Simulations using this criterion generated fracture patterns thatare reasonably similar to those observed in experiments. Simu-lated cracks propagated along one of the fixture plates in approx.70% of numerical realizations, and in the remaining 30% of real-izations the erosion path turned toward the centerline (compareFig. 14b and a). This is in agreement with experiments, sincetwo of the tested specimens developed a crack along one of theloading platens, and one specimen exhibited diagonal cracks(see Fig. 7).
Principal strain based approach provided good predictions ofthe strength and crack patterns, but did not capture the post-peakresidual capacity of the specimen (Fig. 15). The most likely expla-nation for this discrepancy in post-peak behavior is that the ele-ment deletion algorithm leaves a gap between the fracturesurfaces, whereas in the physical experiments contact of therough fracture surfaces occurs and allows the material to main-tain significant load carrying capacity. The fracture paths in theexperimental sample are also more tortuous than those producedby the simulations, further enhancing the potential load transferacross the crack. Of the two element deletion criteria investi-gated, both predict the strength well, with the stress-based crite-rion overestimating ductility and the strain based criterionunderestimating ductility, and thus providing a more conserva-tive estimate of failure. Further investigation of the appropriateelement deletion criterion would be an interesting pursuit, butlies beyond the scope of this paper.
Fig. 11. Sample numerical realizations of tensile fracture. Note: colors represent model components with randomly assigned, unique material properties. Colors are cycled(due to limited number of available colors), thus two identically colored elements do not have the same material properties. (For interpretation of the references to color inthis figure legend, the reader is referred to the web version of this article.)
Fig. 12. Numerical realization of the compressive test with axial strains plotted. Note non-uniform axial deformations.
Fig. 13. Calibration (compression) and verification (tension) of numerical modelagainst experiments.
S.T. Szyniszewski et al. / Materials and Design 54 (2014) 1083–1094 1091

6. Importance of Poisson’s ratio
Having shown that D–F plasticity can provide a good approxi-mation to the physical behavior of hollow sphere steel foam inthe three canonical loading modes (tension, compression andshear), the D–F plasticity formulation is now used to explore theeffect of Poisson’s ratio on response of steel foam components un-der multi-axial stress states.
6.1. Effect of confinement on compressive behavior
A finite element model of a prismatic block of HS steel foam wasdeveloped in LS-DYNA and material properties calibrated to the
experimental tests were assigned to the individual elements inthe form of a spatially varying random field as described previ-ously. This model was then exercised using boundary conditionscorresponding to laterally confined compression(e1 < 0,e2 = e3 = 0), and triaxial compression (e1 = e2 = e3 < 0). Suchconditions regularly occur in structural applications and thebehavior of HS steel foam under such conditions must be under-stood before the material can be widely deployed. While a formalexperimental investigation is needed, these numerical experi-ments provide an indication of the types of behavior to beexpected.
The most interesting aspects of our particular HS steel foam(me = 0.01,mp = 0.12) behavior under multiaxial loading is that con-finement does not increase the magnitude of surface traction(termed further as apparent yield stress) needed to yield the con-fined specimen. Also, under triaxial loading the apparent yieldstress is actually lower than the apparent yield stress in uniaxialcompression (Fig. 16a), although the material does eventually stif-fen and harden under triaxial loading. This feature of the responsecan also be seen in Fig. 8 left in which the diameter of the D–F ellip-soid along the r1 = r2 = r3 axis is smaller than the radius of the vonMises cylinder.
It should be noted that other types of foams with Poisson’s ratiogreater than 0.33 may exhibit the opposite behavior, because Pois-son’s ratio affects the apparent yield stress of the confined HSfoam. The applied surface traction to yield the confined specimencan be analytically expressed by deriving the stress state corre-sponding to non-zero axial strain, and zero transverse strains,and later substituting these stress components into the D–F yieldcriterion, to obtain:
rconf :y #
!!!!!!!!!!!!!!!!!!!!!!!!!!!!!!!!!!!!!!!!!!!!!!!!!!!!!1' 1
2$1"2mp%$1'mp%
1$1'me%2
' 92$1"2mp%$1'mp%
13$1"me%
" #2
vuuut * runiax:y $15%
which depends on the elastic and plastic Poisson’s ratios me and mp
(Fig. 16b). Fig. 16b shows that when the elastic Poisson’s ratio isvery small the confined yield stress is essentially equal to theunconfined yield stress, as is the case in the current HS steel foamwith me = 0.01.
Only when me becomes substantially larger than zero, confine-ment creates transverse stress resulting in triaxial pressure. Thetriaxial pressure lowers the apparent yield stress for foams withmp < 0.33, and increases the apparent yield stress for foams withmp > 0.33.
It is important to note, first, that Deshpande and Fleck [27]experimentally probed the yield surface of foams, and that there-fore this result for the HS foam can be considered instructive eventhough multiaxial physical tests have not been performed, and sec-ond, that by tuning me and mp, it is in fact possible to generate a D–Fmaterial with a higher confined than unconfined yield stress. Suchtuning of the Poisson’s ratio is possible through control of themicrostructure and porosity.
The reduction in triaxial yield stress of our HS foam also arisesdirectly from the D–F yield criterion (with deviatoric term re = 0under triaxial pressure), in which the triaxial yield stress, rmy, ex-pressed as a function of uniaxial yield stress, is:
rmy #!!!!!!!!!!!!!!!!!!!1' a2=3
p
a * ry #
!!!!!!!!!!!!!!!!!1
3" 6mp
s
* ry $16%
where a #!!!!!!!!!!!!!!!!92$1"2mp%$1'mp%
qis the yield surface parameter and mp is the
plastic Poisson’s ratio.Triaxial yield stress, rmy becomes infinite if mp approaches 0.5
(incompressible plasticity), and gives rmy < ry when mp < 0.33 asis the case for our HS steel foam with mp = 0.12 (see Fig. 16b).
Fig. 14. Numerical simulation of the shear tests: (A) experiment, (B) postulatedmaterial erosion based on the maximum principal strain at failure, and (C) elementdeletion based on the maximum principal stress.
Fig. 15. Comparison of shear simulations with experiments.
1092 S.T. Szyniszewski et al. / Materials and Design 54 (2014) 1083–1094

6.2. Foam compaction
Another key property of foams is the compaction strain—thecompressive strain at which foam porosity is zero, and all poresare completely closed. Compaction strain should not be confusedwith the densification strain—the compressive strain at whichthe foam begins to rapidly stiffen and harden due to collapse ofthe cells and widespread contact between the cell walls. Compac-tion strain is an important design parameter because it effectivelydefines the amount of compressive deformation that can beaccommodated by a foam without the transfer of stresses at highlevels of the base foam material occurring. The D–F plasticity mod-el defines a compaction strain that is dependent on the plasticPoisson’s ratio and relative density q. The logarithmic compactionstrain in unconfined axial compression is [29]:
eD # "9' a2
3a2 ln$q% # " 11" 2mp
ln$q% $17%
which can be converted to an engineering value by:
eD:eng # eeD " 1 # q1
1"2mp " 1 $18%
It is self-evident that the compaction strain will be smaller forfoams with higher relative density (and inherent lower porosity).Furthermore, the compaction strain becomes larger (see Fig. 17) asthe incompressibility increases, characterized by the larger
Poisson’s ratio. This counterintuitive behavior stems from the factthat, under uniaxial compression, higher incompressibility resultsin transverse creeping of the material, and thus increases uniaxialstrain needed to close all the pores. This is another material responsedomain in which the crushability of the foam, as characterized by theplastic Poisson’s ratio, can dramatically affect their behavior.
6.3. Discussion of simulations and modeling approach
D–F plasticity formulation, which accounts for material com-pressibility under triaxial pressure, offers a more physical materialrepresentation than classical j2 plasticity, which assumes materialincompressibility. Our experimental shear results confirmed theefficacy of D–F plasticity for modeling of hollow sphere foams. Itis also important to note that D–F plasticity operates on logarith-mic strains and true stresses, which require measurements of theactual cross-sectional dimensions during uniaxial experiments.Such measurements are also need for quantification of Poisson’sratio, which determines the shape of the D–F yield surface.
Inclusion of random variability of mechanical properties in hol-low sphere foams enhances modeling of fracture patterns, andrealism of failure simulations. Principal strain based formulationwas more accurate in reproducing experimental shear fracture pat-terns than principal stress based approach.
Foam Poisson’s ratio is indispensable for quantification of com-pressibility, but is rarely reported in experimental papers, and itstheoretical estimate [1] is thought to be 0.3. However, our experi-mental tests indicated that true plastic Poisson’s ratio can be aslow as 0.12, and its value is a critical indicator of material com-pressibility. Plastic Poisson’s ratio impacts the shape of the D–Fyield surface, changes resistance of confined components to axialloading, and controls the value of the compaction strain. PlasticPoisson’s ratio is a fundamental characteristic of compressiblefoams, and should be routinely reported in experimental papers.
7. Conclusions
This paper characterizes mechanical properties of steel hollowsphere (SHS) foam, and applies calibrated Deshpande–Fleck plas-ticity to mechanical simulations of steel foam components. Theexperimental characterization of the hollow sphere foam encom-passed compressive yield stress and densification strain, compres-sive plastic Poisson’s ratio, compressive unloading modulus, aswell as tensile elastic modulus, tensile unloading modulus, tensileyield stress, tensile fracture strain, and shears yield stress andshear fracture strain. A definition of densification strain was
Fig. 16. (a) Stress–strain histories from simulations of our HS foam, characterizedwith elastic me = 0.01 and plastic Poisson’s ratio and me = 0.12 (b) aggregatedapparent yield values, normalized by uniaxial yield, from a parametric sweep ofplastic Poisson’s ratios mp = 0.0–0.5. Since confinement stress depends on elasticPoisson’s ratio, two curves for elastic Poisson’s ratio of 0.01 and 0.25 are plotted.Note that onsets of yield from (a) correspond to 3 points in (b).
Fig. 17. Effect of relative density and plastic Poisson’s ratio on uniaxial compactionstrain.
S.T. Szyniszewski et al. / Materials and Design 54 (2014) 1083–1094 1093

expressed in mathematical terms based on rigorous regressions.Novel testing approaches for shear and tensile properties of HSsteel foams were also proposed.
HS steel foam is a compressible material, with exceptionaldeformation capabilities under compressive loads (up to 0.9 engi-neering strain). While it exhibits a long phase of compressive duc-tility between yield and the onset of densification, we observed thepresence of a significant hardening modulus that would render aperfectly-plastic assumption difficult to justify. We also observedan average value of true Poisson’s ratio to be approximately 0.12;and this value of Poisson’s ratio differs from those reported forother metal foams [1].
Tensile behavior exhibited limited but non-zero ductility, awell-defined yield point, and strength comparable to the yieldstress in compression. Macroscopic fracture was caused by failureof the hollow sphere shells at the connections to neighboringspheres, and the use of thicker spheres may mitigate this failuremode. Shear behavior exhibited limited ductility, reaching ulti-mate strength at engineering strains between 0.05 and 0.10.
D–F plasticity [27] is adequate to model plastic behavior of HSfoams because it accounts for foam compressibility. D–F providedmore accurate prediction of the experimental shear yield stressthan classical von Mises plasticity. However, D–F plasticity needsto be supplemented with a suitable fracture criterion in order toaccount for asymmetry between compressive and tensile fracture,e.g. based on the maximum principal strain. Random distributionsof material properties within each component enhanced the real-ism of the tensile and shear simulations.
Poisson’s ratio provides invaluable information about the foamcompressibility, which affects the resistance in the case of confinedboundaries, and under multi-axial loads. Plastic Poisson’s ratio canbe obtained from a uniaxial experiment, circumventing the needfor specialized multi-axial testing equipment. Since transversedimensions need to be measured during a uniaxial test in orderto calculate true stresses, determination of plastic Poisson’s ratiorequires only manipulation of the collected data.
Future work is needed on tensile and shear testing standards formetallic foams. Also, evolution of plastic hardening and especiallyfracture under multi-axial, complex load paths needs furtherinvestigation. Random spatial distributions of material propertiesmay also warrant further studies due to their potential impact onreliability of foamed components. This work is part of a larger ef-fort to help develop steel foam as a material with relevance to civilengineering applications.
Acknowledgements
This work was funded by the United States National ScienceFoundation under grants CMMI- 1000334, 1000167, 0970059.Drs. Hartmut Goehler and Guenter Stephani of the FraunhoferInstitute in Dresden were instrumental in making the hollowsphere foam samples available for testing. Drs. Hartmut Goehlerand Guenter Stephani support is hugely appreciated. This workused the Extreme Science and Engineering Discovery Environment(XSEDE), which is supported by National Science Foundation grantnumber OCI-1053575.
Appendix A. Supplementary material
Supplementary data associated with this article can be found, inthe online version, at http://dx.doi.org/10.1016/j.matdes.2013.08.045.
References
[1] Ashby M. Metal foams: a design guide. Boston: Butterworth-Heinemann; 2000.
[2] Mutlu I, Oktay E. Mechanical properties of sinter-hardened Cr–Si–Ni–Mo basedsteel foam. Mater Des 2013;44:274–82.
[3] Hsu H-C, Wu S-C, Hsu S-K, Tsai M-S, Chang T-Y, Ho W-F. Processing andmechanical properties of porous Ti–7.5Mo alloy. Mater Des [n.d.].
[4] Gibson LJ, Ashby MF, Ashby M. Cellular solids: structure and properties. 2nded. Cambridge University Press; 1999.
[5] Bazant Z, Zhou Y. Why did the world trade center collapse? – simple analysis. JEng Mech 2002;128:2–6.
[6] Szyniszewski S. Dynamic energy based method for progressive collapseanalysis. Structures congress – do not mess with structural engineers:expanding our role, April 30, 2009–May 2, 2009, Austin, TX, United States:American Society of Civil Engineers; 2009, p. 1259–68.
[7] Szyniszewski S, Krauthammer T. Energy flow in progressive collapse of steelframed buildings. Eng Struct 2012;42:142–53.
[8] Peroni L, Scapin M, Avalle M, Weise J, Lehmhus D. Dynamic mechanicalbehavior of syntactic iron foams with glass microspheres. Mater Sci Eng A2012;552:364–75.
[9] Moradi M, Arwade SR, Schafer BW. Computational evaluation of limit states ofthin-walled channels made from steel foam. Thin-Walled Struct2013;62:206–14.
[10] Szyniszewski S, Smith BH, Hajjar JF, Arwade SR, Schafer BW. Local bucklingstrength of steel foam sandwich panels. Thin-Walled Struct 2012;59:11–9.
[11] Szyniszewski S, Smith BH, Hajjar JF, Arwade SR, Schafer BW. Local bucklingstrength of steel foam sandwich panels. In: Structural stability researchcouncil annual stability conference 2012;2012:620–37.
[12] Szyniszewski S, Smith BH, Zeinoddini VM, Hajjar JF, Arwade SR, Schafer BW.Towards the design of cold-formed steel foam sandwich columns. In: 21stInternational specialty conference on cold-formed steel structures – recentresearch and developments in cold-formed steel design and, construction;2012, p. 355–71.
[13] Wadee MA, Yiatros S, Theofanous M. Comparative studies of localized bucklingin sandwich struts with different core bending models. Int J Non-Linear Mech2010;45:111–20.
[14] Yiatros S, Wadee MA. Interactive buckling in sandwich beam-columns. IMA JAppl Math 2011;76:146–68.
[15] Yiatros S, Wadee M, Völlmecke C. Modeling of interactive buckling insandwich struts with functionally graded cores. J Eng Mech 2013;139:952–60.
[16] Smith BH, Szyniszewski S, Hajjar JF, Schafer BW, Arwade SR. Steel foam forstructures: a review of applications, manufacturing and material properties. JConstr Steel Res 2012;71:1–10.
[17] Banhart J, Seeliger H-W. Aluminium foam sandwich panels: manufacture.Metall Appl Adv Eng Mater 2008;10:793–802.
[18] Jasion P, Magnucka-Blandzi E, Szyc W, Magnucki K. Global and local bucklingof sandwich circular and beam-rectangular plates with metal foam core. Thin-Walled Struct 2012;61:154–61.
[19] Hipke T. Personal communication; 2011.[20] Lefebvre L-P, Banhart J, Dunand DC. Porous metals and metallic foams: current
status and recent developments. Adv Eng Mater 2008;10:775–87.[21] Fiedler T, Belova IV, Murch GE. Critical analysis of the experimental
determination of the thermal resistance of metal foams. Int J Heat MassTransfer [n.d].
[22] Neugebauer R, Hipke T. Machine tools with metal foams. Adv Eng Mater2006;8:858–63.
[23] Han F, Seiffert G, Zhao Y, Gibbs B. Acoustic absorption behaviour of an open-celled aluminium foam. J Phys D: Appl Phys 2003;36:294.
[24] Lu TJ, Chen C. Thermal transport and fire retardance properties of cellularaluminium alloys. Acta Mater 1999;47:1469–85.
[25] Losito O, Barletta D, Dimiccoli V. A wide-frequency model of metal foam forshielding applications. IEEE Trans Electromagn Compat 2010;52:75–81.
[26] Xu S, Bourham M, Rabiei A. A novel ultra-light structure for radiation shielding.Mater Des 2010;31:2140–6.
[27] Deshpande VS, Fleck NA. Isotropic constitutive models for metallic foams. JMech Phys Solids 2000;48:1253–83.
[28] Smith BH, Szyniszewski S, Hajjar JF, Schafer BW, Arwade SR. Materialcharacterization and microstructural simulation of hollow spheres and PCMsteel foams. Struct Stab Res Council Ann Stab Conf 2012;2012:602–19.
[29] Reyes A, Hopperstad OS, Berstad T, Hanssen AG, Langseth M. Constitutivemodeling of aluminum foam including fracture and statistical variation ofdensity. Eur J Mech A Solids 2003;22:815–35.
[30] Hanssen AG, Hopperstad OS, Langseth M, Ilstad H. Validation of constitutivemodels applicable to aluminium foams. Int J Mech Sci 2002;44:359–406.
[31] Technical Committee ISO/TC 164. Compression test for porous and cellularmetals – ISO 13314 2011.
[32] Technical Committee ISO/TC 61. Plastics, subcommittee SC 10. Cellularplastics. Rigid cellular plastics. Determination of shear strength – ISO1922:2012 2012.
[33] Friedl O, Motz C, Peterlik H, Puchegger S, Reger N, Pippan R. Experimentalinvestigation of mechanical properties of metallic hollow sphere structures.Metall Mater Trans B 2008;39:135–46.
[34] Miller RE. A continuum plasticity model for the constitutive and indentationbehaviour of foamed metals. Int J Mech Sci 2000;42:729–54.
[35] Hallquist J. LS-DYNA theory manual. Livermore, California: Lawrence SoftwareTechnology Corporation; 2006.
1094 S.T. Szyniszewski et al. / Materials and Design 54 (2014) 1083–1094