Embed Size (px)
Citation preview

University of Massachusetts BostonScholarWorks at UMass Boston
Gastón Institute Publications Gastón Institute for Latino CommunityDevelopment and Public Policy Publications
10-28-1991
The Meaning of the Browning of AmericaMiren UriarteUniversity of Massachusetts Boston, [email protected]
Follow this and additional works at: http://scholarworks.umb.edu/gaston_pubsPart of the Chicano Studies Commons, and the Demography, Population, and Ecology
Commons
This Research Report is brought to you for free and open access by the Gastón Institute for Latino Community Development and Public PolicyPublications at ScholarWorks at UMass Boston. It has been accepted for inclusion in Gastón Institute Publications by an authorized administrator ofScholarWorks at UMass Boston. For more information, please contact [email protected].
Recommended CitationUriarte, Miren, "The Meaning of the Browning of America" (1991). Gastón Institute Publications. Paper 1.http://scholarworks.umb.edu/gaston_pubs/1

MAURICIO GASTON INSTITUTE FOR LATINO COMMUNITY DEVELOPMENT AND PUBLIC POLICY
THE MEANING OF THE BROWNING OF AMERICA
MIREN URIARTE
PRESENTATION AT THE RETREAT OF HISPANICS IN PHILANTHROPY. NEW YORK, OCTOBER 28TH, 1991

THE MEANING OF THE BROWNING OF AMERICA
I wanted, first of all, to thank Aida
Rodriguez of the Rockefeller Foundation and
Diana Campoamor, Director of Hispanics in
Philanthropy for inviting me to address you here
tonight.
In the course of the last three weeks, we
have talked several times about the issues
facing you as Latinos and as people concerned
about the future of Latinos in the world of
philanthropy. In the process of these
discussions, I lost whatever nervousness I may
have had about addressing you because I realized
that your questions and your struggle is not
different from mine in the academy and the world
of policy, or for that matter, from that of
many, many Latinos across the United States in
their daily lives.

Many of you are in the same position that
many of us are in the academy or at the
community level. We have two jobs. That of
doing the work we are paid to do- be it research
or anything else- as well as developing the
awareness of those around us of the particular
needs of Latinos in the hopes of having the
community receive a more equitable treatment.
In my experience, there is no other way to
accomplish both jobs and remain sane without
getting together with others in the same
situation and discussing strategies and action.
I salute you in your organization and hope that
your deliberations here this week are fruitful.
Tonight I wanted to talk to you about social
change, not revolutionary change, but rather a
gradual change in the social and demographic
makeup of the United States and its implications
to the work of those of us involved on issues
affecting Latinos.
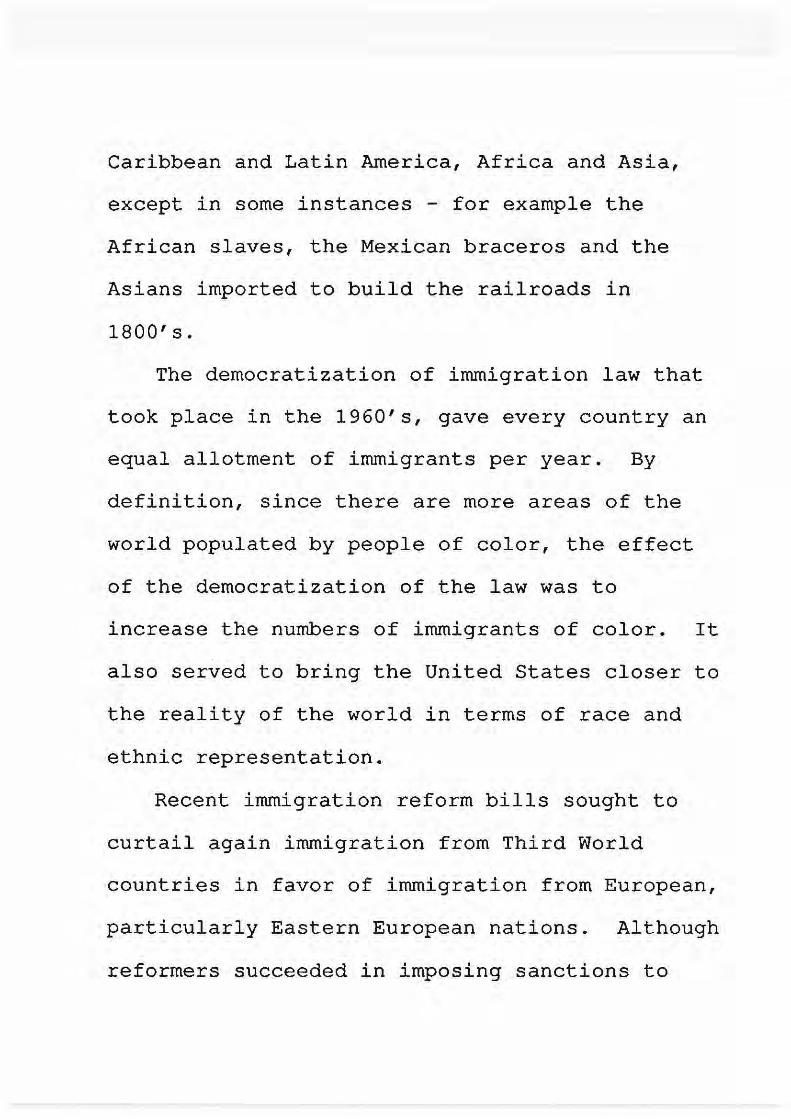
I will first tell you about the change and
hopefully put it in some perspective. Then I
will give you some information about Latino
groups nationally. And then focus in on the
meaning of these changes at the local level, or
how is the browning of America affecting Latino
communities and the cities and states in where
they live.
In doing the latter, I will be concentrating
on Massachusetts, perhaps not the state with the
largest Latino population in the country, but
one in which the changes are having a profound
effect.
Staff at the Gaston Institute at UMASS-Boston
have prepared some charts for you that I hope
you will find helpful. My hope that after I
present some information briefly, we can have a
discussion of the meaning of it to you and what
you are trying to accomplish.

The big news of the 1990 census is the
growing diversity in the population of the
United States.
From 1980 to 1990, the non-Hispanic white
population of the United States increased by 7.8
million people, a growth of 4.4%; while the
population of Blacks, Asians, Latinos ~nd other
groups had a combined growth of more than 14
million, a rate of growth of 30.9%.
Today, about one out of every four Americans
is a Black, a Latino, an Asian or a person of
another Third World origin.
This growth has been most pronounced among
Latitios and Asians. The national rate of growth
for Asians nationally is a whopping 107%; for
Latinos it is 53%. In comparison, Blacks grew
by 13.2% and as I mentioned above, the Non
Hispanic whites population grew only by 4.4%
between 1980 and 1990.

IMMIGRATION: 1820-1990 (millionsl
n~----------------------~
9 8.8
8 7.3
7
6 7
5.2
5 4.
4

Although increases by births contributes to
this growth, most of the growth among Latinos
and Asians is due to immigration. Among Latinos
immigration from Mexico and from Central
American, has been significant in this decade.
Among Asians, it is safe to say that a large
chunk of that growth comes from Southeast Asia.
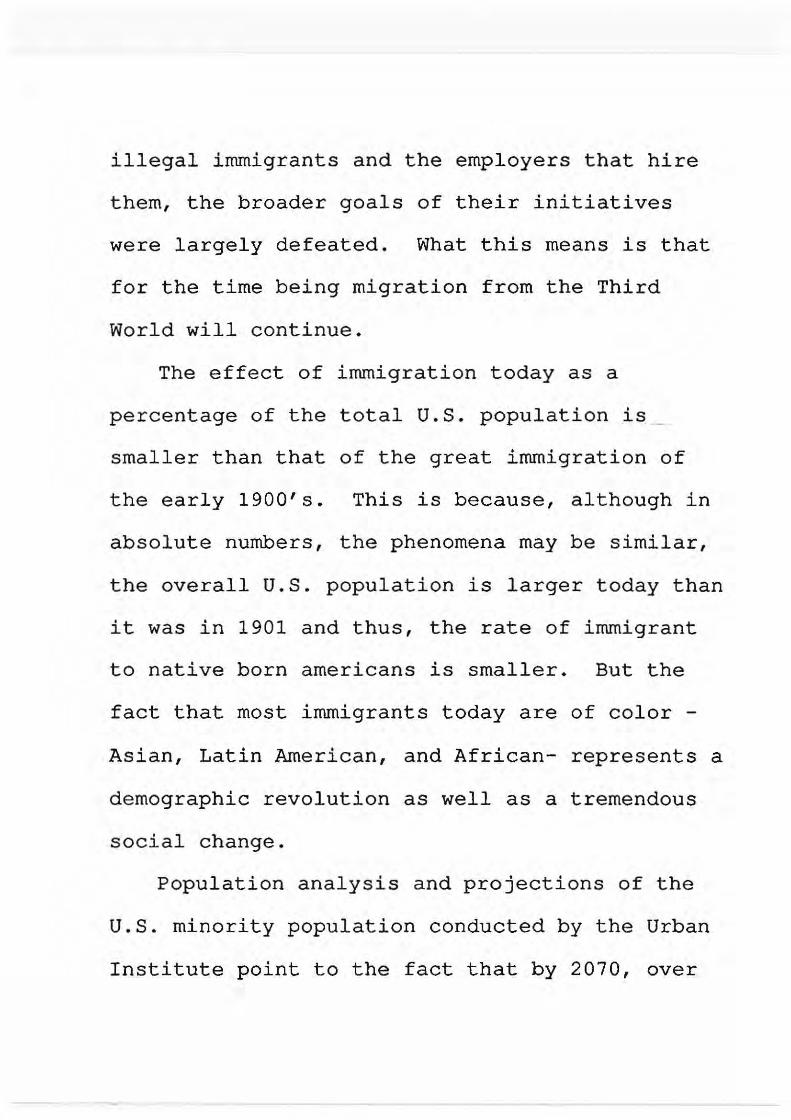
Although we know that this is a fact, it is
important that we understand that we are talking
about a rate of immigrant growth that rivals the
great European migrations of the early 20th
Century. Your first chart graphs the numbers in
millions of the immigrants that arrived during
each decade from 1820 to 1990. As you can see,
at 7.3 million people over the last 10 years,
immigrant growth during this decade surpasses
that of every previous decade with the exception
of the decade from 1901 to 1910.
The Boston Globe, as part of a lengthy
analysis of the diversification of the U.S.

population in terms of race, produced the graph
that we reproduced with their permission.
Again, using figures from the Immigration and
Naturalization Service, they track the growth of
immigrants by area of origin during the same
period.
We tried to reproduce this . graph for you in a
way that would make the information more clear,
and for example, separate english speaking from
spanish-speaking caribbean immigrants, but the
time did not allow it. It is not perfect, but
follow it with me, if you can.
The line that peaks in 1901-1910, is that of
immigration from Europe. White European
immigrants up until 1970, accounted for the
largest number of immigrants to the u.s ..
Today, immigration from Europe falls behind that

8
7
6
5
4
3
2
1
US immigration by racial/ethnic group, 1820·1990, in millions
IISTOIY
I1IWIll
Siege of the
Alamo
filii" Europe
""I Asia filii" Mexico
Latin .po America·
? CanlJbean
1'.'\ Africa
Gold rush
.~
Uncoln assasslnoUon
ChlW ..
Great Chicago
Ore
Immigration Center opens at Ellis Islend
Immi",lion re,chetl, pm betw ... 19o1,nd 1910, wilen U million D .... m ... (8 million of til ... while Europeans) ,rritetl iD the Unitetl Stat ...
Stock Market crash
Jackie Robinson breaks
baseball's color barrier
Q- l , ,-Kennedy assass- Nixon American Inatlon resignation bicentennial
.WJ-ft« '" tI lift ~ II 1M 1910s ... '"'" Asia, UIio -._ IMCWbua.
WarId Warl
World Warll
Konao VielRaIl
CoOlti", """lilUtei, 500,000 .. docD ... ". ;'iputs, til ... will be more --. i. tile U.~etI States i. 1M 19901 tIIae in .. 'pmio ........
Immigration Act of 1921
War I War
Immigratioa I N.turaraatioa Act
of 1952
1840 1IMlO o , ,re::::::"""" "" 1820 if" "I"W"","",,,;:Itt j""" 1",.."" 111';1'···· .... · .. · , : ••• JI
1850 1870 1880 1890 - 1910 1920 1930 1950 1940 1960 1970 1980 1990 '"1rldUdn Centre! and South ArMric:e
GLOBf STAFF GRAPHICS I NEil C. PlNCHIN

of every other area of the world except Africa.
But let's look at what is happening at
immigration from third world countries. As they
point out 80% of immigrants came from Asia,
Latin America and the Caribbean. The rest came
from Europe and Africa. The growth of
immigration from Asia, particularly since the
1970's is clear on the graph.
But although the graph leads one to believe
that it is the highest, let's look at
immigration from Mexico, Latin America and the
Caribbean. When you add the numbers of
immigrants from Mexico and Central and South
America, it approaches very closely that of
Asians. Those numbers, though, do not include
immigration from Cuba and the Dominican Republic
(both Caribbean nations) or the migration of
Puerto Ricans to the United States.
What I conclude, from this graph, is that the
rate of movement from Latin America to the U.S.

is perhaps the most significant factor in the
growth of immigration in the last decade. And
if so, the most significant factor in the
diversification of the population of the United
States.
Let me talk briefly about what has fueled
this large migration from the Third World. The
first factor, clearly is consistent dynamic of
migratory flows from peripheral to core areas of
the world economic. The uneven development of
the world economies leads to migration from the
more marginal areas towards the core. The
United States is a powerful world economy with
great influence over Latin America and many
Asian countries. The deterioration of the
economic and political conditions in this
section of the World, would naturally fuel
economy towards the United States.

Another factor is the political upheavals
that have been experienced in the last two
decades. Central America has been an important
focus of instability, fueling the movement of
refugees north. Although many of these people,
for political reasons, are not considered
refugees in the United States, they still make
their way into the country in large numbers.
South East Asia has also experienced marked
changes in the last twenty years, fueling the
movement of refugees allover the world,
including the United States.
U.S. migration policies that began to be
implemented in the 1960's are also contributing
to an increased migration by people of color.
At that time, President Kennedy proposed reforms
in immigration law that ended the preference for
persons of European background - that preference
had been in force since the early 1800's and
basically barred large immigrations from the
Caribbean and Latin America, Africa and Asia,
except in some instances - for example the
African slaves, the Mexican braceros and the
Asians imported to build the railroads in
1800's.
The democratization of immigration law that
took place in the 1960's, gave every country an
equal allotment of immigrants per year. By
definition, since there are more areas of the
world populated by people of color, the effect
of the democratization of the law was to
increase the numbers of immigrants of color. It
also served to bring the United States closer to
the reality of the world in terms of race and
ethnic representation.
Recent immigration reform bills sought to
curtail again immigration from Third World
countries in favor of immigration from European,
particularly Eastern European nations. Although
reformers succeeded in imposing sanctions to
illegal immigrants and the employers that hire
them, the broader goals of their initiatives
were largely defeated. What this means is that
for the time being migration from the Third
World will continue.
The effect of immigration today as a
percentage of the total U.S. population is __
smaller than that of the great immigration of
the early 1900's. This is because, although in
absolute numbers, the phenomena may be similar,
the overall U.S. population is larger today than
it was in 1901 and thus, the rate of immigrant
to native born americans is smaller. But the
fact that most immigrants today are of color -
Asian, Latin American, and African- represents a
demographic revolution as well as a tremendous
social change.
Population analysis and projections of the
U.S. minority population conducted by the Urban
Institute point to the fact that by 2070, over

half of the population of the u.s. will be of
color. The minority population that we will be
speaking about then will be white. By the year
2000, just less than 1/3 of the U.S. population
will be of color.
This is a profound transformation for the
United States. It will call int~ questions many
of the values and principles that formed this
nation: equality, democracy, the rights of
individuals. It will engage us socially and
politically for years to come.
The United States is just now waking up to
the magnitude of the transformation. We are in
the first two decades of the journey that will
take almost three quarters of a century.
Often, it is hard to be very concerned about
a social change that will come into fruition
when none of us will be here. It is also hard
to see, with all the things that are happening
around us, the outlines of the emerging debate.
From English only, the difficulties in the
assimilation of immigrants of color, and the
development of scapegoat groups among ourselves
to the arduous work at the community level
around issues of diversity, the growing -but
still lacking- understanding of the dynamics of
new immigrant communities and the work of folks
like you, everywhere in the U.S. that, in one
way or another are arguing that inclusion now is
important in order to avoid violence and turmoil
for the next 75 years.
At the center of this transformation will be
the Latinos in the United States. Latinos will
be the largest minority in the country where
racial minorities will be becoming majorities.
How we approach this transformation, how we
prepare ourselves and our communities for this
process, how do we develop leaders with the
vision that will be required, are key questions
for Latinos everywhere.

U.S. MINORITY POPUlATIOO BY REGION ~~--------------------~
37
35
30 30
25 25
20 17
15 15
5
o Ibtheaat MiltNesl real
SlMce: Boetoo 61., Oel13, 1991
~ % of total 1190 ~ % of total2lQ)

Let me walk you through some additional
figures that fill out the picture of diversity
in America. By far the most diverse areas of
the country are the West and the South. In the
West, 19% of the population is Latino 7.7% is
Asian and 5.4 % is Black; in the South 19% of
the population is Black and 8% is Latino and
1.3% is Asian. The Northeast is the third most
diverse area. In the Northeast, 11% of the
population is Black, 7.4% is Latino and 2.6% is
Asian.
Projections by the Urban Institute in
Washington D.C. indicate that by the year 2000,
this pattern will be maintained, but that some
regions will experience more change than others.
The West Coast will lead the way, followed by
the Northeast. The South will experience less
growth in minority populations, although its
share of minorities will continue to be very
large. The Midwest will continue to lag far

behind.
When we examine the geographic dispersion of
Latinos, we see that Latinos congregate in the
West and the South, 75% of Latinos live in these
areas. But if we look at the 10 states with the
largest numeric increases of Latino population
over the last decade, one is in the midwest
(illinois), two are southern states (Texas and
Florida), three are in the Northeast (New York,
New Jersey and Massachusetts), and four are in
the West (Arizona, California, New Mexico,
Washington); seven out of ten are in the
Northeast and the West.
Let's now take a look at the Latino
population. For this analysis we used 1980 and
1990 U.S. Census figures as well as the Current
Population Survey for 1988, 1989 and 1990.
In terms of composition, we can see that
Mexicans account for the largest percentage of
Latinos followed by Puerto Ricans. Central and


~
~ :0 -. i -z:; ~ -
8 ~
f ~ -
B • ,....
t -I
f , '

z
f I» I-
~ -E: ; _. f • .. -;"'I ~
,

south Americans together account for 14% of the
population. Cubans account for just under 5%.
Other Latino, which really means Dominicans,
since everyone else is accounted for in the
other categories, account for almost 7%. So the
ranking should go: Mexicans, Puerto Ricans,
Dominicans, Cubans, and everyone else.
Although the categories are not the same, a
comparison between 1980 and 1990 figures
provides some light as to which Latino
populations are growing. The share of Mexicans
of the Latino population increased by just over
4% in the decade. Both Cubans and Puerto Ricans
decreased
in their share of the Latino population, while
the combination of Dominicans, Central and South
Americans remained roughly the same.
Latinos are a young population as compared to
the overall population. Among Latino groups,
median age is higher among Cuban Americans and

PERCENT WITH 4 YRS OF H.S. OR MORE ..... atIGII2S y __ old ...r 0_
~.-----------~----~---------------------.
80 78 eo
70 88
80
50
30
20
\0
o 1888
lowest among Mexican Americans. The youth of
the Latino population has great implications for
policy in the area of education. It also has
great implications in the area of political
participation; almost half of the Latino
population is not able to vote because of age.
We prepared a few indicators on Latinos for
this discussion. We have data on the percent of
Latinos and non-Latinos that have educational
attainment at the top levels of the educational
scale.
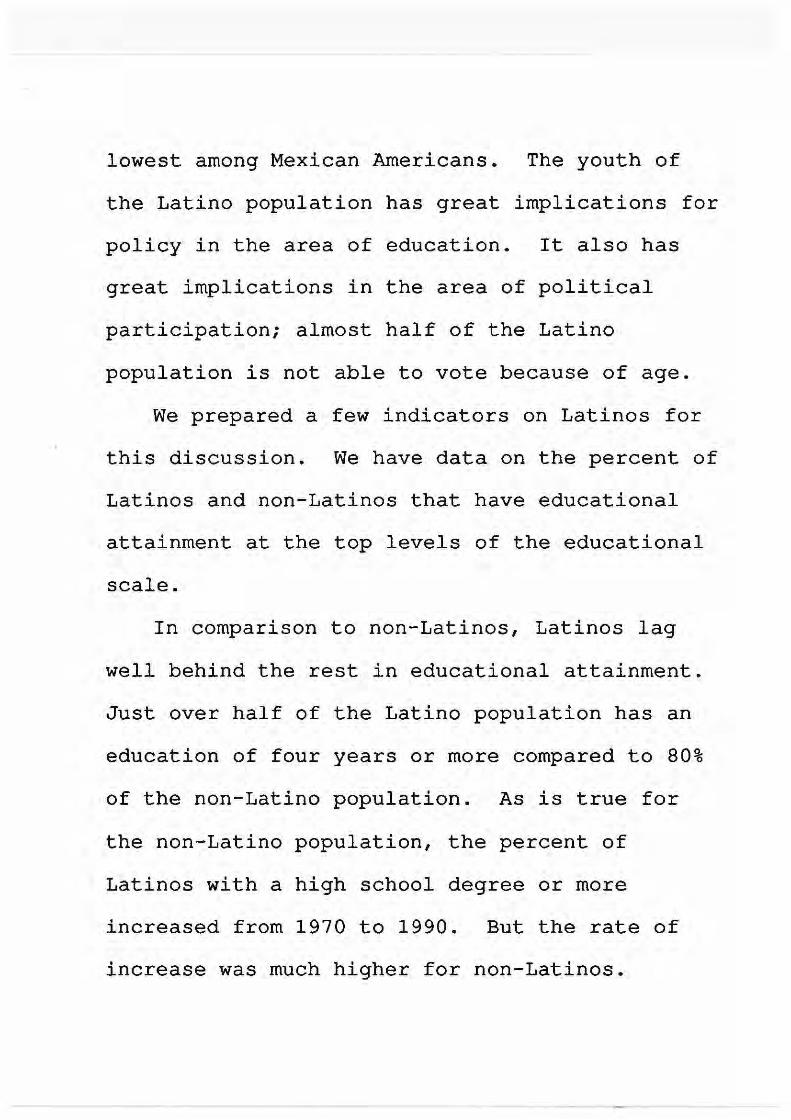
In comparison to non-Latinos, Latinos lag
well behind the rest in educational attainment.
Just over half of the Latino population has an
education of four years or more compared to 80%
of the non-Latino population. As is true for
the non-Latino population, the percent of
Latinos with a high school degree or more
increased from 1970 to 1990. But the rate of
increase was much higher for non-Latinos.

PERCENT WITH 4 YRS OF COLL. OR MORE I'os>uIatfon 2S y ... old 1M 0_
~.-----------~----~--------------------~
22
20
18
16
14
12
10
8
8
4
22 22

Educational attainment of high school or more
among Latinos increased by 19 points from 1970
to 1990, and lags well behind the 27 point
increase achieved by other groups.
The rate of attainment of a college education
among Latinos in more than half of that of the
non-Latino population. In 1990, just 9% of the
Latino population had 4 years of college or more
as compared to 22% for the non-Latino
population. The percent of both Latinos and
non-Latinos attaining a college education or
more increased over the last 20 years, but the
patterns are somewhat different. For non
Latinos, the, pattern has been one of sustained
increases over the 20 year period, doubling the
rate over the last two decades. The rate of
Latinos has also increased, in fact it doubled
between 1970 and 1988, but by 1990 it had begun
to decline.
Among Latino groups, the highest rates of

educational attainment -as measured by high
school completion- are among Central and South
American and "other Hispanic". Mexican
Americans have the lowest rates of high school
completion among Latino groups. Educational
attainment of four years of college or more is
highest among Cuban Americans and lowest among
Mexican Americans.
Latinos labor market participation of males -
the percentage of Latinos that are working or
actively seeking a job- ranges from the high
sixties among Puerto Ricans to the mid-eighties
among Central and South Americans. A similar
pattern is observed among women from different
national groups. The labor force participation
of Latino men is in fact higher than that of
non-Latinos but the participation of women is
significantly lower. Through the 1980's, the
overall labor force participation of Latino men,
remained stable in the high 70's; labor force

'-1"'\ ...,"'. " • "'." "'... • 1"'\'"'' '" II 1"'\" "'.,. ." 1"'\ • ..._
MALE AND FEMALE 16+ 85
80 80.5 80.1 79.6 ~7 78.2 78.5 7~0 r:.3 7:~ EJ
o 0
75 ~ ~ ~ ~ ~ ~ ~ ~ ~ o e e e e e e e 0
70
65
60
55
50
57.4
~~~7"?~7:~~ _ ~ ~ ~ _ ru ~
~ 48.9 + 1-
47.3
45 1982 1983 1984 1985 1986 1987 1988 1989 1990
o LATINO .... ' E + LATINO FEMALE <> NON LATINO MALE t. NON LATINO FEMALE

UNEMPLOYMENT RATES: MARCH 1982-1990 PopJIaticft 18 y ... old '"'" ~
18r-----------~~--~----------------------_,
17
18 15
18.6
14 13.4
13
12
n 10
9
8
7
8
5
4
3
2
1 o '--~ """--"""
1982 1983 1984 1985 1988 1987 1988 1989 1990

MEDIAN EARNINGS: 1981-1988 1987 S. (Morch CPS)
22
2\ 20.303 20.498 20.582
19~ e " 20
19.193 19.Cl86 19 ~.538 18.778 e .. e
18
17
1 18
16
14 13.558 13.001 12.974 13._
13 12.425 12.715 12.384 12.527
12
n 10.478 10.745 10,883 6
~ 10 9.455 9.803 ~~ 9.077 9.097 6 6
9 8.~44 8.ffi4 8.299 8.391 8~ 8~S9 8,554
8 1981 1982 1983 1984 1985 1988 1987 1988
0 latina Male + l.ItIna f_1e (> Non l.ItIna male '" Non l.ItIna f_1e

participation for non-Latino males was also
stable in the mid 70's. Among women, the labor
force participation of both Latinas and non
Latinas increased significantly during the
1980's.
Still, unemployment remains a problem among
Latinos. During the 1980's, unemployment rates
among Latinos were considerable higher than
those of non-Latinos. Unemployment rates were
highest among Mexican Americans and Puerto
Ricans at the end of the decade.
Median earnings for Latinos were
significantly lower than those of non-Latinos.
Among both men and women, Mexican American men
had the lowest mean earnings of all Latino
groups during the late 1980's. Cuban American
men had the highest mean earnings of all groups;
among women, the earnings of Puerto Rican, Cuban
and other Hispanic women are comparable while
those of Mexican American and Central and South

American were lower.
The high unemployment rates, the lower rate
of participation of women in the labor force and
the lower wages Latinos earn in their jobs has
led to considerable rates of poverty in the
population.
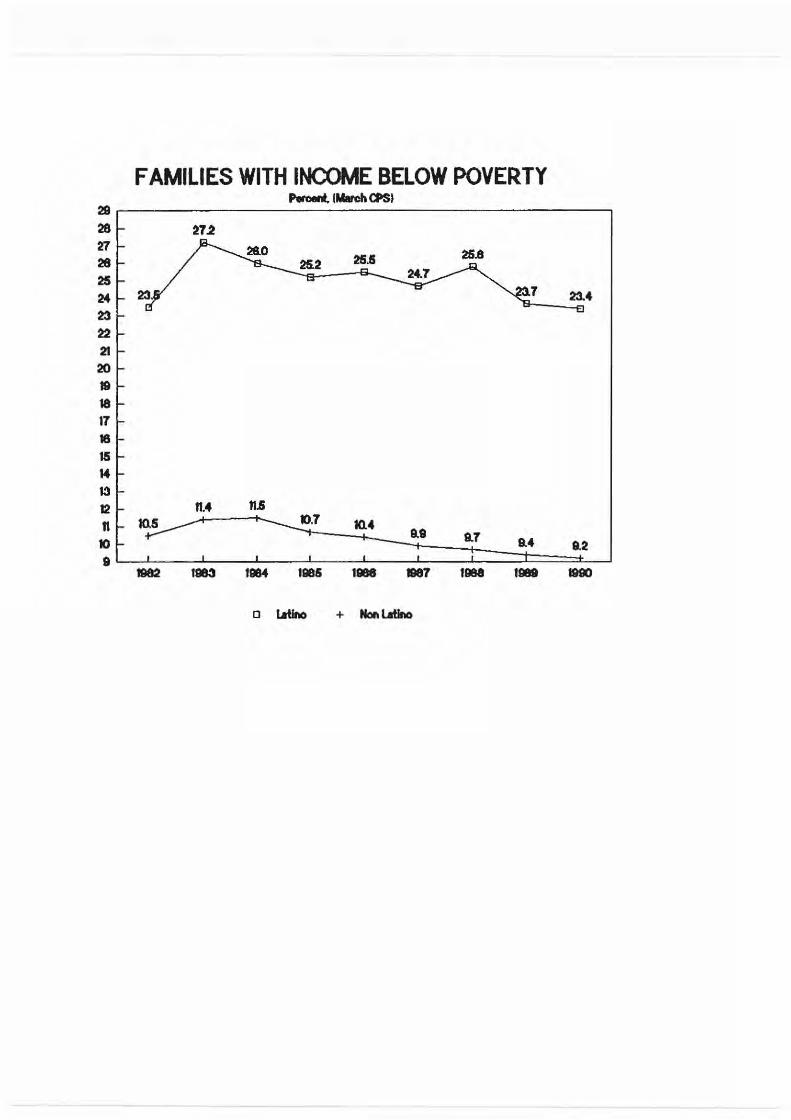
Rates of povertyam~ng Latino families has
remained more than twice that of non-Latino
families during the 1980's. Poverty among
Latino families reached a high of 27% in 1983
(compared to 11% among non-Latinos). By the end
of the decade, both rates had decreased but
Latino families still had rates of poverty
hovering around 25%.
Poverty is higher among Puerto Ricans than
among any other Latino group. In 1988, poverty
rates for Puerto Rican families reached 38%,
four times the rate of non-Latino families. By
the end of the decade, they were at 30%.
FAMILIES WITH INCOME BELOW POVERTY PoroooIt. (MItch CPS)
29
28 272 ~
25.8 28 25.2 25.11
25 24.7
24 23 7 23.4
23 22
21 20 19 18 17 18
111 14 13
12 11.4 11.&
11 10.5 10.7 10.4 9.8 8.7 10 9.4 9.2
9 1982 11183 1984 11185 I. 11187
I_ 1988 1990
0 IrihD + Nonlatlno

Poverty rates are lowest among Cubans, with
their rates of poverty being lower than the
Latino average but significantly higher than
that of non-Latinos.
More than one quarter of Mexican American
families are poor, which is about average for
the Latino population and just under three times
that of non-Latino families.
Lower educational attainments and a
population that is by and large working and
poor, characterizes the situation of Latinos
nationally.
There is a lot of debate about the future of
the Latino population in the United States. On
the one hand some argue that their immigrant
characteristics -language proficiency, low
educational attainment, etc- in time will
disappear for, at least, some of the groups and
that Latinos may, with time, follow the path of
earlier immigrants.

Others argue that Latinos are behaving
structurally like racial minorities, that is
that their immigrant status is secondary to
their race and ethnic background in the outcomes
of their economic and social insertion.
But regardless of the ultimate outcome, the
fact is that the situation in Latino communities
is a serious one. No where in the United States
is the situation worse than in the state I come
from, Massachusetts. Latino educational
outcomes, earnings, and poverty rates are the
worst of any Latino community in the Unites
States.
Let me retake the initial discussion, in
explaining the Massachusetts situation.
The New England States, particularly
Massachusetts have experienced among the highest
rates of growth of Blacks, Latinos and Asians of
any area of the country. If we look at the 5
states with the highest rates of growth for each

of these groups, we find that 3 out of 5 of the
States is a New England State. In
Massachusetts, over the last 20 years the
population of Non-Hispanic whites (European
background) has decreased by 4.5% while the
minority populations have increased by (3.6%).
Although, the state and the region remain
primarily white, the large presence and high
growth of the Black, Latino and Asians
population is a significant change in the
region.
This region has been racially homogeneous for
most of its history, - aside from the pockets of
Blacks in Hartford, New Haven and Boston, the
population has been ethnically diverse, but
racially homogeneous. The experiences in the
west and South during the earlier part of the
century, largely by-passed New England and
Massachusetts.

Unlike Blacks, who congregate primarily in
the South central area of Boston, Latino
settlements are more widespread throughout the
city and the State. About half of the Latino
population of the State lives in Boston; but the
highest rates of growth have taken place outside
of the capital city.
There are large Latino concentrations in
Lawrence for example, where Latinos account for
42% of the population of the city; in Holyoke
and Chelsea, Latinos account for 31% of the
population of these cities. Latinos account for
10.8% of the population of Boston.
Massachusetts has led the nation in the
process of de-industrialization and in the re
structuring of the economy. De
industrialization in the city of Boston, for
example, began in the 1930's and by the 1980's
industry in the city has almost disappeared. It
has been replaced by a high powered service

economy and a high technology industry which,
unlike California and Texas, emphasizes the
least labor intensive aspects of the industry -
software and systems development rather than
assembly of computer equipment, for example.
Latinos, by and large work in the dying
manufacturing sector of the state. In Boston,
Latinos are the cleaners, the food handlers and
the clerks of the city's financial, health, and
service industries. Poverty among Latinos in
Boston, for example, declined very little during
the city's boom of the 1980's. In fact, among
families headed by women, poverty increased.
75% of the Latino children in Boston live in a
poor household.
Although the growth of the Latino population
has had important effects in their labor market
experience, it has had a tremendous effect in
the social and political experience of the
group. We can safely say that the high rate of

growth has not allowed city and state government
to abreast of changes within Latino communities
specifically, and in general, with the dramatic
changes in the demographics of the population.
With the notable exception of the Gateway
Cities Legislation in the late 1980's, there has
been little accounting by state and ~ity
government of the growth of "newcomers" and
little attention has been paid to their very
pressing needs.
Latinos, by and large, have been invisible to
policy makers. There are several reasons.
Latinos are a young population; median age for
Latinos in Massachusetts is 21. This means that
half of the population cannot vote and has not
political participation. Even in those areas in
which Latinos compose high percentages of then
population, there are no Latino elected
officials. In Lawrence, for example, the lack
of district representation forces Latinos to run

city-wide rather than from within their own
base; no Latino has ever held office in
Lawrence. By and large, Latinos are not a
political threat, at this point, to elected
officials.
But Latinos have been invisible to government
policy makers in other way§ _ as well. Latino
rates of employment in city and state government
in Massachusetts are very low, lower than those
of Latinos in other areas of the country.
Although there have been some highly visible
appointments, such as Chair of the Massachusetts
Commission Against Discrimination and
Commissioner of Welfare, the truth is that
highly placed appointed officials rely on the
work of staff, staff that is primarily non
Latino. In this context, there is little that
an official alone can do.
There are other structural sources of
invisibility. For example, up to 1989, there
was no information on birth or death rates for
Latinos in Massachusetts. Today, there are few
economic indicators in the state that
disaggregate Latinos from whites or blacks.
This absence of Latino information in the
routinely available data handled by
administrators and policy makers in the state is
a serious structural problem, one that repeats
itself in other areas of the United States.
The result has been that even under the best
intentioned policy makers, with money to develop
initiatives directed at problems facing Latinos
in the state -such as model employment and
training programs and extensive social service
initiatives- Latinos were largely bypassed by
these reforms.
How were they by-passed? Because the general
policies although laudable and sound, did not
take into account the needs of Latinos at the
time of implementation.

An example of this is the employment and
training program in Massachusetts, a model
program that, by most accounts, has been highly
successful in placing AFDC women in jobs.
Latinas participated actively in ET programs,
particularly in programs operated at the
community level - most participants were
involved in a community based program. That
they did right, they involved community based
contractors and in doing so resolved a strong
barrier to participation.
But what they did wrong is that they did not
pay attention to the kinds of programs that
would be successful with a population that
required both remedial education and skills
training. No combined programs were ever
funded, in fact they were discouraged. There
was never any connection articulated between
educational and skills training programs. There
was no effort to develop strong linkages to the

sources of employment.
The result is that although Latinas
participated, they participated primarily in
education only programs that did not lead to
jobs. Outcomes -in terms of placement and wages
- for Latino participation were the worse of any
group. From my perspective, a very large
opportunity was missed.
Like this one there are many examples of good
policy not having the desired effect in
particular sectors of the population; in
Massachusetts, more often than not, that sector
happens to be Latinos.
Lack of information that is readily
available, lack of Latino personnel in policy
positions and the non-threatening nature of the
Latino population in the voting booth are
potentiated by the tremendous effect on the
capacity for advocacy and strategy development
that the tremendous growth and needs of the

Latino population represents for Latino
community based organizations.
The sustained high rate of growth,
particularly in the absence of official
response, has placed a great burden on Latino
communities to develop transitional and ongoing
supports that would help stabilize a community
undergoing this high rate of change. Although
there has been considerable institutional
development in the Latino community in Boston
and Massachusetts, the growth of these
institutions has not kept up with the increases
in the population and its needs.
Strengthening the institutional base of
Latino communities is critical both for the
healthy survival of these communities under the
stress of such rapid growth, but also for the
capacity of Latinos to participate actively in
shaping policies and programs that affect their
daily lives and their future.

There is a lot of debate about the extent to
which community based organizations, which in
many cases are service organizations, are an
asset or a liability to communities. Some argue
that the dependency in government programs on
the part of these agencies has changed their
character and effectiveness.
It is important to understand, though, that
this dependency is fostered by lack of resources
that permit more creative and innovative
approaches at the community level. That
dependency in government programs is a strategy
for survival for organizations that, in most
cases, form the institutional backbone of Latino
communities across the United States.
Strengthening the institutional base of
Latino communities is a critical priority at
this juncture. Community organizations should
be encouraged to expand their vision and
endeavor at the community level from one focused

solely on service to one focused on the
community development needs -whatever they may
be. This may include a range of initiatives
such as voter registration and citizenship
education to community based economic
development activity to the experimentation in
model programs of employment and training.
Strengthening the power, reach and
effectiveness of community based organizations
along a range of areas that are not now even
considered is critical for the development that
is necessary for Latinos to take their place in
the new majority. Community based
organizations are the best training grounds for
leadership in our communities; they are also the
best springboard to the participation of
Latinos, that are really knowledgeable of
community conditions and needs, in the debate on
public policy at the local level.

A great Massachusetts politician - former
Speaker of the House of Representatives Tip
O'neill always used to say that all politics are
local. In the era of the new federalism, that
is certainly true. The federal government has,
in large measure, abandoned the terrain to the
states and localities in the PQlicy making that
most closely affects people's lives - schools,
economic development, job strategies, etc.
The results of the new federalism are just
beginning to be felt. The great diversity of
experience from one state to the other in terms
of life chances and opportunities will surely
begin to be documented with this census.
In Massachusetts, the most insidious of the
results of these policies at the federal and
state levels are making themselves felt with a
vengeance due to the economic crisis facing the
state. I mention them here today, because they
may be a harbinger of things to come.

Over the last three years, we are seeing that
the fiscal crisis in the state is leading to the
abandonment of municipal systems, particularly
the schools. The tax payers' revolt is taking
the shape of having large sectors of the middle
class resist supporting educational services and
other municipal se:r:vices. In Massachusetts, the
state has just released a report on the
tremendous crisis affecting several school
districts: all four of the school districts
highlighted are districts where Latinos
predominate : Chelsea, Lawrence, Holyoke, and
Brockton. In the case of Chelsea, the school
system is already being managed by a private
entity, Boston University, in a move highly
contested by the large Latino community of the
city. The Lawrence and Holyoke school systems
are about to be placed in receivership.
But the problem extends beyond the schools.
A month ago the mayor of the city of Chelsea was

replaced with a receiver appointed by Governor
Weld because the elected city government was
unable to manage the city's affairs. Lawrence,
Massachusetts is widely discussed as the next
city where the Governor will have to appoint a
receiver. Both are cities where the Latino
population is very high and where the
demographic changes have been profound and
extremely quick.
It is still too early to tell whether the
examples of abandonment and anarchy that we are
witnessing in Chelsea and Lawrence following the
rapid transformation of the population will
become a pattern in other communities undergoing
similar change. But it is clearly a development
to be watched very carefully.
The demographic transformation of the
population is an incontrovertible fact, whose
outlines we are just beginning to witness and
whose outcome will not come in our lifetime.

Whether this will be a peaceful process will
depend on the basis that we set now, it will
rely on the values and the principles that our
generation establishes.
That Latinos will be at the center of this
process is also clear. And as I said earlier,
how we approach this transformation, how we
prepare ourselves and our communities for this
process, how do we develop leaders with the
vision that will be required, are key questions
for Latinos everywhere.
I have taken a lot of your time and I
wanted to leave some space for discussion. I
hope that I have provided you with some ideas as
to the challenge we face together.

SELECTED CHARACTERISTICS FOR LATINO SUBGROUPS. MARCH 1988, 1989, 1990
Mexican Puerto Cuban Central Other Rican or South Hispanic
American
Population (thousands)
1988 12,110 2,471 1,035 2,242 1,573 1989 12,565 2,330 1,069 2,544 1,567 1990 13,305 2,180 1,014 2,842 1,437
Median age (yrs)
1988 23.9 24.9 38.7 27.6 29.7 1989 23.6 26.8 41. 4 28.4 29.8 1990 24.1 27.0 39.1 28.0 31. 1
Percent male
1988 51. 5 46.7 50.9 47.3 48.7 1989 51.0 47.9 48.0 50.0 48.9 1990 51. 2 47.7 48.4 48.8 48.1
Percent female
1988 48.5 53.3 49.1 52.7 51. 4 1989 49.0 52.1 52.0 50.0 51. 1 1990 48.8 52.3 51. 6 51. 2 51. 9
Percent with 4 yrs of HS or more
1988 44.6 50.7 60.5 63.8 65.2 1989 42.7 54.0 63.0 66.0 63.7 1990 44.1 55.5 63.5 58.5 68.7
Percent with 4 yrs of college or more
1988 7.1 9.6 17.2 16.5 14.0 1989 6.1 9.8 19.8 17.5 12.9 1990 5.4 9.7 20.2 15.6 15.2
Source. March 1988, 1989, 1990 Current Population Survey

LABOR MARKET CHARACTERISTICS FOR LATINO SUBGROUPS MARCH 1988, 1989, 1990
Male labor force participation rates (16+)
1988 80.4 68.6 77.2 84.8 74.5 1989 82.8 69.6 76.3 85.4 72.2 1990 81.2 69.2 74.9 83.7 75.3
Female labor force participation rates (16+)
1988 52.4 40.9 53.6 61.7 51. 6 1989 52.7 41.7 49.1 61.7 53.2 1990 52.9 41. 4 57.8 61.0 57.0
Male unemployment rates
1988 11.0 8.2 4.1 5.6 10.2 1989 8.3 12.1 6.4 4.6 6.7 1990 8.6 8.2 6.3 6.9 6.2
Female unemployment rates
1988 7.7 10.5 1.7 3.9 7.7 1989 8.8 5.0 5.7 8.3 5. 1 1990 9 . 8 9. 1 5. 1 6.3 5.9
Male median earnings in previous years (civilians 15+)
1988 11,791 15,672 16,634 13,105 15,574 1989 12,107 16,122 17,572 14,930 16,030 1990 12,527 18,222 19,336 15,067 17,486
Female median earnings in previous years (civilians 15+)
1988 7,912 11,327 11,364 8,056 11,239 1989 8,110 11,241 11,966 9,936 12,104 1990 8,874 12,812 12,880 10,083 11,564
Percent of families below the poverty level in previous year
1988 25.5 37.9 13.8 18.9 26.1 1989 24.9 30.8 16.9 16.6 20.6 1990 25.7 30.4 12.5 16.8 15.8
Source, March 1988, 1989, 1990 Current Population Survey

SOURCES FOR GRAPHS: Unless otherwise noted, all data come from yearly (March)
U.S. Census Current Population Surveys, the U.S. Census of 1980 and the U.S. Census of 1990.
PREPARED BY: MAURICIO GASTON INSTITUTE FOR LATINO COMMUNITY DEVELOPMENT AND PUBLIC POLICY UNIVERSITY OF MASSACHUSETTS-BOSTON HEALY LIBRARY, 10TH FLOOR BOSTON, MA 02125
617·287·5790